Attached files
| file | filename |
|---|---|
| 8-K - 8-K - NORTHERN TRUST CORP | a2016annualmeeting8-k.htm |
1 northerntrust.com | © Northern Trust 2016 2016 Annual Meeting of Stockholders NORTHERN TRUST CORPORATION April 19, 2016 Frederick H. Waddell Chairman & Chief Executive Officer Reminder: Use of cameras, recording devices, cell phones and other electronic equipment is strictly prohibited. Thank you.
2 northerntrust.com | © Northern Trust 2016 2016 Annual Meeting of Stockholders NORTHERN TRUST CORPORATION April 19, 2016 Frederick H. Waddell Chairman & Chief Executive Officer
3 northerntrust.com | © Northern Trust 2016 FORWARD-LOOKING STATEMENTS This presentation may include statements which constitute “forward-looking statements” within the meaning of the safe harbor provisions of the Private Securities Litigation Reform Act of 1995. Forward-looking statements are identified typically by words or phrases such as “believe,” “expect,” “anticipate,” “intend,” “estimate,” “project,” “likely,” “plan,” “goal,” “target,” “strategy,” and similar expressions or future or conditional verbs such as “may,” “will,” “should,” “would,” and “could”. Forward-looking statements include statements, other than those related to historical facts, that relate to Northern Trust’s financial results and outlook, capital adequacy, dividend policy, anticipated expense levels, spending related to technology and regulatory initiatives, risk management policies, contingent liabilities, strategic initiatives, industry trends, and expectations regarding the impact of recent legislation. These statements are based on Northern Trust’s current beliefs and expectations of future events or future results, and involve risks and uncertainties that are difficult to predict and subject to change. These statements are also based on assumptions about many important factors, including the factors discussed in Northern Trust’s most recent annual report on Form 10-K and other filings with the U.S. Securities and Exchange Commission, all of which are available on Northern Trust’s website. We caution you not to place undue reliance on any forward-looking statement as actual results may differ materially from those expressed or implied by forward-looking statements. Northern Trust assumes no obligation to update its forward-looking statements.
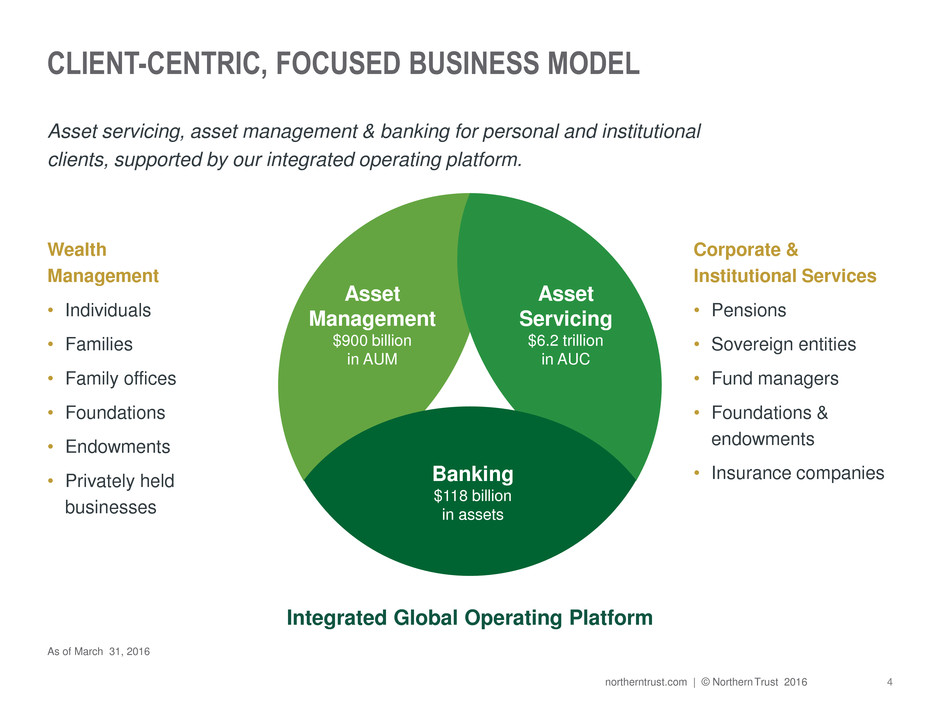
4 northerntrust.com | © Northern Trust 2016 CLIENT-CENTRIC, FOCUSED BUSINESS MODEL Asset servicing, asset management & banking for personal and institutional clients, supported by our integrated operating platform. Wealth Management • Individuals • Families • Family offices • Foundations • Endowments • Privately held businesses Corporate & Institutional Services • Pensions • Sovereign entities • Fund managers • Foundations & endowments • Insurance companies As of March 31, 2016 Integrated Global Operating Platform Banking $118 billion in assets Asset Servicing $6.2 trillion in AUC Asset Management $900 billion in AUM
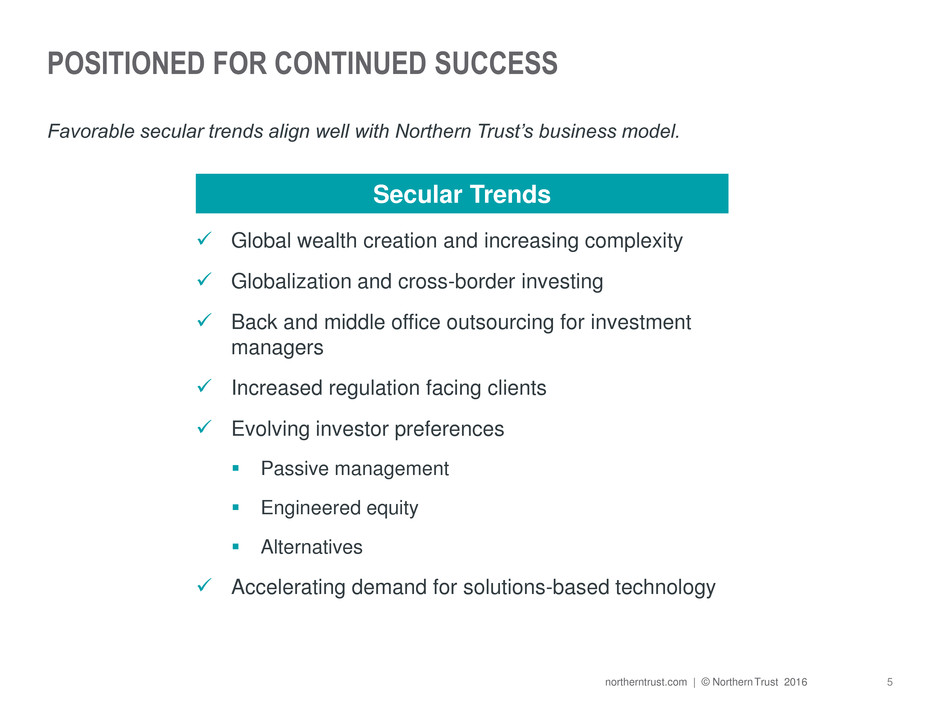
5 northerntrust.com | © Northern Trust 2016 POSITIONED FOR CONTINUED SUCCESS Favorable secular trends align well with Northern Trust’s business model. Secular Trends Global wealth creation and increasing complexity Globalization and cross-border investing Back and middle office outsourcing for investment managers Increased regulation facing clients Evolving investor preferences Passive management Engineered equity Alternatives Accelerating demand for solutions-based technology
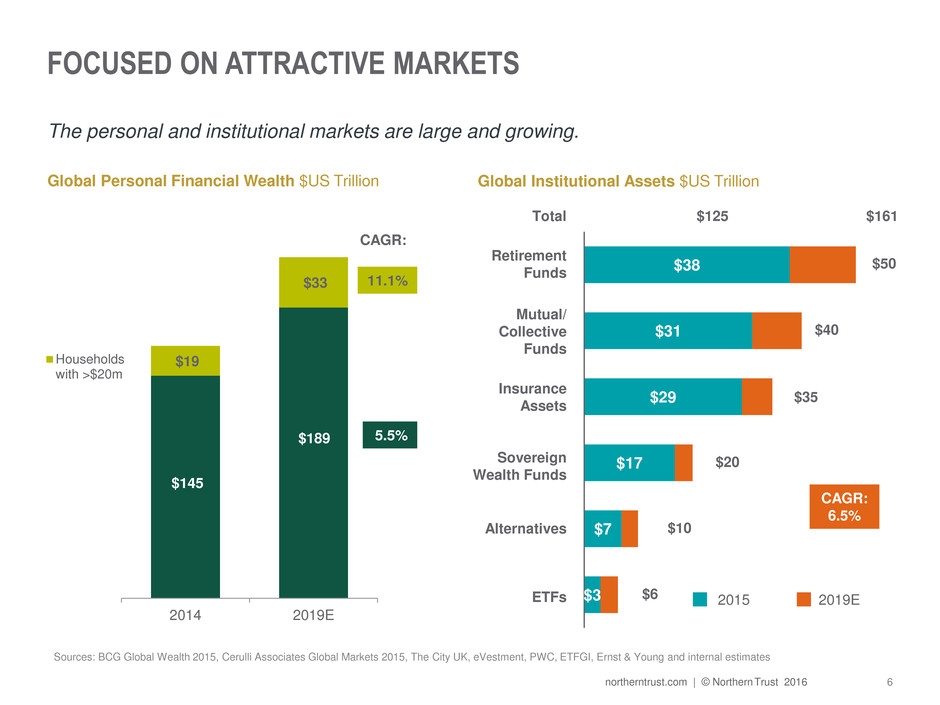
6 northerntrust.com | © Northern Trust 2016 FOCUSED ON ATTRACTIVE MARKETS The personal and institutional markets are large and growing. Global Personal Financial Wealth $US Trillion $145 $189 $19 $33 2014 2019E Households with >$20m CAGR: 5.5% 11.1% Sources: BCG Global Wealth 2015, Cerulli Associates Global Markets 2015, The City UK, eVestment, PWC, ETFGI, Ernst & Young and internal estimates Global Institutional Assets $US Trillion $38 $31 $29 $17 $7 $3 $161 $50 $40 $35 $20 $10 $6 2015 2019E Total $125 Retirement Funds Mutual/ Collective Funds Insurance Assets Sovereign Wealth Funds Alternatives ETFs CAGR: 6.5%
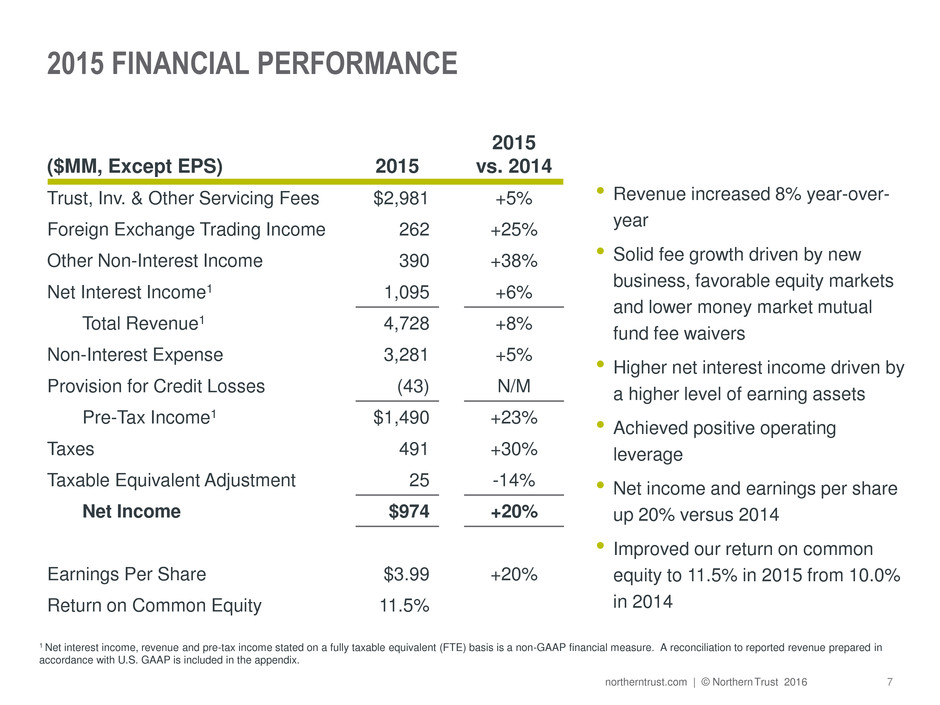
7 northerntrust.com | © Northern Trust 2016 2015 FINANCIAL PERFORMANCE • Revenue increased 8% year-over- year • Solid fee growth driven by new business, favorable equity markets and lower money market mutual fund fee waivers • Higher net interest income driven by a higher level of earning assets • Achieved positive operating leverage • Net income and earnings per share up 20% versus 2014 • Improved our return on common equity to 11.5% in 2015 from 10.0% in 2014 ($MM, Except EPS) 2015 2015 vs. 2014 Trust, Inv. & Other Servicing Fees $2,981 +5% Foreign Exchange Trading Income 262 +25% Other Non-Interest Income 390 +38% Net Interest Income1 1,095 +6% Total Revenue1 4,728 +8% Non-Interest Expense 3,281 +5% Provision for Credit Losses (43) N/M Pre-Tax Income1 $1,490 +23% Taxes 491 +30% Taxable Equivalent Adjustment 25 -14% Net Income $974 +20% Earnings Per Share $3.99 +20% Return on Common Equity 11.5% 1 Net interest income, revenue and pre-tax income stated on a fully taxable equivalent (FTE) basis is a non-GAAP financial measure. A reconciliation to reported revenue prepared in accordance with U.S. GAAP is included in the appendix.
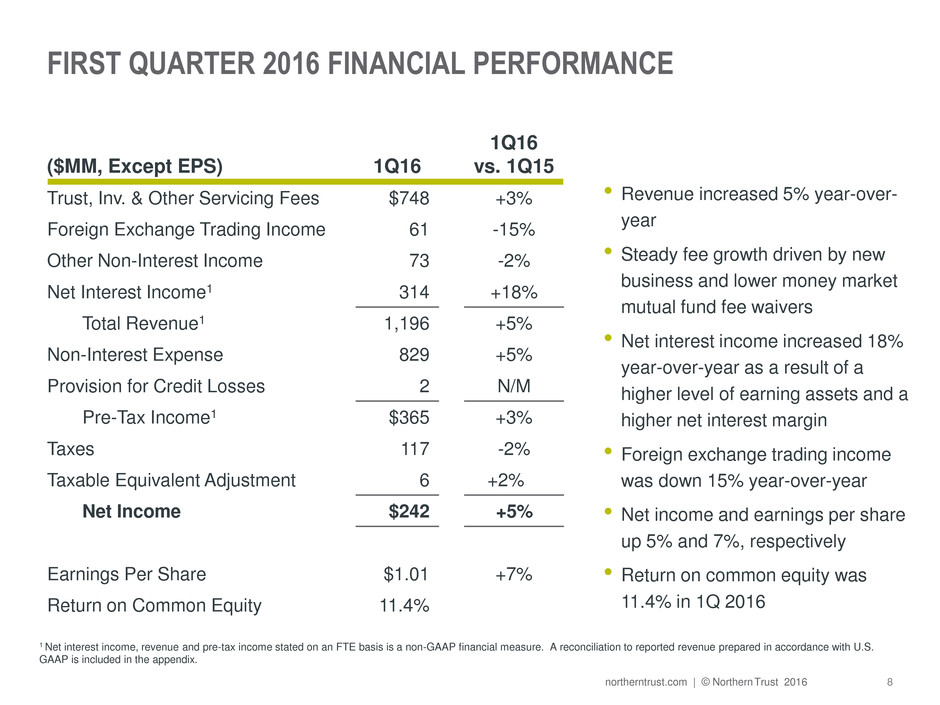
8 northerntrust.com | © Northern Trust 2016 FIRST QUARTER 2016 FINANCIAL PERFORMANCE • Revenue increased 5% year-over- year • Steady fee growth driven by new business and lower money market mutual fund fee waivers • Net interest income increased 18% year-over-year as a result of a higher level of earning assets and a higher net interest margin • Foreign exchange trading income was down 15% year-over-year • Net income and earnings per share up 5% and 7%, respectively • Return on common equity was 11.4% in 1Q 2016 ($MM, Except EPS) 1Q16 1Q16 vs. 1Q15 Trust, Inv. & Other Servicing Fees $748 +3% Foreign Exchange Trading Income 61 -15% Other Non-Interest Income 73 -2% Net Interest Income1 314 +18% Total Revenue1 1,196 +5% Non-Interest Expense 829 +5% Provision for Credit Losses 2 N/M Pre-Tax Income1 $365 +3% Taxes 117 -2% Taxable Equivalent Adjustment 6 +2%% Net Income $242 +5% Earnings Per Share $1.01 +7% Return on Common Equity 11.4% 1 Net interest income, revenue and pre-tax income stated on an FTE basis is a non-GAAP financial measure. A reconciliation to reported revenue prepared in accordance with U.S. GAAP is included in the appendix.
9 northerntrust.com | © Northern Trust 2016 FOCUSED ON ACHIEVING SUSTAINABLE PROFITABLE GROWTH We are executing on our strategies: • Disciplined, client-centric approach • Accelerate revenue growth • Improve profitability and returns • Return capital to shareholders
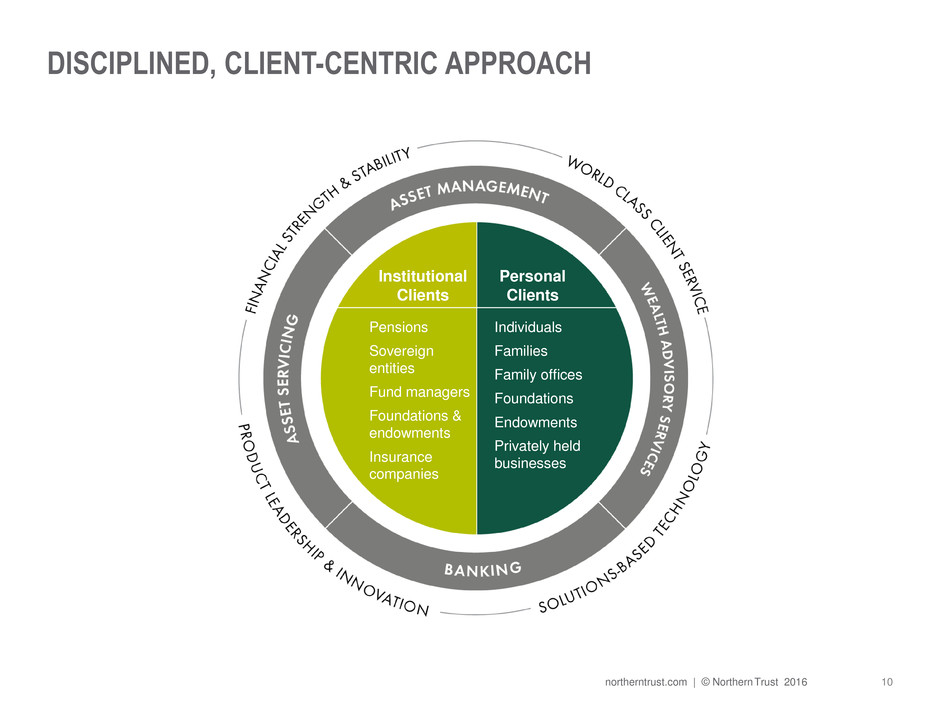
10 northerntrust.com | © Northern Trust 2016 DISCIPLINED, CLIENT-CENTRIC APPROACH Pensions Sovereign entities Fund managers Foundations & endowments Insurance companies Individuals Families Family offices Foundations Endowments Privately held businesses Institutional Clients Personal Clients
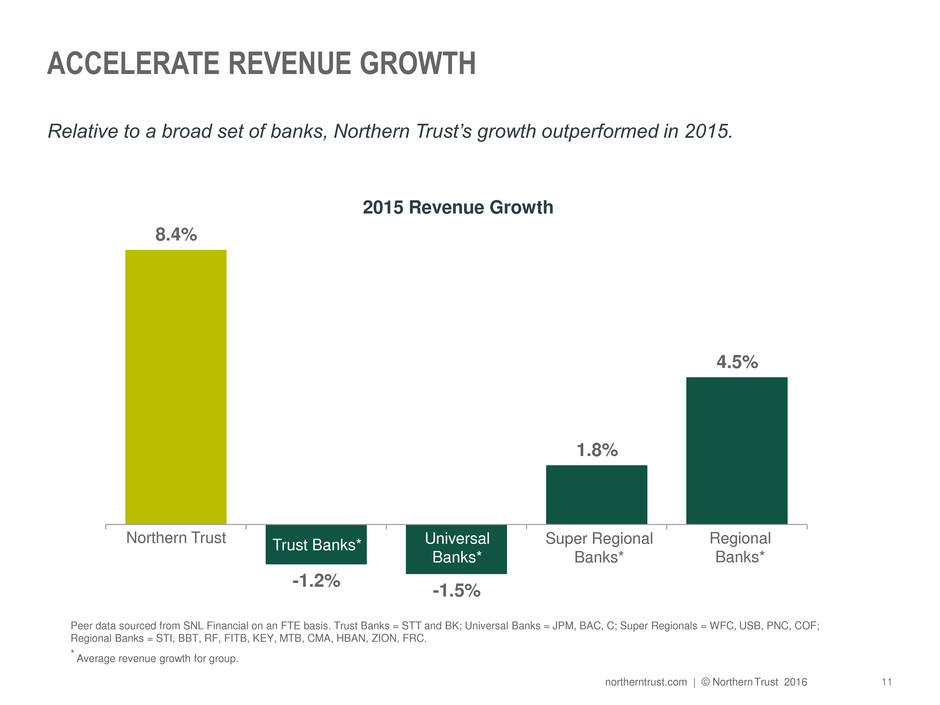
11 northerntrust.com | © Northern Trust 2016 ACCELERATE REVENUE GROWTH 8.4% -1.2% -1.5% 1.8% 4.5% Peer data sourced from SNL Financial on an FTE basis. Trust Banks = STT and BK; Universal Banks = JPM, BAC, C; Super Regionals = WFC, USB, PNC, COF; Regional Banks = STI, BBT, RF, FITB, KEY, MTB, CMA, HBAN, ZION, FRC. * Average revenue growth for group. Northern Trust Trust Banks* Universal Banks* Super Regional Banks* Regional Banks* Relative to a broad set of banks, Northern Trust’s growth outperformed in 2015. 2015 Revenue Growth
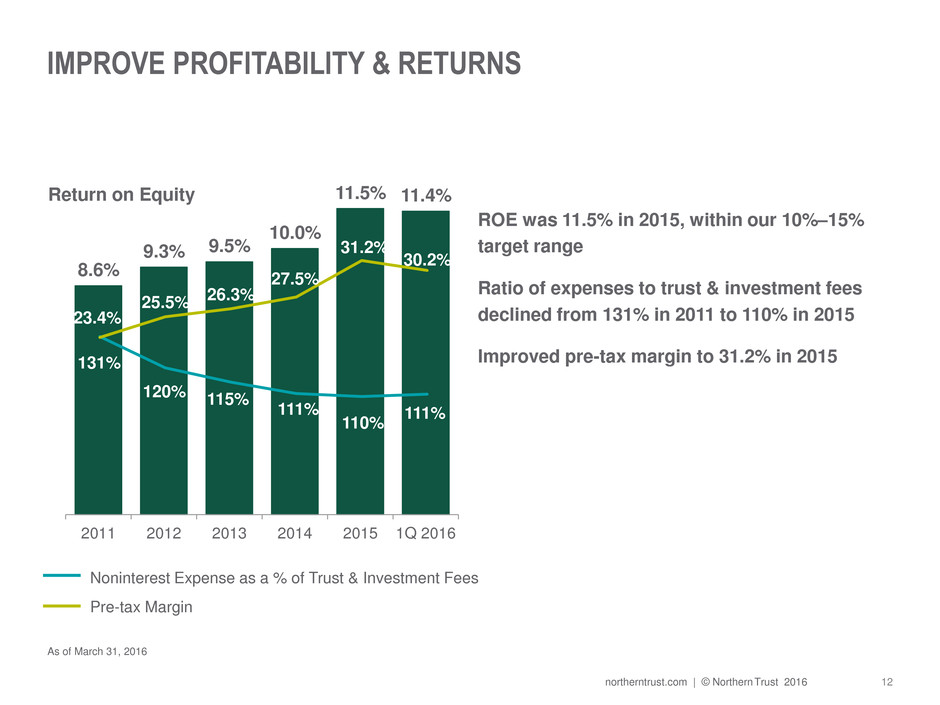
12 northerntrust.com | © Northern Trust 2016 IMPROVE PROFITABILITY & RETURNS ROE was 11.5% in 2015, within our 10%–15% target range Ratio of expenses to trust & investment fees declined from 131% in 2011 to 110% in 2015 Improved pre-tax margin to 31.2% in 2015 As of March 31, 2016 8.6% 9.3% 9.5% 10.0% 11.5% 11.4% 2011 2012 2013 2014 2015 1Q 2016 Pre-tax Margin 131% 120% 115% 111% 110% 111% Noninterest Expense as a % of Trust & Investment Fees Return on Equity 23.4% 25.5% 26.3% 27.5% 31.2% 30.2%
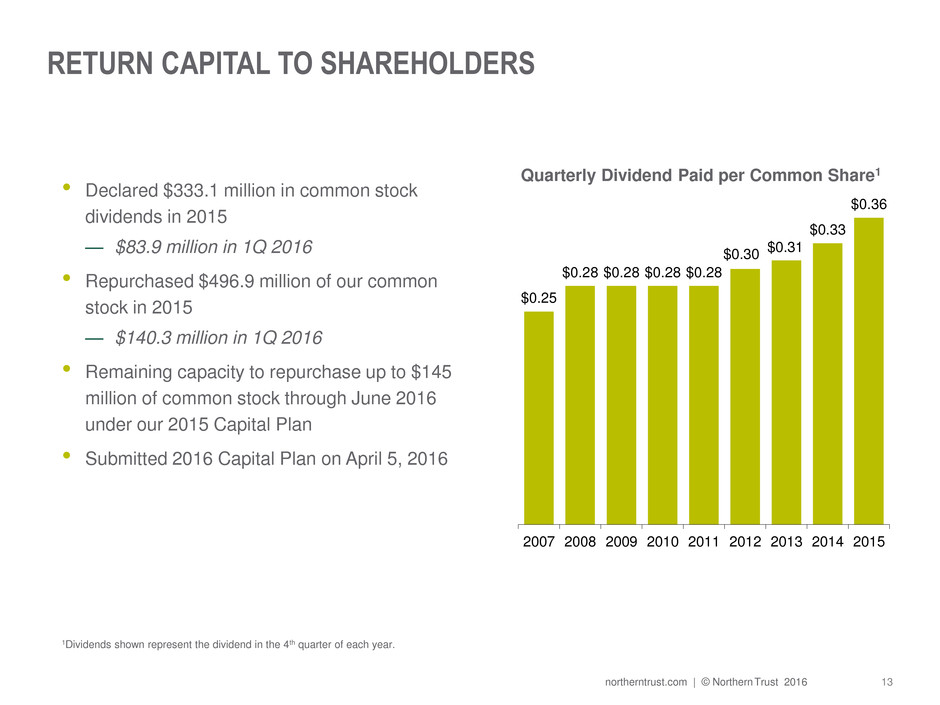
13 northerntrust.com | © Northern Trust 2016 RETURN CAPITAL TO SHAREHOLDERS • Declared $333.1 million in common stock dividends in 2015 — $83.9 million in 1Q 2016 • Repurchased $496.9 million of our common stock in 2015 — $140.3 million in 1Q 2016 • Remaining capacity to repurchase up to $145 million of common stock through June 2016 under our 2015 Capital Plan • Submitted 2016 Capital Plan on April 5, 2016 $0.25 $0.28 $0.28 $0.28 $0.28 $0.30 $0.31 $0.33 $0.36 2007 2008 2009 2010 2011 2012 2013 2014 2015 Quarterly Dividend Paid per Common Share1 1Dividends shown represent the dividend in the 4th quarter of each year.
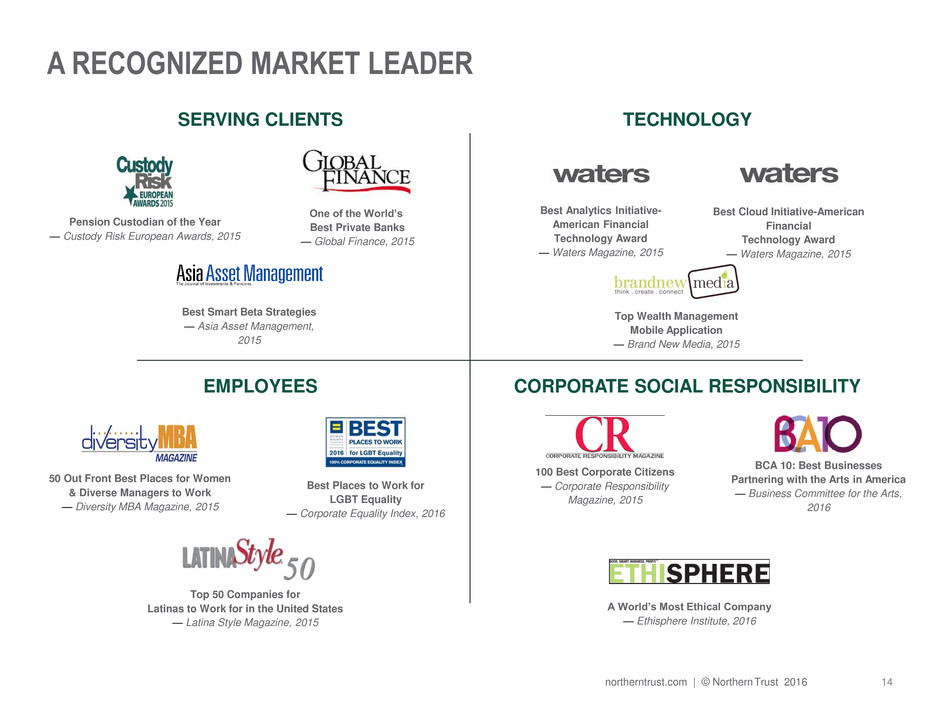
14 northerntrust.com | © Northern Trust 2016 A RECOGNIZED MARKET LEADER Pension Custodian of the Year — Custody Risk European Awards, 2015 One of the World’s Best Private Banks — Global Finance, 2015 Best Smart Beta Strategies — Asia Asset Management, 2015 SERVING CLIENTS TECHNOLOGY Top Wealth Management Mobile Application — Brand New Media, 2015 Best Cloud Initiative-American Financial Technology Award — Waters Magazine, 2015 Best Analytics Initiative- American Financial Technology Award — Waters Magazine, 2015 CORPORATE SOCIAL RESPONSIBILITY 100 Best Corporate Citizens — Corporate Responsibility Magazine, 2015 A World’s Most Ethical Company — Ethisphere Institute, 2016 BCA 10: Best Businesses Partnering with the Arts in America — Business Committee for the Arts, 2016 EMPLOYEES 50 Out Front Best Places for Women & Diverse Managers to Work — Diversity MBA Magazine, 2015 Top 50 Companies for Latinas to Work for in the United States — Latina Style Magazine, 2015 Best Places to Work for LGBT Equality — Corporate Equality Index, 2016
15 northerntrust.com | © Northern Trust 2016 THANK YOU
16 northerntrust.com | © Northern Trust 2016 Appendix NORTHERN TRUST CORPORATION
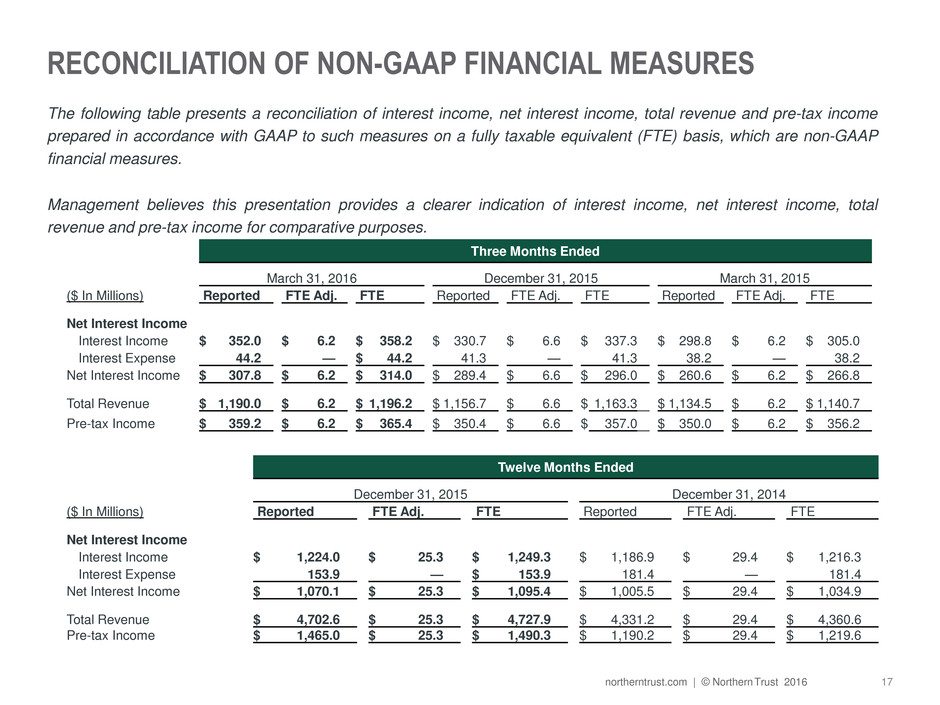
17 northerntrust.com | © Northern Trust 2016 RECONCILIATION OF NON-GAAP FINANCIAL MEASURES The following table presents a reconciliation of interest income, net interest income, total revenue and pre-tax income prepared in accordance with GAAP to such measures on a fully taxable equivalent (FTE) basis, which are non-GAAP financial measures. Management believes this presentation provides a clearer indication of interest income, net interest income, total revenue and pre-tax income for comparative purposes. Twelve Months Ended December 31, 2015 December 31, 2014 ($ In Millions) Reported FTE Adj. FTE Reported FTE Adj. FTE Net Interest Income Interest Income $ 1,224.0 $ 25.3 $ 1,249.3 $ 1,186.9 $ 29.4 $ 1,216.3 Interest Expense 153.9 — $ 153.9 181.4 — 181.4 Net Interest Income $ 1,070.1 $ 25.3 $ 1,095.4 $ 1,005.5 $ 29.4 $ 1,034.9 Total Revenue $ 4,702.6 $ 25.3 $ 4,727.9 $ 4,331.2 $ 29.4 $ 4,360.6 Pre-tax Income $ 1,465.0 $ 25.3 $ 1,490.3 $ 1,190.2 $ 29.4 $ 1,219.6 Three Months Ended March 31, 2016 December 31, 2015 March 31, 2015 ($ In Millions) Reported FTE Adj. FTE Reported FTE Adj. FTE Reported FTE Adj. FTE Net Interest Income Interest Income $ 352.0 $ 6.2 $ 358.2 $ 330.7 $ 6.6 $ 337.3 $ 298.8 $ 6.2 $ 305.0 Interest Expense 44.2 — $ 44.2 41.3 — 41.3 38.2 — 38.2 Net Interest Income $ 307.8 $ 6.2 $ 314.0 $ 289.4 $ 6.6 $ 296.0 $ 260.6 $ 6.2 $ 266.8 Total Revenue $ 1,190.0 $ 6.2 $ 1,196.2 $ 1,156.7 $ 6.6 $ 1,163.3 $ 1,134.5 $ 6.2 $ 1,140.7 Pre-tax Income $ 359.2 $ 6.2 $ 365.4 $ 350.4 $ 6.6 $ 357.0 $ 350.0 $ 6.2 $ 356.2
