Attached files
| file | filename |
|---|---|
| 8-K - 8-K - Rimini Street, Inc. | v437324_8k.htm |
| EX-99.1 - EXHIBIT 99.1 - Rimini Street, Inc. | v437324_ex99-1.htm |
Exhibit 99.2

Investor Presentation Strictly Private & Confidential April 19, 2016 GP Investments Acquisition Corp.

Safe Harbor Statement Disc l a i m e r: T h ese m a t e ri a ls h a ve b e e n pr e p a red f o r i n f o rm a ti o n a l p u rp o ses o n ly a nd ne i t h er W orld Kitchen (“the Com p a n y”) nor M o rg a n Sta n ley m a ke a n y im p li e d re p resen t at i o n s as to the accuracy o r com p le t e n ess of the in f orm a ti o n pr o vide d , or accept a n y lia b il i ty which m a y be b a sed on the in f orm a ti o n cont a in e d her e in or o m itt e d h e refr o m. Y ou a g ree to keep con f id e nt i al the in f orm a ti o n cont a in e d h er e in, the fact th a t th i s d o cum e nt h a s be e n de l ivered to you, and the fact th a t the Com p a n y i s consid e ring a po t e n ti a l tra n sactio n . The esti m at e s, pr o jecti o ns a n d forward lo o king stat e m e nts set forth h e rein were pr e p a red b a sed o n vari o us assump t io n s which m a y n o t be re a lized in fact, a n d sh o uld n o t be re l ied u p on as an accurate re p resen t at i on of fu t ure resul t s, which m a y di f fer m a ter i al l y from the in f orm a ti o n pr e sent e d her e . Nei t h e r t h e Com p a n y n or M o rg a n Sta n ley a ssu m e a ny resp o nsib i l i ty to u p d a te a n y of the esti m at e s, pr o jecti o ns or forw a rd lo o king stat e m e nts cont a in e d h er e in. The Co m p a ny will m a ke no re p resen t at i o n s re g ar d ing its b u siness, o p er a ti o ns or fin a ncial resul t s except in a ful l y executed d e fi n itive a g re e m e nt a p pr o ved by its Board of Directors. Th i s d ocu m e n t: (i) is n o t an o f fer or invit a ti o n b y Mor g an Sta n ley o r the Com p a n y to p u rchase or sell securiti e s o r assets, whe t h e r in rel a ti o n to the pr o p o sed t ra n saction or ot h erwise n o r a n y form of comm i tm e nt or recom m e n d a ti o n by M o rg a n Sta n ley or the Com p a n y; a n d ( i i) does n ot form the basis o f a n y contract u al or ot h er a g re e m e nt in rel a ti o n t o th i s tra n sactio n . 2 Investor Presentation This communication is for informational purposes only and has been prepared to assist interested parties in making their own eva luation with respect to the proposed business combination between WKI Holding Company Inc. (“WKI”) and GP Investments Acquisition Corp. (“GPIAC”) and for no other purpose. The information contained herein does not pu rpo rt to be all - inclusive. The data contained herein is derived from various internal and external sources. No representation is made as to the reasonableness of the assumptions made within or the accuracy or completeness of an y projections, modelling or back - testing or any other information contained herein. All levels, prices and spreads are historical and do not represent current market levels, prices or spreads, some or all of which may hav e c hanged since the issuance of this communication. Any data on past performance, modeling or back - testing contained herein is no indication as to future performance. GPIAC assumes no obligation to update the information in thi s communication. No Offer or Solicitation This communication is not intended to and does not constitute an offer to sell or the solicitation of an offer to buy or an i nvi tation to purchase any securities or the solicitation of any vote or approval in any jurisdiction in connection with the proposed business combination between WKI and GPIAC or otherwise, nor shall there be any sale, issuance o r t ransfer of securities in any jurisdiction in contravention of applicable law. Important Information For Investors And Stockholders In connection with the transactions referred to in this communication, GPIAC expects to file a registration statement on Form S - 4 with the Securities and Exchange Commission (“SEC”) containing a preliminary proxy statement of GPIAC that also constitutes a preliminary prospectus of GPIAC. After the registration statement is declared effective GPIAC w ill mail a definitive proxy statement/prospectus to stockholders of GPIAC and stockholders of WKI. This communication is not a substitute for the proxy statement/prospectus or registration statement or for any other document that GP IAC may file with the SEC and send to GPIAC’s stockholders and/or WKI’s stockholders in connection with the proposed transactions. INVESTORS AND SECURITY HOLDERS ARE URGED TO READ THE PROXY STATEMENT/PROSPECTUS AN D O THER DOCUMENTS FILED WITH THE SEC CAREFULLY AND IN THEIR ENTIRETY WHEN THEY BECOME AVAILABLE BECAUSE THEY WILL CONTAIN IMPORTANT INFORMATION. Investors and security holders will be able to ob tai n free copies of the proxy statement/prospectus (when available) and other documents filed with the SEC by GPIAC through the website maintained by the SEC at http://www.sec.gov. Copies of the document s f iled with the SEC by GPIAC will be available free of charge by contacting GPIAC at 150 E. 52nd Street, Suite 5003, New York, New York 10022, Attn: Investor Relations. Participants in the Solicitation GPIAC and WKI and their respective directors and certain of their respective executive officers may be considered participant s i n the solicitation of proxies with respect to the proposed transactions under the rules of the SEC. Information about the directors and executive officers of GPIAC is set forth in its Annual Report on Form 10 - K for the year ende d December 31, 2015, which was filed with the SEC on March 28, 2016. Additional information regarding the participants in the proxy solicitations and a description of their direct and indirect interests, by security h old ings or otherwise, will also be included in the proxy statement/prospectus and other relevant materials to be filed with the SEC when they become available. Forward Looking Statements Certain statements included in this communication are not historical facts but are forward - looking statements for purposes of th e safe harbor provisions under The Private Securities Litigation Reform Act of 1995. Forward - looking statements generally are accompanied by words such as “may”, “should”, “would”, “plan”, “intend”, “anticipate”, “believe”, “e sti mate”, “predict”, “potential”, “seem”, “seek”, “continue”, “future”, “will”, “expect”, “outlook” or other similar words, phrases or expressions. These forward - looking statements include statements regarding our industry, future events, the proposed transaction between GPIAC and WKI, the estimated or anticipated future results and benefits of GPIAC and WKI following the transaction, including the likelihood and ability of the parties to succe ssf ully consummate the proposed transaction, future opportunities for the combined company, and other statements that are not historical facts. These statements are based on the current expectations of GPIAC and WKI management and are not predictions of actual performance. These statements are subject to a number of risks and uncertainties regarding GPIAC’s and WKI’s respective businesses and the transaction, and actual results may differ materi all y. These risks and uncertainties include, but are not limited to, changes in the business environment in which GPIAC and WKI operate, including inflation and interest rates, and general financial, economic, regulatory and polit ica l conditions affecting the industry in which WKI operates; changes in taxes, governmental laws, and regulations; competitive product and pricing activity; difficulties of managing growth profitably; the loss of one or more me mbe rs of GPIAC’s or WKI’s management team; the inability of the parties to successfully or timely consummate the proposed transaction, including the risk that the required regulatory approvals are not obtained, are delayed or are subject to unanticipated conditions that could adversely affect the combined company or the expected benefits of the transaction or that the approval of the stockholders of GPIAC and/or the stockholders of WKI for the tr ansaction is not obtained; failure to realize the anticipated benefits of the transaction, including as a result of a delay in consummating the transaction or a delay or difficulty in integrating the businesses of GPIAC and WKI; un cer tainty as to the long - term value of GPIAC common stock; the inability to realize the expected amount and timing of cost savings and operating synergies; those discussed in GPIAC’s Annual Report on Form 10 - K for the year ended Dec ember 31, 2015 under the heading “Risk Factors,” as updated from time to time by GPIAC’s Quarterly Reports on Form 10 - Q and other documents of GPIAC on file with the SEC or in the proxy statement/prospectus that will be filed with the SEC by GPIAC. There may be additional risks that neither GPI AC nor WKI presently know or that GPIAC and WKI currently believe are immaterial that could also cause actual results to differ from those contain ed in the forward - looking statements. In addition, forward - looking statements provide GPIAC’s and WKI’s expectations, plans or forecasts of future events and views as of the date of this communication. GPIAC and WKI anticip ate that subsequent events and developments will cause GPIAC’s and WKI’s assessments to change. However, while GPIAC and WKI may elect to update these forward - looking statements at some point in the future, GPIAC and WKI spe cifically disclaim any obligation to do so. These forward - looking statements should not be relied upon as representing GPIAC’s and WKI’s assessments as of any date subsequent to the date of this communication. Non - GAAP Financial Measures This communication includes non - GAAP financial measures, including EBITDA, Adjusted EBITDA, which are supplemental measures of performance that are neither required by, nor presented in accordance with, U.S. generally accepted accounting principles ("GAAP"). EBITDA is calculated as earnings before interest and taxes plus depreciation and am ort ization. Adjusted EBITDA is calculated as EBITDA, excluding the impact of certain items that WKI management does not consider representative of its ongoing operating performance. A reconciliation of such non - GAAP financial m easures to GAAP financial measures is included as an appendix hereto. GPIAC believes that such non - GAAP financial measures provide useful supplemental information to its board of directors, manageme nt and investors regarding certain financial and business trends relating to WKI's financial condition and results of operation. GPIAC believes such measures, when viewed in conjunction with its consolidated financial st atements, consistency and comparability with WKI’s past financial performance, facilitate period - to - period comparisons of operating performance and may facilitate comparisons with other companies. Undue reliance should not be pl aced on these measures as WKI's only measures of operating performance, nor should such measures be considered in isolation from, or as a substitute for, financial information presented in compliance with GAAP. N on - GAAP financial measures as used in respect of WKI may not be comparable to similarly titled amounts used by other companies.

Today’s Presenter 3 Antonio Bonchristiano CEO , GPIAC and GP Investments Mr. Bonchristiano is CEO of GPIAC and GP Investments (“GP”), a leading alternative investments firm founded in 1993 – GP has raised over US$5 billion from investors worldwide – GP has made investments in over 50 companies across 15 sectors Currently serves on the Board of Directors of AMBEV, BRZ Investimentos , GP Advisors, and Spice Previously served on the boards of Submarino ( Retail / E - commerce ), ALL (Logistics), Gafisa (Homebuilding), BrProperties (Real Estate), Sascar (Fleet Management / Cargo Tracking Services) and BHG (Hospitality) Previously was the Chief Financial Officer of SuperMar Supermercados (Retail) and Founder and Chief Executive Officer of Submarino Mr. Bonchristiano holds a Bachelor’s degree in Politics, Philosophy, and Economics from the University of Oxford

GP Investments Acquisition Corp. to Acquire World Kitchen 4 Transaction Overview On April 19, 2016, GP Investments Acquisition Corp. (NASDAQ: “GPIAU”; “GPIA”; GPIAW”) entered into a definitive agreement to acquire WKI Holding Company, Inc. (“WKI”) – World Kitchen manufactures and markets homeware products in the U.S. and internationally under well - recognized brands including Corelle, Pyrex, CorningWare and Snapware – Following consummation of the transaction, GPIAC will be renamed World Kitchen Group, Inc. and intends to trade on NASDAQ as “WDKN” Transaction highlights: – Leading global housewares company with iconic brands and significant future opportunity for growth – Enterprise Value of approximately US$566 million (1) – Attractive purchase valuation at 7.2x 2016E adj. EBITDA of US$78 million (~20% discount to peers (2) ) – Modest net PF leverage at 3.0x 2016E adj. EBITDA – GP Investments will be the largest single shareholder with 9.3 million shares of common stock, representing ~28% (3) PF ownership – Pro forma cash balance of US$43 million to fund future growth Confidence in growth potential and value creation opportunity of merged entity: – GP Investments will co - invest an additional US$50 million of permanent capital alongside SPAC investors in the form of new common equity at US$10.00 per share – Current WKI shareholders will roll equity to participate in the upside of the merged entity, translating into ~20% (3) PF ownership (1) Based on 33.0mm shares outstanding at US$10.00/share and net debt of US$236mm. (2) The peers include Helen of Troy, Newell Rubbermaid, Spectrum Brands, Tupperware Brands, De’longhi , SEB, Nobia and Libbey . (3) Based on US$10.00 per share.

GP Investments History of Success Source : Company information, Factset, Capital IQ and Mergermarket. Select Transaction Examples 5 Founded in 1993 with investments in over 50 companies, executing over 20 equity capital market transactions, GP Investments is a leading alternative investments firm with a track record of success having raised US$5 billion of capital across 15 sectors. Investment Initial Investment Date (Exit) Overview Return Highlights 2006 (2012) Leading full - service Brazilian steakhouses in the US and Brazil; GP grew the restaurant base from three to seven in Brazil and from six to eighteen in the United States Overall investment generated a 24% IRR and 3.4x cash - on - cash (in US$ terms) in six years 2007 (2009) Diversified consumer goods company with over 150 brands Overall investment generated a 56% IRR and 2.4x cash - on - cash (in US$ terms) just two years after the original investment 2006 (2010) Brazil’s largest integrated shopping mall company; Led by a GP Partner, BR Malls grew its portfolio from six to forty malls Overall investment generated a 47% IRR and 3.2x cash - on - cash (in US$ terms) in four years Other Investments

GP’s Investment Philosophy 6 Value creation through active management and operationally - oriented approach Significant ownership structures that ensure influence and implementation of strategic change Accelerated growth through revenue and margin expansion and M&A Core Principals Management Tools Focus on results and search for excellence Attraction , retention and development of the best talents Alignment of interests and meritocracy Transparency and ethics in the conduct of business “ No measurement, no management” Standard approach for effective board monitoring Flat hierarchical structures and open communication Permanent focus on cost control Aggressive performance - based compensation Management techniques: EVAtm , Six Sigma, Zero Based Budget , Goal - Based Management 1 2 3 4 5 1 2 3 4 5

Thesis for Investment in World Kitchen 7 Branded Consumer Products Company Multiple Value Creation Levers to Drive Growth Global Footprint Industry - Leading Innovation Stable Organic Growth Profile Compelling Consolidation Opportunity Iconic Brands with Leading Market Share in Key Categories Proprietary Technology Highly Fragmented H omeware S pace Detailed due diligence process with numerous top - tier third party consultants engaged across functions including business, manufacturing, legal, financial, insurance and IT Predictable and Attractive Cash Flow Generation High Growth Emerging Market Exposure

64% 11% 9% 4% 4% 4% 3% 1% U.S. Greater China Korea Canada ROA Australia Latin America / EMEA India Snapshot of World Kitchen Net Sales (US$ in millions) Key Financials FY 2015 Net Sales by Geography Diverse Portfolio of Key Leading Brands Sour c e: Company’s audited financials, NPD a n d AC N i e l sen POS D a ta . Y T D E n d i ng D e cem b er 2 0 1 4 A (1) Gre a ter C h i n a i n cl u d e s ma i n l a n d C h i n a, H o ng K o ng a n d T a i w an. (2) ROA = R e st of Asia. $630 $644 $672 FY 2013 FY 2014 FY 2015 $71 $75 $77 FY 2013 FY 2014 FY 2015 8 Adj. EBITDA (US$ in millions) Total Net Sales: US$672mm (2) (1)

Region Projected Market Size (US$ in millions), 2019 CAGR (2010 – 2014) CAGR (2015 – 2019) APAC (Excluding China) China Western Europe North America LatAm Eastern Europe MEA Homewares: An Attractive and Fragmented Global Category 9 Outsized Momentum in APAC and China U.S. Homewares – Stable and Large Category Source: Euromonitor , IBIS World Kitchenware and Cookware Market Research . (1) Includes cookware, kitchen tools and gadgets, food storage, beverageware , dinnerware, cutlery/kitchen utensils, bakeware, and flatware. 4.9% 5.8% 13.5% 12.7% (0.5)% 2.1% 2.0% 3.4% 8.7% 13.7% 5.2% 5.4% 5.8% 8.4% 17,437 23,100 29,691 15,841 12,360 7,222 4,983 Markets with WKI Presence US Homewares Market (1) (US$ in b illions) 10.4 10.7 11.0 11.1 11.3 11.6 11.8 2012 2013 2014 2015 2016 2017 2018 Highly Fragmented U.S. Homewares Market Cookware Food Storage Bakeware Cutlery / Kitchen Utensils Private Label Private Label Private Label Private Label

Continued Organic Growth Platform Optimization Sector Consolidation Opportunity Investment Highlights Leading Market Positions via Iconic Brand Portfolio in Large and Stable Homeware Sector Global Footprint Across Multiple Brands, Channels and Retail Partners Proprietary Technology and Track Record of Innovation Solid Financial Performance With Consistent Growth Three Pillar Strategy for Growth and Value Creation 10 1 2 3 4 5 5 A 5 B 5 C

Leading Market Share and Iconic Brands Product Category Market Share Representative Products Dinnerware Bakeware Storage Bakeware Cookware Cutware Brands 11 International Sales No.1 in Korea No.1 in U.S. No.1 in Canada No.1 in Singapore No.1 in U.S. No.1 in Canada No.4 in U.S. No.1 in U.S. No.1 in Canada No.1 in Asia Pacific No.1 in China No.3 in U.S. 73% 48% 31% 56% 100% 38% 1 Source: Management presentation and Company’s audited financials. Other Brands

Diverse, Global Footprint Across Products and Channels North American Channel Mix (2015) Strong Relationships with Blue Chip North American Customers Net Sales by Geography (2015) Iconic Brands Drive Net Sales Across Regions T o tal US $6 72 MM Source: Management presentation. (1) ROA = R e st of Asia . (2) Gre a ter C h i n a i n cl u d e s ma i n l a n d C h i n a, H o ng K o ng a n d T a i w an . (3) Includes worldkitchen.com and all online - only retailers; major brick and mortar retailers’ online channel is included within the ir respective segments. 12 U.S., 64% Greater China (2) , 11% Korea , 9% Canada, 4% ROA (1) , 4% Australia , 4% Latin America / EMEA , 3% India , 1% 2 Mass, 29% Retail, 16% Department , 13% Club , 13% Online (3) , 9% Grocery , 9% Specialty Channel, 5% Other , 5% Hardware , 1%

$164 $170 $189 $197 $208 2013 2014 2015 2016 2017 Significant Presence in High Growth Emerging Markets 13 Emerging Markets Platform Highlights 5.4% 13.7% Viable Households (in millions) (3) Japan 38.2 Indonesia 3.3 1.3 Vietnam 1.9 Thailand Philippines 1.6 Other Opportunities: Opportunities in Asia: Latin America Eastern Europe ’15 – ’19 Dinnerware Category Growth Balanced, h ighly p rofitable c ountry and channel p ortfolio Focused growth s trategy with well - managed go - to - market m odels t ailored to each geography Significant untapped g rowth o pportunities in key c ountries and product c ategories Strong brands with high r egional a wareness and sustained b rand b uilding with a focus on digital Solid global and r egional p roduct p ipeline e nsures h ealthy, profitable g rowth Growth Generated from Attractive Geographic Markets 2 Large Untapped Opportunity in Other High - Growth Markets $466 $474 $483 $490 $507 2013 2014 2015 2016 2017 Emerging Markets Driving Outsized Growth (1) (Net Sales, US$ in millions) Supported by Steady Developed Market Presence (Net Sales, US$ in millions) Source: Management presentation, Company’s audited f inancials and Euromonitor . (1) Emerging markets constitute Asia, Latin America and EMEA. (2) Includes allocation of corporate - related adjustments as % of total net sales. (3) Per Euromonitor as of 2013, China per management estimate. (2) (2) (2) (2)

Proprietary Technology and Track Record of Innovation 14 Track Record of Innovation 2013A 2014A 2015A Vitality Index (1) 22% 26% 30% Global Product Launches 21 31 37 Case Studies on Innovation Features x Interchangeable lid fits on glass and plastic World Kitchen houses proprietary glass - making know - how and processes – Only manufacturer of unique 3 - layer Vitrelle ® glass used in Corelle – Vitrelle ® is a lightweight yet stronger and more durable glass product relative to competition In - house manufacturing processes account for 64% of products Manufactu ri n g model emphas i z e s the ha l o , w hich is critical to cons u mers and retail e rs gl o ba l ly Proprietary Technology Manufacturing Facilities Corning, NY Charleroi, PA Mira Loma, CA Johor Bahru , Malaysia 3 Source: Management presentation. (1) Reflects % of net sales coming from products launched in the last 3 years. x Breakthrough color infusion technology Brands Products x First, airtight, leak - proof 4 - latch line in bakeware aisle

15 Solid Financial Performance With Consistent Growth (1) 4 Net Sales Gross Profit Adj. EBITDA $630 $644 $672 $687 $715 FY 2013 FY 2014 FY 2015 FY 2016 FY 2017 $194 $192 $197 $205 $217 FY 2013 FY 2014 FY 2015 FY 2016 FY 2017 $71 $75 $77 $78 $84 FY 2013 FY 2014 FY 2015 FY 2016 FY 2017 YoY Growth: 2.1% 2.3% 4.3% 2.2% 4.1% Margin: -- -- -- -- -- 7.1% (1.2%) 2.7% 3.8% 6.2% 30.9% 29.8% 29.3% 29.8% 30.4% 7.2% 5.8% 2.6% 2.2% 7.4% 11.2% 11.6% 11.4% 11.4% 11.8% Source: Company’s audited financials. (1) Preliminary guidance for FY 2016 and FY 2017. (US $ in millions) (US $ in millions) (US $ in millions)

Three Pillar Strategy for Growth and Value Creation 16 Online New Channels, Categories Revitalize Brands Optimized Store Network Improved Select Rates Lean G&A 5 Sector Consolidation Opportunity Complementary Sales Cost Synergies Advanced Capabilities

Continued Organic Growth 17 5 A 1 Online 2 New Product Development 3 Expand Channels 4 Revitalize Brands Enhance presence in underrepresented channels such as foodservice and high - end specialty stores (> US$2 billion market) 5 New Market Opportunities Source: Euromonitor . Pursue omni channel opportunities Enter new markets at premium price points Initially enter via distributors and shift to direct model (e.g. Korea)
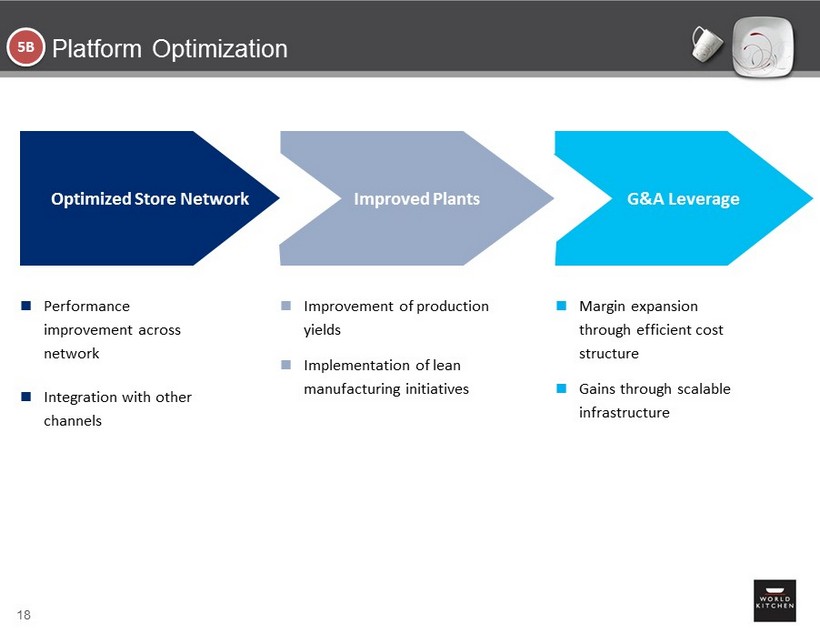
Platform Optimization 18 5 B Performance improvement across network Integration with other channels Improvement of production yields Implementation of lean manufacturing initiatives Improved Plants Optimized Store Network G&A Leverage Margin expansion through efficient cost structure Gains through scalable infrastructure

Sector Consolidation Opportunity in Homeware 19 5 C WKI H a s Significa n t C a tegory White Sp a ce in a Highly Fragmented Indu s try Hous e w a r e s Mark e t by Category Substantial Market Expansion Opportunity Key Acquisition Criterion U n derpe ne trat e d C a tegories for WKI 53% of Total Hous e war e s Mar k et C a tegories in W h ich WKI C o mpetes 47% of Total Hous e war e s Mar k et Kitchen Utensils & Gadgets 14% Stove Top Cookware 24% Beverageware 15% Ovenware 7% Cutlery 9% Food Storage 11% Dinnerware 20% Geography Category Beverageware Stove Top Cookware Kitchen Utensils & Gadgets Europe Latin America Asia x Strong Brands x Complementary Sales x Low Capital Expenditures x Cost Synergies x Advanced Capabilities

Transaction Overview Transaction Overview On April 19, 2016, GP Investments Acquisition Corp. ( “GPIAU”; “GPIA”; GPIAW ”) entered into a definitive agreement to acquire WKI Holding Company, Inc. (“WKI”) – Following consummation of the transaction, GPIAC will be renamed World Kitchen Group, Inc. and intends to trade on NASDAQ as “WDKN” Confidence in Transaction by Primary Shareholders GP Investments will co - invest US$50 million of new equity alongside investors in the form of common equity at US$10.00 per share Current WKI Shareholders will roll 6.45 million shares at US$10.00 per share (US$64.5 million) of existing equity into World Kitchen Attractive Valuation and Financial Flexibility to Spur Future Growth The enterprise value of US$566 million implies a 7.2x 2016E adj. EBITDA for the merged company Implied post closing equity value of US$330 million at US$10.00 per share Proceeds from the transaction will be used to refinance WKI’s existing US$242 million in gross debt In addition, an estimated US$43 million (1) will go to WKI’s cash balance to strengthen the capital structure and fund future growth The Company will raise a total funded debt of US$275 million at closing, including an ABL Facility and TLB The US$173 million of cash in Trust plus GP new co - investment and new debt will be used to: – Fund the cash consideration – Pay down existing debt – Cash to balance sheet Timing Preliminary proxy statement / prospectus expected to be filed with the SEC in April GPIAC Shareholder Vote and closing expected in the third quarter of 2016 20 (1) Assumes no redemptions by current shareholders.

7.2x 14.5x 11.3x 11.3x 9.4x 9.1x 8.8x 7.9x 6.5x WKI HELE-US NWL SPB-US DLG-IT TUP-US SK-FR NOBI-SE LBY Valuation Benchmarking (1) E V / CY 2016E EBITDA Median: 9.3x Source: Factset and management presentation. Market data as of April 8, 2016. (1) World Kitchen’s estimate is calculated b ased on US$566 million of enterprise value. (2) Pro forma for the acquisition of Jarden . 21 (1)
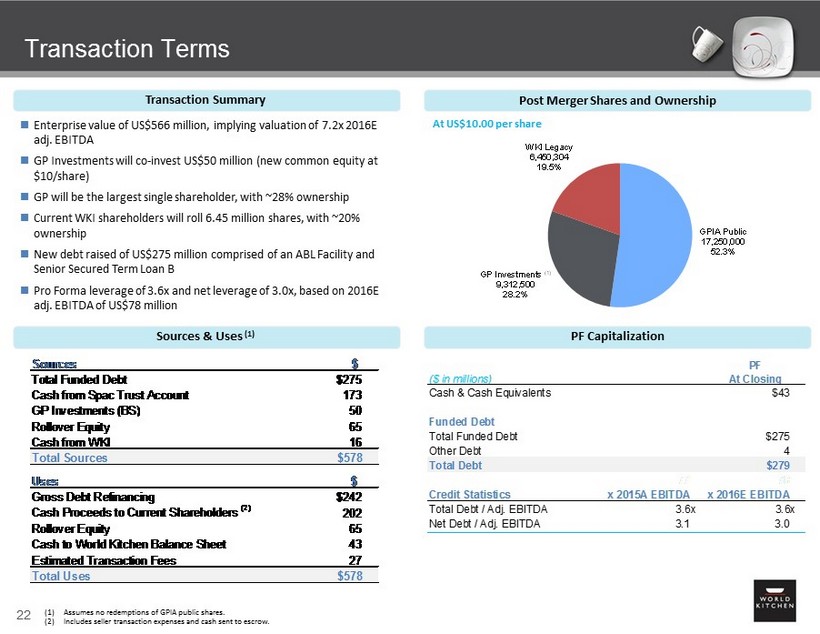
Transaction Terms Sources & Uses (1) Transaction Summary Enterprise value of US$566 million, implying valuation of 7.2x 2016E adj. EBITDA GP Investments will co - invest US$50 million (new common equity at $10/share) GP will be the largest single shareholder, with ~28% ownership Current WKI shareholders will roll 6.45 million shares, with ~20% ownership New debt raised of US$275 million comprised of an ABL Facility and Senior Secured Term Loan B Pro Forma leverage of 3.6x and net leverage of 3.0x, based on 2016E adj. EBITDA of US$78 million Post Merger Shares and Ownership 22 PF Capitalization GPIA Public 17,250,000 52.3% GP Investments (1) 9,312,500 28.2% WKI Legacy 6,450,304 19.5% At US$10.00 per share PF ($ in millions) At Closing Cash & Cash Equivalents $43 Funded Debt Total Funded Debt $275 Other Debt 4 Total Debt $279 77 78 Credit Statistics x 2015A EBITDA x 2016E EBITDA Total Debt / Adj. EBITDA 3.6x 3.6x Net Debt / Adj. EBITDA 3.1 3.0 (1) Assumes no redemptions of GPIA public shares. (2) Includes seller transaction expenses and cash sent to escrow. Sources $ Total Funded Debt $275 Cash from Spac Trust Account 173 GP Investments (BS) 50 Rollover Equity 65 Cash from WKI 16 Total Sources $578 Uses $ Gross Debt Refinancing $242 Cash Proceeds to Current Shareholders (2) 202 Rollover Equity 65 Cash to World Kitchen Balance Sheet 43 Estimated Transaction Fees 27 Total Uses $578

Continued Organic Growth Platform Optimization Sector Consolidation Opportunity Investment Highlights Leading Market Positions via Iconic Brand Portfolio in Large and Stable Homeware Sector Global Footprint Across Multiple Brands, Channels and Retail Partners Proprietary Technology and Track Record of Innovation Solid Financial Performance With Consistent Growth Three Pillar Strategy for Growth and Value Creation 23 1 2 3 4 5 5 A 5 B 5 C

Appendix

Non - GAAP Reconciliation 25 (US$ in millions) (1) Includes losses on fixed asset disposals, losses on purchase of inventory, one - time cost associated with HQ relocation, severanc e costs as a result of restructuring and various other non - recurring costs. FY 2013 FY 2014 FY 2015 Net Income (Loss) ($12.2) ($75.5) $11.6 Interest Expense - Net 18.2 20.7 19.6 Income Tax Expense (Benefit) (0.6) 80.0 3.6 D&A 41.9 41.8 37.3 EBITDA $47.3 $67.0 $72.1 Management Adjustments Stock-Based Compensation $1.5 $0.8 $1.2 Cost Reductions 2.2 3.8 1.4 Restructuring Charges 16.5 2.6 1.0 Other Adjustments (1) 3.1 0.7 0.8 Adjusted EBITDA $70.6 $74.8 $76.6