Attached files
| file | filename |
|---|---|
| EX-23 - EX-23 - HOOKER FURNITURE CORP | ex23.htm |
| EX-31.1 - EX-31.1 - HOOKER FURNITURE CORP | ex31-1.htm |
| EX-31.2 - EX-31.2 - HOOKER FURNITURE CORP | ex31-2.htm |
| EX-32.1 - EX-32.1 - HOOKER FURNITURE CORP | ex32-1.htm |
| EX-10.1(I) - EX-10.1(I) - HOOKER FURNITURE CORP | ex10-1i.htm |
UNITED STATES
SECURITIES AND EXCHANGE COMMISSION
Washington, DC 20549
Form 10-K
Annual Report Pursuant to Section 13 or 15(d) of the Securities Exchange Act of 1934
For the fiscal year ended January 31, 2016
Commission file number 000-25349
HOOKER FURNITURE CORPORATION
(Exact name of registrant as specified in its charter)
| Virginia | 54-0251350 |
| (State or other jurisdiction of incorporation or organization) | (I.R.S. Employer Identification Number) |
440 East Commonwealth Boulevard, Martinsville, VA 24112
(Address of principal executive offices, Zip Code)
(276) 632-2133
(Registrant’s telephone number, including area code)
Securities registered pursuant to Section 12(b) of the Act:
|
Title of Each Class
|
Name of Each Exchange
on Which Registered
|
| Common Stock, no par value | NASDAQ Global Select Market |
Securities registered pursuant to Section 12(g) of the Act: None
Indicate by check mark if the registrant is a well-known seasoned issuer, as defined in Rule 405 of the Securities Act. Yes o No x
Indicate by check mark if the registrant is not required to file reports pursuant to Section 13 or Section 15(d) of the Act. Yes o No x
Indicate by check mark whether the registrant (1) has filed all reports required to be filed by Section 13 or 15(d) of the Securities Exchange Act of 1934 during the preceding 12 months (or for such shorter period that the registrant was required to file such reports), and (2) has been subject to such filing requirements for the past 90 days. Yes x No o
Indicate by check mark whether the registrant has submitted electronically and posted on its corporate Web site, if any, every Interactive Data File required to be submitted and posted pursuant to Rule 405 of Regulation S-T (§232.405 of this chapter) during the preceding 12 months (or for such shorter period that the registrant was required to submit and post such files). Yes x No o
Indicate by check mark if disclosure of delinquent filers pursuant to Item 405 of Regulation S-K (§229.405 of this chapter) is not contained herein, and will not be contained, to the best of registrant’s knowledge, in definitive proxy or information statements incorporated by reference in Part III of this Form 10-K or any amendment to this Form 10-K. x
Indicate by check mark whether the registrant is a large accelerated filer, an accelerated filer, a non-accelerated filer, or a smaller reporting company. See the definitions of “large accelerated filer,” “accelerated filer” and “smaller reporting company” in Rule 12b-2 of the Exchange Act. (Check one):
|
Large accelerated Filer o
|
Accelerated Filer x
|
|
Non-accelerated Filer o
(Do not check if a smaller reporting company)
|
Smaller reporting company o
|
Indicate by check mark whether the registrant is a shell company (as defined in Rule 12b-2 of the Act). Yes o No x
State the aggregate market value of the voting and non-voting common equity held by non-affiliates computed by reference to the price at which the common equity was last sold, or the average bid and asked price of such common equity, as of the last business day of the registrant’s most recently completed second fiscal quarter: $262.9 million.
Indicate the number of shares outstanding of each of the registrant’s classes of common stock as of April 8, 2016:
| Common stock, no par value |
11,535,251
|
| (Class of common stock) | (Number of shares) |
Documents incorporated by reference: Portions of the registrant’s definitive Proxy Statement for its Annual Meeting of Shareholders scheduled to be held June 7, 2016 are incorporated by reference into Part III.
Hooker Furniture Corporation
TABLE OF CONTENTS
|
Part I
|
Page
|
|
|
Item 1.
|
5
|
|
|
Item 1A.
|
12
|
|
|
Item 1B.
|
20
|
|
|
Item 2.
|
20
|
|
|
Item 3.
|
21
|
|
|
Item 4.
|
21
|
|
|
22
|
||
|
Part II
|
||
|
Item 5.
|
23
|
|
|
Item 6.
|
25
|
|
|
Item 7.
|
26
|
|
|
Item 7A.
|
43
|
|
|
Item 8.
|
44
|
|
|
Item 9.
|
44
|
|
|
Item 9A.
|
44
|
|
|
Item 9B.
|
44
|
|
|
Part III
|
||
|
Item 10.
|
45
|
|
|
Item 11.
|
45
|
|
|
Item 12.
|
45
|
|
|
Item 13.
|
45
|
|
|
Item 14.
|
45
|
|
|
Part IV
|
||
|
Item 15.
|
46
|
|
|
48
|
||
|
Index to Consolidated Financial Statements
|
F-1
|
|
All references to the “Company,” “we,” “us” and “our” in this document refer to Hooker Furniture Corporation and its consolidated subsidiaries, unless specifically referring to segment information. All references to 2016, 2015, 2014, 2013 and 2012 or other years are referring to our fiscal years, unless otherwise stated. Our fiscal years end on the Sunday closest to January 31. Our quarterly periods are based on thirteen-week “reporting periods” (which end on a Sunday) rather than quarterly periods consisting of three calendar months. As a result, each quarterly period generally is thirteen weeks, or 91 days, long, except as noted above. In some years (generally once every six years) the fourth quarter will be fourteen weeks long and the fiscal year will consist of fifty-three weeks. The 2013 fiscal year that ended on February 3, 2013 was a 53-week fiscal year.
Forward-Looking Statements
Certain statements made in this report, including under Part II, Item 7 – “Management’s Discussion and Analysis of Financial Condition and Results of Operations,” and in the notes to the consolidated financial statements included in this report, are not based on historical facts, but are forward-looking statements. These statements reflect our reasonable judgment with respect to future events and typically can be identified by the use of forward-looking terminology such as “believes,” “expects,” “projects,” “intends,” “plans,” “may,” “will,” “should,” “would,” “could” or “anticipates,” or the negative thereof, or other variations thereon, or comparable terminology, or by discussions of strategy. Forward-looking statements are subject to risks and uncertainties that could cause actual results to differ materially from those in the forward-looking statements. Those risks and uncertainties include but are not limited to:
|
|
§
|
general economic or business conditions, both domestically and internationally, and instability in the financial and credit markets, including their potential impact on our (i) sales and operating costs and access to financing or (ii) customers and suppliers and their ability to obtain financing or generate the cash necessary to conduct their respective businesses;
|
|
|
§
|
the risks related to the recent acquisition of substantially all of the assets of Home Meridian International, Inc., (“HMI”) including maintaining HMI’s existing customer relationships, deal-related costs to be recognized in fiscal 2017, integration costs, costs related to acquisition debt, including debt service costs, interest rate volatility, the use of operating cash flows to service debt to the detriment of other corporate initiatives or strategic opportunities, financial statement charges related to the application of current accounting guidance in accounting for the acquisition, the recognition of significant additional depreciation and amortization expenses by the combined entity, the loss of key employees from HMI, the ongoing costs related to the assumption of HMI’s pension liabilities, the disruption of ongoing businesses or inconsistencies in standards, controls, procedures and policies across the companies which could adversely affect our internal control or information systems and the costs of bringing them into compliance and failure to realize benefits anticipated from the acquisition;
|
|
|
§
|
the risks specifically related to HMI’s operations including significant concentrations of its sales and accounts receivable in only a few customers or disruptions affecting its Madison, NC, Mayodan, NC or Redlands, CA warehouses or its High Point, NC administrative facilities;
|
|
|
§
|
achieving and managing growth and change, and the risks associated with new business lines, acquisitions, restructurings, strategic alliances and international operations;
|
|
|
§
|
our ability to successfully implement our business plan to increase sales and improve financial performance;
|
|
|
§
|
the cost and difficulty of marketing and selling our products in foreign markets;
|
|
|
§
|
disruptions involving our vendors or the transportation and handling industries, particularly those affecting imported products from China and Vietnam, including customs issues, labor stoppages, strikes or slowdowns and the availability of shipping containers and cargo ships;
|
|
|
§
|
the interruption, inadequacy, security breaches or integration failure of our information systems or information technology infrastructure, related service providers or the internet;
|
|
|
§
|
disruptions affecting our Martinsville and Henry County, Virginia warehouses and corporate headquarters facilities;
|
|
|
§
|
when or whether our new business initiatives, including, among others, H Contract and Homeware, meet growth and profitability targets;
|
|
|
§
|
price competition in the furniture industry;
|
|
|
§
|
changes in domestic and international monetary policies and fluctuations in foreign currency exchange rates affecting the price of our imported products and raw materials;
|
|
|
§
|
the cyclical nature of the furniture industry, which is particularly sensitive to changes in consumer confidence, the amount of consumers’ income available for discretionary purchases, and the availability and terms of consumer credit;
|
|
|
§
|
risks associated with the cost of imported goods, including fluctuation in the prices of purchased finished goods and transportation and warehousing costs;
|
|
|
§
|
risks associated with domestic manufacturing operations, including fluctuations in capacity utilization and the prices and availability of key raw materials, as well as changes in transportation, warehousing and domestic labor costs and environmental compliance and remediation costs;
|
|
|
§
|
the direct and indirect costs associated with the implementation of our Enterprise Resource Planning system, including costs resulting from unanticipated disruptions to our business;
|
|
|
§
|
adverse political acts or developments in, or affecting, the international markets from which we import products, including duties or tariffs imposed on those products;
|
|
|
§
|
risks associated with distribution through third-party retailers, such as non-binding dealership arrangements;
|
|
|
§
|
capital requirements and costs;
|
|
|
§
|
competition from non-traditional outlets, such as catalog and internet retailers and home improvement centers;
|
|
|
§
|
changes in consumer preferences, including increased demand for lower-quality, lower-priced furniture due to, among other things, declines in consumer confidence, amounts of discretionary income available for furniture purchases and the availability of consumer credit;
|
|
|
§
|
higher than expected costs associated with product quality and safety, including regulatory compliance costs related to the sale of consumer products and costs related to defective or non-compliant products; and
|
|
|
§
|
higher than expected employee medical costs.
|
Any forward-looking statement that we make speaks only as of the date of that statement, and we undertake no obligation, except as required by law, to update any forward-looking statements whether as a result of new information, future events or otherwise.
We face a number of significant risks and uncertainties, as more fully discussed in Item 1A, “Risk Factors”.
Hooker Furniture Corporation
Part I
ITEM 1. BUSINESS
Except where noted, information contained in Item 1 is as of January 31, 2016, our most recently completed fiscal year and does not include the results of or describe the operations of Home Meridian International, a business whose assets we acquired subsequent to the end of the 2016 fiscal year.
Hooker Furniture Corporation (the “Company”, “we,” “us” and “our”) is a home furnishings marketing, design and logistics company offering worldwide sourcing of residential and contract casegoods and upholstery, as well as domestically-produced custom leather and fabric-upholstered furniture. We were incorporated in Virginia in 1924 and are ranked among the nation’s top 10 largest publicly traded furniture sources, based on 2015 shipments to U.S. retailers, according to a 2015 survey published by Furniture Today, a leading trade publication. We are a key resource for residential wood and metal furniture (commonly referred to as “casegoods”) and upholstered furniture. Our major casegoods product categories include accents, home office, dining, bedroom and home entertainment furniture under the Hooker Furniture brand. Our residential upholstered seating companies include Bradington-Young, a specialist in upscale motion and stationary leather furniture and Sam Moore Furniture, focused on upscale occasional chairs, settees, sofas and sectional seating with an emphasis on cover-to-frame customization. An extensive selection of designs and formats along with finish and cover options in each of these product categories makes us a comprehensive resource for retailers primarily targeting the upper-medium price range. We also market a line of imported leather upholstery under the Hooker Upholstery trade name and work directly with several large customers to develop private-label, unbranded products exclusively for those customers. Our H Contract division supplies upholstered seating and casegoods to upscale senior living facilities throughout the country, working with designers specializing in the contract industry to provide functional furniture for senior living facilities that meets the style and comfort expectations of today’s retirees. Homeware is an online-only brand that is sold through leading international e-commerce retailers. It supplies unique chairs, sofas and ottomans designed to be assembled in minutes by the consumer with no tools or hardware required.
For our core product line, our principal customers are both traditional and online retailers of residential home furnishings that are broadly dispersed throughout the United States and in thirty-six other countries around the globe. Our customers include independent furniture stores, specialty retailers, department stores, catalog and internet merchants, interior designers and national and regional chains. They are serviced by over 60 independent North American sales representatives and 8 foreign sales representatives. H Contract’s customers include designers, design firms, industry dealers and distributors and senior living facilities throughout the United States. It has its own sales force of independent multi-line sales representatives. Homeware’s customers are primarily online Home furnishings retailers including Wayfair, Hayneedle and One Kings Lane.
We sold to approximately 3,600 customers during fiscal 2016. No single customer accounted for more than 3.5% of our sales in 2016. No significant part of our business is dependent upon a single customer, the loss of which would have a material effect on our business. However, the loss of several of our major customers could have a material impact on our business. In addition to our broad domestic customer base, 5.4% of our sales in fiscal 2016 were to international customers, which we define as sales outside of the United States. We believe our broad network of retailers and independent sales representatives reduces our exposure to regional recessions and allows us to capitalize on emerging trends in distribution channels.
The Home Meridian Acquisition
On January 5, 2016, we entered into an asset purchase agreement (the “Asset Purchase Agreement”) with Home Meridian International, Inc. (“HMI”) to acquire substantially all of HMI’s assets (the “Acquisition”). On February 1, 2016, we closed on the transaction by paying $85 million in cash and issuing 716,910 shares of our common stock (the “Stock Consideration”) to designees of HMI as consideration for the Acquisition. The Stock Consideration consisted of (i) 530,598 shares accounting for the $15 million of consideration payable in shares of our common stock under the Asset Purchase Agreement, and (ii) 186,312 shares issued pursuant to working capital adjustments detailed in the Asset Purchase Agreement. The working capital adjustment was driven by an increase in HMI’s accounts receivable due to strong sales towards the end of calendar 2015. The number of shares of common stock issued at closing for the Stock Consideration was determined by reference to the mean closing price of our common stock for the fifteen trading days immediately preceding the closing date ($28.27). Under the Asset Purchase Agreement, we also assumed certain liabilities of HMI, including approximately $7.8 million of liabilities related to certain retirement plans. The assumed liabilities did not include the indebtedness (as defined in the Asset Purchase Agreement) of HMI. We believe this acquisition will more than double the size of the Company on a net sales basis and consequently, make us one of the top five sources for the U.S. furniture market. See Item 7 and note 18 to our consolidated financial statements for additional information.
The Home Meridian division includes five business units: Pulaski Furniture, Samuel Lawrence Furniture, Samuel Lawrence Hospitality, Prime Resources International and Right 2 Home. HMI has a unique business model which allows the company to create global sourcing solutions for major customers and multiple channels of distribution. This business model, global sourcing and broad experience have allowed HMI to adapt and gain significant market share within the industry. HMI has consistently been recognized as an industry and regional leader in sales gain and growth. Its divisional headquarters is located in High Point, N.C., with distribution centers on both coasts and Asian operations in China, Vietnam and Malaysia.
For more information regarding HMI and the significant differences between the Hooker and Home Meridian businesses, please see “The Home Meridian Business” below on page 12.
Strategy and Mission
Our mission is to “enrich the lives of the people we touch,” using the following strategy:
|
§
|
To offer world-class style, quality and product value as a complete residential and contract wood, metal and upholstered furniture resource through excellence in product design, manufacturing, global sourcing, marketing, logistics, sales and customer service.
|
|
§
|
To be an industry leader in sales growth and profitability performance, providing an outstanding investment for our shareholders and contributing to the well-being of our customers, employees, suppliers and community.
|
|
§
|
To nurture the relationships, teamwork and integrity that define our corporate culture and have distinguished our company for over 90 years.
|
Segments
For financial reporting purposes, we are organized into three operating segments – casegoods furniture, upholstered furniture and all other. As of the end of fiscal 2016, our operating segments and their associated brands are as follows:
|
Hooker Furniture Corporation
|
||||
|
Operating Segments
|
||||
|
Casegoods
|
Upholstery
|
All other
|
||
|
Brands:
|
Brands:
|
Brands:
|
||
|
Hooker Furniture
|
Bradington-Young
|
H Contract
|
||
|
Hooker Upholstery
|
Homeware
|
|||
|
Sam Moore
|
||||
Home furnishings sales account for all of our net sales. The percentages of net sales provided by each of our segments for the fifty-two week fiscal years that ended January 31, 2016 (fiscal 2016), February 1, 2015 (fiscal 2015), and February 2, 2014 (fiscal 2014):
|
Segment Sales as a Percentage of Consolidated Net Sales
|
||||||||||||
|
Fiscal Year
|
||||||||||||
|
2016
|
2015
|
2014
|
||||||||||
|
Casegoods segment
|
63 | % | 63 | % | 63 | % | ||||||
|
Upholstery segment
|
34 | % | 35 | % | 36 | % | ||||||
|
All other segment
|
3 | % | 2 | % | 1 | % | ||||||
|
Total
|
100 | % | 100 | % | 100 | % | ||||||
See note 14 to our consolidated financial statements for additional financial information regarding our segments.
Sourcing
Imported Products
We have sourced products from foreign manufacturers since 1988. Imported casegoods and upholstered furniture together accounted for approximately 70% of net sales in fiscal 2016, 71% of net sales in fiscal 2015, and 72% of net sales in fiscal 2014. We import finished furniture in a variety of styles, materials and product lines. We believe the best way to leverage our financial strength and differentiate our import business from the industry is through innovative and collaborative design, extensive product lines, compelling products, value, consistent quality, excellent customer service, easy ordering and quick delivery through significant finished goods inventories, world-class global logistics and robust distribution systems.
We import products predominantly from Asia. Because of the large number and diverse nature of the foreign factories from which we source our imported products, we have significant flexibility in the sourcing of products among any particular factory or country. In fiscal 2016, imported products sourced from China and Vietnam accounted for approximately 68% and 26%, respectively, of import purchases. The factory in China from which we directly source the most product, accounted for approximately 58% of our worldwide purchases of imported product. A disruption in our supply chain from this factory, or from China or Vietnam in general, could significantly compromise our ability to fill customer orders for products manufactured at that factory or in that country. If such a disruption were to occur, we believe that we would have sufficient inventory currently on hand and in transit to our U.S. warehouses in Martinsville, Virginia to adequately meet demand for approximately 4.5 months, with up to an additional 1.25 months available for immediate shipment from our primary Asian warehouse. Also, with the broad spectrum of product we offer, we believe that, in some cases, buyers could be offered similar products available from alternative sources. We believe we could, most likely at higher cost, source most of the products currently sourced in China or Vietnam from factories in other countries and could produce certain upholstered products domestically at our own factories. However, supply disruptions and delays on selected items could occur for up to 6 months. If we were to be unsuccessful in obtaining those products from other sources or at a comparable cost, then a disruption in our supply chain from our largest import furniture supplier, or from China or Vietnam in general, could decrease our sales, earnings and liquidity. Given the capacity available in China, Vietnam and other low-cost producing countries, we believe the risks from these potential supply disruptions are manageable.
Our imported furniture business is subject to inherent risks in importing products manufactured abroad, including, but not limited to, supply disruptions and delays, currency exchange rate fluctuations, transportation-related issues, economic and political developments and instability, as well as the laws, policies and actions of foreign governments and the United States. These acts may include regulations affecting trade or the application of tariffs.
Manufacturing and Raw Materials
At January 31, 2016, we operated approximately 507,400 square feet of manufacturing and supply plant capacity in North Carolina and Virginia for our domestic upholstered furniture production. We consider the machinery and equipment at these locations to be generally modern and well-maintained.
We believe there are continued strong market opportunities for domestically produced upholstery, particularly in the upper and upper-medium price points, which provide two key competitive advantages compared to imported upholstery:
|
|
§
|
the ability to offer customized upholstery combinations to the upscale consumer and interior design trade; and
|
|
|
§
|
the ability to offer quick four-to six-week product delivery of custom products.
|
Significant materials used in manufacturing upholstered furniture products include leather, fabric, foam, wooden frames and metal mechanisms. Most of the leather is imported from Italy, South America and China, and is purchased as full hides and cut and sewn in our facilities, or is purchased as pre-cut and sewn kits processed by our vendors to our pattern specifications.
We believe that our sources for raw materials are adequate and that we are not dependent on any one supplier. Hooker’s five largest suppliers accounted for approximately 37% of our raw materials supply purchases for domestic upholstered furniture manufacturing operations in fiscal 2016. One supplier accounted for approximately 18% of our raw material purchases in fiscal 2016. Should disruptions with this supplier occur, we believe we could successfully source these products from other suppliers without significant disruption to our operations.
Products
Our product lines cover most major style categories, including European and American traditional, contemporary, transitional, urban, country, casual, and cottage designs. We offer furniture in a variety of materials, such as various types of wood, metal, leather and fabric, as well as veneer and other natural woven products, often accented with marble, stone, slate, glass, ceramic, brass and/or hand-painted finishes.
Major casegoods product categories include accents, home office, dining, bedroom and home entertainment furniture which are marketed under the Hooker Furniture brand name, as well as “private label” products marketed under a retailer’s brand name. Our casegoods are typically designed for and marketed in the upper-medium to lower high-end price range.
Bradington-Young markets its products under the Bradington-Young brand name, offers a broad variety of residential leather and fabric upholstered furniture and specializes in leather reclining and motion chairs, sofas, club chairs and executive desk chairs. It offers numerous leather and fabric selections for domestically produced upholstered furniture, generally targeted at the upper price range.
Hooker Upholstery is an imported line of leather upholstery and is targeted at the upper-medium price points. It offers numerous leather and fabric selections and offers a broad variety of married cover options on stationary sofa groups, recliners, office chairs, club chairs, motion groups, and decorative ottomans.
Sam Moore Furniture’s products, which are primarily domestically produced, are marketed under the Sam Moore brand name or private label and offer upscale occasional chairs, sofas and other seating with an emphasis on fabric-to-frame customization. Sam Moore offers many different styles of upholstered products in numerous fabric and leather selections, including customer supplied upholstery coverings. Sam Moore’s products are targeted at the upper-medium and upper price ranges.
H Contract’s and Homeware’s products are sourced from Hooker, Sam Moore or domestic or international OEM manufacturers.
Marketing
The product life cycle for home furnishings has shortened in recent years as consumers have demanded innovative new features, functionality, style, finishes and fabrics. New styles in each of our product categories are designed and developed semi-annually to replace discontinued products and collections, and in some cases, to enter new product or style categories. Our collaborative product design process begins with the marketing team identifying customer needs and trends and then conceptualizing product ideas and features. A variety of sketches are produced, usually by independent designers, from which prototype furniture pieces are built. We invite some of our independent sales representatives and a representative group of retailers to view and critique these prototypes. Based on this input, we may modify the designs and then prepare samples for full-scale production. We generally introduce new product styles at the International Home Furnishings Market held each Fall and Spring in High Point, N.C., and support new product launches with promotions, public relations, product brochures, point-of-purchase consumer catalogs and materials and online marketing through our websites, as well as through popular social media venues. We schedule purchases of imported furniture and the production of domestically manufactured upholstered furniture based upon actual and anticipated orders and product acceptance at the Spring and Fall markets. The flexibility of both our global-sourcing business model and the quick delivery times provided by our domestic upholstery manufacturing presence gives us the ability to offer a range of styles, items and price points to a variety of retailers serving a range of consumer markets. Based on sales and market acceptance, we believe our products represent good value, and that the style and quality of our furniture compares favorably with more premium-priced products. Our all-digital marketing strategy is centered on directly engaging the consumer, to connect them with Hooker Furniture brands and direct them to our retail partners.
Warehousing and Distribution
We sell our products through a large number of distribution channels which include independent furniture retailers, department stores, national membership clubs, regional chain stores, catalog merchandisers, specialty retailers, designers and E-retailers, design firms and senior living facilities.
We distribute furniture to retailers from our distribution centers and warehouses in Virginia and North Carolina and directly from Asia via our container direct programs. We have a warehousing and distribution arrangement in China with our largest supplier of imported products and a consolidation warehouse in Vietnam, which allows customers to mix containers from several Vietnamese factories. In addition, we also ship containers directly from a variety of other suppliers in Asia.
We strive to provide imported and domestically produced furniture on-demand for our dealers. During fiscal year 2016, we shipped 80% of all casegoods orders and approximately 61% of all upholstery orders within 30 days of order receipt. It is our policy and industry practice to allow order cancellation for casegoods up to the time of shipment; therefore, customer orders for casegoods are not firm. However, domestically produced upholstered products are predominantly custom-built and shipped within six to eight weeks after an order is received and consequently, cannot be cancelled once the leather or fabric has been cut.
For imported products, we generally negotiate firm pricing with foreign suppliers in U.S. Dollars, typically for a term of at least one year. We accept the exposure to exchange rate movements beyond these negotiated periods. We do not use derivative financial instruments to manage this risk but could choose to do so in the future. Since we transact our imported product purchases in U.S. Dollars, a relative decline in the value of the U.S. Dollar could increase the price we pay for imported products beyond the negotiated periods. We generally expect to reflect substantially all of the effects of any price increases from suppliers in the prices we charge for imported products. However, these price changes could adversely impact sales volume and profit margin during affected periods. Conversely, a relative increase in the value of the U.S. Dollar could decrease the cost of imported products and favorably impact net sales and profit margins during affected periods. See also “Item 7A. Quantitative and Qualitative Disclosures About Market Risk.”
Working Capital Practices
The following describes our working capital practices:
Inventory: We generally import casegoods inventory and certain upholstery items in amounts that enable us to meet the delivery requirements of our customers, our internal in-stock goals and minimum purchase requirements from our sourcing partners. We do not carry significant amounts of domestically produced upholstery inventory, as most of these products are built to order and are shipped shortly after their manufacture.
Accounts receivable: Substantially all of our trade accounts receivable are due from retailers and dealers that sell residential home furnishings, which consist of a large number of entities with a broad geographic dispersion. We perform credit evaluations of our customers and generally do not require collateral. For qualified customers, we offer payment terms, generally requiring payment 30 days from shipment. However, we may offer extended payment terms in certain circumstances, including to promote sales of our products. Sam Moore factored substantially all of its accounts receivable prior to implementing our ERP in May 2015 and Bradington-Young currently factors substantially all of its receivables, in most cases on a non-recourse basis; however, in order to realize operational efficiencies, cost savings, leverage best practices and present a single face to our customers, we plan to end our factoring relationship as our new Enterprise Resource Planning system (“ERP”) becomes fully operational for Bradington-Young in the first half of fiscal 2017. However, given our current and projected liquidity, we do not expect the transition to have a material adverse effect on our future liquidity.
Accounts payable: Payment for our imported products warehoused first in Asia is due fourteen days after our quality audit inspections are complete and the vendor invoice is presented. Payment for goods which are shipped to Hooker FOB Origin is due upon proof of lading onto a US-bound vessel and invoice presentation. Payment terms for domestic raw materials and non-inventory related charges vary, but are generally 30 days from invoice date.
Order Backlog
At January 31, 2016, our backlog of unshipped orders for our casegoods, upholstery and all other segments were as follows:
|
Order Backlog
|
||||||||||||||||
|
(Dollars in 000s)
|
||||||||||||||||
|
January 31, 2016
|
February 1, 2015
|
|||||||||||||||
|
Dollars
|
Weeks
|
Dollars
|
Weeks
|
|||||||||||||
|
Casegoods segment
|
$ | 12,310 | 4.1 | $ | 14,793 | 5.1 | ||||||||||
|
Upholstery segment
|
9,163 | 5.7 | 8,802 | 5.3 | ||||||||||||
|
All other segment
|
950 | 6.1 | 542 | 7.3 | ||||||||||||
|
Consolidated
|
$ | 22,423 | 4.7 | $ | 24,137 | 5.2 | ||||||||||
We consider unshipped order backlogs to be one helpful indicator of sales for the upcoming 30-day period, but because of our relatively quick delivery and our cancellation policies (discussed under Warehousing and Distribution, above), we do not consider order backlogs to be a reliable indicator of expected long-term business.
Seasonality
In general, the summer months are the slowest for our business, especially for leather upholstery sales in our upholstery segment. We believe that consumer home furnishings purchases are driven by an array of factors, including general economic conditions such as:
|
|
§
|
consumer confidence;
|
|
|
§
|
availability of consumer credit;
|
|
|
§
|
energy and other commodity prices; and
|
|
|
§
|
housing and mortgage markets;
|
as well as lifestyle-driven factors such as changes in:
|
|
§
|
fashion trends;
|
|
|
§
|
disposable income; and
|
|
|
§
|
household formation and turnover.
|
Competition
The furniture industry is highly competitive and includes a large number of foreign and domestic manufacturers and importers, none of which dominates the market in our price points. While the markets in which we compete include a large number of relatively small and medium-sized manufacturers, certain competitors have substantially greater sales volumes and financial resources than we do. U.S. imports of furniture produced overseas, such as from China and other Asian countries, have stabilized in recent years.
The primary competitive factors for home furnishings in our price points include price, style, availability, service, quality and durability. We believe our design capabilities, ability to import and/or manufacture upholstered furniture, product value, longstanding customer and supplier relationships, significant sales, distribution and inventory capabilities, ease of ordering, financial strength, experienced management and customer support are significant competitive advantages.
Environmental Matters
As a part of our business operations, our manufacturing sites generate both non-hazardous and hazardous wastes; the treatment, storage, transportation and disposal of which are subject to various local, state and national laws relating to environmental protection. We are in various stages of investigation, remediation or monitoring of alleged or acknowledged contamination at current or former manufacturing sites for soil and groundwater contamination, none of which we believe is material to our results of operations or financial position. Our policy is to record monitoring commitments and environmental liabilities when expenses are probable and can be reasonably estimated. The costs associated with our environmental responsibilities, compliance with federal, state and local laws regulating the discharge of materials into the environment, or costs otherwise relating to the protection of the environment, have not had and are not expected to have a material effect on our financial position, results of operations, capital expenditures or competitive position.
Hooker Furniture is committed to protecting the environment. We participate in a voluntary, industry-wide environmental stewardship program referred to as Enhancing Furniture’s Environmental Culture or “EFEC.” In September of fiscal 2010, the American Home Furnishings Alliance granted us initial EFEC registration, recognizing the successful company-wide implementation of the EFEC program, which includes the successful reduction of water and electricity usage, recycling efforts to reduce landfill use and the implementation of a community outreach program. Since our initial registration we have:
|
|
§
|
recycled over 850,000 pounds of paper, cardboard and plastic;
|
|
|
§
|
reduced electricity usage by an average of 5% per year; and
|
|
|
§
|
reduced natural gas usage by an average of 4% per year.
|
We are inspected annually by the EFEC organization in order to maintain our registration under this program and are currently certified through January 2017.
Employees
As of January 31, 2016, we had 645 full-time employees of which 222 were employed in the casegoods segment, 414 in the upholstery segment and 9 in the All Other segment. None of our employees are represented by a labor union. We consider our relations with our employees to be good.
Patents and Trademarks
The Hooker Furniture, Bradington-Young and Sam Moore trade names represent many years of continued business. We believe these trade names are well-recognized and associated with quality and service in the furniture industry. We also own a number of patents and trademarks, both domestically and internationally, none of which is considered to be material.
Hooker, the “H” logo, Bradington-Young, the “B-Y” logo, Sam Moore, H Contract, Homeware, Sam Moore Furniture Industries, Sam Moore Furniture, LLC, America’s Premier Chair Specialist, America’s Chairmaker for over 70 Years, Rhapsody, Sanctuary, Mélange, Corsica, Solana, Palisade, Beladora, Classique, Abbott Place, Grandover, North Hampton, Small Office Solutions, Preston Ridge, Waverly Place, Sectional Seating by Design, Accommodations, SmartLiving ShowPlace, SmartWorks Home Office, SmartWorks Home Center and The Great Entertainers are trade names or trademarks of Hooker Furniture Corporation.
Governmental Regulations
Our company is subject to U.S. federal, state, and local laws and regulations in the areas of safety, health, employment and environmental pollution controls, as well as U.S. and international trade laws and regulations. We are also subject to foreign laws and regulations. Compliance with these laws and regulations has not in the past had any material effect on our earnings, capital expenditures, or competitive position in excess of those affecting others in our industry; however, the effect of compliance in the future cannot be predicted. We believe we are in material compliance with applicable U.S. and international laws and regulations.
The Home Meridian Business
Some significant differences between the Hooker and Home Meridian businesses include:
Sales. 100% of HMI’s sales are sourced from Asia, while only about 70% of Hooker’s are, with the balance being domestically-produced upholstery products. However, both businesses’ sales are weighted towards casegoods products. Approximately 70% of HMI’s sales are container direct sales, while less than 10% of Hooker’s sales fall in this category. HMI’s sales tend to be lower margin, higher volume sales, while Hooker’s tend to be the opposite. In terms of seasonality, Hooker’s sales tend to be the slowest in the summer months, while HMI’s sales are slowest early in the calendar year.
Customers. A significant part of HMI’s business is dependent upon mega accounts and key customers. Though the loss of any one of HMI’s largest customers would have an impact on the business, only two of the largest customers individually account for more than 10% of total sales. While Hooker and HMI share some larger customers, most of Hooker’s sales are derived from independent furniture stores and small chains. Average order size for Hooker product is much smaller, due to warehouse oriented business, which services smaller stores and in many cases, individual consumer orders. Many HMI orders are shipped to customer distribution centers for distribution to the customers’ stores. Both companies have a significant and growing ecommerce operation; however HMI’s is larger and more advanced on an operational basis.
Asian operations. Both companies have Asian operations. Hooker has representative offices in China and Vietnam and its Asian associates are responsible primarily for vendor relations, production oversight and quality control. HMI has locations in China, Vietnam and Malaysia. HMI’s Asian operations include order entry, computer programming, accounting, production planning and product development as well as the sourcing related functions performed by Hooker personnel in Asia.
Sourcing. Hooker sources from eighteen vendors with factories located in five countries. Home Meridian primarily sources from approximately sixty different vendors located in three countries. The factory in China from which Hooker sources most of its imported product, accounted for approximately 60% of our worldwide purchases of imported product in fiscal 2016.
Products. Hooker’s product design process usually starts with its design team identifying perceived customer needs based on current home furnishings trends and developing products to fill those perceived needs. While HMI’s process is similar, it provides more customized and proprietary products to customers based on a design process that tends to be more collaborative with its customers. Hooker’s products are sold at upper-medium price to lower high-end price points while HMI’s focus more on the lower-medium to medium price points. Hooker has casegoods and upholstery design teams, while HMI has a sales and design team for each brand. Hooker has around 3,000 SKUs and HMI about 4,500.
Employees. The approximate number of employees of both organizations as of January 31, 2016 are shown below. Approximately two-thirds of Hooker’s US associates are in employed in its domestic upholstery operations.
|
Number of Employees at January 31, 2016
|
||||||||||||
|
Hooker
|
HMI
|
Total
|
||||||||||
|
US
|
200 | 123 | 323 | |||||||||
|
Asia
|
31 | 160 | 191 | |||||||||
|
Subtotal
|
231 | 283 | 514 | |||||||||
|
US Upholstery Manufacturing
|
414 | - | 414 | |||||||||
|
Totals
|
645 | 283 | 928 | |||||||||
Additional Information
You may visit us online at hookerfurniture.com, bradington-young.com, sammoore.com, homeware.com and hcontractfurniture.com. We make available, free of charge through our Hooker Furniture website, our annual report on Form 10-K, quarterly reports on Form 10-Q, current reports on Form 8-K, amendments to those reports, and other documents as soon as practical after they are filed with or furnished to the Securities and Exchange Commission. A free copy of our annual report on Form 10-K may also be obtained by contacting Robert W. Sherwood, Vice President - Credit, Secretary and Treasurer at BSherwood@hookerfurniture.com or by calling 276-632-2133.
ITEM 1A. RISK FACTORS
Our business is subject to a variety of risks. The risk factors discussed below should be considered in conjunction with the other information contained in this annual report on Form 10-K. If any of these risks actually materialize, our business, results of operations, financial condition or future prospects could be negatively impacted. These risks are not the only ones we face. There may be additional risks that are presently unknown to us or that we currently believe to be immaterial that could affect our business.
General Risks of the Company
We rely on offshore sourcing, particularly from China, for predominantly all of our casegoods furniture products and for a significant portion of our upholstered products. Consequently:
|
|
§
|
A disruption in supply from China or from our most significant Chinese supplier could adversely affect our ability to timely fill customer orders for these products and decrease our sales, earnings and liquidity.
|
In fiscal 2016, imported products sourced from China and Vietnam accounted for approximately 68% and 26%, respectively, of our import purchases and the factory in China from which we directly source the largest portion of our import products accounted for approximately 58% of our worldwide purchases of imported products. Furniture manufacturing creates large amounts of highly flammable wood dust and utilizes other highly flammable materials such as varnishes and solvents in its manufacturing processes and is therefore subject to the risk of losses arising from explosions and fires. A disruption in our supply chain from this factory, or from China or Vietnam in general, could significantly impact our ability to fill customer orders for products manufactured at that factory or in that country. If such a disruption were to occur, we believe that we would have sufficient inventory on hand and in transit to our U.S. warehouses in Martinsville, VA to adequately meet demand for approximately 4.5 months with up to an additional 1.25 months available for immediate shipment from our warehouses in Asia. We believe that we could, most likely at higher cost, source most of the products currently sourced in China from factories in other countries and could produce certain upholstered products domestically at our own factories. However, supply disruptions and delays on selected items could occur for up to 6 months before the impact of remedial measures would be reflected in our results. If we were to be unsuccessful in obtaining those products from other sources or at comparable cost, a disruption in our supply chain from our largest import furniture supplier, or from China or Vietnam in general, could adversely affect our sales, earnings, financial condition and liquidity.
|
|
§
|
We are subject to changes in foreign government regulations and in the political, social and economic climates of the countries from which we source our products.
|
Changes in political, economic, and social conditions, as well as in the laws and regulations in the foreign countries from which we source our products could adversely affect our sales, earnings, financial condition and liquidity. These changes could make it more difficult to provide products and service to our customers or could increase the cost of those products. International trade regulations and policies of the United States and the countries from which we source finished products could adversely affect us. Imposition of trade sanctions relating to imports, taxes, import duties and other charges on imports affecting our products could increase our costs and decrease our earnings. For example since 2004, the U.S. Department of Commerce has imposed tariffs on wooden bedroom furniture coming into the United States from China. In this case, none of the rates imposed have been of sufficient magnitude to alter our import strategy in any meaningful way; however, these and other tariffs are subject to review and could be implemented or increased in the future.
|
|
§
|
Our dependence on non-U.S. suppliers could, over time, adversely affect our ability to service customers.
|
We rely exclusively on non-U.S. suppliers for our casegoods furniture products and for a significant portion of our upholstered products. Our non-U.S. suppliers may not provide goods that meet our quality, design or other specifications in a timely manner and at a competitive price. If our suppliers do not meet our specifications, we may need to find alternative vendors, potentially at a higher cost, or may be forced to discontinue products. Also, delivery of goods from non-U.S. vendors may be delayed for reasons not typically encountered for domestically manufactured furniture, such as shipment delays caused by customs issues, labor issues, port-related issues such as weather, congestion or port equipment, decreased availability of shipping containers and/or the inability to secure space aboard shipping vessels to transport our products. Our failure to timely fill customer orders due to an extended business interruption for a major non-U.S. supplier, or due to transportation issues, could negatively impact existing customer relationships and adversely affect our sales, earnings, financial condition and liquidity.
|
|
§
|
Our inability to accurately forecast demand for our imported products could cause us to purchase too much, too little or the wrong mix of inventory.
|
Manufacturing and delivery lead times for our imported products necessitate that we make forecasts and assumptions regarding current and future demand for these products. If our forecasts and assumptions are inaccurate, we may purchase excess or insufficient amounts of inventory. If we purchase too much or the wrong mix of inventory, we may be forced to sell it at lower margins, which could adversely affect our sales, earnings, financial condition and liquidity. If we purchase too little or the wrong mix of inventory, we may not be able to fill customer orders and may lose market share and weaken or damage customer relationships, which also could adversely affect our sales, earnings, financial condition and liquidity.
|
|
§
|
Changes in the value of the U.S. Dollar compared to the currencies for the countries from which we obtain our products could adversely affect our sales, earnings and liquidity.
|
For imported products, we generally negotiate firm pricing with our foreign suppliers in U.S. Dollars, typically for periods of at least one year. We accept the exposure to exchange rate movements beyond these negotiated periods. We do not use derivative financial instruments to manage this risk, but could choose to do so in the future. Since we transact our imported product purchases in U.S. Dollars, a relative decline in the value of the U.S. Dollar could increase the price we must pay for imported products beyond the negotiated periods. These price changes could decrease our sales, earnings and liquidity during affected periods.
|
|
§
|
Supplier transitions, including cost or quality issues, could result in longer lead times and shipping delays.
|
In the past, inflation concerns, and to a lesser extent quality and supplier viability concerns, affecting some of our imported product suppliers located in China prompted us to source more of our products from lower cost suppliers located in other countries, such as Vietnam and Indonesia. As conditions dictate, we could be forced to make similar transitions in the future. When undertaken, transitions of this type involve significant planning and coordination by and between us and our new suppliers in these countries. Despite our best efforts and those of our new sourcing partners, these transition efforts are likely to result in longer lead times and shipping delays over the short term, which could adversely affect our sales, earnings, financial condition and liquidity.
The interruption, inadequacy, security failure or integration failure of our information systems or information technology infrastructure or the internet could adversely impact our business, sales, earnings, financial condition and liquidity.
Our information systems (software) and information technology (hardware) infrastructure platforms and those of third parties who provide these services to us, including internet service providers and third-parties who store data for us on their servers, facilitate and support every facet of our business, including the sourcing of raw materials and finished goods, planning, manufacturing, warehousing, customer service, shipping, accounting and human resources. Our systems, and those of third parties who provide services to us, are vulnerable to disruption or damage caused by a variety of factors including, but not limited to: power disruptions or outages; natural disasters or other so-called “Acts of God”; computer system or network failures; viruses or malware; physical or electronic break-ins; the theft of computers, tablets and smart phones utilized by our employees or contractors; unauthorized access and cyber-attacks. If these information systems or technologies are interrupted or fail, our operations may be adversely affected, which could adversely affect our sales, earnings, financial condition and liquidity.
Unauthorized disclosure of confidential information provided to us by our customers, employees, or third parties could harm our business.
We rely on the internet and other electronic methods to transmit confidential information and we store confidential information on our networks. If there was a disclosure of confidential information by our employees or contractors, including accidental loss, inadvertent disclosure or unapproved dissemination of information, or if a third party were to gain access to the confidential information we possess, our reputation could be harmed and we could be subject to civil or criminal liability and regulatory actions. A claim that is brought against us, successful or unsuccessful, that is uninsured or under-insured could harm our business, result in substantial costs, divert management attention and adversely affect our sales, earnings, financial condition and liquidity.
We may engage in acquisitions and investments in companies, form strategic alliances and pursue new business lines. These activities could disrupt our business, dilute our earnings per share, decrease the value of our common stock and decrease our earnings and liquidity.
We may acquire or invest in businesses that offer complementary products and that we believe offer competitive advantages. However, we may fail to identify significant liabilities or risks that could negatively affect us or result in our paying more for the acquired company or assets than they are worth. We may also have difficulty assimilating the operations and personnel of an acquired business into our current operations. Acquisitions may disrupt or distract management from our ongoing business. We may pay for future acquisitions using cash, stock, the assumption of debt, or a combination of these. Future acquisitions could result in dilution to existing shareholders and to earnings per share and decrease the value of our common stock. We may pursue new business lines in which we have limited or no prior experience or expertise. These pursuits may require substantial investment of capital and personnel. New business initiatives may fail outright or fail to produce an adequate return, which could adversely affect our earnings, financial condition and liquidity.
The implementation of our Enterprise Resource Planning system could disrupt our business.
We are in the final phase of implementing an Enterprise Resource Planning (ERP) system in our legacy Hooker Furniture business. (HMI operates on a separate ERP platform.) Our ERP system implementation may not result in improvements that outweigh its costs and may disrupt our operations. Our inability to mitigate existing and future disruptions could adversely affect our sales, earnings, financial condition and liquidity. The ERP system implementation subjects us to substantial costs and inherent risks associated with migrating from our legacy systems. These costs and risks could include, but are not limited to:
|
§
|
significant capital and operating expenditures;
|
|
§
|
disruptions to our domestic and international supply chains;
|
|
§
|
inability to fill customer orders accurately and on a timely basis, or at all;
|
|
§
|
inability to process payments to suppliers, vendors and associates accurately and in a timely manner;
|
|
§
|
disruption of our internal control structure;
|
|
§
|
inability to fulfill our SEC or other governmental reporting requirements in a timely or accurate manner;
|
|
§
|
inability to fulfill federal, state and local tax filing requirements in a timely or accurate manner; and
|
|
§
|
increased demands on management and staff time to the detriment of other corporate initiatives.
|
We may not be able to collect amounts owed to us.
We grant payment terms to most customers ranging from 30 to 60 days and do not generally require collateral. However, in some instances we provide longer payment terms. Some of our customers have experienced, and may in the future experience, credit-related issues. While we perform credit evaluations of our customers, those evaluations may not prevent uncollectible trade accounts receivable. Credit evaluations involve significant management diligence and judgment. Should more customers than we anticipate experience liquidity issues, or if payment is not received on a timely basis, we may have difficulty collecting amounts owed to us by these customers, which could adversely affect our sales, earnings, financial condition and liquidity.
Our new business initiatives could fail to meet growth and profitability targets.
During fiscal 2014, we launched H Contract and Homeware, two new business initiatives which comprise our All Other operating segment. Both businesses require experience and expertise outside of our traditional skillset, so we hired professionals who we believe have the skills and experience to lead them. H Contract has been profitable on an operating profit basis for the last two fiscal years and its net sales have increased; however, there is no guarantee that H Contract’s early successes will continue and that its sales and earnings will continue to grow. Homeware has not yet achieved operating profitability. Consequently, we adjusted Homeware’s strategy during the second half of fiscal 2016. Despite these changes, we may not succeed in growing Homeware into a profitable business and it may fail outright or fail to produce an adequate return. We expect this segment to have a negative impact on our short-term earnings and liquidity as we attempt to grow these businesses. If Homeware fails to become profitable or H Contract’s early successes diminish or stall, our sales, earnings, financial condition and liquidity could be adversely affected.
A disruption affecting our Martinsville and Henry County Virginia warehouses, distribution or administrative facilities could disrupt our business.
Our Martinsville and Henry County Virginia facilities are critical to our success. Our Martinsville, Virginia warehouses housed approximately 50% of our consolidated inventories at January 31, 2016. During fiscal 2016, approximately 60% of our invoiced sales were shipped out of our Martinsville facilities. Additionally, our corporate headquarters, which houses all of our corporate administration, sourcing, sales, finance, merchandising, customer service and traffic functions for our imported products is located in this area. Any disruption affecting our Martinsville area facilities, for even a relatively short period of time, could adversely affect our ability to ship our imported furniture products and disrupt our business, which could adversely affect our sales, earnings, financial condition and liquidity.
Our ability to grow and maintain sales and earnings depends on the successful execution of our business strategies.
We are primarily a residential furniture design, sourcing, marketing and logistics company with domestic upholstery manufacturing capabilities. We are completely dependent on non-U.S. suppliers for all of our casegoods furniture products and a significant portion of our upholstered products. Our ability to grow and maintain sales and earnings depends on:
|
|
§
|
the continued correct selection and successful execution and refinement of our overall business strategies and business systems for designing, marketing, sourcing, distributing and servicing our products;
|
|
|
§
|
good decisions about product mix and inventory availability targets;
|
|
|
§
|
the enhancement of relationships and business systems that allow us to continue to work more efficiently and effectively with our global sourcing suppliers; and
|
|
|
§
|
the right mix between domestic manufacturing and foreign sourcing for upholstered products.
|
Our traditional customer base, independent furniture stores and regional chains, is getting smaller and the demographic profile of the typical home furnishings consumer is evolving. Therefore, we must:
|
|
§
|
identify and adapt to trends in retailing; and
|
|
|
§
|
develop strategies to sell in the channels in which our consumers prefer to shop.
|
All of these factors affect our ability to grow and maintain sales, earnings and liquidity.
Failure to anticipate or timely respond to changes in fashion and consumer tastes could adversely impact our business.
Furniture is a styled product and is subject to rapidly changing fashion trends and consumer tastes, as well as to increasingly shorter product life cycles. If we fail to anticipate or promptly respond to these changes we may lose market share or be faced with the decision of whether to sell excess inventory at reduced prices. This could adversely affect our sales, earnings, financial condition and liquidity.
Fluctuations in the price, availability or quality of raw materials for our domestically manufactured upholstered furniture could cause manufacturing delays, adversely affect our ability to provide goods to our customers or increase our costs.
We use various types of wood, leather, fabric, foam and other filling material, high carbon spring steel, bar and wire stock and other raw materials in manufacturing upholstered furniture. We depend on outside suppliers for raw materials and must obtain sufficient quantities of quality raw materials from these suppliers at acceptable prices and in a timely manner. We do not have long-term supply contracts with our suppliers. Unfavorable fluctuations in the price, quality or availability of required raw materials could negatively affect our ability to meet the demands of our customers. We may not always be able to pass price increases in raw materials through to our customers due to competition and other market pressures. The inability to meet customers’ demands or recover higher costs could adversely affect our sales, earnings, financial condition and liquidity.
If demand for our domestically manufactured upholstered furniture declines we may respond by realigning manufacturing.
Our domestic manufacturing operations make only upholstered furniture. A decline in demand for our domestically produced upholstered furniture could result in the realignment of our domestic manufacturing operations and capabilities and the implementation of cost-saving measures. These programs could include the consolidation and integration of facilities, functions, systems and procedures. We may decide to source certain products from other suppliers instead of continuing to manufacture them. These realignments and cost-saving measures typically involve initial upfront costs and could result in decreases in our near-term earnings before the expected cost savings are realized, if they are realized at all. We may not always accomplish these actions as quickly as anticipated and may not achieve the expected cost savings, which could adversely affect our sales, earnings, financial condition and liquidity.
We may experience impairment of our long-lived assets, which would decrease our earnings and net worth.
Accounting rules require that long-lived assets be tested for impairment when circumstances indicate, but at least annually. At January 31, 2016 we had $24.2 million in net long-lived assets, consisting primarily of property, plant and equipment, trademarks and trade names. The outcome of impairment testing could result in the write-off of all or a portion of the value of these assets. A write-down of our assets would, in turn, reduce our earnings and net worth; factors which may lead to additional write-downs of our long-lived assets include, but are not limited to:
|
|
§
|
A significant decrease in the market value of a long-lived asset;
|
|
|
§
|
A significant adverse change in the extent or manner in which a long-lived asset group is being used, or in its physical condition;
|
|
|
§
|
A significant adverse change in legal factors or in the business climate that could affect the value of a long-lived asset, including an adverse action or assessment by a regulator;
|
|
|
§
|
An accumulation of costs significantly in excess of the amount originally expected to acquire or construct a long-lived asset;
|
|
|
§
|
A current period operating or cash flow loss or a projection or forecast that demonstrates continuing losses associated with a long-lived asset’s use; and
|
|
|
§
|
A current expectation that more-likely-than-not, a long-lived asset will be sold or otherwise disposed of significantly before the end of its previously estimated useful life.
|
We may not be able to maintain or raise prices in response to inflation and increasing costs.
Competitive and market forces could prohibit future successful price increases for our products in order to offset increased costs of finished goods, raw materials, freight and other product-related costs, which could decrease our sales, earnings and liquidity.
Economic downturns could result in decreased sales, earnings and liquidity.
The furniture industry is particularly sensitive to cyclical variations in the general economy and to uncertainty regarding future economic prospects. Home furnishings are generally considered a postponable purchase by most consumers. Economic downturns could affect consumer spending habits by decreasing the overall demand for home furnishings. Changes in interest rates, consumer confidence, new housing starts, existing home sales, the availability of consumer credit and broader national or geopolitical factors have particularly significant effects on our business. A recovery in our sales could lag significantly behind a general recovery in the economy after an economic downturn, due to, among other things, the postponable nature and relatively significant cost of home furnishings purchases. These events could also impact retailers, our primary customers, possibly adversely affecting our sales, earnings and liquidity.
We may lose market share due to competition.
The furniture industry is very competitive and fragmented. We compete with numerous domestic and non-U.S. residential furniture sources. Some competitors have greater financial resources than we have and often offer extensively advertised, well-recognized, branded products. Competition from non-U.S. sources has increased dramatically over the past decade. We may not be able to meet price competition or otherwise respond to competitive pressures, including increases in supplier and production costs. Also, due to the large number of competitors and their wide range of product offerings, we may not be able to continue to differentiate our products (through value and styling, finish and other construction techniques) from those of our competitors. In addition, some large furniture retailers are sourcing directly from non-U.S. furniture factories. Over time, this practice may expand to smaller retailers. As a result, we are continually subject to the risk of losing market share, which could adversely affect our sales, earnings, financial condition and liquidity.
The loss of several large customers through business consolidations, failures or other reasons could adversely affect our business.
The loss of several of our major customers through business consolidations, failures or otherwise, could adversely affect our sales, earnings, financial condition and liquidity. Lost sales may be difficult to replace. Amounts owed to us by a customer whose business fails, or is failing, may become uncollectible, and we could lose future sales, any of which could adversely affect our sales, earnings, financial condition and liquidity.
We may incur higher employee costs in the future.
We maintain a self-insured healthcare plan for our employees. We have insurance coverage in place for aggregate claims above a specified amount in any year. While our healthcare costs in recent years have generally increased at the same rate or greater than the national average, those costs have increased more rapidly than general inflation in the U.S. economy. Continued inflation in healthcare costs, as well as additional costs we may incur as a result of current or future federal or state healthcare legislation and regulations, could significantly increase our employee healthcare costs in the future. Continued increases in our healthcare costs could adversely affect our earnings, financial condition and liquidity.
Our results of operations for any quarter are not necessarily indicative of our results of operations for a full year.
Home furnishings sales fluctuate from quarter to quarter due to factors such as changes in economic and competitive conditions, weather conditions and changes in consumer order patterns. From time to time, we have experienced, and may continue to experience, volatility with respect to demand for our home furnishing products. The acquisition and integration of Home Meridian may increase that volatility. Accordingly, our results of operations for any quarter are not necessarily indicative of the results of operations to be expected for a full year.
Future costs of complying with various laws and regulations may adversely impact future operating results.
Our business is subject to various domestic and international laws and regulations that could have a significant impact on our operations and the cost to comply with such laws and regulations could adversely impact our sales, earnings, financial condition and liquidity. In addition, failure to comply with such laws and regulations, even inadvertently, could produce negative consequences which could adversely impact our operations and reputation.
Risks Specific to the Acquisition and Integration of Home Meridian
We may fail to realize all of the anticipated benefits of the Home Meridian acquisition.
While we believe that the Home Meridian acquisition will be accretive to our earnings per share beginning in fiscal 2017, this expectation is based on preliminary estimates which may materially change. While we do not expect to merge operations or change customer-facing services, the success of this acquisition will depend, in part, on our ability to improve each business by sharing best practices in order to lower costs, improve efficiencies and grow sales. There can be no assurance regarding when or the extent to which we will be able to realize these benefits. Achieving the anticipated benefits is subject to a number of uncertainties, including whether the business acquired can be operated in the manner we intend. Events outside of our control could also adversely affect our ability to realize the anticipated benefits from the acquisition. Thus, the integration of Home Meridian’s business may be unpredictable, subject to delays or changed circumstances, and we can give no assurance that the acquired business will perform in accordance with our expectations, or that our expectations with respect to integration or benefits as a result of the acquisition will materialize. Additionally, a major asset acquired in this acquisition was Home Meridian’s existing customer relationships. While we believe that these relationships will continue and result in profitable sales, there can be no assurance that they will.
The anticipated benefits and cost savings of the proposed acquisition may not be realized fully or at all, or may take longer to realize than expected. The integration process could result in the loss of key employees, the disruption of ongoing businesses or inconsistencies in standards, controls, procedures and policies. If the integration is not completed as planned, our ongoing business and financial results may be adversely affected, which could adversely affect our sales, earnings, financial condition and liquidity.
We incurred significant debt to provide permanent financing for the acquisition.
We funded $60 million of the acquisition price with term loans. Acquisition-related principal and interest payments on the borrowed funds are expected to be approximately $7.0 million in fiscal 2017. We are subject to interest rate volatility due to the variable rates of interest on our loans. Among other risks, our debt:
|
|
§
|
may limit our flexibility to pursue other strategic opportunities or react to changes in our business and the industry in which we operate and, consequently, place us at a competitive disadvantage to competitors with less debt;
|
|
|
§
|
will require a portion of our cash flows from operations to be used for debt service payments, thereby reducing the availability of cash flows to fund working capital, capital expenditures, dividend payments and other general corporate purposes;
|
|
|
§
|
may result in higher interest expense in the event of increases in market interest rates for both long‑term debt as well as any borrowings under our line of credit at variable rates; and
|
|
|
§
|
may require that additional terms, conditions or covenants be placed on us.
|
The intangible assets we expect to record as a result of the acquisition could become impaired.
We expect to account for this acquisition using the acquisition method of accounting, which could result in charges to our earnings that could adversely affect our reported operating results. Under this method, we will allocate the total purchase price to the assets acquired and liabilities assumed from HMI based on their fair values as of February 1, 2016 (the date of the completion of the acquisition) and will record any excess of the purchase price over those fair values as goodwill. To the extent the value of goodwill or intangible assets were to become impaired, we may be required to incur charges relating to the impairment of those assets. Goodwill is tested for impairment annually or whenever events or changes in circumstances indicate impairment may have occurred. If we make changes in our business strategy or if market or other conditions adversely affect operations in any of our businesses, we may be forced to record a non-cash impairment charge, which would reduce our reported assets, net income and shareholders’ equity. If the testing performed indicates that impairment has occurred, we are required to record an impairment charge for the difference between the carrying value of the goodwill and the implied fair value of the goodwill in the period the determination is made. The testing of goodwill for impairment requires us to make significant estimates about our future performance and cash flows, as well as other assumptions. These estimates can be affected by numerous factors, including: future business operating performance, changes in economic conditions and interest rates, regulatory, industry or market conditions, changes in business operations, or changes in competition. Any changes in key assumptions, or actual performance compared with key assumptions, about our business and its future prospects could affect the fair value of one or more business segments, which may result in an impairment charge which would adversely affect our earnings and financial condition.
We incurred significant acquisition and acquisition‑related costs in connection with this transaction and expect to incur additional acquisition and integration-related costs in fiscal 2017.
Through the end of our 2016 fiscal year, we incurred approximately $1.1 million in deal-related costs and anticipate incurring approximately $1.5 million in additional deal and integration-related costs in fiscal 2017. We could encounter other integration-related costs or other factors, such as the failure to realize benefits anticipated from the proposed transaction, which could negatively impact the projected financial consequences of the acquisition and adversely affect our financial condition and liquidity. Our anticipated costs to achieve the integration of Home Meridian may differ significantly from our current estimates. The integration may place an additional burden on our management and internal resources, and the diversion of management’s attention during the integration process could have an adverse effect on our business, financial condition and expected operating results. Any of these factors could adversely affect our earnings, financial condition and liquidity.
We assumed HMI’s legacy pension plan obligations.
We assumed approximately $9.0 million of HMI’s legacy pension plan obligations on the acquisition date of February 1, 2016. While the plan is frozen and no new participants are being added, we expect to be impacted by the plan’s investment performance, changes in actuarial assumptions and the funded status of the plan, which could adversely affect our financial condition and liquidity. Should we decide to terminate the pension plan in the future, we expect to record settlement expenses against our earnings and contribute a final cash contribution, which could adversely affect our financial condition and liquidity.
Risks Specific to HMI’s Operations or to the Operations of the Combined Entity
As previously mentioned, we completed the acquisition of substantially all of the assets of Home Meridian International (HMI) subsequent to the end of our 2016 fiscal year and we are early into the process of integrating the two companies. The risks outlined above are forward looking, but are largely based on our operations before the completion of the acquisition on February 1, 2016. However, except for the risk factors above that deal with domestic manufacturing and upholstery operations, we believe that the risk factors disclosed represent, in all material respects, most of the risks of the combined companies. However, there are risk factors not detailed above that are either specific to Home Meridian’s operations or different enough from those discussed above to warrant separate or additional disclosure:
A material part of HMI’s sales and accounts receivable are concentrated in a few customers, some of which are existing Hooker customers.
Sixty-percent of HMI’s fiscal 2015 sales were concentrated in ten customers. Hooker sold to six of those ten customers during its 2016 fiscal year and sales to those customers accounted for nearly 12% of Hooker’s fiscal 2016 sales. Two of those ten customers each accounted for over 10% of HMI’s fiscal 2015 sales and both of those customers combined accounted for over 27% of HMI’s total fiscal 2015 sales. Of those two customers, Hooker sold to only one during its 2016 fiscal year and those sales accounted for less than 1% of Hooker’s fiscal 2016 sales. Those same two customers accounted for over 30% of HMI’s accounts receivable at the end of its fiscal year on November 1, 2015. HMI’s results will be included in Hooker’s quarterly and annual fiscal 2017 results; however, we are early into the 2017 fiscal year and therefore unable to determine if the two customers referenced above will account for 10% or more of the combined entity’s sales or accounts receivable for fiscal 2017. However, the loss of one or a combination of those customers, could adversely affect our earnings, financial condition and liquidity.
A disruption affecting Home Meridian’s Madison, NC, Mayodan, NC or Redlands, CA warehouses or its High Point, NC administrative facilities could disrupt our business.
Home Meridian’s domestic warehouses are critical to its success. Its division headquarters houses most of its administration, sourcing, sales, finance, merchandising, customer service and traffic functions. A disruption affecting any or a combination of these facilities, for even a relatively short period of time, could adversely affect its ability to ship its products and disrupt its business, which could adversely affect our sales, earnings, financial condition and liquidity.
ITEM 1B. UNRESOLVED STAFF COMMENTS
None.
ITEM 2. PROPERTIES
Set forth below is information with respect to our principal properties at April 15, 2016. We believe all of these properties are well-maintained and in good condition. During fiscal 2016, we estimate our upholstery plants operated at approximately 81% of capacity on a one-shift basis. All our production facilities are equipped with automatic sprinkler systems. All facilities maintain modern fire and spark detection systems, which we believe are adequate. We have leased certain warehouse facilities for our distribution and import operations, typically on a short and medium-term basis. We expect that we will be able to renew or extend these leases or find alternative facilities to meet our warehousing and distribution needs at a reasonable cost. All facilities set forth below are active and operational, representing approximately 3.5 million square feet of owned space, leased space or properties utilized under third-party operating agreements.
|
Location
|
Segment Use
|
Primary Use
|
Approximate Size in Square Feet
|
Owned or Leased
|
||||||
|
Martinsville, Va.
|
All segments
|
Corporate Headquarters
|
43,000
|
Owned
|
||||||
|
Martinsville, Va.
|
All segments
|
Distribution and Imports
|
580,000
|
Owned
|
||||||
|
Martinsville, Va.
|
All segments
|
Customer Support Center
|
146,000
|
Owned
|
||||||
|
Martinsville, Va.
|
All segments
|
Distribution
|
628,000
|
Leased (1)
|
||||||
|
High Point, N.C.
|
All segments
|
Showroom
|
80,000
|
Leased (2)
|
||||||
|
Cherryville, N.C.
|
Upholstery
|
Manufacturing Supply Plant
|
53,000
|
Owned (3)
|
||||||
|
Hickory, N.C.
|
Upholstery
|
Manufacturing
|
91,000
|
Owned (3)
|
||||||
|
Hickory, N.C.
|
Upholstery
|
Manufacturing and Offices
|
36,400
|
Leased (3) (4)
|
||||||
|
Bedford, Va.
|
Upholstery
|
Manufacturing and Offices
|
327,000
|
Owned (5)
|
||||||
|
High Point, N.C.
|
*
|
Showroom
|
77,000
|
Leased (6) (13)
|
||||||
|
High Point, N.C.
|
*
|
Office
|
23,796
|
Leased (6) (7)
|
||||||
|
High Point, N.C.
|
*
|
Warehouse
|
16,900
|
Leased (6) (8)
|
||||||
|
Madison, N.C.
|
*
|
Warehouse
|
500,000
|
Leased (6) (9)
|
||||||
|
Mayodan, N.C.
|
*
|
Warehouse
|
100,000
|
Leased (6) (10)
|
||||||
|
Mayodan, N.C.
|
*
|
Warehouse
|
235,144
|
Leased (6) (11)
|
||||||
|
Redlands, CA.
|
*
|
Warehouse
|
327,790
|
Leased (6) (12)
|
||||||
|
Ho Chi Minh City, Vietnam
|
*
|
Office and Warehouse
|
4,893
|
Leased (6) (14)
|
||||||
|
Haining, China
|
*
|
Warehouse
|
5,920
|
Leased (6) (12)
|
||||||
|
Haining, China
|
*
|
Office
|
1,690
|
Leased (6) (15)
|
||||||
|
Dongguan, China
|
*
|
Office
|
1,571
|
Leased (6) (16)
|
||||||
|
(1) Lease expires March 31, 2021.
|
||||||||||
|
(2) Lease expires October 31, 2016.
|
||||||||||
|
(3) Comprise the principal properties of Bradington-Young LLC.
|
||||||||||
|
(4) Lease expires December 15, 2016 and provides for 2 two-year extensions at our election.
|
||||||||||
|
(5) Comprise the principal properties of Sam Moore Furniture LLC.
|
||||||||||
|
(6) Comprise the principal properties of Home Meridian International.
|
||||||||||
|
(7) Lease expires March 31, 2022.
|
||||||||||
|
(8) Lease expires May 31, 2016.
|
||||||||||
|
(9) Lease expires August 31, 2016.
|
||||||||||
|
(10) Lease expires May 31, 2020 and provides for two twelve-month extensions at our election.
|
||||||||||
|
(11) Lease expires October 31, 2020.
|
||||||||||
|
(12) Lease expires December 31, 2016.
|
||||||||||
|
(13) Lease expires October 31, 2023.
|
||||||||||
|
(14) Lease expires March 15, 2018.
|
||||||||||
|
(15) Lease expires September 17, 2016.
|
||||||||||
|
(16) Lease expires September 30, 2016.
|
||||||||||
|
* The completion of the acquisition of HMI's assets occurred subsequent to the end of our 2016 fiscal year.
|
||||||||||
|
Consequently, we have not yet determined the operating segments of the combined entity.
|
||||||||||
Set forth below is information regarding principal properties we utilize that are owned and operated by third parties.
|
Location
|
Segment Use
|
Primary Use
|
Approximate Size in Square Feet
|
|||
|
Guangdong, China
|
Casegoods
|
Distribution
|
210,000 (1)
|
|||
|
Ho Chi Minh City, Vietnam
|
Casegoods
|
Distribution
|
25,000 (2)
|
|||
|
(1) This property is subject to an operating agreement that expires on July 31, 2016.
|
||||||
|
Renewal is automatic unless either party gives notice to terminate 120 days prior to expiration.
|
||||||
|
(2) This property is subject to an operating agreement that may be canceled by either party
|
||||||
|
upon 45 days written notice and is canceled if no storage or other services are performed
|
||||||
|
under the contract for 180 days.
|
||||||
ITEM 3. LEGAL PROCEEDINGS
None.
ITEM 4. MINE SAFETY DISCLOSURES
None.
EXECUTIVE OFFICERS OF
HOOKER FURNITURE CORPORATION
Hooker Furniture’s executive officers and their ages as of April 15, 2016 and the calendar year each joined the Company are as follows:
|
Name
|
Age
|
Position
|
Year Joined Company
|
|||
|
Paul B. Toms, Jr.
|
61
|
Chairman and Chief Executive Officer
|
1983
|
|||
|
Paul A. Huckfeldt
|
58
|
Chief Financial Officer and
|
2004
|
|||
|
Senior Vice President - Finance and Accounting
|
||||||
|
Michael W. Delgatti, Jr.
|
62
|
President - Hooker Furniture Corporation
|
2009
|
|||
|
Anne M. Jacobsen
|
54
|
Senior Vice President-Administration
|
2008
|
|||
|
George Revington
|
69
|
President and Chief Operating Officer - Home Meridian
|
2016
|
Paul B. Toms, Jr. has been Chairman and Chief Executive Officer since December 2000 and also served as President for most of the period from November 2006 to August 2011. Mr. Toms was President and Chief Operating Officer from December 1999 to December 2000, Executive Vice President - Marketing from 1994 to December 1999, Senior Vice President - Sales and Marketing from 1993 to 1994, and Vice President - Sales from 1987 to 1993. Mr. Toms joined the Company in 1983 and has been a Director since 1993.
Paul A. Huckfeldt has been Senior Vice President - Finance and Accounting since September 2013 and Chief Financial Officer since January 2011. Mr. Huckfeldt served as Vice President – Finance and Accounting from December 2010 to September 2013, Corporate Controller and Chief Accounting Officer from January 2010 to January 2011, Manager of Operations Accounting from March 2006 to December 2009 and led the Company’s Sarbanes-Oxley implementation and subsequent compliance efforts from April 2004 to March 2006.
Michael W. Delgatti, Jr. has been President since February 2014. Mr. Delgatti served as President – Hooker Upholstery from August 2011 to January 2014 and Executive Vice-President of Corporate Sales from September 2012 to January 2014. Mr. Delgatti joined the Company in January of 2009 as Executive Vice-President of Hooker Upholstery.
Anne M. Jacobsen has been Senior Vice President- Administration since January 2014. Ms. Jacobsen joined the Company in January of 2008 as Director of Human Resources and served as Vice President- H R and Administration from January 2011 to January 2014 and Vice President-Human Resources from November 2008 to January 2011.
George Revington joined the Company as President and Chief Operating Officer of the Home Meridian division upon the acquisition of Home Meridian’s assets by the Company in February 2016. Prior to that, Mr. Revington served as President and Chief Executive Officer of Home Meridian International since its creation in 2006.
Hooker Furniture Corporation
Part II
ITEM 5. MARKET FOR REGISTRANT’S COMMON EQUITY, RELATED SHAREHOLDER MATTERS AND ISSUER PURCHASES OF EQUITY SECURITIES
Our stock is traded on the NASDAQ Global Select Market under the symbol “HOFT”. The table below sets forth the high and low sales prices per share for our common stock and the dividends per share we paid with respect to our common stock for the periods indicated.
|
Sales Price Per Share
|
Dividends
|
|||||||||||
|
High
|
Low
|
Per Share
|
||||||||||
|
November 2, 2015 - January 31, 2016
|
$ | 30.51 | $ | 24.00 | $ | 0.10 | ||||||
|
August 3, - November 1, 2015
|
26.50 | 22.16 | 0.10 | |||||||||
|
May 4, - August 2, 2015
|
27.30 | 23.50 | 0.10 | |||||||||
|
February 2 - May 3, 2015
|
26.67 | 17.57 | 0.10 | |||||||||
|
November 3, 2014 - February 1, 2015
|
$ | 18.77 | $ | 14.25 | $ | 0.10 | ||||||
|
August 4, - November 2, 2014
|
16.00 | 14.24 | 0.10 | |||||||||
|
May 5, - August 3, 2014
|
17.40 | 13.60 | 0.10 | |||||||||
|
February 3 - May 4, 2014
|
16.24 | 13.64 | 0.10 | |||||||||
As of January 31, 2016, we had approximately 5,300 beneficial shareholders. We expect that future regular quarterly dividends will be declared and paid in the months of March, June, September, and December. Although we presently intend to continue to declare regular cash dividends on a quarterly basis for the foreseeable future, the determination as to the payment and the amount of any future dividends will be made by the Board of Directors on a quarterly basis and will depend on our then-current financial condition, capital requirements, results of operations and any other factors then deemed relevant by the Board of Directors.
Purchase of Equity Securities by the Issuer and Affiliated Purchasers
During the fiscal 2013 first quarter, our Board of Directors authorized the repurchase of up to $12.5 million of the Company’s common shares. During fiscal 2013, we used an aggregate of $671,000 to purchase 57,700 shares of our stock at an average price of $11.63 per share. No shares were purchased during fiscal 2014, 2015 or fiscal 2016. Approximately $11.8 million remains available under the board’s authorization as of January 31, 2016. For additional information regarding this repurchase authorization, see the “Share Repurchase Authorization” section in Management’s Discussion and Analysis of Financial Condition and Results of Operations.
Performance Graph
The following graph compares cumulative total shareholder return for the Company with a broad performance indicator, the Russell 2000® Index, and an industry index, the Household Furniture Index, for the period from January 30, 2011 to January 31, 2016.
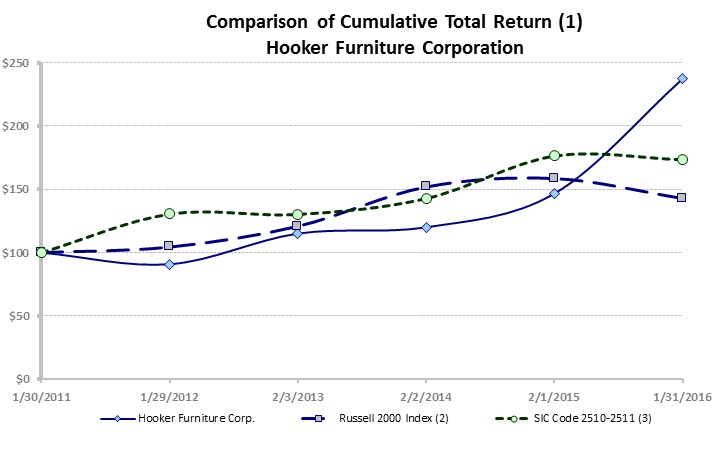
|
(1)
|
The graph shows the cumulative total return on $100 invested at the beginning of the measurement period in our common stock or the specified index, including reinvestment of dividends.
|
|
(2)
|
The Russell 2000® Index, prepared by Frank Russell Company, measures the performance of the 2,000 smallest companies out of the 3,000 largest U.S. companies based on total market capitalization.
|
|
(3)
|
Household Furniture Index as prepared by Zacks Investment Research, Inc. consists of companies under SIC Codes 2510 and 2511, which includes home furnishings companies that are publically traded in the United States or Canada. At January 31, 2016, Zacks Investment Research, Inc. reported that these two SIC Codes consisted of Bassett Furniture Industries, Inc., Dorel Industries, Inc., Ethan Allen Interiors, Inc., Flexsteel Industries, Inc., Hooker Furniture Corporation, La-Z-Boy, Inc., Leggett & Platt, Inc., Natuzzi SPA-ADR, Nova Lifestyle, Inc., Select Comfort Corporation, Stanley Furniture Company, Inc., Luvu Brands Inc., Kimball International, Inc. and Tempur Sealy.
|
ITEM 6. SELECTED FINANCIAL DATA
The following selected financial data for each of our last five fiscal years has been derived from our audited, consolidated financial statements. The selected financial data should be read in conjunction with the consolidated financial statements, including the related notes, and Management’s Discussion and Analysis of Financial Condition and Results of Operations included elsewhere in this report. Additionally, we face a number of significant risks and uncertainties, as more fully discussed in Item 1A, “Risk Factors”, above. If any or a combination of these risks and uncertainties were to occur, the information below may not be fully indicative of our future financial condition or results of operations.
|
Fiscal Year Ended (1)
|
||||||||||||||||||||
|
January 31,
|
February 1,
|
February 2,
|
February 3,
|
January 29,
|
||||||||||||||||
|
2016
|
2015
|
2014
|
2013
|
2012
|
||||||||||||||||
|
(In thousands, except per share data)
|
||||||||||||||||||||
|
Income Statement Data:
|
||||||||||||||||||||
|
Net sales
|
$ | 246,999 | $ | 244,350 | $ | 228,293 | $ | 218,359 | $ | 222,505 | ||||||||||
|
Cost of sales
|
178,311 | 181,550 | 173,568 | 165,813 | 173,642 | |||||||||||||||
|
Gross profit
|
68,688 | 62,800 | 54,725 | 52,546 | 48,863 | |||||||||||||||
|
Selling and administrative expenses (2)
|
44,426 | 43,752 | 42,222 | 39,606 | 40,375 | |||||||||||||||
|
Goodwill and intangible asset impairment charges (3)
|
- | - | - | - | 1,815 | |||||||||||||||
|
Operating income
|
24,262 | 19,048 | 12,503 | 12,940 | 6,673 | |||||||||||||||
|
Other income (expense), net
|
197 | 350 | (35 | ) | 53 | 272 | ||||||||||||||
|
Income before income taxes
|
24,459 | 19,398 | 12,468 | 12,993 | 6,945 | |||||||||||||||
|
Income taxes
|
8,274 | 6,820 | 4,539 | 4,367 | 1,888 | |||||||||||||||
|
Net income
|
16,185 | 12,578 | 7,929 | 8,626 | 5,057 | |||||||||||||||
|
Per Share Data:
|
||||||||||||||||||||
|
Basic earnings per share
|
$ | 1.50 | $ | 1.17 | $ | 0.74 | $ | 0.80 | $ | 0.47 | ||||||||||
|
Diluted earnings per share
|
$ | 1.49 | $ | 1.16 | $ | 0.74 | $ | 0.80 | $ | 0.47 | ||||||||||
|
Cash dividends per share
|
0.40 | 0.40 | 0.40 | 0.40 | 0.40 | |||||||||||||||
|
Net book value per share (4)
|
14.46 | 13.30 | 12.57 | 12.19 | 11.78 | |||||||||||||||
|
Weighted average shares outstanding (basic)
|
10,779 | 10,736 | 10,722 | 10,745 | 10,762 | |||||||||||||||
|
Balance Sheet Data:
|
||||||||||||||||||||
|
Cash and cash equivalents
|
$ | 53,922 | $ | 38,663 | $ | 23,882 | $ | 26,342 | $ | 40,355 | ||||||||||
|
Trade accounts receivable
|
28,176 | 32,245 | 29,393 | 28,272 | 25,807 | |||||||||||||||
|
Inventories
|
43,713 | 44,973 | 49,016 | 49,872 | 34,136 | |||||||||||||||
|
Working capital
|
111,462 | 100,871 | 94,142 | 92,200 | 89,534 | |||||||||||||||
|
Total assets
|
181,653 | 170,755 | 155,481 | 155,823 | 149,171 | |||||||||||||||
|
Long-term debt
|
- | - | - | - | - | |||||||||||||||
|
Shareholders' equity
|
156,061 | 142,909 | 134,803 | 131,045 | 127,113 | |||||||||||||||
|
(1)
|
Our fiscal years end on the Sunday closest to January 31. The fiscal years presented above all had 52 weeks, except for the fiscal year ended February 3, 2013, which had 53 weeks.
|
|
(2)
|
Selling and administrative expenses for fiscal 2014 included $2.1 million of startup costs pre-tax ($1.4 million, or $0.13 per share after tax) for our H Contract and Homeware business initiatives.
|
|
(3)
|
Based on our annual impairment analyses, we recorded intangible asset impairment charges in fiscal 2012, $1.8 million pretax ($1.1 million after tax or $0.10 per share) on our Bradington-Young trade name.
|
|
(4)
|
Net book value per share is derived by dividing “shareholders’ equity” by the number of common shares issued and outstanding, excluding unvested restricted shares, all determined as of the end of each fiscal period.
|
ITEM 7. MANAGEMENT’S DISCUSSION AND ANALYSIS OF FINANCIAL CONDITION AND RESULTS OF OPERATIONS
The following discussion should be read in conjunction with the selected financial data and the consolidated financial statements, including the related notes, contained elsewhere in this annual report. We especially encourage users of this report to familiarize themselves with:
|
|
§
|
All of our recent public filings made with the Securities and Exchange Commission (“SEC”). Our public filings made with the SEC are available, without charge, at www.sec.gov and at http://investors.hookerfurniture.com;
|
|
|
§
|
The forward-looking statements contained in Item 1 of this report, which describe the significant risks and uncertainties that could cause actual results to differ materially from those forward-looking statements made in this report, including those contained in this section of our annual report on Form 10-K;
|
|
|
§
|
The company-specific risks found in Item 1A “Risk Factors” of this report. This section contains critical information regarding significant risks and uncertainties that we face. If any of these risks materialize, our business, financial condition and future prospects could be adversely impacted; and
|
|
|
§
|
Our commitments and contractual obligations and off-balance sheet arrangements described on page 36 and in Note 15 on page F-27 of this report. These sections describe commitments, contractual obligations and off-balance sheet arrangements, some of which are not reflected in our consolidated financial statements.
|
All references to the Company in this discussion refer to the Company and its consolidated subsidiaries, unless specifically referring to segment information. Unless otherwise indicated, amounts shown in tables are in thousands, except for share and per share data.
Our fiscal years end on the Sunday closest to January 31. In some years (generally once every six years) the fourth quarter will be fourteen weeks long and the fiscal year will consist of fifty-three weeks. For example, the 2013 fiscal year that ended on February 3, 2013 was a 53-week fiscal year. Our quarterly periods are based on thirteen-week “reporting periods” (which end on a Sunday) rather than quarterly periods consisting of three calendar months. As a result, each quarterly period generally is thirteen weeks, or 91 days, long, except as noted above.
The financial statements filed as part of this annual report on Form 10-K include the:
|
|
§
|
fifty-two week period that began February 2, 2015 and ended on January 31, 2016 (fiscal 2016);
|
|
|
§
|
fifty-two week period that began February 3, 2014 and ended on February 1, 2015 (fiscal 2015); and
|
|
|
§
|
fifty-two week period that began February 4, 2013 and ended on February 2, 2014 (fiscal 2014).
|
Nature of Operations
Hooker Furniture Corporation (the “Company”, “we,” “us” and “our”) is a home furnishings marketing, design and logistics company offering worldwide sourcing of residential and contract casegoods and upholstery, as well as domestically-produced custom leather and fabric-upholstered furniture. We were incorporated in Virginia in 1924 and are ranked among the nation’s top 10 largest publicly traded furniture sources, based on 2015 shipments to U.S. retailers, according to a 2015 survey published by Furniture Today, a leading trade publication. We are a key resource for residential wood and metal furniture (commonly referred to as “casegoods”) and upholstered furniture. Our major casegoods product categories include accents, home office, dining, bedroom and home entertainment furniture under the Hooker Furniture brand. Our residential upholstered seating companies include Bradington-Young, a specialist in upscale motion and stationary leather furniture and Sam Moore Furniture, a specialist in upscale occasional chairs, settees, sofas and sectional seating with an emphasis on cover-to-frame customization. An extensive selection of designs and formats along with finish and cover options in each of these product categories makes us a comprehensive resource for retailers primarily targeting the upper-medium price range. We also market a line of imported leather upholstery under the Hooker Upholstery trade name. We also work directly with several large customers to develop private-label, unbranded products exclusively for those customers. Our H Contract division supplies upholstered seating and casegoods to upscale senior living facilities throughout the country, working with designers specializing in the contract industry to provide functional furniture for senior living facilities that meets the style and comfort expectations of today’s retirees. Homeware is an online-only brand that is sold through leading international e-commerce retailers. It supplies unique chairs, sofas and ottomans designed to be assembled in minutes by the consumer with no tools or hardware required.
For our core product line, our principal customers are both traditional and online retailers of residential home furnishings that are broadly dispersed throughout the United States and in thirty-six other countries around the globe. Our customers include independent furniture stores, specialty retailers, department stores, catalog and internet merchants, interior designers and national and regional chains. They are serviced by over 60 independent North American sales representatives and 8 foreign sales representatives. H Contract’s customers include designers, design firms, industry dealers and distributors and senior living facilities throughout the United States. It has its own sales force of independent multi-line sales representatives. Homeware’s customers are primarily online home furnishings retailers.
On January 5, 2016, we entered into an asset purchase agreement with Home Meridian International, Inc. (“HMI”) to acquire substantially all of HMI’s assets in exchange for $85 million in cash and approximately $20.3 million in unregistered shares of our common stock, of which $5.3 million was due to a working capital adjustment provided for in the asset purchase agreement. We completed the acquisition on February 1, 2016, subsequent to the end of our 2016 fiscal year and thus none of the results of HMI are included in our fiscal 2016 results. We believe this acquisition will more than double the size of the Company on a net sales basis and consequently, make us one of the top five public sources for the U.S. furniture market. See note 18 to our consolidated financial statements for additional information.
For financial reporting purposes, we are organized into three operating segments – casegoods furniture, upholstered furniture and all other.
Overview
Consumer home furnishings purchases are driven by an array of factors, including general economic conditions such as:
|
|
§
|
consumer confidence;
|
|
|
§
|
availability of consumer credit;
|
|
|
§
|
energy and other commodity prices; and
|
|
|
§
|
housing and mortgage markets;
|
as well as lifestyle-driven factors such as changes in:
|
|
§
|
fashion trends;
|
|
|
§
|
disposable income; and
|
|
|
§
|
household formation and turnover.
|
Our lower overhead, variable-cost import operations help drive our profitability and provide us with more flexibility to respond to changing demand by adjusting inventory purchases from suppliers. This import model requires constant vigilance due to a larger investment in inventory and longer production lead times. We constantly evaluate our imported furniture suppliers and when quality concerns, inflationary pressures, or trade barriers, such as duties and tariffs, diminish our value proposition, we transition sourcing to other suppliers, often located in different countries or regions.
Our domestic upholstery operations have significantly higher overhead and fixed costs than our import operations, and their profitability has been and can be adversely affected by economic downturns. Our upholstery segment operations have been profitable since fiscal 2013, with overall profitability improving each year, primarily due to improving profitability in our domestic upholstery, which lagged the import operations during the economic downturn but are now seeing the impact of cost reduction efforts and improving sales on their operations.
Fiscal 2016 Executive Summary-Results of Operations
All segments reported improved operating profitability over the prior year, even on generally modest sales increases. Consolidated gross profit increased 9.4% or $5.9 million primarily due to decreased discounting, reduced returns and allowances and lower quality costs in our casegoods segment; improved operating efficiencies and decreased contract manufacturing in our upholstery segment; and increased net sales in our All Other segment, due primarily to a 70% net sales increase at H Contract. Flat selling and administrative expenses (“S&A”) as a percentage of net sales were due primarily to increased net sales. S&A increased by $674,000 in absolute terms due primarily to $1.2 million in acquisition-related costs recognized in the fiscal year which were mostly offset by other decreases in S&A discussed below. Consolidated operating income increased $5.2 million or about 28% to nearly 10% of net sales due to these factors. Our casegoods segment generated an operating margin of about 12% and upholstery segment operating income more than doubled. Net income increased $3.6 million or nearly 30%.
Results of Operations
The following table sets forth the percentage relationship to net sales of certain items for the annual periods included in the consolidated statements of income:
|
Fifty-two
|
Fifty-two
|
Fifty-two
|
||||||||||
|
weeks ended
|
weeks ended
|
weeks ended
|
||||||||||
|
January 31,
|
February 1,
|
February 2,
|
||||||||||
|
2016
|
2015
|
2014
|
||||||||||
|
Net sales
|
100.0 | % | 100.0 | % | 100.0 | % | ||||||
|
Cost of sales
|
72.2 | 74.3 | 76.0 | |||||||||
|
Gross profit
|
27.8 | 25.7 | 24.0 | |||||||||
|
Selling and administrative expenses
|
18.0 | 17.9 | 18.5 | |||||||||
|
Operating income
|
9.8 | 7.8 | 5.5 | |||||||||
|
Other income, net
|
0.1 | 0.2 | 0.0 | |||||||||
|
Income before income taxes
|
9.9 | 7.9 | 5.5 | |||||||||
|
Income taxes
|
3.3 | 2.8 | 2.0 | |||||||||
|
Net income
|
6.6 | 5.1 | 3.5 | |||||||||
Fiscal 2016 Compared to Fiscal 2015
Net Sales
|
Fifty-two weeks ended
|
Fifty-two weeks ended
|
|||||||||||||||||||||||
|
January 31, 2016
|
February 1, 2015
|
$ Change
|
% Change
|
|||||||||||||||||||||
|
% Net Sales
|
% Net Sales
|
|||||||||||||||||||||||
|
Casegoods
|
$ | 155,106 | 62.8 | % | $ | 153,882 | 63.0 | % | $ | 1,224 | 0.8 | % | ||||||||||||
|
Upholstery
|
84,090 | 34.0 | % | 86,362 | 35.3 | % | (2,272 | ) | -2.6 | % | ||||||||||||||
|
All Other
|
8,033 | 3.3 | % | 5,025 | 2.1 | % | 3,008 | 59.9 | % | |||||||||||||||
|
Intercompany Eliminations
|
(230 | ) | (919 | ) | 689 | |||||||||||||||||||
|
Consolidated
|
$ | 246,999 | 100.0 | % | $ | 244,350 | 100.0 | % | $ | 2,649 | 1.1 | % | ||||||||||||
Unit Volume and Average Selling Price
|
Unit Volume
|
FY16 % Increase vs. FY15
|
Average Selling Price ("ASP")
|
FY16 % Increase vs. FY15
|
|||||||
|
Casegoods
|
-3.7 | % |
Casegoods
|
4.1 | % | |||||
|
Upholstery
|
-5.2 | % |
Upholstery
|
2.7 | % | |||||
|
All other
|
98.0 | % |
All other
|
-19.7 | % | |||||
|
Consolidated
|
-1.5 | % |
Consolidated
|
2.0 | % | |||||
The increase in consolidated net sales for fiscal 2016 was principally due to increased unit volume in our All Other segment due to significantly increased sales at H Contract and higher ASP in our casegoods segment due to lower product discounting.
We believe the decreased unit volume in our casegoods segment was due to:
|
|
§
|
Slowing retail furniture sales in the second half of 2016;
|
|
|
§
|
Lingering product availability challenges due to expanding lead times and late deliveries of certain of our more popular October 2014 market introductions in that segment during the fiscal 2016 first quarter. We received most of the October market introductions and delivered standing orders to customers during the fiscal 2016 second quarter; however, late deliveries resulted in delayed reorders even on products which have retailed well, which impacted shipments into the fiscal 2016 second half; and
|
|
|
§
|
Outages of key component products that prevented orders for certain suites from shipping during the fiscal 2016 third quarter.
|
Unit volume decreases in our upholstery segment were primarily caused by:
|
|
§
|
decreases at Hooker upholstery due to pressure on motion upholstery pricing and, to a lesser extent, exiting lower margin sales programs at the expense of net sales; and
|
|
|
§
|
decreases at Sam Moore due to the effects of discontinuing unprofitable sales programs at the expense of net sales and lingering post-ERP implementation inefficiencies during the second half of fiscal 2016.
|
Gross Profit
|
Fifty-two weeks ended
|
Fifty-two weeks ended
|
|||||||||||||||||||||||
|
January 31, 2016
|
February 1, 2015
|
$ Change
|
% Change
|
|||||||||||||||||||||
| % Segment Net Sales | % Segment Net Sales | |||||||||||||||||||||||
|
Casegoods
|
$ | 47,558 | 30.7 | % | $ | 44,868 | 29.2 | % | $ | 2,690 | 6.0 | % | ||||||||||||
|
Upholstery
|
18,852 | 22.4 | % | 16,489 | 19.1 | % | 2,363 | 14.3 | % | |||||||||||||||
|
All Other
|
2,252 |
28.0
|
% | 1,465 | 29.2 | % | 787 | 53.7 | % | |||||||||||||||
|
|
||||||||||||||||||||||||
| Intercompany Eliminations | 26 | (22 | ) | 48 | ||||||||||||||||||||
| Consolidated | $ | 68,688 | 27.8 | % | $ | 62,800 | 25.7 | % | $ | 5,888 | 9.4 | % | ||||||||||||
Consolidated gross profit increased in the fiscal 2016, primarily due to:
|
|
§
|
Improved casegoods segment gross profit due to decreased discounting due to a better product mix, lower cost of goods sold due to declining freight costs, which more than offset vendor price increases, and lower returns and allowances and other quality related costs as a result of better product quality;
|
|
|
§
|
Improved upholstery segment gross profit due to operating efficiencies such as decreased contract manufacturing and lower medical claims expense in that segment; and
|
|
|
§
|
Improved All Other segment gross profit due primarily to increased net sales at H Contract.
|
Selling and Administrative Expenses
|
Fifty-two weeks ended
|
Fifty-two weeks ended
|
|||||||||||||||||||||||
|
January 31, 2016
|
February 1, 2015
|
$ Change
|
% Change
|
|||||||||||||||||||||
|
% Segment
Net Sales
|
% Segment
Net Sales
|
|||||||||||||||||||||||
|
Casegoods
|
$ | 29,049 | 18.7 | % | $ | 27,582 | 17.9 | % | $ | 1,467 | 5.3 | % | ||||||||||||
|
Upholstery
|
12,833 | 15.3 | % | 13,618 | 15.8 | % | (785 | ) | -5.8 | % | ||||||||||||||
|
All Other
|
2,544 | 31.7 | % | 2,552 | 50.8 | % | (8 | ) | -0.3 | % | ||||||||||||||
|
Consolidated
|
$ | 44,426 | 18.0 | % | $ | 43,752 | 17.9 | % | $ | 674 | 1.5 | % | ||||||||||||
Flat consolidated S&A expenses as a percentage of net sales were due primarily to slightly increased net sales and the recognition of $1.1 million in acquisition-related costs in casegoods segment S&A. Consolidated S&A increased by $674,000 in absolute terms due primarily due to the acquisition-related costs, which were partially offset by other decreases in S&A, such as bad debts and banking expenses. Upholstery segment S&A decreased primarily due to lower selling expenses due to decreased net sales and lower banking and bad debt expenses. Selling and administrative expenses in our All Other segment decreased despite a net sales increase in that segment, as our H Contract and Homeware businesses have each progressed beyond the startup phase.
Operating Income
|
Fifty-two weeks ended
|
Fifty-two weeks ended
|
|||||||||||||||||||||||
|
January 31, 2016
|
February 1, 2015
|
$ Change
|
% Change
|
|||||||||||||||||||||
|
% Segment
Net Sales
|
% Segment
Net Sales
|
|||||||||||||||||||||||
|
Casegoods
|
$ | 18,509 | 11.9 | % | $ | 17,286 | 11.2 | % | $ | 1,223 | 7.1 | % | ||||||||||||
|
Upholstery
|
6,020 | 7.2 | % | 2,871 | 3.3 | % | 3,149 | 109.7 | % | |||||||||||||||
|
All Other
|
(293 | ) | -3.6 | % | (1,087 | ) | -21.6 | % | 794 | 73.0 | % | |||||||||||||
|
Intercompany Eliminations
|
26 | (22 | ) | 48 | ||||||||||||||||||||
|
Consolidated
|
$ | 24,262 | 9.8 | % | $ | 19,048 | 7.8 | % | $ | 5,214 | 27.4 | % | ||||||||||||
Operating income increased for fiscal 2016 compared to the prior year both as a percentage of net sales and in absolute terms, due to the factors discussed above.
Income Taxes
|
Fifty-two weeks ended
|
Fifty-two weeks ended
|
|||||||||||||||||||||||
|
January 31, 2016
|
February 1, 2015
|
$ Change
|
% Change
|
|||||||||||||||||||||
|
% Net Sales
|
% Net Sales
|
|||||||||||||||||||||||
|
Consolidated income tax expense
|
$ | 8,274 | 3.3 | % | $ | 6,820 | 2.8 | % | $ | 1,454 | 21.3 | % | ||||||||||||
|
Effective Tax Rate
|
33.8 | % | 35.2 | % | ||||||||||||||||||||
We recorded income tax expense of $8.3 million during fiscal 2016, compared to $6.8 million for fiscal 2015, due primarily to higher taxable income. The effective income tax rates for the two fiscal years were 33.8% and 35.2% respectively. The decrease in effective rate is primarily due to the domestic production deduction as well as a decrease in uncertain tax positions.
Net Income and Earnings Per Share
|
Fifty-two weeks ended
|
Fifty-two weeks ended
|
|||||||||||||||||||||||
|
January 31, 2016
|
February 1, 2015
|
$ Change
|
% Change
|
|||||||||||||||||||||
|
% Net Sales
|
% Net Sales
|
|||||||||||||||||||||||
|
Consolidated
|
$ | 16,185 | 6.6 | % | $ | 12,578 | 5.1 | % | $ | 3,607 | 28.7 | % | ||||||||||||
|
Diluted earnings per share
|
$ | 1.49 | $ | 1.16 | ||||||||||||||||||||
Fiscal 2015 Compared to Fiscal 2014
Net Sales
|
Fifty-two weeks ended
|
Fifty-two weeks ended
|
|||||||||||||||||||||||
|
February 1, 2015
|
February 2, 2014
|
$ Change
|
% Change
|
|||||||||||||||||||||
|
% Net Sales
|
% Net Sales
|
|||||||||||||||||||||||
|
Casegoods
|
$ | 153,882 | 63.0 | % | $ | 143,802 | 63.0 | % | $ | 10,080 | 7.0 | % | ||||||||||||
|
Upholstery
|
86,362 | 35.3 | % | 83,027 | 36.4 | % | $ | 3,335 | 4.0 | % | ||||||||||||||
|
All Other
|
5,025 | 2.1 | % | 1,487 | 0.7 | % | $ | 3,538 | 237.9 | % | ||||||||||||||
|
Intercompany Eliminations
|
(919 | ) | (23 | ) | $ | (896 | ) | |||||||||||||||||
|
Consolidated
|
$ | 244,350 | 100.0 | % | $ | 228,293 | 100.0 | % | $ | 16,057 | 7.0 | % | ||||||||||||
|
Unit Volume
|
FY15 % Increase vs. FY14
|
Average Selling Price
|
FY15 % Increase vs. FY14
|
|||||||
|
Casegoods
|
-3.8 | % |
Casegoods
|
11.5 | % | |||||
|
Upholstery
|
-2.3 | % |
Upholstery
|
6.6 | % | |||||
|
All other
|
234.2 | % |
All other
|
2.9 | % | |||||
|
Consolidated
|
-1.5 | % |
Consolidated
|
9.3 | % | |||||
The increase in consolidated net sales in fiscal 2015 was primarily due to higher average selling prices in all operating segments, partially offset by lower casegoods and upholstery segment unit volume. Average selling price increased due to increased sales of products in the ‘best’ segment of our ‘better-best’ product assortment, as well as reduced casegoods discounting, which was a result of significant improvements in inventory management which reduced the amount of excess and obsolete inventory sold during the year and the discounts required to move those products. Unit volume decreases in our casegoods segment were primarily due to reduced sales of off-priced products, as well as reduced sales of the lower-priced Opus Designs and Envision products, as we exit those product lines. Upholstery net sales increased due to net sales gains at both Sam Moore and Bradington-Young, which were due primarily to higher average selling prices, partially offset by lower unit volume. We believe that the all other segment percentages shown are of limited use since the businesses in this segment are starting from a very low base and just completed their first full fiscal year in operation in fiscal 2015.
Gross Profit
|
Fifty-two weeks ended
|
Fifty-two weeks ended
|
|||||||||||||||||||||||
|
February 1, 2015
|
February 2, 2014
|
$ Change
|
% Change
|
|||||||||||||||||||||
|
% Segment Net Sales
|
% Segment Net Sales
|
|||||||||||||||||||||||
|
Casegoods
|
$ | 44,868 | 29.2 | % | $ | 38,762 | 27.0 | % | $ | 6,106 | 15.8 | % | ||||||||||||
|
Upholstery
|
16,489 | 19.1 | % | 15,393 | 18.5 | % | 1,096 | 7.1 | % | |||||||||||||||
|
All Other
|
1,465 | 29.2 | % | 588 | 39.5 | % | 877 | 149.1 | % | |||||||||||||||
|
Intercompany Eliminations
|
(22 | ) | (18 | ) | (4 | ) | ||||||||||||||||||
|
Consolidated
|
$ | 62,800 | 25.7 | % | $ | 54,725 | 24.0 | % | $ | 8,075 | 14.8 | % | ||||||||||||
Consolidated gross profit increased, primarily due to:
|
|
§
|
decreased casegoods segment discounting, partially offset by increased returns and allowances;
|
|
|
§
|
a $1.1 million gross profit increase in our upholstery segment due primarily to higher net sales and reduced manufacturing costs; and
|
|
|
§
|
a substantial increase in net sales for our H Contract business initiative as that business completes its first full year in operation and begins to establish itself in the contract furniture industry.
|
Selling and Administrative Expenses
|
Fifty-two weeks ended
|
Fifty-two weeks ended
|
|||||||||||||||||||||||
|
February 1, 2015
|
February 2, 2014
|
$ Change
|
% Change
|
|||||||||||||||||||||
|
% Segment Net Sales
|
% Segment Net Sales
|
|||||||||||||||||||||||
|
Casegoods
|
$ | 27,582 | 17.9 | % | $ | 26,612 | 18.5 | % | $ | 970 | 3.6 | % | ||||||||||||
|
Upholstery
|
13,618 | 15.8 | % | 13,480 | 16.2 | % | 138 | 1.0 | % | |||||||||||||||
|
All Other
|
2,552 | 50.8 | % | 2,130 | 143.3 | % | 422 | 19.8 | % | |||||||||||||||
|
Consolidated
|
$ | 43,752 | 17.9 | % | $ | 42,222 | 18.5 | % | $ | 1,530 | 3.6 | % | ||||||||||||
Casegoods segment selling and administrative expenses decreased as a percentage of net sales due to higher net sales, but increased in absolute terms primarily due to increased:
|
|
§
|
commission expense due to higher sales;
|
|
|
§
|
bonus expense due to higher earnings; and
|
|
|
§
|
bad debts expense due to the write-off of a customer account during the period.
|
These increases were partially offset by decreased:
|
|
§
|
professional services due to lower compliance costs; and
|
|
|
§
|
salaries and benefits expense due to the retirement of an executive in early fiscal 2015 and decreases in medical claims expense and increases in the cash surrender value of Company-owned life insurance.
|
Upholstery segment selling and administrative expenses decreased as a percentage of net sales primarily due to increased net sales but increased in absolute terms primarily due to increased:
|
|
§
|
bad debt expense due to the write-off of a customer account during the period; and
|
|
|
§
|
benefits expense due to higher medical claims expense.
|
These increases were partially offset by decreased:
|
|
§
|
advertising supplies due to better cost management; and
|
|
|
§
|
professional services due to reduced manufacturing-related consulting.
|
All other segment selling and administrative expenses increased primarily due to completing its first full year of operations, which included increased spending on salaries, wages and benefits and marketing expenses as we grow these new business initiatives out of their start-up phases, and higher commissions and other variable costs due to increased sales.
Operating Income
|
Fifty-two weeks ended
|
Fifty-two weeks ended
|
|||||||||||||||||||||||
|
February 1, 2015
|
February 2, 2014
|
$ Change
|
% Change
|
|||||||||||||||||||||
|
% Segment Net Sales
|
% Segment Net Sales
|
|||||||||||||||||||||||
|
Casegoods
|
$ | 17,286 | 11.2 | % | $ | 12,150 | 8.4 | % | $ | 5,136 | 42.3 | % | ||||||||||||
|
Upholstery
|
2,871 | 3.3 | % | 1,913 | 2.3 | % | 958 | 50.1 | % | |||||||||||||||
|
All Other
|
(1,087 | ) | -21.6 | % | (1,542 | ) | -103.7 | % | 455 | -29.5 | % | |||||||||||||
|
Intercompany Eliminations
|
(22 | ) | (18 | ) | (4 | ) | ||||||||||||||||||
|
Consolidated
|
$ | 19,048 | 7.8 | % | $ | 12,503 | 5.5 | % | $ | 6,545 | 52.3 | % | ||||||||||||
Operating income increased for fiscal 2015 compared to the prior year both as a percentage of net sales and in absolute terms, due to the factors discussed above.
Income Taxes
|
Fifty-two weeks ended
|
Fifty-two weeks ended
|
|||||||||||||||||||||||
|
February 1, 2015
|
February 2, 2014
|
$ Change
|
% Change
|
|||||||||||||||||||||
|
% Net Sales
|
% Net Sales
|
|||||||||||||||||||||||
|
Consolidated income tax expense
|
$ | 6,820 | 2.8 | % | $ | 4,539 | 2.0 | % | $ | 2,281 | 50.3 | % | ||||||||||||
|
Effective Tax Rate
|
35.2 | % | 36.4 | % | ||||||||||||||||||||
We recorded income tax expense of $6.8 million during fiscal 2015, compared to $4.6 million for fiscal 2014, due primarily to higher taxable income. The effective income tax rates for the two fiscal years were 35.2% and 36.4% respectively. The lower effective income tax rate in fiscal 2015 was due to a smaller impact of certain permanent differences due to higher taxable income.
Net Income and Earnings Per Share
|
Fifty-two weeks ended
|
Fifty-two weeks ended
|
|||||||||||||||||||||||
|
February 1, 2015
|
February 2, 2014
|
$ Change
|
% Change
|
|||||||||||||||||||||
|
% Net Sales
|
% Net Sales
|
|||||||||||||||||||||||
|
Consolidated
|
$ | 12,578 | 5.1 | % | $ | 7,929 | 3.5 | % | $ | 4,649 | 58.6 | % | ||||||||||||
|
Earnings per share
|
$ | 1.16 | $ | 0.74 | ||||||||||||||||||||
Financial Condition, Liquidity and Capital Resources
Balance Sheet and Working Capital
The following chart shows changes in our total assets, current assets, current liabilities, net working capital and working capital ratio at January 31, 2016 compared to February 1, 2015:
|
Balance Sheet and Working Capital
|
||||||||||||
|
January 31, 2016
|
February 1, 2015
|
$ Change
|
||||||||||
|
Total Assets
|
$ | 181,653 | $ | 170,755 | $ | 10,898 | ||||||
|
Cash
|
$ | 53,922 | $ | 38,663 | $ | 15,259 | ||||||
|
Trade Receivables
|
28,176 | 32,245 | (4,069 | ) | ||||||||
|
Inventories
|
43,713 | 44,973 | (1,260 | ) | ||||||||
|
Prepaid Expenses & Other
|
2,256 | 2,353 | (97 | ) | ||||||||
|
Total Current Assets
|
$ | 128,067 | $ | 118,234 | $ | 9,833 | ||||||
|
Trade accounts payable
|
$ | 9,105 | $ | 10,293 | $ | (1,188 | ) | |||||
|
Accrued salaries, wages and benefits
|
4,834 | 4,824 | 10 | |||||||||
|
Other accrued expenses, commissions and deposits
|
2,666 | 3,950 | (1,284 | ) | ||||||||
|
Total current liabilities
|
$ | 16,605 | $ | 19,067 | $ | (2,462 | ) | |||||
|
Net working capital
|
$ | 111,462 | $ | 99,167 | $ | 12,295 | ||||||
|
Working capital ratio
|
7.7 to 1
|
6.2 to 1
|
||||||||||
As of January 31, 2016, total assets increased compared to February 1, 2015, primarily due to increased cash and cash equivalents due to increased operating cash flows during fiscal 2016, decreased accounts receivable due to lower sales in fourth quarter of fiscal 2016 compared to fiscal 2015 and decreased inventories as a result of more effectively matching inventory levels with projected demand.
Summary Cash Flow Information – Operating, Investing and Financing Activities
|
Fifty-Two Weeks Ended
|
Fifty-Two Weeks Ended
|
Fifty-Two Weeks Ended
|
||||||||||
|
January 31,
|
February 1,
|
February 2,
|
||||||||||
|
2016
|
2015
|
2014
|
||||||||||
|
Net cash provided by operating activities
|
$ | 23,036 | $ | 22,768 | $ | 5,696 | ||||||
|
Net cash used in investing activities
|
(3,455 | ) | (3,681 | ) | (3,855 | ) | ||||||
|
Net cash used in financing activities
|
(4,322 | ) | (4,306 | ) | (4,301 | ) | ||||||
|
Net increase (decrease) in cash and cash equivalents
|
$ | 15,259 | $ | 14,781 | $ | (2,460 | ) | |||||
During fiscal 2016, $23.0 million of cash generated from operations and cash on hand funded cash dividends of $4.3 million, purchases of property and equipment of $2.8 million and Company-owned life insurance premium payments of $707,000. Company-owned life insurance policies are in place to compensate us for the loss of key employees, to facilitate business continuity and to serve as a funding mechanism for certain executive benefits.
During fiscal 2015, $22.8 million of cash generated from operations and cash on hand funded cash dividends of $4.3 million, purchases of property and equipment of $3.0 million and Company-owned life insurance premium payments of $789,000.
During fiscal 2014, $5.7 million of cash generated from operations, cash on hand and proceeds received on Company-owned life insurance policies of $517,000, funded cash dividends of $4.3 million, purchases of property and equipment of $3.5 million and Company-owned life insurance premium payments of $834,000.
Liquidity, Financial Resources and Capital Expenditures
Our financial resources include:
|
|
§
|
available cash and cash equivalents, which are highly dependent on incoming order rates and our operating performance;
|
|
|
§
|
expected cash flow from operations; and
|
|
|
§
|
available lines of credit.
|
We believe these resources are sufficient to meet our business requirements through fiscal 2017 and for the foreseeable future, including:
|
|
§
|
capital expenditures;
|
|
|
§
|
working capital, including capital required for insourcing our Bradington-Young trade receivables in fiscal 2017 and for our new business initiatives;
|
|
|
§
|
the payment of regular quarterly cash dividends on our common stock; and
|
|
|
§
|
the servicing of debt related to our acquisition of HMI.
|
As of January 31, 2016, we had an aggregate $13.3 million available under our revolving credit facility to fund working capital needs. Standby letters of credit in the aggregate amount of $1.7 million, used to collateralize certain insurance arrangements and for imported product purchases, were outstanding under the revolving credit facility as of January 31, 2016. There were no additional borrowings outstanding under the revolving credit facility on January 31, 2016.
Loan Agreement and Revolving Credit Facility
On February 1, 2016, we entered into an amended and restated loan agreement (the “Loan Agreement”) with Bank of America, N.A. (“BofA”) in connection with the completion of the Home Meridian acquisition. The Loan Agreement increases the amount available under our existing unsecured revolving credit facility to $30 million and increases the sublimit of such facility available for the issuance of letters of credit to $4 million. Amounts outstanding under the revolving facility will bear interest at a rate, adjusted monthly, equal to the then current LIBOR monthly rate plus 1.50%. We must also pay a quarterly unused commitment fee that is based on the average daily amount of the facility utilized during the applicable quarter.
The Loan Agreement also provides us with a $41 million unsecured term loan (the “Unsecured Term Loan”) and a $19 million term loan (the “Secured Term Loan”) secured by a security interest in certain Company-owned life insurance policies granted to BofA by us under a security agreement, dated as of February 1, 2016 (the “Security Agreement”). BofA’s rights under the Security Agreement are enforceable upon the occurrence of an event of default under the Loan Agreement. Any amount borrowed under the Unsecured Term Loan will bear interest at a rate, adjusted monthly, equal to the then current LIBOR monthly rate plus 1.50%. Any amount borrowed under the Secured Term Loan will bear interest at a rate, adjusted monthly, equal to the then current LIBOR monthly rate plus 0.50%. We must repay any principal amount borrowed under Unsecured Term Loan in monthly installments of approximately $490,000, together with any accrued interest, until the full amount borrowed is repaid or until February 1, 2021, at which time all amounts outstanding under Unsecured Term Loan will become due and payable. We must pay the interest accrued on any principal amount borrowed under Secured Term Loan on a monthly basis until the full principal amount borrowed is repaid or until February 1, 2021, at which time all amounts outstanding under the Secured Term Loan will become due and payable. We may prepay any outstanding principal amounts borrowed under either the Unsecured Term Loan or the Secured Term Loan in full or in part on any interest payment date without penalty. On February 1, 2016, we borrowed in full the amounts available under the Unsecured Term Loan and the Secured Term Loan in connection with the completion of this acquisition.
This loan agreement also included customary representations and warranties and required us to comply with customary covenants, including, among other things, the following financial covenants:
|
§
|
Maintain a tangible net worth of at least $105.0 million plus 40% of net income before taxes;
|
|
§
|
Maintain a ratio of funded debt to EBITDA not exceeding:
|
|
|
□
|
2.50:1.0 through August 31, 2017;
|
|
|
□
|
2.25:1.0 through August 31, 2018;
|
|
|
□
|
2.00:1.0 September 1, 2018 and thereafter.
|
|
§
|
Maintain a basic fixed coverage charge of 1.25 to 1.0;
|
|
§
|
Limit capital expenditures to no more than $15.0 million during any fiscal year; and
|
|
§
|
Limitations on the types of investments we are allowed to make.
|
The Loan Agreement also limits our right to incur other indebtedness and to create liens upon our assets, subject to certain exceptions, among other restrictions. The Loan Agreement does not restrict our ability to pay cash dividends on, or repurchase, shares of our common stock, subject to our compliance with the financial covenants discussed above, if we are not otherwise in default under the Loan Agreement.
We were in compliance with the financial covenants of our previous loan agreement at January 31, 2016. Further, we expect to be in compliance with the covenants under the new Amended and Restated Loan Agreement for fiscal 2017 and into the foreseeable future. The Amended and Restated Loan Agreement does not restrict our ability to pay cash dividends on, or repurchase shares of, our common stock, subject to complying with the financial covenants under the agreement.
Factoring Arrangement
We currently factor substantially all of Bradington-Young’s accounts receivable, in most cases without recourse to us. Historically, we have factored these receivables because factoring:
|
§
|
allowed us to outsource the administrative burden of the credit and collections functions for our domestic upholstery operations;
|
|
§
|
allowed us to transfer the collection risk associated with the majority of our domestic upholstery receivables to the factor; and
|
|
§
|
provided us with an additional, potential source of short-term liquidity.
|
In order to realize operational efficiencies, cost savings, leverage best practices and present a single face to our customers, we plan to end our factoring relationship as our ERP system becomes fully operational at Bradington-Young in the first half of fiscal 2017. However, given our current and projected liquidity, we do not expect the transition to have a material adverse effect on our future liquidity.
Capital Expenditures
We expect to spend between $3.5 million to $5.0 million in capital expenditures in the 2017 fiscal year to maintain and enhance our operating systems and facilities. Of these estimated amounts, we expect to spend approximately $400,000 on the implementation of our legacy Hooker Enterprise Resource Planning (ERP) system in our upholstery segment during fiscal 2017.
Enterprise Resource Planning
Our new ERP system became operational for our casegoods and imported upholstery operations early in the third quarter of fiscal 2013, at H Contract and Homeware when their operations began in fiscal 2014 and at Sam Moore in the second fiscal quarter of 2016. Implementation is scheduled to be completed at Bradington-Young (BY) during the first half of fiscal 2017. Once BY is fully operational on the ERP platform, we expect to realize operational efficiencies and cost savings as well as present a single face to our customers and leverage best practices across the traditional Hooker organization. HMI operates on a separate ERP platform.
Cost savings are difficult to quantify until the ERP system becomes fully operational across our Hooker business units. We expect to be able to reduce administrative functions, which are presently duplicated across our segments and improve our purchasing power and economies of scale. In addition to the capital expenditures discussed above, our ERP implementation will require a significant amount of time invested by our associates.
We refer you to Item “1A. Risk Factors”, above, for additional discussion of risks involved in our ERP system conversion and implementation.
Share Repurchase Authorization
During the fiscal 2013 first quarter, our Board of Directors authorized the repurchase of up to $12.5 million of the Company’s common shares. The authorization does not obligate us to acquire a specific number of shares during any period and does not have an expiration date, but it may be modified, suspended or discontinued at any time at the discretion of our Board of Directors. Repurchases may be made from time to time in the open market, or through privately negotiated transactions or otherwise, in compliance with applicable laws, rules and regulations, and subject to our cash requirements for other purposes, compliance with the covenants under the loan agreement for our revolving credit facility and other factors we deem relevant. No shares were purchased under the authorization during fiscal 2016, fiscal 2015 or fiscal 2014. Approximately $11.8 million remained available for future purchases under the authorization as of January 31, 2016.
Dividends
On March 1, 2016 our Board of Directors declared a quarterly cash dividend of $0.10 per share, payable on March 31, 2016 to shareholders of record at March 15, 2016. We declared and paid dividends of $0.40 per share or approximately $4.3 million in fiscal 2016.
Commitments and Contractual Obligations
As of January 31, 2016, our commitments and contractual obligations were as follows:
|
Cash Payments Due by Period (In thousands)
|
||||||||||||||||||||
|
Less than
|
More than
|
|||||||||||||||||||
|
1 Year
|
1-3 Years
|
3-5 Years
|
5 years
|
Total
|
||||||||||||||||
|
Deferred compensation payments (1)
|
$ | 354 | $ | 1,060 | $ | 1,590 | $ | 11,226 | $ | 14,230 | ||||||||||
|
Operating leases (2)
|
1,857 | 2,781 | 2,701 | 212 | 7,551 | |||||||||||||||
|
Other long-term obligations (3)
|
1,175 | 331 | 63 | - | 1,569 | |||||||||||||||
|
Total contractual cash obligations
|
$ | 3,386 | $ | 4,172 | $ | 4,354 | $ | 11,438 | $ | 23,350 | ||||||||||
__________________
|
(1)
|
These amounts represent estimated cash payments to be paid to participants in our supplemental retirement income plan or “SRIP” through fiscal year 2043, which is 15 years after the last current SRIP participant is assumed to have retired. The present value of these benefits (the actuarially derived projected benefit obligation for this plan) was approximately $8.2 million at January 31, 2016 and is shown on our consolidated balance sheets, with $354,000 recorded in current liabilities and $7.8 million recorded in long-term liabilities. The monthly retirement benefit for each participant, regardless of age, would become fully vested and the present value of that benefit would be paid to each participant in a lump sum upon a change in control of the Company as defined in the plan. See note 10 to the consolidated financial statements beginning on page F-18 for additional information about the SRIP.
|
|
(2)
|
These amounts represent estimated cash payments due under operating leases for real estate utilized in our operations and warehouse and office equipment. $6.7 million of these estimated cash payments pertain to two leases: (1) Our CDC II warehouse and distribution facility and (2) our showroom at the International Home Furnishings Center. See Item 2 “Properties,” for a description of our leased real estate.
|
|
(3)
|
These amounts represent estimated cash payments due under various long-term service and support agreements, for items such as warehouse management services, information technology support and human resources related consulting and support.
|
Off-Balance Sheet Arrangements
Standby letters of credit in the aggregate amount of $1.7 million, used to collateralize certain insurance arrangements and for imported product purchases, were outstanding under our revolving credit facility as of January 31, 2016. See the “Commitments and Contractual Obligations” table above and Note 16 to the consolidated financial statements included in this annual report on Form 10-K for additional information on our off-balance sheet arrangements.
Recently Issued Accounting Pronouncements
In May 2014, the Financial Accounting Standards Board (the “FASB”) issued Accounting Standards Update (“ASU”) 2014-09, Revenue from Contracts with Customers (Topic 606) (“ASU 2014-09”). The amendments in ASU 2014-09 affects any entity that either enters into contracts with customers to transfer goods or services or enters into contracts for the transfer of nonfinancial assets unless those contracts are within the scope of other standards. This ASU will supersede the revenue recognition requirements in Topic 605, Revenue Recognition, and most industry-specific guidance, and creates a Topic 606, Revenue from Contracts with Customers. The core principle of the guidance is that an entity should recognize revenue to depict the transfer of promised goods or services to customers in an amount that reflects the consideration to which the entity expects to be entitled in exchange for those goods or services. In August 2015, the FASB issued ASU 2015-14, Revenue from Contracts with Customers (Topic 606): Deferral of the Effective Date (“ASU 2015-14”), which defers the effective date of ASU 2014-09 for all entities by one year. ASU 2014-09 is now effective for financial statements issued for annual reporting periods beginning after December 15, 2017. We are currently evaluating the impact of the pending adoption of ASU 2014-09 on our consolidated financial statements.
In July 2015, the FASB issued ASU 2015-11, Inventory (Topic 330): Simplifying the Measurement of Inventory (“ASU 2015-11”). The amendments in ASU 2015-11 require an entity to measure in scope inventory at the lower of cost and net realizable value. Net realizable value is defined as the estimated selling price in the ordinary course of business, less reasonable predictable costs of completion, disposal, and transportation. Subsequent measurement is unchanged for inventory measured using last-in, first-out (“LIFO”) or the retail inventory method. The amendments do not apply to LIFO or the retail inventory method. The amendments apply to all other inventory, which includes inventory that is measured using first-in, first-out (“FIFO”) or average cost. The amendment is effective for public entities for fiscal years beginning after December 15, 2016 and should be applied prospectively, however early adoption is permitted. We do not anticipate ASU 2015-11 will have a material impact on our consolidated financial statements.
In July 2015, the FASB issued ASU 2015-16, Business Combinations (Topic 805): Simplifying the Accounting for Measurement Period Adjustments. ASU 2015-16 requires that an acquirer recognize adjustments to provisional amounts that are identified during the measurement period in the reporting period in which the adjustment amounts are determined. The amendments in this Update require that the acquirer record, in the same period’s financial statements, the effect on earnings of changes in depreciation, amortization, or other income effects, if any, as a result of the change to the provisional amounts, calculated as if the accounting had been completed at the acquisition date. Any current period adjustments to provisional amounts that would have impacted a prior period’s earnings had they been recognized at the acquisition date are required to be presented separately on the face of the income statement or disclosed in the notes. The amendments in this ASU are effective for fiscal years beginning after December 15, 2015, including interim periods within those fiscal years. The amendments in this ASU should be applied prospectively to adjustments to provisional amounts that occur after the effective date of this ASU with earlier application permitted for financial statements that have not been issued. Therefore the amendments in ASU 2015-16 will become effective for us as of the beginning of our 2017 fiscal year. We are currently evaluating the impact of the pending adoption of ASU 2015-16 on our consolidated financial statements.
In November 2015, the FASB issued Accounting Standards Update No. 2015-17 (ASU 2015-17), Balance Sheet Classification of Deferred Taxes. This update amends the balance sheet classification of deferred taxes and requires that deferred tax liabilities and assets be classified as noncurrent on the balance sheet. Previous guidance required deferred tax liabilities and assets to be separated into current and noncurrent amounts on the balance sheet. The guidance is effective for fiscal years beginning on or after December 15, 2016, and interim periods within those years. Early adoption is permitted as of the beginning of any interim or annual reporting period. This guidance may be applied either prospectively, for all deferred tax assets and liabilities, or retrospectively by reclassifying the comparative balance sheet. We have early adopted this standard and have applied retrospective treatment of the standard. We feel the classification of all deferred tax assets and liabilities as noncurrent provides a more informative disclosure because many of our deferred tax items are by definition short-term, however are of a recurring nature and tend to behave more like non-current assets or liabilities. The retrospective reclassification resulted in a reduction in current assets of $1.7 million and an increase in non-current assets of the same amount for the period ended February 1, 2015.
Strategy
Our strategy is to offer world-class style, quality and product value as a complete residential casegoods and upholstered furniture resource through excellence in product design, global sourcing, manufacturing, logistics, sales, marketing and customer service. We strive to be an industry leader in sales growth and profitability performance, thereby providing an outstanding investment for our shareholders and contributing to the well-being of our customers, employees, suppliers and communities. Additionally, we strive to nurture the relationships, teamwork and integrity that characterizes our corporate culture and that has distinguished our company for over 90 years.
Fiscal 2016 in Review
Profitability improvement was the high point of fiscal 2016. All operating segments reported improved profitability over the prior year, even on essentially flat sales in the casegoods segment and decreased sales in the upholstery segment. We believe sales were impacted by an uneven national and global economy which culminated in stock market declines in the fourth quarter of calendar 2015, despite generally positive economic news. We believe this market behavior has a short-term influence on big-ticket purchases such as home furnishings, but we continue to believe that housing and the US economy in general will continue to trend positively, but not without occasional downward pressures.
Our Casegoods segment, a major contributor to corporate profitability, reported a 7% increase in operating profit despite disappointing sales growth and approximately $1.1 million of professional fees related to the Home Meridian acquisition. Casegoods reported another year of operating income margin in excess of 10%, thanks to continued low discounting, relatively low inflation, lower quality related costs, and a focus on account and sales program profitability, as well as ongoing cost containment efforts.
We are especially pleased with the fiscal 2016 performance of our upholstery segment, which doubled operating income compared to the prior year. Bradington-Young (B-Y) built on good performance in the prior year, growing operating profit by 70% thanks to a 5% sales increase and manufacturing cost improvements as B-Y’s factories continue to run smoothly and efficiently. Sam Moore also reported $1.5 million in operating income, in its first profitable year, even while implementing an Enterprise Resource Planning system at their location during the year. After resolving the typical bumps and slowdowns after going live mid-year, Sam Moore is now reaping the benefits of the substantial time and financial investment we’ve made in these systems. Information is now more readily available for customers and for internal planning, scheduling and purchasing and we are moving closer to our goal of ‘One Face to the Customer’. While Sam Moore’s sales volume declined from the prior year, some of the lost sales were in unprofitable or low profitability sales programs. Focusing on more profitable sales and significantly improved manufacturing efficiency contributed to the income turnaround. Hooker Upholstery also experienced a 4% sales decline due to changes with some of our largest customers and lower demand for some of Hooker Upholstery’s more upscale imported leather seating. Despite this volume decline, Hooker Upholstery was able to increase operating income by nearly 30%, thanks to cost and inventory management and the addition of new product categories such as bar and counter stools to meet changing customer preferences.
Our All Other segment also showed improvement in fiscal 2016. H Contract, which sells casegoods and upholstery to the senior living market, increased net sales by nearly 70% over the prior year and reported 6.2% operating income in its second full year of operations. While still a relatively small part of our volume, we are pleased with the progress H Contract has made and believe it will continue to grow at well above industry average for several more years. During the past year, H Contract focused on improving business processes and customer service, added marketing and operations personnel, increased sales representation coverage and invested in new products and additional marketing to grow the business. Thanks to its ability to leverage Hooker casegoods and the unique look of many Sam Moore designed products, supplemented by wood and upholstered products sourced from other vendors, H Contract has developed significant relationships with some of the largest developers in the senior living industry.
Homeware, our other internal growth initiative, grew sales by about 28% and reduced operating losses by more than 40% while repositioning and redefining its strategy. After determining that the costs of merchandising and driving traffic to a consumer web site proved to be more than we were willing to spend, we evaluated the data gathered during Homeware’s first year in operation and revised our strategy. We believe that the original Homeware concept; high fashion, high quality products, which were easy to assemble and could be shipped via parcel delivery services; still resonates with consumers. Our challenges were to improve the product value proposition and increase sales volume of products reflecting Homeware’s core values. To accomplish these objectives, we pared the product line, discontinued consumer direct marketing and online sales and began sourcing products from lower cost suppliers. We are focused on promoting these updated products through major online home furnishings retailers and believe Homeware will see greater success under this new business model.
Home Meridian Acquisition
On January 5, 2016, we entered into an asset purchase agreement (“the “Agreement”) with Home Meridian International, Inc. (“HMI”) to acquire substantially all of HMI’s assets in exchange for $85 million in cash and $15.0 million in unregistered shares of our common stock, with both amounts subject to adjustment for certain working capital estimates detailed in the Agreement. We completed the acquisition on February 1, 2016, subsequent to the end of our 2016 fiscal year. The working capital adjustment, paid for with 186,312 shares of our common stock, totaled $5.3 million and was driven by an increase in HMI’s accounts receivable due to strong sales towards the end of 2015. We also assumed certain liabilities of HMI, including approximately $7.8 million of liabilities related to certain retirement plans. The assumed liabilities did not include HMI’s indebtedness (as defined in the Agreement).
We have had a long and successful history in the furniture industry for over ninety years; marketing, sourcing and manufacturing wood and upholstery furniture, primarily in the mid-to-upper price points, and much of it through traditional furniture retailers. We have adapted to changes within those channels and price points and have become a major supplier in our channels. However, a great deal of furniture is sold in channels and at price points in which we have traditionally not been a factor. For several years, we sought to find appropriate investments to expand our reach with furniture consumers and find ways to do business in new channels, new products or new customers. We have long desired to invest to position Hooker Furniture for the future furniture market and looked for acquisition or investment opportunities which would help us meet those objectives.
When we were offered the opportunity to negotiate to purchase Home Meridian International, we saw those opportunities. HMI was a privately held furniture supplier, whose sales had grown at about three times the industry growth rate, was profitable on an operating income basis and appeared to be establishing itself as a key supplier within its distribution channels.
Like Hooker, casegoods are a substantial portion of the HMI business’s revenues; however, there are few similarities beyond that. In HMI we see a business which addresses the needs of mass market furniture suppliers including ‘big box’ furniture stores, department stores, and warehouse clubs and rental stores. Many of HMI’s customers are ‘mega-accounts’ capable of purchasing large quantities and maintaining their own national or regional distribution networks. These mega-accounts are focused on product price, value and sourcing, which HMI is able to maximize by delivering over 70% of its sales container direct from factories in Asia. A lean, data and technology driven business, HMI is able to offer a strong value proposition for the mid-price products which comprise the bulk of their offerings. HMI sales teams collaborate with merchandise managers at these mega-accounts to design and develop new products. Overall, we believe that HMI understands how to do business in this channel and to be a key supplier to these accounts.
Beyond the mega-account strategy, HMI offers us other avenues for growth as well, through a well- developed e-commerce division. This division, which develops products and programs for major e-retailers sells more moderately priced products through traditional furniture stores and through its growing hospitality division, which supplies hotels and other institutional customers. In addition to products and distribution channels, the acquisition brings together two strong performers in the furniture industry which we believe will create the second largest casegoods source and the fifth largest public furniture supplier in the US. Opportunities to leverage costs and best practices across the organization will help create value beyond the earnings accretion, which will occur by combining these two profitable entities and the combined management and employee group offers greater growth and succession planning opportunities for employees in both organizations.
We believe this move will help diversify our customer and product portfolio, help create growth and implement best practices in both organizations and will help position us for market leadership well into the future.
We expect to record significant tangible and intangible assets on our consolidated balance sheets during our fiscal 2017 first fiscal quarter. For certain tangible and intangible assets, reevaluating fair value as of the completion date of the acquisition will result in additional depreciation and/or amortization expense that exceed the combined amounts recorded by Hooker and HMI prior to the acquisition. This increased expense will be recorded by us over the useful lives of the underlying assets. We expect to record approximately $3.4 million in amortization expense on those intangible assets during fiscal 2017 and expect amortization expense of approximately $1.4 million per year starting in fiscal 2018 through fiscal 2027.
This acquisition is not without substantial risks. We refer you to Item 1A. Risk Factors and note 18 to our consolidated financial statements in this report for additional information.
Potential Duties on Accent Chests
On May 27, 2014, the U.S. Department of Commerce (“DoC”) determined that certain accent chests manufactured in China for one of our competitors constitute “wooden bedroom furniture” that is subject to anti-dumping duties under the Continued Dumping Subsidy Offset Act of 2000. In early June 2014, the DoC directed U.S. Customs and Border Protection (“CBP”) to begin collecting the anti-dumping duty on these items. While the DoC ruling applies only to the specific accent chests mentioned in the ruling, it is uncertain whether CBP also will begin to collect anti-dumping duties with respect to other similar accent chests imported from China. We currently import, and have imported in the past, accent chests from China that may be similar to those that are subject to the DoC ruling, including accent chests sourced from the same Chinese company that manufactures the accent chests addressed by the DoC ruling.
We are currently not able to determine whether any of the accent chests we source from China, now or in the past, would be subject to the anti-dumping duties. Nor are we able to estimate the potential amount of any such duties. We do not believe the duties, if any, would be assessed retroactively; however, CBP audits can go back five years and any assessment could be subject to interest and penalties. If the bedroom furniture anti-dumping duties, or related penalties, were to be assessed on accent chests that we import, or have imported in the past, from China, our results of operations, financial condition, liquidity and prospects could be adversely affected.
During the fiscal 2015 third quarter, the DoC agreed to reconsider some of its earlier findings related to accent chests and early in the fiscal 2015 fourth quarter, DoC reaffirmed its decision that certain of our competitor’s accent chests constituted wooden bedroom furniture subject to anti-dumping duties. The competitor challenged DoC’s position in the United States Court of International Trade (“CIT”). On December 1, 2015, the court issued a decision remanding the accent chest issue to DoC with the instruction to reconsider the treatment of accent chests in a manner consistent with the court’s decision, which on balance is favorable to our views. DoC issued a remand decision holding that the accent chests were not bedroom furniture. On February 29, 2016, the CIT sustained that determination. DoC has 60 days to appeal that decision.
Customs Penalty
In September 2009, CBP issued an audit report asserting that we had not paid all required antidumping duties due with respect to certain bedroom furniture we imported from China. In February 2015, CBP assessed a civil penalty of approximately $2.1 million and unpaid duties of approximately $500,000 on the matter. In December 2015, in response to our petition to eliminate or modify the assessment, CBP revised the proposed penalty to approximately $1.7 million, while leaving the duty assessment at approximately $500,000. We continue to assert that no antidumping duties are due and that there is no basis for the imposition of a penalty. We intend to vigorously defend against the penalty. In the opinion of management, the ultimate disposition of this matter will not have a material adverse effect on our consolidated financial position, results of operations, or liquidity.
Our business is subject to a number of significant risks and uncertainties, including our reliance on offshore sourcing, any of which can adversely affect our business, results of operations, financial condition or future prospects. For a discussion of risks and uncertainties that we face, see “Forward Looking Statements” beginning on page 3 of this report and Item 1A, “Risk Factors” beginning on page 12 of this report.
Outlook
Looking forward, we see a generally healthy US economy, but one with more volatility than that to which many investors are accustomed. We also see a furniture industry in which consumer tastes and the channels in which they shop are evolving at a rapid rate. To address these changes, we also continue to change. Sometimes evolving and growing and sometimes with big changes, such as the acquisition of Home Meridian International, which gives us access to many new customers, distribution channels and price points and helps position us, we believe, for market leadership well into the future.
So far in fiscal 2017, we have seen lower demand for our products compared to the same period a year ago. However, given the mostly positive economic news over the past year, we are optimistic about our longer-term future, with our core businesses, our new ventures and in our new Home Meridian division.
As we progress through 2017, we will focus on:
|
|
§
|
evaluating ways to expand into new distribution channels;
|
|
|
§
|
successfully integrating the Home Meridian division;
|
|
|
§
|
leveraging best practices in order to lower costs, improve efficiencies and grow sales;
|
|
|
§
|
growing and improving the profitability of our new business initiatives;
|
|
|
§
|
building on our initial successes in expanding our merchandising reach in the “better” parts of our “good-better-best” casegoods product offerings;
|
|
|
§
|
growing sales of our Cynthia Rowley home furnishings collection;
|
|
|
§
|
improving the product assortment and value proposition of the Hooker Upholstery imported products line;
|
|
|
§
|
improving operating profitability and increasing production capacity at Sam Moore;
|
|
|
§
|
mitigating inflation on our imported products and raw materials;
|
|
|
§
|
maintaining proper inventory levels and optimizing product availability on best-selling items;
|
|
|
§
|
strengthening our relationships with key vendors and sourcing product from cost-competitive locations and from quality-conscious sourcing partners;
|
|
|
§
|
offering an array of new products and designs, which we believe will help generate additional sales;
|
|
|
§
|
upgrading and refining our information systems capabilities to support our businesses, including implementing an ERP system at Bradington-Young; and
|
|
|
§
|
controlling costs.
|
We face a number of significant risks and uncertainties, as more fully discussed in Item 1A, “Risk Factors” beginning on page 12 and in our “Forward Looking Statements” beginning on page 3, which can affect adversely our results of operations and financial condition.
Critical Accounting Policies and Estimates
Hooker Furniture’s significant accounting policies are described in “Note 1 – Summary of Significant Accounting Policies” to the consolidated financial statements beginning at page F-1 in this report. The preparation of financial statements in conformity with U.S. generally accepted accounting principles requires us to make estimates and assumptions in certain circumstances that affect amounts reported in the accompanying financial statements and related notes. In preparing these financial statements, we have made our best estimates and judgments of certain amounts included in the financial statements, giving due consideration to materiality. We do not believe that actual results will deviate materially from our estimates related to our accounting policies described below. However, because application of these accounting policies involves the exercise of judgment and the use of assumptions as to future uncertainties, actual results could differ materially from these estimates.
Allowance for Doubtful Accounts. We evaluate the adequacy of our allowance for doubtful accounts at the end of each quarter. In performing this evaluation, we analyze the payment history of our significant past due accounts, subsequent cash collections on these accounts and comparative accounts receivable aging statistics. Based on this information, along with consideration of the general condition of the economy, we develop what we consider to be a reasonable estimate of the uncollectible amounts included in accounts receivable. This estimate involves significant judgment and actual uncollectible amounts may differ materially from our estimate.
Valuation of Inventories. We value all of our inventories at the lower of cost or market (using the last-in, first-out (“LIFO”) method). LIFO cost for all of our inventories is determined using the dollar-value, link-chain method. This method allows for the more current cost of inventories to be reported in cost of sales, while the inventories reported on the balance sheet consist of the costs of inventories acquired earlier, subject to adjustment to the lower of cost or market. Hence, if prices are rising, the LIFO method will generally lead to higher cost of sales and lower profitability as compared to the first-in, first-out (“FIFO”) method. We evaluate our inventory for excess or slow moving items based on recent and projected sales and order patterns. We establish an allowance for those items when the estimated market or net sales value is lower than their recorded cost. This estimate involves significant judgment and actual values may differ materially from our estimate.
Income Taxes. At times, tax law and generally accepted accounting principles differ in the treatment of certain income and expense items. These items may be excluded or included in taxable income at different times than is required for GAAP or “book” reporting purposes. These differences may be permanent or temporary in nature.
For quarterly reporting purposes, we determine our annual effective income tax rate based on forecasted pre-tax book income and forecasted permanent book and tax differences. The rate is established at the beginning of the year and is evaluated on a quarterly basis. We consider the level and mix of income of our separate legal entities, statutory tax rates, business credits available in the various jurisdictions in which we operate and permanent tax differences. Significant judgment is required in evaluating tax positions that affect the annual tax rate. Any changes to the forecasted information may cause adjustments to the effective rate. Additional tax, interest and penalties associated with uncertain tax positions are recognized in tax expense on a quarterly basis.
To the extent that any book and tax differences are temporary in nature, that is, the book realization will occur in a different period than the tax realization, a deferred tax asset or liability is established. To the extent that a deferred tax asset is created, we evaluate our ability to realize this asset. If we determine that we will not be able to fully utilize deferred tax assets, we establish a valuation reserve. In assessing the realization of deferred tax assets, we consider whether it is more likely than not that some portion or all of the deferred tax assets will be realized. The ultimate realization of deferred tax assets is primarily dependent upon the generation of future taxable income during the periods in which those temporary differences reverse.
We early adopted Accounting Standards Update No. 2015-17 (ASU 2015-17), Balance Sheet Classification of Deferred Taxes in the fourth quarter of fiscal 2016 and have applied retrospective treatment of the standard. Consequently, all deferred tax assets and liabilities are classified as non-current on our consolidated balance sheets We feel the classification of all deferred tax assets and liabilities as noncurrent provides a more informative disclosure because many of our deferred tax items are by definition short-term, however are of a recurring nature and tend to behave more like non-current assets or liabilities. The retrospective reclassification results in a reduction in current assets of $1.7 million and an increase in non-current assets of the same amount for the period ended February 1, 2015.
Impairment of Long-Lived Assets
Tangible Assets
We regularly review our property, plant and equipment for indicators of impairment, as specified in the Property, Plant and Equipment topic of the Accounting Standards Codification. Although not exhaustive, this accounting guidance lists potential indicators of impairment, which we use to facilitate our review. These potential indicators of impairment include:
|
|
§
|
A significant decrease in the market value of the long-lived asset;
|
|
|
§
|
A significant adverse change in the extent or manner in which a long-lived asset group is being used, or in its physical condition;
|
|
|
§
|
A significant adverse change in the legal factors or in the business climate that could affect the value of a long-lived asset, including an adverse action or assessment by a regulator;
|
|
|
§
|
An accumulation of costs significantly in excess of the amount originally expected to acquire or construct a long-lived asset;
|
|
|
§
|
A current period operating or cash flow loss or a projection or forecast that demonstrates continuing losses associated with the long-lived asset’s use; and
|
|
|
§
|
A current expectation that more-likely-than-not, a long-lived asset will be sold or otherwise disposed of significantly before the end of its previously estimated useful life.
|
When an indicator of impairment is present, the impairment test for our property, plant and equipment requires us to assess the recoverability of the value of the assets by comparing their net carrying value to the sum of undiscounted estimated future cash flows directly associated with and arising from use and eventual disposition of the assets. We principally use our internal forecasts to estimate the undiscounted future cash flows used in our impairment analyses. These forecasts are subjective and are largely based on management’s judgment, primarily due to the changing industry in which we compete; changing consumer tastes, trends and demographics and the current economic environment. We monitor changes in these factors as part of the quarter-end review of these assets. While our forecasts have been reasonably accurate in the past, during periods of economic instability, uncertainty, or rapid change within our industry, we may not be able to accurately forecast future cash flows from our long-lived assets and our future cash flows may be diminished. Therefore, our estimates and assumptions related to the viability of our long-lived assets may change, and are reasonably likely to change in future periods. These changes could adversely affect our consolidated statements of income and consolidated balance sheets. As of January 31, 2016, the fair value of our property, plant and equipment was substantially in excess of its carrying value.
When we conclude that any of these assets are impaired, the asset is written down to its fair value. Any impaired assets that we expect to dispose of by sale are measured at the lower of their carrying amount or fair value, less estimated cost to sell; are no longer depreciated; and are reported separately as “assets held for sale” in the consolidated balance sheets, if we expect to dispose of the assets in one year or less.
Intangible Assets
We own certain indefinite-lived intangible assets, including those related to Bradington-Young, Sam Moore and Homeware. We may acquire additional amortizable assets and/or indefinite lived intangible assets in the future. Our principal indefinite-lived intangible assets are trademarks, trade names and a URL, which are not amortized but are tested for impairment annually or more frequently if events or circumstances indicate that the asset might be impaired. The fair value of our indefinite-lived intangible assets is determined based on the estimated earnings and cash flow capacity of those assets. The impairment test consists of a comparison of the fair value of the indefinite-lived intangible assets with their carrying amount. If the carrying amount of the indefinite-lived intangible assets exceeds their fair value, an impairment loss is recognized in an amount equal to that excess.
Trade names are tested for impairment annually as of the first day of our fiscal fourth quarter or more frequently if events or changes in circumstances indicate that the asset might be impaired. Circumstances that could indicate a potential impairment include, but are not limited to:
|
|
§
|
a significant adverse change in the economic or business climate either within the furniture industry or the national or global economy;
|
|
|
§
|
significant changes in demand for our products;
|
|
|
§
|
loss of key personnel; and
|
|
|
§
|
the likelihood that a reporting unit or significant portion of a reporting unit will be sold or otherwise subject to disposal.
|
The assumptions used to determine the fair value of our intangible assets are highly subjective and judgmental and include long-term growth rates, sales volumes, projected revenues, assumed royalty rates and factors used to develop an applied discount rate. If the assumptions that we use in these calculations differ from actual results, we may realize additional impairment on our intangible assets which may have a material-adverse effect on our results of operations and financial condition.
At January 31, 2016, the fair value of our Bradington-Young trade name exceeded its carrying value by approximately $1.4 million, and the fair value of our Sam Moore trade name was approximately $637,000 in excess of its carrying value.
Concentrations of Sourcing Risk
We source imported products through approximately 18 different vendors, from approximately 20 separate factories, located in five countries. Because of the large number and diverse nature of the foreign factories from which we can source our imported products, we have some flexibility in the placement of products in any particular factory or country.
Factories located in China and Vietnam are an important resource for Hooker Furniture. In fiscal year 2016, imported products sourced from China and Vietnam accounted for approximately 68% and 26%, respectively, of import purchases, and the factory in China from which we directly source the most product accounted for approximately 58% of our worldwide purchases of imported product. A sudden disruption in our supply chain from this factory, or from China in general, could significantly impact our ability to fill customer orders for products manufactured at that factory or in that country. If such a disruption were to occur, we believe that we would have sufficient inventory currently on hand in and in transit to our U.S. warehouses in Martinsville, VA to adequately meet demand for approximately four and one-half months, with an additional one and one quarter months available for immediate shipment from our Asia warehouse. Also, with the broad spectrum of product we offer, we believe that, in some cases, buyers could be offered similar product available from alternative sources. We believe that we could, most likely at higher cost, source most of the products currently sourced in China from factories in other countries and could produce certain upholstered products domestically at our own factories. However, supply disruptions and delays on selected items could occur for six months. If we were to be unsuccessful in obtaining those products from other sources, or at comparable cost, then a sudden disruption in the supply chain from our largest import furniture supplier, or from China in general, could have a short-term material adverse effect on our results of operations. Given the capacity available in China and other low-cost producing countries, we believe the risks from these potential supply disruptions are manageable.
ITEM 7A. QUANTITATIVE AND QUALITATIVE DISCLOSURES ABOUT MARKET RISK
We are exposed to market risk from foreign currency exchange rates, which could impact our results of operations or financial condition. We manage our exposure to this risk through our normal operating activities.
For imported products, we generally negotiate firm pricing denominated in U.S. Dollars with our foreign suppliers, typically for periods of at least one year. We accept the exposure to exchange rate movements beyond these negotiated periods. We do not use derivative financial instruments to manage this risk, but could choose to do so in the future. Most of our imports are purchased from suppliers located in China. The Chinese currency floats within a limited range in relation to the U.S. Dollar, resulting in exposure to foreign currency exchange rate fluctuations.
Since we transact our imported product purchases in U.S. Dollars, a relative decline in the value of the U.S. Dollar could increase the price we pay for imported products beyond the negotiated periods. We generally expect to reflect substantially all of the effect of any price increases from suppliers in the prices we charge for imported products. However, these changes could adversely impact sales volume or profit margins during affected periods.
Amounts outstanding under our revolving credit facility would bear interest at variable rates. In the past, we have entered into swap agreements to hedge against the potential impact of increases in interest rates on our floating-rate debt instruments. There was no outstanding balance under our revolving credit facility as of January 31, 2016, other than standby letters of credit in the amount of $1.7 million. Therefore, a fluctuation in market interest rates of one percentage point (or 100 basis points) would not have a material impact on our results of operations or financial condition.
ITEM 8. FINANCIAL STATEMENTS AND SUPPLEMENTARY DATA
Our consolidated financial statements listed in Item 15(a), and which begin on page F-1, of this report are incorporated herein by reference and are filed as a part of this report.
Certain Non-GAAP Financial Measures
In our Annual Report to Shareholders (of which this annual report on Form 10-K is a part), under the heading “Financial Highlights,” we reported net income and earnings per share both including and excluding the impact of restructuring and asset impairment charges.
The net income, earnings per share and operating income margin figures excluding the impact of the items specified above are “non-GAAP” financial measures. We provide this information because we believe it is useful to investors in evaluating our ongoing operations. Non-GAAP financial measures provide insight into this selected financial information and should be evaluated in the context in which they are presented. These measures are of limited usefulness in evaluating our overall financial results presented in accordance with GAAP and should be considered in conjunction with the consolidated financial statements, including the related notes, and Management’s Discussion and Analysis of Financial Condition and Results of Operations included elsewhere in this report.
ITEM 9. CHANGES IN AND DISAGREEMENTS WITH ACCOUNTANTS ON ACCOUNTING AND FINANCIAL DISCLOSURE
None.
ITEM 9A. CONTROLS AND PROCEDURES
Evaluation of Disclosure Controls and Procedures
Our management, with the participation of our principal executive officer and principal financial officer, evaluated the effectiveness of our disclosure controls and procedures as of the end of the fiscal quarter ended January 31, 2016. Based on this evaluation, our principal executive officer and our principal financial officer concluded that our disclosure controls and procedures were effective as of January 31, 2016, the end of the period covered by this annual report, to provide reasonable assurance that information required to be disclosed in the reports that we file or submit under the Securities Exchange Act of 1934, as amended, is accumulated and communicated to the Company’s management, including our principal executive officer and principal financial officer, as appropriate to allow timely decisions regarding required disclosure and are effective to provide reasonable assurance that such information is recorded, processed, summarized and reported within the time periods specified in the Securities and Exchange Commission’s rules and forms.
Management’s Annual Report on Internal Control over Financial Reporting
In accordance with Section 404 of the Sarbanes-Oxley Act and SEC rules thereunder, management has conducted an assessment of our internal control over financial reporting as of January 31, 2016, based on the framework in Internal Control-Integrated Framework (2013) issued by the Committee of Sponsoring Organizations of the Treadway Commission. Management’s report regarding that assessment is included on page F-2 of this report, with our consolidated financial statements, and is incorporated herein by reference.
Report of Registered Public Accounting Firm
Our independent registered public accounting firm, KPMG LLP, audited the consolidated financial statements included in this annual report on Form 10-K and has issued an audit report on the effectiveness of our internal control over financial reporting. KPMG’s report is included on page F-4 of this report, with our consolidated financial statements, and is incorporated herein by reference.
Changes in Internal Control over Financial Reporting
There have been no changes in our internal control over financial reporting for our fourth quarter ended January 31, 2016, that have materially affected, or are reasonably likely to materially affect, our internal control over financial reporting.
ITEM 9B. OTHER INFORMATION
None.
Hooker Furniture Corporation
Part III
In accordance with General Instruction G (3) of Form 10-K, most of the information called for by Items 10, 11, 12, 13 and 14 of Part III will be incorporated by reference to the Company’s definitive Proxy Statement for its Annual Meeting of Shareholders scheduled to be held June 2, 2016 (the “2016 Proxy Statement”), as set forth below.
ITEM 10. DIRECTORS, EXECUTIVE OFFICERS AND CORPORATE GOVERNANCE
Information relating to our directors will be set forth under the caption “Proposal One-Election of Directors” in the 2016 Proxy Statement and is incorporated herein by reference.
Information relating to our executive officers is included in Part I of this report under the caption “Executive Officers of Hooker Furniture Corporation” and is incorporated herein by reference.
Information relating to compliance with Section 16(a) of the Exchange Act will be set forth under the caption “Section 16(a) Beneficial Ownership Reporting Compliance” in the 2016 Proxy Statement and is incorporated herein by reference.
Information relating to the code of ethics that applies to our principal executive officer, principal financial officer, principal accounting officer or controller, or persons performing similar functions will be set forth under the caption “Code of Business Conduct and Ethics” in the 2016 Proxy Statement and is incorporated herein by reference.
Information relating to material changes, if any, in the procedures by which shareholders may recommend nominees for our Board of Directors will be set forth under the caption “Procedures for Shareholder Recommendations of Director Nominees” in the 2016 Proxy Statement and is incorporated herein by reference.
Information relating to the Audit Committee of our Board of Directors, including the composition of the Audit Committee and the Board’s determinations concerning whether certain members of the Audit Committee are “financial experts” as that term is defined under Item 407(d)(5) of Regulation S-K will be set forth under the captions “Corporate Governance” and “Audit Committee” in the 2016 Proxy Statement and is incorporated herein by reference.
ITEM 11. EXECUTIVE COMPENSATION
Information relating to this item will be set forth under the captions “Report of the Compensation Committee,” “Executive Compensation” and “Director Compensation” in the 2016 Proxy Statement and is incorporated herein by reference.
ITEM 12. SECURITY OWNERSHIP OF CERTAIN BENEFICIAL OWNERS AND MANAGEMENT AND RELATED SHAREHOLDER MATTERS
Information relating to this item will be set forth under the captions “Equity Compensation Plan Information” and “Security Ownership of Certain Beneficial Owners and Management” in the 2016 Proxy Statement and is incorporated herein by reference.
ITEM 13. CERTAIN RELATIONSHIPS AND RELATED TRANSACTIONS, AND DIRECTOR INDEPENDENCE
Information relating to this item will be set forth in the last paragraph under the caption “Audit Committee” and the caption “Corporate Governance” in the 2016 Proxy Statement and is incorporated herein by reference.
ITEM 14. PRINCIPAL ACCOUNTING FEES AND SERVICES
Information relating to this item will be set forth under the caption “Proposal Two- Ratification of Selection of Independent Registered Public Accounting Firm” in the 2016 Proxy Statement and is incorporated herein by reference.
Hooker Furniture Corporation
Part IV
ITEM 15. EXHIBITS AND FINANCIAL STATEMENT SCHEDULES
|
(a)
|
Documents filed as part of this report on Form 10-K:
|
|
(1)
|
The following financial statements are included in this report on Form 10-K:
|
|
Management’s Report on Internal Control Over Financial Reporting
|
|
|
Reports of Independent Registered Public Accounting Firm
|
|
|
Consolidated Balance Sheets as of January 31, 2016 and February 1, 2015.
|
|
|
Consolidated Statements of Income for the fifty-two week periods ended January 31, 2016, February 1, 2015, and February 2, 2014.
|
|
|
Consolidated Statements of Comprehensive Income for the fifty-two week periods ended January 31, 2016, February 1, 2015, and February 2, 2014.
|
|
|
Consolidated Statements of Cash Flows for the fifty-two week periods ended January 31, 2016, February 1, 2015, and February 2, 2014.
|
|
|
Consolidated Statements of Shareholders’ Equity for the fifty-two week periods ended January 31, 2016, February 1, 2015, and February 2, 2014.
|
|
|
Notes to Consolidated Financial Statements
|
|
|
(2)
|
Financial Statement Schedules:
|
|
Financial Statement Schedules have been omitted because the information required has been separately disclosed in the consolidated financial statements or related notes.
|
|
|
(b)
|
Exhibits:
|
|
2.1
|
Asset Purchase Agreement by and between the Company and Home Meridian International, Inc., dated as of January 5, 2016 (incorporated by reference to Exhibit 2.1 of the Company’s Form 8-K (SEC File No. 000-25349) filed on January 7, 2016
|
|
3.1
|
Amended and Restated Articles of Incorporation of the Company, as amended March 28, 2003 (incorporated by reference to Exhibit 3.1 of the Company’s Form 10-Q (SEC File No. 000-25349) for the quarter ended February 28, 2003)
|
|
3.2
|
Amended and Restated Bylaws of the Company as amended December 10, 2013 (incorporated by reference to Exhibit 3.2 of the Company’s Form 10-K (SEC File No. 000-25349) for the fiscal year ended February 2, 2014)
|
|
4.1
|
Amended and Restated Articles of Incorporation of the Company (See Exhibit 3.1)
|
|
4.2
|
Amended and Restated Bylaws of the Company (See Exhibit 3.2)
|
|
|
Pursuant to Regulation S-K, Item 601(b)(4)(iii), instruments, if any, evidencing long-term debt not exceeding 10% of the Company’s total assets have been omitted and will be furnished to the Securities and Exchange Commission upon request.
|
|
10.1(a)
|
Form of Executive Life Insurance Agreement dated December 31, 2003, between the Company and certain of its executive officers (incorporated by reference to Exhibit 10.1 of the Company’s Form 10-Q (SEC File No. 000-25349) for the quarter ended February 29, 2004)*
|
|
|
|
|
10.1(b)
|
Form of Outside Director Restricted Stock Agreement (incorporated by reference to Exhibit 99.1 of the Company’s Current Report on Form 8-K (SEC File No. 000-25349) filed on January 17, 2006)*
|
|
10.1(c)
|
2015 Amendment and Restatement of the Hooker Furniture Corporation Stock Incentive Plan (incorporated by reference to Appendix A of the Company’s Definitive Proxy Statement dated March 1, 2015 (SEC File No. 000-25349))*
|
|
10.1(d)
|
2010 Amended and Restated Hooker Furniture Corporation Supplemental Retirement Income Plan, dated as of June 8, 2010 (incorporated by reference to Exhibit 10.1 of the Company’s Form 10-Q (SEC File No. 000-25349) for the quarter ended October 31, 2010)*
|
|
10.1(e)
|
Form of Time-Based Restricted Stock Unit Agreement (incorporated by reference to Exhibit 10.1 of the Company’s Current Report on Form 8-K (SEC File No. 000-25349) filed on February 13, 2012)*
|
|
10.1(f)
|
Form of Performance Grant Agreement (incorporated by reference to Exhibit 10.2 of the Company’s Current Report on Form 8-K (SEC File No. 000-25349) filed on February 13, 2012)*
|
|
10.1(g)
|
Employment Agreement, dated August 22, 2011, between Michael W. Delgatti, Jr. and the Company (incorporated by reference to Exhibit 10.1(l) of the Company’s Form 10-K (SEC File No. 000-25349) filed on April 12, 2013)*
|
|
10.1(h)
|
Consulting Letter Agreement dated May 21, 2014, between the Company and Alan D. Cole. (incorporated by reference to Exhibit 10.1(b) of the Company’s Form 10-Q (SEC File No. 000-25349) for the quarter ended May 4, 2014)*
|
|
10.1(i)
|
|
|
10.2(a)
|
Amended and Restated Loan Agreement, dated as of February 1, 2016, between Bank of America, N.A., the Company, Bradington-Young, LLC and Same Moore Furniture LLC (incorporated by referenced to Exhibit 10.1 of the Company’s Current Report on Form 8-K (SEC File No. 000-25349) filed on February 2, 2016
|
|
10.2(b)
|
Security Agreement (Assignment of Life Insurance Policy as Collateral), dated as of February 1, 2016, between Bank of America, N.A. and the Company (incorporated by referenced to Exhibit 10.2 of the Company’s Current Report on Form 8-K (SEC File No. 000-25349) filed on February 2, 2016
|
|
21
|
List of Subsidiaries:
|
|
|
Bradington-Young LLC, a North Carolina limited liability company
|
|
|
Sam Moore Furniture LLC, a Virginia limited liability company
|
|
23
|
|
|
31.1
|
|
|
31.2
|
|
|
32.1
|
|
|
101
|
The following financial statements from the Company's Annual Report on Form 10-K for the fiscal year ended January 31, 2016, formatted in Extensible Business Reporting Language (“XBRL”): (i) consolidated balance sheets, (ii) consolidated statements of income, (iii) consolidated statements of comprehensive income, (iv) consolidated statements of cash flows, (v) consolidated statements of shareholders’ equity and (vi) the notes to the consolidated financial statements, tagged as blocks of text (filed herewith)
|
*Management contract or compensatory plan
Pursuant to the requirements of Section 13 or 15(d) of the Securities Exchange Act of 1934, the registrant has duly caused this report to be signed on its behalf by the undersigned, thereunto duly authorized.
HOOKER FURNITURE CORPORATION
April 15, 2016 /s/ Paul B. Toms, Jr.
Paul B. Toms, Jr.
Chairman and Chief Executive Officer
Pursuant to the requirements of the Securities Exchange Act of 1934, this report has been signed below by the following persons on behalf of the registrant and in the capacities and on the dates indicated.
|
Signature
|
Title
|
Date
|
||
|
/s/ Paul B. Toms, Jr.
|
Chairman, Chief Executive Officer and
|
April 15, 2016
|
||
|
Paul B. Toms, Jr.
|
Director (Principal Executive Officer)
|
|||
|
/s/ Paul A. Huckfeldt
|
Senior Vice President - Finance and Accounting
|
April 15, 2016
|
||
|
Paul A. Huckfeldt
|
and Chief Financial Officer (Principal Financial and Accounting Officer)
|
|||
|
/s/ W. Christopher Beeler, Jr.
|
Director
|
April 15, 2016
|
||
|
W. Christopher Beeler, Jr.
|
||||
|
/s/ John L. Gregory, III
|
Director
|
April 15, 2016
|
||
|
John L. Gregory, III
|
||||
|
/s/ E. Larry Ryder
|
Director
|
April 15, 2016
|
||
|
E. Larry Ryder
|
||||
|
/s/ David G. Sweet
|
Director
|
April 15, 2016
|
||
|
David G. Sweet
|
||||
|
/s/ Ellen C. Taaffe
|
Director
|
April 15, 2016
|
||
|
Ellen C. Taaffe
|
||||
|
/s/ Henry G. Williamson, Jr.
|
Director
|
April 15, 2016
|
||
|
Henry G. Williamson, Jr.
|
||||
HOOKER FURNITURE CORPORATION AND SUBSIDIARIES
INDEX TO CONSOLIDATED FINANCIAL STATEMENTS
|
Page
|
|
|
F-2
|
|
|
F-3
|
|
|
F-5
|
|
|
F-6
|
|
|
F-7
|
|
|
F-8
|
|
|
F-9
|
|
|
F-10
|
MANAGEMENT’S REPORT ON INTERNAL CONTROL OVER FINANCIAL REPORTING
To the Shareholders of
Hooker Furniture Corporation
Martinsville, Virginia
Management is responsible for establishing and maintaining adequate internal control over financial reporting, as defined in Securities Exchange Act Rule 13a-15(f). Under the supervision and with the participation of management, including the principal executive officer and principal financial officer, the Company conducted an evaluation of the effectiveness of its internal control over financial reporting based on the framework in Internal Control—Integrated Framework (2013) issued by the Committee of Sponsoring Organizations of the Treadway Commission (COSO). Based on the Company’s evaluation under that framework, management concluded that the Company’s internal control over financial reporting was effective as of January 31, 2016.
The effectiveness of the Company’s internal control over financial reporting as of January 31, 2016 has been audited by KPMG LLP, the Company’s independent registered public accounting firm, as stated in their report which is included herein.

Paul B. Toms, Jr.
Chairman and Chief Executive Officer
(Principal Executive Officer)
April 15, 2016

Paul A. Huckfeldt
Senior Vice President – Finance and Accounting
and Chief Financial Officer
(Principal Financial and Accounting Officer)
April 15, 2016
Report of Independent Registered Public Accounting Firm
The Board of Directors and Shareholders
Hooker Furniture Corporation:
We have audited Hooker Furniture Corporation and subsidiaries’ internal control over financial reporting as of January 31, 2016, based on criteria established in Internal Control – Integrated Framework (2013) issued by the Committee of Sponsoring Organizations of the Treadway Commission (COSO). Hooker Furniture Corporation and subsidiaries’ management is responsible for maintaining effective internal control over financial reporting and for its assessment of the effectiveness of internal control over financial reporting, included in the accompanying Management’s Report on Internal Control over Financial Reporting. Our responsibility is to express an opinion on the Company’s internal control over financial reporting based on our audit.
We conducted our audit in accordance with the standards of the Public Company Accounting Oversight Board (United States). Those standards require that we plan and perform the audit to obtain reasonable assurance about whether effective internal control over financial reporting was maintained in all material respects. Our audit included obtaining an understanding of internal control over financial reporting, assessing the risk that a material weakness exists, and testing and evaluating the design and operating effectiveness of internal control based on the assessed risk. Our audit also included performing such other procedures as we considered necessary in the circumstances. We believe that our audit provides a reasonable basis for our opinion.
A company’s internal control over financial reporting is a process designed to provide reasonable assurance regarding the reliability of financial reporting and the preparation of financial statements for external purposes in accordance with generally accepted accounting principles. A company’s internal control over financial reporting includes those policies and procedures that (1) pertain to the maintenance of records that, in reasonable detail, accurately and fairly reflect the transactions and dispositions of the assets of the company; (2) provide reasonable assurance that transactions are recorded as necessary to permit preparation of financial statements in accordance with generally accepted accounting principles, and that receipts and expenditures of the company are being made only in accordance with authorizations of management and directors of the company; and (3) provide reasonable assurance regarding prevention or timely detection of unauthorized acquisition, use, or disposition of the company’s assets that could have a material effect on the financial statements.
Because of its inherent limitations, internal control over financial reporting may not prevent or detect misstatements. Also, projections of any evaluation of effectiveness to future periods are subject to the risk that controls may become inadequate because of changes in conditions, or that the degree of compliance with the policies or procedures may deteriorate.
In our opinion, Hooker Furniture Corporation maintained, in all material respects, effective internal control over financial reporting as of January 31, 2016, based on criteria established in Internal Control – Integrated Framework (2013) issued by COSO.
We also have audited, in accordance with the standards of the Public Company Accounting Oversight Board (United States), the consolidated balance sheets of Hooker Furniture Corporation and subsidiaries as of January 31, 2016 and February 1, 2015, and the related consolidated statements of income, comprehensive income, shareholders’ equity, and cash flows for each of the fifty-two week periods ended January 31, 2016, February 1, 2015 and February 2, 2014 and our report dated April 15, 2016 expressed an unqualified opinion on those consolidated financial statements.
/s/ KPMG LLP
Charlotte, North Carolina
April 15, 2016
Report of Independent Registered Public Accounting Firm
The Board of Directors and Shareholders
Hooker Furniture Corporation:
We have audited the accompanying consolidated balance sheets of Hooker Furniture Corporation and subsidiaries as of January 31, 2016 and February 1, 2015, and the related consolidated statements of income, comprehensive income, shareholders’ equity, and cash flows for each of the years in the fifty-two week periods ended January 31, 2016, February 1, 2015 and February 2, 2014. These consolidated financial statements are the responsibility of the Company’s management. Our responsibility is to express an opinion on these consolidated financial statements based on our audits.
We conducted our audits in accordance with the standards of the Public Company Accounting Oversight Board (United States). Those standards require that we plan and perform the audit to obtain reasonable assurance about whether the financial statements are free of material misstatement. An audit includes examining, on a test basis, evidence supporting the amounts and disclosures in the financial statements. An audit also includes assessing the accounting principles used and significant estimates made by management, as well as evaluating the overall financial statement presentation. We believe that our audits provide a reasonable basis for our opinion.
In our opinion, the consolidated financial statements referred to above present fairly, in all material respects, the financial position of Hooker Furniture Corporation and subsidiaries as of January 31, 2016 and February 1, 2015, and the results of their operations and their cash flows for each of the years in the fifty-two week periods ended January 31, 2016, February 1, 2015 and February 2, 2014, in conformity with U.S. generally accepted accounting principles.
We also have audited, in accordance with the standards of the Public Company Accounting Oversight Board (United States), Hooker Furniture Corporation’s internal control over financial reporting as of January 31, 2016, based on criteria established in Internal Control – Integrated Framework (2013) issued by the Committee of Sponsoring Organizations of the Treadway Commission (COSO), and our report dated April 15, 2016 expressed an unqualified opinion on the effectiveness of the Company’s internal control over financial reporting.
/s/ KPMG LLP
Charlotte, North Carolina
April 15, 2016
|
As of
|
January 31,
|
February 1,
|
||||||
|
2016
|
2015
|
|||||||
|
Assets
|
||||||||
|
Current assets
|
||||||||
|
Cash and cash equivalents
|
$ | 53,922 | $ | 38,663 | ||||
|
Trade accounts receivable, less allowance for doubtful
accounts of $1,032 and $1,329 on each respective date
|
28,176 | 32,245 | ||||||
|
Inventories
|
43,713 | 44,973 | ||||||
|
Prepaid expenses and other current assets
|
2,256 | 2,353 | ||||||
|
Total current assets
|
128,067 | 118,234 | ||||||
|
Property, plant and equipment, net
|
22,768 | 22,824 | ||||||
|
Cash surrender value of life insurance policies
|
21,888 | 20,373 | ||||||
|
Deferred taxes
|
5,350 | 5,892 | ||||||
|
Intangible assets
|
1,382 | 1,382 | ||||||
|
Other assets
|
2,198 | 2,050 | ||||||
|
Total non-current assets
|
53,586 | 52,521 | ||||||
|
Total assets
|
$ | 181,653 | $ | 170,755 | ||||
|
Liabilities and Shareholders’ Equity
|
||||||||
|
Current liabilities
|
||||||||
|
Trade accounts payable
|
$ | 9,105 | $ | 10,293 | ||||
|
Accrued salaries, wages and benefits
|
4,834 | 4,824 | ||||||
|
Income tax accrual
|
357 | 1,368 | ||||||
|
Accrued commissions
|
818 | 916 | ||||||
|
Other accrued expenses
|
694 | 813 | ||||||
|
Customer deposits
|
797 | 853 | ||||||
|
Total current liabilities
|
16,605 | 19,067 | ||||||
|
Deferred compensation
|
8,409 | 8,329 | ||||||
|
Income tax accrual
|
166 | 90 | ||||||
|
Other liabilities
|
412 | 360 | ||||||
|
Total long-term liabilities
|
8,987 | 8,779 | ||||||
|
Total liabilities
|
25,592 | 27,846 | ||||||
|
Shareholders’ equity
|
||||||||
|
Common stock, no par value, 20,000 shares authorized,
10,818 and 10,774 shares issued and outstanding on each date
|
18,667 | 17,852 | ||||||
|
Retained earnings
|
137,255 | 125,392 | ||||||
|
Accumulated other comprehensive income (loss)
|
139 | (335 | ) | |||||
|
Total shareholders’ equity
|
156,061 | 142,909 | ||||||
|
Total liabilities and shareholders’ equity
|
$ | 181,653 | $ | 170,755 | ||||
See accompanying Notes to Consolidated Financial Statements.
HOOKER FURNITURE CORPORATION AND SUBSIDIARIES
CONSOLIDATED STATEMENTS OF INCOME
(In thousands, except per share data)
For the 52 Week Periods Ended January 31, 2016, February 1, 2015, and February 2, 2014.
|
2016
|
2015
|
2014
|
||||||||||
|
Net sales
|
$ | 246,999 | $ | 244,350 | $ | 228,293 | ||||||
|
Cost of sales
|
178,311 | 181,550 | 173,568 | |||||||||
|
Gross profit
|
68,688 | 62,800 | 54,725 | |||||||||
|
Selling and administrative expenses
|
44,426 | 43,752 | 42,222 | |||||||||
|
Operating income
|
24,262 | 19,048 | 12,503 | |||||||||
|
Other income (expense), net
|
197 | 350 | (35 | ) | ||||||||
|
Income before income taxes
|
24,459 | 19,398 | 12,468 | |||||||||
|
Income taxes
|
8,274 | 6,820 | 4,539 | |||||||||
|
Net income
|
$ | 16,185 | $ | 12,578 | $ | 7,929 | ||||||
|
Earnings per share:
|
||||||||||||
|
Basic
|
$ | 1.50 | $ | 1.17 | $ | 0.74 | ||||||
|
Diluted
|
$ | 1.49 | $ | 1.16 | $ | 0.74 | ||||||
|
Weighted average shares outstanding:
|
||||||||||||
|
Basic
|
10,779 | 10,736 | 10,722 | |||||||||
|
Diluted
|
10,807 | 10,771 | 10,752 | |||||||||
|
Cash dividends declared per share
|
$ | 0.40 | $ | 0.40 | $ | 0.40 | ||||||
See accompanying Notes to Consolidated Financial Statements.
HOOKER FURNITURE CORPORATION AND SUBSIDIARIES
CONSOLIDATED STATEMENTS OF COMPREHENSIVE INCOME
(In thousands)
For the 52 Week Periods Ended January 31, 2016, February 1, 2015, and February 2, 2014.
|
2016
|
2015
|
2014
|
||||||||||
|
Net Income
|
$ | 16,185 | $ | 12,578 | $ | 7,929 | ||||||
|
Other comprehensive income (loss):
|
||||||||||||
|
Amortization of actuarial gain (loss)
|
751 | (687 | ) | (163 | ) | |||||||
|
Income tax effect on amortization
|
(277 | ) | 254 | 59 | ||||||||
|
Adjustments to net periodic benefit cost
|
474 | (433 | ) | (104 | ) | |||||||
|
Total Comprehensive Income
|
$ | 16,659 | $ | 12,145 | $ | 7,825 | ||||||
See accompanying Notes to Consolidated Financial Statements.
HOOKER FURNITURE CORPORATION AND SUBSIDIARIES
CONSOLIDATED STATEMENTS OF CASH FLOWS
(In thousands)
For the 52 Week Periods Ended January 31, 2016, February 1, 2015, and February 2, 2014.
|
2016
|
2015
|
2014
|
||||||||||
|
Operating Activities:
|
||||||||||||
|
Net income
|
$ | 16,185 | $ | 12,578 | $ | 7,929 | ||||||
|
Adjustments to reconcile net income to net cash
provided by operating activities:
|
||||||||||||
|
Depreciation and amortization
|
2,946 | 2,599 | 2,491 | |||||||||
|
Loss / (gain) on disposal of assets
|
83 | (23 | ) | (8 | ) | |||||||
|
Deferred income tax expense
|
544 | (135 | ) | 340 | ||||||||
|
Non-cash restricted stock and performance awards
|
829 | 123 | 338 | |||||||||
|
Provision for doubtful accounts
|
(105 | ) | 928 | 456 | ||||||||
|
Changes in assets and liabilities
|
||||||||||||
|
Trade accounts receivable
|
4,174 | (3,780 | ) | (1,576 | ) | |||||||
|
Income tax recoverable
|
- | 682 | (682 | ) | ||||||||
|
Inventories
|
1,260 | 4,043 | 856 | |||||||||
|
Gain on life insurance policies
|
(799 | ) | (709 | ) | (147 | ) | ||||||
|
Prepaid expenses and other current assets
|
(207 | ) | (76 | ) | 30 | |||||||
|
Trade accounts payable
|
(1,273 | ) | 3,216 | (4,499 | ) | |||||||
|
Accrued salaries, wages and benefits
|
273 | 1,347 | 162 | |||||||||
|
Accrued income taxes
|
(1,011 | ) | 1,368 | (751 | ) | |||||||
|
Accrued commissions
|
(98 | ) | (18 | ) | (62 | ) | ||||||
|
Customer deposits
|
(56 | ) | 194 | 659 | ||||||||
|
Other accrued expenses
|
(119 | ) | 56 | (31 | ) | |||||||
|
Deferred compensation
|
358 | 317 | 88 | |||||||||
|
Other long-term liabilities
|
52 | 58 | 103 | |||||||||
|
Net cash provided by operating activities
|
23,036 | 22,768 | 5,696 | |||||||||
|
Investing Activities:
|
||||||||||||
|
Purchases of property, plant and equipment
|
(2,847 | ) | (2,994 | ) | (3,471 | ) | ||||||
|
Proceeds received on notes receivable
|
93 | 31 | 36 | |||||||||
|
Proceeds from sale of property and equipment
|
6 | 71 | 22 | |||||||||
|
Purchase of intangible
|
- | - | (125 | ) | ||||||||
|
Premiums paid on life insurance policies
|
(707 | ) | (789 | ) | (834 | ) | ||||||
|
Proceeds received on life insurance policies
|
- | - | 517 | |||||||||
|
Net cash used in investing activities
|
(3,455 | ) | (3,681 | ) | (3,855 | ) | ||||||
|
Financing Activities:
|
||||||||||||
|
Cash dividends paid
|
(4,322 | ) | (4,306 | ) | (4,301 | ) | ||||||
|
Net cash used in financing activities
|
(4,322 | ) | (4,306 | ) | (4,301 | ) | ||||||
|
Net increase (decrease) in cash and cash equivalents
|
15,259 | 14,781 | (2,460 | ) | ||||||||
|
Cash and cash equivalents at the beginning of year
|
38,663 | 23,882 | 26,342 | |||||||||
|
Cash and cash equivalents at the end of year
|
$ | 53,922 | $ | 38,663 | $ | 23,882 | ||||||
|
Supplemental schedule of cash flow information:
|
||||||||||||
|
Income taxes paid, net
|
$ | 8,837 | $ | 4,696 | $ | 5,534 | ||||||
|
Supplemental schedule of noncash investing activities:
|
||||||||||||
|
Increase in property and equipment through accrued purchases
|
$ | 85 | - | $ | 43 | |||||||
See accompanying Notes to Consolidated Financial Statements.
HOOKER FURNITURE CORPORATION AND SUBSIDIARIES
CONSOLIDATED STATEMENTS OF SHAREHOLDERS' EQUITY
(In thousands, except per share data)
For the 52 Week Periods Ended January 31, 2016, February 1, 2015 and February 2, 2014.
|
Accumulated
|
||||||||||||||||||||
| Other |
Total
|
|||||||||||||||||||
| Common Stock | Retained | Comprehensive | Shareholders' | |||||||||||||||||
|
Shares
|
Amount
|
Earnings
|
Income
|
Equity
|
||||||||||||||||
|
Balance at February 3, 2013
|
10,746 | $ | 17,360 | $ | 113,483 | $ | 202 | $ | 131,045 | |||||||||||
|
Net income
|
- | - | 7,929 | - | 7,929 | |||||||||||||||
|
Unrealized loss on defined benefit plan, net of tax of $59
|
- | - | - | (104 | ) | (104 | ) | |||||||||||||
|
Cash dividends paid and accrued ($0.40 per share)
|
- | - | (4,301 | ) | - | (4,301 | ) | |||||||||||||
|
Restricted stock grants, net of forfeitures
|
7 | (8 | ) | 9 | - | - | ||||||||||||||
|
Restricted stock compensation cost
|
- | 233 | - | - | 233 | |||||||||||||||
|
Balance at February 2, 2014
|
10,753 | $ | 17,585 | $ | 117,120 | $ | 98 | $ | 134,803 | |||||||||||
|
Net income
|
- | - | 12,578 | - | 12,578 | |||||||||||||||
|
Unrealized loss on defined benefit plan, net of tax of $254
|
- | - | - | (433 | ) | (433 | ) | |||||||||||||
|
Cash dividends paid and accrued ($0.40 per share)
|
- | - | (4,306 | ) | - | (4,306 | ) | |||||||||||||
|
Restricted stock grants, net of forfeitures
|
21 | 51 | - | - | 51 | |||||||||||||||
|
Restricted stock compensation cost
|
- | 216 | - | - | 216 | |||||||||||||||
|
Balance at February 1, 2015
|
10,774 | $ | 17,852 | $ | 125,392 | $ | (335 | ) | $ | 142,909 | ||||||||||
|
Net income
|
- | - | 16,185 | - | 16,185 | |||||||||||||||
| Unrealized loss on defined benefit plan, net of tax of $(277) | - | - | - | 474 | 474 | |||||||||||||||
| Cash dividends paid and accrued ($0.40 per share) | - | - | (4,322 | ) | - | (4,322 | ) | |||||||||||||
|
Restricted stock grants, net of forfeitures
|
44 | 563 | - | - | 563 | |||||||||||||||
|
Restricted stock compensation cost
|
- | 252 | - | - | 252 | |||||||||||||||
|
Balance at January 31, 2016
|
10,818 | $ | 18,667 | $ | 137,255 | $ | 139 | $ | 156,061 | |||||||||||
See accompanying Notes to Consolidated Financial Statements.
NOTE 1 – SUMMARY OF SIGNIFICANT ACCOUNTING POLICIES
Nature of Business
Hooker Furniture Corporation and subsidiaries (the “Company,” “we,” “us” and “our”) design, import, manufacture and market residential household furniture for sale to wholesale and retail merchandisers located principally in North America.
Consolidation
The consolidated financial statements include the accounts of Hooker Furniture Corporation and our wholly owned subsidiaries. All material intercompany accounts and transactions have been eliminated in consolidation. All references to the Company refer to the Company and our consolidated subsidiaries, unless specifically referring to segment information. For comparative purposes, certain amounts in the consolidated financial statements and notes have been reclassified to conform to the fiscal 2016 presentation.
Segments
We are organized into three operating segments – casegoods, upholstery and an All Other segment. The upholstery segment consists of Bradington-Young, Sam Moore Furniture and Hooker Upholstery. The All Other segment consists of H Contract and Homeware.
Cash and Cash Equivalents
We temporarily invest unused cash balances in a high quality, diversified money market fund that provides for daily liquidity and pays dividends monthly. Cash equivalents are stated at cost plus accrued interest, which approximates fair value.
Trade Accounts Receivable
Substantially all of our trade accounts receivable are due from retailers and dealers that sell residential home furnishings, and consist of a large number of entities with a broad geographic dispersion. We perform credit evaluations of our customers and generally do not require collateral. In the event a receivable is determined to be potentially uncollectible, we engage collection agencies or law firms to attempt to collect amounts owed to us after all internal collection attempts have ended. Once we have determined the receivable is uncollectible, it is charged against the allowance for doubtful accounts. Bradington-Young factors substantially all of their receivables on a non-recourse basis. Accounts receivable are reported net of allowance for doubtful accounts.
Fair Value Measurements
We utilize valuation techniques that maximize the use of observable inputs and minimize the use of unobservable inputs to the extent possible. We determine fair value based on assumptions that we believe market participants would use in pricing an asset or liability in the principal or most advantageous market. When considering market participant assumptions in fair value measurements, the following fair value hierarchy distinguishes between observable and unobservable inputs, which are categorized in one of the following levels:
|
|
§
|
Level 1 Inputs: Unadjusted quoted prices in active markets for identical assets or liabilities accessible to the reporting entity at the measurement date.
|
|
|
§
|
Level 2 Inputs: Observable inputs other than quoted prices included in Level 1 inputs that are observable for the asset or liability, either directly or indirectly, for substantially the full term of the asset or liability.
|
|
|
§
|
Level 3 Inputs: Unobservable inputs for the asset or liability used to measure fair value to the extent that observable inputs are not available, thereby allowing for situations in which there is little, if any, market activity for the asset or liability at measurement date.
|
Fair Value of Financial Instruments
The carrying value for each of our financial instruments (consisting of cash and cash equivalents, trade accounts receivable and payable, and accrued liabilities) approximates fair value because of the short-term nature of those instruments.
Notes to Consolidated Financial Statements - Continued
(Tables in thousands, except per share data)
Inventories
All inventories are stated at the lower of cost, or market value using the last-in, first-out (LIFO) method.
Property, Plant and Equipment
Property, plant and equipment are stated at cost, less allowances for depreciation. Provision for depreciation has been computed at annual rates using straight-line or declining balance depreciation methods that will amortize the cost of the depreciable assets over their estimated useful lives.
Impairment of Long-Lived Assets
Long-lived assets, such as property, plant and equipment, are evaluated for impairment annually or more frequently when events or changes in circumstances indicate that the carrying amount of the assets may not be recoverable through the estimated undiscounted future cash flows from the use of those assets. When any such impairment exists, the related assets are written down to fair value. Long-lived assets subject to disposal by sale are measured at the lower of their carrying amount or fair value less estimated cost to sell, are no longer depreciated, and are reported separately as “assets held for sale” in the consolidated balance sheets.
Intangible Assets
We own certain indefinite-lived intangible assets related to our upholstery segment and all other segment. We may acquire additional amortizable assets and/or indefinite lived intangible assets in the future. Our indefinite-lived intangible assets are trademarks, trade names and a URL, which are not amortized but are tested for impairment annually or more frequently if events or circumstances indicate that the asset might be impaired. The fair value of our indefinite-lived intangible assets is determined based on the estimated earnings and cash flow capacity of those assets. The impairment test consists of a comparison of the fair value of the indefinite-lived intangible assets with their carrying amount. If the carrying amount of the indefinite-lived intangible assets exceeds their fair value, an impairment loss is recognized in an amount equal to that excess.
Trade names are tested for impairment annually as of the first day of our fiscal fourth quarter or more frequently if events or changes in circumstances indicate that the asset might be impaired. Circumstances that could indicate a potential impairment include:
|
|
§
|
a significant adverse change in the economic or business climate either within the furniture industry or the national or global economy;
|
|
|
§
|
significant changes in demand for our products;
|
|
|
§
|
loss of key personnel; and
|
|
|
§
|
the likelihood that a reporting unit or significant portion of a reporting unit will be sold or otherwise subject to disposal.
|
The assumptions used to determine the fair value of our intangible assets are highly subjective, involve significant judgment and include long term growth rates, sales volumes, projected revenues, assumed royalty rates and various factors used to develop an applied discount rate. If the assumptions that we use in these calculations differ from actual results, we may realize additional impairment of our intangible assets which may have a material adverse effect on our results of operations and financial condition.
Cash Surrender Value of Life Insurance Policies
We own eighty-seven life insurance policies on certain of our current and former executives and other key employees. These policies have a carrying value of approximately $22 million and a face value of approximately $35 million. Proceeds from the policies are used to fund certain employee benefits and for other general corporate purposes. We account for life insurance as a component of employee benefits cost. Consequently the cost of the coverage and any resulting gains or losses related to those insurance policies are recorded as a decrease or increase to operating income. Cash payments that increase the cash surrender value of these policies are classified as investing outflows on the Consolidated Statements of Cash Flows, with amounts paid in excess of the increase in cash surrender value included in operating activities. Gains on life insurance policies, which typically occur at the time a policy is redeemed, are included in the reconciliation of net income to net cash used in or provided by operating activities.
Notes to Consolidated Financial Statements - Continued
(Tables in thousands, except per share data)
Revenue Recognition
Our sales revenue is recognized when title and the risk of loss pass to the customer, which typically occurs at the time of shipment. In some cases however, title does not pass until the shipment is delivered to the customer. Sales are recorded net of allowances for trade promotions, estimated product returns, rebate advertising programs and other discounts.
Cost of Sales
The major components of cost of sales are:
|
|
§
|
the cost of imported products purchased for resale;
|
|
|
§
|
raw materials and supplies used in our domestically manufactured products;
|
|
|
§
|
labor and overhead costs associated with our domestically manufactured products;
|
|
|
§
|
the cost of our foreign import operations;
|
|
|
§
|
charges associated with our inventory reserves;
|
|
|
§
|
warehousing and certain shipping and handling costs; and
|
|
|
§
|
all other costs required to be classified as cost of sales.
|
Selling and Administrative Expenses
The major components of our selling and administrative expenses are:
|
|
§
|
the cost of our marketing and merchandising efforts, including showroom expenses;
|
|
|
§
|
sales and design commissions;
|
|
|
§
|
the costs of administrative support functions including, executive management, information technology, human resources and finance; and
|
|
|
§
|
all other costs required to be classified as selling and administrative expenses.
|
Advertising
We offer advertising programs to qualified dealers under which we may provide signage, catalogs and other marketing support to our dealers and may reimburse some advertising and other costs incurred by our dealers in connection with promoting our products. The cost of these programs does not exceed the fair value of the benefit received. We charge the cost of point-of-purchase materials (including signage and catalogs) to selling and administrative expense as incurred. Advertising costs charged to selling and administrative expense for fiscal years 2016, 2015 and 2014 were $2.3 million, $2.0 million and $2.2 million, respectively. The costs for other advertising allowance programs are charged against net sales. We also have arrangements with some dealers to reimburse them for a portion of their advertising costs, which provides advertising benefits to us. Costs for these arrangements are expensed as incurred and are netted against revenues in our consolidated statements of income and comprehensive income.
Income Taxes
At times, tax law and generally accepted accounting principles differ in the treatment of certain income and expense items. These items may be excluded or included in taxable income at different times than is required for GAAP or “book” reporting purposes. These differences may be permanent or temporary in nature.
We determine our annual effective income tax rate based on forecasted pre-tax book income and forecasted permanent book and tax differences. The rate is established at the beginning of the year and is evaluated on a quarterly basis. We consider the level and mix of income of our separate legal entities, statutory tax rates, business credits available in the various jurisdictions in which we operate and permanent tax differences. Significant judgment is required in evaluating tax positions that affect the annual tax rate. Any changes to the forecasted information may cause adjustments to the effective rate. Additional tax, interest and penalties associated with uncertain tax positions are recognized in tax expense on a quarterly basis.
To the extent any book and tax differences are temporary in nature, that is, the book realization will occur in a different period than the tax realization, a deferred tax asset or liability is established. To the extent a deferred tax asset is created, we evaluate our ability to realize this asset. If we determine that we will not be able to fully utilize deferred tax assets, we establish a valuation reserve. In assessing the realization of deferred tax assets, we consider whether it is more likely than not that some portion or all of the deferred tax assets will be realized. The ultimate realization of deferred tax assets is primarily dependent upon the generation of future taxable income during the periods in which those temporary differences reverse.
Notes to Consolidated Financial Statements - Continued
(Tables in thousands, except per share data)
We early adopted Accounting Standards Update No. 2015-17 (ASU 2015-17), Balance Sheet Classification of Deferred Taxes in the fourth quarter of fiscal 2016 and have applied retrospective treatment of the standard. Consequently, all deferred tax assets and liabilities are classified as non-current on our consolidated balance sheets We feel the classification of all deferred tax assets and liabilities as noncurrent provides a more informative disclosure because many of our deferred tax items are by definition short-term, however are of a recurring nature and tend to behave more like non-current assets or liabilities. The retrospective reclassification results in a reduction in current assets of $1.7 million and an increase in non-current assets of the same amount for the period ended February 1, 2015.
Earnings Per Share
We use the two class method to compute basic earnings per share. Under this method we allocate earnings to common shares and participating securities according to their participation rights in dividends declared and undistributed earnings and divide the income available to each class by the weighted average number of common shares for the period in each class. Unvested restricted stock grants made to our non-employee directors are considered participating securities because the shares have the right to receive non-forfeitable dividends. Because the participating shares have no obligation to share in net losses, we do not allocate losses to our common shares in this calculation.
Diluted earnings per share reflect the potential dilutive effect of securities that could share in our earnings. Restricted stock awarded to non-employee directors and restricted stock units granted to employees that have not yet vested are considered when computing diluted earnings per share. We use the treasury stock method to determine the dilutive effect of both unvested restricted stock and unvested restricted stock units. Shares of unvested restricted stock and unvested restricted stock units under a stock-based compensation arrangement are considered options for purposes of computing diluted earnings per share and are considered outstanding shares as of the grant date for purposes of computing diluted earnings per share even though their exercise may be contingent upon vesting. Those stock-based awards are included in the diluted earnings per share computation even if the non-employee director may be required to forfeit the stock at some future date, or no shares may ever be issued to the employees. Unvested restricted stock and unvested restricted stock units are not included in outstanding common shares in computing basic earnings per share.
Use of Estimates
The preparation of financial statements in conformity with U.S. generally accepted accounting principles requires us to make estimates and assumptions that affect the reported amounts of: (i) assets and liabilities, including disclosures regarding contingent assets and liabilities at the dates of the financial statements; and (ii) revenue and expenses during the reported periods. Significant items subject to such estimates and assumptions include the useful lives of fixed assets; allowance for doubtful accounts; deferred tax assets; the valuation of fixed assets; our supplemental retirement income plan; and stock-based compensation. These estimates and assumptions are based on our best judgments. We evaluate these estimates and assumptions on an ongoing basis using historical experience and other factors, including the current economic environment, which we believe to be reasonable under the circumstances. We adjust our estimates and assumptions as facts and circumstances dictate. Actual results could differ from our estimates.
NOTE 2- FISCAL YEAR
Our fiscal years end on the Sunday closest to January 31. In some years, generally once every six years, the fourth quarter will be fourteen weeks long and the fiscal year will consist of fifty-three weeks. For example, the 2013 fiscal year that ended on February 3, 2013 was a 53-week fiscal year. Our quarterly periods are based on thirteen-week “reporting periods,” which end on Sundays. As a result, each quarterly period generally will be thirteen weeks, or 91 days long, except as noted above.
In the notes to the consolidated financial statements, references to the:
|
|
§
|
2016 fiscal year and comparable terminology mean the fiscal year that began February 2, 2015 and ended January 31, 2016;
|
|
|
§
|
2015 fiscal year and comparable terminology mean the fiscal year that began February 3, 2014 and ended February 1, 2015; and
|
|
|
§
|
2014 fiscal year and comparable terminology mean the fiscal year that began February 4, 2013 and ended February 2, 2014.
|
Notes to Consolidated Financial Statements - Continued
(Tables in thousands, except per share data)
NOTE 3 – ALLOWANCE FOR DOUBTFUL ACCOUNTS
The activity in the allowance for doubtful accounts was:
|
Fifty-Two
|
Fifty-Two
|
Fifty-Two
|
||||||||||
|
Weeks Ended
|
Weeks Ended
|
Weeks Ended
|
||||||||||
|
January 31,
|
February 1,
|
February 2,
|
||||||||||
|
2016
|
2015
|
2014
|
||||||||||
|
Balance at beginning of year
|
$ | 1,329 | $ | 1,243 | $ | 1,249 | ||||||
|
Non-cash charges to cost and expenses
|
(105 | ) | 928 | 456 | ||||||||
|
Less uncollectible receivables written off, net of recoveries
|
(192 | ) | (842 | ) | (462 | ) | ||||||
|
Balance at end of year
|
$ | 1,032 | $ | 1,329 | $ | 1,243 | ||||||
NOTE 4 – ACCOUNTS RECEIVABLE
|
January 31,
|
February 1,
|
|||||||
|
2016
|
2015
|
|||||||
|
Trade accounts receivable
|
$ | 25,520 | $ | 25,322 | ||||
|
Receivable from factor
|
3,688 | 8,252 | ||||||
|
Allowance for doubtful accounts
|
(1,032 | ) | (1,329 | ) | ||||
|
Accounts receivable
|
$ | 28,176 | $ | 32,245 | ||||
“Receivable from factor” represents amounts due with respect to factored accounts receivable. Before the fiscal 2016 second quarter, we factored substantially all of our domestically-produced upholstery accounts receivable without recourse to us. However, we ended Sam Moore’s factoring relationship when our ERP system became fully operational there at the beginning of the fiscal 2016 second quarter. Since that time, we have been managing Sam Moore’s accounts receivable in-house. As of November 1, 2015 there were no outstanding receivables for which payment was due to us from the factor as part of its residual obligations under Sam Moore’s legacy factoring agreement.
Under our current factoring agreement, which continues to serve Bradington-Young (BY), invoices for domestically produced BY upholstery products are generated and transmitted to our customers, with copies to the factor on a daily basis, as products are shipped to our customers. The factor collects the amounts due and remits collected funds to us semi-weekly, less factoring fees. We retain ownership of the accounts receivable until the invoices are 90 days past due. At that time, the factor pays us the net invoice amount, less factoring fees, and takes ownership of the accounts receivable. The factor is then entitled to collect the invoices on its own behalf and retain any subsequent remittances. The invoiced amounts are reported as accounts receivable on our condensed consolidated balance sheets, generally from the date the merchandise is shipped to our customer until payment is received from the factor.
A limited number of our accounts receivable for our domestically produced BY upholstery products are factored with recourse to us. The amounts of these receivables at January 31, 2016 and February 1, 2015 were $255,000 and $237,000, respectively. If the factor is unable to collect the amounts due, invoices are returned to us for collection. We include an estimate of potentially uncollectible receivables in the calculation of our allowance for doubtful accounts.
NOTE 5 – INVENTORIES
|
January 31,
|
February 1,
|
|||||||
|
2016
|
2015
|
|||||||
|
Finished furniture
|
$ | 55,120 | $ | 54,896 | ||||
|
Furniture in process
|
727 | 615 | ||||||
|
Materials and supplies
|
7,994 | 9,131 | ||||||
|
Inventories at FIFO
|
63,841 | 64,642 | ||||||
|
Reduction to LIFO basis
|
(20,128 | ) | (19,669 | ) | ||||
|
Inventories
|
$ | 43,713 | $ | 44,973 | ||||
If the first-in, first-out (FIFO) method had been used in valuing all inventories, net income would have been $16.5 million in fiscal 2016, $13.4 million in fiscal 2015 and $8.2 million in fiscal 2014. We recorded total LIFO expense of $499,000 in fiscal 2016, $1.3 million in fiscal 2015 and $493,000 in fiscal 2014. The reduction in LIFO basis as of February 2, 2014 and February 3, 2013 was $18.4 million and $17.9 million, respectively.
Notes to Consolidated Financial Statements - Continued
(Tables in thousands, except per share data)
At January 31, 2016 and February 1, 2015, we had approximately $1.3 million and $1.1 million, respectively, in consigned inventories, which are included in the “Finished furniture” line in the table above.
At January 31, 2016, we held $11.0 million in inventory (approximately 6% of total assets) outside of the United States, in China and in Vietnam. At February 1, 2015, we held $10.2 million in inventory (approximately 6% of total assets) outside of the United States, in China and Vietnam.
NOTE 6 – PROPERTY, PLANT AND EQUIPMENT
|
Depreciable Lives
|
January 31,
|
February 1,
|
|||||||||
|
(In years)
|
2016
|
2015
|
|||||||||
|
Buildings and land improvements
|
15 - 30 | $ | 22,777 | $ | 22,162 | ||||||
|
Computer software and hardware
|
3 - 10 | 16,137 | 18,444 | ||||||||
|
Machinery and equipment
|
10 | 4,864 | 4,757 | ||||||||
|
Leasehold improvements
|
Term of lease
|
2,817 | 2,840 | ||||||||
|
Furniture and fixtures
|
3 - 8 | 1,453 | 2,240 | ||||||||
|
Other
|
5 | 546 | 628 | ||||||||
|
Total depreciable property at cost
|
48,594 | 51,070 | |||||||||
|
Less accumulated depreciation
|
27,739 | 32,790 | |||||||||
|
Total depreciable property, net
|
20,855 | 18,280 | |||||||||
|
Land
|
1,067 | 1,067 | |||||||||
|
Construction-in-progress
|
846 | 3,477 | |||||||||
|
Property, plant and equipment, net
|
$ | 22,768 | $ | 22,824 | |||||||
The decreases in computer software and hardware, furniture and fixtures and accumulated depreciation line items above are primarily due to the write-off of fully depreciated assets that are no longer in use.
At January 31, 2016, construction-in-progress consisted of approximately $294,000 of expenditures related to our ongoing Enterprise Resource Planning (ERP) conversion efforts and approximately $552,000 related to various other projects to enhance our facilities and operations.
The decrease in the construction-in-progress line item above is primarily due to placing our ERP asset in service when the Sam Moore division went-live on our ERP platform during the fiscal 2016 second quarter. This partially offset the decreases in the computer software and hardware line item discussed above.
No significant property, plant or equipment was held outside of the United States at either January 31, 2016 or February 1, 2015.
Capitalized Software Costs
Certain costs incurred in connection with developing or obtaining computer software for internal use are capitalized. These costs are amortized over periods of ten years or less. Capitalized software is reported as a component of computer software and hardware above and on the property, plant, and equipment line of our consolidated balance sheets. The activity in capitalized software costs was:
|
Fifty-Two Weeks
|
Fifty-Two Weeks
|
Fifty-Two Weeks
|
||||||||||
|
Ended
|
Ended
|
Ended
|
||||||||||
|
January 31,
|
February 1,
|
February 2,
|
||||||||||
|
2016
|
2015
|
2014
|
||||||||||
|
Balance beginning of year
|
$ | 2,726 | $ | 2,550 | $ | 3,954 | ||||||
|
Purchases
|
4,113 | 606 | 173 | |||||||||
|
Amortization expense
|
(777 | ) | (430 | ) | (311 | ) | ||||||
|
Disposals
|
- | - | (1,266 | ) | ||||||||
|
Balance end of year
|
$ | 6,062 | $ | 2,726 | $ | 2,550 | ||||||
Notes to Consolidated Financial Statements - Continued
(Tables in thousands, except per share data)
NOTE 7 – INTANGIBLE ASSETS
|
January 31,
|
February 1,
|
|||||||||
|
Segment
|
2016
|
2015
|
||||||||
|
Non-amortizable Intangible Assets
|
||||||||||
|
Trademarks and trade names - Bradington-Young
|
Upholstery
|
$ | 861 | $ | 861 | |||||
|
Trademarks and trade names - Sam Moore
|
Upholstery
|
396 | 396 | |||||||
|
URL- Homeware.com
|
All other
|
125 | 125 | |||||||
|
Total Non-amortizable Intangible Assets
|
1,382 | 1,382 | ||||||||
We recorded certain intangible assets related to the acquisitions of Bradington-Young and Sam Moore and upon purchase of the Homeware.com URL. The Bradington-Young and Sam Moore trademarks and trade names have indefinite useful lives and, consequently, are not subject to amortization for financial reporting purposes but are tested for impairment annually or more frequently if events or circumstances indicate that the asset might be impaired. See “Note 1 – Summary of Significant Accounting Policies: Intangible Assets.”
Trademarks and trade names are related to the acquisitions of Bradington-Young and Sam Moore. In conjunction with our evaluation of the cash flows generated by the reporting units, we evaluated the carrying value of trademarks and trade names using the relief from royalty method, which values the trademark/trade name by estimating the savings achieved by ownership of the trademark/trade name when compared to licensing the mark/name from an independent owner. The inputs used in the trademark/trade name analyses are considered Level 3 fair value measurements.
At January 31, 2016, the fair value of our Bradington-Young trade name exceeded its carrying value by approximately $1.4 million, and the fair value of our Sam Moore trade name was approximately $637,000 in excess of its carrying value.
NOTE 8 – FAIR VALUE MEASUREMENTS
Fair value is the price that would be received upon the sale of an asset or paid upon the transfer of a liability (an exit price) in an orderly transaction between market participants on the applicable measurement date. We use a three-tier fair value hierarchy, which prioritizes the inputs used in measuring fair value. These tiers include:
Level 1, defined as observable inputs such as quoted prices in active markets for identical assets and liabilities;
Level 2, defined as inputs other than quoted prices in active markets that are either directly or indirectly observable; and
Level 3, defined as unobservable inputs for which little or no market data exists, therefore requiring an entity to develop its own assumptions.
As of January 31, 2016 and February 1, 2015, Company-owned life insurance was measured at fair value on a recurring basis based on Level 2 inputs. The fair value of the Company-owned life insurance is determined by inputs that are readily available in public markets or can be derived from information available in publicly quoted markets. Additionally, the fair value of the Company-owned life insurance is marked to market each reporting period and any change in fair value is reflected in income for that period.
Notes to Consolidated Financial Statements - Continued
(Tables in thousands, except per share data)
As of January 31, 2016, a mortgage note receivable, secured by a lien on the property, was measured at fair value on a non-recurring basis using Level 3 inputs. The note receivable was delivered to us by the buyer as part of the purchase price for our Cloverleaf facility during the fiscal 2015 first quarter and was recorded at approximately $1.6 million, the original face value of the note. The carrying value of the note is assumed to approximate its fair value. We measure the probability that amounts due to us under this note will be collected primarily based on the buyer’s payment history. Specifically, we consider the buyer’s adherence to the contractual payment terms for both timeliness and payment amounts. Should it become probable that we would be unable to collect all amounts due according to the contractual terms of the note, we would measure the note for impairment and record a valuation allowance against the note, if needed, with the related expense charged to income for that period. The current portion of the note receivable is included in the prepaid expenses and other current assets line of our condensed consolidated balance sheets. The non-current portion is included in the “Other Assets” line of our condensed consolidated balance sheets.
Our assets measured at fair value on a recurring and non-recurring basis at January 31, 2016 and February 1, 2015, were as follows:
|
Fair value at January 31, 2016
|
Fair value at February 1, 2015
|
|||||||||||||||||||||||||||||||
|
Description
|
Level 1
|
Level 2
|
Level 3
|
Total
|
Level 1
|
Level 2
|
Level 3
|
Total
|
||||||||||||||||||||||||
|
|
(In thousands)
|
|||||||||||||||||||||||||||||||
|
Assets measured at fair value
|
|
|||||||||||||||||||||||||||||||
|
Company-owned life insurance
|
$ | - | $ | 21,888 | $ | $ | 21,888 | $ | - | $ | 20,373 | $ | - | $ | 20,373 | |||||||||||||||||
|
Mortgage note receivable
|
- | 1,575 | 1,575 | - | - | 1,575 | 1,575 | |||||||||||||||||||||||||
NOTE 9 – LONG-TERM DEBT
Subsequent to the end of our 2016 fiscal year, we completed the acquisition of substantially all of the assets of Home Meridian International, Inc. and entered into an amended and restated loan agreement with Bank of America. See Item 7 and note 18 to our consolidated financial statements for additional information.
Our loan agreement with Bank of America, N.A. as of January 31, 2016, which was scheduled to expire on July 31, 2018, included the following terms:
|
|
§
|
A $15.0 million unsecured revolving credit facility, up to $3.0 million of which could have been used to support letters of credit;
|
|
|
§
|
A floating interest rate, adjusted monthly, based on USD LIBOR, plus an applicable margin based on the ratio of our funded debt to our EBITDA (each as defined in the agreement);
|
|
|
§
|
A quarterly unused commitment fee of 0.20%; and
|
|
|
§
|
No pre-payment penalty.
|
The Company could have permanently terminated or reduced the $15 million revolving commitment under the loan agreement without penalty. The loan agreement also included customary representations and warranties and required us to comply with customary covenants, including, among other things, the following financial covenants:
|
|
§
|
Maintain a tangible net worth of at least $95.0 million;
|
|
|
§
|
Limit capital expenditures to no more than $15.0 million during any fiscal year; and
|
|
|
§
|
Maintain a ratio of funded debt to EBITDA not exceeding 2.0:1.0.
|
We were in compliance with each of these financial covenants at January 31, 2016 and, as of that date, expect to remain in compliance with existing covenants through fiscal 2017 and for the foreseeable future. The loan agreement did not restrict our ability to pay cash dividends on, or repurchase our common shares, subject to complying with the financial covenants under the agreement.
As of January 31, 2016, we had an aggregate $13.3 million available under our revolving credit facility to fund working capital needs. Standby letters of credit in the aggregate amount of $1.7 million, used to collateralize certain insurance arrangements and for imported product purchases, were outstanding under the revolving credit facility as of January 31, 2016. There were no additional borrowings outstanding under the revolving credit facility on January 31, 2016.
Notes to Consolidated Financial Statements - Continued
(Tables in thousands, except per share data)
NOTE 10 – EMPLOYEE BENEFIT PLANS
Employee Savings Plans
We sponsor a tax-qualified 401(k) retirement plan covering substantially all employees. This plan assists employees in meeting their savings and retirement planning goals through employee salary deferrals and discretionary employer matching contributions. Our contributions to the plan amounted to $666,000 in fiscal 2016, $605,000 in fiscal 2015, and $593,000 in fiscal 2014.
Executive Benefits
We provide supplemental executive retirement benefits to certain management employees under a supplemental retirement income plan (“SRIP”). The SRIP provides monthly payments to participants or their designated beneficiaries based on a participant’s “final average monthly earnings” and “specified percentage” participation level as defined in the plan, subject to a vesting schedule that may vary for each participant. The benefit is payable for a 15-year period following the participant’s termination of employment due to retirement, disability or death. In addition, the monthly retirement benefit for each participant, regardless of age, becomes fully vested and the present value of that benefit is paid to each participant in a lump sum upon a change in control of the Company as defined in the plan. The SRIP is unfunded and all benefits are payable solely from our general assets. The plan liability is based on the aggregate actuarial present value of the vested benefits to which participating employees are currently entitled, but based on the employees’ expected dates of separation or retirement. No employees have been added to the plan since 2008 and we do not expect to add additional employees in the future, due to changes in our compensation philosophy, which emphasizes more performance-based compensation measures in total management compensation.
Summarized plan information as of each fiscal year-end (the measurement date) is as follows:
|
Fifty-Two
|
Fifty-Two
|
|||||||
|
Weeks Ended
|
Weeks Ended
|
|||||||
|
January 31,
|
February 1,
|
|||||||
|
2016
|
2015
|
|||||||
|
Change in benefit obligation:
|
||||||||
|
Beginning projected benefit obligation
|
$ | 8,385 | $ | 7,662 | ||||
|
Service cost
|
406 | 102 | ||||||
|
Interest cost
|
289 | 339 | ||||||
|
Benefits paid
|
(354 | ) | (354 | ) | ||||
|
Actuarial (gain) loss
|
(573 | ) | 636 | |||||
|
Ending projected benefit obligation (funded status)
|
$ | 8,153 | $ | 8,385 | ||||
|
Accumulated benefit obligation
|
$ | 7,446 | $ | 7,373 | ||||
|
Discount rate used to value the ending benefit obligations:
|
4.25 | % | 3.5 | % | ||||
|
Amount recognized in the consolidated balance sheets:
|
||||||||
|
Current liabilities (Accrued salaries, wages and benefits line)
|
$ | 354 | $ | 354 | ||||
|
Non-current liabilities (Deferred compensation line*)
|
7,799 | 8,031 | ||||||
|
Total
|
$ | 8,153 | $ | 8,385 | ||||
Notes to Consolidated Financial Statements - Continued
(Tables in thousands, except per share data)
*Total Deferred Compensation in the Long-Term Liabilities section of our Consolidated Balance Sheets is $8.4 million at January 31, 2016 and $8.3 million at February 1, 2015. These totals include the SRIP amounts shown in the table above, as well as additional long-term compensation-related items unrelated to our SRIP.
|
Fifty-Two
|
Fifty-Two
|
Fifty-Two
|
||||||||||
|
Weeks Ended
|
Weeks Ended
|
Weeks Ended
|
||||||||||
|
January 31,
|
February 1,
|
February 2,
|
||||||||||
| 2016 | 2015 | 2014 | ||||||||||
|
Net periodic benefit cost
|
||||||||||||
|
Service cost
|
$ | 406 | $ | 102 | $ | 256 | ||||||
|
Interest cost
|
289 | 339 | 292 | |||||||||
|
Net loss (gain)
|
178 | (51 | ) | (106 | ) | |||||||
|
Net periodic benefit cost
|
$ | 873 | $ | 390 | $ | 442 | ||||||
|
Other changes recognized in accumulated other comprehensive income
|
||||||||||||
|
Net (gain) loss arising during period
|
(574 | ) | 636 | 57 | ||||||||
|
(Loss) gain
|
(178 | ) | 51 | 106 | ||||||||
|
Total recognized in other comprehensive (income) loss
|
(752 | ) | 687 | 163 | ||||||||
|
Total recognized in net periodic benefit cost and
accumulated other comprehensive income
|
$ | 121 | $ | 1,077 | $ | 605 | ||||||
|
Assumptions used to determine net periodic benefit cost:
|
||||||||||||
|
Discount rate (Moody's Composite Bond Rate)
|
3.5 | % | 4.5 | % | 4.0 | % | ||||||
|
Increase in future compensation levels
|
4.0 | % | 4.0 | % | 4.0 | % | ||||||
|
Estimated Future Benefit Payments:
|
||||
|
Fiscal 2017
|
$ | 354 | ||
|
Fiscal 2018
|
530 | |||
|
Fiscal 2019
|
530 | |||
|
Fiscal 2020
|
795 | |||
|
Fiscal 2021
|
795 | |||
|
Fiscal 2022 through Fiscal 2026
|
4,376 |
The decrease in the net loss recognized in other accumulated comprehensive income was primarily due to an increase in the discount rate from 3.5% at February 1, 2015 to 4.25% at January 31, 2016. The discount rate utilized in each period was the Annualized Moody’s Composite Bond Rate rounded to the nearest 0.25%.
Increasing the SRIP discount rate by 1% would decrease the projected benefit obligation at January 31, 2016 by approximately $610,000. Similarly, decreasing the discount rate by 1% would increase the projected benefit obligation at January 31, 2016 by $688,000.
At January 31, 2016, the actuarial gains related to this plan amounted to $139,000, net of tax of ($79,000). At February 1, 2015, the actuarial losses related to this plan amounted to ($335,000), net of tax of $198,000. The estimated prior service (cost) credit and actuarial gain (loss) that will be amortized from accumulated other comprehensive income into net periodic benefit cost over fiscal 2017 are $0 and $73,000, respectively.
We also provide a life insurance program for certain executives. The life insurance program provides death benefit protection for these executives during employment up to age 65. Coverage under the program declines when a participating executive attains age 60 and automatically terminates when the executive attains age 65 or terminates employment with us for any reason, other than death, whichever occurs first. The life insurance policies funding this program are owned by the Company with a specified portion of the death benefits payable under those policies endorsed to the insured executives’ designated beneficiaries.
Notes to Consolidated Financial Statements - Continued
(Tables in thousands, except per share data)
Performance Grants
The Compensation Committee of our Board of Directors annually awards performance grants to certain senior executives under the Company’s Stock Incentive Plan. Payments under these awards are based on our achieving specified performance targets during a designated performance period. Generally, each executive must remain continuously employed with the Company through the end of the performance period. Typically, performance grants can be paid in cash, shares of the Company’s common stock, or both, at the discretion of the Compensation Committee at the time payment is made.
Outstanding performance grants are classified as liabilities since the (i) settlement amount for each grant is not known until after the applicable performance period is completed and (ii) settlement of the grants may be made in common stock, cash or a combination of both. The estimated cost of each grant is recorded as compensation expense over its performance period when it becomes probable that the applicable performance targets will be achieved. The expected cost of the performance grants is revalued each reporting period. As assumptions change regarding the expected achievement of performance targets, a cumulative adjustment is recorded and future compensation expense will increase or decrease based on the currently projected performance levels. If we determine that it is not probable that the minimum performance thresholds for outstanding performance grants will be met, no further compensation cost will be recognized and any previously recognized compensation cost will be reversed.
During fiscal 2013, the Compensation Committee awarded performance grants for the 2014 fiscal year. The 2014 awards had a three-year performance period that ended on January 15, 2016. The performance criteria for these awards were met and were paid in April 2016. During fiscal 2015 and fiscal 2016, the Compensation Committee awarded performance grants for the 2015 and 2016 fiscal years that have three-year performance periods ending on January 29, 2017 and January 28, 2018. The following amounts were accrued in our consolidated balance sheets as of the fiscal period-end dates indicated:
|
January 31,
|
February 1,
|
|||||||
|
2016
|
2015
|
|||||||
|
Performance grants
|
||||||||
|
Fiscal 2013 grant (Current liabilities, Accrued wages, salaries and benefits)
|
$ | - | $ | 689 | ||||
|
Fiscal 2014 grant (Current liabilities, Accrued wages, salaries and benefits)
|
619 | 195 | ||||||
|
Fiscal 2015 grant (Non-current liabilities, Deferred compensation)
|
429 | 86 | ||||||
|
Fiscal 2016 grant (Non-current liabilities, Deferred compensation)
|
129 | - | ||||||
|
Total performance grants accrued
|
$ | 1,177 | $ | 970 | ||||
NOTE 11 – SHARE-BASED COMPENSATION
Our Stock Incentive Plan permits incentive awards of restricted stock, restricted stock units, stock appreciation rights and performance grants to key employees. A maximum of 750,000 shares of the Company’s common stock is authorized for issuance under the Stock Incentive Plan. The Stock Incentive Plan also provides for annual restricted stock awards to non-employee directors. We have issued restricted stock awards to our non-employee directors since January 2006 and certain other management employees since 2014.
We account for restricted stock awards as “non-vested equity shares” until the awards vest or are forfeited. Restricted stock awards to non-employee directors and certain other management employees vest if the director/employee remains on the board/employed through a 36-month service period for shares and may vest earlier upon certain events specified in the plan. For shares issued to non-employee directors during fiscal 2016 and after, there is a 12-month service period. The fair value of each share of restricted stock is the market price of our common shares on the grant date. The weighted average grant-date fair values of restricted stock awards issued during fiscal year 2016 were $25.72, $26.09 and $21.44, during 2015 were $15.96 and $13.86 per share, and in 2014 and 2013 was $15.96 and $10.38 per share, respectively.
Notes to Consolidated Financial Statements - Continued
(Tables in thousands, except per share data)
The restricted stock awards outstanding as of January 31, 2016 had an aggregate grant-date fair value of $476,000, after taking vested and forfeited restricted shares into account. As of January 31, 2016, we have recognized non-cash compensation expense of approximately $274,000 related to these non-vested awards and $626,000 for awards that have vested. The remaining $202,000 of grant-date fair value for unvested restricted stock awards outstanding at January 31, 2016 will be recognized over the remaining vesting periods for these awards.
For each restricted stock issuance, the following table summarizes restricted stock activity, including the weighted average issue price of those shares on the grant date, the fair value of each grant of restricted stock on the grant date, compensation expense recognized for the unvested shares of restricted stock for each grant and the remaining fair value of the unvested shares of restricted stock for each grant as of January 31, 2016:
|
Whole
|
Grant-Date
|
Aggregate
|
Compensation
|
Grant-Date Fair Value
|
||||||||||||||||
|
Number of
|
Fair Value
|
Grant-Date
|
Expense
|
Unrecognized At
|
||||||||||||||||
|
Shares
|
Per Share
|
Fair Value
|
Recognized
|
January 31, 2016
|
||||||||||||||||
|
Previous Awards (vested)
|
$ | 626 | ||||||||||||||||||
|
Restricted shares Issued on June 7, 2013
|
6,876 | $ | 15.96 | 110 | 80 | 10 | ||||||||||||||
|
Forfeited
|
(1,269 | ) | $ | 15.96 | (20 | ) | - | - | ||||||||||||
|
Balance
|
5,607 | 90 | 80 | 10 | ||||||||||||||||
|
Restricted shares Issued on June 4, 2014
|
1,624 | $ | 13.86 | 23 | 13 | 10 | ||||||||||||||
|
Restricted shares Issued on June 10, 2014
|
8,385 | $ | 15.96 | 133 | 61 | 49 | ||||||||||||||
|
Forfeited
|
(1,434 | ) | $ | 15.96 | (23 | ) | - | - | ||||||||||||
|
Balance
|
6,951 | 110 | 61 | 49 | ||||||||||||||||
|
Restricted shares Issued on April 6, 2015
|
5,741 | $ | 21.44 | 123 | 34 | 89 | ||||||||||||||
|
Restricted shares Issued on June 9, 2015
|
4,302 | $ | 26.09 | 112 | 75 | 37 | ||||||||||||||
|
Restricted shares Issued on July 21, 2015
|
694 | $ | 25.72 | 18 | 11 | 7 | ||||||||||||||
|
Awards outstanding at January 31, 2016:
|
24,919 | $ | 476 | $ | 274 | $ | 202 | |||||||||||||
Notes to Consolidated Financial Statements - Continued
(Tables in thousands, except per share data)
We have awarded time-based restricted stock units to certain senior executives since 2011. Each restricted stock unit, or “RSU”, entitles the executive to receive one share of the Company’s common stock if he remains continuously employed with the Company through the end of a three-year service period. The RSUs may be paid in shares of the Company’s common stock, cash or both, at the discretion of the Compensation Committee. The RSUs are accounted for as “non-vested stock grants.” Similar to the restricted stock grants issued to our non-employee directors, RSU compensation expense is recognized ratably over the applicable service period. However, unlike restricted stock grants, no shares are issued, or other payment made, until the end of the applicable service period (commonly referred to as “cliff vesting”) and grantees are not entitled to receive dividends on their RSUs during that time. The fair value of each RSU is the market price of a share of our common stock on the grant date, reduced by the present value of the dividends expected to be paid on a share of our common stock during the applicable service period, discounted at the appropriate risk-free rate. The following table presents RSU activity for the years ended January 31, 2016 and February 3, 2013, adjusted for forfeitures (as there were not RSU activities for the fiscal year ended February 2, 2014):
|
Whole
|
Grant-Date
|
Aggregate
|
Compensation
|
Grant-Date Fair Value
|
||||||||||||||||
|
Number of
|
Fair Value
|
Grant-Date
|
Expense
|
Unrecognized At
|
||||||||||||||||
|
Units
|
Per Unit
|
Fair Value
|
Recognized
|
January 31, 2016
|
||||||||||||||||
|
Previous Awards (vested)
|
$ | 305 | ||||||||||||||||||
|
RSUs Awarded on April 15, 2014
|
7,322 | $ | 12.91 | 95 | 63 | 32 | ||||||||||||||
|
RSUs Awarded on April 6, 2015
|
5,518 | $ | 17.52 | 97 | 27 | 70 | ||||||||||||||
|
Awards outstanding at January 31, 2016:
|
12,840 | $ | 192 | $ | 90 | $ | 102 | |||||||||||||
NOTE 12 – EARNINGS PER SHARE
We refer you to the Earnings Per Share disclosure in Note 1-Summary of Significant Accounting Policies, above, for more detailed information concerning the calculation of earnings per share.
We have issued restricted stock awards to non-employee directors since 2006 and certain management employees since 2014 and have issued restricted stock units (RSUs) to certain senior executives since fiscal 2012, under the Company’s Stock Incentive Plan. We expect to continue to grant these types of awards annually in the future. The following table sets forth the number of outstanding restricted stock awards and RSUs, net of forfeitures and vested shares, as of the fiscal year-end dates indicated:
|
January 31,
|
February 1,
|
February 2,
|
||||||||||
|
2016
|
2015
|
2014
|
||||||||||
|
Restricted shares
|
24,919 | 27,458 | 28,614 | |||||||||
|
Restricted stock units
|
12,840 | 24,546 | 32,353 | |||||||||
| 37,759 | 52,004 | 60,967 | ||||||||||
All restricted shares awarded that have not yet vested are considered when computing diluted earnings per share. Unlike the restricted stock grants issued to our non-employee directors, the transfer of ownership of common shares issued under our RSUs, if any, occurs after the three-year vesting period; however, RSUs are also considered when computing diluted earnings per share.
Notes to Consolidated Financial Statements - Continued
(Tables in thousands, except per share data)
The following table sets forth the computation of basic and diluted earnings per share:
|
Fifty-Two
|
Fifty-Two
|
Fifty-Two
|
||||||||||
|
Weeks Ended
|
Weeks Ended
|
Weeks Ended
|
||||||||||
|
January 31,
|
February 1,
|
February 2,
|
||||||||||
|
2016
|
2015
|
2014
|
||||||||||
|
Net income
|
$ | 16,185 | $ | 12,578 | $ | 7,929 | ||||||
|
Less: Dividends on unvested restricted shares
|
11 | 11 | 12 | |||||||||
|
Net earnings allocated to unvested restricted stock
|
40 | 33 | 22 | |||||||||
|
Earnings available for common shareholders
|
$ | 16,134 | $ | 12,534 | $ | 7,895 | ||||||
|
Weighted average shares outstanding for basic
earnings per share
|
10,779 | 10,736 | 10,722 | |||||||||
|
Dilutive effect of unvested restricted stock awards
|
28 | 35 | 30 | |||||||||
|
Weighted average shares outstanding for diluted
earnings per share
|
10,807 | 10,771 | 10,752 | |||||||||
|
Basic earnings per share
|
$ | 1.50 | $ | 1.17 | $ | 0.74 | ||||||
|
Diluted earnings per share
|
$ | 1.49 | $ | 1.16 | $ | 0.74 | ||||||
We completed the acquisition of substantially all of the assets of Home Meridian International subsequent to the end of our 2016 fiscal year on February 1, 2016. Upon completion, we issued 716,910 shares of our common stock to designees of Home Meridian as partial consideration for the acquisition.
NOTE 13 – INCOME TAXES
Our provision for income taxes was as follows for the periods indicated:
|
Fifty-Two
|
Fifty-Two
|
Fifty-Two
|
||||||||||
|
Weeks Ended
|
Weeks Ended
|
Weeks Ended
|
||||||||||
|
January 31,
|
February 1,
|
February 2,
|
||||||||||
|
2016
|
2015
|
2014
|
||||||||||
|
Current expense
|
||||||||||||
|
Federal
|
$ |
7,196
|
$ | 6,024 | $ | 3,755 | ||||||
|
Foreign
|
41 | 40 | 41 | |||||||||
|
State
|
771 | 635 | 403 | |||||||||
|
Total current expense
|
8,008
|
6,699 | 4,199 | |||||||||
|
Deferred taxes
|
||||||||||||
|
Federal
|
244
|
97 | 214 | |||||||||
|
State
|
22 | 24 | 126 | |||||||||
|
Total deferred taxes
|
266
|
121 | 340 | |||||||||
|
Income tax expense
|
$ | 8,274 | $ | 6,820 | $ | 4,539 | ||||||
Total tax expense for fiscal 2016 was $8.6 million, of which $8.3 million was allocated to continuing operations and $277,000 was allocated to other comprehensive income. Total tax expense for fiscal 2015 was $6.6 million, of which $6.8 million was allocated to continuing operations and $254,000 benefit was allocated to other comprehensive income. Total tax expense for fiscal 2014 was $4.5 million, of which $4.5 million was allocated to continuing operations and $59,000 benefit was allocated to Other Comprehensive Income.
Notes to Consolidated Financial Statements - Continued
(Tables in thousands, except per share data)
The effective income tax rate differed from the federal statutory tax rate as follows for the periods indicated:
|
Fifty-Two
|
Fifty-Two
|
Fifty-Two
|
||||||||||
|
Weeks Ended
|
Weeks Ended
|
Weeks Ended
|
||||||||||
|
January 31,
|
February 1,
|
February 2,
|
||||||||||
|
2016
|
2015
|
2014
|
||||||||||
|
Income taxes at statutory rate
|
35.0 | % | 35.0 | % | 34.0 | % | ||||||
|
Increase (decrease) in tax rate resulting from:
|
||||||||||||
|
State taxes, net of federal benefit
|
2.1 | 2.0 | 2.1 | |||||||||
|
Domestic Production Deduction
|
(0.6 | ) | - | - | ||||||||
|
Officer's life insurance
|
(1.1 | ) | (1.2 | ) | (1.8 | ) | ||||||
|
Other, net
|
(1.6 | ) | (0.6 | ) | 2.1 | |||||||
|
Effective income tax rate
|
33.8 | % | 35.2 | % | 36.4 | % | ||||||
The tax effects of temporary differences that give rise to significant portions of the deferred tax assets and liabilities for the period indicated were:
|
January 31,
|
February 1,
|
|||||||
|
2016
|
2015
|
|||||||
|
Assets
|
||||||||
|
Deferred compensation
|
$ | 4,345 | $ | 4,120 | ||||
|
Allowance for bad debts
|
380 | 492 | ||||||
|
State income taxes
|
43 | 8 | ||||||
|
Property, plant and equipment
|
- | 405 | ||||||
|
Intangible assets
|
703 | 524 | ||||||
|
Charitable contribution carryforward
|
- | 246 | ||||||
|
Inventories
|
158 | - | ||||||
|
Other
|
378 | 404 | ||||||
|
Total deferred tax assets
|
6,007 | 6,199 | ||||||
|
Valuation allowance
|
- | - | ||||||
| 6,007 | 6,199 | |||||||
|
Liabilities
|
||||||||
|
Employee benefits
|
256 | 362 | ||||||
|
Inventories
|
- | 143 | ||||||
|
Property, plant and equipment
|
321 | - | ||||||
|
Total deferred tax liabilities
|
577 | 505 | ||||||
|
Net deferred tax asset without AOCI
|
5,430 | 5,694 | ||||||
|
Deferred tax asset (liability) in AOCI
|
(80 | ) | 198 | |||||
|
Total net deferred tax asset
|
$ | 5,350 | $ | 5,892 | ||||
At January 31, 2016 and February 1, 2015 our net deferred tax asset was $5.4 million and $5.9 million, respectively. We expect to fully realize the benefit of the deferred tax assets in future periods when the amounts become deductible.
Notes to Consolidated Financial Statements - Continued
(Tables in thousands, except per share data)
At February 1, 2015, we had an uncertain tax position of $284,000 related to our investment in a captive insurance arrangement. The reserve decreased to $74,000 at January 31, 2016. Also, at February 1, 2015, we had a reserve of $142,000 for an uncertain tax position related to the use of state loss carryforwards in our tax returns. The balance of this reserve was $147,000 at January 31, 2016. We expect $55,000 of this uncertain tax position to be settled during the next twelve months.
Current accounting standards prescribe a recognition threshold and measurement attribute for the financial statement recognition and measurement of a tax position taken or expected to be taken in a tax return. The guidance also addresses de-recognition, classification, interest and penalties, accounting in interim periods and disclosures.
A reconciliation of the beginning and ending amount of total unrecognized tax benefits for the fiscal years ended January 31, 2016 and February 1, 2015 are as follows:
|
January 31,
|
February 1,
|
|||||||
|
2016
|
2015
|
|||||||
|
Balance, beginning of year
|
$ | 482 | $ | 359 | ||||
|
Increase related to prior year tax positions
|
- | 75 | ||||||
|
Decrease related to prior year tax positions
|
(203 | ) | - | |||||
|
Increase related to current year tax positions
|
- | 48 | ||||||
|
Balance, end of year
|
$ | 279 | $ | 482 | ||||
The net unrecognized tax benefits as of January 31, 2016, which, if recognized, would affect our effective tax rate are $221,000. We expect that $74,000 of gross unrecognized tax benefits will decrease within the next year.
We have elected to classify interest and penalties recognized with respect to unrecognized tax benefits as income tax expense. Interest expense of $12,000 and $26,000 was accrued as of January 31, 2016 and February 1, 2015, respectively.
Tax years ending January 30, 2013, through January 31, 2016 remain subject to examination by federal and state taxing authorities. An examination of the fiscal 2013 with federal taxing authorities was completed during fiscal 2016 with no changes. An examination of our North Carolina state tax returns for fiscal year 2012 and 2013 is underway with the North Carolina Department of Revenue.
Notes to Consolidated Financial Statements - Continued
(Tables in thousands, except per share data)
NOTE 14 – SEGMENT INFORMATION
For financial reporting purposes, we are organized into three operating segments – casegoods furniture, upholstered furniture and an “All Other” segment, which includes H Contract and Homeware. The following table presents segment information for the periods, and as of the dates, indicated:
|
Fifty-Two Weeks Ended
|
Fifty-Two Weeks Ended
|
Fifty-Two Weeks Ended
|
||||||||||||||||||||||
|
January 31, 2016
|
February 1, 2015
|
February 2, 2014
|
||||||||||||||||||||||
|
% Net
|
% Net
|
% Net
|
||||||||||||||||||||||
|
Net Sales
|
Sales
|
Sales
|
Sales
|
|||||||||||||||||||||
|
Casegoods
|
$ | 155,106 | 62.8 | % | $ | 153,882 | 63.0 | % | $ | 143,802 | 63.0 | % | ||||||||||||
|
Upholstery
|
84,090 | 34.0 | % | 86,362 | 35.3 | % | 83,027 | 36.4 | % | |||||||||||||||
|
All other
|
8,033 | 3.3 | % | 5,025 | 2.1 | % | 1,487 | 0.7 | % | |||||||||||||||
|
Intercompany eliminations
|
(230 | ) | (919 | ) | (23 | ) | ||||||||||||||||||
|
Consolidated
|
$ | 246,999 | 100.0 | % | $ | 244,350 | 100.0 | % | $ | 228,293 | 100.0 | % | ||||||||||||
|
Gross Profit
|
||||||||||||||||||||||||
|
Casegoods
|
$ | 47,558 | 30.7 | % | $ | 44,868 | 29.2 | % | $ | 38,762 | 27.0 | % | ||||||||||||
|
Upholstery
|
18,852 | 22.4 | % | 16,489 | 19.1 | % | 15,393 | 18.5 | % | |||||||||||||||
|
All other
|
2,252 | 28.0 | % | 1,465 | 29.2 | % | 588 | 39.5 | % | |||||||||||||||
|
Intercompany eliminations
|
26 | (22 | ) | (18 | ) | |||||||||||||||||||
|
Consolidated
|
$ | 68,688 | 27.8 | % | $ | 62,800 | 25.7 | % | $ | 54,725 | 24.0 | % | ||||||||||||
|
Operating Income
|
||||||||||||||||||||||||
|
Casegoods
|
$ | 18,509 | 11.9 | % | $ | 17,286 | 11.2 | % | $ | 12,150 | 8.4 | % | ||||||||||||
|
Upholstery
|
6,020 | 7.2 | % | 2,871 | 3.3 | % | 1,913 | 2.3 | % | |||||||||||||||
|
All other
|
(293 | ) | -3.6 | % | (1,087 | ) | -21.6 | % | (1,542 | ) | -103.7 | % | ||||||||||||
|
Intercompany eliminations
|
26 | (22 | ) | (18 | ) | |||||||||||||||||||
|
Consolidated
|
$ | 24,262 | 9.8 | % | $ | 19,048 | 7.8 | % | $ | 12,503 | 5.5 | % | ||||||||||||
|
Capital Expenditures
|
||||||||||||||||||||||||
|
Casegoods
|
$ | 2,219 | $ | 2,124 | $ | 2,489 | ||||||||||||||||||
|
Upholstery
|
621 | 830 | 982 | |||||||||||||||||||||
|
All other
|
7 | 40 | - | |||||||||||||||||||||
|
Consolidated
|
$ | 2,847 | $ | 2,994 | $ | 3,471 | ||||||||||||||||||
|
Depreciation
& Amortization
|
||||||||||||||||||||||||
|
Casegoods
|
$ | 1,808 | $ | 1,591 | $ | 1,551 | ||||||||||||||||||
|
Upholstery
|
1,126 | 1,005 | 940 | |||||||||||||||||||||
|
All other
|
12 | 3 | - | |||||||||||||||||||||
|
Consolidated
|
$ | 2,946 | $ | 2,599 | $ | 2,491 | ||||||||||||||||||
|
As of January 31,
|
As of February 1,
|
|||||||||||||||||||||||
| 2016 |
%Total
|
2015 |
%Total
|
|||||||||||||||||||||
|
Total Assets
|
Assets
|
Assets
|
||||||||||||||||||||||
|
Casegoods
|
$ | 146,794 | 80.8 | % | $ | 135,403 | 79.3 | % | ||||||||||||||||
|
Upholstery
|
34,010 | 18.7 | % | 33,788 | 19.8 | % | ||||||||||||||||||
|
All other
|
863 | 0.5 | % | 1,605 | 0.9 | % | ||||||||||||||||||
|
Intercompany eliminations
|
(14 | ) | (41 | ) | ||||||||||||||||||||
|
Consolidated
|
$ | 181,653 | 100.0 | % | $ | 170,755 | 100.0 | % | ||||||||||||||||
No significant long-lived assets were held outside the United States at either January 31, 2016 or February 2, 2014. International customers accounted for approximately 5% of consolidated invoiced sales in fiscal 2016 and approximately 6% of consolidated net sales in both fiscal 2015 and fiscal 2014.
Notes to Consolidated Financial Statements - Continued
(Tables in thousands, except per share data)
NOTE 15 – COMMITMENTS, CONTINGENCIES AND OFF BALANCE SHEET ARRANGEMENTS
Customs Penalty
In September 2009, U.S. Customs and Border Protection (“CBP”) issued an audit report asserting that we had not paid all required antidumping duties due with respect to certain bedroom furniture we imported from China. In February 2015, CBP assessed a civil penalty of approximately $2.1 million and unpaid duties of approximately $500,000 on the matter. In December 2015, in response to our petition to eliminate or modify the assessment, CBP revised the proposed penalty to approximately $1.7 million, while leaving the duty assessment at approximately $500,000. We continue to assert that no antidumping duties are due and that there is no basis for the imposition of a penalty. We intend to vigorously defend against the penalty. In the opinion of management, the ultimate disposition of this matter will not have a material adverse effect on our consolidated financial position, results of operations, or liquidity.
Commitments and Off Balance Sheet Arrangements
We lease warehousing facilities, showroom space and office equipment under leases expiring over the next five years. Rent expense was $3.1 million in fiscal 2016, $2.8 million in fiscal 2015 and $2.3 million in fiscal 2014. Future minimum annual commitments under leases and operating agreements are $3.0 million in fiscal 2017, $1.7 million in fiscal 2018 and $1.4 million in each of fiscal 2019, fiscal 2020 and fiscal 2021.
We had letters of credit outstanding totaling $1.7 million on January 31, 2016. We utilize letters of credit to collateralize certain imported inventory purchases and certain insurance arrangements.
In the ordinary course of our business, we may become involved in legal proceedings involving contractual and employment relationships, product liability claims, intellectual property rights and a variety of other matters. We do not believe that any pending legal proceedings will have a material impact on our financial position or results of operations.
Our business is subject to a number of significant risks and uncertainties, including our reliance on offshore sourcing, any of which can adversely affect our business, results of operations, financial condition or future prospects. For a discussion of risks and uncertainties that we face, see “Forward Looking Statements” beginning on page 3 of this report and Item 1A, “Risk Factors” beginning on page 12 of this report.
Notes to Consolidated Financial Statements - Continued
(Tables in thousands, except per share data)
NOTE 16 – CONCENTRATIONS OF SOURCING RISK
We source imported products through approximately 18 different vendors, from approximately 20 separate factories, located in five countries. Because of the large number and diverse nature of the foreign factories from which we can source our imported products, we have some flexibility in the placement of products in any particular factory or country.
Factories located in China and Vietnam are a critical resource for Hooker Furniture. In fiscal year 2016, imported products sourced from China and Vietnam accounted for 68% and 26%, respectively, of import purchases, and the factory in China from which we directly source the most product accounted for 58% of our worldwide purchases of imported product. A disruption in our supply chain from this factory, or from China or Vietnam in general, could significantly impact our ability to fill customer orders for products manufactured at that factory or in that country.
NOTE 17 – CONSOLIDATED QUARTERLY DATA (Unaudited- see accompanying accountant’s report.)
|
Fiscal Quarter
|
||||||||||||||||
|
First
|
Second
|
Third
|
Fourth
|
|||||||||||||
|
2016
|
||||||||||||||||
|
Net sales
|
$ | 60,956 | $ | 60,140 | $ | 65,338 | $ | 60,565 | ||||||||
|
Cost of sales
|
44,581 | 44,047 | 47,173 | 42,510 | ||||||||||||
|
Gross profit
|
16,375 | 16,093 | 18,165 | 18,055 | ||||||||||||
|
Selling and administrative expenses
|
11,133 | 10,234 | 11,525 | 11,534 | ||||||||||||
|
Net income
|
3,472 | 3,938 | 4,630 | 4,145 | ||||||||||||
|
Basic earnings per share
|
$ | 0.32 | $ | 0.36 | $ | 0.43 | $ | 0.38 | ||||||||
|
Diluted earnings per share
|
$ | 0.32 | $ | 0.36 | $ | 0.43 | $ | 0.38 | ||||||||
|
2015
|
||||||||||||||||
|
Net sales
|
$ | 61,396 | $ | 54,883 | $ | 63,168 | $ | 64,903 | ||||||||
|
Cost of sales
|
45,786 | 41,226 | 47,137 | 47,401 | ||||||||||||
|
Gross profit
|
15,610 | 13,657 | 16,031 | 17,502 | ||||||||||||
|
Selling and administrative expenses
|
11,367 | 10,243 | 11,148 | 10,994 | ||||||||||||
|
Net income
|
2,804 | 2,272 | 3,204 | 4,298 | ||||||||||||
|
Basic earnings per share
|
$ | 0.26 | $ | 0.21 | $ | 0.30 | $ | 0.40 | ||||||||
|
Diluted earnings per share
|
$ | 0.26 | $ | 0.21 | $ | 0.30 | $ | 0.40 |
Earnings per share for each fiscal quarter is derived using the weighted average number of shares outstanding during that quarter. Earnings per share for each fiscal year is derived using the weighted average number of shares outstanding on an annual basis. Consequently, the sum of earnings per share for the quarters of a fiscal year may not equal earnings per share for the full fiscal year.
Notes to Consolidated Financial Statements - Continued
(Tables in thousands, except per share data)
NOTE 18 – SUBSEQUENT EVENTS
Acquisition of Home Meridian International
On February 1, 2016, we completed the previously announced acquisition (the “Acquisition”) of substantially all of the assets of Home Meridian International, Inc. (“Home Meridian”) pursuant to the Asset Purchase Agreement into which we and Home Meridian entered on January 5, 2016 (the “Asset Purchase Agreement”). Upon completion, we paid $85 million in cash and issued 716,910 shares of our common stock (the “Stock Consideration”) to designees of Home Meridian as consideration for the Acquisition. The Stock Consideration consisted of (i) 530,598 shares due to the $15 million of consideration payable in shares of our common stock under the Asset Purchase Agreement, and (ii) 186,312 shares issued pursuant to working capital adjustments detailed in the Asset Purchase Agreement. The working capital adjustment was driven by an increase in HMI’s accounts receivable due to strong sales towards the end of 2015. The number of shares of common stock issued at closing for the Stock Consideration was determined by reference to the mean closing price of our common stock for the fifteen trading days immediately preceding the closing date ($28.27). Under the Asset Purchase Agreement, we also assumed certain liabilities of Home Meridian, including approximately $7.8 million of liabilities related to certain retirement plans. The assumed liabilities did not include the indebtedness (as defined in the Asset Purchase Agreement) of Home Meridian.
Also on February 1, 2016, we entered into an amended and restated loan agreement (the “Loan Agreement”) with Bank of America, N.A. (“BofA”) in connection with the completion of this acquisition. The Loan Agreement increases the amount available under our existing unsecured revolving credit facility to $30 million and increases the sublimit of such facility available for the issuance of letters of credit to $4 million. Amounts outstanding under the revolving facility will bear interest at a rate, adjusted monthly, equal to the then current LIBOR monthly rate plus 1.50%. We must also pay a quarterly unused commitment fee that is based on the average daily amount of the facility utilized during the applicable quarter.
The Loan Agreement also provides us with a $41 million unsecured term loan (the “Unsecured Term Loan”) and a $19 million term loan (the “Secured Term Loan”) secured by a security interest in certain Company-owned life insurance policies granted to BofA under a security agreement, dated as of February 1, 2016 (the “Security Agreement”). BofA’s rights under the Security Agreement are enforceable upon the occurrence of an event of default under the Loan Agreement. Any amount borrowed under the Unsecured Term Loan will bear interest at a rate, adjusted monthly, equal to the then current LIBOR monthly rate plus 1.50%. Any amount borrowed under the Secured Term Loan will bear interest at a rate, adjusted monthly, equal to the then current LIBOR monthly rate plus 0.50%. We must repay any principal amount borrowed under Unsecured Term Loan in monthly installments of approximately $490,000, together with any accrued interest, until the full amount borrowed is repaid or until February 1, 2021, at which time all amounts outstanding under the Unsecured Term Loan will become due and payable. We must pay the interest accrued on any principal amount borrowed under the Secured Term Loan on a monthly basis until the full principal amount borrowed is repaid or until February 1, 2021, at which time all amounts outstanding under the Secured Term Loan will become due and payable. We may prepay any outstanding principal amounts borrowed under either the Unsecured Term Loan or the Secured Term Loan in full or in part on any interest payment date without penalty. On February 1, 2016, we borrowed in full the amounts available under the Unsecured Term Loan and the Secured Term Loan in connection with the completion of this acquisition.
The Loan Agreement includes customary representations and warranties and requires us to comply with certain customary covenants, including, among other things, the following financial covenants: (i) maintaining at least a specified minimum level of tangible net worth, (ii) maintaining a ratio of funded debt to EBITDA not exceeding a specified amount and (iii) maintaining a basic fixed charge coverage ratio within a specified range. The Loan Agreement also limits our right to incur other indebtedness and to create liens upon our assets, subject to certain exceptions, among other restrictions. The Loan Agreement does not restrict our ability to pay cash dividends on, or repurchase, shares of our common stock, subject to our compliance with the financial covenants discussed above, if we are not otherwise in default under the Loan Agreement.
Notes to Consolidated Financial Statements - Continued
(Tables in thousands, except per share data)
Since the closing date we have made unscheduled payments of $5.0 million on the Unsecured Term Loan and $1.8 million on the Secured Term Loan, in addition to the regularly scheduled debt service payments required by the Loan agreement.
Pro forma consolidated net sales and net income for the combined entity are estimated to be $571 million and $22.5 million, respectively, for the year ended January 31, 2016. These pro forma estimates assume the transaction took place on February 2, 2015, the beginning of Hooker Furniture’s 2016 fiscal year, which end on January 31, 2016. The pro forma net sales and net earnings estimates include estimates for interest expense related to the Bank of America Acquisition Credit Facility and amortization expense of identified intangible assets, net of the elimination of historical amortization of Home Meridian intangible assets. The pro forma net sales and net earnings estimates exclude non-recurring transaction related costs from the statement of operations of both companies and interest expense paid by Home Meridian under its former credit agreement.
Fair Value Estimates of Assets Acquired and Liabilities Assumed
The consideration and components of Hooker Furniture’s initial fair value allocation of the purchase price paid at closing and in the subsequent Net Working Capital Adjustment consisted of the following:
|
Fair value estimates of assets acquired and liabilities assumed
|
||||
|
Purchase price consideration
|
||||
|
Cash paid for assets acquired
|
$ | 85,000 | ||
|
Value of shares issued for assets acquired
|
15,000 | |||
|
Value of shares issued for excess net working capital
|
5,267 | |||
|
Cash paid for net working capital adjustment
|
995 | |||
|
Total purchase price
|
$ | 106,262 | ||
|
Accounts receivable
|
$ | 45,360 | ||
|
Inventory
|
37,607 | |||
|
Prepaid expenses and other current assets
|
2,045 | |||
|
Property and equipment
|
5,814 | |||
|
Intangible assets
|
28,800 | |||
|
Goodwill
|
21,023 | |||
|
Accounts payable and accrued expenses
|
(18,948 | ) | ||
|
Accrued expenses
|
(6,783 | ) | ||
|
Pension plan and deferred compensation liabilities
|
(8,656 | ) | ||
|
Total purchase price
|
$ | 106,262 | ||
Substantially all of these amounts are subject to subsequent adjustment as we continue to gather information during the measurement period. Certain intangible assets were acquired as part this transaction. Trade names, customer relationships, and order backlog have been assigned preliminary fair values subject to additional analysis during the measurement period. Some of these intangible assets have been assigned useful lives while others have been determined to be indefinite-lived.
Notes to Consolidated Financial Statements - Continued
(Tables in thousands, except per share data)
We have not yet determined the composition of our operating segments for the combined entity. We expect to be able to deduct goodwill for income tax purposes; however, book and tax goodwill may differ due to differences in book and tax capitalization rules.
Cash Dividend
On March 1, 2016, our Board of Directors declared a quarterly cash dividend of $0.10 per share, payable on March 31, 2016 to shareholders of record at March 15, 2016.
F-31