Attached files
| file | filename |
|---|---|
| 8-K - 8-K - Horsehead Holding Corp | d180762d8k.htm |
Exhibit 99.1
|
|
Exhibit 99.1
HORSEHEAD CORPORATION Leading the world in Zinc Recyling Horsehead Corp – Blowout Materials April 12, 2016
|
|
| 2 |
|
Revised Business Plan Summary HORSEHEAD CORPORATION |
|
|
Business Plan Development Process Business Plan was developed based on a refresh of the December financial forecasts to reflect January and February actuals, a number of key operating changes, as well as an update of key assumptions with regard to zinc pricing, costs etc. The Plan was developed with two scenarios, one with Mooresboro restarting ramping up production (the “Ramp-Up” scenario) and one with Mooresboro in an idle state (the “Idle” scenario) – Primary difference in the Business Plan, as compared to the December plan, is investment plan for the Mooresboro facility and assumptions around commodity prices When the initial plan was developed, Mooresboro was still operational and as such the Company’s capital spend plan was phased differently – The Ramp-Up scenario assumes Mooresboro remains idled during Phase 1 (12 months) of the capital plan and the Company would sell Wox / Calcine. The capital investment during Phase 1 would allow an accelerated ramp up of production upon restart Mooresboro production to full capacity during 2018 & H1 2019 with subsequent cost improvements implemented in years H2 2019 & 2020 Capital plan reflects 20% contingency ($16MM) on non-anode, non-cathode investment – Management also developed an Idle scenario which contemplates the Mooresboro facility remaining idled, putting it on care and maintenance spending, and continuing to sell the full WOX/Calcine output of the EAF dust recycling facilities – Updated commodity price assumptions based upon consensus forecasts for projection period LME zinc $0.80 / $0.89 / $1.00 / $1.00 / $1.00; prior forecast utilized $0.80 / $1.00 / $1.00 LME nickel $4.38 / $5.06 / $6.06 / $7.14 / $7.93 ; prior forecast utilized $4.00 / $6.82 / $6.82 – Business Plan incorporates ~2% cost inflation per year INMETCO – continuous improvement as nickel prices recover Zochem – modest investment in additional bag house capacity permits higher production, margin improvements expected from transportation cost reduction initiatives and portfolio management of customer mix Public company expense removed from SG&A 3 HORSEHEAD CORPORATION
|
|
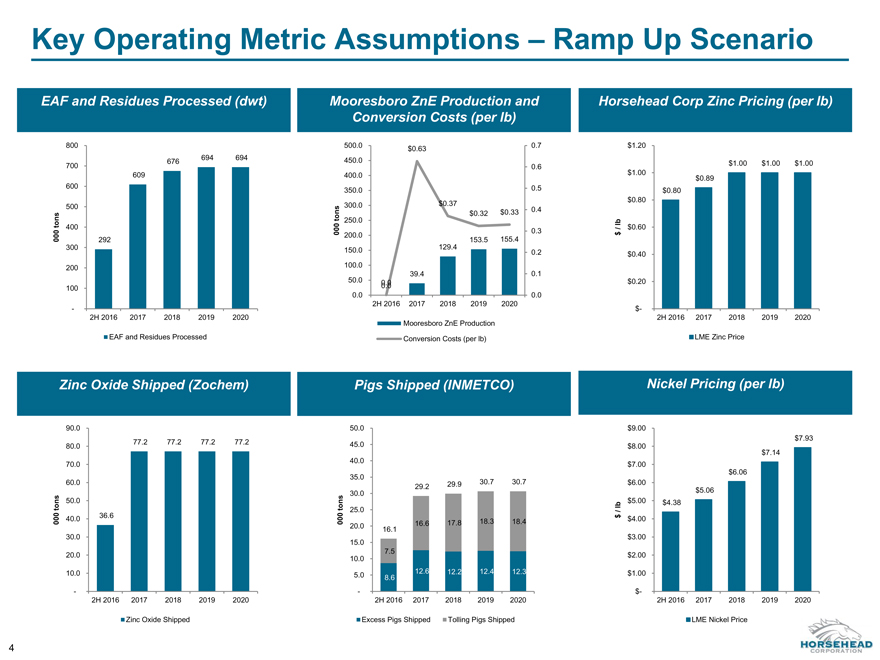
Key Operating Metric Assumptions – Ramp Up Scenario EAF and Residues Processed (dwt) Mooresboro ZnE Production and Conversion Costs (per lb) Zinc Oxide Shipped (Zochem) Horsehead Corp Zinc Pricing (per lb) 4 Pigs Shipped (INMETCO) Nickel Pricing (per lb) 292 609 676 694 694—100 200 300 400 500 600 700 800 2H 2016 2017 2018 2019 2020 000 tons EAF and Residues Processed 0.0 39.4 129.4 153.5 155.4 0.0 $0.63 $0.37 $0.32 $0.33 0.0 0.1 0.2 0.3 0.4 0.5 0.6 0.7 0.0 50.0 100.0 150.0 200.0 250.0 300.0 350.0 400.0 450.0 500.0 2H 2016 2017 2018 2019 2020 000 tons Mooresboro ZnE Production Conversion Costs (per lb) $0.80 $0.89 $1.00 $1.00 $1.00 $- $0.20 $0.40 $0.60 $0.80 $1.00 $1.20 2H 2016 2017 2018 2019 2020 $ / lb LME Zinc Price 36.6 77.2 77.2 77.2 77.2—10.0 20.0 30.0 40.0 50.0 60.0 70.0 80.0 90.0 2H 2016 2017 2018 2019 2020 000 tons Zinc Oxide Shipped 8.6 12.6 12.2 12.4 12.3 7.5 16.6 17.8 18.3 18.4 16.1 29.2 29.9 30.7 30.7—5.0 10.0 15.0 20.0 25.0 30.0 35.0 40.0 45.0 50.0 2H 2016 2017 2018 2019 2020 000 tons Excess Pigs Shipped Tolling Pigs Shipped $4.38 $5.06 $6.06 $7.14 $7.93 $- $1.00 $2.00 $3.00 $4.00 $5.00 $6.00 $7.00 $8.00 $9.00 2H 2016 2017 2018 2019 2020 $ / lb LME Nickel Price HORSEHEAD CORPORATION
|
|
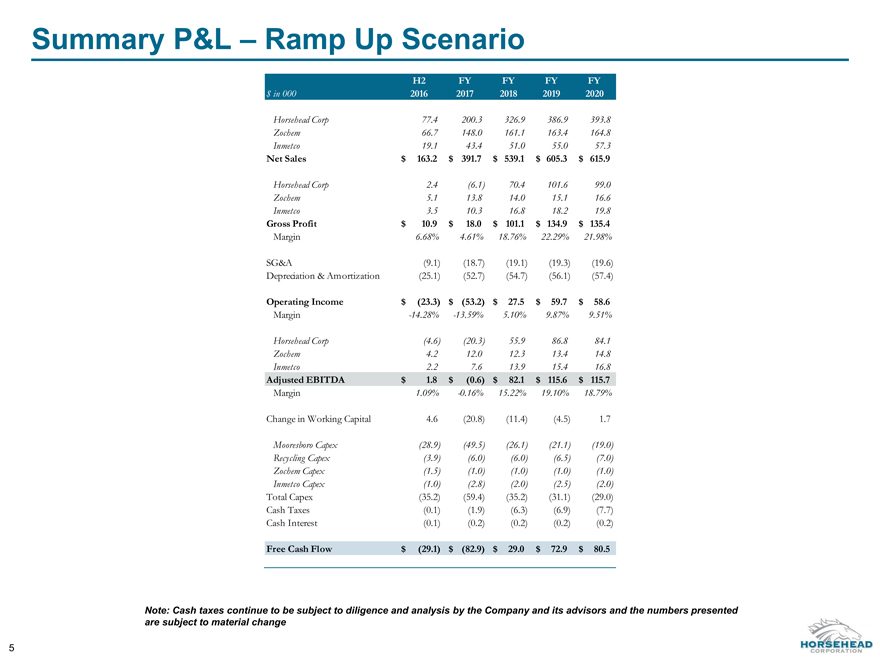
Summary P&L – Ramp Up Scenario 5 Note: Cash taxes continue to be subject to diligence and analysis by the Company and its advisors and the numbers presented are subject to material change H2 FY FY FY FY $ in 000 2016 2017 2018 2019 2020 Horsehead Corp 77.4 200.3 326.9 386.9 393.8 Zochem 66.7 148.0 161.1 163.4 164.8 Inmetco 19.1 43.4 51.0 55.0 57.3 Net Sales $ 163.2 $ 391.7 $ 539.1 $ 605.3 $ 615.9 Horsehead Corp 2.4 (6.1) 70.4 101.6 99.0 Zochem 5.1 13.8 14.0 15.1 16.6 Inmetco 3.5 10.3 16.8 18.2 19.8 Gross Profit $ 10.9 $ 18.0 $ 101.1 $ 134.9 $ 135.4 Margin 6.68% 4.61% 18.76% 22.29% 21.98% SG&A (9.1) (18.7) (19.1) (19.3) (19.6) Depreciation & Amortization (25.1) (52.7) (54.7) (56.1) (57.4) Operating Income $ (23.3) $ (53.2) $ 27.5 $ 59.7 $ 58.6 Margin -14.28% -13.59% 5.10% 9.87% 9.51% Horsehead Corp (4.6) (20.3) 55.9 86.8 84.1 Zochem 4.2 12.0 12.3 13.4 14.8 Inmetco 2.2 7.6 13.9 15.4 16.8 Adjusted EBITDA $ 1.8 $ (0.6) $ 82.1 $ 115.6 $ 115.7 Margin 1.09% -0.16% 15.22% 19.10% 18.79% Change in Working Capital 4.6 (20.8) (11.4) (4.5) 1.7 Mooresboro Capex (28.9) (49.5) (26.1) (21.1) (19.0) Recycling Capex (3.9) (6.0) (6.0) (6.5) (7.0) Zochem Capex (1.5) (1.0) (1.0) (1.0) (1.0) Inmetco Capex (1.0) (2.8) (2.0) (2.5) (2.0) Total Capex (35.2) (59.4) (35.2) (31.1) (29.0) Cash Taxes (0.1) (1.9) (6.3) (6.9) (7.7) Cash Interest (0.1) (0.2) (0.2) (0.2) (0.2) Free Cash Flow $ (29.1) $ (82.9) $ 29.0 $ 72.9 $ 80.5 HORSEHEAD CORPORATION
|
|
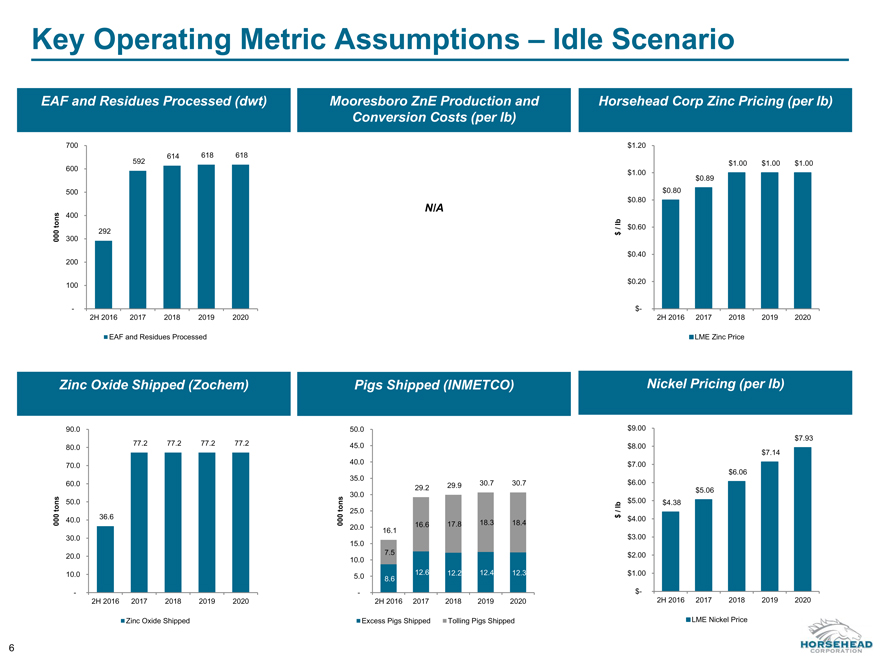
Key Operating Metric Assumptions – Idle Scenario EAF and Residues Processed (dwt) Mooresboro ZnE Production and Conversion Costs (per lb) Zinc Oxide Shipped (Zochem) Horsehead Corp Zinc Pricing (per lb) 6 Pigs Shipped (INMETCO) Nickel Pricing (per lb) N/A 292 592 614 618 618—100 200 300 400 500 600 700 2H 2016 2017 2018 2019 2020 000 tons EAF and Residues Processed $0.80 $0.89 $1.00 $1.00 $1.00 $- $0.20 $0.40 $0.60 $0.80 $1.00 $1.20 2H 2016 2017 2018 2019 2020 $ / lb LME Zinc Price 36.6 77.2 77.2 77.2 77.2—10.0 20.0 30.0 40.0 50.0 60.0 70.0 80.0 90.0 2H 2016 2017 2018 2019 2020 000 tons Zinc Oxide Shipped 8.6 12.6 12.2 12.4 12.3 7.5 16.6 17.8 18.3 18.4 16.1 29.2 29.9 30.7 30.7—5.0 10.0 15.0 20.0 25.0 30.0 35.0 40.0 45.0 50.0 2H 2016 2017 2018 2019 2020 000 tons Excess Pigs Shipped Tolling Pigs Shipped $4.38 $5.06 $6.06 $7.14 $7.93 $- $1.00 $2.00 $3.00 $4.00 $5.00 $6.00 $7.00 $8.00 $9.00 2H 2016 2017 2018 2019 2020 $ / lb LME Nickel Price HORSEHEAD CORPORATION
|
|
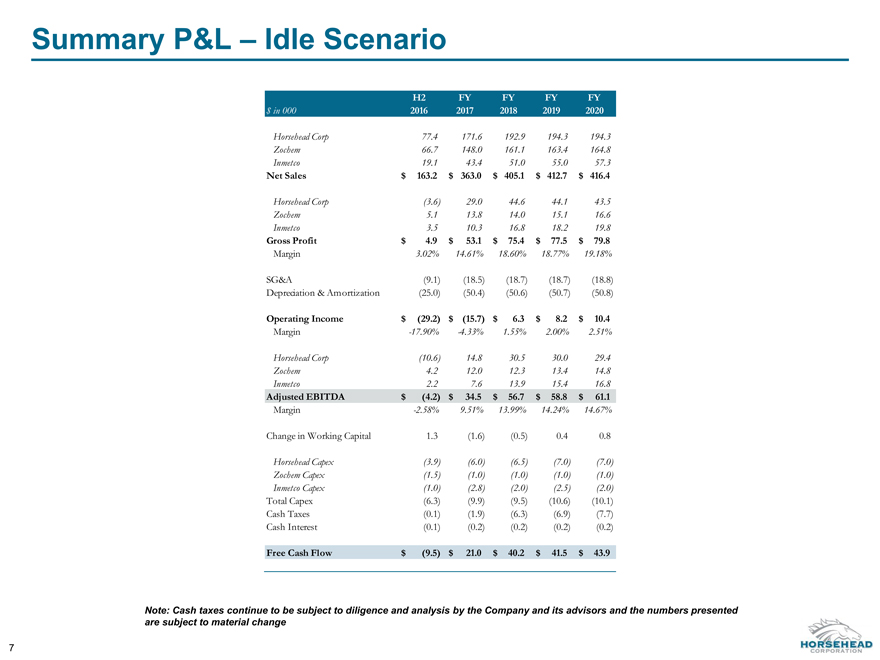
Summary P&L – Idle Scenario 7 Note: Cash taxes continue to be subject to diligence and analysis by the Company and its advisors and the numbers presented are subject to material change H2 FY FY FY FY $ in 000 2016 2017 2018 2019 2020 Horsehead Corp 77.4 171.6 192.9 194.3 194.3 Zochem 66.7 148.0 161.1 163.4 164.8 Inmetco 19.1 43.4 51.0 55.0 57.3 Net Sales $ 163.2 $ 363.0 $ 405.1 $ 412.7 $ 416.4 Horsehead Corp (3.6) 29.0 44.6 44.1 43.5 Zochem 5.1 13.8 14.0 15.1 16.6 Inmetco 3.5 10.3 16.8 18.2 19.8 Gross Profit $ 4.9 $ 53.1 $ 75.4 $ 77.5 $ 79.8 Margin 3.02% 14.61% 18.60% 18.77% 19.18% SG&A (9.1) (18.5) (18.7) (18.7) (18.8) Depreciation & Amortization (25.0) (50.4) (50.6) (50.7) (50.8) Operating Income $ (29.2) $ (15.7) $ 6.3 $ 8.2 $ 10.4 Margin -17.90% -4.33% 1.55% 2.00% 2.51% Horsehead Corp (10.6) 14.8 30.5 30.0 29.4 Zochem 4.2 12.0 12.3 13.4 14.8 Inmetco 2.2 7.6 13.9 15.4 16.8 Adjusted EBITDA $ (4.2) $ 34.5 $ 56.7 $ 58.8 $ 61.1 Margin -2.58% 9.51% 13.99% 14.24% 14.67% Change in Working Capital 1.3 (1.6) (0.5) 0.4 0.8 Horsehead Capex (3.9) (6.0) (6.5) (7.0) (7.0) Zochem Capex (1.5) (1.0) (1.0) (1.0) (1.0) Inmetco Capex (1.0) (2.8) (2.0) (2.5) (2.0) Total Capex (6.3) (9.9) (9.5) (10.6) (10.1) Cash Taxes (0.1) (1.9) (6.3) (6.9) (7.7) Cash Interest (0.1) (0.2) (0.2) (0.2) (0.2) Free Cash Flow $ (9.5) $ 21.0 $ 40.2 $ 41.5 $ 43.9 HORSEHEAD CORPORATION
|
|
| 8 |
|
Mooresboro Capital Plan and Restart HORSEHEAD CORPORATION |
|
|
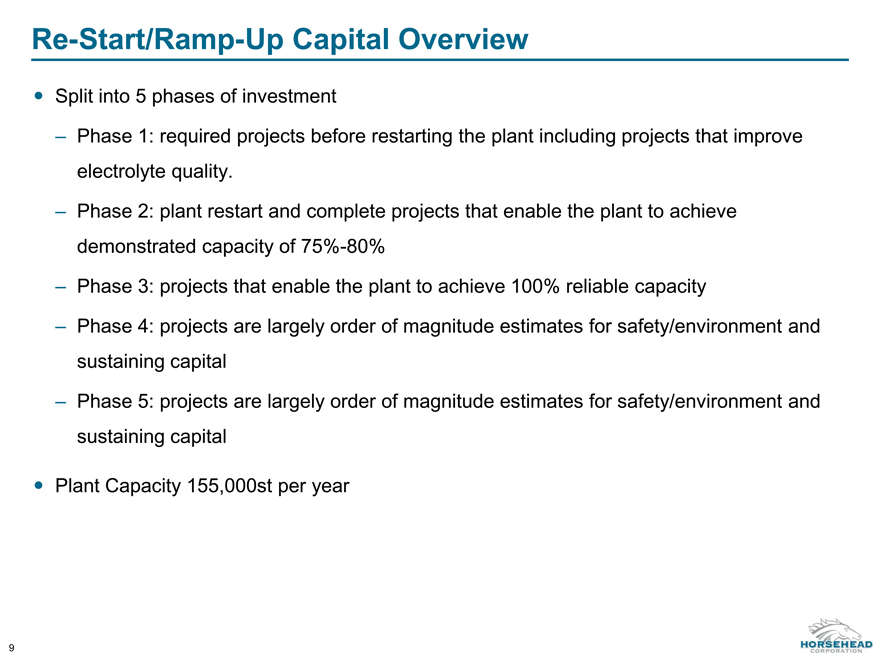
Re-Start/Ramp-Up Capital Overview Split into 5 phases of investment – Phase 1: required projects before restarting the plant including projects that improve electrolyte quality. – Phase 2: plant restart and complete projects that enable the plant to achieve demonstrated capacity of 75%-80% – Phase 3: projects that enable the plant to achieve 100% reliable capacity – Phase 4: projects are largely order of magnitude estimates for safety/environment and sustaining capital – Phase 5: projects are largely order of magnitude estimates for safety/environment and sustaining capital Plant Capacity 155,000st per year 9 HORSEHEAD CORPORATION
|
|
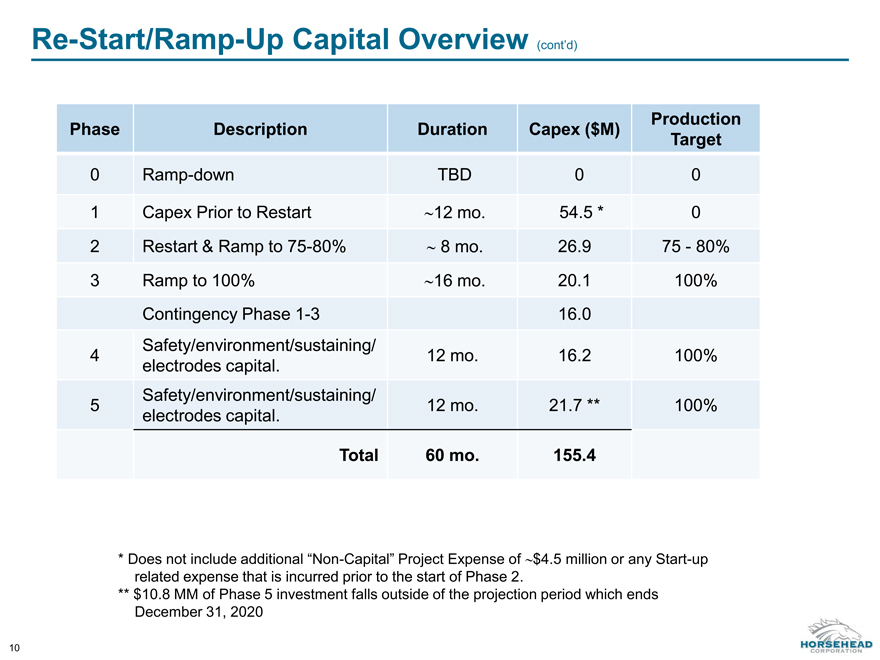
Re-Start/Ramp-Up Capital Overview (cont’d) 10 Phase Description Duration Capex ($M) Production Target 0 Ramp-down TBD 0 0 1 Capex Prior to Restart 12 mo. 54.5 * 0 2 Restart & Ramp to 75-80% 8 mo. 26.9 75—80% 3 Ramp to 100% 16 mo. 20.1 100% Contingency Phase 1-3 16.0 4 Safety/environment/sustaining/ electrodes capital. 12 mo. 16.2 100% 5 Safety/environment/sustaining/ electrodes capital. 12 mo. 21.7 ** 100% Total 60 mo. 155.4 * Does not include additional “Non-Capital” Project Expense of $4.5 million or any Start-up related expense that is incurred prior to the start of Phase 2. ** $10.8 MM of Phase 5 investment falls outside of the projection period which ends December 31, 2020 HORSEHEAD CORPORATION
|
|
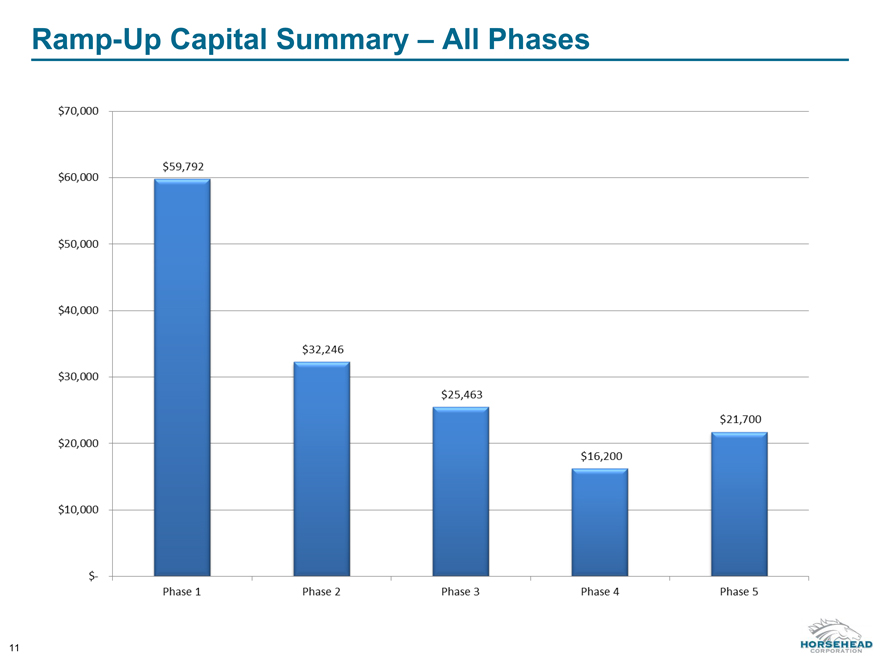
Ramp-Up Capital Summary – All Phases 11 HORSEHEAD CORPORATION $70,000
$60,000 $50,000 $40,000 $30,000 $20,000 $10,000 $59,792 $32,246 $25,463 $16,200 $21,700 $-
Phase 1 Phase 2 Phase 3 Phase 4 Phase 5
|
|
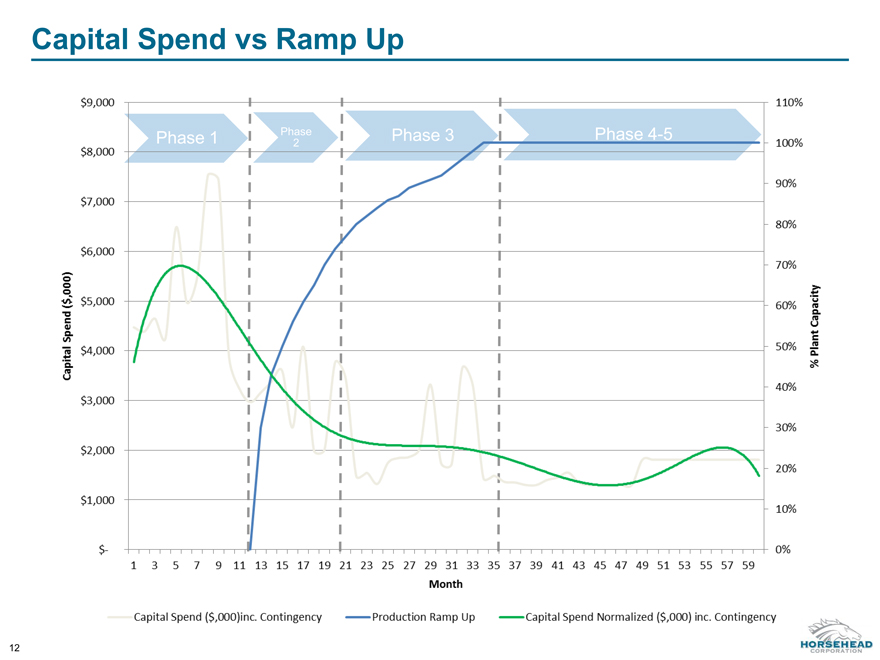
Phase 1 Phase Phase 4-5 2 Phase 3 Capital Spend vs Ramp Up 12 HORSEHEAD CORPORATION
$9,000 $8,000 $7,000 $6,000 $5,000 $4,000 $3,000 $2,000 $1,000 $- Capital
Spend ($,000) 0% 10% 20% 30% 40% 50% 60% 70% 80% 90% 100% 110% 1 3 5 7 9 11 13 15 17 19 21 23 25 27 29 31 33 35 37 39 41 43 45 47 49 51 53 55 57 59 Capital Spend ($,000) inc. Contingency Production Ramp Up Capital Spend Normalized ($,000) inc. Contingency % Plant Capacity
|
|
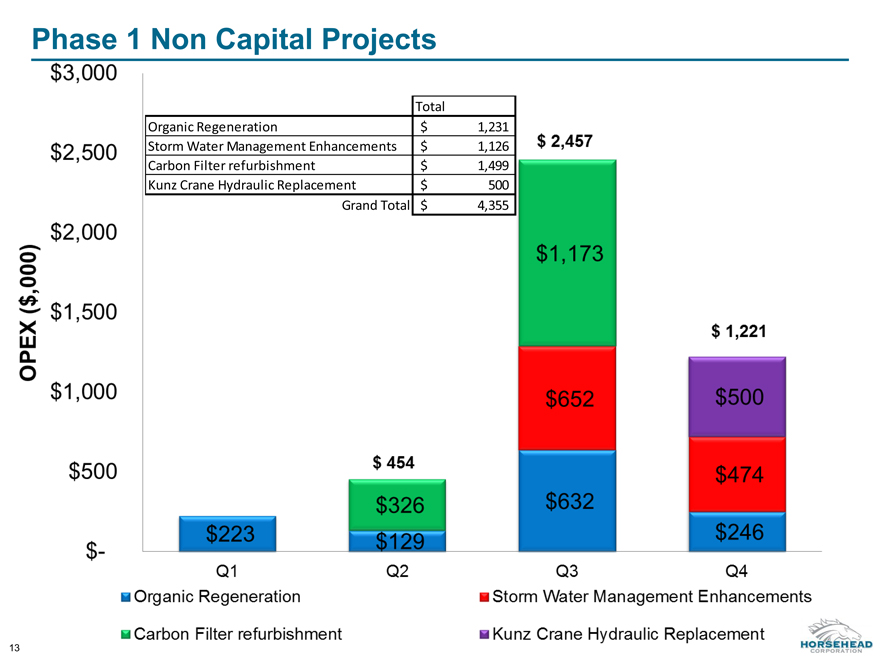
Phase 1 Non Capital Projects 13 Total Organic Regeneration $ 1,231 Storm Water Management Enhancements $ 1,126 Carbon Filter refurbishment $ 1,499 Kunz Crane Hydraulic Replacement $ 500 Grand Total $ 4,355 HORSEHEAD CORPORATION $3,000 $2,500 $2,000 $1,500 $1,000 $500 $- S223 $454 $326 $129 $2,457 $1,173 $652 $632 $1,221 $500 $474 $246 Q1 Q2 Q3 Q4 Organic Regeneration Carbon Filter refurbishment Kunz Crane Hydraulic Replacement OPEX ($,000) Storm Water Management Enhancements