Attached files
| file | filename |
|---|---|
| 8-K - CURRENT REPORT - Virginia National Bankshares Corp | vnb_8k.htm |
Exhibit 99.1
![]()
INVESTOR UPDATE
April 13, 2016
Dear Fellow Shareholders:
On behalf of the Board of Directors and the management team of Virginia National Bankshares Corporation (the Company), I am pleased to provide an update on the Company’s performance for the year ending December 31, 2015.
Last year, I stated “The after-shock of the recession changed community banking dynamics and financials forever. A big bank now has $200 billion in assets, and a mega bank holding company has a trillion dollars in assets.” The number of banks continues to shrink, especially those under $500 million in assets, while mega bank mergers are almost nonexistent. Many rural banks around the country are beginning their expansion into larger towns and cities in hopes of creating additional loan demand. Simultaneously, banks above $200 billion in assets are closing a significant number of branches in those same areas. This is simply another example of the ever-changing banking environment. It is my belief this shift will continue until equilibrium is reached in both rural areas and large cities. My guess is the total number of banks in this country will be reduced to about 5,000. Community banks that do not accept the new normal will likely see their Return on Assets (ROA) remain stagnant. Many will be purchased and become part of the ongoing historical rewrite of banking after the Great Recession. So how is our Company doing?
Virginia National Bank (the Bank) continued its march toward a 1% ROA by reducing expenses wherever possible, implementing technology solutions to streamline processes, and creating new products that will increase net-interest and non-interest income. It is important to increase earnings by growing existing income streams, creating new streams of income, and managing expenses. We expect to grow our market position, focusing on balanced deposit and loan growth. In 2015, we remained extremely competitive in our markets, which resulted in exceptional organic loan growth. While our net interest margin improved, it continued to be below the average of Virginia and national banks with assets of $100 million to $1 billion. This strategy was intentional in order to maintain our disciplined approach of attracting the highest quality credits. Lastly, our strategy is not dependent on the Federal Reserve’s monetary policy. This is the same position we took last year, and we are pleased with the Bank’s record earnings in 2015.
In 2015, VNBTrust, which operates under the trade name VNB Wealth Management created competitive pricing models for existing products in the marketplace and improved the average profitability of its relationships. The team added new clients in 2015, and VNB Wealth Management completed the purchase of a book of business early in 2016, which will add to the fixed fee revenue stream. It is important to note that 2015 was the last year of guaranteed bonuses, which were strategically used to retain valued personnel to stabilize the VNB Wealth Management team during its planned transition. The team is poised to grow the business and add to the profitability of the Company.
Completed and Ongoing Objectives.
| ● |
Capital Allocation Plan. The Company repurchased 288,497 shares under its Stock Repurchase Program through the end of 2015. In early 2016, the Company completed the purchase of a book of business under the VNBTrust charter. Future stock and asset purchases may be made when deemed advantageous. |
| ● |
Mortgage Division. The first full year of operations was completed in 2015, with enhancements made throughout the year designed to increase the profitability on the origination and sale of loans to the secondary market. This new line of business contributed to non-interest income, and as expected, created opportunities to grow portfolio mortgage loans, thereby increasing interest income. |
| ● |
Debit Card Security. The Bank began deploying EMV chip cards in late 2015 and will complete the conversion in the second quarter of 2016. This security enhancement is a continuation of our commitment to protect our customers and the Bank from fraud. |
| ● |
Return on Assets. In 2014, the Bank embarked upon a strategy to increase its return on assets, with the objective of achieving 1% by fiscal year end 2016. We made significant progress in 2015 toward achieving this goal through: |
| ○ |
A record year of organic loan growth, supplemented by loan purchase transactions of $36.4 million of privately insured student loans and $15.0 million in Shared National Credits. |
| ○ |
A reduction in expenses, particularly personnel expenses, which represent the Bank’s largest non-interest expense. We continually evaluate opportunities to streamline operations and maximize the efficiency of staff. In 2015, headcount was further reduced by 7.4% to 94, through attrition. The Bank also reduced marketing and promotion expenses, professional and consulting fees, and OREO write downs and expenses, adding to a total expense reduction of over $1 million. |
| ● |
Renegotiation of Core Provider Contract. The current 8-year contract expires in June 2017, and the Bank is in the process of negotiating lower pricing to further reduce non-interest expense. |
| ● |
Expanding Markets. We are continually seeking opportunities to expand our footprint, increase earnings, and enhance shareholder value. |
| ● |
VNB Wealth Management. We are pursuing revenue sharing and other arrangements to supplement and accelerate the growth of profitable Assets Under Management (AUM). |
Margins and Yields – Bank Only. The following graph shows a 19 basis point decrease in average loan yield from 2014 to 2015. While the pressure of increased competition continued, we held firm in our commitment to book high quality loans, which required more competitive pricing over the same period. The Federal Reserve’s delay in increasing rates until December 2015 contributed to the pressure on loan yields. The net interest margin increased 12 basis points due to a shift in our earning asset mix, together with the purchase of higher-yielding, privately insured student loans.
Gross loans grew 35.2%, from $313.3 million at year-end 2014 to $423.7 million at year-end 2015. As loan growth was consistent over the four quarters, the full impact of that growth will be realized in 2016’s net interest income. While margins may not improve in the near term, we expect further loan growth in 2016, which will continue to improve the Bank’s net interest income.

2
Comparative Earnings Data – Bank Only. The Bank’s earnings increased 115.7%, from $1.8 million in 2014 to $3.8 million in 2015. There were three primary reasons for this significant increase. First, we experienced a great year of organic loan growth, supplemented by purchases of privately insured student loan portfolios and Shared National Credits. Second, the fee increases implemented in late 2014 gave us a fully loaded year in 2015. Last, non-interest expense was reduced by 7.6%, primarily due to decreased headcount, marketing and promotion expenses, professional and consulting fees, and OREO write downs and expenses. As stated earlier, our ability to streamline operations and appropriately deploy technology has allowed us to eliminate positions through attrition.
Management will maintain its focus on controlling expenses and improving income. To further our success in loan production, we will continue to evaluate whether our rates and terms remain competitive. As has been our practice, we will pursue new relationships through our community partnerships, host special events for existing clients and prospects, and promote brand awareness. This strategy of establishing and maintaining relationships is generating many opportunities to bid on loans. While the challenges for 2016 are a bit different than those in 2015, we will remain focused on loan production, non-interest income, and expense reductions.
Bank Only – Comparative
Earnings Data
(Dollar Amounts Shown in Thousands)
 |
 | |
 |
 |
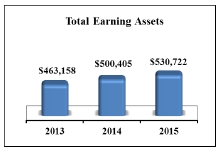
Balance Sheet. The Company achieved meaningful growth in all categories shown in the charts on the following page. Our non-interest bearing deposits grew from 33.3% of total deposits in 2014 to 38.0% in 2015. We were able to take advantage of the value of low cost deposits to fund loan growth. During the first quarter of 2015, deleveraging slowed, and business owners appeared ready to borrow, as the economy showed signs of recovery. Rather than assume the increased loan demand would continue, we made the decision to supplement organic loan growth with additional participation interests in several Shared National Credits and the purchase of two portfolios of privately insured student loans. These purchases aligned with our philosophy of superior credit quality, while serving to diversify our earnings stream and efficiently deploy capital. This strategy followed parameters set in 2014 to limit concentrations within these portfolios and ensure total loan purchases did not exceed certain limits of risk-based capital. Due to these actions, the Bank posted a record year in loan growth. We finished the year at over $423 million in loans and substantially increased our loan-to-deposit ratio from 68.6% in 2014 to a strong 87.1% in 2015.
3
Balance Sheet at
Year-End
(Dollar
Amounts Shown in Thousands)
 |
 | |
 |
 |
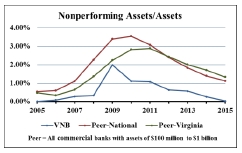
Credit Quality. The following graphs illustrate the results of the Bank’s commitment to credit quality, as our performance was well above our peers in all categories. By the end of 2015, our level of nonperforming assets was nominal at 0.03% of total assets, and the Bank had no OREO properties remaining. Net charge-offs decreased in 2015 to 0.02% of total loans, representing an 88.1% decrease over 2014. At year-end 2015, the Bank’s Loan Loss Allowance dropped to 0.84%, the lowest level in the Bank’s history. Had our allowance been at the Virginia peer group average of 1.26%, the Bank’s net income before taxes would have been $1.8 million less. We will continue to focus on maintaining our superior credit quality.
 |
 | |
 | ||
4
VNB Wealth Management. As you can see in the chart below, there was a significant reduction in Assets Under Management (AUM) over the past two years. While the financial results of VNB Wealth Management in 2015 showed a loss, these results were expected during the transition period following the sale of Swift Run Capital Management, LLC (SRCM) in 2013. The expected transfer of assets accounted for roughly $200 million in decreased AUM since the sale. Additionally, we received a lower percentage of royalty and referral fee income from SRCM on these transferred AUMs. Toward the end of 2015, we began to see AUM stabilize. In 2016, the Wealth Management team is focused on serving their existing clients and growing the business.

VNB Wealth Management has three sources of revenue:
| ● |
Management fees – Derived from its AUM. |
| ● |
Incentive income – Based on the investment returns generated on its performance-based AUM. |
| ● |
SRCM income – Royalty and revenue sharing arrangement on both fixed and incentive fees, which has 8 years remaining. |
In any given year, revenues are driven by the combination of these income streams. Management fees are reasonably predictable, while incentive fee income is unpredictable. The chart below shows the volatility of incentive fee income. It also indicates we had an imbalance between our fixed fee income and expenses, which has happened several times over the past years. During 2014 and 2015, we recalibrated the earnings and expense streams of VNB Wealth Management. Net income was negative in 2015 for three main reasons: 1) there was very little incentive fee income on our performance-based AUMs; 2) there was no incentive fee revenue from SRCM; and 3) the payout of guaranteed bonuses. These bonuses were necessary to retain key employees and unify the team during the transition period. For 2016, it is important to note there are no guaranteed bonuses, and we anticipate fixed fee income will cover fixed expenses.

5
VNB Wealth Management’s Future Challenges. In 2015, the conversation continued in the money management industry regarding active versus passive investing; specifically, whether active investing was a thing of the past and no longer needed. Based on the flow of money pouring into passive funds during the 2014-2015 period, it would seem that active investing might become obsolete. However, just when investors found themselves almost seven years into a bull market and believing investing was easy, the market’s behavior in the latter part of 2015 and the first two months of 2016 began to give them pause. Now the tone of the conversation has changed, and there is renewed interest in active investing.
On the financial end, VNB Wealth Management must have sufficient fixed fee income to cover fixed expenses. We expect fixed fees from the recently completed purchase of a wealth management practice to help close the gap and result in at least a neutral year, without factoring in the potential incentive fee income. Balancing VNB Wealth Management’s fixed expenses with fixed fee income will have a favorable impact on the Company’s bottom line in 2016.
Conclusion. The top challenges and opportunities for the Company in 2016 are as follows:
| ● |
VNB Wealth Management – Focus on the addition of new clients and profitable AUM. |
| ● |
Loan Growth – Attract the highest quality loans and proactively anticipate market demands. |
| ● |
Expense Reductions – Realize operational efficiencies to further reduce non-interest expense. |
| ● |
Capital Allocation – Deploy excess capital effectively. |
| ● |
Technology – Implement technologies which protect our customers and the Company. |
We believe the Company will prosper as it becomes more efficient and competitive, embraces technology, reduces expenses, and creates new ways to generate earnings. Our progress in 2015 demonstrates we are committed to these actions. The Company remains financially sound and profitable.
Your confidence and support are sincerely appreciated. Please do not hesitate to call me at 434-817-8649 should you have any questions.
|
Sincerely, |
 |
| Glenn W. Rust |
| President & CEO |
Forward-Looking Statements; Other Information: Statements in this letter which express or imply a view about the objectives and future performance of the Virginia National Bankshares Corporation are “forward-looking statements.” Such statements are often characterized by use of qualified words such as “expect,” “believe,” “estimate,” “project,” “anticipate,” “intend,” “will,” “should,” or words of similar meaning or other statements concerning the opinions or judgment of the Company and its management about future events. While Company management believes such statements to be reasonable, future events and predictions are subject to circumstances that are not within the control of the Company and its management, and actual events in the future may be substantially different from those expressed in this letter. The Company’s past results are not necessarily indicative of future performance. Factors that could cause future performance to differ from past performance or anticipated performance could include, but are not limited to, changes in national and local economies, employment or market conditions; changes in interest rates, deposits, loan demand and asset quality; competition; changes in banking regulations and accounting principles or guidelines; and performance of assets under management. These statements speak only as of the date made, and the Company does not undertake to update them to reflect changes or events that may occur later. Information based on other sources is believed by management of the Company to be reliable, but has not been independently verified. For more information about the Company’s 2015 performance, please refer to the Company’s audited consolidated financial statements in its Annual Report on Form 10-K for the year ended December 31, 2015 filed with the Securities and Exchange Commission on March 30, 2016.
6