Attached files
| file | filename |
|---|---|
| EX-23.1 - EX-23.1 - inVentiv Group Holdings, Inc. | d156892dex231.htm |
Table of Contents
As filed with the Securities and Exchange Commission on April 5, 2016
Registration No. 333-
UNITED STATES
SECURITIES AND EXCHANGE COMMISSION
Washington, D.C. 20549
FORM S-1
REGISTRATION STATEMENT
UNDER
THE SECURITIES ACT OF 1933
inVentiv Group Holdings, Inc.
(Exact name of registrant as specified in its charter)
| Delaware | 8742 | 01-0973593 | ||
| (State or Other Jurisdiction of Incorporation or Organization) |
(Primary Standard Industrial Classification Code Number) |
(I.R.S. Employer Identification Number) |
1 Van De Graaff Drive
Burlington, Massachusetts 01803
(800) 416-0555
(Address, Including Zip Code, and Telephone Number, Including Area Code, of Registrant’s Principal Executive Offices)
Eric R. Green, Esq.
General Counsel
1 Van De Graaff Drive
Burlington, Massachusetts 01803
(800) 416-0555
(Name, Address, Including Zip Code, and Telephone Number, Including Area Code, of Agent For Service)
Copies to:
| Alexander D. Lynch, Esq. Heather L. Emmel, Esq. Weil, Gotshal & Manges LLP 767 Fifth Avenue New York, New York 10153 (212) 310-8000 (Phone) (212) 310-8007 (Fax) |
Deanna L. Kirkpatrick, Esq. Davis Polk & Wardwell LLP 450 Lexington Avenue New York, New York 10017 (212) 450-4000 (Phone) (212) 701-5800 (Fax) |
Approximate date of commencement of proposed sale to the public: As soon as practicable after the effective date of this Registration Statement.
If any of the securities being registered on this Form are to be offered on a delayed or continuous basis pursuant to Rule 415 under the Securities Act of 1933, check the following box. ¨
If this Form is filed to register additional securities for an offering pursuant to Rule 462(b) under the Securities Act, please check the following box and list the Securities Act registration statement number of the earlier effective registration statement for the same offering. ¨
If this Form is a post-effective amendment filed pursuant to Rule 462(c) under the Securities Act, check the following box and list the Securities Act registration statement number of the earlier effective registration statement for the same offering. ¨
If this Form is a post-effective amendment filed pursuant to Rule 462(d) under the Securities Act, check the following box and list the Securities Act registration statement number of the earlier effective registration statement for the same offering. ¨
Indicate by check mark whether the registrant is a large accelerated filer, an accelerated filer, a non-accelerated filer or a smaller reporting company. See the definitions of “large accelerated filer,” “accelerated filer” and “smaller reporting company” in Rule 12b-2 of the Exchange Act.
| Large accelerated filer | ¨ | Accelerated filer | ¨ | |||
| Non-accelerated filer | x | Smaller reporting company | ¨ | |||
CALCULATION OF REGISTRATION FEE
|
| ||||
| Title of Each Class of Securities to be Registered |
Proposed Maximum Aggregate Offering Price(1)(2) |
Amount of Registration Fee | ||
| Common stock, $0.01 par value per share |
$100,000,000 | $10,070.00 | ||
|
| ||||
|
| ||||
| (1) | Estimated solely for the purpose of calculating the registration fee in accordance with Rule 457(o) promulgated under the Securities Act. |
| (2) | Includes shares of common stock that may be issuable upon exercise of an option to purchase additional shares granted to the underwriters. |
The Registrant hereby amends this Registration Statement on such date or dates as may be necessary to delay its effective date until the Registrant shall file a further amendment which specifically states that this Registration Statement shall thereafter become effective in accordance with Section 8(a) of the Securities Act or until the Registration Statement shall become effective on such date as the Commission, acting pursuant to said Section 8(a), may determine.
Table of Contents
The information in this preliminary prospectus is not complete and may be changed. We may not sell these securities until the registration statement filed with the Securities and Exchange Commission is effective. This preliminary prospectus is not an offer to sell these securities and it is not soliciting an offer to buy these securities in any state where the offer or sale is not permitted.
SUBJECT TO COMPLETION, DATED APRIL 5, 2016
Shares

inVentiv Group Holdings, Inc.
Common Stock
This is an initial public offering of shares of common stock of inVentiv Group Holdings, Inc. We are offering shares of common stock.
Prior to this offering, there has been no public market for our common stock. The initial public offering price of our common stock is expected to be between $ and $ per share. We intend to apply to list our common stock on the New York Stock Exchange (“NYSE”) or NASDAQ Global Market (“NASDAQ”) under the symbol “ .”
The underwriters have an option, for a period of 30 days from the date of this prospectus, to purchase a maximum of additional shares of our common stock at the initial public offering price, less the underwriting discount.
We will be a “controlled company” under the corporate governance rules for NYSE- or NASDAQ-listed companies and therefore we will be permitted to, and we intend to, elect not to comply with certain NYSE or NASDAQ corporate governance requirements. See “Management.”
Investing in our common stock involves a high degree of risk. See “Risk Factors” beginning on page 15.
| Initial public offering price |
Underwriting discounts and commissions(1) |
Proceeds to us |
||||||||||
| Per Share |
$ | $ | $ | |||||||||
| Total |
$ | $ | $ | |||||||||
| (1) | We have agreed to reimburse the underwriters for certain FINRA-related expenses in connection with this offering. See “Underwriting.” |
Delivery of the shares of common stock will be made on or about , 2016.
Neither the Securities and Exchange Commission (the “SEC”) nor any state securities commission has approved or disapproved of these securities or passed on the adequacy or accuracy of this prospectus. Any representation to the contrary is a criminal offense.
| Credit Suisse | Morgan Stanley |
| Goldman, Sachs & Co. | Jefferies | |
| Citigroup | BofA Merrill Lynch | Barclays | Wells Fargo Securities | |||
The date of this Prospectus is , 2016
Table of Contents
| ii | ||||
| ii | ||||
| 1 | ||||
| 15 | ||||
| 46 | ||||
| 49 | ||||
| 50 | ||||
| 51 | ||||
| 52 | ||||
| 54 | ||||
| Management’s Discussion and Analysis of Financial Condition and Results of Operations |
56 | |||
| 88 | ||||
| 101 | ||||
| 103 | ||||
| 110 | ||||
| 121 | ||||
| 123 | ||||
| 128 | ||||
| 131 | ||||
| 138 | ||||
| Material U.S. Federal Income Tax Considerations for Non-U.S. Holders |
140 | |||
| 144 | ||||
| 150 | ||||
| 150 | ||||
| 150 | ||||
| F-1 |
Neither we nor the underwriters have authorized anyone to provide you with information that is different from that contained in this prospectus, any amendment or supplement to this prospectus or any free-writing prospectus prepared by us or on our behalf or to which we have referred you. We do not, and the underwriters do not, take any responsibility for, and can provide no assurances as to, the reliability of any information that others provide to you. We are offering to sell, and seeking offers to buy, shares of common stock only in jurisdictions where offers and sales are permitted. The information contained in this prospectus is accurate only as of the date of this prospectus, regardless of the time of delivery of this prospectus or of any sale of the common stock. Our business, financial condition, results of operations and prospectus may have changed since that date.
Until , 2016 (25 days after the commencement of this offering), all dealers that buy, sell or trade shares of our common stock, whether or not participating in this offering, may be required to deliver a prospectus. This delivery requirement is in addition to the obligation of dealers to deliver a prospectus when acting as underwriters and with respect to their unsold allotments or subscriptions.
For investors outside the United States: neither we or any of the underwriters have done anything that would permit this offering or possession or distribution of this prospectus in any jurisdiction where action for that purpose is required, other than in the United States. You are required to inform yourselves about and to observe any restrictions related to this offering and the distribution of this prospectus outside of the United States.
Table of Contents
Some of the market and industry data contained in this prospectus are based on independent industry publications or other publicly available information. Although we believe that these independent publications and other publicly available information are reliable as of their respective dates, we have not verified the accuracy or completeness of the data presented from independent sources.
In addition, certain market and industry data contained in this prospectus are based on internal data, studies and management estimates, which are derived from information obtained from analysts’ reports, independent industry publications or publicly available sources, as well as our clients, partners, trade and business organizations and other contacts in the markets in which we operate, and also reflect our management’s understanding of industry conditions. In particular, our estimates of current commercialization spend and the growth rate of commercialization spend by biopharmaceutical companies through 2020 is based on the assumption that growth in selling, general and administrative (“SG&A”) expenses is indicative of growth in commercialization expenses, its largest component, over the same period. Although we believe that such information included in this prospectus is reliable as of their respective dates, such data, studies and estimates, particularly as they relate to market size, market growth, penetration, market share and our general expectations, involve important risks, uncertainties and assumptions and are subject to change based on various factors, including those discussed under “Risk Factors” and “Cautionary Note Regarding Forward-Looking Statements” in this prospectus. These and other factors could cause results to differ materially from those expressed in the estimates and beliefs made by the independent parties and by us.
References in this prospectus to (i) our “top clients” are based upon such clients’ contribution to our 2015 net revenues and (ii) the “largest global biopharmaceutical companies” are based upon 2014 revenues within the biopharmaceutical industry.
inVentiv Health and the associated logo are some of our registered and unregistered trademarks. This prospectus also includes other registered and unregistered trademarks of ours. All other trademarks, tradenames and service marks appearing in this prospectus are the property of their respective owners.
Solely for convenience, certain trademarks, service marks and trade names referred to in this prospectus are listed without the ® and ™ symbols, but such references are not intended to indicate in any way that we will not assert, to the fullest extent under applicable law, our rights to these trademarks, service marks and trade names.
ii
Table of Contents
This summary highlights information appearing elsewhere in this prospectus. Because it is a summary, it does not contain all of the information that you should consider before investing. You should read this entire prospectus carefully, including the section entitled “Risk Factors,” “Management’s Discussion and Analysis of Financial Condition and Results of Operations” and our consolidated financial statements and the notes thereto included elsewhere in this prospectus, before investing in our common stock. The terms “inVentiv,” “Company,” “we,” “us” and “our” refer to inVentiv Group Holdings, Inc. and its consolidated subsidiaries. Various financial terms, including “EBITDA,” “Adjusted EBITDA” and “Constant currency net revenues” are described under “—Summary Consolidated Financial and Operating Data” and “Management’s Discussion and Analysis of Financial Condition and Results of Operations—Exchange Rate Fluctuations.”
Overview
We are a leading global provider of outsourced clinical development and commercialization services to biopharmaceutical companies. We are the only provider delivering a full suite of services to enhance our clients’ ability to successfully develop, launch and market their products. We offer our services on both a standalone basis and as integrated solutions to support clinical development and commercialization. Our solutions are designed to drive greater efficiency and lower costs. We helped develop or commercialize over 80% of all new molecular entities approved by the Food and Drug Administration (“FDA”) and 70% of those approved by the European Medicines Agency (“EMA”) over the last five years through our innovative model. In 2015, we served more than 550 client organizations, including all 20 of the largest global biopharmaceutical companies, and have the ability to service clients in over 90 countries.
We focus on the large and rapidly growing outsourcing component of the estimated $250 billion biopharmaceutical clinical development and commercialization market. Our services cover the entire biopharmaceutical development and commercialization continuum spanning from first-in-human clinical trials to the ongoing commercialization of mature products. Our services are designed to enhance our clients’ revenues and profitability, increase the likelihood of success of their clinical programs and commercial efforts and accelerate the execution of their projects in order to shorten the time from “lab to life.”
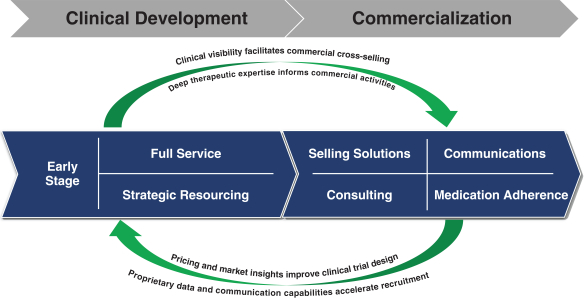
Our Clinical business is a leading global contract research organization (“CRO”) that is therapeutically-focused and provides a wide range of capabilities, including Phase I (early stage) and Phase II–IV clinical development, delivered on a project (full service) or functional (strategic resourcing) basis. Our services are designed to accelerate our clients’ pursuit of regulatory approval. We provide our services through teams that possess operational and scientific expertise in a broad range of therapeutic areas with a particular focus in high growth areas such as oncology, neuroscience, pain and respiratory. Our Commercial business is a contract commercial organization (“CCO”), the biopharmaceutical industry’s only provider of a full suite of complementary commercialization services, including selling solutions, communications, consulting and medication adherence. We believe this unique CCO model provides a competitive advantage by integrating strategic, creative and operational expertise enhanced by the deep therapeutic expertise from our Clinical business to help optimize performance, reduce risk and expedite delivery of innovative products.
We have over 14,000 employees globally, including more than 750 M.D.s and Ph.D.s, and offer clients a differentiated set of solutions designed to enhance operational and financial efficiencies across the clinical development and commercialization continuum. Our Clinical and Commercial segments inform and enhance one another, and the flexibility of our model allows us to provide additional services over time as the needs of our clients evolve.
1
Table of Contents
The creation of our comprehensive and integrated approach to serve the biopharmaceutical development and commercialization continuum began in 2010 with our acquisition by our sponsor, Thomas H. Lee Partners, L.P. (“THL”). We have made substantial investments, strategic acquisitions and operational changes to expand and strengthen our clinical development and commercial service offerings, geographic presence, human capital, systems and infrastructure to better serve our clients. These strategic and operational initiatives included:
| • | Completion and integration of 10 strategic acquisitions, including three CROs, to offer a full suite of services on a global basis; |
| • | Enhancement of therapeutic area focus with particular expertise in oncology, neuroscience, pain and respiratory; |
| • | Integration and rationalization of legacy commercial acquisitions and separately-operated brands into the biopharmaceutical industry’s only CCO providing a full suite of complementary commercialization services; |
| • | Expansion of our geographic capabilities in Japan, India, Western Europe, Latin America and China; |
| • | Evolution of our selling solutions capabilities into a market-leading strategic offering with expertise in helping clients launch and market complex biopharmaceutical products; and |
| • | Recruitment of Michael A. Bell, our Chairman and CEO who has extensive experience across the healthcare delivery continuum and who has managed and grown sophisticated global service organizations. |
These initiatives have helped us create a leading biopharmaceutical outsourcing business with an unmatched ability to provide a full suite of integrated services to meet our clients’ needs. Each of our top 10 clients and 24 of our top 25 clients utilized services from both our Clinical and Commercial segments in 2015. The following financial metrics are reflective of our improved performance from 2014 to 2015:
| • | Net revenues increased 10.4% on an as-reported basis (13.0% on a constant currency basis) to $1,994.3 million. |
| • | Clinical segment net revenues increased 8.9% to $947.9 million (47.2% of total net revenues). |
| • | Commercial segment net revenues increased 12.3% to $1,059.9 million (52.8% of total net revenues). |
| • | Adjusted EBITDA increased 33.9% to $275.9 million. |
| • | Adjusted EBITDA as a percentage of net revenues increased to 13.8% from 11.4%. |
2
Table of Contents
We incurred losses from continuing operations of $150.6 million and $180.6 million for the year ended December 31, 2015 and 2014, respectively. See “—Summary Consolidated Financial and Operating Data” for a discussion of Adjusted EBITDA and “Management’s Discussion and Analysis of Financial Condition and Results of Operations—Exchange Rate Fluctuations” for a discussion of constant currency net revenues.
Our Markets
Global demand for biopharmaceutical products is expected to continue to increase in both developed and emerging markets, driven by expanding access to care, increasing life expectancy and the growing prevalence of chronic conditions. Growing regulatory requirements, pricing and reimbursement challenges, a need to replenish product pipelines and a shift to more targeted and personalized medicines are driving higher costs and complexities and increasing pressures on biopharmaceutical companies. Additionally, advancements in science are driving new therapies (such as gene therapies, stem cells and biologics) that necessitate more complex clinical development and commercialization services. Faced with these pressures, biopharmaceutical companies are increasingly seeking to improve the efficiencies and effectiveness of their clinical development and commercialization activities by outsourcing these services throughout the entire product lifecycle. In particular, the following trends are expected to increase demand for outsourced clinical development and commercialization services:
| • | Growth in R&D Spending. We estimate the total research and development (“R&D”) spending in the biopharmaceutical industry was approximately $140 billion in 2015. Potential outsourcing development spending accounted for approximately 70%, or $100 billion, and is estimated to grow approximately 4% annually through 2020. |
| • | Increased Product Commercialization Spending. We estimate that spending related to product commercialization in the biopharmaceutical industry exceeded $150 billion in 2015 and will grow at approximately 2% to 3% annually through 2020. |
| • | Expansion in the Use of Outsourcing Services. We estimate that total clinical development outsourcing to CROs in 2015 was approximately 30% of total potential outsourcing development spending, representing an approximately $30 billion market. This market is expected to achieve approximately 40% penetration, or approximately $55 billion of spending, by 2020. Because the market for product commercialization services is more diverse, it is difficult to estimate the current amount of outsourced product commercialization services and the expected growth in such services. However, we estimate that less than 15% of product commercialization expenditures are currently being outsourced. As business models continue to evolve in the healthcare sector, we believe that the rate of commercial outsourcing could follow a similar path to the clinical development market. |
| • | Increased Complexity in Clinical Development and Commercialization. Significant unmet medical needs and scientific advancements are driving biopharmaceutical companies to seek to discover, develop and commercialize new, increasingly complex treatments. As an illustration, the average number of clinical endpoints required for a Phase III study increased 86% from 2002 to 2012. |
These trends represent significant opportunities in both of our segments:
| • | Clinical Segment. Our Clinical segment provides a full suite of services spanning Phases I-IV of clinical development, allowing us to respond to our clients’ needs throughout the development continuum. We expect the continued need for cost efficiency and increased speed to market across expanding product pipelines to benefit outsourced providers, particularly those with global scale and therapeutic expertise. We estimate that total R&D spending in the biopharmaceutical industry was approximately $140 billion in 2015, of which we estimate that potential outsourcing development spending was approximately $100 |
3
Table of Contents
| billion. Based on our estimates, approximately 30% of potential outsourcing development spending in our market was outsourced in 2015. We estimate that the amount of outsourced clinical services will experience a compound annual growth rate (“CAGR”) in the high single digits from 2015 through 2020 as a result of growth in R&D spending by biopharmaceutical companies and the increased outsourcing of this spending. |
| • | Commercial Segment. Our Commercial segment addresses the needs of clients in support of and following product approval and links clinical development to healthcare delivery. The services we provide to address this market include selling solutions, communications, consulting and medication adherence. Because the market served by our Commercial segment is diverse, it is difficult to estimate the current amount of outsourced product commercialization services and the expected growth in such services. However, we estimate that total spending by biopharmaceutical companies related to commercialization of their products exceeded $150 billion in 2015 and less than 15% of these expenditures are currently being outsourced and that the outsourcing of these services is in the early stages of penetration. Growth for the outsourced commercial services market will be driven primarily by two factors: increased spending on commercialization services overall and increased outsourcing penetration within the market. |
Our Competitive Strengths
We address a large and growing market and believe we are well-positioned to continue expanding our market share. Our key competitive strengths include the following:
A global leader in biopharmaceutical outsourcing with differentiated positioning. We serve more than 550 client organizations, including all 20 of the largest global biopharmaceutical companies, and have the ability to service clients in over 90 countries. Over 80% of all new molecular entities approved by the FDA and 70% of those approved by the EMA over the last five years have been developed or commercialized with our support. We believe our scale, global reach and breadth of services, coupled with our deep industry expertise and experience, enable us to offer the solutions our clients need as they navigate an increasingly complex and evolving market. We believe our clients are seeking to consolidate their outsourcing to large global providers like us to address the changing industry dynamics. The breadth of our global clinical and commercial services should position us well to capitalize on this evolving environment and penetrate both existing and new clients.
Adding value across the biopharmaceutical product lifecycle. Our broad suite of services allows us to deliver customized solutions and provide value to biopharmaceutical companies and other key constituents across the healthcare delivery system. We leverage new and existing knowledge capital and proprietary data assets across our offerings to help biopharmaceutical clients optimize execution and reduce costs throughout the product lifecycle. The following are notable examples of these capabilities:
| • | Superior clinical trial design: We leverage our expanding clinical and commercial knowledge capital to inform and enhance clinical trial design in order to facilitate shorter and more efficient trials intended to improve the likelihood of regulatory and subsequent commercial success. |
| • | Enhanced site selection and patient recruitment: We utilize proprietary data assets, behavioral insights, social media and communications capabilities to enhance the speed and success of site selection and patient recruitment. |
| • | Proactive pre-launch reimbursement and formulary management: We bridge the gap between clinical development and commercialization by utilizing our diverse capabilities and communicating clinical benefits to payers and pharmacy benefit managers (“PBMs”) to help optimize reimbursement and patient access. |
| • | Highly effective commercial product launch capabilities: We help our clients navigate the complexities of launching a product by orchestrating interconnected work streams to develop and execute an effective product launch strategy. |
4
Table of Contents
| • | Proprietary programs to improve medication adherence: We have the ability to reach over 175 million patients through multi-channel medication adherence programs designed to mitigate costs related to non-adherence, which are estimated by the Centers for Disease Control and Prevention to exceed $100 billion annually. |
| • | Efficient project ramp-up: We scale clinical or commercial projects rapidly and effectively through our recruiting, training, and deployment capabilities, leveraging over 150 dedicated recruiting personnel and our proprietary database of over 650,000 industry professionals. |
Diversified operating model including deepening relationships with blue-chip client base. We are diversified across our leading Clinical (47% of 2015 net revenues) and Commercial (53% of 2015 net revenues) segments. We have a large and expanding client base, extensive range of services, geographic scope and an ability to provide solutions at nearly every stage of the product lifecycle. We have a loyal client base of over 550 client organizations, including all 20 of the largest global biopharmaceutical companies as well as a significant number of high-growth, small and mid-sized biopharmaceutical companies. Our top five clients accounted for approximately 37% of net revenues in the year ended December 31, 2015, with our largest client accounting for approximately 10% of our net revenues. All of our top 25 clients are diversified across multiple projects, compounds or service offerings. We have strong and growing relationships with our top clients. All of our top 20 clients have been clients since 2010 and many of these clients had long-standing relationships with the companies we have acquired.
Deep and aligned therapeutic expertise. We provide our clients highly-differentiated, specialized teams in both our Clinical and Commercial segments, with operational and scientific expertise in a range of therapeutic areas such as oncology, neuroscience, pain and respiratory. These core, high-growth therapeutic areas constituted 66% of our Clinical segment backlog as of December 31, 2015. We have strategically organized our business around therapeutic area expertise and serve some of the fastest growing areas in the market. Our deep understanding of these therapeutic areas extends throughout our business, allowing our clients to benefit from this knowledge base throughout our full suite of services. We believe our specialized therapeutic expertise in our Commercial segment is unique in our industry and becoming increasingly important to our clients as therapies become more complex and targeted. Our experienced medical and scientific professionals, including more than 750 M.D.s and Ph.D.s, apply innovative insights and science to clinical trials as well as to the commercialization of products.
Attractive financial profile with strong organic growth and operating leverage. We have achieved robust operating and financial performance over the past few years while increasing the scale and breadth of our service offerings. For the year ended December 31, 2015, our net revenues and Adjusted EBITDA grew 10% and 34%, respectively, all of which has been organic. Over the same period, we grew our market share in both Clinical and Commercial segments, as evidenced by growth in net revenues of 9% and 12%, respectively. The momentum in our Clinical segment is further reflected in the 11% growth in our Clinical backlog from December 31, 2014 to December 31, 2015 and 12% growth in net new business awards during the year ended December 31, 2015. Adjusted EBITDA as a percentage of net revenues increased to 13.8% from 11.4%. This margin expansion has been aided by a series of strategic investments and initiatives intended to both build out and rationalize our infrastructure. Examples of these include: (i) shifting selected support services to lower-cost geographies, (ii) centralizing administrative functions and (iii) optimizing our technology spend. We believe our outstanding financial profile and strong operating momentum position us for continued market share gains across both of our segments.
Highly experienced and committed management team. We are led by a dedicated executive management team, averaging 29 years of relevant experience, with extensive experience with biopharmaceutical companies, payers and health systems. Our team has been responsible for executing on our strategy, growing our client base and driving our significant growth in net revenues and Adjusted EBITDA over the past three years. This management team contributes to a company-wide culture of collaboration focused on delivering services and solutions that meet or exceed the quality standards demanded by clients, physicians, patients and regulatory authorities.
5
Table of Contents
Growth Strategy
Our goal is to generate profitable revenue growth in both of our segments and to increase margins through operational efficiency initiatives. The key elements of our growth strategy include:
Leverage our market leadership position in large and attractive markets. Our Clinical and Commercial segments are benefiting from specific industry trends that are expected to drive attractive growth through 2020. We estimate that the amount of outsourced clinical services will experience a CAGR in the high single digits from 2015 through 2020. As business models continue to evolve in the healthcare sector, we believe that the rate of commercial outsourcing could follow a similar path to the clinical development market. Global demand for biopharmaceutical products continues to increase, driven by expanding access to care, increasing life expectancy and the growing prevalence of chronic conditions in both developed and emerging markets. Higher costs and increased complexity are driving our clients to seek efficiency and expertise through outsourcing services. We intend to capitalize on these trends by continuing to provide the services our clients need.
Increase market share through our unmatched service offering and scale. We believe we are uniquely positioned to meet our clients’ evolving needs as the only provider of a full suite of services through the clinical development and commercialization continuum. Our size and scale enable us to provide solutions designed to accelerate our clients’ clinical or commercial projects effectively, thereby driving speed and cost efficiencies. Our ability to engage clients at the early phases of clinical trials with respect to commercial insights allows them to make more informed decisions on clinical trial design and strategies, a key differentiator from our competitors. We intend to leverage our differentiated service offerings to increase our share of the growing market for outsourced clinical and commercialization services.
Drive acceleration of commercial outsourcing. There is increasing demand for the outsourcing of many aspects of commercialization that have been traditionally handled internally by biopharmaceutical companies. Specialized knowledge and expertise, along with efficient cost and productivity management, are increasingly required for the successful launch and commercialization of new complex products. We have continuously expanded and invested in our commercial outsourcing capabilities and we intend to leverage our extensive knowledge, experience and unmatched offerings to drive expansion of the commercial outsourcing opportunity with new and existing clients.
Increase profitability by leveraging our scalable infrastructure. We have focused on creating an organization built for operational flexibility to efficiently provide services to address our clients’ needs. As we succeed in winning new business, we believe our significant degree of operating leverage will allow us to drive incremental margin expansion. Over the last few years, we have streamlined our organizational structure and made progress to optimize the efficiency of our operations. We have centralized and outsourced administrative functions and integrated and rationalized our technology systems to better serve our clients and improve our efficiency. We intend to leverage our improvements and continue to execute on internal efficiency initiatives to increase profitability.
Increase cross-selling with existing clients. We believe that we have substantial opportunities to expand the reach of our services that we provide to our existing clients. As only 53 of our top 100 clients utilized services from our Clinical and Commercial segments in 2015, we believe there is significant potential to sell additional services to our existing client base. In addition, a number of our largest clients that use both clinical and commercial services do not use each of them to the same extent and we are targeting these clients to expand the use of our services within the less utilized segment. Given our past success in expanding the scope of services provided to current clients, we intend to further expand our business with our existing clients by cross-selling additional clinical and commercial services. For example, for the year ended December 31, 2015, each of our top 10 clients in each segment utilized, on average, approximately 40% fewer services (as measured by net revenues) from the other segment. As part of our cross-selling efforts, we market the potential operational and economic efficiencies that clients can achieve by using more of our services throughout the product lifecycle.
6
Table of Contents
Capitalize on client and geographic growth opportunities. We intend to target segments of the biopharmaceutical market in which we are underpenetrated. Specifically, we plan to actively seek to expand our market share among small and mid-sized biopharmaceutical companies, as they frequently lack the robust infrastructures and service capabilities of larger clients. Additionally, we have developed a global platform with a presence in all of the major biopharmaceutical markets in the world with the ability to service clients in over 90 countries and we intend to further expand our business outside of the United States. We are focused on replicating our success in the U.S. market to other major biopharmaceutical markets around the world. We have demonstrated our capabilities for geographic expansion in Japan, the world’s second largest biopharmaceutical market, where we grew from less than 10 employees at the beginning of 2009 to approximately 700 employees at the end of 2015. In Western Europe, we principally see the opportunity to expand our commercial services with our existing clients in North America. We may also selectively identify and acquire complementary businesses to enhance our services, capabilities and geographic presence.
Our Principal Stockholders
Thomas H. Lee Partners, L.P. is one of the world’s oldest and most experienced private equity firms. Since the firm’s founding in 1974, THL has raised over $20 billion of equity capital and invested in more than 130 portfolio companies with an aggregate value of over $150 billion. THL invests in growth-oriented businesses, headquartered primarily in North America, across three sectors: Business & Financial Services, Consumer & Healthcare, and Media & Information Services. THL strives to build great companies of lasting value and generate superior investment returns.
Tax Receivables Agreement
Prior to the completion of this offering, we plan to enter into a tax receivables agreement (“TRA”) that generally provides the right to receive future payments from us to our current (pre-offering) stockholders and certain equity award holders (collectively, the “Existing Stockholders”) of 85% of the amount of income tax savings, if any, that we and our subsidiaries realize as a result of the utilization of certain tax assets attributable to periods prior to our initial public offering (the “Pre-IPO Tax Assets”). Based on current tax laws and assuming that we and our subsidiaries earn sufficient taxable income to realize the full tax benefits subject to the TRA, we expect that future payments under the TRA relating to the Pre-IPO Tax Assets could aggregate to between $ million and $ million. See “Certain Relationships and Related Party Transactions—Tax Receivables Agreement” and “Risk Factors.”
Risks Affecting Our Business
Investing in our common stock involves a high degree of risk. You should carefully consider the risks described under “Risk Factors” before making a decision to invest in our common stock. If any of these risks actually occurs, our business, results of operations, financial condition or prospects could be materially and adversely affected. In such case, the trading price of our common stock would likely decline and you may lose some or all of your investment. Below is a summary of some of the principal risks we believe we face:
| • | Our projects may be delayed, reduced in scope or terminated for reasons beyond our control. |
| • | The relationship of our backlog, book-to-bill ratio and net new awards to net revenues and operating results varies over time. |
| • | We may underprice our contracts, overrun our cost estimates or fail to receive approval for or experience delays in change orders. |
| • | We may be unable to achieve operational efficiencies or grow revenues faster than expenses. |
| • | Our relationships with existing or potential clients who are in competition with each other may adversely impact the degree to which other clients or potential clients use our services. |
7
Table of Contents
| • | We may be unable to recruit suitable willing investigators and patients for clinical trials. |
| • | Our insurance may not cover all of our indemnification obligations and other liabilities associated with our operations. |
| • | We could lose our access to certain data assets, which could impair our ability to provide certain of our services. |
| • | Some of our services involve direct interaction with clinical trial subjects or volunteers and operation of early stage (Phase I and IIa) clinical facilities, which could create potential liability. |
| • | We may be adversely affected by client concentration or concentration in therapeutic areas in which we conduct clinical trials. |
| • | We may be unable to successfully develop and market new services or enter new markets. |
| • | We may be unable to manage our growth effectively. |
| • | We may be impacted by actions of regulators, government regulation and recent and future healthcare reform initiatives. |
| • | We are subject to international economic, political and other risks. |
| • | We have a history of net losses and may not achieve profitability in the future. |
| • | We may be impacted by declines in outsourcing expenditures by companies in the biopharmaceutical industry. |
| • | We have a substantial amount of indebtedness. |
| • | We are controlled by THL, whose interests may be different from those of our public stockholders. |
| • | Upon the listing of our shares on the NYSE or NASDAQ, we will be a “controlled company” within the meaning of the NYSE or NASDAQ rules. As a result, our stockholders will not have certain corporate governance protections concerning the independence of our board of directors (the “Board”) that would otherwise apply to us. |
The above list is not exhaustive. Before you invest in our common stock, you should carefully consider all of the information in this prospectus, including matters set forth under the heading “Risk Factors” immediately following this prospectus summary.
Our Corporate Information
We were incorporated in Delaware in May 2010. Our corporate headquarters is located at 1 Van De Graaff Drive, Burlington, MA 01803. Our telephone number is (800) 416-0555. Our website is www.inventivhealth.com. The information on our website is not deemed to be part of this prospectus, and you should not rely on it in connection with your decision whether or not to invest in our common stock.
8
Table of Contents
The Offering
| Issuer |
inVentiv Group Holdings, Inc. |
| Common stock offered by us |
shares of common stock. |
| Common stock to be outstanding immediately after this offering |
shares of common stock ( shares if the underwriters’ option to purchase additional shares is exercised in full). |
| Option to purchase additional shares |
The underwriters have an option to purchase a maximum of additional shares of common stock from us. The underwriters can exercise this option at any time within 30 days from the date of this prospectus. |
| Use of proceeds |
We estimate that the net proceeds from the sale of our common stock in this offering, after deducting the underwriting discount and estimated offering expenses payable by us, will be approximately $ ($ if the underwriters exercise in full their option to purchase additional shares) based on an assumed initial public offering price of $ per share (the midpoint of the estimated public offering price range set forth on the cover page of this prospectus). |
| We intend to use these net proceeds to repay certain of our outstanding indebtedness and for general corporate purposes. See “Use of Proceeds.” |
| Dividend policy |
We do not intend to pay dividends on our common stock for the foreseeable future. However, we may change this policy in the future. Present and future agreements may also limit our ability to pay dividends. See “Dividend Policy.” |
| Voting rights |
Each share of our common stock will entitle its holder to one vote on all matters to be voted on by stockholders generally. See “Description of Capital Stock.” |
| Listing |
We intend to apply to have our common stock listed on the NYSE or NASDAQ under the symbol “ ”. |
| Risk factors |
Investing in our common stock involves a high degree of risk. See the “Risk Factors” section beginning on page 15 of this prospectus for a discussion of factors you should carefully consider before deciding to purchase shares of our common stock. |
9
Table of Contents
Unless otherwise indicated, the number of shares of common stock to be outstanding after this offering is based on shares of common stock outstanding as of , 2016 and all information in this prospectus:
| • | assumes no exercise of the underwriters’ option to purchase additional shares; |
| • | excludes shares of our common stock issuable upon the exercise of options to purchase shares of our common stock, which have a weighted average exercise price of $ per share; |
| • | excludes shares of our common stock issuable upon the vesting of restricted stock units; |
| • | assumes an initial public offering price of $ per share (the midpoint of the estimated public offering price range set forth on the cover page of this prospectus); |
| • | excludes an aggregate of shares of our common stock that will be available for future equity awards under the inVentiv Group Holdings, Inc. 2016 Equity Incentive Plan (the “2016 Plan”); |
| • | gives effect to a -for- stock split of our common stock that will occur prior to the consummation of this offering; and |
| • | gives effect to our amended and restated certificate of incorporation and our amended and restated bylaws, which will be in effect immediately prior to the consummation of this offering. |
10
Table of Contents
Summary Consolidated Financial and Operating Data
The following table summarizes our consolidated financial data and other data for the periods and at the dates indicated. We derived the consolidated statement of operations data for the years ended December 31, 2015, 2014 and 2013 and the consolidated balance sheet data as of December 31, 2015 from our audited consolidated financial statements included elsewhere in this prospectus. Our historical results are not necessarily indicative of the results to be expected for any future period.
The following information should be read together with the information under the headings “Selected Historical Financial Data,” “Capitalization” and “Management’s Discussion and Analysis of Financial Condition and Results of Operations” and our consolidated financial statements and related notes included elsewhere in this prospectus.
| Year Ended December 31, | ||||||||||||
| (in millions, except share and per share data) | 2015 | 2014 | 2013 | |||||||||
| Statement of Operations Data: |
||||||||||||
| Net revenues |
$ | 1,994.3 | $ | 1,806.4 | $ | 1,644.6 | ||||||
| Reimbursed out-of-pocket expenses |
327.0 | 266.8 | 259.9 | |||||||||
|
|
|
|
|
|
|
|||||||
| Total revenues |
2,321.3 | 2,073.2 | 1,904.5 | |||||||||
|
|
|
|
|
|
|
|||||||
| Operating expenses: |
||||||||||||
| Cost of revenues |
1,326.8 | 1,203.6 | 1,084.8 | |||||||||
| Reimbursable out-of-pocket expenses |
327.0 | 266.8 | 259.9 | |||||||||
| Selling, general and administrative expenses |
525.2 | 529.4 | 538.3 | |||||||||
| Proceeds from purchase price finalization |
— | — | (14.2 | ) | ||||||||
| Impairment of goodwill |
34.0 | 15.8 | 36.9 | |||||||||
| Impairment of long-lived assets |
35.2 | 8.2 | 2.0 | |||||||||
|
|
|
|
|
|
|
|||||||
| Total operating expenses |
2,248.2 | 2,023.8 | 1,907.7 | |||||||||
|
|
|
|
|
|
|
|||||||
| Operating income (loss) |
73.1 | 49.4 | (3.2 | ) | ||||||||
| Loss on extinguishment of debt and refinancing costs |
— | (10.1 | ) | (0.8 | ) | |||||||
| Interest expense |
(228.3 | ) | (217.4 | ) | (209.3 | ) | ||||||
| Interest income |
0.1 | 0.4 | 0.1 | |||||||||
| Other income |
11.3 | — | — | |||||||||
|
|
|
|
|
|
|
|||||||
| Income (loss) before income tax (provision) benefit and income (loss) from equity investments |
(143.8 | ) | (177.7 | ) | (213.2 | ) | ||||||
| Income tax (provision) benefit |
(5.6 | ) | (2.5 | ) | (3.0 | ) | ||||||
|
|
|
|
|
|
|
|||||||
| Income (loss) before income (loss) from equity investments |
(149.4 | ) | (180.2 | ) | (216.2 | ) | ||||||
| Income (loss) from equity investments |
(1.2 | ) | (0.4 | ) | — | |||||||
|
|
|
|
|
|
|
|||||||
| Income (loss) from continuing operations |
(150.6 | ) | (180.6 | ) | (216.2 | ) | ||||||
| Net income (loss) from discontinued operations, net of tax |
— | (8.2 | ) | (20.2 | ) | |||||||
|
|
|
|
|
|
|
|||||||
| Net Income (loss) |
(150.6 | ) | (188.8 | ) | (236.4 | ) | ||||||
| Less: Net (income) loss attributable to the noncontrolling interest |
(0.9 | ) | (0.8 | ) | (1.2 | ) | ||||||
|
|
|
|
|
|
|
|||||||
| Net income (loss) attributable to inVentiv Group Holdings, Inc. |
$ | (151.5 | ) | $ | (189.6 | ) | $ | (237.6 | ) | |||
|
|
|
|
|
|
|
|||||||
11
Table of Contents
| Year Ended December 31, | ||||||||||||
| (in millions, except share and per share data) | 2015 | 2014 | 2013 | |||||||||
| Earnings per share attributable to inVentiv Group Holdings, Inc. |
||||||||||||
| Basic and diluted:(1) |
||||||||||||
| Income (loss) from continuing operations |
$ | (28.04 | ) | $ | (33.59 | ) | $ | (40.23 | ) | |||
| Income (loss) from discontinued operations |
— | (1.51 | ) | (3.75 | ) | |||||||
|
|
|
|
|
|
|
|||||||
| Net income (loss) per share attributable to inVentiv Group Holdings, Inc. |
$ | (28.04 | ) | $ | (35.10 | ) | $ | (43.98 | ) | |||
|
|
|
|
|
|
|
|||||||
| Weighted average number of shares outstanding- basic and diluted |
5,402,377 | 5,402,377 | 5,402,017 | |||||||||
|
|
|
|
|
|
|
|||||||
| Selected statement of cash flows data: |
||||||||||||
| Net cash provided by (used in) continuing operations: |
||||||||||||
| Operating activities |
$ | 106.7 | $ | (46.0 | ) | $ | 22.6 | |||||
| Investing activities |
(5.2 | ) | (23.4 | ) | (24.3 | ) | ||||||
| Financing activities |
(34.7 | ) | 25.5 | (1.3 | ) | |||||||
| Other financial data: |
||||||||||||
| Segment net revenues: |
||||||||||||
| Clinical |
$ | 947.9 | $ | 870.3 | $ | 865.1 | ||||||
| Commercial |
1,059.9 | 943.7 | 784.1 | |||||||||
| Intersegment eliminations |
(13.5 | ) | (7.6 | ) | (4.6 | ) | ||||||
|
|
|
|
|
|
|
|||||||
| Total |
$ | 1,994.3 | $ | 1,806.4 | $ | 1,644.6 | ||||||
|
|
|
|
|
|
|
|||||||
| Adjusted EBITDA(2): |
||||||||||||
| Clinical |
$ | 139.3 | $ | 99.6 | $ | 93.4 | ||||||
| Commercial |
176.0 | 135.5 | 118.7 | |||||||||
| Corporate and other |
(39.4 | ) | (29.1 | ) | (43.8 | ) | ||||||
|
|
|
|
|
|
|
|||||||
| Total |
$ | 275.9 | $ | 206.0 | $ | 168.3 | ||||||
|
|
|
|
|
|
|
|||||||
| Capital expenditures |
$ | 39.3 | $ | 33.1 | $ | 35.7 | ||||||
| As of December 31, 2015 | ||||||||
| (in millions) | Actual | As Adjusted(3) | ||||||
| Selected balance sheet data: |
||||||||
| Cash and cash equivalents |
$ | 121.3 | $ | |||||
| Total assets |
2,152.7 | |||||||
| Total debt |
2,170.5 | |||||||
| Total liabilities |
2,923.8 | |||||||
| Total stockholders’ deficit |
(771.1 | ) | ||||||
| (1) | Basic and diluted loss per share is computed by dividing the net loss available to common stockholders by the weighted-average number of shares of common stock outstanding during the period. |
| (2) | We report our financial results in accordance with generally accepted accounting principles in the United States (“GAAP”). To supplement this information, we have included the following supplemental non-GAAP financial measures in this prospectus: EBITDA and Adjusted EBITDA. |
EBITDA is defined as income before interest expense, loss on extinguishment of debt and refinancing costs, income tax provision, depreciation and amortization, equity investment income and other income.
Adjusted EBITDA is defined as EBITDA adjusted to exclude certain items (e.g., the impact of impairment losses, acquisition accounting, acquisition expenses, management fees and stock-based compensation) and to include the impact of our acquisition of Catalina Health Resource, LLC (“Catalina Health”), a provider of
12
Table of Contents
tailored, direct-to-patient medication adherence programs, in October 2013. Adjusted EBITDA is a key metric that management uses to assess the performance of our operations and is calculated in a manner consistent with the terms of the instruments governing our indebtedness. We believe that Adjusted EBITDA provides additional relevant information to our investors to compare performance from period to period by excluding certain items that we believe are not representative of our core business.
EBITDA and Adjusted EBITDA are not defined under GAAP, are not measures of net income, operating income or any other performance measure derived in accordance with GAAP, and are subject to important limitations. Our use of the terms EBITDA and Adjusted EBITDA may not be comparable to similarly titled measures of other companies in our industry and are not measures of performance calculated in accordance with GAAP. EBITDA and Adjusted EBITDA have important limitations as analytical tools and you should not consider them in isolation or as substitutes for analysis of our financial performance as reported under GAAP and should not be considered as alternatives to net income or any other performance measures derived in accordance with GAAP as measures of operating performance or as alternatives to cash flow from operating activities as measures of our liquidity. For example, EBITDA and Adjusted EBITDA, among other things:
| • | exclude certain tax payments that may represent a reduction in cash available to us; |
| • | exclude certain non-recurring cash charges; |
| • | do not reflect any cash capital expenditure requirements for the assets being depreciated and amortized that may have to be replaced in the future; |
| • | do not reflect changes in, or cash requirements for, our working capital needs; and |
| • | do not reflect the significant interest expense, or the cash requirements necessary to service interest or principal payments, on our debt. |
Because of these limitations, EBITDA and Adjusted EBITDA should not be considered as measures of discretionary cash available to us to invest in the growth of our business. We compensate for these limitations by relying primarily on our GAAP results and using EBITDA and Adjusted EBITDA only for supplemental purposes.
A reconciliation of income (loss) from continuing operations, the most directly comparable GAAP measure, to EBITDA and from EBITDA to Adjusted EBITDA for the periods indicated is as follows:
| Year Ended December 31, | ||||||||||||
| 2015 | 2014 | 2013 | ||||||||||
| (in millions) | ||||||||||||
| Income (loss) from continuing operations |
$ | (150.6 | ) | $ | (180.6 | ) | $ | (216.2 | ) | |||
| Income tax provision (benefit) |
5.6 | 2.5 | 3.0 | |||||||||
| Interest expense, net |
228.2 | 217.0 | 209.2 | |||||||||
| Loss on extinguishment of debt and refinancing costs |
— | 10.1 | 0.8 | |||||||||
| Equity investment income |
1.2 | 0.4 | — | |||||||||
| Other income |
(11.3 | ) | — | — | ||||||||
|
|
|
|
|
|
|
|||||||
| Operating income (loss) |
73.1 | 49.4 | (3.2 | ) | ||||||||
| Depreciation and amortization |
95.2 | 107.3 | 106.0 | |||||||||
|
|
|
|
|
|
|
|||||||
13
Table of Contents
| Year Ended December 31, | ||||||||||||
| 2015 | 2014 | 2013 | ||||||||||
| (in millions) | ||||||||||||
| EBITDA |
$ | 168.3 | $ | 156.7 | $ | 102.8 | ||||||
|
|
|
|
|
|
|
|||||||
| Impairment loss(a) |
69.2 | 24.0 | 38.9 | |||||||||
| Stock-based compensation(b) |
4.3 | 0.6 | (0.9 | ) | ||||||||
| Impact of acquisition accounting adjustments(c) |
1.8 | (4.3 | ) | 2.1 | ||||||||
| Management fees(d) |
2.7 | 2.5 | 2.8 | |||||||||
| Foreign currency transaction (gains) losses(e) |
0.5 | 0.4 | — | |||||||||
| Impact of unrestricted subsidiaries, net of addback(f) |
3.0 | 4.6 | 3.7 | |||||||||
| Acquisition and financing expense(g) |
1.4 | 0.3 | 2.1 | |||||||||
| Severance(h) |
10.8 | 13.8 | 12.3 | |||||||||
| Restructuring costs(i) |
9.4 | 9.5 | 10.8 | |||||||||
| Purchase price finalization(j) |
— | — | (14.2 | ) | ||||||||
| Other(k) |
4.5 | (2.1 | ) | 7.9 | ||||||||
|
|
|
|
|
|
|
|||||||
| Adjusted EBITDA |
$ | 275.9 | $ | 206.0 | $ | 168.3 | ||||||
|
|
|
|
|
|
|
|||||||
| (a) | Represents non-cash losses associated with the impairment of goodwill, intangible assets and other long-lived assets. |
| (b) | Represents non-cash compensation charges. |
| (c) | Represents non-cash adjustments resulting from the revaluation of certain items such as deferred revenue and deferred rent recognized in connection with our prior acquisitions. |
| (d) | Represents the annual sponsor management fee paid pursuant to our management services agreement with THL (the “THL Management Agreement”) described in “Certain Relationships and Related Party Transactions—Management Services Agreements.” The THL Management Agreement will be terminated in connection with this offering. |
| (e) | Represents the net gain or loss resulting from currency remeasurements. |
| (f) | Represents loss from continuing operations of certain foreign subsidiaries that are treated as investments until they reach sustained profitability. |
| (g) | Represents legal and advisory fees incurred in connection with our acquisitions that do not relate to and are not indicative of our core on-going operations. |
| (h) | Represents employee termination costs. |
| (i) | Represents costs in connection with facility closures, relocations, integrations and business optimization. |
| (j) | Represents the final purchase price adjustment recorded in the second quarter of 2013 related to the acquisition of United Health Group’s clinical development business (the “i3 Acquisition”). |
| (k) | Represents third party costs for tax services, franchise taxes and certain non-cash items and one-time costs from third party advisors and gives effect to the results of Catalina Health prior to the closing of the acquisition in the fourth quarter of 2013. |
For a segment-level reconciliation of income (loss) from continuing operations, the most directly comparable GAAP measure, to EBITDA and from EBITDA to Adjusted EBITDA for the periods indicated, see “Management’s Discussion and Analysis of Financial Condition and Results of Operations—Additional Segment Data.”
| (3) | As adjusted information gives effect to the application of the net proceeds received by us from the offering as described under “Use of Proceeds.” |
14
Table of Contents
Investing in our common stock involves a high degree of risk. You should carefully consider the following risk factors and all other information contained in this prospectus before purchasing our common stock. If any of the following risks occur, our business, results of operations or financial condition could be materially and adversely affected. In that case, the trading price of our common stock could decline and you may lose some or all of your investment.
Risks Related to Our Business
Our projects may be delayed, reduced in scope or terminated for reasons beyond our control, which could adversely affect our business, results of operations and financial condition.
Many of our projects, including those in our backlog, may be delayed, reduced in scope or terminated upon short notice (generally 30 to 90 days) without cause. As a result, delays, reductions in scope and cancellations may occur for a variety of reasons that are beyond our control, including:
| • | delays in, or the failure to obtain, required regulatory approvals; |
| • | actions by regulatory authorities; |
| • | the failure of products to satisfy safety requirements or efficiency criteria; |
| • | unexpected or undesired results of the products; |
| • | insufficient patient enrollment; |
| • | insufficient investigator recruitment; |
| • | the client’s lack of available financing, budgetary limits or changing priorities; |
| • | production problems resulting in shortages of the product being tested; |
| • | the client’s decision to terminate the development or commercialization of a product or to end a particular project; |
| • | shift of business to a competitor or internal resources; and |
| • | withdrawal of a product following launch. |
In addition, many of our biopharmaceutical selling solutions service contracts provide our clients with the opportunity to internalize the resources provided under the contract and terminate all or a portion of the services we provide under the contract and our clients may also decide to shift their business to a competitor.
As a result, contract terminations, cancellations, delays and modifications are a regular part of our business. For example, our full service offering within our Clinical segment has been, and may continue to be, negatively impacted by project delays. In addition, project start delays, downsizings and cancellations, particularly within our selling solutions and communications offerings, which are part of our Commercial segment, have impacted our results. The loss, reduction in scope or delay of a large project or of multiple projects could have a material adverse effect on our business, results of operations and financial condition. In addition, we might not realize the full benefits of our backlog if our clients cancel, delay or reduce their commitments to us.
In the event of termination, our contracts may provide reimbursement for the costs of winding down the terminated project as well as fees earned by us up to the time of the termination. These fees may not be sufficient for us to maintain our margins and, as a result, terminations may result in lower operating margins. In addition, cancellation of a clinical trial may result in the unwillingness or inability of our client to satisfy certain associated accounts receivable. We may also be legally or ethically bound to compete or wind down the trial at our own expense. Any of these factors may in turn have a material adverse effect on our business, results of operations and financial condition.
15
Table of Contents
The relationship of backlog, book-to-bill ratio and net new awards to net revenues and operating results varies over time.
Backlog represents future net revenues from work not yet completed or performed under signed contracts, letters of intent or pre-contract commitments that are supported by written communications. Once work begins on a project, net revenues are recognized over the duration of the project. Projects may be terminated or delayed by the client or delayed by regulatory authorities for reasons beyond our control. To the extent projects are delayed, our revenue recognition could be affected. In the event that a client cancels a contract, we typically would be entitled to receive payment for all services performed up to the cancellation date and subsequent client-authorized services related to terminating the canceled project. Typically, however, we have no contractual right to the full amount of the net revenues reflected in our backlog in the event of a contract cancellation. The duration of the projects included in our backlog, and the related revenue recognition, range from a few weeks to many years.
Our backlog at December 31, 2015 was $3,465.4 million compared to backlog of $2,616.0 million at December 31, 2014. Although an increase in backlog will generally result in an increase in net revenues to be recognized over time (depending on the level of cancellations), an increase in backlog at a particular point in time does not necessarily correspond directly to an increase in net revenues during a particular period. The extent to which contracts in backlog will result in future net revenues depends on many factors, including, but not limited, to delivery against projected project schedules, the need for scope changes (change orders), contract cancellations and the nature, duration, size and complexity of the projects, each of which can vary significantly from time to time. Our $3,465.4 million of backlog at December 31, 2015 included approximately $1,973.0 million of backlog that we do not expect to generate net revenues in 2016, compared to our $2,616.0 million of backlog at December 31, 2014, which included approximately $1,310.8 million of backlog that we did not expect to generate net revenues in 2015. While we believe backlog for our Clinical segment can be a useful component of predicting future performance given the multi-year nature of most of the contracts, the majority of our service offerings in our Commercial segment have short term contracts and, as a result, we do not believe backlog is as meaningful a metric and we do not use it as a key metric in managing the Commercial segment. See “Management’s Discussion and Analysis of Financial Condition and Results of Operations—How we Assess our Performance—Backlog, Book-to-Bill Ratio and Net New Awards.”
We also consider net new business awards and book-to-bill ratio in our Clinical segment in assessing our performance. Net new business awards represent the value of future net revenues for services awarded during the period under signed contracts, letters of intent or pre-contract commitments that are supported by written communications that are expected to commence within the next twelve months, net of cancellations of prior awards. Book-to-bill ratio is a ratio calculated by dividing net new business awards by net revenues in a particular period. For the year ended December 31, 2015, our Clinical segment recorded net new business awards of $1,145.3 million and book-to-bill ratio of 1.21x.
The rate at which our backlog converts to net revenues, and the relationship of our book-to-bill ratio and net new business awards to net revenues and operating results, may vary over time for a variety of reasons. The revenue recognition on larger, more global projects could be slower than on smaller, less global projects for a variety of reasons, including, but not limited to, an extended period of negotiation between the time the project is awarded to us and the actual execution of the contract, as well as an increased timeframe for obtaining the necessary regulatory approvals. Additionally, the increased complexity of clinical trials and the need to enroll precise patient populations could extend the length of clinical trials causing revenues to be recognized over a longer period of time. Further, delayed projects will remain in backlog, unless and until otherwise canceled by the client, and will not generate net revenues at the rate originally expected. As a result, the relationship of backlog to realized net revenues and future operating results may vary over time, and may not be indicative of our future net revenues or operating results, and we may not realize the anticipated future net revenues reflected in our backlog, and book-to-bill ratio or net new business awards.
16
Table of Contents
Our financial results may be adversely affected if we underprice our contracts, overrun our cost estimates or fail to receive approval for or experience delays in change orders.
Most of our client contracts are either fee-for-service contracts or fixed-fee contracts. Our financial results have been, and our future financial results may be, adversely impacted if we initially underprice our contracts or otherwise overrun our cost estimates and are unable to successfully negotiate a change order. Change orders and other changes in scope typically occur when the scope of work we perform needs to be modified from that originally contemplated by our contract with the relevant client. Modifications can occur, for example, when there is a change in a key clinical trial assumption or parameter, commercialization strategy or a significant change in timing. Where we are not successful in including out-of-scope work into our current contracts, we bear the cost of the additional work. Even if we are successful in negotiating changes in scope, we cannot recognize additional revenues anticipated from changes in scope until appropriate documentation is received by us from the relevant client authorizing the change. However, if we incur additional expense in anticipation of receipt of that documentation, we must recognize the expense as incurred. Any of the foregoing could have a material adverse effect on our business, results of operations, financial condition and cash flows.
Our operating margins and profitability will be adversely affected if we are unable to achieve operational efficiencies or grow revenues faster than expenses.
We operate in a highly competitive environment and experience competitive pricing pressure. We have implemented initiatives to control our operating expenses, and we will continue to utilize these initiatives in the future with a view to offsetting any such pricing pressures and improving our operational efficiency. However, we cannot be certain that we will be able to achieve the efficiency gains necessary to maintain or grow our operating margins, or that the magnitude of growth in our revenues will be faster than the growth in our operating costs. If we are unable to grow our revenues at a faster rate than our operating costs, our operating margins will be adversely affected. Our initiatives and any future cost initiatives may also adversely affect us, as they may decrease employee morale or make it more difficult for us to meet operational requirements.
Our relationships with existing or potential clients who are in competition with each other may adversely impact the degree to which other clients or potential clients use our services, which may adversely affect our results of operations.
The biopharmaceutical industry is highly competitive, with biopharmaceutical companies each seeking to persuade payers, providers and patients that their products are better and more cost-effective than competing products marketed or being developed by competing firms. We regularly provide services to biopharmaceutical companies who compete with each other, and often with respect to competitive products, and we sometimes provide services to such clients regarding competing products in clinical development. Our existing or future relationships with our biopharmaceutical clients, particularly with respect to any given product that might compete directly with another client’s product, may therefore deter other biopharmaceutical clients from using our services or may result in our clients seeking to place limits on our ability to serve other biopharmaceutical companies. A loss of clients or reductions in the level of revenues from a client could have a material adverse effect on our business, results of operations and financial condition.
If we are unable to recruit suitable willing investigators and patients, there may be a material adverse effect on the results of operations of our Clinical segment and an adverse impact on our ability to attract new business.
The recruitment of investigators and patients for clinical trials is essential to our business. We contract with physicians located in hospitals, clinics and other such sites, who serve as investigators in conducting clinical trials to test new biopharmaceutical products on their patients. Investigators supervise administration of the investigational product to patients during the course of a clinical trial. Patients for clinical trials are generally from the communities in which the clinical trials are conducted. The availability of suitable patients for enrollment in studies is dependent upon many factors including the size of the patient population, the design of the study protocol, eligibility criteria, the referral practices of physicians, the perceived risks and benefits of the
17
Table of Contents
investigational product under study and the availability of alternative medication, including medication undergoing separate clinical trials. The expanding global nature of clinical trials increases the risks associated with attracting suitable investigators and patients, especially if these trials are conducted in regions where our resources or experience may be more limited. Insufficient patient enrollment or investigator recruitment may result in the termination or delay of a clinical trial, or may require us to expend additional funds to obtain access to more investigators and patients than planned which may, in turn, result in additional costs to us. Any of these factors could have a material adverse effect on the results of operations of our Clinical segment, and may also adversely affect our ability to attract new business.
Our insurance may not cover all of our indemnification obligations and other liabilities associated with our operations.
We maintain insurance designed to provide coverage for ordinary risks associated with our operations and our ordinary indemnification obligations. The coverage provided by such insurance may not be adequate for all claims we may make or may be contested by our insurance carriers. If our insurance is not adequate or available to pay liabilities associated with our operations, or if we are unable to purchase adequate insurance at reasonable rates in the future, our profitability may be adversely impacted.
We could lose our access to certain data assets, which could impair our ability to provide certain services.
Our services depend upon continued access to and receipt of data from internal and external sources, including clinical trial data and other data received from clients and strategic partners, and on our ability to utilize such data in our business. Potential security breaches by employees and others with or without permitted access to our systems pose a risk that such data may be exposed to unauthorized persons or to the public, or that such data may be corrupted, lost or otherwise rendered inaccessible. Such breaches could also arise from negligence or fraud on the part of third parties who store, transfer or process our data, or from cyber-attacks by computer programmers and hackers who may develop and deploy viruses, worms or other malicious software programs. In addition, we may lose access to such data for a variety of other reasons, including the loss of any clients or strategic partners through which such data is generated (including as a result of the perception that our systems are not secure), and disruptions or damage to our information systems.
Our ability to utilize such data generally is subject to limitations in agreements we have with certain of our clients and strategic partners, as well as applicable legal and regulatory restrictions. If we violate any such limitations or restrictions, our ability to utilize such data in our business may be adversely effected. Moreover, we may also become subject to increased legislative, regulatory or judicial restrictions or mandates on the collection, disclosure or use of such data, which could result in additional restrictions on our ability to utilize such data, in particular if such data is not collected in a way that allows us to use such data in our business.
Any of these factors would impact our ability to provide certain of our services and could have a material adverse effect on our reputation, our ability to attract clients, and on our business, results of operations and financial condition.
Some of our services involve direct interaction with clinical trial subjects or volunteers and operation of early stage (Phase I and IIa) clinical facilities, which could create potential liability that may adversely affect our business, results of operations and financial condition.
We operate facilities where early stage clinical trials are conducted, which ordinarily involve testing an investigational product on a limited number of individuals to evaluate a product’s basic safety and identify any side effects as well as, in some instances, early indications of efficacy. Failure to operate such a facility in accordance with applicable regulations could result in that facility being shut down, which could materially disrupt our operations. Regulations applicable to our early stage activities are subject to continuing evolution and change, which could result in the imposition of additional restrictions, create additional costs to us or otherwise
18
Table of Contents
negatively impact our offering. We may also become more susceptible to these risks as we expand our early stage offering. For example, we opened our first Phase I clinic in the United States in January 2016 and, as a result, a portion of our early stage activities are now subject to the U.S. regulatory framework.
Additionally, we face risks associated with adverse events resulting from the administration of such investigational products to trial participants and the professional malpractice of medical care providers we employ. We directly employ doctors, nurses and other trained employees who assist in implementing the testing involved in our clinical trials. Any professional malpractice or negligence by such doctors, nurses or other employees could potentially result in liability to us in the event of personal injury to or death of a participant in clinical trials. This liability, particularly if it were to exceed the limits of any indemnification agreements and insurance coverage, may have a material adverse effect on our business, results of operations and financial condition.
We may be adversely affected by client concentration or concentration in therapeutic areas in which we conduct clinical trials.
For the years ended December 31, 2015, 2014 and 2013, an individual client in each year has accounted for approximately 10%, 10% and 12%, respectively, of our net revenues, and our top ten clients accounted for approximately 54%, 48% and 46% of our net revenues, respectively. In addition, our success depends in part on our ability to position ourselves as a partner of choice for clients seeking to consolidate service providers. The reduction or termination of any large client’s relationship with us as a result of consolidation of service providers or otherwise may have a material adverse effect on our business, results of operations or financial condition. Moreover, in recent years the biopharmaceutical industry has experienced consolidation through mergers and acquisitions. The consolidation of our clients may result in the termination or reduction in scope of our existing engagements if client decision makers change as a result of such activity. Consolidation can also result in pricing pressure as an individual client’s business grows.
Additionally, we conduct multiple clinical trials for different clients in single therapeutic areas involving products with the same or similar chemical characteristics, which has in the past, and may in the future, adversely affect our business if some or all of the trials are canceled because of new scientific information or regulatory judgments that affect such products, or if industry consolidation results in the rationalization of clinical development pipelines.
If we are unable to successfully develop and market new services or enter new markets, our growth, business, results of operations and financial condition could be adversely affected.
A key element of our growth strategy is the successful development and marketing of new services or expanding our existing business or entering new markets that complement our existing business. As we develop new services or enter new markets, we may not have or adequately build the competencies necessary to perform such services satisfactorily, may not receive market acceptance for such services or may face increased competition. If we are unable to succeed in developing new services, entering new markets or attracting a client base for our new services or in new markets, we will be unable to implement this element of our growth strategy, and our future business, results of operations and financial condition could be adversely affected.
Our business is subject to international economic, political and other risks that could negatively affect our business, results of operations and financial condition.
A significant portion of our revenue is derived from countries outside the United States. For the years ended December 31, 2015, 2014 and 2013, we derived 22%, 26% and 27%, respectively, of our net revenues from international operations. We anticipate that revenues from international operations will grow in the future. Accordingly, our business is subject to risks associated with doing business internationally, including:
| • | conducting a single clinical trial across multiple countries is complex, and issues in one country (such as a failure to comply with local regulations or restrictions) may affect the progress of the clinical trial in the |
19
Table of Contents
| other countries, for example, by limiting the amount of data necessary for a clinical trial to proceed, resulting in delays or potential cancellation of contracts, which in turn may result in loss of revenues; |
| • | foreign countries are expanding or may expand their regulatory framework with respect to patient informed consent, protection and compensation in clinical trials, which could delay or inhibit our ability to conduct clinical trials in such jurisdictions; |
| • | potential adverse tax consequences, including the complexities of transfer pricing and changes in tax laws that could increase our effective tax rate and affect our ability to repatriate profits; |
| • | unfavorable labor regulations; |
| • | greater difficulties in managing and staffing foreign operations; |
| • | the need to ensure compliance with the numerous regulatory and legal requirements applicable to our business in each of these jurisdictions and to maintain an effective compliance program to ensure compliance with these requirements, including compliance with applicable anti-bribery laws such as the United States Foreign Corrupt Practices Act (the “FCPA”) and the UK Bribery Act of 2010 (the “UK Bribery Act”); |
| • | changes in political and economic conditions leading to changes in the business environment in which we operate, including changes in foreign currency exchange rates or currency exchange controls; |
| • | changes in trade policies, regulatory requirements and other barriers; |
| • | foreign regulatory or judicial authorities enforcing legal rights and recognizing business procedures in a manner in which we are not accustomed or would not reasonably expect; |
| • | potential tax and other legal restrictions on our ability to transfer capital to our international subsidiaries and the ability of our international subsidiaries to remit money to us; and |
| • | longer payment cycles of foreign clients and difficulty collecting receivables in foreign jurisdictions. |
These risks and uncertainties could negatively impact our ability to, among other things, perform large, global projects for our clients. Furthermore, our ability to deal with these issues could be affected by applicable laws and the need to protect our assets. In addition, we will be more susceptible to these risks as we grow our presence in emerging countries and regions, including India, China, Eastern Europe and Latin America, which may be subject to a relatively higher risk of political instability, economic volatility, crime, corruption and social and ethical unrest, all of which are exacerbated in many cases by a lack of an independent and experienced judiciary and uncertainties in how local law is applied and enforced. The realization of any of these or other risks associated with operating in foreign countries could have a material adverse effect on our business, results of operations or financial condition and the potential impact of these risks will continue to grow as we continue to expand into foreign markets.
Due to our role as a global service provider, we may be exposed to liabilities under the FCPA and various other anti-corruption and anti-bribery laws, and any allegation or determination that we violated these laws could have a material adverse effect on our business, results of operations and financial condition.
We offer a broad range of services and operate on a global scale. As a result, we are required to comply with the FCPA, the UK Bribery Act and other U.S. and international anti-corruption laws, which prohibit companies from making corrupt payments to government officials or certain payments or remunerations to certain other recipients. In addition, the FCPA imposes certain books, records, and accounting control obligations on public companies and other issuers. We operate in parts of the world in which corruption can be common and compliance with anti-bribery laws may conflict with local customs and practices. Our global operations face the risk of corrupt conduct by employees, consultants, agents and business partners for which we may be held responsible. Although we have implemented policies and training designed to prohibit these practices, we face the risk of corrupt conduct by employees, consultants, agents and business partners for which we may be held
20
Table of Contents
responsible. If our employees, consultants, agents or business partners are found to have engaged in such practices, we could be subject to severe penalties and other liabilities, which could have a material adverse effect on our business, results of operations and financial condition. In some cases, companies that violate the FCPA may be debarred by the U.S. government and/or lose their U.S. export privileges. As a result, violations of the FCPA or other U.S. or international anti-corruption laws, or even allegations of such violations, could disrupt our business and result in a material adverse effect on our business, results of operations and financial condition. Changes in anti-corruption laws or enforcement priorities could also result in increased compliance requirements and related costs which could adversely affect our business, results of operations and financial condition. In addition, the United States or other governments may seek to hold us liable for successor liability FCPA violations or violations of other U.S. or international anti-corruption laws committed by companies in which we invest or that we acquired or will acquire.
Our business depends on the continued effectiveness and availability of our information systems, including the information systems we use to provide our services to our clients, and failures of these systems may materially limit our operations.
We are dependent on the proper functioning of our information systems in operating our business. Information systems used in daily operations are critical to our ability to provide our services to clients. Additionally, we rely on our information systems in managing our accounting and financial reporting, and to perform billing and accounts receivable functions. Our information systems are protected through physical and software safeguards and we have backup remote processing capabilities and disaster recovery plans in place. However, despite any precautions we take, they are still vulnerable to fire, storm, flood, power loss, telecommunications failures, physical or software break-ins, system failures, computer viruses and similar events. Disruptions to our information systems caused by any such events could adversely affect our business. In the event that critical information systems fail or are otherwise unavailable, these functions would have to be accomplished manually, which could temporarily impact our ability to service our clients effectively, to identify business opportunities quickly, to maintain billing and clinical records reliably, to bill for services efficiently and to maintain our accounting and financial reporting accurately. Moreover, the materialization of any of these risks may impede the processing of data, the delivery of databases and services, and the day-to-day management of our business and could result in the corruption, loss or unauthorized disclosure of proprietary, confidential or other data. Corruption or loss of data may result in the need to repeat a clinical trial at no cost to the client, but at significant cost to us, the termination of a contract or damage to our reputation. Additionally, significant delays in system enhancements or inadequate performance of new or upgraded systems once completed could damage our reputation and harm our business. Finally, long-term disruptions in the infrastructure caused by events such as natural disasters, the outbreak of war, the escalation of hostilities and acts of terrorism, particularly in locations where we have offices, could adversely affect our businesses. Although we carry property and business interruption insurance, our coverage might not be adequate to compensate us for all losses that may occur.
Additionally, potential data security breaches by employees and others with or without permitted access to our systems pose a risk that confidential or sensitive data may be exposed to unauthorized persons or to the public. Such breaches could also arise from negligence or fraud on the part of third parties, including cloud providers, who store, transfer or process our data, or from cyber-attacks by computer programmers and hackers who may develop and deploy viruses, worms or other malicious software programs. Any security breach or failure of our critical information systems could damage our reputation and cause us to lose clients, which could have a material adverse effect on our business, results of operations and financial condition.
Upgrading the information systems that support our operating processes and evolving the technology platform for our services pose risks that could have a material adverse effect on our business, results of operations and financial condition.
Continued efficient operation of our business requires that we implement standardized global business processes and evolve our information systems to enable this implementation. We have continued to undertake
21
Table of Contents
significant programs to optimize business processes with respect to our services. Our inability to effectively manage the implementation and adapt to new processes designed into these new or upgraded systems in a timely and cost-effective manner may have a material adverse effect on our business, results of operations and financial condition.
If we lose or fail to attract and retain key employees and management personnel, our business, results of operations and financial condition could be adversely affected.
Our executive officers and other key employees are among our most important assets. An important aspect of our competitiveness is our ability to attract and retain our executive officers and key employees. There is significant and increasing competition for qualified personnel, particularly those with higher educational degrees, such as a medical degree, a Ph.D. or an equivalent degree, or relevant experience, such as clinical research associates. The loss of the services of key personnel and our inability to recruit effective replacements or to otherwise attract, motivate, or retain highly qualified personnel could have a material adverse effect on our business, results of operations and financial condition.
Disruptions in the credit and capital markets and unfavorable general economic conditions could negatively affect our business, results of operations and financial condition.
Disruptions in the credit and capital markets could have negative effects on our business that may be difficult to predict or anticipate, including the ability of our clients, vendors, contractors and financing sources to meet their contractual obligations. Such disruptions, and any inability of our clients, vendors, contractors and financing sources to meet their obligations to us, could have a material adverse effect on our business, results of operations and financial condition.
Our acquisition strategy may present additional risks.
We have historically grown our business both organically and through acquisitions. We have and will continue to assess the need and opportunity to offer additional services through acquisitions of other companies. Acquisitions involve numerous risks, including the following:
| • | ability to identify suitable acquisition opportunities or obtain any necessary financing on commercially acceptable terms; |
| • | increased risk to our financial position and liquidity through changes to our capital structure and assumption of acquired liabilities, including any indebtedness incurred to finance the acquisitions and related interest expense; |
| • | diversion of management’s attention from normal daily operations of the business; |
| • | insufficient revenues to offset increased expenses associated with acquisitions; |
| • | assumption of liabilities and exposure to unforeseen liabilities of acquired companies, including liabilities for their failure to comply with healthcare, tax and other regulations; |
| • | inability to achieve identified operating and financial synergies anticipated to result from an acquisition; |
| • | ability to integrate acquired operations, products and technologies into our business; |
| • | difficulties integrating acquired personnel and distinct cultures into our business; and |
| • | the potential loss of key employees, clients or projects. |
If any of these risks were to materialize, it could have a material adverse effect on our business, results of operations and financial condition.
22
Table of Contents
Downgrades of our credit ratings could adversely affect us.
We can be adversely affected by downgrades of our credit ratings because ratings are a factor influencing our ability to access capital and the terms of any new indebtedness, including covenants and interest rates. Our clients and vendors may also consider our credit profile when negotiating contract terms, and if they were to change the terms on which they deal with us, it could have a material adverse effect on our business, results of operations and financial condition.
Many of our vendors have the right to declare us in default of our agreements if any such vendor, including the lessors under our vehicle fleet leases, determines that a change in our financial condition poses a substantially increased credit risk. Upon default, the lessors can repossess the vehicles and require us to compensate them for any remaining lease payments in excess of the value of the repossessed vehicles. As of December 31, 2015, we had $66.7 million in capital lease obligations, primarily related to vehicles used in our selling solutions offering in the United States. Our selling solutions offering may be negatively impacted if we lost the use of vehicles for any period of time.
Exchange rate fluctuations may affect our results of operations and financial condition.
For the years ended December 31, 2015, 2014 and 2013, we derived 22%, 26% and 27%, respectively, of our net revenues from international operations, and the percentage of our revenues attributable to our international operations may increase as our activities in international geographies increase. Because our financial statements are denominated in U.S. Dollars, factors associated with international operations, including changes in foreign currency exchange rates, could significantly affect our results of operations and financial condition. See “Management’s Discussion and Analysis of Financial Condition and Results of Operations—Quantitative and Qualitative Disclosures About Market Risk—Foreign Currency Exchange Rate Exposure.” Exchange rate fluctuations between local currencies and the U.S. Dollar create risk in several ways, including the following:
| • | The revenues and expenses of our foreign operations are generally denominated in local currencies and translated into U.S. Dollars for reporting purposes. In addition, in some cases domestic transactions are denominated in currencies other than U.S. Dollars. Accordingly, exchange rate fluctuations will affect the translation of results from our foreign operations or such transactions into U.S. Dollars for purposes of reporting our consolidated results. |
| • | Our service contracts may be denominated in a currency other than the currency in which we incur expenses related to such contracts. For example, the majority of our global contracts are denominated in U.S. Dollars or Pound Sterling, while the currency used to fund our operating costs in foreign countries is denominated in various different currencies. Accordingly, exchange rate fluctuations may affect our profitability with respect to such contracts. |
| • | We typically earn revenues from our service contacts over a period of several months and, in many cases, particularly in our Clinical segment, over several years. Accordingly, exchange rate fluctuations during this period may affect our profitability with respect to such contracts. |
In some cases, as part of our risk management strategies, we may choose to hedge our exposure to foreign currency exchange rate through the utilization of derivative financial instruments. If we misjudge these risks, there could be a material adverse effect on our operating results and financial position. In addition, changes in exchange rates for foreign currencies may reduce international demand for our products, increase our labor or supply costs in international markets, or reduce the U.S. Dollar value of revenues we recognize. These and other economic factors could have an adverse effect on demand for our products and services, and on our business, results of operations and financial condition.
23
Table of Contents
We face risks arising from the restructuring of our operations.
From time to time, we have adopted plans to improve our operating efficiency through various means, such as reduction of overcapacity, elimination of non-billable support roles or other realignment of resources. For example, for the years ended December 31, 2015 and 2014 we recognized $16.4 million and $17.9 million, respectively, of restructuring charges. Restructuring presents significant potential risks of events occurring that could adversely affect us, including:
| • | actual or perceived disruption of service or reduction in service standards to clients; |
| • | the failure to preserve relationships with clients, vendors and other important third parties and to resolve conflicts that may arise; |
| • | loss of sales and revenues as we reduce or eliminate personnel in non-core services; |
| • | diversion of management attention from ongoing business activities; and |
| • | the failure to maintain employee morale and retain key employees. |
Because of these and other factors, we cannot predict whether we will realize the purpose and anticipated benefits of these measures and, if we do not, our business, results of operations and financial condition may be adversely affected.
Additionally, there may be delays in implementing restructuring activities or a failure to achieve the anticipated levels of cost savings and efficiency as a result of the restructuring activities, each of which could materially and adversely impact our business, results of operations and financial condition. Further restructuring or reorganization activities may also be required in the future beyond what is currently planned, which could further enhance the risks associated with these activities.
Our field-based and functional-based offerings could subject us to significant employment liability.
With our field-based and functional-based offerings, our employees may be placed at the physical workplaces of our clients and may have varying levels of client direction in their roles. The risks of this activity include claims of errors and omissions, misuse or misappropriation of client proprietary information, theft of client property and torts or other claims under employment liability, co-employment liability or joint employment liability. We have policies and guidelines in place to reduce our exposure to such risks, but if we fail to follow these policies and guidelines, we may suffer reputational damage, loss of client relationships and business and monetary damages. Any such outcome could have a material adverse effect on our business, results of operations and financial condition.
Our success will depend on our ability to obtain, maintain and protect our intellectual property rights.
We rely on a combination of contractual provisions, confidentiality procedures and patent, copyright, trademark, service mark, trade secret and other intellectual property laws to protect the proprietary aspects of our brands, technology and data. These legal measures afford only limited protection, and competitors or others may gain access to or use our intellectual property and proprietary information. Our success will depend, in part, on preserving our trade secrets, maintaining the security of our data and know-how and obtaining and maintaining other intellectual property rights. We may not be able to obtain or maintain intellectual property or other proprietary rights necessary to our business or in a form that provides us with a competitive advantage. In addition, our trade secrets, data and know-how could be subject to unauthorized use, misappropriation, or disclosure to unauthorized parties, despite our efforts to enter into confidentiality agreements with our employees, consultants, clients and other vendors who have access to such information, and could otherwise become known or be independently discovered by third parties. Our intellectual property, including trademarks, could be challenged, invalidated, infringed, and circumvented by third parties, and our trademarks could also be diluted, declared generic or found to be infringing on other marks. If any of the foregoing occurs, we could be
24
Table of Contents
forced to re-brand our services, resulting in loss of brand recognition and requiring us to devote resources to advertising and marketing new brands, and suffer other competitive harm. Third parties may also adopt trademarks similar to ours, which could harm our brand identity and lead to market confusion. Failure to obtain and maintain intellectual property rights necessary for our business and failure to protect, monitor and control the use of our intellectual property rights could negatively impact our ability to compete and cause us to incur significant expenses. The intellectual property laws and other statutory and contractual arrangements in the United States and other jurisdictions we depend upon may not provide sufficient protection in the future to prevent the infringement, use or misappropriation of our trademarks, data, technology and other intellectual property and services, and may not provide an adequate remedy if our intellectual property rights are infringed, misappropriated or otherwise violated.
Litigation and other intellectual property related proceedings may be necessary to enforce our intellectual property rights, to protect our trade secrets and to determine the validity and scope of our intellectual property and proprietary rights. In addition, a third party may allege that we infringe, misappropriate or otherwise violate its intellectual property. Any future litigation or other proceeding, regardless of outcome, could result in substantial expense and diversion of our resources and management attention, and we may not prevail in any such litigation or proceeding. Any of the foregoing could have a material adverse effect on our business, results of operations and financial condition.
The intellectual property of our clients may be damaged, misappropriated, stolen, or lost while in our possession, subjecting us to litigation and other adverse consequences.
In the course of providing services to our clients, we may be granted access to and rights to use certain intellectual property of our clients. If such intellectual property is damaged, misappropriated, stolen, or lost, we could suffer, among other consequences:
| • | claims under indemnification provisions in client agreements or other liability for damages, which could be substantial; |
| • | delayed or lost revenues, including due to adverse client reaction; |
| • | negative publicity; and |
| • | litigation that could be costly and time consuming. |
Any adverse impact attributable to any of the foregoing factors could have a material adverse effect on our business, results of operations and financial condition.
We may not properly manage any future expansion or contraction of our business.
Significant expansion or contraction in our business could strain our operational, human and financial resources and facilities. If we fail to properly manage any changes, our expenses might grow more than revenues and our business, results of operations and financial condition might be materially and adversely affected. In order to manage expansion or contraction, we must, among other things:
| • | continue to improve our operating, administrative and information systems; |
| • | continue to enhance our compliance function; |
| • | accurately predict our future personnel, resource and facility needs to meet our commitments; |
| • | track the progress of ongoing projects; and |
| • | attract and retain qualified management as well as scientific, technical and other operating personnel. |
Since the purchase of our company by THL in 2010, we have made substantial investments and strategic acquisitions to expand our service offerings and geographic presence. To manage that growth as well as any
25
Table of Contents
future growth, we must continue to improve our operating, compliance and administrative systems and attract and retain qualified management, professional, scientific and technical operating personnel. In addition, we have numerous service offerings. If we cannot properly manage these offerings, it may disrupt our operations. The nature and pace of our growth increases risks associated with client dissatisfaction related to, amongst other things, quality control and project delays. We cannot assure you that we will identify and effectively address any potential weaknesses and areas for improvement in our operational, compliance, human and financial resources, policies and procedures that may be required or appropriate as a result of our growth.
We also face additional risks in expanding our international operations to support growth. Specifically, we might find it difficult to:
| • | assimilate differences in international business practices and regulations; |
| • | properly integrate systems and operating procedures; |
| • | hire and retain qualified personnel; and |
| • | overcome language and cultural barriers. |
International growth of our business may require additional investment in resources to ensure compliance with applicable laws and regulatory requirements. Significant additional spending on compliance resources could adversely affect our margins.
Our inability to effectively manage growth, and to effectively maintain and enhance our operating, compliance and administrative systems in connection with our growth, could have a material adverse effect on our business, results of operations and financial condition.
Tax matters could materially adversely affect our operating results and financial condition.
We operate worldwide and our earnings are subject to taxation in many differing jurisdictions and at differing rates. We seek to organize our affairs in a tax-efficient manner, taking account of the jurisdictions in which we operate. Our provision for income taxes and cash tax liability in the future could be adversely affected by numerous factors, including income before taxes being lower than anticipated in countries with lower statutory tax rates and higher than anticipated in countries with higher statutory tax rates, changes in the valuation of deferred tax assets and liabilities, and changes in tax laws and regulations, which could have a material adverse effect on our business, results of operations and financial condition. In addition, we are subject to recurring examination of our income tax returns by the U.S. Internal Revenue Service (the “IRS”) and other tax authorities. We regularly assess the likelihood of adverse outcomes resulting from these examinations to determine the adequacy of our provision for income taxes. The outcomes from these examinations may have a material adverse effect on our provision for income taxes and tax liability.
Our effective income tax rate may fluctuate, which may adversely affect our results of operations, net income and earnings per share.
Our effective income tax rate is influenced by our profitability in the various taxing jurisdictions in which we operate. Changes in the distribution of profits and losses among taxing jurisdictions may have a significant impact on our effective income tax rate, which in turn could have an adverse effect on our net income and earnings per share. Factors that may affect our effective income tax rate include, but are not limited to:
| • | the incurrence of pre-tax losses in jurisdictions where no income tax benefit can be recognized; |
| • | the repatriation of foreign earnings to the United States or the recognition of a tax provision against expected future repatriation; |
| • | changes in tax laws in various taxing jurisdictions; |
26
Table of Contents
| • | changes in our capital structure; |
| • | audits by taxing authorities; |
| • | the establishment of or increase in valuation allowances against deferred income tax assets if we determine that it is more likely than not that future income tax benefits will not be realized; and |
| • | the reversal of existing valuation allowances when we conclude that existing valuation allowances are not required may benefit our effective tax rate in the period of reversal, but may lead to higher effective tax rates in future periods as earnings will be subject to full tax provisions rather than an offset against the valuation allowance. |
These changes may cause fluctuations in our effective income tax rate that could have a material adverse effect on our results of operations and cause fluctuations in our net income and earnings per share, on both an annual and quarterly basis.
Our results of operations may be adversely affected if we fail to realize the full value of our goodwill and intangible assets.
As of December 31, 2015, we had goodwill and net intangible assets of $1,230.0 million, which constituted approximately 57.1% of our total assets at the end of this period. We assess the realizability of our indefinite-lived intangible assets and goodwill annually and conduct an interim evaluation whenever events or changes in circumstances, such as operating losses or a significant decline in earnings associated with the acquired business or asset, indicate that these assets may be impaired. Our ability to realize the value of the goodwill and indefinite-lived intangible assets will depend on the future cash flows of the businesses we have acquired, which in turn depend in part on how well we have integrated these businesses into our own business. As of December 31, 2015, there was approximately $135.3 million of goodwill associated with five reporting units for which the fair value of those reporting units does not significantly exceed the respective carrying values as of the last annual impairment assessment. If we are not able to realize the value of the goodwill and indefinite-lived intangible assets, we may be required to incur material charges relating to the impairment of those assets. Such impairment charges could materially and adversely affect our results of operations and financial condition.
Any future litigation against us could be costly and time-consuming to defend.
We may, from time to time, become subject to legal proceedings, claims or investigations that arise in the ordinary course of business or pursuant to governmental or regulatory enforcement activity. For example, we may be subject to legal proceedings, claims and investigations if we fail to perform our services in accordance with applicable contractual requirements, regulatory standards and ethical considerations. Additionally, our selling solutions personnel utilize company automobiles in the performance of their duties, and we may be subject to legal proceedings and claims resulting from such use. While we do not believe that the resolution of any currently pending lawsuits against us will, individually or in the aggregate, be material to our business, we can provide no assurance as to the outcome of such lawsuits. Accordingly, any such lawsuits, as well as any legal proceedings or claims to which we subsequently become a party or any investigations to which we subsequently become subject, could result in substantial costs and divert management’s attention and resources, which could have a material adverse effect on our business, results of operations and financial condition.
Although we attempt to negotiate indemnification agreements with our clients, subcontractors and other vendors, we may not have the benefit of any such indemnification agreement for certain claims and liabilities. In addition, even if such an indemnification agreement does exist, any legal proceedings, claims or investigations could result in potential liability for us if the claim is outside the scope of the relevant indemnification agreement, if the relevant client, subcontractor or vendor does not abide by the relevant indemnification agreement as required, or if the liability exceeds the amount of any applicable indemnification limits. In addition, although we maintain the types and amounts of insurance we view as customary in the industries and countries in which we operate, such insurance might not cover any such claims or liabilities, might not provide sufficient
27
Table of Contents
payments to cover all of the costs to resolve one or more such claims, or might not continue to be available on terms acceptable to us. Claims or liabilities that are uninsured or underinsured could result in unanticipated costs and could have a material adverse effect on our business, results of operations and financial condition.
We rely on third parties for important products and services.
We depend on certain third parties to provide us with products and services critical to our business. Such third parties include software providers, CRO subcontractors and providers of information technology infrastructure. The failure of any of these third parties to adequately provide the required products or services, or to do so in compliance with applicable contractual and regulatory requirements, could have a material adverse effect on our business, results of operations and financial condition.
We are subject to a variety of environmental, health and safety laws and regulations, and we are subject to risks and requirements relating to our use of regulated materials, including biomedical waste and other hazardous materials.
We handle biomedical waste, hazardous materials, chemicals and various radioactive compounds. We are subject to a variety of federal, state, local, foreign and provincial environmental laws and regulations governing, among other matters, the use, management, storage, handling, release and disposal of these materials and wastes, and worker health and safety. Failure to comply with such laws and regulations, which tend to become more stringent over time, could result in, among other sanctions, fines or penalties, obligations to investigate or remediate contamination, or claims for property damage or personal injury. We cannot eliminate the risk of accidental contamination or injury from these materials. In such event, we could be held liable for any resulting damages and incur liabilities which may have a material adverse effect on our business, results of operations and financial condition. In addition, we cannot predict the extent of the adverse effect on our business or the financial and other costs that might result from any new laws and regulations arising out of future legislative, administrative or judicial actions.
We have a history of net losses and may not achieve or sustain profitability in the future.
We incurred losses from continuing operations of $(150.6) million, $(180.6) million and $(216.2) million for the years ended December 31, 2015, 2014 and 2013, respectively. We may not achieve profitability in the foreseeable future, if at all. Although our net revenues have increased in recent periods, we may not be able to sustain this growth. In addition, our expenses have generally increased with our growth in net revenues. If we are unable to grow our net revenues at a faster rate than our operating costs, our operating margins will be adversely affected.
Risks Related to Our Industry
Declines in outsourcing expenditures for clinical development and commercialization services by companies in the biopharmaceutical industry could adversely affect our business, results of operations and financial condition.
Our revenues are highly dependent on expenditures by companies in the biopharmaceutical industry for outsourced clinical development and commercialization services. If aggregate demand for these services declines, or if demand for these services fails to grow at projected rates, our business, results of operations and financial condition could be materially and adversely affected. Accordingly, economic factors and industry trends in the biopharmaceutical industry affect our business. In addition, the following factors, among others, could cause demand for our services to decline:
| • | the ability and willingness of companies in the biopharmaceutical industry to spend on R&D and commercialization; |
| • | the ability of biopharmaceutical companies to raise capital to fund their R&D and commercialization projects; |
28
Table of Contents
| • | governmental reform or private market initiatives intended to reduce the cost of biopharmaceutical products, or governmental, medical association or biopharmaceutical industry initiatives designed to regulate the manner in which biopharmaceutical companies promote their products; |
| • | further consolidation in the biopharmaceutical industry, which could negatively affect certain of our service offerings by reducing overall outsourced expenditures if we are unsuccessful in winning business from the consolidated entity, or could result in the delay or cancellation of existing projects, cause reductions in overall outsourcing expenditures, or lead to increased pricing pressures; and |
| • | companies electing to perform clinical development and commercialization services we provide internally based on industry or company-specific factors, such as the rate of new product development, the number of professionals employed internally in relation to demand for or the need to promote new and existing products or develop new products. |
Actions by government regulators or clients to limit a prescription’s scope or withdraw an approved product from the market could adversely affect our business, results of operations and financial condition.
Government regulators have the authority, after approving a biopharmaceutical product, to limit its scope of prescription or withdraw it from the market completely based on safety concerns. Similarly, clients may act to voluntarily limit the scope of prescription of biopharmaceutical products or withdraw them from the market. In the past, we have provided services with respect to products that have been limited and/or withdrawn. If we are providing services to clients for products that are limited or withdrawn, we may be required to narrow the scope of or terminate our services with respect to such products, which would prevent us from earning the full amount of revenues anticipated under the related contracts with negative impacts to our business, results of operations and financial condition.
Recent and future health care reform initiatives or changes in the reimbursement policies of third party payers may negatively impact our business, results of operations and financial condition.
The U.S. Congress continues to consider healthcare reform legislation and impose healthcare industry cost containment measures, which may significantly impact the biopharmaceutical industry. In addition, numerous foreign and domestic governmental bodies are considering or have adopted various healthcare reforms and may undertake, or are in the process of undertaking, efforts to control growing healthcare costs through legislation, regulation and voluntary agreements with medical care providers and biopharmaceutical companies. We are uncertain as to the effects of these recent reforms on our business and are unable to predict what legislative proposals, if any, will be adopted in the future. If regulatory cost containment efforts limit the profitability of new biopharmaceutical products, our clients may reduce their R&D spending or commercialization expenditures, which could reduce the business they outsource to us.
For example, most of our net revenues are generated from clients whose businesses are involved in the development, manufacture and commercialization of biopharmaceutical products. Sales of biopharmaceutical products are dependent, in large part, on the availability and extent of reimbursement from government health administration authorities, private health insurers and other organizations. Changes in government regulations or private third-party payers’ reimbursement policies may reduce reimbursement for biopharmaceutical products and adversely affect demand for our services, resulting in a material adverse effect on our business, results of operations and financial condition.
The Patient Protection and Affordable Care Act, as amended by the Health Care and Education Reconciliation Act (collectively, the “Affordable Care Act”) introduces an extensive set of new laws to the health care industry. Among other things, this law imposes cost-containment measures intended to reduce or constrain the growth of healthcare spending, enhances remedies against healthcare fraud and abuse, adds new requirements for biopharmaceutical companies to disclose payments to physicians, including principal investigators, imposes
29
Table of Contents
new taxes and fees on biopharmaceutical companies and imposes additional health policy reforms. Accordingly, while the Affordable Care Act will likely increase the number of patients who have insurance coverage for biopharmaceutical products, it also made changes that adversely affect our clients’ businesses and therefore, our business, including increasing rebates required from biopharmaceutical companies whose products are covered by state Medicaid programs, requiring discounts for biopharmaceutical products that are covered by Medicare Part D and imposing new fees on manufacturers of branded biopharmaceuticals. In addition, regulations promulgated pursuant to the Affordable Care Act or new laws may create risks of liability or otherwise increase our costs.
Managed care organizations continue to seek price discounts and to impose restrictions on the coverage of particular biopharmaceutical products. Government efforts to reduce Medicaid expenses may lead to increased use of managed care organizations by Medicaid programs. This may result in managed care organizations influencing prescription decisions for a larger segment of the population and a corresponding constraint on prices and reimbursement for biopharmaceutical products. Any of these developments could have a material adverse effect on our business, results of operations and financial condition.
Foreign and domestic governmental bodies may also adopt healthcare legislation or regulations that are more burdensome than existing regulations. For example, (i) product safety concerns and recommendations by the Drug Safety Oversight Board could change the regulatory environment for biopharmaceutical products, (ii) additional legislative initiatives or laws could limit biopharmaceutical sales and marketing practices and (iii) new or heightened regulatory and licensing requirements may increase our expenses or limit or delay our ability to offer some of our services. Additionally, new or heightened regulatory requirements may have a negative impact on the ability of our clients to conduct clinical trials. Any of these factors which could reduce the need for our services, which could have a material adverse effect on our business, results of operations and financial condition.
We operate in highly competitive industries and may face price pressure or other conditions that could adversely affect our business, results of operations and financial condition.
Our business is dependent on our ability to grow our existing client relationships, obtain new clients and cross-sell our services, as well as our ability to maintain existing client contracts for clinical development and commercial services. The biopharmaceutical industry is fragmented and highly competitive. We often compete for business with both large and smaller specialty CROs, large global communications holding companies and smaller specialized communications agencies. Our largest competitors are the internal R&D departments and sales and marketing organizations within our clients and potential clients, many of which could be considered large services companies in their own right. Some of these competitors have greater financial resources and a wider range of services relative to our competitive offering over a greater geographic area than we do. In addition, the biopharmaceutical industry has experienced consolidation in recent years and may continue to experience further consolidation, which is likely to produce more competition from the resulting larger companies. Increased competition has led to price and other forms of competition, such as acceptance of less favorable contract terms, which could adversely affect our business, results of operations and financial condition. Increased competition among biopharmaceutical companies as a result of patent expirations, further consolidation in the biopharmaceutical industry, market acceptance of generic biopharmaceutical products and efforts by governmental agencies and privately managed care organizations to reduce healthcare costs have also added to pricing pressures.
Biopharmaceutical companies continue to seek long-term strategic collaborations with global CROs with favorable pricing terms. Competition for these collaborations is intense and we might not be selected, in which case a competitor may enter into the collaboration and our business with the client, if any, may be limited. In the event that we enter into long-term strategic collaborations with clients, we may experience pricing pressure on the services we sell to those clients. Our failure to develop or maintain these types of relationships and the pricing pressure resulting from these relationships could have a material adverse effect on our business, results of operations and financial condition.
30
Table of Contents
Additionally, purchasing power within our clients is increasingly shifting from decision makers within business units to a centralized procurement function. This shift is increasing the negotiating leverage of many of our clients and, as a result, limits our ability to negotiate agreements with favorable terms. This in turn creates pricing pressure and may reduce our net revenues and operating margins, which could have a material adverse effect on our business, results of operations and financial condition.
Our clients face intense competition from lower cost generic products and other competing products, which may lower the amount that they spend on our services and could have a material adverse effect on our business, results of operations and financial condition.
Our clients face increasing competition from competing products and, in particular, from lower cost generic products, which in turn may affect their ability to pursue clinical development and commercialization activities. In the United States, the European Union (“EU”) and Japan, political pressure to reduce spending on prescription products has led to legislation and other measures which encourage the use of generic products. In addition, proposals emerge from time to time in the United States and other countries for legislation to further encourage the early and rapid approval of generic products. Loss of patent protection for a product typically is followed promptly by generic substitutes, reducing our clients’ sales of that product and their overall profitability. Availability of generic substitutes for our clients’ products or other competing products may cause them to lose market share and, as a result, may adversely affect their results of operations and cash flow, which in turn may mean that they would not have adequate capital to purchase our services. If competition from generic or other products impacts our clients’ finances such that they decide to curtail our services, our net revenues may decline and this could have a material adverse effect on our business, results of operations and financial condition.
If we fail to perform our services in accordance with contractual requirements, regulatory standards and ethical considerations, we could be subject to significant costs or liability and our reputation could be harmed.
We have contractual relationships with biopharmaceutical companies to perform a wide range of services to assist them in bringing new products to market. The process of bringing a new product to market is time-consuming and expensive. Our services are complex and subject to contractual requirements, regulatory standards and ethical considerations. For example, we must adhere to regulatory requirements, such as regulatory requirements of the FDA and current good clinical practice (“GCP”), good laboratory practice (“GLP”) and good manufacturing practice (“GMP”) requirements. If we do not perform our services to contractual requirements, regulatory standards or ethical considerations, the clinical trial process could be adversely affected. Additionally, if clinical trial services such as laboratory analysis or electronic data capture and related services do not conform to contractual or regulatory standards, trial participants or trial results could be affected. As a result, regulatory agencies may take action against us or our clients. Such regulatory actions may include sanctions (such as injunctions or failure of such regulatory authorities to grant marketing approval of products), imposition of clinical holds or delays, suspension or withdrawal of approvals, rejection of data collected in our studies, license revocation, product seizures or recalls, operational restrictions, civil or criminal penalties or prosecutions, damages or fines. Additionally, actions by regulatory authorities, if they result in significant inspectional observations or other measures, could harm our reputation and cause clients not to award us future contracts or to cancel existing contracts. Clients may also bring claims against us, including claims for breach of contractual obligations to comply with regulatory requirements, which could result in substantial costs and divert management’s attention and resources, and we may also be required to bear the cost of any additional work required to address any such regulatory actions. For example, we are currently party to an arbitration in which a former client has alleged breach of contract, fraud in the inducement and common law fraud in connection with services we performed with respect to a Phase III clinical trial of on its investigational drug. See “Business—Legal Proceedings.”
We also contract with physicians to serve as investigators in conducting clinical trials, and in some cases we enter into sub-contracting arrangements pursuant to which our sub-contractors agree to contract with physicians to serve as investigators. Such studies create risk of liability for personal injury to, or death of, clinical trial participants, particularly to clinical trial participants with life-threatening illnesses, resulting from adverse
31
Table of Contents
reactions to the products administered during testing. If the investigators commit errors or make omissions during a clinical trial that result in harm to clinical trial patients or after a clinical trial to a patient using the product after it has received regulatory approval, claims for personal injury or products liability damages may result. Additionally, if the investigators engage in fraudulent behavior, clinical trial data may be compromised, which may require us to repeat the clinical trial. In addition, it is possible third parties could claim that we should be held liable for losses arising from any fraudulent behavior, professional malpractice or error of the investigators or sub-contractors with whom we contract, or in the event of personal injury to or death of persons participating in clinical trials. We do not believe we are legally accountable for the medical care rendered by third-party investigators, and we would vigorously defend any such claims. However, such claims may still be brought against us, and it is possible we could be found liable for these types of losses, which could have a material adverse effect on our business, results of operations and financial condition.
Further, when we commercialize biopharmaceutical products under contract for our clients, we could suffer liability for harm allegedly caused by those products, either as a result of a lawsuit to which we are joined, a lawsuit naming us, or an action launched by a regulatory body. Any such liability could be significant, and could have a material adverse effect on our business, results of operations, financial condition and reputation. Furthermore, negative publicity associated with harm caused by products we helped to market could have a material adverse effect on our business and reputation.
Further, regulation and ethical standards applicable to our business directly or indirectly through agreements with our clients is subject to continuing evolution and change. We may also become subject to new or additional regulatory or ethical requirements as we enter new markets or expand our service offerings. For example, we opened our first Phase I clinic in the United States in January 2016 and, as a result, a portion of our early stage services are now subject to the U.S. regulatory framework. Failure to comply with such laws, regulations and ethical standards, or significant changes in laws or regulations and ethical standards affecting our clients or the services we provide, could result in the imposition of additional restrictions, create additional costs to us or otherwise negatively impact our business operations. See “Business—Government Regulation.”
Our services are subject to evolving industry standards and rapid technological changes. If we do not keep pace with rapid technological changes, our services may become less competitive or obsolete, which could have a material adverse effect on our business, results of operations and financial condition.
The markets for our services are characterized by rapidly changing technology, evolving industry standards and frequent introduction of new and enhanced services. To succeed, we must continue to enhance our existing services, introduce new services on a timely and cost-effective basis to meet evolving client requirements, integrate new services with existing services, achieve market acceptance for new services, and respond to emerging industry standards and other technological changes.
Moreover, the introduction of new services embodying new technologies and the emergence of new industry standards could render existing services obsolete or less attractive. Our continued success will depend on our ability to adapt to changing technologies, manage and process ever-increasing amounts of data and information and improve the performance, features and reliability of our services in response to changing client and industry demands. We may experience difficulties that could delay or prevent the successful design, development, testing, introduction or marketing of our services. New services, or enhancements to existing services, may not adequately meet the requirements of current and prospective clients or achieve any degree of significant market acceptance. If we fail to meet marketplace needs, or if other companies introduce superior products or services, our competitive position would be harmed, which could reduce demand for our services and could have a material adverse effect on our business, results of operations and financial condition.
The industry in which we operate is subject to a high degree of government regulation. If we fail to comply with applicable laws and regulations, we could face substantial penalties and our business, results of operations and financial condition could be adversely affected.
The biopharmaceutical industry in which we operate is subject to a high degree of governmental regulation, at the federal, state and international levels, and our clients are subject to extensive government regulation.
32
Table of Contents
Generally, compliance with these laws and regulations is the responsibility of those clients. However, several of our service offerings are themselves subject to the direct effect of government regulation in several areas, including biopharmaceutical, biotechnology and medical device promotions, sales and development regulations, information security and privacy laws and healthcare fraud and abuse laws and resolutions. For example, we must adhere to regulatory requirements, such as regulatory requirements of the FDA and GCP, GLP and GMP requirements. Our selling solutions offering subjects us to federal and state laws pertaining to healthcare fraud and abuse, as well as similar laws in other jurisdictions in which we operate, which have been used to sanction entities for engaging in the off-label promotion and marketing of pharmaceutical products. In particular, the FDA’s regulations against off-label promotion require sales representatives to restrict promotion of the approved product they are detailing to the approved labeling for the product. Our selling solutions offering also must comply with the federal anti-kickback statute, which imposes both civil and criminal penalties for, among other things, offering or paying any remuneration to induce someone to refer patients to, or to purchase, lease or order (or arrange for or recommend the purchase, lease or order of) any item or service for which payment may be made by Medicare, as well as similar laws in other jurisdictions in which we operate. In addition, even though we do not and will not order healthcare services or bill directly to Medicare, Medicaid or other third party payers, certain federal and state healthcare laws and regulations pertaining to fraud and abuse are and will be applicable to our business.
If we fail to perform our services in accordance with these requirements, regulatory agencies may take action against us for failure to comply with applicable regulations governing clinical trials or commercialization practices, and we could be subject to healthcare fraud and abuse laws of both the federal government and the states in which we conduct our business. Such actions may include sanctions, such as injunctions or failure of such regulatory authorities to grant marketing approval of products, delay, suspension or withdrawal of approvals, license revocation, product seizures or recalls, operational restrictions, civil or criminal penalties or prosecutions, damages or fines. In addition, we may be liable under certain of our client contracts for the violation of government laws and regulations by our clients to the extent those violations result from, or relate to, the services we have performed for such clients. Further, regulation applicable to our business directly or indirectly through agreements with our clients is subject to continuing evolution and change. We may also become subject to new or additional regulatory or ethical requirements as we enter new markets or expand our service offerings. For example, we opened our first Phase I clinic in the United States in January 2016 and, as a result, a portion of our early stage services are now subject to the U.S. regulatory framework. Failure to comply with such laws and regulations or significant changes in laws or regulations affecting our clients or the services we provide could result in the imposition of additional restrictions, require us to curtail or restructure our operations, subject us to penalties, damages or fines, create additional costs to us or otherwise negatively impact our business operations, any of which could have a material adverse effect on our business, results of operations and financial condition. See “Business—Government Regulation.” The growth of our business, particularly in new geographies, may require additional investment in compliance resources to ensure compliance with applicable laws and regulatory requirements, which could adversely affect our operating margins.
Circumstances beyond our control could cause the CRO industry to suffer reputational or other harm that could result in an industry-wide reduction in demand for CRO services, which could harm our business.
Demand for our services may be affected by perceptions of our clients regarding the CRO industry as a whole. For example, other CROs could engage in conduct that could render our clients less willing to do business with CROs generally, including with us. Although to date no event has occurred causing material industry-wide reputational harm, one or more CROs could engage in or fail to detect malfeasance, such as inadequately monitoring sites, producing inaccurate databases or analysis, falsifying patient records, performing incomplete lab work, or taking other actions that would reduce the confidence of our clients in the CRO industry. As a result, the willingness of biopharmaceutical companies to outsource clinical development to CROs could diminish, and our business, results of operations and financial condition could be materially harmed.
33
Table of Contents
Current and proposed laws and regulations regarding the protection of personal data could result in increased risks of liability or increased cost to us or could limit our service offerings.
Our services depend upon continued access to and receipt of data from internal and external sources, including clinical trial data and other data received from clients and strategic partners, and on our ability to utilize such data in our business. For example, some of the services provided within our medication adherence offering involve access to Protected Health Information (“PHI”) and communications (such as refill reminders) with federal health care program beneficiaries and other direct consumers of health care products and services.
The confidentiality, collection, use and disclosure of personal data, including clinical trial patient-specific information, are subject to governmental regulation generally in the country that the personal data were collected or used. For example, U.S. federal regulations under the Health Insurance Portability and Accountability Act of 1996 (“HIPAA”), and as amended in 2014 by the Health Information Technology for Economic and Clinical Health (“HITECH”) Act, require individuals’ written authorization, in addition to any required informed consent, before PHI may be used for research. Such regulations specify standards for de-identifications and for limited data sets. We are both directly and indirectly affected by the privacy provisions surrounding individual authorizations because many investigators with whom we are involved in clinical trials are directly subject to them as a HIPAA “covered entity” and (although we generally do not obtain PHI from investigators) we could be exposed to PHI. We also may obtain PHI from other third parties that are subject to such regulations. As there are some instances where we are a HIPAA “business associate” of a “covered entity,” we can also be directly liable for mishandling PHI. Under HIPAA’s enforcement scheme, we can be subject to up to $1.5 million in annual civil penalties for each HIPAA violation.
In the EU, personal data includes any information that relates to an identified or identifiable natural person with health information carrying additional obligations, including obtaining the explicit consent from the individual for collection, use or disclosure of the information. In addition, we are subject to EU rules with respect to cross-border transfers of such data out of the EU. The United States, the EU and its member states, and other countries where we have operations, such as Canada, Japan, South Korea, Malaysia, the Philippines, Russia and Singapore, continue to issue new privacy and data protection rules and regulations that relate to personal data and health information. Failure to comply with certain certification/registration and annual re-certification/registration provisions associated with these data protection and privacy regulations and rules in various jurisdictions, or to resolve any serious privacy complaints, could subject us to regulatory sanctions, criminal prosecution or civil liability, any of which could have a material adverse effect on our business, results of operations and financial condition.
Federal, state and foreign governments are contemplating or have proposed or adopted additional legislation governing the collection, possession, use or dissemination of personal data, such as PHI and personal financial data as well as security breach notification rules for loss or theft of such data. Additional legislation or regulation of this type might, among other things, require us to implement new security measures and processes or bring within the legislation or regulation de-identified health or other personal data, each of which may require substantial expenditures or limit our ability to offer some of our services. The uncertainty of the regulatory environment is increased by the fact that we generate and receive data from many sources. As a result, there are many ways governments might attempt to regulate our use of this data. Any such restriction could have a material adverse effect on our business, results of operations and financial condition. Additionally, if we violate applicable laws, regulations or duties relating to the use, privacy or security of personal data, we could be subject to civil liability or criminal prosecution, be forced to alter our business practices and suffer reputational harm, any of which could have a material adverse effect on our business, results of operations and financial condition. In the next few years, the European data protection framework may be revised as a generally applicable data regulation. The text has not yet been finalized, but it contains new provisions specifically directed at the processing of health information, sanctions of up to 4% of worldwide gross revenue and extra-territoriality measures intended to bring non-EU companies under the proposed regulation.
34
Table of Contents
Risks Related to Our Indebtedness
We have a substantial amount of indebtedness and this substantial level of indebtedness could materially adversely affect our ability to generate sufficient cash to fulfill our obligations under such indebtedness, to react to changes in our business and to incur additional indebtedness to fund future needs.
As of December 31, 2015, we had total indebtedness outstanding of $2,214.9 million ($2,170.5 million net of discounts and deferred financing costs), and $145.5 million of additional borrowings available under our credit facilities. Substantially all of our outstanding indebtedness will become due and payable in 2018. Our net interest expense was $228.2 million, $217.0 million and $209.2 million for the years ended December 31, 2015, 2014 and 2013, respectively. Our substantial indebtedness, combined with our other financial obligations and contractual commitments, could have important consequences for our business. For example, it could:
| • | make it more difficult for us to satisfy our obligations with respect to our indebtedness, and any failure to comply with the obligations under any of our debt instruments, including restrictive covenants, could result in an event of default under the agreements governing such indebtedness; |
| • | require us to dedicate a substantial portion of our cash flow from operations to payments on our indebtedness, thereby reducing funds available for working capital, capital expenditures, acquisitions, business development and other purposes; |
| • | increase our vulnerability to adverse general economic and industry conditions, which could place us at a competitive disadvantage compared to our competitors, many of which have less indebtedness than us on a relative basis; |
| • | limit our flexibility in planning for, or reacting to, changes in our business and the industries in which we operate; |
| • | limit our ability to borrow additional funds, or to dispose of assets to raise funds, if needed, for working capital, capital expenditures, acquisitions and other corporate purposes; |
| • | prevent us from raising the funds necessary to repurchase all the 10% Senior Notes due 2018 (the “Senior Unsecured Notes”), 9.0% Senior Secured Notes due 2018 (the “Senior Secured Notes”) or 10%/12% Junior Lien Secured Notes due 2018 (the “Junior Lien Secured Notes”) tendered to us upon the occurrence of certain changes of control, which would constitute a default under the indentures governing our Senior Unsecured Notes, Senior Secured Notes or Junior Lien Secured Notes, respectively; and |
| • | limit our ability to redeem, repurchase, defease or otherwise acquire or retire for value any subordinated indebtedness we may incur. |
Restrictions imposed by our debt instruments may limit the ability of our subsidiaries to operate their business and to finance our future operations or capital needs or to engage in other business activities.
The terms of our debt instruments restrict certain of our subsidiaries from engaging in specified types of transactions. These covenants restrict the ability of inVentiv Health, Inc. (“inVentiv Health”), our wholly-owned subsidiary, and its restricted subsidiaries, as well as inVentiv Health Clinical UK Limited (“inVentiv UK”) and its subsidiaries, among other things, to:
| • | incur or guarantee additional indebtedness; |
| • | pay dividends on capital stock or redeem, repurchase or retire capital stock or indebtedness, as applicable; |
| • | make investments, loans, advances and acquisitions; |
| • | create restrictions on the payment of dividends or other amounts by such restricted subsidiaries or subsidiaries, as the case may be; |
| • | engage in transactions with our affiliates; |
| • | sell assets, including capital stock of subsidiaries; |
35
Table of Contents
| • | consolidate or merge; |
| • | enter into additional capital leases, our primary means of procuring vehicles for our selling solutions offering, which could cause us to consider alternatives such as the purchase of vehicles or operating leases which may not be on terms as favorable as capital leases; and |
| • | create liens. |
In addition, the asset-based revolving credit facility for up to $150.0 million entered into by inVentiv Health on August 16, 2013 (the “ABL Facility”) and the asset-based lending facility for up to $20.0 million entered into by inVentiv UK (the “International Facility”) require inVentiv Health and inVentiv UK, respectively, as well as their respective subsidiaries, to, under certain circumstances, comply with a fixed charge coverage ratio and certain cash management restrictions. Our ability to comply with these restrictions can be affected by events beyond our control, and we may not be able to maintain compliance with them. A breach of any of these covenants would be an event of default.
In the event of a default under any of our debt instruments, the lenders or noteholders, as applicable, could elect to declare all amounts outstanding under such debt instruments, to be immediately due and payable or in the case of our Senior Secured Credit Facilities, ABL Facility or International Facility, may terminate their commitments to lend additional money. If the indebtedness under any of our debt instruments were to be accelerated, our assets may not be sufficient to repay such indebtedness in full. In addition, our Senior Secured Credit Facilities, ABL Facility, Senior Secured Notes and Junior Lien Secured Notes are secured by security interests on substantially all of inVentiv Health’s and its domestic subsidiaries’ assets. If an event of default occurs under our debt instruments, the lenders or noteholders, as applicable, could exercise their rights under the related security documents, and an event of default may be triggered under our other debt instruments. Any acceleration of amounts due under our debt instruments or the substantial exercise by the lenders or noteholders, as applicable, of their rights under the security documents, would have a material adverse effect on us.
We may not be able to generate sufficient cash to service all of our indebtedness, and may be forced to take other actions to satisfy our obligations under our indebtedness, which may not be successful.
As of December 31, 2015, we had total indebtedness outstanding of $2,214.9 million ($2,170.5 million net of discounts and deferred financing costs), substantially all of which will become due and payable in 2018. We may not be able to maintain a level of cash flows from operating activities sufficient to permit us to pay the principal, premium, if any, and interest on our indebtedness when due. In particular, we had substantial deficiencies of earnings to cover fixed charges of approximately $144.6 million, $178.6 million and $214.4 million for the years ended December 31, 2015, 2014 and 2013, respectively. Our ability to make scheduled payments on our debt obligations, including our ability to repay substantially all of our outstanding indebtedness in 2018, depends on our financial condition and operating performance, which is subject to prevailing economic and competitive conditions and to certain financial, business and other factors beyond our control.
If our cash flows and capital resources are insufficient to fund our debt service obligations, we may be forced to reduce or delay investments and capital expenditures, or to sell assets, seek additional capital or restructure or refinance our indebtedness. Our ability to restructure or refinance our debt will depend on the condition of the capital markets and our financial condition at such time. Any refinancing of our debt could be at higher interest rates and may require us to comply with more onerous covenants, which could further restrict our business operations. The terms of existing or future debt instruments and the indentures governing the Senior Secured Notes, the Junior Lien Secured Notes and the Senior Unsecured Notes may restrict us from adopting some of these alternatives. Any failure to make payments of interest and principal on our outstanding indebtedness on a timely basis would result in a default under our debt instruments and would allow the lenders under our Senior Secured Credit Facilities, ABL Facility and International Facility to terminate their commitments to lend additional money or foreclose against the assets, if any, securing their borrowings, and we could be forced into bankruptcy or liquidation. In addition, any failure to make payments on our outstanding indebtedness would likely result in a reduction of our credit rating, which could harm our ability to incur
36
Table of Contents
additional indebtedness. In the absence of such operating results and resources, we could face substantial liquidity problems and might be required to dispose of material assets or operations to meet our debt service and other obligations. Our Senior Secured Credit Facilities, the ABL Facility, the International Facility and the indentures governing the Senior Secured Notes, the Junior Lien Secured Notes and the Senior Unsecured Notes restrict our ability to dispose of assets and use the proceeds from the disposition. We may not be able to consummate any such dispositions or to obtain the proceeds that we could realize from them and these proceeds may not be adequate to meet any debt service obligations then due. These alternative measures may not be successful and may not permit us to meet our scheduled debt service obligations.
Despite our level of indebtedness, we, including our subsidiaries, have the ability to incur substantially more indebtedness, including senior secured indebtedness. Incurring such indebtedness could further exacerbate the risks to our financial condition.
We, certain of our subsidiaries and, subject to the restrictions in our Senior Secured Credit Facilities, ABL Facility, International Facility and the indentures governing the Senior Unsecured Notes, Senior Secured Notes and Junior Lien Secured Notes, our other subsidiaries, may incur significant additional indebtedness. As of December 31, 2015, we had:
| • | subject to certain conditions, the option to increase the amounts borrowed under our Senior Secured Credit Facilities by up to $300.0 million, which, if borrowed, would be senior secured indebtedness; |
| • | the capacity to borrow up to $150.0 million (less $18.8 million of letters of credit outstanding) under our ABL Facility, subject to certain limitations, which, if borrowed, would be senior secured indebtedness; |
| • | the capacity to borrow up to $14.3 million (no letters of credit outstanding) under our International Facility, subject to certain limitations; and |
| • | the ability to make interest payments in kind under the Indenture governing our Junior Lien Secured Notes, subject to certain limitations. |
Although the terms of our Senior Secured Credit Facilities, the ABL Facility, the International Facility and the indentures governing our Senior Secured Notes, the Junior Lien Secured Notes and the Senior Unsecured Notes contain restrictions on the incurrence of additional indebtedness by inVentiv Health, inVentiv UK and certain of their subsidiaries, as applicable, these restrictions are subject to a number of important exceptions, and indebtedness incurred in compliance with these restrictions could be substantial. For example, the indentures governing our Senior Secured Notes, Junior Lien Secured Notes and the Senior Unsecured Notes allow us to classify and then reclassify subsequently incurred senior secured and senior unsecured debt among the various baskets and ratio-based incurrence tests contained in those indentures. We utilized this flexibility in connection with prior financings and reclassified borrowings under our Senior Secured Credit Facilities from a specific “credit facility” basket to ratio-based secured debt, thereby creating capacity for us to incur additional “credit facility” senior secured debt in the future (and we subsequently utilized a portion of that capacity to incur incremental indebtedness under the Senior Secured Credit Facilities). If we and our subsidiaries incur significant additional indebtedness, the related risks to our financial condition could increase.
Our ability to repay our debt is affected by the cash flow generated by our subsidiaries.
Our subsidiaries own substantially all of our assets and conduct substantially all of our operations. Accordingly, repayment of our indebtedness will be dependent on the generation of cash flow by our subsidiaries and their ability to make such cash available to inVentiv Health, the issuer or borrower, as applicable, of all our outstanding indebtedness, by dividend, debt repayment or otherwise. Our subsidiaries may not be able to, or may not be permitted to, make distributions to enable inVentiv Health to make payments in respect of our indebtedness. Each subsidiary is a distinct legal entity and, under certain circumstances, legal and contractual restrictions may limit inVentiv Health’s ability to obtain cash from its subsidiaries. While the terms of our outstanding indebtedness limit the ability of our subsidiaries to incur consensual restrictions on their ability to
37
Table of Contents
pay dividends or make other intercompany payments to inVentiv Health, these limitations are subject to certain important qualifications and exceptions. In the event that we do not receive distributions from our subsidiaries, we may be unable to make required principal and interest payments on our indebtedness.
Interest rate fluctuations may have a material adverse effect on our business, results of operations, financial condition and cash flows.
Indebtedness under our Senior Secured Credit Facilities, ABL Facility and International Facility bears interest at variable rates. Because we have substantial variable rate debt, fluctuations in interest rates may affect our business, results of operations, financial condition and cash flows. We may attempt to minimize interest rate risk and lower our overall borrowing costs through the utilization of derivative financial instruments, primarily interest rate swaps. As of December 31, 2015, we had approximately $575.3 million of indebtedness under our Senior Secured Credit Facilities with variable interest rates, and no amounts outstanding under our ABL Facility or International Facility. A change of 0.125% in floating rates above the 1.5% LIBOR floor used to calculate the interest rate under our Senior Secured Credit Facilities would increase our estimated annual interest expense on the borrowings under our Senior Secured Credit Facilities by $0.7 million.
Risks Related to Our Structure
We will be required to pay our Existing Stockholders 85% of certain tax benefits related to Pre-IPO Tax Assets, which could amount to substantial cash payments in which the investors purchasing shares in this offering would not participate.
Prior to the completion of this offering, we plan to enter into the TRA, pursuant to which we will grant our Existing Stockholders the right to receive future payments from us equal to 85% of the amount of income tax savings, if any, that we and our subsidiaries realize as a result of the utilization of the Pre-IPO Tax Assets. Investors purchasing shares in this offering will only be entitled to the economic benefit of the Pre-IPO Tax Assets to the extent of our continuing 15% interest in those assets. See “Certain Relationships and Related Party Transactions—Tax Receivables Agreement.”
These payment obligations will be our obligations. The actual utilization of the Pre-IPO Tax Assets, as well as the timing of any payments required under the TRA, cannot be determined with any reasonable degree of certainty, and will vary depending upon a number of variables, including the amount, character and timing of our and our subsidiaries’ taxable income in the future.
We expect that the payments we make under this TRA will be material. Based on current tax laws and assuming that we and our subsidiaries earn sufficient taxable income to realize the full tax benefits subject to the TRA, we expect that future payments under the TRA relating to the Pre-IPO Tax Assets could aggregate to between $ million and $ million.
In addition, the TRA provides that upon certain mergers, reorganizations, consolidations, asset sales or other changes of control, breaches of our material obligations under the TRA or upon our election to terminate the TRA prior to the utilization of all the Pre-IPO Tax Assets, all obligations under the TRA will be accelerated and we will be required to make a payment approximating the present value of future payments under the TRA, the amount of which would be determined based on specified assumptions. In these situations, our obligations under the TRA could have a substantial negative impact on our liquidity and could have the effect of delaying, deferring or preventing certain mergers, asset sales, other forms of business combinations or other changes of control.
In the event we make payments under the TRA in respect of realized tax benefits, and those tax benefits are subsequently revised, the counterparties under the TRA are not obligated to reimburse us for any such payments (although future payments otherwise owing by us could be adjusted to the extent possible to reflect the result of such disallowance). As a result, we may be required to make payments under the TRA in certain circumstances that exceed our actual tax savings.
38
Table of Contents
Certain transactions could cause us to recognize taxable income (possibly material amounts of income) without a current receipt of cash. Payments under the TRA with respect to such taxable income would cause a net reduction in our available cash. For example, transactions giving rise to cancellation of debt income or “Subpart F” income would each produce income with no corresponding increase in cash. In these cases, we may use some of the Pre-IPO Tax Assets to offset income from these transactions and, under the TRA, would be required to make a payment to our Existing Stockholders even though we receive no cash from such income.
Because we are a holding company with no operations of our own, our ability to make payments under the TRA is dependent on the ability of our subsidiaries to make distributions to us. To the extent that a liability accrues under the TRA but we are unable to make a payment thereof, such payments will be deferred and accrue interest at a rate that is equal to the highest prime rate of interest quoted from time to time by The Wall Street Journal, U.S. Edition, as the “base rate” on corporate loans at large money center commercial banks in effect on such day, plus 2% per annum.
If we did not enter into the TRA, we would be entitled to realize and retain the full economic benefit of the Pre-IPO Tax Assets. Generally, the TRA is designed to determine the amount of tax we would pay each year assuming no Pre-IPO Tax Assets, to determine the amount of tax we save as a result of the Pre-IPO Tax Assets, and to require that we pay 85% of that tax saving to our Existing Stockholders. As a result, investors purchasing shares in this offering will not be entitled to the economic benefit of the Pre-IPO Tax Assets that would have been available if the TRA were not in effect (except to the extent of our continuing 15% interest in the Pre-IPO Tax Assets).
We are a “controlled company” within the meaning of NYSE or NASDAQ rules, and as a result, we qualify for, and intend to rely on, exemptions from certain corporate governance requirements. You will not have the same protections afforded to stockholders of companies that are subject to such requirements.
THL controls a majority of the voting power of our outstanding common stock and, upon completion of this offering, will continue to hold a controlling interest in us as a result of its ownership of common stock. As a result, we qualify as a “controlled company” within the meaning of the corporate governance rules of the NYSE or NASDAQ. Under these rules, a company of which more than 50% of the voting power in the election of directors is held by an individual, group or another company is a “controlled company” and may elect not to comply with certain corporate governance requirements, including the requirements that (i) a majority of our Board consist of independent directors and (ii) that our Board have Compensation and Nominating and Corporate Governance Committees composed entirely of independent directors.
For at least some period following this offering, we intend to utilize these exemptions. As a result, immediately following this offering we do not expect the majority of our directors will be independent or that our Compensation Committee or Nominating and Corporate Governance Committee will be comprised entirely of independent directors. Accordingly, although we may transition to fully independent Compensation and Nominating and Corporate Governance Committees prior to the time we cease to be a “controlled company,” for such period of time you will not have the same protections afforded to stockholders of companies that are subject to all of these corporate governance requirements. In the event that we cease to be a “controlled company” and our shares continue to be listed on the NYSE or NASDAQ, we will be required to comply with these provisions within the applicable transition periods. In the event we cease to be a “controlled company” and our common stock continues to be listed on the NYSE or NASDAQ, we will be required to comply with these provisions within the applicable transition periods.
We are controlled by THL, whose interests may differ from those of our public stockholders.
We are controlled by THL, and after this offering will continue to be controlled by THL. After the completion of this offering THL will beneficially own in the aggregate approximately % of the voting power of our common stock (or approximately % if the underwriters exercise their option to purchase additional shares in full). As a result of this ownership, THL will have effective control over the outcome of votes on all
39
Table of Contents
matters requiring approval by our stockholders, including the election of directors, the adoption of amendments to our charter and bylaws and other significant corporate transactions. THL can also cause those of its affiliates that own interests in us to take actions that have the effect of delaying or preventing a change of control of us or discouraging others from making tender offers for our shares, which could prevent stockholders from receiving a premium for their shares. These actions may be taken even if other stockholders oppose them.
In addition, persons associated with THL currently serve on our Board. Following this offering, the interests of THL may not always coincide with the interests of our other stockholders, and the concentration of effective control in THL will limit other stockholders’ ability to influence corporate matters. The concentration of ownership and voting power of THL may also delay, defer or even prevent an acquisition by a third party or other change of control and may make some transactions more difficult or impossible without their support, even if such events are in the best interests of our other stockholders. Therefore, the concentration of voting power controlled by THL may have an adverse effect on the price of our common stock. We may also take actions that our other stockholders do not view as beneficial, which may adversely affect our results of operations and financial condition and cause the value of your investment to decline.
Further, THL may have an interest in pursuing acquisitions, divestitures, financing or other transactions, including, but not limited to, the issuance of additional debt or equity and the declaration and payment of dividends, that, in its judgment, could enhance their equity investments, even though such transactions may involve risk to us. Additionally, THL may make investments in businesses that directly or indirectly compete with us, or may pursue acquisition opportunities that may be complementary to our business and, as a result, those acquisition opportunities may not be available to us.
Our charter and bylaws and provisions of Delaware law may discourage or prevent strategic transactions, including a takeover of our company, even if such a transaction would be beneficial to our stockholders.
Provisions contained in our charter and bylaws and provisions of the Delaware General Corporate Law (the “DGCL”), could delay or prevent a third party from entering into a strategic transaction with us, as applicable, even if such a transaction would benefit our stockholders. For example, our charter and bylaws:
| • | authorize the issuance of “blank check” preferred stock that could be issued by us upon approval of our Board to increase the number of outstanding shares of capital stock, making a takeover more difficult and expensive; |
| • | provide that directors may be removed from office only for cause and that any vacancy on our Board may only be filled by a majority of our directors then in office, which may make it difficult for other stockholders to reconstitute our Board; |
| • | provide that special meetings of the stockholders may be called only upon the request of a majority of our Board or by our chairman of the Board or chief executive officer; and |
| • | require advance notice to be given by stockholders for any stockholder proposals or director nominees. |
These restrictions and provisions could keep us from pursuing relationships with strategic partners and from raising additional capital, which could impede our ability to expand our business and strengthen our competitive position. These restrictions could also limit stockholder value by impeding a sale of our Company. See “Description of Capital Stock” for more detail.
Additionally, Section 203 of the DGCL, prohibits a publicly held Delaware corporation from engaging in a business combination with an interested stockholder, generally a person which together with its affiliates owns, or within the last three years has owned, 15% or more of our voting stock, for a period of three years after the date of the transaction in which the person became an interested stockholder, unless the business combination is
40
Table of Contents
approved in a prescribed manner. The existence of the foregoing provision could also limit the price that investors might be willing to pay in the future for shares of our common stock, thereby depressing the market price of our common stock.
Risks Related to this Offering
There is no existing public market for our common stock and an active, liquid trading market for our common stock may not develop.
There is no existing public market for our common stock. We cannot predict the extent to which investor interest in our company will lead to the development of an active trading market or how liquid that market may become. If an active trading market does not develop, you may have difficulty selling any of our shares that you purchase. The initial public offering price of our common stock will be determined by negotiations between us and the underwriters and may not be indicative of prices that will prevail following the completion of this offering. The market price of our common stock may decline below the initial public offering price, and you may not be able to resell your shares at, or above, the initial public offering price, or at all. An inactive trading market may also impair our ability to raise capital to continue to fund operations by selling shares and may impair our ability to acquire other companies by using our shares as consideration.
Future sales of our common stock or securities convertible into or exchangeable for common stock could depress the market price of our common stock.
We and all of our existing stockholders may sell additional shares of common stock in subsequent public offerings. We may also issue additional shares of common stock, or securities convertible into or exchangeable for shares of our common stock, in connection with financings, acquisitions, investments or otherwise. Sales of substantial amounts of our common stock in the public market, or the perception that such sales could occur, could adversely affect the market price of our common stock.
At the completion of this offering, we will have outstanding shares of common stock. All of the shares of common stock that we are selling in this offering (or shares if the underwriters exercise their option to purchase additional shares in full), may be resold immediately in the public market without restriction or further registration under the Securities Act of 1933, as amended (the “Securities Act”) by persons other than our “affiliates.” The remaining shares of common stock held by our existing stockholders will be “restricted securities” within the meaning of Rule 144 under the Securities Act and may not be sold in the absence of registration under the Securities Act, unless an exemption from registration is available, including the exemptions in Rule 144. See “Shares Eligible for Future Sale.” In addition, our directors and executive officers, THL and certain of our other stockholders and equity holders will be subject to the lock-up agreements described in “Underwriting,” pursuant to which such stockholders have agreed not to sell, dispose of or hedge any of our shares of common stock, or securities convertible into or exchangeable for shares of our common stock, subject to specified exceptions, during the period from the date of this prospectus continuing through the date 180 days after the date of this prospectus, except with the prior written consent of Credit Suisse Securities (USA) LLC and Morgan Stanley & Co. LLC on behalf of the underwriters. Credit Suisse Securities (USA) LLC and Morgan Stanley & Co. LLC may, in their sole discretion and without notice, release all or any portion of the shares subject to lock-up agreements prior to expiration of the lock-up period. After this offering and upon expiration of those lock-up agreements, and after the holding period requirements of Rule 144 of the Securities Act have elapsed, approximately additional shares will be eligible for sale in the public market.
We have granted THL and certain of our other stockholders (and certain permitted transferees thereof) registration rights with respect to the common stock they hold as described under “Certain Relationships and Related Party Transactions—Registration and Participation Rights Agreement.” Upon registration, those shares will be eligible for sale in the public market. However, the shares held by THL and certain of our other stockholders and equity holders are subject to the 180-day lock-up period described above.
41
Table of Contents
In addition, we have agreed with the underwriters not to issue, dispose of or hedge any of our shares of common stock, or securities convertible into or exchangeable for shares of our common stock, subject to specified exceptions, during the period from the date of this prospectus continuing through the date 180 days after the date of this prospectus, except with the prior written consent of Credit Suisse Securities (USA) LLC and Morgan Stanley & Co. LLC on behalf of the underwriters. Subject to this agreement, we may issue and sell in the future additional shares of our common stock in connection with a financing, acquisition, investment or otherwise. Credit Suisse Securities (USA) LLC and Morgan Stanley & Co. LLC may, in their sole discretion and without notice, waive such restrictions prior to expiration of the lock-up period. See “Underwriting.”
We intend to file one or more registration statements on Form S-8 under the Securities Act to register shares of our common stock issued or reserved for issuance under our 2010 Plan and our 2016 Plan. Any such Form S-8 registration statement will automatically become effective upon filing. Accordingly, shares registered under such registration statement will be available for sale in the public market, unless such shares are subject to vesting restrictions with us or the lock-up restrictions described above. We expect that the registration statement on Form S-8 will cover shares.
We cannot predict the size of future issuances of our common stock or the effect, if any, that future issuances and sales of our common stock will have on the market price of our common stock. Any such issuance could result in substantial dilution to our existing stockholders, and could have an adverse effect on the market price of our common stock. Due to these factors, sales of a substantial number of shares of our common stock in the public market could occur at any time. Any decline in the price of shares of our common stock could impede our ability to raise capital through the issuance of additional shares of our common stock or other equity securities.
Although inVentiv Health already files certain periodic reports with the SEC, becoming a public company will increase our expenses and administrative burden, in particular to bring our company into compliance with certain provisions of the Sarbanes Oxley Act of 2002 and NYSE or NASDAQ rules to which we are not currently subject.
As a public company, we will incur significant legal, accounting and other expenses that we did not incur as a private company. In addition, our administrative staff will be required to perform additional tasks. For example, in anticipation of becoming a public company, we will need to create or revise the roles and duties of our Board committees, retain a transfer agent and adopt an insider trading policy in compliance with our obligations under the securities laws.
In addition, changing laws, regulations and standards relating to corporate governance and public disclosure, including the Sarbanes-Oxley Act of 2002 (the “Sarbanes-Oxley Act”) and related regulations implemented by the SEC and the NYSE or NASDAQ, will increase our legal and financial compliance costs and make some activities more time consuming. We are currently evaluating and monitoring developments with respect to these rules and cannot predict or estimate the amount of the additional costs we may incur or the timing of such costs. We intend to invest resources to comply with evolving laws, regulations and standards, and this investment may result in increased general and administrative expenses and a diversion of management’s time and attention from revenue-generating activities to compliance activities. If our efforts to comply with new laws, regulations and standards differ from the activities intended by regulatory or governing bodies due to ambiguities related to practice, regulatory authorities may initiate legal proceedings against us and our business may be harmed. We also expect that being a public company and these new rules and regulations will make it more expensive for us to obtain director and officer liability insurance, and we may be required to accept reduced coverage or incur substantially higher costs to obtain coverage. These factors could also make it more difficult for us to attract and retain qualified members of our Board, particularly to serve on our Audit Committee, and qualified executive officers. Any of these factors could have a material adverse effect on our business, results of operations and financial condition, as well as on the trading price for our common stock.
42
Table of Contents
Our internal control over financial reporting may not meet the standards required by Section 404 of the Sarbanes-Oxley Act, and failure to achieve and maintain effective internal control over financial reporting in accordance with Section 404 of the Sarbanes-Oxley Act could have a material adverse effect on our business, results of operations and financial condition.
We are in the early stages of addressing our internal control procedures to satisfy all of the requirements of Section 404 of the Sarbanes-Oxley Act, which requires that we must perform system and process evaluation and testing of our internal control over financial reporting to allow management and our independent registered public accounting firm to report on the effectiveness of our internal control over financial reporting, with auditor attestation of the effectiveness of our internal controls, beginning with our annual report on Form 10-K for the year ending December 31, 2016 if we then constitute an accelerated filer or large accelerated filer. If we are not able to implement the requirements of Section 404 in a timely manner or with adequate compliance, our independent registered public accounting firm may not be able to attest to the effectiveness of our internal control over financial reporting. In addition, we may encounter problems or delays in completing the implementation of any required improvements and receiving a favorable attestation in connection with the attestation provided by our independent registered public accounting firm. Further, material weaknesses or significant deficiencies in our internal controls over financial reporting may exist or otherwise be discovered in the future. We will be unable to issue securities in the public markets through the use of a shelf registration statement if we are not in compliance with the applicable provisions of Section 404. Furthermore, if we are unable to maintain adequate internal control over financial reporting, we may be unable to report our financial information on a timely basis, may suffer adverse regulatory consequences or violations of applicable stock exchange listing rules (including potential delisting by the NYSE or NASDAQ) and may breach the covenants under our credit facilities. There could also be a negative reaction in the financial markets due to a loss of investor confidence in us and the reliability of our financial statements, which would harm our business and the market price of our common stock.
In addition, we will incur additional costs in order to improve our internal control over financial reporting and comply with Section 404, including increased auditing and legal fees and costs associated with hiring additional accounting and administrative staff.
Our ability to successfully implement our business plan and comply with the Sarbanes-Oxley Act requires us to be able to prepare timely and accurate financial statements, among other requirements. Any delay in the implementation of, or disruption in the transition to, new or enhanced systems, procedures or controls, may cause our operations to suffer and we may be unable to conclude that our internal control over financial reporting is effective and to obtain an unqualified report on internal controls from our independent registered public accounting firm. Moreover, we cannot be certain that these measures would ensure that we implement and maintain adequate controls over our financial processes and reporting in the future. Even if we were to conclude, and our independent registered public accounting firm were to concur, that our internal control over financial reporting provided reasonable assurance regarding the reliability of financial reporting and the preparation of financial statements for external purposes in accordance with GAAP, because of its inherent limitations, internal control over financial reporting may not prevent or detect fraud or misstatements. Any of these factors could have a material adverse impact on our business, results of operations and financial condition, as well as on the trading price for our common stock.
The price of our common stock may be volatile and you could lose all or part of your investment.
Securities markets worldwide have experienced, and are likely to continue to experience, significant price and volume fluctuations. This market volatility, as well as general economic, market or political conditions could reduce the market price of our common stock regardless of our results of operations. The trading price of our common stock is likely to be highly volatile and could be subject to wide price fluctuations in response to various factors, including, among other things, the risk factors described herein, and other factors beyond our control. Factors affecting the trading price of our common stock could include:
| • | market conditions or trends in the biopharmaceutical industry, the healthcare industry in general, or in the economy as a whole; |
43
Table of Contents
| • | actual or anticipated variations in our quarterly and annual financial and operating results and in our prospects; |
| • | variations in financial and operating results and prospects of similar companies; |
| • | actual or anticipated growth rates relative to our competitors; |
| • | introduction of new services or strategic actions, such as acquisitions or restructurings, or the entry into new markets, in each case by us, our competitors or our clients; |
| • | issuance of new, negative or changed securities analysts’ reports or recommendations or estimates; |
| • | the public’s reaction to press releases, other public announcements and filings with the SEC by us or third parties; |
| • | guidance, if any, that we provide to the public, and any changes in any such guidance or our failure to meet any such guidance; |
| • | changes in, or failure to meet, earnings estimates or recommendations by research analysts who track our common stock or the stock of other companies in our industries; |
| • | changes in the credit ratings of our debt; |
| • | investor perceptions of us and the industries in which we or our clients operate; |
| • | sales, or anticipated sales, of our stock, including sales by existing stockholders, and the termination or expiration of lock-up agreements with our directors, officers, THL and certain other stockholders and equity holders; |
| • | additions or departures of key personnel; |
| • | changes in accounting standards, policies, guidance, interpretations or principles; |
| • | legal, regulatory or political developments; |
| • | stock-based compensation expense under applicable accounting standards; |
| • | litigation and governmental investigations; |
| • | exchange rate fluctuations; and |
| • | changing economic conditions in the United States and globally. |
These and other factors may cause the market price and demand for shares of our common stock to fluctuate substantially, which may limit or prevent investors from readily selling their shares of common stock and may otherwise negatively affect the liquidity of our common stock. In addition, in the past, when the market price of a stock has been volatile, holders of that stock have sometimes instituted securities class action litigation against the company that issued the stock. Securities litigation against us, regardless of the merits or outcome, could result in substantial costs and divert the time and attention of our management from our business, which could significantly harm our business and reputation.
We do not anticipate paying any dividends for the foreseeable future.
We do not intend in the foreseeable future to pay any dividends to holders of our common stock. Therefore, the success of an investment in shares of our common stock will depend upon the future appreciation in the price of our common stock on the public market, which may not occur. There is no guarantee that shares of our common stock will appreciate in value or even maintain the price at which our stockholders have purchased their shares. The payment of future dividends will be at the discretion of our Board, subject to applicable law, and will depend on, among other things, our earnings, financial condition, capital requirements, level of indebtedness, statutory and contractual restrictions apply to the payment of dividends and other considerations that our Board deems relevant. Our debt instruments limit the amounts available to us to pay cash dividends, and, to the extent
44
Table of Contents
that we require additional funding, any future financing arrangements we enter into may also prohibit or limit the payment of a dividend. See “Dividend Policy.” As a consequence of these limitations and restrictions, we may not be able to make, or may have to reduce or eliminate, the payment of any dividends on our common stock.
If you purchase shares of common stock sold in this offering, you will incur immediate and substantial dilution.
The initial public offering price per share is substantially higher than the as adjusted net tangible book value per share immediately after this offering. As a result, you will pay a price per share that substantially exceeds the book value of our assets after subtracting the book value of our liabilities. Based on our as adjusted net tangible book value as of December 31, 2015 and assuming an offering price of $ per share, the midpoint of the range set forth on the cover page of this prospectus, you will incur immediate and substantial dilution in the amount of $ per share. In addition, you may also experience additional dilution if options or other rights to purchase our common stock that are outstanding or that we may issue in the future are exercised, or if we issue additional shares of our common stock or securities that are convertible into or exchangeable for shares of our common stock at prices lower than our net tangible book value at such time. See “Dilution.”
We are a holding company and rely on dividends and other payments, advances and transfers of funds from our subsidiaries to meet our obligations and pay any dividends.
We have no direct operations and no significant assets other than ownership of the capital stock of our subsidiaries. Because we conduct our operations through our subsidiaries, we depend on those entities for dividends and other payments to generate the funds necessary to meet our financial obligations, and to pay any dividends with respect to our common stock. Legal and contractual restrictions in the documents governing the currently outstanding indebtedness of our subsidiaries and other agreements which may govern future indebtedness of our subsidiaries, as well as the financial condition and operating requirements of our subsidiaries, may limit our ability to obtain cash from our subsidiaries. The earnings from, or other available assets of, our subsidiaries might not be sufficient to pay dividends or make distributions or loans to enable us to pay any dividends on our common stock or other obligations. Further, there may be significant tax and other legal restrictions on the ability of our international subsidiaries to remit money to us. Any of the foregoing could materially and adversely affect our business, results of operations, financial condition and cash flows.
We have broad discretion in the use of the net proceeds from this offering and may not use them effectively.
We have broad discretion in the application of the net proceeds from this offering, including for any of the purposes described in the section entitled “Use of Proceeds,” and you will not have the opportunity as part of your investment decision to assess whether the net proceeds to us are being used appropriately. Because of the number and variability of factors that will determine our use of the net proceeds from this offering, their ultimate use may vary substantially from their currently intended use. Our management might not apply our net proceeds in ways that ultimately increase the value of your investment. The failure by our management to apply these funds effectively could harm our business. Pending their use, we may invest the net proceeds from this offering in a manner that does not produce income or that loses value.
If securities or industry analysts do not publish research or reports about our business, if they adversely change their recommendations regarding our stock or if our results of operations do not meet their expectations, our stock price and trading volume could decline.
The trading market for our common stock will be influenced by the research and reports that industry or securities analysts publish about us, our business or our industry. If one or more of these analysts cease coverage of our company or fail to publish reports on us regularly, we could lose visibility in the financial markets, which in turn could cause our stock price or trading volume to decline. Moreover, if one or more of the analysts who cover us downgrade our stock, or if our results of operations do not meet their expectations, our stock price could decline.
45
Table of Contents
CAUTIONARY NOTE REGARDING FORWARD-LOOKING STATEMENTS
This prospectus contains forward-looking statements that are subject to risks and uncertainties. All statements other than statements of historical fact or relating to present facts or current conditions included in this prospectus are forward-looking statements. Forward-looking statements give our current expectations and projections relating to our financial condition, results of operations, plans, objectives, future performance and business. You can identify forward-looking statements by the fact that they do not relate strictly to historical or current facts. These statements may include words such as “anticipate,” “estimate,” “expect,” “project,” “target,” “plan,” “intend,” “believe,” “may,” “will,” “should,” “can have,” “likely” and other words and terms of similar meaning in connection with any discussion of the timing or nature of future operating or financial performance or other events. Examples, though the absence of these words does not necessarily mean that a statement is not forward-looking, include, but are not limited to statements we make regarding:
| • | our business strategy, outlook, objectives, plans, intentions and goals, and our estimates of market size, market growth, market penetration and market share; |
| • | our estimates regarding our liquidity, capital expenditures and sources of both, our ability to maintain and improve our operating margins and our ability to fund our operations and planned capital expenditures for the foreseeable future; |
| • | our belief that our growth and success will depend on our ability to continue to enhance the quality of our existing services, serve our clients throughout the evolution of a product, and to introduce new services on a timely and cost-effective basis, integrate new services with existing services, increase penetration with existing and new clients and recruit, motivate and retain qualified personnel; |
| • | our expectations that biopharmaceutical companies will increasingly outsource their clinical development and commercialization services; |
| • | our belief that our clients are looking for service providers with scale and global capabilities; |
| • | our expectations regarding our pursuit of additional debt or equity sources to finance our internal growth initiatives or acquisitions; |
| • | our expectations regarding the levels of R&D and commercialization spending and outsourcing by biopharmaceutical companies; and |
| • | our expectations regarding the impact of the adoption of new accounting pronouncements. |
These forward-looking statements reflect our current views about future events and are subject to risks, uncertainties and assumptions. We caution readers that certain important factors may have affected and could in the future affect our actual results and could cause actual results to differ significantly from those expressed in any forward-looking statement and such forward-looking statements should not be unduly relied upon. Factors that could prevent us from achieving our goals, and cause the assumptions underlying forward-looking statements and the actual results to differ materially from those expressed in or implied by those forward-looking statements include, but are not limited to, the following:
| • | the impact of client project delays, cancellations and terminations, including the impact on our backlog; |
| • | the failure to convert backlog into net revenues; |
| • | our ability to accurately price our contracts and forecast costs; |
| • | our ability to achieve operational efficiencies or grow our net revenues faster than expenses; |
| • | the risks related to our relationships with existing or potential clients who are in competition with each other; |
| • | our ability to recruit suitable willing investigators and patients for clinical trials; |
46
Table of Contents
| • | our ability to maintain insurance coverage for our operations and indemnification obligations; |
| • | the impact of a loss of our access to certain data assets; |
| • | the potential liability associated with injury to clinical trial participants; |
| • | the risk of client concentration or concentration in therapeutic areas; |
| • | our ability to successfully develop and market new services and enter new markets; |
| • | the potential impact of financial, economic, political and other risks related to conducting business internationally; |
| • | our exposure to liability under the FCPA and various other anti-corruption and anti-bribery laws; |
| • | the risks associated with our information systems infrastructure; |
| • | the risks associated with upgrading our information systems and evolving the technology platform for our services; |
| • | our ability to recruit, motivate and retain qualified personnel; |
| • | the impact of disruptions in the credit and capital markets and unfavorable economic conditions; |
| • | the risks associated with our acquisition strategy and integrating acquisitions; |
| • | the impact of any downgrade in our current credit ratings; |
| • | the risks associated with exchange rate fluctuations; |
| • | the risks associated with the restructuring of our operations; |
| • | risks associated with employment liability; |
| • | our limited ability to protect our intellectual property rights and the intellectual property rights of our clients; |
| • | our failure to manage any business expansion or contraction in the future; |
| • | the risks associated with effective income tax rate fluctuation and other tax matters; |
| • | potential impairment of goodwill or other intangible assets; |
| • | the risk of litigation and personal injury claims; |
| • | our reliance on third parties for important products and services; |
| • | our ability to comply with all applicable laws as well as our ability to successfully adapt to any changes in applicable laws; |
| • | our history of losses and our ability to achieve and sustain profitability in the future; |
| • | changes in outsourcing expenditures for clinical development and commercialization services by companies in the biopharmaceutical industry; |
| • | the impact of government regulators or clients limiting a prescription’s scope or withdrawing an approved product from the market; |
| • | the potential impact of healthcare reform initiatives or from changes in the reimbursement policies of third-party payers; |
| • | competition in the markets we serve, which may result in pricing pressure; |
| • | the impact on our clients of lower cost generic and other competing products; |
| • | the impact of costs, liability and reputational harm from failing to perform our services in accordance with contractual requirements, regulatory standards and ethical considerations; |
47
Table of Contents
| • | our ability to respond to rapid technological changes; |
| • | the potential impact of government regulation on us and our clients; |
| • | the risks associated with an industry-wide reduction in demand for CRO services; |
| • | the impact of regulations regarding the protection of personal data; |
| • | the effect of covenant restrictions in our debt agreements on our ability to operate our business; and |
| • | our ability to service our substantial indebtedness. |
See “Risk Factors” for a further description of these risks and other factors that could prevent us from achieving our goals, and cause the assumptions underlying forward-looking statements and the actual results to differ materially from those expressed in or implied by those forward-looking statements.
Except to the extent required by applicable laws or rules, we do not undertake to update any forward-looking statements or to publicly announce revisions to any of the forward-looking statements, whether as a result of new information, future events or otherwise.
48
Table of Contents
We estimate that the net proceeds to us from this offering will be approximately $ million, or approximately $ million if the underwriters exercise in full their option to purchase additional shares, assuming an initial public offering price of $ per share (the midpoint of the range set forth on the cover page of this prospectus), after deducting the underwriting discount and estimated offering expenses payable by us.
We intend to use the net proceeds from this offering to repay certain of our outstanding indebtedness and for general corporate purposes.
Each $1.00 increase or decrease in the public offering price per share would increase or decrease, as applicable, our net proceeds by $ (assuming no exercise of the underwriters’ option to purchase additional shares), assuming the number of shares of common stock offered by us, as set forth on the cover page of this prospectus, remains the same and after deducting the underwriting discount and estimated offering expenses payable by us. Similarly, an increase or decrease of one million shares of common stock sold in this offering by us would increase or decrease, as applicable, our net proceeds by $ , assuming the initial public offering price of $ per share (the midpoint of the estimated offering price range set forth on the cover page of this prospectus), remains the same and after deducting the underwriting discount and estimated offering expenses payable by us.
The foregoing represents our current intentions with respect to the use and allocation of the net proceeds of this offering based upon our present plans and business conditions, but our management will have significant flexibility and discretion in applying the net proceeds. The occurrence of unforeseen events or changed business conditions could result in application of the net proceeds of this offering in a manner other than as described in this prospectus. See “Risk Factors—Risks Related to this Offering—We have broad discretion in the use of the net proceeds from this offering and may not use them effectively.”
49
Table of Contents
We do not intend to pay cash dividends on our common stock in the foreseeable future. However, in the future, subject to the factors described below and our future liquidity and capitalization, we may change this policy and choose to pay dividends.
We are a holding company and do not conduct any business operations of our own. As a result, our ability to pay cash dividends on our common stock is dependent upon cash dividends and distributions and other transfers from our subsidiaries. The ability of our subsidiaries to pay dividends is currently restricted by the terms of our Senior Secured Credit Facilities, ABL Facility, International Facility and the indentures governing our Senior Secured Notes, Junior Lien Secured Notes and Senior Unsecured Notes and may be further restricted by any future indebtedness we or they incur.
In addition, under Delaware law, our Board may declare dividends only to the extent of our surplus (which is defined as total assets at fair market value minus total liabilities, minus statutory capital) or, if there is no surplus, out of our net profits for the then current and/or immediately preceding fiscal year.
Any future determination to pay dividends will be at the discretion of our Board and will take into account:
| • | restrictions in our debt instruments, including those discussed under “Description of Material Indebtedness”; |
| • | general economic business conditions; |
| • | our net income, financial condition and results of operations; |
| • | our capital requirements; |
| • | our prospects; |
| • | the ability of our operating subsidiaries to pay dividends and make distributions to us; |
| • | legal restrictions; and |
| • | such other factors as our Board may deem relevant. |
See “Risk Factors—Risks Related to this Offering—We do not anticipate paying any dividends for the foreseeable future.” and “Management’s Discussion and Analysis of Financial Condition and Results of Operations—Financial Condition, Liquidity and Capital Resources.”
50
Table of Contents
The following table sets forth our cash and cash equivalents and our capitalization as of December 31, 2015:
| • | on an actual basis; and |
| • | on an as adjusted basis to give effect to (i) the -for- stock split that will occur prior to the consummation of this offering, (ii) the sale of shares of our common stock in this offering at the assumed initial public offering price of $ per share (the midpoint of the price range set forth on the cover of this prospectus) and (iii) the application of the net proceeds received by us from this offering as described under “Use of Proceeds.” |
This table should be read in conjunction with “Use of Proceeds,” “Selected Historical Financial Data,” “Management’s Discussion and Analysis of Financial Condition and Results of Operations,” “Description of Capital Stock—Authorized Capitalization,” “Description of Material Indebtedness” and our consolidated financial statements and related notes included elsewhere in this prospectus.
| As of December 31, 2015 | ||||||||
| Actual | As Adjusted(1) | |||||||
| (In millions, except shares and per share amount) | ||||||||
| Cash and cash equivalents |
$ | 121.3 | $ | |||||
|
|
|
|
|
|||||
| Debt (including current maturities): |
||||||||
| ABL Facility |
$ | — | $ | |||||
| Senior Secured Credit Facilities |
575.3 | |||||||
| International Facility |
— | |||||||
| 9% Senior Secured Notes due 2018 |
625.0 | |||||||
| 10% / 12% Junior Lien Secured Notes due 2018 |
569.7 | |||||||
| 10% Senior Unsecured Notes due 2018 |
376.3 | |||||||
| Obligations under capital leases and other financial arrangements |
68.6 | |||||||
| Less: Unamortized premium (discount) |
(9.0 | ) | ||||||
| Less: Deferred financing costs |
(35.4 | ) | ||||||
|
|
|
|
|
|||||
| Total debt |
$ | 2,170.5 | ||||||
|
|
|
|
|
|||||
| Equity: |
||||||||
| Common stock, $0.01 par value, 7,500,000 shares authorized and 5,402,377 shares issued and outstanding, on an actual basis and shares authorized and shares issued and outstanding on an as adjusted basis |
— | |||||||
| Additional paid-in capital |
573.7 | |||||||
| Accumulated deficit |
(1,309.1 | ) | ||||||
| Accumulated other comprehensive loss |
(37.3 | ) | ||||||
| Noncontrolling interest |
1.6 | |||||||
|
|
|
|
|
|||||
| Total stockholders’ deficit |
(771.1 | ) | ||||||
|
|
|
|
|
|||||
| Total capitalization |
$ | 1,399.4 | $ | |||||
|
|
|
|
|
|||||
| (1) | Each $1.00 increase or decrease in the public offering price per share would increase or decrease, as applicable, our as adjusted cash and cash equivalents, additional paid-in capital, total stockholders’ equity and total capitalization by $ million (assuming no exercise of the underwriters’ option to purchase additional shares), assuming the number of shares of common stock offered by us, as set forth on the cover page of this prospectus, remains the same and after deducting the underwriting discount and estimated offering expenses payable by us. Similarly, an increase or decrease of one million shares of common stock sold in this offering by us would increase or decrease, as applicable, our as adjusted cash and cash equivalents, additional paid-in capital, total stockholders’ equity and total capitalization by $ million, assuming the initial public offering price of $ per share, which is the midpoint of the estimated offering price range set forth on the cover page of this prospectus, remains the same and after deducting the underwriting discount and estimated offering expenses payable by us. |
51
Table of Contents
If you invest in our common stock, your interest will be diluted to the extent of the difference between the initial public offering price per share of our common stock and the net tangible book value per share of our common stock upon the consummation of this offering. Dilution results from the fact that the per share offering price of common stock is substantially in excess of the book value per share attributable to our existing investors.
Our historical net tangible book value as of December 31, 2015 was $ , or $ per share of common stock. Historical net tangible book value represents the amount of total tangible assets less total liabilities, and historical net tangible book value per share represents historical net tangible book value divided by shares of common stock outstanding as of December 31, 2015.
After giving effect to (i) the sale of shares of common stock in this offering at the assumed initial public offering price of $ per share (the midpoint of the price range set forth on the cover of this prospectus) and (ii) the application of the net proceeds from this offering as described under “Use of Proceeds,” our as adjusted net tangible book value as of December 31, 2015 would have been $ million, or $ per share. This represents an immediate increase in as adjusted net tangible book value of $ per share to our existing investors and an immediate dilution in as adjusted net tangible book value of $ per share to new investors.
The following table illustrates this dilution on a per share of common stock basis without giving effect to the underwriters’ option to purchase additional shares:
| Assumed initial public offering price per share |
$ | |||||||
| Historical net tangible book value per share as of December 31, 2015 |
$ | |||||||
| Increase in net tangible book value per share attributable to new investors |
||||||||
|
|
|
|||||||
| As adjusted net tangible book value per share after this offering |
||||||||
|
|
|
|||||||
| Dilution per share to new investors in this offering |
$ | |||||||
|
|
|
Each $1.00 increase (decrease) in the assumed initial public offering price of $ per share (the midpoint of the estimated price range set forth on the cover page of this prospectus), would increase (decrease) our as adjusted net tangible book value, after this offering by $ million, or $ per share and the dilution per share to new investors by $ , in each case assuming the number of shares offered by us, as set forth on the cover page of this prospectus, remains the same and after deducting the underwriting discount and estimated offering expenses payable by us.
A one million increase (decrease) in the number of shares offered by us would increase (decrease) our as adjusted net tangible book value by approximately $ million, or $ per share, and the dilution per share to new investors by approximately $ , in each case assuming the initial public offering price of $ per share, which is the midpoint of the estimated offering price range set forth on the cover page of this prospectus remains the same, and after deducting the underwriting discount and estimated offering expenses payable by us.
If the underwriters exercise their option to purchase additional shares in full in this offering, the as adjusted net tangible book value after the offering would be $ per share, the increase in adjusted net tangible book value per share to existing stockholders would be $ per share, and the dilution per share to new investors would be $ per share, in each case assuming an initial public offering price of $ per share, which is the midpoint of the range set forth on the cover page of this prospectus, remains the same and after deducting the underwriting discount and estimated offering expenses payable by us. If any shares are issued upon exercise of outstanding options, you will experience further dilution.
52
Table of Contents
The following table summarizes, on an as adjusted basis as of December 31, 2015 after giving effect to this offering, the total number of shares of common stock purchased from us, the total cash consideration paid to us and the average price per share paid by our existing investors and by new investors purchasing shares in this offering. The calculation below is based on an assumed initial public offering price of $ per share, which is the midpoint of the range listed on the cover page of this prospectus, before deducting the underwriting discount and estimated offering expenses payable by us.
| Shares Purchased | Total Consideration | Average Price Per Share |
||||||||||||||||
| Number | Percent | Amount | Percent | |||||||||||||||
| Existing stockholders |
% | $ | $ | |||||||||||||||
| New investors |
% | |||||||||||||||||
|
|
|
|
|
|
|
|
||||||||||||
| Total |
% | $ | % | |||||||||||||||
|
|
|
|
|
|
|
|
||||||||||||
If the underwriters fully exercise their option to purchase additional shares of our common stock in this offering, the percentage of shares of our common stock held by existing investors would be %, and the percentage of shares of our common stock held by new investors would be %.
The foregoing tables and calculations exclude (i) shares of our common stock issuable upon the exercise of options outstanding as of , 2015 under the inVentiv Group Holdings, Inc. 2010 Equity Incentive Plan (the “2010 Plan”) and (ii) shares of our common stock reserved for future issuance under our 2016 Plan as of the date hereof, which will be effective upon the completion of this offering. To the extent these options are exercised, there will be further dilution to new investors.
53
Table of Contents
SELECTED HISTORICAL FINANCIAL DATA
The following table summarizes our consolidated financial data and other data for the periods and at the dates indicated. We derived our consolidated statement of operations data and our statement of cash flow data for the years ended December 31, 2015, 2014 and 2013 and our consolidated balance sheet data as of December 31, 2015 and 2014 from our audited consolidated financial statements included elsewhere in this prospectus. We derived our statement of operations data and our statement of cash flow data for the years ended December 31, 2012 and 2011 and our balance sheet data as of December 31, 2013, 2012, and 2011 from our unaudited consolidated financial statements that do not appear in this prospectus.
Our historical results are not necessarily indicative of the results to be expected for any future period. The following information should be read together with the information under the headings “Capitalization” and “Management’s Discussion and Analysis of Financial Condition and Results of Operations” and our consolidated financial statements and related notes included elsewhere in this prospectus.
| Year Ended December 31, | ||||||||||||||||||||
| (in millions, except share and per share data) | 2015 | 2014 | 2013 | 2012 | 2011 | |||||||||||||||
| Statement of Operations Data: |
||||||||||||||||||||
| Net revenues |
$ | 1,994.3 | $ | 1,806.4 | $ | 1,644.6 | $ | 1,715.7 | $ | 1,414.0 | ||||||||||
| Reimbursed out-of-pocket expenses |
327.0 | 266.8 | 259.9 | 275.4 | 221.4 | |||||||||||||||
|
|
|
|
|
|
|
|
|
|
|
|||||||||||
| Total revenues |
2,321.3 | 2,073.2 | 1,904.5 | 1,991.1 | 1,635.4 | |||||||||||||||
|
|
|
|
|
|
|
|
|
|
|
|||||||||||
| Operating expenses: |
||||||||||||||||||||
| Cost of revenues |
1,326.8 | 1,203.6 | 1,084.8 | 1,073.2 | 911.7 | |||||||||||||||
| Reimbursable out-of-pocket expenses |
327.0 | 266.8 | 259.9 | 275.4 | 221.4 | |||||||||||||||
| Selling, general and administrative expenses |
525.2 | 529.4 | 538.3 | 594.3 | 481.7 | |||||||||||||||
| Proceeds from purchase price finalization |
— | — | (14.2 | ) | — | — | ||||||||||||||
| Impairment of goodwill |
34.0 | 15.8 | 36.9 | 361.6 | 30.0 | |||||||||||||||
| Impairment of long-lived assets |
35.2 | 8.2 | 2.0 | 49.8 | 3.6 | |||||||||||||||
|
|
|
|
|
|
|
|
|
|
|
|||||||||||
| Total operating expenses |
2,248.2 | 2,023.8 | 1,907.7 | 2,354.3 | 1,648.4 | |||||||||||||||
|
|
|
|
|
|
|
|
|
|
|
|||||||||||
| Operating income (loss) |
73.1 | 49.4 | (3.2 | ) | (363.2 | ) | (13.0 | ) | ||||||||||||
| Loss on extinguishment of debt and refinancing costs |
— | (10.1 | ) | (0.8 | ) | (18.6 | ) | (2.7 | ) | |||||||||||
| Interest expense |
(228.3 | ) | (217.4 | ) | (209.3 | ) | (185.9 | ) | (123.5 | ) | ||||||||||
| Interest income |
0.1 | 0.4 | 0.1 | 0.4 | 0.1 | |||||||||||||||
| Other income |
11.3 | — | — | — | — | |||||||||||||||
|
|
|
|
|
|
|
|
|
|
|
|||||||||||
| Income (loss) before income tax (provision) benefit and income (loss) from equity investments |
(143.8 | ) | (177.7 | ) | (213.2 | ) | (567.3 | ) | (139.1 | ) | ||||||||||
| Income tax (provision) benefit |
(5.6 | ) | (2.5 | ) | (3.0 | ) | 0.4 | 32.9 | ||||||||||||
|
|
|
|
|
|
|
|
|
|
|
|||||||||||
| Income (loss) before income (loss) from equity investments |
(149.4 | ) | (180.2 | ) | (216.2 | ) | (566.9 | ) | (106.2 | ) | ||||||||||
| Income (loss) from equity investments |
(1.2 | ) | (0.4 | ) | — | — | — | |||||||||||||
|
|
|
|
|
|
|
|
|
|
|
|||||||||||
| Income (loss) from continuing operations |
(150.6 | ) | (180.6 | ) | (216.2 | ) | (566.9 | ) | (106.2 | ) | ||||||||||
| Net income (loss) from discontinued operations, net of tax |
— | (8.2 | ) | (20.2 | ) | (10.5 | ) | (33.5 | ) | |||||||||||
|
|
|
|
|
|
|
|
|
|
|
|||||||||||
| Net income (loss) |
(150.6 | ) | (188.8 | ) | (236.4 | ) | (577.4 | ) | (139.7 | ) | ||||||||||
| Less: Net (income) loss attributable to the noncontrolling interest |
(0.9 | ) | (0.8 | ) | (1.2 | ) | (1.4 | ) | (1.3 | ) | ||||||||||
|
|
|
|
|
|
|
|
|
|
|
|||||||||||
| Net income (loss) attributable to inVentiv Group Holdings, Inc. |
$ | (151.5 | ) | $ | (189.6 | ) | $ | (237.6 | ) | $ | (578.8 | ) | $ | (141.0 | ) | |||||
|
|
|
|
|
|
|
|
|
|
|
|||||||||||
54
Table of Contents
| Year Ended December 31, | ||||||||||||||||||||
| (in millions, except share and per share data) | 2015 | 2014 | 2013 | 2012 | 2011 | |||||||||||||||
| Earnings per share attributable to inVentiv Group Holdings, Inc. |
||||||||||||||||||||
| Basic and diluted:(1) |
||||||||||||||||||||
| Income (loss) from continuing operations |
$ | (28.04 | ) | $ | (33.59 | ) | $ | (40.23 | ) | $ | (121.27 | ) | $ | (25.70 | ) | |||||
| Income (loss) from discontinued operations |
— | (1.51 | ) | (3.75 | ) | (2.24 | ) | (8.01 | ) | |||||||||||
|
|
|
|
|
|
|
|
|
|
|
|||||||||||
| Net income (loss) per share attributable to inVentiv Group Holdings, Inc. |
$ | (28.04 | ) | $ | (35.10 | ) | $ | (43.98 | ) | $ | (123.51 | ) | $ | (33.71 | ) | |||||
|
|
|
|
|
|
|
|
|
|
|
|||||||||||
| Weighted average number of shares outstanding- basic and diluted |
5,402,377 | 5,402,377 | 5,402,017 | 4,686,413 | 4,183,266 | |||||||||||||||
|
|
|
|
|
|
|
|
|
|
|
|||||||||||
| Selected statement of cash flows data: |
||||||||||||||||||||
| Net cash provided by (used in) continuing operations: |
||||||||||||||||||||
| Operating activities |
$ | 106.7 | $ | (46.0 | ) | $ | 22.6 | $ | (13.1 | ) | $ | 99.9 | ||||||||
| Investing activities |
(5.2 | ) | (23.4 | ) | (24.3 | ) | (101.3 | ) | (1,095.1 | ) | ||||||||||
| Financing activities |
(34.7 | ) | 25.5 | (1.3 | ) | 148.2 | 1,058.3 | |||||||||||||
| As of December 31, | ||||||||||||||||||||
| 2015 | 2014 | 2013 | 2012 | 2011 | ||||||||||||||||
| Selected balance sheet data: |
||||||||||||||||||||
| Cash and cash equivalents |
$ | 121.3 | $ | 57.1 | $ | 116.2 | $ | 129.4 | $ | 109.3 | ||||||||||
| Total assets |
2,152.7 | 2,105.1 | 2,216.5 | 2,370.8 | 2,756.9 | |||||||||||||||
| Total debt |
2,170.5 | 2,067.4 | 1,982.8 | 1,947.0 | 1,828.0 | |||||||||||||||
| Total liabilities |
2,923.8 | 2,718.9 | 2,624.5 | 2,532.2 | 2,433.7 | |||||||||||||||
| Total stockholders’ equity (deficit) |
(771.1 | ) | (613.8 | ) | (408.0 | ) | (161.4 | ) | 323.2 | |||||||||||
| (1) | Basic and diluted loss per share is computed by dividing the net loss available to common stockholders by the weighted-average number of share of common stock outstanding during the period. |
55
Table of Contents
MANAGEMENT’S DISCUSSION AND ANALYSIS OF FINANCIAL CONDITION AND
RESULTS OF OPERATIONS
You should read the following discussion and analysis of our financial condition and results of operations together with the consolidated financial statements and the related notes included elsewhere in this prospectus. The following discussion and analysis of our financial condition and results of operations contains forward-looking statements and involves numerous risks and uncertainties, including, but not limited to, those set forth under “Risk Factors” and “Cautionary Note Regarding Forward-Looking Statements.” Actual results may differ materially from those contained in any forward-looking statement. You should read the following discussion and analysis together with the section entitled “Risk Factors,” “Selected Historical Financial Data” and the financial statements and related notes thereto included elsewhere in this prospectus.
Overview
We are a leading global provider of outsourced clinical development and commercialization services to biopharmaceutical companies. We are the only provider delivering a full suite of services to enhance our clients’ ability to successfully develop, launch and market their products. We offer our services on both a standalone basis and as integrated solutions to support clinical development and commercialization. We helped develop or commercialize over 80% of all new molecular entities approved by the FDA and 70% of those approved by the EMA over the last five years through our innovative model. In 2015, we served more than 550 client organizations, including all 20 of the largest global biopharmaceutical companies, and have the ability to service clients in over 90 countries. We have over 14,000 employees globally, including more than 750 M.D.s and Ph.D.s.
The creation of our comprehensive and integrated approach to serve the biopharmaceutical development and commercialization continuum began in 2010 when we were acquired by affiliates of THL, certain co-investors and members of management (the “Investors”). We have made substantial investments, strategic acquisitions and operational changes to expand and strengthen our clinical development and commercial service offerings, geographic presence, human capital, systems and infrastructure to better serve our clients. These strategic and operational initiatives included:
| • | Completion and integration of 10 strategic acquisitions, including three CROs, to offer a full suite of services on a global basis; |
| • | Enhancement of therapeutic area focus with particular expertise in oncology, neuroscience, pain and respiratory; |
| • | Integration and rationalization of dozens of legacy commercial acquisitions and separately-operated brands into four service offerings to form the biopharmaceutical industry’s only CCO providing a full suite of complementary commercialization services; |
| • | Consolidation of administrative functions, including finance, accounting, information technology and legal to reduce costs and increase effectiveness; |
| • | Expansion of our geographic capabilities in Japan, India, Western Europe, Latin America and China; |
| • | Evolution of our selling solutions capabilities into a market-leading strategic offering with expertise in helping clients launch and market complex biopharmaceutical products; and |
| • | Recruitment of Michael A. Bell, our Chairman and CEO who has extensive experience across the healthcare delivery continuum and who has managed and grown sophisticated global service organizations. |
We have actively pursued the integration of our acquisitions and sought cost savings or synergies from combining our existing and acquired businesses. These synergies include elimination of redundant facilities, functions and employees and use of our existing infrastructure to expand revenues associated with our service offerings.
56
Table of Contents
Business Segments
We provide services through the following segments, each of which provides multiple service offerings.
| • | Clinical. Our Clinical segment is a leading global CRO that is therapeutically-focused and provides a wide range of capabilities, including Phase I-IV clinical development services, delivered on a project or functional basis. For the year ended December 31, 2015, our Clinical segment generated total net revenues of $947.9 million, representing approximately 47% of 2015 consolidated net revenues. |
| • | Commercial. Our Commercial segment is a CCO, the biopharmaceutical industry’s only provider of a full suite of complementary commercialization services including selling solutions, communications, consulting and medication adherence (patient outcomes). For the years ended December 31, 2015, our Commercial segment generated total net revenues of $1,059.9 million, representing approximately 53% of 2015 consolidated net revenues. |
Key metrics we use to measure and evaluate our segment operating performance are net revenues and Adjusted EBITDA. The following table sets forth these metrics for each of our segments for the periods presented.
| For the Year Ended December 31, | ||||||||||||
| (in millions) | 2015 | 2014 | 2013 | |||||||||
| Net revenues: |
||||||||||||
| Clinical |
$ | 947.9 | $ | 870.3 | $ | 865.1 | ||||||
| Commercial |
1,059.9 | 943.7 | 784.1 | |||||||||
| Intersegment Eliminations |
(13.5 | ) | (7.6 | ) | (4.6 | ) | ||||||
|
|
|
|
|
|
|
|||||||
| Total |
$ | 1,994.3 | $ | 1,806.4 | $ | 1,644.6 | ||||||
|
|
|
|
|
|
|
|||||||
| Adjusted EBITDA(1): |
||||||||||||
| Clinical |
$ | 139.3 | $ | 99.6 | $ | 93.4 | ||||||
| Commercial |
176.0 | 135.5 | 118.7 | |||||||||
| Corporate and other(2) |
(39.4 | ) | (29.1 | ) | (43.8 | ) | ||||||
|
|
|
|
|
|
|
|||||||
| Total |
$ | 275.9 | $ | 206.0 | $ | 168.3 | ||||||
|
|
|
|
|
|
|
|||||||
| (1) | A reconciliation of income (loss) from continuing operations, the most directly comparable GAAP measure, to EBITDA and from EBITDA to Adjusted EBITDA for the Company on a consolidated basis and for each segment for each of the periods indicated is set forth in “—Additional Segment Data.” |
| (2) | We incur shared corporate expenses related to human resources, finance, legal and executive functions which are recorded as Corporate and other. We have an agreement to provide commercialization services to a biopharmaceutical client for the launch of certain products in return for a royalty on the client’s net revenues from such products. The results of this arrangement are included in Corporate and other as the contract is managed and evaluated on a corporate level. |
Material Trends Affecting our Results of Operations
Biopharmaceutical Industry Trends
Our business is affected by general levels of R&D and commercialization spending by biopharmaceutical companies, as well as the degree to which biopharmaceutical companies choose to outsource their clinical development and commercialization activities, rather than performing such activities internally.
We estimate that total R&D spending in the biopharmaceutical industry was approximately $140 billion in 2015. Potential outsourcing development spending accounted for approximately 70%, or $100 billion, and is estimated to grow approximately 4% annually through 2020.
57
Table of Contents
We estimate that total clinical development outsourcing to CROs in 2015 was approximately 30% of total potential outsourcing development spending, representing an approximately $30 billion market. This market is expected to achieve approximately 40% penetration, or approximately $55 billion of spending, by 2020. Because the market for product commercialization services is more diverse, it is difficult to estimate the current amount of outsourced product commercialization services and the expected growth in such services. However, we estimate that less than 15% of product commercialization expenditures are currently being outsourced. As business models continue to evolve in the healthcare sector, we believe that the rate of commercial outsourcing could follow a similar path to the clinical development market.
If outsourced clinical development or commercialization declines or grows less rapidly than anticipated, or we are unable to compete in these markets successfully, it could have a material adverse effect on our results of operations and financial condition. See “Risk Factors—Risks Related to Our Business” and “Risk Factors—Risks Related to Our Industry.”
The Number, Type and Timing of Projects
In both of our segments, our client relationships are typically comprised of numerous services and projects and our results are tied to the number, type and timing of projects that we manage. The timing of project starts and completions are subject to various factors, including regulatory approvals, interim analysis of project results and success, and client budget cycles. Our full service offering in our Clinical segment is subject to regular project delays and cancellations due to interim client results or client budget reprioritizations, which can adversely affect our results of operations. Within our Commercial segment, project start delays, downsizings and cancellations, particularly within our selling solutions and communications service offerings, can adversely effect our results of operations. While there are operational steps we can take to mitigate our operating expenses in the event a project is delayed or terminated, these steps may not be sufficient to offset the resultant effect on our results of operations.
How We Assess our Performance
Adjusted EBITDA
Adjusted EBITDA is a non-GAAP financial measure of our operating performance that we calculate as income (loss) from continuing operations before interest expense, loss on extinguishment of debt and refinancing costs, income tax provision, depreciation and amortization, equity investment income and other income and further adjusted to exclude certain items (e.g., the impact of impairment losses, acquisition accounting, acquisition expenses, management fees and stock-based compensation) and to give effect to our acquisition of Catalina Health in the fourth quarter of 2013. For a reconciliation of Adjusted EBITDA to income (loss) from continuing operations, the most directly comparable GAAP measure, see ‘‘Prospectus Summary—Summary Consolidated Financial and Operating Data,” and “—Additional Segment Data.” Adjusted EBITDA is a key metric that management uses to assess the performance of our operations and is calculated in a manner consistent with the terms in the instruments governing our indebtedness. We believe that Adjusted EBITDA provides additional relevant information to our investors to compare performance from period to period by excluding certain items that we believe are not representative of our core business.
Backlog, Book-to-Bill Ratio and Net New Awards
Backlog represents future net revenues from work not yet completed or performed under signed contracts, letters of intent or pre-contract commitments that are supported by written communications. Once work commences, net revenues are generally recognized over the life of the contract as services are provided. Included within backlog at December 31, 2015 is approximately $1,973.0 million of backlog that we do not expect to generate net revenues in 2016.
58
Table of Contents
The following table sets forth backlog as of the following dates:
| As of December 31, | ||||||||
| (in millions) | 2015 | 2014 | ||||||
| Clinical backlog |
$ | 2,058.2 | $ | 1,860.5 | ||||
| Commercial backlog |
1,407.2 | 755.5 | ||||||
|
|
|
|
|
|||||
| Backlog |
$ | 3,465.4 | $ | 2,616.0 | ||||
|
|
|
|
|
|||||
We believe backlog for our Clinical segment can be a useful component of predicting future performance given the multi-year nature of most of the contracts. The majority of our service offerings in the Commercial segment have short term contracts and, as a result we do not believe backlog is as meaningful of a metric and we do not use it as a key metric in managing the Commercial segment.
Net new business awards represent the value of future net revenues for services awarded during the period under signed contracts, letters of intent or pre-contract commitments that are supported by written communications that are expected to commence within the next twelve months, net of cancellations of prior awards. Book-to-bill ratio is a ratio calculated by dividing net new business awards by net revenues in a particular period. For the year ended December 31, 2015, our Clinical segment recorded net new business awards of $1,145.3 million compared to $1,023.2 million in 2014, a 12% increase, and book-to-bill ratio of 1.21x compared to 1.18x in 2014.
We believe that our backlog, net new business awards and book-to-bill ratio as of any date are not necessarily meaningful predictors of future results. For more details regarding risks related to our backlog, book-to-bill and net new awards, see “Risk Factors—Risks Related to Our Business.”
Components of Results of Operations
Sources of Revenues
Total revenues are comprised of net revenues and revenues from reimbursed out-of-pocket expenses. Net revenues primarily include the revenues we earn from providing clinical development and commercialization services to our clients. Reimbursed out-of-pocket expenses are comprised principally of payments to investigators, pass-through travel expenses and other costs that are reimbursed by clients. We do not provide an analysis of the fluctuations in reimbursed out-of-pocket expenses as they represent pass-through costs to our clients and, as a result, the fluctuations from period-to-period are not meaningful to our underlying performance.
Net Revenues
Net revenues primarily include the revenues we earn from providing clinical development and commercialization services to our clients. Our service contracts are typically on a fixed price or fee-for-service basis and may include variable components such as incentive fees and performance penalties. We also enter into time and materials contracts. We may offer volume discounts to our large clients based on annual volume thresholds. We record an estimate of the annual volume rebate as a reduction of net revenues based on the estimated rebate earned during the period. The duration of our contracts ranges from a few months to several years. Our top five clients accounted for approximately 37% of net revenues in the year ended December 31, 2015, with our largest client accounting for approximately 10% of our net revenues.
We recognize revenues when all of the following criteria are met: (i) persuasive evidence of an arrangement exists, (ii) services have been rendered, (iii) fees are fixed or determinable and (iv) collectability is reasonably assured.
Our contracts frequently undergo modifications as the work progresses due to changes in the scope of work being performed. We do not recognize revenues related to contract modifications until client acceptance and payment is deemed reasonably assured.
59
Table of Contents
Typically, our contracts may be terminated by our clients with 30 to 90 days’ notice. In the event of termination, our contracts generally require payment for services rendered through the date of termination and may provide for the reimbursement of our costs of winding down the project. We may also be legally and ethically bound to complete or wind down a related clinical trial at our expense.
Costs and Expenses
Our costs and expenses are comprised primarily of our cost of revenues, SG&A expenses, interest expense, impairment expenses and income taxes.
Cost of Revenues
Our cost of revenues consists of service costs and reimbursable out-of-pocket expenses. Service costs include payroll-related costs of client-serving personnel, as well as costs related to technology assets directly used in servicing contracts, third-party service providers, postage and freight, travel and certain facilities costs. Historically, service costs have increased with an increase in net revenues. The future relationship between service costs and net revenues may vary from historical relationships. As noted above, the reimbursable out-of-pocket expenses are comprised principally of payments to investigators, pass-through travel expenses and other costs that are reimbursed by clients. Since reimbursed out-of-pocket expense is offset by our out-of-pocket reimbursable expenses, we measure costs as a percentage of net revenues rather than total revenues as we believe this is a more meaningful comparison and better reflects our business operations.
Selling, General and Administrative Expenses
SG&A expenses include costs related to administrative functions including compensation and benefits, travel, professional services, information technology, facilities and depreciation and amortization. SG&A expenses also includes fees paid pursuant to our THL Management Agreement, pursuant to which entities affiliated with THL (the “THL Managers”) provide us with specified management services. In connection with the termination of the THL Management Agreement in connection with the completion of this offering, we will be required to pay to the THL Managers a termination fee, which we currently estimate will be approximately $ , which will be expensed in the quarter in which we complete this offering. We expect our SG&A expenses will increase as we become a public company as a result of the expected increase in audit fees, legal fees, regulatory compliance and corporate governance, director compensation, director and officer insurance premiums and other related costs. In addition, after this offering, we may incur expenses pursuant to our TRA from time to time as described under “Certain Relationships and Related Party Transactions—Tax Receivables Agreement.”
Proceeds from Purchase Price Finalization
Proceeds from purchase price finalization includes $14.2 million paid to us on May 6, 2013, which amount was based on the final determination of certain post-closing adjustments related to the i3 Acquisition for $375.9 million in cash. The purchase price finalization amount was recorded in 2013 and we have not recorded any additional proceeds from purchase price finalization in any subsequent periods.
Impairment of Goodwill and Long-Lived Assets
Goodwill and indefinite-lived intangible assets are assessed for potential impairment on at least an annual basis or when management determines that the carrying value of goodwill or an indefinite-lived intangible asset may not be recoverable based upon the existence of certain indicators of impairment. Long-lived assets, including finite-lived intangible assets, property and equipment, are reviewed for impairment whenever events or circumstances indicate that the carrying value of an asset may not be recoverable. The impairment analysis requires significant judgments, estimates and assumptions and impairment charges may be recognized in future
60
Table of Contents
periods to the extent changes in factors or circumstances occur. Impairment of goodwill and long-lived assets represent non-cash charges that do not impact our liquidity, compliance with any covenants under our debt agreements or our future results of operations.
Loss on Extinguishment of Debt and Refinancing Costs
Loss on extinguishment of debt and refinancing costs consists of previously unamortized debt financing costs that were expensed as a result of the extinguishment of debt with certain non-participating lenders in a refinancing transaction and third party fees associated with the modification of debt as a result of debt amendments. In connection with our Junior Lien Notes exchange offer, certain of our Senior Secured Credit Facilities were amended on July 28, 2014. There was no net change in the outstanding principal balance of the term loans as a result of the modified terms. In connection with these transactions, we recognized a loss on extinguishment of debt and refinancing costs of approximately $10.1 million in the third quarter of 2014.
Interest Expense
Interest expense consists of interest on borrowings and the amortization of costs incurred to obtain long-term financing. The interest rates on certain of our debt instruments are based on variable market indices, which are subject to a floor. As a result, the amount of interest payable may increase if market interest rates increase above such floor. The interest rate with respect to the Junior Lien Secured Notes is a cash rate of 10% per annum or a payment-in-kind (“PIK”) rate of 12% per annum. We paid interest on the Junior Lien Secured Notes for the periods commencing August 15, 2014 and February 15, 2015 in PIK interest and elected to pay interest for the period commencing August 15, 2015 in PIK interest. The election to pay PIK interest increases our interest expense. In February 2016, we elected to settle the interest due under the upcoming interest period ended August 15, 2016 in cash. Our interest expense may decrease to the extent that we repay indebtedness with the proceeds from this offering and do not otherwise incur additional indebtedness.
Other Income
On August 31, 2015, we sold inVentiv Patient Access Solutions (“iPAS”), an entity within our Commercial segment, resulting in a gain on sale of $11.3 million, which was recorded within Other income in our consolidated statement of operations. The disposal of iPAS did not result in a strategic shift that has or will have a material impact on our consolidated financial position or results of operations. Accordingly, the disposition was not presented as a discontinued operation.
Income Tax (Provision) Benefit
Income tax (provision) benefit depends on the geographic distribution of our pre-tax earnings, the establishment or release of deferred tax asset valuation allowances, changes in jurisdictional tax rates, tax credits and non-deductible items. At December 31, 2015, we had U.S. federal net operating loss carry forwards (“NOLs”) of $889.7 million which will expire beginning in 2026 and ending in 2035 and foreign NOLs of $73.4 million which will expire in varying amounts beginning in 2020 with certain amounts having an indefinite life. As of December 31, 2015 we had a total valuation allowance of $406.5 million. We will record tax expense related to the amortization of our tax deductible indefinite-lived intangible assets and goodwill during those future periods for which we maintain a domestic valuation allowance or until our unamortized balance of $133.0 million at December 31, 2015 is fully amortized for tax purposes.
61
Table of Contents
Exchange Rate Fluctuations
Some of our agreements with our clients provide for payment in currencies other than the U.S. Dollar. We have significant transactions in Pound Sterling, Canadian Dollar and Japanese Yen. These foreign currency revenues when converted into U.S. Dollars, can vary significantly from period to period depending on the exchange rates during a respective period. We believe that comparing these foreign currency denominated revenues, by holding the exchange rates constant with the prior year period is useful to management and investors in evaluating the performance of our ongoing operations on a period-to-period basis. We anticipate that fluctuations in foreign exchange rates and these related constant currency adjustments will continue to occur in future periods.
We believe that the non-GAAP adjustments for constant currency adjustments assist investors in making comparisons of period-to-period operating results and that these items are not indicative of our ongoing core operating performance. A reconciliation of net revenues, the most directly comparable GAAP measure, to constant currency net revenues for the periods presented is indicated as follows:
| For the Year Ended December 31, | ||||||||||||
| (in millions) | 2015 | 2014(1) | 2013(1) | |||||||||
| Consolidated net revenues |
$ | 1,994.3 | $ | 1,806.4 | $ | 1,644.6 | ||||||
| Currency adjustments |
47.8 | 1.2 | — | |||||||||
|
|
|
|
|
|
|
|||||||
| Constant currency consolidated net revenues |
$ | 2,042.1 | $ | 1,807.6 | $ | 1,644.6 | ||||||
|
|
|
|
|
|
|
|||||||
| Clinical net revenues |
$ | 947.9 | $ | 870.3 | $ | 865.1 | ||||||
| Currency adjustments |
33.7 | (2.6 | ) | — | ||||||||
|
|
|
|
|
|
|
|||||||
| Constant currency Clinical net revenues |
$ | 981.6 | $ | 867.7 | $ | 865.1 | ||||||
|
|
|
|
|
|
|
|||||||
| Commercial net revenues |
$ | 1,059.9 | $ | 943.7 | $ | 784.1 | ||||||
| Currency adjustments |
14.1 | 3.8 | — | |||||||||
|
|
|
|
|
|
|
|||||||
| Constant currency Commercial net revenues |
$ | 1,074.0 | $ | 947.5 | $ | 784.1 | ||||||
|
|
|
|
|
|
|
|||||||
| (1) | The year ended December 31, 2014 is the base year for December 31, 2015 constant currency net revenues. Because the year ended December 31, 2013 is the base year for December 31, 2014 constant currency net revenues, currency adjustments for the year ended December 31, 2013 are not meaningful. |
We have translated our foreign currency net revenues into U.S. Dollars using the following average exchange rates:
| For the Year Ended December 31, | ||||||||||||
| U.S. Dollars per: | 2015 | 2014 | 2013 | |||||||||
| Pound Sterling |
1.53 | 1.65 | 1.56 | |||||||||
| Canadian Dollar |
0.78 | 0.91 | 0.97 | |||||||||
| Japanese Yen |
0.0083 | 0.0095 | 0.0103 | |||||||||
62
Table of Contents
Results of Continuing Operations
The following tables set forth our consolidated statements of operations and certain segment data in dollars and as a percentage of net revenues for the periods presented.
| For the Year Ended December 31, | ||||||||||||||||||||||||
| (in millions, except percentages) | 2015 | % of Net revenues |
2014 | % of Net revenues |
2013 | % of Net revenues |
||||||||||||||||||
| Statement of Operations Data: |
||||||||||||||||||||||||
| Net revenues |
$ | 1,994.3 | 100.0 | % | $ | 1,806.4 | 100.0 | % | $ | 1,644.6 | 100.0 | % | ||||||||||||
| Reimbursed out-of-pocket expenses |
327.0 | 16.4 | % | 266.8 | 14.8 | % | 259.9 | 15.8 | % | |||||||||||||||
|
|
|
|
|
|
|
|
|
|
|
|
|
|||||||||||||
| Total revenues |
2,321.3 | 116.4 | % | 2,073.2 | 114.8 | % | 1,904.5 | 115.8 | % | |||||||||||||||
|
|
|
|
|
|
|
|
|
|
|
|
|
|||||||||||||
| Operating expenses: |
||||||||||||||||||||||||
| Cost of revenues |
1,326.8 | 66.5 | % | 1,203.6 | 66.6 | % | 1,084.8 | 66.0 | % | |||||||||||||||
| Reimbursable out-of-pocket expenses |
327.0 | 16.4 | % | 266.8 | 14.8 | % | 259.9 | 15.8 | % | |||||||||||||||
| Selling, general and administrative expenses |
525.2 | 26.3 | % | 529.4 | 29.3 | % | 538.3 | 32.7 | % | |||||||||||||||
| Proceeds from purchase price finalization |
— | — | — | — | (14.2 | ) | (0.8 | )% | ||||||||||||||||
| Impairment of goodwill |
34.0 | 1.7 | % | 15.8 | 0.9 | % | 36.9 | 2.2 | % | |||||||||||||||
| Impairment of long-lived assets |
35.2 | 1.8 | % | 8.2 | 0.5 | % | 2.0 | 0.1 | % | |||||||||||||||
|
|
|
|
|
|
|
|
|
|
|
|
|
|||||||||||||
| Total operating expenses |
2,248.2 | 112.7 | % | 2,023.8 | 112.1 | % | 1,907.7 | 116.0 | % | |||||||||||||||
|
|
|
|
|
|
|
|
|
|
|
|
|
|||||||||||||
| Operating income (loss) |
73.1 | 3.7 | % | 49.4 | 2.7 | % | (3.2 | ) | (0.2 | )% | ||||||||||||||
| Loss on extinguishment of debt and refinancing costs |
— | — | (10.1 | ) | (0.6 | )% | (0.8 | ) | — | |||||||||||||||
| Interest expense |
(228.3 | ) | (11.5 | )% | (217.4 | ) | (12.0 | )% | (209.3 | ) | (12.7 | )% | ||||||||||||
| Interest income |
0.1 | — | 0.4 | — | 0.1 | — | ||||||||||||||||||
| Other income |
11.3 | 0.6 | % | — | — | — | — | |||||||||||||||||
|
|
|
|
|
|
|
|
|
|
|
|
|
|||||||||||||
| Income (loss) before income tax (provision) benefit and income (loss) from equity investments |
(143.8 | ) | (7.2 | )% | (177.7 | ) | (9.9 | )% | (213.2 | ) | (12.9 | )% | ||||||||||||
| Income tax (provision) benefit |
(5.6 | ) | (0.3 | )% | (2.5 | ) | (0.1 | )% | (3.0 | ) | (0.2 | )% | ||||||||||||
|
|
|
|
|
|
|
|
|
|
|
|
|
|||||||||||||
| Income (loss) before income (loss) from equity investments |
(149.4 | ) | (7.5 | )% | (180.2 | ) | (10.0 | )% | (216.2 | ) | (13.1 | )% | ||||||||||||
| Income (loss) from equity investments |
(1.2 | ) | (0.1 | )% | (0.4 | ) | — | — | — | |||||||||||||||
|
|
|
|
|
|
|
|
|
|
|
|
|
|||||||||||||
| Income (loss) from continuing operations |
(150.6 | ) | (7.6 | )% | (180.6 | ) | (10.0 | )% | (216.2 | ) | (13.1 | )% | ||||||||||||
| Net income (loss) from discontinued operations, net of tax |
— | — | (8.2 | ) | (0.5 | )% | (20.2 | ) | (1.2 | )% | ||||||||||||||
|
|
|
|
|
|
|
|
|
|
|
|
|
|||||||||||||
| Net Income (loss) |
(150.6 | ) | (7.6 | )% | (188.8 | ) | (10.5 | )% | (236.4 | ) | (14.3 | )% | ||||||||||||
| Less: Net (income) loss attributable to the noncontrolling interest |
(0.9 | ) | — | (0.8 | ) | — | (1.2 | ) | (0.1 | )% | ||||||||||||||
|
|
|
|
|
|
|
|
|
|
|
|
|
|||||||||||||
| Net income (loss) attributable to inVentiv Group Holdings, Inc. |
$ | (151.5 | ) | (7.6 | )% | $ | (189.6 | ) | (10.5 | )% | $ | (237.6 | ) | (14.4 | )% | |||||||||
|
|
|
|
|
|
|
|
|
|
|
|
|
|||||||||||||
63
Table of Contents
| For the Year Ended December 31, | ||||||||||||||||||||||||
| (in millions, except percentages, share and per share data) | 2015 | % of Net revenues |
2014 | % of Net revenues |
2013 | % of Net revenues |
||||||||||||||||||
| Segment Data: |
||||||||||||||||||||||||
| Net revenues: |
||||||||||||||||||||||||
| Clinical |
$ | 947.9 | 47.2 | % | $ | 870.3 | 48.0 | % | $ | 865.1 | 52.5 | % | ||||||||||||
| Commercial |
1,059.9 | 52.8 | % | 943.7 | 52.0 | % | 784.1 | 47.5 | % | |||||||||||||||
| Cost of revenues: |
||||||||||||||||||||||||
| Clinical |
618.4 | 65.2 | % | 571.5 | 65.7 | % | 572.2 | 66.1 | % | |||||||||||||||
| Commercial |
714.1 | 67.4 | % | 637.9 | 67.6 | % | 516.7 | 65.9 | % | |||||||||||||||
| Corporate and other |
5.2 | — | 0.8 | — | — | — | ||||||||||||||||||
| SG&A: |
||||||||||||||||||||||||
| Clinical |
240.1 | 25.3 | % | 264.8 | 30.4 | % | 269.1 | 31.1 | % | |||||||||||||||
| Commercial |
235.4 | 22.2 | % | 225.8 | 23.9 | % | 222.6 | 28.4 | % | |||||||||||||||
| Corporate and other |
49.7 | 2.5 | % | 38.8 | 2.1 | % | 46.6 | 2.8 | % | |||||||||||||||
Year Ended December 31, 2015 compared to the Year Ended December 31, 2014
Net revenues
| For the Year Ended December 31, | Change | |||||||||||||||||||||||
| (in millions, except percentages) | 2015 | % of Total | 2014 | % of Total | $ | % | ||||||||||||||||||
| Net revenues: |
||||||||||||||||||||||||
| Clinical |
$ | 947.9 | 47.2 | % | $ | 870.3 | 48.0 | % | $ | 77.6 | 8.9 | % | ||||||||||||
| Commercial |
1,059.9 | 52.8 | % | 943.7 | 52.0 | % | 116.2 | 12.3 | % | |||||||||||||||
| Intersegment eliminations |
(13.5 | ) | — | (7.6 | ) | — | (5.9 | ) | — | |||||||||||||||
|
|
|
|
|
|
|
|
|
|
|
|
|
|||||||||||||
| Net revenues |
$ | 1,994.3 | 100.0 | % | $ | 1,806.4 | 100.0 | % | $ | 187.9 | 10.4 | % | ||||||||||||
|
|
|
|
|
|
|
|
|
|
|
|
|
|||||||||||||
Net revenues increased approximately $187.9 million or 10.4% (13.0% on a constant currency basis), to $1,994.3 million in 2015 from $1,806.4 million in 2014, due to an increase in net revenues in both our Clinical and Commercial segments. Foreign currency exchange rate fluctuations computed on a constant currency basis resulted in a decrease of approximately $47.8 million in net revenues for the year ended December 31, 2015.
Net revenues in our Clinical segment increased approximately $77.6 million or 8.9% (12.8% on a constant currency basis), to $947.9 million in 2015 from $870.3 million in 2014. This increase was primarily attributable to increased volume from new projects and the acceleration of conversion of backlog in our full service offering. Foreign currency exchange rate fluctuations computed on a constant currency basis resulted in a decrease of approximately $33.7 million in net revenues for the year ended December 31, 2015.
Net revenues in our Commercial segment increased approximately $116.2 million or 12.3% (13.8% on a constant currency basis), to $1,059.9 million in 2015 from $943.7 million in 2014. The increase is primarily attributable to growth in our selling solutions offering, our largest offering in our Commercial segment by net revenues, in the United States as a result of new project wins. This growth was partially offset by a decrease in our patient outcomes offering as a result of the loss of certain projects, including relating to patent expiration of our clients’ products. Foreign currency exchange rate fluctuations computed on a constant currency basis resulted in a decrease of approximately $14.1 million in net revenues for the year ended December 31, 2015.
64
Table of Contents
Cost of revenues
| For the Year Ended December 31, | Change | Gross Margin | ||||||||||||||||||||||||||||||
| (in millions, except percentages) | 2015 | % of Net Revenues |
2014 | % of Net Revenues |
$ | % | 2015 | 2014 | ||||||||||||||||||||||||
| Cost of revenues: |
||||||||||||||||||||||||||||||||
| Clinical |
$ | 618.4 | 65.2 | % | $ | 571.5 | 65.7 | % | $ | 46.9 | 8.2 | % | 34.8 | % | 34.3 | % | ||||||||||||||||
| Commercial |
714.1 | 67.4 | % | 637.9 | 67.6 | % | 76.2 | 11.9 | % | 32.6 | % | 32.4 | % | |||||||||||||||||||
| Corporate and other |
5.2 | — | 0.8 | — | 4.4 | 550.0 | % | — | — | |||||||||||||||||||||||
| Intersegment eliminations |
(10.9 | ) | — | (6.6 | ) | — | (4.3 | ) | — | — | — | |||||||||||||||||||||
|
|
|
|
|
|
|
|
|
|
|
|
|
|
|
|
|
|||||||||||||||||
| Cost of revenues |
$ | 1,326.8 | 66.5 | % | $ | 1,203.6 | 66.6 | % | $ | 123.2 | 10.2 | % | 33.5 | % | 33.4 | % | ||||||||||||||||
|
|
|
|
|
|
|
|
|
|
|
|
|
|
|
|
|
|||||||||||||||||
Cost of revenues increased $123.2 million, or 10.2%, to $1,326.8 million in 2015 from $1,203.6 million in 2014, due to volume increases in our Clinical and Commercial segments. Gross margin remained relatively constant and was 33.5% in 2015 compared to 33.4% in 2014.
Cost of revenues in our Clinical segment increased $46.9 million, or 8.2%, to $618.4 million in 2015 from $571.5 million in 2014. The increase primarily reflected the cost of incremental resources to deliver against higher volumes in our full service offering. Despite the increased cost of revenues, the higher volumes in our full service offering in 2015 resulted in a slight improvement in gross margin to 34.8% compared to 34.3% for the year ended December 31, 2014.
Cost of revenues in our Commercial segment increased $76.2 million, or 11.9%, to $714.1 million in 2015 from $637.9 million in 2014. The increase was primarily due to a higher volume of projects in our selling solutions offering, partially offset by decreased costs associated with lower volume in our patient outcomes offering and improved efficiencies in our communications service offering. Gross margin increased modestly to 32.6% in 2015 from 32.4% in 2014.
Corporate and other cost of revenues increased as a result of costs incurred in connection with an agreement to provide commercialization services to a biopharmaceutical client for launch of certain specified products in return for a royalty on the client’s net revenues for such products.
Selling, General and Administrative (SG&A) Expenses
| For the Year Ended December 31, | Change | |||||||||||||||||||||||
| (in millions, except percentages) | 2015 | % of Net Revenues |
2014 | % of Net Revenues |
$ | % | ||||||||||||||||||
| SG&A: |
||||||||||||||||||||||||
| Clinical |
$ | 240.1 | 25.3 | % | $ | 264.8 | 30.4 | % | $ | (24.7 | ) | (9.3 | )% | |||||||||||
| Commercial |
235.4 | 22.2 | % | 225.8 | 23.9 | % | 9.6 | 4.3 | % | |||||||||||||||
| Corporate and other |
49.7 | 2.5 | % | 38.8 | 2.1 | % | 10.9 | 28.1 | % | |||||||||||||||
|
|
|
|
|
|
|
|
|
|
|
|
|
|||||||||||||
| Total SG&A |
$ | 525.2 | 26.3 | % | $ | 529.4 | 29.3 | % | $ | (4.2 | ) | (0.8 | )% | |||||||||||
|
|
|
|
|
|
|
|
|
|
|
|
|
|||||||||||||
SG&A expenses decreased $4.2 million, or 0.8%, to $525.2 million in 2015 from $529.4 million in 2014, due to decreased Clinical segment SG&A expenses, partially offset by increased SG&A expenses in our Commercial segment and Corporate and other.
SG&A expenses in our Clinical segment decreased $24.7 million, or 9.3%, to $240.1 million in 2015 from $264.8 million in 2014. The decrease was primarily due to realized benefits of our efficiency initiatives, including lower compensation related costs and facility costs and lower depreciation and amortization, partially
65
Table of Contents
offset by an increase in expenses related to information technology investments. Non-cash amortization expense related to finite-lived intangible assets was $29.0 million in 2015 compared to $44.4 million in 2014.
SG&A expenses in our Commercial segment increased $9.6 million, or 4.3%, to $235.4 million in 2015 from $225.8 million in 2014. The increase in SG&A for our Commercial segment was primarily due to higher compensation related costs and the $4.7 million non-cash benefit realized in 2014 related to the reversal of the fair value of the contingent consideration obligation associated with the Catalina Health acquisition. This increase was partially offset by lower depreciation and amortization and professional service fees. Non-cash amortization expense related to finite-lived intangible assets was $18.6 million in 2015 compared to $22.3 million in 2014.
Corporate and other SG&A expenses increased $10.9 million, or 28.1%, to $49.7 million in 2015 from $38.8 million in 2014. The increase was primarily due to higher compensation related costs, partially offset by lower information technology investments and lower professional service fees.
Impairments of Goodwill and Long-lived Assets
| For the Year Ended December 31, |
||||||||
| (in millions) | 2015 | 2014 | ||||||
| Impairments of goodwill and long-lived assets |
$ | 69.2 | $ | 24.0 | ||||
In the fourth quarter of each of 2015 and 2014, we performed our annual goodwill and indefinite-lived intangible asset impairment assessment. We concluded that the fair value of certain of our reporting units was less than the carrying value and recorded a goodwill and long-lived asset impairment charge of $34.0 million and $35.2 million, respectively, in 2015. We recorded a goodwill and long-lived asset impairment charge of $15.8 million and $8.2 million, respectively, in 2014.
Loss on Extinguishment of Debt and Refinancing Costs
| For the Year Ended December 31, |
||||||||
| (in millions) | 2015 | 2014 | ||||||
| Loss on extinguishment of debt and refinancing costs |
$ | — | $ | 10.1 | ||||
For the year ended December 31, 2014, we recognized a loss on extinguishment of debt and refinancing costs of approximately $10.1 million related to the August 15, 2014 exchange offer described under “Description of Material Indebtedness.”
Interest Expense, Net
| For the Year Ended December 31, |
||||||||
| (in millions) | 2015 | 2014 | ||||||
| Interest expense, net |
$ | 228.2 | $ | 217.0 | ||||
Interest expense, net increased $11.2 million to $228.2 million in 2015 from $217.0 million in 2014. The higher interest expense reflects both a higher average debt balance and higher average interest rates for 2015 compared to 2014 as a result of the August 2014 exchange offer. Interest expense included non-cash debt issuance costs and bond discount/premium amortization of $19.0 million and $18.6 million, for 2015 and 2014, respectively, and penalty interest on the Senior Unsecured Notes of $2.2 million and $6.5 million, for 2015 and 2014, respectively.
66
Table of Contents
(Provision) Benefit for Income Taxes
| For the Year Ended December 31, | ||||||||||||||||
| (in millions, except percentages) | 2015 | Effective Tax Rate | 2014 | Effective Tax Rate | ||||||||||||
| (Provision) benefit for income taxes |
$ | (5.6 | ) | (3.9 | )% | $ | (2.5 | ) | (1.4 | )% | ||||||
The reconciliation between our statutory tax rate (reflecting a tax benefit on our consolidated loss) and the effective tax rate (a tax provision) is provided in Note 16 to the consolidated financial statements included elsewhere in this prospectus. The 2015 consolidated tax provision of $5.6 million primarily reflected that we (i) continued to record a full valuation allowance for our domestic and certain foreign tax jurisdictions, (ii) recorded a tax provision for certain foreign and state jurisdictions that generated earnings, (iii) incurred a deferred tax provision in our domestic jurisdiction arising from taxable temporary differences related to amortization of indefinite-lived intangible assets and goodwill, and (iv) recorded changes in unrecognized tax benefits (including related penalties and interest) as they occurred. The tax provision included $1.0 million of foreign taxes, $4.9 million of taxable temporary differences from amortization of indefinite-lived intangible assets and goodwill (reduced by the reduction in previously recorded deferred taxes related to impairments of indefinite-lived intangible assets and goodwill), and a $0.3 million net decrease in unrecognized tax benefits. The provision for foreign taxes included a $5.9 million deferred tax benefit from the release of a portion of our valuation allowance for our Canadian jurisdiction. We will record tax expense related to the amortization of our tax deductible indefinite-lived intangible assets and goodwill during those future periods for which we maintain a domestic valuation allowance or until our unamortized balance of $133.0 million at December 31, 2015 is fully amortized for tax purposes.
The 2014 consolidated tax provision of $2.5 million included $3.2 million of foreign taxes, $4.4 million of taxable temporary differences from amortization of indefinite-lived intangible assets and goodwill (reduced by the reduction in previously recorded deferred taxes related to impairments of indefinite-lived intangible assets and goodwill), a $5.2 million net decrease in unrecognized tax benefits, primarily from the favorable resolution of a federal tax examination, and $0.1 million of other items.
Year Ended December 31, 2014 compared to the Year Ended December 31, 2013
Net revenues
| For the Year Ended December 31, | Change | |||||||||||||||||||||||
| (in millions, except percentages) | 2014 | % of Total | 2013(1) | % of Total | $ | % | ||||||||||||||||||
| Net revenues: |
||||||||||||||||||||||||
| Clinical |
$ | 870.3 | 48.0 | % | $ | 865.1 | 52.5 | % | $ | 5.2 | 0.6 | % | ||||||||||||
| Commercial |
943.7 | 52.0 | % | 784.1 | 47.5 | % | 159.6 | 20.4 | % | |||||||||||||||
| Intersegment eliminations |
(7.6 | ) | — | (4.6 | ) | — | (3.0 | ) | — | |||||||||||||||
|
|
|
|
|
|
|
|
|
|
|
|
|
|||||||||||||
| Net revenues |
$ | 1,806.4 | 100.0 | % | $ | 1,644.6 | 100.0 | % | $ | 161.8 | 9.8 | % | ||||||||||||
|
|
|
|
|
|
|
|
|
|
|
|
|
|||||||||||||
| (1) | On October 25, 2013, we completed the acquisition of Catalina Health, which is reported in our Commercial segment. |
Net revenues increased approximately $161.8 million or 9.8% (9.9% on a constant currency basis), to $1,806.4 million in 2014 from $1,644.6 million in 2013, primarily due to an increase in net revenues in our Commercial segment. Approximately $43.4 million of the $159.6 million increase in net revenues in our Commercial segment was attributable to the current year net revenues of the Catalina Health business, which we acquired on October 25, 2013. Foreign currency exchange rate fluctuations, computed on a constant currency basis, resulted in an approximately $1.2 million decrease in net revenues for the year ended December 31, 2014.
67
Table of Contents
Net revenues in our Clinical segment increased approximately $5.2 million or 0.6% (0.3% on a constant currency basis), to $870.3 million in 2014 from $865.1 million in 2013. Foreign currency exchange rate fluctuations computed on a constant currency basis resulted in approximately $2.6 million of additional net revenues for the year ended December 31, 2014.
Net revenues in our Commercial segment increased approximately $159.6 million or 20.4% (20.8% on a constant currency basis), to $943.7 million in 2014 from $784.1 million in 2013. Approximately $43.4 million of the increase in net revenues in our Commercial segment was attributable to the current year net revenues of the Catalina Health business. Excluding the impact of the Catalina Health acquisition, net revenues for our Commercial segment increased by approximately $116.2 million. The increase primarily reflected growth in our selling solutions offering from new project wins in the United States and international growth. Foreign currency exchange rate fluctuations resulted in a $3.8 million decrease in net revenues for the year ended December 31, 2014.
Cost of revenues
| For the Year Ended December 31, | Change | Gross Margin |
||||||||||||||||||||||||||||||
| (in millions, except percentages) | 2014 | % of Net Revenues |
2013(1) | % of Net Revenues |
$ | % | 2014 | 2013 | ||||||||||||||||||||||||
| Cost of revenues: |
||||||||||||||||||||||||||||||||
| Clinical |
$ | 571.5 | 65.7 | % | $ | 572.2 | 66.1 | % | $ | (0.7 | ) | (0.1 | )% | 34.3 | % | 33.9 | % | |||||||||||||||
| Commercial |
637.9 | 67.6 | % | 516.7 | 65.9 | % | 121.2 | 23.5 | % | 32.4 | % | 34.1 | % | |||||||||||||||||||
| Corporate and other |
0.8 | — | — | — | 0.8 | — | — | — | ||||||||||||||||||||||||
| Intersegment eliminations |
(6.6 | ) | — | (4.1 | ) | — | (2.5 | ) | — | — | — | |||||||||||||||||||||
|
|
|
|
|
|
|
|
|
|
|
|
|
|
|
|
|
|||||||||||||||||
| Cost of revenues |
$ | 1,203.6 | 66.6 | % | $ | 1,084.8 | 66.0 | % | $ | 118.8 | 11.0 | % | 33.4 | % | 34.0 | % | ||||||||||||||||
|
|
|
|
|
|
|
|
|
|
|
|
|
|
|
|
|
|||||||||||||||||
| (1) | On October 25, 2013, we completed the acquisition of Catalina Health, which is reported in our Commercial segment. |
Cost of revenues increased $118.8 million, or 11.0%, to $1,203.6 million in 2014 from $1,084.8 million in 2013, due to an increase in cost of revenues in our Commercial segment. Approximately $29.1 million of the increase in cost of revenues in our Commercial segment was attributable to the current year cost of revenues of Catalina Health, which we acquired on October 25, 2013. Gross margin decreased to 33.4% in 2014 compared to 34.0% in 2013 due to decreased gross margin in our Commercial segment, which was partially offset by increased gross margin in our Clinical segment.
Cost of revenues in our Clinical segment decreased $0.7 million, or 0.1%, to $571.5 million in 2014 from $572.2 million in 2013. Gross margin increased to 34.3% in 2014 compared to 33.9% in 2013, due primarily to an increase in operating efficiencies including lower compensation costs in the current year.
Cost of revenues in our Commercial segment increased $121.2 million, or 23.5%, to $637.9 million in 2014 from $516.7 million in 2013. Approximately $29.1 million of the increase in cost of revenues in our Commercial segment was attributable to the current year cost of revenues of Catalina Health, which we acquired on October 25, 2013. Excluding the impact of the Catalina Health acquisition, cost of revenues for our Commercial segment increased $92.1 million, which is primarily due to higher volumes in our selling solutions offering, partially offset by decreases in our patient outcomes offering. Gross margin decreased to 32.4% in 2014 from 34.1% in 2013 due primarily to service mix, the timing of certain fees received in 2013 related to our selling solutions offering, new project start-up costs and international expansion in 2014.
Corporate and other cost of revenues includes costs incurred in connection with an agreement to provide commercialization services to a biopharmaceutical client for launch of certain specified products in return for a royalty on the net revenues for such products.
68
Table of Contents
Selling, General and Administrative (SG&A) Expenses
| For the Year Ended December 31, | Change | |||||||||||||||||||||||
| (in millions, except percentages) | 2014 | % of Net Revenues |
2013(1) | % of Net Revenues |
$ | % | ||||||||||||||||||
| SG&A: |
||||||||||||||||||||||||
| Clinical |
$ | 264.8 | 30.4 | % | $ | 269.1 | 31.1 | % | $ | (4.3 | ) | (1.6 | )% | |||||||||||
| Commercial |
225.8 | 23.9 | % | 222.6 | 28.4 | % | 3.2 | 1.4 | % | |||||||||||||||
| Corporate and other |
38.8 | 2.1 | % | 46.6 | 2.8 | % | (7.8 | ) | (16.7 | )% | ||||||||||||||
|
|
|
|
|
|
|
|
|
|
|
|
|
|||||||||||||
| Total SG&A |
$ | 529.4 | 29.3 | % | $ | 538.3 | 32.7 | % | $ | (8.9 | ) | (1.7 | )% | |||||||||||
|
|
|
|
|
|
|
|
|
|
|
|
|
|||||||||||||
| (1) | On October 25, 2013, we completed the acquisition of Catalina Health, which is reported in our Commercial segment. |
SG&A expenses decreased $8.9 million, or 1.7%, to $529.4 million in 2014 from $538.3 million in 2013, due primarily to decreases in our Clinical segment and Corporate and other SG&A, partially offset by an increase in SG&A in our Commercial segment. Included in SG&A in our Commercial segment was $15.1 million related to the current year SG&A of Catalina Health, which we acquired on October 25, 2013.
SG&A expenses in our Clinical segment decreased $4.3 million, or 1.6%, to $264.8 million in 2014 from $269.1 million in 2013. The decrease reflects savings from facility optimizations and lower depreciation and amortization, partially offset by information technology investments. Non-cash amortization expense related to finite-lived intangible assets was $44.4 million in 2014 compared to $46.6 million in 2013.
SG&A expenses in our Commercial segment increased $3.2 million, or 1.4%, to $225.8 million in 2014 from $222.6 million in 2013. Approximately $15.1 million of the increase in SG&A in our Commercial segment was attributable to the current year SG&A of Catalina Health, which we acquired on October 25, 2013. Excluding the impact of the Catalina Health acquisition, SG&A for our Commercial segment decreased $11.9 million, which was due in part to the benefit of a $4.7 million decrease in the fair value of the contingent consideration associated with the Catalina Health acquisition, lower facility related costs and depreciation and amortization. Non-cash amortization expense related to finite-lived intangible assets was $22.3 million in 2014 compared to $25.6 million in 2013.
Corporate and other SG&A expenses decreased $7.8 million, or 16.7%, to $38.8 million in 2014 from $46.6 million in 2013. The decrease was primarily the result of lower compensation and benefit related costs and professional service fees.
Impairments of Goodwill and Long-lived Assets
| For the Year Ended December 31, |
||||||||
| (in millions) | 2014 | 2013 | ||||||
| Impairments of goodwill and long-lived assets |
$ | 24.0 | $ | 38.9 | ||||
In the fourth quarter of 2014 and 2013, we performed our annual goodwill and indefinite-lived intangible asset impairment assessment. We concluded that the fair value of certain of our reporting units was less than the carrying value and recorded a goodwill and long-lived asset impairment charge of $15.8 million and $8.2 million, respectively, in 2014. We recorded a goodwill and long-lived asset impairment charge of $36.9 million and $2.0 million, respectively, in 2013.
69
Table of Contents
Loss on Extinguishment of Debt and Refinancing Costs
| For the Year Ended December 31, |
||||||||
| (in millions) | 2014 | 2013 | ||||||
| Loss on extinguishment of debt and refinancing costs |
$ | 10.1 | $ | 0.8 | ||||
For 2014, we recognized a loss on extinguishment of debt and refinancing costs of approximately $10.1 million related to the August 15, 2014 exchange offer. For the year ended December 31, 2013, we recognized a loss on extinguishment of debt of $0.8 million in connection with the execution of the ABL Facility.
Interest Expense, Net
| For the Year Ended December 31, |
||||||||
| (in millions) | 2014 | 2013 | ||||||
| Interest expense, net |
$ | 217.0 | $ | 209.2 | ||||
Interest expense, net increased by $7.8 million to $217.0 million in 2014 from $209.2 million in 2013. The higher interest expense reflects both a higher average debt balance and higher average interest rates for 2014 compared to 2013 as a result of the exchange offer on August 15, 2014. Interest expense includes non-cash debt issuance costs and bond discount and premium amortization of $18.6 million for each of the years ended December 31, 2014 and 2013, and penalty interest on the Senior Unsecured Notes of $6.5 million and $8.0 million for the years ended December 31, 2014 and 2013, respectively.
(Provision) Benefit for Income Taxes
| For the Year Ended December 31, | ||||||||||||||||
| (in millions, except percentages) | 2014 | Effective Tax Rate |
2013 | Effective Tax Rate |
||||||||||||
| (Provision) benefit for income taxes |
$ | (2.5 | ) | (1.4 | )% | $ | (3.0 | ) | (1.4 | )% | ||||||
The reconciliation between our statutory tax rate (reflecting a tax benefit on our consolidated loss) and the effective tax rate (a tax provision) is provided in Note 16 to the consolidated financial statements included elsewhere in this prospectus. The 2014 tax provision of $2.5 million included $3.2 million of foreign taxes, $4.4 million of taxable temporary differences from amortization of indefinite-lived intangible assets and goodwill (reduced by the reduction in previously recorded deferred taxes related to impairments of indefinite-lived intangible assets and goodwill), a $5.2 million net decrease in unrecognized tax benefits, primarily from the favorable resolution of an IRS examination, and $0.1 million of other items. The 2013 tax provision of $3.0 million included $1.5 million of foreign tax benefits, $5.4 million of taxable temporary differences from amortization of indefinite-lived intangible assets and goodwill (reduced by the reduction in previously recorded deferred taxes related to impairments of indefinite-lived intangible assets and goodwill), a $2.5 million net decrease in unrecognized tax benefits, and $1.6 million of other items.
Quarterly Results of Operations
The following table sets forth statement of operations data for each of the quarters presented. We have prepared the quarterly statement of operations data on a basis consistent with the audited consolidated financial statements included elsewhere in this prospectus. In the opinion of management, the financial information reflects all adjustments, consisting of normal recurring adjustments, which we consider necessary for a fair presentation of this data. This information should be read in conjunction with the audited consolidated financial statements and related notes included elsewhere in this prospectus. The results of historical periods are not necessarily indicative of the results for any future period.
70
Table of Contents
| For the Three Months Ended | ||||||||||||||||||||||||||||||||
| (in millions, except share and per share data) |
December 31, 2015 |
September 30, 2015 |
June 30, 2015 |
March 31, 2015 |
December 31, 2014 |
September 30, 2014 |
June 30, 2014 |
March 31, 2014 |
||||||||||||||||||||||||
| (unaudited) | ||||||||||||||||||||||||||||||||
| Statement of Operations Data: |
||||||||||||||||||||||||||||||||
| Net revenues |
$ | 532.5 | $ | 521.4 | $ | 489.4 | $ | 451.0 | $ | 472.6 | $ | 462.4 | $ | 449.6 | $ | 421.8 | ||||||||||||||||
| Reimbursed out-of-pocket expenses |
88.7 | 87.9 | 83.1 | 67.3 | 84.0 | 62.5 | 64.0 | 56.3 | ||||||||||||||||||||||||
|
|
|
|
|
|
|
|
|
|
|
|
|
|
|
|
|
|||||||||||||||||
| Total revenues |
621.2 | 609.3 | 572.5 | 518.3 | 556.6 | 524.9 | 513.6 | 478.1 | ||||||||||||||||||||||||
|
|
|
|
|
|
|
|
|
|
|
|
|
|
|
|
|
|||||||||||||||||
| Operating expenses: |
||||||||||||||||||||||||||||||||
| Cost of revenues |
354.2 | 345.9 | 326.2 | 300.5 | 310.1 | 310.3 | 301.6 | 281.6 | ||||||||||||||||||||||||
| Reimbursable out-of-pocket expenses |
88.7 | 87.9 | 83.1 | 67.3 | 84.0 | 62.5 | 64.0 | 56.3 | ||||||||||||||||||||||||
| Selling, general and administrative expenses |
127.1 | 131.6 | 133.6 | 132.9 | 128.2 | 133.0 | 136.4 | 131.8 | ||||||||||||||||||||||||
| Impairment of goodwill |
34.0 | — | — | — | 15.8 | — | — | — | ||||||||||||||||||||||||
| Impairment of long-lived assets |
35.2 | — | — | — | 8.2 | — | — | — | ||||||||||||||||||||||||
| Total operating expenses |
639.2 | 565.4 | 542.9 | 500.7 | 546.3 | 505.8 | 502.0 | 469.7 | ||||||||||||||||||||||||
|
|
|
|
|
|
|
|
|
|
|
|
|
|
|
|
|
|||||||||||||||||
| Operating income (loss) |
(18.0 | ) | 43.9 | 29.6 | 17.6 | 10.3 | 19.1 | 11.6 | 8.4 | |||||||||||||||||||||||
| Loss on extinguishment of debt and refinancing costs |
— | — | — | — | — | (10.1 | ) | — | — | |||||||||||||||||||||||
| Interest expense |
(57.4 | ) | (57.3 | ) | (57.1 | ) | (56.5 | ) | (56.5 | ) | (55.0 | ) | (53.3 | ) | (52.6 | ) | ||||||||||||||||
| Interest income |
0.1 | — | — | — | 0.1 | 0.1 | 0.1 | 0.1 | ||||||||||||||||||||||||
| Other income |
— | 11.3 | — | — | — | — | — | — | ||||||||||||||||||||||||
|
|
|
|
|
|
|
|
|
|
|
|
|
|
|
|
|
|||||||||||||||||
| Income (loss) before income tax (provision) benefit and income (loss) from equity investments |
(75.3 | ) | (2.1 | ) | (27.5 | ) | (38.9 | ) | (46.1 | ) | (45.9 | ) | (41.6 | ) | (44.1 | ) | ||||||||||||||||
| Income tax (provision) benefit |
6.0 | (4.4 | ) | (2.7 | ) | (4.5 | ) | 7.4 | (2.3 | ) | (5.7 | ) | (1.9 | ) | ||||||||||||||||||
|
|
|
|
|
|
|
|
|
|
|
|
|
|
|
|
|
|||||||||||||||||
| Income (loss) before income (loss) from equity investments |
(69.3 | ) | (6.5 | ) | (30.2 | ) | (43.4 | ) | (38.7 | ) | (48.2 | ) | (47.3 | ) | (46.0 | ) | ||||||||||||||||
| Income (loss) from equity investments |
0.1 | — | 0.3 | (1.6 | ) | (0.2 | ) | — | (0.2 | ) | — | |||||||||||||||||||||
|
|
|
|
|
|
|
|
|
|
|
|
|
|
|
|
|
|||||||||||||||||
| Income (loss) from continuing operations |
(69.2 | ) | (6.5 | ) | (29.9 | ) | (45.0 | ) | (38.9 | ) | (48.2 | ) | (47.5 | ) | (46.0 | ) | ||||||||||||||||
| Net income (loss) from discontinued operations, net of tax |
— | — | — | — | — | — | (5.5 | ) | (2.7 | ) | ||||||||||||||||||||||
|
|
|
|
|
|
|
|
|
|
|
|
|
|
|
|
|
|||||||||||||||||
| Net income (loss) |
(69.2 | ) | (6.5 | ) | (29.9 | ) | (45.0 | ) | (38.9 | ) | (48.2 | ) | (53.0 | ) | (48.7 | ) | ||||||||||||||||
| Less: Net (income) loss attributable to the noncontrolling interest |
(0.3 | ) | (0.2 | ) | (0.3 | ) | (0.1 | ) | (0.3 | ) | — | — | (0.5 | ) | ||||||||||||||||||
|
|
|
|
|
|
|
|
|
|
|
|
|
|
|
|
|
|||||||||||||||||
| Net income (loss) attributable to inVentiv Group Holdings, Inc. |
$ | (69.5 | ) | $ | (6.7 | ) | $ | (30.2 | ) | $ | (45.1 | ) | $ | (39.2 | ) | $ | (48.2 | ) | $ | (53.0 | ) | $ | (49.2 | ) | ||||||||
|
|
|
|
|
|
|
|
|
|
|
|
|
|
|
|
|
|||||||||||||||||
| Earnings per share attributable to inVentiv Group Holdings, Inc.: |
||||||||||||||||||||||||||||||||
| Basic and diluted:(1) |
||||||||||||||||||||||||||||||||
| Income (loss) from continuing operations |
$ | (12.86 | ) | $ | (1.24 | ) | $ | (5.60 | ) | $ | (8.35 | ) | $ | (7.25 | ) | $ | (8.92 | ) | $ | (8.80 | ) | $ | (8.61 | ) | ||||||||
| Income (loss) from discontinued operations |
— | — | — | — | — | — | (1.01 | ) | (0.50 | ) | ||||||||||||||||||||||
|
|
|
|
|
|
|
|
|
|
|
|
|
|
|
|
|
|||||||||||||||||
| Net income (loss) per share attributable to inVentiv Group Holdings, Inc. |
$ | (12.86 | ) | $ | (1.24 | ) | $ | (5.60 | ) | $ | (8.35 | ) | $ | (7.25 | ) | $ | (8.92 | ) | $ | (9.81 | ) | $ | (9.11 | ) | ||||||||
|
|
|
|
|
|
|
|
|
|
|
|
|
|
|
|
|
|||||||||||||||||
| Weighted average number of shares outstanding- basic and diluted |
5,402,377 | 5,402,377 | 5,402,377 | 5,402,377 | 5,402,377 | 5,402,377 | 5,402,377 | 5,402,377 | ||||||||||||||||||||||||
|
|
|
|
|
|
|
|
|
|
|
|
|
|
|
|
|
|||||||||||||||||
| (1) | Basic and diluted loss per share is computed by dividing the net loss available to common stockholders by the weighted-average number of shares of common stock outstanding during the period. |
71
Table of Contents
Seasonality
Our results are subject to some quarterly variability as a result of client purchasing patterns, the timing of the realization of incentive and performance fees and the annual cadence of compensation and benefits expenses. We have historically experienced an increase in net revenues in the fourth quarter as a result of clients’ increased spending at the end of the calendar year as well as the realization of incentive and performance fees under certain selling solutions contracts. We have also historically experienced decreased cost of net revenues and SG&A expenses in the fourth quarter and, to a lesser extent, the third quarter related to compensation and benefits expenses, specifically related to reduced employment taxes and benefits accruals.
Financial Condition, Liquidity and Capital Resources
Our primary sources of liquidity are cash flows from operations and borrowings under our credit facilities. At December 31, 2015, we had cash and cash equivalents of $121.3 million and $145.5 million of combined unused availability under our ABL Facility and International Facility to fund our general working capital needs.
Our primary cash needs are for operating expenses, acquisitions, working capital, capital expenditures, the repayment of principal and the payment of interest on our indebtedness and debt repurchases. Our capital expenditures have been primarily related to information technology and real estate and were $39.3 million, $33.1 million and $35.7 million in 2015, 2014 and 2013, respectively.
We and our subsidiaries, affiliates and significant stockholders may from time to time seek to retire or repurchase our outstanding debt through cash purchases and/or exchanges, in open market purchases, privately negotiated transactions, by tender offer or otherwise. Such repurchases or exchanges, if any, will depend on prevailing market conditions, liquidity requirements, contractual restrictions and other factors. The amounts involved may be material. We repurchased $23.7 million in face value of our Junior Lien Secured Notes during the first quarter of 2016. See Note 21 to our consolidated financial statements included elsewhere in this prospectus. In addition, after this offering, we may need cash to fund payments under our TRA, as described under “Certain Relationships and Related Party Transactions—Tax Receivables Agreement.” Prior to this offering, we required cash to pay the THL Managers an annual fee pursuant to the THL Management Agreement. Upon the completion of this offering, we will no longer be required to pay the THL Managers an annual fee; however we will be required to pay a cash termination fee to the THL Managers upon the completion of this offering, which we currently estimate will be approximately $ . See “Certain Relationships and Related Party Transactions—Management Services Agreements.”
Our Junior Lien Secured Notes permit up to six semi-annual interest payments to be settled on a PIK basis through the issuance of additional Junior Lien Secured Notes. We paid $30.4 million, $32.2 million and $33.9 million of interest on the Junior Lien Secured Notes for the periods commencing August 15, 2014, February 15, 2015 and August 15, 2015, respectively, in PIK interest, and elected to pay interest for the period commencing February 15, 2016 in cash.
We believe that our current cash and equivalents, along with cash flows from operations and unused availability under our ABL Facility and International Facility will be sufficient to fund our current operating requirements over the next twelve months. Our liquidity and our ability to meet our obligations and fund our capital and other requirements are also dependent on our future financial performance, which is subject to general economic and market conditions and other factors that are beyond our control. Accordingly, we cannot assure you that our business will generate sufficient cash flow from operations or that future borrowings or equity financings will be available to meet our liquidity needs. If we were unable to generate new contracts with existing and new clients, if the level of contract cancellations increased, or if contract delays lengthen or increase, our cash flow from operations would be materially adversely affected. We anticipate that to the extent we need additional liquidity, it will be funded through the incurrence of additional indebtedness, equity financings or a combination thereof. We cannot assure you that we will be able to obtain this additional liquidity on reasonable
72
Table of Contents
terms or at all. Although we have no current plans to do so, if we decide to pursue one or more significant acquisitions or significant internal growth initiatives, we may incur additional debt or sell additional equity to finance such acquisitions or initiatives.
The following table sets forth our net financial liabilities at December 31, 2015 and 2014:
| As of December 31, | ||||||||
| (in millions) | 2015 | 2014 | ||||||
| Financial assets: |
||||||||
| Cash and cash equivalents |
$ | 121.3 | $ | 57.1 | ||||
| Restricted cash |
1.6 | 1.7 | ||||||
|
|
|
|
|
|||||
| Total financial assets |
122.9 | 58.8 | ||||||
| Financial liabilities: |
||||||||
| Current portion of capital leases and other financing arrangements |
23.3 | 16.3 | ||||||
| Senior Secured Credit Facilities |
575.3 | 575.3 | ||||||
| Senior Secured Notes |
625.0 | 625.0 | ||||||
| ABL Facility |
— | — | ||||||
| Junior Lien Secured Notes |
569.7 | 507.0 | ||||||
| Senior Unsecured Notes |
376.3 | 376.3 | ||||||
| International Facility |
— | — | ||||||
| Long-term portion of capital leases |
45.3 | 29.3 | ||||||
| Less: unamortized premium (discount) |
(9.0 | ) | (12.4 | ) | ||||
| Less: deferred financing costs |
(35.4 | ) | (49.4 | ) | ||||
|
|
|
|
|
|||||
| Total debt |
2,170.5 | 2,067.4 | ||||||
|
|
|
|
|
|||||
| Net financial liabilities |
$ | (2,047.6 | ) | $ | (2,008.6 | ) | ||
|
|
|
|
|
|||||
Cash Flows
The following table presents a summary of cash flows from operating, investing and financing activities for the periods presented:
| For the Year Ended December 31, |
||||||||||||
| (in millions) | 2015 | 2014 | 2013 | |||||||||
| Cash provided by (used in) continuing operations: |
||||||||||||
| Operating activities |
$ | 106.7 | $ | (46.0 | ) | $ | 22.6 | |||||
| Investing activities |
(5.2 | ) | (23.4 | ) | (24.3 | ) | ||||||
| Financing activities |
(34.7 | ) | 25.5 | (1.3 | ) | |||||||
For the Year December 31, 2015 versus the Year Ended December 31, 2014
Cash provided by operating activities from continuing operations increased by $152.7 million to $106.7 million for the year ended December 31, 2015, compared to cash used in operating activities from continuing operations of $46.0 million for the year ended December 31, 2014. The increase in cash provided by operations for the year ended December 31, 2015 compared to the year ended December 31, 2014 was primarily due to a reduction in cash paid for interest, growth in the business and timing of cash flows associated with certain accruals and other liabilities.
Cash used in investing activities decreased by $18.2 million to $5.2 million for the year ended December 31, 2015 compared to $23.4 million for the year ended December 31, 2014. For the year ended December 31, 2015,
73
Table of Contents
the primary use of cash related to our purchase of property and equipment, partially offset by proceeds from the sale of our iPAS business, our fleet vehicle sales and rebates on our fleet vehicle leases. For the year ended December 31, 2014, the primary use of cash related to our purchase of property and equipment, partially offset by proceeds from our fleet vehicle sales and rebates on our fleet vehicle leases.
Cash used in financing activities increased by $60.2 million to $34.7 million for the year ended December 31, 2015, compared to cash provided by financing activities of $25.5 million for the year ended December 31, 2014. Cash used for the year ended December 31, 2015 primarily reflects payments on our capital lease obligations and other financing arrangements, payment of debt issuance costs and partial settlement of an installment note related to our acquisition of Campbell Alliance Group, Inc. in 2011 (the “Campbell Acquisition”). Cash provided by financing activities for the year ended December 31, 2014 primarily reflects proceeds from issuance of debt, partially offset by payments on our capital lease obligations and other financing arrangements, payment of debt issuance costs and partial settlement of an installment note related to the Campbell Acquisition.
For the Year December 31, 2014 versus the Year Ended December 31, 2013
Cash used in operating activities from continuing operations increased by $68.6 million to $46.0 million during the year ended December 31, 2014, compared to cash provided by operating activities of $22.6 million for the year ended December 31, 2013. The increase in cash used in operations for the year ended December 31, 2014 was primarily due to higher debt service costs compared to the year ended December 31, 2013, current year refinancing costs, and timing of cash flows associated with our billed and unbilled receivables and certain accruals and other liabilities.
Cash used in investing activities from continuing operations decreased by $0.9 million to $23.4 million during the year ended December 31, 2014 compared to $24.3 million for the year ended December 31, 2013. For the year ended December 31, 2014 and 2013, the primary use of cash related to our purchase of property and equipment and disbursements for investments, partially offset by proceeds from our fleet vehicle sales and rebates on our fleet vehicle leases.
Cash provided by financing activities increased by $26.8 million to $25.5 million for the year ended December 31, 2014, compared to cash used in financing activities of $1.3 million for the year ended December 31, 2013. The year ended December 31, 2014 primarily reflects proceeds from issuance of debt, partially offset by payments on our capital lease obligations and other financing arrangements, payment of debt issuance costs and partial settlement of an installment note related to the Campbell Acquisition. Cash used for the year ended December 31, 2013 primarily relates to payments on our capital lease obligations and other financing arrangements and payment of debt issuance costs, partially offset by proceeds from issuance of debt.
Long-term Debt and Credit Facilities
At December 31, 2015, we had $575.3 million outstanding under our Senior Secured Credit Facilities, which consisted of $129.6 million under the B-3 term loans and $445.7 million under the B-4 term loans. The term loans under our Senior Secured Credit Facilities mature in May 2018. In addition, we have an ABL Facility which matures in August 2018, and an International Facility, which matures in July 2020. At December 31, 2015, we had no outstanding borrowings and $18.8 million in letters of credit outstanding under the ABL Facility and no outstanding borrowings under the International Facility, and we would have been able to borrow up to $131.2 million and $14.3 million, respectively, under those facilities. We also had the option, subject to certain conditions, to increase the amounts borrowed under term loan facilities in our Senior Secured Credit Facilities by up to $300.0 million.
In addition, at December 31, 2015, we also had $625.0 million principal amount of our 9% Senior Secured Notes due 2018 outstanding, which mature in January 2018, $569.7 million principal amount of our 10%/12% Junior Lien Secured Notes due 2018 outstanding, which mature in August 2018, and $376.3 million principal amount of our 10% Senior Unsecured Notes due 2018 outstanding, which mature in August 2018.
74
Table of Contents
We also had capitalized leases and other financing arrangements of $68.6 million outstanding as of December 31, 2015.
As of December 31, 2015, we were in compliance with the covenants under each of the credit agreements governing our credit facilities and each of the indentures governing our notes. For an additional description of the terms of our debt instruments, see “Description of Material Indebtedness.”
Commitments and Contractual Obligations
A summary of our current contractual obligations and commercial commitments as of December 31, 2015 is as follows (in millions):
| Contractual Obligations |
Total amounts for all years |
Less than 1 year |
1-3 years | 3-5 years | More than 5 years |
|||||||||||||||
| Long term debt obligations: (a) |
||||||||||||||||||||
| Principal payments |
$ | 2,180.5 | $ | — | $ | 2,180.5 | $ | — | $ | — | ||||||||||
| Interest payments (b) |
508.9 | 170.4 | 338.4 | 0.1 | — | |||||||||||||||
| Capital lease obligations (c) |
69.4 | 22.6 | 38.8 | 8.0 | — | |||||||||||||||
| Other financing arrangements |
1.9 | 1.9 | — | — | — | |||||||||||||||
| Operating leases (d) |
227.4 | 41.1 | 66.9 | 43.4 | 76.0 | |||||||||||||||
| Acquisition contingent consideration accrued on the balance sheet (e) |
0.5 | 0.5 | — | — | — | |||||||||||||||
| Deferred compensation plan accrued on the balance sheet (f) |
12.1 | — | — | — | 12.1 | |||||||||||||||
| Other non-current liabilities (g) |
— | — | — | — | — | |||||||||||||||
| Management agreement with the THL Managers (h) |
— | — | — | — | — | |||||||||||||||
|
|
|
|
|
|
|
|
|
|
|
|||||||||||
| Total obligations (i) |
$ | 3,000.7 | $ | 236.5 | $ | 2,624.6 | $ | 51.5 | $ | 88.1 | ||||||||||
|
|
|
|
|
|
|
|
|
|
|
|||||||||||
| (a) | These future commitments represent the principal and interest payments with respect to the our Senior Secured Credit Facilities, our 9% Senior Secured Notes, our 10%/12% Junior Lien Secured Notes and our 10% Senior Unsecured Notes. We have assumed herein that the remaining five semi-annual interest payments of our Junior Lien Secured Notes will be settled in cash, subject to change based on an election that will be made by us for each respective interest payment period. The February 15, 2016 semi-annual interest payment was settled through the issuance of an additional $33.9 million of Junior Lien Secured Notes. Subsequent to December 31, 2015, we repurchased $23.7 million principal amount of our Junior Lien Secured Notes as discussed in Note 21 to our consolidated financial statements included elsewhere in this prospectus. |
| (b) | Future interest payments on our variable debt are based on the effective interest rate at December 31, 2015. |
| (c) | These future commitments include interest and lease administration fees of $2.8 million, which are not recorded on the consolidated balance sheets as of December 31, 2015, but will be recorded as incurred. |
| (d) | Minimum lease payments have not been reduced by the minimum sublease payments of $6.3 million due from January 2016 to February 2019 under noncancellable subleases. |
| (e) | Represents management’s estimate of acquisition related contingent consideration if the acquired businesses achieve specified performance measurements and the amounts payable in consideration for the early cancellation of certain contingent installment notes we issued to certain members of management in connection with the Campbell Acquisition. |
| (f) | The deferred compensation plan liability is recorded in other non-current liabilities on the consolidated balance sheets. The obligations are payable upon retirement or termination of employment. We have established an irrevocable trust to hold assets to partially fund benefit obligations under the deferred compensation plan, but cannot reasonably estimate the amount or timing of payments, if any, which we will make related to this liability. |
75
Table of Contents
| (g) | At December 31, 2015, we had $25.5 million of unrecognized tax benefits. Of that balance, $22.8 million is related to the U.S. federal tax jurisdiction and, if disallowed by the IRS, would only result in a decrease in our NOL carryforward. Of the balance of $2.7 million, we cannot reasonably estimate the amount or timing of payments, if any. |
| (h) | On August 4, 2010, upon completion of our acquisition by the Investors, we entered into the THL Management Agreement with THL Managers, pursuant to which the THL Managers provide us with management services. Pursuant to the THL Management Agreement, the THL Managers receive an aggregate annual management fee in the amount per year equal to the greater of (a) $2.5 million, or (b) 1.5% of Annual EBITDA (as defined in the THL Management Agreement). The THL Management Agreement includes customary exculpation and indemnification provisions in favor of the THL Managers and their affiliates. The THL Managers may terminate the THL Management Agreement at any time. The THL Management Agreement will terminate automatically upon the consummation of this offering. Upon termination in connection with this offering, the THL Managers will be entitled to a termination fee based on the net present value of the estimate of their annual fee due during the remaining period from the date of termination to the then applicable scheduled date of termination. In connection with the termination of the THL Management Agreement upon the completion of this offering, we will be required to pay to the THL Managers a termination fee which we currently estimate will be approximately $ . See “Certain Relationships and Related Party Transactions—Management Services Agreements.” |
| (i) | Potential payments under our TRA are not reflected in this table. See “Certain Relationships and Related Party Transactions—Tax Receivables Agreement.” |
Off-Balance Sheet Arrangements
As of December 31, 2015 and 2014, we did not have any off-balance-sheet arrangements, as defined in Item 303(a)(4)(ii) of SEC Regulation S-K.
Critical Accounting Policies
Our discussion and analysis of our financial condition and results of operations are based upon our consolidated financial statements, which have been prepared in conformity with GAAP. During the preparation of our consolidated financial statements in conformity with GAAP, we are required to make estimates and assumptions that affect the reported amounts of assets, liabilities, revenues and expenses, fair value measures, goodwill and intangible assets and related disclosures of assets and liabilities. On an ongoing basis, we evaluate such estimates and assumptions. We base our estimates on historical experience and on various assumptions that are believed to be reasonable under the circumstances. Actual results may differ from these estimates under different assumptions or conditions.
Accounting estimates and assumptions discussed in this section do not reflect a comprehensive list of all of our accounting policies, but are those that we consider to be the most critical to an understanding of our financial statements because they involve significant judgments and uncertainties. Our critical accounting policies include:
Revenue Recognition
Our revenue arrangements are typically service-based contracts which may be on a fixed price or fee-for-service basis and may include variable components such as incentive fees and performance penalties. The duration of our contracts ranges from a few months to several years, depending on the arrangement. We recognize revenues when all of the following criteria are met: (i) persuasive evidence of an arrangement exists, (ii) services have been rendered, (iii) fees are fixed or determinable and (iv) collectability is reasonably assured. Our contracts do not generally contain a refund provision. We do not recognize revenues with respect to start-up activities including contract and scope negotiation, and feasibility analysis. The costs for these activities are expensed as incurred. Revenues related to changes in contract scope, which are subject to client approval, is recognized when amounts are determinable and realization is reasonably assured.
76
Table of Contents
We recognize revenues from our service contracts either using a fee-for-service method, proportional performance method or completed contract method. For fee-for-service contracts, we record revenues as contractual items (i.e., “units”) are delivered to the client, or, in the event the contract is time and materials based, when labor hours are incurred. We use the completed contract method when fees are not determinable until all services are delivered to the client, or, when there is uncertainty with respect to our ability to deliver the services to the client. We use the proportional performance method when our fees for a service obligation are fixed pursuant to the contractual terms. Revenues are recognized as services are performed and measured on a proportional performance basis, generally using output measures that are specific to the services provided. To measure performance on a given date, we compare effort expended through that date to estimated total effort to complete the contract. We believe the best indicator of effort expended to complete our performance requirement related to our contractual obligation are the actual units delivered to the client, or the incurrence of labor hours when no other pattern of performance exists. In the event we use labor hours as the basis for determining proportional performance, we estimate the number of hours remaining to complete our service obligation. Actual hours incurred to complete the service requirement may differ from our estimate, and such differences are accounted for prospectively.
We enter into multiple element arrangements in which we are engaged to provide multiple services under one agreement. In such arrangements, we record revenues as each separate service, or element, is delivered to the client. Such arrangements are predominantly within our Commercial segment where we are engaged to provide recruiting, deployment and selling services. These services may be sold individually or in combination with contractual fees that may be based on fixed fees for each element; variable fees for each element; or a combination of both fixed and variable fees. For the arrangements that include multiple elements, arrangement consideration is allocated to units of accounting based on the relative selling price. The best evidence of selling price of a unit of accounting is vendor-specific objective evidence (“VSOE”), which is the price we charge when the deliverable is sold separately. When VSOE is not available to determine selling price, we use relevant third-party evidence (“TPE”) of selling price, if available. When neither VSOE nor TPE of selling price exists, we use our best estimate of selling price (“BESP”), which generally consists of an expected margin on the cost of the services.
We do not defer costs associated with services to a client in return for a royalty on the client’s net revenues. Costs are recognized as incurred and royalties will be earned from net revenues of the client’s product.
Our contracts frequently undergo modifications as the work progresses due to changes in the scope of work being performed. We do not recognize revenues related to contract modifications until client acceptance and payment is deemed reasonably assured.
We may offer volume discounts to our large clients based on annual volume thresholds. We record an estimate of the annual volume rebate as a reduction of net revenues based on the estimated rebate earned during the period.
Most contracts may be terminated with advance notice from a client. In the event of termination, our contracts generally require payment for services rendered through the date of termination.
Deferred Revenues
In some cases, a portion of the contract fee is billed or paid at the time the contract is initiated or prior to the service being performed. In the event we bill or receive cash in advance of the services being performed, we record a liability denoted as deferred revenues and client advances in the accompanying consolidated balance sheets and recognize revenues as the services are performed. In the Commercial segment, we are entitled to additional compensation if certain performance-based criteria are achieved over the contract duration. As there is substantive uncertainty regarding the ability to realize such amounts at the onset of the arrangements, such net revenues are deferred until we determine it has met the performance-based criteria and the other revenue recognition criteria described above.
77
Table of Contents
Receivables, Billed and Unbilled
In general, prerequisites for billings and payments are established by contractual provisions including predetermined payment schedules, submission of appropriate billing detail or the achievement of contract milestones, depending on contract terms. Unbilled services represent services that have been rendered for which net revenues have been recognized but amounts have not been billed. Billed receivables represent amounts we have invoiced our client according to contractual terms.
We maintain an allowance for doubtful accounts for estimated losses inherent in accounts receivable. In establishing the required allowance, we consider historical losses and current market conditions, our clients’ financial condition, receivables in dispute, the receivables aging and payment patterns. Account balances are charged off against the allowance after all means of collection have been exhausted and the potential for recovery is considered remote. If the financial condition of one or more of our clients deteriorates in the future, impacting the clients’ ability to make payments, an increase to our allowance might be required or our allowance may not be sufficient to cover actual write-offs.
Business Combinations
We account for business combinations in accordance with the acquisition method of accounting. The acquisition method of accounting requires that assets acquired and liabilities assumed be recorded at their fair values on the date of a business acquisition. The consolidated financial statements and results of operations reflect the operations of the acquired business from the date of the acquisition.
The judgments that we make in determining the estimated fair value assigned to each class of assets acquired and liabilities assumed, as well as asset lives, can materially impact net earnings in periods following a business combination. We generally use either the income, cost or market approach to determine the appropriate fair values. The income approach presumes that the value of an asset can be estimated by the net economic benefit to be received over the life of the asset, discounted to a present value. The cost approach presumes that an investor would pay no more for an asset than its replacement or reproduction cost. The market approach estimates value based on what other participants in the market have paid for reasonably similar assets. Although each valuation approach is considered in valuing the assets acquired, the approach ultimately selected for each asset or class of assets or liabilities assumed is based on the relevant characteristics and the availability of information.
We record contingent consideration resulting from a business combination at its fair value on the acquisition date. Each reporting period thereafter, we revalue these obligations and record increases or decreases in their fair value as an adjustment to SG&A expenses within the consolidated statements of operations. The changes in the fair value of the contingent consideration obligation are the result of updates to the achievement of expected financial targets and the weighted probability of achieving future financial targets.
Significant judgment is employed in determining the appropriateness of the valuation assumptions as of the acquisition date and for each subsequent period. Accordingly, any change in the valuation assumptions could have an impact on our financial statements. See Note 3 to our consolidated financial statements included elsewhere in this prospectus for additional information.
Goodwill and Indefinite-lived Intangible Assets
Goodwill represents the amount of the purchase price in excess of the fair values assigned to the underlying identifiable net assets of acquired businesses. Goodwill and other indefinite-lived intangible assets, such as tradenames, are assessed for potential impairment on at least an annual basis or when management determines that the carrying value of goodwill or an indefinite-lived intangible asset may not be recoverable based upon the existence of certain indicators of impairment, such as a loss of a significant client, a significant change to our regulatory environment that hinders the ability to conduct business, or a significant downturn in the economy. Goodwill is tested for impairment at the reporting unit level, which is one level below the business segment level.
78
Table of Contents
As part of our annual goodwill impairment testing, we first assess qualitative factors to determine whether it is more likely than not that the fair value of a reporting unit is less than its carrying value. Reporting units are the level at which discrete financial information is available and reviewed by management on a regular basis. The qualitative assessment is also used as a basis for determining whether it is necessary to perform the two-step quantitative impairment test. Qualitative factors assessed at the reporting unit level include, but are not limited to, macroeconomic, industry and market conditions, competitive environments, results of past impairment tests, new service offerings, cost factors and financial performance of the reporting unit. If we choose not to complete a qualitative assessment for a given reporting unit or if the initial assessment indicates that it is more likely than not that the carrying value of a reporting unit exceeds its estimated fair value, performance of the two-step quantitative impairment test is required.
During the fourth quarter of 2015, we utilized a qualitative assessment (step zero) for 5 of our 14 reporting units with goodwill where the fair value substantially exceeded the carrying value in the prior year step one analysis, no significant changes occurred and no potential impairment indicators existed since the previous evaluation of goodwill. After weighing all relevant events and circumstances, we concluded that it is not more-likely-than-not that the fair value of the reporting units was less than their carrying value on a reporting unit basis. Consequently, we did not perform a step one quantitative assessment for these reporting units in 2015. These reporting units represented $589.2 million or 66% of the goodwill reported on the consolidated balance sheet at December 31, 2015. For 2014 and 2013, we elected to proceed directly to the step one quantitative analysis rather than perform the step zero qualitative assessment for our reporting units.
For the annual goodwill impairment test at the reporting units with goodwill for which a step zero assessment was not performed, we utilized a two-step quantitative test. In the first step we compared the fair value of each reporting unit to its carrying value. We estimated the fair value of each individual reporting unit using the income approach (discounted cash flow method). The assumptions utilized in the evaluation of the impairment of goodwill under the income approach included a number of estimates and assumptions regarding future net revenues, and margin growth, changes in working capital, income tax rates, foreign currency exchange rates, capital expenditures, weighted average cost of capital (“WACC”) and expected long-term terminal growth rates applicable to each reporting unit.
The cash flows employed in the income approach were based on our most recent budgets, forecasts and business plans as well as various growth rate assumptions for an initial five year period plus a terminal value. The cash flows were discounted to their present value using a WACC ranging from 11%-13% in 2015, 10%-13% in 2014 and 11%-12% in 2013, and included a 2-3% long-term growth rate applied beyond the forecast period. The assumptions and rates used in our impairment tests require significant judgment, and variations in assumptions could result in materially different indications of fair value and, if applicable, the impairment amount.
If the carrying value of the reporting unit exceeds the fair value, the second step of the test is performed to measure the value of impairment loss, if any. The second step compares the implied fair value of reporting unit goodwill with the carrying value of that goodwill. To calculate the implied fair value of goodwill in this second step, we allocate the fair value of the reporting unit to the assets and liabilities of that reporting unit (including any previously unrecognized intangible assets) as if the reporting unit had been acquired in a current business combination and the fair value was the price paid to acquire the reporting unit. The excess of the fair value of the reporting unit over the amount assigned to the assets and liabilities of the reporting unit represents the implied fair value of goodwill. The step two assessment performed by us resulted in the carrying value of goodwill exceeding the implied fair value of goodwill for certain reporting units and therefore recognition of a pre-tax non-cash goodwill impairment charge of $34.0 million in 2015, $15.8 million in 2014 and $36.9 million in 2013. As of December 31, 2015, there was approximately $135.3 million of goodwill associated with five reporting units for which the fair value of those reporting units does not significantly exceed the respective carrying values as of the last annual impairment assessment. If future cash flows are less than those forecasted in our fair value estimates, additional impairment charges may be required.
79
Table of Contents
We recognized a pre-tax non-cash goodwill impairment charge of $34.0 million for the year ended December 31, 2015 related to a reporting unit in our patient outcomes offering for which impairment charges were taken in the prior year and for which forecasted net revenues and earnings growth have not been met due to slower than anticipated market demand. There is no remaining goodwill for this reporting unit as of December 31, 2015.
Testing indefinite-lived intangible assets, other than goodwill, for impairment requires a one-step approach. As part of our annual indefinite-lived intangible impairment testing, we may first assess qualitative factors to determine whether it is more likely than not that the fair value of the intangible is less than its carrying value. Qualitative factors assessed at the reporting unit level include, but are not limited to, macroeconomic, industry and market conditions, competitive environments, results of past impairment tests, new service offerings, cost factors and financial performance of the applicable reporting unit. If the carrying amount of indefinite-lived intangible assets exceeds the fair value, an impairment loss is recognized equal to the excess. The process of estimating the fair value of indefinite-lived intangible assets is subjective and requires the use of estimates. Such estimates include, but are not limited to, future operating performance and cash flows, royalty rate, terminal growth rate, and discount rate. Based on our analysis performed, we recorded an impairment charge of $6.7 million and $4.1 million for the years ended December 31, 2015 and 2014 related to our indefinite-lived intangible assets. There were no impairment charges related to our indefinite-lived intangible assets for the year ended December 31, 2013.
These non-cash impairment charges do not impact our liquidity, compliance with any covenants under our debt agreements or potential future results of operations. Our historical operating results may not be indicative of our future operating results. See Note 5 and 6 to our consolidated financial statements included elsewhere in this prospectus for additional information related to our goodwill and indefinite-lived intangible assets.
Long-lived Assets
We review our long-lived assets, including finite-lived intangible assets, property and equipment, for impairment whenever events or circumstances indicate that the carrying value of an asset may not be recoverable. Events or circumstances that would result in an impairment review primarily include operations reporting sustained losses or a significant change in the use of an asset. Determination of recoverability is based on an estimate of undiscounted future cash flows resulting from the use of the asset and its eventual disposition. Should we determine that the carrying values of held-for-use long-lived assets may not be recoverable, we will measure any impairment based on a projected discounted cash flow method. We may also estimate fair value based on market prices for similar assets, as appropriate. Significant judgments are required to estimate future cash flows, including the selection of appropriate discount rates, projected cash flows from the use of an asset and other assumptions. Changes in these estimates and assumptions could materially affect the determination of fair value for these assets.
As noted above, economic and market conditions that affected our reporting units required us to test for impairment of long-lived assets pertaining to those businesses during the years ended December 31, 2015, 2014 and 2013. We recorded an impairment charge of $28.5 million, $4.1 million and $2.0 million related to the carrying value of our finite-lived intangible and long-lived assets for the years ended December 31, 2015, 2014 and 2013, respectively. See Note 6 to our consolidated financial statements included elsewhere in this prospectus for additional information related to our finite-lived intangible assets.
Income Taxes
Deferred tax assets and liabilities are determined based on the difference between the financial reporting and the tax bases of assets and liabilities and are measured using the tax rates and laws that are expected to apply to taxable income in the years in which those temporary differences are expected to be recovered or settled. A valuation allowance is established, when necessary, to reduce deferred income tax assets to the amount that is
80
Table of Contents
more likely than not to be realized. Realization is dependent on generating sufficient taxable income to recover the deferred tax assets, including income generation prior to the expiration of any loss or tax credit carry forwards. The deferred tax assets may be reduced if estimates of future taxable income during the carry forward period decrease. We recorded a full valuation allowance against the domestic net deferred tax assets as it was deemed more likely than not that we will not realize the benefits of these domestic deferred tax assets based on our recent operating results and current projections of future losses. As of December 31, 2015 and 2014, we had a valuation allowance of $406.5 million and $375.6 million, respectively.
Income tax benefits are recognized if we believe that if a dispute arose with the taxing authority and were taken to a court of last resort, it is more likely than not (i.e., a probability greater than 50 percent) that the tax position would be sustained as filed based on the technical merits of a tax position. If a position is determined to be more likely than not of being sustained, we recognize the largest amount of tax benefit that is greater than 50 percent likely of being realized upon ultimate settlement with the taxing authority. In addition, we maintain reserves for uncertain tax positions, which are included in non-current income tax liability in our consolidated balance sheets. We periodically review these reserves to determine if adjustments to these balances are necessary. We record interest and penalties related to unrecognized tax benefits in income tax expense.
Share-based Compensation Expense
In accordance with the Financial Accounting Standards Board’s (“FASB”) Accounting Standards Codification Topic 718, Stock Compensation, we measure compensation cost for share-based payment awards granted to employees and non-employee directors at fair value using the Black Scholes option pricing model for performance and service condition awards and the Monte Carlo model for awards with market conditions. Share-based compensation expense includes share-based awards granted to employees and non-employee directors and has been reported in cost of service and SG&A expenses in our consolidated statements of income based upon the classification of the individuals who were granted share-based awards. Share-based compensation expense (credit) was $4.3 million, $0.6 million and $(1.8) million for the years ended December 31, 2015, 2014 and 2013, respectively.
The Black Scholes option pricing model requires the use of subjective assumptions, including share price volatility, the expected life of the award, risk-free interest rate and the fair value of the underlying shares of common stock on the date of grant. In developing our assumptions, we take into account the following:
| • | as a result of our status as a private company prior to this offering, we calculate expected volatility based on reported data for selected reasonably similar publicly traded companies for which historical information is available; |
| • | we determine the risk-free interest rate by reference to implied yields available from United States Treasury securities with a remaining term equal to the expected life assumed at the date of grant; |
| • | the assumed dividend yield is based on our historical dividends paid; |
| • | we estimate the average expected life of the award based on projected employee stock option exercise behaviors; and |
| • | we estimate forfeitures based on our historical analysis of actual forfeitures. |
81
Table of Contents
The assumptions used in the Black Scholes option pricing model are set forth below:
| Years Ended December 31, | ||||||||||||
| 2015 | 2014 | 2013 | ||||||||||
| Expected volatility |
56.1 | % | 63.0 | % | 62.0 | % | ||||||
| Expected dividends |
— | — | — | |||||||||
| Expected life (in years) |
6.5 | 6.0 | 6.0 | |||||||||
| Risk free interest rate |
2.0 | % | 1.7 | % | 1.6 | % | ||||||
|
|
|
|
|
|
|
|||||||
| Weighted average grant date fair value |
$ | 53.19 | $ | 48.75 | $ | 47.91 | ||||||
The estimated fair value of the underlying shares of common stock on the grant date takes into consideration various objective and subjective factors, including valuations of our common stock. Due to the absence of an active market for our common stock, the fair value of our common stock for purposes of determining the exercise price for award grants was based on a number of objective and subjective factors including:
| • | contemporaneous third party valuations of our common stock; |
| • | the shares of common stock underlying the award involved illiquid securities in a private company; |
| • | our results of operations and financial position; |
| • | the composition of, and changes to, our management team; |
| • | the material risks related to our business; |
| • | our business strategy; |
| • | the market performance of publicly traded companies in the life sciences and biopharmaceutical sectors, and recently completed mergers and acquisitions of companies comparable to us; |
| • | the likelihood of achieving a liquidity event for the holders of our common stock and options such as an initial public offering given prevailing market conditions; and |
| • | external market conditions affecting the life sciences and biopharmaceutical industry sectors. |
In establishing the exercise price, in addition to the objective and subjective factors discussed above, we also considered the most recent available valuation of our common stock. For each award grant, a contemporaneous valuation (within the meaning of such term under the American Institute of Certified Public Accountants Practice Aid, Valuation of Privately-Held-Company Equity Securities Issued as Compensation) was performed. At each grant date, we considered whether any events or circumstances occurred between the date of the valuation and the date of the grant that would indicate a significant change in the fair value of our common stock during that period. No change in value resulted from this analysis for any of the grants.
For the valuations performed, two commonly accepted valuation approaches were applied to estimate our enterprise value: the discounted cash flow method (“DCF Method”) and the market approach. The DCF Method focused on our unlevered income-producing capability by incorporating our specific operating characteristics in a prospective analysis. The market approach compares us to selected reasonably similar publicly traded companies. Under this method, valuation multiples are (1) derived from the operating data of selected guideline companies, (2) evaluated and adjusted based on our strengths and weaknesses relative to the selected guideline companies and (3) applied to our operating data to arrive at an indication of value. In order to establish the fair value of our common equity value, company-specific adjustments were made to enterprise value, including applying a discount for lack of marketability.
Once a fair value was established under both the DCF Method and the market approach, the resulting fair value was derived using a weighted average with greater consideration given to the DCF Method due to its ability to capture our specific growth and margin characteristics. The resulting fair value was then divided by the then-outstanding number of shares of common stock on a fully-diluted basis to arrive at the fair value per share of our common stock.
82
Table of Contents
On March 25, 2016, we approved the grant of 106,207 option awards at an exercise price per share of $206.23, which represents the per share estimated fair value of common stock on the date of grant. Thirty-five percent of the options vest upon the passage of time and completion of a service requirement and sixty-five percent vests based upon achievement of certain specified performance targets and completion of a service requirement. We will recognize the fair value of the option awards in compensation expense over the service period to the extent that vesting of the awards is considered probable.
Quantitative and Qualitative Disclosures About Market Risk
We are exposed to market risk from changes in interest rates and foreign currency exchange rates.
Interest Rate Exposure
We will incur variable interest expense with respect to our Senior Secured Credit Facilities and any outstanding borrowings under our ABL Facility and International Facility. Based on our variable rate debt outstanding at December 31, 2015, a hypothetical increase or decrease of 10% of current market rates would not have an effect on our interest expense since market rates are well below the minimum floating rate (i.e. a floor of 1.5% for Eurodollar rate loans) that is used to calculate the interest we are required to pay pursuant to our Senior Secured Credit Facilities and there are no outstanding borrowings under our ABL Facility or our International Facility.
Foreign Currency Exchange Rate Exposure
Our international expansion has resulted in increased foreign exchange rate exposure and we may become more susceptible to foreign currency exchange rate exposure as we continue to expand our international operations. We may enter into forward exchange contracts to mitigate this variability.
The financial statements of our subsidiaries expressed in foreign currencies are translated from the respective functional currencies to U.S. Dollars, with results of operations and cash flows translated at average exchange rates during the period, and assets and liabilities translated at end of the period exchange rates. At December 31, 2015, the accumulated other comprehensive loss related to foreign currency translations was approximately $37.6 million.
We have net revenues denominated in currencies other than the U.S. Dollar. Our financial statements are reported in U.S. Dollars and, accordingly, fluctuations in exchange rates will affect the translation of our revenues and expenses denominated in foreign currencies into U.S. Dollars for purposes of reporting our consolidated financial results. In 2015 and 2014, the most significant currency exchange rate exposures were the Pound Sterling, Canadian Dollar and Japanese Yen. Excluding the impacts from any potential future hedging transactions, a hypothetical change of 10% in average exchange rates used to translate all foreign currencies to U.S. Dollars would have impacted income (loss) before income tax provision (benefit) for the year ended December 31, 2015 by approximately $1.1 million.
We are subject to foreign currency transaction risk for fluctuations in exchange rates during the period of time between the consummation and cash settlement of a transaction. We earn revenues from our contracts over a period of several months and, in some cases, over a period of several years. Accordingly, exchange rate fluctuations during this period may affect our profitability with respect to such contracts. We limit our foreign currency transaction risk through exchange rate fluctuation provisions stated in our contracts with clients, or we may hedge our transaction risk with foreign currency exchange contracts. Historically we have not used derivative financial instruments or other financial instruments to hedge such economic exposures.
We do not have significant operations in countries in which the economy is considered to be highly-inflationary.
83
Table of Contents
Recent Accounting Pronouncements
In February 2016, the FASB issued Accounting Standards Update 2016-02 (“ASU 2016-02”), Leases (Topic 842) to increase transparency and comparability among organizations by recognizing lease assets and liabilities on the balance sheet and disclosing key information about leasing arrangements. ASU 2016-02 requires that operating leases recognize a right-of-use asset and a lease liability measured at the present value of the lease payments in the statement of financial position, recognize a single lease cost allocated over the lease term on a generally straight-line basis, and classify all cash payments within operating activities in the statement of cash flows. ASU 2016-02 requires that capital leases, now called finance leases, recognize a right-of-use asset and a lease liability measured at the present value of the lease payments in the statement of financial position, recognize interest on the lease liability separately from amortization of the right-of-use asset in the statement of comprehensive income, and classify repayments of the principal portion of the lease liability within financing activities and payments of interest on the lease liability and variable lease payments within operating activities in the statement of cash flows. Initial costs directly attributable to negotiating and arranging the lease will be included in the asset. For leases with a term of 12 months or less, a lessee can make an accounting policy election by class of underlying asset to not recognize an asset and corresponding liability. Lessees will also be required to provide additional qualitative and quantitative disclosures regarding the amount, timing and uncertainty of cash flows arising from leases. ASU 2016-2 also provides specific guidance for sale and leaseback transactions, build-to-suit leases and amounts previously recognized in accordance with the business combinations guidance for leases. ASU 2016-02 will be applied on a modified retrospective basis and to each prior reporting period presented and is effective for interim and annual reporting periods beginning after December 15, 2018. Early adoption is permitted. We are currently evaluating the impact of adopting ASU 2016-2 on our consolidated financial position, results of operations and cash flows.
In November 2015, the FASB issued ASU 2015-17, Income Taxes: Balance Sheet Classification of Deferred Taxes (Topic 740) (“ASU 2015-17”), to simplify the balance sheet classification of deferred income taxes. ASU 2015-17 requires that deferred tax liabilities and assets be classified as noncurrent in a classified statement of financial position. ASU 2015-17 may be applied either retrospectively to each period presented or on a prospective basis and is effective for interim and annual periods beginning after December 15, 2016. Early adoption is permitted. We early adopted ASU 2015-17 effective December 31, 2015 on a prospective basis. Adoption of this guidance resulted in a reclassification of our current deferred tax assets to the non-current deferred tax assets in our consolidated balance sheet as of December 31, 2015. The deferred tax assets and liabilities of the prior periods were not retrospectively adjusted. The impact of this guidance on our consolidated balance sheet was not material.
In April 2015, the FASB issued ASU 2015-03, Interest-Imputation of Interest: Simplifying the Presentation of Debt Issuance Costs (“ASU 2015-03”). ASU 2015-03 requires that debt issuance costs be presented in the balance sheet as a deduction from the carrying amount of the related debt and not as a deferred charge presented in other assets on our consolidated balance sheets. The recognition and measurement guidance for debt issuance costs are not affected by the new amendment. ASU 2015-03 will be applied on a retrospective basis and to each prior reporting period presented and is effective for interim and annual reporting periods beginning after December 15, 2015. Early adoption is permitted. In August 2015, the FASB issued ASU 2015-15 to amend the presentation and subsequent measurement of debt issuance costs associated with line-of-credit arrangements. ASU 2015-15 permits presenting debt issuance costs for a line-of-credit as an asset and subsequently amortizing the deferred debt issuance costs ratably over the term of the line-of-credit arrangement, regardless of whether there are any outstanding borrowings on the line-of-credit arrangement. We adopted this guidance early, as of December 31, 2015, resulting in a reclassification of deferred financing costs to reduce the carrying amount of the debt by $35.4 million and $49.4 million as of December 31, 2015 and 2014, respectively. Deferred financing costs totaling $3.6 million and $4.3 million as of December 31, 2015 and 2014, respectively, relate to line-of-credit costs and are included in other assets in the consolidated balance sheets.
In May 2014, the FASB issued ASU 2014-09, Revenue from Contracts with Customers (Topic 606), which provides guidance for revenue recognition (“ASU 2014-09”). ASU 2014-09 will supersede the revenue
84
Table of Contents
recognition requirements in Revenue Recognition (Topic 605), and most industry-specific guidance. In July 2015, the FASB deferred the effective date of the new revenue recognition standard by one year, and it is effective for interim and annual periods beginning after December 15, 2017. Early adoption is permitted, but no earlier than the original effective date of January 1, 2017. We are currently evaluating the impact of adopting ASU 2014-09 on our consolidated financial position and results of operations.
In April 2014, the FASB issued ASU 2014-08, Reporting Discontinued Operations and Disclosures of Disposals of Components of an Entity (“ASU 2014-08”). ASU 2014-08 changes the criteria for reporting a discontinued operation. Under ASU 2014-08, a disposal of a part of an organization that has (or will have) a major effect on its operations and financial results is a discontinued operation. ASU 2014-08 applies prospectively for all disposals or components of our business classified as held for sale during fiscal periods beginning after December 15, 2014. The adoption of ASU 2014-08 did not have a material impact on our consolidated financial position or results of operations, although the impact will depend on the extent of any future discontinued operations.
Additional Segment Data
The following table sets forth a reconciliation of income (loss) from continuing operations, the most directly comparable GAAP measure, to EBITDA and from EBITDA to Adjusted EBITDA for the Company and each of our segments for each of the periods indicated as follows:
| Year Ended December 31, 2015 | ||||||||||||||||
| (in millions) | Clinical | Commercial | Corporate and other |
Consolidated | ||||||||||||
| Income (loss) from continuing operations |
$ | (150.6 | ) | |||||||||||||
| Income tax provision (benefit) |
5.6 | |||||||||||||||
| Interest expense, net |
228.2 | |||||||||||||||
| Equity investment income |
1.2 | |||||||||||||||
| Other income |
(11.3 | ) | ||||||||||||||
|
|
|
|||||||||||||||
| Operating income (loss) |
$ | 89.4 | $ | 41.2 | $ | (57.5 | ) | $ | 73.1 | |||||||
| Depreciation and amortization |
39.5 | 48.4 | 7.3 | 95.2 | ||||||||||||
|
|
|
|
|
|
|
|
|
|||||||||
| EBITDA |
128.9 | 89.6 | (50.2 | ) | 168.3 | |||||||||||
|
|
|
|
|
|
|
|
|
|||||||||
| Impairment loss(a) |
— | 69.2 | — | 69.2 | ||||||||||||
| Stock-based compensation(b) |
1.9 | 1.1 | 1.3 | 4.3 | ||||||||||||
| Impact of acquisition accounting adjustments(c) |
1.0 | 0.8 | — | 1.8 | ||||||||||||
| Management fees(d) |
— | — | 2.7 | 2.7 | ||||||||||||
| Foreign currency transaction (gains) losses(e) |
(2.4 | ) | 3.5 | (0.6 | ) | 0.5 | ||||||||||
| Impact of unrestricted subsidiaries, net of addback(f) |
(0.7 | ) | 3.7 | — | 3.0 | |||||||||||
| Acquisition and financing expense(g) |
— | 0.1 | 1.3 | 1.4 | ||||||||||||
| Severance(h) |
4.3 | 5.6 | 0.9 | 10.8 | ||||||||||||
| Restructuring costs(i) |
5.3 | 2.2 | 1.9 | 9.4 | ||||||||||||
| Other(j) |
1.0 | 0.2 | 3.3 | 4.5 | ||||||||||||
|
|
|
|
|
|
|
|
|
|||||||||
| Adjusted EBITDA |
$ | 139.3 | $ | 176.0 | $ | (39.4 | ) | $ | 275.9 | |||||||
|
|
|
|
|
|
|
|
|
|||||||||
85
Table of Contents
| Year Ended December 31, 2014 | ||||||||||||||||
| (in millions) | Clinical | Commercial | Corporate and other |
Consolidated | ||||||||||||
| Income (loss) from continuing operations |
$ | (180.6 | ) | |||||||||||||
| Income tax provision (benefit) |
2.5 | |||||||||||||||
| Interest expense, net |
217.0 | |||||||||||||||
| Loss on extinguishment of debt and refinancing costs |
10.1 | |||||||||||||||
| Equity investment income |
0.4 | |||||||||||||||
| Other income |
— | |||||||||||||||
|
|
|
|||||||||||||||
| Operating income (loss) |
$ | 33.1 | $ | 56.9 | $ | (40.6 | ) | $ | 49.4 | |||||||
| Depreciation and amortization |
54.8 | 45.0 | 7.5 | 107.3 | ||||||||||||
|
|
|
|
|
|
|
|
|
|||||||||
| EBITDA |
87.9 | 101.9 | (33.1 | ) | 156.7 | |||||||||||
|
|
|
|
|
|
|
|
|
|||||||||
| Impairment loss(a) |
0.9 | 23.1 | — | 24.0 | ||||||||||||
| Stock-based compensation(b) |
0.1 | (0.1 | ) | 0.6 | 0.6 | |||||||||||
| Impact of acquisition accounting adjustments(c) |
(0.5 | ) | (3.8 | ) | — | (4.3 | ) | |||||||||
| Management fees(d) |
— | — | 2.5 | 2.5 | ||||||||||||
| Foreign currency transaction (gains) losses(e) |
(1.6 | ) | 2.3 | (0.3 | ) | 0.4 | ||||||||||
| Impact of unrestricted subsidiaries, net of addback(f) |
— | 4.6 | — | 4.6 | ||||||||||||
| Acquisition and financing expense(g) |
— | — | 0.3 | 0.3 | ||||||||||||
| Severance(h) |
5.2 | 7.7 | 0.9 | 13.8 | ||||||||||||
| Restructuring costs(i) |
5.3 | 3.3 | 0.9 | 9.5 | ||||||||||||
| Other(j) |
2.3 | (3.5 | ) | (0.9 | ) | (2.1 | ) | |||||||||
|
|
|
|
|
|
|
|
|
|||||||||
| Adjusted EBITDA |
$ | 99.6 | $ | 135.5 | $ | (29.1 | ) | $ | 206.0 | |||||||
|
|
|
|
|
|
|
|
|
|||||||||
| Year Ended December 31, 2013 | ||||||||||||||||
| (in millions) | Clinical | Commercial | Corporate and other |
Consolidated | ||||||||||||
| Income (loss) from continuing operations |
$ | (216.2 | ) | |||||||||||||
| Income tax provision (benefit) |
3.0 | |||||||||||||||
| Interest expense, net |
209.2 | |||||||||||||||
| Loss on extinguishment of debt and refinancing costs |
0.8 | |||||||||||||||
| Equity investment income |
— | |||||||||||||||
| Other income |
— | |||||||||||||||
|
|
|
|||||||||||||||
| Operating income (loss) |
$ | 34.5 | $ | 9.4 | $ | (47.1 | ) | (3.2 | ) | |||||||
| Depreciation and amortization |
58.0 | 46.7 | 1.3 | 106.0 | ||||||||||||
|
|
|
|
|
|
|
|
|
|||||||||
| EBITDA |
92.5 | 56.1 | (45.8 | ) | 102.8 | |||||||||||
|
|
|
|
|
|
|
|
|
|||||||||
| Impairment loss(a) |
3.4 | 35.5 | — | 38.9 | ||||||||||||
| Stock-based compensation(b) |
— | 0.4 | (1.3 | ) | (0.9 | ) | ||||||||||
| Impact of acquisition accounting adjustments(c) |
(0.3 | ) | 2.4 | — | 2.1 | |||||||||||
| Management fees(d) |
— | — | 2.8 | 2.8 | ||||||||||||
| Foreign currency transaction (gains) losses(e) |
(0.1 | ) | 0.6 | (0.5 | ) | — | ||||||||||
| Impact of unrestricted subsidiaries, net of addback(f) |
— | 3.7 | — | 3.7 | ||||||||||||
| Acquisition and financing expense(g) |
1.2 | — | 0.9 | 2.1 | ||||||||||||
| Severance(h) |
2.5 | 8.9 | 0.9 | 12.3 | ||||||||||||
| Restructuring costs(i) |
6.3 | 4.0 | 0.5 | 10.8 | ||||||||||||
| Purchase price finalization(k) |
(14.2 | ) | — | — | (14.2 | ) | ||||||||||
| Other(j) |
2.1 | 7.1 | (1.3 | ) | 7.9 | |||||||||||
|
|
|
|
|
|
|
|
|
|||||||||
| Adjusted EBITDA |
$ | 93.4 | $ | 118.7 | $ | (43.8 | ) | $ | 168.3 | |||||||
|
|
|
|
|
|
|
|
|
|||||||||
| (a) | Represents non-cash losses associated with the impairment of goodwill, intangible assets and other long-lived assets. |
86
Table of Contents
| (b) | Represents non-cash compensation charges. |
| (c) | Represents non-cash adjustments resulting from the revaluation of certain items such as deferred revenue and deferred rent recognized in connection with our prior acquisitions. |
| (d) | Represents the annual sponsor management fee paid pursuant to the THL Management Agreement described in “Certain Relationships and Related Party Transactions—Management Services Agreements.” The THL Management Agreement will be terminated in connection with this offering. |
| (e) | Represents the net gain or loss resulting from currency remeasurements. |
| (f) | Represents loss from continuing operations of certain foreign subsidiaries that are treated as investments until they reach sustained profitability. |
| (g) | Represents legal and advisory fees incurred in connection with our acquisitions that do not relate to and are not indicative of our core on-going operations. |
| (h) | Represents employee termination costs. |
| (i) | Represents costs in connection with facility closures, relocations, integrations and business optimization. |
| (j) | Represents third party costs for tax services, franchise taxes and certain non-cash items and one-time costs from third party advisors and gives effect to the results of Catalina Health prior to the closing of the acquisition in the fourth quarter of 2013. |
| (k) | Represents the final purchase price adjustment recorded in the second quarter of 2013 related to the i3 Acquisition. |
87
Table of Contents
Overview
We are a leading global provider of outsourced clinical development and commercialization services to biopharmaceutical companies. We are the only provider delivering a full suite of services to enhance our clients’ ability to successfully develop, launch and market their products. We offer our services on both a standalone basis and as integrated solutions to support clinical development and commercialization. Our solutions are designed to drive greater efficiency and lower costs. We helped develop or commercialize over 80% of all new molecular entities approved by the FDA and 70% of those approved by the EMA over the last five years through our innovative model. In 2015, we served more than 550 client organizations, including all 20 of the largest global biopharmaceutical companies, and have the ability to service clients in over 90 countries.
We focus on the large and rapidly growing outsourcing component of the estimated $250 billion biopharmaceutical clinical development and commercialization market. Our services cover the entire biopharmaceutical development and commercialization continuum spanning from first-in-human clinical trials to the ongoing commercialization of mature products. Our services are designed to enhance our clients’ revenues and profitability, increase the likelihood of success of their clinical programs and commercial efforts and accelerate the execution of their projects in order to shorten the time from “lab to life.”
Our Clinical business is a leading global CRO that is therapeutically-focused and provides a wide range of capabilities, including Phase I (early stage) and Phase II–IV clinical development, delivered on a project (full service) or functional (strategic resourcing) basis. Our services are designed to accelerate our clients’ pursuit of regulatory approval. We provide our services through teams that possess operational and scientific expertise in a broad range of therapeutic areas with a particular focus in high growth areas such as oncology, neuroscience, pain and respiratory. Our Commercial business is a CCO, the biopharmaceutical industry’s only provider of a full suite of complementary commercialization services, including selling solutions, communications, consulting and medication adherence. We believe this unique CCO model provides a competitive advantage by integrating strategic, creative and operational expertise enhanced by the deep therapeutic expertise from our Clinical business to help optimize performance, reduce risk and expedite delivery of innovative products.
We have over 14,000 employees globally, including more than 750 M.D.s and Ph.D.s, and offer clients a differentiated set of solutions designed to enhance operational and financial efficiencies across the clinical development and commercialization continuum. Our Clinical and Commercial segments inform and enhance one another, and the flexibility of our model allows us to provide additional services over time as the needs of our clients evolve.
88
Table of Contents
The creation of our comprehensive and integrated approach to serve the biopharmaceutical development and commercialization continuum began in 2010 with our acquisition by our sponsor, THL. We have made substantial investments, strategic acquisitions and operational changes to expand and strengthen our clinical development and commercial service offerings, geographic presence, human capital, systems and infrastructure to better serve our clients. These strategic and operational initiatives included:
| • | Completion and integration of 10 strategic acquisitions, including three CROs, to offer a full suite of services on a global basis; |
| • | Enhancement of therapeutic area focus with particular expertise in oncology, neuroscience, pain and respiratory; |
| • | Integration and rationalization of legacy commercial acquisitions and separately-operated brands into the biopharmaceutical industry’s only CCO providing a full suite of complementary commercialization services; |
| • | Expansion of our geographic capabilities in Japan, India, Western Europe, Latin America and China; |
| • | Evolution of our selling solutions capabilities into a market-leading strategic offering with expertise in helping clients launch and market complex biopharmaceutical products; and |
| • | Recruitment of Michael A. Bell, our Chairman and CEO who has extensive experience across the healthcare delivery continuum and who has managed and grown sophisticated global service organizations. |
These initiatives have helped us create a leading biopharmaceutical outsourcing business with an unmatched ability to provide a full suite of integrated services to meet our clients’ needs. Each of our top 10 clients and 24 of our top 25 clients utilized services from both our Clinical and Commercial segments in 2015. The following financial metrics are reflective of our improved performance from 2014 to 2015:
| • | Net revenues increased 10.4% on an as-reported basis (13.0% on a constant currency basis) to $1,994.3 million. |
| • | Clinical segment net revenues increased 8.9% to $947.9 million (47.2% of total net revenues). |
| • | Commercial segment net revenues increased 12.3% to $1,059.9 million (52.8% of total net revenues). |
| • | Adjusted EBITDA increased 33.9% to $275.9 million. |
| • | Adjusted EBITDA as a percentage of net revenues increased to 13.8% from 11.4%. |
We incurred losses from continuing operations of $150.6 million and $180.6 million for the year ended December 31, 2015 and 2014, respectively. See “Summary—Summary Consolidated Financial and Operating Data” for a discussion of Adjusted EBITDA and “Management’s Discussion and Analysis of Financial Condition and Results of Operations—Exchange Rate Fluctuations” for a discussion of constant currency net revenues.
Our Competitive Strengths
We address a large and growing market and believe we are well-positioned to continue expanding our market share. Our key competitive strengths include the following:
A global leader in biopharmaceutical outsourcing with differentiated positioning. We serve more than 550 client organizations, including all 20 of the largest global biopharmaceutical companies, and have the ability to service clients in over 90 countries. Over 80% of all new molecular entities approved by the FDA and 70% of those approved by the EMA over the last five years have been developed or commercialized with our support. We believe our scale, global reach and breadth of services, coupled with our deep industry expertise and experience, enable us to offer the solutions our clients need as they navigate an increasingly complex and evolving market. We believe our clients are seeking to consolidate their outsourcing to large global providers like us to address the changing industry dynamics. The breadth of our global clinical and commercial services should position us well to capitalize on this evolving environment and penetrate both existing and new clients.
89
Table of Contents
Adding value across the biopharmaceutical product lifecycle. Our broad suite of services allows us to deliver customized solutions and provide value to biopharmaceutical companies and other key constituents across the healthcare delivery system. We leverage new and existing knowledge capital and proprietary data assets across our offerings to help biopharmaceutical clients optimize execution and reduce costs throughout the product lifecycle. The following are notable examples of these capabilities:
| • | Superior clinical trial design: We leverage our expanding clinical and commercial knowledge capital to inform and enhance clinical trial design in order to facilitate shorter and more efficient trials intended to improve the likelihood of regulatory and subsequent commercial success. |
| • | Enhanced site selection and patient recruitment: We utilize proprietary data assets, behavioral insights, social media and communications capabilities to enhance the speed and success of site selection and patient recruitment. |
| • | Proactive pre-launch reimbursement and formulary management: We bridge the gap between clinical development and commercialization by utilizing our diverse capabilities and communicating clinical benefits to payers and PBMs to help optimize reimbursement and patient access. |
| • | Highly effective commercial product launch capabilities: We help our clients navigate the complexities of launching a product by orchestrating interconnected work streams to develop and execute an effective product launch strategy. |
| • | Proprietary programs to improve medication adherence: We have the ability to reach over 175 million patients through multi-channel medication adherence programs designed to mitigate costs related to non-adherence, which are estimated by the Centers for Disease Control and Prevention to exceed $100 billion annually. |
| • | Efficient project ramp-up: We scale clinical or commercial projects rapidly and effectively through our recruiting, training, and deployment capabilities, leveraging over 150 dedicated recruiting personnel and our proprietary database of over 650,000 industry professionals. |
Diversified operating model including deepening relationships with blue-chip client base. We are diversified across our leading Clinical (47% of 2015 net revenues) and Commercial (53% of 2015 net revenues) segments. We have a large and expanding client base, extensive range of services, geographic scope and an ability to provide solutions at nearly every stage of the product lifecycle. We have a loyal client base of over 550 client organizations, including all 20 of the largest global biopharmaceutical companies as well as a significant number of high-growth, small and mid-sized biopharmaceutical companies. Our top five clients accounted for approximately 37% of net revenues in the year ended December 31, 2015, with our largest client accounting for approximately 10% of our net revenues. All of our top 25 clients are diversified across multiple projects, compounds or service offerings. We have strong and growing relationships with our top clients. All of our top 20 clients have been clients since 2010 and many of these clients had long-standing relationships with the companies we have acquired.
Deep and aligned therapeutic expertise. We provide our clients highly-differentiated, specialized teams in both our Clinical and Commercial segments, with operational and scientific expertise in a range of therapeutic areas such as oncology, neuroscience, pain and respiratory. These core, high-growth therapeutic areas constituted 66% of our Clinical segment backlog as of December 31, 2015. We have strategically organized our business around therapeutic area expertise and serve some of the fastest growing areas in the market. Our deep understanding of these therapeutic areas extends throughout our business, allowing our clients to benefit from this knowledge base throughout our full suite of services. We believe our specialized therapeutic expertise in our Commercial segment is unique in our industry and becoming increasingly important to our clients as therapies become more complex and targeted. Our experienced medical and scientific professionals, including more than 750 M.D.s and Ph.D.s, apply innovative insights and science to clinical trials as well as to the commercialization of products.
90
Table of Contents
Attractive financial profile with strong organic growth and operating leverage. We have achieved robust operating and financial performance over the past few years while increasing the scale and breadth of our service offerings. For the year ended December 31, 2015, our net revenues and Adjusted EBITDA grew 10% and 34%, respectively, all of which has been organic. Over the same period, we grew our market share in both Clinical and Commercial segments, as evidenced by growth in net revenues of 9% and 12%, respectively. The momentum in our Clinical segment is further reflected in the 11% growth in our Clinical backlog from December 31, 2014 to December 31, 2015 and 12% growth in net new business awards during the year ended December 31, 2015. Adjusted EBITDA as a percentage of net revenues increased to 13.8% from 11.4%. This margin expansion has been aided by a series of strategic investments and initiatives intended to both build out and rationalize our infrastructure. Examples of these include: (i) shifting selected support services to lower-cost geographies, (ii) centralizing administrative functions and (iii) optimizing our technology spend. We believe our outstanding financial profile and strong operating momentum position us for continued market share gains across both of our segments.
Highly experienced and committed management team. We are led by a dedicated executive management team, averaging 29 years of relevant experience, with extensive experience with biopharmaceutical companies, payers and health systems. Our team has been responsible for executing on our strategy, growing our client base and driving our significant growth in net revenues and Adjusted EBITDA over the past three years. This management team contributes to a company-wide culture of collaboration focused on delivering services and solutions that meet or exceed the quality standards demanded by clients, physicians, patients and regulatory authorities.
Growth Strategy
Our goal is to generate profitable revenue growth in both of our segments and to increase margins through operational efficiency initiatives. The key elements of our growth strategy include:
Leverage our market leadership position in large and attractive markets. Our Clinical and Commercial segments are benefiting from specific industry trends that are expected to drive attractive growth through 2020. We estimate that the amount of outsourced clinical services will experience a CAGR in the high single digits from 2015 through 2020. As business models continue to evolve in the healthcare sector, we believe that the rate of commercial outsourcing could follow a similar path to the clinical development market. Global demand for biopharmaceutical products continues to increase, driven by expanding access to care, increasing life expectancy and the growing prevalence of chronic conditions in both developed and emerging markets. Higher costs and increased complexity are driving our clients to seek efficiency and expertise through outsourcing services. We intend to capitalize on these trends by continuing to provide the services our clients need.
Increase market share through our unmatched service offering and scale. We believe we are uniquely positioned to meet our clients’ evolving needs as the only provider of a full suite of services through the clinical development and commercialization continuum. Our size and scale enable us to provide solutions designed to accelerate our clients’ clinical or commercial projects effectively, thereby driving speed and cost efficiencies. Our ability to engage clients at the early phases of clinical trials with respect to commercial insights allows them to make more informed decisions on clinical trial design and strategies, a key differentiator from our competitors. We intend to leverage our differentiated service offerings to increase our share of the growing market for outsourced clinical and commercialization services.
Drive acceleration of commercial outsourcing. There is increasing demand for the outsourcing of many aspects of commercialization that have been traditionally handled internally by biopharmaceutical companies. Specialized knowledge and expertise, along with efficient cost and productivity management, are increasingly required for the successful launch and commercialization of new complex products. We have continuously expanded and invested in our commercial outsourcing capabilities and we intend to leverage our extensive knowledge, experience and unmatched offerings to drive expansion of the commercial outsourcing opportunity with new and existing clients.
91
Table of Contents
Increase profitability by leveraging our scalable infrastructure. We have focused on creating an organization built for operational flexibility to efficiently provide services to address our clients’ needs. As we succeed in winning new business, we believe our significant degree of operating leverage will allow us to drive incremental margin expansion. Over the last few years, we have streamlined our organizational structure and made progress to optimize the efficiency of our operations. We have centralized and outsourced administrative functions and integrated and rationalized our technology systems to better serve our clients and improve our efficiency. We intend to leverage our improvements and continue to execute on internal efficiency initiatives to increase profitability.
Increase cross-selling with existing clients. We believe that we have substantial opportunities to expand the reach of our services that we provide to our existing clients. As only 53 of our top 100 clients utilized services from our Clinical and Commercial segments in 2015, we believe there is significant potential to sell additional services to our existing client base. In addition, a number of our largest clients that use both clinical and commercial services do not use each of them to the same extent and we are targeting these clients to expand the use of our services within the less utilized segment. Given our past success in expanding the scope of services provided to current clients, we intend to further expand our business with our existing clients by cross-selling additional clinical and commercial services. For example, for the year ended December 31, 2015, each of our top 10 clients in each segment utilized, on average, approximately 40% fewer services (as measured by net revenues) from the other segment. As part of our cross-selling efforts, we market the potential operational and economic efficiencies that clients can achieve by using more of our services throughout the product lifecycle.
Capitalize on client and geographic growth opportunities. We intend to target segments of the biopharmaceutical market in which we are underpenetrated. Specifically, we plan to actively seek to expand our market share among small and mid-sized biopharmaceutical companies, as they frequently lack the robust infrastructures and service capabilities of larger clients. Additionally, we have developed a global platform with a presence in all of the major biopharmaceutical markets in the world with the ability to service clients in over 90 countries and we intend to further expand our business outside of the United States. We are focused on replicating our success in the U.S. market to other major biopharmaceutical markets around the world. We have demonstrated our capabilities for geographic expansion in Japan, the world’s second largest biopharmaceutical market, where we grew from less than 10 employees at the beginning of 2009 to approximately 700 employees at the end of 2015. In Western Europe, we principally see the opportunity to expand our commercial services with our existing clients in North America. We may also selectively identify and acquire complementary businesses to enhance our services, capabilities and geographic presence.
Our Segments and Key Service Offerings
We provide services through two reportable segments: Clinical and Commercial. Each reportable segment provides multiple service offerings that, when combined, create a fully integrated biopharmaceutical outsourced services provider. Our Clinical segment provides a continuum of services spanning Phases I-IV of clinical development, while our Commercial segment provides selling solutions, communications, consulting, and medication adherence services.
Clinical Segment
Our Clinical segment is a leading global CRO that is therapeutically-focused and provides a wide range of capabilities, including Phase I-IV clinical development services, delivered on a project or functional basis. We believe our capabilities and the breadth of our service offerings allow us to address our clients’ wide range of clinical development needs, from small, Phase I studies to complex, multinational, late-stage trials, and position us for strategic partnerships with top-tier biopharmaceutical clients. We provide our services through teams that possess operational and scientific expertise in a broad range of therapeutic areas with particular focus in high growth areas such as oncology, neuroscience, pain and respiratory. For the year ended December 31, 2015, our Clinical segment generated net revenues of $947.9 million.
92
Table of Contents
Early Stage
Our early stage offering provides a full range of services for Phase I and Phase IIa clinical trials as well as bioanalytical analysis. We conduct studies at our two facilities located in Quebec, Canada and Miami, FL. We also perform bioanalytical analysis at our two laboratories located in Quebec, Canada and Princeton, NJ. We have extensive experience in first-in-human, proof-of concept and bioavailability studies, and have built direct relationships with leading hospitals. We have a large base of available subjects, including patient populations with specific medical conditions and healthy volunteers, which provides efficient and rapid patient recruitment.
Full Service and Strategic Resourcing
Our full service and strategic resourcing offerings provide comprehensive solutions to address the clinical development needs of our clients, primarily in Phase II-IV. Our solutions can be delivered on a project-basis or on a functional or resource basis. We are able to customize our services to provide clients support within an individual clinical study, a single function, multiple functions within a single therapeutic area or across a client’s entire product portfolio. We can leverage our extensive knowledge capital across our business to inform clinical development strategy and design. Our full range of services include: (i) clinical trial design and feasibility; (ii) project management; (iii) investigator recruitment and site management; (iv) clinical monitoring; (v) safety and pharmacovigilance; (vi) biostatistics and statistical programming; (vii) data management; (viii) medical writing and (ix) medical and scientific affairs.
| • | Clinical Trial Design and Feasibility. Limiting the required time and controlling cost are key priorities in designing a clinical trial. Our capabilities help identify strategies to mitigate execution risks and costs associated with clinical trials. Specifically, we assist clients in validating whether a protocol has been designed to meet global regulatory requirements, identifying the most suitable sites and/or countries in which to conduct the trial, and identifying any potential impacts from competitive trials, patient access and retention and local regulatory timelines. |
| • | Project Management. Our project managers help oversee the clinical development process. They assist our clients in setting and managing the development process to meet specific operational and financial targets, and help ensure that projects track against plan. They are typically responsible for accessing and managing resources across multiple clinical operations disciplines. |
| • | Investigator Recruitment & Site Management. Identification and enrollment of investigators and resulting access to their patient populations is a critical element of a clinical trial. We leverage our proprietary data assets and relationships to help identify and onboard optimal sites to conduct clinical trials. We help our clients select qualified investigators, train investigators and site staff on the clinical protocol and required technology tools, implement participant retention programs and communicate with sites regarding performance issues or contractual matters. |
| • | Clinical Monitoring. We provide trial monitoring services to our clients that include study procedures development, source document review, patient eligibility confirmation, patient compliance tracking, clinical trial supply management, adverse event reporting, regulatory compliance monitoring and regulatory documentation maintenance. In addition to traditional on-site and remote monitoring, we leverage monitoring strategies that are focused on the potential risks that would affect the reliability of study data. For example, we also offer targeted on-site monitoring, centralized remote monitoring, risk-based monitoring and real-time review of clinical data using statistical analysis. |
| • | Safety and Pharmacovigilance. Our safety and pharmacovigilance team supports clinical trial safety surveillance. We offer stand-alone and integrated solutions to support product safety monitoring in compliance with regulatory requirements in both pre- and post-approval studies. Our team has expertise in drug safety, pharmacovigilance and pharmacoepidemiology, and a deep understanding of the changing regulatory environment. To manage clinical trial safety, we provide our clients with qualified medical analysis and review of serious adverse events, and assist them in creating materials for submission to United States and international regulatory authorities and data safety monitoring boards. |
93
Table of Contents
| • | Biostatistics and Statistical Programming. We provide statistical analyses of clinical trial results and other scientific databases. Our biostatistics and statistical programming team has experience across all aspects of clinical trials, from the initial stage of planning the design and calculating sample size requirements, to analyzing, displaying and interpreting data in the final stages of the study. Our team consists of Ph.D. and M.S.-level statisticians and statistical programmers who help to plan the analyses before a study begins, and then provide reports, statistical summaries and efficacy and safety analyses as the study progresses. We leverage a combination of standard templates and customizable programs to help our clients accelerate their regulatory submissions and improve the accuracy of their study results. |
| • | Data Management. We offer a study-specific approach to data management that begins with a review of the study specifications, client preferences/history, data to be collected, and technologies available. We provide guidance to clients on the most appropriate method for data collection to address the needs of their trial sites and project teams. Our scalable and software-agnostic processes enable us to efficiently capture, maintain, clean and deliver data for a client’s project regardless of phase, therapeutic area, size, or method of data capture. We have expertise with a variety of software applications and can assist our clients in choosing a solution to meet their particular needs. |
| • | Medical Writing. We offer our clients regulatory writing assistance, including protocol and protocol amendments, clinical study reports, subject narratives and investigator brochures, as well as assistance with scientific manuscripts, abstracts, and posters. Our medical writing team includes writers, editors, and writing management staff with expertise in areas such as preparation of regulatory submissions and safety-related documents. |
| • | Medical and Scientific Affairs. We offer medical and scientific affairs services that include clinical development planning, product safety analysis, regulatory submission support and product specific training on a global basis. Our medical and scientific affairs team is staffed with highly qualified staff including M.D.s and Ph.D.s. |
Commercial Segment
Our Commercial segment is a CCO, the biopharmaceutical industry’s only provider of a full suite of complementary commercialization services, including selling solutions, communications, consulting and medication adherence. For the year ended December 31, 2015, our Commercial segment generated net revenues of $1,059.9 million.
Selling Solutions
Our selling solutions offering designs and executes comprehensive sales solutions to help our clients launch and promote their products. We develop tailored and multichannel programs designed to ensure our clients’ product information and message reaches the key healthcare providers that our clients are targeting. Our programs combine face-to-face communications with on-demand and digital promotions accessible from mobile devices, tablets and web portals. We design and implement non-personal promotion programs encompassing direct mail, emails, tele-detailing and web conferencing to complement our programs. We begin with robust market and data analysis leveraging both proprietary and third-party data related to patients, physicians and prescriptions. We then aim to refine our targeting strategies for physicians, nurses, pharmacists and other key constituents to maximize impact and return on investment for our clients. Following strategy design, we utilize our team of recruiters and trainers to locate, recruit, onboard and train the talent best suited to implement the strategy and maximize our clients’ objectives, including field-based selling specialists, nurses, medical science liaisons, national account managers and M.D.s. We then deploy and project manage our solutions, and provide our clients with data analytics, reporting and other ancillary services. The flexibility of our model allows us to modify our commercialization approach based on real time market conditions and evolve that approach over the lifecycle of the product.
94
Table of Contents
Communications
We are one of the world’s premier healthcare communications companies. Our global offering specializes in healthcare advertising, medical communications and education, digital marketing, communications planning, public relations and branding services. We believe our focus and deep expertise in healthcare and the significant medical and scientific knowledge we possess throughout our business allows us to provide more impactful solutions to our clients. We create customized communications programs for clients that can span from individual campaign-based activity, to comprehensive communications support of a particular biopharmaceutical product, to support of the entire portfolio of products of a client within a therapeutic area. We have the ability to deploy communications services throughout a product’s lifecycle, beginning well before commercial launch, encompassing regulatory approval and market introduction, and continuing throughout the life of the product.
Consulting
We offer strategy and management consulting services based on our life science expertise and advanced analytics. Our consulting offering aims to support critical decision-making throughout the lifecycle of a product. We provide a wide range of consulting services to our clients that address the following areas:
| • | Commercial Strategy and Planning. We assist our clients in preparing for and launching their products as well as portfolio strategy, new product planning, brand planning and management and lifecycle planning. |
| • | Pricing and Market Access. We work with our clients to develop effective pricing and channel strategies that are informed by research we conduct with payer decision makers. |
| • | Medical. We provide organizational strategies for our clients’ medical affairs teams, as well as annual planning and launch readiness support and product-specific strategic planning. Additionally, our clinical support capabilities guide clients in developing, optimizing, and aligning product development processes at the local, regional and global level. |
| • | Risk and Program Management. We guide consortiums of biopharmaceutical companies responsible for managing single, shared Risk Evaluation and Mitigation Strategy (“REMS”) programs. Our team of REMS and program management experts help our clients navigate the legal, financial, policy and operational challenges of initiating and implementing these complex programs. |
Patient Outcomes (Medication Adherence)
We provide tailored, direct-to-patient medication adherence programs designed to help patients stay on their prescribed therapy. We have the ability to communicate with patients in the doctor’s office, at the point of retail sale, in their home and on their mobile devices. Our services include patient compliance, analytics, patient support programs and patient education to help clients maximize the revenue potential of their products while producing improved patient outcomes. We also provide a behavioral insights offering which brings together health psychologists, behavioral scientists, clinical specialists, consumer marketers, design experts and user experience specialists to develop and implement approaches and programs to maximize the impact of direct to patient communications.
95
Table of Contents
International Operations
We have the ability to service clients in over 90 countries. As of December 31, 2015, we maintained offices or retained employees in the following countries or territories:
| Segment |
Country or Territory | |
| Clinical |
Argentina; Australia; Austria; Belgium; Brazil; Bulgaria; Canada; Chile; China; Colombia; Costa Rica; Croatia; Czech Republic; Denmark; Finland; France; Germany; Greece; Hong Kong; Hungary; India; Ireland; Israel; Italy; Japan; South Korea; Malaysia; Mexico; Netherlands; New Zealand; Peru; Philippines; Poland; Puerto Rico; Romania; Russia; Serbia; Slovak Republic; Singapore; South Africa; Spain; Sweden; Switzerland; Taiwan; Thailand; Turkey; United Kingdom; Ukraine and Uruguay | |
| Commercial |
Austria; Belgium; Canada; China; Denmark; Finland; France; Germany; Italy; Japan; Netherlands; Poland; Spain; Switzerland and United Kingdom | |
Our international operations are generally accounted for using the functional currency of the country where the business is located, translated to U.S. Dollars in our consolidated financial statements. For financial information about our geographic areas, see Note 18 to our consolidated financial statements included elsewhere in this prospectus. For the years ended December 31, 2015, 2014 and 2013 we derived 22%, 26% and 27% of our net revenues from international operations.
Clients
We serve over 550 client organizations, including all 20 of the largest global biopharmaceutical companies, as well as numerous emerging and specialty biotechnology companies, medical device makers and diagnostics companies. For the years ended December 31, 2015, 2014 and 2013, one client accounted for approximately 10%, 10% and 12% of our net revenues, respectively, and our top ten clients accounted for approximately 54%, 48% and 46% of our net revenues, respectively. We believe our diversified client base and broad scope of projects reduce our dependence on any individual client or contract, and contribute to the stability of our financial performance, which we view as a competitive strength.
Competition
We operate in highly competitive industries. Our competitors include a variety of companies providing services to the biopharmaceutical industry, including large and smaller specialty CROs, large global communications holding companies and smaller specialized communications agencies. Each of our reportable segments faces distinct competitors within the markets they serve:
| • | Clinical: Our largest competitors include Quintiles Transnational Holdings Inc. (“Quintiles”), Pharmaceutical Product Development, Inc., ICON plc, PAREXEL International Corporation (“PAREXEL”), INC Research Holdings, Inc. and PRA Health Sciences, Inc. |
| • | Commercial: Our largest competitors in the outsourced sales market are Quintiles, Publicis Touchpoint Solutions, Inc. and UDG Healthcare PLC. Our primary competitors in the communications market are the large global communications holding companies: WPP Group plc, Omnicom Group Inc., Publicis Groupe S.A., The Interpublic Group of Companies, Inc. and Havas SA. Our consulting services’ largest competitors are IMS Consulting, a division of IMS Health Holdings, Inc., L.E.K. Consulting LLC, McKinsey & Company, Inc. and ZS Associates, Inc. |
We also compete in our addressable market with the internal operations of biopharmaceutical companies that choose to perform the clinical development and commercialization tasks we provide internally.
96
Table of Contents
Government Regulation
The biopharmaceutical industry is subject to a high degree of governmental regulation, at the federal, state and international levels, and our clients are subject to extensive government regulation. Generally, compliance with these laws and regulations is the responsibility of those clients. However, several of our businesses are themselves subject to the direct effect of government regulation. In addition, we may be liable under certain of our client contracts for the violation of government laws and regulations by our clients to the extent those violations result from, or relate to, the services we have performed for such clients. Further, many of our clients are parties to corporate integrity agreements (“CIAs”) with the federal government and our contracts with such clients may obligate us to comply with certain provisions of these CIAs. Failure to comply with such laws and regulations or such contractual obligations or significant changes in laws or regulations affecting our clients or the services we provide could result in the imposition of additional restrictions, create additional costs to us or otherwise negatively impact our business operations. See “Risk Factors—Risks Related to Our Business” and “Risk Factors—Risks Related to Our Industry.”
Regulation of Our Clinical Segment
The activities of our Clinical segment are subject to regulation by the FDA and by the regulatory agencies located in other countries where our Clinical segment operates or will conduct clinical trials, including, but not limited to, Health Canada, the Department of Health in the United Kingdom and the EMA. In providing CRO services, we may be subject to the same regulatory actions as the sponsor of the relevant clinical trial if we fail to comply with any obligation required of sponsors under regulations of the FDA or other regulatory agencies outside the United States. Under these regulations, we face a range of potential liabilities, including but not limited to liability arising from errors and omissions during a trial that impair the validity or usefulness of study data, risks associated with adverse effects resulting from the administration of products to clinical trial participants and collateral liability (for negligent selection or oversight) in regulatory actions against investigators and medical care providers. Our Clinical segment’s health care staffing services offering is also regulated in many states as well as on an international level. For example, in some states, staffing companies must be registered to establish and advertise as a healthcare agency or must qualify for an exemption from registration.
Many regulatory authorities, including the FDA and those in the EU require that study results and data submitted to such authorities be based on studies conducted in accordance with GCP. GCP represent the global industry standards for the conduct of clinical R&D studies. GCP include:
| • | complying with specific regulations governing the selection of qualified investigators and clinical research sites; |
| • | obtaining specific written commitments from the investigators; |
| • | ensuring the protection of human subjects by verifying that Institutional Review Board or independent Ethics Committee approval and patient informed consent are obtained; |
| • | instructing investigators to maintain records and reports; |
| • | verifying product or device accountability; |
| • | timely reporting and medical evaluation of adverse events; |
| • | adequate monitoring of the study for compliance with GCP requirements; and |
| • | maintaining adequate records and reports and permitting appropriate regulatory authorities access to data for their review. |
Records for clinical studies must be maintained for specified periods for inspection by the FDA and other regulatory agencies. Significant material non-compliance with GCP requirements can result in the disqualification of data collected during the clinical trial. We are also obligated to comply with regulations issued
97
Table of Contents
by national and supra-national regulators such as the FDA and the EMA. By way of example, these regulations include the FDA’s regulations on electronic records and signatures which set out requirements for data in electronic format for purposes of submissions made to the FDA, and the EMA’s Note for Guidance “Good Clinical Practice for Trials on Medicinal Products in the European Community.”
We write our standard operating procedures related to clinical studies in accordance with regulations and guidelines appropriate to the region where they will be used, thus helping to ensure compliance with GCP. Within Europe, we perform our work subject to the EMA’s Note for Guidance “Good Clinical Practice for Trials on Medicinal Products in the European Community.” All clinical trials (other than those defined as “non-interventional”) to be submitted to the EMA must meet the requirements of the International Conference on Harmonisation of good clinical practices. In addition, FDA regulations and guidelines serve as a basis for our North American standard operating procedures. Our offices in the Asia-Pacific region and in Canada have developed standard operating procedures in accordance with their local requirements and in harmony with those adopted by North American and European operations.
Regulation of Our Commercial Segment
Our selling solutions offering within our Commercial segment provides field based and non-field based selling resources to the pharmaceutical industry. Some of our field personnel may handle and distribute samples of pharmaceutical products. In the United States, the handling and distribution of prescription drug products are subject to regulation under the Prescription Drug Marketing Act and other applicable federal, state and local laws and regulations. These laws and regulations regulate the distribution of drug samples by mandating procedures for storage, hazard communication and employees’ right to know, as well as the handling, use, management, release and disposal of medical specimens and hazardous waste and radioactive materials. These laws and regulations also govern the safety and health of laboratory employees, solicitation and record-keeping requirements for drug samples and ban the purchase or sale of drug samples. Further, companies holding or distributing controlled substances are subject to regulation by the United States Drug Enforcement Agency.
Our selling solutions offering is also subject to detailed and comprehensive regulation in each geographic market in which we operate. Such regulation relates, among other things, to the distribution of drug samples, the qualifications of our personnel and the use of healthcare professionals in sales functions. The very ability of biopharmaceutical companies to use sales representatives and other personnel in its promotional and medical affairs, and other outreach work is subject to resolution in each geographic market and we are unable to offer all services in all geographies.
Our selling solutions offering’s delivery of field based selling resources subjects us to federal and state laws pertaining to healthcare fraud and abuse, which have been used to sanction entities for engaging in the off-label promotion and marketing of biopharmaceutical products. In particular, the FDA’s regulations against off-label promotion require selling resources to restrict promotion of the approved product they are detailing to the approved labeling for the product. The federal anti-kickback statute imposes both civil and criminal penalties for, among other things, offering or paying any remuneration to induce someone to refer patients to, or to purchase, lease or order (or arrange for or recommend the purchase, lease or order of) any item or service for which payment may be made by Medicare, Medicaid or other federal healthcare programs. Violations of the statute can result in numerous sanctions, including criminal fines, imprisonment and exclusion from participation in the Medicare and Medicaid programs. State anti-kickback laws are typically modeled on the federal anti-kickback statute, vary in scope and are often not clearly interpreted by courts and regulatory agencies. Many such laws apply, however, to all healthcare items or services, regardless of whether Medicare or Medicaid funds are involved. Further, the sale or distribution of biopharmaceutical products and devices is also governed by the U.S. Federal Trade Commission Act and state consumer protection laws.
Our communications offering within our Commercial segment is subject to all of the risks, including regulatory risks, that similar communications companies generally experience as well as risks that relate
98
Table of Contents
specifically to the provision of these services to the biopharmaceutical industry. Such regulatory risks may include enforcement by the FDA, Health Canada, the Department of Health in the United Kingdom, EMA and the Federal Trade Commission as well as state agencies and other foreign regulators enforcing laws relating to product advertising, false advertising, and unfair and deceptive trade practices. In addition to enforcement actions initiated by government agencies, there has been an increasing tendency in the United States among biopharmaceutical companies to resort to the courts and industry and self-regulatory bodies to challenge comparative prescription drug advertising on the grounds that the advertising is false and deceptive. Through the years, there has been a continuing expansion of specific rules, prohibitions, media restrictions, labeling disclosures and warning requirements with respect to the advertising for certain products.
Regulation of Patient Information
The confidentiality of patient-specific information and the circumstances under which such patient-specific records may be released for inclusion in our databases or used in other aspects of our business are heavily regulated. HIPAA and the regulations promulgated thereunder require the use of standard transactions, privacy and security standards and other administrative simplification provisions by covered entities, which includes many healthcare providers, health plans and healthcare clearinghouses. Additional legislation has been proposed from time to time at both the state and federal levels that may require us to implement security measures that could involve substantial expenditures or limit our ability to offer some of our products and services. Such legislation may restrict or negatively affect the portions of our consulting offering that perform market research. The uncertainty of the regulatory environment is increased by the fact that we generate and receive data from many sources. As a result, there are many ways government might attempt to regulate our use of this data. Any such restriction could have a material adverse effect on our business, results of operations and financial condition.
In addition, privacy legislation in international jurisdictions could have a limiting effect on some of our services, including, for example, the European Data Protection Directive (the “Directive”) which applies in each member state of the EU. The Directive seeks to protect the personal data of individuals and, among other things, places restrictions on the manner in which such personal data can be collected, processed and disclosed and the purposes for which such data can be used. Other countries have or are in the process of putting privacy laws into place affecting similar areas of our business. For instance, the Directive applies standards for the protection of all personal data, not just health information, in the EU and requires the EU member states to enact national laws implementing the Directive. Such legislation or regulations could materially affect our business.
Some of the services provided by our patient outcomes offering within our Commercial segment, including patient compliance and medication adherence programs, involve access to PHI and provide communications (e.g., refill reminders) with federal health care program beneficiaries and other direct consumers of health care products and services. These activities are subject to regulation under federal and state information privacy and security laws, including HIPAA and the rules promulgated thereunder by the U.S. Department of Health and Human Services, the federal anti-kickback statute and corresponding state privacy and anti-kickback laws. Although we believe that the activities of our patient outcomes offering currently comply with all applicable federal and state laws in all material respects, the interpretation of many of these laws is constantly evolving.
We could incur significant expenses or be prohibited from providing certain services if our patient outcomes’ activities are determined to be non-compliant with any applicable laws and, depending on the extent and scope of any such regulatory developments, our business, results of operations and financial condition could be materially and adversely affected.
Impact of the Affordable Care Act on our Business
The Affordable Care Act introduced an extensive set of new laws to the health care industry. Although the Affordable Care Act generally does not impact our business directly, it impacts our clients’ businesses directly and therefore, our business indirectly. While the Affordable Care Act will likely increase the number of patients
99
Table of Contents
who have insurance coverage for biopharmaceutical products, it also made changes that may adversely affect our clients’ businesses, including increasing rebates required from manufacturers whose products are covered by stated Medicaid programs, requiring discounts for products that are covered by Medicare Part D and imposing new fees on manufacturers of branded biopharmaceuticals. If biopharmaceutical companies react to these changes by spending less on clinical development and commercialization, we could have fewer business opportunities and our business could be adversely affected.
Conversely, the Affordable Care Act and similar health reform initiatives may stimulate greater demand for our services as our clients seek our expertise in managing the increasing complexity of the regulatory environment in which they operate and pricing pressures caused by these initiatives increase our clients need for the efficiencies that may be realized by utilizing our services.
Employees
As of December 31, 2015, we employed approximately 14,000 employees. Many aspects of our business are very labor intensive and the turnover rate of employees in our industry, and in corresponding segments of the biopharmaceutical industry, is generally high, particularly with respect to selling solutions employees and clinical research associates. Certain of our international employees are currently members of collective bargaining agreements or foreign works councils. We are unaware of any current efforts or plans to organize any of our U.S. employees. We believe that our relations with our employees are generally good.
Properties
As of December 31, 2015, we lease office facilities totaling approximately 2.1 million square feet, including our principal executive offices located in Burlington, Massachusetts, and our principal businesses located in New Jersey and New York. 58 facilities totaling approximately 0.9 million square feet are leased by our Clinical segment and 45 facilities totaling approximately 1.1 million square feet are leased by our Commercial segment. We believe that our facilities are adequate for our present and reasonably anticipated business requirements, and none of our leases are individually material to our business.
Legal Proceedings
From time to time, we are involved in legal proceedings, including legal proceedings that are incidental to the normal conduct of our business. While we believe that the ultimate outcome of any such proceedings, if decided adversely to our interests, would not have a material adverse effect on our business, financial condition or results of operations, litigation is subject to inherent uncertainties. Were an unfavorable outcome to occur, there exists the possibility of a material adverse effect on our business, results of operations and financial condition.
On October 31, 2013, Cel-Sci Corporation (“Cel-Sci”) made a demand for arbitration under a Master Services Agreement (the “MSA”), dated as of April 6, 2010 with certain of our subsidiaries. Under the MSA and related project agreement, which were terminated by Cel-Sci in April 2013 under the without cause provisions of the MSA, Cel-Sci engaged the relevant subsidiaries in connection with a Phase III clinical trial of its investigational drug. The arbitration claim alleges breach of contract, fraud in the inducement and common law fraud on the part of our subsidiaries, and seeks damages of at least $50.0 million. In December 2013, we filed a counterclaim against Cel-Sci that alleges breach of contract and seeks at least $2.0 million in damages. The matter proceeded to the discovery phase, and in January 2015, we filed additional counterclaims against Cel-Sci alleging breach of contract, opportunistic breach, restitution and unjust enrichment and defamation, and seeking at least $2.0 million in damages and $20.0 million in other equitable remedies. A hearing is currently scheduled to begin in September 2016. While discovery is continuing and litigation is inherently unpredictable, we believe that no loss is currently considered probable and accordingly no provision has been recorded. See Note 12 to our consolidated financial statements included elsewhere in this prospectus for additional information.
100
Table of Contents
Market Trends
Global demand for biopharmaceutical products is expected to continue to increase in both developed and emerging markets, driven by expanding access to care, increasing life expectancy and the growing prevalence of chronic conditions. Growing regulatory requirements, pricing and reimbursement challenges, a need to replenish product pipelines and a shift to more targeted and personalized medicines are driving higher costs and complexities and increasing pressures on biopharmaceutical companies. Additionally, advancements in science are driving new therapies (such as gene therapies, stem cells and biologics) that necessitate more complex clinical development and commercialization services. Faced with these pressures, biopharmaceutical companies are increasingly seeking to improve the efficiencies and effectiveness of their clinical development and commercialization activities by outsourcing these services throughout the entire product lifecycle. In particular, the following trends are expected to increase demand for outsourced clinical development and commercialization services:
Growth in R&D Spending. We estimate the total R&D spending in the biopharmaceutical industry was approximately $140 billion in 2015. Potential outsourcing development spending accounted for approximately 70%, or $100 billion, and is estimated to grow approximately 4% annually through 2020. Biopharmaceutical companies seek new products to replenish their pipelines in advance of patent expirations. There were approximately 5,950 products in the Phase I-III pipeline at the end of 2015, an increase of 79% since 2008. The FDA approved 45 new molecular entities in 2015. This elevated level of approvals represents an approximate doubling of the 23 average approvals per year received from 2000 to 2010.
Increased Product Commercialization Spending. We estimate that spending related to product commercialization in the biopharmaceutical industry exceeded $150 billion in 2015, and will grow at approximately 2% to 3% annually through 2020. Changes in the product marketing process, including regulatory and ethical factors as well as a greater demand for efficacy and safety data, are placing greater burdens on biopharmaceutical companies as well as increasing the risks associated with the product development process. These companies are seeking to meet these burdens and address the pressures in the healthcare industry through efficiency gains in commercialization.
Expansion in the Use of Outsourcing Services. We estimate that total clinical development outsourcing to CROs in 2015 was approximately 30% of total potential outsourcing development spending, representing an approximately $30 billion market. This market is expected to achieve approximately 40% penetration, or approximately $55 billion of spending, by 2020. Because the market for product commercialization services is more diverse, it is difficult to estimate the current amount of outsourced product commercialization services and the expected growth in such services. However, we estimate that less than 15% of product commercialization expenditures are currently being outsourced. As business models continue to evolve in the healthcare sector, we believe that the rate of commercial outsourcing could follow a similar path to the clinical development market.
The need for in-depth knowledge, therapeutic expertise and cost efficiencies across the biopharmaceutical industry are all expected to be key factors driving increased outsourcing. Specifically, we believe the successful launch and commercialization of complex products will increasingly require specialized knowledge and expertise. Clinical trials represent a significant portion of both overall clinical development time and overall development costs. We expect biopharmaceutical companies to outsource more activities as they focus on becoming more efficient and seek to maximize their returns on product development. Due to these factors, we believe larger scale outsourced providers with industry expertise stand to benefit disproportionately.
Increased Complexity in Clinical Development and Commercialization. Significant unmet medical needs and scientific advancements are driving biopharmaceutical companies to seek to discover, develop and commercialize new, increasingly complex treatments. Biopharmaceutical companies face increased complexities in a variety of areas, including patient eligibility criteria, approval endpoints, trial procedures, pharmacoeconomics, selling strategies,
101
Table of Contents
marketing, distribution and reimbursement. As an illustration, the average number of clinical endpoints required for a Phase III study increased 86% from 2002 to 2012 and the total number of countries utilized in such studies increased 209% over the same period. Further, increasing complexity in specialized therapeutic areas, such as orphan drugs, oncology and neuroscience, is driving greater demand for a specialty commercialization model with more extensive subject knowledge required to successfully commercialize these more complex products. We believe that these requirements will increasingly benefit outsourced commercial services providers, particularly those with global scale and widespread industry knowledge.
These trends represent significant opportunities in both of our segments:
CRO Industry
Increased demand for outsourced clinical development in the biopharmaceutical industry has led to significant growth and development of the CRO market. Today, CROs provide a comprehensive range of services spanning the spectrum from pre-clinical to early stage to late-stage/phase II-IV clinical development. Services offered by CROs include biopharmaceutical development, biologic assay development, preclinical research, clinical research, clinical trials management and pharmacovigilance. Structurally, the market is highly fragmented, and, in recent years, has experienced substantial consolidation as biopharmaceutical companies seek scale and providers with the global experience required to support them.
The nature of the biopharmaceutical clinical development process requires both global expertise and a sophisticated therapeutic area understanding. There are complex approval procedures and requirements for the development of products, which vary dramatically across different regions of the world. Clinical development spending in the United States represents approximately 50% of global spending in the industry, with the Asia-Pacific region and Europe, the Middle East and Africa representing 23% and 28%, respectively. It is estimated that early stage development represents approximately 28% of the industry, while late-stage development represents around 72%. We believe these trends as well as the need to meet changing industry dynamics, are driving biopharmaceutical companies to consolidate their clinical development outsourcing to large global providers like us.
CCO Industry
Biopharmaceutical companies are increasingly facing pressures to improve the efficiencies of their commercialization and marketing activities, which is driving outsourcing of the commercialization of their products. The ability to scale commercial resources up or down as products are approved or relevant patents expire is important to the biopharmaceutical industry in order to increase revenues and manage costs. For larger clients, products that present compelling market opportunities but that are in non-core areas present a unique challenge as these clients seek to bring such products to market. For mid-to-small sized biopharmaceutical companies, the ability to outsource the entirety of their commercialization process is increasingly attractive as they seek to avoid the complexities and investment costs associated with building these on their own. The commercialization process is also becoming increasingly complex as the industry faces more stringent regulations. These factors, as well as the increased specialization of products, demand more experience and expertise. Services offered by outsourced commercialization providers include consulting, selling solutions, market access, branding, advertising, public relations and medication adherence. Commercialization services also require an understanding of the broad set of market participants in the healthcare industry that drive end market demand for products, including payers, providers and patients.
While the outsourced commercialization industry is still evolving, we believe the ability to offer global reach, broad therapeutic expertise and integrated services differentiates competitors in this landscape. In addition, we believe the highly complementary nature of commercialization with clinical development can afford providers a strategic advantage, as leveraging an understanding of commercialization needs during the clinical development process can improve efficiency, increase market opportunities and shorten the time to market for products.
102
Table of Contents
Directors & Executive Officers
The following table sets forth certain information regarding the current members of our Board and executive officers.
| Name |
Age* | Position | ||
| Michael A. Bell | 60 | Chairman and Chief Executive Officer | ||
| Jonathan E. Bicknell | 47 | Chief Financial Officer and Chief Accounting Officer | ||
| Michael J. McKelvey | 63 | Executive Vice President, President of Clinical Segment | ||
| Eric R. Green | 53 | General Counsel & Secretary | ||
| Jeffrey P. McMullen | 64 | Vice Chairman and Director, Chairman of inVentiv Health Clinical | ||
| Rachel A. Stahler | 40 | Chief Information Officer | ||
| Todd M. Abbrecht | 47 | Director | ||
| Laura A. Grattan | 34 | Director | ||
| Joshua M. Nelson | 43 | Director | ||
| Charles J. Shea | 60 | Director | ||
| R. Blane Walter | 45 | Vice Chairman and Director |
| (*) | Age as of April 1, 2016. |
Michael A. Bell
Michael A. Bell was appointed Chairman and Chief Executive Officer in September 2014. Mr. Bell served as our Chief Operating Officer from May 2014 until his appointment as Chairman and Chief Executive Officer. From 1998 until he joined the Company, Mr. Bell was a Managing Partner and Founder of Monitor Clipper Partners, a private equity firm where he invested in companies in the professional services, procurement outsourcing and biopharmaceutical services industries. Mr. Bell also served as Senior Executive Vice President of John Hancock Financial Services, Inc., reporting to the Chairman and Chief Executive Officer, from 2001 until the business was sold to Manulife Financial Corporation in 2004. In 1983 Mr. Bell was a founder of Monitor Group, a management consulting firm engaged across the healthcare delivery system, and was a member of the firm’s leadership team until 1998 when he joined Monitor Clipper Partners, LLC. Mr. Bell’s experience serving as a director of various companies and his extensive experience as an executive, including with us, led to the conclusion that he should serve as a member of our Board.
Jonathan E. Bicknell
Jonathan E. Bicknell was appointed Chief Financial Officer in October 2014, after being appointed Interim Chief Financial Officer in August 2013. Mr. Bicknell joined us as Chief Accounting Officer in April 2012. Prior to joining us, Mr. Bicknell was with PriceWaterhouseCoopers, LLP (“PwC”) for nearly 18 years, most recently as a Partner in the Banking and Capital Markets group. During his tenure at PwC, he worked in both the Audit and Transaction Services groups, focusing on financial services as well as biotechnology and start up technology companies.
Michael J. McKelvey
Michael J. McKelvey was appointed Executive Vice President and President of inVentiv Health Clinical in June 2015. He previously served as Executive Vice President and Chief Operating Officer at Aptiv Solutions, Inc. (“Aptiv Solutions”), a global clinical development services company focused on adaptive clinical trial design from January 2011 to May 2014. Dr. McKelvey was an industry consultant following the sale of Aptiv Solutions
103
Table of Contents
to ICON plc, from May 2014 until joining us in June 2015. Prior to Aptiv Solutions, Dr. McKelvey was President and Chief Executive Officer and served on the board of directors of eResearchTechnology, Inc. (“eResearchTechnology”), a provider of clinical research services from 2006 to 2010. Prior to eResearchTechnology, he served as Corporate Senior Vice President of Clinical Research Services at PAREXEL International Corporation from 2001 to 2006 as well as the Head of Global Data Management and Head of Global Biostatistics.
Eric R. Green
Eric R. Green was appointed General Counsel and Secretary in October 2014, after joining us as General Counsel of inVentiv Health Commercial in November 2011. Prior to joining us, Mr. Green was Senior Counsel of GE Healthcare Inc. from August 2010 until November 2011. From June 1999 until August 2010, Mr. Green served in several senior legal roles at Quintiles, including Vice President and Senior Associate General Counsel.
Jeffrey P. McMullen
Jeffrey P. McMullen was appointed Vice Chairman and a member of our Board in May 2012 and Chairman of inVentiv Health Clinical in May 2014. Prior to joining us, he previously served as the Chief Executive Officer of PharmaNet Development Group, Inc. (“PharmaNet”), which he co-founded in 1996. He served as President and CEO of PharmaNet from December 2005 to May 2012, when PharmaNet was acquired by us. Prior to his role as President and CEO of PharmaNet, Mr. McMullen held the positions of President and Chief Operating Officer from 2003 to 2005, Executive Vice President and Chief Operating Officer from 2001 to 2003 and Senior Vice President, Business Development from 1996 to 2001 at PharmaNet. Mr. McMullen’s extensive experience in the industry and as an executive of our Company led to the conclusion that he should serve as a member of our Board.
Rachel A. Stahler
Rachel A. Stahler was appointed Chief Information Officer in September 2015 after joining us as Senior Vice President and Chief Information Officer of our Clinical segment in July 2014. Prior to joining us, Ms. Stahler was the Chief Information Officer and Senior Vice President of Marketing at Optimer Pharmaceuticals, Inc. from August 2011 until March 2014. Ms. Stahler held various roles at Pfizer, Inc. from November 2003 until August 2011.
Todd M. Abbrecht
Todd M. Abbrecht is a Managing Director with THL and was appointed as a member of our Board in August 2010. Prior to joining THL in 1992, Mr. Abbrecht was in the Mergers and Acquisitions department of Credit Suisse First Boston. Mr. Abbrecht previously served on the board of directors of Warner Chilcott plc and Dunkin’ Brands Group, Inc. Mr. Abbrecht currently serves as a director of Aramark, Fogo de Chao, Inc., Intermedix Corporation, Party City Holdings Inc., Curo Health Services, LLC (“Curo Health Services”) and Healthcare Staffing Services, LLC (“Healthcare Staffing Services”). Mr. Abbrecht’s experience serving as a director of various companies and his affiliation with THL, whose common stock holdings entitle it to elect a certain number of directors prior to the consummation of this offering, led to the conclusion that he should serve as a member of our Board.
Laura A. Grattan
Laura A. Grattan is a Director at THL and was appointed to our Board in August 2010. Prior to joining THL in 2005, Ms. Grattan worked in the Private Equity Group at Goldman, Sachs & Co. Ms. Grattan serves on the board of West Corporation. Ms. Grattan’s experience serving as a director of various companies and her affiliation with THL, whose common stock holdings entitle it to elect a certain number of directors prior to the consummation of this offering, led to the conclusion that she should serve as a member of our Board.
104
Table of Contents
Joshua M. Nelson
Joshua M. Nelson is a Managing Director with THL and was appointed to our Board in August 2010. Prior to joining THL in 2003, Mr. Nelson worked at J.P. Morgan Partners, LLC, the private equity affiliate of JPMorgan Chase & Co. Mr. Nelson also worked at McKinsey & Co. from 1995 to 1997 and The Beacon Group, LLC from 1997 to 1999. Mr. Nelson currently also serves as a director of Advanced BioEnergy, LLC, Hawkeye Energy Holdings, LLC, Party City Holdco Inc., Curo Health Services, Healthcare Staffing Services and Intermedix Holdings, Inc. Mr. Nelson’s experience serving as a director of various companies and his affiliation with THL, whose common stock holdings entitle it to elect a certain number of directors prior to the consummation of this offering, led to the conclusion that he should serve as a member of our Board.
Charles J. Shea
Charles J. Shea was appointed to our Board in February 2015 and has been an Operating Advisor to THL since 2013. Prior to THL, Mr. Shea was an Executive Vice President in our Commercial segment during 2012. From 2008 to 2011, Mr. Shea was a Managing Director with Devonshire Investors, a private equity investment firm owned by Fidelity Investments. Mr. Shea also served as chairman of Boston Coach Corporation and Veritude, LLC from 2008 to 2011, and as Executive Vice President with Sodexo USA, Inc.’s outsourced services business from 1990 to 1998. Mr. Shea currently also serves on the board of Curo Health Services and Healthcare Staffing Services. Mr. Shea’s experience as a director and officer of various companies, including his experience as an executive with us, led to the conclusion that he should serve as a member of our Board.
R. Blane Walter
R. Blane Walter is currently a Partner at Talisman Capital Partners and was appointed to our Board in October 2005. Mr. Walter is currently our Vice Chairman and previously served as Chief Executive Officer of inVentiv Health from 2008 until 2011. Mr. Walter founded inChord Communications, Inc. (“inChord”), an independently-owned, healthcare communications company, and served as CEO and Chairman from 1998 until October 2005, when inChord which was acquired by us. Mr. Walter currently serves on the board of Helius Medical Technologies, Inc. Mr. Walter’s prior experience as our Chief Executive Officer and his extensive background in healthcare marketing and communications led to the conclusion that he should serve as a member of our Board.
Board of Directors
Our business and affairs are managed under the direction of our Board. Upon the completion of this offering, our amended and restated bylaws will provide that our Board will consist of between and directors. Upon the consummation of this offering, our Board will be composed of directors, and seats on our Board will be occupied by full-time investment professionals of THL. Our executive officers and key employees serve at the discretion of our Board.
Controlled Company Exception
After the completion of this offering, affiliates of THL will continue to beneficially own shares representing more than 50% of the voting power of our shares eligible to vote in the election of directors. As a result, we will be a “controlled company” for purposes of the rules of the NYSE or NASDAQ. Under these corporate governance standards, a company of which more than 50% of the voting power for the election of directors is held by an individual, group or another company is a “controlled company” and may elect not to comply with certain corporate governance requirements, including the requirements (1) that a majority of our Board consist of independent directors; (2) that our Board has a Compensation Committee that is comprised entirely of independent directors with a written charter addressing the committee’s purpose and responsibilities; (3) that our
105
Table of Contents
director nominees are selected, or recommended for selection by our Board, either by (a) independent directors constituting a majority of our board’s independent directors in a vote in which only independent directors participate or (b) a Nominating and Corporate Governance Committee comprised solely of independent directors with a written charter addressing the committee’s purpose and responsibilities; and (4) of an annual performance evaluation of the Nominating and Corporate Governance and Compensation Committees. For at least some period following this offering, we intend to utilize these exemptions. Immediately following this offering we do not expect the majority of our directors will be independent or that our Compensation Committee or Nominating and Corporate Governance Committee will be comprised entirely of independent directors. Accordingly, although we may transition to fully independent Compensation and Nominating and Corporate Governance Committees prior to the time we cease to be a “controlled company,” for such period of time you will not have the same protections afforded to stockholders of companies that are subject to all of these corporate governance requirements. In the event that we cease to be a “controlled company” and our shares continue to be listed on the NYSE or NASDAQ, we will be required to comply with these provisions within the applicable transition periods. The controlled company exemption does not modify the independence requirements for the Audit Committee, and we intend to comply with the requirements of the Sarbanes-Oxley Act and the NYSE or NASDAQ rules, which require that our Audit Committee be composed of at least three members, one of whom will be independent upon the listing of our common stock on the NYSE or NASDAQ, a majority of whom will be independent within 90 days of the date of this prospectus and each of whom will be independent within one year of the date of this prospectus. In the event we cease to be a “controlled company” and our common stock continues to be listed on the NYSE or NASDAQ, we will be required to comply with these provisions within the applicable transition periods.
Director Independence
Our business affairs will be managed under the direction of our Board.
We intend to apply to list our common stock on the NYSE or NASDAQ. Under the listing standards of the NYSE or NASDAQ, independent directors must comprise a majority of a listed company’s board of directors. In addition, the NYSE or NASDAQ listing standards require that, subject to specified exceptions, each member of a listed company’s audit, compensation and Nominating and Corporate Governance Committees must be independent. As discussed above, we intend to avail ourselves of the “controlled company” exception and, as a result, we will not have a majority of independent directors on our Board. Under the NYSE or NASDAQ listing standards, a director is independent only if our Board makes an affirmative determination that the director has no material relationship with us. However, notwithstanding the foregoing, our Board has affirmatively determined that and are independent directors under the applicable rules of the NYSE and NASDAQ and as such term is defined in Rule 10A-3(b)(1) under the Exchange Act.
Board Committees
Our Board has the authority to appoint committees to perform certain management and administration functions. Upon the consummation of this offering, our Board will have three committees: the Audit Committee, the Compensation Committee and the Nominating and Corporate Governance Committee.
Audit Committee
The primary purpose of our Audit Committee is to assist the Board’s oversight of:
| • | the adequacy and integrity of our financial statements; |
| • | our internal financial reporting and compliance with our disclosure controls and procedures; |
| • | the qualifications, engagement, compensation, independence and performance of our independent registered public accounting firm; |
106
Table of Contents
| • | our independent registered public accounting firm’s annual audit of our financial statements and any engagement to provide other services; |
| • | the performance of our internal audit function; |
| • | our legal and regulatory compliance; and |
| • | the application of our codes of business conduct and ethics as established by management and our Board. |
Upon the consummation of this offering, , and will serve on the Audit Committee. will serve as chairman of the Audit Committee and also qualifies as an “audit committee financial expert” as such term has been defined by the SEC in Item 407(d)(5) of Regulation S-K and each Audit Committee member meets the financial literacy requirements of the NYSE or NASDAQ. Our Board has affirmatively determined that meet the definition of an “independent director” for the purposes of serving on the Audit Committee under applicable SEC and NYSE or NASDAQ rules, and we intend to comply with these independence requirements for all members of the Audit Committee within the time periods specified therein. The Audit Committee is governed by a charter that complies with the rules of the NYSE or NASDAQ.
Compensation Committee
The primary purposes of our Compensation Committee are to:
| • | oversee our executive compensation policies and practices; |
| • | review, determine and approve the compensation of our executive officers (including our chief executive officer); |
| • | provide oversight of our compensation policies, plans and benefit programs including reviewing and approving all equity incentive plans, policies and programs; and |
| • | approve and recommend to the Board reports on compensation matters required to be included in our annual proxy statement or annual report. |
Upon the consummation of this offering, , and will serve on the Compensation Committee, and will serve as the chairman. Our Board has affirmatively determined that meets the definition of an “independent director” for the purposes of serving on the Compensation Committee under applicable NYSE or NASDAQ rules, and we intend to comply with these independence requirements for all members of the Compensation Committee within the time periods specified therein. The Compensation Committee is governed by a charter that complies with the rules of the NYSE or NASDAQ.
Nominating and Corporate Governance Committee
The primary purposes of our Nominating and Corporate Governance Committee are to:
| • | recommend to the Board for approval the qualifications, qualities, skills and expertise required for Board membership; |
| • | identify potential members of the Board consistent with the criteria approved by the Board and select and recommend to the Board the director nominees for election at the next annual meeting of stockholders or to otherwise fill vacancies; |
| • | evaluate and make recommendations regarding the structure, membership and governance of the committees of the Board; |
| • | develop and make recommendations to the Board with regard to our corporate governance policies and principles; and |
| • | oversee the annual review of the Board’s performance. |
107
Table of Contents
Upon the consummation of this offering, , and will serve on the Nominating and Corporate Governance Committee, and will serve as the chairman. Our Board has affirmatively determined that meets the definition of an “independent director” for the purposes of serving on the Nominating and Corporate Governance Committee under applicable NYSE or NASDAQ rules, and we intend to comply with these independence requirements for all members of the Nominating and Corporate Governance Committee within the time periods specified therein. The Nominating and Corporate Governance Committee is governed by a charter that complies with the rules of the NYSE or NASDAQ.
Compensation Committee Interlocks and Insider Participation
The Compensation Committee is comprised of Messrs. Abbrecht, Bell, Nelson and Shea (Chairperson). Mr. Bell became our Chairman and Chief Executive Officer in September 2014. At no time during 2015 was any other member of the Compensation Committee an officer or employee. None of our executive officers has served on the Compensation Committee of any other entity that has or has had one or more executive officers who served as a member of the Compensation Committee during the year ended December 31, 2015.
Code of Business Conduct and Ethics
We have adopted a code of business conduct and ethics that applies to all of our employees, officers and directors, including those officers responsible for financial reporting. These standards are designed to deter wrongdoing and to promote honest and ethical conduct. The code of business conduct and ethics will be available on our website at www.inventivhealth.com. Any waiver of the code for directors or executive officers may be made only by our Board and will be promptly disclosed to our stockholders as required by applicable U.S. federal securities laws and the corporate governance rules of the NYSE or NASDAQ. Amendments to the code must be approved by our Board and will be promptly disclosed (other than technical, administrative or non-substantive changes). Any amendments to the code, or any waivers of its requirements, will be disclosed on our website. The inclusion of our website in this prospectus does not include or incorporate by reference the information on our website into this prospectus.
Corporate Governance Guidelines
Our Board will adopt corporate governance guidelines in accordance with the corporate governance rules of the NYSE or NASDAQ, as applicable, that serve as a flexible framework within which our Board and its committees operate. These guidelines will cover a number of areas including the size and composition of the Board, Board membership criteria and director qualifications, director responsibilities, Board agenda, roles of the Chairman of the Board, Chief Executive Officer and presiding director, meetings of independent directors, committee responsibilities and assignments, Board member access to management and independent advisors, director communications with third parties, director compensation, director orientation and continuing education, evaluation of senior management and management succession planning. A copy of our corporate governance guidelines will be posted on our website.
Indemnification of Officers and Directors
Our amended and restated bylaws that will be in effect upon completion of this offering will provide that we will indemnify our directors and officers to the fullest extent permitted by the DGCL. We have established directors’ and officers’ liability insurance that insures such persons against the costs of defense, settlement or payment of a judgment under certain circumstances.
Our amended and restated certificate of incorporation that will be in effect upon completion of this offering will provide that our directors will not be liable for monetary damages for breach of fiduciary duty, except for liability relating to any breach of the director’s duty of loyalty, acts or omissions not in good faith or which involve intentional misconduct or a knowing violation of law, violations under Section 174 of the DGCL or any transaction from which the director derived an improper personal benefit.
108
Table of Contents
We intend to enter into new indemnification agreements with each of our directors and executive officers. These agreements, among other things, will require us to indemnify each director and executive officer to the fullest extent permitted by Delaware law, including indemnification of expenses such as attorneys’ fees, judgments, fines and settlement amounts incurred by the director or executive officer in any action or proceeding, including any action or proceeding by or in right of us, arising out of the person’s services as a director or executive officer, as applicable.
109
Table of Contents
EXECUTIVE AND DIRECTOR COMPENSATION
Introduction
This section describes our executive compensation philosophy and objectives and each of the key elements of our compensation programs for the year ended December 31, 2015 as they applied to the following individuals, who are referred to in this prospectus as the “named executive officers”:
| • | Michael A. Bell, Chairman and Chief Executive Officer; |
| • | Jonathan E. Bicknell, Chief Financial Officer and Chief Accounting Officer; |
| • | Michael A. Griffith, Executive Vice President, President of Commercial segment until March 15, 2016; |
| • | Michael J. McKelvey, Executive Vice President, President of Clinical segment; and |
| • | Rachel A. Stahler, Chief Information Officer. |
The Compensation Committee, which is comprised of Messrs. Abbrecht, Bell, Nelson and Shea, is responsible for making compensation decisions for our named executive officers. Mr. Bell did not, however, participate in committee discussions or decisions regarding his compensation.
Compensation Discussion and Analysis
Compensation Philosophy
Our compensation philosophy, as administered by the Compensation Committee, seeks to:
| • | align the interests of executive officers with the long-term interests of our stockholders; |
| • | achieve an appropriate balance between fixed compensation, such as annual base salaries, and variable compensation, such as annual bonus and short-term and long-term incentive plans; |
| • | motivate executive officers to achieve specified performance targets on an annual basis; |
| • | recognize and reward current year performance; |
| • | establish retention incentives for executive officers; and |
| • | establish competitive levels of annual and long-term incentive compensation. |
The Compensation Process
The Compensation Committee typically reviews and approves bonus awards for the most recently completed fiscal year and base salaries and bonus targets for the current year in the first quarter of the current year and reviews and approves equity awards upon hire, promotion and on a situational basis when appropriate. We anticipate that the Compensation Committee will follow a similar process in 2016 for bonus awards, base salaries, bonus targets and equity awards.
Neither we nor the Compensation Committee engaged a compensation consultant to advise on executive compensation matters during 2015. We relied on industry relevant survey data to benchmark Dr. McKelvey and Ms. Stahler’s compensation but did not use survey data to benchmark executive compensation for our other named executive officers. We do not maintain security ownership guidelines for our named executive officers. We periodically refer to publicly available compensation information to assess the compensation of certain named executive officers.
The Compensation Committee determined executive compensation for 2015 in a multi-step process:
| • | base salaries for all of our then named executive officers were reviewed by the Compensation Committee in 2015; and |
| • | discretionary bonus awards with respect to fiscal 2015 were determined at a meeting of the Compensation Committee in February 2016. |
110
Table of Contents
Elements of Executive Compensation
The elements of our compensation programs as applied to our named executive officers during 2015 are described below. The specific elements of compensation provided to each named executive officer were determined within the framework of their offer letters, which are described in detail under “—Executive Employment and Separation Agreements” below.
Base Salary
Base salaries were a key component of the compensation of our named executive officers for 2015. We review the base salaries of our named executive officers on a periodic basis and may adjust as appropriate. Mr. Bell is party to an employment agreement which sets his base salary. Messrs. Bicknell and Griffith and Dr. McKelvey have offer letters that establish a base salary. Ms. Stahler received a promotion letter in connection with her appointment as Chief Information Officer, which increased her base salary. No other named executive officers received salary increases during the year.
Annual Bonus
Our annual bonus program is a key component of our named executive officers’ compensation for 2015. Each of our named executive officers was eligible to earn annual bonuses for 2015 pursuant to our annual bonus plan (the “Annual Bonus Plan”). The goal of the Annual Bonus Plan is to motivate exemplary performance by the senior management team during the applicable annual period both as a group and on an individual basis. Awards from the Annual Bonus Plan were made from a pool with three different funding criteria. The first one-third portion of the pool is funded regardless of our performance during 2015. The second one-third portion of the pool was eligible to begin funding upon attainment of at least 90% of segment performance targets which cumulatively supported a Company Consolidated EBITDA target of $230.0 million (the “EBITDA Target”). The EBITDA Target calculation was reviewed and approved by the Compensation Committee. Funding for the remaining one-third portion of the pool was subject to the Company exceeding the EBITDA Target.
In allocating pool funds, the Compensation Committee considered the following factors:
| • | Mr. Bell will receive a total bonus of $875,000 (140% of his base salary) at the discretion of members of the Compensation Committee (excluding Mr. Bell) in recognition of his leadership role in fundamentally changing our performance. Mr. Bell’s actions resulted in significant and tangible financial and operational improvements as demonstrated in our net revenues and EBITDA growth year over year. Mr. Bell created a structured and disciplined approach to running the business, and rebuilt our culture through increased communications, focus on employee accountability, and the specific measurement of success through quantifiable metrics. |
| • | Mr. Bicknell will receive a total bonus of $230,000 (approximately 56% of his base salary) at the discretion of the Compensation Committee in recognition of his role in our net revenues and EBITDA growth during 2015, his leadership role in registering certain of our outstanding notes pursuant to a Registration Statement on Form S-4 filed with the SEC, which resulted in greater transparency of financial reporting and the termination of additional interest obligations, and continued improvement of financial and other operational processes and procedures globally. |
| • | Mr. Griffith will receive a total bonus of $450,000 (approximately 86% of his base salary) at the discretion of the Compensation Committee in recognition of his role in the net revenues and EBITDA growth of the Commercial segment during 2015 and his leadership of operational improvements in the Commercial segment during his tenure with us. |
| • | Dr. McKelvey will receive a total bonus of $525,000 (100% of his base salary) at the discretion of the Compensation Committee in recognition of his role in the net revenues and EBITDA growth of the Clinical segment during 2015. His leadership in operational improvements resulted in identifying and actioning programs that reduced costs in the Clinical segment which improved our EBITDA margin in 2015. |
111
Table of Contents
| • | Ms. Stahler will receive a total bonus of $275,000 (approximately 69% of her base salary) at the discretion of the Compensation Committee in recognition of her role in our net revenues and EBITDA growth during 2015 and her leadership (after being appointed to the Chief Information Officer role) in restructuring the information technology organization to consolidate certain groups and streamline processes yielding cost savings. |
The bonus targets for our named executive officers for 2015 were as follows:
| Executive |
Target (% of Base Salary) |
|||
| Michael A. Bell |
100 | % | ||
| Jonathan E. Bicknell |
50 | % | ||
| Michael A. Griffith |
100 | % | ||
| Michael J. McKelvey |
100 | % | ||
| Rachel A. Stahler |
50 | % | ||
Equity-Based Incentive Awards
Another key component of our named executive officers’ compensation for 2015 was equity compensation. The goal of our equity-based incentive awards is to align the long-term interests of executive officers with stockholders and to provide each executive with a significant incentive to manage us from the perspective of an owner with an equity stake in the business.
On July 2, 2015 our Board approved the grant of new option awards (“2015 Incentive Options”) to eligible employees in exchange for certain outstanding restricted stock units granted under the 2010 Plan, on a one-for-one basis. Thirty-five percent of 2015 Incentive Options are time-based vesting over five years and sixty-five percent vests based upon achievement of specified performance targets and completion of a service requirement. Messrs. Bicknell and Griffith and Ms. Stahler exchanged 6,654, 14,458 and 2,949 restricted stock units, respectively, for an equivalent number of 2015 Incentive Options in the exchange program. Mr. Griffith, Dr. McKelvey and Ms. Stahler were granted 21,595, 13,215 and 4,000 new 2015 Incentive Options, respectively, during 2015 in addition to those received in the exchange program.
During 2015, Mr. Bell received 12,816 time-based vesting options which vest quarterly over a one-year period and 19,882 restricted stock units which vest if THL sells its interest in us for cash and the price realized exceeds its initial investment. All of the units were granted pursuant to the terms of Mr. Bell’s Employment, Non-Compete and Severance Agreement described in “—Executive Employment and Separation Agreements.” Of the aforementioned awards granted to Mr. Bell, 5,316 of the stock options and 6,000 of the restricted stock units granted in 2015 were awarded in recognition of Mr. Bell’s service as an executive officer in 2014.
Severance and Change in Control Benefits
Mr. Bell is party to an employment agreement which provides for severance payments and benefits upon termination by us without cause or by the executive for good reason. These payments and benefits are discussed in more detail under “—Executive Employment and Separation Agreements.”
Each of Messrs. Bicknell, Griffith, Dr. McKelvey and Ms. Stahler are party to a Severance and Non-Competition Agreement with us that provides for severance payments and benefits upon termination by us without cause, as well as certain payments and benefits upon termination by us without cause or, with respect to Messrs. Bicknell and Griffith and Dr. McKelvey, by the executive for good reason during the 12 month period following a change in control. These payments and benefits are discussed in more detail under “—Executive Employment and Separation Agreements” and “—Executive Compensation Tables—Potential Payments Upon Termination or Change in Control” below. We extended these benefits in order to maintain the competitiveness of its compensation practices and to induce the executives to enter into their employment or assume additional responsibilities.
112
Table of Contents
Executive Employment and Separation Agreements
The following is a summary of the employment agreements that were in place between us and our named executive officers as of December 31, 2015.
Mr. Bell is party to an Employment, Severance and Non-Competition Agreement effective as of September 24, 2014, which provides for a base salary of $625,000 per year, with a bonus target of 100%. Mr. Bell’s agreement provides for the equity incentive awards discussed in more detail under “—Elements of Executive Compensation—Equity-Based Incentive Awards,” along with additional annual grants beginning in 2015 of (i) 7,500 options with a fair market value exercise price as of the date of grant which shall vest in four equal installments on the last day of each calendar quarter following the grant date, (ii) restricted stock units valued at $667,500 which vest if THL sells its interest in us for cash and the price realized is at least equal to its initial investment, and (iii) restricted stock units under the LTIP valued at $667,500 which shall be earned if the Consolidated EBITDA targets referenced in “—Elements of Executive Compensation—Equity-Based Incentive Awards” are met. Mr. Bell’s agreement was amended on June 18, 2015 to: (i) provide for the issuance of 5,316 fully-vested options replacing the 5,000 options which were initially committed in 2014 described in “—Elements of Executive Compensation—Equity-Based Incentive Awards” and (ii) to replace the annual commitment to grant restricted stock units under the LTIP valued at $667,500 with an annual commitment to grant restricted stock units of an equivalent value which vest if THL sells its interest in us for cash and the price realized is at least equal to the greater of: (a) the value of its initial investment or (b) the grant date value of its initial investment. The agreement further provides for the following severance benefits in the event Mr. Bell is terminated without cause or resigns for good reason: (i) aggregate severance payments of $1,250,000, (ii) 12 months of continued health and welfare coverage at active employee levels and cash payments to cover the employee premium, (iii) acceleration of any options that are due to vest within six months of termination and (iv) three months of executive-level career transition services. Mr. Bell’s agreement also provides for certain non-competition, non-solicitation of clients and employees and non-hire restrictions during the period of employment and for 12 months thereafter.
Each of Messrs. Bicknell and Griffith and Dr. McKelvey received an offer letter from us upon commencement of employment and are party to a Severance and Non-Competition Agreement with us. Ms. Stahler received a promotion letter upon being promoted to the role of Chief Information Officer and is party to a Severance and Non-Competition Agreement with us. The letters provide that Messrs. Bicknell and Griffith, Dr. McKelvey and Ms. Stahler shall be paid an annual base salary of $400,000, $525,000, $525,000 and $400,000 respectively, and shall have an annual bonus target of 50%, 100%, 100% and 50% respectively. Mr. Bicknell’s salary was increased to $410,000, effective April 1, 2013 to reflect his contributions during 2012, including his role in key financing initiatives. Additionally, Dr. McKelvey is eligible to receive a bonus of $750,000 upon the earliest to occur of an initial public offering, a change of control or termination of his employment by us without cause.
The Severance and Non-Competition Agreements between us and each of Messrs. Bicknell, and Griffith, Dr. McKelvey and Ms. Stahler provide that upon termination of the executive without cause, the executive shall be entitled to receive (i) all base salary earned but unpaid and certain other accrued benefits as of the date of termination, (ii) a pro-rata bonus for the year of termination, as determined in accordance with our then-current bonus program, (iii) severance pay equal to 12 months of the executive’s base salary, (iv) 12 months of continued health and welfare coverage at active employee levels and cash payments to cover the employee premium and (v) three months of executive-level career transition services. However, with respect to Messrs. Bicknell and Griffith and Dr. McKelvey, if we terminate the executive without cause or the executive resigns with good reason within 12 months following a change of control, we shall not pay the executive a pro-rata bonus, but shall instead pay to the executive an amount equal to 100% of the executive’s annual cash incentive bonus payment at target for the year preceding the change in control. In the event of termination of the executive’s employment as a result of the executive’s death, we shall pay to the executive’s heirs, executors, administrators or other legal representatives the amounts described in (i) and (ii) above, or if the executive’s death occurs within the 12 month period following a change of control, an
113
Table of Contents
amount equal to 100% of the executive’s annual cash incentive bonus payment at target for the year preceding the change in control. If the executive’s employment is terminated voluntarily by the executive or by us for cause, the executive shall be entitled to the benefits described in (i) above. Each of the Severance and Non-Competition Agreements provide for certain non-competition, non-solicitation of clients and employees and no-hire restrictions during the period of employment and for 12 months thereafter and requires the executive, during the period in which the executive is receiving severance benefits under the agreement, to make a good faith effort to seek employment on comparable terms, and the severance benefits provided under the agreement shall be reduced by any employment compensation received by the executive during such period.
As of the close of business on March 15, 2016, Mr. Michael Griffith’s employment with us terminated. On March 16, 2016, we entered into an Enhanced Separation Agreement and General Release of Claims (“Griffith Enhanced Separation Agreement”) with Mr. Griffith concerning the conclusion of Mr. Griffith’s employment services with us, which supersedes, in part, and incorporates by reference, in part, our previous Severance and Non-Competition Agreement with Mr. Griffith dated May 10, 2014 (the “Griffith Severance and Non-Competition Agreement”).
Under the terms of the Griffith Enhanced Separation Agreement, provided that Mr. Griffith executes and does not revoke a Separation Agreement and General Release of Claims (“Griffith Separation Agreement”), we will, among the other benefits provided for in the Griffith Severance and Non-Competition Agreement, pay Mr. Griffith a bonus in an amount equal to $650,000, which amount includes $450,000 which shall be regarded as Mr. Griffith’s annual bonus for the year ended December 31, 2015 and $200,000 which shall be regarded as a partial bonus for the year ended December 31, 2016. In addition, following the termination of Mr. Griffith’s employment, he will remain eligible to vest in certain time-based and EBITDA-based options in accordance with the terms thereof and such options, to the extent vested, will remain outstanding and exercisable until September 30, 2018. If Mr. Griffith fails to execute or executes and revokes the Griffith Separation Agreement, in place of the foregoing benefits under the Griffith Enhanced Separation Agreement, he shall instead receive a lump-sum, one-time payment in the amount of $50,000.
Deductibility of Compensation
In determining which elements of compensation are to be paid, and how they are weighted, on a going forward basis, we will take into account whether a particular form of compensation will be deductible under Section 162(m) of the Internal Revenue Code (the “Code”). Section 162(m) generally limits the deductibility of compensation paid to our named executive officers to $1 million during any fiscal year unless such compensation is “performance-based” under Section 162(m). However, under a Section 162(m) transition rule for compensation plans or agreements of corporations which are privately held and which become publicly held in an initial public offering, compensation paid under a plan or agreement that existed prior to the initial public offering will not be subject to Section 162(m) until the earliest of (1) the expiration of the plan or agreement, (2) a material modification of the plan or agreement, (3) the issuance of all employer stock and other compensation that has been allocated under the plan or (4) the first meeting of stockholders at which directors are to be elected that occurs after the close of the third calendar year following the year of the initial public offering (the “Transition Date”). After the Transition Date, rights or awards granted under the plan, other than options and stock appreciation rights, will not qualify as “performance-based compensation” for purposes of Section 162(m) unless such rights or awards are granted or vest upon pre-established objective performance goals.
114
Table of Contents
Executive Compensation Tables
Summary Compensation Table
The following Summary Compensation Table sets forth the compensation earned by our named executive officers for the years ending December 31, 2015, 2014 and 2013.
| Name and Principal Position |
Year | Salary($) | Bonus($)(1) | Stock Awards($)(2) |
Option Awards($)(2) |
All Other Compensation ($)(3) |
Total($) | |||||||||||||||||||||
| Michael A. Bell |
2015 | 645,193 | 875,000 | 1,912,052 | 630,900 | 7,950 | 4,071,095 | |||||||||||||||||||||
| Chairman and Chief |
2014 | 340,385 | 316,000 | — | — | 7,800 | 664,185 | |||||||||||||||||||||
| Executive Officer |
2013 | — | — | — | — | — | — | |||||||||||||||||||||
| Jonathan E. Bicknell |
2015 | 402,116 | 230,000 | — | 355,674 | — | 987,790 | |||||||||||||||||||||
| Chief Financial Officer and |
2014 | 410,000 | 175,000 | 307,495 | — | 19,500 | 911,995 | |||||||||||||||||||||
| Chief Accounting Officer |
2013 | 408,308 | 103,000 | 75,000 | — | 56,250 | 642,558 | |||||||||||||||||||||
| Michael A. Griffith |
2015 | 514,904 | 450,000 | — | 1,927,130 | 7,356 | 2,899,390 | |||||||||||||||||||||
| Executive Vice President, |
2014 | 424,039 | 426,625 | 1,998,406 | — | 3,029 | 2,852,099 | |||||||||||||||||||||
| President of Commercial segment | 2013 | — | — | — | — | — | — | |||||||||||||||||||||
| Michael J. McKelvey |
2015 | 282,692 | 525,000 | — | 706,377 | 7,376 | 1,521,445 | |||||||||||||||||||||
| Executive Vice President, |
2014 | — | — | — | — | — | — | |||||||||||||||||||||
| President of Clinical segment(4) | 2013 | — | — | — | — | — | — | |||||||||||||||||||||
| Rachel A. Stahler |
2015 | 353,500 | 275,000 | — | 369,718 | 7,950 | 1,006,168 | |||||||||||||||||||||
| Chief Information Officer(5) |
2014 | — | — | — | — | — | — | |||||||||||||||||||||
| 2013 | — | — | — | — | — | — | ||||||||||||||||||||||
| (1) | The amounts shown in the “Bonus” column constitute the cash incentive awards made to our executive officers under the our Annual Bonus Plan. We made payments for 2015 bonuses early in April 2016. For a detailed discussion of our Annual Bonus Plan, see “—Elements of Executive Compensation—Annual Bonus” above. |
| (2) | The amounts shown in the “Stock Awards” and “Option Awards” columns represent the value of restricted stock units and 2015 Incentive Options based on the methodology we employed for purposes of preparing our annual financial statements in accordance with ASC 718, without taking into account any projected forfeitures of service-based awards. See “—Grants of Plan-Based Awards” and “—Outstanding Equity Awards at Fiscal Year-End” below. For a further discussion of this methodology, see Note 13 to our consolidated financial statements included elsewhere in this prospectus. |
| (3) | The amounts shown in the “All Other Compensation” column for 2015 represent the following: |
| i. | For Messrs. Bell and Griffith and Ms. Stahler, the amount for 2015 represents matching contributions under our 401(k) retirement savings plan. |
| ii. | For Dr. McKelvey, the amount for 2015 represents matching contributions under our 401(k) retirement savings plan and reimbursement for biometric registration. |
The amounts shown in the “All Other Compensation” column for 2014 represent the following:
| i. | For Messrs. Bell and Griffith, the amount for 2014 represents matching contributions under our 401(k) retirement savings plan. |
| ii. | For Mr. Bicknell, the amount for 2014 represents additional contributions to health benefit premiums provided to employees participating in certain incentive programs. |
The amount shown in the “All Other Compensation” column for 2013 represents cash payments made to Mr. Bicknell during the year under the 2013 incentive award program.
| (4) | Dr. McKelvey was hired as our Executive Vice President, President of our Clinical segment on June 1, 2015. |
| (5) | Ms. Stahler was promoted to our Chief Information Officer effective September 1, 2015. The amounts shown in the above table include all amounts earned in Ms. Stahler’s prior position during 2015. |
115
Table of Contents
Grants of Plan-Based Awards
The following table presents information on equity awards granted during 2015 to our named executive officers:
| Name |
Grant Date |
Estimated Future Payouts Under Non-Equity Incentive Plan Awards |
Estimated Future Payouts Under Equity Incentive Plan Awards |
All Other Stock Awards: Number of Shares of Stock or Units(#) |
All Other Option Awards: Number Securities Underlying Options(#) |
Exercise or Base Price of Option Awards ($/Sh) |
Grant Date Fair Value of Stock And Option Awards($) |
|||||||||||||||||||||||||||||||||||||
| Threshold($) | Target($) | Maximum($) | Threshold(#) | Target(#) | Maximum(#) | |||||||||||||||||||||||||||||||||||||||
| Michael A. Bell |
6/18/2015 | — | — | — | — | — | — | 12,941 | (1) | — | — | 1,244,536 | ||||||||||||||||||||||||||||||||
| 6/18/2015 | — | — | — | — | — | — | — | 5,316 | (1) | 96.17 | 261,900 | |||||||||||||||||||||||||||||||||
| 9/24/2015 | — | — | — | — | — | — | 6,941 | (1) | — | — | 667,516 | |||||||||||||||||||||||||||||||||
| 9/24/2015 | — | — | — | — | — | — | — | 7,500 | (1) | 96.17 | 369,001 | |||||||||||||||||||||||||||||||||
| Jonathan E. Bicknell |
7/2/2015 | — | — | — | — | — | — | — | 6,654 | (2) | 96.17 | 355,674 | ||||||||||||||||||||||||||||||||
| Michael A. Griffith |
7/2/2015 | — | — | — | — | — | — | — | 36,053 | (2) | 96.17 | 1,927,130 | ||||||||||||||||||||||||||||||||
| Michael J. McKelvey |
7/2/2015 | — | — | — | — | — | — | — | 13,215 | (2) | 96.17 | 706,377 | ||||||||||||||||||||||||||||||||
| Rachel A. Stahler |
7/2/2015 | — | — | — | — | — | — | — | 2,949 | (2) | 96.17 | 157,632 | ||||||||||||||||||||||||||||||||
| 9/24/2015 | — | — | — | — | — | — | — | 4,000 | (2) | 96.17 | 212,086 | |||||||||||||||||||||||||||||||||
| (1) | Represents 19,882 restricted stock units and 12,816 time-based vesting options awarded under Mr. Bell’s Employment, Non-Compete and Severance Agreement described under “—Elements of Executive Compensation—Equity-Based Incentive Awards” above, which includes 5,316 stock options and 6,000 restricted stock units awarded in recognition of Mr. Bell’s service as an executive officer in 2014. For a description of the vesting terms of the restricted stock units and time-based vesting options, see “—Elements of Executive Compensation—Equity-Based Incentive Awards.” |
| (2) | Amounts shown represent the grant of 2015 Incentive Options described under “—Elements of Executive Compensation—Equity-Based Incentive Awards” above. 35% of the 2015 Incentive Options have a time-based vesting schedule over five years, and 65% vest upon the achievement of specified performance targets and completion of a service requirement. Messrs. Bicknell and Griffith and Ms. Stahler exchanged 6,654, 14,458 and 2,949 restricted stock units, respectively, for an equivalent number of 2015 Incentive Options in the exchange program. |
Outstanding Equity Awards at Fiscal Year-End
The following table provides information with respect to outstanding option and restricted stock unit awards of each named executive officer as of December 31, 2015. See “Executive Compensation—Elements of Executive Compensation” and “—Equity-Based Incentive Awards” above for description of the vesting terms of outstanding stock awards.
| Option Awards | Stock Awards | |||||||||||||||||||||||||||
| Name |
Number of Securities Underlying Unexercised Options (#) Exercisable |
Number of Securities Underlying Unexercised Options (#) Unexercisable |
Number of Securities Underlying Unearned Unexercised Options (#) |
Option Exercise Price ($) |
Option Expiration Date |
Number of Shares or Units of Stock That Have Not Vested (#) (3) |
Market Value of Shares or Units of Stock That Have Not Vested ($) (4) |
|||||||||||||||||||||
| Michael A. Bell(1) |
5,316 | — | — | 96.17 | 6/18/2025 | — | — | |||||||||||||||||||||
| — | — | — | — | — | 12,941 | 2,445,849 | ||||||||||||||||||||||
| 1,875 | 5,625 | — | 96.17 | 9/24/2025 | — | — | ||||||||||||||||||||||
| — | — | — | — | — | 6,941 | 1,311,849 | ||||||||||||||||||||||
| Jonathan E. Bicknell(2) |
865 | 2,329 | 3,460 | 96.17 | 7/2/2025 | — | — | |||||||||||||||||||||
| — | — | — | — | — | 721 | 136,269 | ||||||||||||||||||||||
| Michael A. Griffith(2) |
4,688 | 12,618 | 18,747 | 96.17 | 7/2/2025 | — | — | |||||||||||||||||||||
| — | — | — | — | — | 7,996 | 1,511,244 | ||||||||||||||||||||||
| Michael J. McKelvey(2) |
1,718 | 4,625 | 6,872 | 96.17 | 7/2/2025 | — | — | |||||||||||||||||||||
| Rachel A. Stahler(2) |
384 | 1,032 | 1,533 | 96.17 | 7/2/2025 | — | — | |||||||||||||||||||||
| 520 | 1,400 | 2,080 | 96.17 | 9/24/2025 | — | — | ||||||||||||||||||||||
| (1) | Options to purchase common stock, with the exception of the options granted to Mr. Bell, vest over 5 years at a rate of 20% per year. The options granted to Mr. Bell vest quarterly over a one-year period at a rate of 25% per quarter. |
116
Table of Contents
| (2) | Options to purchase common stock are subject to performance-based vesting upon the achievement of certain specified performance targets and completion of a service requirement as described in “—Elements of Executive Compensation—Equity-Based Incentive Awards.” |
| (3) | Included are 19,882 restricted stock units issued to Mr. Bell under the terms of his Employment, Non-Compete and Severance Agreement, with grant dates of June 18, 2015 and September 24, 2015. The restricted stock units granted to Mr. Bell vest if THL sells its interest in us for cash and the price realized is at least equal to the greater of: (a) the value of its initial investment or (b) the grant date value of its initial investment. The restricted stock units issued to Mr. Bicknell vest upon a change of control. The restricted stock units issued to Mr. Griffith vest if THL sells its interest in us for cash and the price realized is at least equal to two times the value of their investment. |
| (4) | Valued based on the methodology employed by us for purposes of preparing our annual financial statements in accordance with ASC 718, without taking into account any projected forfeitures of service-based awards. For a further discussion of this methodology, see Note 13 to our consolidated financial statements included elsewhere in this prospectus. |
Option Exercises and Stock Vested
None of our named executive officers exercised any stock options in 2015 and no restricted stock units held by our named executive officers vested in 2015.
Nonqualified Deferred Compensation and Pension Benefits
Dr. McKelvey was our only named executive officer who participated in our non-qualified deferred compensation plan in 2015. Dr. McKelvey contributed $6,058 to our deferred compensation plan in 2015. We did not make any contributions to Dr. McKelvey’s deferred compensation account and he did not make any withdrawals or take any distributions during the period. He had a loss of $82 for the year, resulting in a balance of $5,975. Our deferred compensation plan provides eligible management and other highly compensated employees with the opportunity to defer, on a pre-tax basis, their salary, bonus, and other specified cash compensation and to receive the deferred amounts, together with a deemed investment return (positive or negative), either at a pre-determined time in the future or upon termination of employment with us.
Potential Payments Upon Termination or Change in Control
The following table describes and quantifies the estimated potential payments and benefits that would become payable under the employment agreement for Mr. Bell and the Severance and Non-Competition Agreements between us and each of Messrs. Bicknell and Griffith, Dr. McKelvey and Ms. Stahler if such executive’s employment were terminated on December 31, 2015 by us without cause or, with respect to Messrs. Bicknell and Griffith and Dr. McKelvey, if, during the 12 months following a change in control, the executive’s employment was terminated by us without cause or by the executive for good reason. The disclosed amounts for these executives are estimates only and do not necessarily reflect the actual amounts that would be paid to the executives.
| Name |
Cash Severance ($)(b)(1) |
Other Benefits ($)(c)(2) |
Total-Termination Without Cause ($) (d)=(b)+(c) |
Target –Bonus ($)(e) (3) |
Total–Termination Without Cause/ Resignation for Good Reason During Change in Control Period ($) (f)=(d)+(e) |
|||||||||||||||
| Michael A. Bell |
1,250,000 | 10,006 | 1,260,006 | 625,000 | 1,885,006 | |||||||||||||||
| Jonathan E. Bicknell |
410,000 | 3,231 | 413,231 | 205,000 | 618,231 | |||||||||||||||
| Michael A. Griffith |
525,000 | 10,205 | 535,205 | 525,000 | 1,060,205 | |||||||||||||||
| Michael J. McKelvey |
1,275,000 | 10,263 | 1,285,263 | 525,000 | 1,810,263 | |||||||||||||||
| Rachel A. Stahler |
400,000 | — | 400,000 | 200,000 | 600,000 | |||||||||||||||
| (1) | For Mr. Bell, the amount set forth in column (b) represents his contractually committed severance pay set forth in his employment agreement. For Messrs. Bicknell and Griffith, Dr. McKelvey and Ms. Stahler, the amount set forth in column (b) represents severance pay equal to 12 months’ pay in the event of termination by us without cause, as provided by the Severance and Non-Competition Agreement between us and each such named executive officer. Under these agreements, each of the named executive officers would be entitled to a pro rata bonus as of the date of termination, as determined by and in accordance with our then current bonus program. Additionally, the amount set forth in column (b) for Dr. McKelvey represents payment of an additional $750,000 bonus which would be due to him pursuant to the terms of his offer letter. See “—Elements of Executive Compensation—Executive Employment and Separation Agreements.” |
117
Table of Contents
| (2) | The amount set forth in column (c) represents the estimated cost of the excess of full monthly premiums for continued health and welfare plan coverage over active employee cost for a 12 month period, as provided by the relevant employment or severance agreement between us and each such named executive officer. |
| (3) | Represents an amount equal to one hundred percent (100%) of such executive’s annual cash incentive bonus payment at target that is payable under the Severance and Non-Competition Agreement between such executive and us in the event of a termination by us without cause or by the executive for good reason within 12 months of the change in control. |
If a change in control had occurred as of December 31, 2015, the only additional benefit payable to any of our executive officers would have been the vesting of 35% of the 2015 Incentive Options and restricted stock units held by Mr. Bell in the amounts set forth in opposite the named executive officer’s name in the table under “—Outstanding Equity Awards at Fiscal Year-End.”
Compensation Policies and Practices as They Relate to Risk Management
In accordance with the applicable disclosure requirements, to the extent that risks may arise from our compensation policies and practices that are reasonably likely to have a material adverse effect on us, we are required to discuss those policies and practices for compensating our employees (including employees that are not named executive officers) as they relate to our risk management practices and the possibility of incentivizing risk-taking. The Compensation Committee has evaluated the policies and practices of compensating our employees in light of the relevant factors, including the following:
| • | the allocation of compensation between cash and equity awards and the focus on stock-based compensation, including stock awards generally vesting upon a transaction resulting in the realization of a certain rate of return, thereby mitigating against short-term risk taking; and |
| • | the financial performance targets of our annual bonus program are the budgeted objectives that are reviewed and approved by our Board and/or the Compensation Committee. |
Based on such evaluation, the Compensation Committee has determined that our policies and practices are not reasonably likely to have a material adverse effect on us.
Director Compensation
During 2015, certain of our directors received cash compensation in connection with their services as a director. Certain directors were also granted stock options in connection with their services as a director. The following table sets forth certain information with respect to cash compensation paid to our directors and stock options granted to our directors in 2015 in connection with their 2015 service. Neither Mr. Bell nor Mr. McMullen received any additional compensation in connection with his service as a director. Mr. Meister served on our Board for 2015, but resigned from our Board on March 28, 2016.
| Name |
Fees Earned or Paid in Cash ($) |
Option Awards ($) (1) |
Total ($) |
|||||||||
| Todd M. Abbrecht |
— | — | — | |||||||||
| Laura A. Grattan |
— | — | — | |||||||||
| Paul M. Meister(2) |
70,000 | 1,411,044 | 1,481,044 | |||||||||
| Joshua M. Nelson |
— | — | — | |||||||||
| Charles J. Shea |
75,000 | 32,100 | 107,100 | |||||||||
| R. Blane Walter |
50,000 | — | 50,000 | |||||||||
| (1) | Valued based on the methodology employed by us for purposes of preparing our annual financial statements in accordance with ASC 718, without taking into account any projected forfeitures of service-based awards. For a further discussion of this methodology, see Note 13 to our consolidated financial statements included elsewhere in this prospectus. |
| (2) | Awards issued directly to Mr. Meister in connection with the cancellation of awards previously granted to Liberty Lane IH LLC (“Liberty Lane”). |
118
Table of Contents
Except as described below, none of our directors received any fees earned or paid in cash, stock awards, or option awards for their services to us for the year ended December 31, 2015. However, as described in more detail under “Certain Relationships and Related Party Transactions—Management Services Agreements,” we entered into management agreements with Liberty Lane, of which Mr. Meister is executive officer, and with THL, of which Messrs. Abbrecht and Nelson are managing directors, Mr. Shea is an operating advisor and Ms. Grattan is director. The management agreement with Liberty Lane was terminated as of September 24, 2014.
We and Jeffrey P. McMullen are parties to an employment agreement, dated as of May 23, 2012 and as amended as of November 30, 2012 and as of May 23, 2014, pursuant to which Mr. McMullen serves as our Vice Chairman. Under the initial two-year term of the agreement, Mr. McMullen received an annual base salary of $779,000 and was eligible for an annual bonus of 75% of base salary based on achievement of his objectives. Effective May 23, 2014, the agreement was amended to extend the term until May 23, 2016 and Mr. McMullen’s annual base salary was set at $450,000 for the additional two-year term. Under the amended agreement, Mr. McMullen received other income of $65,452 in 2015 and received a grant of 24,000 options, half of which will vest over a three-year period and half of which vest if we achieve certain performance targets over the three-year period. 8,000 of Mr. McMullen’s options are currently vested with a strike price of $104.
We and R. Blane Walter are party to a non-statutory stock option agreement dated as of December 19, 2013. Under the option agreement, Mr. Walter was granted an option to purchase 18,000 shares of our common stock at an exercise price of $104 per share in consideration of Mr. Walter’s advisory services to our Communications Division. One third of the shares underlying the option vested on each of December 19, 2013, September 1, 2014 and September 1, 2015.
We and Charles J. Shea are party to a letter agreement dated as of March 3, 2015. Mr. Shea is entitled to annual director’s fees of $75,000 and was granted an option to purchase 630 shares of our common stock at an exercise price of $89 per share in 2014 as consideration for his services as a member of our Board.
We and Paul M. Meister are party to a letter agreement with an effective date of September 24, 2014. Prior to his resignation on March 28, 2016, Mr. Meister was entitled to annual director’s fees of $70,000 and was granted an option to purchase 38,054 shares of our common stock with a weighted average exercise price of $114 per share. A total of 32,980 of these options vest in full if THL realizes cash proceeds of at least 3.25 times its initial investment and an additional 5,074 of these options vest if THL realizes cash proceeds of at least five times its initial investment.
Equity Incentive Plans
Our Board adopted, and our stockholders approved, the 2010 Plan in August 2010. Our Board adopted amendments to the 2010 Plan in April 2012 and in March 2014. In connection with this offering, we intend to adopt the 2016 Plan for equity grants in connection with and following the consummation of this offering. We intend to file a registration statement on Form S-8 covering the shares issuable under the 2010 Plan and the 2016 Plan. The following is a summary of certain features of the existing 2010 Plan and the 2016 Plan.
2010 Plan
The 2010 Plan authorizes stock options and other stock awards for the purchase of common stock. The awards offered under this plan include options that vest based upon the passage of time and the employees’ successful completion of a service requirement, option awards that vest upon certain performance targets being met in addition to the completion of a service requirement, option awards and that vest if a liquidity event occurs such that THL and its related investment funds that hold shares in us achieve a defined return on their investment and restricted stock units and option awards that vest following a change in control.
119
Table of Contents
No awards will be granted under the 2010 Plan following the offering. The number of shares available for grants or subject to outstanding awards shall be proportionally adjusted in the event of any corporate event or transaction affecting our capital structure.
The Board may amend, alter, suspend, discontinue or terminate the 2010 Plan or any award under the 2010 Plan at any time, provided such action will not adversely affect the rights granted to any participant under any outstanding award without the participant’s consent.
2016 Plan
In connection with this offering, our Board expects to adopt, and our stockholders expect to approve, the 2016 Plan prior to the completion of this offering. The 2016 Plan will authorize us to grant options or other awards to our employees, directors and consultants.
120
Table of Contents
The following table shows information regarding the beneficial ownership of our common stock (i) immediately following the -for- stock split of our common stock that will occur prior to the consummation of this offering, and (ii) as adjusted to give effect to this offering, by:
| • | each person whom we know to own beneficially more than 5% of our common stock; |
| • | each of our directors, nominees for director, and named executive officers individually; and |
| • | all directors and executive officers as a group. |
Beneficial ownership of shares is determined under rules of the SEC and generally includes any shares over which a person exercises sole or shared voting or investment power. Except as indicated by footnote, and subject to community property laws where applicable, we believe based on the information provided to us that the persons and entities named in the table below have sole voting and investment power with respect to all shares of our common stock shown as beneficially owned by them. Percentage of beneficial ownership is based on shares of common stock outstanding as of , 2016 after giving effect to the -for- stock split of our common stock that will occur prior to the consummation of this offering, and shares of common stock outstanding after giving effect to this offering, assuming no exercise of the underwriters’ option to purchase additional shares, or shares of common stock, assuming the underwriters exercise their option to purchase additional shares in full. The table does not reflect any shares of our common stock that may be purchased in this offering. Unless otherwise indicated, the address for each holder listed below is inVentiv Group Holdings, Inc., 1 Van De Graaff Drive, Burlington, Massachusetts 01803.
| Shares of common stock beneficially owned before this offering |
Shares of common stock beneficially owned after this offering (assuming no exercise of the option to purchase additional shares) |
Shares of common stock beneficially owned after this offering (assuming full exercise of the option to purchase additional shares)) | ||||||||||
| Name and address of beneficial owner 5% stockholders: |
Number of shares |
Percentage of shares (%) |
Number of shares |
Percentage of shares (%) |
Number of shares |
Percentage of shares (%) | ||||||
| Funds affiliated with Thomas H. Lee Partners, L.P(1). |
||||||||||||
| Named executive officers and directors: |
||||||||||||
| Michael A. Bell |
||||||||||||
| Jonathan E. Bicknell |
||||||||||||
| Michael A. Griffith |
||||||||||||
| R. Blane Walter |
||||||||||||
| Michael J. McKelvey |
||||||||||||
| Jeffrey P. McMullen |
||||||||||||
| Todd M. Abbrecht(2) |
||||||||||||
| Joshua M. Nelson(2) |
||||||||||||
| Charles J. Shea |
||||||||||||
| Rachel A. Stahler |
||||||||||||
| Laura A. Grattan(2) |
||||||||||||
| All directors and executive officers as a group (11 persons) |
||||||||||||
| * | Represents beneficial ownership of less than 1% |
| (1) | Shares shown as beneficially owned by investment funds affiliated with Thomas H. Lee Partners, L.P. reflect an aggregate of the following record ownership: (i) shares held by Thomas H. Lee Equity Fund VI, L.P.; (ii) shares held by Thomas H. Lee Parallel Fund VI, L.P.; (iii) shares held by Thomas H. Lee Parallel (DT) Fund VI, L.P.; (iv) shares held by THL Equity Fund VI Investors (inVentiv), LLC; (v) shares held by THL Coinvestment Partners, L.P., (vi) shares held by THL Operating Partners, L.P.; (collectively, the “THL Funds”); (vii) shares held by Great-West Investors, L.P. (the “Great-West Fund”); and (viii) shares |
121
Table of Contents
| held by Putnam Investments Employees’ Securities Company III LLC (the “Putnam Fund”). THL Holdco, LLC is the managing member of Thomas H. Lee Advisors, LLC, which is the general partner of Thomas H. Lee Partners, L.P., which is the sole member of THL Equity Advisors VI, LLC, which is the general partner of Thomas H. Lee Equity Fund VI, L.P., Thomas H. Lee Parallel Fund VI, L.P. and Thomas H. Lee Parallel (DT) Fund VI, L.P. and the manager of THL Equity Fund VI Investors (inVentiv), LLC. Thomas H. Lee Partners, L.P. is the general partner of THL Coinvestment Partners, L.P. and THL Operating Partners, L.P. The Great-West Fund and the Putnam Fund are co-investment entities of the THL Funds, and are contractually obligated to co-invest (and dispose of securities) alongside certain of the THL Funds on a pro rata basis. Voting and investment determinations with respect to the shares held by the THL Funds are made by the private equity management committee of THL Holdco, LLC. (the “THL Committee”) consisting of Todd M. Abbrecht, Anthony J. DiNovi, Thomas M. Hagerty, Seth W. Lawry, Soren L. Oberg, Scott M. Sperling and Kent R. Weldon and as such each member of the THL Committee may be deemed to share beneficial ownership of the shares held or controlled by the THL Funds. Each of member of the THL Committee disclaims beneficial ownership of such securities except to the extent of their pecuniary interest therein. In addition to the stock owned directly and of record by the Great-West Fund, the Great-West Fund may be deemed to share dispositive and voting power over, and thus beneficially own, an additional shares of our common stock. The Great-West Fund disclaims beneficial ownership of such shares. Putnam Investment Holdings, LLC (“Holdings”) is the managing member of the Putnam Fund. Holdings disclaims any beneficial ownership of any shares held by the Putnam Fund. Putnam Investments LLC, the managing member of Holdings, disclaims beneficial ownership of any shares held by the Putnam Fund. The address of each of the THL Funds and each member of the THL Committee is c/o Thomas H. Lee Partners, L.P., 100 Federal Street, Boston, MA 02110. The address of the Great-West Fund is 8515 East Orchard Road, Greenwood Village, CO 80111. The address of the Putnam Fund is c/o Putnam Investment, Inc., 1 Post Office Square, Boston, MA 02109. |
| (2) | Mr. Abbrecht and Mr. Nelson are managing directors of THL and Ms. Grattan is a director of THL. Mr. Abbrecht, Mr. Nelson and Ms. Grattan each disclaim beneficial ownership of the securities held or controlled by the THL Funds, except to the extent of their respective pecuniary interest therein. Their addresses are c/o Thomas H. Lee Partners, L.P., 100 Federal Street, Boston, MA 02110. |
122
Table of Contents
CERTAIN RELATIONSHIPS AND RELATED PARTY TRANSACTIONS
Management Services Agreements
On August 4, 2010 we entered into management agreements with the THL Managers and entities affiliated with Liberty Lane (the “Liberty Lane Managers,” and, together with the THL Managers, the “Managers”) pursuant to which such entities agreed to provide management, advisory and consulting services to us and/or one or more of our parent or subsidiary entities until the tenth anniversary of the consummation of our acquisition through a take-private transaction by affiliates or co-investors of THL and Liberty Lane in August of 2010 (the “THL Acquisition”) with evergreen one-year extensions thereafter.
Pursuant to the THL Management Agreement, the THL Managers received a transaction fee equal to $14.25 million for the services rendered by such entities related to the THL Acquisition upon entering into the agreement, and reimbursement for out-of-pocket expenses, including travel-related costs, incurred by the THL Managers in connection with the THL Management Agreement and the THL Acquisition. They also receive an annual monitoring fee equal to the greater of $2.5 million or 1.5% of EBITDA as compensation for the services rendered. For the year ended December 31, 2015, the THL Managers received an aggregate of $3.3 million in fees and expenses.
The Liberty Lane Managers received a transaction fee equal to $750,000 for the services rendered by such entities related to the THL Acquisition upon entering into the agreement and reimbursement for out-of-pocket expenses incurred by the Liberty Lane Managers in connection with the agreement and the THL Acquisition. They also received an annual monitoring fee equal to $1.0 million as compensation for the services rendered. In December 2012, the Liberty Lane management agreement was amended to reduce the annual monitoring fee to $0.8 million, effective January 1, 2013, as a portion of the compensation paid by us for Mr. Meister’s services as our Chief Executive Officer has been paid directly by us to Mr. Meister since January 1, 2013. In addition, we granted equity incentive awards to or for the benefit of the Liberty Lane Managers and/or affiliates, members or employees of the Liberty Lane Managers after the consummation of the THL Acquisition and in November 2012. The Liberty Lane management agreement and equity incentive awards were terminated as of September 24, 2014 in connection with Mr. Meister’s resignation as Chief Executive Officer.
The THL Management Agreement includes customary exculpation and indemnification provisions in favor of the THL Managers and their affiliates. The THL Managers may terminate the THL Management Agreement at any time. The THL Management Agreement will terminate automatically upon an initial public offering or a change of control. Upon termination due to an initial public offering or a change of control, the THL Managers will be entitled to a termination fee based on the net present value of their annual fee due during the remaining period from the date of termination to the then applicable scheduled date of termination of the THL Management Agreement. We currently estimate that the termination fee due to the THL Managers as a result of termination of the THL Management Agreement in connection with this offering will be approximately $ million. However, our estimate of the termination payment is based on a number of current assumptions, and we can provide no assurance that the actual amount of the termination payment will not differ materially from our estimate.
Registration and Participation Rights Agreement
On August 4, 2010, we and certain of our subsidiaries entered into a registration and participation rights agreement (the “Registration Rights Agreement”) with certain entities affiliated with THL, R. Blane Walter and a trust affiliated with Mr. Walter, certain entities affiliated with Liberty Lane, and RGIP, LLC (collectively, the “Investors”), which provides for the rights described below.
Registration Rights
Under the Registration Rights Agreement, if any THL entity party to the Registration Rights Agreement (the “THL Funds”), together with its affiliates, holds more than 5% of the shares of our common stock collectively
123
Table of Contents
held by the Investors, such entity may request by written notice that we effect the registration under the Securities Act of all or a portion of our equity securities held or acquired by them, provided that the value of such equity securities they propose to sell is greater than $10,000,000 or such lower amount as may be agreed by our Board. We will register under the Securities Act shares held by such entities as well as any other Investors electing to participate in such offering pursuant to the piggy-back registration rights described below. We are not obligated to take any action to effect registration pursuant to these demand registration rights (i) during the effectiveness of any lock-up agreement entered into in connection with an offering of securities for our own account (including this offering), or (ii) if a registration statement requested pursuant to the demand registration rights became effective within 90 days prior to the demand.
The THL Funds also have the benefit of certain shelf registration rights that allow them to request by written notice that we effect an underwritten offering at any time during which we have an effective shelf registration statement with respect to such holders share of our equity securities, provided that the value of such equity securities they propose to sell is at least $20,000,000 or such lower amount as may be agreed by our Board. We are not obligated to take any action to effect any underwritten offering pursuant to these provisions if such an offering was consummated within 90 days prior to the request.
In addition, the Registration Rights Agreement provides that if we register any of our equity securities either for our own account or for the account of other security holders (including pursuant to the registration rights described above), the Investors and certain of their transferees are entitled to notice of the registration and may include their equity securities in the registration, subject to certain restrictions. We have no obligation to register equity securities pursuant to the registration rights described in this paragraph with respect to this offering, any public offering relating to employee benefit plans or dividend reinvestment plans, or any public offering relating to the acquisition or merger by us or any of our subsidiaries of or with any other business (except to the extent such public offering is for the sale of securities for cash).
The number of equity securities that are included in any underwritten offering pursuant to these provisions may be limited by the underwriters on a pro rata basis based on marketing factors, and may be reduced to zero. In addition, our obligation to register any equity securities and take other actions pursuant to the Registration Rights Agreement is subject to certain exceptions and limitations.
Pursuant to the Registration Rights Agreement, all fees, costs, and expenses in connection with the registration of our equity securities pursuant to these provisions will be borne by us, other than underwriting discounts and selling commissions, which will be borne by each stockholder selling its shares.
Participation Rights
The Registration Rights Agreement provides for certain participation rights in the event that we issue or sell any shares our capital stock or any securities convertible into or exchangeable for any shares of our capital stock, or grant any options or warrants for the purchase of any shares of our capital stock or such securities, or enter into any agreements providing for the issuance of any shares of our capital stock or such securities, in each case to any Investor. These provisions will terminate upon the completion of this offering.
Stockholders’ Agreement
On August 4, 2010, we and certain of our subsidiaries entered into a stockholders’ agreement (the “Stockholders’ Agreement”) with the Investors.
The Stockholders Agreement prohibits transfers of any shares of our common stock held by the Investors, subject to certain exceptions which include transfers to certain affiliates, transfers among the Investors or to us, transfers to partners, members, managers, stockholders of the Investors of affiliates thereof, transfers to any director, officer or employee of ours, transfers to any consultant or adviser to us. In addition, following
124
Table of Contents
completion of this offering, transfers will be permitted in any public offering, pursuant to Rule 144 under the Securities Act, or in a registered offering in accordance with the terms of any registration rights agreement to which we are a party. These provisions will terminate on the six month anniversary of the closing of this offering.
In addition, the Stockholders’ Agreement provides for a voting agreement among the Investors, certain tag-along and drag-along rights, and certain options to purchase shares. These provisions will terminate upon the completion of this offering.
Tax Receivables Agreement
Following this offering, in determining our income tax liability we expect to be able to utilize the Pre-IPO Tax Assets, which arose or are related to periods prior to this offering. These Pre-IPO Tax Assets will reduce the amount of tax that we and our subsidiaries would otherwise be required to pay in the future. See “Risk Factors—Risks Related to Our Structure—We will be required to pay our Existing Stockholders 85% of certain tax benefits related to Pre-IPO Tax Assets, which could amount to substantial cash payments in which the investors purchasing shares in this offering would not participate.”
Prior to the completion of this offering, we plan to enter into the TRA, which generally obligates us to pay to our Existing Stockholders 85% of the amount of income tax savings, if any, that we and our subsidiaries realize (or are deemed to realize in the case of a change of control or certain other transactions or events, as discussed below) as a result of the utilization of our and our subsidiaries’ Pre-IPO Tax Assets. In addition, we will pay interest on the payments we will make to the Existing Stockholders with respect to this amount of savings from the due date (without extensions) of our tax return until payment is actually made. Different timing rules will apply to payments under the TRA to be made to relevant pre-offering equity award holders (“Award Holders”). Such payments will generally be deemed invested by us into a notional account rather than made to Award Holders on the scheduled payment dates, and the account will be distributed during the calendar year which includes the anniversary of the execution of the TRA, together with an amount equal to the net present value of such Award Holder’s future expected payments, if any, under the TRA.
For purposes of the TRA, savings in our income tax are computed by reference to the reduction in our liability for income taxes resulting from the utilization of the tax benefits subject to the TRA. The term of the TRA will commence upon consummation of this offering and will continue until there is no potential for any future tax benefit payments.
In the event we make payments under the TRA in respect of realized tax benefits and those tax benefits are subsequently revised, the counterparties under the TRA are not obligated to reimburse us for any such payments (although future payments otherwise owing by us would be adjusted to the extent possible to reflect the result of such disallowance). As a result, in certain circumstances, payments could be made under the TRA in excess of our actual tax savings.
While the actual amount and timing of any payments under the TRA will vary depending upon a number of factors, including the amount and timing of the taxable income we and our subsidiaries generate in the future, and our and our subsidiaries’ use of Pre-IPO Tax Assets, we expect that, during the term of the TRA, the payments that we may make could be material. Based on current tax laws and assuming that we and our subsidiaries earn sufficient taxable income to realize the full tax benefits subject to the TRA, we expect that payments under the TRA relating to the Pre-IPO Tax Assets could aggregate to approximately $ million to $ million. We plan to use cash flow from operations and availability under our ABL Facility to fund this obligation.
If we undergo a change of control, all our obligations under the TRA would be accelerated and we would be required to make a payment approximating the present value of future payments under the TRA, which payment
125
Table of Contents
would be based on specified assumptions, including those relating to our and our subsidiaries’ future taxable income. Additionally, if we sell or otherwise dispose of any of our subsidiaries in a transaction that is not a change of control for purposes of the TRA, we would be required to make a payment approximating the present value of future payments under the TRA attributable to the Pre-IPO Tax Assets of such subsidiary that is sold or disposed of, applying the assumptions described above.
The TRA provides that in the event that we elect to terminate the TRA prior to our utilization of all of the Pre-IPO Tax Assets or materially breach any of our material obligations under it, whether, in the case of a breach, as a result of our failure to make any payment when due (subject to a three-month cure period), failure to honor any other material obligation under it or by operation of law as a result of the rejection of it in a case commenced under the United States Bankruptcy Code or otherwise, then all our payment and other obligations under the TRA would be accelerated and would become due and payable applying the same assumptions described above. Such payments could be substantial and could exceed our actual tax savings.
Certain transactions by us could cause us to recognize taxable income (possibly material amounts of income) without a current receipt of cash. Payments under the TRA with respect to such taxable income would cause a net reduction in our available cash. For example, transactions giving rise to cancellation of debt income or “Subpart F” income would each produce income with no corresponding increase in cash. In these cases, we may use some of the Pre-IPO Tax Assets to offset income from these transactions and, under the TRA, would be required to make a payment to our Existing Stockholders even though we receive no cash from such income.
Because we are a holding company with no operations of our own, our ability to make payments under the TRA is dependent on the ability of our subsidiaries to make distributions to us. To the extent that a liability accrues under the TRA but we are unable to make a payment thereof, such payments will be deferred and accrue interest at a rate that is equal to the highest prime rate of interest quoted from time to time by The Wall Street Journal, U.S. Edition, as the “base rate” on corporate loans at large money center commercial banks in effect on such day, plus 2% per annum.
The TRA will be filed as an exhibit to the registration statement of which this prospectus forms a part, and the foregoing description of the TRA is qualified by a reference thereto.
Commercial Transactions
There were four entities during the years ending December 31, 2015, 2014 and 2013 in which THL or its affiliates held a 10% or greater interest that provided services exceeding $120,000 in value to us. The services provided to us for the years ending December 31, 2015, 2014 and 2013 were facilities management, audio conferencing and information technology services. The aggregate fees for these services were $4.3 million, $5.3 million and $4.0 million for the years ending December 31, 2015, 2014 and 2013, respectively.
One of our directors, R. Blane Walter, acquired a 10% or greater interest in, and became a director of, an entity in 2013 which provided relationship enterprise technology solutions to us exceeding $120,000 in value over the prior twelve month period. The services were provided for fees of $1.8 million, $1.8 million and $0.3 million for the year ending December 31, 2015, 2014 and 2013, respectively. Mr. Walter has also invested as a limited partner in THL Executive Fund VII, the general partner of which is an affiliate of THL.
Debt Instruments
On August 12, 2014, affiliates of THL, Liberty Lane and Blane Walter purchased $25.0 million of our Junior Lien Secured Notes and $26.3 million of our Senior Unsecured Notes for a total consideration of $50.0 million as described in Note 9 to our consolidated financial statements included elsewhere in this prospectus.
126
Table of Contents
Indemnification of Directors and Officers; Directors’ and Officers’ Insurance
Our current directors and officers are entitled to continued indemnification and insurance coverage. See “Management—Indemnification of Officers and Directors.”
Review, Approval or Ratification of Transactions with Related Persons
Our Board has adopted a written policy regarding the approval of related person transactions, with escalating approval thresholds for management and our Board. Transactions required to be disclosed pursuant to Item 404(a) of Regulation S-K adopted by the SEC are reviewed pursuant to this policy. In reviewing proposed related person transactions, we consider all relevant facts and circumstances, including without limitation the commercial reasonableness of the terms, the benefit and perceived benefit, or lack thereof, to us, opportunity costs of alternate transactions, the materiality and character of the related person’s direct or indirect interest, and the actual or apparent conflict of interest of the related person.
127
Table of Contents
The following is a description of (i) the material terms of our amended and restated certificate of incorporation and amended and restated bylaws as we expect them to be in effect following the consummation of this offering and the related -for- stock split of our common stock that will occur prior to the consummation of this offering and (ii) certain applicable provisions of Delaware law. We refer you to our amended and restated certificate of incorporation and amended and restated bylaws, copies of which are filed as exhibits to the registration statement of which this prospectus is a part.
Authorized Capitalization
Following this offering, our authorized capital stock will consist of shares of common stock, par value $0.01 per share and shares of preferred stock, par value $ per share. Following the consummation of this offering, shares of common stock and shares of preferred stock shall be issued and outstanding. As of December 31, 2015, there were 37 holders of our common stock.
Common Stock
Voting Rights
The holders of common stock are entitled to one vote per share on all matters to be voted upon by the stockholders.
Dividend Rights
Subject to preferences that may be applicable to any outstanding preferred stock, the holders of shares of our common stock are entitled to receive ratably such dividends, if any, as may be declared from time to time by our Board out of funds legally available therefor. See “Dividend Policy.”
Rights upon Liquidation
In the event of any voluntary or involuntary liquidation, dissolution or winding up of our affairs, the holders of common stock are entitled to share ratably in all assets remaining after payment of our debts and other liabilities, subject to prior distribution rights of preferred stock, then outstanding, if any.
Other Rights
The holders of our common stock have no preemptive or conversion rights or other subscription rights. There are no redemption or sinking fund provisions applicable to our common stock. The rights, preferences and privileges of holders of our common stock will be subject to those of the holders of any shares of our preferred stock we may issue in the future.
Registration Rights
Certain of our existing stockholders have registration rights with respect to our common stock pursuant to the Registration Rights Agreement. See “Certain Relationships and Related Party Transactions—Registration and Participation Rights Agreement.”
Preferred Stock
Our Board has the authority to issue shares of preferred stock in one or more series and to fix the rights, preferences and limitations thereof, including dividend rights, specification of par value, conversion rights, voting rights, terms of redemption, liquidation preferences and the number of shares constituting any series or the designation of such series, without further vote or action by the stockholders.
128
Table of Contents
The issuance of preferred stock may have the effect of delaying, deferring or preventing a change of control of us without further action by the stockholders and may adversely affect the voting and other rights of the holders of common stock. At present, we have no shares of preferred stock issued and outstanding and we have no plans to issue any preferred stock.
Election and Removal of Directors; Vacancies
Our amended and restated certificate of incorporation will provide that our Board will consist of between and directors. The exact number of directors will be fixed from time to time by a majority of our Board. Each director will be elected for a three-year term. There will be no limit on the number of terms a director may serve on our Board.
Anti-Takeover Effects of Provisions of Our Charter, Our Bylaws and Delaware Law
Certain provisions of our amended and restated certificate of incorporation and amended and restated bylaws that will be in effect upon completion of this offering, as summarized below, and applicable provisions of the DGCL may make it more difficult for or prevent a third party from acquiring control of us or changing our Board and management. These provisions may have the effect of deterring hostile takeovers or delaying changes in our control or in our management. These provisions are intended to enhance the likelihood of continued stability in the composition of our Board and in the policies furnished by them and to discourage certain types of transactions that may involve an actual or threatened change in our control. These provisions are designed to reduce our vulnerability to an unsolicited acquisition proposal, and to encourage persons seeking to acquire control of us to first negotiate with our Board, which we believe may result in an improvement of the terms of any such acquisition in favor of our stockholders. The provisions also are intended to discourage certain tactics that may be used in proxy fights. However, these provisions could have the effect of discouraging others from making tender offers for our shares and they also give our Board the power to discourage acquisitions that some stockholders may favor. As a consequence, they also may inhibit fluctuations in the market price of our shares that could result from actual or rumored takeover attempts. Such provisions may also have the effect of preventing changes in our management.
Special Meetings of Stockholders
Our bylaws provide that a special meeting of stockholders may be called only by the chairman of our Board or by a resolution adopted by a majority of our Board. Stockholders are not permitted to call a special meeting of stockholders, to require that the chairman call such a special meeting, or to require that our Board request the calling of a special meeting of stockholders.
No Stockholder Action by Written Consent
Our amended and restated certificate of incorporation will provide that, for so long as we remain a “controlled company” under the NYSE or NASDAQ rules, stockholder action may be taken only at an annual meeting or special meeting of stockholders and may not be taken by written consent instead of a meeting, unless the action to be taken by written consent of stockholders and the taking of this action by written consent has been expressly approved in advance by our Board. Failure to satisfy any of the requirements for a stockholder meeting could delay, prevent or invalidate stockholder action.
Stockholder Advance Notice Procedure
Our amended and restated bylaws will establish an advance notice procedure for stockholders to make nominations of candidates for election as directors or to bring other business before an annual meeting of our stockholders. The amended and restated bylaws will provide that any stockholder wishing to nominate persons for election as directors at, or bring other business before, an annual meeting must deliver to our secretary advanced written notice of the stockholder’s intention to do so.
129
Table of Contents
Exclusive Forum
Our amended and restated bylaws will provide that unless we consent to the selection of an alternative forum, a state or federal court located within the state of Delaware will, with certain limited exceptions, be the sole and exclusive forum for any stockholder (including any beneficial owner) to bring (i) any derivative action or proceeding brought on our behalf, (ii) any action asserting a claim of breach of a fiduciary duty owed by any of our directors, officers or other employees to us or our stockholders, (iii) any action asserting a claim arising pursuant to any provision of the DGCL or (iv) any action asserting a claim governed by the internal affairs doctrine, in each such case subject to said Delaware court having personal jurisdiction over the indispensable parties named as defendants therein. Any person or entity purchasing or otherwise acquiring or holding any interest in shares of our capital stock shall be deemed to have notice of and consented to the forum provisions in our amended and restated bylaws. However, the enforceability of similar forum provisions in other companies’ certificates of incorporation or bylaws has been challenged in legal proceedings, and it is possible that a court could find these types of provisions to be inapplicable or unenforceable.
Listing
We intend to list our common stock on the NYSE or NASDAQ under the symbol “ .” We have not yet filed an application to have our common stock approved for listing. We intend to file such application following the filing of this registration statement.
Transfer Agent and Registrar
The transfer agent and registrar for our common stock is .
130
Table of Contents
DESCRIPTION OF MATERIAL INDEBTEDNESS
The following description is a summary of the material terms of our material indebtedness. We refer you to credit agreements, security documents and indentures governing our material indebtedness, copies of which are filed as exhibits to the registration statement of which this prospectus is a part.
Senior Secured Credit Facilities
On August 4, 2010, inVentiv Health, as parent borrower, and inVentiv Holdings, Inc. (“inVentiv Holdings”), entered into a credit agreement with Citibank, N.A., as administrative agent, and the other agents and lenders party thereto, providing for senior secured credit facilities (the “Senior Secured Credit Facilities”) initially consisting of a $525.0 million senior secured B1 term loan and a $75.0 million senior secured revolving credit facility (the “Revolving Facility”). On February 11, 2011 in connection with the Campbell Acquisition, we amended the Senior Secured Credit Facilities to borrow an additional $105.0 million. This amendment also provided us with an additional $210.0 million term loan on a delayed draw and increased our Revolving Facility to $100.0 million. We drew the additional $210.0 million on June 4, 2011. On July 13, 2011, we further amended the facility in order to borrow an additional $245.0 million and to increase our Revolving Facility to $130 million.
On December 20, 2012, we amended the terms of the Senior Secured Credit Facilities to allow for the offering of $600 million principal amount of our Senior Secured Notes. The proceeds of the offering were used to repay $488.9 million outstanding under the Senior Secured Credit Facilities B1-2 and B-3 term loans, including the settlement of the 1% per annum principal payment on the B1-2 and B-3 term loans due prior to the final maturity date, and $97.5 million outstanding on the Revolving Facility. We also amended the terms of the Senior Secured Credit Facilities to (a) permit inVentiv Health to enter into an asset-based credit facility of up to $150.0 million as an alternative to the Revolving Facility and (b) eliminate the financial maintenance covenants, except in certain circumstances when the balance on the Revolving Facility exceeds a threshold as described below.
On August 16, 2013, inVentiv Health entered into the ABL Facility (as defined below) which replaced the Revolving Facility under our Senior Secured Credit Facilities. The Revolving Facility matured and the lenders’ commitments under the Revolving Facility terminated on August 16, 2013.
On July 28, 2014, in connection with the Junior Lien Notes Exchange Offer (as defined below), we amended the terms of the Senior Secured Credit Facilities to permit the Junior Lien Notes Exchange Offer, the investment by certain of our affiliates in the Senior Unsecured Notes and the Junior Lien Secured Notes, the issuance of an additional amount of Junior Lien Secured Notes to certain existing holders of our Senior Unsecured Notes and to extend the maturity of the B1-2 loans by replacing the B1-2 loans with a new B-4 term loan maturing on May 15, 2018. All of our outstanding term loans issued pursuant to the Senior Secured Credit Facilities now mature on May 15, 2018.
At December 31, 2015, we had $575.3 million outstanding under our Senior Secured Credit Facilities, which consisted of $129.6 million outstanding under the B-3 term loans and $445.7 million outstanding under the B-4 term loans. We also have the option, subject to certain conditions, to increase the amounts under the term loan facilities in our Senior Secured Credit Facilities by up to $300.0 million.
The material terms of the Senior Secured Credit Facilities are described below.
Interest Rate and Fees
Amounts borrowed under the Senior Secured Credit Facilities are subject to an interest rate per annum equal to an applicable margin plus, at our option, either (a) for base rate loans, a base rate determined by reference to the highest of (i) the prime rate of Citibank, N.A., (ii) 2.5%, or (iii) the one month US Dollar LIBOR rate plus 1.0% or (b) for Eurodollar rate loans, a rate determined by reference to the highest of (i) the US Dollar LIBOR
131
Table of Contents
rate based on the term of the borrowing or (ii) 1.50%. As of December 31, 2015, the applicable margin percentage for the B-3 and B-4 term loans is a percentage per annum equal to 5.25% for base rate loans and 6.25% for Eurodollar rate loans, and the interest rate applicable to B-3 and B-4 terms loans was 7.75%.
Mandatory Repayments
The credit agreement governing our Senior Secured Credit Facilities requires us to prepay outstanding term loans, subject to certain exceptions, with: (1) 100% of the net cash proceeds of any incurrence of debt other than debt permitted under our Senior Secured Credit Facilities, (2) commencing with the fiscal year ended December 31, 2011, 50% (which percentage will be reduced to 25% and 0% if our total leverage ratio is less than a specified ratio) of our annual excess cash flow (as defined in the credit agreement governing our Senior Secured Credit Facilities), and (3) 100% of the net cash proceeds of all non-ordinary course asset sales or other dispositions of property (including casualty events) by inVentiv Health or by any of its restricted subsidiaries, subject to reinvestment rights and certain other exceptions. Mandatory repayments will be applied pro rata across the term loans.
Voluntary Repayments
We may voluntarily prepay outstanding loans under our Senior Secured Credit Facilities at any time without premium or penalty, other than customary “breakage” costs.
Amortization and Final Maturity
The B-3 and B-4 term loans amortize at 1% per annum in equal quarterly installments from July 13, 2011, with the balance payable on May 15, 2018. Quarterly installments of principal on the B-3 and B-4 term loans ceased in connection with the prepayments made in December 2012.
Guarantees and Security
Certain of our direct and indirect wholly-owned domestic subsidiaries are co-borrowers and are jointly and severally liable for all obligations under our Senior Secured Credit Facilities. Such obligations are unconditionally guaranteed by inVentiv Holdings and each of inVentiv Health’s direct and indirect wholly-owned domestic subsidiaries who are not co-borrowers (with certain agreed-upon exceptions).
All obligations under our Senior Secured Credit Facilities, and the guarantees of those obligations, are secured, subject to certain exceptions, by (i) with respect to us, a first priority security interest in inVentiv Health’s capital stock and (ii) substantially all of inVentiv Health’s assets and the assets of its co-borrowers and subsidiary guarantors, including:
| • | a first-priority pledge of 100% of inVentiv Health’s capital stock and certain of the capital stock or equity interests held by it or any subsidiary guarantor (which pledge, in the case of the stock of any foreign subsidiary (each such entity, a “Pledged Foreign Sub”) (with certain agreed-upon exceptions) and the equity interests of certain U.S. subsidiaries that hold capital stock of foreign subsidiaries and are disregarded entities for U.S. federal income tax purposes (each such entity, a “Pledged U.S. DE”) (with certain agreed-upon exceptions), is limited to 65% of the stock or equity interests of such Pledged Foreign Sub or Pledged U.S. DE, as the case may be), in each case excluding any interests in joint ventures to the extent such a pledge would violate the governing documents thereof, and subject to certain other exceptions; and |
| • | a first-priority security interest in, and mortgages on, substantially all other tangible and intangible assets of inVentiv Health, the co-borrowers and each subsidiary guarantor. |
The liens securing our obligations under our Senior Secured Credit Facilities, and the guarantees of those obligations, are on par with the lien granted to the holders of the Senior Secured Notes and subject to a first priority lien on the collateral securing the ABL Facility.
132
Table of Contents
Certain Covenants and Events of Default
Our Senior Secured Credit Facilities contain a number of covenants that, among other things and subject to certain exceptions, restrict the ability of inVentiv Health and its restricted subsidiaries and co-borrowers, and the ability of inVentiv Holdings, to:
| • | incur additional indebtedness, including capital leases; |
| • | pay dividends on our capital stock or redeem, repurchase or retire our capital stock or other indebtedness; |
| • | make investments, loans, advances and acquisitions; |
| • | create restrictions on the payment of dividends or other amounts to us from our restricted subsidiaries; |
| • | engage in transactions with our affiliates; |
| • | sell assets, including the capital stock of our subsidiaries; |
| • | consolidate or merge; and |
| • | create liens. |
The credit agreement governing our Senior Secured Credit Facilities also contains certain events of default, including payment defaults, failure to perform or observe covenants, cross-defaults with certain other events of default in connection with our other indebtedness, a change of control, or certain bankruptcy events, among others.
ABL Facility
On August 16, 2013, inVentiv Health, as parent borrower, and inVentiv Holdings entered into a credit agreement with Citibank, N.A., as administrative agent, and the other agents and lenders party thereto, for an asset-based revolving credit facility (“ABL Facility”) which allows us to draw up to $150.0 million, subject to borrowing base availability, and matures on August 16, 2018. Up to $35.0 million of the ABL Facility is available for the issuance of letters of credit. The ABL Facility replaced the Revolving Facility under our Senior Secured Credit Facilities.
On July 28, 2014, in connection with the Junior Lien Notes Exchange Offer, we amended the terms of our ABL Facility to permit the Junior Lien Notes Exchange Offer, the investment by certain of our affiliates in the Senior Unsecured Notes and the Junior Lien Secured Notes, and the issuance of an additional amount of Junior Lien Secured Notes to certain existing holders of our Senior Unsecured Notes.
Amounts borrowed under the ABL Facility are subject to interest at a rate per annum equal to an applicable margin plus, at our option, either (a) for a base rate loan, a base rate determined by reference to the highest of (i) the Federal Funds Rate plus 0.5%, (ii) the prime rate of Citibank, N.A., or (iii) the one month US Dollar LIBOR rate plus 1.0% or (b) for a Eurodollar rate loan, the US Dollar LIBOR rate based on the interest period. The applicable margin percentage for asset-based revolving loans is a percentage per annum and ranges from 1.0% to 1.5% for base rate loans or 2.0% to 2.5% for the Eurodollar rate loans. The applicable margin percentages with respect to borrowings under the ABL Facility is subject to adjustments based on historical excess availability as defined in the credit agreement for the ABL Facility. As of December 31, 2015, the interest rate applicable to borrowings under the ABL Facility was 4.25%. We are also required to pay an unused line fee to the lenders under the ABL Facility on the committed but unutilized balance of the ABL Facility at a rate of 0.25% or 0.375% per annum, which varies depending on utilization.
The ABL Facility contains customary covenants and restrictions on the activities of inVentiv Health and its restricted subsidiaries and co-borrowers, and the activities of inVentiv Holdings, including limitations on the incurrence of additional indebtedness, use of cash, issuances of dividends, repurchases of capital stock,
133
Table of Contents
investments, loans, asset sales, distributions and acquisitions, ability to enter into certain transactions with affiliates and ability to create liens, among others. The ABL Facility requires inVentiv Health to maintain a fixed-charge coverage ratio of at least 1.0 to 1.0, and restricts the ability of loan parties to use cash in certain circumstances if the available borrowing capacity is less than the greater of (i) 10% of the maximum amount that can be borrowed under the ABL Facility, based on the borrowing base at such time, and (ii) $12.0 million. As of December 31, 2015, the requirement to maintain a minimum fixed charge coverage ratio was not in effect given our available borrowing capacity.
Certain of our direct and indirect wholly-owned domestic subsidiaries are co-borrowers and are jointly and severally liable for all obligations under the ABL Facility. Such obligations are also unconditionally guaranteed by inVentiv Holdings and each of inVentiv Health’s direct and indirect wholly-owned domestic subsidiaries (with certain agreed-upon exceptions). All obligations under the ABL Facility are secured by a first priority lien on all current assets of inVentiv Health and such domestic subsidiaries and by a second priority lien on all other assets of inVentiv Health and such domestic subsidiaries. The credit agreement governing the ABL Facility also contains certain events of default, including payment defaults, failure to perform or observe covenants, cross-defaults with certain other events of default in connection with our other indebtedness, a change of control, or certain bankruptcy events, among others.
The available borrowing capacity under the ABL Facility varies monthly according to the levels of our eligible accounts receivable and unbilled receivables. As of December 31, 2015, we had no outstanding borrowings under the ABL Facility and approximately $18.8 million in letters of credit outstanding against the ABL Facility, and would have been able to borrow up to an additional $131.2 million.
International Facility
On July 1, 2015, inVentiv UK, as borrower, and inVentiv Health Switzerland GmbH, as guarantor, entered into a credit agreement with Citibank, N.A., as administrative agent, and the other agents and lenders party thereto, for an asset-based lending facility (the “International Facility”), which allows us to draw up to $20.0 million, subject to borrowing base availability, and matures on July 1, 2020. The International Facility is guaranteed by inVentiv Health Switzerland GmbH, our indirect subsidiary in Switzerland. The borrower and guarantor for the International Facility are not directly held by us or by any guarantor of our Senior Secured Credit Facilities or ABL Facility. We use the International Facility to enhance our international cash management.
Amounts borrowed under the International Facility are subject to interest at a rate per annum equal to an applicable margin plus, at our option, either (a) for a base rate loan, a base rate determined by reference to the highest of (i) the Federal Funds Rate plus 0.5%, (ii) the prime rate quoted in the Wall Street Journal, or (iii) the one month LIBOR rate (for loans denominated in U.S. Dollars or Pound Sterling) or EURIBOR rate (for loans denominated in Euros) plus 1.0% or (b) for a Eurocurrency loan, the LIBOR rate (for loans denominated in U.S. Dollars or Pound Sterling) or EURIBOR rate (for loans denominated in Euros) based on the interest period. The applicable margin percentage for asset-based revolving loans is a percentage per annum and ranges from 0.5% to 1.0% for base rate loans or 1.5% to 2.0% for the Eurocurrency rate loans. The applicable margin percentages with respect to borrowings under the International Facility is subject to adjustments based on historical excess availability as defined in the credit agreement for the International Facility. As of December 31, 2015, the interest rate applicable to borrowings under the International Facility was 2.127%. We are also required to pay an unused line fee to the lenders under the International Facility on the committed but unutilized balance of the International Facility at a rate of 0.375% per annum.
The International Facility contains customary covenants and restrictions on the activities of the borrower, the guarantor and their subsidiaries, including limitations on the incurrence of additional indebtedness, issuances of dividends, repurchases of capital stock, investments, loans, asset sales, distributions and acquisitions, ability to enter into certain transactions with affiliates and ability to create liens, among others. The International Facility
134
Table of Contents
requires the borrower to maintain a fixed-charge coverage ratio of at least 1.0 to 1.0, and restricts the borrower’s ability to use cash in certain circumstances if the available borrowing capacity is less than the greater of (i) 20% of the maximum amount that can be borrowed under the International Facility, based on the borrowing base at such time, and (ii) $5.0 million. As of December 31, 2015, the requirement to maintain a minimum fixed charge coverage ratio was not in effect given the borrower’s available borrowing capacity.
The obligations under the International Facility are secured by a first primary lien on the assets of inVentiv UK, including accounts receivable, and guaranteed by inVentiv Health Switzerland GmbH. The credit agreement governing the International Facility also contains certain events of default, including payment defaults, failure to perform or observe covenants, cross-defaults with certain other events of default in connection with our other indebtedness, a change of control, or certain bankruptcy events, among others.
As of December 31, 2015, we had no outstanding borrowings under the International Facility, and we would have been able to borrow up to $14.3 million.
10% Senior Unsecured Notes due 2018
On August 4, 2010, inVentiv Health issued $275.0 million aggregate principal amount of 10% Senior Notes due 2018 (the “Senior Unsecured Notes”). In addition, on August 12, 2014, in connection with the Junior Lien Notes Exchange Offer (as defined below), affiliates of THL and certain co-investors purchased $26.3 million of the Senior Unsecured Notes, which were issued at a 5% discount to par value resulting in a $1.3 million discount that is accreted over the related term using the effective interest method.
In addition, inVentiv Health issued $160.0 million of Senior Unsecured Notes on June 10, 2011 and $390.0 million of Senior Unsecured Notes on July 13, 2011 in connection with certain acquisitions, which were issued at a 5% discount to par value, creating a discount of $19.5 million that is recorded net of the related notes within long-term debt, net of current portion, in the unaudited condensed consolidated balance sheet and is accreted up to the par value using an effective interest method over its related term.
The Senior Unsecured Notes bear interest at a rate of 10% per annum and mature on August 15, 2018. Interest on the Senior Unsecured Notes is payable semi-annually on February 15 and August 15 of each year. The Senior Unsecured Notes are guaranteed, on an unsecured senior basis, by each of our domestic wholly-owned subsidiaries that guarantee the Senior Secured Credit Facilities. The Senior Unsecured Notes are unsecured senior obligations of inVentiv Health and its subsidiary guarantors and rank equally in right of payment with all of the existing and future unsubordinated unsecured indebtedness of inVentiv Health and its subsidiary guarantors and senior to any future subordinated indebtedness of inVentiv Health and its subsidiary guarantors.
The indenture governing the Senior Unsecured Notes provides for customary events of default and contains covenants limiting, among other things, the ability of inVentiv Health and its restricted subsidiaries to (subject to certain exceptions) incur indebtedness, make certain restricted payments and investments, create liens on certain assets to secure debt, consolidate, merge, sell or otherwise dispose of all or substantially all assets and enter into certain transactions with affiliates. In addition, inVentiv Health entered into registration rights agreements in connection with the issuances of the Senior Unsecured Notes, and subsequently registered the Senior Unsecured Notes on August 5, 2015 with the SEC. As a result of such registration and completion of the subsequent exchange offer for the Senior Unsecured Notes, the obligation to pay additional interest on $185.5 million principal amount of the Senior Unsecured Notes ceased on August 5, 2015 and the obligation to pay additional interest on $164.5 million of Senior Unsecured Notes ceased on September 3, 2015. We incurred additional interest in connection with our failure to comply with our registration obligations of $2.2 million, $6.5 million and $8.0 million on the Senior Unsecured Notes for the years ended December 31, 2015, 2014 and 2013, respectively.
135
Table of Contents
On and after August 15, 2015, we may redeem the Senior Unsecured Notes, in whole or in part, at the redemption prices set forth below, plus accrued and unpaid interest during the 12-month period beginning on August 15 of each of the years indicated below:
| Year |
Redemption Price (%) |
|||
| 2015 |
102.50 | % | ||
| 2016 and thereafter |
100.00 | % | ||
In the event of a change in control as defined in the indenture governing the Senior Unsecured Notes, we must provide holders of the Senior Unsecured Notes the opportunity to sell their Senior Unsecured Notes to us at a price equal to 101% of the aggregate principal amount thereof, plus accrued and unpaid interest.
As of December 31, 2015, we had $376.3 million aggregate principal amount of Senior Unsecured Notes outstanding.
9.0% Senior Secured Notes due 2018
On December 20, 2012, inVentiv Health issued $600.0 million aggregate principal amount of 9.0% Senior Secured Notes due 2018 (the “Senior Secured Notes”). On December 13, 2013, inVentiv Health issued an additional $25.0 million aggregate principal amount of the Senior Secured Notes, which were issued at a 2.5% premium.
The Senior Secured Notes bear interest at a rate of 9% per annum and mature on January 15, 2018. Interest on the Senior Secured Notes is payable semi-annually on April 15 and October 15 of each year. The Senior Secured Notes are guaranteed, on a secured senior basis, by each of inVentiv Health’s domestic wholly-owned subsidiaries that guarantee the Senior Secured Credit Facilities. All obligations under the Senior Secured Notes, and the guarantees of those obligations, are secured by, a senior lien on all of inVentiv Health’s assets and the assets of its domestic subsidiaries on par with the lien granted pursuant to the Senior Secured Credit Facilities and subject to a first priority lien on the current assets pledged pursuant to the ABL Facility. The Senior Secured Notes are the secured senior obligations of inVentiv Health and its subsidiary guarantors and rank equally in right of payment with all existing and future unsubordinated secured indebtedness of inVentiv Health and its subsidiary guarantors and senior to any future subordinated indebtedness of inVentiv Health and its subsidiary guarantors.
The indenture governing the Senior Secured Notes provides for customary events of default and contains covenants limiting, among other things, the ability of inVentiv Health and its restricted subsidiaries to (subject to certain exceptions) incur indebtedness, make certain restricted payments and investments, create liens on certain assets to secure debt, consolidate, merge, sell or otherwise dispose of all or substantially all assets and enter into certain transactions with affiliates.
On and after January 15, 2016, we may redeem the Senior Secured Notes, in whole or in part, at the redemption prices set forth below, plus accrued and unpaid interest during the 12-month period beginning on January 15 of each of the years indicated below:
| Year |
Redemption Price (%) |
|||
| 2016 |
104.50 | % | ||
| 2017 and thereafter |
100.00 | % | ||
In the event of a change in control as defined in the indenture governing the Senior Secured Notes, we must provide holders of the Senior Secured Notes the opportunity to sell their Senior Secured Notes to us at a price equal to 101% of the aggregate principal amount thereof, plus accrued and unpaid interest.
As of December 31, 2015, we had $625.0 million aggregate principal amount of Senior Secured Notes outstanding.
136
Table of Contents
10%/12% Junior Lien Secured Notes due 2018
On August 15, 2014, inVentiv Health issued $475.0 million aggregate principal amount of 10%/12% Junior Lien Secured Notes due 2018 (the “Junior Lien Secured Notes”) pursuant to an exchange offer (the “Junior Lien Notes Exchange Offer”) with holders of its Senior Unsecured Notes in exchange for a like amount of Senior Unsecured Notes. In addition, on August 12, 2014, in connection with the Junior Lien Notes Exchange Offer, affiliates of THL and certain co-investors purchased $25.0 million of Junior Lien Secured Notes. On August 15, 2014, inVentiv Health issued an additional $7.0 million of Junior Lien Secured Notes to a group of holders of the Senior Unsecured Notes as consideration for such holders’ agreement to tender the Senior Unsecured Notes held by them into the Junior Lien Notes Exchange Offer.
The Junior Lien Secured Notes bear interest at a cash rate of 10% per annum and a PIK rate of 12% per annum and mature on August 15, 2018. Interest on the Junior Lien Secured Notes is payable semi-annually in arrears on February 15 and August 15 of each year. We may elect to pay interest by increasing the amount of the Junior Lien Secured Notes or by issuing additional Junior Lien Secured Notes for six interest payment periods in the aggregate. We paid interest on the Junior Lien Secured Notes for the periods commencing August 15, 2014 and February 15, 2015 in PIK interest, and elected to pay interest for the period commencing August 15, 2015 in PIK interest. As of December 31, 2015, we accrued 12% interest on the Junior Lien Secured Notes related to the August 15, 2015 PIK interest election, which is included in other non-current liabilities. In February 2016, we elected to settle the interest for the period commencing February 15, 2016 in cash.
The Junior Lien Secured Notes are guaranteed, on a junior lien basis, by each of inVentiv Health’s domestic wholly-owned subsidiaries that guarantee the Senior Secured Credit Facilities. All obligations under the Junior Lien Secured Notes, and the guarantees of those obligations, are secured on a junior lien basis, by inVentiv Health’s assets and the assets of its subsidiary guarantors that secure the obligations under our Senior Secured Credit Facilities and ABL Facility. The Junior Lien Secured Notes are secured senior obligations of inVentiv Health and its subsidiary guarantors, and rank equally in right of payments with all of the existing and future unsubordinated indebtedness of inVentiv Health and its subsidiary guarantors and senior to any of the future subordinated indebtedness of inVentiv Health and its subsidiary guarantors.
The indenture governing the Junior Lien Secured Notes provides for customary events of default and contains covenants limiting, among other things, the ability of inVentiv Health and its restricted subsidiaries to (subject to certain exceptions) incur indebtedness, make certain restricted payments and investments, create liens on certain assets to secure debt, consolidate, merge, sell or otherwise dispose of all or substantially all assets and enter into certain transactions with affiliates.
On and after August 15, 2015, we may redeem the Junior Lien Secured Notes, in whole or in part, at the redemption prices set forth below, plus accrued and unpaid interest during the 12-month period beginning on August 15 of each of the years indicated below:
| Year |
Redemption Price (%) |
|||
| 2015 |
105.00 | % | ||
| 2016 |
102.50 | % | ||
| 2017 and thereafter |
100.00 | % | ||
In addition, prior to August 15, 2016, we may redeem up to 35% of the aggregate principal amount of the Junior Lien Notes at a redemption price equal to 110% of the principal amount of notes to be redeemed. In the event of a change in control as defined in the indenture governing the Junior Lien Secured Notes, we must provide holders of the Junior Lien Secured Notes the opportunity to sell their Junior Lien Secured Notes to us at a price equal to 101% of the aggregate principal amount thereof, plus accrued and unpaid interest.
As of December 31, 2015, we had $569.7 million aggregate principal amount of Junior Lien Secured Notes outstanding. With the settlement of PIK interest in February 2016, an additional $33.9 million of Junior Lien Secured Notes were issued.
137
Table of Contents
SHARES ELIGIBLE FOR FUTURE SALE
Prior to this offering, there has been no public market for our common stock. Future sales of our common stock in the public market, or the perception that sales may occur, could materially adversely affect the prevailing market price of our common stock at such time and our ability to raise equity capital in the future.
Upon consummation of this offering, we will have shares of our common stock outstanding (or shares, if the underwriters exercise their option to purchase additional shares in full). All of the shares of common stock sold in this offering will be freely tradable without restrictions or further registration under the Securities Act, unless the shares are purchased by our “affiliates” as that term is defined in Rule 144 under the Securities Act and except certain shares that may be subject to the lock-up agreements described below after completion of this offering. Any shares owned by our affiliates may not be resold except in compliance with Rule 144 volume limitations, manner of sale and notice requirements, pursuant to another applicable exemption from registration or pursuant to an effective registration statement.
Rule 144
The shares of our common stock sold in this offering will generally be freely transferable without restriction or further registration under the Securities Act, except that any shares of our common stock held by an “affiliate” of ours may not be resold publicly except in compliance with the registration requirements of the Securities Act or under an exemption under Rule 144 or otherwise. Rule 144 permits our common stock that has been acquired by a person who is an affiliate of ours, or has been an affiliate of ours within the past three months, to be sold into the market in an amount that does not exceed, during any three-month period, the greater of:
| • | one percent of the total number of shares of our common stock outstanding, which will equal approximately shares immediately after this offering; or |
| • | the average weekly reported trading volume of our common stock for the four calendar weeks prior to the sale. |
Such sales are also subject to specific manner of sale provisions, a one-year holding period requirement, notice requirements and the availability of current public information about us.
Rule 144 also provides that a person who is not deemed to have been an affiliate of ours at any time during the three months preceding a sale, and who has for at least six months beneficially owned shares of our common stock that are restricted securities, will be entitled to freely sell such shares of our common stock immediately upon closing of this offering, subject only to the availability of current public information regarding us. A person who is not deemed to have been an affiliate of ours at any time during the three months preceding a sale, and who has beneficially owned for at least one year shares of our common stock that are restricted securities, will be entitled to freely sell such shares of our common stock under Rule 144 immediately upon closing of this offering, without regard to the current public information requirements of Rule 144.
Upon closing of this offering, and disregarding any restrictions due to vesting, an aggregate of approximately shares of our common stock will be eligible for sale under Rule 144, of which approximately shares will be subject to the 180-day lock-up period described below. Upon expiration of the 180-day lock-up period described below, and disregarding any restrictions due to vesting, an aggregate of approximately shares of our common stock will be eligible for sale under Rule 144. We cannot estimate the number of shares of our common stock that our existing stockholders will elect to sell under Rule 144.
Lock-up Agreements
In connection with this offering, we expect that each of our directors and executive officers, as well as THL and certain of our other stockholders and equity holders, will enter into lock-up agreements as further described
138
Table of Contents
under “Underwriting” that restrict the offer, sale, pledge or other disposition, directly or indirectly, of any shares of our common stock or securities convertible into or exchangeable or exercisable for any shares of our common stock, for a period of 180 days after the date of this prospectus without the consent of Credit Suisse Securities (USA) LLC and Morgan Stanley & Co. LLC. The restrictions in the lock-up agreements are subject to certain exceptions as described under “Underwriting.” In addition, Credit Suisse Securities (USA) LLC and Morgan Stanley & Co. LLC may, in their discretion, release any of the securities subject to the lock-up agreements at any time.
Following the lock-up periods described above, all of the shares of our common stock that are restricted securities or are held by our affiliates as of the date of this prospectus would be eligible for sale in the public market in compliance with Rule 144 under the Securities Act.
Registration Rights
In addition, following the expiration of the lock-up period, certain stockholders that collectively hold shares of our common stock (including shares of common stock underlying options and restricted stock units issued pursuant to awards under the 2010 Plan) have the right, subject to certain conditions, to require us to register the sale of their shares of our common stock under federal securities laws. If any of these stockholders exercise this right, other existing stockholders that have the benefit of such registration rights may also require us to register shares of our common stock. See “Certain Relationships and Related Party Transactions—Registration and Participation Rights Agreement.” By exercising their registration rights and selling a large number of shares, these selling stockholders could cause the prevailing market price of our common stock to decline.
Additional Registration Statements
We intend to file a registration statement on Form S-8 under the Securities Act to register shares of our common stock to be issued or reserved for issuance under our equity incentive plans. Such registration statement is expected to be filed soon after the date of this prospectus and will automatically become effective upon filing with the SEC. Accordingly, shares registered under such registration statement will be available for sale in the open market, unless such shares are subject to vesting restrictions with us or the lock-up agreements described above.
Rule 701
In general, under Rule 701 as currently in effect, any of our employees, directors, officers, consultants or advisors who acquired common stock from us in connection with a written compensatory stock or option plan or other written agreement in compliance with Rule 701 under the Securities Act before the effective date of a registration statement are entitled to rely on Rule 701 to resell such shares in reliance on Rule 144. In general, Rule 701 permits an affiliate of the issuer to resell their Rule 701 shares in reliance on Rule 144 without having to comply with the holding period requirements of Rule 144, and permits a non-affiliate of the issuer to resell their Rule 701 shares in reliance on Rule 144 without having to comply with the holding period requirements of Rule 144 and without regard to the volume of such sales or the availability of public information about the issuer. However, of the shares of our common stock issued under Rule 701 eligible for sale immediately after the offering, shares will be subject to lock-up agreements as described above and will only become eligible for sale upon the expiration of the restrictions set forth in those agreements.
139
Table of Contents
MATERIAL U.S. FEDERAL INCOME TAX CONSIDERATIONS FOR NON-U.S. HOLDERS
The following is a general discussion of the material U.S. federal income and estate tax consequences to non-U.S. holders (as defined below) of the purchase, ownership and disposition of our common stock. This discussion does not provide a complete analysis of all potential U.S. federal income tax and estate tax considerations relating thereto. This description is based on the Code, existing and proposed U.S. Treasury regulations promulgated thereunder, administrative pronouncements, judicial decisions and interpretations of the foregoing, all as of the date hereof and all of which are subject to change, possibly with retroactive effect. This discussion is limited to non-U.S. Holders who hold shares of our common stock as capital assets within the meaning of Section 1221 of the Code. Moreover, this discussion is for general information only and does not address all of the tax consequences that may be relevant to you in light of your particular circumstances, nor does it discuss special tax provisions, which may apply to you if you are subject to special treatment under U.S. federal income tax laws, such as for certain financial institutions or financial services entities, insurance companies, tax-exempt entities, dealers in securities or currencies, entities that are treated as partnerships for U.S. federal income tax purposes, “controlled foreign corporations,” “passive foreign investment companies,” former U.S. citizens or long-term residents, persons deemed to sell common stock under the constructive sale provisions of the Code, and persons that hold common stock as part of a straddle, hedge, conversion transaction, or other integrated investment. In addition, this summary does not address the Medicare tax on certain investment income or any state, local or foreign taxes or any U.S. federal tax laws other than U.S. federal income tax laws and estate tax laws.
You are urged to consult with your own tax advisor concerning the U.S. federal income tax and estate tax consequences of acquiring, owning and disposing of our common stock, as well as the application of any state, local and foreign income and other tax laws.
As used in this section, a “non-U.S. holder” is a beneficial owner of our common stock that is not, for U.S. federal income tax purposes:
| • | an individual who is a citizen or resident of the United States, |
| • | a corporation (or other entity taxable as a corporation) that is created or organized in or under the laws of the United States, any state thereof or the District of Columbia, |
| • | an estate the income of which is subject to U.S. federal income taxation regardless of its source, or |
| • | a trust if (i) a court within the United States is able to exercise primary supervision over the administration of the trust and one or more U.S. persons have the authority to control all substantial decisions of the trust or (ii) it has a valid election in effect under applicable U.S. Treasury regulations to be treated as a domestic trust. |
If you are an individual, you are a resident alien if you are a lawful permanent resident of the United States (e.g., a green card holder) and you may, in many cases, be deemed to be a resident alien, as opposed to a nonresident alien, by virtue of being present in the United States (i) for at least 183 days during the calendar year or (ii) for at least 31 days in the calendar year and for an aggregate of at least 183 days during a three-year period ending in the current calendar year. For the purpose of (ii), all the days present in the current year, one-third of the days present in the immediately preceding year, and one-sixth of the days present in the second preceding year are counted. Resident aliens are subject to U.S. federal income tax as if they were U.S. citizens. Such an individual is urged to consult his or her own tax advisor regarding the U.S. federal income tax consequences of the purchase, ownership or disposition of our common stock.
If a partnership or other pass-through entity is a beneficial owner of our common stock, the tax treatment of a partner in the partnership or an owner of the other pass-through entity will depend upon the status of the partner or owner and the activities of the partnership or other pass-through entity. Any partner in a partnership or owner of a pass-through entity holding shares of our common stock should consult its own tax advisor.
140
Table of Contents
INVESTORS CONSIDERING THE PURCHASE OF OUR COMMON STOCK SHOULD CONSULT THEIR OWN TAX ADVISORS REGARDING THE APPLICATION OF THE U.S. FEDERAL INCOME AND ESTATE TAX LAWS TO THEIR PARTICULAR SITUATIONS AND THE CONSEQUENCES OF OTHER FEDERAL, STATE, LOCAL AND FOREIGN TAX LAWS AND APPLICABLE TAX TREATIES.
Distributions on Common Stock
If we pay distributions on shares of our common stock, such distributions will constitute dividends for U.S. federal income tax purposes to the extent paid from our current or accumulated earnings and profits, as determined under U.S. federal income tax principles. Distributions in excess of our current and accumulated earnings and profits will constitute a return of capital that is applied against and reduces, but not below zero, a non-U.S. holder’s adjusted tax basis in shares of our common stock. Any remaining excess will be treated as gain realized on the sale or other disposition of our common stock. See “—Dispositions of Common Stock.”
Any dividend paid to a non-U.S. holder on our common stock will generally be subject to U.S. federal withholding tax at a 30% rate. The withholding tax might not apply, however, or might apply at a reduced rate, under the terms of an applicable income tax treaty between the United States and the non-U.S. holder’s country of residence. You should consult your tax advisors regarding your entitlement to benefits under a relevant income tax treaty. Generally, in order for us or our paying agent to withhold tax at a lower treaty rate, a non-U.S. holder must certify its entitlement to treaty benefits. A non-U.S. holder generally can meet this certification requirement by providing an IRS Form W-8BEN or IRS Form W-8BEN-E, as applicable, to us or our paying agent. If the non-U.S. holder holds the stock through a financial institution or other agent acting on the holder’s behalf, the holder will be required to provide appropriate documentation to the agent. The holder’s agent will then be required to provide certification to us or our paying agent, either directly or through other intermediaries. A non-U.S. holder that does not timely furnish the required documentation, but that qualifies for a reduced treaty rate, may obtain a refund of any excess amounts withheld by timely filing an appropriate claim for refund with the IRS.
Dividends received by a non-U.S. holder that are effectively connected with a U.S. trade or business conducted by the non-U.S. holder and, if required by an applicable income tax treaty between the United States and the non-U.S. holder’s country of residence, are attributable to a permanent establishment (or, in certain cases involving individual holders, a fixed base) maintained by the non-U.S. holder in the United States, are not subject to such withholding tax. To obtain this exemption, a non-U.S. holder must provide us with an IRS Form W-8ECI properly certifying such exemption. Such effectively connected dividends, although not subject to such withholding tax, are taxed at the same graduated rates applicable to U.S. persons, net of certain deductions and credits. In addition to the graduated tax described above, such effectively connected dividends received by corporate non-U.S. holders may also be subject to a branch profits tax at a rate of 30% or such lower rate as may be specified by an applicable income tax treaty.
Dispositions of Common Stock
Subject to the discussion below on backup withholding and other withholding requirements, gain realized by a non-U.S. holder on a sale, exchange or other disposition of our common stock generally will not be subject to U.S. federal income or withholding tax, unless:
| • | the gain (i) is effectively connected with the conduct by the non-U.S. holder of a U.S. trade or business and (ii) if required by an applicable income tax treaty between the United States and the non-U.S. holder’s country of residence, is attributable to a permanent establishment (or, in certain cases involving individual holders, a fixed base) maintained by the non-U.S. holder in the United States (in which case the special rules described below apply), |
141
Table of Contents
| • | the non-U.S. holder is an individual who is present in the United States for 183 or more days in the taxable year of such disposition and certain other conditions are met (in which case the gain would be subject to a flat 30% tax, or such reduced rate as may be specified by an applicable income tax treaty, which may be offset by certain U.S. source capital losses) or |
| • | we are, or have been, a U.S. real property holding corporation, or a USRPHC, for U.S. federal income tax purposes at any time during the shorter of the five-year period ending on the date of disposition of our common stock and the non-U.S. holder’s holding period for our common stock. |
Generally, a corporation is a USRPHC if the fair market value of its “United States real property interests” equals 50% or more of the sum of the fair market value of (a) its worldwide real property interests and (b) its other assets used or held for use in a trade or business. The tax relating to stock in a USRPHC does not apply to a non-U.S. holder whose holdings, actual and constructive, amount to 5% or less of our common stock at all times during the applicable period, provided that our common stock is regularly traded on an established securities market. We believe we have not been and are not currently a USRPHC, and do not anticipate being a USRPHC in the future.
If any gain from the sale, exchange or other disposition of our common stock, (1) is effectively connected with a U.S. trade or business conducted by a non-U.S. holder and (2) if required by an applicable income tax treaty between the United States and the non-U.S. holder’s country of residence, is attributable to a permanent establishment (or, in certain cases involving individuals, a fixed base) maintained by such non-U.S. holder in the United States, then the gain generally will be subject to U.S. federal income tax at the same graduated rates applicable to U.S. persons, net of certain deductions and credits. If the non-U.S. holder is a corporation, under certain circumstances, that portion of its earnings and profits that is effectively connected with its U.S. trade or business, subject to certain adjustments, generally would also be subject to a “branch profits tax.” The branch profits tax rate is generally 30%, although an applicable income tax treaty between the United States and the non-U.S. holder’s country of residence might provide for a lower rate.
U.S. Federal Estate Tax
Individuals, or an entity the property of which is includable in an individual’s gross estate for U.S. federal estate tax purposes, should note that any of our common stock held at the time of such individual’s death will be included in such individual’s gross estate for U.S. federal estate tax purposes, and may be subject to U.S. federal estate tax, unless an applicable estate tax treaty provides otherwise.
Backup Withholding and Information Reporting
Any dividends that are paid to a non-U.S. holder must be reported annually to the IRS and to the non-U.S. holder. Copies of these information returns also may be made available to the tax authorities of the country in which the non-U.S. holder resides under the provisions of various treaties or agreements for the exchange of information. Unless the non-U.S. holder is an exempt recipient, dividends paid on our common stock and the gross proceeds from a taxable disposition of our common stock may be subject to additional information reporting and may also be subject to U.S. federal backup withholding if such non-U.S. holder fails to comply with applicable U.S. information reporting and certification requirements. Provision of any IRS Form W-8 appropriate to the non-U.S. holder’s circumstances will generally satisfy the certification requirements necessary to avoid the backup withholding.
Backup withholding is not an additional tax. Any amounts so withheld under the backup withholding rules will be refunded by the IRS or credited against the non-U.S. holder’s U.S. federal income tax liability, provided that the required information is timely furnished to the IRS.
142
Table of Contents
Other Withholding Taxes
Provisions commonly referred to as “FATCA” impose withholding of 30% on payments of U.S.-source dividends and, beginning in 2019, on sales or other disposition proceeds, paid to “foreign financial institutions” (which is broadly defined for this purpose and in general includes investment vehicles) and certain other non-U.S. entities unless various U.S. information reporting and due diligence requirements (generally relating to ownership by U.S. persons of interests in or accounts with those entities) have been satisfied, or an exemption applies. An intergovernmental agreement between the United States and the entity’s jurisdiction may modify these requirements. If FATCA withholding is imposed, a beneficial owner that is not a foreign financial institution generally will be entitled to a refund of any amounts withheld by filing a U.S. federal income tax return (which may entail significant administrative burden). Amounts withheld under FATCA may be credited against withholding tax liabilities under other provisions of the Code. See, for example, the discussion of withholding on dividends at “—Distributions on Common Stock.” Non-U.S. holders should consult their tax advisors regarding the effects of FATCA on their investment in our common stock.
THE PRECEDING DISCUSSION OF U.S. FEDERAL INCOME TAX AND ESTATE TAX CONSIDERATIONS IS FOR GENERAL INFORMATION ONLY. IT IS NOT TAX ADVICE. EACH PROSPECTIVE INVESTOR SHOULD CONSULT ITS OWN TAX ADVISOR REGARDING THE PARTICULAR U.S. FEDERAL, STATE, LOCAL AND FOREIGN TAX CONSEQUENCES OF PURCHASING, HOLDING AND DISPOSING OF OUR COMMON STOCK, INCLUDING THE CONSEQUENCES OF ANY PROPOSED CHANGE IN APPLICABLE LAWS.
143
Table of Contents
Under the terms and subject to the conditions contained in an underwriting agreement dated , 2016 , we have agreed to sell to the underwriters named below, for whom Credit Suisse Securities (USA) LLC, Morgan Stanley & Co. LLC, Goldman, Sachs & Co. and Jefferies LLC are acting as representatives, the following respective numbers of shares of common stock:
| Underwriter |
Number of Shares | |
| Credit Suisse Securities (USA) LLC |
||
| Morgan Stanley & Co. LLC |
||
| Goldman, Sachs & Co. |
||
| Jefferies LLC |
||
| Barclays Capital Inc. |
||
| Citigroup Global Markets Inc. |
||
| Merrill Lynch, Pierce, Fenner & Smith Incorporated |
||
| Wells Fargo Securities, LLC |
||
|
| ||
| Total |
||
|
|
The underwriting agreement provides that the underwriters are obligated to purchase all the shares of common stock in the offering if any are purchased, other than those shares covered by the option to purchase additional shares from us described below. The underwriting agreement also provides that if an underwriter defaults the purchase commitments of non-defaulting underwriters may be increased or the offering may be terminated.
We have agreed to indemnify the underwriters and certain of their controlling persons against certain liabilities, including liabilities under the Securities Act, and to contribute to payments that the underwriters may be required to make in respect of those liabilities.
We have granted to the underwriters a 30-day option to purchase on a pro rata basis up to additional shares at the initial public offering price less the underwriting discounts and commissions.
The underwriters propose to offer the shares of common stock initially at the public offering price on the cover page of this prospectus and to selling group members at that price less a selling concession of up to $ per share. After the initial public offering the representatives may change the public offering price and selling concession.
The following table summarizes the compensation and estimated expenses we will pay:
| Per Share |
Total | |||||||||||||
| Without |
With Over-allotment |
Without Over-allotment |
With Over-allotment |
|||||||||||
| Underwriting Discounts and Commissions paid by us |
$ | $ | $ | $ | ||||||||||
We estimate that our out of pocket expenses for this offering will be approximately $ . We have also agreed to reimburse the underwriters for their expenses in connection with the qualification of the shares with the Financial Industry Regulatory Authority, Inc. (“FINRA”). In accordance with FINRA Rule 5110, this reimbursed fee is deemed underwriting compensation for this offering.
144
Table of Contents
We have agreed that we will not offer, sell, issue, contract to sell, pledge or otherwise dispose of, directly or indirectly, or file with the SEC a registration statement under the Securities Act relating to, any shares of our common stock or securities convertible into or exchangeable or exercisable for any shares of our common stock (including, without limitation, securities which may be issued upon exercise of a stock option or warrant), enter into any swap, hedge or any other agreement that transfers, in whole or in part, the economic consequences of ownership of any shares of our common stock or such other securities, establish or increase a put equivalent position or liquidate or decrease a call equivalent position in any shares of our common stock or such other securities, or publicly disclose the intention to make any offer, sale, pledge, issuance, disposition or filing, without the prior written consent of Credit Suisse Securities (USA) LLC and Morgan Stanley & Co. LLC for a period of 180 days after the date of this prospectus, except grants of employee stock options pursuant to the terms of a plan in effect on the date of this prospectus and described in this prospectus, and issuances pursuant to the exercise of such options or the exercise of any other employee stock options outstanding on the date of this prospectus and described in this prospectus.
Our directors and executive officers, as well as THL and certain of our other stockholders and equity holders have agreed that they will not offer, sell, contract to sell, pledge or otherwise dispose of, directly or indirectly, any shares of our common stock or securities convertible into or exchangeable or exercisable for any shares of our common stock, enter into a transaction that would have the same effect, or enter into any swap, hedge or other arrangement that transfers, in whole or in part, any of the economic consequences of ownership of our common stock, whether any of these transactions are to be settled by delivery of our common stock or other securities, in cash or otherwise, or publicly disclose the intention to make any such offer, sale, pledge or disposition, or to enter into any transaction, swap, hedge or other arrangement, without, in each case, the prior written consent of Credit Suisse Securities (USA) LLC and Morgan Stanley & Co. LLC for a period of 180 days after the date of this prospectus.
The restrictions described in the paragraph above do not apply, subject in certain cases to various conditions (including no filing requirements (other than certain filings on Form 5) and the transfer of the lock-up restrictions), to:
| • | any shares of our common stock acquired in the open market after completion of the offering; |
| • | transfer to a any family members or trusts; and |
| • | the establishment of a written trading plan that satisfies all of the requirements of Rule 10b5-1 under the Exchange Act. |
Credit Suisse Securities (USA) LLC and Morgan Stanley & Co. LLC may, in their discretion, release any of the securities subject to the lock-up agreements at any time.
We intend to apply to list the shares of common stock on the NYSE or NASDAQ, under the symbol “ ”.
The underwriters and their respective affiliates are full-service financial institutions engaged in various activities, which may include securities trading, commercial and investment banking, financial advisory, investment management, investment research, principal investment, hedging, financing and brokerage activities. Certain of the underwriters and their respective affiliates have, from time to time, performed, and may in the future perform, various financial advisory and investment banking services for us, for which they received or will receive customary fees and expenses. In particular, an affiliate of Citigroup Global Markets Inc. is the administration agent, swing line lender and letter of credit issuer and, together with an affiliate of Merrill Lynch, Pierce, Fenner & Smith Incorporated, who is the syndication agent, and an affiliate of Jefferies LLC, were lead arrangers, and, together with Credit Suisse Securities (USA) LLC and Wells Fargo Securities, LLC, were joint bookrunners in connection with, and are lenders under, our Senior Secured Credit Facilities. In addition, an affiliate of Citigroup Global Markets Inc. is the administration agent, swing line lender and letter of credit issuer and, together with an affiliate of Merrill Lynch, Pierce, Fenner & Smith Incorporated, who is the syndication agent, and an affiliate of Jefferies LLC, were lead arrangers, and, together with Credit Suisse Securities (USA)
145
Table of Contents
LLC and Wells Fargo Securities, LLC, were joint bookrunners in connection with, and are lenders under, our ABL Facility. Also, an affiliate of Barclays Capital Inc. is the administrative agent, collateral agent, letter of credit issuer and lender under, and was the bookrunner in connection with, our International Facility.
In addition, in the ordinary course of their business activities, the underwriters and their affiliates may make or hold a broad array of investments and actively trade debt and equity securities (or related derivative securities) and financial instruments (including bank loans) for their own account and for the accounts of their customers. These investments and securities activities may involve securities and/or instruments of ours or our affiliates. The underwriters and their affiliates may also make investment recommendations and/or publish or express independent research views in respect of such securities or financial instruments and may hold, or recommend to clients that they acquire, long and/or short positions in such securities and instruments.
Prior to this offering, there has been no public market for our common stock. The initial public offering price was determined by negotiations among us and the representatives and will not necessarily reflect the market price of the common stock following this offering. The principal factors that were considered in determining the initial public offering price included:
| • | the information presented in this prospectus and otherwise available to the underwriters; |
| • | the history of, and prospects for, the industry in which we compete; |
| • | the ability of our management; |
| • | the prospects for our future earnings; |
| • | the present state of our development, results of operations and our current financial condition; |
| • | the general condition of the securities markets at the time of this offering; |
| • | the recent market prices of, and the demand for, publicly traded common stock of generally comparable companies; and |
| • | other factors deemed relevant by the underwriters and us. |
We cannot assure you that the initial public offering price will correspond to the price at which the common stock will trade in the public market subsequent to this offering or that an active trading market for the common stock will develop and continue after this offering.
In connection with the offering the underwriters may engage in stabilizing transactions, over-allotment transactions, syndicate covering transactions, penalty bids and, if we apply to list our common stock on NASDAQ, passive market making in accordance with Regulation M under the Securities Exchange Act of 1934, as amended (the “Exchange Act”).
| • | Stabilizing transactions permit bids to purchase the underlying security so long as the stabilizing bids do not exceed a specified maximum. |
| • | Over-allotment involves sales by the underwriters of shares in excess of the number of shares the underwriters are obligated to purchase, which creates a syndicate short position. The short position may be either a covered short position or a naked short position. In a covered short position, the number of shares over-allotted by the underwriters is not greater than the number of shares that they may purchase in the underwriters’ option to purchase additional shares from us. In a naked short position, the number of shares involved is greater than the number of shares in the underwriters’ option to purchase additional shares from us. The underwriters may close out any covered short position by either exercising their option to purchase additional shares from us and/or purchasing shares in the open market. |
| • | Syndicate covering transactions involve purchases of the common stock in the open market after the distribution has been completed in order to cover syndicate short positions. In determining the source of shares to close out the short position, the underwriters will consider, among other things, the price of |
146
Table of Contents
| shares available for purchase in the open market as compared to the price at which they may purchase shares through their option to purchase additional shares from us. If the underwriters sell more shares than could be covered by their option, a naked short position, the position can only be closed out by buying shares in the open market. A naked short position is more likely to be created if the underwriters are concerned that there could be downward pressure on the price of the shares in the open market after pricing that could adversely affect investors who purchase in this offering. |
| • | Penalty bids permit the representatives to reclaim a selling concession from a syndicate member when the common stock originally sold by the syndicate member is purchased in a stabilizing or syndicate covering transaction to cover syndicate short positions. |
| • | In passive market making, market makers in the common stock who are underwriters or prospective underwriters may, subject to limitations, make bids for or purchases of our common stock until the time, if any, at which a stabilizing bid is made. |
These stabilizing transactions, syndicate covering transactions and penalty bids may have the effect of raising or maintaining the market price of our common stock or preventing or retarding a decline in the market price of our common stock. As a result the price of our common stock may be higher than the price that might otherwise exist in the open market. These transactions may be effected on the NYSE or NASDAQ, in the over-the-counter market or otherwise and, if commenced, may be discontinued at any time.
A prospectus in electronic format may be made available on the web sites maintained by one or more of the underwriters, or selling group members, if any, participating in this offering and one or more of the underwriters participating in this offering may distribute prospectuses electronically. The representatives may agree to allocate a number of shares to underwriters and selling group members for sale to their online brokerage account holders. Internet distributions will be allocated by the underwriters and selling group members that will make internet distributions on the same basis as other allocations.
Selling Restrictions
Canada
The shares may be sold only to purchasers purchasing, or deemed to be purchasing, as principal that are accredited investors, as defined in National Instrument 45 106 Prospectus Exemptions or subsection 73.3(1) of the Securities Act (Ontario), and are permitted clients, as defined in National Instrument 31 103 Registration Requirements, Exemptions and Ongoing Registrant Obligations. Any resale of the shares must be made in accordance with an exemption from, or in a transaction not subject to, the prospectus requirements of applicable securities laws.
Securities legislation in certain provinces or territories of Canada may provide a purchaser with remedies for rescission or damages if this prospectus (including any amendment thereto) contains a misrepresentation, provided that the remedies for rescission or damages are exercised by the purchaser within the time limit prescribed by the securities legislation of the purchaser’s province or territory. The purchaser should refer to any applicable provisions of the securities legislation of the purchaser’s province or territory for particulars of these rights or consult with a legal advisor.
Pursuant to section 3A.3 of National Instrument 33 105 Underwriting Conflicts (NI 33 105), the underwriters are not required to comply with the disclosure requirements of NI 33 105 regarding underwriter conflicts of interest in connection with this offering.
European Economic Area
In relation to each Member State of the European Economic Area which has implemented the Prospectus Directive (each, a “Relevant Member State”), with effect from and including the date on which the Prospectus Directive is implemented in that Relevant Member State (the “Relevant Implementation Date”), our common
147
Table of Contents
stock will not be offered to the public in that Relevant Member State prior to the publication of a prospectus in relation to our common stock that has been approved by the competent authority in that Relevant Member State or, where appropriate, approved in another Relevant Member State and notified to the competent authority in that Relevant Member State, all in accordance with the Prospectus Directive, except that, with effect from and including the Relevant Implementation Date, an offer of our common stock may be made to the public in that Relevant Member State at any time:
| • | to any legal entity that is a qualified investor as defined in the Prospectus Directive; |
| • | to fewer than 100 or, if the Relevant Member State has implemented the relevant provision of the 2010 PD Amending Directive, 150, natural or legal persons (other than qualified investors as defined in the Prospectus Directive), as permitted under the Prospectus Directive, subject to obtaining the prior consent of the representatives; or |
| • | in any other circumstances falling within Article 3(2) of the Prospectus Directive; |
provided that no such offer of shares shall require us or the representatives to publish a prospectus pursuant to Article 3 of the Prospectus Directive or supplement a prospectus pursuant to Article 16 of the Prospectus Directive.
For the purposes of this provision, the expression an “offer of common shares to the public” in relation to any shares in any Relevant Member State means the communication in any form and by any means of sufficient information on the terms of the offer and the shares to be offered so as to enable an investor to decide to purchase or subscribe to the shares, as the same may be varied in that Relevant Member State by any measure implementing the Prospectus Directive in that Relevant Member State. The expression “Prospectus Directive” means Directive 2003/71/EC (and amendments thereto, including the 2010 PD Amending Directive, to the extent implemented in the Relevant Member State) and includes any relevant implementing measure in each Relevant Member State, and the expression “2010 PD Amending Directive” means Directive 2010/73/EU.
United Kingdom
In addition, in the United Kingdom, this document is being distributed only to, and is directed only at, and any offer subsequently made may only be directed at persons who are “qualified investors” (as defined in the Prospectus Directive) (i) who have professional experience in matters relating to investments falling within Article 19 (5) of the Financial Services and Markets Act 2000 (Financial Promotion) Order 2005, as amended (the “Order”) and/or (ii) who are high net worth companies (or persons to whom it may otherwise be lawfully communicated) falling within Article 49(2)(a) to (d) of the Order (all such persons together being referred to as “relevant persons”).
Any person in the United Kingdom that is not a relevant person should not act or rely on the information included in this document or use it as basis for taking any action. In the United Kingdom, any investment or investment activity that this document relates to may be made or taken exclusively by relevant persons. Any person in the United Kingdom that is not a relevant person should not act or rely on this document or any of its contents.
Switzerland
This document is not intended to constitute an offer or solicitation to purchase or invest in the shares described herein. The shares may not be publicly offered, sold or advertised, directly or indirectly, in, into or from Switzerland and will not be listed on the SIX Swiss Exchange or on any other exchange or regulated trading facility in Switzerland. Neither this document nor any other offering or marketing material relating to the shares constitutes a prospectus as such term is understood pursuant to article 652a or article 1156 of the Swiss Code of Obligations or a listing prospectus within the meaning of the listing rules of the SIX Swiss Exchange or any other regulated trading facility in Switzerland, and neither this document nor any other offering or marketing material relating to the shares may be publicly distributed or otherwise made publicly available in Switzerland.
148
Table of Contents
Neither this document nor any other offering or marketing material relating to the offering, nor the Company nor the shares have been or will be filed with or approved by any Swiss regulatory authority. The shares are not subject to the supervision by any Swiss regulatory authority, e.g., the Swiss Financial Markets Supervisory Authority FINMA (“FINMA”), and investors in the shares will not benefit from protection or supervision by such authority.
Hong Kong
The shares of our common stock may not be offered or sold in Hong Kong by means of any document other than (i) in circumstances which do not constitute an offer to the public within the meaning of the Companies Ordinance (Cap.32, Laws of Hong Kong), or (ii) to “professional investors” within the meaning of the Securities and Futures Ordinance (Cap.571, Laws of Hong Kong) and any rules made thereunder, or (iii) in other circumstances which do not result in the document being a “prospectus” within the meaning of the Companies Ordinance (Cap.32, Laws of Hong Kong), and no advertisement, invitation or document relating to the shares of our common stock may be issued or may be in the possession of any person for the purpose of issue (in each case whether in Hong Kong or elsewhere), which is directed at, or the contents of which are likely to be accessed or read by, the public in Hong Kong (except if permitted to do so under the laws of Hong Kong) other than with respect to shares of our common stock which are or are intended to be disposed of only to persons outside Hong Kong or only to “professional investors” within the meaning of the Securities and Futures Ordinance (Cap. 571, Laws of Hong Kong) and any rules made thereunder.
Singapore
This prospectus has not been registered as a prospectus with the Monetary Authority of Singapore. Accordingly, this prospectus and any other document or material in connection with the offer or sale, or invitation for subscription or purchase, of the shares of our common stock may not be circulated or distributed, nor may the shares of our common stock be offered or sold, or be made the subject of an invitation for subscription or purchase, whether directly or indirectly, to persons in Singapore other than (i) to an institutional investor under Section 274 of the Securities and Futures Act, Chapter 289 of Singapore (the “SFA”), (ii) to a relevant person pursuant to Section 275(1), or any person pursuant to Section 275(1A), and in accordance with the conditions, specified in Section 275 of the SFA or (iii) otherwise pursuant to, and in accordance with the conditions of, any other applicable provision of the SFA.
Where the shares of our common stock are subscribed or purchased under Section 275 by a relevant person which is (i) a corporation (which is not an accredited investor) the sole business of which is to hold investments and the entire share capital of which is owned by one or more individuals, each of whom is an accredited investor, or (ii) a trust (where the trustee is not an accredited investor) whose sole purpose is to hold investments and each beneficiary is an accredited investor, then shares, debentures and units of shares and debentures of that corporation or the beneficiaries’ rights and interest in that trust shall not be transferable for six months after that corporation or that trust has acquired the shares of our common stock under Section 275 except: (a) to an institutional investor under Section 274 of the SFA or to a relevant person, or any person pursuant to Section 275(1A), and in accordance with the conditions, specified in Section 275 of the SFA; (b) where no consideration is given for the transfer; or (c) by operation of law.
Japan
The securities have not been and will not be registered under the Financial Instruments and Exchange Law of Japan (the Financial Instruments and Exchange Law) and each underwriter has agreed that it will not offer or sell any securities, directly or indirectly, in Japan or to, or for the benefit of, any resident of Japan (which term as used herein means any person resident in Japan, including any corporation or other entity organized under the laws of Japan), or to others for re-offering or resale, directly or indirectly, in Japan or to a resident of Japan, except pursuant to an exemption from the registration requirements of, and otherwise in compliance with, the Financial Instruments and Exchange Law and any other applicable laws, regulations and ministerial guidelines of Japan.
149
Table of Contents
Weil, Gotshal & Manges LLP, New York, New York, has passed upon the validity of common stock offered hereby on behalf of us. The validity of the shares of common stock offered hereby will be passed upon on behalf of the underwriters by Davis Polk & Wardwell LLP, New York, New York.
The financial statements as of December 31, 2015 and 2014, and for each of the three years in the period ended December 31, 2015, included in this prospectus and the related financial statement schedule included elsewhere in the registration statement, have been audited by Deloitte & Touche LLP, an independent registered public accounting firm, as stated in their report appearing herein. Such financial statements and financial statement schedule have been so included in reliance upon the report of such firm given upon their authority as experts in accounting and auditing.
WHERE YOU CAN FIND MORE INFORMATION
We have filed with the SEC a registration statement on Form S-1 under the Securities Act with respect to the shares of our common stock offered by this prospectus. For purposes of this section, the term registration statement means the original registration statement and any and all amendments including the schedules and exhibits to the original registration statement or any amendment. This prospectus, filed as part of the registration statement, does not contain all of the information set forth in the registration statement or the exhibits and schedules thereto as permitted by the rules and regulations of the SEC. For further information about us and our common stock, you should refer to the registration statement, including the exhibits. This prospectus summarizes provisions that we consider material of certain contracts and other documents to which we refer you. Because the summaries may not contain all of the information that you may find important, you should review the full text of those documents.
The registration statement, including its exhibits and schedules, may be inspected and copied at the public reference facilities maintained by the SEC at 100 F Street, N.E., Room 1580, Washington, D.C. 20549. You may obtain information on the operation of the public reference room by calling 1-202-551-8909. Copies of such materials are also available by mail from the Public Reference Branch of the SEC at 100 F Street, N.E., Room 1580, Washington, D.C. 20549 at prescribed rates. In addition, the SEC maintains a website at (http://www.sec.gov) from which interested persons can electronically access the registration statement, including the exhibits and schedules to the registration statement.
Neither we nor the underwriters have authorized anyone to provide you with information that is different from that contained in this prospectus, any amendment or supplement to this prospectus or any free-writing prospectus prepared by us or on our behalf or to which we have referred you. We do not, and the underwriters do not, take any responsibility for, and can provide no assurances as to, the reliability of any information that others provide to you. We are offering to sell, and seeking offers to buy, shares of common stock only in jurisdictions where offers and sales are permitted.
150
Table of Contents
INDEX TO CONSOLIDATED FINANCIAL STATEMENTS
| Page | ||||
| inVentiv Group Holdings, Inc. Audited Consolidated Financial Statements |
||||
| F-2 | ||||
| Consolidated Balance Sheets as of December 31, 2015 and 2014 |
F-3 | |||
| Consolidated Statements of Operations for the years ended December 31, 2015, 2014 and 2013 |
F-4 | |||
| Consolidated Statements of Comprehensive Loss for the years ended December 31, 2015, 2014 and 2013 |
F-5 | |||
| Consolidated Statements of Equity (Deficit) for the years ended December 31, 2015, 2014 and 2013 |
F-6 | |||
| Consolidated Statements of Cash Flows for the years ended December 31, 2015, 2014 and 2013 |
F-7 | |||
| F-8 | ||||
F-1
Table of Contents
REPORT OF INDEPENDENT REGISTERED PUBLIC ACCOUNTING FIRM
To the Board of Directors and Stockholders of
inVentiv Group Holdings, Inc.
Burlington, Massachusetts
We have audited the accompanying consolidated balance sheets of inVentiv Group Holdings, Inc. and subsidiaries (the “Company”) as of December 31, 2015 and 2014, and the related consolidated statements of operations, comprehensive loss, stockholders’ deficit, and cash flows for each of the three years in the period ended December 31, 2015. Our audits also included the financial statement schedule listed in the Exhibit Index at Item 16. These financial statements and financial statement schedule are the responsibility of the Company’s management. Our responsibility is to express an opinion on these financial statements and financial statement schedule based on our audits.
We conducted our audits in accordance with the standards of the Public Company Accounting Oversight Board (United States). Those standards require that we plan and perform the audit to obtain reasonable assurance about whether the financial statements are free of material misstatement. The Company is not required to have, nor were we engaged to perform, an audit of its internal control over financial reporting. Our audits included consideration of internal control over financial reporting as a basis for designing audit procedures that are appropriate in the circumstances, but not for the purpose of expressing an opinion on the effectiveness of the Company’s internal control over financial reporting. Accordingly, we express no such opinion. An audit also includes examining, on a test basis, evidence supporting the amounts and disclosures in the financial statements, assessing the accounting principles used and significant estimates made by management, as well as evaluating the overall financial statement presentation. We believe that our audits provide a reasonable basis for our opinion.
In our opinion, such consolidated financial statements present fairly, in all material respects, the financial position of inVentiv Group Holdings, Inc. and subsidiaries as of December 31, 2015 and 2014, and the results of their operations and their cash flows for each of the three years in the period ended December 31, 2015, in conformity with accounting principles generally accepted in the United States of America. Also, in our opinion, such financial statement schedule, when considered in relation to the basic consolidated financial statements taken as a whole, presents fairly in all material respects the information set forth therein.
/s/ Deloitte & Touche LLP
Boston, Massachusetts
April 5, 2016
F-2
Table of Contents
INVENTIV GROUP HOLDINGS, INC.
(in thousands, except share and per share data)
| December 31, | ||||||||
| 2015 | 2014 | |||||||
| ASSETS | ||||||||
| Current assets: |
||||||||
| Cash and cash equivalents |
$ | 121,317 | $ | 57,059 | ||||
| Restricted cash |
1,607 | 1,717 | ||||||
| Accounts receivable, net of allowances for doubtful accounts of $5,395 |
359,081 | 302,847 | ||||||
| Unbilled services |
207,465 | 179,036 | ||||||
| Prepaid expenses and other current assets |
42,930 | 38,225 | ||||||
| Income tax receivable |
1,076 | 1,363 | ||||||
| Current deferred tax assets |
— | 7,512 | ||||||
|
|
|
|
|
|||||
| Total current assets |
733,476 | 587,759 | ||||||
| Property and equipment, net |
142,032 | 121,859 | ||||||
| Goodwill |
895,369 | 931,787 | ||||||
| Intangible assets, net |
334,646 | 417,824 | ||||||
| Non-current deferred tax assets |
10,032 | 3,944 | ||||||
| Other assets |
37,134 | 41,882 | ||||||
|
|
|
|
|
|||||
| Total assets |
$ | 2,152,689 | $ | 2,105,055 | ||||
|
|
|
|
|
|||||
| LIABILITIES AND STOCKHOLDERS’ DEFICIT | ||||||||
| Current liabilities: |
||||||||
| Current portion of capital lease obligations and other financing arrangements |
$ | 23,333 | $ | 16,265 | ||||
| Accrued payroll, accounts payable and accrued expenses |
333,726 | 286,613 | ||||||
| Income taxes payable |
5,484 | 1,209 | ||||||
| Deferred revenue and client advances |
246,656 | 199,130 | ||||||
|
|
|
|
|
|||||
| Total current liabilities |
609,199 | 503,217 | ||||||
| Capital lease obligations, net of current portion |
45,258 | 29,324 | ||||||
| Long-term debt, net of current portion |
2,101,885 | 2,021,852 | ||||||
| Non-current income tax liability |
5,942 | 6,461 | ||||||
| Deferred tax liability |
73,360 | 77,232 | ||||||
| Other non-current liabilities |
88,153 | 80,756 | ||||||
|
|
|
|
|
|||||
| Total liabilities |
2,923,797 | 2,718,842 | ||||||
|
|
|
|
|
|||||
| Commitments and contingencies (Note 11 and 12) |
||||||||
| inVentiv Group Holdings, Inc. stockholders’ deficit: |
||||||||
| Common stock, $.01 par value, 7,500,000 shares authorized, 5,402,377 shares issued and outstanding at December 31, 2015 and 2014 |
54 | 54 | ||||||
| Additional paid-in-capital |
573,686 | 569,810 | ||||||
| Accumulated deficit |
(1,309,136 | ) | (1,157,668 | ) | ||||
| Accumulated other comprehensive loss |
(37,340 | ) | (27,377 | ) | ||||
|
|
|
|
|
|||||
| Total inVentiv Group Holdings, Inc. stockholders’ deficit |
(772,736 | ) | (615,181 | ) | ||||
| Noncontrolling interest |
1,628 | 1,394 | ||||||
|
|
|
|
|
|||||
| Total stockholders’ deficit |
(771,108 | ) | (613,787 | ) | ||||
|
|
|
|
|
|||||
| Total liabilities and stockholders’ deficit |
$ | 2,152,689 | $ | 2,105,055 | ||||
|
|
|
|
|
|||||
The accompanying notes are an integral part of these consolidated financial statements.
F-3
Table of Contents
INVENTIV GROUP HOLDINGS, INC.
CONSOLIDATED STATEMENTS OF OPERATIONS
(in thousands, except share and per share data)
| For the Year Ended December 31, | ||||||||||||
| 2015 | 2014 | 2013 | ||||||||||
| Net revenues |
$ | 1,994,318 | $ | 1,806,405 | $ | 1,644,555 | ||||||
| Reimbursed out-of-pocket expenses |
326,955 | 266,786 | 259,925 | |||||||||
|
|
|
|
|
|
|
|||||||
| Total revenues |
2,321,273 | 2,073,191 | 1,904,480 | |||||||||
|
|
|
|
|
|
|
|||||||
| Operating expenses: |
||||||||||||
| Cost of revenues |
1,326,782 | 1,203,636 | 1,084,767 | |||||||||
| Reimbursable out-of-pocket expenses |
326,955 | 266,786 | 259,925 | |||||||||
| Selling, general and administrative expenses |
525,229 | 529,366 | 538,328 | |||||||||
| Proceeds from purchase price finalization |
— | — | (14,221 | ) | ||||||||
| Impairment of goodwill |
33,964 | 15,795 | 36,864 | |||||||||
| Impairment of long-lived assets |
35,193 | 8,228 | 2,017 | |||||||||
|
|
|
|
|
|
|
|||||||
| Total operating expenses |
2,248,123 | 2,023,811 | 1,907,680 | |||||||||
|
|
|
|
|
|
|
|||||||
| Operating income (loss) |
73,150 | 49,380 | (3,200 | ) | ||||||||
| Loss on extinguishment of debt and refinancing costs |
— | (10,062 | ) | (818 | ) | |||||||
| Interest expense |
(228,287 | ) | (217,473 | ) | (209,350 | ) | ||||||
| Interest income |
88 | 424 | 119 | |||||||||
| Other income |
11,318 | — | — | |||||||||
|
|
|
|
|
|
|
|||||||
| Income (loss) before income tax (provision) benefit and income (loss) from equity investments |
(143,731 | ) | (177,731 | ) | (213,249 | ) | ||||||
| Income tax (provision) benefit |
(5,567 | ) | (2,507 | ) | (2,955 | ) | ||||||
|
|
|
|
|
|
|
|||||||
| Income (loss) before income (loss) from equity investments |
(149,298 | ) | (180,238 | ) | (216,204 | ) | ||||||
| Income (loss) from equity investments |
(1,279 | ) | (404 | ) | 15 | |||||||
|
|
|
|
|
|
|
|||||||
| Income (loss) from continuing operations |
(150,577 | ) | (180,642 | ) | (216,189 | ) | ||||||
| Net income (loss) from discontinued operations, net of tax |
— | (8,163 | ) | (20,228 | ) | |||||||
|
|
|
|
|
|
|
|||||||
| Net Income (loss) |
(150,577 | ) | (188,805 | ) | (236,417 | ) | ||||||
| Less: Net (income) loss attributable to the noncontrolling interest |
(891 | ) | (830 | ) | (1,156 | ) | ||||||
|
|
|
|
|
|
|
|||||||
| Net income (loss) attributable to inVentiv Group Holdings, Inc. |
$ | (151,468 | ) | $ | (189,635 | ) | $ | (237,573 | ) | |||
|
|
|
|
|
|
|
|||||||
| Earnings per share attributable to inVentiv Group Holdings, Inc. Basic and diluted: |
||||||||||||
| Income (loss) from continuing operations |
$ | (28.04 | ) | $ | (33.59 | ) | $ | (40.23 | ) | |||
| Income (loss) from discontinued operations |
— | (1.51 | ) | (3.75 | ) | |||||||
|
|
|
|
|
|
|
|||||||
| Net income (loss) per share attributable to inVentiv Group Holdings, Inc. |
$ | (28.04 | ) | $ | (35.10 | ) | $ | (43.98 | ) | |||
|
|
|
|
|
|
|
|||||||
| Weighted average number of shares outstanding- basic and diluted |
5,402,377 | 5,402,377 | 5,402,017 | |||||||||
|
|
|
|
|
|
|
|||||||
The accompanying notes are an integral part of these consolidated financial statements.
F-4
Table of Contents
INVENTIV GROUP HOLDINGS, INC.
CONSOLIDATED STATEMENTS OF COMPREHENSIVE LOSS
(in thousands)
| For the Year Ended December 31, | ||||||||||||
| 2015 | 2014 | 2013 | ||||||||||
| Net Income (loss) |
$ | (150,577 | ) | $ | (188,805 | ) | $ | (236,417 | ) | |||
| Other comprehensive income (loss): |
||||||||||||
| Foreign currency translation adjustment |
(9,963 | ) | (16,848 | ) | (7,246 | ) | ||||||
|
|
|
|
|
|
|
|||||||
| Total other comprehensive income (loss) |
(9,963 | ) | (16,848 | ) | (7,246 | ) | ||||||
|
|
|
|
|
|
|
|||||||
| Total comprehensive income (loss) |
(160,540 | ) | (205,653 | ) | (243,663 | ) | ||||||
|
|
|
|
|
|
|
|||||||
| Less: Comprehensive (income) loss attributable to the noncontrolling interest |
(891 | ) | (830 | ) | (1,156 | ) | ||||||
|
|
|
|
|
|
|
|||||||
| Comprehensive income (loss) attributable to inVentiv Group Holdings, Inc. |
$ | (161,431 | ) | $ | (206,483 | ) | $ | (244,819 | ) | |||
|
|
|
|
|
|
|
|||||||
The accompanying notes are an integral part of these consolidated financial statements.
F-5
Table of Contents
INVENTIV GROUP HOLDINGS, INC.
CONSOLIDATED STATEMENTS OF STOCKHOLDERS’ DEFICIT
(in thousands, except share data)
| Shares | Common Stock |
Additional Paid-In Capital |
Accumulated Deficit |
Accumulated Other Comprehensive Loss |
Non- controlling Interest |
Total | ||||||||||||||||||||||
| Balance at December 31, 2012 |
5,402,039 | $ | 54 | $ | 571,008 | $ | (730,460 | ) | $ | (3,283 | ) | $ | 1,334 | $ | (161,347 | ) | ||||||||||||
| Equity contribution from Investors |
115 | — | 44 | — | — | — | 44 | |||||||||||||||||||||
| Exercise of stock options |
418 | — | 41 | — | — | — | 41 | |||||||||||||||||||||
| Withheld shares for taxes |
— | — | (41 | ) | — | — | — | (41 | ) | |||||||||||||||||||
| Repurchase of common stock |
(195 | ) | — | (27 | ) | — | — | — | (27 | ) | ||||||||||||||||||
| Net loss |
— | — | — | (237,573 | ) | — | 1,156 | (236,417 | ) | |||||||||||||||||||
| Foreign currency translation adjustment |
— | — | — | — | (7,246 | ) | — | (7,246 | ) | |||||||||||||||||||
| Stock-based compensation credit |
— | — | (1,771 | ) | — | — | — | (1,771 | ) | |||||||||||||||||||
| Distributions to noncontrolling interest |
— | — | — | — | — | (1,273 | ) | (1,273 | ) | |||||||||||||||||||
|
|
|
|
|
|
|
|
|
|
|
|
|
|
|
|||||||||||||||
| Balance at December 31, 2013 |
5,402,377 | 54 | 569,254 | (968,033 | ) | (10,529 | ) | 1,217 | (408,037 | ) | ||||||||||||||||||
| Net loss |
— | — | — | (189,635 | ) | — | 830 | (188,805 | ) | |||||||||||||||||||
| Foreign currency translation adjustment |
— | — | — | — | (16,848 | ) | — | (16,848 | ) | |||||||||||||||||||
| Stock-based compensation expense |
— | — | 556 | — | — | — | 556 | |||||||||||||||||||||
| Distributions to noncontrolling interest |
— | — | — | — | — | (653 | ) | (653 | ) | |||||||||||||||||||
|
|
|
|
|
|
|
|
|
|
|
|
|
|
|
|||||||||||||||
| Balance at December 31, 2014 |
5,402,377 | 54 | 569,810 | (1,157,668 | ) | (27,377 | ) | 1,394 | (613,787 | ) | ||||||||||||||||||
| Net loss |
— | — | — | (151,468 | ) | — | 891 | (150,577 | ) | |||||||||||||||||||
| Foreign currency translation adjustment |
— | — | — | — | (9,963 | ) | — | (9,963 | ) | |||||||||||||||||||
| Stock-based compensation expense |
— | — | 3,876 | — | — | — | 3,876 | |||||||||||||||||||||
| Distributions to noncontrolling interest |
— | — | — | — | — | (657 | ) | (657 | ) | |||||||||||||||||||
|
|
|
|
|
|
|
|
|
|
|
|
|
|
|
|||||||||||||||
| Balance at December 31, 2015 |
5,402,377 | $ | 54 | $ | 573,686 | $ | (1,309,136 | ) | $ | (37,340 | ) | $ | 1,628 | $ | (771,108 | ) | ||||||||||||
|
|
|
|
|
|
|
|
|
|
|
|
|
|
|
|||||||||||||||
The accompanying notes are an integral part of these consolidated financial statements.
F-6
Table of Contents
INVENTIV GROUP HOLDINGS, INC.
CONSOLIDATED STATEMENTS OF CASH FLOWS
(in thousands)
| For the Year Ended December 31, | ||||||||||||
| 2015 | 2014 | 2013 | ||||||||||
| Cash flows from operating activities: |
||||||||||||
| Net Income (loss) |
$ | (150,577 | ) | $ | (188,805 | ) | $ | (236,417 | ) | |||
| Adjustments to reconcile net income (loss) to net cash provided by (used) in operating activities: |
||||||||||||
| (Income) loss from discontinued operations, net of tax |
— | 8,163 | 20,228 | |||||||||
| Depreciation |
47,536 | 40,583 | 33,781 | |||||||||
| Amortization of intangible assets |
47,552 | 66,732 | 72,218 | |||||||||
| Amortization of deferred financing costs and original issue discount/premium |
19,033 | 18,635 | 18,620 | |||||||||
| Impairment of goodwill |
33,964 | 15,795 | 36,864 | |||||||||
| Impairment of long-lived assets |
35,193 | 8,228 | 2,017 | |||||||||
| Payment-in-kind interest |
65,508 | 22,984 | — | |||||||||
| Gain on sale of business |
(11,318 | ) | — | — | ||||||||
| (Gain) loss on disposal of assets |
810 | 244 | 1,246 | |||||||||
| Stock-based compensation expense |
3,876 | 556 | (1,771 | ) | ||||||||
| Loss on extinguishment of debt |
— | 3,537 | 818 | |||||||||
| Deferred taxes |
(2,744 | ) | 4,638 | 1,428 | ||||||||
| Other non-cash adjustments |
1,596 | (4,618 | ) | 813 | ||||||||
| Changes in assets and liabilities, net |
||||||||||||
| Accounts receivable, net |
(67,726 | ) | (37,141 | ) | 51,032 | |||||||
| Unbilled services |
(31,567 | ) | (10,249 | ) | 3,916 | |||||||
| Prepaid expenses and other current assets |
(7,286 | ) | (547 | ) | (3,912 | ) | ||||||
| Accrued payroll, accounts payable and accrued expenses |
58,836 | (4,406 | ) | 33,734 | ||||||||
| Net change in income tax receivable and non-current income tax liability |
4,135 | (1,734 | ) | (3,141 | ) | |||||||
| Deferred revenue and client advances |
59,969 | 12,762 | (7,980 | ) | ||||||||
| Other, net |
(55 | ) | (1,404 | ) | (866 | ) | ||||||
|
|
|
|
|
|
|
|||||||
| Net cash provided by (used in) continuing operations |
106,735 | (46,047 | ) | 22,628 | ||||||||
| Net cash provided by (used in) discontinued operations |
— | (7,988 | ) | (6,188 | ) | |||||||
|
|
|
|
|
|
|
|||||||
| Net cash provided by (used in) operating activities |
106,735 | (54,035 | ) | 16,440 | ||||||||
|
|
|
|
|
|
|
|||||||
| Cash flows from investing activities: |
||||||||||||
| Cash paid for acquisitions, net of cash acquired |
— | — | (400 | ) | ||||||||
| Purchases of property and equipment |
(39,279 | ) | (33,089 | ) | (35,677 | ) | ||||||
| Proceeds from sale of business |
14,251 | — | — | |||||||||
| Proceeds from vehicle sales and rebates on vehicle leases |
17,731 | 12,190 | 15,134 | |||||||||
| Proceeds from sale of investments |
2,024 | — | — | |||||||||
| Purchase of investments |
— | (2,625 | ) | (3,590 | ) | |||||||
| Other, net |
39 | 163 | 271 | |||||||||
|
|
|
|
|
|
|
|||||||
| Net cash provided by (used in) continuing operations |
(5,234 | ) | (23,361 | ) | (24,262 | ) | ||||||
| Net cash provided by (used in) discontinued operations |
— | — | (1,941 | ) | ||||||||
|
|
|
|
|
|
|
|||||||
| Net cash provided by (used in) investing activities |
(5,234 | ) | (23,361 | ) | (26,203 | ) | ||||||
|
|
|
|
|
|
|
|||||||
| Cash flows from financing activities: |
||||||||||||
| Repayments on capital leases |
(29,417 | ) | (17,866 | ) | (22,186 | ) | ||||||
| Borrowings under line of credit |
153,000 | 369,000 | 54,500 | |||||||||
| Repayment on line of credit |
(153,000 | ) | (369,000 | ) | (54,500 | ) | ||||||
| Payment on installment note and contingent consideration related to acquisition |
(2,500 | ) | (1,500 | ) | — | |||||||
| Proceeds from issuances of debt |
2,444 | 2,776 | 2,418 | |||||||||
| Payment of debt issuance costs |
(1,771 | ) | (2,428 | ) | (3,059 | ) | ||||||
| Repayment of debt and other financing arrangements |
(2,800 | ) | (4,859 | ) | (2,797 | ) | ||||||
| Issuance of notes payable |
— | 50,000 | 25,625 | |||||||||
| Other, net |
(657 | ) | (653 | ) | (1,257 | ) | ||||||
|
|
|
|
|
|
|
|||||||
| Net cash provided by (used in) financing activities |
(34,701 | ) | 25,470 | (1,256 | ) | |||||||
|
|
|
|
|
|
|
|||||||
| Effects of foreign currency exchange rate changes on cash |
(2,542 | ) | (7,242 | ) | (2,167 | ) | ||||||
|
|
|
|
|
|
|
|||||||
| Net increase (decrease) in cash and cash equivalents |
64,258 | (59,168 | ) | (13,186 | ) | |||||||
| Cash and cash equivalents, beginning of year |
57,059 | 116,227 | 129,413 | |||||||||
|
|
|
|
|
|
|
|||||||
| Cash and cash equivalents, end of year |
$ | 121,317 | $ | 57,059 | $ | 116,227 | ||||||
|
|
|
|
|
|
|
|||||||
| Supplemental disclosure of cash flow information: |
||||||||||||
| Cash paid for interest |
$ | 145,153 | $ | 194,050 | $ | 174,096 | ||||||
| Cash paid (refund) for income taxes |
2,903 | (1,273 | ) | 5,090 | ||||||||
| Supplemental disclosure of non-cash activities: |
||||||||||||
| Issuance of Junior Lien Secured Notes for backstop fees |
— | 7,000 | — | |||||||||
| Vehicles acquired through capital lease agreements |
52,806 | 35,532 | 14,963 | |||||||||
| Accrued capital expenditures |
2,666 | 5,338 | 5,482 | |||||||||
The accompanying notes are an integral part of these consolidated financial statements.
F-7
Table of Contents
Notes to Consolidated Financial Statements
1. Organization and Business
inVentiv Group Holdings, Inc. (“inVentiv”, or together with its consolidated subsidiaries, the “Company”) is a leading global provider of outsourced clinical development and commercialization services to biopharmaceutical companies The Company provides services through two reportable business segments: Clinical and Commercial. The Company provides a full suite of services to enhance its clients’ ability to successfully develop, launch and market their products. The Company offers its solutions on both a standalone and integrated basis. The Company’s services cover the entire biopharmaceutical development and commercialization continuum spanning from first-in-human clinical trial to the ongoing commercialization of mature products.
On August 4, 2010, inVentiv’s subsidiary, inVentiv Acquisition, Inc., merged with and into inVentiv Health, Inc. (“inVentiv Health”), with inVentiv Health as the surviving company (the “THL Acquisition”). inVentiv is controlled by affiliates of Thomas H. Lee Partners (“THL”), a global private investment and advisory firm, as well as certain co-investors and certain members of management (together with the private equity funds sponsored by THL, and the co-investors, the “Investors”).
On August 31, 2015, the Company sold inVentiv Patient Access Solutions (“iPAS”), an entity within the Company’s Commercial segment, resulting in a gain on sale of $11.3 million, which was recorded within other income in the consolidated statements of operations. We derived net revenues of $11.9 million, $16.1 and $11.3 million from iPAS for the years ended December 31, 2015, 2014 and 2013, respectively. The disposal of iPAS did not result in a strategic shift that has or will have a material impact on the Company’s consolidated financial position or results of operations. Accordingly, the disposition was not presented as a discontinued operation.
2. Summary of Significant Accounting Policies
Basis of Presentation
The consolidated financial statements, prepared in conformity with accounting principles generally accepted in the United States of America (“GAAP”), include the accounts of inVentiv and its wholly owned subsidiaries. In addition, the Company consolidates the accounts of its 60% owned subsidiary and reflects the minority interest as a noncontrolling interest classified in equity. The Company has both equity and cost method investments in securities of certain privately held entities. Investments accounted for under the equity method are recorded at the amount of the Company’s investment and adjusted each period for the Company’s share of the investee’s income or loss. During the year ended December 31, 2015, the Company recognized a $1.3 million loss on dissolution of a joint venture accounted for under the equity method, which is included in income (loss) from equity investments in the consolidated statements of operations. Investments accounted for under the cost method are recorded at the historical carrying value. The carrying value of both types of investments is recorded in other assets in the consolidated balance sheets and is immaterial. All intercompany transactions have been eliminated in consolidation.
Discontinued Operations
In 2012, the Company adopted plans to sell its medical management and sample management businesses, which were small non-core businesses within the Commercial segment. The results have been classified and presented as discontinued operations in the accompanying consolidated financial statements for 2014 and 2013. The cash flows of these businesses are also presented separately in the consolidated statements of cash flows. See Note 4 for additional information.
F-8
Table of Contents
Revenue Recognition
The Company’s revenue arrangements are typically service-based contracts which may be on a fixed price or fee-for-service basis and may include variable components such as incentive fees and performance penalties. The duration of the Company’s contracts ranges from a few months to several years, depending on the arrangement. The Company recognizes revenue when all of the following criteria are met: (i) persuasive evidence of an arrangement exists, (ii) services have been rendered, (iii) fees are fixed or determinable, and (iv) collectability is reasonably assured. The Company’s contracts do not generally contain a refund provision. The Company does not recognize revenue with respect to start-up activities including contract and scope negotiation, and feasibility analysis. The costs for these activities are expensed as incurred. Revenue related to changes in contract scope, which are subject to client approval, is recognized when amounts are determinable and realization is reasonably assured.
The Company recognizes revenue from its service contracts either using a fee-for-service method, proportional performance method, or completed contract method. For fee-for-service contracts, the Company records revenue as contractual items (i.e., “units”) are delivered to the client, or, in the event the contract is time and materials based, when labor hours are incurred. The Company uses the completed contract method when fees are not determinable until all services are delivered to the client, or, when there is uncertainty with respect to the Company’s ability to deliver the services to the client. The Company uses the proportional performance method when its fees for a service obligation are fixed pursuant to the contractual terms. Revenue is recognized as services are performed and measured on a proportional performance basis, generally using output measures that are specific to the services provided. To measure performance on a given date, the Company compares effort expended through that date to estimated total effort to complete the contract. The Company believes the best indicator of effort expended to complete its performance requirement related to its contractual obligation are the actual units delivered to the client, or the incurrence of labor hours when no other pattern of performance exists. In the event the Company uses labor hours as the basis for determining proportional performance, the Company estimates the number of hours remaining to complete its service obligation. Actual hours incurred to complete the service requirement may differ from the Company’s estimate, and such differences are accounted for prospectively.
The Company enters into multiple element arrangements in which the Company is engaged to provide multiple services under one agreement. In such arrangements, the Company records revenue as each separate service, or element, is delivered to the client. Such arrangements are predominantly within the Company’s Commercial segment where the Company is engaged to provide recruiting, deployment, and detailing services. These services may be sold individually or in combination with contractual fees that may be based on fixed fees for each element; variable fees for each element; or a combination of both fixed and variable fees. For the arrangements that include multiple elements, arrangement consideration is allocated to units of accounting based on the relative selling price. The best evidence of selling price of a unit of accounting is vendor-specific objective evidence (“VSOE”), which is the price the Company charges when the deliverable is sold separately. When VSOE is not available to determine selling price, the Company uses relevant third-party evidence (“TPE”) of selling price, if available. When neither VSOE nor TPE of selling price exists, the Company uses its best estimate of selling price (“BESP”), which generally consists of an expected margin on the cost of services.
The Company does not defer costs associated with services to a client in return for a royalty on the client’s net sales. Costs are recognized as incurred and royalties will be earned from revenues related to sales of the client’s product.
The Company’s contracts frequently undergo modifications as the work progresses due to changes in the scope of work being performed. The Company does not recognize revenue related to contract modifications until client acceptance and payment is deemed reasonably assured.
The Company may offer volume discounts to its large clients based on annual volume thresholds. The Company records an estimate of the annual volume rebate as a reduction of revenue based on the estimated rebate earned during the period.
F-9
Table of Contents
Most contracts may be terminated with advance notice from a client. In the event of termination, the Company’s contracts generally require payment for services rendered through the date of termination.
Deferred Revenue
In some cases, a portion of the contract fee is billed or paid at the time the contract is initiated or prior to the service being performed. In the event the Company bills or receives cash in advance of the services being performed, the Company records a liability denoted as deferred revenue and client advances in the accompanying consolidated balance sheets and recognizes revenue as the services are performed. For the Commercial segment, the Company is entitled to additional compensation if certain performance-based criteria are achieved over the contract duration. As there is substantive uncertainty regarding the ability to realize such amounts at the onset of the arrangements, such revenues are deferred until the Company determines it has met the performance-based criteria and the other revenue recognition criteria described above.
Reimbursable Out-Of-Pocket Expenses
The Company records reimbursable out-of-pocket expenses as a separate revenue and expense line in the consolidated statements of operations when the Company is the primary obligor in such transactions. This amount consists of such items as payments to investigators, pass through travel expenses and other out-of-pocket costs that are reimbursed by clients.
Receivables, Billed and Unbilled
In general, prerequisites for billings and payments are established by contractual provisions including predetermined payment schedules, submission of appropriate billing detail or the achievement of contract milestones, depending on contract terms. Unbilled services represent services that have been rendered for which revenue has been recognized but amounts have not been billed. Billed receivables represent amounts the Company invoiced its client according to contractual terms. The Company evaluates its receivables for collectability based on specific client circumstances, credit conditions, history of write-offs and collections. The Company records a provision for bad debts to record the receivable based on the amount the Company deems probable of collection.
Cash and Cash Equivalents and Restricted Cash
Cash and cash equivalents are comprised principally of amounts in operating cash accounts that are stated at cost, which approximates fair value, and have original maturities of three months or less.
In addition to cash equivalents, the Company held $1.6 million and $1.7 million at December 31, 2015 and 2014, respectively, of restricted cash that collateralizes certain security deposits and obligations.
Cash Pooling
inVentiv Health and certain of its international subsidiaries entered into a notional cash pooling arrangement (“Cash Pool”) to help manage global liquidity requirements. The parties to the arrangement combine their cash balances in pooling accounts with the ability to set-off overdrafts to the bank against positive cash balances. Each subsidiary receives interest on the cash balances or pays interest on amounts owed. At December 31, 2015, the Company’s net cash position in the pool of $51.0 million, defined as the gross cash position in the pool of $124.3 million less borrowings of $73.3 million, is reflected as cash and cash equivalents in the consolidated balance sheet.
F-10
Table of Contents
Property and Equipment
Property and equipment is stated at cost. The Company depreciates furniture, fixtures and office equipment on a straight-line basis over three to seven years; computer equipment and software over two to five years; and leasehold improvements over the shorter of the term of the lease or the estimated useful lives of the improvements. The Company amortizes the cost of vehicles under capital leases on a straight-line basis over their estimated useful lives, which is generally equal to or less than the applicable lease term.
Business Combinations
The Company accounts for business combinations in accordance with the acquisition method of accounting. The acquisition method of accounting requires that assets acquired and liabilities assumed be recorded at their fair values on the date of a business acquisition. The consolidated financial statements reflect the results of operations of the acquired business from the date of the acquisition.
The judgments that the Company makes in determining the estimated fair value assigned to each class of assets acquired and liabilities assumed, as well as asset lives, can materially impact earnings in periods following a business combination. The Company generally uses either the income, cost or market approach to determine the appropriate fair values. The income approach presumes that the value of an asset can be estimated by the net economic benefit to be received over the life of the asset, discounted to a present value. The cost approach presumes that an investor would pay no more for an asset than its replacement or reproduction cost. The market approach estimates value based on what other participants in the market have paid for reasonably similar assets. Although each valuation approach is considered in valuing the assets acquired, the approach ultimately selected for each asset or class of assets or liabilities assumed is based on the relevant characteristics and the availability of information.
The Company records contingent consideration resulting from a business combination at its fair value on the acquisition date. Each reporting period thereafter, the Company revalues these obligations and records increases or decreases in their fair value as an adjustment to selling, general and administrative (“SG&A”) expenses within the consolidated statements of operations. The changes in the fair value of the contingent consideration obligation are the result of updates to the achievement of expected financial targets and the weighted probability of achieving future financial targets.
Significant judgment is employed in determining the appropriateness of these valuation assumptions as of the acquisition date and for each subsequent period. Accordingly, any change in these valuation assumptions could have an impact on the Company’s financial statements. See Note 3 for additional information.
Goodwill and Indefinite-lived Intangible Assets
Goodwill represents the amount of the purchase price in excess of the fair values assigned to the underlying identifiable net assets of acquired businesses. Goodwill and other indefinite-lived intangible assets, such as tradenames, are assessed annually for potential impairment on October 1 or when management determines that the carrying value of goodwill or an indefinite-lived intangible asset may not be recoverable based upon the existence of certain indicators of impairment, such as a loss of a significant client, a significant change to the Company’s regulatory environment that hinders the ability to conduct business, or a significant downturn in the economy. Goodwill is tested for impairment at the reporting unit level, which is one level below the operating segment level. The Company identified 14 reporting units with goodwill assigned during 2015. As part of the Company’s annual goodwill impairment testing, the Company first assesses qualitative factors to determine whether it is more likely than not that the fair value of a reporting unit is less than its carrying value. Qualitative factors assessed at the reporting unit level include, but are not limited to, macroeconomic, industry and market conditions, competitive environments, results of past impairment tests, new service offerings, cost factors and financial performance of the reporting unit. If the Company chooses not to complete a quantitative assessment
F-11
Table of Contents
for a given reporting unit or it the initial assessment indicates that it is more likely than not that the carrying value of a reporting unit exceeds its estimated fair value, performance of the two-step quantitative impairment test is required. The first step compares the fair value of the reporting unit to its carrying value. If the carrying value exceeds the fair value, the second step of the test is performed to measure the amount of impairment loss, if any. The second step compares the implied fair value of reporting unit goodwill with the carrying value of that goodwill. To calculate the implied fair value of goodwill in this second step, the Company allocates the fair value of the reporting unit to all of the assets and liabilities of that reporting unit (including any previously unrecognized intangible assets) as if the reporting unit had been acquired in a current business combination and the fair value was the price paid to acquire the reporting unit. The excess of the fair value of the reporting unit over the amount assigned to the assets and liabilities of the reporting unit represents the implied fair value of goodwill. If the carrying value of goodwill exceeds the implied fair value of goodwill, an impairment loss is recognized for that difference. See Note 5 for additional information.
Testing indefinite-lived intangible assets, other than goodwill, for impairment requires a one-step approach. As part of the Company’s annual indefinite-lived intangible impairment testing, the Company may first assess qualitative factors to determine whether it is more likely than not that the fair value of the intangible is less than its carrying value. Qualitative factors include, but are not limited to, macroeconomic, industry and market conditions, competitive environments, results of past impairment tests, new service offerings, cost factors and financial performance of the reporting unit. If the carrying amount of indefinite-lived intangible assets exceeds the fair value, an impairment loss is recognized equal to the excess. The process of estimating the fair value of indefinite-lived intangible assets is subjective and requires the use of estimates. Such estimates include, but are not limited to, future operating performance and cash flows, royalty rate, terminal growth rate, and discount rate. See Note 6 for additional information.
Long-lived Assets
The Company reviews its long-lived assets, including finite-lived intangible assets and property and equipment, for impairment whenever events or circumstances indicate that the carrying value of an asset may not be recoverable. Events or circumstances that would result in an impairment review primarily include sustained operating losses or a significant change in the use of an asset. Determination of recoverability is based on an estimate of undiscounted future cash flows resulting from the use of the asset and its eventual disposition. Should we determine that the carrying values of held-for-use long-lived assets may not be recoverable, we will measure any impairment based on a projected discounted cash flow method. We may also estimate fair value based on market prices for similar assets, as appropriate. Significant judgments are required to estimate future cash flows, including the selection of appropriate discount rates, projected cash flows from the use of an asset and other assumptions. Changes in these estimates and assumptions could materially affect the determination of fair value for these assets. An impairment loss would be recognized based on the amount by which the carrying value of the asset exceeds its fair value. See Note 6 for additional information.
Customer Relationships
An important element in most of the Company’s acquisition agreements are customer relationships, which primarily arise from the allocation of the purchase price of the respective businesses acquired. Customer relationships are finite-lived intangible assets.
The valuation of the Company’s customer relationships and the determination of their appropriate useful lives require substantial judgment. In the Company’s evaluation of the appropriate useful lives of these assets, the Company considers the nature and terms of the underlying agreements; the historical breadth of the respective customer relationships; and the projected growth of the customer relationships. The Company determines the useful lives of the customer relationships by analyzing historical customer attrition rates. The Company amortizes its customer relationships over their estimated useful lives using a straight-line method, which generally ranges from three to fifteen years. For these customer relationships, evaluations for impairment are performed only if facts and circumstances indicate that the carrying value may not be recoverable.
F-12
Table of Contents
Claims and Insurance Accruals
The Company maintains self-insured retention limits for certain insurance policies including employee medical, automobile insurance and workers’ compensation. The liabilities associated with the risk retained by the Company are estimated, in part, based on historical experience, third-party actuarial analysis, demographics, nature and severity, past experience and other assumptions, which have been consistently applied. The liabilities for self-funded retention are included in claims and insurance reserves based on claims incurred and recorded in accrued payroll, accounts payable and accrued expenses in the consolidated balance sheets. Liabilities for unsettled claims and claims incurred but not yet reported are actuarially determined using current workers’ compensation and auto liability claims activity. Reserves are estimated based on management’s evaluation of the nature and severity of individual claims and historical experience. However, these estimated accruals could be significantly affected if the Company’s actual costs differ from these assumptions. A significant number of these claims typically take several years to develop and even longer to ultimately settle. The Company believes its estimation methodology is reasonable; however, assumptions regarding severity of claims, medical cost inflation, as well as specific case facts can create short-term volatility in estimates. The amounts are immaterial as of December 31, 2015 and 2014.
Asset Retirement Obligations
The Company reviews legal obligations associated with the retirement of long-lived assets that result from contractual obligations or the acquisition, construction, development and normal use of those assets. If it is determined that a legal obligation exists, regardless of whether the obligation is conditional on a future event, the fair value of the liability for an asset retirement obligation is recognized in the period in which it is incurred, if a reasonable estimate of fair value can be made. The fair value of the liability is added to the carrying amount of the associated asset, and this additional carrying amount is depreciated over the life of the asset. The difference between the gross expected future cash flows and its present value is accreted over the life of the related lease as SG&A expense. At December 31, 2015 and 2014, the Company recorded asset retirement obligations of $4.3 million and $2.9 million, respectively. The amounts recognized are based on certain estimates and assumptions, including future retirement costs, future inflation rates and the credit-adjusted risk-free interest rate.
Income Taxes
Deferred tax assets and liabilities are determined based on the difference between the financial reporting and the tax bases of assets and liabilities and are measured using the tax rates and laws that apply to taxable income in the years in which those temporary differences are expected to be recovered or settled. A valuation allowance is established, when necessary, to reduce deferred income tax assets to the amount that is more likely than not to be realized. Realization is dependent on generating sufficient taxable income to recover the deferred tax assets, including income generation prior to the expiration of any loss carryforwards or capital losses. The deferred tax asset may be reduced in the future if estimates of future taxable income during the carryforward period decrease.
Income tax benefits are recognized when the Company believes that if a dispute arose with the taxing authority and were taken to a court of last resort, it is more likely than not (i.e., a probability greater than 50 percent) that the tax position would be sustained as filed based on the technical merits of a tax position. If a position is determined to be more likely than not of being sustained, the Company recognizes the largest amount of tax benefit that is greater than 50 percent likely of being realized upon ultimate settlement with the taxing authority. In addition, the Company maintains reserves for uncertain tax benefits, which are included in non-current income tax liability in its consolidated balance sheets. The Company periodically reviews these reserves to determine if adjustments to these balances are necessary. The Company recognizes interest and penalties related to uncertain tax positions in income tax expense.
F-13
Table of Contents
Foreign Currency Translation
The financial statements of the Company’s subsidiaries expressed in foreign currencies are translated from the respective functional currencies to U.S. Dollars, with results of operations and cash flows translated at average exchange rates during the period, and assets and liabilities translated at end of the period exchange rates. At December 31, 2015 and 2014, the accumulated other comprehensive loss related to foreign currency translation adjustments were approximately $37.6 million and $27.3 million, respectively. Foreign currency transaction gains (losses) were $(0.6) million, $(0.3) million and less than $(0.1) million for the years ended December 31, 2015, 2014 and 2013, respectively, and are included in SG&A expenses within the consolidated statements of operations.
Fair Value of Financial Instruments
The carrying amount of cash and cash equivalents, restricted cash, accounts receivable, unbilled services, accounts payable, short-term borrowings, capital leases and other financing arrangements approximate fair value because of the relatively short maturity of these instruments or consistency of the terms of such instruments and current market rates. For disclosure purposes, the Company estimates the fair value of its long-term debt based upon quoted market prices for the same or similar issues, or on the current rates offered for debt with the same remaining maturities.
Concentration of Credit Risk
The Company’s receivables are concentrated with major pharmaceutical companies. Credit risk is managed through the continuous monitoring of exposures with the Company’s clients. The Company does not require collateral or other security to support client receivables. For the years ended December 31, 2015, 2014 and 2013, one client accounted for approximately 10%, 10% and 12% of the Company’s net revenues, respectively. For the years ended December 31, 2015, 2014 and 2013, our top 10 clients accounted for approximately 54%, 48% and 46% of our revenues, respectively. As of December 31, 2015 one client represented approximately 12% of the accounts receivable balance. As of December 31, 2014, no client represented more than 10% of the accounts receivable balance.
Share-Based Payment Awards
The Company recognized $4.3 million, $0.6 million and $(1.8) million of share-based compensation expense (credit) during the years ended December 31, 2015, 2014 and 2013, respectively. The Company accounts for its share-based compensation under the fair value method and uses the Black-Scholes option pricing model to value its options, or the Monte Carlo model for awards that include market conditions, to estimate the fair value of the share-based awards. Due to the absence of an active market for the Company’s common stock, the fair value of its common stock for purposes of determining the exercise price for award grants was determined based on a number of factors, including: the common stock underlying the award involved illiquid securities in a private company; results of operations and financial position; material business risks; the status of implementation of the Company’s business strategy; market performance of comparable publicly traded companies and recently completed merges and acquisitions of comparable companies; the likelihood of achieving a liquidity event for the holders of the Company’s common stock given prevailing market conditions; and external market conditions affecting the industry.
Use of Forecasted Financial Information in Accounting Estimates
The use of forecasted financial information is inherent in many of the Company’s accounting estimates, including but not limited to, determining the estimated fair value of goodwill and intangible assets that is used in the Company’s impairment analysis, matching intangible asset amortization to underlying benefits (e.g., sales and cash inflows) and evaluating the realizability of deferred tax assets. Such forecasted financial information is
F-14
Table of Contents
comprised of numerous assumptions regarding the Company’s future revenues, operational results and cash flows. Management believes that its financial forecasts used for such purposes are reasonable and appropriate based upon current facts and circumstances. Because of the inherent nature of forecasts, however, actual results may differ from these forecasts.
Reclassifications
The Company reclassified certain costs from SG&A expenses to cost of revenues for 2014 and 2013 to conform to the presentation adopted for 2015. The revised classification aligns all personnel and related costs associated with service delivery within cost of revenues, along with the associated information technology costs supporting these processes. These changes better harmonize the accounting policies of the group, and are consistent with how management is assessing performance and managing costs. As a result of the revision in the classification of the costs, SG&A was reduced by $35.2 million and $28.7 million in 2014, and 2013, respectively, and cost of revenues has increased by a corresponding amount. The reclassification had no impact on our consolidated financial position, net operating results included in our statements of operations or cash flows. The Company also aggregated the presentation of certain line items in the consolidated statements of cash flows in 2015, and 2014 and 2013 years have been adjusted to conform to the current year presentation.
Use of Estimates
The consolidated financial statements include certain amounts that are based on management’s best estimates and judgments. Estimates are used in determining items such as revenue recognition, reserves for accounts receivable, certain assumptions related to goodwill and intangible assets, deferred tax asset valuation, claims and insurance accruals, stock-based compensation and amounts recorded for contingencies and other reserves. Because of the uncertainty inherent in such estimates, actual results may differ from these estimates.
Recent Accounting Pronouncements
In February 2016, the Financial Accounting Standards Board (“FASB”) issued Accounting Standards Update 2016-02 (“ASU 2016-02”), Leases (Topic 842) to increase transparency and comparability among organizations by recognizing lease assets and liabilities on the balance sheet and disclosing key information about leasing arrangements. ASU 2016-02 requires that operating leases recognize a right-of-use asset and a lease liability measured at the present value of the lease payments in the statement of financial position, recognize a single lease cost allocated over the lease term on a generally straight-line basis, and classify all cash payments within operating activities in the statement of cash flows. ASU 2016-02 requires that capital leases, now called finance leases, recognize a right-of-use asset and a lease liability measured at the present value of the lease payments in the statement of financial position, recognize interest on the lease liability separately from amortization of the right-of-use asset in the statement of comprehensive income, and classify repayments of the principal portion of the lease liability within financing activities and payments of interest on the lease liability and variable lease payments within operating activities in the statement of cash flows. Initial costs directly attributable to negotiating and arranging the lease will be included in the asset. For leases with a term of 12 months or less, a lessee can make an accounting policy election by class of underlying asset to not recognize an asset and corresponding liability. Lessees will also be required to provide additional qualitative and quantitative disclosures regarding the amount, timing and uncertainty of cash flows arising from leases. ASU 2016-2 also provides specific guidance for sale and leaseback transactions, build-to-suit leases and amounts previously recognized in accordance with the business combinations guidance for leases. ASU 2016-02 will be applied on a modified retrospective basis and to each prior reporting period presented and is effective for interim and annual reporting periods beginning after December 15, 2018. Early adoption is permitted. The Company is currently evaluating the impact of adopting ASU 2016-2 on the Company’s consolidated financial position, results of operations and cash flows.
F-15
Table of Contents
In November 2015, the FASB issued ASU 2015-17, Income Taxes: Balance Sheet Classification of Deferred Taxes (Topic 740) (“ASU 2015-17”) to simplify the balance sheet classification of deferred income taxes. ASU 2015-17 requires that deferred tax liabilities and assets be classified as noncurrent in a classified statement of financial position. ASU 2015-17 may be applied either retrospectively to each period presented or on a prospective basis and is effective for interim and annual periods beginning after December 15, 2016. Early adoption is permitted. The Company early adopted ASU 2015-17 effective December 31, 2015 on a prospective basis. Adoption of this guidance resulted in a reclassification of the Company’s current deferred tax assets to non-current deferred tax assets in the Company’s consolidated balance sheet as of December 31, 2015. The deferred tax assets and liabilities of the prior periods were not retrospectively adjusted. The impact of this guidance on the consolidated balance sheet was not material.
In April 2015, the FASB issued ASU 2015-03, Interest-Imputation of Interest: Simplifying the Presentation of Debt Issuance Costs (“ASU 2015-03”). ASU 2015-03 requires that debt issuance costs be presented in the balance sheet as a deduction from the carrying amount of the related debt and not as a deferred charge presented in other assets on the Company’s consolidated balance sheets. The recognition and measurement guidance for debt issuance costs are not affected by the new amendment. ASU 2015-03 will be applied on a retrospective basis and to each prior reporting period presented and is effective for interim and annual reporting periods beginning after December 15, 2015. Early adoption is permitted. In August 2015, the FASB issued ASU 2015-15 to amend the presentation and subsequent measurement of debt issuance costs associated with line-of-credit arrangements. ASU 2015-15 permits presenting debt issuance costs for a line-of-credit as an asset and subsequently amortizing the deferred debt issuance costs ratably over the term of the line-of-credit arrangement, regardless of whether there are any outstanding borrowings on the line-of-credit arrangement. The Company adopted this guidance early, as of December 31, 2015 resulting in a reclassification of deferred financing costs to reduce the carrying amount of the debt by $35.4 million and $49.4 million as of December 31, 2015 and 2014, respectively. Deferred financing costs totaling $3.6 million and $4.3 million as of December 31, 2015 and 2014, respectively, relate to line-of-credit costs and are included in other assets in the consolidated balance sheets.
In May 2014, the FASB issued ASU 2014-09, Revenue from Contracts with Customers (Topic 606), which provides guidance for revenue recognition (“ASU 2014-09”). ASU 2014-09 will supersede the revenue recognition requirements in Revenue Recognition (Topic 605), and most industry-specific guidance. In July 2015, the FASB deferred the effective date of the new revenue recognition standard by one year, and it is effective for interim and annual periods beginning after December 15, 2017. Early adoption is permitted, but no earlier than the original effective date of January 1, 2017. The Company is currently evaluating the impact of adopting ASU 2014-09 on the Company’s consolidated financial position and results of operations.
In April 2014, the FASB issued ASU 2014-08, Reporting Discontinued Operations and Disclosures of Disposals of Components of an Entity (“ASU 2014-08”). ASU 2014-08 changes the criteria for reporting a discontinued operation. Under ASU 2014-08, a disposal of a part of an organization that has (or will have) a major effect on its operations and financial results is a discontinued operation. ASU 2014-08 applies prospectively for all disposals or components of the Company’s business classified as held for sale during fiscal periods beginning after December 15, 2014. The adoption of ASU 2014-08 did not have a material impact on the Company’s consolidated financial position or results of operations, although the impact will depend on the extent of any future discontinued operations.
3. Acquisitions
The Company has accounted for its business combinations using the acquisition method. Purchase prices have been allocated to the tangible assets and identifiable intangible assets acquired and liabilities assumed based upon their relative fair values. The excess of the purchase price over the tangible and intangible assets acquired and liabilities assumed has been recorded as goodwill.
F-16
Table of Contents
Catalina Health Acquisition
On October 25, 2013, the Company completed the acquisition of Catalina Health Resource, LLC (“Catalina Health”), a provider of tailored, direct-to-patient medication adherence programs, for no cash consideration at closing. This acquisition expands the Company’s physician and pharmacy partner network and further streamlines the delivery of effective adherence communications. The purchase price is a 5 year contingent earnout obligation based on the combined performance, as defined by the agreement, of Catalina Health and the Company’s existing patient adherence business, which is included in the Company’s Commercial segment. As of December 31, 2015, there is no remaining goodwill for this acquisition.
i3 Global Acquisition
On June 10, 2011, the Company completed the acquisition of i3 Global from UHG for approximately $375.9 million in cash. The purchase price of i3 Global was subject to post-closing adjustment based on the final determination of certain net income before interest expense, income tax provision, depreciation and amortization (“EBITDA”) and working capital calculations. On May 6, 2013, the Company and UHG finalized the purchase price resulting in a $14.2 million payment to the Company, which is recorded in the consolidated statement of operations separately as proceeds from purchase price finalization.
Campbell Acquisition
On February 11, 2011, the Company completed the acquisition of Campbell Alliance Group, Inc. (“Campbell”) for approximately $122.2 million, consisting of cash consideration of $113.3 million and rollover equity of $8.9 million. The acquisition of Campbell enhanced the Company’s ability to offer consulting services to biopharmaceutical clients with products in various stages of product development. In connection with the acquisition of Campbell, the Company issued unsecured contingent installment notes (the “Campbell Notes”) to certain members of Campbell management (the “Holders”) in which approximately $13.0 million of pre-acquisition equity in Campbell was “rolled over” into the Campbell Notes.
In March 2014, the Company and the Holders agreed to an early termination of the Campbell Notes. In consideration of the termination of the Campbell Notes, the Company agreed to pay the Holders a total of $5.25 million. Of this amount, $1.5 million, $1.75 million and $2.0 million were paid in March 2014, February 2015 and January 2016, respectively.
4. Discontinued Operations
In 2012, the Company adopted plans to sell its sample management and medical management businesses, which were small non-core businesses within the Commercial segment. On April 2, 2013, the Company completed the sale of its sample management business. The Company abandoned its medical management business in 2014.
The following table sets forth the results of the discontinued operations (in thousands):
| For the Year Ended December 31, | ||||||||
| 2014 | 2013 | |||||||
| Net revenues |
$ | 3,254 | $ | 19,908 | ||||
| Pre-tax income (loss) from discontinued operations |
(8,163 | ) | (20,228 | ) | ||||
| Income tax (provision) benefit from discontinued operations |
— | — | ||||||
| Net income (loss) from discontinued operations |
(8,163 | ) | (20,228 | ) | ||||
F-17
Table of Contents
The pre-tax loss from discontinued operations includes non-cash long-lived asset impairment charges of $12.8 million for the year ended December 31, 2013.
5. Goodwill
The following table sets forth the carrying amount of goodwill as of December 31, 2015 and 2014 (in thousands):
| Clinical | Commercial | Total | ||||||||||
| Net goodwill at January 1, 2014 |
$ | 382,363 | $ | 567,845 | $ | 950,208 | ||||||
| Adjustments to purchase price allocation (1) |
— | 1,367 | 1,367 | |||||||||
| Impairment charges |
— | (15,795 | ) | (15,795 | ) | |||||||
| Foreign currency translation |
(47 | ) | (3,946 | ) | (3,993 | ) | ||||||
|
|
|
|
|
|
|
|||||||
| Net goodwill at December 31, 2014 |
382,316 | 549,471 | 931,787 | |||||||||
|
|
|
|
|
|
|
|||||||
| Accumulated impairments at December 31, 2014 |
(267,141 | ) | (177,162 | ) | (444,303 | ) | ||||||
|
|
|
|
|
|
|
|||||||
| Impairment charges |
— | (33,964 | ) | (33,964 | ) | |||||||
| Foreign currency translation |
(101 | ) | (2,353 | ) | (2,454 | ) | ||||||
|
|
|
|
|
|
|
|||||||
| Net goodwill at December 31, 2015 |
382,215 | 513,154 | 895,369 | |||||||||
|
|
|
|
|
|
|
|||||||
| Accumulated impairments at December 31, 2015 |
(267,141 | ) | (211,126 | ) | (478,267 | ) | ||||||
|
|
|
|
|
|
|
|||||||
| Gross goodwill at December 31, 2015 |
$ | 649,356 | $ | 724,280 | $ | 1,373,636 | ||||||
|
|
|
|
|
|
|
|||||||
| (1) | Adjustment relates to the October 25, 2013 acquisition of Catalina Health, which was not reflected as of December 31, 2013 as the impact of the retrospective application was immaterial. |
The Company performs annual impairment tests on goodwill assets in the fourth quarter, or when events occur or circumstances change that would, more likely than not, reduce the fair value of a reporting unit below its carrying value. During the fourth quarter of 2015, the Company utilized a qualitative assessment (step zero) for 5 of its 14 reporting units with goodwill where the fair value substantially exceeded the carrying value in the prior year step one analysis. After weighing all relevant events and circumstances, the Company concluded that it is not more-likely-than-not that the fair value of these reporting units was less than their carrying value. Consequently, the Company did not perform a step one quantitative assessment for these reporting units in 2015. These reporting units represented $589.2 million or 66% of the goodwill reported on the consolidated balance sheet at December 31, 2015. For 2014 and 2013, the Company elected to proceed directly to the step one quantitative analysis rather than perform the step zero qualitative assessment for all of its reporting units.
The Company utilized an income approach to measure the fair value of its reporting units for which a step zero qualitative assessment was not performed. The income approach utilized a discounted cash flow analysis, which requires the use of significant estimates and assumptions, including long-term projections of future cash flows, market conditions, discount rates reflecting the risk inherent in future cash flows, revenue growth and profitability. The revenue and earnings growth assumptions reflect current backlog, near term trends, potential opportunities and planned investment in the reporting units. The projections reflect expected cash flows for the next five years and a 2-3% revenue growth rate applied thereafter. The discounted cash flow analyses assumed weighted average cost of capital discount rates ranging from 11% - 13% in 2015, 10% - 13% in 2014 and 11% - 12% in 2013.
The result of the first step of the goodwill impairment analysis indicated the fair value of certain of the Company’s reporting units were less than the carrying value in each of the three years ended December 31, 2015. Step two of the goodwill impairment test was performed, utilizing significant unobservable inputs that cause the
F-18
Table of Contents
determination of the implied fair value of goodwill to fall within level three of the GAAP fair value hierarchy. The step two assessment performed by the Company resulted in the recognition of pre-tax non-cash goodwill impairment charges in 2015, 2014 and 2013. Impairment charges were recognized for reporting units that have not met forecasted revenue and earnings growth due to slower than anticipated market demand, discontinuation of service lines and project delays. As a result of these factors, the forecasted operating results were reduced and impairment charges were recognized. The Company recorded impairment charges in 2015, 2014 and 2013 of $34.0 million, $15.8 million and $34.4 million, respectively, within the Commercial segment and $2.5 million within the Clinical segment in 2013. The pre-tax non-cash goodwill impairment charge of $34.0 million for the year ended December 31, 2015 related to the patient outcomes service offering for which impairment charges were taken in the prior year and for which forecasted revenue and earnings growth have not been met due to slower than anticipated market demand. There is no remaining goodwill for this reporting unit as of December 31, 2015.
These non-cash impairment charges do not impact the Company’s liquidity, compliance with any covenants under its debt agreements or potential future results of operations. As of December 31, 2015, there was $135.3 million of goodwill associated with five reporting units for which the fair value of those reporting units does not significantly exceed the respective carrying values as of the most recent annual impairment assessment. If future cash flows are less than those forecasted and included in our fair value estimates, additional impairment charges may be required for these or other reporting units.
The impairment analysis requires significant judgments, estimates and assumptions. There is no assurance that the actual future earnings or cash flows of the reporting units will not decline significantly from the projections used in the impairment analysis. Goodwill impairment charges may be recognized in future periods in one or more of the reporting units to the extent changes in factors or circumstances occur, including deterioration in the macroeconomic environment, industry, deterioration in the Company’s performance or its future projections, or changes in plans for one or more reporting units.
6. Intangible Assets
The following table sets forth the carrying amount of the Company’s intangible assets as of December 31, 2015 and 2014 (in thousands):
| December 31, 2015 | December 31, 2014 | |||||||||||||||||||||||||||
| Gross | Accumulated Amortization |
Net | Weighted Average Amortization Period |
Gross | Accumulated Amortization |
Net | ||||||||||||||||||||||
| Customer relationships |
$ | 365,777 | $ | (148,679 | ) | $ | 217,098 | 11.9 years | $ | 405,021 | $ | (128,510 | ) | $ | 276,511 | |||||||||||||
| Technology |
27,003 | (26,206 | ) | 797 | 5.0 years | 27,832 | (23,442 | ) | 4,390 | |||||||||||||||||||
| Tradenames subject to amortization |
18,293 | (16,657 | ) | 1,636 | 3.3 years | 24,505 | (18,513 | ) | 5,992 | |||||||||||||||||||
| Backlog |
95,014 | (89,427 | ) | 5,587 | 4.1 years | 95,015 | (80,447 | ) | 14,568 | |||||||||||||||||||
| Other |
1,020 | (585 | ) | 435 | 8.5 years | 1,020 | (465 | ) | 555 | |||||||||||||||||||
|
|
|
|
|
|
|
|
|
|
|
|
|
|||||||||||||||||
| Total finite-lived intangible assets |
507,107 | (281,554 | ) | 225,553 | 553,393 | (251,377 | ) | 302,016 | ||||||||||||||||||||
| Tradenames not subject to amortization |
109,093 | — | 109,093 | 115,808 | — | 115,808 | ||||||||||||||||||||||
|
|
|
|
|
|
|
|
|
|
|
|
|
|||||||||||||||||
| Total intangible assets |
$ | 616,200 | $ | (281,554 | ) | $ | 334,646 | $ | 669,201 | $ | (251,377 | ) | $ | 417,824 | ||||||||||||||
|
|
|
|
|
|
|
|
|
|
|
|
|
|||||||||||||||||
The Company recorded a pre-tax non-cash intangible asset impairment charge of $28.5 million and $3.3 million within the Commercial segment related to the carrying value of finite-lived intangible assets for the years ended December 31, 2015 and 2014, respectively. The Company recorded a pre-tax non-cash intangible
F-19
Table of Contents
asset impairment charge of $1.9 million related to the carrying value of finite-lived intangible assets, $1.1 million within the Commercial segment and $0.8 million within the Clinical segment, for the years ended December 31, 2013. The Company also recorded a pre-tax non-cash intangible asset impairment charge of $6.7 million and $4.1 million within the Commercial segment related to the carrying value of indefinite-lived intangible assets for the years ended December 31, 2015 and 2014, respectively. There were no impairment charges related to indefinite-lived intangible assets for the year ended December 31, 2013. The intangible asset impairment charges were a result of not meeting or expected to meet in the future the previously forecasted revenue and earnings growth. All impairment charges were included in the impairment of long-lived assets line in the consolidated statements of operations.
The fair value of the intangibles that were subject to impairment was determined using the income approach. The pretax intangible impairment charges for the year ended December 31, 2015 included $33.0 million related to intangibles used in the patient outcomes service offering for which impairment charges were taken in the prior year and for which forecasted revenue and earnings growth have not been met due to slower than anticipated market demand. The remaining impairment charges in 2015 reflected a change in the planned use of a tradename, which is expected to be subject to a shorter useful life. These non-cash impairment charges do not impact the Company’s liquidity, compliance with any covenants under its debt agreements or potential future results of operations. The impairment analysis requires significant judgments, estimates and assumptions. If future cash flows are less than those forecasted and included in our fair value estimates, additional impairment charges may be required.
The following is a schedule of future amortization expense for finite-lived intangible assets held as of December 31, 2015 (in thousands):
| Years Ending December 31, | Amount | |||
| 2016 |
$ | 36,450 | ||
| 2017 |
31,123 | |||
| 2018 |
30,652 | |||
| 2019 |
30,312 | |||
| 2020 |
26,550 | |||
| Thereafter |
70,466 | |||
|
|
|
|||
| Total future amortization expense |
$ | 225,553 | ||
|
|
|
|||
These amounts may vary as acquisitions and disposals occur in the future.
7. Property and Equipment, Net
Property and equipment consist of the following (in thousands):
| December 31, | ||||||||
| 2015 | 2014 | |||||||
| Buildings and leaseholds improvements |
$ | 51,530 | $ | 46,929 | ||||
| Computer equipment and software |
130,992 | 116,891 | ||||||
| Vehicles |
71,408 | 47,326 | ||||||
| Furniture and fixtures |
16,164 | 16,379 | ||||||
|
|
|
|
|
|||||
| 270,094 | 227,525 | |||||||
| Accumulated depreciation |
(128,062 | ) | (105,666 | ) | ||||
|
|
|
|
|
|||||
| Property and Equipment, net |
$ | 142,032 | $ | 121,859 | ||||
|
|
|
|
|
|||||
Depreciation expense for property and equipment (including vehicles under capital lease) totaled $47.5 million, $40.6 million and $33.8 million for the years ended December 31, 2015, 2014 and 2013, respectively.
F-20
Table of Contents
The Company leases vehicles for certain sales representatives in the Commercial segment and those leases are accounted for as capital leases. At December 31, 2015 and 2014, the gross book value of leased vehicles is $71.4 million and $47.2 million, respectively, and accumulated depreciation was $18.4 million and $13.7 million, respectively. Depreciation expense related to such vehicle leases was $20.6 million, $13.2 million and $9.6 million for the years ended December 31, 2015, 2014 and 2013, respectively.
8. Accrued Payroll, Accounts Payable and Accrued Expenses
Accrued payroll, accounts payable and accrued expenses consist of the following (in thousands):
| December 31, | ||||||||
| 2015 | 2014 | |||||||
| Accrued payroll and related employee benefits |
$ | 142,138 | $ | 101,363 | ||||
| Accounts payable |
51,725 | 44,581 | ||||||
| Accrued interest |
34,836 | 36,316 | ||||||
| Accrued rebates |
12,602 | 16,126 | ||||||
| Other accrued expenses |
92,425 | 88,227 | ||||||
|
|
|
|
|
|||||
| Total |
$ | 333,726 | $ | 286,613 | ||||
|
|
|
|
|
|||||
9. Debt
The Company’s indebtedness is summarized as follows (in thousands):
| December 31, | ||||||||
| 2015 | 2014 | |||||||
| Senior Secured Credit Facilities: |
||||||||
| Term Loan Facility B3 loans, due 2018 |
$ | 129,645 | $ | 129,645 | ||||
| Term Loan Facility B4 loans, due 2018 |
445,694 | 445,694 | ||||||
| Senior Secured Notes, due 2018 |
625,000 | 625,000 | ||||||
| ABL Facility |
— | — | ||||||
| Junior Lien Secured Notes, due 2018 |
569,691 | 507,000 | ||||||
| Senior Unsecured Notes, due 2018 |
376,316 | 376,316 | ||||||
| International Facility |
— | — | ||||||
| Capital leases and other financing arrangements |
68,591 | 45,589 | ||||||
|
|
|
|
|
|||||
| Total borrowings |
2,214,937 | 2,129,244 | ||||||
| Less: unamortized premium (discount) |
(9,030 | ) | (12,423 | ) | ||||
| Less: unamortized deferred financing costs |
(35,431 | ) | (49,380 | ) | ||||
| Less: current portion of capital leases and other financing arrangements |
(23,333 | ) | (16,265 | ) | ||||
|
|
|
|
|
|||||
| Total long-term borrowings, net of current portion |
$ | 2,147,143 | $ | 2,051,176 | ||||
|
|
|
|
|
|||||
Repayment of long term debt
The following table displays the required minimum future repayment of the Company’s debt, excluding capital leases and other financing arrangements as well as any mandatory prepayments that may be required if the Company incurs additional indebtedness, exceeds an annual excess cash flow target, or if inVentiv Health completes certain asset sales:
| Year Ending December 31, |
(in thousands) | |||
| 2018 |
$ | 2,146,346 | ||
|
|
|
|||
| Total |
$ | 2,146,346 | ||
|
|
|
|||
F-21
Table of Contents
Senior Secured Credit Facilities
At December 31, 2015, inVentiv Health had $575.3 million outstanding under the Senior Secured Credit Facilities, which consisted of $129.6 million under the B3 term loans and $445.7 million under the B4 term loans.
On December 20, 2012, inVentiv Health amended the terms of the Senior Secured Credit Facilities to allow for the offering of $600 million principal amount of the Senior Secured Notes (as defined below). The proceeds of the offering were used to repay $488.9 million on the Senior Secured Credit Facilities B1-2 and B-3 term loans, including the settlement of the 1% per annum principal payment on the B1-2 and B-3 term loans due prior to the final maturity date, and $97.5 million outstanding on the Revolving Facility. inVentiv Health also amended the terms of the Senior Secured Credit Facilities to (a) permit inVentiv Health to enter into an asset-based credit facility of up to $150.0 million as an alternative to the Revolving Facility and (b) eliminate the financial maintenance covenants, except in certain circumstances when the balance on the Revolving Facility exceeded a threshold.
In connection with the amendment, the Company recorded a loss of $18.6 million related to debt that was repaid, comprising $11.5 million of existing deferred financing costs and $7.1 million of lender fees paid in connection with the refinancing. The Company capitalized $17.0 million of third party costs. On July 28, 2014, in connection with the Junior Lien Notes Exchange Offer (as defined below), inVentiv Health’s term loan facility and asset-backed revolving facility were amended on July 28, 2014 (the “Credit Agreement Amendments”) to permit the Junior Lien Notes Exchange Offer, the New Money Investment (discussed below) and the issuance of the Backstop Consideration (discussed below) and to extend the maturities of certain outstanding term loans from 2016 to 2018. The margin on the term loans increased by 0.25% when compared to the interest rates on the prior term loans. There was no net change in the outstanding principal balance of the term loans as a result of the modified terms. In connection with these transactions, inVentiv Health recognized a loss on extinguishment of debt and refinancing costs of approximately $10.1 million in the third quarter of 2014. The extinguishment of debt relates to the write-off of unamortized deferred borrowing costs associated with non-participating lenders and the refinancing costs represent the third party fees associated with the transactions that were deemed a modification as the terms of the new debt instruments were not substantially different than the prior instruments.
Borrowings under the Senior Secured Credit Facilities are secured by a senior lien on all of inVentiv Health’s and its domestic subsidiaries’ assets on par with the lien granted to the holders of inVentiv Health’s Senior Secured Notes and subject to a first priority lien on the current assets pledged pursuant to the ABL Facility. Amounts borrowed under the Senior Secured Credit Facilities are subject to an interest rate per annum equal to an applicable margin plus, at inVentiv Health’s option, either (a) for base rate loans, a base rate determined by reference to the highest of (i) the prime rate of Citibank, N.A., (ii) 2.5%, or (iii) the one month US Dollar LIBOR rate plus 1.0% or (b) for Eurodollar rate loans, a rate determined by reference to the highest of (i) the US Dollar LIBOR rate based on the term of the borrowing or (ii) 1.50%. As noted above, on July 28, 2014, inVentiv Health amended the Senior Secured Credit Facilities to extend the maturity date of the B1-2 loans to May 2018 from August 2016 by replacing the B1-2 loans with new B4 loans. All of inVentiv Health’s outstanding term loans issued pursuant to the Senior Secured Credit Facilities now mature in May 2018. As of December 31, 2015 and 2014, margins on the Senior Secured term B3 loans were 6.25% for Eurodollar Rate loans and 5.25% for Base Rate loans. As of December 31, 2015 and 2014, margins on Senior Secured term B4 loans were 6.25% for Eurodollar Rate loans and 5.25% for Base Rate loans. The weighted average interest rate at December 31, 2015 was 7.75%. The terms contained in the Senior Secured Credit Facilities provide for customary events of default and contains covenants limiting, among other things, the ability of inVentiv Health and its restricted subsidiaries and co-borrowers to (subject to certain exceptions) incur indebtedness, make certain restricted payments and investments, create liens on certain assets to secure debt, consolidate, merge, sell or otherwise dispose of all or substantially all of our assets and enter into certain transactions with affiliates.
F-22
Table of Contents
9% Senior Secured Notes due 2018
On December 13, 2013, inVentiv Health issued an additional $25 million of aggregate principal amount of 9.0% Senior Secured Notes due 2018 (the “Senior Secured Notes”). The additional notes were issued at a 2.5% premium, have the same terms and are treated as single series with the previously issued $600 million Senior Secured Notes. At December 31, 2015, inVentiv Health has $625.0 million aggregate principal amount of 9.0% Senior Secured Notes due 2018 outstanding.
The Senior Secured Notes bear interest at a rate of 9.0% per annum and mature on January 15, 2018. Interest on the Senior Secured Notes is payable semi-annually on April 15 and October 15 of each year. The Senior Secured Notes are secured, by a senior lien on all assets of inVentiv Health and its domestic subsidiaries on par with the lien granted pursuant to the Senior Secured Credit Facilities and subject to a first priority lien on the current assets pledged pursuant to the ABL Facility. The Senior Secured Notes are the guarantors’ secured senior obligations and rank equally in right of payment with all of inVentiv Health’s and the guarantors’ existing and future unsubordinated secured indebtedness and senior to any of inVentiv Health’s and the guarantors’ future subordinated indebtedness, if any. The indenture governing the Senior Secured Notes provides for customary events of default and contains covenants limiting, among other things, the ability of inVentiv Health and its restricted subsidiaries to (subject to certain exceptions) incur indebtedness, make certain restricted payments and investments, create liens on certain assets to secure debt, consolidate, merge, sell or otherwise dispose of all or substantially all of their assets and enter into certain transactions with affiliates.
On and after January 15, 2016, inVentiv Health may redeem the Senior Secured Notes, in whole or in part, at the redemption prices set forth below, plus accrued and unpaid interest during the twelve-month period beginning on January 15 of each of the years indicated below:
| Year |
Pay Notes Percentage |
|||
| 2016 |
104.50 | % | ||
| 2017 and thereafter |
100.00 | % | ||
In the event of a Change in Control, as defined in the indenture governing the Senior Secured Notes, inVentiv Health must provide holders of the Senior Secured Notes the opportunity to sell to inVentiv Health their notes at a price equal to 101% of the aggregate principal amount thereof, plus accrued and unpaid interest.
Asset Based Revolving Credit Facilities
On August 16, 2013, inVentiv Health, Citibank, N.A. and certain financial institutions entered into a credit agreement for an asset-based revolving credit facility of up to $150.0 million (the “ABL Facility”), subject to borrowing base availability, which matures on August 16, 2018. Up to $35.0 million of the ABL Facility is available for the issuance of letters of credit. Amounts borrowed under the ABL Facility are subject to interest at a rate per annum equal to an applicable margin plus, at inVentiv Health’s option, either (a) for a base rate loan, a base rate determined by reference to the highest of (i) the Federal Funds Rate plus 0.5%, (ii) the prime rate of Citibank, N.A., or (iii) the one month US Dollar LIBOR rate plus 1.0% or (b) for a Eurodollar rate loan, the US Dollar LIBOR rate based on the interest period. The applicable margin percentage for revolving loans is a percentage per annum and ranges from 1.0% to 1.5% for base rate loans or 2.0% to 2.5% for the Eurodollar rate loans. The applicable margin percentages with respect to borrowings under the ABL Facility is subject to adjustments based on historical excess availability as defined in the credit agreement for the ABL Facility. As of December 31, 2015, the interest rate applicable to such borrowings was 4.25%. inVentiv Health is required to pay an unused line fee to the lenders under the ABL Facility on the committed but unutilized balance of the ABL Facility at a rate per annum of 0.25% or 0.375%, which varies depending on utilization.
F-23
Table of Contents
The ABL Facility contains customary covenants and restrictions on inVentiv Health and its subsidiaries’ activities, including but not limited to, limitations on the incurrence of additional indebtedness, use of cash in certain circumstances, dividends, repurchase of capital stock, investments, loans, asset sales, distributions, acquisitions, divestitures and ability to enter into certain transactions with affiliates. The ABL Facility requires inVentiv Health to maintain a fixed-charge coverage ratio of at least 1.0 to 1.0 and requires certain cash management restrictions, in each case, if available borrowing capacity is less than the greater of 10% of the maximum amount that can be borrowed under the ABL Facility, based on the borrowing base at such time, and $12.0 million. The requirement to maintain a minimum fixed-charge coverage ratio was not in effect given inVentiv Health’s available borrowing capacity as of December 31, 2015. All obligations under the ABL Facility are secured by inVentiv Health’s domestic subsidiaries and secured by a first priority lien on current assets of inVentiv Health and its domestic subsidiaries and a second priority lien on all other assets of inVentiv Health and its domestic subsidiaries. The credit agreement also contains events of default for breach of principal or interest payments, breach of certain representations and warranties, breach of covenants and other customary events of default. The available borrowing capacity varies monthly according to the levels of inVentiv Health’s eligible accounts receivable and unbilled receivables. As of December 31, 2015, inVentiv Health had no outstanding borrowings under the ABL Facility, approximately $18.8 million in letters of credit outstanding against the ABL Facility and would have been able to borrow up to an additional $131.2 million.
International Facility
On July 1, 2015 one of the Company’s indirect subsidiaries in the United Kingdom, inVentiv Health Clinical UK Ltd., (“inVentiv UK”) as borrower, and one of the Company’s indirect subsidiaries in Switzerland, inVentiv Health Switzerland GmbH, as guarantor, entered into an asset-based lending facility (the “International Facility”) for up to $20.0 million. This new facility will be used to enhance international cash management. At December 31, 2015, inVentiv Health had no outstanding borrowings under the International Facility and would have been able to borrow up to $14.3 million.
Amounts borrowed under the International Facility are subject to interest at a rate per annum equal to an applicable margin plus, at the Company’s option, either (a) for a base rate loan, a base rate determined by reference to the highest of (i) the Federal Funds Rate plus 0.5%, (ii) the prime rate quoted in the Wall Street Journal, or (iii) the one month LIBOR rate (for loans denominated in U.S. Dollars or Pound Sterling) or EURIBOR rate (for loans denominated in Euros) plus 1.0% or (b) for a Eurocurrency loan, the LIBOR rate (for loans denominated in U.S. Dollars or Pound Sterling) or EURIBOR rate (for loans denominated in Euros) based on the interest period. The applicable margin percentage for asset-based revolving loans is a percentage per annum and ranges from 0.5% to 1.0% for base rate loans or 1.5% to 2.0% for the Eurocurrency rate loans. The applicable margin percentages with respect to borrowings under the International Facility is subject to adjustments based on historical excess availability as defined in the credit agreement for the International Facility. As of December 31, 2015, the interest rate applicable to borrowings under the International Facility was 2.127%. The Company is also required to pay an unused line fee to the lenders under the International Facility on the committed but unutilized balance of the International Facility at a rate of 0.375% per annum.
The International Facility contains customary covenants and restrictions on the activities of the borrower, the guarantor and their subsidiaries, including limitations on the incurrence of additional indebtedness, issuances of dividends, repurchases of capital stock, investments, loans, asset sales, distributions and acquisitions, ability to enter into certain transactions with affiliates and ability to create liens, among others. The International Facility requires the borrower to maintain a fixed-charge coverage ratio of at least 1.0 to 1.0, and restricts the borrower’s ability to use cash in certain circumstances if the available borrowing capacity is less than the greater of (i) 20% of the maximum amount that can be borrowed under the International Facility, based on the borrowing base at such time, and (ii) $5.0 million. As of December 31, 2015, the requirement to maintain a minimum fixed charge coverage ratio was not in effect given the borrower’s available borrowing capacity.
The obligations under the International Facility are secured by a first primary lien on the assets of inVentiv UK, including accounts receivable, and guaranteed by inVentiv Health Switzerland GmbH. The credit agreement
F-24
Table of Contents
governing the International Facility also contains certain events of default, including payment defaults, failure to perform or observe covenants, cross-defaults with certain other events of default in connection with other indebtedness, a change of control, or certain bankruptcy events, among others.
10%/12% Junior Lien Secured Notes due 2018
On August 15, 2014, inVentiv Health consummated an exchange offer (the “Junior Lien Notes Exchange Offer”) with holders of its 10% Senior Unsecured Notes due 2018 in which inVentiv Health issued $475.0 million aggregate principal amount of new 10%/12% Junior Lien Secured Notes due 2018 (the “Junior Lien Secured Notes”) in exchange for a like amount of inVentiv Health’s Senior Unsecured Notes (as defined below). The Junior Lien Secured Notes permit up to six semi-annual interest payments to be settled through the issuance of additional Junior Lien Secured Notes. The interest rate with respect to the Junior Lien Secured Notes is a cash rate of 10% per annum or a payment-in-kind (“PIK”) rate of 12% per annum (“PIK Interest”). inVentiv Health paid interest on the Junior Lien Secured Notes for the periods commencing August 15, 2014 and February 15, 2015 in PIK Interest and elected to pay interest for the period commencing August 15, 2015 in PIK Interest.
In connection with the Junior Lien Notes Exchange Offer, the Company’s Senior Secured Credit Facilities and ABL Facility were amended on July 28, 2014 (the “Credit Agreement Amendments”) to permit the Junior Lien Notes Exchange Offer, the New Money Investment (as defined below) and the issuance of the Backstop Consideration (as defined below) and to extend the maturities of certain outstanding term loans from 2016 to 2018. The margin on the term loans increased by 0.25% when compared to the interest rates on the prior term loans. There was no net change in the outstanding principal balance of the term loans as a result of the modified terms. In connection with these transactions, the Company recognized a loss on extinguishment of debt and refinancing costs of approximately $10.1 million in the third quarter of 2014. The extinguishment of debt relates to the write-off of unamortized deferred borrowing costs associated with non-participating lenders and the refinancing costs represent the third party fees associated with the transactions that were deemed a modification as the terms of the new debt instruments were not substantially different than the prior instruments.
As of December 31, 2015, inVentiv Health accrued 12% interest on the Junior Lien Secured Notes related to the August 15, 2015 PIK Interest election, which is included in other non-current liabilities, as such interest is required to be settled through the issuance of additional Junior Lien Secured Notes on the interest payment date in February 2016. In February 2016, inVentiv Health elected to settle the interest due under the upcoming interest period ended August 2016 in cash.
On August 12, 2014, in connection with the Junior Lien Notes Exchange Offer, affiliates of Thomas H. Lee Partners, L.P. and certain co-investors purchased $25.0 million of Junior Lien Secured Notes and $26.3 million of inVentiv Health’s 10% Senior Unsecured Notes due 2018 for a total consideration of $50.0 million (the “New Money Investment”). The $26.3 million of 10% Senior Unsecured Notes due 2018 were issued at a 5% discount to par value resulting in a $1.3 million discount that is accreted over the related term using the effective interest method. Additionally, on August 15, 2014 inVentiv Health issued an additional $7.0 million of Junior Lien Secured Notes (the “Backstop Consideration”) to a group of holders of inVentiv Health’s 10% Senior Unsecured Notes due 2018 as consideration for such holders’ agreement to tender the 10% Senior Unsecured Notes due 2018 held by them into the Junior Lien Notes Exchange Offer.
Accordingly, the total amount of Junior Lien Secured Notes outstanding as of December 31, 2015 was $569.7 million. With the settlement of PIK Interest in February 2016, an additional $33.9 million of Junior Lien Secured Notes were issued.
The Junior Lien Secured Notes are guaranteed, on a junior lien basis, by each of inVentiv Health’s domestic wholly-owned subsidiaries that guarantee the Senior Secured Credit Facilities. All obligations under the Junior Lien Secured Notes, and the guarantees of those obligations, are secured on a junior lien basis by inVentiv Health’s assets and the assets of inVentiv Health’s subsidiary guarantors that secure the obligations under
F-25
Table of Contents
inVentiv Health’s Senior Secured Credit Facilities and ABL Facility. The Junior Lien Secured Notes are inVentiv Health’s and the guarantors’ secured senior obligations and rank equally in right of payments with all of inVentiv Health’s and the guarantors’ existing and future unsubordinated indebtedness and senior to any of inVentiv Health’s and the guarantors’ future subordinated indebtedness, if any. The indenture governing the Junior Lien Secured Notes provides for customary events of default and contains covenants limiting, among other things, the ability of inVentiv Health and its restricted subsidiaries to (subject to certain exceptions) incur indebtedness, make certain restricted payments and investments, create liens on certain assets to secure debt, consolidate, merge, sell or otherwise dispose of all or substantially all of our assets and enter into certain transactions with affiliates.
10% Senior Unsecured Notes due 2018
As a result of the Junior Lien Notes Exchange Offer and the New Money Investment, inVentiv Health had $376.3 million in Senior Unsecured Notes outstanding as of December 31, 2015. The Senior Unsecured Notes bear interest at a rate of 10.0% per annum and mature on August 15, 2018. Interest on the Senior Unsecured Notes is payable semi-annually on February 15 and August 15 of each year. The Senior Unsecured Notes are guaranteed, on an unsecured senior basis, by each of inVentiv Health’s domestic wholly-owned subsidiaries that guarantee the Senior Secured Credit Facilities. The Senior Unsecured Notes are inVentiv Health’s and the guarantors’ unsecured senior obligations and rank equally in right of payment with all of inVentiv Health’s and the guarantors’ existing and future unsubordinated unsecured indebtedness and senior to any of inVentiv Health’s and the guarantors’ future subordinated indebtedness, if any. The indenture governing the Senior Unsecured Notes provides for customary events of default and contains covenants limiting, among other things, the ability of inVentiv Health and its restricted subsidiaries to (subject to certain exceptions) incur indebtedness, make certain restricted payments and investments, create liens on certain assets to secure debt, consolidate, merge, sell or otherwise dispose of all or substantially all of their assets and enter into certain transactions with affiliates.
inVentiv Health entered into registration rights agreements in connection with the issuances of the Senior Unsecured Notes. Under the registration rights agreement with respect to the notes issued on August 4, 2010 in connection with the THL Acquisition, inVentiv Health agreed to use reasonable best efforts to file a registration statement related to the exchange of such notes for exchange notes with the SEC on or prior to the 270th day after August 4, 2010, to cause such registration statement to become effective under the Securities Act on or prior to the earlier of the 90th day following such filing or the 360th day after August 4, 2010, and to consummate the exchange offer on or prior to the 30th day after effectiveness. The registration rights agreement provides that additional interest will accrue on the principal amount of the notes at a rate of 0.25% per annum during the 90-day period immediately following the first to occur of these events and will increase by 0.25% per annum at the end of each subsequent 90-day period until all such defaults are cured, but in no event will the penalty rate exceed 1.00% per annum. The registration rights agreements with respect to the additional notes issued on June 10, 2011 and July 13, 2011 contain similar requirements. inVentiv Health registered the Senior Unsecured Notes on August 5, 2015 with the Securities and Exchange Commission. As a result of such registration and completion of the subsequent exchange offer for the notes, the obligation to pay additional interest on $185.5 million of the notes issued in 2010 ceased on August 5, 2015 and the obligation to pay additional interest on $164.5 million of notes issued in 2011 ceased on September 3, 2015. inVentiv Health has incurred penalty interest of $2.2 million, $6.5 million and $8.0 million on the Senior Unsecured Notes for the years ended December 31, 2015, 2014 and 2013, respectively.
inVentiv Health’s Senior Secured Credit Facilities, ABL Facility, Senior Secured Notes, Junior Lien Secured Notes and Senior Unsecured Notes are not guaranteed by certain of inVentiv Health’s subsidiaries including all of its non-U.S. subsidiaries or non-wholly owned subsidiaries, and the International Facility is not guaranteed by any subsidiaries other than inVentiv Health Switzerland GmbH. Accordingly, claims of holders of the notes and lenders under the Company’s credit facilities will be structurally subordinated to the claims of creditors of these non-guarantor subsidiaries, including trade creditors. All obligations of inVentiv Health’s non-guarantor subsidiaries will have to be satisfied before any of the assets of such subsidiaries would be available for distribution, upon a liquidation or otherwise, to inVentiv Health or a guarantor of our indebtedness.
F-26
Table of Contents
Other Financing Arrangements
inVentiv Health has other financing obligations that total $1.9 million and $2.3 million at December 31, 2015 and 2014, respectively. Substantially all amounts outstanding as of December 31, 2015 are expected to be repaid in 2016.
Unamortized Premium (Discount) and Debt Issuance costs
At December 31, 2015, inVentiv Health had unamortized premium (discount) on the outstanding debts of $(9.0) million that is to be amortized or accreted over the remaining term, including $0.4 million of unamortized premium and $9.4 million of unamortized discount. At December 31, 2014, inVentiv Health had unamortized premium (discount) on the outstanding debts of $(12.4) million that is to be amortized or accreted over the remaining term, including $0.5 million of unamortized premium and $12.9 million of unamortized discount.
At December 31, 2015 and 2014, inVentiv Health had deferred borrowing costs of $35.4 million and $49.4 million, respectively, which relate to inVentiv Health’s financing arrangements and are recorded as a reduction in inVentiv Health’s debt obligations. Deferred financing costs are amortized to interest expense using an effective interest rate method over the life of the related borrowings. Amortization expense related to debt issuance costs (including those that are related to outstanding line-of-credit) was $15.6 million, $16.0 million and $16.4 million for the years ended December 31, 2015, 2014 and 2013, respectively.
Fair Value of Long-Term Debt
The carrying amounts and the estimated fair values of long-term debt as of December 31, 2015 and 2014 are as follows (in thousands):
| December 31, 2015 | December 31, 2014 | |||||||||||||||
| Carrying value | Estimated fair value | Carrying value | Estimated fair value | |||||||||||||
| Term Loan Facility |
$ | 567,673 | $ | 570,051 | $ | 564,380 | $ | 571,024 | ||||||||
| Senior Secured Notes |
618,616 | 633,594 | 615,440 | 636,719 | ||||||||||||
| Junior Lien Secured Notes |
551,552 | 537,646 | 482,112 | 469,609 | ||||||||||||
| Senior Unsecured Notes |
364,043 | 371,142 | 359,919 | 327,952 | ||||||||||||
The fair value of long-term debt instruments is measured based on market values for debt issues with similar characteristics, such as maturities, credit ratings, collateral and interest rates available on the measurement dates for debt with similar terms (level 2 within the fair value hierarchy). The Company believes the carrying values for capital leases and other financing arrangements approximate their fair values.
10. Fair Value Measurements
The Company’s financial instruments include cash and cash equivalents, accounts receivables, unbilled services, accounts payable, short-term borrowings, capital leases and other financing arrangements as well as deferred revenues and client advances. Due to the short-term nature of such instruments, the Company believes their carrying values approximate fair value. Please refer to Note 9 for discussion of the Company’s debt instruments.
The Company’s contingent consideration obligations are carried at fair value considering the Company’s best estimate as to the probable timing and amount of settlement. In March 2014, the Company and the holders of the Campbell Notes agreed to an early termination of the Campbell Notes. In consideration of the termination of the Campbell Notes, the Company agreed to pay the holders $5.3 million, resulting in a $0.3 million credit to earnings, which is included in SG&A expenses. As of December 31, 2015 and 2014, the other contingent consideration obligations had an aggregate fair value of $0.5 million and $1.5 million, which is included in accrued expenses and other non-current liabilities.
F-27
Table of Contents
The Company’s deferred compensation plan provides eligible management and other highly compensated employees with the opportunity to defer their compensation and to receive the deferred amounts in the future or upon termination of employment with the Company. The Company invests in the underlying mutual fund investments available to plan participants through investments held in a rabbi trust, which generally offset the liability associated with the deferred compensation plan. These securities are classified as trading securities and carried at fair value of $10.8 million as of December 31, 2015 and included in other assets in the consolidated balance sheets. Gains and losses are included in SG&A expenses. The Company did not have traded securities in 2014 or 2013 as investments were instead primarily held in company owned life insurance policies.
Fair value guidance includes a fair value hierarchy that is intended to increase consistency and comparability in fair value measurements and related disclosures. The fair value hierarchy is based on inputs to valuation techniques that are used to measure fair value that are either observable or unobservable. Observable inputs reflect assumptions market participants would use in pricing an asset or liability based on market data obtained from independent sources while unobservable inputs reflect a reporting entity’s pricing based upon their own market assumptions. The fair value hierarchy consists of the following three levels:
| Level 1 | Inputs are quoted prices in active markets for identical assets or liabilities. | |
| Level 2 | Inputs are quoted prices for similar assets or liabilities in an active market, quoted prices for identical or similar assets or liabilities in markets that are not active, inputs other than quoted prices that are observable and market-corroborated inputs which are derived principally from or corroborated by observable market data. | |
| Level 3 | Inputs are derived from valuation techniques in which one or more significant inputs or value drivers are unobservable. | |
Recurring Fair Value Measurements
The following table represents the Company’s liabilities measured at fair value on a recurring basis as of December 31, 2015 and 2014 (in thousands):
| December 31, 2015 | Level 1 | Level 2 | Level 3 | |||||||||||||
| Assets |
||||||||||||||||
| Trading Securities |
$ | 10,751 | $ | 10,751 | $ | — | $ | — | ||||||||
|
|
|
|
|
|
|
|
|
|||||||||
| Total Assets |
$ | 10,751 | $ | 10,751 | $ | — | $ | — | ||||||||
|
|
|
|
|
|
|
|
|
|||||||||
| Liabilities |
||||||||||||||||
| Acquisition-related contingent consideration |
$ | 538 | $ | — | $ | — | $ | 538 | ||||||||
|
|
|
|
|
|
|
|
|
|||||||||
| Total liabilities |
$ | 538 | $ | — | $ | — | $ | 538 | ||||||||
|
|
|
|
|
|
|
|
|
|||||||||
| December 31, 2014 | Level 1 | Level 2 | Level 3 | |||||||||||||
| Liabilities |
||||||||||||||||
| Acquisition-related contingent consideration |
$ | 1,481 | $ | — | $ | — | $ | 1,481 | ||||||||
|
|
|
|
|
|
|
|
|
|||||||||
| Total liabilities |
$ | 1,481 | $ | — | $ | — | $ | 1,481 | ||||||||
|
|
|
|
|
|
|
|
|
|||||||||
F-28
Table of Contents
The following is a rollforward of the Level 3 liabilities from January 1, 2014 through December 31, 2015 (in thousands):
| Balance at January 1, 2014 |
$ | 11,883 | ||
| Adjustments recorded through earnings (1) |
(5,152 | ) | ||
| Payments and other adjustments (2) |
(5,250 | ) | ||
|
|
|
|||
| Balance at December 31, 2014 |
1,481 | |||
| Adjustments recorded through earnings (1) |
(193 | ) | ||
| Payments (3) |
(750 | ) | ||
|
|
|
|||
| Balance at December 31, 2015 |
$ | 538 | ||
|
|
|
| (1) | Represents changes in fair value recorded through earnings related to the Company’s contingent consideration obligations. The changes in fair value are included in SG&A expenses. |
| (2) | The Campbell Notes are no longer required to be measured at fair value on a recurring basis due to the termination of the notes in March 2014. As such, the obligation has been removed from the table above. |
| (3) | Represents cash payments related to the Company’s contingent consideration obligations. |
Non-recurring Fair Value Measurements
Certain assets are carried on the accompanying consolidated balance sheets at cost and are not measured to fair value on a recurring basis. These assets include goodwill and indefinite-lived intangible assets that are tested for impairment annually and when a triggering event occurs. Finite-lived intangible assets are tested when a triggering event occurs. See Note 5 and 6 for more information regarding the methodology and the level 3 assumptions used. As of December 31, 2015, assets carried on the balance sheet and not remeasured to fair value on a recurring basis include $895.4 million of goodwill and $334.6 million of identifiable intangible assets.
11. Lease Commitments
The Company leases certain facilities, office equipment and other assets under non-cancelable operating leases. The operating leases are expensed on a straight-line basis and may include certain renewal options and escalation clauses. The following is a schedule of future minimum lease payments for these operating leases as of December 31, 2015 (in thousands):
| Years Ending December 31, | ||||
| 2016 |
$ | 41,133 | ||
| 2017 |
36,761 | |||
| 2018 |
30,146 | |||
| 2019 |
23,546 | |||
| 2020 |
19,818 | |||
| Thereafter |
76,016 | |||
|
|
|
|||
| Total future minimum lease payments (1) |
$ | 227,420 | ||
|
|
|
|||
| (1) | Future minimum lease payments have not been reduced by the minimum sublease payments of $6.3 million due from January 2016 to February 2019 under non-cancellable subleases. |
Rental expense charged to operations was approximately $44.5 million, $47.3 million and $44.0 million for the years ended December 31, 2015, 2014 and 2013, respectively. Included in rent expense was sublease income of $4.3 million, $4.7 million and $3.6 million, respectively, for the years ended December 31, 2015, 2014 and 2013, respectively.
F-29
Table of Contents
The Company also had commitments under capital leases. Certain vendors have the right to declare us in default of our agreements if any such vendor, including the lessors under our vehicle fleet leases, determines that a change in our financial condition poses a substantially increased credit risk. The following is a schedule of future minimum lease payments for these capital leases at December 31, 2015 (in thousands):
| Years Ending December 31, | ||||
| 2016 |
$ | 22,586 | ||
| 2017 |
21,596 | |||
| 2018 |
17,301 | |||
| 2019 |
7,951 | |||
| 2020 |
5 | |||
| Thereafter |
— | |||
|
|
|
|||
| Total future minimum lease payments (1) |
69,439 | |||
| Amount representing interest and management fees |
(2,784 | ) | ||
|
|
|
|||
| 66,655 | ||||
| Current portion |
(21,397 | ) | ||
|
|
|
|||
| Non-current lease obligations |
$ | 45,258 | ||
|
|
|
|||
| (1) | These future commitments include interest and management fees, which are not recorded on the consolidated balance sheets as of December 31, 2015 and will be expensed as incurred. |
12. Contingencies
On October 31, 2013, Cel-Sci Corporation (Cel-Sci) (“Claimant”) made a demand for arbitration under a Master Services Agreement (the “MSA”), dated as of April 6, 2010 between Claimant and two of our subsidiaries, inVentiv Health Clinical, LLC (formerly known as PharmaNet, LLC) and PharmaNet GmbH (currently known as inVentiv Health Switzerland GmbH and formerly known as PharmaNet AG) (collectively, “PharmaNet”). Under the MSA and related project agreement, which were terminated by Claimant in April 2013, Claimant engaged PharmaNet in connection with a Phase III Clinical Trial of its investigational drug. The arbitration claim alleges (i) breach of contract, (ii) fraud in the inducement, and (iii) common law fraud on the part of PharmaNet, and seeks damages of at least $50 million. In December 2013, inVentiv Health Clinical, LLC filed a counterclaim against Claimant that alleges breach of contract and seeks at least $2 million in damages. The matter proceeded to the discovery phase. In January 2015, inVentiv Health Clinical, LLC filed additional counterclaims against Claimant that allege (i) breach of contract, (ii) opportunistic breach, restitution and unjust enrichment, and (iii) defamation, and seeks at least $2 million in damages and $20 million in other equitable remedies. A hearing is currently scheduled to begin in September 2016. No assessment can be made at this time as to the likely outcome of this matter. Accordingly, no provision has been recorded as no loss is considered probable.
Other Matters
The Company is subject to lawsuits, investigations and claims arising out of the conduct of its business, including those related to commercial transactions, contracts, government regulation and employment matters. Certain claims, suits and complaints have been filed or are pending against the Company. The Company does not believe that the outcome of any legal proceedings, if decided adversely to its interests, would have a material adverse effect on our business, financial condition or results of operations.
F-30
Table of Contents
13. Common Stock and Stock Incentive Plans
Description of Capital Stock
The Company is authorized to issue 7,500,000 shares of capital stock, all of which are Common Stock, with a par value of $0.01 per share. In accordance with the Amended and Restated Certificate of Incorporation of the Company, each share of Common Stock shall have one vote, and the Common Stock shall vote together as a single class. Subject to the terms of any debt instruments the Company may enter into, the Board of Directors may declare dividends upon the stock of the Company as and when the Board deems appropriate and in accordance with the General Corporation Law of the State of Delaware, as applicable.
Stock-based Compensation
Stock-based compensation expense (credit) for the years ended December 31, 2015, 2014 and 2013 was $4.3 million, $0.6 million and ($1.8) million, respectively, of which $0.5 million, $(0.1) million and $(0.2) million, respectively, was recorded in cost of revenue and $3.8 million, $0.7 million and $(1.6) million was recorded in SG&A expenses, respectively.
Stock Incentive Plan
inVentiv established the 2010 Equity Incentive Plan (the “2010 Plan”) in August 2010, and subsequently amended in April 2012 and March 2014, that authorizes stock options and other stock awards for the purchase of an aggregate of 781,588 shares of Common Stock in inVentiv. There remained 265,270 shares available for grant under the 2010 Plan as of December 31, 2015. The awards offered under this plan include options that vest based upon the passage of time and the employees’ successful completion of a service requirement (“Time-Based Option Award”), option awards that vest upon certain performance targets being met in addition to the completion of a service requirement (“EBITDA Performance-Based Option Award”), option awards and restricted stock awards that vest if a liquidity event occurs such that Thomas H. Lee Partners, L.P. and its related investment funds that hold shares of Common Stock in inVentiv (“Investors”) achieve a defined return on their investment (Multiple of Money, or “MoM Option Award” and “MoM RSU Award”), option awards that vest following a change in control (“CIC”), as well as restricted stock awards that vest upon a qualifying liquidity event (“RSU Award”). In March 2014, the Compensation Committee of the board of directors of the Company approved a performance contingent award program (“EIP”) under the 2010 Plan that provides for awards that vest if the Company achieves certain financial targets over a three-year period. Under this program, participants may elect to receive cash-based awards at a fixed value or restricted stock units. Vested cash-based awards issued with respect to the 2014-2016 performance period settle upon the earlier of a qualifying liquidity event or in cash in December 2018. Vested restricted stock units with respect to the 2014-2016 performance period settle upon a qualifying liquidity event, however, participants may elect in December 2018 to require the Company to purchase from the participant a number of shares having a value equal to the lesser of: (i) the aggregate fair value of the shares as of the date of repurchase and (ii) the aggregate value of the shares on the date of grant. All awards have a ten year contractual term.
On July 2, 2015 the Company’s Board of Directors approved the grant of new option awards to eligible employees in exchange for certain outstanding restricted stock units granted under the 2010 Plan, on a one-for-one basis. Thirty-five percent of the options in the new award vest upon the passage of time and completion of a service requirement and sixty-five percent vests based upon achievement of certain specified performance targets and completion of a service requirement. Approximately 148,748 of the outstanding restricted stock units were exchanged in the program. The exchange was treated as a modification of the awards and no incremental stock compensation was recognized as the exchange securities were not considered probable of vesting on the date of the exchange. The Company recognizes the fair value of the new option awards in compensation expense over the service period to the extent that vesting of the awards is considered probable.
Compensation for Time-Based Option Awards is recognized on a straight-line basis over the performance period (generally five years). Compensation for EBITDA Performance-Based Awards is recognized on a graded
F-31
Table of Contents
vesting basis, based on the probability of achieving the performance targets over the service period for the entire award. Performance targets are generally established over a four-to-five year period. Since the occurrence of a qualifying liquidity event that will trigger the eligibility of vesting for the MoM Option, CIC Option, MoM RSU and RSU Awards is outside of the control of the Company or the option holders, compensation related to these awards will be recognized when the qualifying event occurs and will be based on the number of shares that become eligible for vesting.
The fair value of each option award was estimated on the date of grant using a Black-Scholes valuation model with the following assumptions:
| Years Ended December 31, | ||||||||||||
| 2015 | 2014 | 2013 | ||||||||||
| Expected volatility |
56.1 | % | 63.0 | % | 62.0 | % | ||||||
| Expected dividends |
— | — | — | |||||||||
| Expected life (in years) |
6.5 | 6.0 | 6.0 | |||||||||
| Risk free interest rate |
2.0 | % | 1.7 | % | 1.6 | % | ||||||
| Weighted average grant date fair value |
$ | 53.19 | $ | 48.75 | $ | 47.91 | ||||||
Expected volatilities are based on the historic volatility of a selected peer group. Expected dividends represent the dividends expected to be issued at the date of grant. The expected term of options represents the period of time that options granted are expected to be outstanding. The risk-free interest rate reflects the U.S. Treasury rate at the date of the grant which most closely resembles the expected life of the options. The fair value of the underlying common stock was determined by the income method. Determining the fair value of stock-based awards at the grant date requires the exercise of judgment, including the amount of stock-based awards that are expected to vest. If the actual number of vested awards differs from our estimates, stock-based compensation expense and our results of operations would be impacted.
A summary of the 2010 Plan activity during 2015 is as follows:
| Time Based Options |
EBITDA Performance Options |
MoM Options |
CIC Options |
Total Options |
Weighted Average Exercise Price |
Weighted Average Remaining Term |
(in thousands) Aggregate Intrinsic Value |
|||||||||||||||||||||||||
| Outstanding January 1, 2015 |
45,468 | 27,355 | 13,815 | 30,000 | 116,638 | $ | 102.47 | 7.98 | $ | — | ||||||||||||||||||||||
| Granted |
35,907 | 41,714 | 38,054 | — | 115,675 | 101.92 | ||||||||||||||||||||||||||
| Exercised |
— | — | — | — | — | — | ||||||||||||||||||||||||||
| Options awarded in connection with the exchange program |
52,062 | 96,686 | — | — | 148,748 | 96.17 | ||||||||||||||||||||||||||
| Cancelled |
(9,604 | ) | (26,095 | ) | (1,650 | ) | — | (37,349 | ) | 97.98 | ||||||||||||||||||||||
|
|
|
|
|
|
|
|
|
|
|
|
|
|||||||||||||||||||||
| Outstanding December 31, 2015 |
123,833 | 139,660 | 50,219 | 30,000 | 343,712 | 100.04 | 8.79 | $ | 30,753 | |||||||||||||||||||||||
| Exercisable December 31, 2015 |
42,321 | 30,816 | — | — | 73,137 | 99.63 | 8.01 | $ | 6,574 | |||||||||||||||||||||||
| Vested and expected to vest at December 31, 2015(1) |
101,849 | 105,576 | — | — | 207,425 | 99.83 | 8.40 | $ | 18,601 | |||||||||||||||||||||||
| (1) | Multiple of Money and Change in Control awards have been excluded as the vesting criteria are based on a qualifying liquidity event. |
F-32
Table of Contents
The aggregate intrinsic value of options exercised in 2013 was less than $0.1 million. There were no options exercised in 2014 and 2015. Under the terms of the 2010 Plan, the Company has the right to repurchase shares acquired upon exercise if certain conditions are met. The unrecognized compensation cost related to unvested Time-Based and EBITDA Performance-Based Option Awards that are expected to vest was $6.7 million as of December 31, 2015 and is expected to be recognized over a weighted average remaining period of 3.3 years. The unrecognized compensation expense of the MoM Options and CIC Options would be $2.8 million as of December 31, 2015, if the performance and market conditions were to be fully achieved.
The following table summarizes the Company’s RSU Award activity:
| MoM RSU | RSU | EIP | Total RSU | |||||||||||||
| Nonvested at January 1, 2015 |
102,359 | 80,224 | 109,912 | 292,495 | ||||||||||||
| Granted |
21,882 | — | — | 21,882 | ||||||||||||
| Vested |
— | — | — | — | ||||||||||||
| Awards exchanged in connection with the exchange program |
(61,859 | ) | — | (86,889 | ) | (148,748 | ) | |||||||||
| Forfeited |
(10,623 | ) | (13,758 | ) | (21,221 | ) | (45,602 | ) | ||||||||
|
|
|
|
|
|
|
|
|
|||||||||
| Nonvested at December 31, 2015 |
51,759 | 66,466 | 1,802 | 120,027 | ||||||||||||
|
|
|
|
|
|
|
|
|
|||||||||
The weighted average grant date value was $95.51, $89.48 and $104.00, for the years ended December 31, 2015, 2014 and 2013, respectively. The unrecognized compensation cost related to unvested EIP awards that are expected to vest was $0.1 million as of December 31, 2015 and is expected to be recognized over a remaining period of 1.0 year. Unrecognized compensation costs related to the MoM RSU and RSU awards would be $9.7 million as of December 31, 2015, if the performance and market conditions were to be fully achieved.
Liberty Lane Plan
In December 2010, the Company established the 2010 Equity Incentive Plan for Liberty Lane IH LLC (“Liberty Lane Plan”) that authorizes stock awards for the purchase of an aggregate of 190,268 shares of Common Stock in the Company. At December 31, 2014 there were 190,268 MoM Option Awards outstanding under the Liberty Lane Plan with a weighted average exercise price of $114. These awards were cancelled in the second quarter of 2015 to reflect Mr. Meister’s resignation as Chief Executive Officer, and the Company issued 38,054 MoM Option Awards to Mr. Meister during 2015 pursuant to the 2010 Plan.
Phantom Equity Incentive Plan
The 2011 Phantom Equity Incentive Plan (the “Campbell Plan”) authorizes the issuance of approximately 4,278,000 units to eligible Campbell employees. Approximately 662,000 units were outstanding at December 31, 2015 under the Campbell Plan. These units become eligible for vesting if a liquidity event occurs such that the Investors achieve a defined return on their investment. Compensation expense related to these units will be recognized when the qualifying event occurs and will be based on the number of units that become eligible for vesting.
14. Employee Benefit Plans
Defined Contribution Plan
The Company maintains defined contribution benefit plans and makes discretionary contributions to these plans. Costs incurred by the Company related to these plans amounted to approximately $18.2 million, $16.6 million and $13.3 million for the years ended December 31, 2015, 2014 and 2013, respectively.
F-33
Table of Contents
Deferred Compensation Plan
The Company’s deferred compensation plan provides eligible management and other highly compensated employees with the opportunity to defer, on a pre-tax basis, their salary, bonus, and other specified cash compensation and to receive the deferred amounts, together with a deemed investment return (positive or negative), either at a pre-determined time in the future or upon termination of employment with the Company. The deferred compensation liability of approximately $12.1 million and $11.8 million was included in accrued expenses and other non-current liabilities in the Company’s consolidated balance sheets as of December 31, 2015 and 2014, respectively. Participants in the plan may elect notional investments in several mutual fund choices per the terms of the plan.
Postretirement Plan
The Company maintains a postretirement plan for employees at a Swiss subsidiary that has characteristics of both a defined benefit plan and a defined contribution plan. The measurement of the related benefit obligations and the net periodic benefit costs recorded each year are based upon actuarial computations, which require management’s judgment as to certain assumptions. Liabilities related to the Company’s postretirement plan are measured at year end. Benefit amounts are based upon years of service and compensation. The Swiss plan was partially funded as of December 31, 2015 and 2014. The Company’s funding policy has been to contribute annually a fixed percentage of the eligible employee’s salary at least equal to the local statutory funding requirements. The pension liability was $1.0 million and $1.5 million at December 31, 2015 and 2014, respectively, and is included in other non-current liabilities in the accompanying consolidated balance sheets.
15. Termination Benefits and Other Cost Reduction Actions
The Company undertook certain actions to continue to integrate its acquisitions and implement cost containment measures in an effort to better align operating costs with market and business conditions. Expenses related to these actions that include real estate consolidations, elimination of redundant functions and employees were $16.4 million for the year ended December 31, 2015, and $17.9 million for each of the years ended December 31, 2014 and 2013.
The $16.4 million of costs incurred in 2015 includes $13.2 million of severance costs for approximately 435 employees and facility-related costs of $3.2 million and includes $6.7 million of costs related to Clinical, $8.8 million related to Commercial and $0.9 million related to Corporate and other. The $17.9 million of costs incurred in 2014 includes $13.7 million of severance costs for approximately 410 employees and facility-related costs of $4.2 million and includes $8.6 million of costs related to Clinical, $8.5 million related to Commercial and $0.8 million related to Corporate and other. The $17.9 million of costs incurred in 2013 includes $12.9 million of severance costs for approximately 390 employees and facility-related costs of $5.0 million and includes $4.5 million of costs related to Clinical, $11.5 million related to Commercial and $1.9 million related to Corporate and other. In addition, the Company incurred non-cash facility consolidation costs of $0.5 million in both 2015 and 2013, respectively, and there were no such non-cash charges in 2014.
The following table summarizes the Company’s restructuring costs for the years ended December 31, 2015, 2014 and 2013 (in thousands):
| For the Year Ended December 31, | ||||||||||||
| 2015 | 2014 | 2013 | ||||||||||
| Employee severance and related costs |
$ | 13,134 | $ | 13,752 | $ | 12,882 | ||||||
| Facilities-related costs |
3,231 | 4,168 | 5,015 | |||||||||
|
|
|
|
|
|
|
|||||||
| Total |
$ | 16,365 | $ | 17,920 | $ | 17,897 | ||||||
|
|
|
|
|
|
|
|||||||
F-34
Table of Contents
For the years ended December 31, 2015, 2014 and 2013, restructuring costs of $5.1 million, $4.7 million and $4.9 million have been included in cost of revenues, and $11.3 million, $13.2 million and $13.0 million have been included in SG&A expenses, respectively. Restructuring costs are not allocated to the Company’s reportable segments as they are not part of the segment performance measures regularly reviewed by the management.
The following table summarizes the Company’s restructuring reserve as of December 31, 2015 and 2014 (in thousands):
| Balance at December 31, 2013 |
2014 Net Costs |
2014 Cash Payments |
Balance at December 31, 2014 |
Net Costs | Cash Payments | Balance at December 31, 2015 |
||||||||||||||||||||||
| Employee severance and related costs |
$ | 5,479 | $ | 13,752 | $ | (14,086 | ) | $ | 5,145 | $ | 13,134 | $ | (14,034 | ) | $ | 4,245 | ||||||||||||
| Facilities-related costs |
6,187 | 4,168 | (3,257 | ) | 7,098 | 3,231 | (6,387 | ) | 3,942 | |||||||||||||||||||
|
|
|
|
|
|
|
|
|
|
|
|
|
|
|
|||||||||||||||
| Total |
$ | 11,666 | $ | 17,920 | $ | (17,343 | ) | $ | 12,243 | $ | 16,365 | $ | (20,421 | ) | $ | 8,187 | ||||||||||||
|
|
|
|
|
|
|
|
|
|
|
|
|
|
|
|||||||||||||||
The Company expects severance payments accrued at December 31, 2015 will be paid within the next twelve months. Certain facility costs will be paid over the remaining lease term of exited facilities through 2027.
The net costs on the table above exclude non-cash charges of $0.5 million in both 2015 and 2013 related to abandoned assets at certain facilities.
16. Income Taxes
For financial reporting purposes, income (loss) from continuing operations before income (loss) from equity investments and income taxes includes the following components (in thousands):
| For the Year Ended December 31, | ||||||||||||
| 2015 | 2014 | 2013 | ||||||||||
| United States |
$ | (165,929 | ) | $ | (184,994 | ) | $ | (232,362 | ) | |||
| Foreign |
22,198 | 7,263 | 19,113 | |||||||||
|
|
|
|
|
|
|
|||||||
| $ | (143,731 | ) | $ | (177,731 | ) | $ | (213,249 | ) | ||||
|
|
|
|
|
|
|
|||||||
The income tax provision is as follows (in thousands):
| For the Year Ended December 31, | ||||||||||||
| 2015 | 2014 | 2013 | ||||||||||
| Current: |
||||||||||||
| U.S. - Federal |
$ | — | $ | (4,648 | ) | $ | 169 | |||||
| U.S. - State and local |
151 | (632 | ) | (210 | ) | |||||||
| Foreign |
8,160 | 3,149 | 1,568 | |||||||||
|
|
|
|
|
|
|
|||||||
| 8,311 | (2,131 | ) | 1,527 | |||||||||
|
|
|
|
|
|
|
|||||||
| Deferred: |
||||||||||||
| U.S. - Federal |
4,496 | 4,423 | 4,061 | |||||||||
| U.S. - State and local |
(111 | ) | 171 | 476 | ||||||||
| Foreign |
(7,129 | ) | 44 | (3,109 | ) | |||||||
|
|
|
|
|
|
|
|||||||
| (2,744 | ) | 4,638 | 1,428 | |||||||||
|
|
|
|
|
|
|
|||||||
| Income tax provision |
$ | 5,567 | $ | 2,507 | $ | 2,955 | ||||||
|
|
|
|
|
|
|
|||||||
F-35
Table of Contents
The provision for taxes on net loss differs from the amount computed by applying the U.S. federal income tax rate as a result of the following:
| For the Year Ended December 31, | ||||||||||||
| 2015 | 2014 | 2013 | ||||||||||
| (stated as percentages) | ||||||||||||
| Taxes at statutory U.S. federal income tax rate |
35.0 | % | 35.0 | % | 35.0 | % | ||||||
| Foreign tax differences |
4.5 | 2.1 | 2.0 | |||||||||
| State and local income taxes, net of federal tax benefit |
— | (0.2 | ) | (0.5 | ) | |||||||
| Valuation allowance |
(27.9 | ) | (43.3 | ) | (36.2 | ) | ||||||
| Federal examination settlement |
— | 2.3 | — | |||||||||
| Impairment of intangible assets |
(7.6 | ) | (2.8 | ) | (3.8 | ) | ||||||
| Proceeds from purchase price finalization |
— | — | 2.3 | |||||||||
| Net operating loss adjustment |
— | 7.7 | — | |||||||||
| Federal tax on foreign earnings |
(6.4 | ) | (3.9 | ) | (3.3 | ) | ||||||
| Other permanent differences |
(1.5 | ) | 1.7 | 3.1 | ||||||||
|
|
|
|
|
|
|
|||||||
| Effective tax rate |
(3.9 | )% | (1.4 | )% | (1.4 | )% | ||||||
|
|
|
|
|
|
|
|||||||
Deferred income taxes are recorded based upon differences between the financial statement and tax bases of assets and liabilities. As of December 31, 2015 and 2014, the deferred tax assets and liabilities consisted of the following (in thousands):
| For the Year Ended December 31, | ||||||||
| 2015 | 2014 | |||||||
| Deferred Tax Assets: |
||||||||
| Accrued expenses |
$ | 29,384 | $ | 24,907 | ||||
| Deferred revenue |
11,150 | 7,847 | ||||||
| Allowance for doubtful accounts and other |
9,462 | 10,744 | ||||||
| Deferred compensation |
6,902 | 5,434 | ||||||
| Intangible assets |
9,416 | 11,639 | ||||||
| Net operating loss |
351,348 | 341,704 | ||||||
| Property and equipment |
5,190 | 2,664 | ||||||
| Research and development credits |
44,506 | 48,894 | ||||||
| Debt basis adjustment |
8,854 | 8,845 | ||||||
| Other |
4,387 | 5,359 | ||||||
|
|
|
|
|
|||||
| Deferred Tax Assets |
480,599 | 468,037 | ||||||
| Valuation Allowance |
(406,477 | ) | (375,638 | ) | ||||
|
|
|
|
|
|||||
| Deferred Tax Liabilities: |
||||||||
| Prepaid expenses |
(2,746 | ) | (2,964 | ) | ||||
| Property and equipment |
(518 | ) | (727 | ) | ||||
| Deferred financing |
(5,052 | ) | (7,368 | ) | ||||
| Intangible assets |
(121,602 | ) | (140,067 | ) | ||||
| U.S. tax on foreign earnings |
(7,000 | ) | (7,000 | ) | ||||
| Other |
(532 | ) | (49 | ) | ||||
|
|
|
|
|
|||||
| Deferred Tax Liabilities |
(137,450 | ) | (158,175 | ) | ||||
|
|
|
|
|
|||||
| Net Deferred Tax Liabilities |
$ | (63,328 | ) | $ | (65,776 | ) | ||
|
|
|
|
|
|||||
At December 31, 2015 and 2014, the Company had U.S. Federal net operating loss carry forwards (“NOLs”) of $889.7 million and $817.2 million, respectively, which will expire beginning in 2026 and ending in 2035. Included in this amount were $82.3 million of NOLs attributable to acquisitions completed during 2011, the
F-36
Table of Contents
utilization of which will be subject to limitations due to the application of Internal Revenue Code (“IRC”) Section 382, a provision that may limit a taxpayer’s ability to utilize its NOLs in the event of an ownership change. The Company does not believe any Section 382 limitations will preclude utilization before these NOLs expire.
At December 31, 2015 and 2014, the Company had foreign NOLs of $73.4 million and $85.8 million, respectively, which will expire in varying amounts beginning in 2020 and certain amounts, have an indefinite life. At December 31, 2015 and 2014, the Company had Canadian research and development credit carry forwards of $60.2 million and $66.7 million, respectively, which expire between 2022 and 2035. At December 31, 2014, the net deferred tax assets were offset by a full valuation allowance. During 2015, a $5.9 million reduction in the valuation allowance was recognized as a benefit to the foreign deferred tax provision, related to the Company’s Canadian Clinical subsidiary.
As of December 31, 2015 and 2014, the Company had a total valuation allowance of $406.5 million and $375.6 million, respectively. The Company maintains a full valuation allowance against its domestic and certain foreign net deferred tax assets because management has concluded that it is more likely than not that it will not realize the benefits of these deferred tax assets based on recent operating results and current projections of future losses. In 2015 and 2014, the valuation allowance increased by $30.9 million (net of the $5.9 million Canadian reduction) and $76.7 million, respectively, primarily due to the domestic NOL each year. The Company continues to evaluate all jurisdictions for potential valuation allowance changes due to improved sustainable profitability or decline of business profits which would either warrant the release of an already established valuation allowance or to record a valuation allowance against the deferred tax assets of the given jurisdiction.
Due to the valuation allowance, for the years ended December 31, 2015 and 2014, the taxable temporary difference from the amortization of indefinite-lived intangible assets and goodwill, resulted in incremental tax expense of $7.6 million and $6.4 million, respectively (before the impact of impairments). The Company will record tax expense related to amortization of its tax deductible indefinite-lived intangible assets and goodwill during those future periods for which it maintains a valuation allowance or until its unamortized balance of $133.0 million as of December 31, 2015, is fully amortized for tax purposes.
The Company provides for U.S. income taxes or non U.S. withholding taxes of undistributed earnings of non U.S. subsidiaries, unless such earnings are considered indefinitely reinvested. As of December 31, 2015, undistributed earnings, for which no provision for U.S. income taxes has been established, was $71.8 million. As of December 31, 2015, the amount of unrecognized deferred tax liability related to this temporary difference is estimated to be approximately $27.6 million, although if distributed during future periods for which the Company maintains a domestic valuation allowance, there would not be a material impact on future tax provisions.
As of December 31, 2015, 2014 and 2013, the Company had unrecognized tax benefits of $25.5 million, $16.7 million and $13.6 million, respectively. Positions totaling $2.7 million, $3.1 million and $8.0 million at December 31, 2015, 2014 and 2013, respectively, if recognized, would affect the effective tax rate.
A reconciliation of the beginning and ending amount of unrecognized tax benefits, which excludes interest and penalties, is as follows (in millions):
| For the Year Ended December 31, | ||||||||||||
| 2015 | 2014 | 2013 | ||||||||||
| Unrecognized tax benefits balance |
$ | 16.7 | $ | 13.6 | $ | 12.3 | ||||||
| Increase (decrease) in tax positions for prior years |
0.1 | (0.2 | ) | (0.4 | ) | |||||||
| Increase in tax positions for current year |
9.4 | 6.9 | 4.3 | |||||||||
| Settlements |
— | (2.8 | ) | (1.4 | ) | |||||||
| Lapse of statute of limitations |
(0.7 | ) | (0.8 | ) | (1.2 | ) | ||||||
|
|
|
|
|
|
|
|||||||
| Unrecognized tax benefits balance |
$ | 25.5 | $ | 16.7 | $ | 13.6 | ||||||
|
|
|
|
|
|
|
|||||||
F-37
Table of Contents
The total amount of accrued interest and penalties recorded as of December 31, 2015 and 2014 was $3.0 million and $2.9 million, respectively. The gross interest and penalties recognized in the statements of operations for the years ended December 31, 2015, 2014 and 2013 was income (expense) of $(0.1) million, $0.4 million and $0.1 million, respectively. The interest and penalties recognized as income is a result of the expiration of the statute of limitations and audit settlement related to several uncertain tax positions.
The Company or one of its subsidiaries files income tax returns in the U.S. federal jurisdiction, and various state and foreign jurisdictions. The Company is no longer subject to U.S. federal income tax examinations for years before 2012 and generally, is no longer subject to state and local income tax examinations by tax authorities for years before 2011.
The Company does not expect that the unrecognized tax benefits balance will decrease within the next 12 months.
17. Related Parties
Management Arrangements
Upon completion of the THL Acquisition, the Company entered into a management agreement (“THL Management Agreement”) with THL Managers VI, LLC (“THL Managers”), in which THL Managers agreed to provide management services to the Company until the tenth anniversary of the consummation of the THL Acquisition with evergreen one-year extensions thereafter. Pursuant to the THL Management Agreement, THL Managers will receive an aggregate annual management fee in an amount per year equal to the greater of (a) $2.5 million or (b) 1.5% of EBITDA, as defined in the THL Management Agreement. In addition, the Company will reimburse out-of-pocket expenses, including travel related costs, incurred by THL Managers. The Company recognized $3.3 million, $2.9 million and $3.0 million in management fees and related costs for the years ended December 31, 2015, 2014 and 2013, respectively.
The management agreement with the THL Managers includes customary exculpation and indemnification provisions in favor of the THL Managers and their affiliates. The THL Managers may terminate their management agreement at any time. The THL Managers’ management agreement will terminate automatically upon an initial public offering or a change of control. Upon termination due to an initial public offering or a change of control, the THL Managers will be entitled to a termination fee based on the net present value of their annual fee due during the remaining period from the date of termination to the then applicable scheduled date of termination of their management agreement.
Upon completion of the THL Acquisition, the Company entered into a management agreement with Liberty Lane, in which Liberty Lane agreed to provide management services to the Company. Mr. Meister, the Company’s former Chief Executive Officer, is affiliated with Liberty Lane. Pursuant to the agreement, Liberty Lane or its affiliates received an aggregate annual management fee in an amount per year equal to $1.0 million. On December 5, 2012, the agreement was amended to lower the per year management fee to $0.8 million beginning January 1, 2013. The agreement was terminated in the second quarter of 2015 with an effective date of September 24, 2014 to reflect Mr. Meister’s resignation as Chief Executive Officer. The Company incurred management fees of $0.7 million and $0.8 million for the years ended December 31, 2014 and 2013, respectively.
On November 12, 2012, the Compensation Committee of the Company granted to Liberty Lane options to purchase shares of Common Stock equal to approximately 1.4% of the fully diluted equity of the Company. The options vest if a liquidity event occurs such that the Investors achieve a certain return on their investment. These awards were cancelled in the second quarter of 2015 to reflect Mr. Meister’s resignation as Chief Executive Officer, and the Company issued 38,054 MoM Option Awards to Mr. Meister during 2015. See Note 13 for additional information.
F-38
Table of Contents
Commercial Transactions
There were four entities for the years ended December 31, 2015, 2014 and 2013 in which THL or its affiliates held a 10% or greater interest that provided services exceeding $120,000 in value to the Company. The services included facilities management, audio conferencing and information technology services. The fees for these services were $4.3 million, $5.3 million and $4.0 million for the years ended December 31, 2015, 2014 and 2013, respectively.
One of the Company’s directors, Blane Walter, acquired a 10% or greater interest in and became a director of an entity in 2013 which provided relationship enterprise technology solutions to the Company exceeding $120,000 in value over the previous twelve month period. The services were provided for fees of $1.8 million, $1.8 million and $0.3 million for the years ended December 31, 2015, 2014 and 2013, respectively.
Debt Instruments
In 2014, affiliates of Thomas H. Lee Partners, L.P., Liberty Lane and Blane Walter purchased $25.0 million of Junior Lien Secured Notes and $26.3 million of the Company’s 10% Senior Unsecured Notes due 2018 for a total consideration of $50.0 million as described in Note 9.
18. Segment Information
The Company provides services through two reportable segments, Clinical and Commercial. Each reportable business segment is comprised of multiple service offerings that, when combined, create a fully integrated biopharmaceutical outsourced services provider. Clinical, which primarily serves pharmaceutical, biotechnology, diagnostic and medical device clients engaged in research and development, provides a continuum of services spanning phases I-IV of clinical development. Commercial, provides commercialization, patient outcomes and consulting services to the pharmaceutical, biotechnology and healthcare industries. The Clinical and Commercial segments provide services to the other segments primarily in connection with the delivery of services to the end client. The Company accounts for intersegment sales on prices that management considers to be consistent with market pricing. Total intersegments sales from Clinical to Commercial was $0.3 million, $1.5 million, and $0.7 million for the years ended December 31, 2015, 2014, and 2013, respectively. Total intersegment sales from Commercial to Clinical or Corporate and other was $13.2 million, $6.1 million, and $3.9 million for the years ended December 31, 2015, 2014, and 2013, respectively.
Management measures and evaluates the Company’s operating segments based on segment net revenue and adjusted operating income. The results of these reportable business segments are regularly reviewed by the Company’s chief operating decision maker, the Chief Executive Officer. Certain costs are excluded from segment operating income because management evaluates the operating results of the segments excluding such charges. These items include depreciation and amortization; certain foreign currency impacts; net charges associated with acquisitions; certain legal charges, net of insurance recoveries; certain asset impairment charges; stock-based compensation; as well as corporate and other unallocated expenses. The Corporate and other unallocated expenses primarily consist of expenses for corporate overhead functions such as finance, human resources, information technology, facilities and legal; restructuring and related charges; and certain expenses incurred in connection with the management agreements with affiliates of certain shareholders. Although these amounts are excluded from segment operating income, as applicable, they are included in reported consolidated operating loss and in the reconciliations presented below. The Company has not presented segment assets since management does not evaluate the Company’s operating segments using this information.
The Company has an agreement to provide commercialization services to a pharmaceutical client for launch of certain products in return for a royalty on the client’s net sales. The results of this arrangement are included in Corporate and other as the contract is managed and evaluated on a corporate level. As these activities were previously included in the Commercial segment information has been restated to include these results in Corporate and other and Commercial recognized intersegment sales related to performing services under this arrangement.
F-39
Table of Contents
Selected information for each reportable segment is as follows (in thousands):
| For the Year Ended December 31, | ||||||||||||
| 2015 | 2014 | 2013 | ||||||||||
| Net Revenues |
||||||||||||
| Clinical |
$ | 947,917 | $ | 870,255 | $ | 865,043 | ||||||
| Commercial |
1,059,876 | 943,716 | 784,130 | |||||||||
| Intersegment revenues |
(13,475 | ) | (7,566 | ) | (4,618 | ) | ||||||
|
|
|
|
|
|
|
|||||||
| Consolidated net revenues |
$ | 1,994,318 | $ | 1,806,405 | $ | 1,644,555 | ||||||
|
|
|
|
|
|
|
|||||||
| Adjusted Segment Operating Income (Loss) |
||||||||||||
| Clinical |
$ | 137,093 | $ | 96,736 | $ | 94,945 | ||||||
| Commercial |
171,940 | 129,684 | 108,782 | |||||||||
| Corporate and other |
(39,765 | ) | (28,790 | ) | (43,725 | ) | ||||||
|
|
|
|
|
|
|
|||||||
| Reportable segments adjusted operating income (loss) |
269,268 | 197,630 | 160,002 | |||||||||
| Depreciation and amortization |
(95,088 | ) | (107,315 | ) | (105,999 | ) | ||||||
| Impairment of goodwill and long-lived assets |
(69,157 | ) | (24,023 | ) | (38,881 | ) | ||||||
| Proceeds from purchase price finalization |
— | — | 14,221 | |||||||||
| Stock-based compensation |
(4,286 | ) | (556 | ) | 1,771 | |||||||
| Other unallocated charges |
(27,587 | ) | (16,356 | ) | (34,314 | ) | ||||||
|
|
|
|
|
|
|
|||||||
| Operating income (loss) |
73,150 | 49,380 | (3,200 | ) | ||||||||
| Loss on extinguishment of debt and refinancing costs |
— | (10,062 | ) | (818 | ) | |||||||
| Interest income (expense), net |
(228,199 | ) | (217,049 | ) | (209,231 | ) | ||||||
| Other income |
11,318 | — | — | |||||||||
|
|
|
|
|
|
|
|||||||
| Income (loss) before income tax (provision) benefit and income (loss) from equity investments |
$ | (143,731 | ) | $ | (177,731 | ) | $ | (213,249 | ) | |||
|
|
|
|
|
|
|
|||||||
| For the Year Ended December 31, | ||||||||||||
| 2015 | 2014 | 2013 | ||||||||||
| Capital Expenditures (in thousands) |
||||||||||||
| Clinical |
$ | 14,816 | $ | 11,237 | $ | 16,478 | ||||||
| Commercial |
14,938 | 10,847 | 9,988 | |||||||||
| Corporate and other |
9,525 | 11,005 | 9,211 | |||||||||
|
|
|
|
|
|
|
|||||||
| Capital expenditures |
$ | 39,279 | $ | 33,089 | $ | 35,677 | ||||||
|
|
|
|
|
|
|
|||||||
F-40
Table of Contents
The following tables contain certain financial information by geographic area based on the location of the primary customer relationship.
| For the Year Ended December 31, | ||||||||||||
| 2015 | 2014 | 2013 | ||||||||||
| Net Revenues by Geography (in thousands) |
||||||||||||
| United States |
$ | 1,554,376 | $ | 1,336,674 | $ | 1,201,428 | ||||||
| Europe |
309,858 | 310,571 | 288,702 | |||||||||
| All Other Americas |
62,804 | 75,040 | 81,843 | |||||||||
| Asia |
60,347 | 73,930 | 61,340 | |||||||||
| All Other |
6,933 | 10,190 | 11,242 | |||||||||
|
|
|
|
|
|
|
|||||||
| Net revenues |
$ | 1,994,318 | $ | 1,806,405 | $ | 1,644,555 | ||||||
|
|
|
|
|
|
|
|||||||
| December 31, | ||||||||
| 2015 | 2014 | |||||||
| Long-Lived Assets by Geography (in thousands) |
||||||||
| United States |
$ | 124,901 | $ | 104,637 | ||||
| Europe |
9,790 | 8,988 | ||||||
| All Other Americas |
4,974 | 6,400 | ||||||
| Asia |
2,334 | 1,779 | ||||||
| All Other |
33 | 55 | ||||||
|
|
|
|
|
|||||
| Long-lived assets |
$ | 142,032 | $ | 121,859 | ||||
|
|
|
|
|
|||||
19. Allowance for Doubtful Accounts
The activity in the allowance for doubtful accounts consisted of the following (in thousands):
| Balance Beginning of Year |
Additions Charged to Income |
Deductions | Other (a) | Balance End of Year |
||||||||||||||||
| Year ended December 31, 2015 |
$ | 4,143 | $ | 2,689 | $ | (1,469 | ) | $ | 32 | $ | 5,395 | |||||||||
| Year ended December 31, 2014 |
4,839 | 1,203 | (1,496 | ) | (403 | ) | 4,143 | |||||||||||||
| Year ended December 31, 2013 |
4,002 | 2,459 | (1,883 | ) | 261 | 4,839 | ||||||||||||||
| (a) | Primarily reflects the impact of currency translation. |
20. Earnings Per Share
Basic earnings per share are computed by dividing net income (loss) by the weighted average number of shares of common stock outstanding for the applicable period. Diluted earnings per share is calculated as the weighted average number of shares of common stock outstanding plus the potential common share effect of dilutive securities. The dilutive effect of common stock equivalents is included in the calculation of diluted earnings per share using the treasury stock method, unless the effect would be antidilutive. Under the treasury stock method, the amount the employee must pay for exercising stock options, the amount of compensation cost for future service that the Company has not yet recognized, and the amount of tax benefit that would be recognized in additional paid-in capital when the award becomes deductible are assumed to be used to repurchase shares.
F-41
Table of Contents
The net income (loss) attributable to the Company and used to calculate basic and diluted income (loss) per share was as follows (in thousands):
| Years Ended December 31, | ||||||||||||
| Amounts attributable to inVentiv Group Holdings, Inc.: | 2015 | 2014 | 2013 | |||||||||
| Income (loss) from continuing operations |
$ | (151,468 | ) | $ | (181,472 | ) | $ | (217,345 | ) | |||
| Income (loss) from discontinued operations |
— | (8,163 | ) | (20,228 | ) | |||||||
|
|
|
|
|
|
|
|||||||
| Net income (loss) |
$ | (151,468 | ) | $ | (189,635 | ) | $ | (237,573 | ) | |||
|
|
|
|
|
|
|
|||||||
The weighted average number of shares used to calculate basic to diluted weighted average shares outstanding was as follows:
| Years Ended December 31, | ||||||||||||
| 2015 | 2014 | 2013 | ||||||||||
| Basic weighted average common shares outstanding |
5,402,377 | 5,402,377 | 5,402,017 | |||||||||
| Effect of dilutive securities |
— | — | — | |||||||||
| Diluted weighted average common shares outstanding |
5,402,377 | 5,402,377 | 5,402,017 | |||||||||
The potentially dilutive securities include 343,712 common stock options and 120,027 restricted stock units at December 31, 2015. As the Company was in a net loss position during all periods presented, all share based payment awards outstanding would be antidilutive. Disclosure of the terms and conditions of these securities is included in Note 13.
21. Subsequent Events
The Company considered all events that occurred after December 31, 2015 through April 5, 2016, the date the financial statements were issued.
On January 8, 2016, the Company’s Board of Directors approved the repurchase by the Company of its Junior Lien Secured Notes and the subsequent cancellation of such repurchased notes (the “PIK Note Repurchase”). The Company has repurchased and cancelled an aggregate principal amount of $23.7 million of its Junior Lien Secured Notes through open market purchases for $23.1 million. As a result of the PIK Note Repurchase, the Company will reduce its debt and a pro rata portion of deferred financing costs on the transactions.
On March 25, 2016, the Company approved the grant of 106,207 option awards. Thirty-five percent of the options vest upon the passage of time and completion of a service requirement and sixty-five percent vests based upon achievement of certain specified performance targets and completion of a service requirement. The Company will recognize the fair value of the option awards in compensation expense over the service period to the extent that vesting of the awards is considered probable.
F-42
Table of Contents

Table of Contents
PART II—INFORMATION NOT REQUIRED IN PROSPECTUS
| Item 13. | Other Expenses of Issuance and Distribution. |
The following table sets forth all costs and expenses, other than the underwriting discount, paid or payable by us in connection with the sale of common stock being registered. All amounts shown are estimates except for the SEC registration fee, the FINRA filing fee and the listing fee for the NYSE or NASDAQ.
| Amount Paid or to be Paid |
||||
| SEC registration fee |
$ 10,070 | |||
| FINRA filing fee |
15,500 | |||
| Exchange listing fee |
* | |||
| Printing and engraving expenses |
* | |||
| Legal fees and expenses |
* | |||
| Accounting fees and expenses |
* | |||
| Transfer agent and registrar fees and expenses |
* | |||
| Miscellaneous expenses |
* | |||
|
|
|
|||
| Total |
$ * | |||
|
|
|
|||
| * | To be provided by amendment. |
| Item 14. | Indemnification of Officers and Directors. |
The Registrant is governed by the Delaware General Corporation Law, or DGCL. Section 145 of the DGCL provides that a corporation may indemnify any person, including an officer or director, who was or is, or is threatened to be made, a party to any threatened, pending or completed legal action, suit or proceeding, whether civil, criminal, administrative or investigative (other than an action by or in the right of such corporation), by reason of the fact that such person was or is an officer, director, employee or agent of such corporation or is or was serving at the request of such corporation as a director, officer, employee or agent of another corporation or enterprise. The indemnity may include expenses (including attorneys’ fees), judgments, fines and amounts paid in settlement actually and reasonably incurred by such person in connection with such action, suit or proceeding, provided such officer, director, employee or agent acted in good faith and in a manner such person reasonably believed to be in, or not opposed to, the corporation’s best interest and, for criminal proceedings, had no reasonable cause to believe that such person’s conduct was unlawful. A Delaware corporation may indemnify any person, including an officer or director, who was or is, or is threatened to be made, a party to any threatened, pending or contemplated action or suit by or in the right of such corporation, under the same conditions, except that such indemnification is limited to expenses (including attorneys’ fees) actually and reasonably incurred by such person, and except that no indemnification is permitted without judicial approval if such person is adjudged to be liable to such corporation. Where an officer or director of a corporation is successful, on the merits or otherwise, in the defense of any action, suit or proceeding referred to above, or any claim, issue or matter therein, the corporation must indemnify that person against the expenses (including attorneys’ fees) which such officer or director actually and reasonably incurred in connection therewith.
The Registrant’s amended and restated certificate of incorporation will authorize the indemnification of its officers and directors, consistent with Section 145 of the DGCL.
Reference is made to Section 102(b)(7) of the DGCL, which enables a corporation in its original certificate of incorporation or an amendment thereto to eliminate or limit the personal liability of a director for violations of the director’s fiduciary duty, except (i) for any breach of the director’s duty of loyalty to the corporation or its stockholders, (ii) for acts or omissions not in good faith or which involve intentional misconduct or a knowing violation of law, (iii) pursuant to Section 174 of the DGCL, which provides for liability of directors for unlawful payments of dividends of unlawful stock purchase or redemptions or (iv) for any transaction from which a director derived an improper personal benefit.
II-1
Table of Contents
The Registrant expects to maintain standard policies of insurance that provide coverage (i) to its directors and officers against loss rising from claims made by reason of breach of duty or other wrongful act and (ii) to the Registrant with respect to indemnification payments that it may make to such directors and officers.
The Registrant’s amended and restated certificate of incorporation and amended and restated bylaws that will be in effect upon completion of this offering will authorize the indemnification of its officers and directors, consistent with Section 145 of the DGCL, as amended. The Registrant intends to enter into indemnification agreements with each of its directors and executive officers. These agreements, among other things, will require the Registrant to indemnify each director and executive officer to the fullest extent permitted by Delaware law, including indemnification of expenses such as attorneys’ fees, judgments, fines and settlement amounts incurred by the director or executive officer in any action or proceeding, including any action or proceeding by or in right of the Registrant, arising out of the person’s services as a director or executive officer.
The proposed form of underwriting agreement filed as Exhibit 1.1 to this Registration Statement provides for indemnification to the Registrant’s directors and officers by the underwriters against certain liabilities.
| Item 15. | Recent Sales of Unregistered Securities |
The following sets forth information regarding all unregistered securities sold by us in the last three years:
| • | Since January 1, 2013, we have granted to our directors, officers and employees options to purchase an aggregate of 439,404 shares of our common stock with per share exercise prices equal to $104.00, $89.00, $100.00, $96.17, $132.95 or $206.23 per share pursuant to the 2010 Plan. |
| • | Since January 1, 2013, we have granted to our officers and employees 349,043 restricted stock units at grant prices of $89.00, $96.17, $104.00 or $132.95 per share pursuant to the 2010 Plan. |
| • | On January 15, 2014, we issued 115 shares of common stock for aggregate consideration of $11,960 to one of our former employees pursuant to Section 4(a)(2) of the Securities Act and Rule 506 thereunder. |
| • | Since January 1, 2013, one of our former employees exercised options and purchased an aggregate of 418 shares of our common stock, at a per share price of $100 pursuant to the 2010 Plan. |
Unless otherwise stated, the sales of the above securities were deemed to be exempt from registration under the Securities Act in reliance
upon Section 4(a)(2) of the Securities Act or Regulation D promulgated thereunder, or Rule 701 promulgated under
Section 3(b) of the Securities Act as transactions by an issuer not involving any public offering or pursuant to
benefit plans and contracts relating to compensation as provided under Rule 701. Individuals who purchased stock as described above represented their intention to acquire the stock for investment only and not with a view to or for sale in
connection with any distribution thereof, and appropriate legends were affixed to the share certificates issued in such transactions
| Item 16. | Exhibits and Financial Statement Schedules |
(a) Exhibits:
| Exhibit |
Exhibit | |
| 1.1* |
Form of Underwriting Agreement. | |
| 3.1* |
Amended and Restated Certificate of Incorporation of inVentiv Group Holdings, Inc., as currently in effect. | |
| 3.2* |
Amended and Restated By-Laws of inVentiv Group Holdings, Inc., as currently in effect. | |
| 3.3* |
Form of Amended and Restated Certificate of Incorporation of inVentiv Group Holdings, Inc. to be in effect prior to the consummation of the offering made under this Registration Statement. | |
II-2
Table of Contents
| Exhibit |
Exhibit | |
| 3.4* |
Amended and Restated By-Laws of inVentiv Group Holdings, Inc. to be in effect prior to the consummation of the offering made under this Registration Statement. | |
| 4.1* |
Form of Certificate of Common Stock. | |
| 4.2* |
Stockholders Agreement, Dated as of August 4, 2010, by and among inVentiv Group Holdings, Inc., inVentiv Midco Holdings, Inc., inVentiv Holdings, Inc., inVentiv Acquisition, Inc. and the Investors, Other Investors and Managers named therein. | |
| 4.3* |
Registration and Participation Rights Agreement, dated as of August 4, 2010, by and among inVentiv Group Holdings, Inc., inVentiv Midco Holdings, Inc., inVentiv Holdings, Inc., inVentiv Acquisition, Inc. and Certain Stockholders of inVentiv Group Holdings, Inc. | |
| 4.4 |
Indenture, dated as of August 4, 2010, by and among inVentiv Health, Inc., the Guarantors identified therein, and Wilmington Trust, FSB, as Trustee (incorporated by reference from Exhibit 4.1 to inVentiv Health, Inc.’s Amendment No. 1 to Form S-4 (File No. 333-197719) filed on October 6, 2014). | |
| 4.5 |
Form of 10% Senior Unsecured Notes due 2018 (included in the Indenture filed as Exhibit 4.4) | |
| 4.6 |
Supplemental Indenture, dated as of September 1, 2010, between Chamberlain Communications LLC, and Wilmington Trust, FSB, as Trustee (incorporated by reference from Exhibit 4.3 to inVentiv Health, Inc.’s Amendment No. 1 to Form S-4 (File No. 333-197719) filed on October 6, 2014). | |
| 4.7 |
Supplemental Indenture, dated as of February 11, 2011, by and among inVentiv Health, Inc., Campbell Alliance Group, Inc., Encuity Research, LLC (previously known as Campbell Alliance Market Research and Analytics, LLC), Pharmaceutical Institute, Inc., and Wilmington Trust, FSB, as Trustee (incorporated by reference from Exhibit 4.4 to inVentiv Health, Inc.’s Amendment No. 1 to Form S-4 (File No. 333-197719) filed on October 6, 2014). | |
| 4.8 |
Third Supplemental Indenture, dated as of June 10, 2011, by and among inVentiv Health, Inc., Ingenix Pharmaceutical Services, Inc., Raven Holdco LLC, and Wilmington Trust, FSB, as Trustee (incorporated by reference from Exhibit 4.5 to inVentiv Health, Inc.’s Amendment No. 1 to Form S-4 (File No. 333-197719) filed on October 6, 2014). | |
| 4.9 |
Fourth Supplemental Indenture, dated as of July 13, 2011, by and among inVentiv Health, Inc., the Guarantors identified therein, and Wilmington Trust, National Association (as successor by merger to Wilmington Trust, FSB), as
Trustee (incorporated by reference from Exhibit 4.6 to inVentiv Health, Inc.’s Amendment No. 1 to Form S-4 (File No. 333-197719) filed on October 6, 2014). | |
| 4.10 |
Fifth Supplemental Indenture, dated as of April 30, 2012, by and among inVentiv Health, Inc., the Guarantors identified therein, and Wilmington Trust, National Association (as successor by merger to Wilmington Trust, FSB), as
Trustee (incorporated by reference from Exhibit 4.7 to inVentiv Health, Inc.’s Amendment No. 1 to Form S-4 (File No. 333-197719) filed on October 6, 2014). | |
| 4.11 |
Sixth Supplemental Indenture, dated as of December 20, 2012, by and among inVentiv Health, Inc., the Guarantors identified therein, and Wilmington Trust, National Association (as successor by merger to Wilmington Trust, FSB), as
Trustee (incorporated by reference from Exhibit 4.8 to inVentiv Health, Inc.’s Amendment No. 1 to Form S-4 (File No. 333-197719) filed on October 6, 2014). | |
| 4.12 |
Seventh Supplemental Indenture, dated as of February 7, 2013, by and among inVentiv Health, Inc., the Guarantors identified therein, and Wilmington Trust, National Association (as successor by merger to Wilmington Trust, FSB), as
Trustee (incorporated by reference from Exhibit 4.9 to inVentiv Health, Inc.’s Amendment No. 1 to Form S-4 (File No. 333-197719) filed on October 6, 2014). | |
| 4.13 |
Eighth Supplemental Indenture, dated as of December 10, 2013, by and among inVentiv Health, Inc., the Guarantors identified therein, and Wilmington Trust, National Association (as successor by merger to Wilmington Trust, FSB), as Trustee (incorporated by reference from Exhibit 4.10 to inVentiv Health, Inc.’s Amendment No. 1 to Form S-4 (File No. 333-197719) filed on October 6, 2014). | |
II-3
Table of Contents
| Exhibit |
Exhibit | |
| 4.14 |
Ninth Supplemental Indenture, dated as of August 12, 2014, by and among inVentiv Health, Inc., the Guarantors identified therein, and Wilmington Trust, National Association, as Trustee (incorporated by reference from Exhibit 4.11 to inVentiv Health, Inc.’s Amendment No. 1 to Form S-4 (File No. 333-197719) filed on October 6, 2014). | |
| 4.15 |
Tenth Supplemental Indenture, dated as of January 16, 2015, by and between inVentiv Advance Insights, LLC and Wilmington Trust, National Association (as successor by merger to Wilmington Trust, FSB), as Trustee (incorporated by reference from Exhibit 4.26 to inVentiv Health, Inc.’s Amendment No. 3 to Form S-4 (File No. 333-197719) filed on February 10, 2015). | |
| 4.16 |
Registration Rights Agreement, dated as of August 4, 2010, by and among inVentiv Health, Inc., the Guarantors identified therein, Banc of America Securities LLC, Citigroup Global Markets Inc., Credit Suisse Securities (USA) LLC and Deutsche Bank Securities Inc. (incorporated by reference from Exhibit 4.12 to inVentiv Health, Inc.’s Amendment No. 1 to Form S-4 (File No. 333-197719) filed on October 6, 2014). | |
| 4.17 |
Registration Rights Agreement, dated as of June 10, 2011, by and among inVentiv Health, Inc., the Guarantors identified therein, and Apollo Investment Corporation (incorporated by reference from Exhibit 4.13 to inVentiv Health, Inc.’s Amendment No. 1 to Form S-4 (File No. 333-197719) filed on October 6, 2014). | |
| 4.18 |
Registration Rights Agreement, dated as of July 13, 2011, by and among inVentiv Health, Inc., the Guarantors identified therein, Merrill Lynch, Pierce, Fenner & Smith Incorporated, Citigroup Global Markets Inc., Jefferies & Company, Inc., Credit Suisse Securities (USA) LLC, Deutsche Bank Securities Inc. and Wells Fargo Securities, LLC (incorporated by reference from Exhibit 4.14 to inVentiv Health, Inc.’s Amendment No. 1 to Form S-4 (File No. 333-197719) filed on October 6, 2014). | |
| 4.19 |
Indenture, dated as of December 20, 2012, by and among inVentiv Health, Inc., the Guarantors identified therein and Wilmington Trust, National Association, as trustee (incorporated by reference from Exhibit 4.15 to inVentiv Health, Inc.’s Amendment No. 1 to Form S-4 (File No. 333-197719) filed on October 6, 2014). | |
| 4.20 |
Form of 9% Senior Secured Notes due 2018 (included in the Indenture filed as Exhibit 4.19). | |
| 4.21 |
First Supplemental Indenture, dated as of February 7, 2013, by and among inVentiv Health, Inc., the Guarantors identified therein and Wilmington Trust, National Association, as trustee (incorporated by reference from Exhibit 4.16 to inVentiv Health, Inc.’s Amendment No. 1 to Form S-4 (File No. 333-197719) filed on October 6, 2014). | |
| 4.22 |
Second Supplemental Indenture, dated as of December 10, 2013, by and among inVentiv Health, Inc., the Guarantors identified therein and Wilmington Trust, National Association, as trustee (incorporated by reference from Exhibit 4.17 to inVentiv Health, Inc.’s Amendment No. 1 to Form S-4 (File No. 333-197719) filed on October 6, 2014). | |
| 4.23 |
Third Supplemental Indenture, dated as of December 18, 2013, by and among inVentiv Health, Inc., the Guarantors identified therein and Wilmington Trust, National Association, as trustee (incorporated by reference from Exhibit 4.18 to inVentiv Health, Inc.’s Amendment No. 1 to Form S-4 (File No. 333-197719) filed on October 6, 2014). | |
| 4.24 |
Fourth Supplemental Indenture, dated as of January 16, 2015, by and between inVentiv Advance Insights, LLC and Wilmington Trust, National Association, as Trustee (incorporated by reference from Exhibit 4.27 to inVentiv Health, Inc.’s Amendment No. 3 to Form S-4 (File No. 333-197719) filed on February 10, 2015). | |
II-4
Table of Contents
| Exhibit |
Exhibit | |
| 4.25 |
Amended and Restated Credit Agreement, dated as of July 13, 2011 by and among inVentiv Health, Inc., inVentiv Holdings, Inc., the lenders and other parties from time to time thereto and Citibank, N.A, as administrative agent
(incorporated by reference from Exhibit 4.19 to inVentiv Health, Inc.’s Amendment No. 1 to Form S-4 (File No. 333-197719) filed on October 6, 2014). | |
| 4.26 |
Amendment No. 1 to the Amended and Restated Credit Agreement, dated as of July 13, 2011 by and among inVentiv Health, Inc., inVentiv Holdings, Inc., the lenders and other parties from time to time thereto and Citibank, N.A, as administrative agent, dated as of March 21, 2012 (incorporated by reference from Exhibit 4.20 to inVentiv Health, Inc.’s Amendment No. 1 to Form S-4 (File No. 333-197719) filed on October 6, 2014). | |
| 4.27 |
Amendment No. 2 to the Amended and Restated Credit Agreement, dated as of July 13, 2011 by and among inVentiv Health, Inc., inVentiv Holdings, Inc., the lenders and other parties from time to time thereto and Citibank, N.A, as administrative agent, dated as of December 20, 2012 (incorporated by reference from Exhibit 4.21 to inVentiv Health, Inc.’s Amendment No. 1 to Form S-4 (File No. 333-197719) filed on October 6, 2014). | |
| 4.28 |
Amendment No. 3 to the Amended and Restated Credit Agreement, dated as of July 13, 2011 by and among inVentiv Health, Inc., inVentiv Holdings, Inc., the lenders and other parties from time to time thereto and Citibank, N.A, as administrative agent, dated as of July 28, 2014 (incorporated by reference from Exhibit 4.22 to inVentiv Health, Inc.’s Amendment No. 1 to Form S-4 (File No. 333-197719) filed on October 6, 2014). | |
| 4.29 |
Credit Agreement, dated as of August 16, 2013 by and among inVentiv Health, Inc., inVentiv Holdings, Inc., the lenders and other parties from time to time thereto and Citibank, N.A, as administrative agent (incorporated by reference from Exhibit 4.23 to inVentiv Health, Inc.’s Amendment No. 1 to Form S-4 (File No. 333-197719) filed on October 6, 2014). | |
| 4.30 |
Amendment No 1. to the Credit Agreement, dated as of August 16, 2013 by and among inVentiv Health, Inc., inVentiv Holdings, Inc., the lenders and other parties from time to time thereto and Citibank, N.A, as administrative agent, dated as of July 28, 2014 (incorporated by reference from Exhibit 4.24 to inVentiv Health, Inc.’s Amendment No. 1 to Form S-4 (File No. 333-197719) filed on October 6, 2014). | |
| 4.31 |
Indenture, dated as of August 12, 2014 by and among inVentiv Health, Inc., the Guarantor identified therein and Wilmington Trust, National Association, as trustee and collateral agent (incorporated by reference from Exhibit 4.25 to inVentiv Health, Inc.’s Amendment No. 1 to Form S-4 (File No. 333-197719) filed on October 6, 2014). | |
| 4.32 |
Form of 10% / 12% Junior Lien PIK Noes due 2018 (included in the Indenture filed as Exhibit 4.31). | |
| 4.33 |
First Supplemental Indenture, dated as of January 16, 2015, by and between inVentiv Advance Insights, LLC and Wilmington Trust, National Association, as Trustee (incorporated by reference from Exhibit 4.28 to inVentiv Health, Inc.’s Amendment No. 3 to Form S-4 (File No. 333-197719) filed on February 10, 2015). | |
| 5.1* |
Opinion of Weil, Gotshal & Manges, LLP. | |
| 10.1 |
Management Agreement, dated as of August 4, 2010, by and among Group Holdings, Inc., inVentiv Midco Holdings, Inc., inVentiv Holdings, Inc., inVentiv Acquisition, Inc., inVentiv Health, Inc. and THL Managers VI, LLC. (incorporated by reference from Exhibit 10.1 to inVentiv Health, Inc.’s Amendment No. 1 to Form S-4 (File No. 333-197719) filed on October 6, 2014). | |
| 10.2 |
Amendment to Management Agreement, dated as of December 2, 2013, by and among Group Holdings, Inc., inVentiv Midco Holdings, Inc., inVentiv Holdings, Inc., inVentiv Acquisition, Inc., inVentiv Health, Inc. and THL Managers VI, LLC
(incorporated by reference from Exhibit 10.2 to inVentiv Health, Inc.’s Amendment No. 1 to Form S-4 (File No. 333-197719) filed on October 6, 2014). | |
II-5
Table of Contents
| Exhibit |
Exhibit | |
| 10.3 |
Employment Agreement, dated January 25, 2012, between inVentiv Health, Inc. and Jonathan Bicknell (incorporated by reference from Exhibit 10.8 to inVentiv Health, Inc.’s Amendment No. 1 to Form S-4 (File No. 333-197719) filed on October 6, 2014). | |
| 10.4 |
Offer Letter, dated January 16, 2015 between inVentiv Health, Inc. and Eric R. Green (incorporated by reference from Exhibit 10.14 to inVentiv Health, Inc.’s Amendment No. 3 to Form S-4 (File No. 333-197719) filed on February 10, 2015). | |
| 10.5 |
Severance and Non-Competition Agreement, dated as of November 1, 2014, between inVentiv Health, Inc. and Eric R. Green (incorporated by reference from Exhibit 10.15 to inVentiv Health, Inc.’s Amendment No. 3 to Form S-4 (File No. 333-197719) filed on February 10, 2015). | |
| 10.6 |
Severance and Non-Competition Agreement, dated as of March 10, 2014, between inVentiv Health, Inc. and Michael Griffith (incorporated by reference from Exhibit 10.16 to inVentiv Health, Inc.’s Amendment No. 3 to Form S-4 (File No. 333-197719) filed on February 10, 2015). | |
| 10.7 |
Offer Letter, dated February 24, 2014, between inVentiv Health, Inc. and Michael Griffith (incorporated by reference from Exhibit 10.17 to inVentiv Health, Inc.’s Amendment No. 3 to Form S-4 (File No. 333-197719) filed on February 10, 2015). | |
| 10.8 |
Employment, Severance and Non-Competition Agreement, dated as of September 24, 2014, between inVentiv Health, Inc. and Michael Bell (incorporated by reference from Exhibit 10.18 to inVentiv Health, Inc.’s Amendment No. 3 to Form S-4 (File No. 333-197719) filed on February 10, 2015). | |
| 10.9 |
Letter Agreement between inVentiv Health, Inc. and Charles J. Shea (incorporated by reference from Exhibit 10.19 to inVentiv Health, Inc.’s Amendment No. 4 to Form S-4 (File No. 333-197719) filed on March 16, 2015). | |
| 10.10 |
inVentiv Group Holdings, Inc. 2010 Equity Incentive Plan (incorporated by reference from Exhibit 10.20 to inVentiv Health, Inc.’s Amendment No. 4 to Form S-4 (File No. 333-197719) filed on March 16, 2015). | |
| 10.11 |
First Amendment to the inVentiv Group Holdings, Inc. 2010 Equity Incentive Plan (incorporated by reference from Exhibit 10.21 to inVentiv Health, Inc.’s Amendment No. 4 to Form S-4 (File No. 333-197719) filed on March 16, 2015). | |
| 10.12 |
Second Amendment to the inVentiv Group Holdings, Inc. 2010 Equity Incentive Plan (incorporated by reference from Exhibit 10.22 to inVentiv Health, Inc.’s Amendment No. 4 to Form S-4 (File No. 333-197719) filed on March 16, 2015). | |
| 10.13 |
Form of Option Award under the 2010 inVentiv Group Holdings, Inc. Equity Incentive Plan (incorporated by reference from Exhibit 10.23 to inVentiv Health, Inc.’s Amendment No. 4 to Form S-4 (File No. 333-197719) filed on March 16, 2015). | |
| 10.14 |
Form of Performance Based Restricted Stock Unit Award under the 2010 inVentiv Group Holdings, Inc. Equity Incentive Plan (incorporated by reference from Exhibit 10.24 to inVentiv Health, Inc.’s Amendment No. 4 to Form S-4
(File No. 333-197719) filed on March 16, 2015). | |
| 10.15 |
Form of 2013 Restricted Stock Unit Award under the 2010 inVentiv Group Holdings, Inc. Equity Incentive Plan (incorporated by reference from Exhibit 10.25 to inVentiv Health, Inc.’s Amendment No. 4 to Form S-4
(File No. 333-197719) filed on March 16, 2015). | |
| 10.16 |
Form of Long Term Incentive Plan Restricted Stock Unit Award under the 2010 inVentiv Group Holdings, Inc. Equity Incentive Plan (incorporated by reference from Exhibit 10.26 to inVentiv Health, Inc.’s Amendment No. 4 to Form S-4 (File No. 333-197719) filed on March 16, 2015). | |
| 10.17 |
Letter Agreement between inVentiv Health, Inc. and Paul M. Meister. (incorporated by reference from Exhibit 10.27 to inVentiv Health, Inc.’s Amendment No. 5 to Form S-4 (File No. 333-197719) filed on June 19, 2015). | |
II-6
Table of Contents
| Exhibit |
Exhibit | |
| 10.18 |
First Amendment to the Employment, Severance and Non-Competition Agreement between Michael Bell and inVentiv Health, Inc. (incorporated by reference from Exhibit 10.28 to inVentiv Health, Inc.’s Amendment No. 5 to Form S-4 (File No. 333-197719) filed on June 19, 2015). | |
| 10.19 |
Form of Option Award under the 2010 inVentiv Group Holdings, Inc. Equity Incentive Plan (incorporated by reference from Exhibit 10.14 to inVentiv Health, Inc.’s Amendment No. 6 to Form S-4 (File No. 333-197719) filed on August 3, 2015). | |
| 10.20 |
Offer Letter, dated May 15, 2015, between inVentiv Health, Inc. and Michael McKelvey (incorporated by reference from Exhibit 10.20 to inVentiv Health, Inc.’s Annual Report on Form 10-K (File No. 000-30318) filed on March 18, 2016). | |
| 10.21 |
Offer Letter, dated September 29, 2015, between inVentiv Health, Inc. and Rachel Stahler (incorporated by reference from Exhibit 10.21 to inVentiv Health, Inc.’s Annual Report on Form 10-K (File No. 000-30318) filed on March 18, 2016). | |
| 10.22 |
Severance and Non-Competition Agreement, dated May 6, 2015, between Michael McKelvey and inVentiv Health, Inc. (incorporated by reference from Exhibit 10.22 to inVentiv Health, Inc.’s Annual Report on Form 10-K (File No. 000-30318) filed on March 18, 2016). | |
| 10.23 |
Severance and Non-Competition Agreement, dated May 27, 2014, between Rachel Stahler and inVentiv Health, Inc. (incorporated by reference from Exhibit 10.23 to inVentiv Health, Inc.’s Annual Report on Form 10-K (File No. 000-30318) filed on March 18, 2016). | |
| 10.24 |
Enhanced Separation Agreement and General Release of Claims, dated March 16, 2016, between inVentiv Health, Inc. and Michael Griffith (incorporated by reference from Exhibit 10.24 to inVentiv Health, Inc.’s Annual Report on Form 10-K (File No. 000-30318) filed on March 18, 2016). | |
| 10.25 |
Separation Agreement and General Release of Claims, dated March 16, 2016, between inVentiv Health, Inc. and Michael Griffith (incorporated by reference from Exhibit 10.25 to inVentiv Health, Inc.’s Annual Report on Form 10-K (File No. 000-30318) filed on March 18, 2016). | |
| 10.26* |
Form of Tax Receivables Agreement. | |
| 14.1 |
Code of Ethics (incorporated by reference from Exhibit 14.1 to inVentiv Health, Inc.’s Annual Report on Form 10-K (File No. 000-30318) filed on March 18, 2016). | |
| 21.1* |
Subsidiaries of inVentiv Group Holdings, Inc. | |
| 23.1 |
Consent of Deloitte & Touche LLP | |
| 23.2* |
Consent of Weil, Gotshal & Manges, LLP (included in Exhibit 5.1) | |
| 24.1 |
Power of Attorney (included on signature page). | |
| * | To be filed by amendment. |
(b) Financial Statement Schedules:
Schedule I—Condensed Financial Information of inVentiv Group Holdings, Inc.
II-7
Table of Contents
| Item | 17. Undertakings |
The undersigned registrant hereby undertakes to provide to the underwriters at the closing specified in the underwriting agreements, certificates in such denominations and registered in such names as required by the underwriters to permit prompt delivery to each purchaser.
Insofar as indemnification for liabilities arising under the Securities Act may be permitted to directors, officers and controlling persons of the registrant pursuant to the provisions referenced in Item 14 of this registration statement, or otherwise, the registrant has been advised that in the opinion of the SEC such indemnification is against public policy as expressed in the Securities Act and is, therefore, unenforceable. In the event that a claim for indemnification against such liabilities (other than the payment by the registrant of expenses incurred or paid by a director, officer, or controlling person of the registrant in the successful defense of any action, suit or proceeding) is asserted by such director, officer or controlling person in connection with the securities being registered hereunder, the registrant will, unless in the opinion of its counsel the matter has been settled by controlling precedent, submit to a court of appropriate jurisdiction the question of whether such indemnification by it is against public policy as expressed in the Securities Act and will be governed by the final adjudication of such issue.
The undersigned registrant hereby undertakes that:
| (1) | For purposes of determining any liability under the Securities Act, the information omitted from the form of prospectus filed as part of this registration statement in reliance upon Rule 430A and contained in a form of prospectus filed by the registrant pursuant to Rule 424(b)(1) or (4) or 497(h) under the Securities Act shall be deemed to be part of this registration statement as of the time it was declared effective. |
| (2) | For the purpose of determining any liability under the Securities Act, each post-effective amendment that contains a form of prospectus shall be deemed to be a new registration statement relating to the securities offered therein, and the offering of such securities at that time shall be deemed to be the initial bona fide offering thereof. |
II-8
Table of Contents
SIGNATURES
Pursuant to the requirements of the Securities Act of 1933, the registrant has duly caused this registration statement to be signed on its behalf by the undersigned, thereunto duly authorized in the City of Burlington, State of Massachusetts, on April 5, 2016.
| INVENTIV GROUP HOLDINGS, INC. | ||
| By: |
/s/ Jonathan E. Bicknell | |
| Name: |
Jonathan E. Bicknell | |
| Title: |
Chief Financial Officer and Chief Accounting Officer | |
KNOW ALL MEN BY THESE PRESENTS, that each of the undersigned constitutes and appoints each of Jonathan E. Bicknell and Eric R. Green or any of them, each acting alone, his true and lawful attorney-in-fact and agent, with full power of substitution and resubstitution, for such person and in his name, place and stead, in any and all capacities, to sign this Registration Statement on Form S-1 (including all pre-effective and post-effective amendments and registration statements filed pursuant to Rule 462(b) under the Securities Act of 1933), and to file the same, with all exhibits thereto, and other documents in connection therewith, with the SEC, granting unto said attorneys-in-fact and agents, each acting alone, full power and authority to do and perform each and every act and thing requisite and necessary to be done in and about the premises, as fully to all intents and purposes as he might or could do in person, hereby ratifying and confirming that any such attorney-in-fact and agent, or his substitute or substitutes, may lawfully do or cause to be done by virtue hereof.
Pursuant to the requirements of the Securities Act of 1933, this registration statement has been signed by the following persons in the capacities indicated on April 5, 2016.
| Signature |
Title | |
| /s/ Michael A. Bell |
Chief Executive Officer, Chairman of the Board and Director (Principal Executive Officer) | |
| Michael A. Bell |
||
| /s/ Jonathan E. Bicknell |
Chief Financial Officer and Chief Accounting Officer (Principal Financial and Accounting Officer) | |
| Jonathan E. Bicknell |
||
| /s/ Jeffrey P. McMullen |
Director | |
| Jeffrey P. McMullen |
||
| /s/ Todd M. Abbrecht |
Director | |
| Todd M. Abbrecht |
||
| /s/ Laura A. Grattan |
Director | |
| Laura A. Grattan |
||
| /s/ Joshua M. Nelson |
Director | |
| Joshua M. Nelson |
||
| /s/ Charles J. Shea |
Director | |
| Charles J. Shea |
||
| /s/ R. Blane Walter |
Director | |
| R. Blane Walter |
||
II-9
Table of Contents
Schedule I-Condensed Financial Information of Registrant
INVENTIV GROUP HOLDINGS, INC. (PARENT COMPANY ONLY)
CONDENSED BALANCE SHEETS
(in thousands, except share data)
| December 31, | ||||||||
| 2015 | 2014 | |||||||
| ASSETS |
||||||||
| Total assets |
$ | — | $ | — | ||||
|
|
|
|
|
|||||
| LIABILITIES AND STOCKHOLDERS’ DEFICIT |
||||||||
| Current liabilities: |
||||||||
| Total current liabilities |
$ | — | $ | — | ||||
| Negative investment in subsidiaries |
772,736 | 615,181 | ||||||
|
|
|
|
|
|||||
| Total liabilities |
772,736 | 615,181 | ||||||
|
|
|
|
|
|||||
| Commitments and contingencies |
||||||||
| Stockholders’ deficit: |
||||||||
| Common stock, $.01 par value, 7,500,000 shares authorized, 5,402,377 shares issued and outstanding at December 31, 2015 and 2014 |
54 | 54 | ||||||
| Additional paid-in-capital |
573,686 | 569,810 | ||||||
| Accumulated deficit |
(1,309,136 | ) | (1,157,668 | ) | ||||
| Accumulated other comprehensive loss |
(37,340 | ) | (27,377 | ) | ||||
|
|
|
|
|
|||||
| Total stockholders’ deficit |
(772,736 | ) | (615,181 | ) | ||||
|
|
|
|
|
|||||
| Total liabilities and stockholders’ deficit |
$ | — | $ | — | ||||
|
|
|
|
|
|||||
S-1
Table of Contents
INVENTIV GROUP HOLDINGS, INC. (PARENT COMPANY ONLY)
CONDENSED STATEMENTS OF OPERATIONS
(in thousands)
| For the Year Ended December 31, | ||||||||||||
| 2015 | 2014 | 2013 | ||||||||||
| Equity in net losses of subsidiaries |
$ | (151,468 | ) | $ | (189,635 | ) | $ | (237,573 | ) | |||
|
|
|
|
|
|
|
|||||||
| Net loss |
$ | (151,468 | ) | $ | (189,635 | ) | $ | (237,573 | ) | |||
|
|
|
|
|
|
|
|||||||
S-2
Table of Contents
INVENTIV GROUP HOLDINGS, INC. (PARENT COMPANY ONLY)
CONDENSED STATEMENTS OF COMPREHENSIVE LOSS
(in thousands)
| For the Year Ended December 31, | ||||||||||||
| 2015 | 2014 | 2013 | ||||||||||
| Net loss |
$ | (151,468 | ) | $ | (189,635 | ) | $ | (237,573 | ) | |||
| Other comprehensive income (loss): |
||||||||||||
| Foreign currency translation adjustment |
(9,963 | ) | (16,848 | ) | (7,246 | ) | ||||||
|
|
|
|
|
|
|
|||||||
| Total other comprehensive loss |
(9,963 | ) | (16,848 | ) | (7,246 | ) | ||||||
|
|
|
|
|
|
|
|||||||
| Total comprehensive loss |
$ | (161,431 | ) | $ | (206,483 | ) | $ | (244,819 | ) | |||
|
|
|
|
|
|
|
|||||||
S-3
Table of Contents
INVENTIV GROUP HOLDINGS, INC. (PARENT COMPANY ONLY)
CONDENSED STATEMENTS OF CASH FLOWS
(in thousands)
| For the Year Ended December 31, | ||||||||||||
| 2015 | 2014 | 2013 | ||||||||||
| Cash flows from operating activities: |
||||||||||||
| Net loss |
$ | (151,468 | ) | $ | (189,635 | ) | $ | (237,573 | ) | |||
| Adjustments to reconcile net loss to net cash provided by (used) in operating activities: |
||||||||||||
| Equity in net losses of subsidiaries |
151,468 | 189,635 | 237,573 | |||||||||
|
|
|
|
|
|
|
|||||||
| Net cash provided by (used in) operating activities |
— | — | — | |||||||||
| Cash flows from investing activities: |
||||||||||||
| Investment in subsidiaries |
— | — | (17 | ) | ||||||||
|
|
|
|
|
|
|
|||||||
| Net cash provided by (used in) investing activities |
— | — | (17 | ) | ||||||||
| Cash flows from financing activities: |
||||||||||||
| Equity contribution from investors |
— | — | 44 | |||||||||
| Stock issued under equity incentive plan |
— | — | 41 | |||||||||
| Repurchase of common stock |
— | — | (27 | ) | ||||||||
| Other, net |
— | — | (41 | ) | ||||||||
|
|
|
|
|
|
|
|||||||
| Net cash provided by (used in) financing activities |
— | — | 17 | |||||||||
|
|
|
|
|
|
|
|||||||
| Net increase (decrease) in cash and cash equivalents |
— | — | — | |||||||||
| Cash and cash equivalents, beginning of year |
— | — | — | |||||||||
|
|
|
|
|
|
|
|||||||
| Cash and cash equivalents, end of year |
$ | — | $ | — | $ | — | ||||||
|
|
|
|
|
|
|
|||||||
S-4
Table of Contents
INVENTIV GROUP HOLDINGS, INC. (PARENT COMPANY ONLY)
NOTES TO CONDENSED FINANCIAL STATEMENTS
| 1. | Background and basis of presentation |
inVentiv Group Holdings, Inc. (the “Parent Company”) is a holding company that conducts substantially all of its business operations through its subsidiaries. The ability of the Parent Company’s subsidiaries to pay dividends is currently restricted by the terms of the Senior Secured Credit Facilities, ABL Facility, International Facility and the indentures governing the Senior Secured Notes, Junior Lien Secured Notes and Senior Unsecured Notes. Substantially all of the net assets of the Parent Company’s consolidated subsidiaries are restricted.
The accompanying condensed financial information includes the accounts of the Parent Company and, on an equity method basis, its investment in subsidiaries and affiliates. Accordingly, these condensed financial statements have been presented on a “parent-only” basis. These parent-only financial statements should be read in conjunction with inVentiv Group Holdings, Inc. audited consolidated financial statements included elsewhere herein.
S-5
Table of Contents
EXHIBIT INDEX
| Exhibit |
Exhibit | |
| 1.1* | Form of Underwriting Agreement. | |
| 3.1* | Amended and Restated Certificate of Incorporation of inVentiv Group Holdings, Inc., as currently in effect. | |
| 3.2* | Amended and Restated By-Laws of inVentiv Group Holdings, Inc., as currently in effect. | |
| 3.3* | Form of Amended and Restated Certificate of Incorporation of inVentiv Group Holdings, Inc. to be in effect prior to the consummation of the offering made under this Registration Statement. | |
| 3.4* | Amended and Restated By-Laws of inVentiv Group Holdings, Inc. to be in effect prior to the consummation of the offering made under this Registration Statement. | |
| 4.1* | Form of Certificate of Common Stock. | |
| 4.2* | Stockholders Agreement, Dated as of August 4, 2010, by and among inVentiv Group Holdings, Inc., inVentiv Midco Holdings, Inc., inVentiv Holdings, Inc., inVentiv Acquisition, Inc. and the Investors, Other Investors and Managers named therein. | |
| 4.3* | Registration and Participation Rights Agreement, dated as of August 4, 2010, by and among inVentiv Group Holdings, Inc., inVentiv Midco Holdings, Inc., inVentiv Holdings, Inc., inVentiv Acquisition, Inc. and Certain Stockholders of inVentiv Group Holdings, Inc. | |
| 4.4 | Indenture, dated as of August 4, 2010, by and among inVentiv Health, Inc., the Guarantors identified therein, and Wilmington Trust, FSB, as Trustee (incorporated by reference from Exhibit 4.1 to inVentiv Health, Inc.’s Amendment No. 1 to Form S-4 (File No. 333-197719) filed on October 6, 2014). | |
| 4.5 | Form of 10% Senior Unsecured Notes due 2018 (included in the Indenture filed as Exhibit 4.4) | |
| 4.6 | Supplemental Indenture, dated as of September 1, 2010, between Chamberlain Communications LLC, and Wilmington Trust, FSB, as Trustee (incorporated by reference from Exhibit 4.3 to inVentiv Health, Inc.’s Amendment No. 1 to Form S-4 (File No. 333-197719) filed on October 6, 2014). | |
| 4.7 | Supplemental Indenture, dated as of February 11, 2011, by and among inVentiv Health, Inc., Campbell Alliance Group, Inc., Encuity Research, LLC (previously known as Campbell Alliance Market Research and Analytics, LLC), Pharmaceutical Institute, Inc., and Wilmington Trust, FSB, as Trustee (incorporated by reference from Exhibit 4.4 to inVentiv Health, Inc.’s Amendment No. 1 to Form S-4 (File No. 333-197719) filed on October 6, 2014). | |
| 4.8 | Third Supplemental Indenture, dated as of June 10, 2011, by and among inVentiv Health, Inc., Ingenix Pharmaceutical Services, Inc., Raven Holdco LLC, and Wilmington Trust, FSB, as Trustee (incorporated by reference from Exhibit 4.5 to inVentiv Health, Inc.’s Amendment No. 1 to Form S-4 (File No. 333-197719) filed on October 6, 2014). | |
| 4.9 | Fourth Supplemental Indenture, dated as of July 13, 2011, by and among inVentiv Health, Inc., the Guarantors identified therein, and Wilmington Trust, National Association (as successor by merger to Wilmington Trust, FSB), as Trustee (incorporated by reference from Exhibit 4.6 to inVentiv Health, Inc.’s Amendment No. 1 to Form S-4 (File No. 333-197719) filed on October 6, 2014). | |
| 4.10 | Fifth Supplemental Indenture, dated as of April 30, 2012, by and among inVentiv Health, Inc., the Guarantors identified therein, and Wilmington Trust, National Association (as successor by merger to Wilmington Trust, FSB), as Trustee (incorporated by reference from Exhibit 4.7 to inVentiv Health, Inc.’s Amendment No. 1 to Form S-4 (File No. 333-197719) filed on October 6, 2014). | |
Table of Contents
| Exhibit |
Exhibit | |
| 4.11 | Sixth Supplemental Indenture, dated as of December 20, 2012, by and among inVentiv Health, Inc., the Guarantors identified therein, and Wilmington Trust, National Association (as successor by merger to Wilmington Trust, FSB), as Trustee (incorporated by reference from Exhibit 4.8 to inVentiv Health, Inc.’s Amendment No. 1 to Form S-4 (File No. 333-197719) filed on October 6, 2014). | |
| 4.12 | Seventh Supplemental Indenture, dated as of February 7, 2013, by and among inVentiv Health, Inc., the Guarantors identified therein, and Wilmington Trust, National Association (as successor by merger to Wilmington Trust, FSB), as Trustee (incorporated by reference from Exhibit 4.9 to inVentiv Health, Inc.’s Amendment No. 1 to Form S-4 (File No. 333-197719) filed on October 6, 2014). | |
| 4.13 | Eighth Supplemental Indenture, dated as of December 10, 2013, by and among inVentiv Health, Inc., the Guarantors identified therein, and Wilmington Trust, National Association (as successor by merger to Wilmington Trust, FSB), as Trustee (incorporated by reference from Exhibit 4.10 to inVentiv Health, Inc.’s Amendment No. 1 to Form S-4 (File No. 333-197719) filed on October 6, 2014). | |
| 4.14 | Ninth Supplemental Indenture, dated as of August 12, 2014, by and among inVentiv Health, Inc., the Guarantors identified therein, and Wilmington Trust, National Association, as Trustee (incorporated by reference from Exhibit 4.11 to inVentiv Health, Inc.’s Amendment No. 1 to Form S-4 (File No. 333-197719) filed on October 6, 2014). | |
| 4.15 | Tenth Supplemental Indenture, dated as of January 16, 2015, by and between inVentiv Advance Insights, LLC and Wilmington Trust, National Association (as successor by merger to Wilmington Trust, FSB), as Trustee (incorporated by reference from Exhibit 4.26 to inVentiv Health, Inc.’s Amendment No. 3 to Form S-4 (File No. 333-197719) filed on February 10, 2015). | |
| 4.16 | Registration Rights Agreement, dated as of August 4, 2010, by and among inVentiv Health, Inc., the Guarantors identified therein, Banc of America Securities LLC, Citigroup Global Markets Inc., Credit Suisse Securities (USA) LLC and Deutsche Bank Securities Inc. (incorporated by reference from Exhibit 4.12 to inVentiv Health, Inc.’s Amendment No. 1 to Form S-4 (File No. 333-197719) filed on October 6, 2014). | |
| 4.17 | Registration Rights Agreement, dated as of June 10, 2011, by and among inVentiv Health, Inc., the Guarantors identified therein, and Apollo Investment Corporation (incorporated by reference from Exhibit 4.13 to inVentiv Health, Inc.’s Amendment No. 1 to Form S-4 (File No. 333-197719) filed on October 6, 2014). | |
| 4.18 | Registration Rights Agreement, dated as of July 13, 2011, by and among inVentiv Health, Inc., the Guarantors identified therein, Merrill Lynch, Pierce, Fenner & Smith Incorporated, Citigroup Global Markets Inc., Jefferies & Company, Inc., Credit Suisse Securities (USA) LLC, Deutsche Bank Securities Inc. and Wells Fargo Securities, LLC (incorporated by reference from Exhibit 4.14 to inVentiv Health, Inc.’s Amendment No. 1 to Form S-4 (File No. 333-197719) filed on October 6, 2014). | |
| 4.19 | Indenture, dated as of December 20, 2012, by and among inVentiv Health, Inc., the Guarantors identified therein and Wilmington Trust, National Association, as trustee (incorporated by reference from Exhibit 4.15 to inVentiv Health, Inc.’s Amendment No. 1 to Form S-4 (File No. 333-197719) filed on October 6, 2014). | |
| 4.20 | Form of 9% Senior Secured Notes due 2018 (included in the Indenture filed as Exhibit 4.19). | |
| 4.21 | First Supplemental Indenture, dated as of February 7, 2013, by and among inVentiv Health, Inc., the Guarantors identified therein and Wilmington Trust, National Association, as trustee (incorporated by reference from Exhibit 4.16 to inVentiv Health, Inc.’s Amendment No. 1 to Form S-4 (File No. 333-197719) filed on October 6, 2014). | |
Table of Contents
| Exhibit |
Exhibit | |
| 4.22 | Second Supplemental Indenture, dated as of December 10, 2013, by and among inVentiv Health, Inc., the Guarantors identified therein and Wilmington Trust, National Association, as trustee (incorporated by reference from Exhibit 4.17 to inVentiv Health, Inc.’s Amendment No. 1 to Form S-4 (File No. 333-197719) filed on October 6, 2014). | |
| 4.23 | Third Supplemental Indenture, dated as of December 18, 2013, by and among inVentiv Health, Inc., the Guarantors identified therein and Wilmington Trust, National Association, as trustee (incorporated by reference from Exhibit 4.18 to inVentiv Health, Inc.’s Amendment No. 1 to Form S-4 (File No. 333-197719) filed on October 6, 2014). | |
| 4.24 | Fourth Supplemental Indenture, dated as of January 16, 2015, by and between inVentiv Advance Insights, LLC and Wilmington Trust, National Association, as Trustee (incorporated by reference from Exhibit 4.27 to inVentiv Health, Inc.’s Amendment No. 3 to Form S-4 (File No. 333-197719) filed on February 10, 2015). | |
| 4.25 | Amended and Restated Credit Agreement, dated as of July 13, 2011 by and among inVentiv Health, Inc., inVentiv Holdings, Inc., the lenders and other parties from time to time thereto and Citibank, N.A, as administrative agent (incorporated by reference from Exhibit 4.19 to inVentiv Health, Inc.’s Amendment No. 1 to Form S-4 (File No. 333-197719) filed on October 6, 2014). | |
| 4.26 | Amendment No. 1 to the Amended and Restated Credit Agreement, dated as of July 13, 2011 by and among inVentiv Health, Inc., inVentiv Holdings, Inc., the lenders and other parties from time to time thereto and Citibank, N.A, as administrative agent, dated as of March 21, 2012 (incorporated by reference from Exhibit 4.20 to inVentiv Health, Inc.’s Amendment No. 1 to Form S-4 (File No. 333-197719) filed on October 6, 2014). | |
| 4.27 | Amendment No. 2 to the Amended and Restated Credit Agreement, dated as of July 13, 2011 by and among inVentiv Health, Inc., inVentiv Holdings, Inc., the lenders and other parties from time to time thereto and Citibank, N.A, as administrative agent, dated as of December 20, 2012 (incorporated by reference from Exhibit 4.21 to inVentiv Health, Inc.’s Amendment No. 1 to Form S-4 (File No. 333-197719) filed on October 6, 2014). | |
| 4.28 | Amendment No. 3 to the Amended and Restated Credit Agreement, dated as of July 13, 2011 by and among inVentiv Health, Inc., inVentiv Holdings, Inc., the lenders and other parties from time to time thereto and Citibank, N.A, as administrative agent, dated as of July 28, 2014 (incorporated by reference from Exhibit 4.22 to inVentiv Health, Inc.’s Amendment No. 1 to Form S-4 (File No. 333-197719) filed on October 6, 2014). | |
| 4.29 | Credit Agreement, dated as of August 16, 2013 by and among inVentiv Health, Inc., inVentiv Holdings, Inc., the lenders and other parties from time to time thereto and Citibank, N.A, as administrative agent (incorporated by reference from Exhibit 4.23 to inVentiv Health, Inc.’s Amendment No. 1 to Form S-4 (File No. 333-197719) filed on October 6, 2014). | |
| 4.30 | Amendment No 1. to the Credit Agreement, dated as of August 16, 2013 by and among inVentiv Health, Inc., inVentiv Holdings, Inc., the lenders and other parties from time to time thereto and Citibank, N.A, as administrative agent, dated as of July 28, 2014 (incorporated by reference from Exhibit 4.24 to inVentiv Health, Inc.’s Amendment No. 1 to Form S-4 (File No. 333-197719) filed on October 6, 2014). | |
| 4.31 | Indenture, dated as of August 12, 2014 by and among inVentiv Health, Inc., the Guarantor identified therein and Wilmington Trust, National Association, as trustee and collateral agent (incorporated by reference from Exhibit 4.25 to inVentiv Health, Inc.’s Amendment No. 1 to Form S-4 (File No. 333-197719) filed on October 6, 2014). | |
| 4.32 | Form of 10% / 12% Junior Lien PIK Noes due 2018 (included in the Indenture filed as Exhibit 4.31). | |
Table of Contents
| Exhibit |
Exhibit | |
| 4.33 | First Supplemental Indenture, dated as of January 16, 2015, by and between inVentiv Advance Insights, LLC and Wilmington Trust, National Association, as Trustee (incorporated by reference from Exhibit 4.28 to inVentiv Health, Inc.’s Amendment No. 3 to Form S-4 (File No. 333-197719) filed on February 10, 2015). | |
| 5.1* | Opinion of Weil, Gotshal & Manges, LLP. | |
| 10.1 | Management Agreement, dated as of August 4, 2010, by and among Group Holdings, Inc., inVentiv Midco Holdings, Inc., inVentiv Holdings, Inc., inVentiv Acquisition, Inc., inVentiv Health, Inc. and THL Managers VI, LLC. (incorporated by reference from Exhibit 10.1 to inVentiv Health, Inc.’s Amendment No. 1 to Form S-4 (File No. 333-197719) filed on October 6, 2014). | |
| 10.2 | Amendment to Management Agreement, dated as of December 2, 2013, by and among Group Holdings, Inc., inVentiv Midco Holdings, Inc., inVentiv Holdings, Inc., inVentiv Acquisition, Inc., inVentiv Health, Inc. and THL Managers VI, LLC (incorporated by reference from Exhibit 10.2 to inVentiv Health, Inc.’s Amendment No. 1 to Form S-4 (File No. 333-197719) filed on October 6, 2014). | |
| 10.3 | Employment Agreement, dated January 25, 2012, between inVentiv Health, Inc. and Jonathan Bicknell (incorporated by reference from Exhibit 10.8 to inVentiv Health, Inc.’s Amendment No. 1 to Form S-4 (File No. 333-197719) filed on October 6, 2014). | |
| 10.4 | Offer Letter, dated January 16, 2015 between inVentiv Health, Inc. and Eric R. Green (incorporated by reference from Exhibit 10.14 to inVentiv Health, Inc.’s Amendment No. 3 to Form S-4 (File No. 333-197719) filed on February 10, 2015). | |
| 10.5 | Severance and Non-Competition Agreement, dated as of November 1, 2014, between inVentiv Health, Inc. and Eric R. Green (incorporated by reference from Exhibit 10.15 to inVentiv Health, Inc.’s Amendment No. 3 to Form S-4 (File No. 333-197719) filed on February 10, 2015). | |
| 10.6 | Severance and Non-Competition Agreement, dated as of March 10, 2014, between inVentiv Health, Inc. and Michael Griffith (incorporated by reference from Exhibit 10.16 to inVentiv Health, Inc.’s Amendment No. 3 to Form S-4 (File No. 333-197719) filed on February 10, 2015). | |
| 10.7 | Offer Letter, dated February 24, 2014, between inVentiv Health, Inc. and Michael Griffith (incorporated by reference from Exhibit 10.17 to inVentiv Health, Inc.’s Amendment No. 3 to Form S-4 (File No. 333-197719) filed on February 10, 2015). | |
| 10.8 | Employment, Severance and Non-Competition Agreement, dated as of September 24, 2014, between inVentiv Health, Inc. and Michael Bell (incorporated by reference from Exhibit 10.18 to inVentiv Health, Inc.’s Amendment No. 3 to Form S-4 (File No. 333-197719) filed on February 10, 2015). | |
| 10.9 | Letter Agreement between inVentiv Health, Inc. and Charles J. Shea (incorporated by reference from Exhibit 10.19 to inVentiv Health, Inc.’s Amendment No. 4 to Form S-4 (File No. 333-197719) filed on March 16, 2015). | |
| 10.10 | inVentiv Group Holdings, Inc. 2010 Equity Incentive Plan (incorporated by reference from Exhibit 10.20 to inVentiv Health, Inc.’s Amendment No. 4 to Form S-4 (File No. 333-197719) filed on March 16, 2015). | |
| 10.11 | First Amendment to the inVentiv Group Holdings, Inc. 2010 Equity Incentive Plan (incorporated by reference from Exhibit 10.21 to inVentiv Health, Inc.’s Amendment No. 4 to Form S-4 (File No. 333-197719) filed on March 16, 2015). | |
| 10.12 | Second Amendment to the inVentiv Group Holdings, Inc. 2010 Equity Incentive Plan (incorporated by reference from Exhibit 10.22 to inVentiv Health, Inc.’s Amendment No. 4 to Form S-4 (File No. 333-197719) filed on March 16, 2015). | |
Table of Contents
| Exhibit |
Exhibit | |
| 10.13 | Form of Option Award under the 2010 inVentiv Group Holdings, Inc. Equity Incentive Plan (incorporated by reference from Exhibit 10.23 to inVentiv Health, Inc.’s Amendment No. 4 to Form S-4 (File No. 333-197719) filed on March 16, 2015). | |
| 10.14 | Form of Performance Based Restricted Stock Unit Award under the 2010 inVentiv Group Holdings, Inc. Equity Incentive Plan (incorporated by reference from Exhibit 10.24 to inVentiv Health, Inc.’s Amendment No. 4 to Form S-4 (File No. 333-197719) filed on March 16, 2015). | |
| 10.15 | Form of 2013 Restricted Stock Unit Award under the 2010 inVentiv Group Holdings, Inc. Equity Incentive Plan (incorporated by reference from Exhibit 10.25 to inVentiv Health, Inc.’s Amendment No. 4 to Form S-4 (File No. 333-197719) filed on March 16, 2015). | |
| 10.16 | Form of Long Term Incentive Plan Restricted Stock Unit Award under the 2010 inVentiv Group Holdings, Inc. Equity Incentive Plan (incorporated by reference from Exhibit 10.26 to inVentiv Health, Inc.’s Amendment No. 4 to Form S-4 (File No. 333-197719) filed on March 16, 2015). | |
| 10.17 | Letter Agreement between inVentiv Health, Inc. and Paul M. Meister. (incorporated by reference from Exhibit 10.27 to inVentiv Health, Inc.’s Amendment No. 5 to Form S-4 (File No. 333-197719) filed on June 19, 2015). | |
| 10.18 | First Amendment to the Employment, Severance and Non-Competition Agreement between Michael Bell and inVentiv Health, Inc. (incorporated by reference from Exhibit 10.28 to inVentiv Health, Inc.’s Amendment No. 5 to Form S-4 (File No. 333-197719) filed on June 19, 2015). | |
| 10.19 | Form of Option Award under the 2010 inVentiv Group Holdings, Inc. Equity Incentive Plan (incorporated by reference from Exhibit 10.14 to inVentiv Health, Inc.’s Amendment No. 6 to Form S-4 (File No. 333-197719) filed on August 3, 2015). | |
| 10.20 | Offer Letter, dated May 15, 2015, between inVentiv Health, Inc. and Michael McKelvey (incorporated by reference from Exhibit 10.20 to inVentiv Health, Inc.’s Annual Report on Form 10-K (File No. 000-30318) filed on March 18, 2016). | |
| 10.21 | Offer Letter, dated September 29, 2015, between inVentiv Health, Inc. and Rachel Stahler (incorporated by reference from Exhibit 10.21 to inVentiv Health, Inc.’s Annual Report on Form 10-K (File No. 000-30318) filed on March 18, 2016). | |
| 10.22 | Severance and Non-Competition Agreement, dated May 6, 2015, between Michael McKelvey and inVentiv Health, Inc. (incorporated by reference from Exhibit 10.22 to inVentiv Health, Inc.’s Annual Report on Form 10-K (File No. 000-30318) filed on March 18, 2016). | |
| 10.23 | Severance and Non-Competition Agreement, dated May 27, 2014, between Rachel Stahler and inVentiv Health, Inc. (incorporated by reference from Exhibit 10.23 to inVentiv Health, Inc.’s Annual Report on Form 10-K (File No. 000-30318) filed on March 18, 2016). | |
| 10.24 | Enhanced Separation Agreement and General Release of Claims, dated March 16, 2016, between inVentiv Health, Inc. and Michael Griffith (incorporated by reference from Exhibit 10.24 to inVentiv Health, Inc.’s Annual Report on Form 10-K (File No. 000-30318) filed on March 18, 2016). | |
| 10.25 | Separation Agreement and General Release of Claims, dated March 16, 2016, between inVentiv Health, Inc. and Michael Griffith (incorporated by reference from Exhibit 10.25 to inVentiv Health, Inc.’s Annual Report on Form 10-K (File No. 000-30318) filed on March 18, 2016). | |
| 10.26* | Form of Tax Receivables Agreement. | |
| 14.1 | Code of Ethics (incorporated by reference from Exhibit 14.1 to inVentiv Health, Inc.’s Annual Report on Form 10-K (File No. 000-30318) filed on March 18, 2016). | |
| 21.1* | Subsidiaries of inVentiv Group Holdings, Inc. | |
| 23.1 | Consent of Deloitte & Touche LLP | |
| 23.2* | Consent of Weil, Gotshal & Manges, LLP (included in Exhibit 5.1) | |
| 24.1 | Power of Attorney (included on signature page). | |
| * | To be filed by amendment. |