Attached files
| file | filename |
|---|---|
| EX-99.1 - PDF OF EXHIBIT 99.1 - UNITED COMMUNITY BANKS INC | ex99_1.pdf |
| EX-99.2 - PDF OF EXHIBIT 99.2 - UNITED COMMUNITY BANKS INC | ex99_2.pdf |
| 8-K - FORM 8-K - UNITED COMMUNITY BANKS INC | t1600184_8k.htm |
| EX-2.1 - EXHIBIT 2.1 - UNITED COMMUNITY BANKS INC | t1600184_ex2-1.htm |
| EX-99.1 - EXHIBIT 99.1 - UNITED COMMUNITY BANKS INC | t1600184_ex99-1.htm |
Exhibit 99.2

ucbi.com | 1 INVESTOR PRESENTATION March 31, 2016 United Community Banks, Inc. Acquisition of Tidelands Bancshares, Inc. April 4, 2016 → Strategic purchase completes a two - step plan, accelerating growth in attractive Coastal South Carolina markets → Additional organic growth from lift - out of an experienced lending team → Compelling acquisition that is immediately accretive to operating earnings
ucbi.com | 2 ucbi.com | 2 Forward - Looking Statements Forward - Looking Statements This presentation contains “forward - looking statements” as defined in the Private Securities Litigation Reform Act of 1995. In general, forward - looking statements usually use words such as “may,” “believe,” “expect,” “anticipate,” “intend,” “will,” “shoul d,” “plan,” “estimate,” “predict,” “continue” and “potential” or the negative of these terms or other comparable terminology, inc lud ing statements related to the expected timing of the closing of the proposed merger transaction, the expected returns and other benefits of the proposed merger transaction to shareholders, expected improvement in operating efficiency resulting from the proposed merger transaction, estimated expense reductions resulting from the transaction and the timing of achievement of suc h reductions, the impact on and timing of the recovery of the impact on tangible book value, and the effect of the proposed mer ger transaction on the capital ratios of United Community Banks, Inc. (“United”). Forward - looking statements represent management’s beliefs, based upon information available at the time the statements are made, with regard to the matters addressed; they are not guarantees of future performance. Forward - looking statements are subject to numerous assumptions, risks and uncertainties that change over time and could cause actual results or financial condition to differ materially from th ose expressed in or implied by such statements . Factors that could cause or contribute to such differences include, but are not limited to, the possibility that expected ben efi ts may not materialize in the time frames expected or at all, or may be more costly to achieve; that the proposed merger transaction ma y not be timely completed, if at all; that prior to completion of the proposed merger transaction or thereafter, the parties’ r esp ective businesses may not perform as expected due to transaction - related uncertainties or other factors; that the parties are unable to implement successful integration strategies; that the required regulatory, shareholder, or other closing conditions are not s ati sfied in a timely manner, or at all; reputational risks and the reaction of the parties’ customers to the proposed merger transacti on; diversion of management time to issues related to the proposed merger transaction; and other factors and risk influences contained in the cautionary language included under the headings “Management’s Discussion and Analysis of Financial Condition and Results of Operations” and “Risk Factors” in United’s Form 10 - K for the year ended December 31, 2015 and other documents subsequently filed by United with the Securities and Exchange Commission (the “SEC”). Consequently, no forward - looking statement can be guaranteed. Neither United nor Tidelands Bancshares, Inc. (“Tidelands”) undertakes any obligation to update or revise any forward - looking statements, whether as a result of new information, future events or otherwise. For any forward - looking statements made in this presentation or any related documents, United and Tidelands claim protection of the safe harbor for forward - looking statements contained in the Private Securities Litigation Reform Act of 1995.

ucbi.com | 3 ucbi.com | 3 Forward - Looking Statements Participants in the Merger Solicitation United and Tidelands, and certain of their respective directors, executive officers and other members of management and employees may be deemed to be participants in the solicitation of proxies from the shareholders of Tidelands in respect of the proposed merger transaction. Information regarding the directors and executive officers of United and Tidelands and other persons who may be deemed participants in the solicitation of the shareholders of Tidelands in connection with the proposed transaction will be included in the proxy statement/prospectus for Tidelands’ meeting of shareholders, which will be filed by Tidelands with the SEC. Information about United’s directors and executive officers can also be found in the United’s definitive proxy statement in connection with its 2016 annual meeting of shareholders, as filed with the SEC on March 31, 2016, and other documents subsequently filed by United with the SEC. Information about Tidelands’ directors and executive officers can also be found in Tidelands’ definitive proxy statement in connection with its 2015 annual meeting of shareholders, as filed with the SEC on April 8, 2016, and other documents subsequently filed by Tidelands with the SEC. Additional information regarding the interests of such participants will be included in the proxy statement and other relevant documents regarding the proposed merger transaction filed with the SEC when they become available.

ucbi.com | 4 Tidelands Bancshares, Inc. United Community Banks, Inc. (134) Tidelands Bancshares, Inc . (7) Combined Branch Map Company Overview ucbi.com | 4 INTERSTATE 185 INTERSTATE 75 INTERSTATE 16 INTERSTATE 77 INTERSTATE 20 INTERSTATE 95 INTERSTATE 74 INTERSTATE 24 INTERSTATE 40 INTERSTATE 26 Knoxville South Carolina North Carolina Greenville Georgia Savannah Florida Tennessee Atlanta Nashville INTERSTATE 575 Charlotte Charleston INTERSTATE 26 INTERSTATE 95 Myrtle Beach Garden City Beach North Charleston Summerville Charleston Hilton Head Island Savannah Headquarters Mt. Pleasant, SC Established 2003 Branches (7) Charleston (4) Myrtle Beach (2) Hilton Head (1) Ticker (OTC Pink) TDBK Assets ($MM) $466 Total Gross Loans ($MM) $325 Deposits ($MM) $421 NPAs / Assets (1) 4.40% LTM ROAA (0.38%) (1) NPAs / Assets = (nonaccrual loans + OREO) / total assets Source: SNL Financial; f inancial metrics as of December 31, 2015
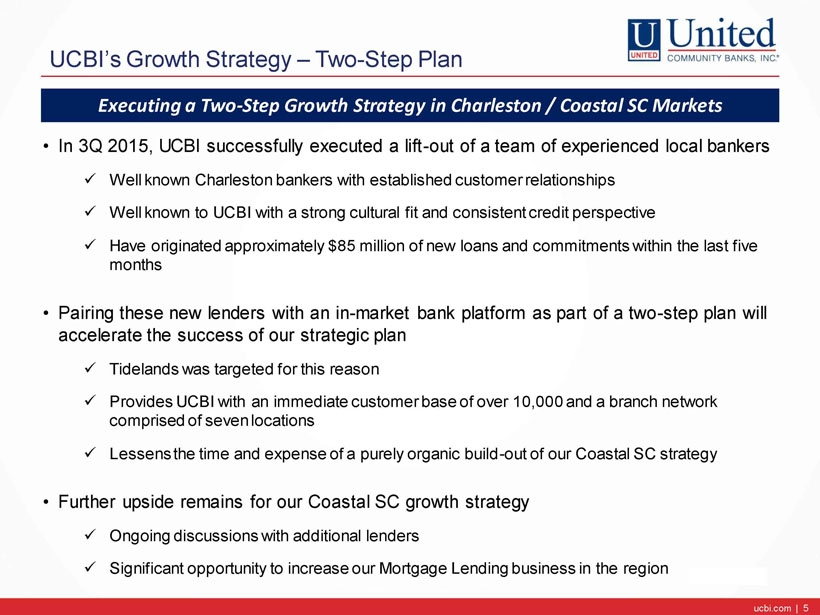
ucbi.com | 5 UCBI’s Growth Strategy – Two - Step Plan ucbi.com | 5 • In 3Q 2015, UCBI successfully executed a lift - out of a team of experienced local bankers x Well known Charleston bankers with established customer relationships x Well known to UCBI with a strong cultural fit and consistent credit perspective x Have originated approximately $85 million of new loans and commitments within the last five months • Pairing these new lenders with an in - market bank platform as part of a two - step plan will accelerate the success of our strategic plan x Tidelands was targeted for this reason x Provides UCBI with an immediate customer base of over 10,000 and a branch network comprised of seven locations x Lessens the time and expense of a purely organic build - out of our Coastal SC strategy • Further upside remains for our Coastal SC growth strategy x Ongoing discussions with additional lenders x Significant opportunity to increase our Mortgage Lending business in the region Executing a Two - Step Growth Strategy in Charleston / Coastal SC Markets

ucbi.com | 6 Transaction Rationale Strategically Compelling • Consistent with UCBI’s Southeastern expansion strategy • Significantly accelerates UCBI’s Coastal South Carolina expansion and leverages existing lift - out team of experienced bankers and in - market resources − The lift - out team enhances the Tidelands franchise by providing senior lending and management expertise with deep community roots in the demographically attractive markets of Charleston, Myrtle Beach and Hilton Head − The lift - out bankers share a community banking philosophy driven by client focus, local expertise and cultural fit • Acquisition of a scalable platform to accelerate Coastal South Carolina growth strategy • Significant cost synergies enhance deal economics Financially Attractive • Accretive to 2017 earnings • Manageable TBV dilution which is earned back in just over two years • Pro forma capital ratios support future growth and expansion • Internal rate of return consistent with management’s objectives Low Execution Risk • Due diligence completed, including an extensive credit and OREO review • Credit mark of 5% on loans and 50% on OREO will mitigate exposure from future losses • Integration risk is offset by merger experience / preparedness and local management already in place ucbi.com | 6

ucbi.com | 7 Transaction Structure and Pro Forma Results Transaction Value / Consideration • $11.2 million aggregate transaction value; 100% cash consideration − $2.2 million value to common, or $0.52 per common share in cash − $9.0 million to redeem TARP, which represents a 56% discount Key Financial Assumptions • Target cost savings : approximately $5.0 million • Total credit mark : $22.7 million − Loan mark of $16.3 million gross or 5.0% of gross loans − OREO mark of $6.4 million or 50% of year - end 2015 balances • CDI : 1.2% of Tidelands non - CD deposits • Estimated transaction costs: $5.7 million, pre - tax • Revenues enhanced by the lift - out of a banking team comprised of experienced, in - market lenders and additional mortgage originators − Average annual projected loan growth of $85 million − Average annual projected mortgage production of $95 million Pro Forma Results • Estimated $0.09 to $0.10 EPS accretive in 2017 • Tangible book value dilution of approximately 1.5% with expected earn - back in just over two years • Pro forma Tier 1 common of 11.5%+ • Anticipated internal rate of return in excess of 20% Approvals / Closing • Tidelands shareholder approval • Customary regulatory approvals • Closing in 3Q 2016 ucbi.com | 7

ucbi.com | 8 Estimated EPS Accretion Summary The transaction is expected to be $0.09 to $0.10 accretive to EPS in 2017 (1) Represents estimated pre - tax income adjustment to reflect a normalized loan loss provision ucbi.com | 8 UCBI Growth and EPS Accretion ($ millions) $0.09 $0.10 Key Assumptions Tidelands standalone pre-tax loss $(1.2) $(1.2) Management's estimate Merger cost savings 4.2 5.2 Implies 30% to 37% of noninterest expenses Market Value / Merger adjustments 4.0 4.0 One-half from time deposits and one-third from loan accretion Tax Impact (2.7) (3.1) Estimated tax rate of 38% Net income contribution $4.3 $4.9 EPS accretion $0.06 $0.07 United's Coastal SC growth strategy: Lift-out bankers $1.6 $2.1 Average loan growth of $85 million, net of expenses Incremental mortgage business 1.4 1.9 Average mortgage production of $95 million, net of expenses Tax impact (1.1) (1.5) Estimated tax rate of 38% Net income contribution $1.9 $2.5 EPS accretion $0.03 $0.03 Aggregate EPS accretion $0.09 $0.10 Accretion Range 2017 EPS

ucbi.com | 9 Credit / Loan Portfolio Review Summary Construction & Development 13% C&I 7% CRE & Multifamily 47% 1 - 4 Family 31% Consumer & Other 1% Tidelands Loan Portfolio (1) Nonaccrual Loans + OREO/Assets 8.72% 6.74% 5.13% 5.63% 4.44% 4.11% 4.40% 0% 1% 2% 3% 4% 5% 6% 7% 8% 9% 2012 2013 2014 Q1 15 Q2 15 Q3 15 Q4 15 $20.5 mil. (1) As of December 31, 2015 • Comprehensive bank - wide due diligence • Achieved high visibility on Tidelands’ loan portfolio and credit quality • Formal reviews by three independent third party firms, including extensive loan file review and field visits to assess certain lending relationships first - hand − 70% of the overall portfolio reviewed − 100% of loans exceeding $800,000 reviewed − 100% of OREO reviewed • Total credit mark of $22.7 million − Credit loan mark of 5.0% or $16.3 million − OREO mark of 50% or $6.4 million − Covers nonaccrual loans and OREO of $20.5 million (1) ucbi.com | 9

ucbi.com | 10 UCBI’s Growth Strategy – Coastal Markets • Tidelands’ markets are in the top 10 fastest growing in the U.S. • Vibrant Charleston area economy − Robust employment market is fueled by growth in software and IT and continued building in the manufacturing sector − Consistently recognized as the #1 travel destination in the U.S. − Home to 10 colleges and universities − Joint Base Charleston is home to 22,000+ military personal with an annual economic impact of $4.5 billion − Port of Charleston ucbi.com | 10 Total Total Deposits in Market Market Share Rank Institution (ST) Branches ($000) (%) 1 Wells Fargo & Co. (CA) 150 14,928,864 19.88 2 Bank of America Corp. (NC) 82 11,018,528 14.67 3 BB&T Corp. (NC) 112 7,701,867 10.25 4 First Citizens BancShares Inc. (NC) 154 6,786,593 9.04 5 South State Corporation (SC) 93 5,506,149 7.33 6 Toronto-Dominion Bank 68 3,672,843 4.89 7 Synovus Financial Corp. (GA) 39 2,916,380 3.88 8 SunTrust Banks Inc. (GA) 45 2,439,818 3.25 9 UCBI Pro Forma 32 1,444,423 1.92 10 BNC Bancorp (NC) 29 1,129,373 1.50 South Carolina Total Total Deposits in Market Market Share Rank Institution (ST) Branches ($000) (%) 1 Wells Fargo & Co. (CA) 25 2,801,831 24.83 2 Bank of America Corp. (NC) 16 1,624,323 14.39 3 South State Corporation (SC) 25 1,515,805 13.43 4 First Citizens BancShares Inc. (NC) 19 764,767 6.78 5 Synovus Financial Corp. (GA) 9 698,547 6.19 6 BB&T Corp. (NC) 13 656,119 5.81 7 BNC Bancorp (NC) 16 616,328 5.46 8 Carolina Financial Corp. (SC) 8 518,510 4.60 9 SunTrust Banks Inc. (GA) 13 342,858 3.04 10 Bank of South Carolina Corp. (SC) 4 330,595 2.93 * 12 UCBI Pro Forma 4 221,207 1.96 Charleston-North Charleston MSA Projected Median Population Population HH Change Change Income 2010-2016 2016-2021 2016 MSA Total Population (%) (%) ($) Charleston-N. Charleston 750,593 12.94 8.47 54,619 Myrtle Beach-Conway-N. Myrtle Beach 433,835 15.16 9.50 44,461 Hilton Head Island-Bluffton-Beaufort 209,656 12.11 8.47 55,689 South Carolina 4,914,247 6.25 5.40 46,382 United States 322,431,073 4.43 3.69 55,551 Source: SNL Financial

ucbi.com | 11 UCBI’s Growth Strategy – Coastal Markets ucbi.com | 11 • Hilton Head is internationally recognized vacation and retirement destination famous for championship golf courses, beaches and resorts • Year - round tourism accounts for more than 60% of local jobs and contributes in excess of $1.5 billion annually to the local economy • Major industries include accommodation and food services, retail trade, health care and social assistance • Myrtle Beach is part of an area known as the “Grand Strand”, which extends across a 60 - mile stretch of coastline; it is consistently recognized as a top U.S. travel destination • The local economy is driven by tourism - related industries, which account for an estimated 65% to 70% of the workforce • The area receives over 17 million annual tourist visits and is well known for its 100+ golf courses Total Total Deposits in Market Market Share Rank Institution (ST) Branches ($000) (%) 1 BB&T Corp. (NC) 27 1,725,635 23.82 2 CNB Corp. (SC) 13 781,915 10.79 3 Wells Fargo & Co. (CA) 10 646,373 8.92 4 Bank of America Corp. (NC) 9 524,419 7.24 5 Toronto-Dominion Bank 8 363,262 5.01 6 First Citizens BancShares Inc. (NC) 10 358,822 4.95 7 Carolina Financial Corp. (SC) 12 352,396 4.86 8 HCSB Financial Corp. (SC) 9 345,516 4.77 9 Synovus Financial Corp. (GA) 3 326,852 4.51 10 South State Corporation (SC) 10 313,616 4.33 * 16 Tidelands Bancshares Inc (SC) 2 135,148 1.87 Myrtle Beach-Conway-North Myrtle Beach MSA Total Total Deposits in Market Market Share Rank Institution (ST) Branches ($000) (%) 1 Wells Fargo & Co. (CA) 6 693,254 17.41 2 South State Corporation (SC) 9 613,163 15.40 3 Bank of America Corp. (NC) 4 503,754 12.65 4 BB&T Corp. (NC) 4 334,101 8.39 5 CoastalSouth Bancshares Inc. (SC) 4 326,762 8.21 6 Toronto-Dominion Bank 5 299,491 7.52 7 SunTrust Banks Inc. (GA) 4 216,701 5.44 8 Regions Financial Corp. (AL) 7 175,225 4.40 9 Palmetto State Bankshares Inc. (SC) 3 139,891 3.51 10 First Citizens BancShares Inc. (NC) 3 108,248 2.72 * 14 Tidelands Bancshares Inc (SC) 1 73,559 1.85 Hilton Head Island-Bluffton-Beaufort, SC
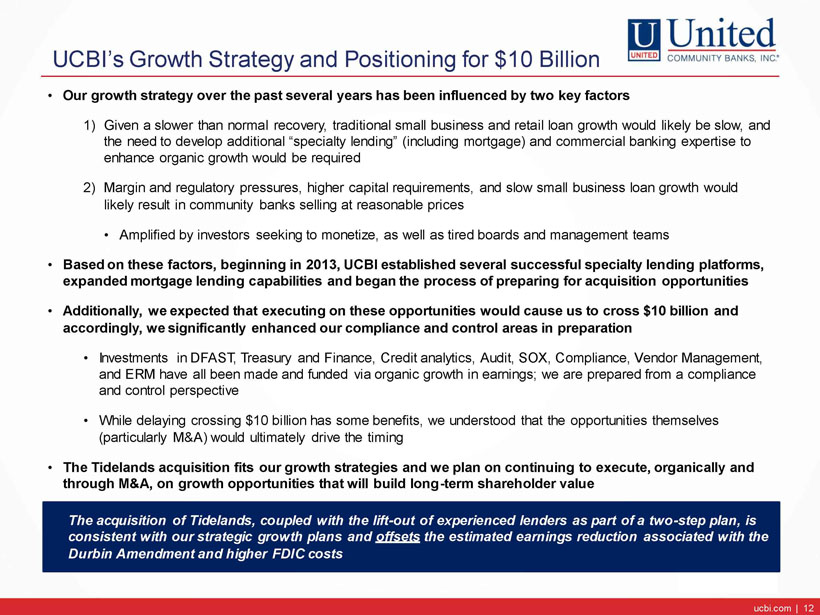
ucbi.com | 12 • Our growth strategy over the past several years has been influenced by two key factors 1) Given a slower than normal recovery, traditional small business and retail loan growth would likely be slow, and the need to develop additional “specialty lending” (including mortgage) and commercial banking expertise to enhance organic growth would be required 2) Margin and regulatory pressures, higher capital requirements, and slow small business loan growth would likely result in community banks selling at reasonable prices • Amplified by investors seeking to monetize, as well as tired boards and management teams • Based on these factors, beginning in 2013, UCBI established several successful specialty lending platforms, expanded mortgage lending capabilities and began the process of preparing for acquisition opportunities • Additionally, we expected that executing on these opportunities would cause us to cross $10 billion and accordingly, we significantly enhanced our compliance and control areas in preparation • Investments in DFAST, Treasury and Finance, Credit analytics, Audit, SOX, Compliance, Vendor Management, and ERM have all been made and funded via organic growth in earnings; we are prepared from a compliance and control perspective • While delaying crossing $10 billion has some benefits, we understood that the opportunities themselves (particularly M&A) would ultimately drive the timing • The Tidelands acquisition fits our growth strategies and we plan on continuing to execute, organically and through M&A, on growth opportunities that will build long - term shareholder value The acquisition of Tidelands, coupled with the lift - out of experienced lenders as part of a two - step plan, is consistent with our strategic growth plans and offsets the estimated earnings reduction associated with the Durbin Amendment and higher FDIC costs UCBI’s Growth Strategy and Positioning for $10 Billion ucbi.com | 12

ucbi.com | 13 Appendix
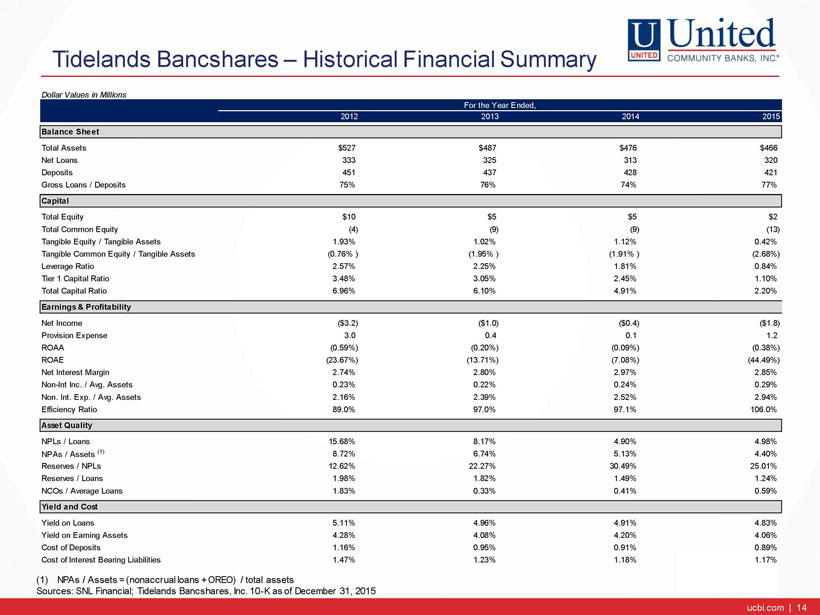
ucbi.com | 14 Tidelands Bancshares – Historical Financial Summary ucbi.com | 14 (1) NPAs / Assets = (nonaccrual loans + OREO) / total assets Sources: SNL Financial; Tidelands Bancshares, Inc. 10 - K as of December 31, 2015 Dollar Values in Millions For the Year Ended, 2012 2013 2014 2015 Balance Sheet Total Assets $527 $487 $476 $466 Net Loans 333 325 313 320 Deposits 451 437 428 421 Gross Loans / Deposits 75% 76% 74% 77% Capital Total Equity $10 $5 $5 $2 Total Common Equity (4) (9) (9) (13) Tangible Equity / Tangible Assets 1.93% 1.02% 1.12% 0.42% Tangible Common Equity / Tangible Assets (0.76% ) (1.95% ) (1.91% ) (2.68%) Leverage Ratio 2.57% 2.25% 1.81% 0.84% Tier 1 Capital Ratio 3.48% 3.05% 2.45% 1.10% Total Capital Ratio 6.96% 6.10% 4.91% 2.20% Earnings & Profitability Net Income ($3.2) ($1.0) ($0.4) ($1.8) Provision Expense 3.0 0.4 0.1 1.2 ROAA (0.59%) (0.20%) (0.09%) (0.38%) ROAE (23.67%) (13.71%) (7.08%) (44.49%) Net Interest Margin 2.74% 2.80% 2.97% 2.85% Non-Int Inc. / Avg. Assets 0.23% 0.22% 0.24% 0.29% Non. Int. Exp. / Avg. Assets 2.16% 2.39% 2.52% 2.94% Efficiency Ratio 89.0% 97.0% 97.1% 106.0% Asset Quality NPLs / Loans 15.68% 8.17% 4.90% 4.98% NPAs / Assets (1) 8.72% 6.74% 5.13% 4.40% Reserves / NPLs 12.62% 22.27% 30.49% 25.01% Reserves / Loans 1.98% 1.82% 1.49% 1.24% NCOs / Average Loans 1.83% 0.33% 0.41% 0.59% Yield and Cost Yield on Loans 5.11% 4.96% 4.91% 4.83% Yield on Earning Assets 4.28% 4.08% 4.20% 4.06% Cost of Deposits 1.16% 0.95% 0.91% 0.89% Cost of Interest Bearing Liabilities 1.47% 1.23% 1.18% 1.17%