Attached files
UNITED STATES SECURITIES AND EXCHANGE COMMISSION
WASHINGTON, D.C. 20549
FORM 10-K
|
|
x ANNUAL REPORT PURSUANT TO SECTION 13 OR 15(d) OF THE SECURITIES EXCHANGE ACT OF 1934
|
FOR THE FISCAL YEAR ENDED DECEMBER 31, 2015
OR
|
|
o TRANSITION REPORT PURSUANT TO SECTION 13 OR 15(d) OF THE SECURITIES EXCHANGE ACT OF 1934
|
For the transition period from to
Commission File Number 000-09908
TOMI ENVIRONMENTAL SOLUTIONS, INC.
(Exact name of registrant as specified in its charter)
|
FLORIDA
|
59-1947988
|
|
(State or other jurisdiction of
incorporation or organization)
|
(I.R.S. Employer
Identification No.)
|
|
9454 Wilshire Blvd., R-1,
Beverly Hills, California
|
90212
|
|
(Address of principal executive offices)
|
(Zip Code)
|
Registrant’s telephone number, including area code: (800) 525-1698
|
Title of Each Class
|
Name of Each Exchange on Which Registered
|
|
|
|
||
|
Common Stock, $0.01Par Value
Cumulative Series A Preferred Stock, $0.01 Par Value
|
OTC Pink Sheet
|
|
|
Cumulative Convertible Series B Preferred Stock, $1,000 Stated Value
|
||
Securities registered under Section 12(b) of the Exchange Act: None
Securities registered under Section 12(g) of the Exchange Act: Common Stock, par value $.01
Indicate by check mark if the registrant is a well-known seasoned issuer, as defined in Rule 405 of the Securities Act. o
Indicate by check mark if the registrant is not required to file reports pursuant to Section 13 or Section 15(d) of the Act. o
Indicate by check mark whether the registrant (1) has filed all reports required to be filed by Section 13 or 15(d) of the Securities Exchange Act of 1934 during the preceding 12 months (or for such shorter period that the registrant was required to file such reports), and (2) has been subject to such filing requirements for the past 90 days. Yes x No o
Indicate by check mark if disclosure of delinquent filers pursuant to Item 405 of Regulation S-K (229.405 of this chapter) is not contained herein, and will not be contained, to the best of registrant’s knowledge, in definitive proxy or information statements incorporated by reference in Part III of this Form 10-K or any amendment to this Form 10-K. x
Indicate by check mark whether the registrant is a large accelerated filer, an accelerated filer, a non-accelerated filer, or a smaller reporting company. See definitions of “large accelerated filer,” “accelerated filer” and “smaller reporting company” in Rule 12b-2 of the Exchange Act. (Check one):
Large Accelerated Filer ¨ Accelerated Filer ¨
Non-Accelerated Filer ¨ Smaller Reporting Company x
Indicate by check mark whether the registrant is a shell company (as defined in Rule 12b-2 of the Exchange Act). Yes o No x
The aggregate market value of the common stock held by non-affiliates of the registrant as of the last business day of the Registrant’s most recently completed second fiscal quarter was approximately $40,608,040 based upon the closing price of registrant’s common stock on that date.
As of March 24, 2016 the registrant had 120,338,596 shares of common stock outstanding.
DOCUMENTS INCORPORATED BY REFERENCE
None.
TOMI ENVIRONMENTAL SOLUTIONS, INC.
FORM 10-K ANNUAL REPORT
FISCAL YEAR ENDED DECEMBER 31, 2015
TABLE OF CONTENTS
|
Item
|
Page
|
||||
|
PART I
|
|||||
|
1.
|
1
|
||||
|
1A.
|
9
|
||||
|
1B.
|
13
|
||||
|
2.
|
13
|
||||
|
3.
|
13
|
||||
|
4.
|
13
|
||||
|
PART II
|
|||||
|
5.
|
14
|
||||
|
6.
|
15
|
||||
|
7.
|
15
|
||||
|
7A.
|
25
|
||||
|
8.
|
25
|
||||
|
9.
|
25
|
||||
|
9A.
|
25
|
||||
|
9B.
|
26
|
||||
|
PART III
|
|||||
|
10.
|
27
|
||||
|
11.
|
30
|
||||
|
12.
|
36
|
||||
|
13.
|
37
|
||||
|
14.
|
38
|
||||
|
PART IV
|
|||||
|
15.
|
39
|
||||
|
Signatures
|
40
|
||||
|
Exhibit Index
|
41 |
|
|||
|
Financial Statements
|
F1-F25 |
|
|||
CAUTIONARY STATEMENT
This Annual Report on Form 10-K contains or incorporates by reference certain forward-looking statements within the meaning of Section 27A of the 1933 Act and Section 21E of the Securities Exchange Act of 1934, as amended, and, as such, may involve known and unknown risks, uncertainties and assumptions. Forward-looking statements are those that predict or describe future events or trends and that do not relate solely to historical matters. You can generally identify forward-looking statements as statements containing the words “will,” “believe,” “expect,” “anticipate,” “intend,” “estimate,” “assume” or other similar expressions. You should not rely on our forward-looking statements because the matters they describe are subject to assumptions, known and unknown risks, uncertainties and other unpredictable factors, many of which are beyond our control. Therefore, our actual results could differ materially and adversely from those expressed in any forward-looking statements as a result of various factors, some of which are listed under the section “Risk Factors,” Item 1A of this Annual Report on Form 10-K.
As used in this Annual Report on Form 10-K, “company,” “we,” “us,” “our” and “TOMI” refer to TOMI Environmental Solutions, Inc.
PART I
|
Item 1.
|
Overview
TOMI Environmental Solutions,Inc. is a leading provider of infection prevention and decontamination products and services, focused primarily on life sciences including healthcare, bio-safety, pharmaceutical, clean-room and research. Our mission is to help our customers create a healthier world thru TOMI’s product line. TOMI’s motto is “innovating for a safer world” for healthcare and life.
As a global decontamination and infectious disease control company, TOMI provides environmental solutions for indoor and outdoor surface decontamination through the sale of equipment, services and licensing of our SteraMistTM Binary Ionization Technology® (“BIT™”) which is a EPA registered hydrogen peroxide based mist and fog.
During August 2010, TOMI entered into negotiations to purchase the assets of a U.S. Defense company’s division that owned and operated BIT Technology. BIT Technology was a division of L-3 Applied Technologies, Inc. (“L-3”). In April 2013, we completed the acquisition of certain assets from L-3 for $3,510,000 and TOMI began to develop, engineer and complete regulatory testing for the EPA registrations of BIT technology and solution as a Hospital-Healthcare Disinfectant. BIT technology is the platform that runs our SteraMistTM equipment that currently accounts for nearly all of our revenue.
TOMI reengineered the prototypes into TOMI’s current model of Binary Ionization Technology® (BIT™), branded as SteraMist™. This technology was developed for the neutralization of anthrax spores and sponsored by the U.S. Defense Advanced Research Projects Agency (“DARPA”). This novel Defense Advanced Research Projects Agency project was sanctioned under DARPA/CMO Contract No. MDA972-03-C-0092 and developed thru the Special Projects Office/SPO
Program: Immune Building
DARPA Order No. P896/00 Program Code: 3310 3701 North Fairfax Drive
Arlington, VA 22203-1714
In June 2015, SteraMist™ BIT™ was granted a registration from the US Environmental Protection Agency (“EPA”) as a hospital-healthcare disinfectant for use as a misting/fogging agent (EPA Registration 90150-2). Our product also holds a second EPA registration for mold control and air & surface remediation (EPA Registration 90150-1).
Our Technology
BIT was developed in response to Amerithrax, the anthrax attacks that occurred in Washington, D.C. shortly after the September 11,2001 US terrorist attacks. It is a patented two-step process that aerosolizes and activates a low concentration hydrogen peroxide solution producing a fine aqueous mist that contains a high concentration of Reactive Oxidative Species (“ROS”), mostly hydroxyl radicals. ROS cause damage to pathogenic organisms via mechanisms such as oxidation of unsaturated fatty acids such as carbohydrates, lipids and amino acids leading to cellular disruption and/or dysfunction. The unique alteration of the chemistry of our solution, occurs after passing our EPA registered solution thru our high energy atmospheric cold plasma arc, causes the breaking of the double bond of a hydrogen peroxide molecule, net result is the hydroxyl radical. This hydroxyl radical is known as Activated Ionized Hydrogen Peroxide (“AIHP”). This TOMI patented process allows these ROS’s (hydroxyl radicals) to exist in high concentrations without rapidly recombining and losing their reactivity.
Testing detailed by DARPA demonstrates these ROS, which include the hydroxyl ion and hydroxyl radicals, aggressively break the double bonds in bacterial spores, biological and chemical warfare agents (BWA and CWA) neutralizing their threat and producing nontoxic byproducts.
1
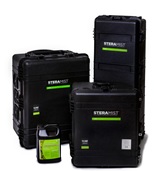
Brought to the commercial market by TOMI in June 2013, TOMI’s current suite of products incorporates TOMI’s BIT™ Solution, special applicators which creates the SteraMist™ Surface Unit and the SteraMist™ Environment System. Current SteraMist™ BIT™ Technology has expanded beyond the initial chemical and biological warfare applications to deactivate problem microorganisms (including spores) in healthcare, laboratory, clean rooms and a wide variety of other commercial and residential settings. SteraMist™ BIT™ provides fast acting biological deactivation and works in even the most hard-to-reach areas while leaving no residue or noxious fumes. The by-products produced by SteraMist are just oxygen and water in the form of humidity.
TOMI’s SteraMist™ Surface Unit is a fully portable fast-acting, hand held, point and spray disinfection/decontamination system. It is a safe and easy process to make certain that your facility, home or assets are disinfected/decontaminated to the maximum extent possible. The single applicator surface unit enables disinfection of all surfaces–including high touch, sensitive medical equipment and electronics. The space is safe to re-enter within minutes after the Activated Ionized Hydrogen Peroxide (AIHP) mist has been applied. With a registered EPA 5-second application time, 7-minute contact time seamlessly results into a quick room turnover and controls and eliminates MRSA and H1N1.
TOMI’s SteraMist™ unit is lightweight, easy to transport, and capable of achieving reliable disinfection/decontamination results as it is easily incorporated into current cleaning procedures and protocols. The hydroxyl radicals produced by TOMI’s plasma science does not require heating, ventilation, or air conditioning systems to be shut down and requires no wiping, leaves no residue and is a bleach, chlorine, formaldehyde, glutaraldehyde, titanium dioxide, peracetic and silver ion free formula.
 |
 |
TOMI’s SteraMist™ Environment System is a transportable remotely controlled system that provides complete room disinfection/decontamination of a sealed space, up to 103.8 m3 (3,663 ft3). Individually, each remote applicator can be used to treat a space of approximately 34.6 m3 (1,221 ft3). Multiple SteraMistTM Environment Systems can be used simultaneously to accommodate larger spaces with fast application and minimal down time. Mechanical cleaning makes whole room disinfecting/decontaminating easier. With TOMI’s touchless application solution you can treat multiple areas simultaneously. Our hybrid technology - applicators can be used in manual and/or fogging modes. Great for frequent daily use, this system saves time and labor. SteraMist™ is a powerful technology in fighting, reducing and eliminating bacteria including C. diff spores. When you reenter the room you can “smell the clean”
 |
 |
2
TOMI currently targets domestic and international markets. TOMI’s approach to the international markets is either thru strategic partners, manufacturer representatives or licensed distribution partners. The company is currently focused in Mexico and Central America, the EU and Asia. Domestically, TOMI’s primary market consists of Healthcare-Hospitals, Bio-safety and Pharmaceutical along with many other verticals that are covered thru its professional service division. Internationally, TOMI technologies are used for the control of microorganisms and the decontamination of large and small indoor space for biological pathogens and chemical agents. These include infectious diseases in hospitals, bio-secure labs and pharmaceutical manufactures, biodefense and biosafety facilities, including isolation and transfer chambers, tissue banks, food safety and many other commercial and residential settings.
Internationally, SteraMist™ has been used and has shown to reduce many problem organisms found in healthcare and other environments including bacterial spores, VRE, C. diff, MERS and Ebola. TOMI has reduced outbreaks of nosocomial MDRO’s (Klebsiella pneumoniae, AB, pseudomonas aeruginosa) at the largest hospital in Panama, participated in the control of MERS in South Korea and has successfully passed a test during the MERS outbreak in the Kingdom of Saudi Arabia. TOMI also decommissioned the Ebola treatment center in West Africa. In U.S. hospitals where SteraMist is being used in terminal cleans, evidence has demonstrated a reduction of C. diff spore rates in those hospitals.
Independent lab testing, study data from international pharmaceutical companies and field clinical data have shown six-log efficacy which is a 99.9999% kill in both C. diff spores and against Geobacillus stearothermophilus. Geobacillus stearothermophilus is a laboratory testing gold standard and is commonly used as a challenge organism for sterilization validation studies and periodic check of sterilization cycles. https://www.ncbi.nlm.nih.gov/pubmed/21856988.
In June 2015, SteraMist™ BIT™ was registered with the EPA as a hospital-healthcare disinfectant for use as a misting/fogging agent. The EPA registered solution and equipment combination provides the unique technology of converting a low percentage hydrogen peroxide into an activated ionized hydrogen peroxide consisting mostly of hydroxyl radicals for Hospital-Healthcare disinfecting (EPA Registration 90150-2). SteraMist™ BIT™ also holds a second EPA registration for mold control and air & surface remediation (EPA Registration 90150-1).
SteraMist is easily incorporated into current cleaning procedures, and is economical, non corrosive and easy to apply. Our technology goes above, beyond, under and around disinfecting sprays and wipes, leaves no residues and requires no wiping. (EPA Registration 90150-2)
All of our SteraMist products are fully validated to comply with GMP (Good Manufacturing Practice) Standards, our solution is manufactured at a EPA registered solution blender and our product performance is supported by GLP (Good Laboratory Practice) efficacy data for Staphylococcus aureus, Pseudomonas aeruginosa, Mold, MRSA, H1N1, Geobacillus stearothermophilus (the gold standard for sterilization) and Clostridium difficile spores (C. diff spores).
Effective as of July 10, 2015, TOMI entered into a Materials Transfer Agreement with the US Agriculture Research Service (ARS) to conduct food safety research using AIHP or SteraMist BIT. The Company is registered and has listed SteraMist as a disinfectant, medical device with the US Food & Drug Administration (“FDA”) for FY 2016 pursuant to Title 21,807 et seq. of the Unites States Code of Federal Regulation. Establishment registration 3012117386, product code LRJ, Regulation Number 880.6890 and is seeking registration with the US Department of Agriculture (“USDA”) approval for its products to be utilized in the medical device sterilization field, food packaging, preservation and food safety industries.
This acquired patented technology relates to a disinfection/decontamination system that applies atmospheric cold plasma activation to a hydrogen peroxide based mist and fog. It then produces an ROS aerosolized mist that resembles a fog but moves like a gas. Trademarked as Binary Ionization Technology® (BITTM), the technology deactivates most organic compounds quickly and effectively by inactivating viruses, killing bacteria, bacteria spores, molds spores, other fungi and yeast, both in the air and on surfaces. The EPA has registered TOMI’s products as a hospital-healthcare disinfectant, its surface unit for killing MRSA and inactivating H1N1 and its multifunctional environment unit for killing C. diff spores. BIT™ does not damage delicate medical equipment and computers as BIT™’s only by-product is oxygen and water (humidity) BIT™ carries a very small carbon footprint.
SteraMistTM (BITTM) converts low percentage levels of hydrogen peroxide into a group of ROS composed mostly of hydroxyl radicals that provides fast acting, broad-spectrum decontamination, leaving no residue or noxious fumes. We believe the characteristics of the produced aerosol mist ensure safety of employees and equipment, while providing maximum decontamination efficacy to both air and surfaces. BITTM has also been shown to effectively decontaminate weaponized biological agents including anthrax, chemical agents such as VX, and Mustard gas when applied using properly developed international protocols.
3
By acquiring this patent and all of its regulatory registrations TOMI now controls this technology and has the ability to build its client base and expand into other market segments beyond its current customer base including bio-safety and pharmaceutical clean rooms, food safety, healthcare, service industries and thru its service division (TSN). TOMI has the assets and capacity to respond to most worldwide pandemic emergencies.
In May 2015, the Company was awarded a grant by the United States Agency for International Development (“USAid”) in the amount of $559,000 for the development of SteraMistTM Mobile Decontamination Chambers to fight Ebola. The grant is based on milestones set forth on the agreement between the Company and USAid. To date, five of the six benchmarks were achieved and TOMI decontaminated and decommissioned the EBOLA treatment center in West Africa in connection with its USAid Grant.
Manufacturing
The Company outsources the manufacturing of the TOMI SteraMist™ line of equipment. In October of 2014, the Company entered into a manufacturing and development agreement with RG Group for a term of two years. RG Group is an ISO9001 registered Company with facilities in Pennsylvania, New York and New Jersey.
Industries
We believe that our technology, services and products offer a significant opportunity to help reduce the surface and rooms involvement in the spread to patients and others of Community Associated (CA) and Healthcare Associated Infections (“HAI”). HAI’s are one of the top ten leading causes of death in the United States. The Centers for Disease Control has noted Healthcare-Associated Infections (HAIs) are a major, yet often preventable, threat to patient safety. The Centers for Disease Control and Prevention (CDC) is committed to helping all Americans receive the best and safest care. The National and State Healthcare-Associated Infections Progress Report (HAI Progress Report) expands upon and provides an update to previous reports detailing progress toward the ultimate goal of eliminating HAIs. The reports can serve as a reference for anyone looking for information about national and state HAI prevention progress. The HAI progress report is specifically designed to be accessible to many audiences. For detailed methods, references, and definitions please refer to the Technical Appendix and Glossary within that report. For complete data tables and frequently asked questions, please visit CDC’s HAI Progress Report website at http://www.cdc.gov/hai/progress-report.
In March of 2009 HAIs have a direct cost to the healthcare system of approximately $35-$45 billion dollars annually. http://www.cdc.gov/hai/pdfs/hai/scottcostpaper.pdf. Statistically, it has been documented that approximately 10% of inpatients contract infections from hospitals resulting in more than 2,000,000 illnesses and over 100,000 deaths per annum or 1 in every 25 admissions www cdc.gov/ hai/progress-report. Further, it has been estimated that approximately 15% of all discharged hospital patients are readmitted with infections. Traditional cleaning has been known to leave 30%-60% of pathogens behind. Also a well known study from 55 New England hospitals stated that 25% of operating room surfaces are left unclean. With the rapid turnover that is needed in today’s hospital rooms, treatment rooms, hotel rooms and mass transportation combined with the ability of bacteria to mutate and form drug resistant bacteria: manual cleaning has proven to be not as effective as it use to be in the past. Even after using surface chlorine wipes many pathogens can colonize, all a human needs is one cell to infect them to cause severe illness and or death. Any remaining surface pathogens can increase the risk of that person acquiring an HAI or other infection.
Whenever challenged, TOMI’s BITTM has safely and effectively produced a 99.9999% (a six-log kill). In comparison to most of its competitors, management believes that SteraMistTM technology has a quicker and higher kill level in a shorter time, leaving no residue, our product is not effected by humidity, is not caustic, does not blister painted surfaces, contains no silver ions, requires no humidity alteration prior to or after use, has a shorter exposure time, and is quicker to exhaust due to the production of our reactive oxygen species (AIHP) verses nebulization of higher concentrates of hydrogen peroxide, such as vaporized hydrogen peroxide (VHP) and hydrogen peroxide vapor (HPV) type products. AIHP is a small 2-4 micron particle which contains no bleach, and rooms require little or no preparation prior to treatment. When AIHP is finished killing, inactivating and neutralizing bacteria, bacteria spores, fungi, viruses and certain chemical agents it converts to oxygen and water.
Our SteraMistTM and BITTM Technology and TOMI’s related service platform are currently being used in a broad spectrum of industries including:
● medical facilities
● bio-safety labs
● tissue labs
● clean rooms
● office buildings
4
● hospitality
● schools
● pharmaceutical companies
● remediation companies
● military
● transportation
● airports
● first responders
● single-family homes and multi-unit residences
We also believe, based on our marketing efforts to date, that other potential vertical industry applications for our technology, service and products include:
● blood banks
● food safety industry
● athletic facilities (from professional to educational)
● airlines
● entertainment
● homeland defense and border protection
● control and containment of pandemic breakouts
The Company intends to generate and support research on improving, extending and applying our patents. To date, we have received interest, both domestically and internationally, to form business alliances with major healthcare companies, biosafety labs, tissue and blood labs, pharmaceutical companies, the food safety industry, border protection including homeland defense companies, construction companies and remediation companies.
Marketing and Distribution
Through our sales and services, our business growth objective is to be a global leader in disinfection and decontamination including domestic and international infectious disease control. We hope to achieve this through our premier platform of hydrogen peroxide mists and fogs, as well as other infectious control products and technologies. We intend to continue to expand and support research on other decontamination and remediation solutions including hydroxyl radicals and other ROS and to form more business alliances. This may include selling licenses and or performing decontamination services within cleanrooms, bio-safety labs, tissue and blood labs, pharmaceutical labs, kidney dialysis centers, major remediation companies, construction companies and corporations specializing in disaster relief. Our current intended geographic targets are located in North America, South America, Central America, Europe, Africa and the Far East.
The Company primarily offers its products and services in the following market segments:
Hospitals. We are seeking to expand our penetration of this market segment as we believe we can offer a solution to a significant problem at many healthcare facilities: the spread of airborne contaminants. Under the Patient Protection and Affordable Care Act’s (also known as the Affordable Care Act or ACA) Hospital Readmissions Reduction Program, hospitals that have high rates of of infections and HAIs now face significant penalties. We believe the enactment of the ACA demonstrates the need hospitals have to control decrease and eliminate infection rates and HAIs. Based on our calculations, we believe that our SteraMist™ BIT™ technology, reduces the surfaces contributing factor in the spread of infections and HAIs in patient rooms, infectious disease rooms and operatory suites, with a corresponding return on investment to the hospital of up to 20-1 in the first year.
Bio-safety labs, tissue and blood labs, cleanrooms. These categories all have one common trait. They need to reduce the chance of transfer risks. As risk assessment is a process used to identify the hazardous characteristics of a known infectious or potentially infectious agent or material, the activities in these labs can result in a person’s exposure to an agent, with a high likelihood that such exposure could cause probable consequences of an infection.
The use of SteraMist™ as a routine decontamination product in all biosafety levels and microbiological practices, safety equipment, and facility safeguards may reduce all the negative effects of current decontamination products such as Vaporized Hydrogen Peroxide (VHP), formaldehyde, glutaraldehyde and titanium dioxide including cancer exposure, blistering of paints, corrosion of metals and lengthy exposure times.
5
There are many requirements and new restrictions on the type of decontamination agents these labs may use to prevent these risks and handle mishaps. In light of these regulations, we believe TOMI’s rapid deployment of its effective aerosolized reactive oxygen species could become the solution to lower risks and perform decontamination clean-up in these labs. Our product works within minutes and leaves no noxious chemical smell behind. Its by-products are just oxygen and humidity.
We also believe that our products and technology can aid in all biosafety levels and microbiological practices, on all safety equipment, transfer hoods, isolation chambers, animal cages, and other equipment along with adding to facility safeguards to help prevent the risks associated with handling infectious microorganisms.
Biosafety level 1 (BSL-1) is the basic level of protection and is appropriate for agents that are not known to cause disease in normal, healthy humans. Biosafety level 2 (BSL-2) is appropriate for handling moderate-risk agents that cause human disease of varying severity by ingestion or through percutaneous or mucous membrane exposure. Biosafety level 3 (BSL-3) is appropriate for agents with a known potential for aerosol transmission, for agents that may cause serious and potentially lethal infections and that are indigenous or exotic in origin. Exotic agents that pose a high individual risk of life-threatening disease by infectious aerosols and for which no treatment is available are restricted to high containment laboratories that meet biosafety level 4 (BSL-4) standards. The laboratory worker’s complete isolation from aerosolized infectious materials is accomplished primarily by working in a so-called Class III biological safety cabinet (BSC), which is a sealed enclosure with a viewing window, or in a full-body, air-supplied positive-pressure personnel suit. The BSL-4 facility itself is generally a separate building or completely isolated zone with complex, specialized ventilation requirements and waste management systems to prevent release of viable agents to the environment.
TOMI’s BIT™ technology has recently been successfully tested in level 3 (BSL-3) and level 4 (BSL-4), including in their animal research cages. SteraMist not only decontaminates space in minutes but also decontaminates the animal cages in minutes which helps in the prevention of the spread of diseases that are typically found within these research animal cages.
Food Safety Industry. We believe that SteraMistTM could become a strongly preferred product as it relates to decontamination in the food safety industry. Food related ingesting of hundreds of bacteria, viruses, and parasites can contaminate parts of the world food supply and cause illnesses. According to the US Centers for Disease Control (“CDC”), 80 million people per year in the United States contract, and 5,000 people die from, food poisoning or other food related illnesses. Current cleaning techniques involve time intensive processes, which can reduce food manufacturers’ profit. TOMI’s AIHP (Activated Ionized Hydrogen Peroxide) degrades into only harmless water and oxygen. Since this can be applied to all foods (pending FDA and USDA approval) and all food packing and storage equipment, we believe it would be safe for use on electronics and kitchenware along with high touch surfaces where most pathogens are found generally (such as phones, computers and kitchen appliances). We believe that SteraMist could be useful for decontamination at all phases of food production, from the farm, slaughter house, packaging and canning facilities, to the transportation of food and to the restaurants and grocery stores.
The Remediation Industry. Generally, a professional certified remediation company waits until an emergency or disaster occurs before they can earn fees. TOMI has implemented and plans to expand its certification, license and equipment program throughout the United States which allows these disaster professionals to earn fees by performing surface remediation and infectious disease control in addition to their emergency response related work. Since there are over 20,000 certified professional remediators in the United States, this is a market we are aggressively targeting. TOMI’s service division (TSN) has been borne out of the demand for our product nationally.
Biodefense Industry. Countries around the world, including the United States, need to protect their borders and cities against a potential terrorist attack. Our SteraMistTM line of products may give international governmental bodies an added tool in their arsenal to potentially mitigate a risk of a weaponized biological attack. In addition, SteraMistTM could specifically assist in mitigating the spread of emerging pandemic viruses including strains of Ebola, MERS, along with various worldwide viruses, including H1N1, H5N1, H7N9 and H10N8. In addition, border patrol agents internationally could utilize our SteraMistTM line of products to assist in ceasing the spread of infectious disease upon detected infected persons trying to enter their respective borders by decontaminating the interview rooms, containment rooms and holding cells after a potential infected carrier’s condition either improves or the carrier dies.
Hospitality. Our products can be used for air remediation and surface cleaning, including those hard to clean areas and objects like remote controls, chairs, nooks and crannies, telephones and toilet seats. This could be advantageous to allow potential hospitality clients (such as hotels and motels) to make their rooms and common areas smell better and be cleaner prior to the check-in of hotel guests using our EPA registered disinfectant.
6
International Sales
The Company began sales to international clients during the third quarter of 2010. In September 2013, the Company entered into a Sales and Distribution Agreement with TOMI Panama, a non-affiliated company in Panama. As part of this agreement the Company successfully completed an official pilot study at the request of Panama Social Security Program (CSS), performing bio-mass reduction and remediation of biological bacterial colonies. As a result, the Panamanian Government accepted the Company’s technology as the only decontamination product of its kind that is authorized by the Panamanian Government to be purchased by their hospitals for the next two years. On September 30, 2013, TOMI was awarded a multi-year contract from Panama Social Security Program (“CSS Contract”) to initiate biomass reduction and decontamination services. During the fourth quarter of 2013, TOMI completed the biomass reduction and decontamination services at The Complejo Hospitalario Metropolitano in Panama City, Panama. Currently, we are actively engaged to expand this program and make SteraMistTM a standard for decontamination in over 41 Panamanian hospitals.
During the fourth quarter of 2013, the Company’s Panamanian distribution partner initiated biomass reduction and decontamination services at The Complejo Hospitalario Metropolitano in Panama City, Panama. The initial project in Panama provides for decontamination services for 64,583 sq./ft. of space for an approximate value to the Company of $420,000. The Company completed this project in October 2013. The maintenance of this hospital continues daily.
On March 21, 2014, the Company entered into a distribution and licensing agreement with Plascencia Universal, S. de R.L. de C.V. (“Plascencia Universal”), a Mexican company that will act as the exclusive distributor of TOMI’s products and services in Mexico. The agreement provides for a $300,000 licensing fee that will be recognized based on the gross purchases made by Plascencia Universal from the Company. Joseph Plascencia, the principal of Plascencia Universal, is the broker for the Company’s insurance policies and was appointed a director of the Company in connection with this agreement. In April 2015, the Company modified its agreement with Plascencia Universal with respect to the license fee included in the original agreement. In December, 2015 Mr. Plascencia resigned from TOMI’s board.
In 2014 and 2015, the Company expanded into the South Korean market and entered into an independent sales agreement with KMS I&T Co., Ltd. and Fine C&S Co., both of whom are representatives of the G -Well Group. The Company has been shipping orders into the South Korean market since the fourth quarter of 2014.
In 2015, the Company further expanded its entrance into the Asian market with an additional order shipped into the Philippines to Espire Health and the commencement of shipments into Singapore through an exclusive agreement with RNF Luxuries and shipments into the Malaysian market through SG Environmental Solutions.
In addition, during the first and second quarters of 2015, the Company continued the expansion of its global presence into Europe with the shipment of product into Italy, France and Spain. In addition, during the quarter ended June 30, 2015 the Company entered into a distribution agreement with Azbil Telstar Technologies, S.L.U., a Spanish company that will act as a non-exclusive distributor of products on a worldwide basis and is currently under contractual review with AM Instruments of Italy.
TOMI Service Network
In February 2015, the Company announced the launch of the TOMI Service Network (“TSN”). The TSN will allow the Company to enhance its service division by creating a national service network composed of existing full service restoration industry specialists. Since the launch of the TSN, the Company has recruited and entered into licensing agreements with 25 geographically and strategically placed companies that will become network hubs to take advantage of the of the Company’s SteraMistTM platform of products and assist as service providers for the Company’s domestic and international client base and provide regional, national, and international large event mobilization response. The current TSN members signed through December 31, 2015 were granted protected territories, exclusive network pricing and job referrals as well as many other service related benefits. The TSN licensing agreements provides for a purchase of certain amounts of SteraMistTM equipment and minimum annual orders of solution based on the population of the territories granted for the licensing agreements. The licensing agreements also provide for required training and marketing fees billed to the TSN members based on services provided by the Company. The term of the licensing agreement is for two years (http://www.tomiservicenetwork.com).
Competition
The decontamination and environmental infectious disease control industry is extremely competitive. The Company’s competitors for its BIT™ Technology include companies that market other hydrogen peroxide based products, such as Steris Corporation, Bioquell, Inc. and Sanosil Ltd, various ultraviolet companies and quad ammonia-chemical companies. These competitors may have longer operating histories, greater name recognition, larger installed customer bases, and substantially greater financial and marketing resources than the Company. The Company believes that the principal factors affecting competition in our markets include name recognition, and the ability to receive referrals based on client confidence in the Company’s service. There are no significant barriers of entry that could keep potential competitors from opening similar facilities. The Company’s ability to compete successfully in the industry will depend, in large part, upon its ability to market and sell its indoor decontamination and infectious disease control products and services. There can be no assurance that the Company will be able to compete successfully in the remediation industry, or that future competition will not have a material adverse effect on the business, operating results, and financial condition of the Company.
7
Competitive Advantages
|
●
|
Our product provides a 99.9999% or 6 log kill (i.e. the statistical destruction of all microorganisms and their spores) on all challenged pathogens including Geobacillus stearothermophilus the spore that is considered a gold standard for validation of sterilization versus household/industrial cleaners that offer a 99.9%, a 3 log to 99.99%, a 4 log kill.
|
|
●
|
Kills within seconds of application versus household/industrial cleaners where dwell time could be anywhere from 5 to 30 minutes.
|
|
●
|
Easy to use.
|
|
●
|
Chemicals that do not have to be mixed.
|
|
●
|
Solutions that do not include silver ions or peracetic acid.
|
|
●
|
Leaves no residue.
|
|
●
|
Not affected by humidity or temperature.
|
|
●
|
Non corrosive.
|
|
●
|
Does not damage medical or electronic equipment.
|
|
●
|
SteraMistTM by-products converts to oxygen and water (humidity).
|
|
●
|
When you enter the room you can “smell the clean”.
|
Research & Development
We are generating and supporting research on improving, extending and applying our patents in the field of mechanical cleaning and decontamination.
Employees
As of March 9 2016, we have 19 principally operational and administrative employees working within the United States. Most of our sales are conducted by independent sales representatives.
Cautionary Statement on Forward-Looking Statements
Certain statements in this report constitute “forward-looking statements” within the meaning of Section 27A of the Securities Act of 1933 and Section 21E of the Securities and Exchange Act of 1934. Certain, but not necessarily all, of such forward-looking statements can be identified by the use of forward-looking terminology such as “believes,” “expects,” “may,” “will,” “should,” or “anticipates” or the negative thereof or other variations thereon or comparable terminology, or by discussions of strategy that involve risks and uncertainties. All statements other than statements of historical fact included in this report regarding our financial position, business and plans or objectives for future operations are forward-looking statements. Without limiting the broader description of forward-looking statements above, we specifically note that statements regarding exploration and mine development, construction and expansion plans, costs, grade, strip ratio, production and recovery rates, permitting, financing needs, the availability of financing on acceptable terms or other sources of funding, if needed, and the timing of additional tests, feasibility studies and environmental permitting are all forward-looking in nature.
Such forward-looking statements involve known and unknown risks, uncertainties and other factors, including but not limited to, the risk factors discussed below in “Item 1A. Risk Factors” which may cause our actual results, performance or achievements to be materially different from any future results, performance or achievements expressed or implied by such forward-looking statements and other factors referenced in this report. We do not undertake and specifically decline any obligation to publicly release the results of any revisions which may be made to any forward-looking statement to reflect events or circumstances after the date of such statements or to reflect the occurrence of anticipated or unanticipated events, except as required by law.
8
Available Information
For more information about us, visit our website at www.tomimist.com. The contents of the website are not part of this Annual Report on Form 10-K. Our electronic filings with the U.S. Securities and Exchange Commission, or SEC (including all Forms 10-K, 10-Q and 8-K, and any amendments to these reports) are available free of charge through our website immediately after we electronically file with or furnish them to the SEC. These filings may also be read and copied at the SEC’s Public Reference Room which is located at 100 F Street, N.E., Washington, D.C. 20549. Information about the operation of the Public Reference Room can be obtained by calling the SEC at 1-800-SEC-0330. The SEC maintains an Internet site that contains reports, proxy and information statements, and other information regarding issuers who file electronically with the SEC at www.sec.gov. In addition, we post the following information on our website (the Company does not intend to, and does not hereby, incorporate by reference the information on our website, http://www.tomimist.com.
|
●
|
our corporate code of conduct, which qualifies as a “code of ethics” as defined by Item 406 of Regulation S-K of the Exchange Act; and
|
|
●
|
charters for our Audit Committee and Compensation Committee.
|
Item 1A. RISK FACTORS.
Our business routinely encounters and attempts to address risks, some of which will cause our future results to differ, sometimes materially, from those originally anticipated. Below, we have described our present view of certain important risks. The risk factors set forth below are not the only risks that we may face or that could adversely affect us. If any of the risks discussed in this Annual Report on Form 10-K actually occur, our business, financial condition and results of operations could be materially adversely affected. If this were to occur, the trading price of our securities could decline significantly and you may lose all or part of your investment.
The following discussion of risk factors contains “forward-looking statements,” which may be important to understanding any statement in this Annual Report on Form 10-K or elsewhere. The following information should be read in conjunction with Item 7—Management’s Discussion and Analysis of Financial Condition and Results of Operations (MD&A) and Item 8—Financial Statements and Supplementary Data of this Annual Report on Form 10-K.
Risk Related To Our Company and Business
The Company's operations are subject to environmental laws and regulations that may increase costs of operations and impact or limit our business plans.
The Company is subject to environmental laws and regulations affecting many aspects of its present and future operations. These laws and regulations can result in increased costs and delays as a result of administrative proceedings and compliance and reporting obligations. These laws and regulations generally require the Company to obtain and comply with a wide variety of EPA labeling requirements and state regulatory agency compliance. Public officials and entities may seek injunctive relief or other remedies to enforce applicable environmental laws and regulations. The Company cannot predict the outcome of any administrative proceedings that may arise.
We are subject to risks in our international operations.
A substantial portion of our sales are made to customers outside the United States. There are a number of risks inherent in doing business in foreign countries including the following:
● Unfavorable political or economic environments;
● Unexpected legal or regulatory changes;
● An inability to effectively protect intellectual property; or
● Potentially adverse tax consequences.
If we are unable to manage the risks inherent in our international activities, our business, financial condition and results of operations could be materially and adversely affected.
9
We are dependent on third party contractors and suppliers; we have no manufacturing facilities.
We are reliant upon third parties to supply the Company with its products’ components. We use contract manufacturers to build our BIT based systems, as we do not maintain our own manufacturing facilities. Any disruption in the manufacturing process could have a material adverse effect on our business, financial condition and results of operations. We cannot ensure that alternative production capacity would be available in the event of a disruption, or if it would be available, it could be obtained on favorable terms.
The pace of introduction of our new products is accelerating and is accompanied by potential design and production delays and by significant costs.
The development and initial production and enhancement of the decontamination systems we produce is often accompanied by design and production delays and related costs. We cannot predict with precision the time and expense required to overcome these problems. If we are unable to introduce or bring to full scale production additional new products as quickly as we anticipate, it could have a material adverse effect on our business, financial condition and results of operations.
Failure to adequately protect intellectual property rights upon which we depend could harm our business.
We rely on intellectual property rights including patents rights we purchased from L-3 related to BIT, trademarks and trade secrets. We face the risk that such measures could prove to be inadequate because:
● Intellectual property laws may not sufficiently support our rights or may change in the future in a manner adverse to us
● Our patents will expire which may result in key technology becoming widely available
● Third parties may be able to develop or obtain patents for similar competing technology
Although we devote resources to the establishment and protection of our patents and trademarks, we cannot assure you that the actions we have taken or will take in the future will be adequate to prevent violation of our trademarks and proprietary rights by others or prevent others from seeking to block sales of our products as an alleged violation of their trademarks and proprietary rights. There can be no assurance that future litigation will not be necessary to enforce our trademarks or proprietary rights or to defend ourselves against claimed infringement or the rights of others. Any future litigation of this type could result in adverse determinations that could have a material adverse effect on our business, financial condition or results of operations. Our inability to use our trademarks and other proprietary rights could also harm our business and sales through reduced demand for our products and reduced revenues
We may not be able to manage our growth effectively, create operating efficiencies or achieve or sustain profitability.
The ability to manage and operate our business as we execute our growth strategy will require effective planning. Rapid growth could strain our internal resources, leading to a lower quality of customer service, reporting problems and delays in meeting important deadlines, resulting in loss of market share and other problems that could adversely affect our reputation and financial performance. Our ability to manage future growth effectively will also require us to continue to update and improve our operational, financial and management controls and procedures. If we do not manage our growth effectively, we could be faced with slower growth and a failure to achieve or sustain profitability.
There is no assurance of future sales or profitability.
The Company’s business is dependent upon the acceptance of its products, licenses and services as an effective and reliable method to perform indoor decontamination and infectious disease control. The Company’s business is also dependent on the effectiveness of its marketing program to attract potential clients, potential independent contractors and remediators to utilize its products and services so that the Company will become profitable. There can be no assurance that the public or industry participants will continue to accept the Company’s products and services, or that the Company will be successful or that its business will earn any profit. There can be no assurance that the Company will earn future revenues or that investors will not lose their entire investment. There is no assurance that the Company will operate its business successfully or that its common stock will have value.
Our industry is extremely competitive.
The decontamination and environmental infectious disease control industry is extremely competitive. The competition includes remediators and disinfection/decontamination companies such as Steris, Bioquell and Clorox various ultraviolet companies and quad ammonia-chemical companies. These competitors have longer operating histories, greater name recognition, larger installed customer bases, and substantially greater financial and marketing resources than the Company. The Company believes that the principal factors affecting competition in this market include name recognition and marketing resources. There are no significant barriers of entry that could keep potential competitors from offering similar products or services. The Company’s ability to compete successfully in the industry will depend, in large part, upon its ability to market and sell its indoor decontamination and infectious disease control products and services. There can be no assurance that the Company will be able to compete successfully in the remediation industry, or that future competition will not have a material adverse effect on the business, operating results, and financial condition of the Company.
10
We are dependent on our key personnel.
The Company’s success is substantially dependent on the performance of its executive officers. Given the Company’s relatively recent entry into the industry, the Company is dependent on its ability to retain and motivate high quality personnel. Although the Company believes it will be able to engage qualified personnel for such purposes, an inability to do so could materially adversely affect the Company’s ability to market and perform its services. The loss of one or more of its key employees, including our Chairman and Chief Executive Officer, Dr. Halden Shane, or the Company’s inability to hire and retain other qualified employees could have a material adverse effect on the Company’s business.
Our operations, and those of our suppliers, are subject to a variety of business continuity hazards and risks, any of which could interrupt production or operations or otherwise adversely affect our performance, results, or value.
Business continuity hazards and other risks include natural disasters, utility and other mechanical failures, labor difficulties, inability to obtain necessary licenses, permits or registrations, disruption of communications, data security and preservation, disruption of supply or distribution, safety regulation, and labor difficulties.
The occurrence of any of these or other events might disrupt or shut down operations, or otherwise adversely impact the production or profitability of a particular facility, or our operations as a whole. Certain casualties also might cause personal injury and loss of life, or severe damage to or destruction of property and equipment, and for casualties occurring at our facilities, result in liability claims against us. Although we maintain property and casualty insurance and liability and similar insurance of the types and in the amounts that we believe are customary for our industries, our insurance coverages have limits and we are not fully insured against all potential hazards and risks incident to our business. Should any of the hazards or risks occur, or should our insurance coverage be inadequate or unavailable, our business, performance, prospects, value, financial condition, and results of operations might be adversely affected, both during and after the event.
If product liability claims are brought against us, we may incur substantial costs if our insurance coverage for such claims is inadequate.
We may be exposed to product liability claims, other claims and litigation in the event that the use of our products results, or is alleged to result, in bodily injury and/or property damage or our products actually or allegedly fail to perform as expected. Although we maintain insurance coverage with respect to certain product liability and other claims, such claims are expensive to defend and our insurance coverage may not be sufficient to cover all of our product liability-related expenses or losses, if it applies at all. Moreover, insurance coverage is becoming increasingly expensive, and, in the future, we may not be able to maintain insurance coverage at a reasonable cost, in sufficient amounts or upon adequate terms to protect us against losses due to product liability. Any damages that are not covered by insurance or are in excess of policy limits could have a material adverse effect on our financial condition, results of operations and cash flows. In addition, product liability and other claims can divert the attention of management and other personnel for significant periods of time, regardless of the ultimate outcome. Further, claims of this nature could cause our customers to lose confidence in our products and us. As a result, an unsuccessful defense of a product liability or other claim could have a material adverse effect on our financial condition, results of operations and cash flows.
We may continue to incur significant costs as a result of operating as a public company, and our management devotes substantial time to new compliance initiatives.
We have and likely will continue to incur significant legal, accounting and other expenses as a public company, including costs resulting from regulations regarding corporate governance practices. Our management and other personnel devote a substantial amount of time to these compliance initiatives. Moreover, these rules and regulations have increased our legal and financial compliance costs and will make some activities more time-consuming and costly. For example, these rules and regulations could make it more difficult for us to attract and retain qualified persons to serve on our board of directors or as executive officers.
11
In addition, the Sarbanes-Oxley Act of 2002 (“SOX”) requires, among other things, that we maintain effective internal control over financial reporting and disclosure controls and procedures. Our testing, or the potential subsequent testing by our independent registered public accounting firm in future periods, may reveal deficiencies in our internal control over financial reporting that are deemed to be material weaknesses. Our compliance with Section 404 of SOX may require that we incur substantial expense and expend significant management time on compliance-related issues. Moreover, if our independent registered public accounting firm identifies deficiencies in our internal control over financial reporting that are deemed to be material weaknesses, the market price of our stock could decline and we could be subject to sanctions or investigations by the US Securities and Exchange Commission (“SEC”) or other regulatory authorities, which would require additional financial and management resources.
Risk Related To Our Securities
Our stock price is volatile and there is a limited market for our shares.
The stock markets generally have experienced, and will probably continue to experience, extreme price and volume fluctuations that have affected the market price of the shares of many small-cap companies. These fluctuations have often been unrelated to the operating results of such companies. Factors that may affect the volatility of our stock price include the following:
● Our success or lack of success, in developing and marketing our products and services;
● Our ability to raise the required capital to fund our business;
● The announcement of new products, services, or technological innovations by us or our competitors;
● Changes in the executive leadership of the Company;
● Quarterly fluctuations of our operating results;
● Changes in revenue or earnings; and
● Competition.
Investors should not expect us to pay dividends.
The Company has not paid dividends on its common stock since its inception. The Company currently intends to retain earnings, if any, for use in the business and does not anticipate paying any dividends to its stockholders in the foreseeable future. Investors who require cash dividends from their investments should not purchase our common stock.
Our common stock is subject to the “penny stock” rules of the SEC, and trading in our securities is very limited, which makes transactions in our common stock cumbersome and may reduce the value of an investment in our securities.
The SEC has adopted Rule 3a51-1 which establishes the definition of a “penny stock,” for the purposes relevant to us, as any equity security that has a market price of less than $5.00 per share or with an exercise price of less than $5.00 per share, subject to certain exceptions. For any transaction involving a penny stock, unless exempt, Rule 15g-9 requires:
|
●
|
that a broker or dealer approve a person’s account for transactions in penny stocks; and
|
|
●
|
the broker or dealer receives from the investor a written agreement to the transaction, setting forth the identity and quantity of the penny stock to be purchased.
|
In order to approve a person’s account for transactions in penny stocks, the broker or dealer must:
|
●
|
obtain financial information and investment experience objectives of the person; and
|
|
●
|
make a reasonable determination that the transactions in penny stocks are suitable for that person and the person has sufficient knowledge and experience in financial matters to be capable of evaluating the risks of transactions in penny stocks.
|
The broker or dealer must also deliver, prior to any transaction in a penny stock, a disclosure schedule prescribed by the SEC relating to the penny stock market, which, in highlight form:
|
●
|
sets forth the basis on which the broker or dealer made the suitability determination; and
|
|
●
|
that the broker or dealer received a signed, written agreement from the investor prior to the transaction.
|
12
Disclosure also has to be made about the risks of investing in penny stocks in both public offerings and in secondary trading and about the commissions payable to both the broker-dealer and the registered representative, current quotations for the securities and the rights and remedies available to an investor in cases of fraud in penny stock transactions. Finally, monthly statements have to be sent disclosing recent price information for the penny stock held in the account and information on the limited market in penny stocks. Generally, brokers may be less willing to execute transactions in securities subject to the “penny stock” rules. This may make it more difficult for investors to dispose of our common stock and cause a decline in the market value of our stock.
We intend in the near future to apply for listing on a national stock exchange; however, there can be no assurance that our listing will be approved or that, if approved, our common stock will continue to trade on such exchange.
We intend to apply to be listed on a national securities exchange and we will need to satisfy certain qualitative and quantitative requirements for our common stock to be listed on such an exchange. We cannot assure you that we will be able to meet initial listing requirements for such listing or that our application will be approved.
If a listing application is approved, we will be required to comply with certain listing requirements of such exchange, which may include compliance with certain requirements with respect to our corporate governance, finances, stock trading volume and stock price. If we fail to meet any of these requirements, an exchange may take steps to delist our common stock. Such a delisting would likely have a negative effect on the price of our common stock and would adversely affect the ability to sell or purchase our common stock. In the event of a delisting, we anticipate that we would take actions to restore our compliance with such exchange’s listing requirements. However, we can provide no assurance that any such action taken by us would allow our common stock to remain listed on such exchange, stabilize our market price, improve the liquidity of our common stock, prevent our common stock from dropping below the relevant exchange’s minimum bid price requirement, or prevent future non-compliance with the relevant exchange’s listing requirements.
We have a substantial number of options and warrants outstanding which could give rise to additional issuances of our common stock and potential dilution of ownership to existing stockholders.
As of December 31, 2015, we have outstanding options and warrants to purchase an aggregate of 35.8 million shares of our common stock at exercise prices ranging from $0.01 to $2.10 per share. Of these, 100,000 represent shares underlying options with exercise prices ranging from $0.05 to $2.10 per share and $35.7 million represent shares underlying warrants at exercise prices ranging from $0.01 to $1.00 per share. To the extent any holders of options or warrants exercise such options and warrants, the issuance of shares of our common stock upon such exercise will result in dilution of ownership to existing stockholders.
Item 1B. UNRESOLVED STAFF COMMENTS
Not Applicable
|
Item 2.
|
PROPERTIES
|
The Company rents 300 square feet of office space at 9454 Wilshire Blvd., Beverly Hills, CA 90212, at $22,500 annually on a month-to-month tenancy, in a professional office building.
In addition, the Company leases 6,000 square feet in Frederick, Maryland comprised of space for offices, warehousing, laboratory, training and mock hospital facilities at $50,400 annually on a three-year term. The lease expires on January 31, 2018.
Item 3. LEGAL PROCEEDINGS
We are not a party to any material proceedings or threatened proceedings as of the date of this filing.
Item 4. REMOVED AND RESERVED
13
PART II
|
Item 5.
|
MARKET FOR REGISTRANT’S COMMON EQUITY, RELATED STOCKHOLDER MATTERS AND ISSUER PURCHASES OF EQUITY SECURITIES
|
Market Information
Our common stock is quoted on the OTC Pink marketplace operated by the OTC Markets Group under the symbol “TOMZ.” Trading in stocks quoted on the OTC Pink is often thin and is characterized by wide fluctuations in trading prices due to many factors that may have little to do with a company’s operations or business prospects.
OTC Pink securities are not listed or traded on the floor of an organized national or regional stock exchange. Instead, OTC Pink securities transactions are conducted through a telephone and computer network connecting dealers in stocks. OTC Pink issuers are traditionally smaller companies that do not meet the financial and other listing requirements of a regional or national stock exchange.
Set forth below are the range of high and low bid quotations for our Common Stock from the OTC Pink for the periods indicated. The market quotations were obtained from the OTC Pink, and reflect inter-dealer prices, without retail mark-up, mark-down or commissions and may not necessarily represent actual transactions.
|
Period
|
High ($)
|
Low ($)
|
||||||
|
Year ended December 31, 2013
|
||||||||
|
First Quarter
|
0.20 | 0.09 | ||||||
|
Second Quarter
|
0.65 | 0.11 | ||||||
|
Third Quarter
|
0.96 | 0.37 | ||||||
|
Fourth Quarter
|
0.80 | 0.30 | ||||||
|
Year ended December 31, 2014
|
||||||||
|
First Quarter
|
0.60 | 0.25 | ||||||
|
Second Quarter
|
0.38 | 0.26 | ||||||
|
Third Quarter
|
0.40 | 0.26 | ||||||
|
Fourth Quarter
|
0.37 | 0.22 | ||||||
|
Year ended December 31, 2015
|
||||||||
|
First Quarter
|
1.50 | 0.20 | ||||||
|
Second Quarter
|
0.68 | 0.35 | ||||||
|
Third Quarter
|
0.65 | 0.28 | ||||||
|
Fourth Quarter
|
0.64 | 0.42 | ||||||
Stockholders
As of March 24, 2016, there were approximately 389 record holders of our common stock. On March 9, 2016, the last reported sale price of our common stock on the OTC pink sheet was $.53 per share.
Recent Sales of Unregistered Securities
Unless otherwise noted, the following sales of securities were effected in reliance on the exemption from registration contained in Section 4(2) of the Act or Regulation D promulgated there under, and such securities may not be reoffered or sold in the United States by the holders in the absence of an effective registration statement, or valid exemption from the registration requirements, under the Securities Act of 1933 (as amended, the “Act”).
Offerings to accredited investors without registration pursuant to the exemptions contained in Section 4(2) and 4(6) of the Securities Act and applicable state securities laws:
On January 28, 2015, the Company issued 20,245 shares of common stock valued at $6,000 to Nick Jennings, CFO, as part of his annual compensation from the Company.
On February 3, 2015, the Company issued 100,000 shares of common stock valued at $25,000 to a consultant in exchange for services provided to the Company.
14
On March 25, 2015, the Company directly sold 260,000 equity units. Each unit sold consisted of 1 share of common stock and a warrant to purchase 2.5 shares of common stock. The warrants have an exercise price of $0.29 per share. Gross proceeds to the Company were $75,387.
On April 7, 2015, the Company issued 5,965 shares of common stock valued at $2,108 to a consultant in exchange for services provided to the Company.
On April 7, 2015, the Company issued 29,827 shares of common stock valued at $10,542 to a consultant in exchange for services provided to the Company.
On April, 16, 2015, the Company issued 17,263 shares of common stock valued at $6,000 to Nick Jennings, CFO, as part of his annual compensation from the Company.
On April, 21, 2015, the Company issued 3,333 shares of common stock valued at $1,500 to an employee in exchange for services.
On May 28, 2015, the Company directly sold 625,000 shares of common stock for gross proceeds of $225,000.
On June 8, 2015, the Company issued 66,604 shares of common stock valued at $20,000 to a consultant in exchange for services provided to the Company.
On July 13, 2015, the Company issued 6,534 shares of common stock valued at $3,248 to a consultant in exchange for services provided to the Company.
On July 13, 2015, the Company issued 32,667 shares of common stock valued at $16,240 to a consultant in exchange for services provided to the Company.
On July 13, 2015, the Company issued 12,638 shares of common stock valued at $6,000 to Nick Jennings, CFO, as part of his annual compensation from the Company.
On July 21, 2015, the Company issued 600,000 shares of common stock valued at $264,000 to a consultant in exchange for services provided to the Company.
On August, 20, 2015, the Company issued 3,000 shares of common stock valued at $1,500 to an employee in exchange for services.
On September 9, 2015, the Company issued 15,000 shares of common stock valued at $5,700 to a consultant in exchange for services provided to the Company.
On October 1, 2015, the Company issued 100,000 shares of common stock valued at $47,000 to an employee in exchange for services.
On October 6, 2015, the Company issued 4,875 shares of common stock valued at $1,846 to a consultant in exchange for services.
On October 6, 2015, the Company issued 24,374 shares of common stock valued at $9,232 to a consultant in exchange for services.
On October 1, 2015, the Company issued 2,500 shares of common stock valued at $1,500 to an employee in exchange for services.
|
Item 6.
|
SELECTED FINANCIAL DATA
|
|
|
Not Required.
|
Item 7.
|
MANAGEMENT’S DISCUSSION AND ANALYSIS OF FINANCIAL CONDITION AND RESULTS OF OPERATIONS
|
This Annual Report on Form 10-K contains or incorporates by reference certain forward-looking statements within the meaning of Section 27A of the 1933 Act and Section 21E of the Securities Exchange Act of 1934, as amended, and, as such, may involve known and unknown risks, uncertainties and assumptions. Forward-looking statements are those that predict or describe future events or trends and that do not relate solely to historical matters. You can generally identify forward-looking statements as statements containing the words “will,” “believe,” “expect,” “anticipate,” “intend,” “estimate,” “assume” or other similar expressions. You should not rely on our forward-looking statements because the matters they describe are subject to assumptions, known and unknown risks, uncertainties and other unpredictable factors, many of which are beyond our control. Therefore, our actual results could differ materially and adversely from those expressed in any forward-looking statements as a result of various factors, some of which are listed under the section “Risk Factors,” Item 1A of this Annual Report on Form 10-K.
In this report references to “TOMI” “we,” “us,” and “our” refer to TOMI Environmental Solutions, Inc.
15
SPECIAL NOTE REGARDING FORWARD-LOOKING STATEMENTS
The Securities and Exchange Commission (“SEC”) encourages companies to disclose forward-looking information so that investors can better understand future prospects and make informed investment decisions. This report contains these types of statements. Words such as “may,” “will,” “expect,” “believe,” “anticipate,” “estimate,” “project,” or “continue” or comparable terminology used in connection with any discussion of future operating results or financial performance identify forward-looking statements. You are cautioned not to place undue reliance on the forward-looking statements, which speak only as of the date of this report. All forward-looking statements reflect our present expectation of future events and are subject to a number of important factors and uncertainties that could cause actual results to differ materially from those described in the forward-looking statements.
The following discussion relates to the years ended December 31, 2015 and 2014. As disclosed elsewhere in this report, we commenced our current operations in the fourth quarter of 2007 and, since 2008, we have proceeded to implement our business plan by acquiring for cash both the intellectual property and methodology that at that time was the core of our ozone treatment systems. TOMI continues to focus on obtaining high-tech decontamination technology and the writing of building health and infectious disease protocols.
Overview
We are a global decontamination and infectious disease control company, providing environmental solutions for indoor and outdoor surface decontamination through the sale of equipment, services and licensing of our SteraMistTM Binary Ionization Technology® (“BIT™”) hydrogen peroxide based mist and fogs.
During August 2010, TOMI entered into negotiations with BIT Technology a division of L-3, and we began to develop applications for and distribution of the SteraMistTM equipment that currently accounts for nearly all of our revenue. In April 2013, we completed the acquisition of certain assets from L-3 Applied Technologies, Inc. (“L-3”) for $3,510,000. At that moment our business model consisting of the production of activated ionized hydrogen peroxide and the transformation into TOMI’s reactive oxygen species began as we reengineered the prototypes into TOMI’s, Binary Ionization Technology® (BIT™), branded as SteraMist™, technology that is a direct offspring of the Defense Advanced Research Projects Agency (DARPA). DARPA is an advanced technology incubator, which has given birth to many game changing technologies, such as stealth fighters, M16 assault rifles, and the Internet. BIT™ is a technology with a strong foundation.
Brought to the commercial market in June 2013, TOMI’s current suite of products incorporates BIT™ Solution and applicators including the SteraMist™ Surface Unit and the SteraMist™ Environment System. Current SteraMist™ BIT™ Technology has expanded beyond chemical and biological warfare applications to deactivate problem microorganisms (including spores) in a wide variety of commercial settings. SteraMist™ BIT™ provides fast acting biological deactivation and works in even the most hard-to-reach areas while leaving no residue or noxious fumes. The by-products of the AIHP are oxygen and water (humidity).
TOMI Environmental Solutions, Inc. currently targets domestic and international markets for the control of microorganisms and the decontamination of large and small indoor space for biological pathogens and chemical agents including infectious diseases in hospital, bio-secure labs, pharmaceutical, biodefense, biosafety including isolation and transfer chambers, tissue banks, food safety and many other commercial and residential settings.
In June of 2015 the EPA registered the Company’s, Binary Ionization Technology® (BIT™) as a two stage rapid disinfection system for use as a healthcare-hospital disinfectant.
In June and July of 2015, the Company received an $8,000,000 equity investment from Arise Asset Management in exchange for approximately 17,000,000 shares of the Company’s common stock. Also, in June of 2015, the Company retired approximately $5,100,000 in convertible debt. With the $8,000,000 investment received and the retirement of the convertible debt, the Company strengthened its balance sheet, added liquidity and working capital.
16
In 2015 the Company launched the TOMI Service Network (“TSN”). This allowed the Company to enhance its service division by creating a national service network composed of existing full service restoration industry specialists. Since the launch of the TSN, the Company has recruited and entered into licensing agreements with 25 geographically and strategically placed companies that will become network hubs to take advantage of the of the Company’s SteraMistTM platform of products and assist as service providers for the Company’s domestic and international client base and provide regional, national, and international large event mobilization response.
During 2014 and 2015, the Company expanded its global presence through the shipment of products into various countries in Europe and Asia.
The Company’s net revenue for the year ended December 31, 2015 was approximately $4,200,000 compared to $2,248,000 in 2014, representing an increase of 86%.
You should read the following discussion and analysis of our financial condition and results of operations in conjunction with our financial statements and related notes included elsewhere in this report. Also refer to Item 1. Business – Overview for more detailed descriptions.
Critical Accounting Policies and Estimates
Our discussion and analysis of our financial condition and results of operations are based upon our consolidated financial statements, which have been prepared in accordance with accounting principles generally accepted in the United States. The preparation of these financial statements requires us to make estimates and judgments that affect the reported amounts of assets, liabilities, revenues and expenses, and related disclosure of contingent assets and liabilities. The estimation process requires assumptions to be made about future events and conditions, and as such, is inherently subjective and uncertain. Actual results could differ materially from our estimates.
The SEC defines critical accounting policies as those that are, in management’s view, most important to the portrayal of our financial condition and results of operations and most demanding of our judgment. We consider the following policies to be critical to an understanding of our consolidated financial statements and the uncertainties associated with the complex judgments made by us that could impact our results of operations, financial position and cash flows.
Revenue Recognition
For revenue from services and product sales, the Company recognized revenue in accordance with Staff Accounting Bulletin No. 104, “Revenue Recognition” (SAB No. 104), which superseded Staff Accounting Bulletin No. 101, “Revenue Recognition in Financial Statements” (SAB No. 101). SAB No. 104 requires that four basic criteria must be met before revenue can be recognized: (1) persuasive evidence of an arrangement exists; (2) service has been rendered or delivery has occurred; (3) the selling price is fixed and determinable; and (4) collectability is reasonably assured. Determination of criteria (3) and (4) are based on management’s judgment regarding the fixed nature of the selling prices of the services rendered or products delivered and the collectability of those amounts. Provisions for discounts to customers, and allowance, and other adjustments will be provided for in the same period the related sales are recorded.
Fair Value Measurement
The authoritative guidance for fair value measurements defines fair value as the exchange price that would be received for an asset or paid to transfer a liability (an exit price) in the principal or the most advantageous market for the asset or liability in an orderly transaction between market participants on the measurement date. Market participants are buyers and sellers in the principal market that are (i) independent, (ii) knowledgeable, (iii) able to transact, and (iv)willing to transact. The guidance describes a fair value hierarchy based on the levels of inputs, of which the first two are considered observable and the last unobservable, that may be used to measure fair value, which are the following:
|
Level 1:
|
Quoted prices in active markets for identical assets or liabilities.
|
|
|
Level 2:
|
Inputs other than Level 1 that are observable, either directly or indirectly, such as quoted prices for similar assets or liabilities; quoted prices in markets that are not active; or other inputs that are observable or corroborated by observable market data or substantially the full term of the assets or liabilities.
|
|
|
Level 3:
|
Unobservable inputs that are supported by little or no market activity and that are significant to the value of the assets or liabilities.
|
|
17
The Company’s financial instruments include cash and equivalents, accounts receivable, accounts payable and accrued expenses and loans payable. All these items were determined to be Level 1 fair value measurements.
The carrying amounts of cash and equivalents, accounts receivable, accounts payable and accrued expenses, approximated fair value because of the short maturity of these instruments. The recorded value of convertible debt approximates its fair value as the terms and rates approximate market rates.
Cash and Cash Equivalents
For purposes of the statement of cash flows, cash and cash equivalents includes cash on hand held at financial institutions and other liquid investments with original maturities of three months or less.
Accounts Receivable
Our accounts receivable are typically from credit worthy customers or, for international customers are supported by pre-payments. For those customers to whom we extend credit, we perform periodic evaluations of them and maintain allowances for potential credit losses as deemed necessary. We have a policy of reserving for uncollectible accounts based on our best estimate of the amount of probable credit losses in existing accounts receivable. We periodically review our accounts receivable to determine whether an allowance is necessary based on an analysis of past due accounts and other factors that may indicate that the realization of an account may be in doubt. Account balances deemed to be uncollectible are charged to the allowance after all means of collection have been exhausted and the potential for recovery is considered remote. Bad debt expense for the years ended December 31, 2015 and 2014 was $39,081 and $134,540, respectively.
At December 31, 2015 and 2014, the allowance for doubtful accounts was $45,000 and $37,500, respectively.
As of December 31, 2015, three customers accounted for 42% of net accounts receivable. Two customers accounted for 26% of net revenues for the year ended December 31, 2015.
Inventories
Inventories are valued at the lower of cost or market using the first-in, first-out (”FIFO”) method. Inventories consist primarily of finished goods and raw materials. At December 31, 2015 and 2014, we did not have a reserve for slow-moving or obsolete inventory.
Deposits on Merchandise
Deposits on merchandise primarily consist of amounts incurred or paid in advance of the receipt of inventory.
Property and Equipment
We account for property and equipment at cost less accumulated depreciation. We compute depreciation using the straight-line method over the estimated useful lives of the assets, generally three to five years. Depreciation for equipment, furniture and fixtures and vehicles commences once placed in service for its intended use. Leasehold improvements are amortized using the straight-line method over the lives of the respective leases or service lives of the improvements, whichever is shorter.
Deferred Financing Costs
The Company follows authoritative guidance for accounting for financing costs as it relates to convertible debt issuance cost. These costs are deferred and amortized over the term of the debt period or until redemption of the convertible debentures.
18
Accounts Payable
As of December 31, 2015 and December 31, 2014, one vendor accounted for approximately 72% and 44% of total accounts payable. One vendor accounted for 84% of cost of goods sold for the year ended December 31, 2015. One vendor accounted for 82% of cost of goods sold for the year ended December 31, 2014.
Income taxes
Deferred income tax assets and liabilities are determined based on differences between the financial statement reporting and tax bases of assets and liabilities and are measured using the enacted tax rates and laws in effect when the differences are expected to reverse. The measurement of deferred income tax assets is reduced, if necessary, by a valuation allowance for any tax benefits, which are, on a more likely than not basis, not expected to be realized; in accordance with ASC guidance for income taxes. Net deferred tax benefits have been reserved at December 31, 2015 and 2014. The effect on deferred income tax assets and liabilities of a change in tax rates is recognized in the period that such tax rate changes are enacted.
Income (Loss) Per Share
Basic income (loss) per share is computed by dividing the Company’s net income (loss) by the weighted average number of common shares outstanding during the period presented. Diluted income per share is based on the treasury stock method and includes the effect from potential issuance of common stock such as shares issuable pursuant to the exercise of warrants and conversions of debentures.
Stock-Based Compensation
The Company accounts for stock-based compensation in accordance with Financial Accounting Standards Board (“FASB”), ASC 718, Compensation- “Stock Compensation.” Under the provisions of FASB ASC 718, stock-based compensation cost is estimated at the grant date based on the award’s fair value and is recognized as expense over the requisite service period. The Company had one active stock-based compensation plan (“2008 Plan”, TOMI Environmental Solutions, Inc. Stock Option and Restricted Stock Plan (the “Plan”). The Plan calls for the Company, through a committee of its Board of Directors, to issue up to 2,500,000 shares of restricted common stock or stock options. The Company generally issues grants to its employees, consultants, and board members. Stock options are granted with an exercise price equal to the closing price of its common stock on the date of the grant with a term no greater than 10 years. Generally, stock options vest over two to four years. Incentive stock options granted to shareholders who own 10% or more of the Company’s outstanding equity securities are granted at an exercise price that may not be less than 110% of the closing price of the Company’s common stock on the date of grant and have a term no greater than five years. On the date of a grant, the Company determines the fair value of the stock option award and recognizes compensation expense over the requisite service period, which is generally the vesting period of the award. The fair value of the stock option award is calculated using the Black-Scholes option-pricing model. On August 25, 2015 the plan was terminated.
On January 29, 2016, the board adopted the 2016 Equity Plan subject to its approval by stockholders.
Concentrations of Credit Risk
Financial instruments that potentially subject the Company to significant concentrations of credit risk consist principally of cash and cash equivalents. The Company maintains cash balances at financial institutions which exceed the current Federal Deposit Insurance Corporation (“FDIC”) limit of $250,000 at times during the year.
Long-Lived Assets Including Acquired Intangible Assets
We will review our intangible assets for impairment whenever events or changes in circumstances indicate the carrying amount of an asset may not be recoverable. We will measure recoverability of these assets by comparing the carrying amounts to the future undiscounted cash flows the assets are expected to generate. If intangible assets are considered to be impaired, the impairment to be recognized equals the amount by which the carrying value of the asset exceeds its fair market value.
Advertising and Promotional Expenses
The Company expenses advertising costs in the period in which they are incurred.
19
Research and Development Expenses
The Company expenses research and development expenses in the period in which they are incurred.
Shipping and Handling Costs
The Company includes shipping and handling costs relating to the delivery of products directly from vendors to the Company in cost of sales. Shipping and handling costs, which include third-party delivery costs relating to the delivery of products from the Company to customers, are classified as a general and administrative expense.
Recent Accounting Pronouncements
In May of 2014, the FASB issued Accounting Standards Update No. 2014-09 (ASU 2014-09) “Revenue from Contracts with Customers.” ASU 2014-09 supersedes the revenue recognition requirements in “Revenue Recognition (Topic 605)”, and requires entities to recognize revenue when it transfers promised goods or services to customers in an amount that reflects the consideration to which the entity expects to be entitled to in exchange for those goods or services. ASU 2014-09 is effective for annual reporting periods beginning after December 15, 2016, including interim periods within that reporting period. Early adoption is not permitted. We are currently in the process of evaluating the impact of the adoption of ASU 2014-09 on our consolidated financial statements.
In November 2015, the FASB issued Accounting Standards Update No. 2015-17, Income Taxes (Topic 740): Balance Sheet Classification of Deferred Taxes (ASU 2015-17), which simplifies the presentation of deferred income taxes by requiring that deferred tax assets and liabilities be classified as non-current. We have retrospectively adopted this standard as of December 31, 2015, and as a result there was no impact to the Company as all of the deferred tax assets for the year ended December 31, 2014 were classified as noncurrent.
In February of 2016, the FASB issued Accounting Standards Update No. 2016-02 (ASU 2016-02) “Leases.” ASU 2016-02 provides new lease accounting guidance. ASU 2016-02 is effective for annual reporting periods beginning after December 15, 2018, including interim periods within that reporting period. Early adoption is permitted. We are currently in the process of evaluating the impact of the adoption of ASU 2016-02 on our consolidated financial statements.
Financial Operations Overview
Our financial position as of December 31, 2015 and 2014, was as follows:
|
As of
|
As of
|
|||||||
|
December 31,
2015
|
December 31,
2014
|
|||||||
|
Total convertible notes payable
|
$ | - | $ | 5,074,000 | ||||
|
Debt discount
|
$ | - | $ | 3,996,033 | ||||
|
Total convertible note payable, net
|
$ | - | $ | 1,077,967 | ||||
|
Total stockholders’ equity
|
$ | 10,422,974 | $ | 1,125,555 | ||||
|
Cash and cash equivalents
|
$ | 5,916,068 | $ | 160,560 | ||||
|
Accounts receivable
|
$ |
1,414,576
|
$ | 441,153 | ||||
|
Inventories
|
$ | 1,395,175 | $ | 772,833 | ||||
|
Deposits on Merchandise
|
$ | 442,358 | $ | - | ||||
|
Derivative liability
|
$ | - | $ | 1,728,883 | ||||
|
Working capital
|
$ | 7,880,462 | $ | (1,826,212 | ) | |||
During our year ended December 31, 2015 our debt and liquidity positions were affected by the following:
|
●
|
Net cash used in operations of approximately $1,654,000;
|
|
●
|
Acquisition of property plant and equipment of $80,000;
|
|
●
|
Proceeds from the issuance of common stock of $8,735,000;
|
|
●
|
Repayment of principal balance on Convertible Notes of $1,300,000;
|
|
●
|
Conversion of principal balance on Convertible Notes of $3,774,000.
|
20
Looking Forward
Certain key factors will affect our future financial and operating results. These include, but are not limited to, the following:
|
●
|
Our 2016 expectations, particularly with respect to sales volumes may differ significantly from actual quarter and full year results due to competition, demand for our products, sales and marketing success, and our ability to effectively and efficiently manufacture our products.
|
Results of Operations for the Year Ended December 31, 2015 Compared to the Year Ended December 31, 2014
Net Income (Loss)
The Company incurred a net loss for the year ended December 31, 2015 of approximately ($12,176,000) as compared to net income for the same period in the prior year of approximately $268,000 representing an increase in net loss of $12,444,000. The primary reason for the increase in the net loss can be attributed to one-time non-cash charges related to the liquidation of the outstanding convertible promissory notes as follows:
|
●
|
Changes in the fair value of the embedded conversion feature of the convertible notes of $9,748,000 resulting from the issuance of convertibles notes in 2013 and retired in June of 2015;
|
|
●
|
Higher amortization of debt discount charges of approximately $2,989,000 related to the $5,074,000 in convertible notes issued in 2013 and retired in June of 2015;
|
|
●
|
Induced conversion costs incurred in connection with the retirement of the convertible notes of $930,000; offset by;
|
|
●
|
Increase in revenue of approximately $1,943,000 and the overall gross profit of approximately $1,173,000;
|
Sales
During the year ended December 31, 2015 and 2014, we had net revenue of approximately $4,192,000 and $2,248,000, respectively, representing an increase in revenue of $1,944,000 or 86%. The primary reason for the increase in revenue was attributable mainly to the Company expanding into new markets, having sufficient supply of product to fill orders, as well as diversifying our client base.
Cost of Sales
During the year ended December 31, 2015 and 2014, we had cost of sales of approximately $1,644,000 and $874,000, respectively, representing an increase of $770,000 or 88%. The primary reason for the increase in cost of sales was due to sales increasing during the year ended December 31, 2015 versus the prior year. Our gross profit margins were consistent with what the Company experienced in the prior year.
Professional Fees
Professional fees for the year ended December 31, 2015 totaled approximately $456,000 as compared to $350,000 during the prior year representing an increase of approximately $106,000 or 30%. Professional fees are mainly comprised of legal, accounting and financial consulting fees.
Depreciation and Amortization
Depreciation and amortization was approximately $499,000 and $470,000 for the year ended December 31, 2015 and 2014, respectively.
Selling Expenses
Selling expenses for the year ended December 31, 2015 totaled approximately $704,000 as compared to $380,000 in 2014 representing an increase of $324,000 or 85%. These expenses represent selling salaries and wages, trade show fees, commissions and marketing expenses. We have ramped up sales and marketing in the current period and expect these costs to increase in future periods.
Research & Development
Research and development expenses for the year ended December 31, 2015 totaled approximately $100,000 as compared to $156,000 in 2014. Research and development expenses mainly include costs incurred in generating and supporting research on improving, extending and applying our patents in the field of mechanical cleaning and decontamination. We expect these costs to increase in 2016.
21
Consulting Fees
Consulting fees for the year ended December 31, 2015 totaled approximately $476,000 as compared to $180,000 during the prior year representing an increase of approximately $296,000. The increase in consulting fees is primarily due to EPA advisory services and the Company entering into a new consulting agreement during the second quarter where 600,000 shares restricted stock valued at $264,000 was issued as part of an agreement to expand Asian sales.
Equity Compensation Expense
Equity compensation expense represents primarily non-cash charges for the year ended December 31, 2015 and totaled approximately $1,706,000 as compared to $2,565,000 in 2014. Equity compensation expense is incurred upon the issuance of warrants. On the date of a grant, we determine the fair value of the stock option award and recognize compensation expense over the requisite service period, which is generally the vesting period of the award. The fair value of the stock option award is calculated using the Black-Scholes Method option-pricing model. The decrease in equity compensation is primarily due to the immediate vesting of warrants of two executive officers of the Company upon their resignation in September of 2014.
General and Administrative Expense
General and administrative expenses include salaries and payroll taxes, rent, insurance expense, utilities and office expense. General and administrative expenses were approximately $1,591,000 and $1,084,000 for the year ended December 31, 2015 and 2014, respectively, representing an increase of $507,000 or 47%. The primary reason for the increase in General and administrative expenses can be attributed mainly to higher salaries and wages due to new hires during the current period and stock bonuses issued to executives in the third quarter.
Other Income and Expense
Amortization of deferred financing costs was approximately $200,000 and $342,000 for the year ended December 31, 2015 and 2014, respectively. This represents the amortization of costs incurred to raise capital in relation to the acquisition of the SteraMistTM line of products from L-3 and were fully amortized in the second quarter of 2015 upon retiring the convertible notes.
Amortization of debt discount was approximately $3,996,000 and $1,007,000 during the year ended December 31, 2015 and 2014, respectively, representing the amortization of debt discount on our $5,074,000 in convertible notes issued in 2013. The debt discount was amortized over the life of the notes utilizing the effective interest method.
The fair value adjustment of the derivative liability during the year ended December 31, 2015, amounted to approximately a $3,811,000 loss in the current period versus a gain of $5,937,000 in the prior period. This represented a $9,748,000 change in the fair value of the embedded conversion feature of the convertible notes. Upon the retirement of the convertible notes in the second quarter of 2015, the derivative liability was reclassified to additional paid in capital.
Induced conversion costs for year ended December 31, 2015 were approximately $930,000 in connection with the retirement of the convertible notes in the second quarter of 2015.
Interest expense for the year ended December 31, 2015 and 2014 was approximately $254,000 and 508,000, respectively. This represented the interest due on the $5,074,000 in convertible notes issued in 2013 in connection with the acquisition of the SteraMistTM line of products from L-3 that were retired in the second quarter of 2015.
Net Income (Loss)
The net loss for the year ended December 31, 2015 amounted to approximately ($12,176, 000) versus a net income of approximately $268,000 for the year ended December 31, 2014. The net loss per common share, basic and diluted, for the year ended December 31, 2015 was ($0.12) and ($0.12), respectively. Net income per common share, basic and diluted, for the year ended December 31, 2014 was $0.00 and $0.00, respectively.
22
Summary of Annual Results
|
For the
|
For the
|
|||||||
|
year ended
|
year ended
|
|||||||
|
December 31,
2015
|
December 31,
2014
|
|||||||
|
Revenues
|
$ | 4,192,000 | $ | 2,248,000 | ||||
|
Gross Profit
|
2,548,000 | 1,374,000 | ||||||
|
Total Operating Expenses(1)
|
5,533,000 | 5,185,000 | ||||||
|
Loss from Operations
|
(2,986,000 | ) | (3,810,000 | ) | ||||
|
Total Other Income (Expense)(2)
|
(9,191,000 | ) | 4,079,000 | |||||
|
Net Income (Loss)
|
$ | (12,176,000 | ) | $ | 268,000 | |||
|
Basic net income (loss) per share
|
$ | (0.12 | ) | $ | 0.00 | |||
|
Diluted net income (loss) per share
|
$ | (0.12 | ) | $ | 0.00 | |||
|
(1)
|
Includes approximately $1,706,000 and $2,565,000 in non-cash equity compensation expense for the year ended December 31, 2015 and 2014, respectively.
|
|
(2)
|
Includes fair value adjustment loss on derivative liability of approximately $3,811,000 for the year ended December 31, 2015 and a fair value adjustment gain of $5,937,000 for the year ended December 31, 2015, amortization of $3,996,000 and $1,008,000 for the year ended December 31, 2015 and 2014, respectively and induced conversion costs in the amount of $930,000 for the year ended December 31, 2015.
|
Liquidity and Capital Resources
As of December 31, 2015, the Company had cash and cash equivalents of approximately $5,900,000 and working capital of $7,880,000.
Our principal capital requirements are to fund operations, invest in research and development and capital equipment, and the continued costs of public company filing requirements. We have historically funded our operations through debt and equity financings. In June 2015, we completed private placements and received net proceeds of approximately $8,000,000. In June and July 2015 we redeemed and converted all of the Secured Notes by issuing approximately 14,900,000 shares of common stock, and $1,300,000 in cash.
The Company intends to up list to a national stock exchange. We understand there are qualitative and quantitative benchmarks that will need to be met in order to get listed on a national stock exchange. This could require us to raise additional capital in order to meet the quantitative benchmarks.
For the years ended December 31, 2015 and 2014, we incurred losses from operations of approximately $2,986,000 and $3,810,000, respectively. The cash used cash in operations amounted to approximately $1,654,000 and $1,127,000 for the years ended December 31, 2015 and 2014, respectively. The Company could incur additional operating losses from costs related to the continuation of product and technology development and administrative activities.
Management of the Company has taken and will take a number of actions in order to improve the Company’s results of operations and the related cash flows generated from operations in order to get the Company to a stronger financial position. These actions include the following items:
|
●
|
Expanding our label with the EPA to include the bacteria’s C. diff and MRSA and the virus H1N1 in the EPA stamped registration. In February 2016, the Company achieved the amended registration and feels it could allow TOMI to change the way our product is marketed in the United States Hospital-Healthcare verticals that could lead to further market penetration for the Company.
|
|
●
|
Expansion of our internal salesforce and manufacturer representatives. In February 2016, the Company hired a Vice President of Sales and an Internal Sales Director in an effort to drive domestic revenue in all Hospital-Healthcare verticals.
|
|
●
|
Expansion of international distributors. In February 2016, the Company announced the distributor relationship with TOMI Asia to facilitate growth in the Asian region, specifically Mainland China and Indo-China excluding South Korea and Australia/New Zealand.
|
|
●
|
Continued growth of the TOMI Service Network (“TSN”). In January 2016, the Company hired a President and Director of Network Recruitment for TSN in order to increase TSN’s internal salesforce which therefore increased membership. TSN currently has a total of 33 members and 9 members have been added year to date.
|
23
We believe that our existing balance of cash and cash equivalents and amounts expected to be provided by operations will provide us with sufficient financial resources to meet our cash requirements for operations, working capital and capital expenditures for the next eighteen months. However, in the event of unforeseen circumstances, unfavorable market developments or unfavorable results from operations, there can be no assurance that the above actions could be successfully implemented as expected, and cash flows may be adversely affected. Our sales cycle has come down but could exceed approximately 4-6 months and it’s possible we may not be able to generate sufficient revenue in the next twenty-four months to cover our operating and compliance costs. We may also need to raise additional debt or equity financing to execute on the commercialization of our product plans. We cannot make any assurances that management's strategies will be effective or that any additional financing will be completed on a timely basis, on acceptable terms or at all. Our inability to successfully implement our strategies or to complete any other financing may mean that we would have to significantly reduce costs and/or delay projects, which would adversely affect our business, customers and program development, and would adversely impact the Company.
The Company’s analysis of cash flows for the years ended December 31, 2015 and 2014, is as follows:
Operating activities
Cash used in operating activities during the year ended December 31, 2015 and 2014 was approximately $1,654,000 and $1,127,000, respectively. Cash used in operating activities increased $527,000 as compared to the year ended December 31, 2014, primarily due to increased accounts receivables, inventory and vendor deposits compared to the same period ended in the prior year.
Investing Activities
Cash used in investing activities during the year ended December 31, 2015 and 2014, amounted to approximately $80,000 and $82,000 primarily due to the acquisition of trade show, computer equipment and office furniture.
Financing Activities
Cash provided by financing activities during the year ended December 31, 2015 amounted to approximately $7,490,000, primarily from the proceeds of the issuance of common stock and warrants of $8,735,000 offset by the repayment of principal for a portion of the convertible notes of $1,300,000. In addition, the Company incurred a finder’s fee of approximately $51,000 in connection with the issuance of the stock for the year ended December 31, 2015.
Cash provided in financing activities during the year ended December 31, 2014 amounted to approximately $663,000, primarily from the proceeds from the issuance of common stock of $765,000 offset by the increase in the bond sinking fund of $36,000. In addition, the Company paid a finder’s fee of approximately $66,000 in connection with the issuance of the stock for the year ended December 31, 2014.
Contractual Obligations
Our contractual obligations as of December 31, 2015 are summarized as follows (in thousands):
|
Payments Due by Period
|
||||||||||||||||||||
|
Contractual Obligations
|
Total
|
Less than
1 Year
|
1 – 3
Years
|
3 – 5
Years
|
More than
5 Years
|
|||||||||||||||
|
Operating leases(1)
|
110 | 52 | 58 | - | - | |||||||||||||||
| $ | 110 | $ | 52 | $ | 58 | $ | - | $ | - | |||||||||||
(1) Amounts represent a non-cancelable operating lease for office space in Frederick, MD that terminates on January 31, 2018. In addition to base rent, the lease calls for payment of common area maintenance operating expenses.
Off-Balance Sheet Arrangements
None.
24
Item 7A. QUANTITATIVE AND QUALITATIVE DISCLOSURES ABOUT MARKET RISK
Not applicable.
|
Item 8. FINANCIAL STATEMENTS AND SUPPLEMENTARY INFORMATION
|
The Company’s financial statements for the fiscal years ended December 31, 2015 and 2014 are included in this annual report, beginning on page F-1.
|
Item 9. CHANGES IN AND DISAGREEMENTS WITH ACCOUNTANTS ON ACCOUNTING AND FINANCIAL DISCLOSURE
|
During the two most recent years we have not had a change in, or disagreement with, our independent registered public accounting firm.
Item 9A. CONTROLS AND PROCEDURES
Our management, with the participation of our Principal Executive Officer and Principal Financial Officer, conducted an evaluation of the effectiveness of our disclosure controls and procedures as of the end of the period covered by this Annual Report, as is defined in Rule 13a-15(e) promulgated under the Securities Exchange Act of 1934, as amended. Our disclosure controls and procedures are intended to ensure that the information we are required to disclose in the reports that we file or submit under the Securities Exchange Act of 1934 is (i) recorded, processed, summarized and reported within the time periods specified in the Securities and Exchange Commission’s rules and forms and (ii) accumulated and communicated to our management, including the Principal Executive Officer and Principal Financial Officer to allow timely decisions regarding required disclosures.
Based on that evaluation, of our Principal Executive Officer and Principal Financial Officer we concluded that, as of the end of the period covered by this Annual Report, our disclosure controls and procedures were effective. Our management has concluded that the financial statements included in this Form 10-K present fairly, in all material respects our financial position, results of operations and cash flows for the periods presented in conformity with generally accepted accounting principles.
It should be noted that any system of controls, however well designed and operated, can provide only reasonable, and not absolute, assurance that the objectives of the system will be met. In addition, the design of any control system is based in part upon certain assumptions about the likelihood of future events.
Management’s Report on Internal Control Over Financial Reporting
Management is responsible for establishing and maintaining adequate internal control over our financial reporting (as defined in Rule 13a-15(f) and 15d-15(f) of the Exchange Act). Internal control over financial reporting is a process designed to provide reasonable assurance regarding the reliability of financial reporting and the preparation of financial statements for external purposes in accordance with accounting principles generally accepted in the United States of America.
Our internal control over financial reporting includes those policies and procedures that (i) pertain to the maintenance of records that, in reasonable detail, accurately and fairly reflect the transactions and dispositions of our assets, (ii) provide reasonable assurance that transactions are recorded as necessary to permit preparation of financial statements in accordance with accounting principles generally accepted in the United States of America, and that our receipts and expenditures are being made only in accordance with authorizations of our management and directors, and (iii) provide reasonable assurance regarding prevention or timely detection of unauthorized acquisition, use or disposition of our assets that could have a material effect on the financial statements.
Because of its inherent limitations, internal control over financial reporting may not prevent or detect misstatements. Also, projections of any evaluation of effectiveness to future periods are subject to the risk that controls may become inadequate because of changes in conditions, or that the degree of compliance with the policies or procedures may deteriorate.
Our management, with the participation of our Principal Chief Executive Officer and our Principal Chief Financial Officer, conducted an evaluation of the effectiveness of our internal control over financial reporting based on the framework in Internal Control - Integrated Framework issued by the Committee of Sponsoring Organizations of the Treadway Commission. Based on this evaluation, our Principal Chief Executive Officer along with our Principal Chief Financial Officer concluded that, as of the end of the period covered by this Annual Report, our internal control over financial reporting was effective.
25
This Annual Report does not include an attestation report of our independent registered public accounting firm regarding internal control over financial reporting. Management’s report was not subject to attestation by our independent registered public accounting firm pursuant to temporary rules of the Securities and Exchange Commission that permit us to provide only management’s report in this Annual Report.
Changes in Internal Control Over Financial Reporting
During our most recent fiscal quarter, there have been no changes in our internal control over financial reporting that have materially affected, or are reasonably likely to materially affect our internal control over financial reporting.
Item 9B. OTHER INFORMATION
None.
26
PART III
Item 10. DIRECTORS, EXECUTIVE OFFICERS AND CORPORATE GOVERNANCE
Our executive officers and directors and their biographical information are presented below. Our bylaws require three directors who serve until our next annual meeting or until each is succeeded by a qualified director. Our executive officers are appointed by our Board of Directors and serve at its discretion. There are no existing family relationships between or among any of our executive officers or directors.
|
Name
|
Age
|
Position
|
|||
|
Halden S. Shane
|
71 |
CEO, Chairman of the Board
|
|||
|
Robert Wotczak
|
49 |
President
|
|||
|
Nick Jennings
|
38 |
Chief Financial Officer
|
|||
|
Norris Gearhart
|
55 |
Chief Operating Officer
|
|||
|
Harold W. Paul
|
67 |
Director
|
|||
|
Walter C. Johnsen
|
65 |
Director
|
|||
|
Kelly J. Anderson
|
48 |
Director
|
|||
|
Edward J. Fred
|
57 |
Director
|
|||
Halden S. Shane: Dr. Shane has been our Chairman since the Company’s inception. Up until 2009 Dr. Shane also served as President and CEO of Tiger Management International, a private management company that deals in business management of private and public companies. Dr. Shane resigned all positions and closed Tiger Management International in 2009. Dr. Shane was founder and CEO of Integrated Healthcare Alliance, Inc. and also founder and General Partner of Doctors Hospital West Covina, California. Prior thereto, Dr. Shane practiced podiatric surgery specializing in ankle arthroscopy.
Robert Wotczak: The Company appointed Robert Wotczak President on February 10, 2016. From January, 2014 through January 2016, he was Executive Vice President and Head of the Capital Markets Advisory Practice at the investor relations firm, LHA, headquartered in New York City. For the previous ten years he was employed by the NYSE and AMEX in various capacities. He led the transition and integration of the AMEX into the NYSE in 2008. Wotczak’s prior work experience includes leading the trust and investment department for Commercial Bank of New York, where he was responsible for more than $1 billion in assets. He holds a BA in Management & Finance from Baruch College.
Nick Jennings: Mr. Jennings has been our Chief Financial Officer since October 2014. From July 2014 until his employment by the Company, Mr. Jennings was self-employed and provided consulting, accounting and tax compliance services to private-owned companies. From November 2006 until June 2014, Mr. Jennings was a senior manager at Richardson Kontogouris Emerson LLP, where he worked with various public and private companies providing services a variety of business areas including tax compliance, tax consulting, general accounting, and business assurance. He is a graduate of Loyola Marymount College with a degree in accounting and is a member of the American Institute of Certified Public Accountants.
Norris Gearhart: Mr. Gearhart has been our Chief Operating Officer since September 2014. Since January 2014 he served as Vice President of Technical Operations. Mr. Gearhart has 30 years’ experience within the insurance claims and disaster response industry. He has served in in regional management roles with Allstate and Travelers insurance companies as well as owning and operating his own disaster response company. He has worked as an international consultant and trainer. He is a former US Army Captain among other assignments serving with 20th Special Forces Group, Airborne.
Harold W. Paul: Mr. Paul has been a director since June 2009. He has been engaged in the private practice of law for more than thirty-five years, primarily as a securities specialist. Mr. Paul has been company counsel to public companies listed on the AMEX, NASDAQ and OTC exchanges. He has served as a director for six public companies in a variety of industries, including technology and financial services. He holds a BA degree from SUNY at Stony Brook and a JD from Brooklyn Law School and is admitted to practice in New York and Connecticut.
Walter C. Johnsen: The Company appointed Mr. Walter C. Johnsen as a Director on January 29, 2016. Since January 1, 2007, Mr. Johnsen has served as Chairman of the Board and Chief Executive Officer of Acme United Corporation, a leading worldwide supplier of innovative branded cutting, measuring and safety products in the school, home, office, hardware & industrial markets. From November 30, 1995 to December 31, 2006, he held the titles of President and Chief Executive Officer at Acme United. Mr. Johnsen previously served as Vice Chairman and a principal of Marshall Products, Inc., a medical supply distributor. Mr. Johnsen holds a Bachelor of Science in Chemical Engineering and a Master of Science in Chemical Engineering from Cornell University, and a Master of Business Administration from Columbia University.
27
Kelly J. Anderson: The Company appointed Ms. Kelly J. Anderson as a Director on January 29, 2016. Ms. Anderson is a partner in C Suite Financial Partners, a financial consulting services company dedicated to serving private, public, private equity, entrepreneurial, family office and government-owned firms in all industries. Between July 2014 through March 2015, Ms. Anderson was CFO of Mavenlink, a SaaS company, between October 2012 and January 2014, Ms. Anderson was Chief Accounting Officer of Fisker Automotive, between April 2010 and February 2012, Ms. Anderson was the President and Chief Financial Officer of T3 Motion, Inc., (“T3”), an electric vehicle technology company. Between March 2008 and April 2010, she served as T3’s Executive Vice President and Chief Financial Officer, and as a director from January 2009 until January 2010. From 2006 until 2008, Ms. Anderson was Vice President at Experian, a leading credit reporting agency. From 2004 until 2006, Ms. Anderson was Chief Accounting Officer for TripleNet Properties, G REIT, Inc., T REIT, Inc., NNN 2002 Value Fund, LLC, and Chief Financial Officer of NNN 2003 Value Fund, LLC and A REIT, Inc., all of which were real estate investment funds managed by TripleNet Properties. From 1996 to 2004, Ms. Anderson held senior financial positions with The First American Corp., a Fortune 500 title insurance company. Ms. Anderson is an inactive California CPA and a 1989 graduate of the College of Business and Economics at California State University, Fullerton.
Edward J. Fred: The Company appointed Mr. Edward J. Fred as a Director on January 29, 2016. After joining CPI Aerostructures Inc. in February 1995, Mr. Fred held the titles of Controller, Secretary, Principal Accounting Officer, Chief Financial Officer, President and ultimately Chief Executive Officer from January 2003 through March 2014. Prior to that, he served in various positions for the international division of Grumman where he last held the position of Controller. He served as a Director of Interlink Electronics, Inc. from July 13, 2010 to July 10, 2014, and he served as a Director of CPI Aerostructures Inc. from January 1999 to March 2014. Mr. Fred holds a Bachelor of Business Administration in Accounting from Dowling College and an Executive MBA from Hofstra University.
Audit Committee
The Company’s audit committee was established in June 2009 and is currently comprised of Kelly Anderson, Edward Fred and Harold Paul. Kelly Anderson will serve as the audit committee chairperson.
Audit Committee Report
The primary responsibility of the Audit Committee (the “Committee”) is to assist the Board of Directors in discharging its oversight responsibilities with respect to financial matters and compliance with laws and regulations. The primary methods used by the Committee to fulfill its responsibility with respect to financial matters are:
|
●
|
To appoint, evaluate, and, as the Committee may deem appropriate, terminate and replace TOMI’s independent registered public accountants;
|
|
●
|
To monitor the independence of TOMI’s independent registered public accountants;
|
|
●
|
To determine the compensation of TOMI’s independent registered public accountants;
|
|
●
|
To pre-approve any audit services, and any non-audit services permitted under applicable law, to be performed by TOMI’s independent registered public accountants;
|
|
●
|
To review TOMI’s risk exposures, the adequacy of related controls and policies with respect to risk assessment and risk management;
|
|
●
|
To monitor the integrity of TOMI’s financial reporting processes and systems of control regarding finance, accounting, legal compliance and information systems; and
|
|
●
|
To facilitate and maintain an open avenue of communication among the Board of Directors, management and TOMI’s independent registered public accountants.
|
28
In discharging its responsibilities relating to internal controls, accounting and financial reporting policies and auditing practices, the Committee discussed with TOMI’s independent registered public accountants, Wolinetz, Lafazan & Company, P.C., the overall scope and process for its audit. The Committee has met with Wolinetz, Lafazan & Company, P.C., with and without management present, to discuss the results of its examinations and the overall quality of TOMI’s financial reporting.
The Committee has discussed with Wolinetz, Lafazan & Company, P.C. its judgments about the quality, in addition to the acceptability, of TOMI’s accounting principles as applied in TOMI’s financial reporting, as required by Statement on Auditing Standards No. 90 “Communications with Audit Committees.”
The Committee also has received a letter from Wolinetz, Lafazan & Company, P.C. that is required by applicable requirements of the Public Company Accounting Oversight Board regarding the independent accountant's communications with the audit committee concerning independence, and has discussed with Wolinetz, Lafazan & Company, P.C. their independence.
The Committee has met and held discussions with management. The Committee has reviewed and discussed with management TOMI’s audited consolidated financial statements as of and for the years ended December 31, 2015 and 2014.
Based on the reviews and discussions referred to above, the Committee recommended to the Board of Directors that the audited financial statements referred to above be included in TOMI’s Annual Report for the year ended December 31, 2015.
This report is respectfully submitted by the members of the Audit Committee of the Board of Directors.
|
AUDIT COMMITTEE
|
|
Kelly J. Anderson, Committee Chairperson
|
Code of Ethics
The Board adopted a Code of Ethics in 2008 applies to, among other persons, Board members, officers including our Chief Executive Officer, contractors, consultants and advisors. Our Code of Ethics sets forth written standards designed to deter wrongdoing and to promote:
|
1.
|
honest and ethical conduct including the ethical handling of actual or apparent conflicts of interest between personal and professional relationships;
|
|
2.
|
full, fair, accurate, timely and understandable disclosure in reports and documents that we file with or submit to the SEC and in other public communications made by us;
|
|
3.
|
compliance with applicable governmental laws, rules and regulations;
|
|
4.
|
the prompt internal reporting of violations of the Code of Ethics to an appropriate person or persons identified in the Code of Ethics; and
|
|
5.
|
accountability for adherence to the Code of Ethics.
|
29
Item 11. EXECUTIVE COMPENSATION
Compensation Discussion and Analysis
The Compensation Discussion and Analysis (the “CD&A”) discusses the compensation of our named executive officers for the year ended December 31, 2015. The named executive officers are Halden S. Shane, Chairman & CEO, Nick Jennings, CFO, and Norris Gearhart, COO (collectively, the “named executive officers”).
Objectives and Philosophy of Executive Compensation
The primary objectives of the Compensation Committee with respect to executive compensation are to attract and retain the most talented and dedicated executives possible, to tie annual and long-term cash and stock incentives to achievement of measurable performance objectives, and to align executives' incentives with stockholder value creation. To achieve these objectives, the Compensation Committee strives to implement and maintain compensation plans that tie a substantial portion of executives' overall compensation to the experience level of the executive or employee, the complexity and amount of responsibility of the employee’s job, key strategic financial and operational goals such as the establishment and maintenance of key strategic relationships, and the performance of our common stock price. The Compensation Committee evaluates individual executive performance with the goal of setting compensation at levels the Compensation Committee believes are comparable with executives in other companies of similar size and stage of development operating in our industry while taking into account our relative performance and our own strategic goals.
On a going forward basis, the Compensation Committee will determine the cash bonus and/or equity incentive award based on the level of achievement of the financial and operational goals of the Company and for the level of achievement of annual performance objectives of each individual named executive officer. These objectives may vary depending on the individual executive, but will relate generally to strategic factors such as establishment and maintenance of key strategic relationships, the development and operation of our mining projects, the identification and possible development of additional mining properties, and to financial factors such as raising capital and improving our results of operations. Bonuses, if awarded, are determined at the sole discretion of the Board of Directors as recommended by the Compensation Committee.
2008 Stock Option Plan
The 2008 Stock Option Plan (the “Plan”) is intended to attract and retain individuals of experience and ability, to provide incentive to our employees, consultants, and non-employee directors, to encourage employee and director proprietary interests in us, and to encourage employees to remain in our employ. Each of the named executive officers is eligible for annual equity awards, which are granted pursuant to the Plan.
The Plan authorizes the grant of non-qualified and incentive stock options, stock appreciation rights and restricted stock awards (each, an “Award”). A maximum of 2,500,000 shares of common stock are reserved for potential issuance pursuant to Awards under the Plan. The plan was terminated in August of 2015.
The Plan is administered by our Board of Directors. The Plan provides for Awards to be made to such of our employees, directors and consultants and our affiliates as the Board may select.
The Plan provides the Board with the general power to amend the Plan, or any portion thereof at any time in any respect without the approval of our stockholders, provided however, that the stockholders must approve any amendment which increases the fixed maximum number of shares of common stock issuable pursuant to the Plan, reduces the exercise price of an Award held by a director, officer or ten percent stockholder or extends the term of an Award held by a director, officer or ten percent stockholder. Notwithstanding the foregoing, stockholder approval may still be necessary to satisfy the requirements of Section 422 of the Code, Rule 16b-3 of the Exchange Act or any applicable stock exchange listing requirements. The Board may amend the Plan in any respect it deems necessary or advisable to provide eligible Employees with the maximum benefits provided or to be provided under the provisions of the Code and the regulations promulgated thereunder relating to Incentive Stock Options and/or to bring the Plan and/or Incentive Stock Options granted under it into compliance therewith.
Although non-cash compensation is utilized by us to prevent placing strains on liquidity, care is taken by management to avoid materially diluting investors.
In the event of a termination of continuous service, unvested stock options shall terminate and, with regard to vested stock options, the exercise period shall end on the earlier of the original expiration date or 90 days from the date continuous service terminates.
30
2016 Equity Compensation Plan
The 2016 Plan is intended to provide incentives primarily to the directors, key employees and other key individuals who provide significant services to the Company and any of its subsidiaries which, with the consent of the Board, participates in the 2016 Plan to encourage a proprietary interest in the Company, to encourage such key employees to remain in the employ of the Company and to provide additional incentives to other individuals to increase their efforts in providing significant services to the Company.
Stockholder approval is necessary to provide the Board, or a committee thereof (collectively, the “Committee”), with the flexibility to grant certain awards that qualify as “performance-based compensation” under Section 162(m) of the Internal Revenue Code.
The 2016 Plan was adopted by the Board on January 29, 2016, subject to its approval by stockholders. On August 25, 2015, the Board terminated the Company’s 2008 Stock Option Plan. Accordingly, the Company will issue future awards under the 2016 Plan.
The 2016 Plan provides for the grant of stock options, stock appreciation rights, restricted stock, restricted stock units and performance units / shares. Up to 5,000,000 shares of the Common Stock are authorized for issuance under the 2016 Plan. Shares issued under the 2016 Plan may be either authorized but unissued shares, treasury shares, or any combination thereof. Provisions in the 2016 Plan permit the reuse or reissuance by the 2016 Plan of shares of Common Stock for numerous reasons, including, but not limited to, shares of Common Stock underlying canceled, expired, or forfeited awards of stock-based compensation and stock appreciation rights paid out in the form of cash. Stock-based compensation will typically be awarded in consideration for the future performance of services to the Company. All recipients of awards under the 2016 Plan are required to enter into award agreements with the Company at the time of the award; awards under the 2016 Plan are expressly conditioned upon such agreements.
The 2016 Plan is administered by the Board or the Committee if designated by the Board. As permitted by law, the Committee may delegate its authority. The Committee consists of no fewer than two members of our Board who are non-employee Directors as defined by Rule 16b-3 under the Securities Exchange Act of 1934. The Committee serves at the pleasure of our Board. The Committee acts by majority vote of all members taken at a meeting of the Committee at which a quorum of members is present or by the written affirmation of all of its members without a meeting. A quorum consists of a majority of the directors being present at the meeting.
Except as otherwise limited by law or by our Articles of Incorporation or Bylaws, the Committee has full power to select individuals who will participate in the 2016 Plan; determine the sizes and types of awards under the 2016 Plan; determine the terms and conditions of awards in a manner consistent with the 2016 Plan; and construe and interpret the 2016 Plan and any agreement entered into under the 2016 Plan. The Committee may permit or require a participant to defer his or her receipt of the payment of cash or the delivery of shares of our Common Stock that would otherwise be due to that participant by virtue of the exercise of an option or SAR, the lapse or waiver of restrictions with respect to restricted stock or RSUs, or the satisfaction of any requirements or goals with respect to performance units/shares. If a deferral election is required or permitted, the Committee in its sole discretion will establish rules and procedures for the payment deferrals, provided that such deferrals will be in compliance with the rules applicable to non-qualified deferred compensation under Section 409A of the Code. Further, the Committee may make all other determinations which may be necessary or advisable for the administration of the 2016 Plan.
All determinations and decisions made by the Committee under the provisions of the 2016 Plan and all related orders and resolutions of the Board will be final, conclusive and binding on all persons, including our stockholders, Directors, employees, participants and their estates and beneficiaries, and us.
Retirement or Change of Control Arrangements
We do not offer retirement benefit plans to our executive officers, nor have we entered into any contract, agreement, plan or arrangement, whether written or unwritten, that provides for payments to a named executive officer at or in connection with the resignation, retirement or other termination of a named executive officer, or a change in control of the company or a change in the named executive officer’s responsibilities following a change in control.
31
SUMMARY COMPENSATION TABLE
The following table sets forth the total compensation paid to or earned by our named executive officers for the years ended December 31, 2015 and 2014, respectively:
|
Name and Principal Position
|
Year
|
Salary
($)
|
Bonus
($)
|
Stock
Awards
($)
|
Option/
Warrant
Awards
($)
|
Non-Equity
Incentive
Plan
Compen-
sation
($)
|
Non-
qualified
Deferred
Compen-
sation
Earnings
($)
|
All Other
Compen-
sation
($)
|
Total
($)
|
|||||||||||||||||||||||||
| Halden S. Shane | 2015 | 36,000 | (1) | 101,250 | (2) | - | 317,268 | (4) | - | - | - | 454,518 | ||||||||||||||||||||||
| Chairman and CEO | 2014 | 36,000 | (1) | - | 25,000 | (3) | 596,291 | (4) | - | - | - | 657,291 | (5) | |||||||||||||||||||||
| Nick Jennings | 2015 | 90,000 | 27,900 | 18,000 | 29,612 | - | - | - | 165,512 | |||||||||||||||||||||||||
| CFO | 2014 | 15,000 | - | - | 37,015 | - | - | - | 52,015 | |||||||||||||||||||||||||
| Christopher Chipman | 2015 | - | - | - | - | - | - | - | - | |||||||||||||||||||||||||
| CFO | 2014 | 60,000 | (8) | - | - | 32,000 | (8) | - | - | - | 92,000 | |||||||||||||||||||||||
| Norris Gearhart | 2015 | 132,333 | 45,000 | (9) | - | - | - | - | - | 177,333 | ||||||||||||||||||||||||
| COO | 2014 | 34,000 | 29,000 | (10) | - | - | - | - | - | 63,000 | ||||||||||||||||||||||||
|
(1)
|
The $36,000 cash portion of his compensation for the year ended December 31, 2014 was deferred and paid during the year ended December 31, 2015.
|
|
(2)
|
In August 2015, the Board approved the issuance of 225,000 shares of common stock valued at $101,250 as a bonus.
|
|
(3)
|
In February 2014, he was issued 78,125 shares of Common Stock as consideration for payment of $25,000 in accrued compensation as of December 31, 2013.
|
|
(4)
|
On February 11, 2014, the Board of Directors approved the grant of 3,000,000 stock warrants to the CEO as executive compensation. The warrants have a term of five years and vest as follows: 1,000,000 warrants vested upon issuance; 1,000,000 warrants vested as of February 11, 2015, and 1,000,000 warrants will vest as of February 11, 2016. The exercise price of the warrants is $0.30 per share based on the closing price of the Company’s common stock on the grant date of $0.32. The Company utilized the Black-Scholes method to fair value the 3,000,000 warrants received by Dr. Shane totaling approximately $952,000 with the following assumptions: volatility, 233%; expected dividend yield, 0%; risk free interest rate, 1.54%; and a life of 5 years. The grant date fair value of each warrant was $0.32. The Company recognized equity based compensation for the CEO for approximately $317,268 and $596,291 on the vested warrants and accrual of unvested warrants for the years ended December 31, 2015 and 2014, respectively.
|
|
(5)
|
The CEO’s prior employment agreement provided for a $20,000 annual salary plus incentive bonuses for the year ended December 31, 2013. The $20,000 cash portion of his salary was deferred in 2013 and paid in 2014. This amount does not reflect such payment.
|
|
(6)
|
The CFO’s current agreement provides for a base annual salary of $132,000. In August 2015, the Board approved the issuance of 62,000 shares of Common Stock valued at $27,900 as a bonus to Mr. Jennings.
|
|
(7)
|
The CFO’s prior employment agreement with the Company provided for a monthly salary of $5,000 to be paid in the form of cash and $2,000 per month to be paid in Common Stock. As part of Mr. Jennings’ agreement, warrants to purchase 300,000 shares of Common Stock were issued with a term of five years vesting 100,000 upon the grant date, 100,000 on October 1, 2015 and 100,000 on October 1, 2016. The exercise price of the warrant is $0.30 per share based on the volume weighted average price of the Common Stock for the five days prior to the grant date. They were valued at $89,000 using the Black Scholes model using the following assumptions: volatility - 221%; divided yield - 0%; discount rate – 1.80% and a life of 5 years. In connection with this transaction the Company recognized approximately $29,612 and $37,015 in compensation charges on the vested warrants and accrual of unvested warrants for the years ended December 31, 2015 and 2014, respectively.
|
32
|
(8)
|
Christopher Chipman, the former CFO of the Company, was paid a fee for his services in the amount of $60,000 for the year ended December 31, 2014. In addition, he was issued 300,000 common stock warrants for services. The warrants had an exercise price of $.30 per share and have a 5 year term. They were valued at $95,000 using the Black Scholes model using the following assumptions: volatility - 233%; divided yield - 0%; discount rate – 1.54% and a life of 5 years. In connection with the issuance of these warrants, the Company recorded compensation expense of approximately $32,000 in the year ended December 31, 2014. Effective July 18, 2014, Chris Chipman resigned from his position as CFO of the Company and the above mentioned warrants expired prior to December 31, 2014.
|
|
(9)
|
In August 2015, the Board approved the issuance of 100,000 shares of Common Stock valued at $45,000 as a bonus to Mr. Gearhart.
|
|
(10)
|
Mr. Gearhart received a signing bonus of 100,000 shares of Common Stock valued at $29,000 in connection with the commencement of his employment.
|
Employment Agreements
We have entered into employment agreements with each of the named executive officers and generally include the named executive officer’s initial base salary and an indication of equity compensation opportunities.
Halden S. Shane
We entered into an employment agreement with Halden S. Shane, our Chief Executive Officer, on January 1, 2014. The term of the employment agreement extended through December 31, 2016 with automatic renewal for successive one-year periods unless otherwise terminated by either party thereunder. Dr. Shane’s annual base salary was $36,000, which would have increased to $120,000 upon the Company exceeding gross revenues of $5,000,000 on a calendar year basis and to $175,000 upon the Company exceeding gross revenues of $10,000,000 on a calendar year basis. Dr. Shane also received a grant of 3,000,000 warrants to purchase shares of the Company’s common stock at a price of $0.30 per share which have a term of five years and vest upon the following schedule: 1,000,000 vested upon issuance, 1,000,000 vested on February 11, 2015, and 1,000,000 will vest as of February 11, 2016. Dr. Shane’s employment agreement included restrictive covenants of non-solicitation and confidentiality of proprietary information. Under the employment agreement, Dr. Shane assigned any and all of his rights to Company proprietary information to the Company and agreed that all property created by him during and in connection with his employment constitutes “works for hire” as defined in the United States Copyright Act.
In January of 2016, the Company entered into a new employment agreement with its CEO. The agreement provides for a base annual salary of $360,000. The agreement also provides for the quarterly issuance of 250,000 options to purchase the Company’s common stock in 2016 with an exercise price equal to the three day trailing VWAP of the stock. The previous agreement between the Company and CEO provided for an annual salary increase in the amount of $120,000 upon the Company exceeding gross revenues of $5,000,000 on a calendar year basis and to $175,000 upon the Company exceeding gross revenues of $10,000,000 on Calendar year which does not exist in the new agreement.
33
Nick Jennings
We entered into an employment agreement with Nick Jennings, our Chief Financial Officer, on September 30, 2014 to provide part-time services. The term of the employment agreement was through December 31, 2014 with a review of employment in January 2015. Mr. Jennings’ salary was $5,000 per month in cash and $2,000 in Common Stock per month, paid quarterly. Mr. Jennings also received a 5-year warrant to purchase up to 300,000 shares of Common Stock at a price per share equal to $0.30 and vests upon the following schedule: 100,000 vested upon issuance, 100,000 vested on October 1, 2015, and 100,000 will vest as of October 1, 2016. In connection with the employment agreement, Mr. Jennings entered into agreements that included restrictive covenants of non-solicitation and confidentiality of proprietary information.
On September 2, 2015, we entered into a new employment agreement with Mr. Jennings, which superseded his prior agreement, pursuant to which he will continue to serve as our Chief Financial Officer. Mr. Jennings’ annual salary is $132,000 which is reviewed each year. Mr. Jennings will also receive a 5-year warrant to purchase up to 100,000 shares of Common Stock at a price per share equal to the preceding 5-day volume weighted average share price and will fully vest at the time of issuance, which was on January 26, 2016. Mr. Jennings is also entitled to additional equity compensation based upon superior performance of his responsibilities, as determined by the Board, in its sole discretion.
Norris Gearhart
On October 16, 2014, we entered into an employment agreement with Norris Gearhart pursuant to which he agreed to serve as the Company’s Chief Operating Officer. Mr. Gearhart’s salary was $126,000 per annum paid bi-monthly. Additionally, Mr. Gearhart received 100,000 shares of Common Stock upon signing his agreement, a monthly transportation expense up to $500 towards a vehicle and the ability to receive an additional cash or equity bonus upon the achievement of pre-agreed performance objectives.
On September 2, 2015, we entered into a new employment agreement with Mr. Gearhart, which superseded his prior agreement, pursuant to which he will continue to serve as our Chief Operating Officer. Mr. Gearhart’s annual salary is $145,000 which is reviewed each at the end of the second anniversary. Mr. Gearhart will receive annual grants of stock options to purchase up to 250,000 shares of Common Stock at an exercise price equal to the volume weighted average price of the five-day period prior to the close of the year. Mr. Gearhart is also entitled to additional equity compensation based upon superior performance of his responsibilities, as determined by the Board, in its sole discretion.
Outstanding Equity Awards at Fiscal Year-End
The following table sets forth certain information with respect to outstanding warrants to purchase Common Stock previously awarded to the Company’s named executive officers as of December 31, 2015.
| Option Award |
Stock Award
|
||||||||||||||||||||||||||||||||
|
Name
|
Number of Securities Underlying Unexercised Warrants/ Options Exercisable
|
Number of Securities Underlying Unexercised Warrants/ Options Unexercisable
|
Equity Incentive Plan Awards: Number of Securities Underlying Unexercised Unearned Warrants
|
Warrant Exercise Price ($)
|
Warrant Expiration Date
|
Number of Shares or Units of Stock That Have Not Vested #
|
Market Value of Shares or Units of Stock That Have Not Vested ($)
|
Equity Incentive Plan Awards: Number of Unearned Shares, Units or Other Rights That Have Not Vested (#)
|
Equity Incentive Plan Awards: Market or Payout Value of Unearned Shares, Units or Other Rights That Have Not Vested ($)
|
||||||||||||||||||||||||
|
Halden. S. Shane
|
3,500,000 | - | - | $ | 0.30 | 10/15/2017 | - | - | - | - | |||||||||||||||||||||||
|
Halden. S. Shane
|
2,000,000 | 1,000,000 | - | $ | 0.30 |
2/11/2019*
|
- | - | - | - | |||||||||||||||||||||||
|
Nick Jennings
|
200,000 | 100,000 | - | $ | 0.30 |
10/1/2019*
|
- | - | - | - | |||||||||||||||||||||||
|
|
|
||||||||||||||||||||||||||||||||
|
Norris Gearhart
|
- | - | - | - |
-
|
- | - | - | - | ||||||||||||||||||||||||
*The above traunches of warrants expire from 2019 through 2021
34
Director Compensation
|
Name
|
Fees earned or paid in cash
($)
|
Stock awards
($)
|
Option awards
($)
|
Non-equity incentive plan compensation
($)
|
Nonqualified deferred
compensation earnings
($)
|
All other compensation
($)
|
Total
($)
|
|||||||||||||||||||||||
| Harold W. Paul | 2015 | - | - | 5,399 | (1) | - | - | - | 5,399 | |||||||||||||||||||||
| 2014 | - | - | 8,723 | (2) | - | - | - | 8,723 | ||||||||||||||||||||||
| Joe Plascencia (3) | 2015 | - | - | 5,399 | (3) | - | - | - | 5,399 | |||||||||||||||||||||
| 2014 | - | - | - | - | - | - | - | |||||||||||||||||||||||
| Walter Johnsen (4) | 2015 | - | - | - | - | - | - | - | ||||||||||||||||||||||
| 2014 | - | - | - | - | - | - | - | |||||||||||||||||||||||
| Kelly Anderson (5) | 2015 | - | - | - | - | - | - | - | ||||||||||||||||||||||
| 2014 | - | - | - | - | - | - | - | |||||||||||||||||||||||
| Edward Fred (6) | 2015 | - | - | - | - | - | - | - | ||||||||||||||||||||||
| 2014 | - | - | - | - | - | - | - | |||||||||||||||||||||||
|
(1)
|
The Company issued 20,000 options valued at $5,399 to Harold Paul in January 2015. The options have an exercise price of $0.27 per share. The options expire in January 2025. The options were valued using the Black-Scholes model using the following assumptions: volatility: 237%; dividend yield: 0%; zero coupon rate: 1.61%; and a life of 10 years.
|
|
(2)
|
The Company issued 20,000 options valued at $8,723 to Harold Paul in January 2014. The options have an exercise price of $0.44 per share. The options expire in January 2024. The options were valued using the Black-Scholes model using the following assumptions: volatility: 233%; dividend yield: 0%; zero coupon rate: 1.72%; and a life of 10 years.
|
|
(3)
|
The Company issued 20,000 options valued at $5,399 to Joe Plascencia in January 2015. The options have an exercise price of $0.27 per share. The options expire in January 2025. The options were valued using the Black-Scholes model using the following assumptions: volatility: 237%; dividend yield: 0%; zero coupon rate: 1.61%; and a life of 10 years. Mr. Plascencia resigned as a member of the Board on December 1, 2015.
|
|
(4)
|
Mr. Walter Johnsen was elected to the Company’s Board of Directors on January 29, 2016. The term of his agreement as director commenced on February 1, 2016 for 1 year and until a successor is elected, or resignation or removal. The agreement between the Company and Mr. Johnsen provides for an annual fee in the amount of $25,000 paid on a quarterly basis and an annual grant of 25,000 options to purchase shares of the Company’s common stock. The Company issued 25,000 options to Mr. Johnsen in February of 2016. The options have an exercise price of $0.55 per share and expire in January 2026.
|
|
(5)
|
Ms. Kelly Anderson was elected to the Company’s Board of Directors on January 29, 2016 and will serve as the chair of the Company’s Audit Committee. The term of her agreement as director commenced on February 1, 2016 for 1 year and until a successor is elected, or resignation or removal. The agreement between the Company and Ms. Anderson provides for an annual fee in the amount of $26,000 paid on a quarterly basis and an annual grant of 25,000 options to purchase shares of the Company’s common stock. The Company issued 25,000 options to Ms. Anderson in February of 2016. The options have an exercise price of $0.55 per share and expire in January 2026.
|
|
(6)
|
Mr. Edward Fred was elected to the Company’s Board of Directors on January 29, 2016. The term of his agreement as director commenced on February 1, 2016 for 1 year and until a successor is elected, or resignation or removal. The agreement between the Company and Mr. Fred provides for an annual fee in the amount of $25,000 paid on a quarterly basis and an annual grant of 25,000 options to purchase shares of the Company’s common stock. The Company issued 25,000 options to Mr. Fred in February of 2016. The options have an exercise price of $0.55 per share and expire in January 2026.
|
35
|
|
Item 12. SECURITY OWNERSHIP OF CERTAIN BENEFICIAL OWNERS AND MANAGEMENT AND RELATED STOCKHOLDER MATTERS
|
Securities Under Equity Compensation Plans
The Board of Directors adopted the 2008 Stock Option Plan that was approved by shareholders on May 13, 2009 and authorized the issuance of up to 2,500,000 shares under the Plan.
In January 2011 and January 2012, Willie L. Brown, Jr.-a former director-and Harold W. Paul were issued 20,000 options each. In January 2013 and 2014, Mr. Paul was issued 20,000 options. In January of 2015, Mr. Paul and Joe Plascencia-a former director were issued 20,000 options each.
Beneficial Ownership
The following table sets forth certain information with respect to the beneficial ownership of our Voting Stock as of March 24, 2016, for:
|
●
|
each stockholder known by us to be the beneficial owner of more than 5% of our outstanding shares of Common stock or Series A Preferred Stock;
|
|
●
|
each of our directors;
|
|
●
|
each of our named executive officers; and
|
|
●
|
all of our directors and executive officers as a group.
|
We have determined beneficial ownership in accordance with the rules of the SEC.Except as indicated by the footnotes below, we believe, based on the information furnished to us, that the persons and entities named in the following table have sole voting and investment power with respect to all shares of Voting Stock that they beneficially own, subject to applicable community property laws.
Applicable percentage ownership is based on 120,338,596 shares of Common Stock and 510,000 shares of Series A Preferred Stock outstanding at March 24, 2016. In computing the number of shares of Voting Stock beneficially owned by a person and the percentage ownership of that person, we deemed to be outstanding all shares of Voting Stock subject to options or other convertible securities held by that person or entity that are currently exercisable or releasable or that will become exercisable or releasable within 60 days of March 24, 2016. We did not deem these shares outstanding, however, for the purpose of computing the percentage ownership of any other person. Except as otherwise noted, the address of each person or entity in the following table is c/o TOMI Environmental Solutions, Inc., 9454 Wilshire Blvd., Penthouse, Beverly Hills, CA 90212.
|
Shares Beneficially Owned
|
% of Total | |||||||||||||||||||
|
Common Stock
|
Series A Preferred Stock
|
Voting | ||||||||||||||||||
|
Shares
|
%
|
Shares
|
%
|
Power(1)
|
||||||||||||||||
|
Named Executive Officers and Directors:
|
||||||||||||||||||||
|
Halden S. Shane, CEO and Chairman of the Board
|
26,770,048 | (2) | 21.1 | 510,000 | 100 | 21.4 | ||||||||||||||
|
Harold W. Paul, Director
|
1,254,774 | (3) | 1.0 | - | - | 1.0 | ||||||||||||||
|
Walter Johnsen, Director
|
25,000 | (4) | * | - | - | * | ||||||||||||||
|
Kelly Anderson, Director
|
25,000 | (5) | * | - | - | * | ||||||||||||||
|
Edward Fred, Director
|
100,000 | (6) | * | - | - | * | ||||||||||||||
|
Norris Gearhart, Chief Operating Officer
|
230,000 | * | - | - | * | |||||||||||||||
|
Nick Jennings, Chief Financial Officer
|
412,145 | (7) | * | - | - | * | ||||||||||||||
|
All current directors and executive officers as a group (7 persons)
|
28,816,967 | (8) | 22.7 | 510,000 | 23.0 | |||||||||||||||
|
Other 5% Stockholders:
|
||||||||||||||||||||
|
Arise Asset Management Pte Ltd.
|
17,361,111 | (9) | 14.4 | 14.4 | ||||||||||||||||
|
Ah Kee Wee
|
7,655,556 | (10) | 6.4 | 6.4 | ||||||||||||||||
* Denotes ownership of less than 1%
(1) Percentage of total voting power represents voting power with respect to all shares of our Common Stock and Series A Preferred Stock, as a single class. The holders of Common Stock and Series A Preferred Stock are each entitled to one vote per share.
(2) Consists of (i) 18,770,048 shares of Common Stock held of record by Dr. Shane, (ii) 500,000 shares of Common Stock held of record by the Shane Family Trust, (iii) 1,000,000 shares of Common Stock held of record by Belinha Shane and (iv) 6,500,000 Shares of Common Stock issuable upon the exercise of warrants to purchase Common Stock held by Dr. Shane. . Dr. Shane is a co-trustee of the Shane Family Trust and may be deemed to share voting and investment power over the securities held by the trust. Belinha Shane is Dr. Shane’s wife. Dr. Shane disclaims ownership of such shares held by his wife, except to the extent of his pecuniary interest.
36
(3) Consists of (i) 1,189,774 shares of Common Stock held of record by Mr. Paul and (ii) 65,000 shares of Common Stock issuable upon exercise of stock options.
(4) Consists of 25,000 shares of Common Stock issuable upon exercise of stock options.
(5) Consists of 25,000 shares of Common Stock issuable upon exercise of stock options.
(6) Consists of (i) 75,000 shares of Common Stock held of record by Mr. Fred and (ii) 25,000 shares of Common Stock issuable upon exercise of stock options.
(7) Consists of (i) 112,145 shares of Common Stock held of record by Mr. Jennings and (ii) 300,000 shares of Common Stock issuable upon the exercise of warrants to purchase Common Stock held by Mr. Jennings. This amount does not include 100,000 shares of Common Stock issuable upon exercise of warrants which are not currently, or within 60 days of March 24, 2016, exercisable.
(8) Consists of (i) 21,801,967 shares of Common Stock, (ii) 6,700,000 shares of Common Stock issuable upon the exercise of warrants to purchase Common Stock and (iii) 10,000 shares of Common Stock issuable upon exercise of stock options. This amount does not include 1,100,000 shares of Common Stock issuable upon exercise of warrants to purchase Common Stock which are not currently, or within 60 days of March 24, 2016, exercisable.
(9) Based on information reported by Arise Asset Management Pte Ltd on Schedule 13D/A filed with the SEC on July 20, 2015. Of the shares of Common Stock beneficially owned, Arise Asset Management Pte Ltd reported that it has sole dispositive power and sole voting power with respect to 17,361,111 shares of Common Stock.
(10) Based on information reported by Mr. Wee to the Company. Consists of (i) 4,655,556 shares of Common Stock and (ii) 3,000,000 shares of Common Stock issuable upon the exercise of warrants to purchase Common Stock held by Mr. Wee.
|
|
Item 13. CERTAIN RELATIONSHIPS AND RELATED TRANSACTIONS, AND DIRECTOR INDEPENDENCE
|
Transactions with Related Parties
None
37
Item 14. PRINCIPAL ACCOUNTANT FEES AND SERVICES
Accountant Fees
The following table presents the aggregate fees billed for each of the last two fiscal years by our independent registered public accounting firm Wolinetz, Lafazan & Company, P.C., Certified Public Accountants, in connection with the audit of our financial statements and other professional services rendered by that accounting firm:
|
December 31,
2015
|
December 31,
2014
|
|||||||
|
Audit fees
|
$ | 84,000 | $ | 77,000 | ||||
|
Audit-related fees
|
- | - | ||||||
|
Tax fees
|
- | - | ||||||
|
All other fees
|
- | - | ||||||
|
Total
|
$ | 84,000 | $ | 77,000 | ||||
Audit fees represent the professional services rendered for the audit of our annual financial statements and the review of our financial statements included in quarterly reports, along with services normally provided by the accounting firm in connection with statutory and regulatory filings or engagements. Audit-related fees represent professional services rendered for assurance and related services by the accounting firm that are reasonably related to the performance of the audit or review of our financial statements that are not reported under audit fees.
Tax fees represent professional services rendered by the accounting firm for tax compliance, tax advice, and tax planning. All other fees represent fees billed for products and services provided by the accounting firm other than the services reported for the other categories.
Pre-approval Policies
Our audit committee evaluates and approves the scope, cost and engagement of an auditor and has done so this year. The Company does not otherwise rely on pre- approval policies and procedures.
38
PART IV
|
Item 15.
|
EXHIBITS AND FINANCIAL STATEMENT SCHEDULES
|
(a) Documents filed as part of this report:
(1) The following financial statements of the Company are included in Part II, Item 8 of this Annual Report on Form 10-K:
|
|
●
|
Report of Independent Registered Public Accounting Firm, Wolinetz, Lafazan & Company, P.C.;
|
|
|
● |
Consolidated Balance Sheets as of December 31, 2015 and December 31, 2014;
|
|
|
●
|
Consolidated Statements of Operations: For the Years Ended December 31, 2015 and December 31, 2015;
|
|
|
●
|
Consolidated Statements of Stockholders’ Equity (Deficiency): For the Years Ended December 31, 2015 and December 31, 2014;
|
|
|
●
|
Consolidated Statements of Cash Flows: For the Years Ended December 31, 2015 and December 31, 2014; and
|
|
|
●
|
Notes to Consolidated Financial Statements.
|
|
|
(2) Schedules to financial statements:
|
All financial statement schedules have been omitted because they are either inapplicable or the information required is provided in the Company’s Consolidated Financial Statements and Notes thereto, included in Part II, Item 8 of this Annual Report on Form 10-K.
|
|
(3) The exhibits listed on the accompanying Exhibit Index are filed as part of this Annual Report on Form 10-K.
|
39
SIGNATURES
Pursuant to the requirements of Section 13 or 15(d) of the Securities Exchange Act of 1934, the registrant has duly caused this report to be signed on its behalf by the undersigned, thereunto duly authorized.
|
TOMI ENVIRONMENTAL SOLUTIONS, INC.
|
|||
|
DATED: March 30, 2016
|
By:
|
/s/ HALDEN S. SHANE | |
|
Halden S Shane
|
|||
|
Chairman of the Board and Chief Executive Officer
(Principal Executive Officer)
|
|||
|
Signature
|
Title
|
Date
|
||
|
/s/ HALDEN S. SHANE
|
Chairman of the Board and Chief Executive Officer (Principal Executive Officer)
|
March 30, 2016
|
||
|
Halden S. Shane
|
||||
|
/s/ NICK JENNINGS
|
Chief Financial Officer (Principal Financial Officer and Principal Accounting Officer)
|
March 30, 2016
|
||
|
Nick Jennings
|
||||
|
/s/ HAROLD W. PAUL
|
Director
|
March 30, 2016
|
||
|
Harold W. Paul
|
||||
|
/s/ WALTER C. JOHNSEN
|
Director
|
March 30, 2016
|
||
|
Walter C. Johnsen
|
||||
|
/s/KELLY J. ANDERSON
|
Director
|
March 30, 2016
|
||
|
Kelly J. Anderson
|
||||
|
/s/ EDWARD J. FRED
|
Director
|
March 30, 2016
|
||
|
Edward J. Fred
|
Pursuant to the requirements of the Securities Exchange Act of 1934, this report has been signed below by the following persons on behalf of the registrant and in the capacities and on the dates indicated.
40
EXHIBIT INDEX
|
Exhibit
Number
|
Description
|
|
31.1
|
Certification of the Principal Executive Officer, as required by Rule 13a-14(a) of the Securities Exchange Act of 1934
|
|
31.2
|
Certification of the Principal Financial Officer, as required by Rule 13a-14(a) of the Securities Exchange Act of 1934
|
|
32.1
|
Certifications of the Principal Executive Officer provided pursuant to 18 U.S.C. Section 1350 as adopted pursuant to Section 906 of the Sarbanes-Oxley Act of 2002
|
|
32.2
|
Certifications of the Principal Financial Officer provided pursuant to 18 U.S.C. Section 1350 as adopted pursuant to Section 906 of the Sarbanes-Oxley Act of 2002
|
41
TOMI ENVIRONMENTAL SOLUTIONS, INC.
INDEX TO CONSOLIDATED FINANCIAL STATEMENTS
|
Page
|
|
|
Report of Independent Registered Public Accounting Firm.
|
F-2
|
|
Consolidated Balance Sheets as of December 31, 2015 and 2014
|
F-3
|
|
Consolidated Statements of Operations for the Years Ended December 31, 2015 and 2014
|
F-4
|
|
Consolidated Statements of Stockholders’ Equity (Deficiency) for the Years Ended December 31, 2015 and 2014
|
F-5
|
|
Consolidated Statements of Cash Flows for the Years Ended December 31, 2015 and 2014
|
F-6
|
|
Notes to Consolidated Financial Statements
|
F-8
|
F-1
REPORT OF INDEPENDENT REGISTERED PUBLIC ACCOUNTING FIRM
Board of Directors and Stockholders
TOMI Environmental Solutions, Inc. (A Florida Corporation)
We have audited the accompanying consolidated balance sheets of TOMI Environmental Solutions, Inc. and Subsidiaries ("the Company") as of December 31, 2015 and 2014 and the related consolidated statements of operations, stockholders' equity (deficiency) and cash flows for each of the two years in the period ended December 31, 2015. These financial statements are the responsibility of the Company's management. Our responsibility is to express an opinion on these financial statements based on our audits.
We conducted our audits in accordance with the standards of the Public Company Accounting Oversight Board (United States). Those standards require that we plan and perform the audit to obtain reasonable assurance about whether the financial statements are free of material misstatement. The Company is not required to have, nor were we engaged to perform, an audit of its internal control over financial reporting. Our audits included consideration of internal control over financial reporting as a basis for designing audit procedures that are appropriate in the circumstances, but not for the purpose of expressing an opinion on the effectiveness of the Company's internal control over financial reporting. Accordingly, we express no such opinion. Also, an audit includes examining, on a test basis, evidence supporting the amounts and disclosures in the financial statements, assessing the accounting principles used and significant estimates made by management, as well as evaluating the overall financial statement presentation. We believe that our audits provide a reasonable basis for our opinion.
In our opinion, the financial statements referred to above present fairly, in all material respects, the financial position of TOMI Environmental Solutions, Inc. and Subsidiaries at December 31, 2015 and 2014, and the results of their operations and their cash flows for each of the two years in the period ended December 31, 2015 in conformity with accounting principles generally accepted in the United States of America.
WOLINETZ, LAFAZAN & COMPANY, P.C.
Rockville Centre, New York
March 30, 2016
F-2
|
TOMI ENVIRONMENTAL SOLUTIONS, INC.
|
||||||||
|
CONSOLIDATED BALANCE SHEET
|
||||||||
|
ASSETS
|
||||||||
|
Current Assets:
|
||||||||
|
December 31, 2015
|
December 31, 2014
|
|||||||
|
Cash and Cash Equivalents
|
$ | 5,916,068 | $ | 160,560 | ||||
|
Cash – Restricted (Note 6)
|
- | 105,776 | ||||||
|
Accounts Receivable - net
|
1,414,576 | 441,153 | ||||||
|
Inventories (Note 3)
|
1,395,175 | 772,833 | ||||||
|
Deposits on Merchandise (Note 11)
|
442,358 | - | ||||||
|
Prepaid Expenses
|
76,730 | 35,404 | ||||||
|
Other Assets
|
36,613 | 36,644 | ||||||
|
Deferred Financing Costs – net (Note 6)
|
- | 199,625 | ||||||
|
Total Current Assets
|
9,281,519 | 1,751,995 | ||||||
|
Property and Equipment – net (Note 4)
|
250,264 | 288,159 | ||||||
|
Other Assets:
|
||||||||
|
Intangible Assets – net (Note 5)
|
2,287,548 | 2,657,056 | ||||||
|
Security Deposits
|
4,700 | 6,552 | ||||||
|
Total Other Assets
|
2,292,248 | 2,663,608 | ||||||
|
Total Assets
|
$ | 11,824,031 | $ | 4,703,762 | ||||
| LIABILITIES AND STOCKHOLDERS’ EQUITY | ||||||||
|
Current Liabilities:
|
||||||||
|
Accounts Payable and Accrued Expenses
|
$ | 1,087,978 | $ | 448,063 | ||||
|
Accrued Interest on Convertible Notes (Note 6)
|
- | 211,417 | ||||||
|
Accrued Officers Compensation (Note 9)
|
- | 41,000 | ||||||
|
Common Stock to be Issued (Note 13)
|
52,721 | 35,925 | ||||||
|
Customer Deposits
|
35,111 | 19,716 | ||||||
|
Deferred Rent
|
14,745 | 15,236 | ||||||
|
Advances on Grant (Note 11)
|
210,503 | - | ||||||
|
Derivative Liability (Note 7)
|
- | 1,728,883 | ||||||
|
Convertible Notes Payable, net of discount at December 31, 2014 of $3,996,033 (Note 6)
|
- | 1,077,967 | ||||||
|
Total Current Liabilities
|
1,401,057 | 3,578,207 | ||||||
|
Total Liabilities
|
1,401,057 | 3,578,207 | ||||||
|
Commitments and Contingencies
|
||||||||
|
Stockholders’ Equity:
|
||||||||
|
Cumulative Convertible Series A Preferred Stock;
|
||||||||
|
par value $0.01, 1,000,000 shares authorized; 510,000 shares issued
|
||||||||
|
and outstanding at December 31, 2015 and December 31, 2014
|
5,100 | 5,100 | ||||||
|
Cumulative Convertible Series B Preferred Stock; $1,000 stated value;
|
||||||||
|
7.5% Cumulative dividend; 4,000 shares authorized; none issued
|
||||||||
|
and outstanding at December 31, 2015 and December 31, 2014
|
- | - | ||||||
|
Common stock; par value $0.01, 200,000,000 shares authorized;
|
||||||||
|
120,063,180 and 83,646,275 shares issued and outstanding
|
||||||||
|
at December 31, 2015 and December 31, 2014, respectively.
|
1,200,632 | 836,463 | ||||||
|
Additional Paid-In Capital
|
40,391,216 | 19,281,647 | ||||||
|
Accumulated Deficit
|
(31,173,973 | ) | (18,997,655 | ) | ||||
|
Total Stockholders’ Equity
|
10,422,974 | 1,125,555 | ||||||
|
Total Liabilities and Stockholders’ Equity
|
$ | 11,824,031 | $ | 4,703,762 | ||||
|
The accompanying notes are an integral part of the financial statements.
|
||||||||
F-3
|
TOMI ENVIRONMENTAL SOLUTIONS, INC.
|
||||||||
|
CONSOLIDATED STATEMENT OF OPERATIONS
|
||||||||
|
For The Year Ended
|
||||||||
|
December 31,
|
||||||||
|
2015
|
2014
|
|||||||
|
Sales, net
|
$ | 4,191,783 | $ | 2,248,341 | ||||
|
Cost of Sales
|
1,644,039 | 873,990 | ||||||
|
Gross profit
|
2,547,744 | 1,374,351 | ||||||
|
Operating Expenses:
|
||||||||
|
Professional Fees
|
455,626 | 349,546 | ||||||
|
Depreciation and Amortization
|
499,344 | 470,327 | ||||||
|
Selling Expenses
|
704,069 | 380,303 | ||||||
|
Research and Development (Note 2)
|
100,321 | 155,984 | ||||||
|
Consulting Fees
|
476,513 | 179,809 | ||||||
|
Equity Compensation Expense (Note 8)
|
1,706,393 | 2,564,707 | ||||||
|
General and Administrative
|
1,591,102 | 1,083,885 | ||||||
|
Total Operating Expenses
|
5,533,368 | 5,184,561 | ||||||
|
Loss from Operations
|
(2,985,624 | ) | (3,810,210 | ) | ||||
|
Other Income (Expense):
|
||||||||
|
Amortization of Deferred Financing Costs
|
(199,625 | ) | (342,492 | ) | ||||
|
Amortization of Debt Discounts
|
(3,996,033 | ) | (1,007,525 | ) | ||||
|
Fair Value Adjustment of Derivative Liability
|
(3,810,955 | ) | 5,936,619 | |||||
|
Induced Conversion Costs
|
(930,383 | ) | - | |||||
|
Interest Expense
|
(253,700 | ) | (507,956 | ) | ||||
|
Total Other Income (Expense)
|
(9,190,695 | ) | 4,078,646 | |||||
|
Net Income (Loss)
|
$ | (12,176,319 | ) | $ | 268,436 | |||
|
Income (Loss) Per Common Share
|
||||||||
|
Basic
|
$ | (0.12 | ) | $ | 0.00 | |||
|
Diluted
|
$ | (0.12 | ) | $ | 0.00 | |||
|
Basic Weighted Average Common Shares Outstanding
|
102,840,185 | 81,281,030 | ||||||
|
Diluted Weighted Average Common Shares Outstanding
|
102,840,185 | 127,398,990 | ||||||
|
The accompanying notes are an integral part of the financial statements.
|
||||||||
F-4
|
TOMI ENVIRONMENTAL SOLUTIONS, INC.
|
|
CONSOLIDATED STATEMENT OF STOCKHOLDERS’ EQUITY (DEFICIENCY)
FOR THE YEARS ENDED DECEMBER 31, 2015 AND 2014
|
|
Series A Preferred
|
Common Stock
|
|||||||||||||||||||||||||||
|
Shares
|
Amount
|
Shares
|
Amount
|
Additional Paid
|
Accumulated
|
Total Stockholders’
|
||||||||||||||||||||||
|
in Capital
|
Deficit
|
Equity (Deficiency)
|
||||||||||||||||||||||||||
|
Balance at December 31, 2013
|
510,000 | $ | 5,100 | 79,867,217 | $ | 798,672 | $ | 15,674,958 | $ | (19,266,090 | ) | $ | (2,787,360 | ) | ||||||||||||||
|
Options and Warrants Issued to Executives for Services
|
2,564,707 | 2,564,707 | ||||||||||||||||||||||||||
|
Common stock issued for services provided
|
901,580 | 9,016 | 340,827 | 349,843 | ||||||||||||||||||||||||
|
Common stock issued for executive compensation
|
178,125 | 1,781 | 52,219 | 54,000 | ||||||||||||||||||||||||
|
Exercise of stock options as payment for legal services
|
20,000 | 200 | (200 | ) | - | |||||||||||||||||||||||
|
Proceeds from issuance of common stock, net
|
377,778 | 3,778 | 95,162 | 98,940 | ||||||||||||||||||||||||
|
Proceeds from issuance of common stock and warrants, net
|
2,290,243 | 22,902 | 574,013 | 596,915 | ||||||||||||||||||||||||
|
Issuance of common stock as finder’s fee
|
11,332 | 113 | (113 | ) | - | |||||||||||||||||||||||
|
Value of common stock to be issued as finder’s fee
|
(19,925 | ) | (19,925 | ) | ||||||||||||||||||||||||
|
Net Income for the year ended December 31, 2014
|
268,435 | 268,435 | ||||||||||||||||||||||||||
|
Balance at December 31, 2014
|
510,000 | $ | 5,100 | 83,646,275 | $ | 836,462 | $ | 19,281,647 | $ | (18,997,655 | ) | $ | 1,125,555 | |||||||||||||||
|
Options and Warrants Issued to Executives for Services
|
1,706,393 | 1,706,393 | ||||||||||||||||||||||||||
|
Common stock issued for services provided
|
1,319,679 | 13,197 | 542,472 | 555,668 | ||||||||||||||||||||||||
|
Common stock issued for officer compensation
|
437,145 | 4,371 | 187,779 | 192,150 | ||||||||||||||||||||||||
|
Proceeds from issuance of common stock and warrants, net
|
1,760,002 | 17,600 | 441,614 | 459,214 | ||||||||||||||||||||||||
|
Proceeds from issuance of common stock
|
17,986,111 | 179,862 | 8,045,126 | 8,224,988 | ||||||||||||||||||||||||
|
Conversion of notes payable and accrued interest into common stock
|
14,913,968 | 149,140 | 3,748,776 | 3,897,916 | ||||||||||||||||||||||||
|
Induced conversion costs
|
912,883 | 912,883 | ||||||||||||||||||||||||||
|
Reclassification of derivative liability
|
5,539,838 | 5,539,838 | ||||||||||||||||||||||||||
|
Value of common stock to be issued as finder’s fee
|
(15,312 | ) | (15,312 | ) | ||||||||||||||||||||||||
|
Net Loss for the year ended December 31, 2015
|
(12,176,319 | ) | (12,176,319 | ) | ||||||||||||||||||||||||
|
Balance at December 31, 2015
|
510,000 | $ | 5,100 | 120,063,180 | $ | 1,200,632 | $ | 40,391,215 | $ | (31,173,974 | ) | $ | 10,422,975 | |||||||||||||||
|
The accompanying notes are an integral part of the financial statements.
|
||||||||||||||||||||||||||||
F-5
|
TOMI ENVIRONMENTAL SOLUTIONS, INC.
|
|
CONSOLIDATED STATEMENT OF CASH FLOWS
|
| For the Year ended December 31, | ||||||||
|
2015
|
2014
|
|||||||
|
Cash Flows From Operating Activities:
|
||||||||
|
Net Income (Loss)
|
$ | (12,176,319 | ) | $ | 268,435 | |||
|
Adjustments to Reconcile Net Income (Loss) to Net Cash
|
||||||||
|
Used in Operating Activities:
|
||||||||
|
Depreciation and Amortization
|
499,344 | 470,328 | ||||||
|
Amortization of Deferred Financing Costs
|
199,625 | 342,492 | ||||||
|
Amortization of Debt Discount
|
3,996,033 | 1,007,525 | ||||||
|
Fair Value Adjustment of Derivative Liability
|
3,810,955 | (5,936,619 | ) | |||||
|
Induced Conversion Costs
|
912,883 | - | ||||||
|
Equity Based Compensation
|
1,706,393 | 2,564,707 | ||||||
|
Value of equity issued for services
|
747,819 | 403,843 | ||||||
|
Reserve for Bad Debts
|
7,500 | 37,500 | ||||||
|
Changes in operating assets and liabilities:
|
||||||||
|
Decrease (increase) in:
|
||||||||
|
Accounts Receivable
|
(980,923 | ) | 327,156 | |||||
|
Inventory
|
(633,787 | ) | (508,200 | ) | ||||
|
Prepaid Expenses
|
(41,326 | ) | (27,424 | ) | ||||
|
Deposits on Merchandise
|
(442,358 | ) | - | |||||
|
Other Assets
|
31 | (36,644 | ) | |||||
|
Deposits
|
1,853 | (4,010 | ) | |||||
|
Increase (decrease) in:
|
||||||||
|
Accounts Payable and Accrued Expenses
|
639,914 | 61,655 | ||||||
|
Accrued Interest
|
(87,500 | ) | 222 | |||||
|
Accrued Officers Compensation
|
(41,000 | ) | 16,000 | |||||
|
Common Stock to Be Issued
|
1,484 | (134,872 | ) | |||||
|
Customer Deposits
|
15,394 | 5,611 | ||||||
|
Deferred Rent
|
(491 | ) | 15,236 | |||||
|
Advances on Grant
|
210,503 | - | ||||||
|
Net Cash Used In Operating Activities
|
(1,653,971 | ) | (1,127,059 | ) | ||||
|
Cash Flows From Investing Activities:
|
||||||||
|
Purchase of Property and Equipment
|
(80,496 | ) | (81,994 | ) | ||||
|
Net Cash Used in Investing Activities
|
(80,496 | ) | (81,994 | ) | ||||
|
The accompanying notes are an integral part of the financial statements.
|
||||||||
F-6
|
TOMI ENVIRONMENTAL SOLUTIONS, INC.
|
|
CONSOLIDATED STATEMENT OF CASH FLOWS - CONTINUED
|
|
For the Year ended December 31,
|
||||||||
|
2015
|
2014
|
|||||||
|
Cash flows from Financing Activities,
|
||||||||
|
Proceeds From Issuances of Common Stock and Warrants
|
$ | 8,735,200 | $ | 765,262 | ||||
|
Repayment of Principal Balance of Convertible Notes
|
(1,300,000 | ) | - | |||||
|
Decrease (Increase) in Bond Sinking Fund
|
105,776 | (35,653 | ) | |||||
|
Payment of Finder's Fee
|
(51,000 | ) | (66,347 | ) | ||||
|
Net Cash Provided by Financing Activities
|
7,489,976 | 663,262 | ||||||
|
Net Increase (Decrease) in Cash and Cash Equivalents
|
5,755,509 | (545,792 | ) | |||||
|
Cash and Cash Equivalents, beginning
|
160,560 | 706,350 | ||||||
|
Cash and Cash Equivalents, ending
|
$ | 5,916,069 | $ | 160,560 | ||||
|
Supplemental Cash Flow Information:
|
||||||||
|
Cash Paid For Interest
|
$ | 341,200 | $ | 507,956 | ||||
|
Cash Paid For Income Taxes
|
$ | - | $ | - | ||||
|
Non-Cash Investing and Finance Activities:
|
||||||||
|
Common Stock issued as payment of accrued interest
|
$ | 123,917 | $ | - | ||||
|
Reclassification of derivative liability to additional paid in capital
|
$ | 5,539,838 | $ | - | ||||
|
Reclassification of demo equipment
|
||||||||
|
from inventory to property and equipment
|
$ | 19,615 | $ | 142,916 | ||||
|
Cash Finder's Fee Accrual
|
$ | - | $ | 3,060 | ||||
|
Common Stock Finder's Fee Accrual
|
$ | 15,312 | $ | 19,925 | ||||
|
Reclassification of property and equipment, net to inventory
|
$ | 8,170 | $ | - | ||||
|
Issuance of common stock on conversion of convertible debt
|
$ | 3,774,000 | $ | - | ||||
The accompanying notes are an integral part of the financial statements.
F-7
TOMI ENVIRONMENTAL SOLUTIONS, INC.
NOTES TO CONSOLIDATED FINANCIAL STATEMENTS
NOTE 1. DESCRIPTION OF BUSINESS
TOMI Environmental Solutions is a leading provider of infection prevention and decontamination products and services, focused primarily on life sciences including healthcare, bio-safety, pharmaceutical, clean-room and research. Our mission is to help our customers create a healthier world thru TOMI’s product line. TOMI’s motto is “innovating for a safer world” for healthcare and life.
As a global decontamination and infectious disease control company, TOMI provides environmental solutions for indoor and outdoor surface decontamination through the sale of equipment, services and licensing of our SteraMistTM Binary Ionization Technology® (“BIT™”) which is a EPA registered hydrogen peroxide based mist and fog.
NOTE 2. SUMMARY OF SIGNIFICANT ACCOUNTING POLICIES
Principles of Consolidation
The accompanying consolidated financial statements include the accounts of TOMI Environmental Solutions, Inc. (a Florida Corporation) (TOMI-Florida), and its wholly-owned subsidiary, TOMI Environmental Solutions, Inc. (a Nevada Corporation) (TOMI-Nevada). The Company’s 55% owned subsidiary, TOMI Environmental-China (TOMI-China), has been dormant since its formation in April 2011. All significant intercompany accounts and transactions have been eliminated in consolidation.
Reclassification of Accounts
Certain reclassifications have been made to prior-year comparative financial statements to conform to the current year presentation. These reclassifications had no effect on previously reported results of operations or financial position.
Use of Estimates
The preparation of consolidated financial statements in conformity with U.S. GAAP requires us to make estimates and assumptions that affect the amounts reported and disclosed in the accompanying consolidated financial statements and the accompanying notes. Actual results could differ materially from these estimates. On an ongoing basis, we evaluate our estimates, including those related to accounts receivable, fair values of financial instruments, intangible assets, useful lives of intangible assets and property and equipment, fair values of stock-based awards, income taxes, and contingent liabilities, among others. We base our estimates on historical experience and on various other assumptions that are believed to be reasonable, the results of which form the basis for making judgments about the carrying values of our assets and liabilities.
Fair Value Measurements
The authoritative guidance for fair value measurements defines fair value as the exchange price that would be received for an asset or paid to transfer a liability (an exit price) in the principal or the most advantageous market for the asset or liability in an orderly transaction between market participants on the measurement date. Market participants are buyers and sellers in the principal market that are (i) independent, (ii) knowledgeable, (iii) able to transact, and (iv)willing to transact. The guidance describes a fair value hierarchy based on the levels of inputs, of which the first two are considered observable and the last unobservable, that may be used to measure fair value, which are the following:
|
Level 1:
|
Quoted prices in active markets for identical assets or liabilities.
|
|
|
Level 2:
|
Inputs other than Level 1 that are observable, either directly or indirectly, such as quoted prices for similar assets or liabilities; quoted prices in markets that are not active; or other inputs that are observable or corroborated by observable market data or substantially the full term of the assets or liabilities.
|
|
|
Level 3:
|
Unobservable inputs that are supported by little or no market activity and that are significant to the value of the assets or liabilities.
|
|
F-8
The Company’s financial instruments include cash and equivalents, accounts receivable, and accounts payable and accrued expenses. All these items were determined to be Level 1 fair value measurements.
The carrying amounts of cash and cash equivalents, accounts receivable, and accounts payable and accrued expenses approximated fair value because of the short maturity of these instruments. At December 31, 2014, the recorded value of convertible debt approximates its fair value as the terms and rates approximate market rates (See also Note 6).
Cash and Cash Equivalents
For purposes of the statement of cash flows, cash and cash equivalents includes cash on hand held at financial institutions and other liquid investments with original maturities of three months or less.
Accounts Receivable
Our accounts receivable are typically from credit worthy customers or, for international customers are supported by pre-payments. For those customers to whom we extend credit, we perform periodic evaluations of them and maintain allowances for potential credit losses as deemed necessary. We have a policy of reserving for uncollectible accounts based on our best estimate of the amount of probable credit losses in existing accounts receivable. We periodically review our accounts receivable to determine whether an allowance is necessary based on an analysis of past due accounts and other factors that may indicate that the realization of an account may be in doubt. Account balances deemed to be uncollectible are charged to the allowance after all means of collection have been exhausted and the potential for recovery is considered remote. Bad debt expense for the years ended December 31, 2015 and 2014 was $39,081 and $134,540, respectively.
At December 31, 2015 and 2014, the allowance for doubtful accounts was $45,000 and $37,500, respectively.
As of December 31, 2015, three customers accounted for 42% of net accounts receivable. Two customers accounted for 26% of net revenues for the year ended December 31, 2015.
Inventories
Inventories are valued at the lower of cost or market using the first-in, first-out (”FIFO”) method. Inventories consist primarily of finished goods and raw materials. At December 31, 2015 and 2014, we did not have a reserve for slow-moving or obsolete inventory.
Deposits on Merchandise
Deposits on merchandise primarily consist of amounts incurred or paid in advance of the receipt of inventory. (See note 11)
Property and Equipment
We account for property and equipment at cost less accumulated depreciation. We compute depreciation using the straight-line method over the estimated useful lives of the assets, generally three to five years. Depreciation for equipment, furniture and fixtures and vehicles commences once placed in service for its intended use. Leasehold improvements are amortized using the straight-line method over the lives of the respective leases or service lives of the improvements, whichever is shorter.
Deferred Financing Costs
The Company follows authoritative guidance for accounting for financing costs as it relates to convertible debt issuance cost. These costs are deferred and amortized over the term of the debt period or until redemption of the convertible debentures. Amortization of deferred financing costs amounted to approximately $200,000 and $342,000 for the year ended December 31, 2015 and 2014, respectively.
Accounts Payable
As of December 31, 2015 and December 31, 2014, one vendor accounted for approximately 72% and 44% of total accounts payable. One vendor accounted for 84% of cost of goods sold for the year ended December 31, 2015. One vendor accounted for 82% of cost of goods sold for the year ended December 31, 2014.
F-9
Accrued Warranties
Accrued warranties represent the estimated costs that will be incurred during the warranty period of our products. We make an estimate of expected costs that will be incurred by us during the warranty period and charge that expense to the consolidated statement of operations at the date of sale. Our manufacturer assumes warranty against product defects for one year which we extend to our customers. We assume responsibility for product reliability and results. As of December 31, 2015 and 2014, the Company did not establish a reserve because warranty costs are covered by the Company’s manufacturer.
Income taxes
Deferred income tax assets and liabilities are determined based on differences between the financial statement reporting and tax bases of assets and liabilities and are measured using the enacted tax rates and laws in effect when the differences are expected to reverse. The measurement of deferred income tax assets is reduced, if necessary, by a valuation allowance for any tax benefits, which are, on a more likely than not basis, not expected to be realized; in accordance with ASC guidance for income taxes. Net deferred tax benefits have been reserved at December 31, 2015 and 2014. The effect on deferred income tax assets and liabilities of a change in tax rates is recognized in the period that such tax rate changes are enacted.
Income (Loss) Per Share
Basic income (loss) per share is computed by dividing the Company’s net income (loss) by the weighted average number of common shares outstanding during the period presented. Diluted income per share is based on the treasury stock method and includes the effect from potential issuance of common stock such as shares issuable pursuant to the exercise of warrants and conversions of debentures.
Potentially dilutive securities as of December 31, 2015, consisted of 35,676,413 common shares from outstanding warrants, 100,000 common shares from options and 510,000 common shares from convertible Series A preferred stock. Diluted and basic weighted average shares are the same, as potentially dilutive shares are anti-dilutive.
Potentially dilutive securities as of December 31, 2014, consisted of 17,496,552 common shares from convertible debentures, 28,051,408 common shares from outstanding warrants (including 7,611,000 warrants issued in conjunction with the above convertible notes), 60,000 common shares from options and 510,000 common shares from convertible Series A preferred stock.
The following provides a reconciliation of the shares used in calculating the per share amounts for the periods presented:
|
For the years
Ended December 31,
|
||||||||
|
2015
|
2014
|
|||||||
|
Numerator:
|
||||||||
|
Net Income (Loss)
|
$ | (12,176,319 | ) | $ | 268,435 | |||
|
Denominator:
|
||||||||
|
Basic weighted-average shares
|
102,840,185 | 81,281,030 | ||||||
|
Effect of dilutive securities
|
||||||||
|
Warrants
|
- | 28,051,408 | ||||||
|
Convertible Debt
|
- | 17,496,552 | ||||||
|
Options
|
- | 60,000 | ||||||
|
Preferred Stock
|
- | 510,000 | ||||||
|
Diluted Weighted Average Shares
|
102,840,185 | 127,398,990 | ||||||
|
Income (Loss) per common share
|
||||||||
|
Basic
|
$ | (0.12 | ) | $ | 0.00 | |||
|
Diluted
|
$ | (0.12 | ) | $ | 0.00 | |||
Note: Warrants, Options, and Preferred Stock for the year ended December 31, 2015, are not included in the computation of diluted weighted average shares as such inclusion would be anti-dilutive.
F-10
Loss from Operations Data:
| For the years Ended December 31, | ||||||||
|
2015
|
2014
|
|||||||
|
Loss from Operations
|
$ | (2,985,624 | ) | $ | (3,810,211 | ) | ||
|
Basic and Diluted Weighted
|
||||||||
|
Average Shares
|
102,840,185 | 81,281,030 | ||||||
|
Basic and Diluted Loss per Share
|
$ | (0.03 | ) | $ | (0.05 | ) | ||
Revenue Recognition
For revenue from services and product sales, the Company recognized revenue in accordance with Staff Accounting Bulletin No. 104, “Revenue Recognition” (SAB No. 104), which superseded Staff Accounting Bulletin No. 101, “Revenue Recognition in Financial Statements” (SAB No. 101). SAB No. 104 requires that four basic criteria must be met before revenue can be recognized: (1) persuasive evidence of an arrangement exists; (2) service has been rendered or delivery has occurred; (3) the selling price is fixed and determinable; and (4) collectability is reasonably assured. Determination of criteria (3) and (4) are based on management’s judgment regarding the fixed nature of the selling prices of the services rendered or products delivered and the collectability of those amounts. Provisions for discounts to customers, and allowance, and other adjustments will be provided for in the same period the related sales are recorded.
Stock-Based Compensation
The Company accounts for stock-based compensation in accordance with Financial Accounting Standards Board (“FASB”), ASC 718, Compensation- “Stock Compensation.” Under the provisions of FASB ASC 718, stock-based compensation cost is estimated at the grant date based on the award’s fair value and is recognized as expense over the requisite service period. The Company had one active stock-based compensation plan (“2008 Plan”), TOMI Environmental Solutions, Inc. Stock Option and Restricted Stock Plan (the “Plan”). The Plan calls for the Company, through a committee of its Board of Directors, to issue up to 2,500,000 shares of restricted common stock or stock options. The Company generally issues grants to its employees, consultants, and board members. Stock options are granted with an exercise price equal to the closing price of its common stock on the date of the grant with a term no greater than 10 years. Generally, stock options vest over two to four years. Incentive stock options granted to shareholders who own 10% or more of the Company’s outstanding equity securities are granted at an exercise price that may not be less than 110% of the closing price of the Company’s common stock on the date of grant and have a term no greater than five years. On the date of a grant, the Company determines the fair value of the stock option award and recognizes compensation expense over the requisite service period, which is generally the vesting period of the award. The fair value of the stock option award is calculated using the Black-Scholes option-pricing model. On August 25, 2015 the plan was terminated.
On January 29, 2016, the board adopted the 2016 Equity Plan subject to its approval by stockholders(see note 15).
Concentrations of Credit Risk
Financial instruments that potentially subject the Company to significant concentrations of credit risk consist principally of cash and cash equivalents. The Company maintains cash balances at financial institutions which exceed the current Federal Deposit Insurance Corporation (“FDIC”) limit of $250,000 at times during the year.
Long-Lived Assets Including Acquired Intangible Assets
The Company assesses long-lived assets for potential impairments at the end of each year, or during the year if an event or other circumstance indicates that we may not be able to recover the carrying amount of the asset. In evaluating long-lived assets for impairment, the Company measures recoverability of these assets by comparing the carrying amounts to the future undiscounted cash flows the assets are expected to generate. If the Company’s long-lived assets are considered to be impaired, the impairment to be recognized equals the amount by which the carrying value of the asset exceeds its fair market value. The Company bases its calculations of the estimated fair value of its long-lived assets on the income approach. For the income approach, The Company uses an internally developed discounted cash flow model that include, among others, the following assumptions: projections of revenues and expenses and related cash flows based on assumed long-term growth rates and demand trends; expected future investments to grow new units; and estimated discount rates. We base these assumptions on our historical data and experience, industry projections, micro and macro general economic condition projections, and our expectations. We have had no long-lived asset impairment charges for the years ended December 31, 2015 and 2014.
F-11
Advertising and Promotional Expenses
The Company expenses advertising costs in the period in which they are incurred. For the years ended December 31, 2015 and 2014, advertising and promotional expenses were approximately $52,000 and $11,000, respectively.
Research and Development Expenses
The Company expenses research and development expenses in the period in which they are incurred. For the years ended December 31, 2015 and 2014, research and development expenses were approximately $100,000 and $156,000, respectively.
Shipping and Handling Costs
The Company includes shipping and handling costs relating to the delivery of products directly from vendors to the Company in cost of sales. Shipping and handling costs, which include third-party delivery costs relating to the delivery of products from the Company to customers, are classified as a general and administrative expense. Shipping and handling costs included in general and administrative expense were $61,000 and $28,000 for the years ended December, 31, 2015 and 2014, respectively.
Recent Accounting Pronouncements
In May of 2014, the FASB issued Accounting Standards Update No. 2014-09 (ASU 2014-09) “Revenue from Contracts with Customers.” ASU 2014-09 supersedes the revenue recognition requirements in “Revenue Recognition (Topic 605)”, and requires entities to recognize revenue when it transfers promised goods or services to customers in an amount that reflect the consideration to which the entity expects to be entitled to in exchange for those goods or services. ASU 2014-09 is effective for annual reporting periods beginning after December 15, 2016, including interim periods within that reporting period. Early adoption is not permitted. We are currently in the process of evaluating the impact of the adoption of ASU 2014-09 on our consolidated financial statements.
In November 2015, the FASB issued Accounting Standards Update No. 2015-17, Income Taxes (Topic 740): Balance Sheet Classification of Deferred Taxes (ASU 2015-17), which simplifies the presentation of deferred income taxes by requiring that deferred tax assets and liabilities be classified as non-current. We have retrospectively adopted this standard as of December 31, 2015, and as a result there was no impact to the Company as all of the deferred tax assets for the year ended December 31, 2014 were classified as noncurrent.
In February of 2016, the FASB issued Accounting Standards Update No. 2016-02 (ASU 2016-02) “Leases.” ASU 2016-02 provides new lease accounting guidance. ASU 2016-02 is effective for annual reporting periods beginning after December 15, 2018, including interim periods within that reporting period. Early adoption is permitted. We are currently in the process of evaluating the impact of the adoption of ASU 2016-02 on our consolidated financial statements.
|
Inventories consist of the following:
|
||||||||
|
December 31,
2015
|
December 31,
2014
|
|||||||
|
Raw materials
|
$ | 13,024 | $ | 159,807 | ||||
|
Finished goods
|
1,382,151 | 613,026 | ||||||
| $ | 1,395,175 | $ | 772,833 | |||||
F-12
NOTE 4. PROPERTY AND EQUIPMENT
Property and equipment consists of the following:
|
December 31,
|
December 31,
|
|||||||
|
2015
|
2014
|
|||||||
|
Furniture and fixtures
|
$ | 79,743 | $ | 69,555 | ||||
|
Equipment
|
421,442 | 374,620 | ||||||
| Vehicles |
44,344
|
44,344
|
||||||
| Software |
34,999
|
12,167
|
||||||
|
Leasehold Improvements
|
15,554
|
8,630
|
||||||
| 596,082 | 509,316 | |||||||
|
Less: Accumulated depreciation
|
345,818 | 221,157 | ||||||
| $ | 250,264 | $ | 288,159 | |||||
For the year ended December 31, 2015 and 2014, depreciation was $129,836 and $100,819, respectively.
NOTE 5. INTANGIBLE ASSETS
Intangible assets consist of Patents and Trademarks related to our Binary Ionization Technology. All of these assets were pledged as collateral for the convertible notes as described below in Note 6. The patents are being amortized over the estimated remaining lives of the related patents. The trademarks have an indefinite life. Amortization expense was $369,508 and $369,508 for the year ended December 31, 2015 and 2014.
Definite life intangible assets consist of the following:
|
December 31,
2015
|
December 31,
2014
|
|||||||
|
Intellectual Property and Patents
|
$ | 2,848,300 | $ | 2,848,300 | ||||
|
Less: Accumulated Amortization
|
1,000,752 | 631,244 | ||||||
|
Intangible Assets, net
|
$ | 1,847,548 | $ | 2,217,056 | ||||
| Indefinite life intangible assets consist of the following: | ||||||||
| Trademarks | $ | 440,000 | $ | 440,000 | ||||
| Total Intangible Assets, net | $ | 2,287,548 | $ | 2,657,056 | ||||
Approximate amortization over the next five years is as follows:
| Twelve Month Period Ending December 31, | Amount | |||
| 2016 | $ | 370,000 | ||
| 2017 | 370,000 | |||
| 2018 | 370,000 | |||
| 2019 | 370,000 | |||
| 2020 | 368,000 | |||
| $ | 1,848,000 | |||
F-13
NOTE 6. CONVERTIBLE DEBT
In November 2012, the Company initiated a Private Placement offering a maximum of 240 Units of the Company’s securities at a price of $25,000 per Unit or $6,000,000. The initial closing of the offering occurred in April 2013 as the bulk of the net proceeds of the offering were to be allocated for the asset purchase from L-3 Applied Technologies, Inc., which was finalized April 2013. Each Unit consisted of $25,000 par amount of a 10% Senior Secured Callable Convertible Promissory Note due and payable on July 31, 2015 and 37,500 warrants each of which allows the investor to purchase one share of common stock and expires on July 31, 2018. Interest was payable on the Notes at a rate of 10% per annum, and payable on July 31st and January 31st. The Notes were secured by the Company's intellectual property such as the Patents, royalties, receivables of the Company and all equipment except for the new equipment acquired with the proceeds from any future financing that is initially secured by this new equipment. The Notes called for the establishment of a sinking fund. Within 45 days of each calendar quarter 15% of the Company’s reported revenue was required to be deposited into the Company’s escrowed sinking fund account.
The Company sold 202.96 Units for gross proceeds of $5,074,000 and issued 7,611,000 warrants in connection with the Units. Net proceeds amounted to $4,462,693 after expenses of offering totaling $611,307. In addition, the placement agent received 1,014,800 warrants valued at $165,180.
The convertible notes were convertible, at the option of the note holder, into shares of our common stock at an initial conversion price of $.29 (which conversion price is subject to adjustment upon the occurrence of events specified in the Convertible Notes, including stock dividends, stock splits, certain fundamental corporate transactions, and certain issuances of common stock by the Company).
The Warrants are exercisable into shares of Common Stock (the "Warrant Shares") at an initial exercise price of $0.30 (which may be subject to certain adjustments as set forth in the Warrants).
The Company evaluated the warrants under ASC 815-40-15 due to the exercise price being adjustable upon certain events occurring. The company determined that the warrants are considered indexed to the Company’s own stock and thus meet the scope exception under FASB ASC 815-10-15-74 and are therefore not considered a derivative. The estimated fair value of the warrants, which contain reset provisions, were calculated using the Monte Carlo valuation model. The Company recorded the warrant’s relative fair value of $956,712 as an increase to additional paid in capital and a discount against the related debt.
The Convertible Notes contained a provision whereby the conversion price is adjustable upon the occurrence of certain events, including the issuance of common stock or common stock equivalents at a price which is lower than the current conversion price. Under FASB ASC 815-40-15-5, the embedded conversion feature was not considered indexed to the Company’s own stock and, therefore, did not meet the scope exception in FASB ASC 815-10-15 and thus needed to be accounted for as a derivative liability. The initial fair value of the embedded conversion feature was estimated at $7,316,092 and recorded as a derivative liability, resulting in an additional discount of $4,117,288 to the convertible notes and a finance charge of $3,198,804 included in the statement of operations for the year ended December 31, 2013. The fair value of the embedded conversion feature was estimated at the end of each quarterly reporting period using the Monte Carlo model.
Inherent in the Monte Carlo Valuation model are assumptions related to expected volatility, remaining life, risk-free rate and expected dividend yield. For the Convertible Notes using a Monte Carlo model, we estimate the probability and timing of potential future financing and fundamental transactions as applicable. The Company applied various assumptions into the Monte Carlo Valuation models to determine the change in the fair value of the derivative liability as of the retirement dates of the convertible notes.
The debt discount was amortized over the life of the convertible note using the effective interest method and was fully amortized upon the retirement of the convertible notes during the quarter ended June 30, 2015.
In June 2015, the Company offered the noteholders options to convert to cash or at a reduced conversion price on the convertible notes from $.29 per share provided the conversion feature was exercised prior to June 30, 2015. If the note holder agreed to lock up the converted shares for six (6) months or an uplift to the NYSE or NASDAQ, whichever is shorter, the conversion price was reduced to $.26 per share. Absent the lock up, the note holder could convert at $.275 per share. All note holders except two converted at $.26. Pursuant to the terms of the conversion offer, an aggregate of $3,774,000 of the convertible notes and $124,000 of accrued interest were converted into 14,913,968 shares of the Company’s common stock. The Company recognized an induced conversion cost of $930,383 related to all conversions and retirements.
In addition, during the quarter ended June 30, 2015, an aggregate of $1,300,000 of the convertible notes and $87,500 in accrued interest were repaid in the form of cash.
F-14
Convertible Notes
The assumptions used in the Monte Carlo Models are as follows:
|
June 30,
|
December 31,
|
|||||||||||
|
2015
|
2014
|
Inception
|
||||||||||
|
Closing stock price
|
$ | 0.55-.64 | $ | 0.27 | $ | 0.13-0.55 | ||||||
|
Conversion price
|
$ | 0.29 | $ | 0.29 | $ | 0.29 | ||||||
|
Expected volatility
|
125 | % | 114 | % | 185%-190 | % | ||||||
|
Remaining term (years)
|
0.09 - 0.11 | 0.58 | 2.30-2.07 | |||||||||
|
Risk-free rate
|
0.00 | % | 0.13 | % | .25%-.43 | % | ||||||
|
Expected dividend yield
|
0 | % | 0 | % | 0 | % | ||||||
Warrants
|
Inception
|
||||
|
Closing stock price
|
0.13-0.55 | |||
|
Conversion price
|
0.30 | |||
|
Expected volatility
|
250 | % | ||
|
Remaining term (years)
|
5.30-5.09 | |||
|
Risk-free rate
|
.76% -(1.61% | ) | ||
|
Expected dividend yield
|
0 | % | ||
Convertible notes consist of the following at December 31, 2015 and December 31, 2014:
|
December 31, 2015
|
December 31, 2014
|
|||||||
|
Convertible notes
|
$ | - | $ | 5,074,000 | ||||
|
Less: Debt discount
|
- | 3,996,033 | ||||||
|
Convertible notes, net
|
$ | - | $ | 1,077,967 | ||||
NOTE 7. FAIR VALUE
Level 3 financial instruments consist of certain embedded conversion features. The fair value of these embedded conversion features that have exercise reset features are estimated using a Monte Carlo valuation model. The Company adopted the disclosure requirements of ASU 2011-04, “Fair Value Measurements.” (See note 6) The unobservable input used by the Company was the estimation of the likelihood of a reset occurring on the embedded conversion feature of the Convertible Notes. These estimates of the likelihood of completing an equity raise that would meet the criteria to trigger the reset provisions are based on numerous factors, including the remaining term of the financial instruments and the Company’s overall financial condition.
The following table summarizes the changes in fair value of the Company’s Level 3 financial instruments for the period ended December 31, 2015 and December 31, 2014. Upon the retirement of the convertible notes in June of 2015, the fair value of the derivative liability was $0.
F-15
|
December 31,
|
December 31,
|
|||||||
|
2015
|
2014
|
|||||||
|
Beginning Balance
|
$ | 1,728,883 | $ | 7,665,502 | ||||
|
Change in fair value
|
3,810,955 | (5,936,619 | ) | |||||
|
Reclassification to additional paid in capital due to retirement of convertible notes
|
(5,539,838 | ) | - | |||||
|
Ending Balance
|
$ | - | $ | 1,728,883 | ||||
Changes in the unobservable input values would likely cause material changes in the fair value of the Company’s Level 3 financial instruments. The significant unobservable input used in the fair value measurement is the estimation of the likelihood of the occurrence of a change to the conversion price based on the contractual terms of the financial instruments. A significant increase (decrease) in this likelihood would result in a higher (lower) fair value measurement. As of December 31, 2015, the balance of the derivative liability was $0 as the convertible notes were retired during the second quarter of 2015.
NOTE 8. STOCKHOLDERS’ EQUITY
The Company’s Board of Directors may, without further action by the Company’s stockholders, from time to time, direct the issuance of any authorized but unissued or unreserved shares of preferred stock in series and at the time of issuance, determine the rights, preferences and limitations of each series. The holders of such preferred stock may be entitled to receive a preference payment in the event of any liquidation, dissolution or winding-up of the Company before any payment is made to the holders of our common stock. Furthermore, the Board of Directors could issue preferred stock with voting and other rights that could adversely affect the voting power of the holders of our common stock.
Convertible Series A Preferred Stock
The Company has authorized 1,000,000 shares of Convertible Series A Preferred Stock, $0.01 par value. At December 31, 2015 and 2014, there were 510,000 shares issued and outstanding, respectively. The Convertible Series A Preferred Stock is convertible at the rate of one share of common stock for one share of Convertible Series A Preferred Stock.
Convertible Series B Preferred Stock
The Company has authorized 4,000 shares of Convertible Series B Preferred Stock, $1,000 stated value, 7.5% Cumulative dividend. At December 31, 2015 and 2014, there were no shares issued and outstanding, respectively.
Common Stock
During the year ended December 31, 2014, the Company issued 326,035 shares of common stock valued at approximately $105,893 for professional services rendered.
During the year ended December 31, 2014, the Company issued 44,319 shares of common stock valued at $15,000 to Harold Paul as payment for legal services rendered.
During the year ended December 31, 2014, the Company issued 455,000 shares to the Rolyn Companies, Inc. (“Rolyn”) for labor and services support valued at $203,950 of which 230,000 shares valued at $128,800 were recorded as common stock to be issued at December 31, 2013.
In addition, the Company issued 76,226 shares valued at $25,000 to a consultant for services rendered for the year ended December 31, 2014.
During the year ended December 31, 2014, the Company issued 78,125 shares as consideration for payment of accrued compensation to the CEO amounting to $25,000. The Company also issued 100,000 shares to the COO amounting to $29,000 as part of his employment agreement.
F-16
During the year ended December 31, 2014, the Company sold 377,778 shares of common stock at $.27 per share for gross proceeds of $102,000. In connection with the sale, the Company incurred a cash finder fee in the amount of $3,060 in addition to a finder’s fee paid in common stock of 11,332 shares valued at $3,060.
During the year ended December 31, 2014, the Company sold 2,290,243 equity units. Each unit consisted of 1 share of common stock and 2.5 warrants. The warrants have an exercise price of $.29 per share and a term of five years. Gross proceeds to the Company amounted to $663,262. In connection with the sale, the Company incurred a cash finder’s fee in the amount of $66,347 in addition to a finder’s fee to be paid in common stock of 68,707 shares valued at $19,925.
During the year ended December 31, 2015, the Company issued 1,094,679 shares of common stock valued at approximately $454,418 for services rendered (Note 11). In addition, the Company issued 225,000 shares of common stock valued at $101,250 to Harold Paul as payment for legal services rendered (Note 9).
During the year ended December 31, 2015, the Company’s Board of Directors approved the issuance of 225,000 shares of common stock from the 2008 Plan valued at $101,250 as a bonus to Halden Shane, CEO, in August of 2015 (Note 9).
During the year ended December 31, 2015, the Company issued 50,146 shares of common stock valued at $18,000 to Nick Jennings, CFO, as part of his annual compensation from the Company. In addition, the Company’s Board of Directors approved the issuance of 62,000 shares of common stock under the Company’s 2008 plan valued at $27,900 as a bonus in August of 2015 (Note 9).
During the year ended December 31, 2015, the Company’s Board of Directors approved the issuance of 100,000 shares of common stock from the 2008 Plan valued at $45,000 as a bonus to Norris Gearhart, COO, in August of 2015 (Note 9).
During the year ended December 31, 2015, the Company sold, 1,760,002 equity units. Each unit consisted of 1 share of common stock and 2.5 warrants. The warrants have an exercise price of $.29 per share and a term of seven years. Gross proceeds to the Company amounted to $510,213. In connection with the sale, the Company incurred a cash finder’s fee in the amount of $51,000 in addition to a finder’s fee to be paid in common stock of 52,800 shares valued at $15,312.
During the year ended December 31, 2015, the Company issued 14,913,968 shares of common stock in connection with the conversion of the convertible notes and the related accrued interest amounting to $3,897,916 (Note 6).
During the year ended December 31, 2015, the Company directly sold to two investors, 17,986,111 shares of common stock. Gross proceeds to the Company in connection with the shares sold amounted to approximately $8,225,000.
Stock Options
The Company issued 20,000 options valued at $8,723 to a director in January 2014. The options have an exercise price of $0.44 per share. The options expire in January 2024. The options were valued using the Black-Scholes model using the following assumptions: volatility: 233%; dividend yield: 0%; zero coupon rate: 1.72%; and a life of 10 years.
The Company issued a total of 40,000 options valued at $10,798 to two directors in January 2015. The options have an exercise price of $0.27 per share. The options expire in January 2025. The options were valued using the Black-Scholes model using the following assumptions: volatility: 237%; dividend yield: 0%; zero coupon rate: 1.61%; and a life of 10 years.
The following table summarizes stock options outstanding as of December 31, 2015 and December 31, 2014:
| December 31, 2015 | December 31, 2014 | |||||||||||||||
|
Number of Options
|
Weighted Average Exercise Price
|
Number of Options
|
Weighted Average Exercise Price
|
|||||||||||||
|
Outstanding, beginning of period
|
60,000 | $ | 1.42 | 60,000 | $ | 1.42 | ||||||||||
|
Granted
|
40,000 | 0.27 | 20,000 | 0.44 | ||||||||||||
|
Exercised
|
- | - | (20,000 | ) | 0.44 | |||||||||||
|
Outstanding, end of period
|
100,000 | $ | 0.96 | 60,000 | $ | 1.42 | ||||||||||
F-17
Options outstanding and exercisable by price range as of December 31, 2015 were as follows:
|
Outstanding Options
|
Average
Weighted
|
Exercisable Options
|
||||||||||||||||
|
Range
|
Number
|
Remaining
Contractual
Life in Years
|
Number
|
Weighted
Average
Exercise Price
|
||||||||||||||
| $ | 2.10 | 40,000 | 4.01 | 40,000 | $ | 2.10 | ||||||||||||
| $ | 0.05 | 20,000 | 5.02 | 20,000 | $ | 0.05 | ||||||||||||
| $ | 0.27 | 40,000 | 9.02 | 40,000 | $ | 0.27 | ||||||||||||
| 100,000 | 100,000 | |||||||||||||||||
Stock Warrants
On February 11, 2014, as part of the employment agreements entered into with its three executive officers (CEO, President and COO), the Board of Directors approved the grant of 3,000,000 stock warrants to each of them as executive compensation. The warrants have a term of five years and vest as follows: 1,000,000 warrants will vest upon issuance; 1,000,000 warrants will vest as of February 11, 2015, and 1,000,000 warrants will vest as of February 11, 2016. The exercise price of the warrants is $0.30 per share based on the closing price of the Company’s common stock on the grant date of $0.32. If employment is terminated, the terms of any then outstanding warrant held by the holder shall extend for a period ending on the earlier of the date on which such warrant would otherwise expire or three months after such termination of employment and the warrant shall be exercisable to the extent it was exercisable as of the date of termination of employment. Any unvested warrants shall immediately vest on termination. The Company utilized the Black-Scholes method to fair value the 3,000,000 warrants received by these individuals totaling approximately $952,000 for each executive with the following assumptions: volatility, 233%; expected dividend yield, 0%; risk free interest rate, 1.54%; and a life of 5 years. The grant date fair value of each warrant was $0.32. Effective September 25, 2014, the President and COO resigned from their positions with the Company and accordingly, the remaining unvested warrants immediately vested. As of December 31, 2014, their warrants expired.
On February 11, 2014, the Company’s Board of Directors approved the granting of 300,000 stock warrants to its CFO Chris Chipman as incentive compensation. Effective July 18, 2014, Chris Chipman resigned from his position of Chief Financial Officer of the Company and accordingly, his unvested share of warrants were deemed to be null and void.
For the year ended December 31, 2014, the Company recorded approximately $2,531,000 in equity based compensation expense on the vested and accrued portion of the warrants issued to executives.
During the year ended December 31, 2014, the Company issued 5,725,608 warrants in connection with the private placement of common stock equity units. See note 8 (common stock) for additional details.
For the year ended December 31, 2015, the Company recognized equity based compensation of approximately $316,000 on the warrants issued to the CEO in connection with the employment agreement (Note 9). In addition, the Company recognized approximately $10,800 for director options (See Note 8-Stock Options), $1,350,000 to consultant’s (Note 9 and 11), and $30,000 on the vesting of warrants issued to the CFO on October 1, 2014 (Note 9).
During the year ended December 31, 2015, the Company issued 4,400,005 warrants in connection with the equity units sold to investors. See note 8 (common stock) for additional details. In addition, the Company issued 3,225,000 warrants to two consultants during the year ended December 31, 2015. See note 11 (contracts and agreements) for additional details.
F-18
The following table summarizes the outstanding common stock warrants as of December 31, 2015 and December 31, 2014:
| December 31, 2015 | December 31, 2014 | |||||||||||||||
|
Number of Warrants
|
Weighted Average Exercise Price
|
Number of Warrants
|
Weighted Average Exercise Price
|
|||||||||||||
|
Outstanding, beginning of period
|
28,051,408 | $ | 0.23 | 19,325,800 | $ | 0.21 | ||||||||||
|
Granted
|
7,625,005 | 0.58 | 15,325,608 | 0.30 | ||||||||||||
|
Expired
|
- | - | (300,000 | ) | 0.77 | |||||||||||
|
Expired
|
- | - | (6,300,000 | ) | 0.30 | |||||||||||
|
Outstanding, end of period
|
35,676,413 | $ | 0.30 | 28,051,408 | $ | 0.23 | ||||||||||
Warrants outstanding and exercisable by price range as of December 31, 2015 were as follows:
|
Outstanding Warrants
|
Exercisable Warrants
|
|||||||||||||||||
|
Range
|
Number
|
Average
|
Number
|
|
||||||||||||||
|
Weighted
|
||||||||||||||||||
|
Remaining
|
Weighted
|
|||||||||||||||||
|
Contractual
|
Average | |||||||||||||||||
|
Life in Years
|
Exercise Price | |||||||||||||||||
| $ | 0.01 | 1,575,000 | 1.53 | 1,575,000 | $ | 0.01 | ||||||||||||
| $ | 0.05 | 975,000 | 1.62 | 975,000 | $ | 0.05 | ||||||||||||
| $ | 0.15 | 7,750,000 | 1.80 | 7,750,000 | $ | 0.15 | ||||||||||||
| $ | 0.26 | 100,000 | 2.49 | 100,000 | $ | 0.26 | ||||||||||||
| $ | 0.29 | 10,125,613 | 4.80 | 10,125,613 | $ | 0.29 | ||||||||||||
| $ | 0.30 | 11,925,800 | 2.75 | 10,825,800 | $ | 0.30 | ||||||||||||
| $ | 0.33 | 75,000 | 2.75 | 75,000 | $ | 0.33 | ||||||||||||
| $ | 0.50 | 75,000 | 2.31 | 75,000 | $ | 0.50 | ||||||||||||
| $ | 0.62 | 75,000 | 2.50 | 75,000 | $ | 0.62 | ||||||||||||
| $ | 1.00 | 3,000,000 | 4.34 | 3,000,000 | $ | 1.00 | ||||||||||||
| 35,676,413 | 34,576,413 | |||||||||||||||||
F-19
Unvested warrants outstanding as of December 31, 2015 were as follows:
|
Unvested Warrants
|
||||||||||
|
Weighted
Average
Exercise Price
|
Number
|
Average
Weighted
Remaining
Contractual
Life in Years
|
||||||||
| $ | 0.30 | 1,100,000 | 5.0 | |||||||
NOTE 9. RELATED PARTY TRANSACTIONS
Employment Agreement
On February 11, 2014, the Company entered into an amended employment agreement with its CEO that provides for a base salary of $36,000 per year. The agreement provided for an increase in the base salary to $120,000 if annual gross revenue exceeds five million and $175,000 if annual gross revenue were to exceed ten million on a calendar year basis. Any bonuses awarded will be based upon the Company’s performance and be made at the discretion of the Board of Directors. The CEO will also have the right to receive expense reimbursements and certain employee benefits. The terms of the employment agreement will be three years terminating on December 31, 2016. In addition, the Company’s board of directors approved the issuance of 225,000 shares from the 2008 Plan valued at $101,250 as a bonus to Dr. Shane in August of 2015. In January of 2016, the Company entered into a new agreement with its CEO (See Note 15).
On September 25, 2014, the Company appointed Norris Gearhart as Principal Operating Officer of the Company and entered into an employment agreement. The agreement provides for a base salary of $126,000 per year and performance based bonuses. In September of 2015, the Company entered into a new agreement with Mr. Gearhart as Principal Operating Officer of the Company. The new agreement provides for a base salary of $145,000 per year and performance based bonuses. In addition, the Company’s board of directors approved the issuance of 100,000 shares from the 2008 Plan valued at $45,000 as a bonus to Mr. Gearhart in August of 2015.
The Company appointed Nick Jennings as its Principal Financial Officer effective September 25, 2014. Mr. Jennings employment with the Company commenced on October 1, 2014. The employment agreement between Mr. Jennings and the Company provides for an annual base salary of $60,000 to be paid in the form of cash and $24,000 to be paid in the form of the Company’s restricted stock. As part of Mr. Jennings’s agreement, 300,000 warrants were issued with a term of five years vesting 100,000 upon the grant date (October 1, 2014), 100,000 on October 1, 2015 and 100,000 on October 1, 2016. The exercise price of the warrant is $0.30 per share based on the volume weighted average price of the Company’s common stock for the five days prior to the grant date. In September of 2015, the Company entered into a new agreement with Mr. Jennings as Principal Financial Officer of the Company. The new agreement provides for a base salary of $132,000 per year and performance based bonuses. The new agreement also provides for 100,000 stock warrants with an exercise price of $.50 per share to be issued January of 2016. In addition, the Company’s board of directors approved the issuance of 62,000 shares from the 2008 Plan valued at $27,900 as a bonus to Mr. Jennings in August of 2015.
In August 2015, the Company’s board of directors approved the issuance of 225,000 shares of common stock valued at $101,250 to Harold Paul as payment for legal services rendered. In addition, Mr. Paul received cash compensation for the year ended December 31, 2015 in the amount of $60,000 in exchange for legal services rendered. During the year ended December 31, 2014, the Company issued 44,319 shares of common stock valued at $15,000 and cash in the amount of $44,000 to Harold Paul as payment for legal services rendered.
In September of 2015, the Company issued 100,000 shares of restricted stock valued at $47,000 as an incentive to accept the position as the Chief Compliance and Regulatory Officer. The Chief Compliance and Regulatory Officer is the daughter of the CEO.
Consulting Agreement
In May of 2015, the Company entered into a consulting agreement that provides for the issuance of 600,000 shares of restricted common stock which was issued in July of 2015 and valued at $264,000. In addition, the agreement provides for the issuance of 3,000,000 common stock warrants that vest upon issuance with an exercise price of $1.00 and have a term of 5 years. The Company utilized the Black-Scholes method to fair value the 3,000,000 warrants with the following assumptions: volatility, 191%; expected dividend yield, 0%; risk free interest rate, 1.49%; and a life of 5 years. The grant date fair value of each warrant was $0.42. For the year ended December 31, 2015, the Company recognized approximately $1,259,000 in equity based compensation on the warrants issued. In December of 2015, the Company paid a sales commissions to the consultant in the amount of $152,442. During 2015, the consultant was a shareholder with greater than 5% ownership in the Company
F-20
During the year ended December 31, 2015, the Company made sales in the amount of $256,285 to three entities under common control and owned by a Consultant that performed services for the Company during 2015. As of December 31, 2015, there was $210,686 in accounts receivables due from these three entities. During 2015 the consultant was the acting director of the TOMI Service Network.
Distribution and Licensing Agreement
On March 21, 2014, the Company entered into a distribution and licensing agreement with Plascencia Universal, S. de R.L. de C.V. (“Plascencia Universal”), a Mexican company that will act as the exclusive distributor of TOMI’s products and services in Mexico. The principal of Plascencia Universal is also the broker for the Company’s insurance policies and was appointed a director of the Company. In April of 2015, the Company modified its agreement with Plascencia Universal with respect to the license fee included in the original agreement. In December of 2015, the principal of Plascencia Universal resigned from the board of directors.
NOTE 10. COMMITMENTS AND CONTINGENCIES
Lease Commitments
In September of 2014 the Company entered into a lease agreement for office and warehouse space in Fredrick Maryland. As part of the lease agreement, the Company received a rent holiday in the first 5 months of the lease. The lease also provides for an escalation clause where the Company will be subject to an annual rent increase of 3%, year over year. The lease expires on January 31, 2018. The Company accounts for the lease using the straight line method and recorded $45,709 in rent expense for the year ended December 31, 2015. Approximate minimum annual rents under the lease are as follows:
| Twelve Month Period Ending December 31, | Amount | |||
| 2016 | $ | 52,000 | ||
| 2017 | 53,000 | |||
| 2018 | 5,000 | |||
| $ | 110,000 | |||
Legal Contingencies
We may become a party to litigation in the normal course of business. In the opinion of management, there are no legal matters involving us that would have a material adverse effect upon our financial condition, results of operations or cash flows.
Product Liability
As of December 31, 2015 and 2014, there were no claims against the Company for product liability.
NOTE 11. CONTRACTS AND AGREEMENTS
In September 2014, the Company entered into a Sales and Distribution Agreement, superseding previous agreements, with TOMI Panama S.A. (“TOMI Panama”) covering Panama. TOMI Panama is the exclusive distributor of the Company’s products and services within the country of Panama. For the years ended December 31, 2015 and 2014, the Company made sales and provided services to TOMI Panama for approximately $118,000 and $400,000, respectively.
On October 15, 2014, the Company entered into a manufacturing and development agreement with RG Group, Inc. The agreement does not provide for any minimum purchase agreements and is for a term of 2 years. For the years ended December 31, 2015 and 2014, RG Group, Inc. manufactured substantially all of the Company’s equipment. At December 31, 2015, the Company maintained deposits on outstanding purchase orders in the amount of $442,358.
F-21
In January of 2015, the Company entered into a consulting agreement which has since been terminated that provided for a fee based on revenue received from existing and prospective clients assigned and revenue from sales related to customers the consultant finds for the Company. The agreement also provided for the issuance of 100,000 shares of the Company’s common restricted stock that were issued in February of 2015 and valued at $25,000. In addition, the agreement provides for the issuance of 75,000 common stock warrants on a quarterly basis that vest upon issuance with a strike price equal to the VWAP for the 5 day period prior to the close of the quarter with a term of 3 years. The exercise price for the warrants issued was $0.50, $0.62 and $0.33. During the year ended December 31, 2015, the Company utilized the Black-Scholes method to fair value the 225,000 warrants with the following range of assumptions: volatility, 157%-174%; expected dividend yield, 0%; risk free interest rate, 1.01%-1.42%; and a life of 3 years. The grant date fair value of the warrant issued was $0.37, $0.54 and $0.30. For the year ended December 31, 2015, the Company recognized approximately $91,000 in equity based compensation on the issuance of the warrants. This consulting agreement was terminated October 1, 2015 when the consultant accepted a full time employment position with the Company.
In May 2015, the Company was awarded a grant by the United States Agency for International Development (“USAID”) in the amount of $559,000 for the development of SteraMistTM Mobile Decontamination Chambers to fight the Ebola epidemic. The grant is based on milestones set forth on the agreement between the Company and USAID. During the year ended December 31, 2015 the Company met the first five milestones and received gross proceeds from the grant in the amount of $537,272. The Company has incurred costs in connection with the grant through December 31, 2015 in the amount of $326,769. The proceeds received as part of the grant in excess of the costs incurred has been presented on the Company’s balance sheet as a liability in the amount of $210,503 as of December 31, 2015.
NOTE 12. INCOME TAXES
|
The Company’s income tax expense consisted of:
|
||||||||
|
December 31,
|
December 31,
|
|||||||
|
2015
|
2014
|
|||||||
|
Current:
|
||||||||
|
United States
|
$ | - | $ | - | ||||
|
Foreign
|
- | - | ||||||
|
|
- | - | ||||||
|
Deferred:
|
||||||||
|
United States
|
- | - | ||||||
|
Foreign
|
- | - | ||||||
| - | - | |||||||
|
Total
|
$ | - | $ | - | ||||
|
The Company’s net income (loss) before income tax consisted of:
|
||||||||
|
December 31,
|
December 31,
|
|||||||
|
2015
|
2014
|
|||||||
|
United States
|
$ | (12,176,319 | ) | $ | 268,435 | |||
|
Foreign
|
- | - | ||||||
|
Total
|
$ | (12,176,319 | ) | $ | 268,435 | |||
F-22
The Company’s income tax expense differed from the amounts computed by applying the United States statutory corporate income tax rate for the following reasons:
|
December 31,
|
December 31,
|
|||||||
|
2015
|
2014
|
|||||||
|
Income (Loss) before income tax
|
$ | ($12,176,319 | ) | $ | 268,435 | |||
|
US statutory corporate income tax rate
|
39.45 | % | 34.00 | % | ||||
|
Income tax expense computed at US statutory corporate income tax rate
|
||||||||
| (4,803,558 | ) | 91,268 | ||||||
|
Reconciling items:
|
||||||||
|
Change in valuation allowance on deferred tax assets
|
592,550 | 698,631 | ||||||
|
Incentive stock options and warrants
|
673,172 | 872,000 | ||||||
|
Finance charges related to convertible notes
|
1,776,059 | 116,447 | ||||||
|
Amortized debt discount
|
269,787 | 269,787 | ||||||
|
Meals and Entertainment
|
5,527 | 4,079 | ||||||
|
Change in fair value of derivative liability
|
1,503,422 | (2,018,450 | ) | |||||
|
Other
|
(16,958 | ) | (33,762 | ) | ||||
|
Income tax expense
|
$ | - | $ | - | ||||
During 2015, the Company increased its US statutory corporate income tax rate from 34% to 39.45% as result of the the income allocated to the various states it operates and files state income tax returns in.
Components of the Company’s deferred income tax assets (liabilities) are as follows:
|
December 31,
|
December 31,
|
|||||||
|
2015
|
2014
|
|||||||
|
Deferred tax assets:
|
||||||||
|
Reserve for Bad Debt
|
$ | 17,750 | $ | - | ||||
|
Inventory Capitalization
|
51,000 | - | ||||||
|
Deferred Rent
|
5,800 | - | ||||||
|
Intangible Assets
|
229,000 | - | ||||||
|
Net operating losses
|
3,392,000 | 3,042,000 | ||||||
|
Valuation Allowance
|
(3,634,550 | ) | (3,042,000 | ) | ||||
|
Deferred Tax Assets
|
61,000 | - | ||||||
|
Deferred tax liabilities:
|
||||||||
|
Property Plant and Equipment
|
$ | (61,000 | ) | $ | - | |||
|
Net Deferred Tax Assets and Liabilities
|
$ | - | $ | - | ||||
Deferred income tax assets and liabilities are determined based on differences between the financial statement reporting and tax bases of assets and liabilities and are measured using the enacted tax rates and laws in effect when the differences are expected to reverse. The measurement of deferred income tax assets is reduced, if necessary, by a valuation allowance for any tax benefits, which are, on a more likely than not basis, not expected to be realized; in accordance with ASC guidance for income taxes. As of December 31, 2015, we recorded a valuation allowance of $3,634,550 for the portion of the deferred tax asset that we do not expect to be realized. The valuation on our net deferred taxes increased by $592,550 during the year ended December 31, 2015, primarily due to additional U.S. deferred tax assets incurred in the current year that cannot be realized. Management believes that based on the available information, it is more likely than not that the U.S. deferred tax assets will not be realized, such that a valuation allowance is required against U.S. deferred tax assets. The effect on deferred income tax assets and liabilities of a change in tax rates is recognized in the period that such tax rate changes are enacted.
F-23
For income tax purposes in the United States, the Company had available federal net operating loss carryforwards ("NOL") as of December 31, 2015 and 2014 of approximately $8,890,000 and $7,516,000 respectively to reduce future federal taxable income. For income tax purposes in the United States, the Company had available state net operating loss carryforwards ("NOL") as of December 31, 2015 and 2014 of approximately $6,779,000 and $5,405,000 respectively to reduce future state taxable income. If any of the NOL's are not utilized, they will expire at various dates through 2035. There may be certain limitations as to the future annual use of the NOLs due to certain changes in the Company's ownership.
We record uncertain tax positions in accordance with ASC 740 on the basis of a two-step process whereby (1) we determine whether it is more likely than not that the tax positions will be sustained on the basis of the technical merits of the position and (2) for those tax positions that meet the more-likely-than-not recognition threshold, we recognize the largest amount of tax benefit that is more than 50 percent likely to be realized upon ultimate settlement with the related tax authority. As of December 31, 2015 and 2014, the management of the Company determined there were no reportable uncertain tax positions.
NOTE 13. COMMON STOCK TO BE ISSUED
As of December 31, 2014, the Company was obligated to issue 155,619 shares of common stock valued at approximately $36,000 primarily to certain vendors and consultants.
As of December 31, 2015, the Company was obligated to issue 202,000 shares of common stock valued at approximately $53,000 primarily to certain vendors and consultants.
NOTE 14. CUSTOMER CONCENTRATION
The Company had certain customers whose revenue individually represented 10% of more of the Company’s total revenue, or whose accounts receivable balances individually represented 10% of more of the Company’s accounts receivable.
For the year ended December 31, 2015, two customers accounted for 26% of revenue.
At December 31, 2015, three customers accounted for 42% of accounts receivable.
NOTE 15. SUBSEQUENT EVENTS
The Company has evaluated subsequent events through the date the financial statements were issued and up to the time of filing of the financial statements with the Securities and Exchange Commission.
In January of 2016, the Company entered into a new employment agreement with its CEO. The agreement provides for a base annual salary of $360,000. The agreement also provides for the quarterly issuance of 250,000 options to purchase the Company’s common stock in 2016 with an exercise price equal to the three day trailing VWAP of the stock.
The Company appointed Mr. Walter C. Johnsen as a Director on January 29, 2016. The term of his agreement as director commenced on February 1, 2016 for 1 year and until a successor is elected, or resignation or removal. The agreement between the Company and Mr. Johnsen provides for an annual fee in the amount of $25,000 paid on a quarterly basis and an annual grant of 25,000 options to purchase shares of the Company’s common stock. The Company issued 25,000 options to Mr. Johnsen in February of 2016. The options have an exercise price of $0.55 per share and expire in January 2026.
The Company appointed Ms. Kelly J. Anderson as a Director on January 29, 2016. Ms. Anderson will serve as the chair of the Company’s audit committee. The term of her agreement as director commenced on February 1, 2016 for 1 year and until a successor is elected, or resignation or removal. The agreement between the Company and Ms. Anderson provides for an annual fee in the amount of $26,000 paid on a quarterly basis and an annual grant of 25,000 options to purchase shares of the Company’s common stock. The Company issued 25,000 options to Ms. Anderson in February of 2016. The options have an exercise price of $0.55 per share and expire in January 2026.
The Company appointed Mr. Edward J. Fred as a Director on January 29, 2016. The term of his agreement as director commenced on February 1, 2016 for 1 year and until a successor is elected, or resignation or removal. The agreement between the Company and Mr. Fred provides for an annual fee in the amount of $25,000 paid on a quarterly basis and an annual grant of 25,000 options to purchase shares of the Company’s common stock. The Company issued 25,000 options to Mr. Fred in February of 2016. The options have an exercise price of $0.55 per share and expire in January 2026.
F-24
In January 29, 2016, the board adopted the 2016 Equity Plan subject to its approval by stockholders. The 2016 Plan provides for authorizes the grant of stock options, stock appreciation rights, restricted stock, restricted stock units and performance units / shares. Up to 5,000,000 shares of the Common Stock are authorized for issuance under the 2016 Plan. Shares issued under the 2016 Plan may be either authorized but unissued shares, treasury shares, or any combination thereof. Provisions in the 2016 Plan permit the reuse or reissuance by the 2016 Plan of shares of Common Stock for numerous reasons, including, but not limited to, shares of Common Stock underlying canceled, expired, or forfeited awards of stock-based compensation and stock appreciation rights paid out in the form of cash. Stock-based compensation will typically be awarded in consideration for the future performance of services to the Company. All recipients of awards under the 2016 Plan are required to enter into award agreements with the Company at the time of the award; awards under the 2016 Plan are expressly conditioned upon such agreements.
F-25