UNITED STATES
SECURITIES AND EXCHANGE COMMISSION
WASHINGTON, DC 20549
FORM 10-K
[ X ] ANNUAL REPORT PURSUANT TO SECTION 13 OR 15(d) OF
THE SECURITIES EXCHANGE ACT OF 1934
FOR THE FISCAL YEAR ENDED DECEMBER 31, 2015
or
[ ] TRANSITION REPORT PURSUANT TO SECTION 13 OR 15(D) OF THE
SECURITIES EXCHANGE ACT OF 1934
Commission File No. 000-18774
SPINDLETOP OIL & GAS CO.
(Exact name of registrant as specified in its charter)
| Texas | 75-2063001 |
| (State or other jurisdiction of incorporation or organization) |
(IRS Employer Identification No.) |
| 12850 Spurling Rd., Suite 200, Dallas, TX | 75230 |
| (Address of principal executive offices) | (Zip Code) |
| (972) 644-2581 | |
| (Registrant's telephone number, including area code) | |
| Securities registered pursuant to Section 12(b) of the Act: | |
| Title of each Class | Name of each exchange on which registered |
| None | N/A |
Securities registered pursuant to Section 12(g) of the Act: Common Stock, $0.01 par value
Indicate by check mark if the registrant is a well-known seasoned issuer, as defined in Rule 405 of the Securities Act. Yes [ ] No [ X ]
Indicate by check mark if the registrant is not required to file reports pursuant to Section 13 or Section 15(d) of the Act. Yes [ ] No [ X ]
Indicate by check mark whether the registrant has submitted electronically and posted on its corporate Web site, if any, every Interactive Data File required to be submitted and posted pursuant to Rule 405 of Regulation S-T during the preceding twelve months (or for such shorter period that the registrant was required to submit and post such files). Yes [ X ] No [ ]
Indicate by check mark whether the registrant (1) has filed all reports required to be filed by Section 13 or 15(d) of the Securities Exchange Act of 1934 during the preceding 12 months (or for such shorter period that the Company was required to file such reports), and (2) has been subject to such filing requirements for the past 90 days. Yes [ X ] No [ ]
| 1 |
Indicate by check mark if disclosure of delinquent filers pursuant to Item 405 of Regulation S-K (§293.405 of this chapter) is not contained herein, and will not be contained, to the best of registrant’s knowledge, in definitive proxy or information statements incorporated by reference in Part III of the Form 10-K or any amendment to this Form 10-K. [ X ]
Indicate by check mark whether the registrant is a large accelerated filer, an accelerated filer or a non-accelerated filer or a smaller reporting company. See definitions of “large accelerated filer”, “accelerated filer”, and “smaller reporting company” in Rule 12b-2 of the Exchange Act (Check one):
Large accelerated filer [ ] Accelerated filer [ ]
Non-accelerated filer [ ] Smaller reporting company [ X ]
Indicate by check mark whether the registrant is a shell company (as defined in Rule 12b-2 of the Exchange Act. Yes [ ] No [ X ]
State the aggregate market value of the voting and non-voting common equity held by non-affiliates computed by reference to the price at which the common equity was last sold, or the average bid and asked price of such common equity, as of the last business day of the registrant’s most recently completed second fiscal quarter.
$4,111,832 based upon a total of 1,035,726 shares held as of June 30, 2015 by persons believed to be non-affiliates of the Registrant; the basis of the calculation does not constitute a determination by the Registrant as defined in Rule 405 of the Securities Act of 1933, as amended, that such calculation, if made as of a date within 60 days of this filing, would yield a different value.
APPLICABLE ONLY TO REGISTRANTS INVOLVED IN BANKRUPTCY
PROCEEDINGS DURING THE PRECEDING FIVE YEARS:
Indicate by check mark whether the registrant has filed all documents and reports required to be filed by Sections 12, 13 or 15(d) of the Securities Exchange Act of 1934 subsequent to the distribution of securities under a plan confirmed by a court. Yes [ ] No [ ]
(APPLICABLE ONLY TO CORPORATE REGISTRANTS)
Indicate the number of shares outstanding of each of the issuer's classes of common, as of the latest practicable date.
| Common Stock, $0.01 par value | 6,936,269 |
| (Class) | (Outstanding at March 30, 2016) |
DOCUMENTS INCORPORATED BY REFERENCE
None
| 2 |
PART I
Item 1. Description of Business
GENERAL
Spindletop Oil & Gas Co. is an independent oil and gas company engaged in the exploration, development, production and acquisition of oil and natural gas; the rental of oilfield equipment; and through one of its subsidiaries, the gathering and marketing of natural gas. The terms the "Company", "We", "Us" or “Spindletop” are used interchangeably herein to refer to Spindletop Oil & Gas Co. (“SOG”) and its wholly owned subsidiaries, Spindletop Drilling Company ("SDC"), and Prairie Pipeline Co. (“PPC”).
The Company has focused its oil and gas operations principally in Texas, although we operate properties in six states including: Texas, Oklahoma, New Mexico, Louisiana, Alabama and Arkansas. We operate a majority of our projects through the drilling and production phases. Our staff has a great deal of experience in the operations arena. We have traditionally leveraged the risks associated with drilling by obtaining industry partners to share in the costs.
In addition, the Company, through PPC, owns approximately 20.8 miles of pipelines located in Texas, which are used for the gathering of natural gas. These gathering lines are located in the Fort Worth Basin and are being utilized to transport the Company's natural gas as well as natural gas produced by third parties.
Website Access to Our Reports
We make available free of charge through our website, www.spindletopoil.com, our annual report on Form 10-K, quarterly reports on Form 10-Q, current reports on Form 8-K, and all amendments to those reports as soon as reasonably practicable after such material is electronically filed with the Securities and Exchange Commission. Information on our website is not a part of this report.
Operating Approach
We believe that a major attribute of the Company is its long history with, and extensive knowledge of, the Fort Worth Basin of Texas. Our technical staff has an average of over 22 years oil and gas experience, most of it in the Fort Worth Basin.
One of our strengths has been the ability of the Company to look at cost effective ways to grow our production. We have traditionally increased our reserve base in one of two ways. Initially, in the 1970s and 1980s, the Company obtained its production through an exploration and development drilling program focused principally in the Fort Worth Basin of North Texas. Today, the Company has retained many of these wells as producing properties and holds a large amount of acreage by production in that Basin.
From the 1990s through 2003, the Company took advantage of the lower product prices by cost effectively adding to its reserve base through value-priced acquisitions. We found that through selective purchases we could make producing property acquisitions that were more cost effective than drilling.
During this time period, the Company acquired a large number of operated and non-operated oil and gas properties in various states.
From 2003 through the fourth quarter of 2008, we returned our focus to a strategy of development drilling with an emphasis on our Barnett Shale acreage. Since 2009, our focus has evolved to seek value-priced acquisitions combined with the development of economically feasible drilling prospects. Currently we are continuing our efforts to acquire producing properties and develop our leasehold acreage. We are pursuing controlled growth through acquisitions of good quality producing properties as well as through the drilling of new wells. With current oil and natural gas prices and high costs to produce, we believe that it is prudent to carefully evaluate all our options and make sure that each transaction can be supported in today’s price environment.
| 3 |
Strategic Business Plans
One of our key strategies is to attempt to maintain shareholder value through implementation of plans for selective drilling and value priced acquisitions to the extent the economics of such projects work in this low energy price environment and development of assets. The Company's long-term focus is to grow its oil and natural gas production through a strategic combination of selected property acquisitions, and an exploration and development program primarily based on developing its leasehold acreage. Additionally, the Company plans to continue to rework existing wells to increase production and reserves when feasible.
The Company's primary area of operation has been in the State of Texas with an emphasis in the geological province known as the Fort Worth Basin. We plan to continue to focus on operations in Texas, and we want to capitalize on our strengths which include an extensive knowledge of the various reservoirs in Texas, experience in operations in this geographic area, development of lease holdings, and utilization of existing infrastructure to minimize costs.
The Company will continue to generate and evaluate prospects using its own technical staff. The Company intends to fund operations primarily from cash flow generated by its operations.
Project Significant Areas
The Company owns various interests in wells located in 14 states and the Company’s operations are currently located in 6 of those states which include Alabama, Arkansas, Louisiana, Oklahoma, New Mexico and Texas.
The Company holds approximately 90,231 gross acres under lease in 14 states. The majority of the leases are held by production. A breakout of the Company’s leasehold acreage by geographic area is as follows:
| Operated | Non-Operated | Percent | ||||||
| Properties | Properties | Total | of Total | |||||
| Gross | Net | Gross | Net | Gross | Net | Gross | Net | |
| Geographic Area | Acres | Acres | Acres | Acres | Acres | Acres | Acres | Acres |
| North Texas (1) | 7,383 | 6,847 | 2,140 | 252 | 9,524 | 7,099 | 10.56% | 32.19% |
| East Texas | 2,802 | 2,343 | 9,165 | 1,144 | 11,967 | 3,487 | 13.26% | 15.81% |
| Gulf Coast Texas | 1,244 | 1,229 | 2,250 | 65 | 3,494 | 1,294 | 3.87% | 5.87% |
| West Texas | 1,275 | 1,030 | 2,451 | 119 | 3,726 | 1,149 | 4.13% | 5.21% |
| Texas Panhandle | 1,760 | 1,195 | 1,520 | 104 | 3,280 | 1,300 | 3.64% | 5.89% |
| Alabama | 1,160 | 634 | 2,829 | 198 | 3,989 | 832 | 4.42% | 3.77% |
| Arkansas | 2,296 | 1,938 | 2,957 | 109 | 5,252 | 2,047 | 5.82% | 9.28% |
| Louisiana | 838 | 589 | 3,058 | 151 | 3,896 | 739 | 4.32% | 3.35% |
| New Mexico | 2,600 | 1,779 | 400 | 7 | 3,000 | 1,786 | 3.32% | 8.10% |
| Oklahoma | 317 | 184 | 33,165 | 1,072 | 33,482 | 1,256 | 37.11% | 5.70% |
| Colorado | - | 1,200 | 64 | 1,200 | 64 | 1.33% | 0.29% | |
| Kansas | - | 640 | 184 | 640 | 184 | 0.71% | 0.83% | |
| Michigan | - | 240 | 6 | 240 | 6 | 0.27% | 0.03% | |
| Mississippi | - | 140 | 6 | 140 | 6 | 0.16% | 0.03% | |
| Montana | - | 690 | 45 | 690 | 45 | 0.76% | 0.20% | |
| North Dakota | - | 1,182 | 138 | 1,182 | 138 | 1.31% | 0.63% | |
| Utah | - | 2,729 | 487 | 2,729 | 487 | 3.02% | 2.21% | |
| Wyoming | - | 1,800 | 134 | 1,800 | 134 | 1.99% | 0.61% | |
| Total | 21,675 | 17,768 | 68,556 | 4,285 | 90,231 | 22,053 | 100.00% | 100.00% |
| (1) North Texas includes the Fort Worth Basin & Bend Arch | ||||||||
| 4 |
The majority of the Company’s net acres (65%) are located in Texas.
A breakout of the Company's most significant oil and gas reserves by geographic area is as follows:
| BOE | ||
| North Texas including the Fort Worth Basin & Bend Arch | 501,864 | 52.34% |
| East Texas | 153,730 | 16.03% |
| Panhandle Texas | 69,260 | 7.22% |
| West Texas | 58,547 | 6.11% |
| Total Texas | 783,400 | 81.71% |
| Alabama | 72,640 | 7.58% |
| Oklahoma | 33,892 | 3.53% |
| New Mexico | 40,063 | 4.18% |
| Louisiana | 25,410 | 2.65% |
| Montana | 2,453 | 0.26% |
| Kansas | 972 | 0.10% |
| Total Other States | 175,430 | 18.29% |
| Total | 958,830 | 100.00% |
North Texas - Fort Worth Basin & Bend Arch
The Fort Worth Basin-Bend Arch Province has been a focal point of the Company since its inception. Our technical personnel have an average of 22 years of exploration, drilling, completing, and production experience extracting natural gas and oil from both conventional and unconventional hydrocarbon deposits found across the basin. Furthermore, the Company maintains comprehensive and extensive dossiers of geologic and engineering data gathered from the province.
The Fort Worth Basin-Bend Arch Province is a major United States onshore natural gas-prone expanse containing multiple pay zones that range in depth from one thousand to nine thousand (1,000-9,000) feet. Improved technical advances in fracturing and stimulation technologies have helped unlock natural gas and oil reserves from the hydrocarbon bearing Barnett Shale Formation; and thus, continue to bolster vigorous exploration and development activities that target these conventional and unconventional reservoir reserves throughout the province.
The Barnett Shale is a thick natural gas and oil bearing stratigraphic zone found throughout the Fort Worth Basin-Bend Arch Province. The natural gas reserves in place are significant; however, as a consequence of the extreme low permeability character of the shales, it has been technically challenging to produce these reserves. According to the United States Geological Survey assessment, an estimated 26.7 trillion cubic feet (TCF) of undiscovered natural gas, 98.5 MMBO of undiscovered oil, as well as a mean of 1.1 BBNGL of undiscovered natural gas liquids reserves remain within the 54,000 square mile Fort Worth Basin-Bend Arch Province. More than 98 percent or approximately 26.2 TCF of the undiscovered natural gas is contained in the organic-rich Mississippian Barnett Shale. Combined, recent advances in hydraulic fracturing, completion procedures, and improvements in pump technology, as well as refined horizontal well drilling technologies, continue to enable the economic recovery of natural gas and oil reserves from tight low-permeability reservoirs found throughout the Fort Worth Basin-Bend Arch Province. Undiscovered conventional reservoir natural gas reserves are estimated to be 467 billion cubic feet of gas (BCFG), the majority of which is dissolved in conventional oil accumulations (source: United States Geological Survey Energy Resource Program).
| 5 |
The Company has 9,524 gross acres under lease across the prolific Fort Worth Basin-Bend Arch Province, the majority of which is held by production from the more shallow producing zones. The Company uses recent and emerging technologies, as well as proven industry practices, to develop and produce oil and natural gas from its properties. Additionally, the Company has a dedicated and well-trained team of employees and professional staff that continually seek out low-risk profitable drilling and acquisition opportunities throughout the Fort Worth Basin-Bend Arch Province.
West Texas
During the fourth quarter of 2014, the Company participated for a 2.62033% non-operated working interest with a 2.12903% net revenue interest in the drilling of the Moore Hooper #1H well located in Phantom (Wolfcamp) field of Loving County, Texas. The well is a horizontal well targeting the Wolfcamp “B”. The well was spud on November 6, 2014 and drilled with a smaller drilling rig. The surface casing was set and cemented at 4,260 ft. on November 11, 2014 and the rig was released. A larger rig was moved in and began drilling on January 2, 2015, and on January 11, 2015, 7-inch intermediate casing was run to 10,708 ft. and cemented-in. The lateral reached a MD of 15,309 ft. on January 27, 2015, and 4.5-inch casing was set and cemented into the 6.125-inch hole on February 18, 2015. The reported TVD was 11,086 ft. and the stimulated portion of the lateral was 3,286 ft. long (top of perf. to lower perf). The well was hydraulically fractured using the plug-n-perf method from February 25, 2015 through March 9, 2015, with 3,785,562 lbs of proppant, 39,000 gallons of 15% acid, and 68,691 bbls. of gel in 14 stages. The perforations were reported to be from 11,524 ft. to 14,810 ft. in the Wolfcamp “B”. The well was placed gas lift and had an initial potential of 432 bopd, 2,017 mcfgpd, and 2,520 bwpd on March 27, 2015.
During the fourth quarter of 2014, the Company participated for a 2.62033% non-operated working interest with a 2.12903% net revenue interest in the drilling of the Moore Hooper #2H well located in the Phantom (Wolfcamp) field of Loving County, Texas. The well is a horizontal well targeting the Wolfcamp “A”. The well was spud on November 26, 2014, and surface casing was set at a depth of 4,183 ft. and cemented in. The operator utilized a smaller rig to drill the vertical and curve portion of the well and to set the surface and intermediate casing. The intermediate casing was set and cemented through the curve at a depth of 10,197 ft. on December 13, 2014. A larger rig was moved in and began drilling the lateral on February 13, 2015, and reached total measured depth of 16,160 ft. with a TVD of 10,909 ft. on February 25, 2015. On February 28, 2015, 4.5-inch casing with sliding sleeves was run to TMD and cemented-in. The well was hydraulically fractured using sliding sleeves. Stage 1 and 2 were completed on March 20, 2015 and the remaining 12 stages were completed March 31, 2015 through April 2, 2015, with 5,729,932 lbs. of proppant, 1,128 bbls. of acid, and 56,650 bbls. of gel. The perforations were reported to be from 10,536 ft. to 11,403 ft. in the Wolfcamp “A”. The well was placed on gas lift and had an initial potential of 1,198 bopd, 1,327 mcfgpd, and 2,767 bwpd on April 23, 2015.
The Company participated for a 2.62033% non-operated working interest with a 2.12903% net revenue interest in the drilling of the Moore Hooper #3H well located in the Phantom (Wolfcamp) field of Loving County, Texas. The well is a horizontal well targeting the Wolfcamp “A”. The well was spud on December 14, 2014, and surface casing was set and cemented at a depth of 4,215 ft. on December 23, 2014. The vertical and the curve portion of the well were then drilled and intermediate casing was set and cemented through the curve at a depth of 10,090 ft. on January 4, 2015 using a smaller rig. A larger rig was moved in and began drilling the lateral on April 29, 2015, and reached total measured depth of 16,160 ft. with a TVD of 10,800 ft. on May 16, 2015. On May 18, 2015, 4.5-inch casing was run to TMD of 16,099 ft. and cemented-in. The well was hydraulically fractured with 26 stages using the plug-n-perf method from June 11, 2015 through June 19, 2015, with 9,529,520 lbs.of proppant, 3,345 bbls of acid, and 160,522 bbls. of gel. The well had an initial potential of 1,620 bopd, 4,255 mcfpd, and 4,420 bwpd on July 16, 2015.
During the fourth quarter of 2014, the Company, as Operator, drilled the Miller #2 well located in the Noodle, NW (Canyon Sand) field of Jones County, Texas. The well is a vertical well targeting the Canyon Sands. The well was spud on October 11, 2014, and reached a TD of 4,360 ft. on October 21, 2014. On October 23, 2014, 5.5-inch production casing was set to 4,358 ft. and cemented in-place. The Canyon Sands were perforated from 3,997 ft. to 4,017 ft. on February 3, 2015. The perfs were broken down with 1,000 gallons of 10% NEFE acid. The well was swabbed for two days and then built pressure for eight days. On February 21, 2015, the Canyon Sands were
| 6 |
hydraulically fractured with 58,112 lbs. of proppant and 1,116 bbls of gel. On May 28, 2015 the well was re-fractured in the previous interval with 18,984 gallons linear gel, 645,252 scf of N2 and 67,276# 20-40 mesh sand. The well was then swabbed for four days and rods were run into the hole on June 11, 2015. The well has temporarily abandoned. The Company owns a 76% working interest, with a 67.375% net revenue interest.
Texas Panhandle
During the third quarter of 2014, the Company, as Operator, participated for a 29.1606% working interest with a 21.87045% net revenue interest in the drilling of the Pope #140-4H well in the Pan Petro (Cleveland) Field in Ochiltree County, Texas. The horizontal well was spud on July 9, 2014, and reached a total measured depth of 8,874 ft. on August 15, 2014, in the Cleveland Sand Formation. The TVD was 6,486 ft. and the lateral length was approximately 1,943 ft. On August 15, 2014, 4.5-inch production casing with an open hole packer system was run from 6,187 ft. to 8,666 ft. and set. On January 28, 2015, the Cleveland Sand was hydraulically fractured in 10 stages from 6,931 ft. to 8,691 ft. with 1,110,680 lbs. of proppant, 14,528 bbls of cross linked gel/XL lightning and 5,313,715 scf Nitrogen (30% Foam quality). From January 28, 2015 through March 10, 2015, activities on the well consisted of flowing back, running of tubing, a packer and gas lift valves in the wellbore, the installation of production facilities, gathering lines, setting a gas lift compressor and installing metering. The well was tested on March 22, 2015 with an initial potential of 57 bopd, 106 mcfgpd and 54 bwpd.
Subsequent to the end of the year, the Company acquired an additional working interest of 3.2144% with a net revenue interest of 2.4108% in the Company’s Pope #140-4H well located in the Pan Petro (Cleveland) Field in Ochiltree County, Texas. This acquisition brought the Company’s interest in the well to a total 32.375% working interest with a 24.28125% net revenue interest.
East Texas
During the third quarter of 2014, the Company participated for a 1.30148796% non-operated working interest with a 1.261019% net revenue interest in the drilling of the Carr-Ward #2H well located in the Halliday (Woodbine) Field of Leon County, Texas. The well was spud on October 7, 2014, reached a total measured depth of 15,521 ft. on November 16, 2014, and casing was run in the lateral and tied back to the intermediate casing on November 21, 2014. The well is a horizontal well targeting the Woodbine Sands at a depth of 7,267 ft. TVD. The well was hydraulically fractured using the plug-n-perf method from December 22, 2014 through December 29, 2014, with 7,153,447 lbs. of proppant, in 24 stages. The perforations were reported from 8,050 ft. to 15,385 ft. in the Woodbine Sand. The well was placed on gas lift and had an initial potential of 302 bopd, 434 mcfgpd, and 383 bwpd on March 3, 2015.
North Texas
During the first quarter of 2015, the Company acquired two (2) working interests, each being 1.142857% with a net revenue interest of 0.857143% in the Company’s Lebleu #1 well located in the Sipes Springs (Marble Falls) field in Comanche County, Texas. Subsequent to the end of the year, the Company acquired an additional working interest of 2.285714% with a net revenue interest of 1.714285% in the Company’s Lebleu #1 well. The additional acquisitions brought the Company’s interest in the well to a total 73.848574% working interest with a 55.386432% net revenue interest.
Effective June 1, 2015, the Company sold eight (8) operated wells in Eastland County Texas, ranging from 70% to 100%, with 52.5% to 75% net revenue. Also included in the sale was a 5.3 mile natural gas pipeline owned and operated by PPC.
Subsequent to the end of the year, the Company acquired a working interest of 1.00% with a net revenue interest of 0.75% in the Company’s Joyce Taylor B #1 well located in Palo Pinto County, Texas. This acquisition brought the Company’s interest in the well to a total 89% working interest with a 67% net revenue interest.
| 7 |
South Texas
Effective September 1, 2015, the Company divested its non-operated working interest of 7.599968% with a net revenue interest of 5.901747% in the Lehrer # 1 well. The well is a natural gas well that produces from the Wilcox in the Easter field in Colorado County, Texas.
Effective November 1, 2015, the Company sold nine (9) operated wells in the Texas Gulf Coast area. One (1) well was located in Bee County, five (5) wells were located in Jackson County, and three (3) wells were located in Victoria County, Texas.
During the fourth quarter of 2015, the Company acquired operations of the Welder Ranch #2A well in which the Company previously had a non-operated working interest. The additional working interest acquired increased the Company’s working interest to 100% with a net revenue interest of 70%.
Also in the fourth quarter of 2015, the Company sold two (2) wells in the Texas Gulf Coast area. One well was located in Chambers County, Texas and the other well was located in Victoria County, Texas.
New Mexico
During the third quarter of 2014, the Company participated in the drilling, completion and equipping phase of the State Line #1 well located in the Sawyer Field of Lea County, New Mexico. The well was drilled to a depth of 5,438 ft. in the San Andres Formation. Production casing was set and cemented in the wellbore. The San Andres was perforated from 4,934 ft. to 4,998 ft. and acidized with 5,000 gals of 15% acid. The well was placed on pump on September 25, 2014. The average production of the first 30 days was 4 bopd and 4 bswpd, while pump testing and then the well was shut-in awaiting permanent surface facilities. Surface facilities including electrification were completed and the well resumed pumping on February 18, 2015 at an initial rate of 19.4 bopd and 8.4 bwpd. The Company owns a 6.25% non-operated working interest with a 4.6875% net revenue interest.
Arkansas
Effective October 1, 2015, the Company sold its non-operated working interests ranging from 0.3472% to 0.5625%, with 0.2605% to 0.421875% net revenue interests in twelve (12) natural gas wells located in Logan County, Arkansas.
California
Effective October 1, 2015, the Company sold its non-operated working interests in three (3) natural gas wells located in Colusa County, California.
.
Oklahoma
Effective November 1, 2015, the Company divested non-operated working interests of 2.7% with net revenue interests of 2.4% in two (2) natural gas wells located in Haskell County, Oklahoma.
Alabama
Subsequent to year end, effective February 1, 2016, the Company divested its non-operated working interest of 8.69841% with a net revenue interest of 7.10451% in an oil unit located in Lamar County, Alabama.
For all of the above wells, the Company cautions that the initial production rates of a newly completed well or newly recompleted well or the production rates at the effective date of acquisition may not be an indicator of stabilized production rates or an indicator of the ultimate recoveries obtained.
| 8 |
Oil and Natural Gas Reserves
The Company’s net proved oil and natural gas reserves have been estimated by Company personnel. (See footnote 18 to the financial statements). No separate independent reserve report analysis has been prepared by an independent third party.
The net proved crude oil and natural gas reserves of the Company as of December 31, 2015 were 285,540 barrels of oil and condensate and 4.040 BCF of natural gas. Based on SEC guidelines, the reserves were classified as follows:
| Barrels of Oil |
BCF Gas | |
| Proved Developed Producing | 285,540 | 4.040 |
| Proved Developed Non-Producing | - | - |
| Proved Undeveloped | - | - |
| Total Proved Reserves | 285,540 | 4.040 |
Only reserves that fell within the Proved classification were considered. Other categories such as Probable or Possible Reserves were not considered. No value was given to the potential future development of behind pipe reserves, untested fault blocks, or the potential for deeper reservoirs underlying the Company's properties. Shut-in uneconomic wells and insignificant non-operated interests were excluded.
On a BOE (barrel of oil equivalent) basis (6 MCF/BOE), the net reserves are:
| Barrels of Oil Equivalent (BOE) |
||
| Natural Gas Reserves | 673,290 | 70% |
| Oil Reserves | 285,540 | 30% |
| Total Reserves | 958,830 | 100% |
| Proved Developed Producing | 958,830 | 100% |
| Proved Developed Non-Producing | - | 0% |
| Proved Undeveloped | - | 0% |
| Total Proved Reserves | 958,830 | 100% |
The Company has operational control over the majority of these reserves and can therefore to a large extent control the timing of development and production.
| Barrels of Oil Equivalent (BOE) |
||
| Operated Wells | 716,633 | 75% |
| Non-Operated Wells | 242,197 | 25% |
| Total | 958,830 | 100% |
| 9 |
Financial Information Relating to Industry Segments
The Company has three identifiable business segments: (1) exploration, acquisition, development and production of oil and natural gas, (2) natural gas gathering, and (3) commercial real estate investment. Footnote 15 to the Consolidated Financial Statements filed herein sets forth the relevant information regarding revenues, income from operations, and identifiable assets for these segments.
Narrative Description of Business
The Company is engaged in the exploration, development, acquisition and production of oil and natural gas, and the gathering and marketing of natural gas. The Company is also engaged in commercial real estate leasing through leasing office space to non-related third party tenants in the Company’s corporate headquarters office building.
Principal Products, Distribution and Availability
The principal products marketed by the Company are crude oil and natural gas which are sold to major oil and gas companies, brokers, pipelines and distributors, and oil and natural gas properties which are acquired and sold to oil and natural gas development entities. Reserves of oil and natural gas are depleted upon extraction, and the Company is in competition with other entities for the discovery of new prospects.
The Company is also engaged in the gathering and marketing of natural gas through its subsidiary PPC, which owns 20.8 miles of pipelines, and currently gathers approximately 1,033 mcfgpd. Natural gas is gathered for a fee. Substantially all of the natural gas gathered by the Company is produced from wells that the Company operates and in which it owns a working interest.
The Company owns land and a two story commercial office building in Dallas, Texas, which it uses as its principal headquarters office. The Company leases the remainder of the building to non-related third party commercial tenants at prevailing market rates.
Patents, Licenses and Franchises
Oil and natural gas leases of the Company are obtained from the owner of the mineral estate. The leases are generally for a primary term of three or more years, and often have extension options for an equivalent period as the original primary term for payment of additional bonus consideration. The leases customarily provide for extension beyond their primary term for as long as oil and natural gas are produced in commercial quantities or other operations are conducted on such leases as provided by the terms of the leases.
The Company currently holds interests in producing and non-producing oil and natural gas leases. The existence of the oil and natural gas leases and the terms of the oil and natural gas leases are important to the business of the Company because future additions to reserves will come from oil and natural gas leases currently owned by the Company, and others that may be acquired, when they are proven to be productive. The Company is continuing to purchase oil and natural gas leases in areas where it currently has production, and also in other areas.
| 10 |
Dependence on Customers
The following is a summary of significant purchasers / operators (listed by percent of total oil and natural gas sales) from oil and natural gas produced by the Company for the three-year period ended December 31, 2015.
| Purchaser / Operator | 2015 | 2014 | 2013 |
| New Gulf Resources | 16% | 9% | 0% |
| Targa Midstream Service, LIM | 9% | 8% | 5% |
| Eastex Crude Company | 8% | 7% | 7% |
| Pruet Production Co. | 7% | 6% | 13% |
| Enbridge Energy Partners | 7% | 12% | 6% |
| Enlink Gas Marketing, LTD. | 6% | 4% | 0% |
| Sunoco Partners Marketing | 5% | 5% | 4% |
| OXY USA, Inc. | 4% | 0% | 0% |
| Shell Trading (US) Company | 4% | 5% | 8% |
| Valero Energy Corporation | 3% | 1% | 0% |
| Phillips 66 | 2% | 1% | 1% |
| Ward Petrolum Corporation | 2% | 1% | 1% |
| DCP Midstream, LP | 2% | 1% | 1% |
| LPC Crude Oil Marketing LLC | 2% | 2% | 0% |
| Midcoast Energy Partners LP | 2% | 2% | 0% |
| Enervest Operating, LLC | 2% | 2% | 2% |
| Enterprise Crude Oil, LLC | 2% | 2% | 2% |
| Agave Energy Company | 1% | 2% | 0% |
| Gulfmark Energy, Inc. | 0% | 0% | 3% |
| Crosstex Gulf Coast Mktg | 0% | 0% | 5% |
| Holly Corp (Formerly Navajo Refining Co.) | 0% | 2% | 2% |
| Halcon Resources Operating, Inc. | 0% | 9% | 28% |
Oil and natural gas is sold to approximately 119 different purchasers under market sensitive, short-term contracts computed on a month to month basis.
Except as set forth above, there are no other customers of the Company that individually accounted for more than two percent of the Company's oil and natural gas revenues during the three years ended
December 31, 2015.
The Company currently has no hedged contracts.
Prospective Drilling Activities
The Company's primary oil and natural gas prospect generation and acquisition efforts have been in known producing areas in the United States with emphasis devoted to Texas.
The Company intends to use a portion of its available funds to participate in drilling activities. The Company does not own any drilling rigs. Independent drilling contractors perform all drilling activity. The Company does not refine or otherwise process its oil and natural gas production.
Exploration for oil and natural gas is normally conducted with the Company acquiring undeveloped oil and natural gas leases under prospects, and carrying out exploratory drilling on the prospective leasehold with the Company retaining a majority interest in the prospect. Interests in the property are sometimes sold to key employees and associated companies at cost. Also, interests may be sold to third parties with the Company retaining an overriding royalty interest, carried working interest, or a reversionary interest.
| 11 |
A prospect is a geographical area designated by the Company for the purpose of searching for oil and natural gas reserves and reasonably expected by it to contain at least one oil or natural gas reservoir. The Company utilizes its own funds along with the issuance of common stock and options to purchase common stock in some limited cases, to acquire oil and gas leases covering the lands comprising the prospects. These leases are selected by the Company and are obtained directly from the landowners, as well as from land men, geologists, other oil companies, some of whom may be affiliated with the Company, and by direct purchase, farm-in, or option agreements. After an initial test well is drilled on a property, any subsequent development drilling of such prospect will normally require the Company to fund the development activities.
Employees
As of December 31, 2015, the Company employed or contracted for the services of a total of approximately seventy-two people. Twenty-five are full-time employees. The remainder are part-time employees or independent contractors. We believe that our relationships with our employees are good.
In order to effectively utilize our resources, we employ the services of independent consultants and contractors to perform a variety of professional, technical, and field services, including in the areas of lease acquisition, land related documentation and contracts, drilling and completion work, pumping, inspection, testing, maintenance and specialized services. We believe that it can be more cost effective to utilize the services of consultants and independent contractors for some of these services.
We depend to a large extent on the services of certain key management personnel and officers, and the loss of any these individuals could have a material adverse effect on our operations. The Company does not maintain key-man life insurance policies on its employees.
Financial information about foreign and domestic operations and export sales
All of the Company's business is conducted domestically, with no export sales.
Compliance with Environmental Regulations
Our oil and natural gas operations are subject to numerous United States federal, state, and local laws and regulations relating to the protection of the environment, including those governing the discharge of materials into the water and air, the generation, management and disposal of hazardous substances and wastes, and clean-up of contaminated sites. We could incur material costs, including clean-up costs, fines, civil and criminal sanctions, and third party claims for property damage and personal injury as a result of violations of, or liabilities under, environmental laws and regulations. Such laws and regulations not only expose us to liability for our own activities, but may also expose us to liability for the conduct of others or for actions by us that were in compliance with all applicable laws at the time those actions were taken. In addition, we could incur substantial expenditures complying with environmental laws and regulations, including future environmental laws and regulations which may be more stringent.
Glossary of Oil and Gas Terms
The following are abbreviations and definitions of terms commonly used in the oil and gas industry that are used in this Report. The terms defined herein may be found in this report in both upper and lower case or a combination of both.
"BBL" means a barrel of 42 U.S. gallons.
“BBNGL” means billion barrels of natural gas liquids.
“BCF” or “BCFG” means billion cubic feet.
"BOE" means barrels of oil equivalent; converting volumes of natural gas to oil equivalent volumes using a ratio of six Mcf of natural gas to one Bbl of oil.
| 12 |
“BOPD” means barrels of oil per day.
"BTU" means British Thermal Units. British Thermal Unit means the quantity of heat required to raise the temperature of one pound of water by one degree Fahrenheit.
“BSWPD” means barrels of salt water per day.
"Completion" means the installation of permanent equipment for the production of oil or natural gas.
"Development Well" means a well drilled within the proved area of an oil or natural gas reservoir to the depth of a strata graphic horizon known to be productive.
"Dry Hole" or "Dry Well" means a well found to be incapable of producing hydrocarbons in sufficient quantities such that proceeds from the sale of such production exceed production expenses and taxes.
"Exploratory Well" means a well drilled to find and produce oil or natural gas reserves not classified as proved, to find a new production reservoir in a field previously found to be productive of oil or natural gas in another reservoir or to extend a known reservoir.
"Farm-Out" means an agreement pursuant to which the owner of a working interest in an oil and natural gas lease assigns the working interest or a portion thereof to another party who desires to drill on the leased acreage. Generally, the assignee is required to drill one or more wells in order to earn its interest in the acreage. The assignor usually retains a royalty or reversionary interest in the lease. The interest received by an assignee is a "farm-in" and the assignor issues a "farm-out."
"Farm-In" see "Farm-Out" above.
"Gas" means natural gas.
"Gross" when used with respect to acres or wells, refers to the total acres or wells in which we have a working interest.
"Infill Drilling" means drilling of an additional well or wells provided for by an existing spacing order to more adequately drain a reservoir.
"MCF" or “MCFG” means thousand cubic feet.
“MCFGPD” means thousand cubic feet of natural gas per day.
"MCFE" means MCF of natural gas equivalent; converting volumes of oil to natural gas equivalent volumes using a ratio of one BBL of oil to six MCF of natural gas.
“MD” means measured depth.
“MMBO” means million barrels of oil.
"MMBTU" means one million BTUs.
"Net" when used with respect to acres or wells, refers to gross acres or wells multiplied, in each case, by the percentage working interest owned by the Company.
"Net Production" means production that is owned by the Company less royalties and production due others.
"Non-Operated" or "Outside Operated" means wells that are operated by a third party.
“Oil and Gas” means oil and natural gas.
| 13 |
"Operator" means the individual or company responsible for the exploration, development, production and management of an oil or gas well or lease.
“Overriding Royalty” means a royalty interest which is usually reserved by an owner of the leasehold in connection with a transfer to a subsequent owner.
"Present Value" ("PV") when used with respect to oil and natural gas reserves, means the estimated future gross revenues to be generated from the production of proved reserves calculated in accordance with the guidelines of the SEC, net of estimated production and future development costs as of the date of estimation without future escalation, and discounted using an annual discount rate of 10%. Prices are not escalated and are computed using a 12-month average price, calculated as the un-weighted arithmetic average of the first-day-of-the month price for each month of the year (except to the extent a contract specifically provides otherwise). No effect is given to non-property related expenses such as general and administrative expenses, debt service, future income tax expense and depreciation, depletion and amortization.
"Productive Wells" or "Producing Wells" consist of producing wells and wells capable of production, including wells waiting on pipeline connections.
"Proved Developed Reserves" means reserves that can be expected to be recovered through existing wells with existing equipment and operating methods. Additional oil and natural gas expected to be obtained through the application of fluid injection or other improved recovery techniques for supplementing the natural forces and mechanisms of primary recovery will be included as "proved developed reserves" only after testing by a pilot project or after the operation of an installed program has confirmed through production response that increased recovery will be achieved.
"Proved Reserves" means the estimated quantities of crude oil and natural gas which upon analysis of geological and engineering data appear with reasonable certainty to be recoverable in future years from known reservoirs under existing economic and operating conditions, i.e., prices and costs as of the date the estimate is made. Prices include consideration of changes in existing prices provided only by contractual arrangements, but not on escalations based upon future conditions.
(i) Reservoirs are considered proved if either actual production or conclusive formation
tests support economic producibility. The area of a reservoir considered proved
includes (A) that portion delineated by drilling and defined by gas-oil and/or oil-water
contacts, if any; and (B) the immediately adjoining portions not yet drilled, but which
can be reasonably judged as economically productive on the basis of available geological
and engineering data. In the absence of information on fluid contacts, the lowest known
structural occurrence of hydrocarbons controls the lower proved limit of the reservoir.
(ii) Reserves which can be produced economically through application of improved recovery
techniques (such as fluid injection) are included in the "proved" classification when successful
testing by a pilot project, or the operation of an installed program in the reservoir, provides
support for the engineering analysis on which the project or program was based.
(iii) Estimates of proved reserves do not include the following: (A) oil that may become
available from known reservoirs but is classified separately as "indicated additional reserves";
(B) crude oil and natural gas, the recovery of which is subject to reasonable doubt because of
uncertainty as to geology, reservoir characteristics or economic factors; (C) crude oil and
natural gas that may occur in undrilled prospects; and (D) crude oil and natural gas that may
be recovered from oil shales, coal, gilsonite and other such resources.
"Proved Undeveloped Reserves" means reserves that are recovered from new wells on undrilled acreage, or from existing wells where a relatively major expenditure is required for completion. Reserves on undrilled acreage shall be limited to those drilling units offsetting productive units that are reasonably certain of production when drilled. Proved reserves for other undrilled units can be claimed only where it can be demonstrated with certainty that there is continuity of production from the existing productive formation. Under no circumstances should estimates for proved
| 14 |
undeveloped reserves be attributable to any acreage for which an application of fluid injection or other improved recovery technique is contemplated, unless such techniques have been proved effective by actual tests in the area and in the same reservoir.
"Recompletion" means the completion for production of an existing well bore in another formation from that in which the well has been previously completed.
"Reserves" means proved reserves.
"Reservoir" means a porous and permeable underground formation containing a natural accumulation of producible oil and/or gas that is confined by impermeable rock or water barriers and is individual and separate from other reservoirs.
"Royalty" means an interest in an oil and natural gas lease that gives the owner of the interest the right to receive a portion of the production from the leased acreage (or of the proceeds of the sale thereof), but generally does not require the owner to pay any portion of the costs of drilling or operating the wells on the leased acreage. Royalties may be either landowner's royalties, which are reserved by the owner of the leased acreage at the time the lease is granted, or overriding royalties, which are usually reserved by an owner of the leasehold in connection with a transfer to a subsequent owner.
“TCF” means trillion cubic feet.
“TD” means total depth.
“TVD” means true vertical depth,
"2-D Seismic" means an advanced technology method by which a cross-section of the earth's subsurface is created through the interpretation of reflecting seismic data collected along a single source profile.
"3-D Seismic" means an advanced technology method by which a three dimensional image of the earth's subsurface is created through the interpretation of reflection seismic data collected over a surface grid. 3-D seismic surveys allow for a more detailed understanding of the subsurface than do conventional surveys and contribute significantly to field appraisal, development and production.
"Working Interest" means an interest in an oil and natural gas lease that gives the owner of the interest the right to drill for and produce oil and gas on the leased acreage and requires the owner to pay a share of the costs of drilling and production operations. The share of production to which a working interest owner is entitled will always be smaller than the share of costs that the working interest owner is required to bear, with the balance of the production accruing to the owners of royalties.
"Workover" means operations on a producing well to restore or increase production.
Item 1A. Risk Factors
Risks related directly to our Company
One should carefully consider the following risk factors, in addition to the other information set forth in this Report, before investing in shares of our common stock. Each of these risk factors could adversely affect our business, operating results and financial condition, as well as adversely affect the value of an investment in our common stock. Some information in this Report may contain "forward-looking" statements that discuss future expectations of our financial condition and results of operation. The risk factors noted in this section and other factors could cause our actual results to differ materially from those contained in any forward-looking statements.
Uncertainties regarding the global economic and financial environment could lead to an extended national or global economic recession. A slowdown in economic activity caused by a recession would likely reduce national and worldwide demand for oil and natural gas and result in lower commodity prices for long periods of time. Costs of
| 15 |
exploration, development and production have not yet adjusted to current economic conditions, or in proportion to the significant reduction in product prices.
In the past several years, capital and credit markets have experienced volatility and disruption. Given the levels of market volatility and disruption, the availability of funds from those markets may diminish substantially. Further, arising from concerns about the stability of financial markets generally and the solvency of borrowers specifically, the cost of accessing the credit markets has increased as many lenders have raised interest rates, enacted tighter lending standards, or altogether ceased to provide funding to borrowers.
Due to these potential capital and credit market conditions, the Company cannot be certain that funding will be available in amounts or on terms acceptable to the Company. The Company is evaluating whether current cash balances and cash flow from operations alone would be sufficient to provide working capital to fully fund the Company's operations. Accordingly, the Company is evaluating alternatives, such as joint ventures with third parties, or sales of interest in one or more of its properties. Such transactions, if undertaken, could result in a reduction in the Company's operating interests or require the Company to relinquish the right to operate the property. There can be no assurance that any such transactions can be completed or that such transactions will satisfy the Company's operating capital requirements. If the Company is not successful in obtaining sufficient funding or completing an alternative transaction on a timely basis on terms acceptable to the Company, the Company would be required to curtail its expenditures or restructure its operations, and the Company would be unable to continue its exploration, drilling, and recompletion program, any of which would have a material adverse effect on its business, financial condition, and results of operations.
We face significant competition, and many of our competitors have resources in excess of our available resources.
The oil and natural gas industry is highly competitive. We encounter competition from other oil and gas companies in all areas of our operations, including the acquisition of producing properties and sale of crude oil and natural gas. Our competitors include major integrated oil and gas companies and numerous independent oil and gas companies, individuals, and drilling and income programs. Many of our competitors are large, well-established companies with substantially larger operating staffs and greater capital resources than us. Such companies may be able to pay more for productive oil and gas properties and exploratory prospects and to define, evaluate, bid for and purchase a greater number of properties and prospects than our financial or human resources permit. Our ability to acquire additional properties and to discover reserves in the future will depend upon our ability to evaluate and select suitable properties and to consummate transactions in this highly competitive environment.
Exploratory drilling is a speculative activity that may not result in commercially productive reserves and may require expenditures in excess of budgeted amounts.
Drilling activities are subject to many risks, including the risk that no commercially productive oil or natural gas reservoirs will be encountered. There can be no assurance that new wells drilled by us will be productive or that we will recover all or any portion of our investment. Drilling for oil and natural gas may involve unprofitable efforts, not only from dry wells, but also from wells that are productive but do not produce sufficient net revenues to return a profit after drilling, operating and other costs. The cost of drilling, completing and operating wells is often uncertain. Our drilling operations may be curtailed, delayed or canceled as a result of a variety of factors, many of which are beyond our control, including economic conditions, mechanical problems, pressure or irregularities in formations, title problems, weather conditions, compliance with governmental requirements, and shortages in or delays in the delivery of equipment and services. In today's environment, shortages make drilling rigs, labor and services difficult to obtain and could cause delays or inability to proceed with our drilling and development plans. Such equipment shortages and delays sometimes involve drilling rigs where inclement weather prohibits the movement of land rigs causing a high demand for rigs by a large number of companies during a relatively short period of time. Our future drilling activities may not be successful. Lack of drilling success could have a material adverse effect on our financial condition and results of operations.
| 16 |
Our operations are also subject to all the hazards and risks normally incident to the development, exploitation, production and transportation of, and the exploration for, oil and natural gas, including unusual or unexpected geologic formations, pressures, down hole fires, mechanical failures, blowouts, explosions, uncontrollable flows of oil, natural gas or well fluids and pollution and other environmental risks. These hazards could result in substantial losses to us due to injury and loss of life, severe damage to and destruction of property and equipment, pollution and other environmental damage and suspension of operations. We participate in insurance coverage maintained by the operator of its wells, although there can be no assurances that such coverage will be sufficient to prevent a material adverse effect to us in such events.
The vast majority of our oil and natural gas reserves are classified as proved reserves. Recovery of the Company's future proved undeveloped reserves will require significant capital expenditures. Our management estimates that additional capital expenditures will be required to fully develop some of these reserves in the next twelve month period. No assurance can be given that our estimates of capital expenditures will prove accurate, that our financing sources will be sufficient to fully fund our planned development activities or that development activities will be either successful or in accordance with our schedule. Additionally, any significant decrease in oil and natural gas prices or any significant increase in the cost of development could result in a significant reduction in the number of wells drilled and/or reworked. No assurance can be given that any wells will produce oil or natural gas in commercially profitable quantities.
We are subject to uncertainties in reserve estimates and future net cash flows.
This annual report contains estimates of our oil and natural gas reserves and the future net cash flows from those reserves. These estimates have been prepared by Company personnel for 2015, 2014 and 2013. There are numerous uncertainties inherent in estimating quantities of reserves of oil and natural gas and in projecting future rates of production and the timing of development expenditures, including many factors beyond our control. The reserve estimates in this annual report are based on various assumptions, including, for example, constant oil and natural gas prices, operating expenses, capital expenditures and the availability of funds, and therefore, are inherently imprecise indications of future net cash flows. Actual future production, cash flows, taxes, operating expenses, development expenditures and quantities of recoverable oil and gas reserves may vary substantially from those assumed in the estimates. Any significant variance in these assumptions could materially affect the estimated quantity and value of reserves set forth in this annual report. Additionally, our reserves may be subject to downward or upward revision based upon actual production performance, results of future development and exploration, prevailing oil and natural gas prices and other factors, many of which are beyond our control.
The present value of future net reserves discounted at 10% (the "PV-10") of proved reserves referred to in this annual report should not be construed as the current market value of the estimated proved reserves of oil and gas attributable to our properties. In accordance with applicable requirements of the SEC, the estimated discounted future net cash flows from proved reserves are generally based on prices and costs as of the date of the estimate, whereas actual future prices and costs may be materially higher or lower. Actual future net cash flows also will be affected by: (i) the timing of both production and related expenses; (ii) changes in consumption levels; and (iii) governmental regulations or taxation. In addition, the calculation of the present value of the future net cash flows using a 10% discount as required by the SEC is not necessarily the most appropriate discount factor based on interest rates in effect from time to time and risks associated with our reserves or the oil and gas industry in general. Furthermore, our reserves may be subject to downward or upward revision based upon actual production, results of future development, supply and demand for oil and natural gas, prevailing oil and natural gas prices and other factors. See "Properties - Oil and Gas Reserves."
| 17 |
Unless we replace our oil and natural gas reserves, our reserves and production will decline, which would adversely affect our cash flows and income.
Unless we conduct successful development, exploitation and exploration activities or acquire properties containing proved reserves, our proved reserves will decline as those reserves are produced. Producing oil and natural gas reservoirs generally are characterized by declining production rates that vary depending upon reservoir characteristics and other factors. Our future oil and natural gas reserves and production, and, therefore our cash flow and income, are highly dependent on our success in efficiently developing and exploiting our current reserves and economically finding or acquiring additional recoverable reserves. We may be unable to make such acquisitions because we are:
| · | unable to identify attractive acquisition candidates or negotiate acceptable purchase contracts with them; |
| · | unable to obtain financing for these acquisitions on economically acceptable terms; or |
| · | outbid by competitors. |
If we are unable to develop, exploit, find or acquire additional reserves to replace our current and future production, our cash flow and income will decline as production declines, until our existing properties would be incapable of sustaining commercial production.
There are risks in acquiring producing oil and natural gas properties, including difficulties in integrating acquired properties into our business, additional liabilities and expenses associated with acquired properties, diversion of management attention, increasing the scope, geographic diversity and complexity of our operations.
One of our business strategies includes growing our reserve base through acquisitions of oil & gas properties. Our failure to integrate acquired properties successfully into our existing business, or the expense incurred in consummating future acquisitions, could result in unanticipated expenses and losses. In addition, we may assume cleanup or reclamation obligations or other unanticipated liabilities in connection with these acquisitions. The scope and cost of these obligations may ultimately be materially greater than estimated at the time of the acquisition.
We are continually investigating opportunities for acquisitions. In connection with future acquisitions, the process of integrating acquired operations into our existing operations may result in unforeseen operating difficulties and may require significant management attention and financial resources that would otherwise be available for the ongoing development or expansion of existing operations. Our ability to make future acquisitions may be constrained by our ability to obtain additional financing.
Possible future acquisitions could result in our incurring debt, contingent liabilities and expense, all of which could have a material effect on our financial condition and operating results.
Acquisitions may prove to be worth less than we paid because of uncertainties in evaluating recoverable reserves and potential liabilities.
Successful acquisitions require an assessment of a number of factors, including estimates of recoverable reserves, exploration potential, recovery applicability from water flood and Enhanced Oil Recovery techniques (“EOR”), future oil and natural gas prices, operating costs and potential environmental and other liabilities. Such assessments are inexact and their accuracy is inherently uncertain. In connection with our assessments, we perform a review of the acquired properties which we believe is generally consistent with industry practices. However, such a review will not reveal all existing or potential problems. In addition, our review may not permit us to become sufficiently familiar with the properties to fully assess their deficiencies and capabilities. We do not inspect every well or property. Even when we inspect a well or property, we do not always discover structural, subsurface and environmental problems that may exist or arise. We are generally not entitled to contractual indemnification for pre-closing liabilities, including environmental liabilities. Normally, we acquire interests in properties on an “as is” basis with limited
| 18 |
remedies for breaches of representations and warranties. As a result of these factors, we may not be able to acquire oil and natural gas properties that contain economically recoverable reserves or be able to complete such acquisitions on acceptable terms.
Additionally, significant acquisitions can change the nature of our operations and business depending upon the character of the acquired properties, which may have substantially different operating and geological characteristics or be in different geographic locations than our existing properties. It is our current intention to continue focusing on acquiring properties with development and exploration potential located in onshore United States. To the extent that we acquire properties substantially different from the properties in our primary operating regions or acquire properties that require different technical expertise, we may not be able to realize the economic benefits of these acquisitions as efficiently as in our prior acquisitions.
We cannot control activities on properties we do not operate. Failure to fund capital expenditure requirements may result in reduction or forfeiture of our interests in some of our non-operated projects.
We do not operate some of the properties in which we have an interest and we have limited ability to exercise influence over operations for these properties or their associated costs. As of December 31, 2015, approximately 25% of our crude oil and natural gas proved reserves were operated by other companies. Our dependence on other operators and other working interest owners for these projects and our limited ability to influence operations and associated costs could materially adversely affect the realization of our targeted return on capital in drilling or acquisition activities and our targeted production growth rate. The success and timing of drilling, development and exploitation activities on properties operated by others depend on a number of factors that are beyond our control, including the operator’s expertise and financial resources, approval of other participants for drilling wells and utilization of technology.
When we are not the majority owner or operator of a particular crude oil or natural gas project, we may have no control over the timing or amount of capital expenditures associated with such project. If we are not willing or able to fund our capital expenditures relating to such projects when required by the majority owner or operator, our interests in these projects may be reduced or forfeited.
We are subject to risks associated with the current United States Government Administration’s proposed budget features.
The Obama administration has set forth budget proposals which if passed, would significantly curtail our ability to attract investors and raise capital. Proposed changes in the Federal income tax laws which would eliminate or reduce the percentage depletion deduction and the deduction for intangible drilling and development costs for small independent producers, will significantly reduce the investment capital available to those in the industry as well as our Company. Lengthening the time to expense seismic costs will also have an adverse effect on our ability to explore and find new reserves.
We are subject to various operating and other casualty risks that could result in liability exposure or the loss of production and revenues.
Our oil and gas business involves a variety of operating risks, including, but not limited to, unexpected formations or pressures, uncontrollable flows of oil, natural gas, brine or well fluids into the environment (including groundwater contamination), blowouts, fires, explosions, pollution and other risks, any of which could result in personal injuries, loss of life, damage to properties and substantial losses. Although we carry insurance at levels that we believe are reasonable, we are not fully insured against all risks. We do not carry business interruption insurance. Losses and liabilities arising from uninsured or under-insured events could have a material adverse effect on our financial condition and operations.
From time to time, due primarily to contract terms, pipeline interruptions or weather conditions, the producing wells in which we own an interest have been subject to production curtailments. The curtailments range from production being partially restricted to wells being completely shut-in. The duration of curtailments varies from a few days to
| 19 |
several months. In most cases, we are provided only limited notice as to when production will be curtailed and the duration of such curtailments. We are not currently experiencing any material curtailment of our production.
We intend to increase to some extent our development and, to a lesser extent, exploration activities. Exploration drilling and, to a lesser extent, development drilling of oil and gas reserves involve a high degree of risk that no commercial production will be obtained and/or that production will be insufficient to recover drilling and completion costs. The cost of drilling, completing and operating wells is often uncertain. Our drilling operations may be curtailed, delayed or canceled as a result of numerous factors, including title problems, weather conditions, compliance with governmental requirements and shortages or delays in the delivery of equipment. Furthermore, completion of a well does not assure a profit on the investment or a recovery of drilling, completion and operating costs.
We depend on our key management personnel and technical experts and the loss of any of these individuals could adversely affect our business.
If we lose the services of our key management personnel, technical experts or are unable to attract additional qualified personnel, our business, financial condition, results of operations, development efforts and ability to grow could suffer. We have assembled a team of engineers and geologists who have considerable experience in applying advanced drilling and completion techniques to explore for and to develop crude oil and natural gas. We depend upon the knowledge, skill and experience of these experts to assist us in improving the performance and reducing the risks associated with our participation in crude oil and natural gas exploration and development projects. In addition, the success of our business depends, to a significant extent, upon the abilities and continued efforts of our management, particularly Chris Mazzini, our Chief Executive Officer, President and Chairman of the Board. We do not have an employment agreement with or key-man life insurance on Mr. Mazzini or any of our other employees.
Certain of our affiliates control a majority of our outstanding common stock, which may affect your vote as a shareholder.
Our executive officers, directors and their affiliates hold approximately 85% of our outstanding shares of common stock. As a result, officers, directors and their affiliates and such shareholders have the ability to exert significant influence over our business affairs, including the ability to control the election of directors and results of voting on all matters requiring shareholder approval. This concentration of voting power may delay or prevent a potential change in control.
Certain of our affiliates have engaged in business transactions with the Company, which may result in conflicts of interest.
Certain officers, directors and related parties, including entities controlled by Mr. Mazzini, the President and Chief Executive Officer, have engaged in business transactions with the Company which were not the result of arm's length negotiations between independent parties. Our management believes that the terms of these transactions were as favorable to us as those that could have been obtained from unaffiliated parties under similar circumstances. All future transactions between us and our affiliates will be on terms no less favorable than could be obtained from unaffiliated third parties and will be approved by a majority of the disinterested members of our Board of Directors.
Our common stock is traded on the Over-the-Counter market and is currently quoted on the OTC Market (Other), symbol "SPND".
The liquidity of our common stock may be adversely affected, and purchasers of our common stock may have difficulty selling our common stock, if our common stock does not continue to trade in that or another suitable trading market.
| 20 |
There is presently only a limited public market for our common stock, and there is no assurance that a ready public market for our securities will develop. It is likely that any market that develops for our common stock will be highly volatile and that the trading volume in such market will be limited. The trading price of our common stock could be subject to wide fluctuations in response to quarter-to-quarter variations in our operating results, announcements of our drilling results and other events or factors. In addition, the United States stock market has from time to time experienced extreme price and volume fluctuations that have affected the market price for many companies and which often have been unrelated to the operating performance of these companies. These broad market fluctuations may adversely affect the market price of our securities.
We do not intend to declare dividends in the foreseeable future.
Our Board of Directors presently intends to retain all of our earnings for the expansion of our business. We therefore do not anticipate the distribution of cash dividends in the foreseeable future. Any future decision of our Board of Directors to pay cash dividends will depend, among other factors, upon our earnings, financial position and cash requirements.
We are subject to certain title risks.
Our company employees and contract land professionals have reviewed title records or other title review materials relating to substantially all of our producing properties. The title investigation performed by us prior to acquiring undeveloped properties is thorough, but less rigorous than that conducted prior to drilling, consistent with industry standards. We believe we have satisfactory title to all our producing properties in accordance with standards generally accepted in the oil and gas industry. Our properties are subject to customary royalty interests, liens incident to operating agreements, liens for current taxes and other burdens, which we believe do not materially interfere with the use of or affect the value of such properties. At December 31, 2015, our leaseholds for some of our net acreage were being kept in force by virtue of production on that acreage in paying quantities. The remaining net acreage was held by lease rentals and similar provisions and requires production in paying quantities prior to expiration of various time periods to avoid lease termination.
We expect to make acquisitions of oil and gas properties from time to time subject to available resources. In making an acquisition, we generally focus most of our title and valuation efforts on the more significant properties. It is generally not feasible for us to review in-depth every property we purchase and all records with respect to such properties. However, even an in-depth review of properties and records may not necessarily reveal existing or potential problems, nor will it permit us to become familiar enough with the properties to assess fully their deficiencies and capabilities. Evaluation of future recoverable reserves of oil and gas, which is an integral part of the property selection process, is a process that depends upon evaluation of existing geological, engineering and production data, some or all of which may prove to be unreliable or not indicative of future performance. To the extent the seller does not operate the properties, obtaining access to properties and records may be more difficult. Even when problems are identified, the seller may not be willing or financially able to give contractual protection against such problems, and we may decide to assume environmental and other liabilities in connection with acquired properties.
Our business is highly capital-intensive, requiring continuous development and acquisition of oil and gas reserves. In addition, capital is required to operate and expand our oil and natural gas field operations and purchase equipment. At December 31, 2015, we had working capital of $10,025,000. We anticipate that we will be able to meet our cash requirements for the next 12 months. However, if such plans or assumptions change or prove to be inaccurate, we could be required to seek additional financing sooner than currently anticipated.
We have funded our operations, acquisitions and expansion costs primarily through our internally generated cash flow. Our success in obtaining the necessary capital resources to fund future costs associated with our operations and expansion plans is dependent upon our ability to: (i) increase revenues through acquisitions and recovery of our proved producing and proved developed non-producing oil and gas reserves; and (ii) maintain effective cost controls
| 21 |
at the corporate administrative office and in field operations. However, even if we achieve some success with our plans, there can be no assurance that we will be able to generate sufficient revenues to achieve significant profitable operations or fund our expansion plans.
We have substantial capital requirements necessary for undeveloped properties for which we may not be able to obtain adequate financing.
Development of our properties will require additional capital resources. We have no commitments to obtain any additional debt or equity financing and there can be no assurance that additional financing will be available, when required, on favorable terms to us. The inability to obtain additional financing could have a material adverse effect on us, including requiring us to curtail significantly our oil and gas acquisition and development plans or farm-out development of our properties. Any additional financing may involve substantial dilution to the interests of our shareholders at that time.
Oil and natural gas prices fluctuate widely and low prices could have a material adverse impact on our business and financial results.
Our revenues, profitability and the carrying value of our oil and gas properties are substantially dependent upon prevailing prices of, and demand for, oil and natural gas and the costs of acquiring, finding, developing and producing reserves. Our ability to obtain borrowing capacity, to repay future indebtedness, and to obtain additional capital on favorable terms is also substantially dependent upon oil and natural gas prices. Historically, the markets for oil and natural gas have been volatile and are likely to continue to be volatile in the future. Prices for oil and natural gas are subject to wide fluctuations in response to: (i) relatively minor changes in the supply of, and demand for, oil and natural gas; (ii) market uncertainty; and (iii) a variety of additional factors, all of which are beyond our control. These factors include domestic and foreign political conditions, the price and availability of domestic and imported oil and natural gas, the level of consumer and industrial demand, weather, domestic and foreign government relations, the price and availability of alternative fuels and overall economic conditions. Furthermore, the marketability of our production depends in part upon the availability, proximity and capacity of gathering systems, pipelines and processing facilities. Volatility in oil and natural gas prices could affect our ability to market our production through such systems, pipelines or facilities. As of December 31, 2015, approximately 84% of our oil and natural gas production is currently sold to 18 purchasing firms on a month-to-month basis at prevailing spot market prices. Oil prices remained subject to unpredictable political and economic forces during 2015, 2014, and 2013, and experienced fluctuations similar to those seen in natural gas prices for the year. We believe that oil prices will continue to fluctuate in response to changes in the policies of the Organization of Petroleum Exporting Countries ("OPEC"), changes in demand from many Asian countries, current events in the Middle East and Eastern Europe, security threats to the United States, and other factors associated with the world political and economic environment. As a result of the many uncertainties associated with levels of production maintained by OPEC and other oil producing countries, the availabilities of worldwide energy supplies and competitive relationships and consumer perceptions of various energy sources, we are unable to predict what changes will occur in crude oil and natural gas prices. (See Management’s Discussion and Analysis under “Results of Operations” for discussion of the significant decline in revenue due to low oil and natural gas prices during 2015).
We may be responsible for additional costs in connection with abandonment of properties.
We are responsible for payment of plugging and abandonment costs on our oil and gas properties pro rata to our working interest. Based on our experience, we anticipate that in most cases, the ultimate aggregate salvage value of lease and well equipment located on our properties should equal to the costs of abandoning such properties. There can be no assurance, however, that we will be successful in avoiding additional expenses in connection with the abandonment of any of our properties. In addition, abandonment costs and their timing may change due to many factors, including actual production results, inflation rates and changes in environmental laws and regulations.
| 22 |
Risks that Involve the Oil & Gas Industry in General.
We are subject to various governmental regulations which may cause us to incur substantial costs.
Our operations are affected from time to time in varying degrees by political developments and federal, state, and local laws and regulations. In particular, oil and natural gas production-related operations are or have been subject to price controls, taxes and other laws and regulations relating to the oil and gas industry. Failure to comply with such laws and regulations can result in substantial penalties. The regulatory burden on the oil and gas industry increases our cost of doing business and affects our profitability. Although we believe we are in substantial compliance with all applicable laws and regulations, because such laws and regulations are frequently amended or reinterpreted, we are unable to predict the future cost or impact of complying with such laws and regulations.
Sales of natural gas by us are not regulated and are generally made at market prices. However, the Federal Energy Regulatory Commission ("FERC") regulates interstate natural gas transportation rates and service conditions, which affect the marketing of natural gas produced by us, as well as the revenues received by us for sales of such production. Sales of our natural gas currently are made at uncontrolled market prices, subject to applicable contract provisions and price fluctuations that normally attend sales of commodity products.
Since the mid-1980s, the FERC has issued a series of orders, culminating in Order Nos. 636, 636-A and 636-B ("Order 636"), that have significantly altered the marketing and transportation of natural gas. Order 636 mandated a fundamental restructuring of interstate pipeline sales and transportation service, including the unbundling by interstate pipelines of the sale, transportation, storage and other components of the city-gate sales services such pipelines previously performed. One of the FERC's purposes in issuing the orders was to increase competition within all phases of the natural gas industry. Order 636 and subsequent FERC orders issued in individual pipeline restructuring proceedings have been the subject of appeals, and the courts have largely upheld Order 636. Because further review of certain of these orders is still possible, and other appeals may be pending, it is difficult to exactly predict the ultimate impact of the orders on us and our natural gas marketing efforts. Generally, Order 636 has eliminated or substantially reduced the interstate pipelines' traditional role as wholesalers of natural gas, and has substantially increased competition and volatility in natural gas markets.
While significant regulatory uncertainty remains, Order 636 may ultimately enhance our ability to market and transport our natural gas, although it may also subject us to greater competition, more restrictive pipeline imbalance tolerances and greater associated penalties for violation of such tolerances.
The FERC has announced several important transportation-related policy statements and proposed rule changes, including the appropriate manner in which interstate pipelines release capacity under Order 636 and, more recently, the price which shippers can charge for their released capacity. In addition, in 1995, the FERC issued a policy statement on how interstate natural gas pipelines can recover the costs of new pipeline facilities. In January 1997, the FERC issued a policy statement and a request for comments concerning alternatives to its traditional cost-of-service rate making methodology. A number of pipelines have obtained FERC authorization to charge negotiated rates as one such alternative. While any additional FERC action on these matters would affect us only indirectly, these policy statements and proposed rule changes are intended to further enhance competition in natural gas markets. We cannot predict what the FERC will take on these matters, nor can we predict whether the FERC's actions will achieve its stated goal of increasing competition in natural gas markets. However, we do not believe that we will be treated materially differently than other natural gas producers and marketers with which we compete.
The price we receive from the sale of oil is affected by the cost of transporting such products to market. Effective January 1, 1995, the FERC implemented regulations establishing an indexing system for transportation rates for oil pipelines, which, generally, would index such rates to inflation, subject to certain conditions and limitations. These regulations could increase the cost of transporting oil by interstate pipelines, although the most recent adjustment
| 23 |
generally decreased rates. These regulations have generally been approved on judicial review. We are not able to predict with certainty the effect, if any, of these regulations on its operations. However, the regulations may increase transportation costs or reduce wellhead prices for oil.
The State of Texas and many other states require permits for drilling operations, drilling bonds and reports concerning operations and impose other requirements relating to the exploration for and production of oil and natural gas. Such states also have statutes or regulations addressing conservation matters, including provisions for the unitization or pooling of oil and gas properties, the establishment of maximum rates of production from wells and the regulation of spacing, plugging and abandonment of such wells. The statutes and regulations of certain states limit the rate at which oil and gas can be produced from our properties. However, we do not believe we will be affected materially differently by these statutes and regulations than any other similarly situated oil and gas company.
We may not have enough insurance to cover all of the risks we face, which could result in significant financial exposure.
We maintain insurance coverage against some, but not all, potential losses in order to protect against the risks we face. We may elect not to carry insurance if our management believes that the cost of insurance is excessive relative to the risks presented. If an event occurs that is not covered, or not fully covered, by insurance, it could harm our financial condition, results of operations and cash flows. In addition, we cannot fully insure against pollution and environmental risks.
We are subject to various environmental risks which may cause us to incur substantial costs.
Our operations and properties are subject to extensive and changing federal, state and local laws and regulations relating to environmental protection, including the generation, storage, handling and transportation of oil and natural gas and the discharge of materials into the environment, and relating to safety and health. The recent trend in environmental legislation and regulation generally is toward stricter standards, and this trend will likely continue. These laws and regulations may require the acquisition of a permit or other authorization before construction or drilling commences and for certain other activities; limit or prohibit construction, drilling and other activities on certain lands lying within wilderness and other protected areas; and impose substantial liabilities for pollution resulting from our operations. The permits required for our various operations are subject to revocation, modification and renewal by issuing authorities. Governmental authorities have the power to enforce compliance with their regulations, and violations are subject to fines, penalties or injunctions. In the opinion of management, we are in substantial compliance with current applicable environmental laws and regulations, and we have no material commitments for capital expenditures to comply with existing environmental requirements. Nevertheless, changes in existing environmental laws and regulations or in interpretations thereof could have a significant impact on us. The impact of such changes, however, would not likely be any more burdensome to us than to any other similarly situated oil and gas company.
The Comprehensive Environmental Response, Compensation, and Liability Act ("CERCLA"), also known as the "Superfund" law, and similar state laws impose liability, without regard to fault or the legality of the original conduct, on certain classes of persons that are considered to have contributed to the release of a "hazardous substance" into the environment. These persons include the owner or operator of the disposal site or sites where the release occurred and companies that disposed or arranged for the disposal of the hazardous substances found at the site. Persons who are or were responsible for releases of hazardous substances under CERCLA may be subject to joint and several liabilities for the costs of cleaning up the hazardous substances that have been released into the environment and for damages to natural resources. Furthermore, neighboring landowners and other third parties may file claims for personal injury and property damage allegedly caused by the hazardous substances released into the environment.
We generate typical oil and gas field wastes, including hazardous wastes that are subject to the Federal Resources Conservation and Recovery Act and comparable state statutes. The United States Environmental Protection Agency and various state agencies have limited the approved methods of disposal for certain hazardous and non-hazardous
| 24 |
wastes. Furthermore, certain wastes generated by our oil and gas operations that are currently exempt from regulation as "hazardous wastes" may in the future be designated as "hazardous wastes", and therefore be subject to more rigorous and costly operating and disposal requirements.
The Oil Pollution Act ("OPA") imposes a variety of requirements on responsible parties for onshore and offshore oil and gas facilities and vessels related to the prevention of oil spills and liability for damages resulting from such spills in waters of the United States. The "responsible party" includes the owner or operator of an onshore facility or vessel or the lessee or permittee of, or the holder of a right of use and easement for, the area where an onshore facility is located. OPA assigns liability to each responsible party for oil spill removal costs and a variety of public and private damages from oil spills. Few defenses exist to the liability for oil spills imposed by OPA. OPA also imposes financial responsibility requirements. Failure to comply with ongoing requirements or inadequate cooperation in a spill event may subject a responsible party to civil or criminal enforcement actions.
We own or lease properties that for many years have produced oil and natural gas. We also own natural gas gathering systems. It is not uncommon for such properties to be contaminated with hydrocarbons. Although we or previous owners of these interests may have used operating and disposal practices that were standard in the industry at the time, hydrocarbons or other wastes may have been disposed of or released on or under the properties or on or under other locations where such wastes have been taken for disposal. These properties may be subject to federal or state requirements that could require us to remove any such wastes or to remediate the resulting contamination. In addition to properties that we operate, we have interests in many properties which are operated by third parties over whom we have limited control. Notwithstanding our lack of control over properties operated by others, the failure of the previous owners or operators to comply with applicable environmental regulations may, in certain circumstances, adversely impact us.
Item 1B. Unresolved Staff Comments
None
Item 2. Properties
OIL AND GAS PROPERTIES
The following table sets forth pertinent data with respect to the Company-owned oil and gas properties, all located within the continental United States, as estimated by the Company:
| Years Ended December 31, | |||
| 2015 | 2014 | 2013 | |
| Gas and Oil Properties, net (1) | |||
| Proved developed gas reserves-Mcf (2) | |||
| Proved developed producing | 4,040,000 | 6,839,000 | 6,735,000 |
| Proved developed non-producing | - | - | 27,000 |
| Proved undeveloped gas reserves-Mcf (3) | - | - | - |
| Total proved gas reserves-Mcf | 4,040,000 | 6,839,000 | 6,762,000 |
| Proved Developed Crude Oil and | |||
| Condensate reserves-Bbls (2) | |||
| Proved developed producing | 286,000 | 405,000 | 419,000 |
| Proved developed non-producing | - | - | 31,000 |
| Proved Undeveloped crude oil and | - | ||
| Condensate reserves-Bbls (3) | - | - | - |
| 286,000 | 405,000 | 450,000 | |
| 25 |
(1) The estimate of the net proved oil and natural gas reserves, future net revenues, and the present value of future net revenues.
(2) "Proved Developed Oil and Natural gas Reserves" are reserves that can be expected to be recovered through existing wells with existing equipment and operating methods.
(3) "Proved Undeveloped Reserves" are reserves that are expected to be recovered from new wells on undrilled acreage, or from existing wells where a relatively major expenditure is required for recompletion. See Footnote 18 to the Financial Statements, Supplemental Reserve Information (Unaudited), for further explanation of the changes for 2013 through 2015.
(4) Reserve amounts are rounded to the nearest thousand.
Productive Wells
The following table sets forth our domestic productive wells and includes both operated wells and wells operated by third parties at December 31, 2015.
| Gas Wells | Oil Wells | Total Wells | |||
| Gross | Net | Gross | Net | Gross | Net |
| 285 | 71.26 | 180 | 59.71 | 465 | 130.97 |
Acreage
The following table sets forth our undeveloped and developed gross and net leasehold acreage for our operated and non-operated wells at December 31, 2015. Undeveloped acreage includes leased acres on which wells have not been drilled or completed to a point that would permit the production of commercial quantities of oil and gas, regardless of whether or not such acreage contains proved reserves. Undeveloped acreage should not be confused with undrilled acreage held by Production under the terms of a lease. Undrilled acreage held by production under the terms of a lease is included in the Developed Acreage category total shown below.
| Undeveloped Acreage |
Developed Acreage |
Total Acreage | |||
| Gross | Net | Gross | Net | Gross | Net |
| 5,264 | 2,027 | 90,231 | 22,053 | 95,495 | 24,080 |
All the leases for the undeveloped acreage summarized in the preceding table will expire at the end of their respective primary terms unless prior to that date, the existing leases are renewed or production has been obtained from the acreage subject to the lease, in which event the lease will remain in effect until the cessation of production. As is customary in the industry, we generally acquire oil and gas acreage without any warranty of title except as to claims made by, through or under the transferor. Although we have title to developed acreage examined prior to acquisition in those cases in which the economic significance of the acreage justifies the cost, there can be no assurance that losses will not result from title defect or from defects in the assignment of leasehold rights.
| 26 |
Wells Drilled and Completed
The Company's working interests in both operated and outside operated exploration and development wells completed during the years indicated were as follows:
| 2015 | 2014 | 2013 | ||||
| Gross | Net | Gross | Net | Gross | Net | |
| Exploratory Wells (1): | ||||||
| Productive | - | - | - | - | - | - |
| Non-Productive | - | - | - | - | - | - |
| Total | - | - | - | - | - | - |
| Developed Wells (2): | ||||||
| Productive | 6.000 | 1.143 | 5.000 | 1.222 | 11.000 | 1.191 |
| Non-Productive | - | - | - | - | - | - |
| Total | 6.000 | 1.143 | 5.000 | 1.222 | 11.000 | 1.191 |
| Total Exploration & Development Wells: | ||||||
| Productive | 6.000 | 1.143 | 5.000 | 1.222 | 11.000 | 1.191 |
| Non-Productive | - | - | - | - | - | - |
| Total | 6.000 | 1.143 | 5.000 | 1.222 | 11.000 | 1.191 |
(1) An exploratory well is a well drilled to find and produce oil or natural gas in an unproved area, to find a new reservoir in a field previously found to be productive of oil or natural gas in another reservoir, or to extend a known reservoir.
(2) A development well is a well drilled within the proved area of an oil or natural gas reservoir to the depth of a stratigraphic horizon known to be productive.
The following tables set forth additional data with respect to production from Company-owned oil and gas operated and non-operated properties, all located within the continental United States:
| For the years ended December 31, | |||||
| 2015 | 2014 | 2013 | 2012 | 2011 | |
| Oil and Gas Production, net: | |||||
| Natural Gas (Mcf) | 730,709 | 739,948 | 736,645 | 791,708 | 733,816 |
| Crude Oil & Condensate (Bbl) | 64,207 | 89,068 | 89,872 | 79,514 | 48,708 |
| Average Sales Price per Unit Produced | |||||
| Natural Gas (Mcf) | $2.51 | $4.53 | $4.05 | $3.64 | $5.34 |
| Crude Oil & Condensate (Bbl) | $44.77 | $93.38 | $105.38 | $89.50 | $83.85 |
| Average Production Cost per Equivalent Barrel (1) (2) | $15.94 | $15.23 | $16.58 | $16.65 | $19.02 |
(1) Includes severance taxes and ad valorem taxes.
| 27 |
(2) Natural gas production is converted to equivalent barrels at the rate of six MCFG per barrel, representing relative energy content of natural gas to oil.
The Company owns producing royalties and overriding royalties under properties located in Texas. The revenue from these properties is not significant.
The Company is not aware of any major discovery or other favorable or adverse event that is believed to have caused a significant change in the estimated proved reserves since December 31, 2015.
OFFICE SPACE
The Company owns a commercial office building. The property is a two story multi-tenant, garden office building with a sub-grade parking garage. The 34 year old building contains approximately 46,286 rentable square feet and sits on a 1.4919 acre block of land situated in north Dallas, Texas in close proximity to hotels, restaurants and shopping areas (the Galleria Mall) with easy access to Interstate Highway 635 (LBJ Freeway) and Dallas Parkway (North Dallas Toll Road). The Company occupies approximately 12,759 rentable square feet of the building as its primary office headquarters, and leases the remaining space in the building to non-related third party commercial tenants at prevailing market rates.
The address of the Company's principal executive offices is One Spindletop Centre, 12850 Spurling Road, Suite 200, Dallas, Texas 75230. The telephone number is (972) 644-2581.
PIPELINES
The Company owns, through its subsidiary, PPC, 20.8 miles of natural gas pipelines in Parker and Palo Pinto Counties, Texas. These pipelines are steel and polyethylene and range in size from two inches to four inches. These pipelines primarily gather natural gas from wells operated by the Company and in which the Company owns a working interest, but also for other parties.
The Company normally does not purchase and resell natural gas, but gathers natural gas for a fee. The fees charged in some cases are subject to regulations by the State of Texas and the Federal Energy Regulatory Commission. Average daily volumes of natural gas gathered by the pipelines owned by the Company were 1,033, 1,063, and 1,096, mcfgpd for 2015, 2014, and 2013, respectively.
Oilfield Production Equipment
The Company owns various natural gas compressors, pumping units, dehydrators and various other pieces of oil field production equipment.
Substantially all of the equipment is located on oil and gas properties operated by the Company and in which it owns a working interest. The rental fees are charged as lease operating fees to each property and each owner.
Item 3. Legal Proceedings
Neither the Registrant nor its subsidiaries nor any officers or directors is a party to any material pending legal proceedings for or against the Company or its subsidiaries, nor are any of their properties subject to any proceedings.
During the fourth quarter of the fiscal year covered by this report, no proceeding previously reported was terminated.
Item 4. Mine Safety Disclosures
Not Applicable
| 28 |
PART II
Item 5. Market For The Company's Common Stock, Related Stockholder Matters And Issuer Purchases Of Equity Securities.
The Company's common stock trades Over-The-Counter under the symbol "SPND".
Prior to 2004, no significant public trading market had been established for the Company's common stock. The Company does not believe that listings of bid and asking prices for its stock are indicative of the actual trades of its stock, since trades are made infrequently. The following table shows high and low trading prices for each quarter in 2015, 2014, and 2013.
| Price Per Share | ||
| High | Low | |
| 2015 | ||
| First Quarter | $ 5.40 | $ 3.85 |
| Second Quarter | $ 4.43 | $ 3.90 |
| Third Quarter | $ 3.98 | $ 3.51 |
| Fourth Quarter | $ 3.80 | $ 1.96 |
| 2014 | ||
| First Quarter | $ 3.95 | $ 3.21 |
| Second Quarter | $ 6.06 | $ 3.45 |
| Third Quarter | $ 6.74 | $ 5.31 |
| Fourth Quarter | $ 5.90 | $ 4.55 |
| 2013 | ||
| First Quarter | $ 2.60 | $ 2.08 |
| Second Quarter | $ 4.15 | $ 2.50 |
| Third Quarter | $ 3.90 | $ 2.84 |
| Fourth Quarter | $ 3.92 | $ 3.21 |
| During the First Quarter of 2016 subsequent to year end, the following high and low prices were recorded for the Company's common stock | ||
| Price Per Share | ||
| High | Low | |
| 2016 | ||
| First Quarter | $ 1.91 | $ 1.40 |
There is no amount of common stock that is subject to outstanding warrants to purchase, or securities convertible into, common stock of the Company.
According to the transfer records of the Company at March 30, 2016, common stock of the Company was held by approximately 539 known holders of record.
| 29 |
The following chart compares the yearly percentage change in the cumulative total stockholder return on the Company's Common Stock during the five years ended December 31, 2015 with the cumulative total return of the Standard and Poor's 500 Stock Index and of the Dow Jones U.S. Exploration and Production Index (formerly Dow Jones Secondary Oil Stock Index). The comparison assumes $100 was invested on December 31, 2010 in the Company's Common Stock and in each of the foregoing indices and assumes reinvestment of dividends. The Company paid no dividends on its Common Stock during the five-year period. Figures shown are past results and are not predictive of results in future periods.
Stock Performance Chart
Comparison of Five-Year Cumulative Total Return Among
Spindletop Oil & Gas Co., S&P 500 Index and
the Dow Jones U.S. Exploration and Production Index
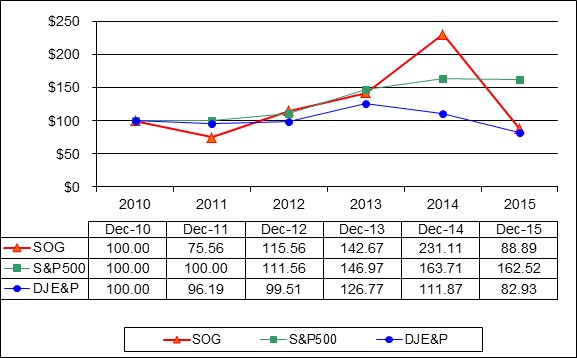
The Company has not paid any dividends since its reorganization and it is not contemplated that it will pay any dividends on its Common Stock in the foreseeable future.
The Registrant currently serves as its own stock transfer agent and registrar.
The Company has not approved nor authorized any standing repurchase program for its common stock.
The Company made no repurchases of its common stock during 2013, 2014 and 2015.
The repurchased shares are held as Treasury Stock.
| 30 |
Item 6. Selected Financial Data
The selected financial information presented should be read in conjunction with the consolidated financial statements and the related notes thereto.
| For the years ended December 31, | |||||
| 2015 | 2014 | 2013 | 2012 | 2011 | |
| Total Revenue | $ 5,944,000 | $ 13,208,000 | $ 13,547,000 | $ 12,106,000 | $ 9,340,000 |
| Net Income | (5,777,000) | 3,205,000 | 3,542,000 | 3,659,000 | 1,753,000 |
| Earnings per Share | $ (0.83) | $ 0.46 | $ 0.51 | $ 0.49 | $ 0.23 |
| For the years ended December 31, | |||||
| 2015 | 2014 | 2013 | 2012 | 2011 | |
| Total Assets | $ 25,889,000 | $ 33,506,000 | $ 28,195,000 | $ 24,653,000 | $ 23,279,000 |
| Long-Term Debt | - | - | - | 600,000 | 720,000 |
Item 7. Management's Discussion And Analysis Of Financial Condition And
Results Of Operations
Liquidity and Capital Resources
The Company's operating capital needs, as well as its capital spending program, are generally funded from cash flow generated by operations. Because future cash flow is subject to a number of variables, such as the level of production and the sales price of oil and natural gas, the Company can provide no assurance that its operations will provide cash sufficient to maintain current levels of capital spending. Continued substantial decreases in crude oil and natural gas prices would likely have a material adverse effect on the Company’s business, financial condition, and results of operations, and could further limit the Company's access to liquidity and credit, and could hinder its ability to satisfy its capital requirements. Accordingly, the Company may be required to seek additional financing from third parties in order to fund its exploration and development programs.
As noted in our Results of Operations discussion below, the Company has focused on lowering costs through headcount reduction by attrition and spending only on essential general and administrative expenditures. In order to raise additional revenue, the Company is pursuing the acquisition of new operated and non-operated reserves through drilling ventures and purchases of existing wells. The Company believes that it is well positioned to take advantage of the declining prices for existing wells with its cash reserves and ability to borrow in order to effect any acquisition.
Results of Operations
2015 Compared to 2014
Oil and natural gas revenues for the year ended December 31, 2015 were $4,841,000 compared to $11,688,000 for the year ended December 31, 2014, a decrease of $6,847,000 or 58.6%.
During the third quarter of 2014, oil and gas prices started to decline worldwide. The Company has experienced a similar decline in the selling prices of its oil and natural gas products as follows; Average quarterly crude oil prices
| 31 |
per barrel for the year ended December 31, 2014 were $113.76, $100.55, $98.05 and $83.03. Average quarterly natural gas prices per MCF for the same periods were $4.64, $4.71, $4.45, and $4.06 respectively. During 2015, average quarterly crude oil prices were $46.33, $54.48, $45.68, and $41.03. Average quarterly natural gas prices were $2.67, $2.46, $2.31, and $2.45 respectively. These declining prices have had a material detrimental effect on the Company’s crude oil and natural gas revenues over the last two years.
Oil revenue for 2015 was approximately $3,010,000 compared to $8,317,000 for 2014, a decrease of approximately $5,307,000 or 63.8%. Average oil prices decreased to an average of $44.77 per barrel in 2015 from an average of $93.38 per barrel in 2014, a decrease of $48.61 per barre or 52.1%. Oil sales decreased to 64,208 barrels from approximately 89,068 barrels in 2014, a decrease of 24,860 barrels or 27.9%. The decrease in oil revenue and sales is predominantly due the significant decreases in crude oil prices beginning in the second half of 2014, and which continued through 2015.
Natural gas revenue for 2015 was approximately $1,831,000 compared to $3,371,000 for 2014, a decrease of approximately $1,540,000 or 45.7%. Natural gas sales decreased to approximately 731,000 mcf in 2015 from approximately 740,000 mcf in 2014, a decrease of approximately 9,000 mcf or 1.2%. Natural gas prices decreased to an average of $2.51 per mcf in 2015, a decrease of $2.02 or 44.6% from an average of $4.53 per mcf in 2014.
Revenue from lease operations was approximately $481,000 for 2015, remaining constant compared to approximately $481,000 in 2014. Revenue from lease operations results from field supervision charges on operated wells as well as administrative overhead billed to working interest owners.
Revenues from gas gathering, compression, and equipment rental for 2015 were approximately $141,000, a decrease of $14,000 or 9.0% from approximately $155,000 in 2014. This was due primarily to a decrease in natural gas volume sold through PPC.
Real estate rental revenue for 2015 was approximately $230,000, down 4.2% or $10,000 from approximately $240,000 in 2014. The decrease was due to some tenant vacancies during 2015 as compared to 2014.
Interest income for 2015 was approximately $68,000, a decrease of $57,000 from approximately $125,000 in 2014 or 45.6%. The decrease in interest income was due to a significant decrease in interest rates paid by a banking institution where the Company had substantial deposits.
Other revenue for 2015 was $183,000, as compared to $519,000 in 2014, a decrease of $336,000 or 64.7%. This change is due primarily to the recognition of prospect participation fees earned under drilling ventures in 2014.
Lease operating expenses in 2015 were approximately $2,365,000 as compared to $2,240,000 in 2014, a net increase of $125,000, or 5.6%. Of this net increase, approximately $112,000 was due to new operated properties added since 2014, offset by a decrease of approximately $63,000 attributable to decreased operating expenses for non-operated leases. The remaining increase of $76,000 represented net increases and decreases on various properties due to general price fluctuations and levels of operational activity.
Production taxes, gathering, and marketing expenses for 2015 were approximately $600,000 compared to $996,000 in 2014, a decrease of approximately $396,000, or 39.8%. This decrease was directly related to the decrease in oil and natural gas production and revenues, which have been partially offset by overall gathering and marketing expenses for non-operated leases.
Pipeline and rental expenses for 2015 were $32,000 compared to $49,000 for 2014, a decrease of $17,000, or 34.7%. This decrease is primarily due to high repair expenses in 2014.
Real estate expenses in 2015 were approximately $215,000 compared to $220,000 during the same period in 2014, a decrease of approximately $5,000 or 2.3%.
| 32 |
Depreciation and amortization expense for 2015 was $2,426,000 compared to $1,846,000 for 2014, an increase of $580,000 or 31.4%. Amortization of the full cost pool of oil and natural gas assets for 2015 was $2,352,000 compared to $1,771,000 for the year ended 2014, an increase of $581,000 or 32.8%.
The Company re-evaluated its proved oil and gas reserves as of December 31, 2015, and decreased its estimated total proved reserves by approximately 585,000 BOE to 959,000 BOE at the end of 2015 compared to 1,544,000 BOE at the end of 2014, a decrease of approximately 37.9%. Sales of oil and natural gas products during 2015 decreased by 23,000 BOE from approximately 212,000 BOE in 2014 to approximately 186,000 BOE in 2015, a decrease of approximately 12.3 %. (See Footnote 18 to the Financial Statements). This resulted in an increase in the depletion rate factor from 12.090% in 2014 on an unamortized full cost pool base of $14,650,000 to a depletion rate factor of 16.246% on an unamortized full cost pool base of $14,474,000 in 2015. The net decrease in the unamortized full cost pool base of $176,000 was due primarily to an increase in the amounts capitalized in the full cost pool of approximately $1,595,000 less the increase in accumulated depletion of $1,771,000.
The Company recorded an impairment expense in the carrying value of its proved oil and gas properties of $5,116,000, due primarily to declines in the average realized prices for sales of its crude oil and natural gas on the first calendar day of each month during the trailing 12-month period prior to December 31, 2015. The net present value of the Company’s proved oil and natural gas reserves, discounted at 10% at December 31, 2015, was approximately $7,006,000 compared to $22,218,000 at December 31, 2014. (See Footnote 18 to the Financial Statements. A ceiling test, determined that the unamortized cost of the full cost pool of $14,474,000 less the current year amortization of $2,352,000 equaled $12,122,000, or $5,116,000 above the net present value of the Company’s proved oil and gas reserves. The impairment provision was credited to accumulated depreciation and amortization on the balance sheet. No impairment of oil and gas properties charge was recorded for 2014 or 2013.
Asset Retirement Obligation (“ARO”) accretion expense for 2015 was $35,000 down from $42,000 in 2014, a decrease of $7,000 or 16.7%. The ARO calculation is based on the Company’s annual reserve report and takes into consideration the changes between years of the Company’s estimated obligation to plug its interest in existing wells. This estimated future cost is discounted using a 10% discount factor based on the estimated life of each property. Changes are incorporated as applicable into the full cost pool and the carrying value of the liability. Accretion expense measures and incorporates changes due to the passage of time into the carrying amount of the liability.
General and administrative expenses for 2015 were approximately $3,198,000 as compared to approximately $4,019,000 for 2014, a decrease of approximately $821,000 or 20.4%. The decrease was primarily due to decreases in salary, wages and related employee benefits. In view of the large decreases in oil and gas prices and reduction of revenues during 2015, the Company has made a concentrated effort to reduce its general and administrative costs. Personnel costs have been reduced by approximately $743,000 primarily through an approximate 25% reduction in headcount through attrition. As employees left the Company, they were not replaced and responsibilities have been spread among the remaining staff.
Other general office and administrative expenses have been reduced by approximately $78,000 as the Company has reduced its spending to essential items.
The Company incurred no interest expense for 2015 or 2014 compared to approximately $17,000 for 2013. Effective December 27, 2013, the Company prepaid the remaining principal plus accrued interest on its bank loan for the Company’s office building.
2014 Compared to 2013
Oil revenue for 2014 was approximately $8,317,000 compared to $9,471,000 for 2013, a decrease of approximately $1,154,000 or 12.2%. Average oil prices decreased to an average of $93.38 per barrel in 2014 from an average of $105.38 per barrel in 2013, a decrease of $12.00 per barrel or 11.4%. Oil sales decreased to 89,068 barrels from approximately 89,872 barrels in 2013, a decrease of 804 barrels or 0.9%. The decrease in oil revenue and sales is predominantly due the significant decreases in crude oil prices beginning in the second half of 2014.
| 33 |
Natural gas revenue for 2014 was approximately $3,371,000 compared to $2,986,000 for 2013, an increase of approximately $385,000 or 12.9%. Natural gas sales increased to approximately 740,000 mcf in 2014 from approximately 737,000 mcf in 2013, an increase of approximately 3,000 mcf or 0.5%. Natural gas prices increased to an average of $4.53 per mcf in 2014, an increase of $0.48 or 11.9% from an average of $4.05 per mcf in 2013.
Revenue from lease operations was $481,000 for 2014, an increase of $72,000 or 17.6% from $409,000 in 2013. This was due primarily to an increase in field supervision charges on operated wells of approximately $31,000 as a result of workover activity during 2014. In addition there was an increase in administrative overhead billed to working interest owners of approximately $41,000 due primarily to an increase in COPAS overhead rates billed.
Revenues from gas gathering, compression and equipment rental for 2014 were $155,000, an increase of $13,000 or 9.2% from $142,000 in 2013. This was due primarily to an increase in natural gas volume sold through PPC.
Real estate rental revenue for 2014 was $240,000, down 3.6% or $9,000 from $249,000 in 2013.
Interest income for 2014 was approximately $125,000, an increase of approximately $44,000 from approximately $81,000 in 2013 or 54.3%. Although overall interest rates on deposit accounts at most of the banking institutions at which the Company is a depositor have decreased over prior years, the Company’s increased cash balances have yielded higher interest income.
Other revenue for 2014 was $519,000, as compared to $209,000 in 2013, an increase of $310,000 or 148%. This change is due primarily to the recognition of fees earned under drilling ventures. In addition, there was a decrease in the amount of cash received for farm-out agreements in 2014 over that received during 2013. From time to time, the Company farms out some of its leasehold acreage to non-affiliated third parties for exploration and development drilling. Generally, the Company receives a one-time payment for the agreement. The revenues from these farm-out agreements vary in size and frequency and should not be considered as regularly recurring revenues that the Company receives.
Lease operating expenses in 2014 were approximately $2,240,000 as compared to $2,524,000 in 2013, a net decrease of $284,000, or 11.3%. Of this net decrease, approximately $394,000 was due to decreased workover expenses on operated properties between periods, and approximately $71,000 was due to material credits transferred from various leases; both decreases were offset by approximately $86,000 attributable to new operated properties added since 2013, approximately $75,000 in increased operating expenses for non-operated leases, and the remaining $20,000 represented net increases and decreases on various properties due to general price fluctuations and levels of operation activity. The majority of the increase in operating expenses for non-operated leases was due to an agreement reached and recorded with an operator regarding lease operating expenses on multiple wells for multiple periods.
Production taxes, gathering, and marketing expenses for 2014 were approximately $996,000 compared to $1,001,000 in 2013, a decrease of approximately $5,000, or 0.5%. This decrease was directly related to the decrease in oil and natural gas production and revenues, which have been partially offset by an overall increase in gas severance tax on operated properties, caused by the expiration of certain severance tax exemptions, as well as increased expenses for non-operated leases.
Pipeline and rental expenses for 2014 were $49,000 compared to $42,000 for 2013, an increase of $7,000, or 16.7%. This increase is primarily due to repairs and maintenance expense.
Real estate expenses in 2014 were approximately $220,000 compared to $215,000 during the same period in 2013, an increase of approximately $5,000 or 2.3%.
Depreciation and amortization expense for 2014 was $1,846,000 compared to $1,913,000 for 2013, a decrease of $67,000, or 3.5%. The Company re-evaluated its proved oil and gas reserves as of December 31, 2014, and decreased its estimated total proved reserves by approximately 33,000 BOE to 1,544,000 BOE at the end of 2014 compared to 1,577,000 BOE at the end of 2013, a decrease of approximately 2.1%. Sales of oil and natural gas
| 34 |
products during 2014 decreased by approximately 1,000 BOE from approximately 213,000 BOE in 2013 to approximately 212,000 BOE in 2014, a decrease of approximately 0.5%. (See Footnote 18 to the Financial Statements). This resulted in a decrease in the depletion rate factor from 13.395% in 2013 on an unamortized full cost pool base of $13,752,000 to a depletion rate factor of 12.090% on an unamortized full cost pool base of $14,650,000 in 2014. The net increase in the unamortized full cost pool base of $898,000 was due primarily to an increase in the amounts capitalized in the full cost pool of approximately $2,740,000 less the increase in accumulated depletion of $1,842,000.
Asset Retirement Obligation (“ARO”) accretion expense for 2014 was $42,000 down from $118,000 in 2013; a decrease of $76,000 or 64.4%. The ARO calculation is based on the Company’s annual reserve report and takes into consideration the changes between years of the Company’s estimated obligation to plug its interest in existing wells. This estimated future cost is discounted using a 10% discount factor based on the estimated life of each property. Changes are incorporated as applicable into the full cost pool and the carrying value of the liability. Accretion expense measures and incorporates changes due to the passage of time into the carrying amount of the liability.
General and administrative expenses for 2014 were approximately $4,019,000 as compared to approximately $3,648,000 for 2013, an increase of approximately $371,000 or 10.2%. The increase was primarily due to increased salary, wages and employee benefits as several new employees have been added in 2014.
The Company incurred no interest expense for 2014 compared to approximately $17,000 for 2013, a decrease of approximately $17,000. Effective December 27, 2013, the Company prepaid the remaining principal plus accrued interest on its bank loan for the Company’s office building.
Certain Factors That Could Affect Future Operations
Certain information contained in this report, as well as written and oral statements made or incorporated by reference from time to time by the Company and its representatives in other reports, filings with the Securities and Exchange Commission, press releases, conferences, teleconferences or otherwise, may be deemed to be 'forward-looking statements' within the meaning of Section 21E of the Securities Exchange Act of 1934 and are subject to the 'Safe Harbor' provisions of that section.
Forward-looking statements include statements concerning the Company's and management's plans, objectives, goals, strategies and future operations and performance and the assumptions underlying such forward-looking statements. When used in this document, the words "anticipates", "estimates", "expects", "believes", "intends", "plans", and similar expressions are intended to identify such forward-looking statements. Actual results and developments could differ materially from those expressed in or implied by such statements due to these and other factor.
Item 8. Consolidated Financial Statements and
Schedules Index at Page 43
Item 9. Changes In And Disagreements With Accountants On Accounting And Financial Disclosure
None
Item 9A. Controls and Procedures
Evaluation of Disclosure Controls and Procedures
Under the supervision and with the participation of our management, including our Principal Executive Officer and Principal Financial and Accounting Officer, we conducted an evaluation of the effectiveness of our disclosure
| 35 |
controls and procedures (as defined in Rule 13a-15(e)) of the Securities Exchange Act of 1934, as amended (the “Exchange Act”), which are designed to ensure that information required to be disclosed by us in the reports that we file or submit under the Exchange Act is recorded, processed, summarized and reported within the time periods specified by the SEC’s rules and forms. Disclosure controls and procedures include, without limitation, controls and procedures designed to ensure that information required to be disclosed by us in the reports that we file or submit under the Exchange Act is accumulated and communicated to our management, including our Principal Executive Officer and Principal Financial and Accounting Officer, as appropriate to allow timely decisions regarding required disclosure. Based on this evaluation, our Principal Executive Officer and Principal Financial and Accounting Officer concluded that our disclosure controls and procedures were effective as of the end of the period covered by this report.
Management’s Report on Internal Control over Financial Reporting
Our management is responsible for establishing and maintaining adequate internal control over financial reporting for the Company. Our internal control over financial reporting is designed to provide reasonable assurance regarding the reliability of financial reporting and the preparation of financial statements in accordance with generally accepted accounting principles. There are inherent limitations to the effectiveness of any system of internal control over financial reporting. These limitations include the possibility of human error, the circumvention of overriding of the system and reasonable resource constraints. Because of its inherent limitations, our internal control over financial reporting may not prevent or detect misstatements. Projections of any evaluation of effectiveness to future periods are subject to the risk that controls may become inadequate because of changes in conditions or that the degree of compliance with policies or procedures may deteriorate.
Management assessed the effectiveness of the Company’s internal controls over financial reporting as of December 31, 2015. In making this assessment, management used the criteria set forth in Internal Control - Integrated Framework (2013) issued by the Committee of Sponsoring Organizations of the Treadway Commission (COSO). Based on management’s assessments and those criteria, management has concluded that Company’s internal control over financial reporting was effective as of December 31, 2015.
This annual report does not include an attestation report of the Company’s registered public accounting firm regarding internal control over financial report. Management’s report was not subject to attestation by the Company’s registered public accounting firm pursuant to rules of the Securities and Exchange Commission that permit the Company to provide only management’s report in this annual report.
Changes in Internal Control over Financial Reporting
In preparation for management’s report on internal control over financial reporting, we documented and tested the design and operating effectiveness of our internal control over financial reporting. There were no changes in our internal controls over financial reporting (as such term is defined in Exchange Act Rule 13a-15(f)) that occurred during the quarter ended December 31, 2015 that have materially affected, or are reasonably likely to materially affect, our internal control over financial reporting.
Item 9B. Other Information
Not Applicable
| 36 |
PART III
Item 10. Directors and Executive Officers Of The Registrant
| The Directors and Executive Officers of the Company and certain information concerning them is set forth below: | ||
| Name | Age | Position |
| Chris G. Mazzini | 58 | Chairman of the Board, Director, and President |
| Michelle H. Mazzini | 54 | Director, Vice President, Secretary, and Treasurer |
| Ted R. Munselle | 60 | Director |
All directors hold offices until the next annual meeting of the shareholders or until their successors are duly elected and qualified. Officers of the Company serve at the discretion of the Board of Directors.
Business Experience
Chris Mazzini, Chairman of the Board of Directors and President, graduated from the University of Texas at Arlington in 1979 with a Bachelor of Science degree in Geology. He started his career in the oil and gas industry in 1978, and began as a Petroleum Geologist with Spindletop in 1979, working the Fort Worth Basin of North Texas. He became Vice President of Geology at Spindletop in 1982 and served in that capacity until he left the Company in 1985 when he founded Giant Energy Corp. ("Giant"). Mr. Mazzini has served as President of Giant since then. He rejoined the Company in December 1999 when he, through Giant, purchased controlling interest. Mr. Mazzini has been Chairman of the Board of Directors and President of the Company since 1999 and is a Certified and Licensed Petroleum Geologist. Mr. Mazzini has worked numerous geological basins throughout the United States with an emphasis on the Fort Worth Basin. He is responsible for several new field discoveries in the Fort Worth Basin.
Michelle Mazzini, Vice President and General Counsel, received her Bachelor of Science Degree in Business Administration (Major: Accounting) from the University of Southwestern Louisiana (now named University of Louisiana at Lafayette) where she graduated magna cum laude in 1985. She earned her law degree from Louisiana State University where she graduated Order of the Coif in 1988. Ms. Mazzini began her career with Thompson & Knight, a large law firm in Dallas, where she focused her practice on general corporate and finance transactions. She also worked as Corporate Counsel for Alcatel USA, a global telecommunications manufacturing corporation where her practice was broad-based. Ms. Mazzini serves as Vice President and General Counsel of the Company.
On February 17, 2012, Mr. Ted R. Munselle was appointed as a member of the Board of Directors of Spindletop Oil & Gas Co. Mr. Munselle is Vice President and Chief Financial Officer (since October 1998) of Landmark Nurseries, Inc. He is a Certified Public Accountant (since 1980) who was employed as an Audit Partner in two Dallas, Texas based CPA firms (1986 to 1998), as an Audit Manager at Grant Thornton, LLP (1983 to 1986) and as Audit Staff to Audit Supervisor at Laventhol & Horwath (1977 to 1983). Mr. Munselle is also a director (since February 2004) of American Realty Investors, Inc. and Transcontinental Realty Investors, Inc., both of which are Nevada corporations which have their common stock listed and traded on the New York Stock Exchange (“NYSE”), as well as a director (since May 2009) of Income Opportunity Realty Investors, Inc., a Nevada corporation which has its common stock listed and traded on the NYSE MKT.
| 37 |
Key and Technical Employees
In addition to the services provided by Mr. Mazzini and Ms. Mazzini (both of whom have biographies listed above), the Company also relies extensively on the key and the technical employees identified below.
Michael G. Boos, Geologist, earned a Bachelor of Science degree in Geology from the University of Delaware in 1979. After performing geophysical research for the State of Delaware seeking hydrothermal energy sources, Mr. Boos worked independently for many years as a Petroleum Exploration Consultant and as a Staff Explorationist for a local oil company. He has numerous field discoveries in the Mid-Continent to his credit. In 1993 Mr. Boos joined Spindletop’s Geological Department. He pursued a Masters degree through the University of Texas system, and later worked as a Geologist and Senior Project Manager for several national environmental consulting firms until rejoining Spindletop in October, 2008. His petroleum exploration experience includes Alaska’s North Slope (Prudhoe Bay), many of the continental U.S. producing basins, as well as Central and South America. He has testified as an expert witness before the Texas Railroad Commission (TRRC) on several occasions. He is a founding member of both the Geological Information Library of Dallas (GILD, now Geomap) and the American Association of Petroleum Geologists (AAPG) Environmental Division, and is a licensed Professional Geologist (P.G.) in the states of Texas and Tennessee.
Dave Chivvis, Petroleum Engineer, joined the Company in May, 2008. Mr. Chivvis earned his Bachelor of Science degree in Petroleum Engineering from Texas A&M University in 1993. After graduation, he worked for Cox Resources Corporation, an independent oil and gas company located in Dallas, Texas. Mr. Chivvis worked in various engineering areas from operations to acquisitions of oil and gas properties in Texas, Oklahoma, Louisiana, and Arkansas. He then moved to Los Angeles in 2001 to pursue other opportunities before moving back to Texas to join the Company.
Robert E. Corbin, Controller, has been a full-time employee of Spindletop since April 2002. From May 2001 until April 2002, Mr. Corbin was an Independent Accounting Consultant and devoted substantially all of his time to Spindletop. He has been active in the oil and gas industry for over 40 years, during which time he has served as financial officer of a publicly-held company as well as several private oil and gas companies and partnerships. Mr. Corbin graduated from Texas Tech University in 1969 with a BBA degree in Accounting and began his accounting career as an auditor with Arthur Andersen & Co. in 1970. Mr. Corbin is a Certified Public Accountant since 1972.
Charles (Chuck) D. Howell, Jr., Geologist, joined the Company in April, 2008. Mr. Howell earned a Bachelor of Science in Geology from Southern Methodist University in 1999. Currently, he is finishing his Ph.D. in Geology at the University of Texas at Dallas. Mr. Howell has been in the energy industry since 2003. He began his career at Pioneer Natural Resources working in the Gulf of Mexico. During 2005, Mr. Howell was an Independent Consulting Geologist for Anadarko Petroleum Corporation and worked on development of the historic Salt Creek Oil Field. In 2007, immediately before joining Spindletop Oil and Gas Company, he was a Geologist for Chevron Energy Technology Company in Houston, Texas and was part of a team of stratigraphic specialists for the West Coast of Africa. Mr. Howell is a long-standing and active member of the American Association of Petroleum Geologists, the Society for Sedimentary Geology, the Geological Society of America, the International Association of Sedimentologists, and remains associated with the Ichnology Research Group.
Dick A. Mastin, Petroleum Landman, has been a full-time employee of the Company since February, 2006. Mr. Mastin graduated cum laude from Stephen F. Austin State University in 1980 with a Bachelor of Science in Forestry and a minor in General Business. From September of 1980 until December of 1985, Mr. Mastin worked for Spindletop Oil & Gas Co. as a Petroleum Landman. He received his Masters of Science in Management and Administrative Sciences from the University of Texas at Dallas in 1990. In January of 1987, he took a position with the Dallas office of the Federal Bureau of Investigation. After a year with the Bureau, he accepted a position with the Internal Revenue Service as a Revenue Agent. Fifteen of his eighteen years with the Service were spent in the Large and Mid-Sized Business unit auditing tax returns of the largest business entities.
| 38 |
Glenn E. Sparks is the Land Director and also acts as Associate General Counsel to the Company. Mr. Sparks was previously employed as a Landman by the Company from 1982 through 1986, prior to attending law school. Mr. Sparks holds a B.B.A. with a concentration in Finance from the University of Texas at Arlington, and a J.D. from Texas Tech University School of Law. From 1990 to 2005, Mr. Sparks practiced law in a private practice focusing primarily on oil and gas law and real estate, as a partner in the law firm of Logan & Sparks, PLLC, and has acted as outside legal counsel for the Company in numerous oil and gas transactions during his years in private practice. Mr. Sparks left his private law practice and joined the Company again as an employee in his current position in 2005. Mr. Sparks is Board Certified in Oil & Gas Mineral Law by the Texas Board of Legal Specialization.
Family Relationships
Michelle Mazzini, Vice President, Secretary, Treasurer, and General Counsel is the wife of Chris Mazzini, Chairman of the Board and President.
Involvement in Certain Legal Proceedings
None of the directors or executive officers of the Registrant, during the past five years, has been involved in any civil or criminal legal proceedings, bankruptcy filings or has been the subject of an order, judgment or decree of any Federal or State authority involving Federal or State securities laws.
Board Meetings and Committees
The Board of Directors met one time in 2015. The Board has established an audit committee. The Board is small and all members of the Board serve on the audit committee. The function of the audit committee is to assist the Board in fulfilling its oversight responsibilities by reviewing the financial information that will be provided to the shareholders and others, the systems of internal controls that management and the Board of Directors have established, and the audit process. During 2015, Mr. Munselle was Chairman of the Audit Committee.
With respect to nominations to the Board, compensation, financial planning, strategies, and business alternatives, the Company does not have separate committees as the Board is small and all members of the Board participate in making recommendations and decisions on these matters.
Item 11. Executive Compensation
Cash Compensation
Cash compensation including salaries and bonuses, of $150,036, $326,539, and $349,405 was paid to Mr. Mazzini in 2015, 2014, and 2013 respectively. Cash compensation including salaries and bonuses of $125,096, $209,424, and $226,185 was paid to Ms. Mazzini in 2015, 2014, and 2013 respectively.
The decrease in cash compensation for 2015 was due to the fact that neither Mr. nor Mrs. Mazzini was paid a cash bonus during the year.
The Company has no stock option or incentive plan, does not grant any plan-based awards or awards of equity securities. The Company has no pension plan for its employees.
Compensation Pursuant to Plan
None
Other Compensation
Key employees and officers of the Company may sometimes be assigned overriding royalty interests and/or carried working interests in prospects acquired by or generated by the Company. These interests normally vary from less than one percent to three percent for each employee or officer. There is no set formula or policy for such program,
| 39 |
and the frequency and amounts are largely controlled by the economics of each particular prospect. We believe that these types of compensation arrangements enable us to attract, retain and provide additional incentives to qualified and experienced personnel.
Compensation of Directors
Directors who are employees of the Company are not currently compensated for their services on the Board. Mr. Munselle was paid a director’s fee of $10,000 in 2015, $10,000 in 2014 and $10,000 in 2013 to compensate him for his position as the Board of Directors’ Financial Expert. Mr. Munselle also receives $2,500 for each Board of Directors’ meeting during the year other than the annual meeting.
Termination of Employment and Change of Control Arrangement
There are no plans or arrangements for payment to officers or directors upon resignation or a change in control of the Registrant.
Item 12. Security Ownership Of Certain Beneficial Owners And Management
Security Ownership of Certain Beneficial Owners and Managers
The table below sets forth the information indicated regarding ownership of the Registrant's common stock, $.01 par value, the only outstanding voting securities, as of March 30, 2016 with respect to: (i) any person who is known to the Registrant to be the owner of more than five percent of the Registrant's common stock; (ii) the common stock of the Registrant beneficially owned by each of the directors of the Registrant, and (iii) by all officers and directors as a group. Each person has sole investment and voting power with respect to the shares indicated, except as otherwise set forth in the footnotes to the table.
| Name and Address of Beneficial Owner |
Number of Shares |
Nature of Beneficial Ownership * |
Pct Based on Outstanding Percent of Class ** |
| Chris Mazzini and Michelle Mazzini | 5,900,543 | (1) | 85.1% |
| 12850 Spurling Rd., Suite 200 | |||
| Dallas, Texas 75230 | |||
| All officers and directors as a group | 5,900,543 | 85.1% | |
* “Beneficial Ownership” means the sole or shared power to vote, or direct the voting of, a security or investment power with respect to a security, or any combination thereof.
** Percentages are based upon 6,936,269 shares of Common Stock outstanding at March 30, 2016.
(1) Chris Mazzini directly owns 39,654 shares (0.5717%). Giant Energy Corp. directly owns 5,860,889 shares (84.4963%). Chris Mazzini owns 100% of the common stock of Giant Energy Corp.
Changes in control
The Company is not aware of any arrangements or pledges with respect to its securities that may result in a change in control of the Company.
| 40 |
Item 13. Certain Relationships And Related Transactions
Transactions with management and others
Certain officers, directors and related parties, including entities controlled by Mr. Mazzini, the President and Chief Executive Officer, have engaged in business transactions with the Company which were not the result of arm's length negotiations between independent parties. Our management believes that the terms of these transactions were as favorable to us as those that could have been obtained from unaffiliated parties under similar circumstances. All future transactions between us and our affiliates will be on terms no less favorable than could be obtained from unaffiliated third parties and will be approved by a majority of the disinterested members of our Board of Directors.
Chris G. Mazzini and Michelle H. Mazzini, through a limited partnership in which they are limited partners, own M-R Oilfield Services, LP ("MRO"), an oilfield service company which, until September, 2015, provided roustabout, swabbing and completion services at rates which are at or below market to the Company. This oilfield services company shut down operations on September 1, 2015, but previously performed work exclusively for the Company, its parent company, Giant Energy Corp. and Giant NRG, LP. The Company benefited by having immediate access to these services. Effective January 1, 2014, MRO began leasing its employees from the Company; effective September 1, 2015, the Company terminated the employment of the employees leased to MRO when MRO shut down its operations.
Certain Business Relationships
The long-term debt, which was secured by the commercial office building, was also guaranteed individually by Chris G. Mazzini and Michelle H. Mazzini, related parties. Effective December 27, 2013, the Company prepaid the remaining principal balance plus accrued interest and the note was paid in full.
On October 1, 2008, Giant entered into an Administrative Services Agreement with the Company whereby Giant pays the Company $250 per month for the Company providing administrative services to Giant. The Company also entered into a management services agreement with MRO whereby MRO made monthly payments in the amount of $1,000 per month to the Company in exchange for the Company providing administrative services to MRO. The Company’s agreement with MRO was terminated effective September 1, 2015. On October 1, 2008, the Company entered into a similar agreement with Giant NRG, LP (“NRG”) a limited partnership with Chris Mazzini and Michelle Mazzini as limited partners. Under this agreement NRG pays a monthly fee of $2,500 to the Company in exchange for the Company providing certain administrative services to NRG. The Company has entered into a similar arrangement with Peveler Pipeline, LP ("Peveler"), whereby Peveler pays the Company a monthly charge of $250 in exchange for the Company providing administrative services to Peveler. Chris and Michelle Mazzini are the owners of Peveler Pipeline, LP, a limited partnership which owns a pipeline gathering system servicing wells owned by Giant, another related entity, described elsewhere in this report. The Company entered into a similar agreement with M-R Ventures, LLC (“MRV”) a limited liability company that operates some wells in Michigan, and that is owned by Chris and Michelle Mazzini. Pursuant to this agreement, MRV pays the Company a monthly fee in the amount of $500 for certain administrative services that the Company provides to MRV. The Company entered into a similar agreement with Reserve Royalty Company (“Reserve”) a sole proprietorship that holds some royalty interests owned by Chris and Michelle Mazzini. Pursuant to this agreement, Reserve pays the Company a monthly fee in the amount of $350 for certain administrative services that the Company provides to Reserve. See also note 6 to the Financial Statements.
| 41 |
Item 14. Principal Accounting Fees and Services
The following table sets forth the aggregate fees for professional services rendered to Spindletop Oil & Gas Co. and Subsidiaries for the years 2015 and 2014 by accounting firm, Farmer, Fuqua, & Huff, P.C.
| Type of Fees | 2015 | 2014 |
| Audit Fees | $ 46,000 | $ 45,500 |
| Audit Related Fees | - | - |
| Tax Fees | 4,525 | - |
| All other fees | - | - |
Members of the Board of Directors (the "Board") fulfill the responsibilities of an audit committee and have established policies and Procedures for the approval and pre-approval of audit services and permitted non-audit services. The Board has the responsibility to engage and terminate Farmer, Fuqua, & Huff, P.C. independent auditors, to pre-approve their performance of audit services and permitted non-audit services, to approve all audit and non-audit fees, and to set guidelines for permitted non-audit services and fees. All the fees for 2015 and 2014 were pre-approved by the Board or were within the pre-approved guidelines for permitted non-audit services and fees established by the Board, and there were no instances of waiver of approved requirements or guidelines during the same periods.
| 42 |
PART IV
Item 15. EXHIBITS AND FINANCIAL STATEMENT SCHEDULES
| a. | The following documents are filed as a part of this report: | |
| (1) FINANCIAL STATEMENTS: The following financial statements of the Registrant and Report of Independent Registered Public Accounting Firm therein are filed as part of this Report on Form 10-K: | ||
| Page | ||
| Report of Farmer, Fuqua & Huff, P.C Independent Registered Public Accounting Firm |
47 | |
| Consolidated Balance Sheets | 48-49 | |
| Consolidated Statements of Operations | 50 | |
| Consolidated Statements of Changes in Stockholders' Equity | 51 | |
| Consolidated Statements of Cash Flows | 52 | |
| Notes to Consolidated Financial Statements | 53 | |
| (2) FINANCIAL STATEMENT SCHEDULES: | ||
| Schedule II - Valuation and Qualifying Accounts | 70 | |
| Schedule III - Real Estate and Accumulated Depreciation | 71 | |
| Other financial statement schedules have been omitted because the information required to be set forth therein is not applicable, is immaterial or is shown in the consolidated financial statements or notes thereto. | ||
| 43 |
|
(3) EXHIBITS: The following documents are filed as exhibits (or are incorporated by reference as indicated) into Report: | ||
| Exhibit Designation |
Exhibit Description | |
| 3.1 | Articles of Incorporation of Spindletop Oil & Gas Co. (previously filed with our General Form for Registration of Securities on Form 10, filed with the Commission on August 14, 1990) | |
| 3.2 | Bylaws of Spindletop Oil & Gas Co. (previously filed with our General Form for Registration of Securities on Form 10, filed with the Commission on August 14, 1990) | |
| 14 | Code of Ethics for Senior Financial Officers (Incorporated by reference to Exhibit 14 to the registrant's annual report Form 10-K for the fiscal year ended December 31, 2005) | |
| 21 | Subsidiaries of the Registrant | |
| 31.1 * | Rule 13a-14(a) Certification of Chief Executive Officer | |
| 31.2 * | Rule 13a-14(a) Certification of Chief Financial Officer | |
| 32. * | Officers' Section 1350 Certifications | |
| * Filed herewith | ||
(b) The Index of Exhibits is included following the Financial Statement Schedules beginning at page 72 of this Report.
(c) The Index to Consolidated Financial Statements and Supplemental Schedules is included following the signatures, beginning at page 45 of this Report
(d) Supplemental Reserve Information (unaudited) is included in Note 18 to the Consolidated Financial Statements.
| 44 |
| SIGNATURES | |||
| Pursuant to the requirements of Section 13 or 15(d) of the Securities Exchange Act of 1934, the Registrant has duly caused this Report to be been signed in its behalf by the undersigned, thereunto duly authorized. | |||
| SPINDLETOP OIL & GAS CO. | |||
| Date: March 30, 2016 | |||
| By:/s/ Chris G. Mazzini | |||
| Chris G. Mazzini | |||
| President, Principal Executive Officer | |||
| Pursuant to the requirements of the Securities Exchange Act of 1934, this Report has been signed below by the following on behalf of the Registrant and in the capacities and on the dates indicated. | |||
| Signatures | |||
| Principal Executive Officers | Capacity | Date | |
| /s/ Chris Mazzini | |||
| President, Director | March 30, 2016 | ||
| Chris Mazzini | (Chief Executive Officer | ||
| /s/ Michelle Mazzini | |||
| Vice President, Secretary, | March 30, 2016 | ||
| Michelle Mazzini | Treasurer, Director | ||
| /s/ Ted R. Munselle | |||
| Director | March 30, 2016 | ||
| Ted R. Munselle | |||
| /s/ Robert E. Corbin | Controller (Principal Financial | March 30, 2016 | |
| and Accounting Officer) | |||
| Robert E. Corbin | |||
| 45 |
| SPINDLETOP OIL & GAS CO. AND SUBSIDIARIES | |
| Index to Consolidated Financial Statements and Schedules | |
| Page | |
| Report of Independent Registered Public Accounting Firm | 47 |
| Consolidated Balance Sheets - December 31, 2015 and 2014 | 48-49 |
| Consolidated Statements of Operations for the years ended | |
| December 31, 2015, 2014, and 2013 | 50 |
| Consolidated Statements of Changes in Shareholders' | |
| Equity for the years ended December 31, 2015, 2014, and 2013 | 51 |
| Consolidated Statements of Cash Flows for the years ended | |
| December 31, 2015, 2014, and 2013 | 52 |
| Notes to Consolidated Financial Statements | 53 |
| Schedules for the years ended December 31, 2015, 2014, and 2013 | |
| II - Valuation and Qualifying Accounts | 70 |
| III - Real Estate and Accumulated Depreciation | 71 |
| All other schedules have been omitted because they are not applicable, not required, or the information has been supplied in the consolidated financial statements or notes thereto. | |
| 46 |
REPORT OF INDEPENDENT REGISTERED PUBLIC ACCOUNTING FIRM
To the Board of Directors and
Shareholders of Spindletop Oil & Gas Co.
We have audited the accompanying consolidated balance sheets of Spindletop Oil & Gas Co. (A Texas Corporation) and subsidiaries as of December 31, 2015 and 2014, and the related consolidated statements of operations, shareholders' equity and cash flows for each of the years in the three-year period ended December 31, 2015. Spindletop Oil & Gas Co.’s management is responsible for these consolidated financial statements. Our responsibility is to express an opinion on these consolidated financial statements based on our audits.
We conducted our audits in accordance with the standards of the Public Company Accounting Oversight Board (United States). Those standards require that we plan and perform the audit to obtain reasonable assurance about whether the consolidated financial statements are free of material misstatement. Our audits included consideration of internal control over financial reporting as a basis for designing audit procedures that are appropriate in the circumstances, but not for the purpose of expressing an opinion on the effectiveness of the company's internal control over financial reporting. Accordingly, we express no such opinion. An audit also includes examining, on a test basis, evidence supporting the amounts and disclosures in the consolidated financial statements, assessing the accounting principles used and significant estimates made by management, as well as evaluating the overall financial statement presentation. We believe that our audits provide a reasonable basis for our opinion.
In our opinion, the consolidated financial statements referred to above present fairly, in all material respects, the financial position of Spindletop Oil & Gas Co. and subsidiaries as of December 31, 2015 and 2014, and the consolidated results of its operations and its cash flows for each of the years in the three-year period ended December 31, 2015 in conformity with accounting principles generally accepted in the United States of America.
We were not engaged to examine management’s assertion about the effectiveness of Spindletop Oil & Gas Co.’s internal control over financial reporting as of December 31, 2015 included in the accompanying management report on internal control over financial reporting and, accordingly, we do not express an opinion thereon.
Our audits were made for the purpose of forming an opinion on the basic consolidated financial statements taken as a whole. The schedules listed in the index of the consolidated financial statements are presented for purposes of complying with the Securities and Exchange Commission's rules and are not part of the basic consolidated financial statements. These schedules have been subjected to the auditing procedures applied in the audits of the basic consolidated financial statements and, in our opinion, fairly state, in all material respects, the financial data required to be set forth therein in relation to the basic consolidated financial statements taken as a whole.
/s/ Farmer, Fuqua & Huff, P.C.
Richardson, Texas
March 30, 2016
| 47 |
| SPINDLETOP OIL & GAS CO. AND SUBSIDIARIES | ||
| CONSOLIDATED BALANCE SHEETS | ||
| December 31, | December 31, | |
| 2015 | 2014 | |
| ASSETS | ||
| Current Assets | ||
| Cash and cash equivalents | $ 12,845,000 | $ 14,294,000 |
| Accounts receivable, trade | 1,835,000 | 2,153,000 |
| Income tax receivable | 754,000 | 172,000 |
| Other short-term investments | 400,000 | 400,000 |
| Total Current Assets | 15,834,000 | 17,019,000 |
| Property and Equipment - at cost | ||
| Oil and gas properties (full cost method) | 29,144,000 | 28,067,000 |
| Rental equipment | 406,000 | 406,000 |
| Gas gathering system | 115,000 | 180,000 |
| Other property and equipment | 296,000 | 251,000 |
| 29,961,000 | 28,904,000 | |
| Accumulated depreciation and amortization | (22,577,000) | (15,147,000) |
| Total Property and Equipment | 7,384,000 | 13,757,000 |
| Real Estate Property - at cost | ||
| Land | 688,000 | 688,000 |
| Commercial office building | 1,580,000 | 1,580,000 |
| Accumulated depreciation | (803,000) | (756,000) |
| Total Real Estate Property | 1,465,000 | 1,512,000 |
| Other Assets | ||
| Other long-term investments | 1,200,000 | 1,200,000 |
| Other | 6,000 | 18,000 |
| Total Other Assets | 1,206,000 | 1,218,000 |
| Total Assets | $ 25,889,000 | $ 33,506,000 |
| The accompanying notes are an integral part of these statements. | ||
| 48 |
| SPINDLETOP OIL & GAS CO. AND SUBSIDIARIES | ||
| CONSOLIDATED BALANCE SHEETS | ||
| December 31, | December 31, | |
| 2015 | 2014 | |
| LIABILITIES AND SHAREHOLDERS' EQUITY | ||
| Current Liabilities | ||
| Accounts payable and accrued liabilities | $ 5,809,000 | $ 6,354,000 |
| Total Current Liabilities | 5,809,000 | 6,354,000 |
| Noncurrent Liabilities | ||
| Asset retirement obligation | 1,121,000 | 1,078,000 |
| Total Noncurrent Liabilities | 1,121,000 | 1,078,000 |
| Deferred Income Tax Payable | 490,000 | 1,828,000 |
| Total Liabilities | 7,420,000 | 9,260,000 |
| Shareholders' Equity | ||
| Common stock, $.01 par value, 100,000,000 shares authorized; 7,677,471 shares issued and 6,936,269 shares outstanding at December 31, 2015 and at December 31, 2014. | 77,000 | 77,000 |
| Additional paid-in capital | 943,000 | 943,000 |
| Treasury stock, at cost | (1,536,000) | (1,536,000) |
| Retained earnings | 18,985,000 | 24,762,000 |
| Total Shareholders' Equity | 18,469,000 | 24,246,000 |
| Total Liabilities and Shareholders' Equity | $ 25,889,000 | $ 33,506,000 |
| The accompanying notes are an integral part of these statements. | ||
| 49 |
| SPINDLETOP OIL & GAS CO. AND SUBSIDIARIES | |||
| CONSOLIDATED STATEMENTS OF OPERATIONS | |||
| Years Ended December 31, | |||
| 2015 | 2014 | 2013 | |
| Revenues | |||
| Oil and gas revenues | $ 4,841,000 | $ 11,688,000 | $ 12,457,000 |
| Revenue from lease operations | 481,000 | 481,000 | 409,000 |
| Gas gathering, compression, equipment rental | 141,000 | 155,000 | 142,000 |
| Real estate rental income | 230,000 | 240,000 | 249,000 |
| Interest Income | 68,000 | 125,000 | 81,000 |
| Other | 183,000 | 519,000 | 209,000 |
| Total Revenues | 5,944,000 | 13,208,000 | 13,547,000 |
| Expenses | |||
| Lease operations | 2,365,000 | 2,240,000 | 2,524,000 |
| Production taxes, gathering and marketing | 600,000 | 996,000 | 1,001,000 |
| Pipeline and rental operations | 32,000 | 49,000 | 42,000 |
| Real estate operations | 215,000 | 220,000 | 215,000 |
| Depreciation and amortization | 2,426,000 | 1,846,000 | 1,913,000 |
| Impairment of oil & gas properties | 5,116,000 | - | - |
| ARO accretion expense | 35,000 | 42,000 | 118,000 |
| General and administrative | 3,198,000 | 4,019,000 | 3,648,000 |
| Interest expense | - | - | 17,000 |
| Total Expenses | 13,987,000 | 9,412,000 | 9,478,000 |
| Income (Loss) Before Income Tax | (8,043,000) | 3,796,000 | 4,069,000 |
| Current income tax provision (benefit) | (928,000) | 526,000 | 602,000 |
| Deferred income tax provision (benefit) | (1,338,000) | 65,000 | (75,000) |
| Total income tax provision (benefit) | (2,266,000) | 591,000 | 527,000 |
| Net Income (Loss) | $ (5,777,000) | $ 3,205,000 | $ 3,542,000 |
| Earnings (Loss) per Share of Common Stock | |||
| Basic and Diluted | $ (0.83) | $ 0.46 | $ 0.51 |
| Weighted Average Shares Outstanding | |||
| Basic and Diluted | 6,936,269 | 6,936,269 | 6,936,269 |
| The accompanying notes are an integral part of these statements. | |||
| 50 |
| SPINDLETOP OIL & GAS CO. AND SUBSIDIARIES | ||||||
| CONSOLIDATED STATEMENTS OF CHANGES IN SHAREHOLDERS' EQUITY | ||||||
| For the Years Ended December 31, 2015, 2014, 2013 | ||||||
| Common Stock Shares |
Common Stock Amount |
Additional Paid-In Capital |
Treasury Stock Shares |
Treasury Stock Amount |
Retained Earnings | |
| Balance December 31, 2012 | 7,677,471 | $ 77,000 | $943,000 | 741,202 | $(1,536,000) | $18,015,000 |
| Net Income | - | - | - | - | - | 3,542,000 |
| Balance December 31, 2013 | 7,677,471 | 77,000 | 943,000 | 741,202 | (1,536,000) | 21,557,000 |
| Net Income | - | - | - | - | - | 3,205,000 |
| Balance December 31, 2014 | 7,677,471 | 77,000 | 943,000 | 741,202 | (1,536,000) | 24,762,000 |
| Net Loss | - | - | - | - | - | (5,777,000) |
| Balance December 31, 2015 | 7,677,471 | $ 77,000 | $943,000 | 741,202 | $(1,536,000) | $18,985,000 |
| The accompanying notes are an integral part of these statements. | ||||||
| 51 |
| SPINDLETOP OIL & GAS CO. AND SUBSIDIARIES | |||
| CONSOLIDATED STATEMENTS OF CASH FLOWS | |||
| Twelve Months Ended, December 31, | |||
| 2015 | 2014 | 2013 | |
| Cash Flows from Operating Activities | |||
| Net Income (Loss) | $ (5,777,000) | $ 3,205,000 | $ 3,542,000 |
| Reconciliation of net income (loss) to net cash | |||
| provided by operating activities | |||
| Depreciation and amortization | 2,426,000 | 1,846,000 | 1,913,000 |
| Impairment of oil and gas properties | 5,116,000 | - | - |
| Accretion of asset retirement obligation | 35,000 | 42,000 | 118,000 |
| Changes in accounts receivable | 318,000 | 1,480,000 | (1,478,000) |
| Changes in income tax receivable | (582,000) | (172,000) | - |
| Changes in accounts payable & accrued liabilities | (545,000) | 2,322,000 | 484,000 |
| Changes in current tax payable | - | (252,000) | 153,000 |
| Changes in deferred tax payable | (1,338,000) | 65,000 | (75,000) |
| Other | 12,000 | (14,000) | 2,000 |
| Net cash provided by (used for) operating activities | (335,000) | 8,522,000 | 4,659,000 |
| Cash Flows from Investing Activities | |||
| Capitalized acquisition, exploration and development costs | (1,114,000) | (3,357,000) | (1,961,000) |
| Net cash used for investing activities | (1,114,000) | (3,357,000) | (1,961,000) |
| Cash Flows from Financing Activities | |||
| Repayment of note payable to bank | - | - | (720,000) |
| Net cash used for financing activities | - | - | (720,000) |
| Increase (decrease) in cash | (1,449,000) | 5,165,000 | 1,978,000 |
| Cash at beginning of period | 14,294,000 | 9,129,000 | 7,151,000 |
| Cash at end of period | $ 12,845,000 | $ 14,294,000 | $ 9,129,000 |
| The accompanying notes are an integral part of these statements. | |||
| 52 |
SPINDLETOP OIL & GAS CO. AND SUBSIDIARIES
NOTES TO CONSOLIDATED FINANCIAL STATEMENTS
1. BASIS OF PRESENTATION AND ORGANIZATION
Merger and Basis of Presentation
On July 13, 1990, Prairie States Energy Co., a Texas corporation, (the Company) merged with Spindletop Oil & Gas Co., a Utah corporation (the Acquired Company). The name of Prairie States Energy Co. was changed to Spindletop Oil & Gas Co., a Texas corporation at the time of the merger.
Organization and Nature of Operations
The Company was organized as a Texas corporation in September 1985, in connection with the Plan of Reorganization ("the Plan"), effective September 9, 1985, of Prairie States Exploration, Inc., ("Exploration"), a Colorado corporation, which had previously filed for Chapter 11 bankruptcy. In connection with the Plan, Exploration was merged into the Company, with the Company being the surviving corporation.
Spindletop Oil & Gas Co. is engaged in the exploration, development and production of oil and natural gas; and through one of its subsidiaries, the gathering and marketing of natural gas.
The Company owns land along with a commercial office building which contains approximately 46,286 of rentable square feet, of which the Company occupies approximately 12,759 rentable square feet as its corporate office headquarters. The Company leases the remaining space in the building to non-related third party commercial tenants at prevailing market rates.
2. SUMMARY OF SIGNIFICANT ACCOUNTING POLICIES
A summary of the significant accounting policies consistently applied in the preparation of the accompanying financial statements follows:
FASB Accounting Standards Codification
The Company presents its financial statements in accordance with generally accepted accounting principles in the United States ("GAAP"). In June, 2009, the Financial Accounting Standards Board ("FASB") completed its accounting guidance codification project. The FASB Accounting Standards Codification ("ASC") became effective for the Company's financial statements issued subsequent to June 30, 2009 and is the single source of authoritative accounting principles recognized by the FASB to be applied to nongovernmental entities in the preparation of financial statements in conformity with GAAP. Accordingly, the Company refers to the ASC as the sole source of authoritative literature.
Consolidation
The consolidated financial statements include the accounts of Spindletop Oil & Gas Co. and its wholly owned subsidiaries, Prairie Pipeline Co. and Spindletop Drilling Company. All significant inter-company transactions and accounts have been eliminated.
Cash and Cash Equivalents
The Company considers all highly liquid instruments with a maturity of three months or less at time of original issuance to be cash equivalents.
| 53 |
Other Investments
Other short-term and long-term investments consist of certificates of deposit with maturities of more than three months. Carrying amounts approximate fair value.
Allowance for Doubtful Accounts
The Company provides an allowance for doubtful accounts equal to the estimated uncollectible portion of accounts receivable. This estimate is based on historical collection experience and a review of the current status of accounts receivable.
Oil and Gas Properties
The Company follows the full cost method of accounting for its oil and gas properties. Accordingly, all costs associated with acquisition, exploration and development of oil and natural gas reserves are capitalized and accounted for in cost centers, on a country-by-country basis. For each cost center, capitalized costs, less accumulated amortization and related deferred income taxes, shall not exceed an amount (the cost center ceiling) equal to the sum of:
| a) | The present value of estimated future net revenues computed by applying current prices of oil and natural gas reserves (with consideration of price changes only to the extent provided by contractual arrangements) to estimated future production of proved oil and gas reserves as of the date of the latest balance sheet presented, less estimated future expenditures (based on current costs) to be incurred in developing and producing the proved reserves computed using a discount factor of ten percent and assuming continuation of existing economic conditions; plus |
| b) | The cost of properties not being amortized; plus |
| c) | The lower of cost or estimated fair market value of unproven properties included in the costs being amortized; less |
| d) | Income tax effects related to differences between the book and tax basis of the properties. |
If unamortized costs capitalized within a cost center, less related deferred income taxes, exceed the cost center ceiling (as defined), the excess is charged to expense and separately disclosed during the period in which the excess occurs. Amounts required to be written off will not be reinstated for any subsequent increase in the cost center ceiling. An impairment of oil and gas properties of $5,116,000 was recorded for 2015. No impairment of oil and gas properties charge was recorded for 2014 or 2013.
Depreciation and amortization for each cost center are computed on a composite unit-of-production method, based on estimated proven reserves attributable to the respective cost center. All costs associated with oil and gas properties are currently included in the base for computation and amortization. Such costs include all acquisition, exploration, development costs and estimated future expenditures for proved undeveloped properties as well as estimated dismantlement and abandonment costs as calculated under the asset retirement obligation category, net of salvage value. All of the Company's oil and gas properties are located within the continental United States.
Gains and losses on sales of oil and gas properties are treated as adjustments of capitalized costs. Gains or losses on sales of property and equipment, other than oil and gas properties, are recognized as part of operations. Expenditures for renewals and improvements are capitalized, while expenditures for maintenance and repairs are charged to operations as incurred.
Property and Equipment
The Company, as operator, leases equipment to owners of oil and gas wells, on a month-to-month basis.
The Company, as operator, transports natural gas through its natural gas gathering systems, in exchange for a fee.
Depreciation is provided in amounts sufficient to relate the cost of depreciable assets to operations over their estimated service lives (5 to 10 years for rental equipment and natural gas gathering systems, 4 to 5 years for other
| 54 |
property and equipment). The straight-line method of depreciation is used for financial reporting purposes, while accelerated methods are used for tax purposes.
Real Estate Property
The Company owns land along with a two-story commercial office building which is situated thereon. The Company occupies a portion of the building as its primary corporate headquarters, and leases the remaining space in the building to non-related third party commercial tenants at prevailing market rates. The Company depreciates the commercial office using the straight-line method of depreciation for financial statement and income tax purposes.
Investments in Real Estate
All investments in real estate holdings are stated at cost or adjusted carrying value. ASC Topic 360, “Accounting for the Impairment or Disposal of Long-Lived Assets”, requires that a property be considered impaired if the sum of the expected future cash flows (undiscounted and without interest charges) is less than the carrying amount of the property. If impairment exists, an impairment loss is recognized by a charge against earnings equal to the amount by which the carrying amount of the property exceeds fair market value less cost to sell the property. If impairment of a property is recognized, the carrying amount of the property is reduced by the amount of the impairment, and a new cost for the property is established. Depreciation is provided over the properties estimated remaining useful life. There was no charge to earnings during 2015 due to impairment of real estate holdings.
Accounting for Asset Retirement Obligations
The Company adopted ASC Topic 410-20, "Accounting for Asset Retirement Obligations" on December 31, 2005. This statement requires the recording of a liability in the period in which an asset retirement obligation ("ARO") is incurred, in an amount equal to the discounted estimated fair value of the obligation that is capitalized. Thereafter, each quarter, this liability is accreted up to the final retirement cost. The determination of the ARO is based on an estimate of the future cost to plug and abandon our oil and gas wells. The actual costs could be higher or lower than current estimates.
The following table reflects the changes of the asset retirement obligations during the period ending December 31;
| 2015 | 2014 | |
| Carrying amount of asset retirement obligation | $ 1,078,000 | $ 1,107,000 |
| Liabilities added | 54,000 | 36,000 |
| Liabilities divested or settled | (46,000) | (107,000) |
| Current period accretion expenses | 35,000 | 42,000 |
| Carrying amount as of December 31, | $ 1,121,000 | $ 1,078,000 |
Revenue Recognition
The Company follows the “sales” (takes or cash) method of accounting for oil and natural gas revenues. Under this method, the Company recognizes revenues on oil and natural gas production as it is taken and delivered to the purchasers. The volumes sold may be more or less than the volumes the Company is entitled to take based on our ownership in the property. These differences result in a condition known as a production imbalance. Our crude oil and natural gas imbalances are insignificant.
| 55 |
Income Taxes
In June, 2006, an interpretation of ASC Topic 740-10, “Accounting for Uncertainty in Income Taxes” was issued. The interpretation creates a single model to address accounting for uncertainty in tax positions. Specifically, the pronouncement prescribes a recognition threshold and a measurement attribute for the financial statement recognition and measurement of a tax position taken or expected to be taken in a tax return. The interpretation also provides guidance on de-recognition, classification, interest and penalties, accounting in interim periods, disclosure and transition of certain tax positions. Federal and state tax authorities generally have the right to examine and audit the previous three years of tax returns filed.
The Company accounts for income taxes pursuant to ASC Topic 740-10 "Accounting for Income Taxes" , which requires the recognition of deferred tax liabilities and assets for the expected future tax consequences of events that have been recognized in the Company's financial statements or tax returns. Under this method, deferred tax liabilities and assets are determined based on the difference between the financial statement carrying amounts and tax bases of assets and liabilities, using enacted tax rates in effect in the years in which the differences are expected to reverse. The temporary differences primarily relate to depreciation, depletion and intangible drilling costs.
Use of Estimates
The preparation of financial statements in conformity with U. S. Generally Accepted Accounting Principles requires management to make estimates and assumptions that affect the reported amounts of assets and liabilities and disclosure of contingent assets and liabilities at the date of the financial statements and the reported amounts of revenues and expenses during the reporting period. Actual results could differ from those estimates.
Share-Based Payments
Effective January 1, 2006, the Company adopted ASC Topic 718-10, “Share-Based Payment". ASC Topic 718-10 requires compensation costs related to share-based payments to be recognized in the income statement over the requisite service period. The amount of the compensation cost is to be measured based on the grant-date fair value of the instrument issued. ASC Topic 718-10 is effective for awards granted or modified after the date of adoption and for awards granted prior to that date that have not vested. ASC Topic 718-10 does not materially change the Company's existing accounting practices or the amount of share-based compensation recognized in earnings.
Recently Issued Accounting Pronouncements
In November, 2015, the FASB issued Accounting Standards Update No. 2015-17: Income Taxes (Topic 740): Balance Sheet Classification of Deferred Taxes. (“ASU 2015-17”). ASU 2015-17 is part of an initiative to reduce complexity in accounting standards. Current GAAP requires an entity to separate deferred income tax liabilities and assets into current and noncurrent amounts in a classified statement of financial position. However, the classification does not generally align with the time period in which the recognized deferred tax amounts are expected to be recovered or settled. To simplify the presentation of deferred income taxes, the amendments in this Update require that deferred tax liabilities and assets be classified as noncurrent in a classified statement of financial position. The current requirement that deferred tax liabilities and assets of a tax-paying component of an entity be offset and presented as a single amount is not affected by the amendments in this Update. For public business entities, the amendments in this Update are effective for financial statement issued for annual periods beginning after December 15, 2016 and interim periods within those annual periods. The Company has selected early application starting with the financial statements issued for the year ending December 31, 2015. The provisions of this accounting update do not have a material impact on the Company’s financial position or results of operations. Accordingly, the deferred tax liability and valuation allowance are classified as non-current.
| 56 |
In May, 2014, the FASB and the International Accounting Standards Board (“IASB”) jointly issued new accounting guidance for recognition of revenue: Accounting Standards Update No. 2014-09: Revenue from Contracts with Customers (Topic 606) (“ASU 2014-09”). In August, 2015, the FASB issued Accounting Standards Update No. 2015-14: Revenue from Contracts with Customers (Topic 606): Deferral of the Effective Date (“ASU 2015-14”). The amendments in ASU 2015-14 defer the effective date of ASU 2014-09 to annual reporting periods beginning after December 15, 2017, including interim reporting periods within that reporting period. Therefore, when the Company issues financial statements on Forms 10-Q and 10-K for periods included in its year ended December 31, 2018, its comparative periods that are presented for the years ended December 31, 2016 and 2017 must be retrospectively presented. The Company does not anticipate that this new guidance will have a material impact on the Company’s consolidated financial position or results of operations for the periods presented.
Currently, there are no other new accounting pronouncements that were issued to be effective in 2015 or subsequent thereto that would have a material impact on the Company’s financial reporting.
Certain amounts in the 2014 financial statements have been reclassified for comparative purposes to conform to the 2015 presentation.
Subsequent Events
The Company has evaluated subsequent events through the issuance date of March 30, 2016.
3. ACCOUNTS RECEIVABLE
| December 31, | ||
| 2015 | 2014 | |
| Trade | $ 167,000 | $ 82,000 |
| Accrued receivable | 1,683,000 | 2,086,000 |
| 1,850,000 | 2,168,000 | |
| Less: Allowance for losses | (15,000) | (15,000) |
| $ 1,835,000 | $ 2,153,000 | |
Accrued receivables are receivables from purchasers of oil and gas. These revenues are booked from check stub detail after receipt of the check for sales of oil and natural gas products. These payments are for sales of oil and natural gas produced in the reporting period, but for which payment has not yet been received until after the closing date of the reporting period. Therefore these sales are accrued as receivables as of the balance sheet date. Revenues for oil and natural gas production that has been sold but for which payment has not yet been received is accrued in the period sold.
4. ACCOUNTS PAYABLE
| December 31, | ||
| 2015 | 2014 | |
| Trade payables | $ 1,609,000 | $ 907,000 |
| Production proceeds payable | 2,911,000 | 2,951,000 |
| Prepaid drilling costs | 1,289,000 | 2,496,000 |
| $ 5,809,000 | $ 6,354,000 | |
| 57 |
5. NOTES PAYABLE
Effective December 27, 2013, the Company prepaid the remaining principal balance plus accrued interest on its note payable to a bank for the commercial office building. The note was paid in full.
6. RELATED PARTY TRANSACTIONS
On October 1, 2008, Giant entered into an Administrative Services Agreement with the Company whereby Giant agreed to pay the Company $250 per month for the Company providing administrative services to Giant. The Company had also entered into a management services agreement with M-R Oilfield Services, LP (“MRO”), whereby MRO made monthly payments in the amount of $1,000 to the Company in exchange for the Company providing administrative services to MRO. The Administrative Services Agreement between the Company and MRO was terminated effective September 1, 2015 when MRO ceased operations. On October 1, 2008, the Company entered into a similar agreement with Giant NRG, LP (“NRG”), a limited partnership with Chris Mazzini and Michelle Mazzini as limited partners. Under this agreement NRG pays a monthly fee of $2,500 to the Company in exchange for the Company providing certain administrative services to NRG. The Company has entered into a similar arrangement with Peveler Pipeline, LP ("Peveler"), whereby Peveler pays the Company a monthly charge of $250 in exchange for the Company providing administrative services to Peveler. Chris and Michelle Mazzini are the owners of Peveler Pipeline, LP, a limited partnership which owns a pipeline gathering system servicing wells owned by Giant, another related entity, described elsewhere in this report. The Company entered into a similar agreement with M-R Ventures, LLC (“MRV”), a limited liability company that operates some wells in Michigan, and that is owned by Chris and Michelle Mazzini. Pursuant to this agreement, MRV pays the Company a monthly fee in the amount of $500 for certain administrative services that the Company provides to MRV. The Company entered into a similar agreement with Reserve Royalty Company (“Reserve”) a sole proprietorship that holds some royalty interests owned by Chris and Michelle Mazzini. Pursuant to this agreement, Reserve pays the Company a monthly fee in the amount $350 for certain administrative services that the Company provides to Reserve.
The long-term debt, which was secured by the commercial office building, was also guaranteed individually by Chris G. Mazzini and Michelle H. Mazzini, related parties. Effective December 27, 2013, the Company prepaid the remaining principal balance plus accrued interest and the note was paid in full.
7. COMMON STOCK
Effective January 1, 2006, the Company adopted ASC Topic 718-10, "Share-Based Payment". ASC Topic 718-10 requires compensation costs related to share-based payments to be recognized in the income statement over the requisite service period. The amount of the compensation cost is to be measured based on the grant date fair value of the instrument issued. ASC Topic 718-10 is effective for awards granted or modified after the date of adoption and for awards granted prior to that date that have not vested. ASC Topic 718-10 does not materially change the Company's existing accounting practices or the amount of share-based compensation recognized in earnings.
During the three year period ending December 31, 2015, the Company did not issue any compensation related to share-based payments.
The Company has not approved nor authorized any standing repurchase program for its common stock.
The Company made no repurchases of its common stock during 2014 or 2015.
The repurchased shares are held as Treasury Stock.
| 58 |
8. INCOME TAXES
The Company accounts for income taxes pursuant to ASC Topic 740-10, "Accounting for Income Taxes". ASC Topic 740-10 utilizes the liability method of computing deferred income taxes.
Income tax differed from the amounts computed by applying an effective United States federal income tax rate of 34% to pretax income in 2015, 2014 and 2013 as a result of the following:
| 2015 | 2014 | 2013 | |
| Computed expected tax expense (benefit) | $ (2,735,000) | $ 1,290,000 | $ 1,405,000 |
| Miscellaneous timing differences | |||
| related to book and tax depletion | |||
| differences and the expensing of | |||
| intangible drilling costs | 1,978,000 | (764,000) | (803,000) |
| Correction of prior year estimate | (171,000) | - | - |
| Expected Federal income tax expense (benefit) | $ (928,000) | $ 526,000 | $ 602,000 |
| Income tax expense (benefit) for the years ended December 31, 2015, 2014 and 2013 consisted of the following: | |||
| 2015 | 2014 | 2013 | |
| Federal income taxes (benefit) | $ (928,000) | $ 526,000 | $ 602,000 |
| State income taxes | - | - | - |
| Current income tax provision (benefit) | $ (928,000) | $ 526,000 | $ 602,000 |
Deferred income taxes reflect the effects of temporary differences between the tax bases of assets and liabilities and the reported amounts of those assets and liabilities for financial reporting purposes. Deferred income taxes also reflect the value of investment tax credits and an offsetting valuation allowance. The Company's total deferred tax assets and corresponding valuation allowance at December 31, 2015 and 2014 consisted of the following:
| December 31, | ||
| 2015 | 2014 | |
| Deferred tax assets | ||
| Depreciation, depletion and amortization | 1,186,000 | 450,000 |
| Other, net | 7,000 | 7,000 |
| Expired leasehold | 190,000 | 89,000 |
| Total deferred tax assets | 1,383,000 | 546,000 |
| Deferred tax liabilities | ||
| Intangible drilling costs | (1,801,000) | (2,115,000) |
| Depreciation | (72,000) | (259,000) |
| Total deferred tax liability | (1,873,000) | (2,374,000) |
| Net deferred tax liability | $ (490,000) | $ (1,828,000) |
| 59 |
9. CASH FLOW INFORMATION
The Company does not consider any of its assets, other than cash and certificates of deposit shown as cash on the balance sheet, to meet the definition of a cash equivalent.
| Net cash provided by operating activities includes cash payments for the following: | |||
| 2015 | 2014 | 2013 | |
| Interest expense | $ - | $ - | $ 17,000 |
| Income taxes | 50,000 | 950,000 | 450,000 |
| Excluded from the Consolidated Statements of Cash Flows were the effects of certain non-cash investing and financing activities, as follows: | |||
| 2015 | 2014 | 2013 | |
| Addition (Reduction) of oil & gas | |||
| properties by recognitions of | |||
| asset retirement obligation | $ 8,000 | $ (71,000) | $ 40,000 |
| $ 8,000 | $ (71,000) | $ 40,000 | |
10. EARNINGS PER SHARE
Earnings per share ("EPS") are calculated in accordance with ASC Topic 260-10, "Earnings per Share", which was adopted in 1997 for all years presented. Basic EPS is computed by dividing income available to common shareholders by the weighted average number of common shares outstanding during the period. The adoption of ASC Topic 260-10 had no effect on previously reported EPS. Diluted EPS is computed based on the weighted number of shares outstanding, plus the additional common shares that would have been issued had the options outstanding been exercised.
11. CONCENTRATIONS OF CREDIT RISK
Subsequent to December 31, 2012, FDIC Deposit Insurance coverage changed. As scheduled, the unlimited insurance coverage for noninterest-bearing transaction accounts provided under the Dodd-Frank Wall Street Reform and Consumer Protection Act expired on December 31, 2012. Deposits held in non-interest-bearing transaction accounts are now aggregated with any interest-bearing deposits the owner may hold in the same ownership category, and the combined total insured up to at least $250,000.
Beginning January 1, 2013, noninterest-bearing transaction accounts will no longer be insured separately from depositors’ other accounts at the same institution. Instead, noninterest-bearing transaction accounts will be added to any of a depositor’s other accounts in the applicable ownership category, and the aggregate balance insured up to at least the Standard Minimum Deposit Insurance Amount (SMDIA) of $250,000, per depositor, at each separately chartered institution.
As of December 31, 2015 the Company had approximately $7,742,000 in checking and money market accounts at one bank, and approximately $3,178,000 in a second bank. The Company also had approximately $3,940,000, including $400,000 of short-term certificates of deposit and $1,200,000 of long-term certificates of deposit invested at five other banking institutions. Cash amounts on deposit at these institutions exceeded current per account FDIC protection limits by approximately $11,672,000.
| 60 |
Most of the Company's business activity is located in Texas. Accounts receivable as of December 31, 2015 and 2014 are due from both individual and institutional owners of joint interests in oil and gas wells as well as purchasers of oil and natural gas. A portion of the Company's ability to collect these receivables is dependent upon revenues generated from sales of oil and natural gas produced by the related wells.
12. FINANCIAL INSTRUMENTS
The estimated fair value of the Company's financial instruments at December 31, 2015 and 2014 follows:
| 2015 | 2014 | |||
| Carrying Amount |
Fair Value |
Carrying Amount |
Fair Value | |
| Cash | $ 12,845,000 | $ 12,845,000 | $ 14,294,000 | $ 14,294,000 |
| Short-term certificates | 400,000 | 400,000 | 400,000 | 400,000 |
| Long-term certificates | 1,200,000 | 1,200,000 | 1,200,000 | 1,200,000 |
| Accounts receivable | 1,835,000 | 1,835,000 | 2,153,000 | 2,153,000 |
The fair value amounts for each of the financial instruments listed above approximate carrying amounts due to the short maturities of these instruments.
13. COMMITMENTS AND CONTINGENCIES
The Company's oil and gas exploration and production activities are subject to Federal, State and environmental quality and pollution control laws and regulations. Such regulations restrict emission and discharge of wastes from wells, may require permits for the drilling of wells, prescribe the spacing of wells and rate of production, and require prevention and clean-up of pollution.
Although the Company has not in the past incurred substantial costs in complying with such laws and regulations, future environmental restrictions or requirements may materially increase the Company's capital expenditures, reduce earnings, and delay or prohibit certain activities.
At December 31, 2015 the Company has acquired bonds and letters of credit issued in favor of various state regulatory agencies as mandated by state law in order to comply with financial assurance regulations required to perform oil and gas operations within the various state jurisdictions.
The Company has seven, $5,000 single-well bonds totaling $35,000 and one $10,000 single well bond with an insurance company, for wells the Company operates in Alabama. The $5,000 bonds are written for a three year period and the $10,000 bond is written for a one year period.
The Company has 11 letters of credit from a bank issued for the benefit of various state regulatory agencies in Texas, New Mexico, Oklahoma, and Louisiana, ranging in amounts from $17,875 to $100,000 and totaling $462,875.00. These letters of credit have expiration dates that range from January 31, 2016 through March 31, 2017 and are fully secured by funds on deposit with the bank in business money market accounts.
| 61 |
14. ADDITIONAL OPERATIONS AND BALANCE SHEET INFORMATION
Certain information about the Company's operations for the years ended December 31, 2015, 2014 and 2013 follows.
Dependence on Customers
The following is a summary of significant purchasers / operators (listed by percent of total oil and natural gas sales) from oil and natural gas produced by the Company for the three-year period ended December 31, 2015:
| Purchaser / Operator | 2015 | 2014 | 2013 |
| New Gulf Resources | 16% | 9% | 0% |
| Targa Midstream Service, LIM | 9% | 8% | 5% |
| Eastex Crude Company | 8% | 7% | 7% |
| Pruet Production Co. | 7% | 6% | 13% |
| Enbridge Energy Partners | 7% | 12% | 6% |
| Enlink Gas Marketing, LTD. | 6% | 4% | 0% |
| Sunoco Partners Marketing | 5% | 5% | 4% |
| OXY USA, Inc. | 4% | 0% | 0% |
| Shell Trading (US) Company | 4% | 5% | 8% |
| Valero Energy Corporation | 3% | 1% | 0% |
| Phillips 66 | 2% | 1% | 1% |
| Ward Petrolum Corporation | 2% | 1% | 1% |
| DCP Midstream, LP | 2% | 1% | 1% |
| LPC Crude Oil Marketing LLC | 2% | 2% | 0% |
| Midcoast Energy Partners LP | 2% | 2% | 0% |
| Enervest Operating, LLC | 2% | 2% | 2% |
| Enterprise Crude Oil, LLC | 2% | 2% | 2% |
| Agave Energy Company | 1% | 2% | 0% |
| Gulfmark Energy, Inc. | 0% | 0% | 3% |
| Crosstex Gulf Coast Mktg | 0% | 0% | 5% |
| Holly Corp (Formerly Navajo Refining Co.) | 0% | 2% | 2% |
| Halcon Resources Operating, Inc. | 0% | 9% | 28% |
Oil and natural gas is sold to approximately 119 different purchasers under market sensitive, short-term contracts computed on a month to month basis.
Except as set forth above, there are no other customers of the Company that individually accounted for more than two percent of the Company's oil and gas revenues during the three years ended
December 31, 2015.
The Company currently has no hedged contracts.
| 62 |
Certain revenues, costs and expenses related to the Company's oil and gas operations are as follows:
| Year Ended December 31, | |||
| 2015 | 2014 | 2013 | |
| Capitalized costs relating to oil and gas | |||
| producing activities: | |||
| Unproved properties | $ 1,872,000 | $ 1,847,000 | $ 2,398,000 |
| Proved properties | 27,272,000 | 26,220,000 | 22,425,000 |
| Total capitalized costs | 29,144,000 | 28,067,000 | 24,823,000 |
| Accumulated amortization | (21,824,000) | (14,357,000) | (12,586,000) |
| Total capitalized costs, net | $ 7,320,000 | 13,710,000 | 12,237,000 |
| Year Ended December 31, | |||
| 2015 | 2014 | 2013 | |
| Costs incurred in oil and gas property | |||
| acquisitions, exploration and development: | |||
| Acquisition of properties | $ 15,000 | $ 413,000 | $ 914,000 |
| Development costs | 1,549,000 | 2,617,000 | 1,087,000 |
| Total costs incurred | $ 1,564,000 | $ 3,030,000 | $ 2,001,000 |
| Year Ended December 31, | |||
| 2015 | 2014 | 2013 | |
| Results of operations from producing activities: | |||
| Sales of oil and gas | $ 4,841,000 | $11,688,000 | $ 12,457,000 |
| Production costs | 2,965,000 | 3,236,000 | 3,526,000 |
| Amortization of oil and gas properties | 2,351,000 | 1,771,000 | 1,842,000 |
| Total production costs | 5,316,000 | 5,007,000 | 5,368,000 |
| Total net revenue | $ (475,000) | $ 6,681,000 | $ 7,089,000 |
| Year Ended December 31, | |||
| 2015 | 2014 | 2013 | |
| Sales price per equivalent Mcf | $ 4.34 | $ 9.17 | $ 9.76 |
| Production costs per equivalent Mcf | $ 2.66 | $ 2.54 | $ 2.76 |
| Amortization per equivalent Mcf | $ 2.11 | $ 1.39 | $ 1.44 |
| 63 |
| Year Ended December 31, | |||
| 2015 | 2014 | 2013 | |
| Results of operations from gas gathering | |||
| and equipment rental activities: | |||
| Revenue | $ 141,000 | $ 155,000 | $ 142,000 |
| Operating expenses | 32,000 | 49,000 | 42,000 |
| Depreciation | 13,000 | 6,000 | - |
| Total costs | 45,000 | 55,000 | 42,000 |
| Total net revenue | $ 96,000 | $ 100,000 | $ 100,000 |
15. BUSINESS SEGMENTS
The Company's three business segments are (1) oil and gas exploration, acquisition, production and operations, (2) transportation and compression of natural gas, and (3) commercial real estate investment. Management has chosen to organize the Company into the three segments based on the products or services provided. The following is a summary of selected information for these segments for the
three-year period ended December 31, 2015:
| Year Ended December 31, | |||
| 2015 | 2014 | 2013 | |
| Revenues: (1) | |||
| Oil and gas exploration, production | $ 5,322,000 | $ 12,169,000 | $ 12,866,000 |
| and operations | |||
| Gas gathering, compression and | 141,000 | 155,000 | 142,000 |
| equipment rental | |||
| Real estate rental | 230,000 | 240,000 | 249,000 |
| $ 5,693,000 | $ 12,564,000 | $ 13,257,000 | |
| Year Ended December 31, | |||
| 2015 | 2014 | 2013 | |
| Depreciation, depletion, and | |||
| amortization expense: | |||
| Oil and gas exploration, production | $ 2,365,000 | $ 1,794,000 | $ 1,860,000 |
| and operations | |||
| Impairment of oil and gas assets | 5,116,000 | - | - |
| Gas gathering, compression and | 13,000 | - | - |
| equipment rental | |||
| Real estate rental | 48,000 | 52,000 | 53,000 |
| $ 7,542,000 | $ 1,846,000 | $ 1,913,000 | |
| 64 |
| Year Ended December 31, | |||
| 2015 | 2014 | 2013 | |
| Income from operations: | |||
| Oil and gas exploration, production | $ (5,159,000) | $ 7,097,000 | $ 7,363,000 |
| and operations | |||
| Gas gathering, compression and | 96,000 | 106,000 | 100,000 |
| equipment rental | |||
| Real estate rental | (33,000) | (32,000) | (19,000) |
| (5,096,000) | 7,171,000 | 7,444,000 | |
| Corporate and other (2) | (681,000) | (3,966,000) | (3,902,000) |
| Consolidated net income (loss) | $ (5,777,000) | $ 3,205,000 | $ 3,542,000 |
| Year Ended December 31, | |||
| 2015 | 2014 | 2013 | |
| Identifiable assets net of DDA: | |||
| Oil and gas exploration, production | |||
| and operations | $ 7,361,000 | $ 13,722,000 | $ 12,267,000 |
| Gas gathering, compression and | |||
| equipment rental | 23,000 | 35,000 | (1,000) |
| Real estate rental | 1,465,000 | 1,512,000 | 1,563,000 |
| 8,849,000 | 15,269,000 | 13,829,000 | |
| Corporate and other (3) | 17,040,000 | 18,237,000 | 14,366,000 |
| Consolidated total assets | $ 25,889,000 | $ 33,506,000 | $ 28,195,000 |
Note (1): All reported revenues are from external customers.
Note (2): Corporate and other includes general and administrative expenses,
other non-operating income and expense and income taxes.
Note (3): Corporate and other includes cash, accounts and notes receivable,
inventory, other property and equipment and intangible assets.
16. SUPPLEMENTARY INCOME STATEMENT INFORMATION
The following items were charged directly to expense:
| Year Ended December 31, | |||
| 2015 | 2014 | 2013 | |
| Maintenance and repairs | $ 21,000 | $ 40,000 | $ 17,000 |
| Production taxes | 190,000 | 582,000 | 569,000 |
| Taxes, other than payroll and income taxes | 35,000 | 48,000 | 29,000 |
| 65 |
17. QUARTERLY DATA (UNAUDITED)
The table below reflects selected quarterly information for the years ended December 31, 2015, 2014 and 2013.
| Year Ended December 31, 2015 | ||||
| First Quarter |
Second Quarter |
Third Quarter |
Fourth Quarter | |
| Revenue | $ 1,456,000 | $ 1,496,000 | $ 1,551,000 | $ 1,441,000 |
| Expense | (1,895,000) | (2,110,000) | (2,097,000) | (7,885,000) |
| Operating income (loss) | (439,000) | (614,000) | (546,000) | (6,444,000) |
| Current tax (provision) benefit | 50,000 | 384,000 | (262,000) | 756,000 |
| Deferred tax (provision) benefit | 233,000 | 278,000 | 329,000 | 498,000 |
| Net income (loss) | $ (156,000) | $ 48,000 | $ (479,000) | $ (5,190,000) |
| Earnings (loss) per share of | ||||
| common stock | ||||
| Basic and diluted | $ (0.02) | $ 0.01 | $ (0.07) | $ (0.75) |
| Year Ended December 31, 2014 | ||||
| First Quarter |
Second Quarter |
Third Quarter |
Fourth Quarter | |
| Revenue | $ 3,568,000 | $ 3,893,000 | $ 3,174,000 | $ 2,573,000 |
| Expense | (2,047,000) | (2,513,000) | (2,001,000) | (2,851,000) |
| Operating income (loss) | 1,521,000 | 1,380,000 | 1,173,000 | (278,000) |
| Current tax (provision) benefit | (216,000) | 39,000 | (136,000) | (213,000) |
| Deferred tax (provision) benefit | (290,000) | (100,000) | (107,000) | 432,000 |
| Net income (loss) | $ 1,015,000 | $ 1,319,000 | $ 930,000 | $ (59,000) |
| Earnings (loss) per share of | ||||
| common stock | ||||
| Basic and diluted | $ 0.15 | $ 0.19 | $ 0.13 | $ (0.01) |
| Year Ended December 31, 2013 | ||||
| First Quarter |
Second Quarter |
Third Quarter |
Fourth Quarter | |
| Revenue | $ 2,368,000 | $ 3,763,000 | $ 2,647,000 | $ 4,769,000 |
| Expense | (1,839,000) | (2,240,000) | (2,120,000) | (3,279,000) |
| Operating income (loss) | 529,000 | 1,523,000 | 527,000 | 1,490,000 |
| Current tax (provision) benefit | (82,000) | (246,000) | 10,000 | (284,000) |
| Deferred tax (provision) benefit | 54,000 | (209,000) | 35,000 | 195,000 |
| Net income (loss) | $ 501,000 | $ 1,068,000 | $ 572,000 | $ 1,401,000 |
| Earnings (loss) per share of | ||||
| common stock | ||||
| Basic and diluted | $ 0.07 | $ 0.15 | $ 0.08 | $ 0.21 |
| 66 |
18. SUPPLEMENTAL RESERVE INFORMATION (UNAUDITED)
The Company’s net proved oil and natural gas reserves as of December 31, 2015, 2014, and 2013 have been estimated by Company personnel.
All estimates are in accordance generally accepted petroleum engineering and evaluation principles and definitions and with guidelines established by the Securities and Exchange Commission. All of the Company’s reserves are located in the United States of America and accounted for under one cost center.
Our policies and practices regarding internal control over the estimating of reserves are structured to objectively and accurately estimate our oil and natural gas reserve quantities and present values in compliance with the U.S. Securities and Exchange Commission (“SEC”) regulations and accounting principles generally accepted in the United States of America. We maintain an internal staff of petroleum engineers and geosciences professionals who work closely with the accounting and financial departments to insure the integrity, accuracy and timeliness of data used in the estimation process. The data used in our reserve estimation process is based on historical results for production, oil and natural gas prices received, lease operating expenses and development costs incurred, ownership interest and other required data. Historical oil and natural gas prices, lease operating expenses, and ownership interests are provided by and verified by the Company’s accounting department.
The Petroleum Engineer responsible for the supervision and preparation of the Company’s internally generated reserve report has a Bachelor of Science degree in Petroleum Engineering from a major university and has experience in preparing economic evaluations and reserve estimates. He meets the requirements regarding qualifications, objectivity and confidentiality set forth in the Standards Pertaining to the Engineering and Auditing of Oil and Gas Reserves Information promulgated by the Society of Petroleum Engineers.
The Company has established a written internal control procedure to verify that the data entered into our engineering evaluation software is complete and correct. These internal control procedures establish the source of the data both internally and externally, the personnel that will collect the data and testing of the data collected to ensure its accuracy.
The following reserve estimates were based on existing economic and operating conditions. Oil and natural gas prices for 2015, 2014, and 2013 were calculated using a 12-month average price, calculated as the un-weighted arithmetic average of the first-day-of-the month price for each month of each year. Operating costs, production and ad valorem taxes and future development costs were based on current costs with no escalation.
There are numerous uncertainties inherent in estimating quantities of proved reserves and in projecting the future rates of production and timing of development expenditures. The following reserve data represents estimates only and should not be construed as being exact. Moreover, the present values should not be construed as the current market value of the Company's oil and natural gas reserves or the costs that would be incurred to obtain equivalent reserves.
| 67 |
Changes in Estimated Quantities of Proved Oil and Gas Reserves (Unaudited):
| Quantities of Proved Reserves: | Crude Oil Bbls |
Natural Gas Mcf | |
| Balance December 31, 2012 | 498,720 | 6,533,000 | |
| Sales of reserves in place | - | - | |
| Acquired properties | 11,490 | 630,830 | |
| Extensions and discoveries | 44,082 | 13,930 | |
| Revisions of previous estimates * | (14,540) | 321,215 | |
| Production | (89,872) | (736,645) | |
| Balance December 31, 2013 | 449,880 | 6,762,330 | |
| Sales of reserves in place | - | - | |
| Acquired properties | 8,910 | - | |
| Extensions and discoveries | 10,240 | 69,870 | |
| Revisions of previous estimates * | 24,544 | 747,239 | |
| Production | (89,068) | (739,948) | |
| Balance December 31, 2014 | 404,506 | 6,839,491 | |
| Sales of reserves in place | - | (121,810) | |
| Acquired properties | - | - | |
| Extensions and discoveries | 38,800 | 107,480 | |
| Revisions of previous estimates * | (93,559) | (2,054,712) | |
| Production | (64,207) | (730,709) | |
| Balance December 31, 2015 | 285,540 | 4,039,740 | |
| * May also include divestitures, not only changes in engineering. | |||
| Proved Developed Reserves: | |||
| Balance December 31, 2013 | 449,880 | 6,762,330 | |
| Balance December 31, 2014 | 404,506 | 6,839,491 | |
| Balance December 31, 2015 | 285,540 | 4,039,740 | |
Standardized Measure of Discounted Future Net Cash Flows and Changes Therein Relating to Proved Oil and Natural Gas Reserves (Unaudited)
The Standardized Measure of Discounted Future Net Cash Flows and Changes Therein Relating to Proved Oil and Natural Gas Reserves ("Standardized Measures") does not purport to present the fair market value of a company's oil and gas properties. An estimate of such value should consider, among other factors, anticipated future prices of oil and natural gas, the probability of recoveries in excess of existing proved reserves, the value of probable reserves and acreage prospects, and perhaps different discount rates. It should be noted that estimates of reserve quantities, especially from new discoveries, are inherently imprecise and subject to substantial revision.
Reserve estimates were prepared in accordance with standard Security and Exchange Commission guidelines. The future net cash flow for 2015, 2014, and 2013, was computed using a 12-month average price, calculated as the un-weighted arithmetic average of the first-day-of-the month price for each month of the year. Lease operating costs, compression, dehydration, transportation, ad valorem taxes, severance taxes, and federal income taxes were deducted. Costs and prices were held constant and were not escalated over the life of the properties. No deduction has been made for interest, or general corporate overhead. The annual discount of estimated future cash flows is defined, for use herein, as future cash flows discounted at 10% per year, over the expected period of realization.
| 68 |
Proved Developed Reserves were calculated based on Decline Curve Analysis on 53 operated wells and 42 non-operated wells. Materially insignificant operated and non-operated wells were excluded from the reserve estimate.
The Company emphasizes that reserve estimates are inherently imprecise. Accordingly, the estimates are expected to change as more current information becomes available. It is reasonably possible that, because of changes in market conditions or the inherent imprecision of these reserve estimates, that the estimates of future cash inflows, future gross revenues, the amount of oil and natural gas reserves, the remaining estimated lives of the oil and natural gas properties, or any combination of the above may be increased or reduced in the near term. If reduced, the carrying amount of capitalized oil and gas properties may be reduced materially in the near term.
| Year Ended December 31, | |||
| 2015 | 2014 | 2013 | |
| Future production revenue | $ 21,230,000 | $ 63,857,000 | $ 69,583,000 |
| Future development costs | - | - | (108,000) |
| Future production costs | (10,989,000) | (27,073,000) | (30,072,000) |
| Future net cash flow before Federal income taxes | 10,241,000 | 36,784,000 | 39,403,000 |
| Future income taxes | (2,867,000) | (10,300,000) | (11,033,000) |
| Future net cash flows | 7,374,000 | 26,484,000 | 28,370,000 |
| Effect of 10% annual discounting | (368,000) | (4,266,000) | (4,209,000) |
| Standardized measure of discounted cash flows | $ 7,006,000 | $ 22,218,000 | $ 24,161,000 |
Changes in the standardized measure of discounted future net cash flows:
| Year Ended December 31, | |||
| 2015 | 2014 | 2013 | |
| Beginning of the year | $ 22,218,000 | $ 24,161,000 | $ 22,263,000 |
| Sales of oil and gas, net of production costs | (1,785,000) | (8,041,000) | (8,498,000) |
| Net changes in prices and production costs | (16,505,000) | (969,000) | 2,945,000 |
| Extensions, discoveries, additions | |||
| less related costs | 937,000 | 345,000 | 2,916,000 |
| Development costs incurred | 1,474,000 | 2,490,000 | 1,035,000 |
| Net changes in future development cost | - | (103,000) | 7,000 |
| Revisions of previous quantity estimates | (1,965,000) | 1,474,000 | (946,000) |
| Net change in purchase and sales of | |||
| minerals in place | - | 116,000 | 1,200,000 |
| Accretion of discount | 2,222,000 | 2,416,000 | 2,226,000 |
| Net change in income taxes | 1,516,000 | (22,000) | 614,000 |
| Other | (1,106,000) | 351,000 | 399,000 |
| End of year | $ 7,006,000 | $ 22,218,000 | $ 24,161,000 |
| 69 |
SPINDLETOP OIL & GAS CO. AND SUBSIDIARIES
VALUATION AND QUALIFYING ACCOUNTS
YEARS ENDED DECEMBER 31, 2015, 2014, AND 2013
| SCHEDULE I I | ||||
| Balance | Costs & Expenses |
Deductions | Ending Balance | |
| Allowance for doubtful accounts | ||||
| December 31, 2013 | $15,000 | $- | $- | $15,000 |
| December 31, 2014 | $15,000 | $- | $- | $15,000 |
| December 31, 2015 | $15,000 | $- | $- | $15,000 |
| 70 |
| SCHEDULE III | |||||
| SPINDLETOP OIL & GAS CO. AND SUBSIDIARIES | |||||
| REAL ESTATE AND ACCUMULATED DEPRECIATION | |||||
| Initial Cost to Corporation | Total Cost | ||||
| Description | Encumbrances | Land | Buildings | Subsequent to Acquist'n | |
| Two story multi-tenant garden office building with sub-grade parking garage located in Dallas, Texas | (b) | $ 688,000 | $ 1,298,000 | $ 282,000 | |
| Gross amounts at which carried at close of year | |||||
| Land | Buildings | Total | Accumulated Depreciation |
Life on which Depreciation Calculated |
Date Acquired |
| $ 688,000 | $1,580,000 | $ 2,268,000 | $ 803,000 | (a) | 12/27/2004 |
| Notes to Schedule III | |||||
| (a) See Footnote 2 to the Financial Statements outlining depreciation methods and lives. | |||||
| (b) See description of notes payable in Footnote 5 to the Financial Statements outlining the terms and provisions of the acquisition loan for the building. | |||||
| (c) The reconciliation for investments in real estate and accumulated depreciation for the years ended December 31, 2015 are as follows | |||
| Investments in Real Estate |
Accumulated Depreciation | ||
| Balance, December 31, 2005 | $ 1,986,000 | $ 49,000 | |
| Acquisitions | 210,000 | ||
| Depreciation expense | 71,000 | ||
| Balance, December 31, 2006 | 2,196,000 | 120,000 | |
| Acquisitions | 34,000 | ||
| Depreciation expense | 84,000 | ||
| Balance, December 31, 2007 | 2,230,000 | 204,000 | |
| Acquisitions | 38,000 | ||
| Depreciation expense | 96,000 | ||
| Balance, December 31, 2008 | 2,268,000 | 300,000 | |
| Acquisitions | |||
| Depreciation expense | 100,000 | ||
| Balance, December 31, 2009 | 2,268,000 | 400,000 | |
| 71 |
| Acquisitions | |||
| Depreciation expense | 101,000 | ||
| Balance, December 31, 2010 | 2,268,000 | 501,000 | |
| Acquisitions | |||
| Depreciation expense | 100,000 | ||
| Balance, December 31, 2011 | 2,268,000 | 601,000 | |
| Acquisitions | |||
| Depreciation expense | 51,000 | ||
| Balance, December 31, 2012 | 2,268,000 | 652,000 | |
| Acquisitions | |||
| Depreciation expense | 52,000 | ||
| Balance, December 31, 2013 | 2,268,000 | 704,000 | |
| Acquisitions | |||
| Depreciation expense | 52,000 | ||
| Balance, December 31, 2014 | 2,268,000 | 756,000 | |
| Acquisitions | |||
| Depreciation expense | 47,000 | ||
| Balance, December 31, 2015 | 2,268,000 | 803,000 |
Exhibit 21
SPINDLETOP OIL & GAS CO. AND SUBSIDIARIES
Subsidiaries of the Registrant
Spindletop Drilling Company, incorporated September 5, 1975, under the laws of the State of Texas, is a wholly owned subsidiary of the Registrant.
Prairie Pipeline Co. incorporated June 22, 1983, under the laws of the State of Texas, is a wholly owned subsidiary of Registrant.
| 72 |
Exhibit 31.1
CERTIFICATIONS
I, Chris G. Mazzini, certify that:
1. I have reviewed this report on Form 10-K of Spindletop Oil & Gas Co.;
2. Based on my knowledge, this report does not contain any untrue statement of a material fact or omit to state a material fact necessary to make the statements made, in light of the circumstances under which such statements were made, not misleading with respect to the period covered by this report;
3. Based on my knowledge, the financial statements, and other financial information included in this report, fairly present in all material respects the financial condition, results of operations and cash flows of the registrant as of, and for, the periods presented in this report;
4. The registrant's other certifying officers and I are responsible for establishing and maintaining disclosure controls and procedures (as defined in Exchange Act Rules 13-15(e) and 15d-15e) and internal control over financial reporting (as defined in Exchange Act Rules 13a-15(f) and 15d-15(f) for the registrant and have:
| (a) | designed such disclosure controls and procedures, or caused such disclosure controls and procedures to be designed under our supervision, to ensure that material information relating to the registrant, including its consolidated subsidiaries, is made known to us by others within those entities, particularly during the period in which this report is being prepared; |
| (b) | designed such internal control over financial reporting, or caused such internal control over financial reporting to be designed under our supervision, to provide reasonable assurance regarding the reliability of financial reporting and the preparation of financial statements for external purposes in accordance with generally accepted accounting principles; |
| (c) | evaluated the effectiveness of the registrant's disclosure controls and procedures and presented in this report our conclusions about the effectiveness of the controls and procedures as of the end of the period covered by this report based on such evaluation; and |
| (d) | disclosed in this report any change in the registrant's internal control over financial reporting that occurred during the registrant's most recent fiscal quarter that has materially affected, or is reasonably likely to materially affect, the registrant's internal control over financial reporting; and |
5. The registrant's other certifying officers and I have disclosed, based on our most recent evaluation of internal control over financial reporting, to the registrant's auditors and the audit committee of registrant's Board of directors (or persons performing the equivalent functions):
| (a) | all significant deficiencies and material weaknesses in the design or operation of internal control over financial reporting which are reasonably likely to adversely affect the registrant's ability to record, process, summarize and report financial information; and |
| (b) | any fraud, whether or not material, that involves management or other employees who have a significant role in the registrant's internal controls. |
|
Date: March 30, 2016
|
|
| By:/s/ Chris G. Mazzini | |
| Chris G. Mazzini | |
| President, Principal Executive Officer |
| 73 |
Exhibit 31.2
CERTIFICATIONS
I, Robert E. Corbin, certify that:
1. I have reviewed this report on Form 10-K of Spindletop Oil & Gas Co.;
2. Based on my knowledge, this report does not contain any untrue statement of a material fact or omit to state a material fact necessary to make the statements made, in light of the circumstances under which such statements were made, not misleading with respect to the period covered by this report;
3. Based on my knowledge, the financial statements, and other financial information included in this report, fairly present in all material respects the financial condition, results of operations and cash flows of the registrant as of, and for, the periods presented in this report;
4. The registrant's other certifying officers and I are responsible for establishing and maintaining disclosure controls and procedures (as defined in Exchange Act Rules 13-15(e) and 15d-15e) and internal control over financial reporting (as defined in Exchange Act Rules 13a-15(f) and 15d-15(f) for the registrant and have:
| (a) | designed such disclosure controls and procedures, or caused such disclosure controls and procedures to be designed under our supervision, to ensure that material information relating to the registrant, including its consolidated subsidiaries, is made known to us by others within those entities, particularly during the period in which this report is being prepared; |
| (b) | designed such internal control over financial reporting, or caused such internal control over financial reporting to be designed under our supervision, to provide reasonable assurance regarding the reliability of financial reporting and the preparation of financial statements for external purposes in accordance with generally accepted accounting principles; |
| (c) | evaluated the effectiveness of the registrant's disclosure controls and procedures and presented in this report our conclusions about the effectiveness of the controls and procedures as of the end of the period covered by this report based on such evaluation; and |
| (d) | disclosed in this report any change in the registrant's internal control over financial reporting that occurred during the registrant's most recent fiscal quarter that has materially affected, or is reasonably likely to materially affect, the registrant's internal control over financial reporting; and |
5. The registrant's other certifying officers and I have disclosed, based on our most recent evaluation of internal control over financial reporting, to the registrant's auditors and the audit committee of registrant's Board of directors (or persons performing the equivalent functions):
| (a) | all significant deficiencies and material weaknesses in the design or operation of internal control over financial reporting which are reasonably likely to adversely affect the registrant's ability to record, process, summarize and report financial information; and |
| (b) | any fraud, whether or not material, that involves management or other employees who have a significant role in the registrant's internal controls. |
| Date: March 30, 2016 | |
| By:/s/ Robert E. Corbin | |
| Robert E. Corbin | |
| Controller, Principal Financial and Accounting Officer |
| 74 |
Exhibit 32
Certification Pursuant to 18 U.S.C. Section 1350
As Adopted Pursuant to Section 906 of the Sarbanes-Oxley Act of 2002
In connection with the Annual Report of Spindletop Oil & Gas Co. (the “Company”), on Form 10-K for the year ended December 31, 2015 as filed with the Securities Exchange Commission on the date hereof (the “Report”), the undersigned Principal Executive Officer and Principal Financial and Accounting Officer of the Company, do hereby certify, pursuant to 18 U.S.C. Section 1350, as adopted pursuant to Section 906 of the Sarbanes-Oxley Act of 2002, that:
The Report fully complies with the requirements of Section 13(a) or 15(d) of the Securities Exchange Act of 1934; and
The information contained in the Report fairly presents, in all material respects, the financial condition and result of operations of the Company.
|
Date: March 30, 2016
|
|
| By:/s/ Chris G. Mazzini | |
| Chris G. Mazzini | |
| President, Principal Executive Officer | |
| By:/s/ Robert E. Corbin | |
| Robert E. Corbin | |
| Controller, Principal Financial and | |
| Accounting Officer |
| 75 |