Attached files
UNITED STATES
SECURITIES AND EXCHANGE COMMISSION
Washington, D.C. 20549
FORM 10-K
o | Annual Report Pursuant to Section 13 or 15(d) of the Securities Exchange Act of 1934 |
For the fiscal year ended December 31, 2015
or
o | Transition Report Pursuant to Section 13 or 15(d) of the Securities Exchange Act of 1934 |
For the transition period from to
Commission File Number
1-37548

Manitowoc Foodservice, Inc.
(Exact name of registrant as specified in its charter)
Delaware | 47-4625716 | |
(State or other jurisdiction | (I.R.S. Employer | |
of incorporation) | Identification Number) | |
2227 Welbilt Boulevard | ||
New Port Richey, FL | 34655 | |
(Address of principal executive offices) | (Zip Code) | |
(727) 375-7010
(Registrant’s telephone number, including area code)
Securities Registered Pursuant to Section 12(b) of the Act:
Title of each class | Name of each exchange on which registered | |
Common Stock, $.01 Par Value | New York Stock Exchange | |
Common Stock Purchase Rights | ||
Securities Registered Pursuant to Section 12(g) of the Act: None
Indicate by check mark if the registrant is a well-known seasoned issuer, as defined in Rule 405 of the Securities Act. Yes o No x
Indicate by check mark if the Registrant is not required to file reports pursuant to Section 13 or 15(d) of the Act. Yes o No x
Indicate by check mark whether the Registrant: (1) has filed all reports required to be filed by Section 13 or 15(d) of the Securities Exchange Act of 1934 during the preceding 12 months (or for such shorter period that the Registrant was required to file such reports), and (2) has been subject to such filing requirements for the past 90 days. Yes o No x
Indicate by check mark whether the registrant has submitted electronically and posted on its corporate website, if any, every Interactive Data File required to be submitted and posted pursuant to Rule 405 of Regulation S-T (§229.405 of this chapter) during the preceding 12 months (or for such shorter period that the registrant was required to submit and post such files). Yes x No o
Indicate by check mark if disclosure of delinquent filers pursuant to Item 405 of Regulation S-K is not contained herein, and will not be contained, to the best of registrant’s knowledge, in definitive proxy or information statements incorporated by reference in Part III of this Form 10-K or any amendment to this Form 10-K. o
Indicate by check mark whether the registrant is a large accelerated filer, an accelerated filer, a non-accelerated filer or a smaller reporting company. See the definitions of “large accelerated filer, accelerated filer, and smaller reporting company” in Rule 12b-2 of the Exchange Act.
Large accelerated filer o | Accelerated filer o | |
Non-accelerated filer x (Do not check if a smaller reporting company) | Smaller reporting company o | |
Indicate by check mark whether the Registrant is a shell company (as defined in Rule 12b-2 of the Act). Yes o No x
On June 30, 2015, the Registrant had not been incorporated and its common stock was not publicly traded.
The number of shares outstanding of the registrant’s Common Stock as of March 4, 2016, the most recent practicable date, was 137,016,712.
DOCUMENTS INCORPORATED BY REFERENCE
See Index to Exhibits immediately following the signature page of this report, which is incorporated herein by reference.
MANITOWOC FOODSERVICE, INC.
Index to Annual Report on Form 10-K
For the Year Ended December 31, 2015
Page | ||
PART I | ||
PART II | ||
PART III | ||
PART IV | ||
-3-
Presentation of Information
On January 29, 2015, The Manitowoc Company, Inc. (“MTW”) announced plans to create two independent public companies to separately operate its two businesses: its Crane business and its Foodservice business. To effect the separation, MTW first undertook an internal reorganization, following which MTW held the Crane business, and Manitowoc Foodservice, Inc. ("MFS") held the Foodservice business. Then on March 4, 2016, MTW distributed all of our common stock to MTW’s shareholders on a pro rata basis, and MFS became an independent publicly traded company (the “Distribution”). As used in this Annual Report on Form 10-K, “Spin-Off” refers to both the above described internal reorganization and Distribution, collectively.
Unless otherwise expressly stated or the context otherwise requires, references to “we,” “our,” “us,” the “Company” or “MFS”, refers to Manitowoc Foodservice, Inc., a Delaware Corporation incorporated in 2015, and its consolidated subsidiaries or, in the case of information as of dates or for periods prior to our separation from MTW, the combined entities of the Foodservice business, and certain other assets and liabilities that were historically held at the MTW corporate level, but were specifically identifiable and attributable to the Foodservice business.
-4-
PART I
Item 1. BUSINESS
GENERAL
MFS is one of the world’s leading commercial foodservice equipment companies. We design, manufacture and service an integrated portfolio of hot and cold category products, and have a long track record of innovation. We have one of the industry’s broadest portfolios of products and are recognized by our customers and channel partners for the quality, reliability, and durability of our products. Our capabilities span refrigeration, ice-making, cooking, holding, food-preparation, and beverage-dispensing technologies, which allow us to equip entire commercial kitchens and serve the world’s growing demand for food prepared away from home. We supply foodservice equipment to commercial and institutional foodservice operators such as full-service restaurants, quick-service restaurant chains, hotels, caterers, supermarkets, convenience stores, business and industry, hospitals, schools and other institutions.
We differentiate ourselves by uniquely integrating food, equipment, digital technologies, and people to increase efficiency throughout the food preparation cycle, and create winning customer and consumer experiences. Our customers and channel partners trust the Company and its food-inspiring technologies to serve their diverse needs on a global basis.
Our products are sold in more than 100 countries globally, across the Americas, EMEA and APAC. (The Americas segment includes the U.S., Canada and Latin America. The EMEA segment is made up of markets in Europe, Middle East and Africa, including Russia and the commonwealth of independent states. The APAC segment is principally comprised of markets in China, Singapore, Australia, India, Malaysia, Indonesia, Thailand and Philippines.)
Our products, services and solutions are marketed through a worldwide network of over 3,000 dealers and distributors under well-established and recognized brands, including Cleveland, Convotherm, Dean, Delfield, Fabristeel, Frymaster, Garland, Inducs, Kolpak, Koolaire, Lincoln, Manitowoc Beverage Systems, Manitowoc Ice, Merco, Merrychef, Moorwood Vulcan, Multiplex, RDI Systems, Servend, TRUpour, U.S. Range, and Welbilt. All of our products are supported by KitchenCare, our aftermarket repair and parts service business. MFS’ scale and expertise enable it to serve a global customer base in continually evolving foodservice markets.
MFS Brands (1) | ||
 |  |  |
 |  |  |
 |  |  |
 |  |  |
 |  |  |
 |  |  |
 |  |  |
 |  | |
-5-
(1) We own or have rights to various trademarks, logos, service marks and trade names that we use in connection with the operation of our business. Solely for convenience, the trademarks, service marks and trade names referred to in this Annual Report on Form 10-K are listed without the ™ or ® symbols, but such references do not constitute a waiver of any rights that might be associated with the respective trademarks, service marks and trade names included or referred to in this Annual Report on Form 10-K.
We believe our ability to deliver a wide range of hot and cold category products and services that can be configured to meet end-users’ foodservice needs is a key driver of our success. Our customers come to us for innovations that may enable profitable growth by improving their menus, enhancing operations, and reducing costs. We accomplish this with:
• | Complementary industry leading brands: A complementary portfolio of strong hot and cold category products integrated under one operating company and supported by growing aftermarket parts and service and support. This enables MFS to design and outfit commercial kitchens in a harmonized, efficient manner and maintain a disciplined focus on targeting our fast-growing customer base with the right products for each need, at the right price; |
• | Integration of food, equipment, digital technologies and people: The ability to integrate food, equipment, digital technologies and people seamlessly through collaborative innovation that enhances our customers’ ability to compete in the marketplace. MFS helps customers differentiate their food and adapt to evolving and local tastes, different cooking styles and aesthetic preferences, both regionally and globally; |
• | Global scale through our network: The scale and breadth of our dealer and distributor network to accompany our customers on their global journey, especially in fast-growing emerging markets; |
• | Trusted innovation and service: Long-standing brands and innovative engineering customers can trust for superior quality and reliability. We regularly partner with our customers to further develop the equipment, systems and technologies they use to serve their specific culinary needs, and enable their success by delivering tailored solutions; and |
• | Seamless customer experience: Dedication to putting customer experience first. We offer a broad portfolio of products coupled with a unified face to the customer and growing service and parts support. Throughout the life cycle of each product, MFS provides customers with a consistent, seamless experience. |
Our broad portfolio of foodservice equipment and services provides us with a balanced, diverse revenue base across geographies and foodservice product categories. Approximately 50% of our revenues are for cold category products, 35% are for hot category products and approximately 15% for aftermarket parts and services.
For the year ended December 31, 2015, MFS generated revenue of $1,570.1 million and earnings before interest and taxes from continuing operations of $159.9 million. Based on sales by destination in the fiscal year ended December 31, 2015, the majority of our revenue was derived from customers in the Americas at approximately 75%, with 15% from EMEA customers and 10% from APAC customers.
History and Developments
MTW, the former parent of MFS, was founded in 1902 and began building commercial ice machines in 1966. MTW publicly listed on the NASDAQ stock exchange in 1971 and publicly listed on the NYSE in 1993. Through a focus on research and development, innovation and superior customer service, as well as strategic and transformational acquisitions, MFS over time became an industry-leading source for foodservice equipment. Our key milestones include:
• | 1995: Acquisition of Shannon Group solidified our strong position in food-cooling products and positioned MFS as a leading manufacturer of commercial ice-cube machines and walk-in refrigerators; opened an ice machine manufacturing facility in China. |
• | 1997: Acquisition of SerVend International, a manufacturer of ice/beverage dispensers; gave us a leading position in the convenience-store segment and in beverage-dispensing equipment. |
• | 1999: Acquisition of Kyees Aluminum Inc., a manufacturer of cooling components for suppliers of fountain soft drink dispensers; enabled us to build and distribute complete drink systems through the bottler channel. |
• | 2000: Acquisition of Multiplex Company provided us with an enhanced line of beverage dispensing equipment and services and accelerated our progress towards becoming a full-service provider of ice and beverage equipment. |
• | 2006: Acquisition of McCann’s Engineering & Manufacturing Co., a provider of beverage dispensing equipment primarily used in fast-food restaurants, stadiums, cafeterias and convenience stores |
• | 2008: Acquisition of Enodis for $2.7 billion, a global leader in equipment manufacturing for the foodservice industry. With this acquisition, our capabilities expanded to span refrigeration, ice-making, cooking, food-prep, and beverage-dispensing technologies. |
-6-
• | 2009: Sale of Scotsman, Ice-O-Matic, Simag, Barline, and other ice machine and related businesses operated by subsidiaries of Enodis; MTW was required to divest Enodis Ice Group as a condition of the U.S. Department of Justice’s and the European Commission’s clearance of the Enodis acquisition. |
• | 2010: Acquisition of Appliance Scientific provided us with innovative accelerated cooking technologies and solidified our offerings for quick-service restaurants and convenience stores. |
• | 2011: Divestiture of Kysor/Warren and Kysor/Warren de Mexico to Lennox International. |
• | 2013: Divestiture of the Jackson warewashing business to Hoshizaki USA Holdings, Inc. |
• | 2013: Acquisition of Inducs provided us with an extensive line of advanced technology induction cooking products. |
• | 2015: On October 21, 2015, acquired the remaining 50% interest in Welbilt Manufacturing (Thailand) Ltd., a manufacturer of cold category foodservice equipment in Thailand and substantially all of the assets and operations comprising the manufacturing facility operated by Somerville (Siam) Ltd. |
• | 2015: On December 17, 2015, announced the completion of the sale of Kysor Panel Systems to D Cubed Group, LLC. |
Market and Industry
Global foodservice sales, which account for the value of all food prepared away from home, is the most important driver of our industry. The global foodservice industry was estimated at approximately $2.7 trillion in 2014 according to Euromonitor International, and is expected to increase at a nominal compounded annual growth rate ("CAGR") of 7% to reach $3.5 trillion by 2018. According to Euromonitor International, the U.S. foodservice market accounted for approximately 19%, or $506 billion, of the total global foodservice market in 2014. We estimate the size of the global foodservice equipment markets we serve to be approximately $27 billion.
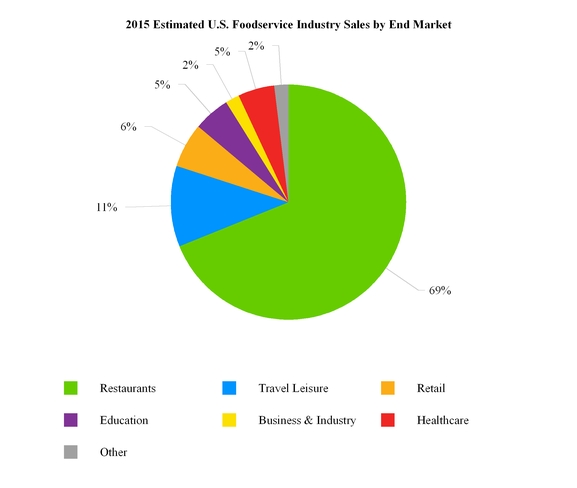
Demand in the restaurant segment, one of seven and our largest end market within the U.S. foodservice industry, is driven by consumer disposable income, employment, investment in new establishments, and the underlying trend for increased convenience.
Foodservice Equipment and Supplies, an industry publication, estimates that in 2016 for U.S. commercial businesses in need of foodservice equipment, 62% of equipment purchases will be to replace existing equipment, 20% for renovations, 11% for more environmentally friendly or sustainable equipment, and 7% for new construction.
-7-
Source: National Restaurant Association
According to Technomic, the foodservice industry in the U.S. is expected to grow at a nominal CAGR of approximately 2% during the 2015-2020 period with some foodservice industry sectors, such as healthcare or fast casual dining growing at the nominal CAGR of 4-6% during the same time period. Management expects that foodservice industry growth within the U.S. will be supported by improving economic conditions, declining rate of unemployment and accelerating increases in real disposable income. Additionally, as a more health conscious public is forsaking convenience foods for fresh, natural alternatives and is focusing on how their food is made, sourced, handled, and prepared, demand for foodservice equipment is expected to rise as foodservice providers adapt to evolving tastes.
On a global level, the demand for affordable dining is expected to continue to increase. Consumers in every market are expected to continue gravitating towards more informal options, a trend seen among both high income consumers looking to save during a slow economic recovery, and lower income consumers new to foodservice looking for accessible entry points. For foodservice equipment operators in emerging markets, this offers enormous room for innovation, particularly in terms of format, as consumers new to eating out look to experiment with a variety of brands and experiences. Fast-food chains, in particular, have proved successful in these markets in serving occasions where they have historically been weak, such as dinner.
Per Euromonitor International, global growth is expected to be driven by solid performance in Asia, Latin America, Middle East and Africa as follows:
• | In APAC, foodservice industry sales are projected to grow at a CAGR of approximately 3%, or by $200 billion, during the 2014-2019 period. China is expected to be a major contributor to this region’s absolute dollar sales growth, despite somewhat challenging market conditions recently. The highest growth is APAC is projected in the juice/smoothie bars and pizza full-service restaurants segments with CAGRs of approximately 13% and 12%, respectively. |
• | In Latin America, foodservice industry sales are expected to grow at an approximately 3% CAGR, or by $50 billion, during the 2014-2019 period. The most significant absolute sales dollar growth is expected in Brazil. The highest growth in Latin America overall is projected in the fast-food category with CAGR of approximately 4%, but the largest regional growth opportunities are projected in juice/smoothie bar category with estimated CAGR of approximately 12% during the 2014-2019 period. |
-8-
• | In the Middle East and Africa region (“MEA”), foodservice industry sales are expected to grow at a CAGR of approximately 4% or by $25 billion during the 2014-2019 period. While Sub-Saharan Africa is likely to be one of the most important regions for growth in the long-term, over the next several years the majority of sales in the region will continue to come from the Middle East and the Gulf States in particular. The largest growth opportunities in MEA are expected in the burger fast-food category with a projected CAGR of approximately 10% during the 2014-2019 period. |
In Western Europe, consumers have become much more value-conscious, and increasingly look to modern chains as the best way to spend on eating out. Foodservice sales in Western Europe are projected to grow at an approximately 1% CAGR during the 2014-2019 period according to Euromonitor International. In Eastern Europe, sales are expected to grow with an approximately 2% CAGR during the 2014-2019 period, with the strongest growth projected in convenience stores and fast-food.
Overall, we believe that continued growth in demand for foodservice equipment will result from the development of new restaurant concepts in the U.S., and the expansion of U.S. and foreign chains into international markets, the replacement and upgrade of existing equipment and new equipment requirements resulting from menu changes. We expect to benefit from these trends, and grow market penetration alongside our customers as they expand into new service categories and geographies. We believe we are well-positioned to take advantage of worldwide growth opportunities with global and regional new product introductions, improvement in operational excellence, and other strategic initiatives.
Strengths
Our competitive strengths derive from combining deep industry expertise and understanding of our markets, our history of investment in research and development, successful product innovation and long-standing customer relationships.
The breadth and complementarity of our product portfolio, with strong hot and cold category brands integrated under one operating company, supported by aftermarket parts and service and support.
MFS offers 23 brands, including 12 industry-leading brands, which provide the full spectrum of foodservice equipment across six hot and cold product and service categories, including primary cooking equipment, ice machines and storage bins, walk-in refrigerator and freezer equipment, beverage dispensers and related products, serving, warming and storage equipment, and aftermarket parts and service solutions (KitchenCare). Offering a full suite of integrated hot and cold kitchen equipment products and services provides us with significant cross-selling opportunities and allows us to keep ahead of evolving industry trends. Our aftermarket offering, KitchenCare, provides support services to our entire product spectrum. This enables MFS to design, outfit and service commercial kitchens in a harmonized, efficient way and maintain a disciplined focus on targeting our fast-growing customer base with the right products for each need, at the right price.
The ability to integrate food, equipment, digital technologies, and people seamlessly through collaborative innovation that enhances our customers’ ability to compete in the marketplace.
We combine our expertise in industrial engineering and culinary sciences to continuously optimize both the functionality and ease of operation of our foodservice equipment products. This effort leads to the creation of innovative kitchens with optimized work flow, energy and labor savings, and more comfortable work spaces, all of which result in high customer satisfaction. Our foodservice equipment and design capabilities help customers differentiate their food and adapt to evolving and local tastes, different cooking styles, and aesthetic preferences, regionally and globally. We continuously innovate by working closely with customers to develop products to meet their evolving needs. By closely tracking customer trends and employing a dedicated staff of chefs, we are able to maintain our position as an expert on every major cooking technique and emerging industry trend.
The scale and breadth of our dealer and distributor network to accompany customers on their global journey, especially in fast-growing emerging markets.
We have extensive manufacturing, sales, and customer service networks across all the regions we serve. Our 36 locations in 12 countries provide us with the scale to serve the largest global customers and the local market expertise to leverage international growth. Our footprint enables us to build our products as close as possible to intended end markets, and apply our developed markets expertise in emerging markets. MFS’ worldwide network of over 3,000 dealers and distributors allows us to serve our customer base globally and grow alongside them as they enter new markets.
Long-standing brands and innovative engineering customers can trust for superior quality and reliability.
MFS delivers high performance, efficient kitchens with innovative features that meet specific culinary needs and enhance our customers’ ability to compete in the marketplace. The MFS Education and Technology Centers (“ETC”) in New Port Richey, Florida, Hangzhou, China and Monterrey, Mexico contain computer-assisted design platforms, a model shop for on-site development of prototypes, a laboratory for product testing, and various display areas for new products. Our test kitchens, flexible demonstration areas, and culinary teams enable us to demonstrate a wide range of equipment in realistic operating environments, and also support a wide range of menu ideation, food development and sensory testing with our customers and food partners. We also use the ETCs to provide training for our customers, marketing representatives, service providers, industry consultants, dealers and distributors.
The superior quality of our foodservice equipment has long been recognized by third-parties. Recent industry awards received by MFS include:
-9-
• | 2015 Best-in-Class Award, Foodservice Equipment & Supplies Magazine: Declared four MFS brands in six categories (Cleveland, Frymaster, Lincoln and Manitowoc Ice) as Best-in-Class. It was the 15th consecutive year in which Frymaster and Manitowoc Ice received the Best-in-Class distinction. |
• | 2015 Energy Star Partner of the Year: MFS has been named an Energy Star Partner of the Year for six consecutive years. In 2015, we also received our fourth Sustained Excellence Award. |
• | 2016 National Restaurant Association Kitchen Innovation Awards: Merrychef and Multiplex won 2016 Kitchen Innovation awards. Reflecting a history of innovation, MFS has won 31 Kitchen Innovation Awards since 2005. |
Dedication to putting customer experience first.
We are the only company in the market offering a broad portfolio coupled with a unified customer service interface. Throughout the life of each product, MFS teams are available to provide a consistent, seamless customer experience. We design custom kitchen environments based on the unique operational needs of each customer, provide reliable equipment that meet or exceeds customer expectations, and offer aftermarket parts and service to resolve any issues.
Strategies
We intend to achieve sustainable, profitable growth globally by leveraging our position as a leading commercial foodservice equipment provider and by using the following strategies:
Driving increased profitability.
We believe we can significantly improve the profitability of our business and are implementing several cost saving initiatives and operating strategies to drive increased margins. We are committed to further improving our margins by focusing on fewer, higher-margin products and markets, value-based pricing, and effective sourcing, as well as by driving operational excellence in our existing plants. Additionally, we will continue to improve the efficiency of our selling, general and administrative functions.
Select currently ongoing projects supporting these goals include:
• | Operational improvements at select production facilities; |
• | 80/20 portfolio rationalization: focus the most resources and investments in developing the products that yield the greatest returns (“80% of the sales from 20% of the portfolio”), to benefit from latent scale advantages; |
• | Facility rationalization: drive best-in-class operating metrics, standardization of operating processes and cost of poor quality (COPQ) reduction; |
• | Global sourcing initiative: ensure that suppliers are able not only to provide parts at competitive cost positions and lead times, but also help identify component-level innovations that will create differentiating advantages for MFS; our sourcing and procurement initiatives also aim to improve product costs, streamline supplier agreements, and improve processes, tools and data analysis; and |
• | New product initiatives: continue to increase our value proposition with customers through products that simplify restaurant operation, improve the quality of the food, improve speed and flexibility, and reduce the overall carbon footprint and life cycle operating cost. |
Growing our customer base and deepening customer penetration.
We believe our broad product portfolio and leading brands position us to achieve profitable growth above the average industry rate by further growing the number of customers we serve and improving customer overall satisfaction. We continue to be a trusted provider to the largest companies in the foodservice industry and plan to further expand our reach to select, high potential mid-sized companies where we can offer strong customer satisfaction. We are working closely with our channel partners to identify emerging high value customers, and provide them with our high-quality products and support services.
Select ongoing projects supporting these goals include:
• | Strengthening channel partner relationships: working closely with dealers and distributors to identify and pursue opportunities with new and emerging customers in high growth markets; and |
• | Increased investment in new customer acquisition: identifying and prioritizing high value and high return on investment opportunities in the marketplace, and disciplined execution against those priorities through strong project management. |
Driving our international expansion.
Our global footprint positions us to capitalize on growth in developed and emerging markets. Approximately 32% of sales were generated internationally during the twelve-month period ended December 31, 2015. We work closely with channel partners to identify emerging global opportunities, particularly in high growth markets including APAC, Latin America, and MEA.
-10-
We continue to invest heavily in the APAC region, as it is expected to remain the largest driver of aggregate global foodservice sales growth over the next few years. We currently have four manufacturing facilities in Asia and a technology center in China, demonstrating our commitment to building lasting relationships with a broad base of Asian foodservice providers. We also have three test kitchens across the region, and partner closely with Asian chefs and distributors to produce foodservice equipment specifically tailored to meet the unique demands of local customers.
In Latin America, MFS enjoys longstanding business relationships with end customers in the fast growing segments of the market such as convenience stores, local chains, global chains, and retail and institutional. We also have a well-established sales and aftermarket technical and culinary support networks in over 30 countries and territories. MFS has manufacturing facilities in Tijuana, Mexico and Monterrey, Mexico, a distribution hub in Mexico City, as well as a sales and service training center in Monterrey, Mexico.
Our engagement in MEA continues to grow as we invest in the expansion of our sales team to serve our customers in this region. Our demonstration kitchen in Jebel Ali Free Zone in Dubai, United Arab Emirates is just one example of our commitment to and engagement in this region.
Selectively pursuing strategic acquisitions and partnerships.
Our industry is fragmented and we believe there is significant opportunity for continued consolidation through acquisitions and partnerships. We have a long track record of acquisitions and believe that we are well positioned to expand our product offerings, geographic footprint and customer base through acquisitions and related strategic alliance activities. Consistent with our strategy, we actively evaluate potential acquisition opportunities for MFS on an ongoing basis. We seek to manage liabilities, integration and other risks associated with acquisitions through due diligence, favorable acquisition contracts, and careful planning and execution of the integration of the acquired businesses.
Expanding the frontier of foodservice innovation.
To remain a leader in our industry and continue to grow our reputation as one of the most innovative companies in our industry, we continuously leverage suppliers to source innovation and refresh existing products with new, locally-relevant, food-inspiring technologies, while simultaneously finding new ways to integrate those products and create cohesive kitchen systems. Our innovation co-creation and customization capabilities uniquely position us to develop solutions that are truly adapted to different ways of cooking and preparing food, whether for new menus or new geographies.
Select ongoing projects supporting these goals include:
• | fitkitchen: “Food Inspiring Technology” designed and developed for integrated kitchens that meet each customer’s individual equipment requirements and size constraints, using our leading test kitchen facilities; |
• | Discovery innovation process: collaboration with customers and suppliers to identify innovations that enhance our customers’ ability to compete in the marketplace; |
• | Digital strategy: to better connect food, equipment and people in the kitchen, and to better connect us with our customers; and |
• | New product initiative prioritization and process: prioritize investments needed to bring to market those new products with the greatest potential for high return on investment. |
Continuing to attract and foster industry-leading talent.
MFS’ people are key to our success. As of December 31, 2015, we had approximately 5,500 employees across all of our locations. We continue to recruit talented individuals and strive to make our company a great place to have a long-term career.
Select ongoing projects supporting this goal include:
• | The LEAD (Leadership Evaluation and Accelerated Development) Program accelerates the development of key leaders for current and future roles to achieve aggressive organizational goals. It provides high potential key leaders for current and future roles by providing them with objective, third party feedback, developmental discussions, career planning, and ongoing support to meet their leadership potential; |
• | The New Manager Assimilation process enables new managers (either new to the organization or new to a position) and their teams to begin working together effectively right from the start; and |
• | Our internal learning and development programs provide employees with opportunities to enhance their leadership and professional skills, while emphasizing the importance of teamwork and diversity. Our course offerings reflect the priorities of the business, from the full range of Six Sigma certifications, safety, and project management training to Rosetta Stone language courses, functional-specific courses, and general competency areas such as time management. |
-11-
FINANCIAL INFORMATION ABOUT BUSINESS SEGMENTS
Our products are sold in more than 100 countries. We report our operating results through three reportable segments: Americas, EMEA and APAC. All three segments offer a broad range of hot and cold category foodservice products and solutions for customers in various end markets.
The following table presents the relative percentages of net sales attributable to each reportable segment for each of the last three fiscal years.
For the Years Ended December 31, | ||||||
2015 | 2014 | 2013 | ||||
Americas | 84.3 | % | 82.3 | % | 83.2 | % |
EMEA | 17.9 | % | 19.9 | % | 20.3 | % |
APAC | 12.2 | % | 12.5 | % | 8.4 | % |
Elimination of inter-segment sales | (14.4 | )% | (14.7 | )% | (11.9 | )% |
In the Americas, we provide foodservice equipment in over 30 countries and territories throughout North America, Canada and Latin America. Our Americas segment contributed net sales including intercompany sales of $1,323.7 million during the year ended December 31, 2015, representing 84.3% of total MFS revenue before eliminations.
In EMEA, we provide foodservice equipment in over 50 countries throughout Europe, the Middle East and Africa, including Russia and the commonwealth of independent states. Our EMEA segment contributed net sales including intercompany sales of $281.6 million during the year ended December 31, 2015, representing 17.9% of total MFS revenue before eliminations.
In APAC, we provide foodservice equipment in over 20 countries throughout Asia, including China, Singapore, Australia, Malaysia, Indonesia, Thailand and India. Our APAC segment contributed net sales including intercompany sales of $191.1 million during the year ended December 31, 2015, representing 12.2% of total MFS revenue before eliminations.
PRODUCTS AND SERVICES
Products and Services
We offer a leading product portfolio of hot and cold category foodservice equipment. Our suite of products is used by commercial and institutional foodservice operators including full-service restaurants, quick-service restaurant chains, hotels, caterers, supermarkets, convenience stores, business and industry, hospitals, schools and other institutions. We have a presence throughout the world’s most significant markets in the following product groups:
• | Primary cooking equipment. We design, manufacture and sell a broad array of ranges, griddles, grills, combi ovens, convection ovens, conveyor ovens, induction cookers, broilers, tilt fry pans/kettles/skillets, braising pans, cheese melters/salamanders, cook stations, table top and countertop cooking/frying systems, fryers, steam jacketed kettles, and steamers. We sell traditional ovens, combi ovens, convection ovens, conveyor ovens, rapid-cooking ovens, range and grill products under the Convotherm, Garland, Lincoln, Merrychef, U.S. Range, and other brand names. Fryers and frying systems are marketed under the Frymaster and Dean brand names, while steam equipment is manufactured and sold under the Cleveland brand. |
• | Serving, warming and storage equipment. We design, manufacture and sell a range of cafeteria and buffet equipment stations, bins, boxes, warming cabinets, warmers, display and deli cases, and insulated and refrigerated salad and food bars. Our equipment stations, cases, food bars and food serving lines are marketed under the Delfield, Fabristeel, Frymaster, Merco and other brand names. |
• | Beverage dispensers and related products. We produce beverage dispensers, blended ice machines, ice/beverage dispensers, beer coolers, post-mix dispensing valves, backroom equipment and support system components and related equipment for use by quick-service restaurant chains, convenience stores, bottling operations, movie theaters, and the soft-drink industry. Our beverage and related products are sold under the Servend, Multiplex, TRUpour, and Manitowoc Beverage Systems brand names. |
• | Ice-cube machines, ice flaker machines, and storage bins. We design, manufacture and sell ice machines under the Manitowoc and Koolaire brand names. Our ice machines make ice in cube, nugget and flake form. The ice-cube machines are available either as self-contained units, which make and store ice, or as modular units, which make ice, but do not store it. |
• | Walk-in refrigerator and freezer equipment. We design, manufacture and sell commercial upright and undercounter refrigerators and freezers, blast freezers, blast chillers and cook-chill systems under the Delfield brand name. We manufacture modular and fully assembled walk-in refrigerators, coolers and freezers, and prefabricated cooler and freezer panels for use in the construction of refrigerated storage rooms and environmental systems under the Kolpak brand name. We also design and manufacture customized refrigeration systems under the RDI Systems brand name. |
• | Aftermarket parts and service solutions. We provide parts and aftermarket service as well as a wide variety of solutions under the KitchenCare brand name. |
-12-
Product Innovation
MFS strives to deliver products that enable our customers to provide fresh, new food experiences to consumers outside the home globally. Customer demands are constantly changing, and a more health-conscious public is looking for fresh, natural alternatives to traditional out-of-home eating options, and increasingly cares about how food is sourced, handled and prepared. MFS is focused on providing our customers with the equipment they need to build on the opportunities from these dynamic changes in the market.
Through innovation, we strive to simplify restaurant operations, improve the quality of the food, improve speed and flexibility of the restaurant operation, and reduce the overall carbon foot print and life cycle operating cost of the equipment. We believe that these benefits will be delivered from our innovation portfolio consisting of mobile connectivity and monitoring, and from stepchange improvements in operator productivity, speed and flexibility, energy efficiency, and health and sanitation.
• | Mobile Connectivity and Monitoring: Integration of mobile devices in kitchens is increasing rapidly, and will extend the user interface beyond the traditional boundaries of the equipment. The combination of wearables and beacons can provide notification of key tasks and equipment situations requiring immediate attention even if the foodservice preparation crew is not looking at the appliance. Bluetooth allows for secure information exchange using cellular or network mobile devices to collect information on the equipment, view training or maintenance instructions, and update menus and equipment software. RFID tracking of food and holding trays helps ensure the right food in the right quantities is available when needed. Our KitchenConnect series also includes a system for equipment monitoring which collects data to reduce downtime, optimize energy use, and improve service response time. |
• | Productivity, Speed and Flexibility: Kitchens that occupy less space, have higher output and are easier to operate are key to growth in the foodservice industry, particularly in urban locations; greater speed and equipment flexibility also allow for higher productivity and a wider range of menu options. For example, restaurants increasingly require smaller zones that can be individually controlled, enabling variable temperature cooking across the surface with lower standby energy losses, and we are a leading provider of such surface cooking platforms. We are also expanding the use of impingement microwave ovens by adding steam and inverter control to the magnetron, which enables better control over moisture levels in the food and the microwave heating rate, and makes the oven much easier to clean with steam. Innovative control systems can improve information flow in the kitchen by letting operators know what and when to cook, and how to maintain and clean the equipment. Our fitkitchen initiative addresses all these procedures holistically, and provides us with unique insights on how to apply and improve our equipment. |
• | Energy Efficiency: We are focused on increasing the efficiency of individual components and reducing standby energy losses. An example of reducing standby energy loss is the use of induction heating for holding pans so that energy is only used when a thermal load is present. We are also leading in the area of high efficiency combustion systems with metal matrix burner technology. This technology reduces gas consumption and allows for variable firing rate. For cooling, natural refrigerants such as R-290 offer improved thermodynamic performance, and variable speed compressors and fans further increase overall cycle performance under part load conditions. |
• | Health and Sanitation: Manual sanitation of equipment in the restaurant has become a major challenge due to extended operating hours, the increasing number and complexity of equipment in kitchens, and competing demands from revenue producing tasks. For the cold product category, our HEPA filtration technology brings the cleanroom into the kitchen, controlling airborne contamination of ice machines. Electrically charged particles of water and UV light provide the basis for automated sterilization of food zones and contact surfaces in equipment. Compact steam generators are being embedded in our equipment, providing a proven technology for cleaning cooking cavities in our ovens. |
We have a strong track record of working with customers to develop equipment platforms from scratch, taking into account freshness, flavor and speed of service, as well as constraints of building infrastructure, kitchen ventilation and HVAC systems. Developing products that give our customers a competitive advantage is at the core of our innovation strategy, and we believe that big opportunities to further advance the interaction of equipment, food and people in the kitchen still lie ahead in the foodservice industry. The following graphic depicts our fitkitchen concept:
-13-

MFS has launched the following major products and innovations over the past five years:
• | Blend-In-Cup Smoothie Machine (with or without Integrated Ice Machine) - Plug and play fully integrated blended beverage station, blending beverages directly in the serving cups. Storing eight ingredient bags in its refrigerated cabinet, it can adapt its blend/mix profile to suit any customer recipe. With its automated portioning and dispense, it reduces waste and labor, and ensures the consistency of the final beverage. Build for both restaurant and retail applications, it blends and dispenses up to three drinks at once, and up to 120 drinks an hour within only 26” of space. The version without ice machine needs to be manually filled with ice and stores up to 25 lbs. of ice. The integrated version includes a high capacity, integrated ice maker with automatic cleaning to ensure constant ice availability and sanitation. |
• | Convotherm 4 - Combi oven designed around our customers' needs, enabling them to achieve outstanding cooking and baking results. It is available in seven sizes and two different configurations, and includes an industry-leading flexible and safe cleaning system. Significantly lower operating cost and a very low service call rate are expected to lead to high customer satisfaction over the product life cycle. |
• | Merrychef eikon - Recent additions to this series include the eikon e2, a compact oven with ventless technology allowing users to prepare food to order at up to 10x the speed of conventional ovens in a minimum of space, and the eikon e4s, which enables speeds of up to 15x that of conventional ovens. Both models are fitted with an EasyToUCH touchscreen allowing selection of profiles at the touch of an icon. The new eikon e6 (as well as the e2) uses the new patented planar plume technology, whereby heated air is directed into planes, which then wrap around the food product to deliver a higher quality, even cook in less time with fast, quiet operation. |
• | Indigo Ice Machine - An awarding-winning state-of-the-art modular cuber platform, offered in various sizes from 300 to 2,100 lbs./day sold under the Manitowoc brand. This product line differentiates itself through unique technological features, convenience, and efficiency to deliver lower long term operating costs. |
• | Koolaire - A new brand of basic-feature ice machines complementing our premium Manitowoc brand, offered in sizes ranging from 170 - 1,800 lbs./day. Koolaire machines are simple, highly reliable, and target an entry level price point. |
• | Chick-fil-A Broiler - Our Garland brand has leveraged its global leadership in clamshell technology to develop the first-ever clamshell broiler in partnership with the largest chicken chain in the U.S. The clamshell broiler enabled our customer to create an entirely new menu, offering healthier grilled chicken sandwiches to complement its emblematic fried-chicken sandwiches. We are currently engaged in developing a next generation version of this technology. |
-14-
• | Merco IntelliHold Series - Specifically developed for commercial kitchens, this warmer provides a holding environment for food between the kitchen and the front-of-house with improved energy efficiency and increased storage capacity within an unchanged footprint. |
• | Frymaster FilterQuick - FilterQuick replaces the time-consuming manual filtration process with a simple push button automatic filtration process that allows the fryer to resume operation in less than four minutes. By combining automatic filtration with our oil conserving frypots, FilterQuick offers customer the most advanced oil-conserving fryer in the market. FilterQuick is also available with an integrated patented oil quality sensor that allows Frymaster customers to measure the exact oil quality with the push of a button, which helps them to maximize oil life without sacrificing food quality. |
Customers
We sell primarily through distributors and dealers ("direct customers"), who ultimately sell to end customers. Our end-customer base is comprised of a wide variety of foodservice providers, including large multinational and regional chain restaurants, convenience stores and retail stores; chain and independent casual and family dining restaurants; independent restaurants and caterers; lodging, resort, leisure and convention facilities; healthcare facilities; schools and universities; large business and industrial customers; and many other foodservice outlets ("end customers"). We serve some of the largest and most widely recognized multinational and regional businesses in the foodservice and hospitality industries; of which McDonald's, an MFS end customer, represented 10% or more of MFS net sales in the years ended December 31, 2014 and December 31, 2013. The following table presents a representative selection of our customers:
-15-
Select MFS Global Foodservice Customers | |||||
 |  |  |  |  | |
 |  |  |  |  | |
 |  |  |  |  | |
 |  |  |  |  | |
 |  |  |  |  | |
 |  |  |  |  | |
 |  |  |  | ||
Additionally, we have a strong base of mid-sized customers and are focused on expanding it further. According to Euromonitor International, many mid-size chains exhibited growth above 20% in 2014, particularly in APAC and Latin America, reflecting the increasing power of local players and strong demand for chained versions of local favorites. Driven by a clear pattern of investment in locally-owned chains and concepts featuring local cuisine, these trends are expected to continue over the long term. We work with each of our mid-size customers to help them capitalize on these trends through our innovation process, which allows us to provide them with the following value propositions:
• | Simplification of their operations; |
• | Improved speed and flexibility of the overall operation; |
• | Improved quality of the food and service; |
• | Reduced energy consumption and carbon footprint; |
-16-
• | Lower total cost over the life cycle of the appliance; and |
• | Superior reliability of the overall equipment system. |
We do not typically have long-term contracts with our customers; however, large chains frequently authorize specific foodservice equipment manufacturers as approved vendors for particular products, and thereafter, sales are made locally or regionally to end customers via kitchen equipment suppliers, dealers or distributors. Many large quick-service restaurant chains refurbish or open a large number of outlets, or implement menu changes requiring investment in new equipment, over a short period of time. When this occurs, these customers often choose a small number of manufacturers whose approved products may or must be purchased by restaurant operators. We work closely with our customers to develop the products they need and to become approved vendors for these products.
Our end-customers often need equipment upgrades that enable them to improve productivity and food safety, reduce labor costs, respond to enhanced hygiene, environmental and menu requirements or reduce energy consumption. These changes often require customized cooking and cooling and freezing equipment. In addition, many restaurants seek to differentiate their products by changing their menu and format. We believe that product development is important to our success because a supplier’s ability to provide customized or innovative foodservice equipment is a primary factor when customers are making their purchasing decisions. Our significant investment in new product research and development positions us to uniquely serve our global customer base.
Sales, Marketing and Distribution
We sell our products through a worldwide network of over 3,000 dealers and distributors in over 100 countries. Our network is differentiated from competitors through serving as a single source for a broad portfolio of leading brands and product categories. This allows us to provide one face to our customers for multiple brands with relevant culinary and ingredients expertise and appropriate key account management for our larger global chain customers. We support our sales efforts with a variety of marketing efforts including trade-specific advertising, cooperative distributor merchandising, digital marketing, and marketing at a variety of industry trade shows.
In the Americas, MFS has a broad portfolio of channel partners, covering all major foodservice market segments, including quick-service restaurants, fast casual, education, health care, business and industry, as well as the convenience and retail space. Our direct sales team is supplemented by a network of industry-leading rep groups, providing national coverage. Direct sales team, sales reps and distributors jointly serve over 900 equipment dealers with our full portfolio of hot and cold product category brands. A dedicated strategic account team with culinary support is focused on the major U.S.-based restaurant chains, where we have significant global market share. Our teams work closely with our customers’ menu and equipment development teams to assure alignment with their strategic plans. We also have distribution hubs in Canada, Mexico and Latin America. KitchenCare provides a range of after-market parts and services that manages a comprehensive factory-authorized service network, assuring proper installation, preventative maintenance, spare parts supply and maximum customer uptime on all MFS appliances.
In EMEA, our distribution includes hubs in Herborn, Germany serving Germany and Austria, in Guildford, UK serving the United Kingdom, and in Barcelona, Spain serving Spain and Portugal. Each of these distribution centers operates a network of third party dealers chosen to satisfy the requirements of both chain customers and independent caterers in their respective territories. Outside these countries, MFS products and services are sold through non-exclusive third party distributors and service companies. In addition, our beverage customers receive specialist support from our beverage systems facility in Halesowen, UK.
In APAC, MFS has had a presence since the mid-1980s. As our chain customers expanded into the region, we first established distribution and service support, followed by building a sales force and our first manufacturing facility in China in 1992. Today, we operate four manufacturing facilities and five sales and service offices throughout the region. We access the market in APAC through our dedicated distribution and dealer channel partners, most of whom have been established in the market for decades and have been MFS partners for over 15 years. Our business in the region is expanding into a local customer base that is focused on western style menus and desires the appliances that will consistently deliver the quality expected from our top brands with the reliability and support for which we are known.
Regulatory Environment
We actively work with standards organizations, industry associations, certification parties, and regulatory bodies to develop and promote effective and balanced standards, codes, and regulations that provide for the advancement of sustainable customer solutions with the highest possible levels of energy efficiency, sanitation, safety, and food quality. For example, we are active members of NAFEM, AHRI, UL task group, NSF Joint Committee, ASHRAE, the working groups responsible for EN safety standards in Europe, HKI, and other regional standards organizations. We are fully engaged with the Department of Energy on new energy standards, EPA on EnergySTAR programs and SNAP alternate refrigerant regulations, and EU ECO directive consultant organizations.
Competition
We sell all of our products in highly competitive markets and compete based on product design, quality, performance and aftermarket support services, as well as maintenance costs, energy and resource saving, other contributions to sustainability, and price. We believe that we benefit from the following competitive advantages:
• | A complementary portfolio of industry-leading hot and cold category products, integrated under one company and supported by growing aftermarket parts, service and support; |
-17-
• | The ability to integrate food, equipment, digital technologies and people seamlessly through collaborative innovation that enhances our customers’ ability to compete in the marketplace; |
• | The scale and breadth of our dealer and distributor network to accompany our customers on their global journey, especially in fast-growing emerging markets; |
• | Long-standing brands and innovative engineering that customers can trust for superior quality and reliability; and |
• | Dedication to putting customer experience first. |
The following table sets forth our primary competitors in each of our product groups:
Products | Primary Competitors | |
Primary cooking equipment | Ali Group; Dover Industries; Duke; Electrolux; Henny Penny; ITW; Middleby; Rational; and Taylor | |
Serving, warming and storage equipment | Alto Shaam; Cambro; Duke; Hatco; ITW; Middleby; Standex; and Vollrath | |
Beverage dispensers and related products | Automatic Bar Controls; Celli; Cornelius; Hoshizaki/Lancer Corporation; Taylor; and Vin Service | |
Ice-cube, ice flaker machines and storage bins | Aucma; Brema; Follett; Hoshizaki; Ice-O-Matic; Scotsman; and Vogt | |
Walk-in Refrigerator and freezer equipment | American Panel; Arctic; Bally; Beverage Air; Hoshizaki; ICS; Master-Bilt; Nor-Lake; Thermo-Kool; Traulsen; True Foodservice; and TurboAir | |
Seasonality
Typically, the second and third quarters of our fiscal year represent the best periods for our financial results. Our customers are primarily in the northern hemisphere, and the warmer summer weather generally leads to an increase in construction and remodeling within the foodservice industry, as well as in the use and replacement of ice machines. As a result, distributors build inventories during the second quarter to prepare for increased demand.
Raw Materials
We support our region-of-use production strategy with corresponding region-of-use supplier partners. The primary raw materials that we use are structural and rolled steel, aluminum, and copper. We also purchase electrical equipment and other semi- and fully-processed materials. We maintain inventories of steel and other purchased material. We have been successful in our goal to maintain alternative sources of raw materials and supplies, and therefore are not dependent on a single source for any particular raw material or supply.
Engineering, Research and Development
We believe our extensive engineering, research and development capabilities are a key driver of our success. We engage in research and development activities at 15 dedicated locations in the Americas, EMEA and APAC. We have a staff of in-house engineers and technicians on three continents, supplemented with external engineering resources, who collectively are responsible for improving existing products and developing new products. We incurred total engineering costs of $47.9 million, $52.6 million, and $42.6 million during the years ended December 31, 2015, 2014 and 2013, respectively, which included research and development costs of $26.1 million, $31.0 million, and $28.7 million during the years ended December 31, 2015, 2014 and 2013, respectively.
Our team of engineers focuses on developing cost effective, innovative, high-performance, low-maintenance products that are intended to solve problems for our customers in differentiated ways and create significant brand loyalty among customers. Design engineers work closely with our culinary, manufacturing and marketing staff which enables us to identify changing end-user requirements, implement new technologies and effectively introduce product innovations. Close, carefully managed relationships with dealers, distributors and end users help us identify their needs, for not only products, but also for the service and support that are critical to their profitable operations. As part of our ongoing commitment to provide superior products, we intend to continue our efforts to design products that meet evolving customer demands and reduce the period from product conception to product introduction.
Key projects and initiatives that are the basis for maintaining a competitive advantage in our capabilities for engineering and product development include the following:
• | Flexing engineering resources among the 15 engineering centers through engineering leadership for hot and cold category products and supplementing the internal resource pool with a strategic relationship with a major services provider based in India; |
• | Regional technology centers that provide a continuous stream of application-focused new technologies and product concepts into the engineering centers and fully leverage supplier and university relationships; |
-18-
• | Internal capability for electronic controls development and application to define our roadmap for controls, work hand-in-hand with strategic suppliers, and ensure continued industry leadership in this increasingly important product dimension; and |
• | Focus areas around technologies to lead the industry in the delivery of healthy food, equipment sanitation, energy efficiency, menu flexibility, and mobile devices and web connectivity. |
Intellectual Property
Intellectual property, inclusive of certain patents, trademarks, copyrights, know-how, trade secrets and other proprietary rights, is important to our business. We hold numerous patents pertaining to our products, and have presently pending applications for additional patents in the U.S. and foreign countries. In addition, we have various registered and unregistered trademarks and licenses that are of material importance to our business and we believe our ownership of this intellectual property is adequately protected in customary fashions under applicable laws. Although certain proprietary intellectual property rights are important to our success, we do not believe we are materially dependent on any particular patent or license, or any particular group of patents or licensees.
Our worldwide intellectual property portfolio provides:
• | Global protection of our R&D and product development investments; |
• | Recognizable competitive distinctions and proprietary advantages; |
• | Brand support and enhancement; and |
• | Leverage for value creation opportunities such as licenses and other dispositions. |
Our intellectual property portfolio is strategically aligned with our businesses and we continually calibrate it for both competitiveness and cost-effectiveness. Additionally, we monitor other companies’ intellectual property to ensure our freedom-to-operate. Similarly, we study our competitors’ products to identify unauthorized use of our protected inventions, and follow-up to resolve through appropriate enforcement programs in case of any violations.
Employees
As of December 31, 2015, we had approximately 5,500 employees. In North America, we have in place eight labor agreements with six employee unions. We have one trade union in Europe and one trade union in China.
Available Information
We make available, free of charge at our Internet site (http://www.manitowocfoodservice.com) our Registration Statement on Form 10, annual reports on Form 10-K, quarterly reports on Form 10-Q, current reports on Form 8-K, our proxy statements and any amendments to those reports, as soon as reasonably practicable after we electronically file such material with, or furnish it to, the Securities and Exchange Commission (SEC). Our SEC reports can be accessed through the investor relations section of our website. Although some documents available on our website are filed with the SEC, the information generally found on our website is not part of this or any other report we file with or furnish to the SEC.
The public may read and copy any materials that we file with the SEC at the SEC’s Public Reference Room located at 100 F Street NE, Washington, DC 20549. The public may obtain information on the operation of the Public Reference Room by calling the SEC at 1-800-SEC-0330. The SEC also maintains electronic versions of our reports on its website at www.sec.gov.
-19-
Item 1A. RISK FACTORS
The following risk factors have been identified by management in that if any events contemplated by the following risks actually occur, then our business, financial condition or results of operations could be materially adversely affected.
Risks Relating to Our Business
We face the following risks in connection with our business and the general conditions and trends of the foodservice industry in which our products are sold:
We have substantial indebtedness, and the degree to which we are leveraged may materially and adversely affect our business, financial condition and results of operations.
Our ability to make payments on and to refinance our substantial indebtedness, including the debt retained or incurred pursuant to the Spin-Off as well as any future debt that we may incur, will depend on our ability to generate cash in the future from operations, financings or asset sales. Our ability to generate cash is subject to general economic, financial, competitive, legislative, regulatory and other factors that are beyond our control. We may not generate sufficient funds to service our debt and meet our business needs, such as funding working capital or the expansion of our operations. If we are not able to repay or refinance our debt as it becomes due, we may be forced to take disadvantageous actions, including reducing spending on marketing, advertising and new product innovation, reducing future financing for working capital, capital expenditures and general corporate purposes, selling assets or dedicating an unsustainable level of our cash flow from operations to the payment of principal and interest on our indebtedness. In addition, our ability to withstand competitive pressures and to react to changes in the foodservice industry could be impaired. The lenders who hold our debt could also accelerate amounts due in the event that we default, which could potentially trigger a default or acceleration of the maturity of our other debt.
In addition, our substantial leverage could put us at a competitive disadvantage compared to our competitors that are less leveraged. These competitors could have greater financial flexibility to pursue strategic acquisitions and secure additional financing for their operations. Our substantial leverage could also impede our ability to withstand downturns in our industry or the economy in general.
Our operational results are dependent on how well we can scale our manufacturing capacity and resources to the level of our customers’ demand.
Our products are sold in an industry that requires manufacturers to make highly efficient use of manufacturing capacity. Insufficient or excess capacity threatens our ability to generate competitive profit margins and may expose us to liabilities related to contract commitments. Adapting or modifying our capacity is difficult, as modifications take substantial time to execute and, in some cases, may require regulatory approval. Additionally, delivering product during process or facility modifications requires special coordination. The cost and resources required to adapt our capacity, such as through facility acquisitions, facility closings, or process moves between facilities, may negate any planned cost reductions or may result in costly delays, product quality issues or material shortages, all of which could adversely affect our operational results and our reputation with our customers.
If we are unable to successfully implement certain cost-reduction initiatives, we may not achieve our earnings targets.
We have developed initiatives to realize cost savings, for example, by reducing the complexity of our product offerings, including our “80/20” initiative that will focus the majority of our resources on our most important products and best customers. However, the success of this and other profit-enhancement and cost-reduction initiatives is not guaranteed, and we may not achieve the cost savings we expect. The 80/20 initiative in particular involves significant cultural shifts, both internally and for our customers, that may inhibit or impair its successful implementation. Additionally, if we devote a disproportionate amount of time, personnel and resources to initiatives that yield slower or less than anticipated results or that are ultimately unsuccessful, we may be distracted from other initiatives and priorities that might have yielded more rapid or better results, and our results of operations may suffer accordingly.
Price increases or our inability to execute successful pricing strategies for some materials and sources of supply, as well as disruptions of supplies of some materials, could affect our profitability.
We use large amounts of steel, stainless steel, aluminum, copper and electronic controls, among other items, in the manufacture of our products. Occasionally, market prices of some of our key raw materials increase significantly, which could adversely affect our margins. Furthermore, although we are implementing a strategic sourcing initiative, we may not be able to achieve the expected cost savings from that initiative. In addition, because we maintain limited raw material and component inventories, even brief unanticipated delays in delivery by suppliers - including those due to capacity constraints, labor disputes, impaired financial condition of suppliers, weather emergencies or other natural disasters - may impair our ability to satisfy our customers and could adversely affect our financial performance.
To better manage our exposures to certain commodity price fluctuations, we regularly hedge our commodity exposures through financial markets. Through this hedging program we fix the future price for a portion of these commodities used in the production of our products. To the extent that our hedging results in fixing commodity prices that are unfavorable in comparison to market prices at the time of purchase, we would experience a negative impact on our profit margins compared to the margins we would have realized if these price commitments were not in place, which may adversely affect our results of operations, financial condition and cash flows in future periods.
-20-
Because we participate in an industry that is highly competitive, our net sales and profits could decline as we respond to competition.
We sell our products in a highly competitive industry. We compete based on product design, quality of products, quality and responsiveness of product support services, product performance and reliability, maintenance costs and price. Some of our competitors may have greater financial, marketing, manufacturing and distribution resources than we do. Competition could cause our sales to decrease or cause us to cut prices or incur additional costs to remain competitive, any of which could adversely affect our financial condition, results of operations and cash flows.
Additionally, a substantial portion of our dealer revenue comes from a small number of buying groups, which gives those buying groups a large degree of leverage and purchasing power with us and other suppliers. In recent years those buying groups have used their leverage to extract larger rebates, discounts and other price reductions. We must continually balance the added revenue from providing reduced prices to those buying groups against the reduced margins generated by them, which could adversely affect our results of operations.
If we do not develop new and innovative products or if customers in our markets do not accept them, our results would be negatively affected.
Our products must be kept current to meet our customers’ needs, overcome competitive products and meet evolving regulatory requirements. To remain competitive, we therefore must develop new and innovative products on an on-going basis, and we invest significantly in the research and development of new products. If we do not successfully develop innovative products, it may be difficult to differentiate our products from our competitors' products and satisfy regulatory requirements, and our sales and results would suffer.
If we do not meet customers’ product quality and reliability standards/expectations, we may experience increased or unexpected product warranty claims and other adverse consequences to our business.
Product quality and reliability are significant factors influencing customers’ decisions to purchase our products. Inability to maintain the high quality of our products relative to the perceived or actual quality of similar products offered by competitors could result in the loss of market share, loss of revenue, reduced profitability, an increase in warranty costs, and/or damage to our reputation. Similarly, if we fail to provide the same level of quality through our KitchenCare aftermarket parts and repair service as we provide in original equipment manufacturing, it could likewise negatively affect our revenue and our reputation with our customers.
Product quality and reliability are determined in part by factors that are not entirely within our control. We depend on our suppliers for parts and components that meet our standards. If our suppliers fail to meet those standards, we may not be able to deliver the quality products that our customers expect, which may impair revenue and our reputation and lead to higher warranty costs.
We provide our customers a warranty covering workmanship, and in some cases materials, on products we manufacture. Our warranty generally provides that products will be free from defects for periods ranging from 12 months to 60 months with certain equipment having longer term warranties. If a product fails to comply with the warranty, we may be obligated, at our expense, to correct any defect by repairing or replacing the defective product. Although we maintain warranty reserves in an amount based primarily on the number of units shipped and on historical and anticipated warranty claims, there can be no assurance that future warranty claims will follow historical patterns or that we can accurately anticipate the level of future warranty claims. An increase in the rate of warranty claims or the occurrence of unexpected warranty claims could adversely affect our financial condition, results of operations and cash flows.
Changing consumer tastes and government regulations affecting the quick-service restaurant industry could affect sales to our largest customers.
A number of our largest customers operate in the quick-service restaurant industry. The quick-service restaurant industry is frequently affected by changes in consumer tastes and eating habits, often as a result of new information or attitudes regarding diet and health or as a result of government regulations requiring quick-service restaurants to disclose the nutritional content of their food. If consumers’ eating habits change significantly, our customers may choose or be required to modify their menu offerings. Such modifications, or the failure to make the modifications to the extent consumers desire, could have an adverse effect on our customers’ business, financial conditions or results, which in turn could adversely affect the customers' demand for our products.
We have significant manufacturing and sales of our products outside of the United States, which may present additional risks to our business.
For the years ended December 31, 2015, 2014 and 2013, approximately 32.1%, 37.1% and 38.4%, respectively, of our net sales were attributable to products sold outside of the United States. Expanding our international sales is part of our growth strategy. International operations generally are subject to various risks, including political, military, religious and economic instability, local labor market conditions, the imposition of foreign tariffs, the impact of foreign government regulations, the effects of income and withholding tax, governmental expropriation, and differences in business practices. We may incur increased costs and experience delays or disruptions in product deliveries and payments in connection with our international sales, manufacturing and the integration of new facilities that could cause loss of revenue or increased cost. Unfavorable changes in the political, regulatory and business climate and currency devaluations of various foreign jurisdictions could adversely affect our financial condition, results of operations and cash flows.
Our results of operations may be negatively impacted by product liability lawsuits.
Our business exposes us to potential product liability risks that are inherent in the design, manufacture, sale and use of our products. We have not to date incurred material costs related to these product liability claims. We vigorously defend ourselves against current claims and intend
-21-
to do so against future claims. However, a substantial increase in the number of claims that are made against us or the amounts of any judgments or settlements could adversely affect our reputation and our financial condition, results of operations and cash flows.
If we fail to protect our intellectual property rights or maintain our rights to use licensed intellectual property, our business could be adversely affected.
Our patents, trademarks and licenses are important in the operation of our businesses. Although we protect our intellectual property rights vigorously, we cannot be certain that we will be successful in doing so. Third parties may assert or prosecute infringement or validity claims against us in connection with the services and products that we offer, and we may or may not be able to successfully defend these claims. Litigation, either to enforce our intellectual property rights or to defend against claimed infringement of the rights of others, could result in substantial costs and diversion of our resources. In addition, if a third party would prevail in an infringement claim against us, then we would likely need to obtain a license from the third party on commercial terms, which would likely increase our costs. Our failure to maintain or obtain necessary licenses or an adverse outcome in any litigation relating to patent infringement or other intellectual property matters could have a material adverse effect on our financial condition, results of operations and cash flows.
Sales of our products are sensitive to volatile or variable factors. A downturn or weakness in overall economic activity or fluctuations in weather or other factors could adversely affect us.
Historically, sales of products that we manufacture and sell have been subject to variations caused by changes in general economic conditions and other factors. In particular, the strength of the economy generally may affect the rates of expansion, consolidation, renovation and equipment replacement within the restaurant, lodging, convenience store and healthcare industries, which may affect our sales. Furthermore, any future economic recession may impact leveraged companies like us more than competing companies with less leverage and may adversely affect our financial condition, results of operations and cash flows.
Weather conditions can substantially affect our business, as relatively cool summer weather and cooler-than-normal weather in hot climates tend to decrease sales of ice and beverage dispensers. Our sales depend in part upon our customers’ replacement or repair cycles. Adverse economic conditions may cause customers to forego or postpone new purchases in favor of repairing existing machinery.
If we are unable to sufficiently adjust to market conditions, among other potential adverse effects on our financial condition, results of operations and cash flows, we could fail to deliver on planned results, fall short of analyst and investor expectations, incur higher fixed costs, and/or fail to benefit from higher than expected customer demand resulting in loss of market share.
Our operations and profitability could suffer if we experience labor relations problems.
As of December 31, 2015, we employed approximately 5,500 people and had eight labor agreements with six employee unions in North America. A large majority of our European employees belong to European trade unions, and we have one trade union in China. During 2015, three of our union contracts expired. Each contract that expired in 2015 was successfully renegotiated without incident. In 2016, we have two union contracts that will expire. Any significant labor relations issues could adversely affect our operations, reputation, results of operations and financial condition.
We are exposed to the risk of changes in interest rates or foreign currency fluctuations.
We have indebtedness that accrues interest at a variable rate. Increases in interest rates will reduce our operating cash flows and could hinder our ability to fund our operations, capital expenditures, acquisitions or dividends. In such cases we may seek to reduce our exposure to fluctuations in interest rates, but hedging our exposure carries the risk that we may forego the benefits we would otherwise experience if interest rates were to change in our favor. Developing an effective strategy for dealing with movements in interest rates is complex, and no strategy is guaranteed to completely insulate us from the risks associated with such fluctuations.
Additionally, some of our operations are or may be conducted by subsidiaries in foreign countries. The results of the operations and the financial position of these subsidiaries will be reported in the relevant foreign currencies and then translated into U.S. dollars at the applicable exchange rates for inclusion in our combined financial statements, which are stated in U.S. dollars. The exchange rates between many of these currencies and the U.S. dollar have fluctuated significantly in recent years and may continue to fluctuate significantly in the future. Such fluctuations may have a material effect on our results of operations and financial position and may significantly affect the comparability of our results between financial periods.
We also incur currency transaction risk whenever one of our operating subsidiaries enters into a transaction using a different currency than its functional currency. We attempt to reduce currency transaction risk whenever one of our operating subsidiaries enters into a material transaction using a different currency than its functional currency by:
• | matching cash flows and payments in the same currency; |
• | direct foreign currency borrowing; and |
• | entering into foreign exchange contracts for hedging purposes. |
However, we may not be able to hedge this risk completely or at an acceptable cost, which may adversely affect our results of operations, financial condition and cash flows in future periods.
-22-
Changes to tax laws or exposure to additional tax liabilities may have a negative impact on our operating results.
Tax policy reform continues to be a topic of discussion in the U.S. A significant change to the tax system in the U.S., including changes to the taxation of international income, could have a material adverse effect upon our results of operations. We regularly undergo tax audits in various jurisdictions in which our products are sold. Although we believe that our tax estimates are reasonable and that we prepare our tax filings in accordance with all applicable tax laws, the final determination with respect to any tax audits, and any related litigation, could be materially different from our estimates or from our historical income tax provisions and accruals. The results of an audit or litigation could materially affect our operating results and/or cash flows in the periods for which that determination is made. In addition, future period earnings may be adversely impacted by litigation costs, settlements, penalties, and/or interest assessments.
Our business and/or reputation could be negatively affected as a result of actions of activist shareholders, and such activism could impact the trading value of our securities.
Certain of our stockholders may in the future publicly or privately express views with respect to the operation of our business, our business strategy, corporate governance considerations or other matters that may not be fully aligned with our own. Responding to actions by activist shareholders can be costly and time-consuming, disrupt our operations and divert the attention of management and our employees. Perceived uncertainties as to our future direction may result in the loss of potential business opportunities, damage to our reputation, and may make it more difficult to attract and retain qualified directors, personnel and business partners. These actions could also cause our stock price to experience periods of volatility.
Activist shareholders may in the future make strategic proposals, suggestions, or requests for changes concerning the operation of our business, our business strategy, corporate governance considerations, or other matters. We cannot predict, and no assurances can be given, as to the outcome or timing of any consequences arising from these actions, and any such consequences may impact the value of our securities.
Environmental liabilities that may arise in the future could be material to us.
Our operations, facilities and properties are subject to extensive and evolving laws and regulations pertaining to air emissions, wastewater discharges, the handling and disposal of solid and hazardous materials and wastes, the remediation of contamination, and otherwise relating to health, safety and the protection of the environment. As a result, we are involved from time to time in administrative or legal proceedings relating to environmental and health and safety matters, and have in the past and will continue to incur capital and other expenditures relating to such matters. We also cannot be certain that identification of presently unidentified environmental conditions, more vigorous enforcement by regulatory authorities, or other unanticipated events will not arise in the future and give rise to additional environmental liabilities, compliance costs and/or penalties that could be material. Further, environmental laws and regulations are constantly evolving and it is impossible to predict accurately the effect any changes may have upon our financial condition, results of operations or cash flows.
Security breaches and other disruptions could compromise our information and expose us to liability, which would cause our business and reputation to suffer.
In the ordinary course of our business, we collect and store sensitive data, including our proprietary business information and that of our customers, suppliers and business partners, as well as personally identifiable information of our customers and employees, in our internal and external data centers, cloud services, and on our networks. The secure processing, maintenance and transmission of this information is critical to our operations and business strategy. Despite our security measures, our information technology and infrastructure, and that of our partners, may be vulnerable to malicious attacks or breached due to employee error, malfeasance or other disruptions, including as a result of roll-outs of new systems. Any such breach or operational failure could compromise our networks and/or that of our partners and the information stored there could be accessed, publicly disclosed, lost or stolen. Any such access, disclosure or other loss of information could result in legal claims or proceedings and/or regulatory penalties, disrupt our operations, damage our reputation, and/or cause a loss of confidence in our products and services, which could adversely affect our business.
Our inability to recover from natural or man-made disasters could adversely affect our business.
Our business and financial results may be affected by certain events that we cannot anticipate or that are beyond our control, such as natural or man-made disasters, national emergencies, significant labor strikes, work stoppages, political unrest, war or terrorist activities that could curtail production at our facilities and cause delayed deliveries and canceled orders. In addition, we purchase components and raw materials and information technology and other services from numerous suppliers, and, even if our facilities were not directly affected by such events, we could be affected by interruptions at such suppliers. Such suppliers may be less likely than our own facilities to be able to quickly recover from such events and may be subject to additional risks such as financial problems that limit their ability to conduct their operations. We cannot assure you that we will have insurance to adequately compensate us for any of these events.
Our international sales and operations are subject to applicable laws relating to trade, export controls and foreign corrupt practices, the violation of which could adversely affect our operations.
We must comply with all applicable international trade, customs, export controls and economic sanctions laws and regulations of the U.S. and other countries. We are also subject to the Foreign Corrupt Practices Act and other anti-bribery laws that generally bar bribes or unreasonable gifts to foreign governments or officials. Changes in trade sanctions laws may restrict our business practices, including cessation of business activities in sanctioned countries or with sanctioned entities, and may result in modifications to compliance programs. Violation of these laws or regulations could result in sanctions or fines and could have a material adverse effect on our financial condition, results of operations and cash flows.
-23-
Compliance with regulations related to conflict minerals may force us to incur additional expenses and affect the manufacturing and sale of our products.
In recent years, governments in both the U.S. and Europe have implemented or proposed regulations governing the use of certain minerals, including tin, tantalum, tungsten and gold (“conflict minerals”). In the U.S., SEC rules require disclosures related to conflict minerals that are necessary to the functionality or production of a product manufactured, or contracted to be manufactured, by an SEC-reporting company, that are sourced from the Democratic Republic of Congo and other countries in central Africa. In the European Union, proposed regulations would require similar disclosures, and may encompass other geographic regions outside of central Africa.
These disclosure requirements could affect the sourcing and availability of some of the minerals used in the manufacture of our products. Our supply chain is complex, and if we are not able to conclusively verify the origins for all conflict minerals used in our products or that our products are “conflict free,” we may face reputational challenges with our customers or investors. Furthermore, we may also encounter challenges to satisfy customers who require that our products be certified as “conflict free,” which could place us at a competitive disadvantage if we are unable to do so. Additionally, as there may be only a limited number of suppliers offering “conflict free” metals, we cannot be sure that we will be able to obtain necessary metals from such suppliers in sufficient quantities or at competitive prices. Finally, because European regulations have not yet been finalized, it is difficult for us to determine whether and how we will establish a compliance program. For all of these reasons, we could incur significant costs related to the conflict minerals compliance process, and face equally significant costs in satisfying the disclosure requirements.
We may increase our debt or raise additional capital in the future, including to fund acquisitions, or for general corporate purposes, which could affect our financial health and decrease our profitability.
We may increase our debt or raise additional capital in the future, subject to restrictions in our debt agreements. In addition, our Board may issue shares of preferred stock without further action by holders of our common stock. If our cash flow from operations is less than we anticipate, or if our cash requirements are more than we expect, we may require more financing. However, debt or equity financing may not be available to us on terms we find acceptable, if at all. If we incur additional debt or raise equity through the issuance of our preferred stock, the terms of the debt or our preferred stock issued may give the holders rights, preferences and privileges senior to those of holders of our common stock, particularly in the event of liquidation. If we raise funds through the issuance of additional equity, our then-existing stockholders' ownership in us would be diluted. Also, regardless of the terms of our debt or equity financing, our agreements and obligations under the Tax Matters Agreement may limit our ability to issue stock. For a more detailed discussion, see “We may not be able to engage in certain transactions after the Spin-Off.” If we are unable to raise additional capital when needed, our financial condition, and thus your investment in us, could be materially and adversely affected.
Risks Relating to the Spin-Off
We face the following risks in connection with the Spin-Off:
There could be significant liability if the Spin-Off is determined to be a taxable transaction, and we could have an indemnification obligation to MTW if the transactions we undertook in the Spin-Off do not qualify for non-recognition treatment, which could materially adversely affect our financial condition.
In connection with the Spin-Off, MTW received an opinion from its legal counsel, substantially to the effect, that the Spin-Off and certain related transactions will qualify as tax-free to MTW and its shareholders under Sections 355, 368 and related provisions of the Code, except to the extent of any cash received in lieu of fractional shares of MFS’ common stock. Any such opinion is not binding on the U.S. Internal Revenue Service (the “IRS”). Accordingly, the IRS may reach conclusions with respect to the Spin-Off that are different from the conclusions reached in the opinion. The opinion relied on certain facts, assumptions, representations and undertakings from MTW and us regarding the past and future conduct of the companies’ respective businesses and other matters, which, if incomplete, incorrect or not satisfied, could alter the conclusions of the party giving such opinion.
If the Spin-Off ultimately is determined to be a taxable event, the Spin-Off could be treated as a taxable dividend to MTW’s shareholders at the time of the Spin-Off for U.S. federal income tax purposes, and MTW’s shareholders could incur significant federal income tax liabilities. In addition, MTW would recognize a taxable gain to the extent that the fair market value of MFS’ common stock exceeds MTW’s tax basis in such stock on the date of the Spin-Off.
Generally, taxes resulting from the failure of the Spin-Off to qualify for non-recognition treatment for U.S. federal income tax purposes would be imposed on MTW or MTW’s shareholders and, under the Tax Matters Agreement, MTW is generally obligated to indemnify us against such taxes. However, under the Tax Matters Agreement, we could be required, under certain circumstances, to indemnify MTW and its affiliates against all tax-related liabilities caused by those failures, to the extent those liabilities result from an action we or our affiliates take or from any breach of our or our affiliates’ representations, covenants or obligations under the Tax Matters Agreement or any other agreement we entered into in connection with the Spin-Off. Events triggering an indemnification obligation under the agreement include events occurring after the Distribution that cause MTW to recognize a gain under Section 355(e) of the Code. See “Certain Relationships and Related Party Transactions, and Director Independence-Agreements with Tax Matters Agreement” in Part III, Item 13 of this Annual Report on Form 10-K.
-24-
We may not be able to engage in certain transactions after the Spin-Off.
To preserve the tax-free treatment of the Spin-Off, we and MTW entered into a Tax Matters Agreement that restricts us from taking any action that prevents the Distribution and related transactions from being tax-free for U.S. federal income tax purposes. Under the Tax Matters Agreement, for an agreed upon period following the Distribution, we are prohibited, except in certain circumstances, from:
• | entering into any transaction resulting in the acquisition of above a certain percentage of our stock or substantially all of our assets, whether by merger or otherwise; |
• | merging, consolidating or liquidating; |
• | issuing equity securities beyond certain thresholds; |
• | repurchasing our capital stock; and |
• | ceasing to actively conduct our business. |
These restrictions may limit our ability to pursue certain strategic transactions or other transactions that we may believe to be in the best interests of our shareholders or that might increase the value of our business. In addition, under the Tax Matters Agreement, we will be required to indemnify MTW against any such tax liabilities as a result of the acquisition of our stock or assets, even if it did not participate in or otherwise facilitate the acquisition.
We may be unable to achieve some or all of the benefits that we expect to achieve from the Spin-Off.
We believe that, as an independent, publicly traded company, we will be able, among other factors, to better focus our financial and operational resources on our specific business, growth profile and strategic priorities, design and implement corporate strategies and policies targeted to our operational focus and strategic priorities, streamline our processes and infrastructure to focus on our core strengths, implement and maintain a capital structure designed to meet our specific needs and more effectively respond to industry dynamics. However, we may be unable to achieve some or all of these benefits. In addition, completion of the Spin-Off has required and will continue to require significant amounts of management’s time and effort, which may divert management’s attention from operating and growing our businesses. If we fail to achieve some or all of the benefits that we expect to achieve as an independent company, or do not achieve them in the time we expect, our business, financial condition and results of operations could be materially and adversely affected.
We may be unable to make, on a timely or cost-effective basis, the changes necessary to operate as an independent company.
We have historically operated as part of MTW’s corporate organization, and MTW has assisted us by providing various corporate functions. Following the Spin-Off, MTW has no obligation to provide us with assistance other than the transition services described under “Certain Relationships and Related Party Transactions, and Director Independence-Agreements with MTW-Transition Services Agreement” in Part III, Item 13 of this Annual Report on Form 10-K. These services do not include every service we have received from MTW in the past, and MTW is only obligated to provide these services for limited periods from the date of the Spin-Off. Accordingly, we need to provide internally or obtain from unaffiliated third parties the services we currently receive from MTW. These services include information technology, finance, legal, insurance, compliance and human resources activities, the effective and appropriate performance of which is critical to our operations. We may be unable to replace these services in a timely manner or on terms and conditions as favorable as those we receive from MTW. In particular, MTW’s information technology networks and systems are complex, and duplicating these networks and systems will be challenging. Because our business previously operated as part of the wider MTW organization, we may be unable to successfully establish the infrastructure or implement the changes necessary to operate independently, or we may incur additional costs that could adversely affect our business. If we fail to obtain the quality of administrative services necessary to operate effectively or incur greater costs in obtaining these services, our profitability, financial condition and results of operations may be materially and adversely affected.
We have no operating history as an independent, publicly traded company, and our historical financial information is not necessarily representative of the results we would have achieved as an independent, publicly traded company and may not be a reliable indicator of our future results.
We derived the historical financial information included in this Annual Report on Form 10-K from MTW’s consolidated financial statements, and this information does not necessarily reflect the results of operations, financial position and cash flows we would have achieved as an independent, publicly traded company during the periods presented, or those that we will achieve in the future. This is primarily because of the following factors:
• | Prior to the Spin-Off, we operated as part of MTW’s broader corporate organization, rather than as an independent company. MTW performed part or all of various corporate functions for us, including information technology, finance, legal, insurance, compliance and human resources activities. Our historical financial information reflects allocations of corporate expenses from MTW for these and similar functions. These allocations may not reflect the costs we will incur for similar services in the future as an independent company. |
• | We have entered into agreements and transactions with MTW that did not exist prior to the Spin-Off. See “Certain Relationships and Related Party Transactions and Director Independence-Agreements with MTW” in Part III, Item 13 of this Annual Report on Form 10-K for information regarding these transactions. |
-25-
• | Our historical financial information does not reflect changes that we have experienced and we expect to experience in the future as a result of the Spin-Off, including changes in our cost structure, personnel needs, tax structure, financing and business operations. As part of MTW, we enjoyed certain benefits from MTW’s operating diversity, size, purchasing power and available capital for investments, and we will lose these benefits after the Spin-Off. After the Spin-Off, as an independent entity, we may be unable to purchase goods, services and technologies, such as insurance and health care benefits and computer software licenses, on terms as favorable to us as those we obtained as part of MTW prior to the Spin-Off. |
Following the Spin-Off, we are also now responsible for the additional costs associated with being an independent, publicly traded company, including costs related to corporate governance, investor and public relations and public reporting. Therefore, our financial statements may not be indicative of our future performance as an independent company. While we have been profitable as part of MTW, we cannot assure you that our profits will continue at a similar level when we are a stand-alone company. For additional information about our past financial performance and the basis of presentation of our financial statements, see “Selected Financial Data,” “Management’s Discussion and Analysis of Financial Condition and Results of Operations” and our historical combined financial statements and accompanying notes included elsewhere in this Annual Report on Form 10-K.
Certain of our directors and officers may have actual or potential conflicts of interest because of their MTW equity ownership or their former MTW positions.
Certain of our executive officers and directors have in the past been MTW officers, directors or employees and thus have professional relationships with MTW’s executive officers, directors or employees. In addition, because of their former MTW positions, certain of our directors and executive officers own MTW common stock or options to acquire shares of MTW common stock, and the individual holdings may be significant for some of these individuals compared to their total assets. These relationships and financial interests may create, or may create the appearance of, conflicts of interest when these directors and officers are faced with decisions that could have different implications for MTW and us. For example, potential conflicts of interest could arise in connection with the resolution of any dispute that may arise between MTW and us regarding the terms of the agreements governing the Spin-Off and the relationship between the companies.
Risks Relating to Our Common Stock and the Securities Markets
You face the following risks in connection with ownership of our common stock:
There is not a long history of trading in our common stock, and our stock price may fluctuate significantly.
We cannot predict the prices at which our common stock may trade. The market price of our common stock may fluctuate widely, depending on many factors, some of which may be beyond our control, including the factors listed in the following:
• | our quarterly or annual earnings, or those of other companies in our industry; |
• | announcements by us or our competitors of significant new business awards; |
• | announcements of significant acquisitions, divestitures, strategic alliances, joint ventures or dispositions by us or our competitors; |
• | the failure of securities analysts to cover our common stock; |
• | changes in earnings estimates by securities analysts; |
• | the operating and stock price performance of other comparable companies; |
• | investor perception of our company and the foodservice industry; |
• | overall market fluctuations; |
• | changes in capital gains taxes and taxes on dividends affecting stockholders; and |
• | general economic conditions and other external factors. |
Stock markets in general have experienced volatility that has often been unrelated to the operating performance of a particular company. These broad market fluctuations could also adversely affect the trading price of our common stock.
We cannot assure you that we will be able to pay dividends in the future on our common stock based on our indebtedness or any other limiting factors.
The timing, declaration, amount and payment of any future dividends to stockholders will fall within the discretion of our Board and will depend on many factors, including our financial condition, earnings, capital requirements and debt service obligations, as well as legal requirements, regulatory constraints, industry practice and other factors that our Board deems relevant. In addition, the terms of the agreements governing our new debt or debt that we may incur in the future may limit or prohibit the payment of dividends. For more information, see “Dividend Policy” as part of "Item 5 - Market of Registrant's Common Equity."
-26-
Item 1B. UNRESOLVED STAFF COMMENTS
None.
-27-
Item 2. PROPERTIES
The following table outlines the principal facilities the Company owns or leases as of December 31, 2015.
Facility Location | Type of Facility | Approximate Square Footage | Owned/Leased | |||
Americas | ||||||
New Port Richey, Florida (2) | Corporate Headquarters | 42,000 | Owned | |||
Manitowoc, Wisconsin (2) | Manufacturing/Office | 376,000 | Owned | |||
Parsons, Tennessee (1) | Manufacturing | 120,000 | Owned | |||
Sellersburg, Indiana (2) | Manufacturing/Office | 146,000 | Owned | |||
Tijuana, Mexico (1) | Manufacturing | 111,000 | Leased | |||
Shreveport, Louisiana (1), (2) | Manufacturing/Office | 539,000 | Owned | |||
Mt. Pleasant, Michigan (2) | Manufacturing/Office | 345,000 | Owned | |||
Baltimore, Maryland | Manufacturing/Office | 16,000 | Leased | |||
Cleveland, Ohio (1), (2) | Manufacturing/Office/Warehouse | 391,000 | Owned/Leased | |||
Covington, Tennessee (1) | Manufacturing/Office/Warehouse | 386,000 | Owned/Leased | |||
Concord, Ontario, Canada | Manufacturing/Office | 116,000 | Leased | |||
Mississauga, Ontario, Canada (1), (2) | Manufacturing/Office/Warehouse | 186,000 | Leased | |||
Monterrey, Mexico | Manufacturing/Office | 303,750 | Leased | |||
EMEA | ||||||
Guildford, United Kingdom (2) | Office | 35,000 | Leased | |||
Eglfing, Germany (2) | Manufacturing/Office/Warehouse | 130,000 | Leased | |||
Herisau, Switzerland (2) | Manufacturing/Office | 26,974 | Leased | |||
Halesowen, United Kingdom (2) | Manufacturing/Office | 86,000 | Leased | |||
Sheffield, United Kingdom | Manufacturing/Office | 100,000 | Leased | |||
APAC | ||||||
Foshan, China (2) | Manufacturing/Office/Warehouse | 125,000 | Leased | |||
Shanghai, China (2) | Office/Warehouse | 29,000 | Leased | |||
Prachinburi, Thailand (2) | Manufacturing/Office/Warehouse | 438,608 | Owned | |||
Singapore | Manufacturing/Office | 93,300 | Owned/Leased | |||
Hangzhou, China (2) | Manufacturing/Office | 260,000 | Owned/Leased | |||
Samutprakarn, Thailand | Office | 4,305 | Leased | |||
(1) There are multiple separate facilities within these locations.
(2) Serves also as a research and development center.
In addition, we lease sales office and/or warehouse space in Manitowoc, Wisconsin; Odessa, Florida; Tampa, Florida; Fort Wayne, Indiana; Jeffersonville, Indiana; Herborn, Germany; Kuala Lumpur, Malaysia; Barcelona, Spain; Naucalpan de Juarez, Mexico; Gurgaon, and Mumbai, India; as well as Mexico City, Mexico.
See Note 20, “Leases,” to the Combined Financial Statements included in Part II, Item 8 of this Form 10-K for additional information regarding leases.
-28-
Item 3. LEGAL PROCEEDINGS
Our global operations are governed by laws addressing the protection of the environment and employee safety and health. Under various circumstances, these laws impose civil and criminal penalties and fines, as well as injunctive and remedial relief, for noncompliance. They also may require remediation at sites where company related substances have been released into the environment.
We have expended substantial resources globally, both financial and managerial, to comply with the applicable laws and regulations, and to protect the environment and our workers. We believe we are in substantial compliance with such laws and regulations and we maintain procedures designed to foster and ensure compliance. However, we have been and may in the future be subject to formal or informal enforcement actions or proceedings regarding noncompliance with such laws or regulations, whether or not determined to be ultimately responsible in the normal course of business. Historically, these actions have been resolved in various ways with the regulatory authorities without material commitments or penalties to the Company.
For information concerning other contingencies and uncertainties, see Note 16, “Contingencies and Significant Estimates,” to the Combined Financial Statements included in Part II, Item 8 of this Form 10-K.
-29-
Item 4. MINE SAFETY DISCLOSURE
Not Applicable.
-30-
Item 5. MARKET FOR REGISTRANT’S COMMON EQUITY AND RELATED STOCKHOLDER MATTERS
The Company’s common stock is traded on the New York Stock Exchange under the symbol MFS. At March 4, 2016, the number of record shareholders of common stock was 1,920.
Dividend Policy
The amount and timing of dividends, if any, will be determined by our Board of Directors at its regular meetings each year. Our Board of Directors does not currently plan on paying a dividend in 2016 as our focus in 2016 will be on the reduction of outstanding debt. The timing, declaration, amount of, and payment of any dividends following the Spin-Off including subsequent to 2016 is within the discretion of our Board of Directors and will depend upon many factors, including our financial condition, earnings, corporate strategy, capital requirements of its operating subsidiaries, covenants associated with certain debt service obligations, legal requirements, regulatory constraints, industry practice, ability to access capital markets, and other factors deemed relevant by our Board of Directors.
Issuer Purchases of Equity Securities
There were no unregistered offerings nor any repurchases of our common stock during the fourth quarter of 2015.
-31-
Item 6. SELECTED FINANCIAL DATA
The following table presents our selected combined financial data as of and for each of the fiscal years in the five-year period ended December 31, 2015. We derived the selected combined financial data for each of the fiscal years ended December 31, 2015, 2014 and 2013 and as of December 31, 2015 and 2014, from our audited combined financial statements included elsewhere in this Annual Report on Form 10-K. We derived the selected combined financial data as of December 31, 2013, and as of and for the fiscal years ended December 31, 2012 and 2011 from our audited and unaudited combined financial statements that are not included in this Annual Report on Form 10-K.
Our combined financial statements include expenses of MTW that were allocated to us for certain functions, including general corporate expenses related to finance, treasury, tax, audit, legal, information technology, human resources, and investor relations. These costs may not be representative of the future costs we will incur as an independent public company. In addition, our historical financial information does not reflect changes that we have experienced or expect to experience in the future as a result of the Spin-Off, including any future changes in our cost structure, personnel needs, tax structure, financing and business operations. Consequently, the financial information included here may not necessarily reflect our financial condition, results of operations and cash flows in the future or what our financial condition, results of operations and cash flows would have been had we been an independent, publicly traded company during the periods presented. No cash dividends were declared during the periods presented. You should read the selected historical combined financial data presented below in conjunction with our audited combined financial statements and accompanying notes, and “Management’s Discussion and Analysis of Financial Condition and Results of Operations” included in this Annual Report Form 10-K.
As of and for the year ended December 31, | ||||||||||||||||||||
(in millions) | 2015 | 2014 | 2013 | 2012 | 2011 | |||||||||||||||
Statement of Operations Data: | ||||||||||||||||||||
Net sales | $ | 1,570.1 | $ | 1,581.3 | $ | 1,541.8 | $ | 1,486.2 | $ | 1,454.6 | ||||||||||
Depreciation and amortization | 51.0 | 53.0 | 51.4 | 53.6 | 56.5 | |||||||||||||||
Earnings from continuing operations before income taxes | 196.3 | 187.2 | 204.6 | 179.5 | 140.9 | |||||||||||||||
Balance Sheet Data: | ||||||||||||||||||||
Working capital (1) | 88.0 | 72.7 | 74.0 | 75.6 | 89.4 | |||||||||||||||
Total assets | 1,754.0 | 1,898.3 | 1,918.2 | 1,969.0 | 2,012.6 | |||||||||||||||
Long-term obligations (2) | 2.3 | 3.6 | 1.7 | 1.8 | 1.9 | |||||||||||||||
Capital expenditures | $ | 13.2 | $ | 25.3 | $ | 33.6 | $ | 17.5 | $ | 11.9 | ||||||||||
(1) Working capital is defined as net receivables and inventory less third-party accounts payable. | ||||||||||||||||||||
(2) Long-term obligations includes long-term capital lease obligations. | ||||||||||||||||||||
-32-
Item 7. MANAGEMENT’S DISCUSSION AND ANALYSIS OF FINANCIAL CONDITION AND RESULTS OF OPERATIONS
The following discussion and analysis should be read in conjunction with the combined financial statements and related notes included in Part II, Item 8 of this Annual Report on Form 10-K.
Introduction
Management’s discussion and analysis of financial condition and results of operations accompanies our combined financial statements and provides additional information about our business, financial condition, liquidity and capital resources, cash flows and results of operations. We have organized the information as follows:
• | Overview. This section provides a brief description of the Spin-Off, our business, reportable segments, accounting basis of presentation and a brief summary of our results of operations. |
• | Results of operations and discussion and analysis. This section highlights items affecting the comparability of our financial results and provides an analysis of our combined and segment results of operations for each of the three years ended December 31, 2015, 2014, and 2013. |
• | Liquidity and capital resources. This section provides an overview of our cash and financing activities. We also review our historical sources and uses of cash in our operating, investing and financing activities. We summarize our debt and other long-term financial commitments. |
• | Quantitative and qualitative disclosures about market risk. This section discusses how we monitor and manage market risk related to changing commodity prices, currency and interest rates. We also provide an analysis of how adverse changes in market conditions could impact our results based on certain assumptions we have provided. We discuss how we hedge certain of these risks to mitigate unplanned or adverse impacts to our operating results and financial condition. |
• | Non-GAAP financial measures. This section discusses certain operational performance measures we use internally to evaluate our operating results and to make important decisions about our business. We also provide a reconciliation of these measures to the financial measures we have reported in our historical combined financial statements so you understand the adjustments we make to further evaluate our underlying operating performance. |
• | Critical accounting policies and estimates. This section summarizes the accounting policies that we consider important to our financial condition and results of operations and that require significant judgment or estimates to be made in their application. We also discuss commodity cost trends impacting our historical results and that we expect will continue through the remainder of the year. |
Overview
Spin-Off
On January 29, 2015, The Manitowoc Company, Inc. (“MTW”) announced plans to create two independent public companies to separately operate its two businesses: its Crane business and its Foodservice business. To effect the separation, MTW first undertook an internal reorganization, following which MTW held the Crane business, and Manitowoc Foodservice, Inc. ("MFS") held the Foodservice business. Then on March 4, 2016, MTW distributed all of our common stock to MTW’s shareholders on a pro rata basis, and MFS became an independent publicly traded company (the “Distribution”). As used in this Annual Report on Form 10-K, “Spin-Off” refers to both the above described internal reorganization and Distribution, collectively.
Business
MFS is among the world’s leading designers and manufacturers of commercial foodservice equipment. Our capabilities span refrigeration, ice-making, cooking, holding, food-preparation, and beverage-dispensing technologies, and allow us to equip entire commercial kitchens and serve the world’s growing demand for food prepared away from home. We supply foodservice equipment to commercial and institutional foodservice operators such as full-service restaurants, quick-service restaurant chains, hotels, caterers, supermarkets, convenience stores, business and industry, hospitals, schools and other institutions.
Our products are sold in over 100 countries globally, across the Americas, EMEA and APAC. Our products, services and solutions are marketed through a worldwide network of over 3,000 dealers and distributors under industry-leading brands, including Cleveland, Convotherm, Dean, Delfield, Fabristeel, Frymaster, Garland, Inducs, Kolpak, Koolaire, Lincoln, Manitowoc Ice, Merco, Merrychef, Multiplex, Servend, and U.S. Range. All of our products are supported by KitchenCare, our aftermarket repair and parts service business. Our scale and expertise enable us to serve a global blue-chip customer base across the world in continually evolving foodservice markets. For the years ended December 31, 2015 and December 31, 2014, we generated revenue of $1,570.1 million and $1,581.3 million respectively, and operating income of $159.9 million and $172.5 million, respectively.
-33-
Reportable Segments
We manage our business in three geographic reportable segments: Americas, EMEA, and APAC. These segments represent the level at which we review our financial performance and make operating decisions. Segment earnings, or earnings before amortization, corporate charges, interest, income taxes and other special gains or charges is the measure of profit and loss that our chief operating decision maker uses to evaluate the financial performance of our business and is the basis for resource allocation and performance reviews. For these reasons, we believe that segment earnings represent the most relevant measure of segment profit and loss. A reconciliation of segment earnings to earnings from continuing operations before income taxes on a U.S. GAAP basis is presented in the “- Results of Operations and Discussion and Analysis - Sales and Earnings by Segment.”
In contrast to many other companies in the fragmented foodservice equipment industry, MFS has the scale and experience to follow its customers globally, operating in the Americas, EMEA and APAC regions. The Americas is by far the Company’s biggest geographic segment in terms of sales, followed by EMEA. While we plan to continue growing in all regions, the Company also recognizes that the bulk of overall growth in the foodservice industry is expected to occur in markets other than the U.S., Canada and Western Europe.
Americas
The Americas segment, including the U.S., Canada and Latin America, had net sales and earnings before interest and taxes of approximately $1,323.7 million and $200.9 million, respectively, for the year ended December 31, 2015. Sales generated by our U.S. operations represent a significant majority of sales in the Americas segment.
EMEA
The EMEA segment is made up of markets in Europe, Middle East and Africa, including Russia and the commonwealth of independent states. The EMEA segment had net sales and earnings of approximately $281.6 million and $23.5 million, respectively, for the year ended December 31, 2015.
APAC
The APAC segment is comprised principally of markets in China, Singapore, Australia, India, Malaysia, Indonesia, Thailand and Philippines. The APAC segment had net sales and earnings of approximately $191.1 million and $21.6 million, respectively, for the year ended December 31, 2015.
Accounting Basis of Presentation
Our historical combined financial statements include the accounts of MFS and its subsidiaries as well as entities which were not previously subsidiaries but now form part of MFS. Our historical combined financial statements include expenses of MTW that were allocated to us for certain functions, including general corporate expenses related to finance, treasury, tax, audit, legal, information technology, human resources, and investor relations.
The combined financial statements are prepared on a standalone basis and reflect the historical results of operations, financial position and cash flows of MFS in accordance with U.S. GAAP. The combined financial statements are presented as if MFS had been carved out of MTW for all periods presented.
You should read the historical combined financial data presented below in conjunction with our audited condensed combined financial statements and accompanying notes.
All dollar amounts are in millions of dollars throughout the tables included in this Management’s Discussion and Analysis of Financial Conditions and Results of Operations unless otherwise indicated.
-34-
Results of Operations and Discussion and Analysis
Results of Operations
The following are our results of operations for years ended December 31, 2015, 2014, and 2013:
(in millions) | 2015 | 2014 | 2013 | |||||||||
Net sales | $ | 1,570.1 | $ | 1,581.3 | $ | 1,541.8 | ||||||
Cost of sales | 1,068.4 | 1,073.3 | 1,030.9 | |||||||||
Gross Profit | 501.7 | 508.0 | 510.9 | |||||||||
Selling, general and administrative expenses | 291.6 | 299.6 | 289.7 | |||||||||
Other operating expenses | 50.2 | 35.9 | 33.5 | |||||||||
Earnings before interest and taxes from continuing operations | 159.9 | 172.5 | 187.7 | |||||||||
Interest expense | (1.4 | ) | (1.3 | ) | (1.0 | ) | ||||||
Interest income on notes with MTW - net | 15.8 | 16.6 | 17.2 | |||||||||
Other income (expense) - net | 22.0 | (0.6 | ) | 0.7 | ||||||||
Earnings from continuing operations before income taxes | 196.3 | 187.2 | 204.6 | |||||||||
Income taxes | 39.3 | 25.9 | 55.3 | |||||||||
Net earnings from continuing operations | 157.0 | 161.3 | 149.3 | |||||||||
Discontinued operations: | ||||||||||||
Earnings (loss) from discontinued operations, net of income expense (benefit) of $0.1, $(0.3), and $(1.0), respectively | 0.1 | (0.4 | ) | (0.5 | ) | |||||||
Loss on sale of discontinued operations, net of income tax (benefit) expense of $0.0, $(0.6) and $4.4, respectively | — | (1.1 | ) | (2.7 | ) | |||||||
Net earnings | $ | 157.1 | $ | 159.8 | $ | 146.1 | ||||||
Discussion of Results of Operations
(in millions) | 2015 | 2014 | 2013 | |||||||||
Net Sales | $ | 1,570.1 | $ | 1,581.3 | $ | 1,541.8 | ||||||
MFS’ sales totaled $1,570.1 million for the year ended December 31, 2015, representing a $11.2 million, or 0.7%, decrease compared to the prior year. The decrease in total net sales included an unfavorable foreign exchange impact of approximately $49.5 million due to the relative strength of the US Dollar to foreign currencies, and product roll-outs in the first half of 2014, which generated sales of approximately $35.2 million, that did not recur in the first half of 2015. Favorable volume, product and price mix impact of $73.5 million partially offset the negative impacts of foreign exchange and product roll-outs over the prior year period. Sales in the Americas totaled $1,323.7 million, an increase of 1.7% over the prior year, on favorable sales volumes across both hot and cold brands. Sales in EMEA and APAC were down 10.6% and 3.6%, respectively, compared to the prior year period, due to unfavorable foreign exchange only partially offset by strength in particular markets and product types. Further analysis of the changes in sales by reportable segments is shown in the “Sales and Earnings by Segment” below.
MFS’ sales totaled $1,581.3 million in 2014, an increase of 2.6% or $39.5 million over 2013. The sales increase during the year was principally driven by higher sales in the Americas and APAC regions which contributed $19.3 million and $68.8 million, respectively, to the increase. Sales in EMEA posted a slight sales increase of approximately $2.5 million during the year. The increase in sales was due to specific product launches in the APAC and Americas regions in our ice, refrigeration and reach-in businesses as well as the Beverage-in-Cup equipment roll-outs by certain of our chain customers. There was also a favorable impact of approximately $4.7 million from foreign currency volatility in relation to the U.S. Dollar as compared with the year ended December 31, 2013. These increases were partially offset by an increase of $51.1 million of higher intersegment sales, particularly in APAC, which are eliminated upon consolidation. Further analysis of the changes in sales by reportable segments is shown in the “Sales and Earnings by Segment” below.
(in millions) | 2015 | 2014 | 2013 | |||||||||
Gross Profit | $ | 501.7 | $ | 508.0 | $ | 510.9 | ||||||
Gross Margin | 32.0 | % | 32.1 | % | 33.1 | % | ||||||
Gross profit for the year ended December 31, 2015 decreased by $6.3 million, or 1.2%, compared to the prior year, and gross profit percentage was approximately flat at 32.0% in 2015 compared to 32.1% in 2014. The decline was primarily due the decrease in sales of $11.2 million, incremental costs of $14.0 million associated with the consolidation and transition of our KitchenCare business to third-party warehouse management during the first three quarters of the year, as well as higher labor and overhead costs of $6.9 million on higher sales volumes, almost entirely offset by $26.0 million of savings from product and manufacturing cost reductions and lower costs for warranty.
-35-
Gross profit for the year ended December 31, 2014 decreased by $2.9 million, or 0.6%, compared to the prior year. The decrease translated to a slightly lower gross margin percentage of 32.1% compared to 33.1% in 2013. The decrease was principally due to an unfavorable product mix, higher rebates and discounts as more volume of sales were sold to the buying groups and dealers, higher conversion costs, higher warranty costs, and incremental costs associated with the consolidation and transition of our KitchenCare business to third-party warehouse management during the fourth quarter of 2014. Savings from product and manufacturing cost reduction initiatives partially offset the aforementioned negative impacts.
(in millions) | 2015 | 2014 | 2013 | |||||||||
Selling, general and administrative expenses | $ | 291.6 | $ | 299.6 | $ | 289.7 | ||||||
Total selling, general and administrative expenses amounted to $291.6 million in 2015, a decrease of 2.7% or $8.0 million compared to the prior year. The year-over-year decrease was attributable primarily to headcount reductions implemented during the year, as well as cost containment across the business.
Total selling, general and administrative expenses amounted to $299.6 million in 2014, an increase of 3.4% or $9.9 million compared to the prior year. The year-over-year increase was attributable to a favorable non-recurring legal settlement and an earn-out adjustment on a prior acquisition which benefited 2013 by approximately $5.2 million in total. Increase in sales commissions, marketing costs as well as project costs associated with new product developments also contributed to the increase in selling, general and administrative expenses. The increase was partially offset by lower employee related costs such as health benefits, short-term incentive compensation, and stock-based compensation.
(in millions) | 2015 | 2014 | 2013 | |||||||||
Amortization expense | $ | 31.4 | $ | 31.8 | $ | 31.4 | ||||||
Asset impairment expense | 9.0 | 1.1 | — | |||||||||
Restructuring expense | 4.6 | 2.6 | 2.9 | |||||||||
Separation expense | 4.3 | — | — | |||||||||
Other operating expense (income) | 0.9 | 0.4 | (0.8 | ) | ||||||||
Total other operating expense | $ | 50.2 | $ | 35.9 | $ | 33.5 | ||||||
Amortization expense for the years ended December, 31, 2015, 2014 and 2013 of $31.4 million, $31.8 million, and $31.4 million, respectively, is related to intangible assets as shown in Note 9, “Goodwill and Other Intangible Assets,” to the Audited Combined Financial Statements.
Asset impairment expense for the year ended December 31, 2015 and 2014 was $9.0 million and $1.1 million, respectively. There was no impairment expense for the year ended December 31, 2013. The 2015 expense related to the write-down to fair value of land, building, and building improvements for the Cleveland facility which was held for sale as of December 31, 2015. The 2014 impairment expense related to the write-down to fair value of land, building, and building improvements for a facility in the Americas which was held for sale as of December 31, 2014.
Restructuring expense for the year ended December 31, 2015, primarily related to reductions in workforce as well as costs associated with the closure of our Cleveland facility. Restructuring expense for the year ended December 31, 2014, related to employee termination costs associated with the transfer of certain manufacturing activities in Manitowoc, Wisconsin, to Monterrey, Mexico. Restructuring expense for the years ended December 31, 2013 and 2012 related to plant and manufacturing facility consolidations in the Americas region as well as workforce reductions in EMEA. See Note 18, “Restructuring and Asset Impairment,” to the Audited Combined Financial Statements for further details.
For the year ended December 31, 2015, MFS incurred separation expenses of $4.3 million related to our spin-off from MTW. For the years ended December 31, 2015, and December 31, 2014, other operating expense of $0.9 million and $0.4 million, respectively, related to miscellaneous fees from divestiture activities. For the year ended December 31, 2013, other income was primarily related to a pension plan curtailment/settlement on a plan during the year.
(in millions) | 2015 | 2014 | 2013 | |||||||||
Interest expense | $ | (1.4 | ) | $ | (1.3 | ) | $ | (1.0 | ) | |||
Interest expense for the years ended December 31, 2015, 2014 and 2013 was primarily related to the financing costs on capital lease arrangements.
(in millions) | 2015 | 2014 | 2013 | |||||||||
Interest income on notes with MTW - net | $ | 15.8 | $ | 16.6 | $ | 17.2 | ||||||
As disclosed in Note 23, "Net Parent Company Investment and Related Party Transactions," to our Audited Combined Financial Statements, MFS provided funding to MTW via intercompany debt. Net interest income reflects the historical net interest income recognized by MFS
-36-
from these intercompany debts which were settled on March 3rd, 2016.
(in millions) | 2015 | 2014 | 2013 | |||||||||
Other income (expense) - net | $ | 22.0 | $ | (0.6 | ) | $ | 0.7 | |||||
Other income - net for the year ended December 31, 2015 included a $9.9 million gain on sale of Kysor Panel Systems, a $5.4 million gain on sale of a certain investment property and a $4.9 million gain on the acquisition of a Thailand joint venture. The remainder of costs in 2015 related primarily to foreign exchange gains. Other (expense) income - net for the years ended December 31, 2014 and 2013 primarily related to foreign exchange gains or losses.
(in millions) | 2015 | 2014 | 2013 | |||||||||
Income taxes | $ | 39.3 | $ | 25.9 | $ | 55.3 | ||||||
MFS’ effective tax rate for the years ended 2015, 2014 and 2013 was 20.1%, 13.8% and 27.0%, respectively. The 2015 tax provision was reduced by $17.8 million related to the divestiture of the Kysor Panel Systems business resulting in a favorable impact to the effective tax rate.This benefit was primarily due to the write-off of $13.8 million of an unamortized deferred tax liability that was recorded in purchase accounting and as a result of the utilization of the capital loss carryforward to offset the tax gain. The 2014 effective tax rate was reduced by a $25.6 million tax benefit related to a capital loss realization from an election with the IRS to treat a Foodservice entity as a partnership for U.S. federal income tax purposes. The 2013 effective tax rate benefited from the release of uncertain tax position reserves related to favorable audit settlements. See Note 12, “Income Taxes,” to the Audited Combined Financial Statements for further details.
(in millions) | 2015 | 2014 | 2013 | |||||||||
Loss (gain) from discontinued operations | $ | (0.1 | ) | $ | 0.4 | $ | 0.5 | |||||
The loss from discontinued operations in 2014 related primarily to administrative costs associated with various businesses previously disposed of in prior years. The loss from discontinued operations for the year ended December 31, 2013 related to the sale of the Jackson business in the first quarter of 2013.
(in millions) | 2015 | 2014 | 2013 | |||||||||
Loss on sale of discontinued operations | $ | — | $ | 1.1 | $ | 2.7 | ||||||
There was no loss on sale of discontinued operations during 2015. Loss on sale of discontinued operations of $1.1 million for the year ended December 31, 2014 related to the settlement of a pension obligation to a previously disposed of entity. Loss on sale of discontinued operations of $2.7 million for the year ended December 31, 2013 was attributable to the sale of the Jackson warewashing business in the first quarter of 2013. See further details at Note 4, “Discontinued Operations and Divestitures,” to our Audited Combined Financial Statements.
Sales and Earnings by Segment
Net sales
(in millions) | 2015 | 2014 | 2013 | |||||||||
Net sales: | ||||||||||||
Americas | $ | 1,323.7 | $ | 1,301.9 | $ | 1,282.6 | ||||||
EMEA | 281.6 | 315.1 | 312.6 | |||||||||
APAC | 191.1 | 198.2 | 129.4 | |||||||||
Elimination of inter-segment sales | (226.3 | ) | (233.9 | ) | (182.8 | ) | ||||||
Net sales | $ | 1,570.1 | $ | 1,581.3 | $ | 1,541.8 | ||||||
In 2015, sales in the Americas segment increased by $21.8 million, or 1.7%, to $1,323.7 million, compared to $1,301.9 million in 2014. This increase was principally driven by higher sales across both hot and cold brands, with new product roll-outs to chain customers for our Delfield and Ovens products, and continued strength in our ice business related to our Koolaire ice machines. In 2014, Americas segment sales increased by $19.3 million, or 1.5%, to $1,301.9 million compared to $1,282.6 million in 2013. This increase was driven by higher sales in both our hot and cold category businesses as well as favorable pricing actions. Ice equipment sales increased with the launch of our Koolaire ice machines while products such as Cleveland, Frymaster and Garland posted higher sales during the year.
Sales in the EMEA region for 2015 decreased by $33.5 million, or 10.6%, to $281.6 million compared to $315.1 million in the prior year. This decrease was primarily driven by unfavorable foreign currency impact and a benefit to 2014 sales from a new product roll-out to a major customer in the EMEA region, which more than offset increases from roll-out of the Convotherm 4 oven and higher general market sales. For the year ended 2014, sales in the EMEA region increased slightly by 0.8%, to $315.1 million from $312.6 million in 2013. This increase was driven by the European roll-out of the Beverage-in-Cup product by a major QSR chain customer during 2014 that was offset by the 2013 Convotherm roll-out which did not recur in 2014.
-37-
Sales in the APAC region decreased by $7.1 million in 2015 from $198.2 million in the prior year. This decrease was primarily driven by lower sales to large QSR chain customers. For the year ended 2014, sales in the APAC region increased by 53.2%, to $198.2 million from $129.4 million in 2013. This increase was primarily driven by improved sales to certain regional chains, particularly in China as well as higher intersegment sales, specifically of ice machine products manufactured in the region.
Earnings by Segment
(in millions) | 2015 | 2014 | 2013 | |||||||||
Earnings before interest and taxes from continuing operations: | ||||||||||||
Americas | $ | 200.9 | $ | 201.8 | $ | 214.3 | ||||||
EMEA | 23.5 | 20.7 | 22.5 | |||||||||
APAC | 21.6 | 20.8 | 16.0 | |||||||||
Corporate expense | (35.8 | ) | (34.9 | ) | (31.6 | ) | ||||||
Amortization expense | (31.4 | ) | (31.8 | ) | (31.4 | ) | ||||||
Asset impairment expense | (9.0 | ) | (1.1 | ) | — | |||||||
Restructuring expense | (4.6 | ) | (2.6 | ) | (2.9 | ) | ||||||
Separation expense | (4.3 | ) | — | — | ||||||||
Other income (expense) | (1.0 | ) | (0.4 | ) | 0.8 | |||||||
Earnings before interest and taxes from continuing operations | $ | 159.9 | $ | 172.5 | $ | 187.7 | ||||||
For the year ended December 31, 2015, earnings for the Americas region remained fairly consistent with the prior year, with a decrease of $0.9 million to $200.9 million, resulting in operating margin of 15.2%, a decline of 30 basis points compared to the prior year. The change was a result of a decline of approximately $13.0 million due to specific product roll-outs in the first half of 2014 that did not recur in the first half of 2015, as well as approximately $14.0 million of incremental costs associated with the consolidation and transition of our KitchenCare business to third-party warehouse management during the first three quarters of the year. These costs were almost entirely offset by savings from headcount reductions and product and manufacturing cost reduction initiatives.
For the year ended December 31, 2014, compared to the prior year, earnings for the Americas region declined despite the increase in sales. The decline in earnings was due to a number of factors including incremental costs associated with the consolidation and transition of our KitchenCare business to third-party warehouse management during the fourth quarter of 2014, and product and channel mix where higher volumes were sold to chain accounts and buying groups which attract lower margins and higher rebates. Year-over-year earnings for 2014 compared to 2013 was also impacted by the one-time benefit recognized in 2013 related to a non-recurring favorable legal claim settlement and a positive earn-out adjustment related to a prior acquisition.
For the year ended December 31, 2015, compared to the prior year, earnings for the EMEA region increased by $2.8 million to $23.5 million, resulting in operating margin of 8.3%, an increase of 170 basis points compared to the prior year. Earnings for the segment increased despite the decrease in sales due to favorable pricing on new product roll-outs and cost containment across the region from headcount reductions and product and manufacturing cost reduction initiatives.
For the year ended December 31, 2014, compared to the prior year, earnings for the EMEA region decreased slightly to $20.7 million from $22.5 million in the prior year, resulting in operating margin of 6.6%, a decline of 60 basis points from the prior year. The decline can be attributed to unfavorable mix as well the non-recurring benefit associated with the higher margin product roll-outs in the prior year. An increase in selling, general and administrative costs likewise negatively impacted margin offset by favorable cost savings.
For the year ended December 31, 2015, earnings for the APAC segment remained fairly consistent with the prior year, with an increase of approximately $0.8 million to $21.6 million, resulting in operating margin of 11.3%, an increase of 80 basis points compared to the prior year. The decline in sales was offset by cost containment from headcount reductions and product and manufacturing cost reduction initiatives.
For the year ended December 31, 2014, compared to the prior year, operating earnings for the APAC segment increased to $20.8 million from $16.0 million in 2013. The increase was primarily due to higher sales during the year. Operating margin, however, declined from 12.4% in 2013 to 10.5% in 2014. The decline was due to sales mix as well as the increase in intersegment sales which attract lower margins.
Total corporate expenses for the year ended December 31, 2015, consisted of $24.6 million of general corporate expenses allocated to MFS during the year and $11.2 million of baseline corporate expenses. Total corporate expenses for the year ended December 31, 2015 remained fairly consistent with the prior year, with an increase of approximately $0.9 million. The increase was primarily due to higher allocated costs from MTW for wages and benefits and employee health expense.
Total corporate expenses for the year ended December 31, 2014 consisted of $22.1 million of general corporate expenses allocated to MFS during the year and $12.8 million of baseline corporate expenses. Total corporate expenses for the year ended December 31, 2013 consisted of $26.3 million of general corporate expenses allocated to MFS during the year and $5.3 million of baseline corporate expenses. The decline of $3.3 million in total corporate expenses in 2014 compared to 2013 was driven by the decrease in short-term incentive payments during the year as well as the one-time favorable adjustment of $3.5 million related to an insurance settlement in 2013.
-38-
Market Conditions and Outlook
MFS is a leading participant in the global foodservice equipment industry. Our customers include many of the fastest-growing and most-innovative foodservice companies in the world. They come to us for innovations that may enable their profitable growth by improving their menus, enhancing operations and reducing their costs. We serve customers around the globe and we will continue to expand and support our customers wherever they grow. Our integrated manufacturing operations, service sites and sales offices work together to assist customers worldwide, whether these customers are local businesses or global companies.
According to Technomic, a foodservice consulting/research firm based in Chicago, 2015 U.S. foodservice sales came in stronger than expected with real growth of 2.3%, the highest rate since 2007. Furthermore, the National Restaurant Association’s Restaurant Performance Index has shown positive growth every month since the last time it went barely negative in February 2013, resulting in 35 consecutive months of growth. Technomic expects this growth to continue in the near-term, with an industry-wide sales growth forecast for 2016 of 4.9% on a nominal basis, or 2.5% real sales growth. Technomic also expects long term industry growth, with a nominal compound annual growth rate (“CAGR”) of approximately 2% during the 2015-2020 period, with some foodservice industry sectors, such as healthcare or fast casual dining, expected to grow at a nominal CAGR of 4-6% during the same time period.
On a global level, the demand for affordable dining is expected to continue to increase. Consumers in every market are expected to continue gravitating towards more informal options, a trend seen among both high income consumers looking to save during a slow economic recovery, and lower income consumers new to foodservice looking for accessible entry points. For foodservice equipment operators in emerging markets, this offers enormous room for innovation, particularly in terms of format, as consumers new to eating out look to experiment with a variety of brands and experiences. Within the restaurant industry, growing trends towards enhancing food safety and waste reduction are expected to drive demand for foodservice equipment. According to the World Health Organization, as populations worldwide become increasingly urbanized and globalized, people are more often eating outside of the home and the global food chain is becoming increasingly complex. Food providers have an ever greater responsibility to ensure food safety for consumers. High quality foodservice equipment can help these providers meet this challenge. Additionally, restaurants are striving to reduce waste and promote sustainability. According to the Food and Agriculture Organization of the United Nations (“FAO”), approximately one third of all food produced globally gets either lost or wasted each year. Modern and efficient foodservice equipment can promote energy efficiency in the kitchen, prevent premature spoilage, and reduce waste.
Overall, we believe that continued growth in demand for foodservice equipment will result from the development of new restaurant concepts in the U.S., the expansion of U.S. and foreign chains into international markets, the replacement and upgrade of existing equipment, and new equipment requirements resulting from menu changes as well as waste reduction. We expect to benefit from these trends, and grow market penetration alongside our customers as they expand into new service categories and geographies. We believe we are well-positioned to take advantage of worldwide growth opportunities with global and regional new product introductions, improvement in operational performance, and other strategic initiatives.
We believe our strong position gives us significant opportunities to grow along with our customers. Not only do we aim to be their supplier of choice, but also their innovator of choice. Our customers are constantly looking for ways to innovate their menus, and we are at the forefront of that innovation. Global chain customers and our channel partners recognize MFS and our brands for innovation and supplier support. In April 2015, MFS was honored for our ongoing commitment to sustainable practices throughout the foodservice industry, earning Energy Star Partner of the Year for Sustained Excellence and our sixth consecutive Energy Star Partner of the Year award. MFS was again honored by the National Restaurant Association ("NRA") as one of the restaurant industry's leading companies focused on innovation by understanding and meeting the operator's needs. In 2015, MFS won Kitchen Innovation Awards from the NRA for the Frymaster Filter Quick Oil Quality Sensor and Merrychef eikon e4s with panini press and has won 2 awards so far in 2016 bringing the total of these prestigious awards to 31 since 2005.
Our brands are well-positioned leaders that span most major commercial foodservice equipment categories. Our team is passionate about the opportunities that our market position and global capabilities provide us. For 2016, our priorities are to continue to grow our customer base, deepen customer penetration, and drive international expansion to continue to grow sales, and to drive margin expansion through right-sizing our operations and business simplification. We believe we are building an industry-leading business for the long-term.
Liquidity and Capital Resources
Historically, MTW provided capital, cash management, and other treasury services to MFS. MTW continued to provide these services until the Spin-Off was consummated. As part of these services, certain cash balances were swept to MTW on a daily basis and were held in a centralized account. In turn, MTW transferred cash to MFS in order for MFS to meet its cash needs. As a result, the cash balances presented in MFS’ combined financial statements consist primarily of cash held at certain MFS entities used to satisfy their own cash needs.
MFS’ primary future cash needs will be centered on operating activities, working capital, and capital investments. Following the Spin-Off, MFS’ capital structure and sources of liquidity have changed significantly from its historical capital structure and sources. MFS no longer participates in capital management with MTW, and MFS’ ability to fund its cash needs now depends on its ongoing ability to generate and raise cash. Although MFS believes that its future cash from operations, together with its access to capital markets, will provide adequate resources to fund its operating and financing needs, its access to, and the availability of financing on acceptable terms in the future will be affected by many factors including: (i) its credit rating, (ii) the liquidity of the overall capital markets and (iii) the then-current state of the economy. There can be no assurances that MFS will have future access to the capital markets on acceptable terms.
-39-
On March 3, 2016, in connection with the completion of the Spin-Off, MFS incurred a total of approximately $1,400 million of aggregate debt, which consists of a $975 million senior secured term loan B facility, which bears interest at a floating rate and will mature in 2023, and $425 million of senior notes due 2024, which bear interest at 9.5% per annum. Additionally, we have a senior secured revolving credit facility that permits borrowings of up to $225 million, which bears interest at a floating rate and will mature in 2021. See "Description of Material Indebtedness" for more information regarding this new debt.
In connection with the Spin-Off we distributed $1,362 million of cash, including net proceeds from debt that we incurred, to MTW.
Cash Flows
The table below shows a summary of cash flows for the years ended 2015, 2014, and 2013 (in millions):
Years Ended December 31, | ||||||||||||
2015 | 2014 | 2013 | ||||||||||
Cash provided by operating activities | $ | 143.0 | $ | 200.2 | $ | 201.9 | ||||||
Cash provided by (used for) investing activities | 59.1 | (25.3 | ) | (42.9 | ) | |||||||
Cash used for financing activities | $ | (183.1 | ) | $ | (167.0 | ) | $ | (171.0 | ) | |||
Operating activities
Cash and cash equivalents on-hand at December 31, 2015 amounted to $32.0 million, compared to $16.5 million at December 31, 2014.
Cash flow from operations during 2015 was $143.0 million, a decrease of $57.2 million compared to the prior year. The decrease in cash flow from operating activities for the year ended December 31, 2015, compared to 2014 was primarily due to the timing of cash payments on trade accounts payable of $46.8 million and lower cash from earnings of $25.1 million, partially offset by a decrease in inventory of $28.5 million on better working capital management and non-recurring inventory build-up at year-end 2014 due to the consolidation and transition of our KitchenCare business in that period.
Cash flows provided by operations during 2014 was $200.2 million compared to $201.9 million in 2013. Operating cash generation during 2014 was primarily driven by cash from earnings. The favorable year-over-year cash earnings impact of $5.2 million, as well as faster collections on accounts receivable of $2.9 million, was offset by increased inventory levels of $15.0 million at the end of 2014 due primarily to the consolidation and transition of our KitchenCare business to third-party warehouse management. Cash and cash equivalents on-hand at December 31, 2014 amounted to $16.5 million compared to $9.6 million at December 31, 2013.
Investing activities
Cash flows provided by investing activities of $59.1 million in 2015 related mainly to $78.2 million of proceeds from a sale of Kysor Panel Systems partially offset by capital expenditures of $13.2 million on fixed asset equipment purchases.
Cash flows used for investing activities of $25.3 million in 2014 related mainly to capital expenditures on fixed asset equipment purchases.
Cash flows used for investing activities in 2013 of $42.9 million consisted primarily of $12.2 million for the acquisition of Inducs, AG and for capital expenditures of $33.6 million, which related to fixed asset equipment purchases as well as investment costs for the new manufacturing facility in Monterrey, Mexico.
Financing activities
Cash flows used for financing activities for the years ended December 31, 2015, 2014 and 2013 were $183.1 million, $167.0 million and $171.0 million, respectively, primarily related to financing transactions with MTW during these periods.
Description of Material Indebtedness
On March 3, 2016, in connection with the completion of the Spin-Off, MFS incurred a total of approximately $1,400 million in new indebtedness, and had an approximately additional $225 million available under a senior secured revolving credit facility, limited by the amount of letters of credit outstanding at any given point of time.
The outstanding indebtedness at the completion of the Spin-Off consisted of:
• | a $975 million senior secured term loan B facility; |
• | $425 million aggregate principal amount of 9.5% senior notes due 2024; and |
• | $0 outstanding under the senior secured revolving credit facility |
The following summarizes the principal terms of the senior secured term loan facility and senior secured revolving credit facility (we refer to these collectively as the “Credit Facilities”) and the terms of our senior notes.
Senior Credit Facilities
-40-
MFS entered into a credit agreement (the “2016 Credit Agreement”) for a new senior secured revolving credit facility in an aggregate principal amount of $225 million (the “Revolving Facility”) and a senior secured term loan B facility in an aggregate principal amount of $975 million (the “Term Loan Facility”) with JPMorgan Chase Bank, N.A, as administrative agent and collateral agent, J.P. Morgan Securities LLC, Goldman Sachs Bank USA, HSBC Securities (USA) Inc., and Citigroup Global Markets Inc., on behalf of certain of its affiliates, as joint lead arrangers and joint bookrunners, and certain lenders, as lenders. The Revolving Facility includes (i) a $20 million sublimit for the issuance of letters of credit on customary terms, and (ii) a $40 million sublimit for swingline loans on customary terms. MFS entered into security and other agreements relating to the 2016 Credit Agreement.
Incremental Facilities
MFS will have the right from time to time to increase the size or add certain incremental revolving or term loan facilities (the “Incremental Facilities”) in minimum amounts of $10,000,000 and in integral multiples of $5,000,000 in excess thereof. The aggregate principal amount of all such Incremental Facilities may not exceed an amount equal to the sum of (i) $225 million plus (ii) an additional amount, so long as, after giving effect to the incurrence of such additional amount, the pro forma senior secured leverage ratio does not exceed 3.75 to 1.
Interest Rate
Borrowings under the Credit Facilities will bear interest at a rate per annum equal to, at the option of MFS, (i) LIBOR plus the applicable margin of approximately 4.75% for term loans subject to a 1.00% LIBOR floor and 1.50% - 2.75% for revolving loans, based on consolidated total leverage, or (ii) an alternate base rate plus the applicable margin, which will be 1.00% lower than for LIBOR loans.
Maturity and Amortization
The loans and commitments under the Revolving Facility mature or terminate on March 3, 2021. The loans and commitments under the Term Loan Facility will mature or terminate on March 3, 2023 and will require quarterly principal payments at a rate of 0.25% of the original principal balance beginning with the fiscal quarter ending September 30, 2016.
Mandatory Prepayments
Mandatory prepayments on the Term Loan Facility are required, subject to customary exceptions, (i) from the receipt of net cash proceeds by MFS or any of its restricted subsidiaries from certain asset dispositions and casualty events, in each case, to the extent such proceeds are not reinvested or committed to be reinvested in assets useful in the business of MFS or any of its subsidiaries within twelve months of the date of such disposition or casualty event, (ii) following the receipt of net cash proceeds from the issuance or incurrence of additional debt of MFS or any of its subsidiaries and (iii) in an amount equal to 50% of excess cash flow of MFS and its subsidiaries with step-downs to 25% if the senior secured leverage ratio is less than or equal to 4.50 to 1 but greater than 4.00 to 1, and to 0% if the senior secured leverage ratio is less than or equal to 4.00 to 1.
Guarantees and Security
Obligations of MFS under the Credit Facilities are jointly and severally guaranteed by certain of its existing and future direct and indirectly wholly-owned U.S. subsidiaries (but excluding (i) unrestricted subsidiaries, (ii) immaterial subsidiaries, and (iii) special purpose securitization vehicles).
There is a first priority perfected lien on substantially all of the assets and property of MFS and guarantors and proceeds therefrom excluding certain excluded assets. The liens securing the obligations of MFS under the Revolving Facility and the Term Loan Facility will be pari passu.
Certain Covenants and Events of Default
The 2016 Credit Agreement contains customary financial covenants including (a) a maximum consolidated total leverage ratio of 6.25 to 1, with step-downs of 0.25 each fiscal quarter beginning with the fiscal quarter ending September 30, 2016 until the ratio reaches 4.00 to 1 in the fiscal quarter ending September 30, 2018 , and (b) a minimum consolidated interest coverage ratio of 2.00 to 1, with increases of 0.25 every other fiscal quarter beginning with the fiscal quarter ending September 30, 2016 until the ratio reaches 3.00 to 1 in the fiscal quarter ending December 30, 2017. Only lenders holding at least a majority of the Revolving Facility have the ability to amend the financial covenants, waive a breach of the financial covenants or accelerate the Revolving Facility upon a breach of the financial covenants, and a breach of the financial covenants will not constitute an event of default with respect to the Term Loan Facility or trigger a cross-default under the Term Loan Facility until the date on which the Revolving Facility has been accelerated and terminated.
In addition, the 2016 Credit Agreement contains a number of covenants that, among other things and subject to certain exceptions, restrict our ability and the ability of our other restricted subsidiaries to:
• | incur additional indebtedness; |
• | pay dividends and other distributions; |
• | make investments, loans and advances; |
• | engage in transactions with our affiliates; |
-41-
• | sell assets or otherwise dispose of property or assets; |
• | alter the business we conduct; |
• | merge and engage in other fundamental changes; and |
• | incur liens. |
The 2016 Credit Agreement also contains certain customary representations and warranties, affirmative covenants and provisions relating to events of default.
The foregoing description of the Credit Facilities and the 2016 Credit Agreement is qualified in its entirety by reference to the 2016 Credit Agreement, which is (1) filed as an exhibit to this Annual Report on Form 10-K, and (2) incorporated into this Annual Report on Form 10-K by reference.
Senior Notes
In connection with the Spin-Off, MFS issued $425 million in aggregate principal amount of 9.5% senior notes due 2024 (the “Senior Notes”) under an indenture with Wells Fargo Bank, National Association, as trustee (the “Trustee”). The Senior Notes were sold to qualified institutional buyers pursuant to Rule 144A (and outside the United States in reliance on Regulation S) under the Securities Act.
The Senior Notes are fully and unconditionally guaranteed, jointly and severally, on an unsecured basis by each of MFS’ domestic restricted subsidiaries that is a borrower or guarantor under the Credit Facilities. The Senior Notes and the subsidiary guarantees will be unsecured, senior obligations.
The notes are redeemable, at our option, in whole or in part from time to time, at any time prior to February 15, 2019 upon not less than 30 nor more than 60 days’ written notice, at a price equal to 100% of the principal amount thereof plus a “make-whole” premium and accrued but unpaid interest to the date of redemption.
In addition, we may redeem the notes at our option, in whole or in part, at the following redemption prices (expressed as percentages of the principal amount thereof) if redeemed during the 12-month period commencing on February 15 of the year set forth below:
Year | Percentage | |
2019 | 107.1 | % |
2020 | 104.8 | % |
2021 | 102.4 | % |
2022 and thereafter | 100.0 | % |
In addition, we must pay accrued and unpaid interest on the notes redeemed to the redemption date.
MFS is generally required to offer to repurchase all of the outstanding Senior Notes upon the occurrence of certain specific change of control events at a purchase price equal to 101% of the principal amount plus accrued and unpaid interest to the date of purchase.
The Indenture provides for customary events of default. Generally, if an event of default occurs (subject to certain exceptions), the Trustee or the holders of at least 25% in aggregate principal amount of the then outstanding Senior Notes may declare all the Senior Notes to be due and payable immediately.
The Indenture also limits, among other things, our ability and the ability of our restricted subsidiaries to engage in certain activities, including: incurring additional indebtedness or issue certain preferred stock; paying dividends or making certain other restricted payments or permitting our restricted subsidiaries to do the same; incurring liens; entering into certain types of transactions with our affiliates; and consolidating or merging with or into other companies. If, in the future, the Senior Notes have investment grade credit ratings and no default or event of default exists under the Indenture, certain of these covenants will no longer apply to the Senior Notes for so long as the Senior Notes are rated investment grade. These and other covenants that will be contained in the Indenture are subject to important exceptions and qualifications.
The foregoing description of the Senior Notes and the Indenture is qualified in its entirety by reference to the Indenture, which is (1) filed as an exhibit to this Annual Report on Form 10-K, and (2) incorporated into this Annual Report on Form 10-K by reference.
Off-balance sheet arrangements
Our disclosures concerning transactions, arrangements and other relationships with uncombined entities or other persons that are reasonably likely to materially affect liquidity or the availability of or requirements for capital resources are as follows:
• | We have disclosed our accounts receivable securitization arrangement in Note 11, “Accounts Receivable Securitization,” to the Audited Combined Financial Statements. |
-42-
• | We lease various assets under operating leases. The future estimated payments under these arrangements are disclosed in Note 20, “Leases,” to the Audited Combined Financial Statements. |
On March 3, 2016, we entered into a new $110.0 million accounts receivable securitization program (the “2016 Securitization Facility”) with Wells Fargo Bank, National Association, as purchaser and agent, whereby we will sell certain of our domestic trade accounts receivable to a wholly-owned, bankruptcy-remote special purpose subsidiary and certain of our non-U.S. trade accounts receivable to a wholly-owned, bankruptcy-remote, foreign special purpose entity, which entities, in turn, will sell, convey, transfer and assign to a third-party financial institution (a “Purchaser”), all of the right, title and interest in and to their pool of receivables to the Purchaser. The Purchaser will receive ownership of the pools of receivables. The Company, along with certain of its subsidiaries, act as servicers of the receivables and as such administer, collect and otherwise enforce the receivables. The servicers will be compensated for doing so on terms that are generally consistent with what would be charged by an unrelated servicer. As servicers, they will initially receive payments made by obligors on the receivables but will be required to remit those payments in accordance with a receivables purchase agreement. The Purchaser will have no recourse for uncollectible receivables. The securitization program also contains customary affirmative and negative covenants. Among other restrictions, these covenants require the Company to meet specified financial tests, which include a consolidated interest coverage ratio and a consolidated total leverage ratio that are the same as the covenant ratios required per the 2016 Credit Agreement. The foregoing description of the 2016 Securitization Facility is not complete, and is qualified in its entirety by reference to that certain Sixth Amended and Restated Receivables Purchase Agreement, dated March 3, 2016, by and among Manitowoc Cayman Islands Funding LTD., as seller, MFS and certain of its subsidiaries, as servicers, and Wells Fargo Bank, N.A., as purchaser and as agent, which is filed as an exhibit to the Annual Report on Form 10-K and is incorporated in this Annual Report on Form 10-K by reference.
Contractual obligations The following table summarizes our significant contractual obligations as of December 31, 2015 and is in addition to the debt we have incurred in connection with the Spin-Off:
(in millions) | Total | 2016 | 2017 | 2018 | 2019 | 2020 | Thereafter | |||||||||||||||||||||
Capital leases | $ | 2.7 | $ | 0.4 | $ | 0.4 | $ | 0.5 | $ | 0.6 | $ | 0.3 | $ | 0.5 | ||||||||||||||
Operating leases | 42.2 | 14.2 | 10.1 | 7.6 | 5.6 | 3.8 | 0.9 | |||||||||||||||||||||
Purchase orders | 56.0 | 55.9 | 0.1 | — | — | — | — | |||||||||||||||||||||
Interest obligations | 0.3 | 0.1 | 0.1 | 0.1 | — | — | — | |||||||||||||||||||||
Total obligations | $ | 101.2 | $ | 70.6 | $ | 10.7 | $ | 8.2 | $ | 6.2 | $ | 4.1 | $ | 1.4 | ||||||||||||||
• | We incurred long-term debt in connection with the Spin-Off. See "Description of Material Indebtedness" for more information. |
• | Unrecognized tax benefits totaling $16.6 million as of December 31, 2015, excluding related interests and penalties, are not included in the table because the timing of their resolution cannot be estimated. See Note 12, “Income Taxes,” to the Audited Combined Financial Statements for disclosures surrounding uncertain income tax positions under Accounting Standards Codification Topic 740. |
We maintain defined benefit pension plans for some of our operations in the United States, Europe and Asia. Additionally, certain of our employees participated in a pension plan sponsored by MTW, which is accounted for as a multiemployer plan. As of March 4, 2016, MFS holds its own Defined Benefit Plan and no longer participates in the MTW Defined Benefit Plan. MFS has established a Retirement Plan Committee to manage the operations and administration of all benefit plans and related trusts. The composition of the MFS plan is substantially the same as the former MTW plan.
In 2015, cash contributions by us to all pension plans, including the multiemployer plan, were $3.3 million, and we estimate that our pension plan contributions will be approximately $6.7 million in 2016 comprised of $3.2 million for the MFS plan and $3.5 million for the former MTW plan.
Please refer to Note 16, “Contingencies and Significant Estimates,” of the Audited Combined Financial Statements, where we have disclosed our environmental, health, safety, contingencies and other matters.
-43-
Non-GAAP financial measures
In addition to analyzing our results on a GAAP basis, management also reviews our results on an "EBITA" and "EBITDA" basis. EBITA is defined as earnings before interest, taxes and amortization and EBITDA is EBITA adjusted for depreciation. Management uses EBITA and EBITDA as the basis on which it evaluates our financial performance and makes resource allocation and other operating decisions. Management considers it important that investors review the same operating information that it uses
In addition, the table below also presents Adjusted EBITDA which is defined as earnings before interest, taxes, depreciation and amortization plus certain items such as certain restructuring charges and non-cash period charges attributable to equity awards (in each case as provided in the definition of “Consolidated EBIT”) under our 2016 Credit Agreement’s definitions. We believe that Adjusted EBITDA is useful to the reader of our financial information in order to understand the basis for our debt covenant calculations.
Our non-GAAP financial measures should not be considered as alternatives to our GAAP net earnings or cash flow from operations, or as indicative of liquidity or the cash available to fund operations. Our non-GAAP measures may not be comparable to similarly titled measures used by other companies.
A reconciliation of net earnings on a U.S. GAAP basis to EBITDA and Adjusted EBITDA is as follows:
Year Ended | ||||||||||||
(in millions) | December 31, 2015 | December 31, 2014 | December 31, 2013 | |||||||||
Free cash flow | ||||||||||||
Net cash provided by operating activities | $ | 143.0 | $ | 200.2 | $ | 201.9 | ||||||
Net capital expenditures | (13.2 | ) | (25.3 | ) | (33.6 | ) | ||||||
Free cash flow | $ | 129.8 | $ | 174.9 | $ | 168.3 | ||||||
Earnings before interest, taxes, and depreciation and amortization | ||||||||||||
Net earnings | $ | 157.1 | $ | 159.8 | $ | 146.1 | ||||||
Income taxes | 39.3 | 25.9 | 55.3 | |||||||||
Interest (income) | (15.8 | ) | (16.6 | ) | (17.2 | ) | ||||||
Interest expense | 1.4 | 1.3 | 1.0 | |||||||||
Amortization expense | 31.4 | 31.8 | 31.4 | |||||||||
Earnings before interest, taxes, and amortization (EBITA) | $ | 213.4 | $ | 202.2 | $ | 216.6 | ||||||
Depreciation expense | 19.6 | 21.2 | 20.0 | |||||||||
Earnings before interest, taxes, and depreciation and amortization (EBITDA) | $ | 233.0 | $ | 223.4 | $ | 236.6 | ||||||
Adjusted earnings before interest, taxes, and amortization | ||||||||||||
Net earnings | $ | 157.1 | $ | 159.8 | $ | 146.1 | ||||||
(Gain) loss from and on sale of discontinued operations | (0.1 | ) | 1.5 | 3.2 | ||||||||
Depreciation and amortization | 51.0 | 53.0 | 51.4 | |||||||||
Restructuring and separation expense | 8.9 | 2.6 | 2.9 | |||||||||
Income taxes | 39.3 | 25.9 | 55.3 | |||||||||
Pension and postretirement | 2.7 | 2.4 | 2.5 | |||||||||
Stock-based compensation | 2.3 | 2.4 | 3.5 | |||||||||
Allocated corporate stock-based compensation and pension and postretirement | 6.4 | 5.4 | 5.1 | |||||||||
Interest (income) | (15.8 | ) | (16.6 | ) | (17.2 | ) | ||||||
Interest expense | 1.4 | 1.3 | 1.0 | |||||||||
Other | (8.5 | ) | 1.7 | (0.4 | ) | |||||||
Adjusted earnings before interest, taxes, and depreciation and amortization (Adjusted EBITDA) | $ | 244.7 | $ | 239.4 | $ | 253.4 | ||||||
Critical accounting policies and estimates
The preparation of financial statements in conformity with accounting principles generally accepted in the United States of America (“U.S. GAAP”) requires us to make estimates and assumptions in certain circumstances that affect amounts reported in the accompanying combined financial statements and related footnotes. In preparing these combined financial statements, we have made our best estimates and judgments of certain amounts included in the combined financial statements giving due consideration to materiality. However, application of these
-44-
accounting policies involves the exercise of judgment and use of assumptions as to future uncertainties and, as a result, actual results could differ from these estimates. Although we have listed a number of accounting policies below which we believe to be most critical, we also believe that all of our accounting policies are important to the reader. Therefore, please refer also to the Notes to the Audited Combined Financial Statements for more detailed description of these and other accounting policies of MFS.
Basis of Presentation - The combined financial statements include the accounts of MFS and its subsidiaries as well as entities which were not previously subsidiaries but will form part of MFS. The initial accounts of MFS are based on the segmental accounts of the Foodservice segment within MTW’s consolidated accounts. The combined accounts also include the costs associated with shared functions, primarily corporate functions such as tax, treasury, internal audit, corporate accounting, reporting and controls, information technology, investor relations, human resources and legal. MTW has historically only allocated a portion of the costs associated with these shared functions to the segments, but not on a fully allocated basis. See “Corporate Expense Allocations” for details of the allocations.
The combined financial statements are prepared on a standalone basis and reflect the historical results of operations, financial position and cash flows of MFS in accordance with U.S. GAAP. The combined financial statements are presented as if MFS had been carved out of MTW for all periods presented. All significant transactions within MFS have been eliminated.
Corporate Expense Allocations - The combined financial statements include expense allocations for (1) corporate support functions that were provided on a centralized basis at MTW enterprise level including, but not limited to, finance, audit, legal, information technology, human resources, tax, treasury, investor relations, and external reporting; (2) share-based compensation; (3) employee compensation, pension and benefit costs; and (4) securitization financing costs. These expenses were allocated to MFS based on direct usage or direct identification where applicable, and where not applicable, such costs were allocated primarily based on net sales, headcount or based on existing allocation methods, specifically for those costs which have been previously partially allocated to MFS. Debt obligations of MTW, specifically those that relate to the enterprise senior notes, term loans and revolving credit facilities, have not been allocated to MFS as it was not an obligor nor a party to the obligations between MTW and the debt holders. Corresponding financing costs related to these debt obligations likewise were not allocated to MFS as it did not participate in these enterprise financing activities. See Note 23, "Net Parent Company Investment and Related Party Transactions," of the Audited Combined Financial Statements for additional discussions on expense allocations.
Management believes that the assumptions underlying the combined financial statements, including the assumptions regarding allocated expenses reasonably reflect the use of services provided to or the benefit received by MFS during the periods presented. Nevertheless, the combined financial statements may not include all of the actual expenses that would have been incurred by MFS and may not reflect our results of operations, financial position and cash flows had we been a standalone Company during the periods presented. Actual expenses that would have been incurred if MFS had been a standalone Company would depend on several factors, including but not limited to the standalone organizational structure and certain operational and strategic decisions in various areas like corporate infrastructure.
Revenue Recognition - Revenue is generally recognized and earned when all the following criteria are satisfied with regard to a specific transaction: persuasive evidence of an arrangement exists, the price is fixed and determinable, collectability of cash is reasonably assured, and delivery has occurred or services have been rendered.
Allowance for Doubtful Accounts - Accounts receivable are reduced by an allowance for amounts that may become uncollectible in the future. Our estimate for the allowance for doubtful accounts related to trade receivables includes evaluation of specific accounts where we have information that the customer may have an inability to meet its financial obligations together with a general provision for unknown but existing doubtful accounts based on historical experience, which are subject to change if experience improves or deteriorates.
Inventories and Related Reserve for Obsolete and Excess Inventory - Inventories are valued at the lower of cost or market using both the first-in, first-out (FIFO) method and the last-in, first-out (LIFO) method and are reduced by a reserve for excess and obsolete inventories. The estimated reserve is based upon specific identification of excess or obsolete inventories based on historical usage, estimated future usage, sales requiring the inventory, and on historical write-off experience and are subject to change if experience improves or deteriorates.
Goodwill, Other Intangible Assets and Other Long-Lived Assets - We account for goodwill and other intangible assets under the guidance of Accounting Standards Codification ("ASC") Subtopic 350-10, “Intangibles - Goodwill and Other.” Under ASC Subtopic 350-10, goodwill is not amortized; however, we perform an annual impairment review at June 30 of every year or more frequently if events or changes in circumstances indicate that the asset might be impaired. We perform impairment reviews for our reporting units, which we have determined to be: Americas, EMEA, and APAC. To perform our impairment review, we use a fair-value method, primarily the income approach, based on the present value of future cash flows, which involves management’s judgments and assumptions about the amounts of those cash flows and the discount rates used. The estimated fair value is then compared with the carrying amount of the reporting unit, including recorded goodwill. Goodwill and other intangible assets are then subject to risk of write-down to the extent that the carrying amount exceeds the estimated fair value.
We will continue to monitor market conditions and determine if any additional interim reviews of goodwill, other intangibles or long-lived assets are warranted. Deterioration in the market or actual results as compared with our projections may ultimately result in a future impairment. In the event we determine that assets are impaired in the future, we would need to recognize a non-cash impairment charge, which could have a material adverse effect on our combined balance sheet and results of operations.
We also review long-lived assets for impairment whenever events or changes in circumstances indicate that the assets carrying amount may not be recoverable. We conduct our long-lived asset impairment analyses in accordance with ASC Subtopic 360-10-5, “Property, Plant, and Equipment.” ASC Subtopic 360-10-5 requires us to group assets and liabilities at the lowest level for which identifiable cash flows are
-45-
largely independent of the cash flows of other assets and liabilities and to evaluate the asset group against the sum of the undiscounted future cash flows.
Other intangible assets with definite lives continue to be amortized over their estimated useful lives. Indefinite and definite lived intangible assets are also subject to impairment testing. Indefinite lived assets are tested annually, or more frequently if events or changes in circumstances indicate that the assets might be impaired. Definite lived intangible assets are tested whenever events or circumstances indicate that the carrying value of the assets may not be recoverable. A considerable amount of management judgment and assumptions are required in performing the impairment tests, principally in determining the fair value of the assets. While we believe our judgments and assumptions were reasonable, different assumptions could change the estimated fair values and, therefore, impairment charges could be required.
Employee Benefit Plans - We provide a range of benefits to our employees and retired employees, including pensions and postretirement health care coverage. Plan assets and obligations are recorded annually based on the Company’s measurement date utilizing various actuarial assumptions such as discount rates, expected return on plan assets, compensation increases, retirement and mortality rates, and health care cost trend rates as of that date. The approach we use to determine the annual assumptions are as follows:
• | Discount Rate - Our discount rate assumptions are based on the interest rate of noncallable high-quality corporate bonds, with appropriate consideration of our pension plans’ participants’ demographics and benefit payment terms. |
• | Expected Return on Plan Assets - Our expected return on plan assets assumptions are based on our expectation of the long-term average rate of return on assets in the pension funds, which is reflective of the current and projected asset mix of the funds and considers the historical returns earned on the funds. |
• | Compensation increase - Our compensation increase assumptions reflect our long-term actual experience, the near-term outlook and assumed inflation |
• | Retirement and Mortality Rates - Our retirement and mortality rate assumptions are based primarily on actual plan experience and mortality tables. |
• | Health Care Cost Trend Rates - Our health care cost trend rate assumptions are developed based on historical cost data, near-term outlook and an assessment of likely long-term trends. |
Measurements of net periodic benefit cost are based on the assumptions used for the previous year-end measurements of assets and obligations. We review our actuarial assumptions on an annual basis and make modifications to the assumptions when appropriate. As required by U.S. GAAP, the effects of the modifications are recorded currently or amortized over future periods. We have developed the assumptions with the assistance of our independent actuaries and other relevant sources, and we believe that the assumptions used are reasonable; however, changes in these assumptions could impact our financial position, results of operations or cash flows. Refer to Note 19, “Employee Benefit Plans,” of the Audited Combined Financial Statements for a summary of the impact of a 0.5% change in the discount rate and rate of return on plan assets and a 1% change on health care trend rates would have on our financial statements.
Product Liability - We are subject in the normal course of business to product liability lawsuits. To the extent permitted under applicable laws, our exposure to losses from these lawsuits is mitigated by insurance with self-insurance retention limits. We record product liability reserves for our self-insured portion of any pending or threatened product liability actions. Our reserve is based upon two estimates. First, we track the population of all outstanding pending and threatened product liability cases to determine an appropriate case reserve for each based upon our best judgment and the advice of legal counsel. These estimates are continually evaluated and adjusted based upon changes to the facts and circumstances surrounding the case. Second, we determine the amount of additional reserve required to cover incurred but not reported product liability issues and to account for possible adverse development of the established case reserves (collectively referred to as "IBNR"). This analysis is performed at least twice annually. We have established a position within the actuarially determined range, which we believe is the best estimate of the IBNR liability.
Income Taxes - We account for income taxes under the guidance of ASC Subtopic 740-10, “Income Taxes.” Deferred tax assets and liabilities are recognized for the future tax consequences attributable to differences between financial statement carrying amounts of existing assets and liabilities and their respective tax bases and operating loss and tax credit carryforwards. Deferred tax assets and liabilities are measured using enacted tax rates expected to apply to taxable income in the years in which those temporary differences are expected to be recovered or settled. We record a valuation allowance that represents a reserve on deferred tax assets for which utilization is not more likely than not. Management judgment is required in determining our provision for income taxes, deferred tax assets and liabilities, and the valuation allowance recorded against our net deferred tax assets. We do not currently provide for additional U.S. and foreign income taxes which would become payable upon repatriation of undistributed earnings of foreign subsidiaries.
We measure and record income tax contingency accruals under the guidance of ASC Subtopic 740-10. We recognize liabilities for uncertain income tax positions based on a two-step process. The first step is to evaluate the tax position for recognition by determining if the weight of available evidence indicates that it is more likely than not that the position will be sustained on audit, including resolution of related appeals or litigation processes, if any. The second step requires us to estimate and measure the tax benefit as the largest amount that is more than 50% likely to be realized upon ultimate settlement. It is inherently difficult and subjective to estimate such amounts, as we must determine the probability of various possible outcomes. We reevaluate these uncertain tax positions on a quarterly basis or when new information becomes available to management. These reevaluations are based on factors including, but not limited to, changes in facts or circumstances, changes in
-46-
tax law, successfully settled issues under audit, expirations due to statutes, and new audit activity. Such a change in recognition or measurement could result in the recognition of a tax benefit or an increase to the tax accrual.
Stock-Based Compensation - The computation of the expense associated with stock-based compensation requires the use of certain valuation models and based on projected achievement of underlying performance criteria for performance shares. We currently use a Black-Scholes option pricing model to calculate the fair value of our stock options and Monte Carlo analysis to calculate the total shareholder return portion of performance shares. The Black-Scholes and Monte Carlo models require assumptions regarding the volatility of the Company’s stock, the expected life of the stock award and the Company’s dividend ratio. We primarily use historical data to determine the assumptions to be used in the Black-Scholes model and have no reason to believe that future data is likely to differ materially from historical data. However, changes in the assumptions to reflect future stock price volatility, future dividend payments and future stock award exercise experience could result in a change in the assumptions used to value awards in the future and may result in a material change to the fair value calculation of stock-based awards.
Warranties - In the normal course of business, we provide our customers warranties covering workmanship, and in some cases materials, on products manufactured by us. Such warranties generally provide that products will be free from defects for periods ranging from 12 months to 60 months with certain equipment having longer-term warranties. If a product fails to comply with our warranty, we may be obligated, at our expense, to correct any defect by repairing or replacing such defective product. We provide for an estimate of costs that may be incurred under our warranty at the time product revenue is recognized based on historical warranty experience for the related product or estimates of projected losses due to specific warranty issues on new products. These costs primarily include labor and materials, as necessary, associated with repair or replacement. The primary factors that affect our warranty liability include the number of shipped units and historical and anticipated rates or warranty claims. As these factors are impacted by actual experience and future expectations, we assess the adequacy of our recorded warranty liability and adjust the amounts as necessary.
Restructuring Charges - Restructuring charges for exit and disposal activities are recognized when the liability is incurred. The Company accounts for restructuring charges under the guidance of ASC Subtopic 420-10, “Exit or Disposal Cost Obligations.” The liability for the restructuring charge associated with an exit or disposal activity is measured initially at its fair value.
Recent Accounting Changes and Pronouncements
On February 25, 2016, the FASB issued ASU No. 2016-02, “Leases (Topic 842)” which requires lessees to recognize right-of-use assets and lease liability, initially measured at present value of the lease payments, on its balance sheet for leases with terms longer than 12 months and classified as either financing or operating leases. ASU 2016-02 requires a modified retrospective transition approach for capital and operating leases existing at, or entered into after, the beginning of the earliest comparative period presented in the financial statements, and provides certain practical expedients that companies may elect. ASU 2016-02 is effective for public companies for fiscal years beginning after December 15, 2018, including interim periods within those fiscal years. We are currently evaluating the effects that the adoption of ASU 2016-02 will have on our consolidated financial statements.
In January 2016, the FASB issued Accounting Standards Update (“ASU”) No. 2016-01, “Financial Instruments (Subtopic 825-10) - Recognition and Measurement of Financial Assets and Financial Liabilities.” This update provides guidance for the recognition, measurement, presentation, and disclosure of financial instruments. This guidance is effective for annual and interim periods beginning after December 15, 2017, and early adoption is not permitted. The Company is evaluating the impact, if any, the adoption of this ASU will have on the Company’s consolidated financial statements.
In November 2015, the FASB issued ASU No. 2015-17, "Balance Sheet Classification of Deferred Taxes (Subtopic 740-10)." ASU 2015-17 simplifies the presentation of deferred income taxes by eliminating the requirement for companies to present deferred tax liabilities and assets as current and non-current on the balance sheet. Instead, companies will be required to classify all deferred tax assets and liabilities as non-current. This guidance is effective for annual and interim periods beginning after December 15, 2016 and early adoption is permitted. We early adopted this ASU on a prospective basis as of December 31, 2015. Prior periods were not retrospectively adjusted.
In September 2015, the FASB issued ASU No. 2015-16, “Business Combinations (Topic 805) - Simplifying the Accounting for Measurement-Period Adjustments.” The amendments in this ASU require that an acquirer in a business combination recognize adjustments to provisional amounts that are identified during the measurement period in the reporting period in which the adjustment amounts are determined, rather than as retrospective adjustments. The amendments in this ASU are effective for fiscal years beginning after December 15, 2015, including interim periods within those fiscal years. The amendments in this ASU should be applied prospectively to adjustments to provisional amounts that occur after the effective date of this ASU with earlier application permitted for financial statements that have not been issued. We believe the adoption of this ASU will not have a material impact on our combined financial statements.
In August 2015, the FASB issued ASU No. 2015-15, “Presentation and Subsequent Measurement of Debt Issuance Costs Associated with Line-of-Credit Arrangements.” This ASU clarifies the guidance related to accounting for debt issuance costs related to line-of-credit arrangements. In April 2015, the FASB issued ASU 2015-03 which requires entities to present debt issuance costs related to a recognized debt liability as a direct deduction from the carrying amount of that debt liability; see further discussion of ASU 2015-03 below. The guidance in ASU 2015-03 did not address presentation or subsequent measurement of debt issuance costs related to line-of-credit arrangements. Given the absence of authoritative guidance within ASU 2015-03 for debt issuance costs related to line-of-credit arrangements, the SEC staff would not object to an entity deferring and presenting debt issuance costs as an asset and subsequently amortizing the deferred debt issuance costs ratably over the term of the line-of-credit arrangement, regardless of whether there are any outstanding borrowings on the line-of-credit arrangement. This ASU will be effective beginning in the interim period ended March 31, 2016 and will not affect the prior periods presented.
-47-
In July 2015, the FASB issued Accounting Standards Update (“ASU”) No. 2015-11, “Inventory (Topic 330): Simplifying the Measurement of Inventory.” This update changes the guidance on accounting for inventory accounted for on a first-in first-out basis (FIFO). Under the revised standard, an entity should measure FIFO inventory at the lower of cost and net realizable value. Net realizable value is the estimated selling prices in the ordinary course of business, less reasonably predictable costs of completion, disposal, and transportation. Subsequent measurement is unchanged for inventory measured on a last-in, first-out basis (LIFO). The amendments in this ASU are effective for fiscal years, and for interim periods within those fiscal years, beginning after December 15, 2016. We believe the adoption of this ASU will not have a material impact on our combined financial statements.
In April 2015, the FASB issued ASU No. 2015-05, “Customer’s Accounting for Fees Paid in a Cloud Computing Arrangement.” This update provides guidance on accounting for a software license in a cloud computing arrangement. If a cloud computing arrangement includes a software license, then the customer should account for the software license element of the arrangement consistent with the acquisition of other software licenses. If a cloud computing arrangement does not include a software license, the customer should account for the arrangement as a service contract. Further, all software licenses are within the scope of Accounting Standards Codification Subtopic 350-40 and will be accounted for consistent with other licenses of intangible assets. The amendments in this ASU are effective for fiscal years, and for interim periods within those fiscal years, beginning after December 15, 2015. We believe the adoption of this ASU will not have a material impact on our combined financial statements.
In April 2015, the FASB issued ASU No. 2015-03, “Simplifying the Presentation of Debt Issuance Costs.” To simplify the presentation of debt issuance costs, this update requires that debt issuance costs related to a recognized debt liability be presented in the balance sheet as a direct deduction from the carrying amount of that debt liability, consistent with debt discounts, rather than as a deferred asset. The recognition and measurement guidance for debt issuance costs are not affected by the amendments in this update. The amendments in this ASU are effective for fiscal years, and for interim periods within those fiscal years, beginning after December 15, 2015, with early application permitted. This ASU will be effective beginning in the interim period ended March 31, 2016 and will not affect the prior periods presented.
In February 2015, the FASB issued ASU No. 2015-02, “Consolidation (Topic 820)-Amendments to the Consolidation Analysis.” This update amends the current consolidation guidance for both the variable interest entity (VIE) and voting interest entity (VOE) consolidation models. The amendments in this ASU are effective for fiscal years, and for interim periods within those fiscal years, beginning after December 15, 2015. We believe the adoption of this ASU will not have a material impact on our combined financial statements.
In January 2015, the FASB issued ASU No. 2015-01, “Income Statement-Extraordinary and Unusual Items.” This update eliminates from GAAP the concept of extraordinary items. ASU 2015-01 is effective for the first interim period within fiscal years beginning after December 15, 2015, with early adoption permitted provided that the guidance is applied from the beginning of the fiscal year of adoption. A reporting entity may apply the amendments prospectively or retrospectively to all prior periods presented in the financial statements. We believe the adoption of this ASU will not have a material impact on our combined financial statements.
In August 2014, the FASB issued ASU No. 2014-15, “Presentation of Financial Statements-Going Concern.” This update provided guidance on management’s responsibility in evaluating whether there is substantial doubt about a company’s ability to continue as a going concern and to provide related footnote disclosures. ASU 2014-15 is effective in the first annual period ending after December 15, 2016, with early adoption permitted. We believe the adoption of this ASU will not have a material impact on our combined financial statements.
In May 2014, the FASB issued ASU No. 2014-09, “Revenue from Contracts with Customers.” This update provided a principles-based approach to revenue recognition to depict the transfer of goods or services to customers in an amount that reflects the consideration to which the entity expects to be entitled in exchange for those goods or services. This ASU provides a five-step model to be applied to all contracts with customers. The five steps are to identify the contract(s) with the customer, identify the performance obligations in the contact, determine the transaction price, allocate the transaction price to the performance obligations in the contract and recognize revenue when each performance obligation is satisfied. The revenue standard is effective for the first interim period within fiscal years beginning after December 15, 2017 (as finalized by the FASB in August 2015 in ASU 2015-14), and can be applied either retrospectively to each prior reporting period presented or retrospectively with the cumulative effect of initially applying the update recognized at the date of initial application along with additional disclosures. Early adoption is permitted as of the original effective date-the first interim period within fiscal years beginning after December 15, 2016. We are evaluating the impact, if any, the adoption of this ASU will have on our combined financial statements.
In April 2014, the FASB issued ASU No. 2014-08, “Presentation of Financial Statements and Property, Plant, and Equipment: Reporting Discontinued Operations and Disclosures of Disposals of Components of an Entity.” This ASU changes the requirements for reporting discontinued operations in Accounting Standards Codification Subtopic 205-20, and now requires a disposal of a component of an entity or a group of components of an entity to be reported in discontinued operations only if the disposal represents a strategic shift that has (or will have) a major effect on an entity’s operations and financial results. There will also be additional disclosures required. The amendments in this ASU are effective prospectively for fiscal years (and interim reporting periods within those years) beginning after December 15, 2014. The significance of this guidance for us is dependent on any future disposals.
Cautionary Statements about Forward-Looking Information
Statements in this report and in other Company communications that are not historical facts are forward-looking statements, which are based upon our current expectations, within the meaning of the Private Securities Litigation Reform Act of 1995.
These statements involve risks and uncertainties that could cause actual results to differ materially from what appears within this quarterly report.
-48-
Forward-looking statements include descriptions of plans and objectives for future operations, and the assumptions behind those plans. The words “anticipates,” “believes,” “intends,” “estimates,” “targets,” “expects,” "could," "will," "may" or similar expressions, usually identify forward-looking statements. Any and all projections of future performance are forward-looking statements.
In addition to the assumptions, uncertainties, and other information referred to specifically in the forward-looking statements, a number of factors relating to each business segment could cause actual results to be significantly different from what is presented in this Annual Report on Form 10-K. Those factors include, without limitation, the following:
• | the impact of our separation from MTW and risks relating to our ability to operate effectively as an independent, publicly traded company; |
• | efficiencies and capacity utilization of facilities; |
• | issues relating to the ability to timely and efficiently execute on manufacturing strategies, including issues relating to new plant start-ups, plant closings, workforce reductions or ramp-ups, and/or consolidations of existing facilities and operations; |
• | our failure to retain our executive management team and to attract qualified new personnel; |
• | realization of anticipated earnings enhancements, cost savings, strategic options and other synergies, and the anticipated timing to realize those enhancements, savings, synergies, and options; |
• | availability of certain raw materials; |
• | growth of general and administrative expenses, including health care and postretirement costs; |
• | changes in raw materials prices, commodity prices and hedges in place; |
• | actions of competitors, including competitive pricing; |
• | the successful development of innovative products and market acceptance of new and innovative products; |
• | the ability to focus and capitalize on product quality and reliability; |
• | unexpected issues associated with the quality of materials and components sourced from third parties and resolution of those issues; |
• | unanticipated issues associated with refresh/renovation plans by national restaurant accounts and global chains; |
• | consumer demand for products from the quick-service restaurant chains and kiosks; |
• | growth in demand for foodservice equipment by customers in emerging markets; |
• | global expansion of customers; |
• | changes in the markets we serve; |
• | unanticipated changes in consumer spending; |
• | unfavorable outcomes in product liability lawsuits, or an increase in the volume of product liability lawsuits; |
• | unexpected costs incurred in protecting our intellectual property; |
• | weather; |
• | changes in domestic and international economic and industry conditions; |
• | work stoppages, labor negotiations, rates and temporary labor; |
• | the availability of local suppliers and skilled labor; |
• | unanticipated changes in capital and financial markets; |
• | changes in the interest rate environment; |
• | pressure of financing leverage; |
• | compliance with debt covenants and maintenance of credit ratings as well as the impact of interest and principal repayment of our debt obligations; |
• | foreign currency fluctuations and their impact on reported results and hedges in place; |
• | unexpected issues affecting our effective tax rate, including, but not limited to, global tax policies, tax reform, and tax legislation; |
• | unanticipated issues associated with the resolution or settlement of uncertain tax positions or unfavorable resolution of tax audits; |
• | the tax treatment of the Distribution and the restrictions on post-Distribution activities imposed on MFS under the Tax Matters Agreement with MTW in order to preserve the tax-free treatment of the Spin-Off; |
• | actions of activist shareholders; |
• | costs associated with unanticipated environmental liabilities; |
• | risks associated with data security and technology systems and protections; |
• | world-wide political risk; |
• | natural disasters disrupting commerce in one or more regions of the world; |
• | acts of terrorism; |
• | geographic factors and economic risks; |
• | changes in laws and regulations, as well as their enforcement, throughout the world; |
• | changes in the costs of compliance with laws regarding trade, export controls and foreign corrupt practices; |
• | foodservice equipment replacement cycles in the U.S. and other mature markets; |
• | the ability to compete and appropriately integrate, and/or transition, restructure and consolidate acquisitions, divestures, strategic alliances, joint ventures and other strategic alternatives and otherwise capitalize on key strategic opportunities; |
-49-
• | in connection with acquisitions, divestitures, strategic alliances and joint ventures, the finalization of the price and other terms, the realization of contingencies consistent with any established reserves, and unanticipated issues associated with transitional services; and |
• | other events outside our control. |
-50-
Item 7A. QUANTITATIVE AND QUALITATIVE DISCLOSURES ABOUT MARKET RISK
Financial Risk Management
We are exposed to market risks from changes in commodities and changes in foreign currency exchange rates. To reduce these risks, we selectively use derivative financial instruments and other proactive management techniques. We have policies and procedures that place financial instruments under the direction of corporate finance and restrict all derivative transactions to those intended for hedging purposes only. The use of financial instruments for trading purposes or speculation is strictly prohibited.
For a more detailed discussion of our accounting policies and the financial instruments that we use, please refer to Note 2, “Summary of Significant Accounting Policies,” and Note 6, “Derivative Financial Instruments,” to the Audited Combined Financial Statements.
Commodity Price Risk
We are exposed to fluctuating market prices for commodities, including steel, nickel, copper, aluminum, and natural gas. We have established programs to manage the negotiations of commodity prices. In addition to the regular negotiations of material prices with certain vendors, our customer contracts generally provide that we may recover increases in the cost of our commodity inputs by increasing our prices with at least 60-days advance notice. We also routinely enter into certain commodity hedges that fix the price of certain of our key commodities utilized in the production of our product offerings. Commodities that are hedged include copper, aluminum, certain steel inputs and natural gas. At December 31, 2015, $0.8 million of unrealized losses due to commodity hedging positions remain deferred in accumulated other comprehensive income and will be realized as a component of cost of sales over the next 12 months. As of December 31, 2015, we had open commodity derivatives that qualify for hedge accounting with aggregate notional values of 1,215 metric tons of aluminum, 472 metric tons of copper, 49,396 million BTU of natural gas, and 11,073 short tons of steel, and no open commodity derivatives that did not qualify for hedge accounting. See Note 6, “Derivative Financial Instruments,” to the Audited Combined Financial Statements.
Historically, we have not experienced material reductions in our margins as a result of increases in commodity prices. However, to the extent that our hedging is not successful in fixing commodity prices that are favorable in comparison to market prices at the time of purchase and we cannot or do not pass along increased commodity prices to our customers, we would experience a negative impact on our profit margins.
Currency Price Risk
We have manufacturing, sales and distribution facilities around the world and thus make investments and enter into transactions denominated in various foreign currencies. Non-U.S. sales were approximately 32% of our total sales for 2015, with the largest percentage (15%) being sales into various European countries.
Regarding transactional foreign exchange risk, we enter into limited forward exchange contracts to 1) reduce the impact of changes in foreign currency rates between a budgeted rate and the rate realized at the time we recognize a particular purchase or sale transaction and 2) reduce the earnings and cash flow impact on nonfunctional currency denominated receivables and payables. Gains and losses resulting from hedging instruments either impact our combined statements of operations in the period of the underlying purchase or sale transaction, or offset the foreign exchange gains and losses on the underlying receivables and payables being hedged. The maturities of these forward exchange contracts coincide with either the underlying transaction date or the settlement date of the related cash inflow or outflow. The hedges of anticipated transactions are designated as cash flow hedges under the guidance of Accounting Standards Codification (“ASC”) Subtopic 815-10, “Derivatives and Hedging.” At December 31, 2015, we had outstanding forward exchange contracts hedging anticipated transactions and future settlements of outstanding accounts receivable and accounts payable with a market value of a $0.1 million of unrealized losses. A 10% appreciation or depreciation of the underlying functional currency at December 31, 2015 for non-designated hedges of foreign exchange contracts would not have a significant impact on our combined statements of operations as any gains or losses under the foreign exchange contracts hedging accounts receivable or payable balances would be offset by equal gains or losses on the underlying receivables or payables. A 10% appreciation or depreciation of the underlying functional currency at December 31, 2015 for foreign exchange contracts designated as cash flow hedges could have an impact of approximately $0.3 million on the date of settlement.
Amounts invested in non-U.S. based subsidiaries are translated into U.S. dollars at the exchange rate in effect at year-end. Results of operations are translated into U.S. dollars at an average exchange rate for the period. The resulting translation adjustments are recorded in stockholders’ equity as cumulative translation adjustments. The translation adjustment recorded in accumulated other comprehensive loss at December 31, 2015 was a loss of $7.9 million.
-51-
Item 8. FINANCIAL STATEMENTS AND SUPPLEMENTARY DATA
Index to Combined Financial Statements and Financial Statement Schedule:
Financial Statements: | ||
Financial Statement Schedule: | ||
All other schedules are omitted because they are not applicable or the required information is shown in the financial statements or notes thereto.
-52-
Report of Independent Registered Public Accounting Firm
To the Stockholders and Board of Directors of Manitowoc Foodservice, Inc.:
In our opinion, the accompanying combined balance sheets and the related combined statements of operations, comprehensive income, cash flows, and equity present fairly, in all material respects, the financial position of Manitowoc Foodservice, Inc. at December 31, 2015 and 2014, and the results of their operations and their cash flows for each of the three years in the period ended December 31, 2015, in conformity with the accounting principles generally accepted in the United States of America. In addition, in our opinion, the financial statement schedule listed in the index appearing under Item 15(a) (2) presents fairly, in all material respects, the information set forth therein when read in conjunction with the related combined financial statements. These financial statements and financial statement schedule are the responsibility of the Company's management. Our responsibility is to express an opinion on these financial statements and financial statement schedule based on our audits. We conducted our audits of these statements in accordance with the standards of the Public Company Accounting Oversight Board (United States). Those standards require that we plan and perform the audit to obtain reasonable assurance about whether the financial statements are free of material misstatement. An audit includes examining, on a test basis, evidence supporting the amounts and disclosures in the financial statements, assessing the accounting principles used and significant estimates made by management, and evaluating the overall financial statement presentation. We believe that our audits provide a reasonable basis for our opinion.
As discussed in Note 2, "Summary of Significant Accounting Policies," to the accompanying combined financial statements, the Company changed the manner in which it classifies deferred taxes in 2015.
/s/ PricewaterhouseCoopers LLP | |
Milwaukee, Wisconsin | |
March 30, 2016 | |
-53-
MANITOWOC FOODSERVICE
Combined Statements of Operations
For the years ended December 31, 2015, 2014, and 2013
Millions of dollars, except per share data | 2015 | 2014 | 2013 | |||||||||
Net sales | $ | 1,570.1 | $ | 1,581.3 | $ | 1,541.8 | ||||||
Cost of sales | 1,068.4 | 1,073.3 | 1,030.9 | |||||||||
Gross profit | 501.7 | 508.0 | 510.9 | |||||||||
Selling, general and administrative expenses | 291.6 | 299.6 | 289.7 | |||||||||
Other operating expenses | 50.2 | 35.9 | 33.5 | |||||||||
Earnings before interest and taxes from continuing operations | 159.9 | 172.5 | 187.7 | |||||||||
Interest expense | (1.4 | ) | (1.3 | ) | (1.0 | ) | ||||||
Interest income on notes with MTW - net | 15.8 | 16.6 | 17.2 | |||||||||
Other income (expense) - net | 22.0 | (0.6 | ) | 0.7 | ||||||||
Earnings from continuing operations before income taxes | 196.3 | 187.2 | 204.6 | |||||||||
Income taxes | 39.3 | 25.9 | 55.3 | |||||||||
Net earnings from continuing operations | 157.0 | 161.3 | 149.3 | |||||||||
Discontinued operations: | ||||||||||||
Earnings (loss) from discontinued operations, net of income taxes of $0.1, $(0.3), and $(1.0), respectively | 0.1 | (0.4 | ) | (0.5 | ) | |||||||
Loss on sale of discontinued operations, net of income taxes of $0.0, $(0.6) and $4.4, respectively | — | (1.1 | ) | (2.7 | ) | |||||||
Net earnings | $ | 157.1 | $ | 159.8 | $ | 146.1 | ||||||
Per Share Data (1) | ||||||||||||
Basic and diluted earnings per common share: | ||||||||||||
Earnings from continuing operations | $ | 1.15 | $ | 1.18 | $ | 1.09 | ||||||
Loss from discontinued operations | — | — | — | |||||||||
Loss on sale of discontinued operations | — | (0.01 | ) | (0.02 | ) | |||||||
Basic and diluted net earnings per share | $ | 1.15 | $ | 1.17 | $ | 1.07 | ||||||
(1) On March 4, 2015, MTW distributed 137.0 million shares of MFS common stock to MTW shareholders in connection with its spin-off of MFS. Basic and diluted earnings per common share and the average number of common shares outstanding were retrospectively restated for the number of MFS shares outstanding immediately following this transaction. As described in Note 1 "Description of the Business and Basis of Presentation," our combined financial statements may not be indicative of MFS' future performance and do not necessarily include all the of the actual expenses that would have been incurred by MFS (including, but not limited to, interest expense related to the debt financing described in Note 25 "Subsequent Events") and may not reflect the results of operations had MFS been a standalone company during the periods presented. See Note 24, "Earnings Per Share" in the Combined Financial Statements for more information.
The accompanying notes are an integral part of these financial statements.
-54-
MANITOWOC FOODSERVICE
Combined Statements of Comprehensive Income
For the years ended December 31, 2015, 2014, and 2013
Millions of dollars | 2015 | 2014 | 2013 | |||||||||
Net earnings | $ | 157.1 | $ | 159.8 | $ | 146.1 | ||||||
Other comprehensive (loss) income, net of tax | ||||||||||||
Foreign currency translation adjustments | (25.2 | ) | (16.9 | ) | 2.6 | |||||||
Unrealized (loss) on derivatives, net of income taxes of $0.5, $0.2, and $0.0, respectively | (0.8 | ) | (0.6 | ) | (0.2 | ) | ||||||
Employee pension and post-retirement benefits, net of income taxes of $0.0, $0.3, and $(0.6), respectively | 2.2 | (4.4 | ) | 5.6 | ||||||||
Total other comprehensive (loss) income, net of tax | (23.8 | ) | (21.9 | ) | 8.0 | |||||||
Comprehensive income | $ | 133.3 | $ | 137.9 | $ | 154.1 | ||||||
The accompanying notes are an integral part of these financial statements.
-55-
MANITOWOC FOODSERVICE
Combined Balance Sheets
As of December 31, 2015 and 2014
Millions of dollars | 2015 | 2014 | ||||||
Assets | ||||||||
Current Assets: | ||||||||
Cash and cash equivalents | $ | 32.0 | $ | 16.5 | ||||
Restricted cash | 0.6 | — | ||||||
Accounts receivable, less allowances of $4.0 and $3.9, respectively | 63.8 | 71.0 | ||||||
Inventories — net | 145.9 | 163.2 | ||||||
Deferred income taxes | — | 23.7 | ||||||
Prepaids and other current assets | 10.3 | 15.1 | ||||||
Total current assets | 252.6 | 289.5 | ||||||
Property, plant and equipment — net | 116.4 | 134.3 | ||||||
Goodwill | 845.8 | 872.8 | ||||||
Other intangible assets — net | 519.6 | 584.5 | ||||||
Other non-current assets | 15.9 | 17.2 | ||||||
Long-term assets held for sale | 3.7 | — | ||||||
Total assets | $ | 1,754.0 | $ | 1,898.3 | ||||
Liabilities and Shareholders' Equity: | ||||||||
Current Liabilities: | ||||||||
Accounts payable | 129.0 | 166.7 | ||||||
Accrued expenses and other liabilities | 157.6 | 165.4 | ||||||
Current portion of capital leases | 0.4 | 0.5 | ||||||
Product warranties | 34.3 | 36.0 | ||||||
Total current liabilities | 321.3 | 368.6 | ||||||
Long-term capital leases | 2.3 | 3.6 | ||||||
Deferred income taxes | 167.9 | 218.0 | ||||||
Pension and postretirement health obligations | 33.3 | 36.4 | ||||||
Other long-term liabilities | 20.5 | 20.3 | ||||||
Total non-current liabilities | 224.0 | 278.3 | ||||||
Commitments and contingencies (Note 16) | ||||||||
Total Equity: | ||||||||
Net parent company investment | 1,253.2 | 1,272.1 | ||||||
Accumulated other comprehensive loss | (44.5 | ) | (20.7 | ) | ||||
Total equity | 1,208.7 | 1,251.4 | ||||||
Total liabilities and equity | $ | 1,754.0 | $ | 1,898.3 | ||||
The accompanying notes are an integral part of these financial statements.
-56-
MANITOWOC FOODSERVICE
Combined Statements of Cash Flows
For the years ended December 31, 2015, 2014, and 2013
Millions of dollars | 2015 | 2014 | 2013 | |||||||||
Cash Flows From Operations | ||||||||||||
Net earnings | $ | 157.1 | $ | 159.8 | $ | 146.1 | ||||||
Adjustments to reconcile net earnings to cash provided by operating activities of continuing operations: | ||||||||||||
Asset impairments | 9.0 | 1.1 | — | |||||||||
Discontinued operations, net of income taxes | (0.1 | ) | 0.4 | 0.5 | ||||||||
Depreciation | 19.6 | 21.2 | 20.0 | |||||||||
Amortization of intangible assets | 31.4 | 31.8 | 31.4 | |||||||||
Deferred income taxes | (30.0 | ) | (17.5 | ) | (9.6 | ) | ||||||
Loss on sale of property, plant, and equipment | 0.9 | 0.3 | 0.7 | |||||||||
Gain on acquisitions and divestitures | (14.8 | ) | — | — | ||||||||
Loss on sale of discontinued operations | — | 1.1 | 2.7 | |||||||||
Other | 2.3 | 2.4 | 3.6 | |||||||||
Changes in operating assets and liabilities, excluding the effects of business acquisitions or dispositions: | ||||||||||||
Accounts receivable | (7.5 | ) | (0.3 | ) | (3.2 | ) | ||||||
Inventories | 4.7 | (23.8 | ) | (8.8 | ) | |||||||
Other assets | 1.4 | (1.3 | ) | (5.7 | ) | |||||||
Accounts payable | (25.6 | ) | 21.2 | 17.0 | ||||||||
Accrued expenses and other liabilities | (5.5 | ) | 4.2 | 9.6 | ||||||||
Net cash provided by operating activities of continuing operations | 142.9 | 200.6 | 204.3 | |||||||||
Net cash provided by (used for) operating activities of discontinued operations | 0.1 | (0.4 | ) | (2.4 | ) | |||||||
Net cash provided by operating activities | 143.0 | 200.2 | 201.9 | |||||||||
Cash Flows From Investing | ||||||||||||
Capital expenditures | (13.2 | ) | (25.3 | ) | (33.6 | ) | ||||||
Proceeds from sale of property, plant and equipment | — | — | 1.6 | |||||||||
Restricted cash | (0.6 | ) | — | — | ||||||||
Business acquisitions, net of cash acquired | (5.3 | ) | — | (12.2 | ) | |||||||
Proceeds from sale of business | 78.2 | — | 0.7 | |||||||||
Net cash provided by (used for) investing activities of continuing operations | 59.1 | (25.3 | ) | (43.5 | ) | |||||||
Net cash provided by investing activities of discontinued operations | — | — | 0.6 | |||||||||
Net cash provided by (used for) investing activities | 59.1 | (25.3 | ) | (42.9 | ) | |||||||
Cash Flows From Financing | ||||||||||||
Payments on capital leases | (0.7 | ) | (3.4 | ) | (2.9 | ) | ||||||
Proceeds from capital leases | 0.5 | 3.1 | 3.4 | |||||||||
Net transactions with MTW | (182.9 | ) | (166.7 | ) | (171.5 | ) | ||||||
Net cash used for financing activities | (183.1 | ) | (167.0 | ) | (171.0 | ) | ||||||
Effect of exchange rate changes on cash | (3.5 | ) | (1.0 | ) | (0.6 | ) | ||||||
Net increase (decrease) in cash and cash equivalents | 15.5 | 6.9 | (12.6 | ) | ||||||||
Balance at beginning of year | 16.5 | 9.6 | 22.2 | |||||||||
Balance at end of year | $ | 32.0 | $ | 16.5 | $ | 9.6 | ||||||
Supplemental Cash Flow Information | ||||||||||||
Income taxes paid | $ | 13.2 | $ | 13.2 | $ | 15.9 | ||||||
The accompanying notes are an integral part of these financial statements.
-57-
MANITOWOC FOODSERVICE
Combined Statements of Equity
For the years ended December 31, 2015, 2014 and 2013
Millions of dollars | 2015 | 2014 | 2013 | |||||||||
Net Parent Company Investment | ||||||||||||
Balance at beginning of year | $ | 1,272.1 | $ | 1,267.2 | $ | 1,303.5 | ||||||
Net earnings | 157.1 | 159.8 | 146.1 | |||||||||
Net decrease in net parent company investment | (176.0 | ) | (154.9 | ) | (182.4 | ) | ||||||
Balance at end of year | $ | 1,253.2 | $ | 1,272.1 | $ | 1,267.2 | ||||||
Accumulated Other Comprehensive (Loss) Income | ||||||||||||
Balance at beginning of year | $ | (20.7 | ) | $ | 1.2 | $ | (6.8 | ) | ||||
Other comprehensive (loss) income | (23.8 | ) | (21.9 | ) | 8.0 | |||||||
Balance at end of year | $ | (44.5 | ) | $ | (20.7 | ) | $ | 1.2 | ||||
Total equity | $ | 1,208.7 | $ | 1,251.4 | $ | 1,268.4 | ||||||
The accompanying notes are an integral part of these financial statements.
-58-
MANITOWOC FOODSERVICE
Notes to Combined Financial Statements
For the Years Ended December 31, 2015, 2014, and 2013
1. Description of the Business and Basis of Presentation
The Spin-Off
On January 29, 2015, The Manitowoc Company, Inc. (“MTW”) announced plans to create two independent public companies to separately operate its two businesses: its Crane business and its Foodservice business. To effect the separation, MTW first undertook an internal reorganization, following which MTW held the Crane business, and Manitowoc Foodservice, Inc. ("MFS") held the Foodservice business. Then on March 4, 2016, MTW distributed all of our common stock to MTW’s shareholders on a pro rata basis, and MFS became an independent publicly traded company (the “Distribution”). As used in this Annual Report on Form 10-K, “Spin-Off” refers to both the above described internal reorganization and Distribution, collectively.
In these combined financial statements, unless the context otherwise requires:
• | "MFS," the "Company," "we," "our" and "us" refer to Manitowoc Foodservice, Inc. and its combined subsidiaries, after giving effect to the internal reorganization and the distribution, or, in the case of information as of dates or for periods prior to our separation from MTW, the combined entities of the Foodservice business, and certain other assets and liabilities that were historically held at the MTW corporate level, but were specifically identifiable and attributable to the Foodservice business; and |
• | "MTW" refers to The Manitowoc Company, Inc. and its consolidated subsidiaries, other than, for all periods following the Spin-Off, MFS. |
• | "Spin-Off" refers to both the above described internal reorganization and distribution, collectively. |
Nature of the Business
MFS is among the world’s most preferred and innovative commercial foodservice equipment companies. It designs, manufactures, and services an integrated portfolio of hot and cold category products. We have one of the industry’s broadest portfolios of products that create optimal value for our channel partners while delivering superior performance, quality, reliability, and durability for our customers. Our capabilities span refrigeration, ice-making, cooking, holding, food-preparation, and beverage-dispensing technologies, and allow us to equip entire commercial kitchens and serve the world’s growing demand for food prepared away from home. We supply foodservice equipment to commercial and institutional foodservice operators such as full-service restaurants, quick-service restaurant chains, hotels, caterers, supermarkets, convenience stores, business and industry, hospitals, schools and other institutions.
Basis of Presentation
The accompanying combined financial statements have been prepared in accordance with accounting principles generally accepted in the United States (“U.S. GAAP”), and derived from the consolidated financial statements and accounting records of MTW. The accompanying combined financial statements include the historical cost basis of assets, liabilities, revenues, and expenses of the individual entities that comprise MTW's historical Foodservice segment, in addition to a corporate entity which historically supported Foodservice operations. All intercompany balances and transactions within MFS and its affiliates have been eliminated. However, interest income and expense related to the notes with MTW have been reflected on a net basis within the combined statement of operations as described in Note 23, "Net Parent Company Investment and Related Party Transactions."
As the separate legal entities that comprise MFS were not historically held by a single legal entity, Net Parent Company Investment is shown in lieu of shareholder’s equity in these combined financial statements. Balances between MFS and MTW (including its Crane business) that were not historically settled in cash are included in Net Parent Company Investment. Net Parent Company Investment represents MTW's interest in the recorded assets of MFS and represents the cumulative investment by MTW in MFS through the dates presented, inclusive of operating results.
During the periods presented, MFS functioned as part of the larger group of companies controlled by MTW, accordingly, MTW performed certain corporate overhead functions for MFS. Therefore, certain costs related to MFS have been allocated from MTW. These allocated costs are primarily related to: 1) corporate officers, 2) employee benefits and compensation, 3) share-based compensation, and 4) certain administrative functions, which are not provided at the business level including, but not limited to, finance, treasury, tax, audit, legal, information technology, human resources, and investor relations. Where possible, these costs were allocated based on direct usage, with the remainder allocated on a basis of revenue, headcount, or other measures we have determined as reasonable.
Management of MFS believes the assumptions underlying the combined financial statements, including the assumptions regarding the allocated expenses, reasonably reflect the utilization of services provided to or the benefit received by MFS during the periods presented. Nevertheless, the accompanying combined financial statements may not be indicative of MFS' future performance, and do not necessarily include all the of the actual expenses that would have been incurred by MFS and may not reflect the results of operations, financial position, and cash flows had MFS been a standalone company during the periods presented.
Cash was managed centrally and flowed through centralized bank accounts controlled and maintained by MTW. Accordingly, cash and cash equivalents held by MTW at the corporate level were not attributable to MFS for any of the periods presented. Only cash amounts specifically
-59-
attributable to MFS are reflected in the combined balance sheets. Transfers of cash, both to and from MTW's centralized cash management system, are reflected as a component of Net Parent Company Investment in the combined balance sheets and as a financing activity on the accompanying combined statements of cash flows. Additionally, none of MTW’s debt has been allocated to the combined financial statements as MFS has no legal obligation for any of the debt agreements. MFS received or provided funding as part of MTW's centralized treasury program.
Income tax expense in the combined statement of operations is computed on a separate return basis, as if MFS was operating as a separate consolidated group and filed separate tax returns in the jurisdictions in which it operates. As a result of potential changes to our business model and potential past and future tax planning, income tax expense included in the combined financial statements may not be indicative of MFS' future expected tax rate. In addition, cash tax payments and items of current and deferred taxes may not be reflective of MFS' actual tax balances prior to or subsequent to the Spin-Off.
2. Summary of Significant Accounting Policies
Cash, Cash Equivalents, and Restricted Cash All short-term investments purchased with an original maturity of three months or less are considered cash equivalents. All cash was managed centrally by MTW and cash held by MTW at the corporate level was not attributed to MFS for any periods presented. Only cash amounts specifically attributable to MFS are reflected in the combined balance sheet.
Inventories Inventories are valued at the lower of cost or market value. Approximately 90.3% and 88.6% of MFS' inventories at December 31, 2015 and 2014, respectively, were valued using the first-in, first-out (FIFO) method. The remaining inventories were valued using the last-in, first-out (LIFO) method. If the FIFO inventory valuation method had been used exclusively, inventories would have increased by $3.4 million and $3.1 million at December 31, 2015 and 2014, respectively. Finished goods and work-in-process inventories include material, labor and manufacturing overhead costs.
Goodwill and Other Intangible Assets MFS accounts for its goodwill and other intangible assets under the guidance of ASC Subtopic 350-10, “Intangibles — Goodwill and Other.” Under ASC Subtopic 350-10, goodwill is not amortized, but it is tested for impairment annually, or more frequently, as events dictate. See additional discussion of impairment testing under “Impairment of Long-Lived Assets,” below. MFS' other intangible assets with indefinite lives, including trademarks and tradenames and in-place distributor networks, are not amortized, but are also tested for impairment annually, or more frequently, as events dictate. MFS’ other intangible assets subject to amortization are tested for impairment whenever events or changes in circumstances indicate that their carrying values may not be recoverable. Other intangible assets are amortized straight-line over the following estimated useful lives:
Useful lives | |
Patents | 10-20 years |
Engineering drawings | 15 years |
Customer relationships | 10-20 years |
Property, Plant and Equipment Property, plant and equipment are stated at cost. Expenditures for maintenance, repairs and minor renewals are charged against earnings as incurred. Expenditures for major renewals and improvements that substantially extend the capacity or useful life of an asset are capitalized and are then depreciated. The cost and accumulated depreciation for property, plant and equipment sold, retired, or otherwise disposed of are relieved from the accounts, and resulting gains or losses are reflected in earnings. Property, plant and equipment are depreciated over the estimated useful lives of the assets using the straight-line depreciation method for financial reporting and on accelerated methods for income tax purposes.
Property, plant and equipment are depreciated over the following estimated useful lives:
Years | |
Building and improvements | 2 - 40 |
Machinery, equipment and tooling | 2 - 20 |
Furniture and fixtures | 3 - 15 |
Computer hardware and software | 2 - 7 |
Impairment of Long-Lived Assets MFS reviews long-lived assets for impairment whenever events or changes in circumstances indicate that the assets’ carrying amount may not be recoverable. MFS conducts its long-lived asset impairment analyses in accordance with ASC Subtopic 360-10-5. ASC Subtopic 360-10-5 requires the Company to group assets and liabilities at the lowest level for which identifiable cash flows are largely independent of the cash flows of other assets and liabilities and to evaluate the asset group against the sum of the undiscounted future cash flows.
For property, plant and equipment and other long-lived assets, other than goodwill and other indefinite lived intangible assets, MFS performs undiscounted operating cash flow analyses to determine impairments. If an impairment is determined to exist, any related impairment loss is calculated based upon comparison of the fair value to the net book value of the assets. Impairment losses on assets held for sale are based on the estimated proceeds to be received, less costs to sell.
-60-
Each year, as of June 30, MFS tests for impairment of goodwill according to a two-step approach. In the first step, MFS estimates the fair values of its reporting units using the present value of future cash flows approach. If the carrying amount exceeds the fair value, the second step of the goodwill impairment test is performed to measure the amount of the impairment loss, if any. In the second step, the implied fair value of the goodwill is estimated as the fair value of the reporting unit used in the first step less the fair values of all other net tangible and intangible assets of the reporting unit. If the carrying amount of the goodwill exceeds its implied fair market value, an impairment loss is recognized in an amount equal to that excess, not to exceed the carrying amount of the goodwill. In addition, goodwill of a reporting unit is tested for impairment between annual tests if an event occurs or circumstances change that would more-likely-than-not reduce the fair value of a reporting unit below its carrying value. For other indefinite lived intangible assets, the impairment test consists of a comparison of the fair value of the intangible assets to their carrying amount. See Note 9, “Goodwill and Other Intangible Assets,” for further details on our impairment assessments.
Warranties Estimated warranty costs are recorded in cost of sales at the time of sale of the warranted products based on historical warranty experience for the related product or estimates of projected costs due to specific warranty issues on new products. These estimates are reviewed periodically and are adjusted based on changes in facts, circumstances or actual experience.
Environmental Liabilities MFS accrues for losses associated with environmental remediation obligations when such losses are probable and reasonably estimable. Such accruals are adjusted as information develops or circumstances change. Costs of long-term expenditures for environmental remediation obligations are discounted to their present value when the timing of cash flows are estimable.
Product Liabilities MFS records product liability reserves for its self-insured portion of any pending or threatened product liability actions. The reserve is based upon two estimates. First, MFS tracks the population of all outstanding pending and threatened product liability cases to determine an appropriate case reserve for each based upon Foodservice's best judgment and the advice of legal counsel. These estimates are continually evaluated and adjusted based upon changes to facts and circumstances surrounding the case. Second, MFS determines the amount of additional reserve required to cover incurred but not reported product liability obligations and to account for possible adverse development of the established case reserves. This analysis is performed at least once annually.
Foreign Currency Translation The financial statements of MFS’ non-U.S. subsidiaries are translated using the current exchange rate for assets and liabilities and the average exchange rate for the year for income and expense items. Resulting translation adjustments are recorded to Accumulated Other Comprehensive Income (AOCI) as a component of equity.
Derivative Financial Instruments and Hedging Activities MTW entered into derivative instruments, on MFS' behalf, to hedge MFS' foreign exchange and commodity exposure associated with aluminum, copper, steel, and natural gas prices.
MTW has and MFS has adopted substantially similar written policies and procedures that place all financial instruments under the direction of corporate treasury and restrict all derivative transactions to those intended for hedging purposes. The use of financial instruments for trading purposes is strictly prohibited. MTW used and MFS continues to use financial instruments to manage the market risk from changes in foreign exchange rates, commodities and interest rates. MFS follows the guidance in accordance with ASC Subtopic 815-10, “Derivatives and Hedging.” The fair values of all derivatives are recorded in the combined balance sheets. The change in a derivative’s fair value is recorded each period in current earnings or AOCI depending on whether the derivative is designated and qualifies as part of a hedge transaction and if so, the type of hedge transaction. During 2015, 2014 and 2013, minimal amounts were recognized in earnings due to ineffectiveness of certain commodity hedges. The amount reported as derivative instrument fair market value adjustment in the AOCI account within the combined statements of comprehensive income (loss) represents the net gain (loss) on foreign currency exchange contracts and commodity contracts designated as cash flow hedges, net of income taxes.
Cash Flow Hedges MTW, on MFS’ behalf, selectively hedged anticipated transactions that were subject to foreign exchange exposure and commodity price exposure, primarily using foreign currency exchange and commodity contracts. These instruments were designated as cash flow hedges in accordance with ASC Subtopic 815-10 and hedged specifically attributable to MFS are recorded in the combined balance sheets at fair value. The effective portion of the contracts’ gains or losses due to changes in fair value are initially recorded as a component of AOCI and are subsequently reclassified into earnings when the hedged transactions, typically sales and costs related to sales occur and affect earnings. These contracts are highly effective in hedging the variability in future cash attributable to changes in currency exchange rates or commodity prices.
Stock-Based Compensation MFS employees have historically participated in MTW's stock-based compensation plans. Stock-based compensation expense has been allocated to the MFS business based on the awards and terms previously granted to its employees. Until consummation of the Spin-Off, the MFS business continued to participate in MTW's stock-based compensation plans and record stock-based compensation expense based on the stock-based awards granted to the MFS employees. Accounting guidance requires that the cost resulting from all stock-based payment transactions be recognized in the financial statements. Guidance establishes fair value as the measurement objective in accounting for stock-based payment arrangements and requires all companies to apply a fair-value-based measurement method in accounting generally for all stock-based payment transactions with employees. Stock based compensation expense related to MFS employees of $2.3 million, $2.4 million and $3.5 million has been recorded in the combined statement of operations for the years ended December 31, 2015, 2014, and 2013, respectively.
Revenue Recognition Revenue is generally recognized and earned when all the following criteria are satisfied with regard to a specific transaction: persuasive evidence of a sales arrangement exists; the price is fixed or determinable; collectability of cash is reasonably assured;
-61-
and delivery has occurred or services have been rendered. Shipping and handling fees are reflected in net sales and shipping and handling costs are reflected in cost of sales in the combined statements of operations.
Research and Development Research and development costs are charged to expense as incurred and amounted to $26.1 million, $31.0 million and $28.7 million for the years ended December 31, 2015, 2014, and 2013, respectively. Research and development costs include salaries, materials, contractor fees and other administrative costs.
Income Taxes In MFS’ combined financial statements, income tax expense and deferred tax balances have been calculated on a separate return basis although MFS’ operations have historically been included in the tax returns filed by the respective MTW entities. In the future, as a standalone entity, MFS will file tax returns on its own behalf and its deferred taxes and effective tax rate may differ from those in historical periods.
MFS recognizes deferred tax assets and liabilities for the expected future income tax consequences of events that have been recognized in MFS' financial statements. Deferred tax assets and liabilities are determined based on the temporary difference between financial statement carrying amounts and the tax basis of assets and liabilities using enacted tax rates in effect in the years in which the temporary differences are expected to reverse. Valuation allowances are provided for deferred tax assets where it is considered more likely than not that the Company will not realize the benefit of such assets. MFS evaluates its uncertain tax positions as new information becomes available. Tax benefits are recognized to the extent a position is more likely than not to be sustained upon examination by the taxing authority.
With the exception of certain separate filing Foodservice U.S. and non-U.S. entities that will transfer to MFS after the Spin-Off, current income tax liabilities were deemed to settle immediately with MTW tax paying entities in the respective jurisdictions. These settlements were reflected as changes in the net parent company investment account.
Comprehensive Income (Loss) Comprehensive income (loss) includes, in addition to net earnings, other items that are reported as direct adjustments to equity. Currently, these items are foreign currency translation adjustments, employee postretirement benefit adjustments and the change in fair value of certain derivative instruments.
Concentration of Credit Risk Credit extended to customers through trade accounts receivable potentially subjects MFS to risk. This risk is limited due to the large number of customers and their dispersion across various industries and many geographical areas. However, a significant amount of MFS' receivables are with distributors and large companies in the foodservice and beverage industry. MFS currently does not foresee a significant credit risk associated with these individual groups of receivables, but continues to monitor the exposure, if any.
Recent accounting changes and pronouncements
On February 25, 2016, the FASB issued ASU No. 2016-02, “Leases (Topic 842)” which requires lessees to recognize right-of-use assets and lease liability, initially measured at present value of the lease payments, on its balance sheet for leases with terms longer than 12 months and classified as either financing or operating leases. ASU 2016-02 requires a modified retrospective transition approach for capital and operating leases existing at, or entered into after, the beginning of the earliest comparative period presented in the financial statements, and provides certain practical expedients that companies may elect. ASU 2016-02 is effective for public companies for fiscal years beginning after December 15, 2018, including interim periods within those fiscal years. We are currently evaluating the effects that the adoption of ASU 2016-02 will have on our consolidated financial statements.
In January 2016, the FASB issued Accounting Standards Update (“ASU”) No. 2016-01, “Financial Instruments (Subtopic 825-10) - Recognition and Measurement of Financial Assets and Financial Liabilities.” This update provides guidance for the recognition, measurement, presentation, and disclosure of financial instruments. This guidance is effective for annual and interim periods beginning after December 15, 2017, and early adoption is not permitted. The Company is evaluating the impact, if any, the adoption of this ASU will have on the Company’s consolidated financial statements.
In November 2015, the FASB issued ASU No. 2015-17, "Balance Sheet Classification of Deferred Taxes (Subtopic 740-10)." ASU 2015-17 simplifies the presentation of deferred income taxes by eliminating the requirement for companies to present deferred tax liabilities and assets as current and non-current on the balance sheet. Instead, companies will be required to classify all deferred tax assets and liabilities as non-current. This guidance is effective for annual and interim periods beginning after December 15, 2016 and early adoption is permitted. We early adopted this ASU on a prospective basis as of December 31, 2015. Prior periods were not retrospectively adjusted.
In September 2015, the FASB issued ASU No. 2015-16, “Business Combinations (Topic 805) - Simplifying the Accounting for Measurement-Period Adjustments.” The amendments in this ASU require that an acquirer in a business combination recognize adjustments to provisional amounts that are identified during the measurement period in the reporting period in which the adjustment amounts are determined, rather than as retrospective adjustments. The amendments in this ASU are effective for fiscal years beginning after December 15, 2015, including interim periods within those fiscal years. The amendments in this ASU should be applied prospectively to adjustments to provisional amounts that occur after the effective date of this ASU with earlier application permitted for financial statements that have not been issued. We believe the adoption of this ASU will not have a material impact on our combined financial statements.
In August 2015, the FASB issued ASU No. 2015-15, “Presentation and Subsequent Measurement of Debt Issuance Costs Associated with Line-of-Credit Arrangements.” This ASU clarifies the guidance related to accounting for debt issuance costs related to line-of-credit arrangements. In April 2015, the FASB issued ASU 2015-03 which requires entities to present debt issuance costs related to a recognized debt liability as a direct deduction from the carrying amount of that debt liability; see further discussion of ASU 2015-03 below. The guidance in
-62-
ASU 2015-03 did not address presentation or subsequent measurement of debt issuance costs related to line-of-credit arrangements. Given the absence of authoritative guidance within ASU 2015-03 for debt issuance costs related to line-of-credit arrangements, the SEC staff would not object to an entity deferring and presenting debt issuance costs as an asset and subsequently amortizing the deferred debt issuance costs ratably over the term of the line-of-credit arrangement, regardless of whether there are any outstanding borrowings on the line-of-credit arrangement. This ASU will be effective beginning in the interim period ended March 31, 2016 and will not affect the prior periods presented.
In July 2015, the FASB issued ASU No. 2015-11, “Inventory (Topic 330): Simplifying the Measurement of Inventory.” This ASU changes the guidance on accounting for inventory accounted for on a first-in first-out basis (FIFO). Under the revised standard, an entity should measure FIFO inventory at the lower of cost and net realizable value. Net realizable value is the estimated selling prices in the ordinary course of business, less reasonably predictable costs of completion, disposal, and transportation. Subsequent measurement is unchanged for inventory measured on a last-in, first-out basis (LIFO). The amendments in this ASU are effective for fiscal years, and for interim periods within those fiscal years, beginning after December 15, 2016. We believe the adoption of this ASU will not have a material impact on our combined financial statements.
In April 2015, the FASB issued ASU No. 2015-05, “Customer’s Accounting for Fees Paid in a Cloud Computing Arrangement.” This update provides guidance on accounting for a software license in a cloud computing arrangement. If a cloud computing arrangement includes a software license, then the customer should account for the software license element of the arrangement consistent with the acquisition of other software licenses. If a cloud computing arrangement does not include a software license, the customer should account for the arrangement as a service contract. Further, all software licenses are within the scope of Accounting Standards Codification Subtopic 350-40 and will be accounted for consistent with other licenses of intangible assets. The amendments in this ASU are effective for fiscal years, and for interim periods within those fiscal years, beginning after December 15, 2015. We believe the adoption of this ASU will not have a material impact on our combined financial statements.
In April 2015, the FASB issued ASU No. 2015-03, “Simplifying the Presentation of Debt Issuance Costs.” To simplify the presentation of debt issuance costs, this update requires that debt issuance costs related to a recognized debt liability be presented in the balance sheet as a direct deduction from the carrying amount of that debt liability, consistent with debt discounts, rather than as a deferred asset. The recognition and measurement guidance for debt issuance costs are not affected by the amendments in this update. The amendments in this ASU are effective for fiscal years, and for interim periods within those fiscal years, beginning after December 15, 2015, with early application permitted. This ASU will be effective beginning in the interim period ended March 31, 2016 and will not affect the prior periods presented.
In February 2015, the FASB issued ASU No. 2015-02, “Consolidation (Topic 820)—Amendments to the Consolidation Analysis.” This update amends the current consolidation guidance for both the variable interest entity (VIE) and voting interest entity (VOE) consolidation models. The amendments in this ASU are effective for fiscal years, and for interim periods within those fiscal years, beginning after December 15, 2015. MFS believes the adoption of this ASU will not have a material impact on its combined financial statements.
In January 2015, the FASB issued ASU No. 2015-01, “Income Statement—Extraordinary and Unusual Items.” This update eliminates from GAAP the concept of extraordinary items. ASU 2015-01 is effective for the first interim period within fiscal years beginning after December 15, 2015, with early adoption permitted provided that the guidance is applied from the beginning of the fiscal year of adoption. A reporting entity may apply the amendments prospectively or retrospectively to all prior periods presented in the financial statements. MFS believes the adoption of this ASU will not have a material impact on its combined financial statements.
In August 2014, the FASB issued ASU No. 2014-15, “Presentation of Financial Statements—Going Concern.” This update provided guidance on management’s responsibility in evaluating whether there is substantial doubt about a company’s ability to continue as a going concern and to provide related footnote disclosures. ASU 2014-15 is effective in the first annual period ending after December 15, 2016, with early adoption permitted. MFS believes the adoption of this ASU will not have a material impact on its combined financial statements.
In May 2014, the FASB issued ASU No. 2014-09, “Revenue from Contracts with Customers.” This update provided a principles-based approach to revenue recognition to depict the transfer of goods or services to customers in an amount that reflects the consideration to which the entity expects to be entitled in exchange for those goods or services. This ASU provides a five-step model to be applied to all contracts with customers. The five steps are to identify the contract(s) with the customer, identify the performance obligations in the contact, determine the transaction price, allocate the transaction price to the performance obligations in the contract and recognize revenue when each performance obligation is satisfied. The revenue standard is effective for the first interim period within fiscal years beginning after December 15, 2017 (as finalized by the FASB in August 2015 in ASU 2015-14), and can be applied either retrospectively to each prior reporting period presented or retrospectively with the cumulative effect of initially applying the update recognized at the date of initial application along with additional disclosures. Early adoption is permitted as of the original effective date—the first interim period within fiscal years beginning after December 15, 2016. MFS is evaluating the impact, if any, the adoption of this ASU will have on its combined financial statements.
In April 2014, the FASB issued ASU No. 2014-08, “Presentation of Financial Statements and Property, Plant, and Equipment: Reporting Discontinued Operations and Disclosures of Disposals of Components of an Entity.” This ASU changes the requirements for reporting discontinued operations in Accounting Standards Codification Subtopic 205-20, and now requires a disposal of a component of an entity or a group of components of an entity to be reported in discontinued operations only if the disposal represents a strategic shift that has (or will have) a major effect on an entity’s operations and financial results. There will also be additional disclosures required. The amendments in this ASU are effective prospectively for fiscal years (and interim reporting periods within those years) beginning after December 15, 2014. The significance of this guidance for MFS is dependent on any future disposals.
-63-
3. Acquisitions
On October 1, 2013, MFS acquired all remaining shares of Inducs, AG (“Inducs”) for a purchase price, net of cash acquired, of approximately $12.2 million. MFS previously held a minority interest in Inducs. Inducs is a leader in induction cooking technology. Allocation of the purchase price resulted in $5.0 million of goodwill and $7.0 million of intangible assets. The results of Inducs have been included in these combined financial statements since the date of the acquisition.
On October 21, 2015, MFS acquired the remaining 50% of outstanding shares of a joint venture in Thailand. Welbilt Thailand is a leading manufacturer of kitchen equipment in South East Asia. The purchase price, net of cash acquired, was approximately $5.3 million. The gain of $4.9 million recognized on the acquisition was a component of Other income (expense) - net in the Combined Statements of Operations for the year ended December 31, 2015. The gain related to the difference between the book value and the fair value of our previously held passive 50% equity interest in the joint venture. Allocation of the purchase price resulted in $1.4 million of goodwill and $4.2 million of intangible assets. The results of Welbilt Thailand have been included in these combined financial statements since the date of the acquisition.
4. Discontinued Operations and Divestitures
On December 7, 2015, we announced the completion of the sale of Kysor Panel Systems, a manufacturer of wood frame and high-density rail panel systems for walk-in freezers and coolers for the retail and convenience-store markets, to an affiliate of D Cubed Group LLC. The sale price for the transaction was approximately $85 million, with cash proceeds received of approximately $78 million. In December 2015, the proceeds from the sale were used to reduce outstanding debt under MTW's then-outstanding credit facility. This divestiture does not qualify for discontinued operations; therefore the results of the business are included in the operating results from continuing operations.
During the fourth quarter of 2012, MTW decided to divest our warewashing equipment business, which operated under the brand name Jackson, and classified this business as discontinued operations in the Company’s financial statements. On January 28, 2013, we sold the Jackson warewashing equipment business to Hoshizaki USA Holdings, Inc. for approximately $39.2 million and a post-closing working capital adjustment of approximately $0.7 million. The transaction resulted in a $2.7 million loss on sale, which included $4.4 million of income tax expense. The results of these operations have been classified as discontinued operations.
The following selected financial data of the Jackson business for the years ended December 31, 2015, 2014, and 2013, is presented for informational purposes only and does not necessarily reflect what the results of operations would have been had the business operated as a stand-alone entity. There was no general corporate expense or interest expense allocated to discontinued operations for this business during the periods presented.
(in millions) | 2015 | 2014 | 2013 | |||||||||
Net sales | $ | — | $ | — | $ | 2.5 | ||||||
Pretax earnings from discontinued operation | — | — | 0.1 | |||||||||
Benefit for taxes on earnings | — | — | (0.4 | ) | ||||||||
Net earnings from discontinued operation | $ | — | $ | — | $ | 0.5 | ||||||
The following selected financial data of various businesses disposed of prior to 2012, primarily consisting of administrative costs, for the years ended December 31, 2015, 2014, and 2013, is presented for informational purposes only and does not necessarily reflect what the results of operations would have been had the businesses operated as stand-alone entities. There was no general corporate expense or interest expense allocated to discontinued operations for these businesses during the periods presented.
(in millions) | 2015 | 2014 | 2013 | |||||||||
Net sales | $ | — | $ | — | $ | — | ||||||
Pretax earnings (loss) from discontinued operations | $ | 0.2 | $ | (0.7 | ) | $ | (1.6 | ) | ||||
Provision (benefit) for taxes on earnings | 0.1 | (0.3 | ) | (0.6 | ) | |||||||
Net earnings (loss) from discontinued operations | $ | 0.1 | $ | (0.4 | ) | $ | (1.0 | ) | ||||
During the third quarter of 2014, we settled a pension obligation related to a previously disposed entity, which resulted in a $1.1 million loss on sale of discontinued operations, net of income tax benefit of $0.6 million, during the period.
-64-
5. Fair Value of Financial Instruments
The following tables sets forth financial assets and liabilities which were attributable to MFS and were accounted for at fair value on a recurring basis as of December 31, 2015 and 2014 by level within the fair value hierarchy. Financial assets and liabilities are classified in their entirety based on the lowest level of input that is significant to the fair value measurement.
Fair Value as of December 31, 2015 | ||||||||||||||||
(in millions) | Level 1 | Level 2 | Level 3 | Total | ||||||||||||
Current Assets: | ||||||||||||||||
Foreign currency exchange contracts | $ | — | $ | — | $ | — | $ | — | ||||||||
Total current assets at fair value | $ | — | $ | — | $ | — | $ | — | ||||||||
Total assets at fair value | $ | — | $ | — | $ | — | $ | — | ||||||||
Current Liabilities: | ||||||||||||||||
Foreign currency exchange contracts | $ | — | $ | 0.1 | $ | — | $ | 0.1 | ||||||||
Commodity contracts | — | 3.1 | — | 3.1 | ||||||||||||
Total current liabilities at fair value | $ | — | $ | 3.2 | $ | — | $ | 3.2 | ||||||||
Non-current Liabilities: | ||||||||||||||||
Commodity contracts | $ | — | $ | 0.4 | $ | — | $ | 0.4 | ||||||||
Total non-current liabilities at fair value | $ | — | $ | 0.4 | $ | — | $ | 0.4 | ||||||||
Total liabilities at fair value | $ | — | $ | 3.6 | $ | — | $ | 3.6 | ||||||||
Fair Value as of December 31, 2014 | ||||||||||||||||
(in millions) | Level 1 | Level 2 | Level 3 | Total | ||||||||||||
Current Assets: | ||||||||||||||||
Foreign currency exchange contracts | $ | — | $ | — | $ | — | $ | — | ||||||||
Total current assets at fair value | $ | — | $ | — | $ | — | $ | — | ||||||||
Total assets at fair value | $ | — | $ | — | $ | — | $ | — | ||||||||
Current Liabilities: | ||||||||||||||||
Foreign currency exchange contracts | $ | — | $ | 0.7 | $ | — | $ | 0.7 | ||||||||
Commodity contracts | — | 0.7 | — | 0.7 | ||||||||||||
Total current liabilities at fair value | $ | — | $ | 1.4 | $ | — | $ | 1.4 | ||||||||
Non-current Liabilities: | ||||||||||||||||
Interest rate swap contracts: Fixed-to-float | $ | — | $ | — | $ | — | $ | — | ||||||||
Total non-current liabilities at fair value | $ | — | $ | 0.3 | $ | — | $ | 0.3 | ||||||||
Total liabilities at fair value | $ | — | $ | 1.7 | $ | — | $ | 1.7 | ||||||||
ASC Subtopic 820-10, "Fair Value Measurement," defines fair value as the price that would be received to sell an asset or paid to transfer a liability in an orderly transaction between market participants at the measurement date. ASC Subtopic 820-10 classifies the inputs used to measure fair value into the following hierarchy:
Level 1 | Unadjusted quoted prices in active markets for identical assets or liabilities |
Level 2 | Unadjusted quoted prices in active markets for similar assets or liabilities, or |
Unadjusted quoted prices for identical or similar assets or liabilities in markets that are not active, or
Inputs other than quoted prices that are observable for the asset or liability
Level 3 | Unobservable inputs for the asset or liability |
MFS endeavors to utilize the best available information in measuring fair value. Financial assets and liabilities are classified in their entirety based on the lowest level of input that is significant to the fair value measurement. The carrying values of cash and cash equivalents, accounts receivable, accounts payable, and deferred purchase price notes on receivables sold (see Note 11, “Accounts Receivable Securitization”), approximate fair value, without being discounted as of December 31, 2015 and December 31, 2014 due to the short-term nature of these instruments.
-65-
As a result of its global operating and financing activities, MFS is exposed to market risks from changes in foreign currency exchange rates, and commodity prices, which may adversely affect its operating results and financial position. When deemed appropriate, MFS minimizes these risks through the use of derivative financial instruments. Derivative financial instruments are used to manage risk and are not used for trading or other speculative purposes, and MFS does not use leveraged derivative financial instruments. The foreign currency exchange and commodity contracts are valued through an independent valuation source which uses an industry standard data provider, with resulting valuations periodically validated through third-party or counterparty quotes. As such, these derivative instruments are classified within Level 2.
6. Derivative Financial Instruments
MFS' risk management objective is to ensure that business exposures to risks that have been identified and measured and are capable of being controlled are minimized or managed using what it believes to be the most effective and efficient methods to eliminate, reduce, or transfer such exposures. Operating decisions consider these associated risks and structure transactions to minimize or manage these risks whenever possible.
Use of derivative instruments is consistent with the overall business and risk management objectives of MFS. Derivative instruments may be used to manage business risk within limits specified by our risk policies and manage exposures that have been identified through the risk identification and measurement process, provided that they clearly qualify as “hedging” activities as defined in the risk policy. Use of derivative instruments is not automatic, nor is it necessarily the only response to managing pertinent business risk. Use is permitted only after the risks that have been identified are determined to exceed defined tolerance levels and are considered to be unavoidable.
The primary risks we manage using derivative instruments are commodity price risk and foreign currency exchange risk. Swap contracts on various commodities are used to manage the price risk associated with forecasted purchases of materials used in MFS’ manufacturing process. We also enter into various foreign currency derivative instruments to help manage foreign currency risk associated with MFS' projected purchases and sales and foreign currency denominated receivable and payable balances.
ASC Subtopic 815-10, "Derivatives and Hedges," requires companies to recognize all derivative instruments as either assets or liabilities at fair value in the statement of financial position. In accordance with ASC Subtopic 815-10, MFS designates commodity swaps and foreign currency exchange contracts as cash flow hedges of forecasted purchases of commodities and currencies.
For derivative instruments that are designated and qualify as cash flow hedges, the effective portion of the gain or loss on the derivative is reported as a component of other comprehensive income (loss) and reclassified into earnings in the same period or periods during which the hedged transaction affects earnings. Gains and losses on the derivative instruments representing either hedge ineffectiveness or hedge components excluded from the assessment of effectiveness are recognized in current earnings. In the next twelve months we estimate $0.8 million of unrealized losses, net of tax, related to commodity price and currency rate hedging will be reclassified from other comprehensive income (loss) into earnings. Foreign currency and commodity hedging is generally completed prospectively on a rolling basis for twelve and twenty-four months, respectively, depending on the type of risk being hedged.
As of December 31, 2015, MFS had the following outstanding commodity and currency forward contracts that were entered into as hedge forecasted transactions:
Commodity | Units Hedged | Type | ||||
Aluminum | 1,215 | MT | Cash flow | |||
Copper | 472 | MT | Cash flow | |||
Natural gas | 49,396 | MMBtu | Cash flow | |||
Steel | 11,073 | Short Tons | Cash flow | |||
Currency | Units Hedged | Type | ||
Canadian Dollar | 587,556 | Cash flow | ||
European Euro | 231,810 | Cash Flow | ||
Great British Pound | 113,115 | Cash Flow | ||
Mexican Peso | 28,504,800 | Cash flow | ||
For derivative instruments that are not designated as hedging instruments under ASC Subtopic 815-10, the gains or losses on the derivatives are recognized in current earnings within other (expense) income, net in the combined statement of operations. As of December 31, 2015, MFS had the following outstanding currency forward contracts that were not designated as hedging instruments:
Currency | Units Hedged | Recognized Location | Purpose | |||
Canadian Dollar | 1,117,850 | Other (expense) income, net | Accounts payable and receivable settlement | |||
-66-
The fair value of outstanding derivative contracts recorded as liabilities in the accompanying combined balance sheet as of December 31, 2015 was as follows:
LIABILITY DERIVATIVES | ||||||
(in millions) | Balance Sheet Location | Fair Value | ||||
Derivatives designated as hedging instruments | ||||||
Foreign exchange contracts | Accounts payable and accrued expenses | $ | 0.1 | |||
Commodity contracts | Accounts payable and accrued expenses | 2.4 | ||||
Commodity contracts | Other non-current liabilities | 0.3 | ||||
Total derivatives designated as hedging instruments | $ | 2.8 | ||||
LIABILITY DERIVATIVES | ||||||
(in millions) | Balance Sheet Location | Fair Value | ||||
Derivatives NOT designated as hedging instruments | ||||||
Commodity Contracts | Accounts payable and accrued expenses | $ | 0.7 | |||
Commodity Contracts | Other non-current liabilities | 0.1 | ||||
Total derivatives NOT designated as hedging instruments | $ | 0.8 | ||||
Total liability derivatives | $ | 3.6 | ||||
The effect of derivative instruments on the combined statement of operations for the year ended December 31, 2015 and gains or losses initially recognized in AOCI in the combined balance sheet were as follows:
Derivatives in Cash Flow Hedging Relationships (in millions) | Amount of Gain or (Loss) Recognized in AOCI on Derivative (Effective Portion, net of tax) | Location of Gain or (Loss) Reclassified from AOCI into Income (Effective Portion) | Amount of Gain or (Loss) Reclassified from AOCI into Income (Effective Portion) | |||||||
Foreign exchange contracts | $ | 0.3 | Cost of sales | $ | (1.4 | ) | ||||
Commodity contracts | (1.1 | ) | Cost of sales | (3.4 | ) | |||||
Total | $ | (0.8 | ) | $ | (4.8 | ) | ||||
Derivatives Relationships (in millions) | Location of Gain or (Loss) Recognized in Income on Derivative (Ineffective Portion and Amount Excluded from Effectiveness Testing) | Amount of Gain or (Loss) Recognized in Income on Derivative (Ineffective Portion and Amount Excluded from Effectiveness Testing) | ||||
Commodity contracts | Cost of sales | $ | 0.1 | |||
Total | $ | 0.1 | ||||
Derivatives Not Designated as Hedging Instruments (in millions) | Location of Gain or (Loss) Recognized in Income on Derivative | Amount of Gain or (Loss) Recognized in Income on Derivative | ||||
Foreign exchange contracts | Other (expense) income, net | $ | 0.1 | |||
Commodity contracts - ST | Other (expense) income, net | (0.7 | ) | |||
Commodity contracts - LT | Other (expense) income, net | (0.1 | ) | |||
Total | $ | (0.7 | ) | |||
As of December 31, 2014, MFS had the following outstanding commodity and currency forward contracts that were entered into as hedge forecasted transactions:
Commodity | Units Hedged | Type | ||||
Aluminum | 1,657 | MT | Cash flow | |||
Copper | 820 | MT | Cash flow | |||
Natural gas | 56,792 | MMBtu | Cash flow | |||
Steel | 12,634 | Short Tons | Cash flow | |||
-67-
Currency | Units Hedged | Type | ||
Canadian Dollar | 7,984,824 | Cash Flow | ||
Mexican Peso | 52,674,383 | Cash Flow | ||
For derivative instruments that are not designated as hedging instruments under ASC Subtopic 815-10, the gains or losses on the derivatives are recognized in current earnings within other (expense) income, net in the combined statement of operations. As of December 31, 2014, MFS had the following outstanding currency forward contracts that were not designated as hedging instruments:
Currency | Units Hedged | Recognized Location | Purpose | ||||
European Euro | 2,172,068 | Other (expense) income, net | Accounts payable and receivable settlement | ||||
Mexican Peso | 3,151,000 | Other (expense) income, net | Accounts payable and receivable settlement | ||||
Canadian Dollar | 2,516 | Other (expense) income, net | Accounts payable and receivable settlement | ||||
The fair value of outstanding derivative contracts recorded as liabilities in the accompanying combined balance sheet as of December 31, 2014 was as follows:
LIABILITIES DERIVATIVES | ||||||
(in millions) | Balance Sheet Location | Fair Value | ||||
Derivatives designated as hedging instruments | ||||||
Foreign exchange contracts | Accounts payable and accrued expenses | $ | 0.6 | |||
Commodity contracts | Accounts payable and accrued expenses | 0.7 | ||||
Commodity contracts | Other non-current liabilities | 0.3 | ||||
Total derivatives designated as hedging instruments | $ | 1.6 | ||||
LIABILITY DERIVATIVES | ||||||
(in millions) | Balance Sheet Location | Fair Value | ||||
Derivatives NOT designated as hedging instruments | ||||||
Foreign exchange contracts | Accounts payable and accrued expenses | $ | 0.1 | |||
Total derivatives NOT designated as hedging instruments | $ | 0.1 | ||||
Total liability derivatives | $ | 1.7 | ||||
The effect of derivative instruments on the combined statement of operations for the year ended December 31, 2014, and gains or losses initially recognized in AOCI in the combined balance sheet were as follows:
Derivatives in Cash Flow Hedging Relationships (in millions) | Amount of Gain or (Loss) Recognized in AOCI on Derivative (Effective Portion, net of tax) | Location of Gain or (Loss) Reclassified from AOCI into Income (Effective Portion) | Amount of Gain or (Loss) Reclassified from AOCI into Income (Effective Portion) | |||||||
Foreign exchange contracts | $ | (0.1 | ) | Cost of sales | $ | (0.9 | ) | |||
Commodity contracts | (0.5 | ) | Cost of sales | (0.3 | ) | |||||
Total | $ | (0.6 | ) | $ | (1.2 | ) | ||||
Derivatives Relationships (in millions) | Location of Gain or (Loss) Recognized in Income on Derivative (Ineffective Portion and Amount Excluded from Effectiveness Testing) | Amount of Gain or (Loss) Recognized in Income on Derivative (Ineffective Portion and Amount Excluded from Effectiveness Testing) | ||||
Commodity contracts | Cost of sales | $ | 0.1 | |||
Total | $ | 0.1 | ||||
-68-
Derivatives Not Designated as Hedging Instruments (in millions) | Location of Gain or (Loss) Recognized in Income on Derivative | Amount of Gain or (Loss) Recognized in Income on Derivative | ||||
Foreign exchange contracts | Other (expense) income, net | $ | — | |||
Total | $ | — | ||||
As of December 31, 2013, MFS had the following outstanding commodity and currency forward contracts that were entered into as hedge forecasted transactions:
Commodity | Units Hedged | Type | ||||
Aluminum | 1,622 | MT | Cash flow | |||
Copper | 382 | MT | Cash flow | |||
Natural gas | 149,994 | MMBtu | Cash flow | |||
Steel | 8,806 | Short Tons | Cash flow | |||
Currency | Units Hedged | Type | ||
Canadian Dollar | 10,422,932 | Cash Flow | ||
European Euro | 13,447,750 | Cash Flow | ||
United States Dollar | 2,100,000 | Cash Flow | ||
For derivative instruments that are not designated as hedging instruments under ASC Subtopic 815-10, the gains or losses on the derivatives are recognized in current earnings within other (expense) income, net in the combined statement of operations. As of December 31, 2013, MFS had no outstanding currency forward contracts that were not designated as hedging instruments.
The fair value of outstanding derivative contracts recorded as assets in the accompanying combined balance sheet as of December 31, 2013, was as follows:
ASSET DERIVATIVES | ||||||
(in millions) | Balance Sheet Location | Fair Value | ||||
Derivatives designated as hedging instruments | ||||||
Foreign exchange contracts | Other current assets | $ | — | |||
Commodity contracts | Other current assets | 0.1 | ||||
Total derivatives designated as hedging instruments | $ | 0.1 | ||||
ASSET DERIVATIVES | ||||||
(in millions) | Balance Sheet Location | Fair Value | ||||
Derivatives NOT designated as hedging instruments | ||||||
Foreign exchange contracts | Other current assets | $ | — | |||
Total derivatives NOT designated as hedging instruments | $ | — | ||||
Total asset derivatives | $ | 0.1 | ||||
The fair value of outstanding derivative contracts recorded as liabilities in the accompanying combined balance sheet as of December 31, 2013, was as follows:
LIABILITIES DERIVATIVES | ||||||
(in millions) | Balance Sheet Location | Fair Value | ||||
Derivatives designated as hedging instruments | ||||||
Foreign exchange contracts | Accounts payable and accrued expenses | $ | 0.4 | |||
Commodity contracts | Accounts payable and accrued expenses | 0.4 | ||||
Total derivatives designated as hedging instruments | $ | 0.8 | ||||
-69-
LIABILITY DERIVATIVES | ||||||
(in millions) | Balance Sheet Location | Fair Value | ||||
Derivatives NOT designated as hedging instruments | ||||||
Foreign exchange contracts | Accounts payable and accrued expenses | $ | — | |||
Total derivatives NOT designated as hedging instruments | $ | — | ||||
Total liability derivatives | $ | 0.8 | ||||
The effect of derivative instruments on the combined statement of operations for the year ended December 31, 2013, and gains or losses initially recognized in AOCI in the combined balance sheet were as follows:
Derivatives in Cash Flow Hedging Relationships (in millions) | Amount of Gain or (Loss) Recognized in AOCI on Derivative (Effective Portion, net of tax) | Location of Gain or (Loss) Reclassified from AOCI into Income (Effective Portion) | Amount of Gain or (Loss) Reclassified from AOCI into Income (Effective Portion) | |||||||
Foreign exchange contracts | $ | (0.3 | ) | Cost of sales | $ | (0.4 | ) | |||
Commodity contracts | 0.3 | Cost of sales | (1.5 | ) | ||||||
Total | $ | — | $ | (1.9 | ) | |||||
Derivatives Relationships (in millions) | Location of Gain or (Loss) Recognized in Income on Derivative (Ineffective Portion and Amount Excluded from Effectiveness Testing) | Amount of Gain or (Loss) Recognized in Income on Derivative (Ineffective Portion and Amount Excluded from Effectiveness Testing) | ||||
Commodity contracts | Cost of sales | $ | 0.1 | |||
Total | $ | 0.1 | ||||
7. Inventories
The components of inventories at December 31, 2015 and December 31, 2014 are summarized as follows:
(in millions) | 2015 | 2014 | ||||||
Inventories — gross: | ||||||||
Raw materials | $ | 70.7 | $ | 77.2 | ||||
Work-in-process | 18.7 | 21.5 | ||||||
Finished goods | 83.4 | 87.9 | ||||||
Total inventories — gross | 172.8 | 186.6 | ||||||
Excess and obsolete inventory reserve | (23.5 | ) | (20.3 | ) | ||||
Net inventories at FIFO cost | 149.3 | 166.3 | ||||||
Excess of FIFO costs over LIFO value | (3.4 | ) | (3.1 | ) | ||||
Inventories — net | $ | 145.9 | $ | 163.2 | ||||
-70-
8. Property, Plant and Equipment
The components of property, plant and equipment at December 31, 2015 and December 31, 2014 are summarized as follows:
(in millions) | 2015 | 2014 | ||||||
Land | $ | 7.3 | $ | 6.6 | ||||
Building and improvements | 94.3 | 100.1 | ||||||
Machinery, equipment and tooling | 216.0 | 237.0 | ||||||
Furniture and fixtures | 6.2 | 6.6 | ||||||
Computer hardware and software | 51.2 | 58.5 | ||||||
Construction in progress | 9.8 | 12.7 | ||||||
Total cost | 384.8 | 421.5 | ||||||
Less accumulated depreciation | (268.4 | ) | (287.2 | ) | ||||
Property, plant and equipment - net | $ | 116.4 | $ | 134.3 | ||||
9. Goodwill and Other Intangible Assets
MFS has three reportable segments: Americas, EMEA, and APAC. The changes in the carrying amount of goodwill by reportable segment for the years ended December 31, 2015, 2014 and 2013 were as follows:
(in millions) | Americas | EMEA | APAC | Total | ||||||||||||
Gross balance as of January 1, 2013 | $ | 1,172.8 | $ | 204.5 | $ | 7.4 | $ | 1,384.7 | ||||||||
Acquisition of Inducs | — | 5.0 | — | 5.0 | ||||||||||||
Restructuring reserve adjustment | (0.7 | ) | — | — | (0.7 | ) | ||||||||||
Foreign currency impact | 0.6 | (0.6 | ) | 0.1 | 0.1 | |||||||||||
Gross balance as of December 31, 2013 | 1,172.7 | 208.9 | 7.5 | 1,389.1 | ||||||||||||
Accumulated asset impairments | (312.2 | ) | (203.5 | ) | — | (515.7 | ) | |||||||||
Net balance as of December 31, 2013 | 860.5 | 5.4 | 7.5 | 873.4 | ||||||||||||
Foreign currency impact | — | (0.5 | ) | (0.1 | ) | (0.6 | ) | |||||||||
Gross balance as of December 31, 2014 | 1,172.7 | 208.4 | 7.4 | 1,388.5 | ||||||||||||
Accumulated asset impairments | (312.2 | ) | (203.5 | ) | — | (515.7 | ) | |||||||||
Net balance as of December 31, 2014 | 860.5 | 4.9 | 7.4 | 872.8 | ||||||||||||
Foreign currency impact | — | (0.1 | ) | (0.4 | ) | (0.5 | ) | |||||||||
Impact of acquisitions and divestitures | (27.9 | ) | — | 1.4 | (26.5 | ) | ||||||||||
Gross balance as of December 31, 2015 | 1,144.8 | 208.3 | 8.4 | 1,361.5 | ||||||||||||
Accumulated asset impairments | (312.2 | ) | (203.5 | ) | — | (515.7 | ) | |||||||||
Net balance as of December 31, 2015 | $ | 832.6 | $ | 4.8 | $ | 8.4 | $ | 845.8 | ||||||||
MFS accounts for goodwill and other intangible assets under the guidance of ASC Topic 350, “Intangibles - Goodwill and Other.” MFS performs an annual impairment test at June 30 of every year or more frequently if events or changes in circumstances indicate that the asset might be impaired. MFS tests its reporting units and indefinite-lived intangible assets using a fair-value method based on the present value of future cash flows, which involves management’s judgments and assumptions about the amounts of those cash flows and the discount rates used. The estimated fair value is then compared with the carrying amount of the reporting unit, including recorded goodwill, or indefinite-lived intangible asset. The intangible asset is then subject to risk of write-down to the extent that the carrying amount exceeds the estimated fair value.
As of June 30, 2015, 2014, and 2013, MFS performed the annual impairment test for its reporting units, which were Americas; EMEA; and APAC, as well as its indefinite-lived intangible assets, and based on those results, no impairment was indicated in any of those periods.
As discussed in Note 3, “Acquisitions,” on October 1, 2013, MFS acquired all remaining shares of Inducs in which it previously held a minority interest. The aggregate purchase price of $12.2 million, net of cash, resulted in $7.0 million of identifiable intangible assets and $5.0 million of goodwill. Of the $7.0 million of acquired intangible assets, $0.7 million was assigned to trademarks that are not subject to amortization, $1.2 million was assigned to customer relationships with a useful life of 19 years, and $5.1 million was assigned to developed technology with a useful life of 12 years. On October 21, 2015, the Company acquired the remaining 50% of outstanding shares of a joint venture in Thailand. The purchase price, net of cash acquired, was approximately $5.3 million. Allocation of the purchase price resulted in $1.4 million of goodwill and $4.2 million of intangible assets.
-71-
The gross carrying amount and accumulated amortization of MFS’ intangible assets other than goodwill are as follows as of December 31, 2015 and December 31, 2014:
December 31, 2015 | December 31, 2014 | |||||||||||||||||||||||
(in millions) | Gross Carrying Amount | Accumulated Amortization Amount | Net Book Value | Gross Carrying Amount | Accumulated Amortization Amount | Net Book Value | ||||||||||||||||||
Trademarks and tradenames | $ | 175.1 | $ | — | $ | 175.1 | $ | 199.4 | $ | — | $ | 199.4 | ||||||||||||
Customer relationships | 415.2 | (150.4 | ) | 264.8 | 415.0 | (129.5 | ) | 285.5 | ||||||||||||||||
Patents | 1.7 | (1.6 | ) | 0.1 | 1.7 | (1.4 | ) | 0.3 | ||||||||||||||||
Other intangibles | 143.2 | (63.6 | ) | 79.6 | 160.7 | (61.4 | ) | 99.3 | ||||||||||||||||
Total | $ | 735.2 | $ | (215.6 | ) | $ | 519.6 | $ | 776.8 | $ | (192.3 | ) | $ | 584.5 | ||||||||||
Amortization expense for the years ended December 31, 2015, 2014 and 2013 was $31.4 million, $31.8 million and $31.4 million, respectively. Excluding the impact of any future acquisitions or divestitures, MFS anticipates amortization will be approximately $32 million per year for the next five years.
10. Accounts Payable and Accrued Expenses and Other Liabilities
Accounts payable and Accrued expenses and other liabilities at December 31, 2015 and December 31, 2014 are summarized as follows:
(in millions) | 2015 | 2014 | ||||||
Accounts payable: | ||||||||
Trade accounts payable and interest payable | $ | 121.7 | $ | 161.6 | ||||
Income taxes payable | 7.3 | 5.2 | ||||||
Total accounts payable | $ | 129.0 | $ | 166.8 | ||||
Accrued expenses and other liabilities: | ||||||||
Employee related expenses | 24.5 | 31.1 | ||||||
Restructuring expenses | 16.8 | 15.6 | ||||||
Profit sharing and incentives | 3.9 | 4.1 | ||||||
Accrued rebates | 51.6 | 52.3 | ||||||
Deferred revenue - current | 3.8 | 3.8 | ||||||
Dividend payable to MTW | 10.2 | 6.2 | ||||||
Customer advances | 2.9 | 3.9 | ||||||
Product liability | 2.6 | 2.2 | ||||||
Miscellaneous accrued expenses | 41.3 | 46.1 | ||||||
Total accrued expenses and other liabilities | $ | 157.6 | $ | 165.3 | ||||
11. Accounts Receivable Securitization
Historically MFS sold accounts receivable through an accounts receivable securitization facility, ("The Securitization Program"), comprised of two funding entities: Manitowoc Funding, LLC (“U.S. Seller”) and Manitowoc Cayman Islands Funding Ltd. (“Cayman Seller”). The U.S. Seller historically serviced domestic entities of both the Foodservice and Crane segments of MTW and remitted all funds received directly to MTW. The Cayman Seller historically serviced solely MFS foreign entities and remitted all funds to MFS entities. The U.S. Seller entity remained with MTW subsequent to the Spin-Off, while the Cayman Seller was transferred to MFS subsequent to the Spin-Off. As the U.S. Seller is not directly attributable to MFS, only the receivables which were transferred to the U.S. Seller but not sold are reflected in MFS combined balance sheet. A portion of the U.S. Seller’s historical expenses related to bond administration fees and settlement fees are allocated to MFS. As the Cayman Seller is directly attributable to MFS, the assets, liabilities, income, and expenses of the Cayman Seller are included in MFS’ consolidated statement of earnings and balance sheet.
On December 15, 2014, MTW executed a Fifth Amended and Restated Receivables Purchase Agreement (the “Receivables Purchase Agreement”) among the U.S. Seller and Cayman Seller, as sellers, MTW, Garland Commercial Ranges Limited (“Garland”), Convotherm Elektrogeräte GmbH (“Convotherm”), Manitowoc Deutschland GmbH (“MTW Deutschland”), Manitowoc Foodservice UK Limited (“Foodservice UK”), and the other persons from time to time party thereto, as servicers, and Wells Fargo Bank, N.A. (“Wells Fargo” or “Purchaser”), as purchaser and agent. Pursuant to this amendment, a German subsidiary (MTW Deutschland) and a United Kingdom subsidiary (Foodservice UK) were added as “originators” under the facility. Under the Receivables Purchase Agreement (and the related Purchase and Sale Agreements referenced in the Receivables Purchase Agreement), certain of MFS' non-U.S. trade accounts receivable were
-72-
sold to Cayman Seller which, in turn, were sold to Purchaser, all of the Cayman Seller’s right, title and interest in and to a pool of receivables to the Purchaser.
The Purchaser received ownership of the pool of receivables, in each instance. New receivables are purchased by Cayman Seller and resold to the Purchaser as cash collections reduce previously sold investments. Garland, Convotherm, MTW Deutschland, and Foodservice UK acted as the servicers of the receivables and as such administered, collected and otherwise enforced the receivables. The servicers were compensated for doing so on terms generally consistent with what would be charged by an unrelated servicer. As servicers, they initially received payments made by obligors on the receivables but were required to remit those payments to the Purchaser in accordance with the Receivables Purchase Agreement. The Purchaser has no recourse for uncollectible receivables. MTW finalized changes to its accounts receivable securitization program. Among other actions, MTW entered into an amendment to the Receivables Purchase Agreement, the results of which were that (i) Manitowoc Foodservice Asia Pacific Private Limited ("Foodservice Asia") was added as an originator and as a servicer under the facility; and (ii) MFS' domestic originators were effectively released from their obligations under the related purchase and sale agreement and will now sell their accounts receivable to the Cayman Seller (prior to these changes, these receivables were sold to the U.S. Seller). The maximum commitment size of the securitization facility did not change and, therefore, remains at $185.0 million. MFS' cost of funds under the facility continues to use a LIBOR index rate plus a 1.25% fixed spread.
Under the Receivables Purchase Agreement (and the related Purchase and Sale Agreements referenced in the Receivables Purchase Agreement), certain of MFS' non-U.S. trade accounts receivable are sold to Cayman Seller which, in turn, will sell, convey, transfer and assign to Purchaser, all of the Cayman Seller’s right, title and interest in and to a pool of receivables to the Purchaser.
Due to a short average collection cycle of less than 60 days for such accounts receivable as well as MFS' collection history, the fair value of MFS' deferred purchase price notes approximated book value. The fair value of the deferred purchase price notes recorded at December 31, 2015 and 2014 was $48.4 million and $33.1 million, respectively, and is included in accounts receivable in the accompanying combined balance sheets.
Trade accounts receivables sold to the Purchaser and being serviced by the Company totaled $100.9 million at December 31, 2015 and $21.1 million at December 31, 2014.
Transactions under the Securitization Program were accounted for as sales in accordance with ASC Topic 860, “Transfers and Servicing.” Sales of trade receivables to the Purchaser are reflected as a reduction of accounts receivable in the accompanying combined balance sheets and the proceeds received, including collections on the deferred purchase price notes, are included in cash flows from operating activities in the accompanying combined statements of cash flows. MFS deems the interest rate risk related to the deferred purchase price notes to be de minimis, primarily due to the short average collection cycle of the related receivables (i.e., 60 days) as noted above.
12. Income Taxes
In the combined financial statements, income tax expense and deferred tax balances have been calculated on a separate return basis although the MFS operations have historically been included in the tax returns filed by the respective MTW entities. With the exception of certain separate filing Foodservice entities that will transfer to MFS after the Spin-Off, current income tax liabilities were deemed to settle immediately with MTW tax paying entities in the respective jurisdictions. These settlements were reflected as changes in the net parent company investment account. In the future, as a standalone entity, MFS will file tax returns on its own behalf and its deferred taxes and effective tax rate may differ from those in historical periods.
Earnings from continuing operations are summarized below:
(in millions) | 2015 | 2014 | 2013 | |||||||||
Earnings from continuing operations before income taxes: | ||||||||||||
Domestic | $ | 121.2 | $ | 123.3 | $ | 157.2 | ||||||
Foreign | 75.1 | 63.9 | 47.4 | |||||||||
Total | $ | 196.3 | $ | 187.2 | $ | 204.6 | ||||||
-73-
Provision for income taxes from continuing operations is summarized below:
(in millions) | 2015 | 2014 | 2013 | |||||||||
Current: | ||||||||||||
Federal and state | $ | 51.1 | $ | 28.3 | $ | 51.9 | ||||||
Foreign | 18.2 | 15.1 | 13.0 | |||||||||
Total current | $ | 69.3 | $ | 43.4 | $ | 64.9 | ||||||
Deferred: | ||||||||||||
Federal and state | $ | (27.9 | ) | $ | (12.0 | ) | $ | (9.0 | ) | |||
Foreign | (2.1 | ) | (5.5 | ) | (0.6 | ) | ||||||
Total deferred | $ | (30.0 | ) | $ | (17.5 | ) | $ | (9.6 | ) | |||
Provision for taxes on earnings | $ | 39.3 | $ | 25.9 | $ | 55.3 | ||||||
The differences between the U.S. federal statutory income tax rate and MFS' effective tax rate were as follows:
2015 | 2014 | 2013 | |||||||
Federal income tax at statutory rate | 35.0 | % | 35.0 | % | 35.0 | % | |||
State income provision | 1.4 | 1.4 | 1.9 | ||||||
Manufacturing and research incentives | (1.7 | ) | (1.7 | ) | (2.9 | ) | |||
Taxes on foreign income which differ from the U.S. statutory rate | (3.9 | ) | (2.4 | ) | (3.2 | ) | |||
Adjustments for unrecognized tax benefits | 0.1 | 4.3 | (3.5 | ) | |||||
Adjustments for valuation allowances | (13.8 | ) | 21.5 | (0.3 | ) | ||||
Capital loss generation | — | (41.4 | ) | — | |||||
Business acquisitions & divestitures | 4.1 | — | — | ||||||
Other items | (1.1 | ) | (2.9 | ) | — | ||||
Effective tax rate | 20.1 | % | 13.8 | % | 27.0 | % | |||
The 2015, 2014 and 2013 effective tax rates were favorably impacted by income earned in jurisdictions where the statutory rate was less than 35%.
The 2015 tax provision benefited by $17.8 million related to the divestiture of Kysor Panel Systems business resulting in a favorable impact to the effective tax rate. The benefit was primarily due to the write-off of $13.8 million of an unamortized deferred tax liability that was recorded in purchase accounting and as a result of the utilization of a capital loss carryforward to offset the tax gain.
In the third quarter of 2014, MFS made an election with the IRS to treat Enodis Holdings, Ltd, MFS’ UK Holding Company, as a partnership for U.S. income tax purposes. As a result of this status change, MFS realized a $25.6 million capital loss tax benefit. This transaction resulted in an effective tax rate benefit of 13.7% unique to 2014.
The 2013 effective tax rate benefited from the release of uncertain tax position reserves related to favorable audit settlements.
The significant components of deferred tax assets and deferred tax liabilities were as follows:
-74-
(in millions) | 2015 | 2014 | ||||||
Current deferred tax assets (liabilities): | ||||||||
Inventories | $ | — | $ | 5.1 | ||||
Accounts receivable | — | 1.2 | ||||||
Product warranty reserves | — | 10.9 | ||||||
Product liability reserves | — | 0.8 | ||||||
Deferred revenue, current portion | — | (0.2 | ) | |||||
Deferred employee benefits | — | 4.7 | ||||||
Other reserves and allowances | — | 5.4 | ||||||
Less valuation allowance | — | (8.3 | ) | |||||
Net deferred tax assets, current (1) | $ | — | $ | 19.6 | ||||
Non-current deferred tax assets (liabilities): | ||||||||
Inventories | $ | 7.6 | $ | — | ||||
Accounts receivable | 1.2 | — | ||||||
Property, plant and equipment | (2.8 | ) | (8.3 | ) | ||||
Intangible assets | (218.9 | ) | (242.4 | ) | ||||
Deferred employee benefits | 15.7 | 12.7 | ||||||
Product warranty reserves | 14.4 | 3.9 | ||||||
Product liability reserves | 1.0 | — | ||||||
Loss carryforwards | 84.9 | 119.1 | ||||||
Deferred revenue | 1.1 | 1.5 | ||||||
Other | 16.9 | 9.7 | ||||||
Total non-current deferred tax liabilities | (78.9 | ) | (103.8 | ) | ||||
Less valuation allowance | (80.1 | ) | (104.9 | ) | ||||
Net deferred tax liabilities, non-current | $ | (159.0 | ) | $ | (208.7 | ) | ||
(1) - In 2015, MFS early adopted ASU No. 2015-17, "Balance Sheet Classification of Deferred Taxes” which eliminated the requirement to present deferred tax liabilities and assets as current and non-current on the balance sheet. Prior periods were not retrospectively adjusted. | ||||||||
Current and long-term tax assets and liabilities included in the combined balance sheets were as follows:
(in millions) | 2015 | 2014 | ||||||
Current income tax asset | $ | — | $ | 23.7 | ||||
Long-term income tax assets, included in other non-current assets | 8.9 | 9.3 | ||||||
Current deferred income tax liability, included in accounts payable and accrued expenses | — | (4.1 | ) | |||||
Long-term deferred income tax liability | (167.9 | ) | (218.0 | ) | ||||
Net deferred income tax liability | $ | (159.0 | ) | $ | (189.1 | ) | ||
MFS has not provided for additional U.S. income taxes on approximately $79.5 million of undistributed earnings of combined non-U.S. subsidiaries as of December 31, 2015 because the Company intends to reinvest such earnings indefinitely outside of the United States. Such earnings could become taxable upon sale or liquidation of these non-U.S. subsidiaries or upon dividend repatriation of cash balances. It is not practicable to estimate the amount of the unrecognized tax liability on such earnings
As of December 31, 2015, MFS has approximately $340.7 million of foreign loss carryforwards, which are available to reduce future foreign tax liabilities. Substantially all of the foreign loss carryforwards are not subject to any time restrictions on their future use, and $328.0 million are offset by a valuation allowance. MFS also has approximately $63.3 million of U.S. capital loss carryforwards which expire in 2019 and are offset by a valuation allowance.
MFS continues to record valuation allowances on the deferred tax assets in the United Kingdom, as it remains more likely than not that they will not be utilized.
MFS will continue to periodically evaluate its valuation allowance requirements in light of changing facts and circumstances, and may adjust its deferred tax asset valuation allowances accordingly. It is reasonably possible that MFS will either add to, or reverse a portion of its existing deferred tax asset valuation allowances in the future. Such changes in the deferred tax asset valuation allowances will be reflected in the current operations through MFS’ income tax provision, and could have a material effect on operating results.
-75-
A reconciliation of MFS’ unrecognized tax benefits is as follows:
(in millions) | 2015 | 2014 | 2013 | |||||||||
Balance at beginning of year | $ | 16.6 | $ | 7.8 | $ | 17.1 | ||||||
Additions based on tax positions related to the current year | 0.2 | 14.1 | 1.0 | |||||||||
Additions for tax positions of prior years | — | — | 0.1 | |||||||||
Reductions based on settlements with taxing authorities | — | (2.8 | ) | (8.0 | ) | |||||||
Reductions for lapse of statute | (0.2 | ) | (2.5 | ) | (2.4 | ) | ||||||
Balance at end of year | $ | 16.6 | $ | 16.6 | $ | 7.8 | ||||||
Substantially all of MFS’ unrecognized tax benefits as of December 31, 2015, 2014 and 2013, if recognized, would affect the effective tax rate.
MFS recognizes interest and penalties related to tax liabilities as a part of income tax expense. As of December 31, 2015 and 2014, MFS has accrued interest and penalties of $0.9 million and $0.8 million, respectively.
MTW concluded an examination of its 2007 through 2009 U.S. tax returns during the third quarter of 2014 as well as an examination its 2010 and 2011 U.S. tax returns in the fourth quarter of 2014. The adjustments did not have a material impact on the financial statements.
MTW is under examination by the Internal Revenue Service for calendar year 2014. There have been no significant developments with respect to the Company’s ongoing tax audits in other jurisdictions.
MTW has filed tax returns on behalf of MFS in the U.S. and various state and foreign jurisdictions through tax year 2015. The 2012 through 2015 tax years remain subject to examination by the IRS. The 2011 though 2015 tax years generally remain subject to examination by state authorities, and tax years 2011 through 2015 remain subject to examination in Germany. Tax years 2007 through 2015 remain subject to audit in China.
MFS regularly assesses the likelihood of an adverse outcome resulting from examinations to determine the adequacy of its tax reserves. As of December 31, 2015, MFS believes that it is more likely than not that the tax positions it has taken will be sustained upon the resolution of its audits resulting in no material impact on its combined financial position and the results of operations and cash flows. However, the final determination with respect to any tax audits, and any related litigation, could be materially different from the Company’s estimates and/or from its historical income tax provisions and accruals and could have a material effect on operating results and/or cash flows in the periods for which that determination is made. In addition, future period earnings may be adversely impacted by litigation costs, settlements, penalties, and/or interest assessments.
During the next twelve months, it is reasonably possible that federal, state and foreign tax audit resolutions could reduce unrecognized tax benefits and income tax expense by up to $0.7 million, either because MFS' tax positions are sustained on audit or settled, or the applicable statute of limitations closes.
13. Other Operating and Non-Operating Expenses
The components of the line item 'Other operating expense' in the Combined Statements of Operations for the years ended December 31, 2015, 2014, and 2013, are summarized as follows:
(in millions) | 2015 | 2014 | 2013 | |||||||||
Amortization expense | 31.4 | 31.8 | 31.4 | |||||||||
Asset impairments | 9.0 | 1.1 | — | |||||||||
Restructuring expense | 4.6 | 2.6 | 2.9 | |||||||||
Separation expense | 4.3 | — | — | |||||||||
Other expense (income) | 0.9 | 0.4 | (0.8 | ) | ||||||||
Total other operating expense | $ | 50.2 | $ | 35.9 | $ | 33.5 | ||||||
-76-
The components of the line item 'Other income (expense) - net' in the Combined Statements of Operations for the years ended December 31, 2015, 2014, and 2013, are summarized as follows:
(in millions) | 2015 | 2014 | 2013 | |||||||||
Gain on sale of Kysor Panel Systems | $ | 9.9 | $ | — | $ | — | ||||||
Gain on sale of investment property | 5.4 | — | — | |||||||||
Gain on acquisition of Thailand joint venture | 4.9 | — | — | |||||||||
Other (1) | 1.8 | (0.6 | ) | 0.7 | ||||||||
Other income (expense) - net | $ | 22.0 | $ | (0.6 | ) | $ | 0.7 | |||||
(1) Other consists primarily of foreign currency gains and losses. | ||||||||||||
The sale of Kysor Panel Systems is discussed further in Note 4, "Discontinued Operations and Divestitures." The acquisition of the Thailand joint venture is discussed further in Note 3, "Acquisitions."
14. Accumulated Other Comprehensive Income (“AOCI”)
The components of accumulated other comprehensive income (loss) as of December 31, 2015 and December 31, 2014 are as follows:
(in millions) | 2015 | 2014 | ||||||
Foreign currency translation | $ | (7.9 | ) | $ | 17.3 | |||
Derivative instrument fair market value, net of income taxes of $0.9 and $0.4 | (1.8 | ) | (1.0 | ) | ||||
Employee pension and postretirement benefit adjustments, net of income taxes of $0.3 and $0.8 | (34.8 | ) | (37.0 | ) | ||||
$ | (44.5 | ) | $ | (20.7 | ) | |||
Summaries of the changes in accumulated other comprehensive income (loss), net of tax, by component for the years ended December 31, 2014, and December 31, 2015 are as follows:
(in millions) | Foreign Currency Translation | Gains and Losses on Cash Flow Hedges | Pension & Postretirement | Total | ||||||||||||
Balance at December 31, 2013 | $ | 34.2 | $ | (0.4 | ) | $ | (32.6 | ) | $ | 1.2 | ||||||
Other comprehensive loss before reclassifications | (16.9 | ) | (1.4 | ) | (4.8 | ) | (23.1 | ) | ||||||||
Amounts reclassified from accumulated other comprehensive income | — | 0.8 | 0.4 | 1.2 | ||||||||||||
Net current period other comprehensive loss | (16.9 | ) | (0.6 | ) | (4.4 | ) | (21.9 | ) | ||||||||
Balance at December 31, 2014 | $ | 17.3 | $ | (1.0 | ) | $ | (37.0 | ) | $ | (20.7 | ) | |||||
Other comprehensive (loss) income before reclassifications | (25.2 | ) | (3.8 | ) | 1.1 | (27.9 | ) | |||||||||
Amounts reclassified from accumulated other comprehensive income | — | 3.0 | 1.1 | 4.1 | ||||||||||||
Net current period other comprehensive (loss) income | (25.2 | ) | (0.8 | ) | 2.2 | (23.8 | ) | |||||||||
Balance at December 31, 2015 | $ | (7.9 | ) | $ | (1.8 | ) | $ | (34.8 | ) | $ | (44.5 | ) | ||||
-77-
A reconciliation of the reclassifications out of accumulated other comprehensive income, net of tax, for the year ended December 31, 2015 is as follows:
(in millions) | Amount Reclassified from Accumulated Other Comprehensive Income | Recognized Location | ||||
Gains and losses on cash flow hedges | ||||||
Foreign exchange contracts | $ | (1.4 | ) | Cost of sales | ||
Commodity contracts | (3.4 | ) | Cost of sales | |||
(4.8 | ) | Total before tax | ||||
1.8 | Tax expense | |||||
$ | (3.0 | ) | Net of tax | |||
Amortization of pension and postretirement items | ||||||
Amortization of prior service cost | — | (a) | ||||
Actuarial losses | (1.1 | ) | (a) | |||
(1.1 | ) | Total before tax | ||||
— | Tax benefit | |||||
$ | (1.1 | ) | Net of Tax | |||
Total reclassifications for the period | $ | (4.1 | ) | Net of Tax | ||
(a) These other comprehensive income components are included in the net periodic pension cost (see Note 19, “Employee Benefit Plans,” for further details). | ||||||
A reconciliation of the reclassifications out of accumulated other comprehensive income, net of tax, for the year ended December 31, 2014 is as follows:
(in millions) | Amount Reclassified from Accumulated Other Comprehensive Income | Recognized Location | ||||
Gains and losses on cash flow hedges | ||||||
Foreign exchange contracts | $ | (0.9 | ) | Cost of sales | ||
Commodity contracts | (0.3 | ) | Cost of sales | |||
(1.2 | ) | Total before tax | ||||
0.4 | Tax expense | |||||
$ | (0.8 | ) | Net of tax | |||
Amortization of pension and postretirement items | ||||||
Amortization of prior service cost | 0.3 | (a) | ||||
Actuarial losses | (0.8 | ) | (a) | |||
(0.5 | ) | Total before tax | ||||
0.1 | Tax benefit | |||||
$ | (0.4 | ) | Net of Tax | |||
Total reclassifications for the period | $ | (1.2 | ) | Net of Tax | ||
(a) These other comprehensive income components are included in the net periodic pension cost (see Note 19, “Employee Benefit Plans,” for further details). | ||||||
15. Stock-Based Compensation
During the periods presented certain employees of MFS participated in stock-based compensation plans sponsored by MTW. Under these stock-based compensation plans, MTW provided awards to employees of MFS with restricted common stock, restricted stock units, and stock options to purchase shares of Manitowoc. Because MFS employees provide services in consideration for their participation in MFS' plans, the stock-based compensation expense for the awards granted to MFS employees has been reflected in the combined financial statements. See Note 23, “Net Parent Company Investment and Related Party Transactions” for further information on corporate allocations.
-78-
MFS recognizes expense for all stock-based compensation on a straight-line basis over the vesting period of the entire award.
Total stock-based compensation expense before tax was $2.3 million, $2.4 million and $3.5 million during 2015, 2014, and 2013, respectively. In 2015, the company also recognized $0.5 million of expense before tax related to restricted stock retention awards.
Stock Options
Any option granted to directors of MTW were exercisable immediately upon granting and expire ten years subsequent to the grant date. For all outstanding grants made to officers and employees prior to 2011, options become exercisable in 25% increments annually over a four-year period beginning on the second anniversary of the grant date and expire ten years subsequent to the grant date. Starting with 2011 grants to officers and directors, such options become exercisable in 25% increments annually over a four-year period beginning on the first anniversary of the grant date and expire ten years subsequent to the grant date.
MTW granted options to MFS employees to acquire 0.4 million, 0.1 million and 0.1 million shares of common stock during 2015, 2014, and 2013, respectively. Stock-based compensation expense is calculated by estimating the fair value of incentive and non-qualified stock options at the time of grant and is amortized over the stock options’ vesting period. MFS recognized $0.6 million ($0.4 million after taxes), $0.9 million ($0.5 million after taxes) and $1.7 million ($1.0 million after taxes) of compensation expense associated with stock options during 2015, 2014, and 2013, respectively.
A summary of MFS' stock option activity is as follows (in millions, except weighted average exercise price per share):
Shares | Weighted Average Exercise Price | Aggregate Intrinsic Value | |||||||||
Options outstanding as of January 1, 2015 | 0.7 | $ | 15.90 | ||||||||
Additional options transferred and outstanding as of January 1, 2015 | 0.5 | 16.31 | |||||||||
Total options outstanding as of January 1, 2015 | 1.2 | 16.31 | |||||||||
Granted | 0.4 | 19.59 | |||||||||
Exercised | (0.2 | ) | 9.08 | ||||||||
Cancelled | — | 22.26 | |||||||||
Options outstanding as of December 31, 2015 | 1.4 | $ | 17.70 | $ | 3.2 | ||||||
Options exercisable as of: | |||||||||||
December 31, 2015 | 1.0 | $ | 16.91 | $ | 3.2 | ||||||
The outstanding stock options at December 31, 2015 have a range of exercise prices from $4.41 to $43.33 per share. The following table shows the options outstanding and exercisable by range of exercise prices at December 31, 2015 (in millions, except range of exercise price per share, weighted average remaining contractual life and weighted average exercise price):
Range of Exercise Price per Share | Outstanding Options | Weighted Average Remaining Contractual Life (Years) | Weighted Average Exercise Price | Exercisable Options | Weighted Average Exercise Price | |||||||||||
$4.41 - $11.34 | 0.2 | 2.9 | $ | 4.41 | 0.2 | $ | 4.41 | |||||||||
$11.35 - $18.13 | 0.4 | 5.4 | 13.79 | 0.3 | 12.72 | |||||||||||
$18.14 - $26.09 | 0.4 | 5.2 | 20.13 | 0.3 | 19.70 | |||||||||||
$26.10 - $29.06 | 0.1 | 0.3 | 26.10 | — | 26.10 | |||||||||||
$29.07 - $38.86 | 0.2 | 3.7 | 29.27 | 0.1 | 29.34 | |||||||||||
$38.87 - $43.33 | 0.1 | 1.9 | 39.27 | 0.1 | 39.27 | |||||||||||
1.4 | 4.3 | $ | 17.70 | 1.0 | $ | 16.91 | ||||||||||
MFS uses the Black-Scholes valuation model to value stock options. MFS used historical stock prices for MTW shares of common stock as the basis for its volatility assumption. The assumed risk-free rates were based on ten-year U.S. Treasury rates in effect at the time of grant. The expected option life represents the period of time that the options granted are expected to be outstanding and is based on historical experience.
As of December 31, 2015, MFS has $1.4 million of unrecognized compensation expense before tax related to stock options, which will be recognized over a weighted average period of 3.3 years.
-79-
The weighted average fair value of options granted per share during the years ended December 31, 2015, 2014, and 2013 was $9.71, $14.83, and $9.00, respectively. The fair value of each option grant was estimated at the date of grant using the Black-Scholes option-pricing method with the following assumptions:
2015 | 2014 | 2013 | |||||||
Expected Life (years) | 6.0 | 6.0 | 6.0 | ||||||
Risk-free Interest rate | 1.8 | % | 1.9 | % | 1.1 | % | |||
Expected volatility | 56.0 | % | 55.0 | % | 56.0 | % | |||
Expected dividend yield | 0.3 | % | 0.4 | % | 0.6 | % | |||
For the years ended December 31, 2015, 2014, and 2013 the total intrinsic value of stock options exercised was $1.8 million, $8.0 million, and $1.5 million, respectively.
Restricted Stock Units
MTW granted restricted performance stock units of 0.2 million, 0.1 million and 0.1 million in 2015, 2014, and 2013, respectively. The restricted stock units are earned either based on service over the vesting period, or based on service over the vesting period on the extent to which performance goals are met over the applicable performance period (“performance shares”). The performance goals and the applicable performance period vary for each grant year. MFS recognized $1.7 million ($1.1 million after taxes), $0.9 million ($0.6 million after taxes) and $1.0 million ($0.6 million after taxes) of compensation expense associated with restricted stock units during 2015, 2014 and 2013, respectively.
The restricted stock units granted to employees in 2015 generally vest on the third anniversary of the grant date, assuming continued employment. The restricted stock units granted to directors in 2015 generally vest on the second anniversary of the grant date, assuming continued service. Performance shares were not granted in 2015 due to anticipated separation.
The restricted stock units granted to employees in 2014 vest on the third anniversary of the grant date. The restricted stock units granted to directors in 2014 vest on the second anniversary of the grant date. The performance shares granted in 2014 are earned based on the extent to which performance goals are met by MFS over a three-year period from January 1, 2014 to December 31, 2016. The performance goals for the performance shares granted in 2014 are based fifty percent (50%) on total shareholder return relative to a peer group of companies over the three-year period and fifty percent (50%) on EVA® improvement over the three-year period. In view of the Spin-Off, the Board of MTW prior to the Spin-Off agreed that the 2014 performance share award would be paid-out at target at the end of the three-year performance period. Depending on the foregoing factors, the number of shares awarded could range from zero to 0.1 million for the 2014 performance share grants. For these awards, the expense is based on the fair value of MTW's shares as of the grant date for the EVA® improvement criteria and a Monte Carlo model for the total shareholder return criteria.
The performance shares granted in 2013 were earned based on the extent to which performance goals are met by MFS over a three-year period from January 1, 2013 to December 31, 2015. The performance goals for the performance shares granted in 2013 were based fifty percent (50%) on total shareholder return relative to a peer group of companies over the three-year period and fifty percent (50%) on debt reduction over the three-year period. These awards were earned at 78.6% of target, which resulted in a payout of 0.1 million shares in 2016. For these awards, the expense was based on the fair value of the company's shares as of the grant date for the debt reduction criteria and a Monte Carlo model for the total shareholder return criteria.
A summary of activity for restricted stock units for the year ended December 31, 2015 is as follows (in millions except weighted average grant date fair value):
Shares | Weighted Average Grant Date Fair Value | ||||||
Unvested as of January 1, 2015 | 0.2 | $ | 30.72 | ||||
Granted | 0.2 | 21.67 | |||||
Vested | (0.1 | ) | 24.82 | ||||
Cancelled | (0.1 | ) | 24.11 | ||||
Unvested as of December 31, 2015 | 0.2 | $ | 24.50 | ||||
As of December 31, 2015, MFS had $1.7 million of unrecognized compensation expense before tax related to restricted performance stock units which will be recognized over a weighted average period of 1.8 years.
-80-
16. Contingencies and Significant Estimates
As of December 31, 2015, MFS held reserves for environmental matters related to Enodis locations of approximately $0.4 million. At certain of MFS’ other facilities, we have identified potential contaminants in soil and groundwater. The ultimate cost of any remediation required will depend upon the results of future investigation. Based upon available information, we do not expect the ultimate costs at any of these locations will have a material adverse effect on its financial condition, results of operations, or cash flows individually or in the aggregate.
MFS believes that it has obtained and is in substantial compliance with those material environmental permits and approvals necessary to conduct its various businesses. Based on the facts presently known, we do not expect environmental compliance costs to have a material adverse effect on its financial condition, results of operations, or cash flows.
As of December 31, 2015, various product-related lawsuits were pending. To the extent permitted under applicable law, all of these are insured with self-insurance retention levels. MFS’ self-insurance retention levels vary by business, and have fluctuated over the last ten years. The range of our self-insured retention levels is $0.1 million to $0.25 million per occurrence. As of December 31, 2015, the largest self-insured retention level for new occurrences currently maintained by us is $0.25 million per occurrence and applies to product liability claims for the hot category products manufactured in the United States.
Product liability reserves in the combined balance sheets at December 31, 2015 and December 31, 2014 were $2.6 million and $2.2 million, respectively; $0.9 million and $0.2 million, respectively, was reserved specifically for actual cases, and $1.7 million and $2.0 million, respectively, for claims incurred but not reported, which were estimated using actuarial methods. Based on our experience in defending product liability claims, management believes the current reserves are adequate for estimated case resolutions on aggregate self-insured claims and insured claims. Any recoveries from insurance carriers are dependent upon the legal sufficiency of claims and solvency of insurance carriers.
At December 31, 2015 and December 31, 2014, MFS had reserved $40.0 million and $42.0 million, respectively, for warranty claims included in product warranties and other non-current liabilities in the combined balance sheets. Certain of these warranty and other related claims involve matters in dispute that ultimately are resolved by negotiations, arbitration, or litigation. See Note 17, “Guarantees,” for further information.
It is reasonably possible that the estimates for environmental remediation, product liability and warranty costs may change in the near future based upon new information that may arise or matters that are beyond the scope of our historical experience. Presently, there are no reliable methods to estimate the amount of any such potential changes.
MFS is also involved in various legal actions arising out of the normal course of business, which, taking into account the liabilities accrued and legal counsel’s evaluation of such actions, in the opinion of management, the ultimate resolution of all matters is not expected to have a material adverse effect on MFS’ financial condition, results of operations, or cash flows.
17. Guarantees
In the normal course of business, MFS provides its customers a warranty covering workmanship, and in some cases materials, on products manufactured by the Company. Such warranty generally provides that products will be free from defects for periods ranging from 12 months to 60 months with certain equipment having longer-term warranties. If a product fails to comply with MFS’ warranty, we may be obligated, at our expense, to correct any defect by repairing or replacing such defective products. MFS provides for an estimate of costs that may be incurred under its warranty at the time product revenue is recognized. These costs primarily include labor and materials, as necessary, associated with repair or replacement. The primary factors that affect our warranty liability include the number of units shipped and historical and anticipated warranty claims. As these factors are impacted by actual experience and future expectations, we assess the adequacy of our recorded warranty liability and adjust the amounts as necessary. Below is a table summarizing the warranty activity for the years ended December 31, 2015 and 2014:
(in millions) | 2015 | 2014 | ||||||
Balance at beginning of period | $ | 42.0 | $ | 38.3 | ||||
Accruals for warranties issued during the period | 24.2 | 27.9 | ||||||
Divestiture | — | (23.7 | ) | |||||
Settlements made (in cash or in kind) during the period | (25.2 | ) | (0.5 | ) | ||||
Currency translation | (1.0 | ) | — | |||||
Balance at end of period | $ | 40.0 | $ | 42.0 | ||||
MFS also offers extended warranties, which are recorded as deferred revenue and are amortized to income on a straight-line basis over a period equal to that of the warranty period. The deferred revenue on warranties included in other current and non-current liabilities at December 31, 2015 and December 31, 2014, was $5.7 million and $5.4 million, respectively.
-81-
18. Restructuring and Asset Impairments
In conjunction with the acquisition of Enodis in October 2008, certain restructuring activities were undertaken to recognize cost synergies and rationalize the new cost structure of MFS. The restructuring reserve balance as of December 31, 2015 and December 31, 2014, includes certain of these costs, including a pension withdrawal liability. MFS recorded additional amounts in 2015 primarily related to a company-wide reduction in force and the proposed closing of the Cleveland facility.
The following is a rollforward of all restructuring activities related to MFS for the year ended December 31, 2015 (in millions):
Restructuring Reserve Balance as of December 31, 2014 | Restructuring Charges | Use of Reserve | Restructuring Reserve Balance as of December 31, 2015 | |||||||||||
$ | 15.6 | $ | 4.6 | $ | (3.4 | ) | $ | 16.8 | ||||||
In conjunction with this restructuring plan, MFS recorded an impairment expense of $9.0 million related to our manufacturing plant in Cleveland that will be closed in 2016.
Restructuring expense of $4.6 million and asset impairment expense of $9.0 million are presented on the Combined Statements of Operations within "Other operating (income) expense - net".
19. Employee Benefit Plans
Defined Contribution Plans
MTW maintains three defined contribution retirement plans for its employees: (1) The Manitowoc Company, Inc. 401(k) Retirement Plan (the “MTW 401(k) Retirement Plan”); (2) The Manitowoc Company, Inc. Retirement Savings Plan (the “MTW Retirement Savings Plan”); and (3) The Manitowoc Company, Inc. Deferred Compensation Plan (the “MTW Deferred Compensation Plan”). Each plan results in individual participant balances that reflect a combination of amounts contributed by MTW or deferred by the participant, amounts invested at the direction of either the company or the participant, and the continuing reinvestment of returns until the accounts are distributed.
MTW 401(k) Retirement Plan The MTW 401(k) Retirement Plan is a tax-qualified retirement plan that is available to substantially all non-union U.S. employees of MTW, its subsidiaries and related entities. The Company merged the accounts of non-union participants in the Enodis Corporation 401(k) Plan with and into the MTW 401(k) Retirement Plan on December 31, 2009.
The MTW 401(k) Retirement Plan allows employees to make both pre- and post-tax elective deferrals, subject to certain limitations under the Internal Revenue Code of 1986, as amended (the “Tax Code”). MTW also has the right to make the following additional contributions: (1) a matching contribution based upon individual employee deferrals and (2) an additional contribution based on MTW’s performance metrics. Each participant in the MTW 401(k) Retirement Plan is allowed to direct the investment of that participant’s account among a diverse mix of investment funds, including a company stock alternative. To the extent that any funds are invested in MTW stock, that portion of the MTW 401(k) Retirement Plan is an employee stock ownership plan, as defined under the Tax Code (an “ESOP”).
The terms governing the retirement benefits under the MTW 401(k) Retirement Plan are the same for MTW’s executive officers as they are for other eligible employees in the United States.
As of March 4, 2016, MFS holds its own 401 (K) Retirement Plan and no longer participates in the MTW 401 (K) Retirement Plan. The composition of the MFS plan is substantially the same as the former MTW plan.
MTW Retirement Savings Plan The MTW Retirement Savings Plan is a tax-qualified retirement plan that is available to certain collectively bargained U.S. employees of MTW, its subsidiaries and related entities. MTW merged the following plans with and into the MTW Retirement Savings Plan on December 31, 2009: (1) The Manitowoc Cranes, Inc. Hourly-Paid Employees’ Deferred Profit-Sharing Plan; (2) the Manitowoc Ice, Inc. Hourly-Paid Employees’ Deferred Profit-Sharing Plan; and (3) the accounts of collectively bargained participants in the Enodis Corporation 401(k) Plan.
The MTW Retirement Savings Plan allows employees to make both pre- and post-tax elective deferrals, subject to certain limitations under the Tax Code. MTW also has the right to make the following additional contributions: (1) a matching contribution based upon individual employee deferrals; and (2) an additional discretionary or fixed company contribution. Each participant in the MTW Retirement Savings Plan is allowed to direct the investment of that participant’s account among a diverse mix of investment funds, including a company stock alternative. To the extent that any funds are invested in MTW stock, that portion of the MTW Retirement Savings Plan is an ESOP.
MTW’s executive officers are not eligible to participate in the MTW Retirement Savings Plan. MTW contributions to the plans are based upon formulas contained in the plans. For both plans mentioned above, MFS' portion of total costs incurred under these plans were $1.5 million, $3.7 million and $4.0 million for the years ended December 31, 2015, 2014 and 2013, respectively.
As of March 4, 2016, MFS holds its own Retirement Savings Plan and no longer participates in the MTW Retirement Savings Plan. The composition of the MFS plan is substantially the same as the former MTW plan.
-82-
MTW Deferred Compensation Plan The MTW Deferred Compensation Plan is a non-tax-qualified supplemental deferred compensation plan for highly compensated and key management employees and for directors. On December 31, 2009, MTW merged the Enodis Corporation Supplemental Executive Retirement Plan, another defined contribution deferred compensation plan, with and into the MTW Deferred Compensation Plan. MTW maintains the MTW Deferred Compensation Plan to allow eligible individuals to save for retirement in a tax-efficient manner despite Tax Code restrictions that would otherwise impair their ability to do so under the MTW 401(k) Retirement Plan. The MTW Deferred Compensation Plan also assists MTW in retaining those key employees and directors.
The MTW Deferred Compensation Plan accounts are credited with: (1) elective deferrals made at the request of the individual participant; and/or (2) a discretionary company contribution for each individual participant. Although unfunded within the meaning of the Tax Code, the MTW Deferred Compensation Plan utilizes a rabbi trust to hold assets intended to satisfy MTW’s corresponding future benefit obligations. Each participant in the MTW Deferred Compensation Plan is credited with interest based upon individual elections from amongst a diverse mix of investment funds that are intended to reflect investment funds similar to those offered under the MTW 401(k) Retirement Plan, including company stock. Participants do not receive preferential or above-market rates of return under the MTW Deferred Compensation Plan.
None of MTW's deferred compensation plan assets or obligations have been reflected in the combined balance sheet of MFS, because MFS is not a party to the obligation between MTW and key management employees and directors.
As of March 4, 2016, MFS holds its own Deferred Compensation Plan and no longer participates in the MTW Deferred Compensation Plan. The composition of the MFS plan is substantially the same as the former MTW plan.
Defined Benefit Plans
Shared Plans
Certain U.S. employees of MFS participate in pension and other postretirement benefit plans (the “Shared Plans”) sponsored by MTW, which include participants of other MTW subsidiaries. MFS accounts for these Shared Plans for the purpose of the combined financial statements as a multiemployer plan. Accordingly, MFS does not record an asset or liability to recognize the funded status of the Shared Plans as MFS is not a party to the obligation between MTW and the participants of the multiemployer plan. However, the costs associated with these Shared Plans of $1.6 million, $1.0 million, and $0.8 million, for the years ended December 31, 2015, 2014, and 2013, respectively, are reflected on the MFS combined statement of operations. This expense reflects an approximation of MFS’ portion of the costs of the Shared Plans as well as costs attributable to MTW corporate employees, which have been allocated to the MFS combined statement of operations based on methodology deemed reasonable by management.
As of March 4, 2016, MFS holds its own Defined Benefit Plan and no longer participates in the MTW Defined Benefit Plan. The composition of the MFS plan is substantially the same as the former MTW plan.
Direct Plans
Certain MFS subsidiaries sponsor their own pension and other postretirement benefit plans (the “Direct Plans”), which are accounted for as defined benefit plans. Accordingly, the funded and unfunded position of each Direct Plan is recorded in our combined balance sheets. Actuarial gains and losses that have not yet been recognized through income are recorded in accumulated other comprehensive income net of taxes until they are amortized as a component of net periodic benefit cost. The determination of benefit obligations and the recognition of expenses related to the Direct Plans are dependent on various assumptions. The major assumptions primarily relate to discount rates, long-term expected rates of return on plan assets, and future compensation increases. Management develops each assumption using relevant company experience in conjunction with market-related data for each individual country in which such plans exist.
-83-
The components of period benefit costs for the Direct Plans for the years ended December 31, 2015, 2014 and 2013 are as follows:
Pension Plans | Postretirement Health and Other | |||||||||||||||||||||||
(in millions) | 2015 | 2014 | 2013 | 2015 | 2014 | 2013 | ||||||||||||||||||
Service cost - benefits earned during the year | $ | 0.4 | $ | 0.5 | $ | 0.5 | $ | — | $ | — | $ | 0.1 | ||||||||||||
Interest cost of projected benefit obligation | 6.5 | 8.1 | 6.8 | 0.1 | 0.2 | 0.2 | ||||||||||||||||||
Expected return on assets | (5.4 | ) | (7.1 | ) | (5.5 | ) | — | — | — | |||||||||||||||
Amortization of prior service cost | — | — | — | — | (0.3 | ) | (0.1 | ) | ||||||||||||||||
Amortization of actuarial net loss (gain) | 1.2 | 0.9 | 1.3 | (0.1 | ) | (0.1 | ) | — | ||||||||||||||||
Curtailment gain recognized | — | — | — | — | — | (0.8 | ) | |||||||||||||||||
Net periodic benefit cost | $ | 2.7 | $ | 2.4 | $ | 3.1 | $ | — | $ | (0.2 | ) | $ | (0.6 | ) | ||||||||||
Weighted average assumptions: | ||||||||||||||||||||||||
Discount rate | 3.5 | % | 4.4 | % | 4.0 | % | 3.7 | % | 4.5 | % | 3.6 | % | ||||||||||||
Expected return on plan assets | 3.5 | % | 4.5 | % | 3.9 | % | N/A | N/A | N/A | |||||||||||||||
Rate of compensation increase | 4.0 | % | 4.0 | % | 3.5 | % | 1.5 | % | 1.5 | % | 3.0 | % | ||||||||||||
The prior service costs are amortized on a straight-line basis over the average remaining service period of active participants. Gains and losses in excess of 10% of the greater of the benefit obligation and the market-related value of assets are amortized over the average remaining service period of active participants.
To develop the expected long-term rate of return on assets assumptions, MFS considered the historical returns and future expectations for returns in each asset class, as well as targeted asset allocation percentages within the pension portfolio.
-84-
The following is a reconciliation of the changes in benefit obligation, the changes in plan assets, and the funded status of the Direct Plans as of December 31, 2015 and 2014:
Pension Plans | Postretirement Health and Other | |||||||||||||||
(in millions) | 2015 | 2014 | 2015 | 2014 | ||||||||||||
Change in Benefit Obligation | ||||||||||||||||
Benefit obligation, beginning of year | $ | 195.0 | $ | 186.0 | $ | 2.8 | $ | 3.3 | ||||||||
Service cost | 0.4 | 0.5 | — | — | ||||||||||||
Interest cost | 6.5 | 8.1 | 0.1 | 0.2 | ||||||||||||
Participant contributions | — | 0.1 | 0.3 | 0.3 | ||||||||||||
Medicare subsidies received | — | — | — | 0.1 | ||||||||||||
Plan settlements | — | 1.7 | — | — | ||||||||||||
Actuarial (gain) loss | (5.5 | ) | 19.3 | 0.7 | (0.5 | ) | ||||||||||
Currency translation adjustment | (8.8 | ) | (10.0 | ) | (0.2 | ) | (0.1 | ) | ||||||||
Benefits paid | (10.4 | ) | (10.7 | ) | (0.5 | ) | (0.5 | ) | ||||||||
Benefit obligation, end of year | $ | 177.2 | $ | 195.0 | $ | 3.2 | $ | 2.8 | ||||||||
Change in Plan Assets | ||||||||||||||||
Fair value of plan assets, beginning of year | $ | 162.1 | $ | 159.5 | $ | — | $ | — | ||||||||
Actual return on plan assets | 0.6 | 18.6 | — | — | ||||||||||||
Employer contributions | 3.1 | 3.1 | 0.2 | 0.1 | ||||||||||||
Participant contributions | — | 0.1 | 0.3 | 0.3 | ||||||||||||
Medicare subsidies received | — | — | — | 0.1 | ||||||||||||
Currency translation adjustment | (7.5 | ) | (8.5 | ) | — | — | ||||||||||
Benefits paid | (10.4 | ) | (10.7 | ) | (0.5 | ) | (0.5 | ) | ||||||||
Fair value of plan assets, end of year | 147.9 | 162.1 | — | — | ||||||||||||
Funded status | $ | (29.3 | ) | $ | (32.9 | ) | $ | (3.2 | ) | $ | (2.8 | ) | ||||
Amounts recognized in the Combined Balance sheet at December 31 | ||||||||||||||||
Pension asset | $ | — | $ | — | $ | — | $ | — | ||||||||
Pension obligation | (29.3 | ) | (32.9 | ) | — | — | ||||||||||
Postretirement health and other benefit obligations | — | — | (3.2 | ) | (2.8 | ) | ||||||||||
Net amount recognized | $ | (29.3 | ) | $ | (32.9 | ) | $ | (3.2 | ) | $ | (2.8 | ) | ||||
Weighted-Average Assumptions | ||||||||||||||||
Discount rate | 3.7 | % | 3.5 | % | 3.9 | % | 3.7 | % | ||||||||
Expected return on plan assets | 3.5 | % | 4.5 | % | N/A | N/A | ||||||||||
Rate of compensation increase | 4.0 | % | 4.0 | % | 1.5 | % | 1.5 | % | ||||||||
Amounts recognized in accumulated other comprehensive income as of December 31, 2015 and 2014, consist of the following:
Pensions | Postretirement Health and Other | |||||||||||||||
(in millions) | 2015 | 2014 | 2015 | 2014 | ||||||||||||
Net actuarial gain (loss) | $ | (35.1 | ) | $ | (38.7 | ) | $ | — | $ | 0.9 | ||||||
Total amount recognized | $ | (35.1 | ) | $ | (38.7 | ) | $ | — | $ | 0.9 | ||||||
We expect to recognize $1.2 million of net periodic benefit cost for the pension plan during the next fiscal year, which cost is currently included in accumulated other comprehensive income and no gain is expected to be recognized for the postretirement health and other plans. For measurement purposes, a 6.7% annual rate of increase in the per capita cost of covered health care benefits was assumed for 2015. The rate was assumed to decrease gradually to 4.5% for 2027 and remain at that level thereafter. Assumed health care cost trend rates have a significant effect on the amounts reported for the health care plans. The following table summarizes the sensitivity of our December 31, 2015 retirement obligations and 2016 retirement benefit costs of our plans to changes in the key assumptions used to determine those results (in millions):
-85-
Change in assumption: | Estimated increase (decrease) in 2016 Pension Cost | Estimated increase (decrease) in Projected Benefit Obligation for the year ended December 31, 2015 | Estimated increase (decrease) in 2016 Other Postretirement Benefit Costs | Estimated increase (decrease) in Other Postretirement Benefit Obligation for the year ended December 31, 2015 | ||||||||||||
0.5% increase in discount rate | $ | (0.3 | ) | $ | (10.8 | ) | $ | — | $ | (0.1 | ) | |||||
0.5% decrease in discount rate | 0.2 | 11.6 | — | 0.2 | ||||||||||||
0.5% increase in long-term return on assets | (0.7 | ) | N/A | N/A | N/A | |||||||||||
0.5% decrease in long-term return on assets | 0.7 | N/A | N/A | N/A | ||||||||||||
1.0% increase in medical trend rates | N/A | N/A | 0.1 | 0.2 | ||||||||||||
1.0% decrease in medical trend rates | N/A | N/A | — | (0.2 | ) | |||||||||||
It is reasonably possible that the estimate for future retirement and health costs may change in the near future due to changes in the health care environment or changes in interest rates that may arise. Presently, there is no reliable means to estimate the amount of any such potential changes.
The weighted-average asset allocations of the pension plans at December 31, 2015 and 2014, by asset category are as follows
2015 | 2014 | |||||
Equity | 10.2 | % | 15.0 | % | ||
Debt Securities | 28.9 | % | 23.8 | % | ||
Other | 60.9 | % | 61.2 | % | ||
100.0 | % | 100.0 | % | |||
Investment Strategy
Certain MFS subsidiaries sponsor their own pension and other postretirement benefit plans (the “Direct Plans”), which are accounted for as defined benefit plans.
The overall objective of MFS' pension assets is to earn a rate of return over time to satisfy the benefit obligations of the pension plans and to maintain sufficient liquidity to pay benefits and address other cash requirements of the pension fund. Specific investment objectives for our long-term investment strategy include reducing the volatility of pension assets relative to pension liabilities, achieving a competitive, total investment return, achieving diversification between and within asset classes and managing other risks. Investment objectives for each asset class are determined based on specific risks and investment opportunities identified.
MFS reviews its long-term, strategic asset allocations annually. MFS uses various analytics to determine the optimal asset mix and consider plan liability characteristics, liquidity characteristics, funding requirements, expected rates of return and the distribution of returns. MFS identifies investment benchmarks for the asset classes in the strategic asset allocation that are market-based and investable where possible.
Actual allocations to each asset class vary from target allocations due to periodic investment strategy changes, market value fluctuations, the length of time it takes to fully implement investment allocation positions and the timing of benefit payments and contributions. The asset allocation is monitored and rebalanced on a monthly basis.
The actual allocations for the pension assets at December 31, 2015, and target allocations by asset class, are as follows:
Target Allocations | Weighted Average Asset Allocations | ||||
Equity Securities | 9.0 | % | 10.2 | % | |
Debt Securities | 29.0 | % | 28.9 | % | |
Other | 62.0 | % | 60.9 | % | |
Risk Management In managing the plan assets, we review and manage risk associated with funded status risk, interest rate risk, market risk, counterparty risk, liquidity risk and operational risk. Liability management and asset class diversification are central to our risk management approach and are integral to the overall investment strategy. Further, asset classes are constructed to achieve diversification by investment
-86-
strategy, by investment manager, by industry or sector and by holding. Investment manager guidelines for publicly traded assets are specified and are monitored regularly.
Fair Value Measurements The following table presents our plan assets using the fair value hierarchy as of December 31, 2015 and 2014. The fair value hierarchy has three levels based on the reliability of the inputs used to determine fair value. Level 1 refers to fair values determined based on quoted prices in active markets for identical assets. Level 2 refers to fair values estimated using significant other observable inputs, and Level 3 includes fair values estimated using significant non-observable inputs.
December 31, 2015 | ||||||||||||||||
Assets (in millions) | Quoted Prices in Active Markets for Identical Assets (Level 1) | Significant Other Observable Inputs (Level 2) | Unobservable Inputs (Level 3) | Total | ||||||||||||
Cash | $ | 0.3 | $ | — | $ | — | $ | 0.3 | ||||||||
Insurance group annuity contracts | — | — | 89.9 | 89.9 | ||||||||||||
Common/collective trust funds — Government, corporate and other non-government debt | — | 36.7 | — | 36.7 | ||||||||||||
Common/collective trust funds — Corporate equity | — | 15.1 | — | 15.1 | ||||||||||||
Common/collective trust funds — Customized strategy | — | 5.9 | — | 5.9 | ||||||||||||
Total | $ | 0.3 | $ | 57.7 | $ | 89.9 | $ | 147.9 | ||||||||
December 31, 2014 | ||||||||||||||||
Assets (in millions) | Quoted Prices in Active Markets for Identical Assets (Level 1) | Significant Other Observable Inputs (Level 2) | Unobservable Inputs (Level 3) | Total | ||||||||||||
Cash | $ | 0.3 | $ | — | $ | — | $ | 0.3 | ||||||||
Insurance group annuity contracts | — | — | 98.9 | 98.9 | ||||||||||||
Common/collective trust funds — Government, corporate and other non-government debt | — | 21.1 | — | 21.1 | ||||||||||||
Common/collective trust funds — Corporate equity | — | 37.5 | — | 37.5 | ||||||||||||
Common/collective trust funds — Customized strategy | — | 4.3 | — | 4.3 | ||||||||||||
Total | $ | 0.3 | $ | 62.9 | $ | 98.9 | $ | 162.1 | ||||||||
Cash equivalents and other short-term investments, which are used to pay benefits, are primarily held in registered money market funds which are valued using a market approach based on the quoted market prices of identical instruments. Other cash equivalent and short-term investments are valued daily by the fund using a market approach with inputs that include quoted market prices for similar instruments.
Insurance group annuity contracts are valued at the present value of the future benefit payments owed by the insurance company to the plans’ participants.
Common/collective funds are typically common or collective trusts valued at their net asset values that are calculated by the investment manager or sponsor of the fund and have daily or monthly liquidity.
A reconciliation of the fair values measurements of plan assets using significant unobservable inputs (Level 3) from the beginning of the year to the end of the year is as follows:
Insurance Contracts Year Ended December 31, | ||||||||
(in millions) | 2015 | 2014 | ||||||
Beginning Balance | $ | 98.9 | $ | 98.7 | ||||
Actual return on assets | 0.9 | 11.2 | ||||||
Benefit payments | (5.4 | ) | (5.8 | ) | ||||
Foreign currency impact | (4.6 | ) | (5.2 | ) | ||||
Ending Balance | $ | 89.8 | $ | 98.9 | ||||
-87-
The expected 2016 contributions for pension plans are as follows: the minimum contribution for 2016 is $3.0 million; and no planned discretionary or non-cash contributions. Expected company paid claims for the postretirement health and life insurance plans are $0.2 million for 2016.
Projected benefit payments from the plans as of December 31, 2015 are estimated as follows:
(in millions) | Pension Plans | Postretirement Health and Other | ||||||
2016 | $ | 10.6 | $ | 0.2 | ||||
2017 | 11.0 | 0.2 | ||||||
2018 | 11.4 | 0.2 | ||||||
2019 | 11.9 | 0.2 | ||||||
2020 | 12.4 | 0.2 | ||||||
2021-2025 | 69.6 | 1.1 | ||||||
The fair value of plan assets for which the accumulated benefit obligation is in excess of the plan assets as of December 31, 2015 and 2014 is as follows:
Pension Plans | ||||||||
(in millions) | 2015 | 2014 | ||||||
Projected benefit obligation | $ | 177.2 | $ | 195.0 | ||||
Accumulated benefit obligation | 176.3 | 194.1 | ||||||
Fair value of plan assets | 147.9 | 162.1 | ||||||
The accumulated benefit obligation for all pension plans as of December 31, 2015 and 2014 was $176.3 million and $194.1 million, respectively.
The measurement date for all plans is December 31, 2015.
MFS, through its Lincoln Foodservice operation, participated in a multiemployer defined benefit pension plan under a collective bargaining agreement that covered certain of its union-represented employees. In 2013, with the finalization of the reorganization and plant restructuring that affected the Lincoln Foodservice operation, MFS was deemed to have effectively withdrawn its participation in the multiemployer defined benefit pension plan. This withdrawal obligation is part of the restructuring accrual in our combined balance sheet. The withdrawal obligation ($13.2 million as of December 31, 2015) is payable in 48 quarterly installments of $0.5 million through April 2025. As MFS was deemed to have effectively withdrawn its participation in this plan in 2013, no further contributions were made to the plan. The contributions by MFS to the multiemployer plan for the years ended December 31, 2015, 2014 and 2013 are as follows:
(in millions) | ||||||||||||||||
Pension Fund | EIN / Pension Plan Number | 2015 | 2014 | 2013 | ||||||||||||
Sheet Metal Workers’ National Pension Fund | 52-6112463 / 001 | $ | — | $ | — | $ | 0.3 | |||||||||
Total Contributions | $ | — | $ | — | $ | 0.3 | ||||||||||
-88-
20. Leases
MFS leases various property, plant and equipment. Terms of the leases vary, but generally require MFS to pay property taxes, insurance premiums, and maintenance costs associated with the leased property. Rental expense attributed to operating leases was $11.2 million, $13.8 million and $10.8 million in 2015, 2014 and 2013, respectively.
Future minimum rental obligations under non-cancelable operating leases, as of December 31, 2015, are payable as follows:
(in millions) | |||
2016 | $ | 14.2 | |
2017 | 10.1 | ||
2018 | 7.6 | ||
2019 | 5.6 | ||
2020 | 3.8 | ||
Thereafter | 0.9 | ||
Total | $ | 42.2 | |
-89-
21. Business Segments
MFS identifies its segments using the “management approach,” which designates the internal organization that is used by management for making operating decisions and assessing performance as the source of MFS’ reportable segments. Management organizes the business based on geography, and has designated the regions Americas, EMEA, and APAC as reportable segments.
The accounting policies of the segments are the same as those described in the summary of significant accounting policies except that certain expenses are not allocated to the segments. These unallocated expenses are corporate overhead, stock-based compensation expense, amortization expense of intangible assets with definite lives, asset impairment expense, restructuring expense, and other non-operating expenses. MFS evaluates segment performance based upon profit and loss before the aforementioned expenses. Financial information relating to MFS’ reportable segments for the years ended December 31, 2015, 2014 and 2013 is as follows:
-90-
(in millions) | 2015 | 2014 | 2013 | |||||||||
Net sales: | ||||||||||||
Americas | $ | 1,323.7 | $ | 1,301.9 | $ | 1,282.6 | ||||||
EMEA | 281.6 | 315.1 | 312.6 | |||||||||
APAC | 191.1 | 198.2 | 129.4 | |||||||||
Elimination of intersegment sales | (226.3 | ) | (233.9 | ) | (182.8 | ) | ||||||
Total net sales | $ | 1,570.1 | $ | 1,581.3 | $ | 1,541.8 | ||||||
Earnings before interest and taxes from continuing operations: | ||||||||||||
Americas | $ | 200.9 | $ | 201.8 | $ | 214.3 | ||||||
EMEA | 23.5 | 20.7 | 22.5 | |||||||||
APAC | 21.6 | 20.8 | 16.0 | |||||||||
Corporate expense | (35.8 | ) | (34.9 | ) | (31.6 | ) | ||||||
Amortization expense | (31.4 | ) | (31.8 | ) | (31.4 | ) | ||||||
Asset impairment expense | (9.0 | ) | (1.1 | ) | — | |||||||
Restructuring expense | (4.6 | ) | (2.6 | ) | (2.9 | ) | ||||||
Separation expense | (4.3 | ) | — | — | ||||||||
Other income (expense) | (1.0 | ) | (0.4 | ) | 0.8 | |||||||
Earnings before interest and taxes from continuing operations | $ | 159.9 | $ | 172.5 | $ | 187.7 | ||||||
Other income (expense): | ||||||||||||
Interest expense | $ | (1.4 | ) | $ | (1.3 | ) | $ | (1.0 | ) | |||
Interest income on notes with MTW - net | 15.8 | 16.6 | 17.2 | |||||||||
Other income (expense) - net | 22.0 | (0.6 | ) | 0.7 | ||||||||
Earnings from continuing operations before income taxes | $ | 196.3 | $ | 187.2 | $ | 204.6 | ||||||
Capital expenditures: | ||||||||||||
Americas | $ | 8.4 | $ | 23.8 | $ | 9.1 | ||||||
EMEA | 1.5 | 1.6 | 2.1 | |||||||||
APAC | 1.4 | 3.7 | 3.8 | |||||||||
Corporate | 1.9 | 4.5 | 2.5 | |||||||||
Total capital expenditures | $ | 13.2 | $ | 33.6 | $ | 17.5 | ||||||
Depreciation: | ||||||||||||
Americas | $ | 14.3 | $ | 13.6 | $ | 15.1 | ||||||
EMEA | 2.6 | 2.4 | 2.1 | |||||||||
APAC | 2.1 | 3.4 | 4.5 | |||||||||
Corporate | 0.6 | 0.6 | 0.6 | |||||||||
Total depreciation | $ | 19.6 | $ | 20.0 | $ | 22.3 | ||||||
Assets: | ||||||||||||
Americas | $ | 1,495.2 | $ | 1,636.2 | $ | 1,642.3 | ||||||
EMEA | 148.5 | 158.3 | 181.5 | |||||||||
APAC | 96.5 | 96.7 | 81.5 | |||||||||
Corporate | 13.8 | 7.1 | 12.9 | |||||||||
Total assets | $ | 1,754.0 | $ | 1,898.3 | $ | 1,918.2 | ||||||
-91-
Net sales by product class are categorized into commercial foodservice whole goods and aftermarket parts and service and support. Net sales by product class for the years ended December 31 are as follows:
(in millions) | 2015 (2) | 2014 (2) | 2013 (1) | ||||||||||
Commercial foodservice whole goods | $ | 1,277.2 | $ | 1,293.6 | $ | 1,355.3 | |||||||
Aftermarket parts and support | 292.9 | 287.7 | 186.5 | ||||||||||
Total | $ | 1,570.1 | $ | 1,581.3 | $ | 1,541.8 | |||||||
(1) MFS began tracking sales by product class during 2013 in the Americas region; the aftermarket parts and support class shown for 2013 represents the Americas only. | |||||||||||||
(2) MFS began tracking sales by product class for EMEA and APAC during 2014; the aftermarket parts and support sales for 2015 and 2014 represents sales from all regions. | |||||||||||||
Net sales in the table below are attributed to geographic regions based on location of customer. Net sales from continuing operations and long-lived asset information by geographic area as of and for the years ended December 31 are as follows:
Net Sales | Long-Lived Assets | |||||||||||||||||||
(in millions) | 2015 | 2014 | 2013 | 2015 | 2014 | |||||||||||||||
United States | 1,066.7 | 996.4 | 949.2 | 1,363.4 | 1,454.7 | |||||||||||||||
Other Americas | 106.6 | 127.4 | 132.4 | 16.0 | 12.4 | |||||||||||||||
Total Americas | 1,173.3 | 1,123.8 | 1,081.6 | 1,379.4 | 1,467.1 | |||||||||||||||
EMEA | 237.2 | 280.3 | 283.2 | 78.2 | 90.2 | |||||||||||||||
APAC | 159.6 | 177.2 | 177.0 | 25.4 | 28.5 | |||||||||||||||
Total | $ | 1,570.1 | $ | 1,581.3 | $ | 1,541.8 | $ | 1,483.0 | $ | 1,585.8 | ||||||||||
Net sales from continuing operations and long-lived asset information for Europe primarily relate to France, Germany and the United Kingdom.
MFS sells primarily through distributors and dealers ("direct customers"), who ultimately sell to end customers. No single direct customer represented 10% or greater of MFS' net sales in the years ended December 31, 2015, 2014, or 2013. Only one end customer, McDonald's, represented 10% or greater of MFS' net sales in the years ended December 31, 2014 and December 31, 2013.
-92-
22. Quarterly Financial Data (Unaudited)
The following table presents quarterly financial data for 2015 and 2014:
2015 | 2014 | ||||||||||||||||||||||||||||||||
(in millions, except per share data) | First | Second | Third | Fourth | First | Second | Third | Fourth | |||||||||||||||||||||||||
Net sales | $ | 345.4 | $ | 407.7 | $ | 425.3 | $ | 391.7 | $ | 383.3 | $ | 406.7 | $ | 417.1 | $ | 374.2 | |||||||||||||||||
Gross profit | 106.6 | 126.9 | 135.3 | 132.9 | 130.1 | 133.5 | 131.8 | 112.6 | |||||||||||||||||||||||||
Earnings from continuing operations before income taxes | 20.6 | 53.8 | 59.1 | 62.8 | 46.1 | 52.4 | 51.0 | 37.7 | |||||||||||||||||||||||||
Discontinued operations: | |||||||||||||||||||||||||||||||||
(Loss) earnings from discontinued operations, net of income taxes | (0.1 | ) | 0.1 | 0.3 | (0.2 | ) | (0.1 | ) | (0.3 | ) | — | — | |||||||||||||||||||||
Loss on sale of discontinued operations, net of income taxes | — | — | — | — | — | — | (1.1 | ) | — | ||||||||||||||||||||||||
Net earnings | 14.0 | 36.9 | 41.1 | 65.1 | 32.6 | 36.9 | 62.9 | 27.4 | |||||||||||||||||||||||||
Basic and diluted earnings per share: | |||||||||||||||||||||||||||||||||
Earnings from continuing operations | $ | 0.10 | $ | 0.27 | $ | 0.30 | $ | 0.48 | $ | 0.24 | $ | 0.27 | $ | 0.47 | $ | 0.20 | |||||||||||||||||
Discontinued operations: | |||||||||||||||||||||||||||||||||
Loss from discontinued operations | — | — | — | — | — | — | — | — | |||||||||||||||||||||||||
Loss on sale of discontinued operations, net of income taxes | — | — | — | — | — | — | (0.01 | ) | — | ||||||||||||||||||||||||
Basic and diluted net earnings per share (1) | $ | 0.10 | $ | 0.27 | $ | 0.30 | $ | 0.48 | $ | 0.24 | $ | 0.27 | $ | 0.46 | $ | 0.20 | |||||||||||||||||
(1) On March 4, 2015, MTW distributed 137.0 million shares of MFS common stock to MTW shareholders in connection with its spin-off of MFS. See Note 24, "Earnings Per Share," in the Combined Financial Statements for more information. Basic and diluted earnings per common share and the average number of common shares outstanding were retrospectively restated for the number of MFS shares outstanding immediately following this transaction.
23. Net Parent Company Investment and Related Party Transactions
Related Party Transactions and Cash Management: MFS does not enter into transactions with related parties to purchase and/or sell goods or services in the ordinary course of business. Transactions between MFS and MTW (including MTW's Crane business) are reflected in Net Parent Company Investment in the combined balance sheets and in the combined statements of cash flows as a financing activity in “Net transfers transactions with MTW”. MFS participated in MTW’s centralized cash management program in which cash was swept each day and held in a centralized account at the corporate level. Cash held in these centralized accounts has not been allocated to MFS. The only cash reflected in the combined balance sheets is that which is held directly by specific MFS entities.
Net Parent Company Investment and Corporate Cost Allocations: Historically, MTW performed certain general and corporate functions on MFS’ behalf. These costs include, but are not limited to, accounting, treasury, tax, legal, human resources, audit, and information technology (“general corporate expenses”). For purposes of preparing the combined financial statements these costs have been allocated on a basis of direct usage, where identifiable, or through the use of allocation methodologies based on percentage of sales, headcount, or other methodologies deemed appropriate by management. These general corporate expenses are included within “Engineering, selling, and administrative” costs and Net Parent Company Investment, accordingly. Management believes the assumptions associated with allocating these costs are reasonable. Nevertheless, the combined financial statements may not include all of the actual expense that would have been incurred and may not represent MFS’ results of operations, financial position, or cash flows had it been a stand-alone company during the periods presented. Actual costs that would have been incurred if MFS had been a standalone company would depend on multiple factors, including organizational structure and strategic decisions made in various areas, including information technology and infrastructure. General corporate expenses allocated to MFS during the fiscal years ended December 31, 2015, 2014 and 2013 were $24.6 million, $22.1 million and $26.3 million, respectively.
None of MTW’s debt has been reflected in the combined balance sheet of MFS, because MFS is not a party to the obligation between MTW and the debt holders. No financing costs or interest expense associated with MTW's debt has been allocated to the combined financial statements.
All significant intercompany transactions between MFS and MTW (including MTW's Cranes business), have been included within Net Parent Company Investment in the combined balance sheets. The total effect of the settlement of these intercompany transactions is reflected as a financing activity in the combined statements of cash flows. However, the interest income and expense related to the notes with MTW is presented on a net basis in the combined statement of operations. Interest income on the notes with MTW for the years ended December 31, 2015, 2014, and 2013, is net of interest expense on the notes with MTW of $0.6 million, $1.3 million, and $0.6 million, respectively. The notes receivable balances from MTW as of the years ended December 31, 2015, 2014, and 2013, were $70.8 million, $273.9 million, and
93
$248.3 million, respectively. The notes payable balances to MTW as of December 31, 2015, 2014, and 2013, were $9.9 million, $6.2 million, and $12.4 million, respectively.
Guarantees: Certain of MTW’s subsidiaries, which includes selected entities that are part of MFS, entered into guarantee agreements with MTW's lenders whereby these subsidiaries guaranteed the obligations under, and/or pledged their assets as collateral, with respect to such MTW debt. However, none of these MFS subsidiaries were named as obligors in the debt agreements held in the name of MTW. For that reason, MTW did not historically allocate debt balances and/or charge out third-party debt related expenses to MFS.
-94-
24. Earnings Per Share
On March 4, 2016, MTW distributed 137.0 million shares of MFS common stock to MTW shareholders, thereby completing the spin-off. Basic and diluted earnings per common share and the average number of common shares outstanding were retrospectively restated for the number of MFS shares outstanding immediately following this transaction. The same number of shares were used to calculate basic and diluted earnings per share, for each year presented, since no equity awards were outstanding prior to the spin-off.
As described in Note 1, "Description of the Business and Basis of Presentation," our combined financial statements may not be indicative of MFS' future performance and do not necessarily include all the of the actual expenses that would have been incurred by MFS (including, but not limited to, interest expense related to the debt financing described in Note 25, "Subsequent Events") and may not reflect the results of operations had MFS been a standalone company during the periods presented.
The following table sets forth the computation of basic and diluted (loss)/earnings per share for the year ended 2015, 2014, and 2013, respectively.
(in millions, except per share data) | 2015 | 2014 | 2013 | ||||||||
Net earnings | $ | 157.1 | $ | 159.8 | $ | 146.1 | |||||
Basic and diluted average shares outstanding | 137,016,712 | 137,016,712 | 137,016,712 | ||||||||
Basic and diluted (loss)/earnings per common share | $ | 1.15 | $ | 1.17 | $ | 1.07 | |||||
25. Subsequent Events
The combined financial statements reflect management’s evaluation of subsequent events through March 30, 2016, the date MFS' audited combined financial statements as of and for the year-ended December 31, 2015, were available to be issued.
On March 4, 2016, MTW completed the previously announced plans to create two independent public companies to separately operate its two businesses: its Crane business and its Foodservice business. To effect the separation, MTW undertook an internal reorganization in which MTW retained the Crane business, and the Foodservice business, Manitowoc Foodservice Inc., was spun-off. As a result of the Spin-Off, Manitowoc Foodservice, Inc. now operates as an independent, publicly traded company on the New York Stock Exchange trading under the symbol "MFS".
On March 4, 2016, MTW distributed 137,016,712 shares of MFS common stock to MFS shareholders. Holders of MTW common stock received one share of MFS for every one share of MTW common stock held on February 22, 2016. MTW structured the distribution to be tax-free to its U.S. shareholders for U.S. federal income tax purposes.
In connection with the Spin-Off of MFS from MTW, MFS entered into the following material agreements related to its debt financing:
Credit Agreement
MFS entered into a credit agreement (the “2016 Credit Agreement”) for a new senior secured revolving credit facility in an aggregate principal amount of $225 million (the “Revolving Facility”) and a senior secured term loan B facility in an aggregate principal amount of $975 million (the “Term Loan Facility,” and together with the Revolving Facility, the “Credit Facilities”) with JPMorgan Chase Bank, N.A, as administrative agent and collateral agent, J.P. Morgan Securities LLC, Goldman Sachs Bank USA, HSBC Securities (USA) Inc., and Citigroup Global Markets Inc., on behalf of certain of its affiliates, as joint lead arrangers and joint bookrunners, and certain lenders, as lenders. The Revolving Facility includes (i) a $20 million sublimit for the issuance of letters of credit on customary terms, and (ii) a $40 million sublimit for swingline loans on customary terms. MFS entered into security and other agreements relating to the 2016 Credit Agreement.
The Term Loan Facility proceeds were used in part to repay existing debt, and for the payment of a cash dividend to MTW in an amount sufficient to repay certain of MTW existing debt and credit facilities (the “Foodservice Dividend”) in connection with the contribution of certain assets to MFS immediately prior to the completion of the Spin-Off. Borrowings under the Credit Facilities will bear interest at a rate per annum equal to, at the option of MFS, (i) LIBOR plus the applicable margin of approximately 4.75% for term loans subject to a 1.00% LIBOR floor and 1.50% to 2.75% for revolving loans, based on consolidated total leverage, or (ii) an alternate base rate plus the applicable margin, which will be 1.00% lower than for LIBOR loans.
The loans and commitments under the Revolving Facility mature or terminate on March 3, 2021. The loans and commitments under the Term Loan Facility are expected to mature or terminate on March 3, 2023 and will require quarterly principal payments at a rate of 0.25% of the original principal balance.
Mandatory prepayments on the Term Loan Facility are required, subject to customary exceptions, (i) from the receipt of net cash proceeds by MFS or any of its restricted subsidiaries from certain asset dispositions and casualty events, in each case, to the extent such proceeds are not reinvested or committed to be reinvested in assets useful in the business of MFS or any of its subsidiaries within twelve months of the date of such disposition or casualty event, (ii) following the receipt of net cash proceeds from the issuance or incurrence of additional debt of MFS or any of its subsidiaries and (iii) in an amount equal to 50% of excess cash flow of MFS and its subsidiaries with step-downs to 25% if the
-95-
senior secured leverage ratio is less than or equal to 4.50 to 1 but greater than 4.00 to 1, and to 0% if the senior secured leverage ratio is less than or equal to 4.00 to 1.
Obligations of MFS under the Credit Facilities are jointly and severally guaranteed by certain of its existing and future direct and indirectly wholly-owned U.S. subsidiaries (but excluding (i) unrestricted subsidiaries, (ii) immaterial subsidiaries, and (iii) special purpose securitization vehicles).
There is a first priority perfected lien on substantially all of the assets and property of MFS and guarantors and proceeds therefrom excluding certain excluded assets. The liens securing the obligations of MFS under the Revolving Facility and the Term Loan Facility will be pari passu.
Senior Notes
On February 18, 2016, in connection with the Spin-Off of MFS from MTW, MFS’ wholly owned subsidiary, MTW Foodservice Escrow Corp. (the “Foodservice Escrow Issuer”), entered into an indenture (the “Foodservice Indenture”) with Wells Fargo Bank, National Association, as trustee (in such capacity, the “Foodservice Trustee”). Pursuant to the Foodservice Indenture, MFS issued $425 million in aggregate principal amount of 9.500% senior notes due 2024 (the “Senior Notes”). The Senior Notes bear interest at a rate of 9.500% per year, payable in cash semi-annually on February 15 and August 15 of each year, commencing on August 15, 2016. The Senior Notes will mature on February 15, 2024, unless earlier repurchased or redeemed. The Senior Notes have not been registered under the Securities Act of 1933, as amended (the “Securities Act”), and were resold by the initial purchasers (the “Foodservice Purchasers”) to qualified institutional buyers pursuant to Rule 144A (and outside the United States in reliance on Regulation S) under the Securities Act.
The Senior Notes are fully and unconditionally guaranteed, jointly and severally, on an unsecured basis by each of MFS’ domestic restricted subsidiaries that is a borrower or guarantor under the Credit Facilities. The Senior Notes and the subsidiary guarantees are senior unsecured obligations.
MFS may redeem some or all of the Senior Notes from time to time at a redemption price equal to the principal amount of the notes to be redeemed plus certain premiums as set forth in the Foodservice Indenture. MFS must generally offer to repurchase all of the outstanding Senior Notes upon the occurrence of certain specific change of control events at a purchase price equal to 101% of the principal amount of Senior Notes purchased plus accrued and unpaid interest to the date of purchase.
The Foodservice Indenture provides for customary events of default. Generally, if an event of default occurs (subject to certain exceptions), the Foodservice Trustee or the holders of at least 25% in aggregate principal amount of the then-outstanding Senior Notes may declare all the Senior Notes to be due and payable immediately.
Among other things, the Foodservice Indenture also limits the ability of MFS and its subsidiaries to engage in certain activities, including: incurring additional indebtedness or issuing certain preferred stock; paying dividends or making certain other restricted payments or permitting our restricted subsidiaries to do the same; incurring liens; entering into certain types of transactions with affiliates; and consolidating or merging with or into other companies or undergoing certain other fundamental changes. If, in the future, the Senior Notes have investment grade credit ratings and no default or event of default exists under the Foodservice Indenture, certain of these covenants will no longer apply to the Senior Notes for so long as the Senior Notes are rated investment grade. These and other covenants contained in the Indenture are subject to important exceptions and qualifications.
In connection with the Spin-Off of MFS from MTW, MFS entered into the following material agreements related to The Securitization Program:
On March 3, 2016, we entered into a new $110.0 million accounts receivable securitization program (the “2016 Securitization Facility”) with Wells Fargo Bank, National Association, as purchaser and agent, whereby we will sell certain of our domestic trade accounts receivable to a wholly-owned, bankruptcy-remote special purpose subsidiary and certain of our non-U.S. trade accounts receivable to a wholly-owned, bankruptcy-remote, foreign special purpose entity, which entities, in turn, will sell, convey, transfer and assign to a third-party financial institution (a “Purchaser”), all of the right, title and interest in and to their pool of receivables to the Purchaser. The Purchaser will receive ownership of the pools of receivables. The Company, along with certain of its subsidiaries, act as servicers of the receivables and as such administer, collect and otherwise enforce the receivables. The servicers will be compensated for doing so on terms that are generally consistent with what would be charged by an unrelated servicer. As servicers, they will initially receive payments made by obligors on the receivables but will be required to remit those payments in accordance with a receivables purchase agreement. The Purchaser will have no recourse for uncollectible receivables. The securitization program also contains customary affirmative and negative covenants. Among other restrictions, these covenants require the Company to meet specified financial tests, which include a consolidated interest coverage ratio and a consolidated total leverage ratio that are the same as the covenant ratios required per the 2016 Credit Agreement.
-96-
Item 9. CHANGES IN AND DISAGREEMENTS WITH ACCOUNTANTS ON ACCOUNTING AND FINANCIAL DISCLOSURE
None.
Item 9A. CONTROLS AND PROCEDURES
Conclusion Regarding the Effectiveness of Disclosure Controls and Procedures
The company’s management, with the participation of the company’s Chief Executive Officer and Chief Financial Officer, have evaluated the effectiveness of the company’s disclosure controls and procedures (as such term is defined in Rules 13a-15(e) and 15d-15(e) under the Securities Exchange Act of 1934, as amended (“the Exchange Act”)) as of the end of the period covered by this report. Based on such evaluation, the company’s Chief Executive Officer and Chief Financial Officer have concluded that, as of the end of such period, the company’s disclosure controls and procedures are effective in recording, processing, summarizing, and reporting, on a timely basis, information required to be disclosed by the company in the reports that it files or submits under the Exchange Act, and that such information is accumulated and communicated to the Chief Executive Officer and Chief Financial Officer, as appropriate, to allow timely discussions regarding required disclosure.
Management’s Report on Internal Control Over Financial Reporting
This Annual Report does not include a report of management’s assessment regarding internal control over financial reporting or an attestation report of the Company’s registered public accounting firm due to a transition period established by the rules of the SEC for newly public companies. Under the rules and regulations of the SEC, the Company is not required to comply with the requirements of Section 404 of the Sarbanes-Oxley Act of 2002 for the year ended December 31, 2015.
Changes in Internal Control Over Financial Reporting
Before the Spin-off, the Company relied on certain financial information and resources of MTW to manage aspects of the Company’s business and to report financial results. These included investor relations, corporate communications, certain accounting, tax, legal, human resources, benefit plan administration, benefit plan reporting, general management, real estate, treasury, insurance and risk management, and oversight functions, such as Board of Directors and internal audit which includes Sarbanes-Oxley compliance. In conjunction with the Spin-off, the Company enhanced its own financial, administrative, and other support systems. The Company is expanding its internal accounting, reporting, legal, and internal audit departments and updated its policies and systems, as needed, to meet all regulatory requirements on a standalone basis. We will continue to review, document and test our internal controls over financial reporting, and may from time to time make changes aimed at enhancing their effectiveness and to ensure that our systems evolve with our business. These efforts may lead to changes in our internal control over financial reporting.
-97-
Item 9B. OTHER INFORMATION
None.
-98-
Item 10. DIRECTORS, EXECUTIVE OFFICERS AND CORPORATE GOVERNANCE
EXECUTIVE OFFICERS OF THE REGISTRANT
The following table sets forth information as of March 15, 2016 regarding our executive officers.
Name | Age | Position With The Registrant | ||
Hubertus M. Muehlhaeuser | 46 | President and Chief Executive Officer | ||
John O. Stewart | 57 | Senior Vice President and Chief Financial Officer | ||
Josef Matosevic | 44 | Senior Vice President and Chief Operating Officer | ||
Maurice D. Jones | 56 | Senior Vice President, General Counsel and Secretary | ||
Richard N. Caron | 59 | Senior Vice President Innovation | ||
Andreas G. Weishaar | 43 | Senior Vice President Strategy, Marketing and Human Resources | ||
Mr. Muehlhaeuser was appointed President and Chief Executive Officer of MFS effective July 28, 2015. Prior to his appointment, he had served as Managing Partner of Karl-H. Muehlhaeuser GmbH & Co K (a subsidiary of Mühlhäuser Holding GmbH (Switzerland)), a leader in the development, production, distribution and service of rail-bound and trackless tunneling and mining equipment from 2013 to 2015. Mr. Muehlhaeuser previously served as Senior Vice President and General Manager, Europe/Africa/Middle East for AGCO Corporation (NYSE: AGCO) (“AGCO”), a leading manufacturer and distributor of agricultural equipment and related replacement parts, in 2012. Prior thereto, he was Senior Vice President - Strategy & Integration and General Manager, Eastern Europe/Asia at AGCO from 2009 to 2011. From 2005 to 2011, Mr. Muehlhaeuser served as Senior Vice President - Strategy & Integration at AGCO, and from 2007 to 2011 he also served as General Manager - Engines. Prior to joining AGCO in 2005, he led the Global Strategy and Organization Practice at Arthur D. Little, Ltd., an international management consulting firm, was a member of the firm’s Global Management Team and was the firm’s Managing Director, Switzerland. Mr. Muehlhaeuser is also a member of the Board of FASTER S.p.A. (Italy) and Chairman of the Board of Mühlhäuser Holding GmbH (Switzerland), where he is still the majority shareholder. Mr. Muehlhaeuser studied Business Administration at the European Business Schools in Oestrich Winkel and London, as well as the Universidad Argentina de la Empresa, and holds a Master of Business Administration degree from EBS University of Business and Law.
Mr. Stewart was appointed Senior Vice President and Chief Financial Officer of MFS effective November 9, 2015. Prior to his appointment, his most recent position was Executive Vice President, Chief Financial Officer and Chief Administrative Officer of Hostess Brands, Inc., a manufacturer and distributor of cake and bread products, which he held from 2010 until May 2013. From May 2013 until his appointment with MFS, Mr. Stewart was retired. Before joining Hostess Brands, Inc. in 2010, Mr. Stewart served as the Executive Vice President and Chief Financial Officer of Dr. Pepper Snapple Group, Inc. (NYSE: DPS), a publicly-traded carbonated soft drinks company, from 2006 until 2010. From 1990 to 2005, Mr. Stewart served in various finance roles within the business of Diageo PLC (NYSE: DEO), a publicly traded premium spirits business, including as the Chief Financial Officer of Diageo PLC’s subsidiary Diageo North America, Inc. from 2001 until 2004. Mr. Stewart holds a Bachelor of Accountancy degree from the University of Glasgow and is a member of the Institute of Chartered Accountants of Scotland.
Mr. Matosevic was promoted to Senior Vice President of Global Operational Excellence for MTW in 2014 after serving as the Executive Vice President - Global Operations and Purchasing for MTW Cranes since early 2012. Prior to joining MTW, Mr. Matosevic served in various executive positions with Oshkosh Corporation (NYSE: OSK), a designer, manufacturer and marketer of a broad range of specialty vehicles and vehicle bodies, from 2008-2012, including as that company’s Executive Vice President, Global Manufacturing Operations from 2010-2012, with responsibilities for the defense segment, global operating systems and lean deployment. He previously served as Vice President of Global Operations from 2005 to 2007 and Chief Operating Officer from 2007 to 2008 at Wynnchurch Capital/Android Industries, a sub-assembler and sequencer of complex modules for automotive original equipment manufacturers. Mr. Matosevic has over 20 years of global operating and business experience, with skills and experience in Lean Six Sigma practices, automation, and supply chain development.
Mr. Jones was appointed Senior Vice President, General Counsel and Secretary of MFS effective September 1, 2015. Prior to the completion of the Spin-Off on March 4, 2016, Mr. Jones served as General Counsel and Secretary of MTW since 1999 and was elected its Vice President in 2002 and a Senior Vice President in 2004. Prior to joining MTW, Mr. Jones was a shareholder in the law firm of Davis and Kuelthau, S.C., and served as legal counsel for Banta Corporation.
Mr. Caron was promoted to Senior Vice President Innovation of MFS in 2015. Previously, he served as EVP Global Marketing and Innovation for MFS and as MFS’ Chief Technology Officer, a position that he has held since 2005 as a former Enodis employee. Under his leadership, Mr. Caron was instrumental in the development and success of the Education and Technology Center. He has also led a variety of new product development initiatives, which have helped distinguish the Company as a technology leader in the foodservice industry. Prior to MFS/Enodis, Mr. Caron served as Chief Executive Officer for the Moseley Corporation in Franklin, Massachusetts. Other key professional experience included serving as president and chief executive officer of TurboChef, Inc. in Dallas, Texas. Before TurboChef, Mr. Caron was managing director of the consumer products practice at Arthur D. Little (ADL) in Cambridge, Massachusetts. During his 19-year affiliation with ADL, Mr. Caron led many consulting assignments involving technology, strategy, and product development. In addition, Mr. Caron holds several patents in the foodservice industry, including automated frying and rapid cooking systems. Mr. Caron is a graduate of the Massachusetts Institute of Technology where he earned Master of Science and Bachelor of Science degrees in Chemical Engineering Practice.
-99-
Mr. Weishaar was appointed Senior Vice President Strategy, Marketing and Human Resources of MFS effective February 1, 2016. Prior to his appointment, he served ten years at AGCO Corporation (NYSE: AGCO) (“AGCO”), a leading manufacturer and distributor of agricultural equipment and related replacement parts. His most recent role at AGCO was as Vice President and General Manager of Global Green Harvesting, responsible for the company’s worldwide hay, forage and sugar business. Prior to joining AGCO, Mr. Weishaar was part of the Strategy & Organization practice of Arthur D. Little, where he worked in areas of strategy and organization, performance improvement and mergers & acquisitions. He holds a Master of Business Administration from the European Business School, Germany, and studied both at the Ecole Supérieure de Commerce de Dijon, France, and the Thunderbird School of Global Management, USA.
BOARD OF DIRECTORS OF THE REGISTRANT
The following table sets forth information as of March 15, 2016 regarding our directors.
Name | Age | Position(s) |
Dino J. Bianco | 54 | Director |
Joan K. Chow | 55 | Director |
Thomas D. Davis | 60 | Director |
Cynthia M. Egnotovich | 58 | Director; Chairperson of the Board |
Timothy J. Fenton | 58 | Director |
Andrew Langham | 42 | Director |
Hubertus M. Muehlhaeuser | 46 | Director |
Mr. Bianco is a member of our Board, the chairperson of the Audit Committee and a member of the Compensation Committee. Mr. Bianco was elected to the Board of Directors of MTW in May 2015 and served on MTW’s Board of Directors until the Spin-Off when he resigned from the Board. He formerly served as Executive Vice President (from 2012 to April, 2015) of Kraft Foods Group, Inc. (NASDAQ: KRFT) and President of its Beverages business (from 2013 to April, 2015). Kraft Foods Group, Inc., headquartered in Northfield, Illinois, is one of the largest consumer packaged food and beverage companies in North America. Mr. Bianco previously served as Senior Vice President of Kraft Foods Group, Inc. and President of Kraft Canada (2005-2012) and Vice President of Marketing for Kraft’s Beverages, Desserts, Grocery and Cereals businesses (2001 to 2005). Mr. Bianco joined Kraft in 1990 as Finance Manager and held several roles in finance, financial planning and analysis, sales strategy and marketing. Mr. Bianco is a Chartered Professional Accountant, and prior to joining Kraft he was employed by PricewaterhouseCoopers LLP. In addition Mr. Bianco is a past chair of Food and Consumer Products of Canada, past member of the Board of The Grocery Foundation, and past member of the Board of Trustees of the United Way of Toronto.
Mr. Bianco brings extensive relevant experience to MFS’ Board of Directors with his 25 years of financial, marketing and senior management experience with one of the largest food and beverage companies in North America. This experience is amplified by his service as past chair of Food and Consumer Products of Canada, past member of the Board of The Grocery Foundation, and past member of the Board of Trustees of the United Way of Toronto.
Ms. Chow is a member of our Board, the chairperson of the Compensation Committee and a member of the Corporate Governance Committee. Ms. Chow became a director of MTW in 2012 and served until the Spin-Off when she resigned. Ms. Chow joined the Greater Chicago Food Depository in February 2016 as Chief Marketing Officer. Prior to joining the Greater Chicago Food Depository, Ms. Chow was the Executive Vice President and Chief Marketing Officer at ConAgra Foods, Inc. (NYSE: CAG) from 2007 to August, 2015. ConAgra Foods, headquartered in Omaha, NE, is one of North America’s leading packaged food companies. Prior to joining ConAgra in 2007, Ms. Chow was employed for nine years with Sears Holdings Corporation in various marketing positions of increasing responsibility, having served as Senior Vice President/Chief Marketing Officer of Sears Retail immediately prior to taking the position with ConAgra. Prior to that, she served in executive positions with Information Resources Inc. and Johnson & Johnson Consumer Products, Inc. Ms. Chow currently serves on the Board of Feeding America, a leading hunger-relief charity in the United States.
Ms. Chow led ConAgra's global marketing team, including integrated marketing planning, advertising, digital, social media, consumer insights, brand design, and multicultural marketing. Ms. Chow's extensive leadership experience in marketing, advertising and consumer insights brings a valuable perspective to MFS’ Board of Directors.
Mr. Davis is a member of our Board, a member of the Audit Committee and a member of the Compensation Committee. Mr. Davis has served as Chairman, President and Chief Executive Officer of Viskase Companies, Inc. (“Viskase”), a meat casing company, since 2011, and as President and Chief Executive Officer of Viskase since 2007. Before joining Viskase in 2007, Mr. Davis served as President and Chief Executive Officer of Specialty Foods Group, Inc., a producer of premium meat products (2000 to 2006). He also served in various executive positions with Smithfield Foods, Inc. (1995 to 1999), and in various operational and financial roles with John Morrell & Company from 1980 until it was acquired by Smithfield Foods in 1995. Mr. Davis has an M.B.A. from Benedictine University and a B.S. from SUNY-Plattsburgh. Mr. Davis’s experience as Chief Executive Officer at two food processing companies, as well as his operational and financial background in the food processing industry, provide a valuable perspective to MFS’ Board of Directors.
Ms. Egnotovich is the Chairperson of the Board and the chairperson of the Corporate Governance Committee. Ms. Egnotovich was also a director of MTW from 2008 until the Spin-Off when she resigned from the MTW board. She served as President, Customer Service of Aerospace Systems of United Technologies Corporation (NYSE: UTX) from 2012 until her retirement in 2013. United Technologies Corporation (UTC), headquartered in Hartford CT, is a diversified company that provides a broad range of high-technology products and
-100-
services to the global aerospace and building systems industries. The UTC Aerospace Systems Customer Service organization focused on program management of customer long-term agreements, sales, and technical support. Previous to her position with UTC, Ms. Egnotovich was Vice President (2002 to 2012) and Segment President, Nacelles and Interior Systems (2007 to 2012) of Goodrich Corporation. Goodrich Corporation was a leading aerospace manufacturer, located in Charlotte, NC, that was acquired by UTC in 2012. Ms. Egnotovich previously served as Segment President, Engine Systems (2005 to 2007); Segment President, Electronic Systems (2003 to 2005); and Segment President, Engine and Safety Systems (2002 to 2003), all at Goodrich Corporation. Ms. Egnotovich held other positions of increasing responsibility since joining Goodrich in 1986. Ms. Egnotovich also serves as a board member of Hexcel Corporation (NYSE: HXL) located in Stamford, CT.
Ms. Egnotovich brings senior management, accounting, and financial controls experience to MFS’ Board of Directors. Ms. Egnotovich's financial controls and accounting expertise had their foundation when she served as a financial analyst and then controller of a division of Goodrich. From there she moved to other positions of increasing responsibility, serving as president of various business segments within Goodrich, and until 2013, as President, Customer Service of Aerospace Systems of UTC until her retirement in 2013. Her background and experience in finance, accounting, and senior management in various segments of large manufacturing companies make her well suited to serve on MFS’ Board of Directors.
Mr. Fenton is a member of the Board, a member of the Audit Committee and a member of the Compensation Committee. Mr. Fenton served as Chief Operating Officer of McDonald’s Corporation (NYSE: MCD), a publicly-traded franchisor and operator of restaurants, from July 2012 until his retirement on December 31, 2014. In his role as Chief Operating Officer, Mr. Fenton was responsible for global supply chain, franchising and development. Prior to becoming Chief Operating Officer, Mr. Fenton served as President, McDonald's Asia/Pacific, Middle East and Africa, with responsibility for operations in 38 countries at more than 8,800 restaurants (January 2005 to June 2012), and as President, East Division for McDonald’s USA (May 2003 to January 2005). Prior to his retirement, Mr. Fenton was employed by McDonald’s Corporation for more than 40 years. Mr. Fenton also owns and manages ten McDonald’s Corporation franchises in Florida.
Mr. Fenton’s experience in senior leadership roles at one of the world’s largest fast-food restaurant companies, with oversight for major market operations and key corporate functions including global supply chain, gives him an industry perspective that is valuable to MFS’ Board of Directors.
Mr. Langham is a member of the Board, a member of the Corporate Governance Committee and a member of the Audit Committee. Mr. Langham has been General Counsel of Icahn Enterprises L.P. (NASDAQ: IEP), a diversified holding company engaged in a variety of businesses, including investment, automotive, energy, gaming, railcar, food packaging, metals, real estate and home fashion, since 2014. From 2005 to January 2015, Mr. Langham was Assistant General Counsel of Icahn Enterprises. Prior to joining Icahn Enterprises, Mr. Langham was an associate at Latham & Watkins LLP focusing on corporate finance, mergers and acquisitions, and general corporate matters. Mr. Langham has been a director of: Freeport McMoRan Inc. (NYSE: FCX), the world’s largest publicly traded copper producer, since October 2015; CVR Partners LP (NYSE: UAN), a nitrogen fertilizer company, since September 2015; CVR Refining, LP (NYSE: CVRR), an independent downstream energy limited partnership, since September 2014; and CVR Energy, Inc. (NYSE: CVI), a diversified holding company primarily engaged in the petroleum refining and nitrogen fertilizer manufacturing industries, since September 2014. CVR Partners, CVR Refining and CVR Energy are each indirectly controlled by Carl C. Icahn. Mr. Icahn also has non-controlling interests in Freeport-McMoRan through the ownership of securities. Mr. Langham received a B.A. from Whitman College, and a J.D. from the University of Washington.
Mr. Langham's legal background, particularly his expertise in corporate matters, finance, and mergers and acquisitions, provides a valuable perspective to MFS’ Board of Directors. His connection with the food packaging business will provide additional insight as a Board member. As General Counsel of Icahn Enterprises L.P. he also brings relevant experience with corporate governance, compliance, and regulatory matters.
Mr. Muehlhaeuser’s biographical information is set forth above under “Executive Officers of the Registrant.”
As the President and Chief Executive Officer of MFS Mr. Muehlhaeuser's day-to-day leadership of the business provides an invaluable contribution to the MFS Board of Directors. His prior senior management experience in equipment and manufacturing industries and his multi-functional expertise, including strategy and integration, operational execution, financial acumen, capital markets knowledge, and strong channel and brand management, offers MFS a unique set of skills as it positions itself for long-term, sustainable growth.
Section 16(a) Beneficial Ownership Reporting Compliance
Section 16(a) of the Exchange Act requires our executive officers and directors, and persons who beneficially own more than ten percent of our common stock, to file initial reports of ownership and reports of changes in ownership with the SEC. Executive officers, directors and greater than ten percent beneficial owners are required by SEC regulations to furnish us with copies of all Section 16(a) forms they file. There were late Form 3 filings by MTW and all of MFS' executive officers and directors in connection with the effectiveness of our Registration Statement on Form 10, which occurred on February 11, 2016. Except as disclosed in the preceding sentence, to our knowledge, all required Section 16(a) filings were timely and correctly made.
Director Independence
NYSE rules require that our Board have a majority of independent directors. Our Board has a majority of independent directors, and our Board committees are comprised of only independent directors.
-101-
Committees of the Board
Our Board has the following committees, each of which operates under a written charter, which is posted on our Web site.
Audit Committee
The Audit Committee was established in accordance with Section 3(a)(58)(A) and Rule 10A-3 under the Exchange Act and is comprised of Dino J. Bianco, Thomas D. Davis, Timothy J. Fenton and Andrew Langham. The responsibilities of our Audit Committee include, among other duties, overseeing:
• | our independent auditors’ qualifications, independence, performance and interactions with management; |
• | management’s review of our annual audited financial statements; |
• | the integrity of our financial statements, including the use of any unusual accounting methods and any issues resulting from the use of such methods; |
• | earnings releases and other public financial communications; |
• | the performance of our internal auditors and internal audit function; |
• | internal procedures for the receipt, retention and treatment of complaints regarding our accounting, internal accounting controls or auditing matters; |
• | our compliance with legal and regulatory requirements; and |
• | our guidelines and policies with respect to risk assessment and risk management. |
The Audit Committee consists entirely of independent directors, each of which meets the independence requirements set forth in the listing standards of the NYSE, Rule 10A-3 under the Exchange Act and the Audit Committee charter. Each member of the Audit Committee is financially literate and has accounting or related financial management expertise as such terms are interpreted by our Board in its business judgment.
Compensation Committee
Our Compensation Committee is comprised of Joan K. Chow, Dino J. Bianco, Thomas D. Davis and Timothy J. Fenton. The responsibilities of our Compensation Committee include the following:
• | reviewing and approving corporate goals and objectives relevant to executive compensation; |
• | setting compensation policy and administering compensation plans on behalf of the Board; |
• | reviewing and recommending to the Board for approval the compensation of the Chief Executive Officer and other key executives; |
• | annually appraising the Chief Executive Officer’s performance; |
• | evaluating compensation levels and payouts for the Chief Executive Officer and other executives against an appropriate comparison group; |
• | reviewing and commenting on strategic and financial plans to determine their relationship to the compensation program; |
• | reviewing and approving new compensation plans; |
• | recommending pay levels for non-employee Board members; |
• | reviewing and approving, in coordination with the Audit Committee, the contents of SEC and other regulatory filings relating to compensation matters, including the Compensation Discussion and Analysis and related executive compensation disclosures. |
The Compensation Committee consists entirely of independent directors, each of which meets the independence requirements set forth in the listing standards of the NYSE and the Compensation Committee charter. The members of the Compensation Committee are “non-employee directors” (within the meaning of Rule 16b-3 of the Exchange Act) and “outside directors” (within the meaning of Section 162(m) of the Code).
Corporate Governance Committee
Our Corporate Governance Committee is comprised of Cynthia M. Egnotovich, Andrew Langham and Joan K. Chow. The responsibilities of our Corporate Governance Committee include the following:
• | evaluating and recommending current directors for re-election and new candidates to fill existing or expected vacancies; |
• | recommending the frequency, agenda, location and timing of Board meetings to the Chief Executive Officer; |
• | reviewing the size, composition and independence of the Board, as well as the number and structure of Board committees; |
• | reviewing validly submitted stockholder proposals; |
• | reviewing our stock ownership guidelines and monitoring directors’ compliance with the stock ownership guidelines; and |
• | facilitating an executive session at each regular Board meeting for non-management directors. |
The Corporate Governance Committee consists entirely of independent directors, each of which meets the independence requirements set forth in the listing standards of the NYSE and the Corporate Governance Committee charter.
Meetings
During the fiscal year ended December 31, 2015, our Board met one time while we were still a subsidiary of MTW. All members of the Board attended at least 75 percent of the meetings held by the Board and the committees on which they served.
-102-
Code of Conduct
We have adopted a written code of conduct, or the “Code of Conduct,” that applies to all of our employees. The Code of Conduct reflects our commitment to operate our business in a manner that meets the highest ethical standards. It includes or refers to policies and rules that cover ethical and legal practices for nearly every aspect of our business. A copy of the Code of Conduct is posted on our Web site at www.manitowocfoodservice.com.
Director Nomination Process
We have adopted corporate governance guidelines that contain information concerning the responsibilities of the Corporate Governance Committee with respect to identifying and evaluating future director candidates.
The Corporate Governance Committee will evaluate future director candidates in accordance with the director membership criteria described in our corporate governance guidelines. The Corporate Governance Committee will evaluate a candidate’s qualifications to serve as a member of our Board based on the skills and characteristics of individual directors as well as the composition of our Board as a whole. In addition, the Corporate Governance Committee will evaluate a candidate’s professional skills and background, areas of expertise, experience in relevant industries, age, diversity, geographic background and number of other directorships, along with qualities expected of all directors, including integrity, judgment, acumen and the time and ability to make a constructive contribution to our Board. The Corporate Governance Committee, along with our Board, will consider a candidate in the context of our Board as a whole to determine the appropriate mix of backgrounds and experiences among our Board members as we believe that varying viewpoints better represent our stockholders, employees, business partners and consumers and contribute to a more informed and effective decision-making process.
Communication with Non-Management Members of Our Board of Directors
Information for stockholders and other parties interested in communicating with our Board or our independent directors, individually or as a group, is posted on our Web site as part of our corporate governance guidelines. Our vice president of investor relations and/or our general counsel will forward such communications to the Board or to individual directors, as applicable. Any communication that our vice president of investor relations or our general counsel determines, in his or her discretion, to be offensive, dangerous, harmful, illegal, illegible, not understandable or nonsensical may, at the option of such person, not be forwarded. Neither MFS nor the Board nor any director shall be obligated to send any reply or response to the interested party, except to indicate to the interested party, if requested, whether the interested party’s communication was forwarded to the Board or the applicable Board member.
Stock Ownership Guidelines
Our corporate governance guidelines contain stock ownership guidelines for non-management directors. The guidelines provide that each non-management director should acquire and hold an amount of our stock with a value at least equal to five times the director’s total annual cash retainer, excluding any meeting fees or any additional retainer for committee chair positions. The guidelines require the stock ownership amount to be met by the end of the fifth full calendar year after the director is first elected to the Board, or in the case of directors who were previously members of the MTW board of directors, by the end of the later of (a) the end of the fifth full calendar year after the director was first appointed or elected as a member of the MTW board of directors, or (b) the end of the third full calendar year after the Spin-Off. Directors are required to retain net shares upon vesting of equity awards until achieving the stock ownership guideline.
For purposes of the guidelines, stock ownership includes shares owned outright, restricted stock and restricted stock units, but does not include unexercised stock options. As of March 15, 2016, each of the directors to whom these guidelines applied was either in compliance or expected to be in compliance within the five-year time period provided for initial compliance.
Compliance will be measured annually at the first Board meeting in a given year, and will be based on each director’s stock ownership and the stock price as of the close of business on the last day of the preceding calendar year.
-103-
Item 11. EXECUTIVE COMPENSATION
COMPENSATION DISCUSSION AND ANALYSIS
Introduction
The following section is designed to assist shareholders with understanding the objectives of the executive compensation program of MTW prior to the Spin-Off and some aspects of MFS' executive compensation program after the Spin-Off, the different components of compensation paid to the persons identified in the 2015 Summary Compensation Table below, who are referred to collectively as our named executive officers, and the basis for the compensation decisions affecting those persons. Mr. Muehlhaeuser and Mr. Stewart are identified as named executive officers because they are serving as, respectively, our President and Chief Executive Officer and our Senior Vice President and Chief Financial Officer following the Spin-Off. The other named executive officers are identified as such because they were the three most highly compensated executive officers of MTW during 2015 who are also serving as executive officers of MFS after the Spin-Off. This discussion and analysis should be read together with the compensation tables located elsewhere in this Information Statement.
The information provided for 2015 and any prior periods reflects compensation earned at MTW or its subsidiaries for each of the named executive officers based on their respective roles with MTW or its subsidiaries during 2015 or such prior periods, if any, and the design and objectives of MTW’s executive compensation programs in place prior to the Spin-Off.
All 2015 executive compensation decisions for our named executive officers prior to the Spin-Off were made or overseen by the Compensation Committee of the Board of Directors of MTW (the “MTW Compensation Committee”). Executive compensation decisions following the Spin-Off are being made by the Compensation Committee of the Board of Directors of MFS (the “MFS Compensation Committee”). This Compensation Discussion and Analysis describes some aspects of our compensation programs for our named executive officers following the Spin-Off.
2015 Say-on-Pay Advisory Vote
In 2015, MTW’s say-on-pay advisory vote received support from over 98% of shares voted. We believe that this result demonstrated a strong endorsement by MTW’s shareholders of its executive compensation program design, decisions and policies. The vote was one of many factors considered by the MTW Compensation Committee in reviewing its executive compensation program. MTW did not make any changes to its executive compensation program in direct response to this vote.
Compensation Program Administration
The MTW Compensation Committee has been, and after the Spin-Off the MFS Compensation Committee is, primarily responsible for administering our executive compensation program. That role entails reviewing and approving all elements of the executive compensation program that cover the named executive officers. The review includes an annual consideration of business strategy and talent needs and alignment of compensation to performance and shareholder interests. MTW previously engaged, and post Spin-Off, MFS has also engaged Willis Towers Watson to assist with its duties.
Compensation Strategy
MTW’s executive compensation program has been intended to align the interests of its executives with the interests of its shareholders as well as to motivate its executives to maximize long-term total returns to its shareholders. For these reasons, the MTW Compensation Committee has designed the executive compensation program consistent with market typical/best practices to ensure strong alignment between executive pay and MTW’s performance. A strong element of the design has been to provide incentive-based compensation that is directly tied to MTW’s performance. The MTW Compensation Committee has annually reviewed the key elements of the program considering MTW’s business strategy and talent needs. MTW’s executive compensation program has sought to provide competitive total compensation opportunities, at costs to MTW that are consistent with the opportunities provided, to attract, motivate and retain highly-qualified executives critical to the achievement of MTW’s financial and strategic goals.
Key objectives and elements of the philosophy have included the following:
• | Paying for performance. A significant portion of the compensation paid to executives of MTW and its former subsidiaries including MFS has been incentive-based and “at risk,” and could be earned based on the achievement of MTW’s financial goals and/or stock price appreciation. (Incentive awards based on achievement of specific goals have been capped at 200% of the targeted award opportunity.) As previously disclosed by MTW, in January 2015, in view of its intention to pursue the Spin-Off, the MTW Compensation Committee determined that it would not serve the interests of MTW to grant to executive officers performance shares in 2015 (in addition to stock options), which would have a multi-year performance period. Instead, given the difficulty of goal setting as a result of the announced intention to separate into two independent, publicly-traded companies by the end of the first quarter of 2016, as well as the additional retentive value of stock options and restricted stock, in 2015 the executive officers of MTW received a grant of restricted stock units (weighted 50%) and stock options (weighted 50%). |
• | Providing market competitive compensation. Pay levels have been targeted to be, on average, at market median levels based on individual factors (such as experience, length of service, time in their role, and individual performance), internal structure and internal and external equity, business needs, MTW’s performance, comparable positions at general industrial companies of similar size, and other factors. |
-104-
• | Encouraging long service. MTW has offered several retirement and savings plans, which pay benefits after retirement and provide employees with the opportunity to earn employer contributions or save pre-tax dollars for retirement. |
• | Facilitating executive stock ownership. Long-term incentive awards to executives of MTW have been solely equity-based, and executive officers of MTW have been subject to stock ownership guidelines, including a potential retention requirement, to ensure meaningful ongoing alignment with shareholders’ interests, although comparator groups have been used when considering specific components of compensation. |
Actual total compensation has been subject to variation from target compensation based on the individual’s performance and MTW’s financial and stock price performance. In accordance with SEC proxy disclosure rules, the Summary Compensation Table below shows the grant date fair value of long-term incentive (LTI) grants, which is often very different from the actual realized and realizable/current values (if any amount is even earned) of such awards. The MTW Compensation Committee has reviewed annually officer pay tally sheets detailing the past several years of actual and target compensation, outstanding long-term incentive awards (including the potential realizable value at various stock prices), accumulated deferred compensation balances, and potential change-in-control severance amounts.
In connection with its executive compensation determinations, MTW has reviewed third-party market survey data among comparable companies and broader market trends/developments, as provided by the MTW Compensation Committee’s compensation consultant, which in 2015 was Willis Towers Watson. Given the range of its businesses prior to the Spin-Off, in setting market-based pay levels MTW has generally reviewed market data provided from surveys of comparably-sized general industrial companies; a specific peer group has not typically been used, although comparator groups have been used when considering specific components of compensation. Survey data of comparable positions has been analyzed annually in considering adjustments to base salaries and target short-term and long-term incentive award opportunities. Survey data has also been reviewed periodically to help maintain the competitiveness of all elements of compensation.
EXECUTIVE COMPENSATION
Compensation Elements. MTW’s executive compensation program is described in more detail below, by element and in total.
Element | Purpose | Characteristics |
Base Salary | Establish a certain element of pay for an individual’s competencies, skills, experience and performance relative to his/her current job | Not at risk; eligible for annual performance-based merit increase consideration and adjustments for changes in job responsibilities |
Short-Term Incentives | Motivate and reward the achievement of annual MTW financial goals aligned to the key strategic objectives for the year | Performance-based (variable) cash opportunity; amount earned will vary based on actual company financial results achieved |
Long-Term Incentives(1) | Motivate and reward the achievement of specific financial goals, Relative TSR performance and stock price appreciation over time for the prior fiscal year award(1) | All of the award opportunity is performance-based with the amount realized, if any, by the executive dependent upon multi-year company financial results and stock price performance(1) |
Retirement Benefits | Encourage long service with MTW by providing retirement plan contributions that can grow in value over an executive’s career | Both fixed and variable aspects; contributions drive growth of funds and future payments |
Benefits and Perquisites | Provide additional financial security and other enhanced benefits for executives (perquisites are limited) | Generally fixed; actual cost is based on participation and usage |
Change in Control (“CIC”) Continued Employment and Severance Benefits | Provide continuity of the leadership team leading up to and after a change in control | Contingent component; provides for continued employment upon a CIC and severance benefits if an executive’s employment is terminated following a CIC |
(1) As previously disclosed by MTW, in January 2015, in view of its intention to pursue the Spin-Off, the MTW Compensation Committee determined that it would not serve the interests of MTW to grant to executive officers performance shares in 2015 (in addition to stock options), which would have a multi-year performance period. Instead, given the difficulty of goal setting as a result of the announced intention to separate into two independent, publicly-traded companies by the end of the first quarter of 2016, as well as the additional retentive value of stock options and restricted stock, in 2015 the executive officers of MTW received grants of restricted stock units (weighted 50%) and stock options (weighted 50%).
In setting total compensation, MTW has applied a consistent approach for all of its executive officers. Executive officers also have been eligible to receive base salary and incentive pay increases at the time of promotions. In connection with promotions, the MTW Compensation Committee may have increased base salary and target incentive award percentages, and made additional incentive grants. Prior to August 2015, Mr. Muehlhaeuser was not an executive officer of MTW, and his compensation was determined through arm’s length negotiations in connection with his recruitment to be an executive officer of MTW prior to the Spin-Off and then become MFS' President and Chief Executive Officer following the Spin-Off, as described further below. Prior to November 2015, Mr. Stewart was not an executive officer of MTW, and his compensation was determined through arm’s length negotiations in connection with his recruitment to be an employee of MTW prior to the Spin-Off and then become MFS' Senior Vice President and Chief Financial Officer following the Spin-Off, as described further below.
-105-
Additional detail regarding each pay element is presented below. Other than the Change in Control Severance Arrangements (Contingent Employment Agreements) and Messrs. Muehlhaeuser's and Stewart's employment agreements described below, we do not have, and MTW did not have, employment agreements with any of our named executive officers.
Base Salaries. MTW reviewed salaries annually, and based adjustments, if any, on consideration of MTW’s overall budget for base salaries for the year, individual factors (competencies, skills, experience, and performance), internal equity, and market pay practice data. Based upon the survey data provided by the MTW Compensation Committee’s compensation consultant, the base salaries for the named executive officers, on average, continued to approximate the median of base salaries of comparable positions, considering an individual’s experience, performance and other factors. In connection with the recruitment of Mr. Muehlhaeuser to serve as our President and Chief Executive Officer after the Spin-Off, MTW negotiated an annual base salary for Mr. Muehlhaeuser of $800,000. In connection with the recruitment of Mr. Stewart to serve as our Senior Vice President and Chief Financial Officer after the Spin-Off, MTW negotiated an annual base salary for Mr. Stewart of $540,000.
Incentive Plans. MTW provided annual and long-term incentive award opportunities to motivate the achievement of the business strategy by specifying key metrics of success. In order to strongly drive results and align performance and payouts, the incentive plans each:
• | Included multiple performance measures; |
• | Had target performance goals set based on forecasts/budget, business conditions, prior year’s performance, probability of achievement and other factors; |
• | Had varied payouts commensurate with performance results (with potential payouts capped at 200% of the target award opportunity for goal-based plans); and |
• | Covered different time periods (annual incentive plan covers one year and long-term incentives typically cover three years (or more for stock options) with an ongoing stock ownership requirement). |
MTW elected to use a combination of performance measures to ensure management was motivated and rewarded for earnings growth, cash flow generation, efficient use of capital and total shareholder returns. Accordingly, the annual incentive plan and performance share component of the long-term incentive plan each used two or more performance metrics (that are not duplicated between the plans), which could change from year-to-year to reflect the critical areas of focus for the respective performance period. The MTW Compensation Committee believed that, collectively, the performance metrics used would best drive long-term shareholder value and align management rewards to MTW’s business strategy.
2016 Incentive Plan Changes. Following the Spin-Off in early 2016, MFS established annual and long-term incentive award opportunities for its executive officers. The annual incentive awards included performance goals based on free cash flow, operating margin and organic net sales growth. The long-term incentive awards consisted of 25% stock options with 4-year ratable vesting and 75% performance shares that will be earned or forfeited based on performance as measured by cumulative fully diluted earnings per share and return on invested capital over a 3-year performance period. The details of these awards to our named executive officers will be disclosed as required by applicable SEC regulations in MFS’ proxy statement for its annual meeting in 2017.
2015 Short-Term Incentives. Annual incentive awards for 2105 were made under MTW’s 2013 Omnibus Incentive Plan, but are referred to in this Information Statement as having been made under MTW’s Short-Term Incentive Plan (“STIP”). The annual or short-term incentives were intended to reward eligible participants for maximizing shareholder value.
The 2015 STIP award for Corporate Officers, including Messrs. Matosevic, Jones and Caron, was based thirty-five percent (35%) on operating earnings, thirty-five percent (35%) on free-cash flow, and thirty percent (30%) on return on invested capital. As described above under “2016 Incentive Plan Changes,” following the Spin-Off in early 2016, MFS established annual incentive award opportunities for its executive officers with performance goals based on free cash flow (weighted 30%), operating margin (weighted 35%) and organic net sales growth (weighted 35%).
The 2015 target annual incentive award percentages assigned to these named executive officers ranged from 50% to 100% of base salary, based on the position’s responsibilities and business impact. Awards earned under the STIP could range from 0% to 200% of an individual’s target award opportunity based on actual business results versus the target performance goals for the year. Earned awards, if any, would be fully paid out after the end of the year.
In connection with the recruitment of Mr. Muehlhaeuser to serve as our President and Chief Executive Officer after the Spin-Off, MTW agreed that Mr. Muehlhaeuser would participate in the STIP with a target annual incentive award of 100% of his base salary. The 2015 award was pro-rated based on Mr. Muehlhaeuser’s date of hire, which was August 3, 2015. The 2015 award opportunity was based on the same performance goals described above for the other named executive officers, and weighted 50% on Corporate performance and 50% on Foodservice performance.
In connection with the recruitment of Mr. Stewart to serve as our Senior Vice President and Chief Financial Officer after the Spin-Off, MTW agreed that Mr. Stewart would participate in the STIP with a target annual incentive award of 70% of his base salary. The 2015 award was guaranteed at 100% of the target but pro-rated based on Mr. Stewart’s date of hire, which was November 9, 2015.
-106-
The potential dollar range of the 2015 annual incentive awards when they were initially granted, by named executive officer, is presented in the Grants of Plan-Based Awards table. Except for the guaranteed amount for Mr. Stewart referenced in the preceding paragraph, in March 2016, however, it was determined that no amounts were earned by any of the named executive officers under the 2015 STIP.
Use of Discretion. The STIP allowed the MTW Compensation Committee to apply discretion in considering potential adjustments (e.g., certain accounting charges such as bad debt and inventory reserve expenses as well as research and development costs) presented by management to assess performance of continuing operations. In practice, the MTW Compensation Committee made a limited number of adjustments, which, for awards to be earned by executives during a particular year, must be determined no later than MTW's Compensation Committee’s February meeting.
2015 Long-Term Incentives. Long-term incentive award grants for 2015 were made prior to the Spin-Off under the MTW 2013 Omnibus Incentive Plan, which was approved by shareholders of MTW at the MTW 2013 Annual Meeting and replaced the MTW 2003 Incentive Stock and Awards Plan (the “2003 Stock Plan”). Prior to 2014, long-term incentive awards were granted under the 2003 Stock Plan.
Long-term incentive awards were intended to align the interests of executives with those of MTW shareholders by allowing executives to share in the growth and financial success of MTW, as reflected in MTW’s stock price and other performance measures. In addition, long-term incentive awards facilitated the attraction, retention and motivation of executives and key employees.
From 2011 to 2014, all of the long-term award opportunity for senior executives of MTW had been “at-risk” - requiring achievement of specific multi-year financial goals or stock price appreciation. From 2010 to 2015; the executive officers of MTW did not receive time-based restricted stock grants. However, as described above, in 2015, due to the then-anticipated Spin-Off, the senior executives of MTW were granted time-based restricted stock units rather than performance shares. In addition, MTW made equity-based retention awards to certain key employees, including Messrs. Matosevic and Jones, to provide additional incentive for the employees to continue in employment and contribute toward the successful completion of the contemplated Spin-Off. These retention awards are described in greater detail below.
Stock Options. Stock options align executives’ interests with those of shareholders, since options only have realizable value if the price of MTW stock increases relative to the grant/exercise price. Stock options granted to the named executive officers during fiscal 2015 had the following terms:
• | Exercise price is the closing trading price of MTW stock on the grant date; |
• | Vest annually in 25% increments beginning on the first anniversary of the grant date and continuing on each subsequent anniversary until the fourth anniversary; and |
• | Expire 10 years after the grant date. |
In connection with Mr. Muehlhaeuser’s recruitment to be our President and Chief Executive Officer, MTW granted him an initial award of non-qualified stock options under the MTW 2013 Omnibus Incentive Plan with a fair market value of $1,000,000 upon the commencement of his employment with MTW. The stock options will vest in four equal annual installments on the anniversary of the grant date; however, if Mr. Muehlhaeuser is terminated for any reason other than for cause (as defined in his employment agreement), no less than one half of the stock options will immediately vest. Mr. Muehlhaeuser will also be eligible for future long-term incentive awards. Under his employment agreement, his long-term incentive award grant target is $2,000,000 per year.
In connection with Mr. Stewart’s recruitment to be our Senior Vice President and Chief Financial Officer, MTW granted him an initial award of non-qualified stock options under the MTW 2013 Omnibus Incentive Plan with a fair market value of $700,000 upon the commencement of his employment with MTW. The stock options will vest in four equal annual installments on the anniversary of the grant date; however, if Mr. Stewart is terminated for any reason other than for cause (as defined in his employment agreement), no less than one quarter of the stock options will immediately vest. Mr. Stewart will also be eligible for future long-term incentive awards. Under the terms of his employment agreement, Mr. Stewart’s long-term incentive award grant target is $700,000 per year.
Restricted Stock Units. In 2015, MTW granted the named executive officers other than Messrs. Muehlhaeuser and Stewart time-based restricted stock units which vest 100% on the third anniversary of the grant date. The MTW Compensation Committee decided to grant these units rather than performance shares in 2015 due to the then-anticipated Spin-Off.
Performance Shares. Performance share award opportunities were provided to the named executive officers (other than Messrs. Muehlhaeuser and Stewart) in years prior to 2015 to directly align the shares earned, if any, to the achievement of specific multi-year goals. The goals and the performance period were established by the MTW Compensation Committee at the time of the award grant.
2014 Performance Share Grant. The 2014 performance share grant could be earned based on performance over the three-year performance period from January 1, 2014 through December 31, 2016 on the following two equally-weighted measures:
• | 3-year cumulative EVA®. EVA is a metric developed by Stern Stewart & Co. that measures the economic profit generated by a business and is equal to the difference between the following: |
• | Net operating profit after tax, defined as operating earnings adjusted to eliminate the impact of, among other items, certain accounting charges such as bad debt and inventory reserve expenses, and research and development costs; and |
-107-
• | A capital charge, defined as capital employed multiplied by the weighted average cost of capital. |
• | 3-year Relative TSR, which assessed MTW’s Total Shareholder Return (“TSR”) - equal to stock price appreciation plus the reinvestment of dividends provided to shareholders relative to a comparator group of 19 direct peers and industrial companies (listed below). Since the comparator group was used for performance, not pay levels, there are some TSR peers that were significantly smaller and larger than MTW. TSR was calculated using the 20-trading-day average closing price at the start and end of the three-year performance cycle. Awards could not exceed target if MTW’s TSR were negative, as assessed at the end of the three-year performance cycle. As described above under “2016 Incentive Plan Changes,” following the Spin-Off in early 2016, MFS established long-term incentive award opportunities for its executive officers consisted of 25% stock options with 4-year ratable vesting and 75% performance shares that will be earned or forfeited based on performance as measured by cumulative fully diluted earnings per share and return on invested capital over a 3-year performance period. The details of these awards to our named executive officers will be disclosed as required by applicable SEC regulations in MFS’ proxy statement for its annual meeting in 2017. |
In view of the Spin-Off, the Board of MTW prior to the Spin-Off agreed that the 2014 performance share award would be paid-out at target at the end of the three-year performance period.
The following is the comparator group of direct peers and industrial companies used for determining Relative TSR performance for the 2014 performance share grants:
Actuant Corporation | Illinois Tool Works Inc. | Oshkosh Corporation |
Astec Industries, Inc. | Ingersoll-Rand plc | Pentair plc |
Briggs & Stratton Corp. | Joy Global Inc. | SPX Corporation |
Caterpillar Inc. | Kennametal Inc. | Standex International Corp. |
Cummins Inc. | Lincoln Electric Holdings Inc. | Terex Corp. |
Dover Corp. | Middleby Corp. | Timken Co. |
Graco Inc. | ||
Consistent with MTW’s pay-performance philosophy and current market practices, with pay approximating median levels for median performance, the target award opportunity for the Relative TSR performance shares would be earned for Relative TSR performance at the median. The payout schedule for the Relative TSR portion of the performance share grants was as follows:
Performance Level | MTW’s Relative TSR Performance | Award Payout (as a % of Target) |
Maximum | 75th Percentile | 200% |
Target | 50th Percentile | 100% |
Threshold | 25th Percentile | 25% |
As described below under the heading “Treatment of Equity-Based Awards in the Spin-Off,” in connection with the Spin-Off, the 2014 performance share grants were deemed bifurcated into two separate awards: (1) a modified award covering MTW common stock; and (2) a new award of the same type covering MFS common stock. Each of these two awards is subject to the same terms and conditions after the Spin-Off as the terms and conditions applicable to the original MTW award prior to the spin-off, except that, because the performance goals for the 2014 performance share grants related to a performance period that was incomplete at the time of the Spin-Off, the performance goals were deemed met at the target level and the number of performance shares was calculated with no proration, but the performance shares remain subject to continued time-based vesting until the end of the applicable performance period (i.e., December 31, 2016).
2013 Performance Share Grant. The 2013 performance share grant was based on performance on two equally-weighted measures (Debt Reduction and Relative TSR) over the three-year performance period from January 1, 2013 through December 31, 2015. Debt reduction was the decrease in the balance of outstanding loans and other debt over the performance period and directly reflected MTW’s ability to generate cash flow that could be used to reduce MTW’s outstanding debt. Relative TSR is defined above.
2016 Performance Share Grants. MFS made performance share grants following the Spin-Off in March 2016. These performance share grants do not use TSR as a performance measure. Instead, these performance shares will use a combination of cumulative earnings per share over a three-year period and cumulative return on invested capital over a three-year period as performance measures. The grants will be disclosed as required by applicable SEC regulations in MFS’ proxy statement for its annual meeting in 2017.
Retention Awards. In April 2015, MTW made equity-based retention awards to certain key employees, including Messrs. Matosevic and Jones, to provide additional incentive for the employees to continue in employment and contribute toward the successful completion of the then-contemplated Spin-Off. The retention awards consisted of shares of MTW common stock that would vest on the second anniversary of the Spin-Off if the employee was continuously employed with MTW or an affiliate through the second anniversary of the effective date of the Spin-Off. The shares would earlier vest in full upon termination of the employee as a result of death, disability or retirement upon or following the Spin-Off. The shares would also vest in full upon an involuntary termination of the employee, other than for cause, by MTW, or a termination by the employee for good reason, regardless of whether the Spin-Off had then occurred. The number of shares subject to the retention award granted to Messrs. Matosevic and Jones, as disclosed in the Grants of Plan-Based Awards table, was determined based on a
-108-
target dollar value equal to a percentage of the officer’s base salary and the share price on the date of grant. For Mr. Matosevic, the percentage was 100% of base salary, and for Messrs. Jones, the percentage was 150% of base salary.
Grant Guideline Development. The MTW Compensation Committee set award guidelines for each officer (other than Mr. Muehlhaeuser, who did not become an executive officer until August 3, 2015, and Mr. Stewart, who did not become an employee until November 9, 2015) and job classification level based upon survey market median levels and MTW’s recent average stock price. Mr. Muehlhaeuser’s 2015 award was determined based on market data and arm’s length negotiations in connection with Mr. Muehlhaeuser’s recruitment to be our President and Chief Executive Officer. Mr. Stewart’s 2015 award was determined based on market data and arm’s length negotiations in connection with Mr. Stewart’s recruitment to be our Senior Vice President and Chief Financial Officer. For the other officers, the approximate 20-trading-day average closing price of MTW stock ending on the date of the February MTW Compensation Committee meeting was used for determining the grant levels. The actual grant price and accounting expense for all officers were determined at the date of grant.
The grant date fair value of the 2015 stock option grants and restricted stock unit awards, which each represented approximately 50% of the award guidelines, is presented in the Grants of Plan-Based Awards table. The ultimate value, if any, which will be realized, is not determinable at the date of grant.
Treatment of Equity-Based Awards in the Spin-Off. Our named executive officers and other executive officers were treated like our other similarly-situated employees with respect to the impact of the Spin-Off on equity-based awards. Each outstanding MTW stock option, restricted share, restricted stock unit and performance share was treated in a manner similar to that experienced by MTW shareholders with respect to their MTW common stock. More specifically, each of these awards was deemed bifurcated into two separate awards: (1) a modified award covering MTW common stock; and (2) a new award of the same type covering MFS common stock. Each of these two awards is subject to the same terms and conditions after the Spin-Off as the terms and conditions applicable to the original MTW award prior to the Spin-Off, except:
• | with respect to each modified stock option award covering MTW common stock and new stock option award covering MFS common stock, the per-share exercise price for such award is subject to adjustment so that the two awards, together, will retain, in the aggregate, the same intrinsic value that the original MTW stock option award had immediately prior to the Spin-Off (subject to rounding); |
• | with respect to performance shares subject to performance goals relating to performance periods that were incomplete at the time of the Spin-Off, the performance goals were deemed met at the target level and the number of performance shares was calculated with no proration, but the performance shares will remain subject to continued time-based vesting until the end of the applicable performance period. |
• | with respect to any continuous employment requirement associated with any equity-based incentive awards, such requirement will be satisfied after the Spin-Off (a) by a MFS employee based on his or her continuous employment with MFS (for equity-based incentive awards of either MFS or MTW) and (b) by a MTW employee based on his or her continuous employment with MTW (for equity-based incentive awards of either MTW or MFS); and |
• | in the event a change in control (as defined in the applicable equity incentive plan or award agreement) occurs with respect to MTW, then (a) any accelerated vesting and/or exercisability applicable to MTW equity-based incentive awards held by MTW employees or former MTW employees will apply to the MFS equity-based incentive awards then held by such individuals, and (b) any accelerated vesting and/or exercisability applicable to MTW equity-based incentive awards then held by MFS employees or former MFS employees will apply; and |
• | in the event a change in control (as defined in the applicable equity incentive plan or award agreement) occurs with respect to MFS, then (a) any accelerated vesting and/or exercisability applicable MFS equity-based incentive awards held by MFS employees or former MFS employees will apply to the MTW equity-based incentive awards then held by such individuals, and (b) any accelerated vesting and/or exercisability applicable to MFS equity-based incentive awards then held by MTW employees or former MTW employees will apply. |
MFS 2016 Omnibus Incentive Plan. We have adopted the MFS 2016 Omnibus Incentive Compensation Plan (the “2016 Plan”), under which we make equity-based and cash-based incentive awards to attract, retain, focus and motivate executives and other selected employees, directors, consultants and advisors and to increase stockholder value. The 2016 Plan is intended to accomplish these objectives by offering participants the opportunity to acquire shares of MFS common stock, receive monetary payments based on the value of such common stock or receive other incentive compensation on the terms that the 2016 Plan provides. In addition, the 2016 Plan permits the issuance of awards (“Replacement Awards”) in partial substitution for awards relating to shares of common stock of MTW immediately prior to the Spin-Off in accordance with the terms of an Employee Matters Agreement as described above under the heading “Treatment of Equity-Based Awards in the Spin-Off.”
The MFS Compensation Committee administers the 2016 Plan (the “Administrator”). The 2016 Plan authorizes the Administrator to interpret the provisions of the 2016 Plan; prescribe, amend and rescind rules and regulations relating to the 2016 Plan; correct any defect, supply any omission, or reconcile any inconsistency in the 2016 Plan, any award or any agreement covering an award; and make all other determinations necessary or advisable for the administration of the 2016 Plan, in each case in its sole discretion.
-109-
The Administrator may designate any of the following as a participant from time to time, to the extent of the Administrator’s authority: any officer or other employee of MFS or its affiliates; any individual whom MFS or an affiliate has engaged to become an officer or employee; any consultant or advisor who provides services to MFS or its affiliates; or any director, including a non-employee director.
The 2016 Plan permits the grant of stock options (including incentive stock options), stock appreciation rights, restricted stock, restricted stock units, performance shares, performance units, annual cash incentives, long-term cash incentives, dividend equivalent units and other types of stock-based awards.
The 2016 Plan provides that 9.8 million shares of MFS common stock are reserved for issuance under the Plan, all of which may be issued upon the exercise of incentive stock options. These numbers may be adjusted in the event of certain corporate transactions or other events specified in the 2016 Plan.
The number of shares of MFS common stock reserved under the 2016 Plan is depleted by the maximum number of shares, if any, that may be issuable under an award at the time of grant, except that the number of shares reserved is depleted by 1.5 shares for each share delivered in payment or settlement of a full-value award. For this purpose, a full-value award includes restricted stock, restricted stock units payable in shares, performance shares, performance units payable in shares, and any other similar award payable in shares under which the value of the award is measured as the full value of a share, rather than the increase in the value of a share.
In general, if an award granted under the 2016 Plan lapses, expires, terminates or is cancelled without the issuance of shares under the award, if it is determined during or at the conclusion of the term of an award that all or some portion of the shares under the award will not be issuable on the basis that the conditions for such issuance will not be satisfied, if shares are forfeited under an award or if shares are issued under any award and MFS reacquires them pursuant to rights reserved upon the issuance of the shares, then such shares again become available for issuance under the 2016 Plan, except that shares reacquired pursuant to reserved rights may not be issued pursuant to incentive stock options. Shares not issued or delivered as a result of the net settlement of an outstanding option or stock appreciation right, shares tendered in payment of the exercise price of an option, shares withheld to satisfy tax withholding obligations and shares purchased by MFS using proceeds from option exercises may not be recredited to the reserve.
In addition to the overall limits on the aggregate number of shares reserved under the 2016 Plan, there are individual award limits. Subject to adjustment as provided in the 2016 Plan and to certain exceptions, no participant may be granted awards that could result in the participant:
• | receiving options for, and/or stock appreciation rights with respect to, more than 2,000,000 shares (or 100,000 shares, in the case of a non-employee director) during any fiscal year; |
• | receiving awards of restricted stock and/or restricted stock units, and/or other stock-based awards, relating to more than 500,000 shares (or 35,000 shares, in the case of a non-employee director) during any fiscal year; |
• | receiving awards of performance shares, and/or awards of performance units the value of which is based on the fair market value of shares, for more than 1,000,000 shares (or 70,000 shares, in the case of a non-employee director) during any fiscal year; |
• | receiving awards with a performance period of more than one year, including awards of performance units the value of which is not based on the fair market value of shares, long-term awards or dividend equivalent units that would pay more than $10,000,000 to the participant (or $600,000, in the case of a non-employee director) during any single fiscal year; or |
• | receiving awards with a performance period of not more than one year, including annual incentive awards, awards of performance units the value of which is not based on the fair market value of shares, or dividend equivalent units that would pay more than $4,000,000 to the participant (or $200,000, in the case of a non-employee director) during any fiscal year. |
The 2016 Plan provides for “double trigger” vesting, which means that, unless the Administrator otherwise determines, awards will not automatically vest on an accelerated basis if there is a change of control of MFS if the awards are assumed or replaced with equivalent awards and adjusted appropriately by the acquiror or other surviving entity in the change of control. Instead, the awards would remain subject to their existing vesting schedules unless the participant’s employment is terminated by MFS without cause or by the participant for good reason within the 24 months immediately following the change of control.
The 2016 Plan’s term is indefinite, in that it terminates when all shares reserved for issuance under the 2016 Plan have been issued, subject to the MFS Board of Directors’ right to terminate the 2016 Plan at any time. In addition, the MFS Board of Directors or the Administrator may amend the 2016 Plan at any time, except:
• | the Board of Directors must approve any amendment to the 2016 Plan if MFS determines such approval is required by prior action of the Board of Directors, applicable corporate law or any other applicable law; |
• | shareholders must approve any amendment to the 2016 Plan if MFS determines that such approval is required by Section 16 of the Exchange Act, the listing requirements of any principal securities exchange or market on which the MFS common stock is then traded, or any other applicable law; and |
• | shareholders must approve any amendment to the 2016 Plan that materially increases the number of shares of common stock reserved under the 2016 Plan, the incentive stock option award limits or the per participant award limitations set forth in the 2016 |
-110-
Plan, that shortens the minimum vesting requirements under the 2016 Plan or that diminishes the provisions prohibiting repricing or backdating stock options and stock appreciation rights.
Neither the Administrator nor any other person may: (1) amend the terms of outstanding stock options or stock appreciation rights to reduce the exercise price of such outstanding stock options or stock appreciation rights; (2) cancel outstanding stock options or stock appreciation rights in exchange for stock options or stock appreciation rights with an exercise price that is less than the exercise price of the original stock options or stock appreciation rights; or (3) cancel outstanding stock options or stock appreciation rights with an exercise price above the current share price in exchange for cash or other securities. In addition, the Administrator may not grant a stock option or stock appreciation right with a grant date that is effective prior to the date the Administrator takes action to approve such award.
Retirement Benefits. In order to facilitate the long service of highly-qualified executives, MTW provided retirement benefits.
Supplemental Executive Retirement Plan (SERP). During 2015 (the period required to be covered by this Compensation Discussion and Analysis), Mr. Jones participated in the nonqualified MTW Supplemental Executive Retirement Plan (“SERP”). Benefits provided under the SERP were intended to provide an annuity based on a percentage of historic base salary and STIP-related awards. When a participant became eligible for a distribution from the SERP, the participant could elect to receive the distribution in a single lump-sum or over a period not to exceed ten years. The actuarial change in the value of Mr. Jones’s SERP benefits during 2015 is presented in the Summary Compensation Table. Detailed information about the SERP is presented in the Pension Benefits Table. In connection with the Spin-Off, we assumed the responsibility for providing Mr. Jones his benefit under the SERP and adopted a similar plan document for purposes of providing the benefit. However, no other employees are or will become eligible to participate in the plan.
401(k) Retirement Plan. During 2015 (the period required to be covered by this Compensation Discussion and Analysis), active, regular, full-time, non-union, U.S.-based employees (including the named executive officers) were eligible to participate in The Manitowoc Company, Inc. 401(k) Retirement Plan, which allowed employees to build retirement savings on a tax-deferred basis. The plan had a tax-qualified defined contribution savings component, the 401(k) Savings feature, in which participating employees received an employer match. In addition, the plan had a Retirement Plan feature, under which MTW may provide employer contributions to another defined contribution account. The value of MTW employer contributions to The Manitowoc Company, Inc. 401(k) Retirement Plan is presented in the Summary Compensation Table. In connection with the Spin-Off, MFS adopted a 401(k) plan similar to The Manitowoc Company, Inc. 401(k) Retirement Plan.
Perquisites/Other Benefits. To provide a market competitive total compensation package, MTW provided a limited amount of perquisites and supplemental benefits to executives. In 2015, MTW provided the following: supplemental long-term disability insurance, tax preparation, car allowance, spouse/guest travel and limited personal use of aircraft. The value of perquisites and supplemental benefits provided in 2015 is presented in the Summary Compensation Table and footnotes. In addition, as part of the recruitment of Mr. Muehlhaeuser, MTW paid a one-time signing bonus to him of $200,000 upon the completion of 90 days of continuous service to MTW. Following the Spin-Off, we provide similar perquisites and supplemental benefits to our executives.
Employment Agreement. Historically, MTW has not entered into employment agreements with its named executive officers providing for benefits prior to a change in control. However, as part of the recruitment of Messrs. Muehlhaeuser and Stewart, MTW entered into employment agreements specifying certain terms and conditions of employment prior to and after the Spin-Off.
Under the terms of his employment agreement, Mr. Muehlhaeuser is entitled to an annual base salary of $800,000. He also received a signing bonus of $200,000. Prior to the Spin-Off, he was eligible to participate in MTW’s 2013 Omnibus Incentive Plan and had a target annual incentive award under that Plan of 100% of his base salary (any award earned based on fiscal 2015 performance will be pro-rated based on Mr. Muehlhaeuser’s date of hire). He received an initial grant of non-qualified stock options under the Plan with a fair market value of $1,000,000 upon the commencement of his employment with MTW. The stock options will vest in four equal annual installments on the anniversary of the grant date; however, if Mr. Muehlhaeuser is terminated for any reason other than for cause (as defined in his employment agreement), no less than one half of the stock options will immediately vest. Mr. Muehlhaeuser will also be eligible for future long-term incentive awards under the Plan; pursuant to his employment agreement, his long-term incentive award grant target is $2,000,000 per year.
Subject to the termination provisions in his employment agreement, Mr. Muehlhaeuser’s employment will continue until the later of: (a) one year from the effective date of the Spin-Off; or (b) December 31, 2016. Upon the occurrence of the Spin-Off, the employment agreement provided that Mr. Muehlhaeuser would be our President and Chief Executive Officer. We assumed the employment agreement in connection with the Spin-Off.
Under his employment agreement, Mr. Muehlhaeuser was eligible for relocation services consistent with MTW policy and was eligible to participate in MTW’s 401(k) Retirement Plan and in its Deferred Compensation Plan. Mr. Muehlhaeuser also became eligible to receive health, dental and life insurance under MTW’s and to receive other benefits customarily offered to MTW’s executive officers, including a car allowance and reimbursement of tax preparation fees.
Mr. Muehlhaeuser’s employment agreement provides certain severance protections that are described below under “Post-Employment Compensation.” Mr. Muehlhaeuser also signed an agreement related to the protection of confidential information and intellectual property, as well as the non-solicitation of employees and the non-solicitation of customers.
Under the terms of his employment agreement, Mr. Stewart is entitled to an annual base salary of $540,000. He received an initial grant of non-qualified stock options under MTW’s 2013 Omnibus Incentive Plan with a fair market value of $700,000 upon the commencement of his employment with MTW. The stock options will vest in four equal annual installments on the anniversary of the grant date; however, if Mr.
-111-
Stewart is terminated for any reason other than for cause (as defined in his employment agreement), no less than one quarter of the stock options will immediately vest. Mr. Stewart will also be eligible for future long-term incentive awards; pursuant to his employment agreement, his long-term incentive award grant target is $700,000 per year.
Mr. Stewart’s employment agreement provides that he will be our Senior Vice President and Chief Financial Officer. Under his employment agreement, Mr. Stewart was eligible for executive benefits similar to those provided to other senior executives, including relocation services consistent with MTW policy. Following our assumption of the employment agreement in connection with the Spin-Off, we will be responsible for providing these benefits to Mr. Stewart. Mr. Stewart’s employment agreement provides certain severance protections that are described below under “Post-Employment Compensation.” Mr. Stewart also signed an agreement related to the protection of confidential information and intellectual property, as well as the non-solicitation of employees and the non-solicitation of customers.
Change in Control Severance Arrangements. In order to facilitate attraction and retention of highly-qualified executives, MTW had arrangements (Contingent Employment Agreements) with the named executive officers and certain other key executives that provide for the executives’ continued employment upon a change in control for a three-year period in the case of Mr. Muehlhaeuser and for a two-year period or a one-year period for other key executives. In addition, the arrangements provided for certain severance benefits in the event the executive is terminated without “cause” (as defined in the agreements) prior to the end of the employment period (as such, the agreements have a “double trigger”). For Mr. Muehlhaeuser, the severance amount was three years; for the other named executive officers, the severance amount was two years; and for all named executive officers there was no excise tax gross-up. Following the Spin-Off, we maintain similar Contingent Employment Agreements with the named executive officers. Further detail regarding these agreements is presented in the Post-Employment Compensation section.
Stock Ownership Guidelines
Prior to the Spin-Off, the MTW Compensation Committee had established stock ownership guidelines for its executive officers. In connection with the Spin-Off, our MFS Compensation Committee has established stock ownership guidelines for MFS' executive officers. The guidelines provide that, within the greater of (a) 5 years from the earlier of (i) the date that an executive officer became an executive officer of MFS, or (ii) the date that the executive officer became an executive officer of MTW if the executive officer had been an officer of MTW prior to the Spin-Off, or (b) three years from the effective date of the Spin-Off, each executive officer should hold an amount of MFS common stock with a value at least equal to the following:
• | CEO: 5 times base salary |
• | Other executive officers: 3 times base salary |
Stock ownership includes shares owned outright, restricted stock (including restricted stock units), and stock equivalents held in deferred compensation/retirement arrangements. Additionally, one-half of the guideline amounts can be met by vested, in-the-money stock options held by the executive. As of March 15, 2016, each of our executive officers met the stock ownership guideline or was on track to meet the guideline within the applicable period. Additionally, each executive officer holding shares of MTW common stock at the time of the Spin-Off is expected to hold those shares until the one-year anniversary of the Spin-Off.
If an executive does not meet his/her ownership requirement, which is measured as of the end of any given year (or the fifth anniversary of the date the executive officer was named an officer or became CEO), the executive must retain all net shares from the exercise of stock options and the vesting of restricted shares and performance shares until compliance is achieved.
Other Pay Elements
Deferred Compensation. To further help in attracting and retaining highly-qualified employees, to facilitate stock ownership and to encourage investing for retirement, executive officers and other key employees of MTW and its subsidiaries in the U.S., including our named executive officers during 2015, were eligible to participate in the MTW Deferred Compensation Plan. In connection with the Spin-Off, we adopted a similar Deferred Compensation Plan (the “MFS DC Plan”) to allow us to provide similar benefits to our key employees, including the named executive officers.
Under the MTW Deferred Compensation Plan, eligible participants may elect to defer up to 40% of base salary and up to 100% of awards to be paid under the STIP and other eligible bonus arrangements. The MFS DC Plan includes similar terms concerning eligible deferrals.
Credits to deferred compensation accounts for key employees under the MTW Deferred Compensation Plan could also include a contribution by MTW. This contribution would equal the amount of compensation deferred by the key employee for the plan year (subject to a maximum of 25% of eligible compensation) multiplied by a rate equal to the rate of variable retirement plan contributions that the participant received for the year under the 401(k) Retirement Plan plus one percent. If MTW were not to make a contribution to the 401(k) Retirement Plan, there would not be any employer contribution to the key employees under the Deferred Compensation Plan. The MFS DC Plan includes similar terms regarding potential contributions by MFS.
Deferred amounts could be invested into a variety of accounts, which mirrored the performance of several different mutual funds offered in the 401(k) Retirement Plan, as well as the MTW Stock Fund (which has included only common stock of MTW). Transfers between the MTW Stock Fund and the other funds have not been permitted. Key employee participants were not required to direct any minimum amount of deferred compensation into the MTW Stock Fund. The MFS DC Plan includes similar terms regarding investment of deferred amounts, including an MFS stock fund in place of the MTW Stock Fund.
-112-
The value of MTW’s annual contributions in 2015 to the MTW Deferred Compensation Plan on behalf of the named executive officers is presented in the Summary Compensation Table. Detailed information about the Deferred Compensation Plan is presented in the Non-Qualified Deferred Compensation Table.
Severance Pay Plan. MTW also had a severance pay plan establishing a discretionary severance program across MTW whereby all severance benefits were provided at MTW’s sole discretion and designed to meet the specific facts and circumstances of each termination. The Board of Directors of MTW had the sole authority to authorize any benefits under the plan to any elected officer of MTW. Other than this discretionary severance pay plan and the severance provisions of Messrs. Muehlhaeuser's and Stewart's respective employment agreements, MTW has not had a formal severance plan for other forms of employment termination in which the MFS named executive officers have participated. In connection with the Spin-Off, MFS adopted a severance pay plan similar to the plan maintained by MTW.
Other Executive Compensation Policies
Stock Awards Granting Policy. In 2015, based on the approval of the MTW Compensation Committee, MTW granted stock awards to its executive officers and other eligible key employees. In years prior to 2015, stock awards to executive officers consisted of stock options and performance shares, and stock awards to other key employees included stock options, performance shares and/or restricted stock units. In 2015, restricted stock units replaced performance shares due to the anticipated separation of MTW into two companies by the end of the first quarter 2016. Stock awards have generally been granted in late February. Stock awards are also used to attract executives and key employees, and, as such, stock awards have at times been made to executives and key employees at the time they became executives or key employees of MTW. In such cases, the grant date was the date employment commenced or the date the MTW Compensation Committee approved the awards. In all cases, the exercise price of stock options was the closing trading price on the grant date.
As described above, in connection with Mr. Muehlhaeuser’s recruitment to be our President and Chief Executive Officer, MTW granted him an initial award of non-qualified stock options under the MTW 2013 Omnibus Incentive Plan with a fair market value of $1,000,000 upon the commencement of his employment with MTW. Also as described above, in connection with Mr. Stewart’s recruitment to be our Senior Vice President and Chief Financial Officer, MTW granted him an initial award of non-qualified stock options under the MTW 2013 Omnibus Incentive Plan with a fair market value of $700,000 upon the commencement of his employment with MTW.
Securities Trading Policy. MTW maintained an Insider Trading Policy imposing specific standards on directors, officers and key employees of MTW. The policy has been intended not only to forbid such persons from trading in MTW stock on the basis of inside information, but to avoid even the appearance of improper conduct on the part of such persons. In addition to the specific restrictions set forth in the policy, which has included limits on pledging shares, the policy has required that all transactions in MTW stock by such persons and by others in their households be pre-cleared by the Corporate Secretary’s office. The only exception to the pre-clearance requirement has been regular, ongoing acquisitions of MTW stock resulting from continued participation in employee benefit plans that MTW or its agents have administered.
Pay Clawbacks. In addition to any right of recoupment against MTW's CEO or CFO pursuant to Section 304 of the Sarbanes-Oxley Act of 2002, MTW expressed an intent to recoup executive officer compensation, or a portion thereof, to the extent required under rules to be adopted by the SEC and New York Stock Exchange pursuant to the Dodd-Frank Wall Street Reform and Consumer Protection Act of 2010. We also intend to implement a policy, at MFS, that complies with such rules.
Tax Deductibility of Executive Compensation. Section 162(m) of the Internal Revenue Code of 1986, as amended (the “Code”), generally limits a publicly-traded company’s federal income tax deduction to $1,000,000 per year for compensation to its CEO and certain other highly compensated executive officers. Qualified performance-based compensation for the CEO and certain “covered officers” is not, however, subject to the deduction limit, provided certain requirements of Section 162(m) are satisfied. Certain awards under the MTW 2003 Incentive Stock and Awards Plan and the MTW 2013 Omnibus Incentive Plan were intended to qualify for the performance-based compensation exception under Section 162(m). It was the MTW's Compensation Committee’s intent to preserve the deductibility of executive compensation to the extent reasonably practicable and consistent with the best interests of MTW and its shareholders. We expect certain elements of our incentive compensation for our named executive officers to qualify as performance-based compensation after the Spin-Off pursuant to transition rules under Section 162(m).
Our Anticipated Compensation Programs
We believe the MTW executive compensation programs described above were both effective at retaining and motivating our named executive officers and competitive as compared to compensation programs at our peers. We have adopted compensation programs, at MFS, that are similar to those in place at MTW immediately prior to the Spin-Off. However, the MFS Compensation Committee will continue to evaluate our compensation and benefit programs and may make changes as necessary to meet prevailing business needs and strategic priorities. Changes to elements of our compensation programs may be made going forward if appropriate, based on industry practices and the competitive environment for a newly-formed, publicly-traded company of our size, or for other reasons.
-113-
Compensation Committee Interlocks and Insider Participation
No Compensation Committee member is:
• | an officer, employee or former officer of MFS; |
• | a participant in a "related person" transaction occurring after January 1, 2013 (for a description of our policy on related person transactions, see "Certain Relationships and Related Party Transactions, and Director Independence - Procedures for Approval of Related Party Transactions"); or |
• | an executive officer of another entity at which one of our executive officers serves on the Board of Directors. |
Compensation Committee Report
The MFS Compensation Committee has reviewed and discussed the Compensation Discussion and Analysis for fiscal year 2015 included in this Annual Report on Form 10-K with the management of MFS. Based on this review and discussion, the MFS Compensation Committee recommended to the Board of Directors of MFS, and the Board has approved, that the Compensation Discussion and Analysis be included in this Annual Report on Form 10-K for the fiscal year ended December 31, 2015 for filing with the SEC.
Joan K. Chow, Chairperson
Dino J. Bianco
Thomas D. Davis
Timothy J. Fenton
Summary Compensation Tables
The following table sets forth the “total compensation” earned by the named executive officers for service with MTW or its subsidiaries during the fiscal year ending December 31, 2015, and, to the extent the named executive officer was a named executive officer of MTW for the fiscal years ending December 31, 2014 or December 31, 2013, such total compensation for service with MTW during those years.
• | Actual payouts are presented in the Salary (before deferrals) and Non-Equity Incentive Plan Compensation (STIP payouts) columns. |
• | The grant date fair value of equity-based grants is shown in the Stock Awards and Options Awards columns. None of this amount was realized during 2015; instead the actual value realized, if any, will be realized over the next several years. |
• | The actuarial change in the pension value from the preceding year is presented in the Change in Pension Value column; MTW did not provide above-market earnings on nonqualified deferred compensation. The amount consists entirely of the change in the actuarial present value of the individual’s accumulated benefit under MTW’s Supplemental Executive Retirement Plan (e.g., for 2015 this reflects the change from December 31, 2014 to December 31, 2015). |
• | In addition to the annual grant of stock option awards and the restricted stock unit awards, in 2015 certain named executive officers received retention awards in the form of Restricted Stock Awards, which are disclosed below and described above in the Compensation Discussion and Analysis. |
-114-
Name & Principal Position | Year | Salary | Bonus | Stock Awards (1) | Option Awards (1)(2) | Non-Equity Incentive Plan Compensation (3) | Change in Pension Value and Nonqualified Deferred Compensation Earnings | All Other Compensation (4) | Total | ||||||||||||||||
Hubertus M. Muehlhaeuser President and Chief Executive Officer | 2015 | $ | 184,615 | $ | 200,000 | $ | — | $ | 1,000,000 | $ | — | $ | — | $ | 134,962 | $ | 1,519,577 | ||||||||
John O. Stewart Senior Vice President and Chief Financial Officer | 2015 | $ | 62,308 | $ | 54,886 | $ | — | $ | 700,000 | $ | — | $ | — | $ | 24,072 | $ | 841,266 | ||||||||
Josef Matosevic Senior Vice President and Chief Operating Officer | 2015 | $ | 347,289 | $ | — | $ | 194,398 | $ | 142,657 | $ | — | $ | — | $ | 50,280 | $ | 734,624 | ||||||||
Maurice D. Jones Senior Vice President General Counsel & Secretary | 2015 | $ | 418,180 | $ | — | $ | 391,201 | $ | 370,432 | $ | — | $ | 204,118 | $ | 31,054 | $ | 1,414,985 | ||||||||
2014 | $ | 412,000 | $ | — | $ | 564,291 | $ | 300,752 | $ | — | $ | 198,769 | $ | 31,503 | $ | 1,507,315 | |||||||||
2013 | $ | 412,000 | $ | — | $ | 409,925 | $ | 227,700 | $ | 258,159 | $ | 241,409 | $ | 33,405 | $ | 1,582,598 | |||||||||
Richard Caron Senior Vice President Innovation | 2015 | $ | 342,916 | $ | — | $ | 92,214 | $ | 87,261 | $ | — | $ | — | $ | 7,800 | $ | 530,191 | ||||||||
(1) | The amounts listed in the "Stock Awards" and "Option Awards" columns represent the aggregate grant date fair value of such awards in accordance with Accounting Standards Codification Topic 718 ("ASC 718"). |
(2) | Reflects the grant date fair value of the awards granted in each year shown as computed under ASC 718. The options expire in ten years from the grant date. Options granted vest in 25% increments annually beginning on the first anniversary of the grant date and continuing on each subsequent anniversary until the fourth anniversary. The retention awards in the form of Restricted Stock Awards, which are described above in the Compensation Discussion and Analysis, had no grant date fair value in 2015 under ASC 718 because they were contingent on the Spin-Off and therefore are not considered granted for purposes of ASC 718 until the completion of the Spin-Off. |
(3) | No amounts were earned under MTW's Short-Term Incentive Plan for 2015, except that Mr. Stewart’s 2015 award was guaranteed at 100% of the target of 70% of base salary but pro-rated based on Mr. Stewart’s date of hire, which was November 9, 2015. The guaranteed bonus amount is shown in the “Bonus” column as required by SEC regulations. |
(4) | Amounts include automobile allowances for all executive officers. For Mr. Muehlhaeuser, the amount also includes an additional cash payment of $123,077 in connection with his commencement of employment and contributions to our defined contribution plans in the amount of $10,600. For Mr. Stewart, the amount also includes a relocation benefit of $22,272 and contributions to our defined contribution plans in the amount of $2,492. For Mr. Matosevic, the amount also includes a relocation benefit of $36,780 and taxable fringe benefits and contributions to our defined contribution plans in the amount of $10,600. For Mr. Jones, the amount also includes contributions to our defined contribution plans in the amount of $10,600 and other taxable fringe benefits. |
GRANTS OF PLAN-BASED AWARDS IN 2015
The following table sets forth the 2015 awards under MTW’s 2013 Omnibus Incentive Plan. In addition to the stock option awards and the restricted stock unit awards, certain named executive officers received retention awards in the form of Restricted Stock Awards, which are disclosed below and described above in the Compensation Discussion and Analysis.
-115-
Name | Award Type | Grant Date | Estimated Future Payouts Under Non-Equity Incentive Plan Awards | All Other Option Awards: Number of Securities Underlying Options (#) | Exercise or Base Price of Option Awards ($/Sh) | Grant Date Fair Value of Stock and Option Awards (1) | ||||||||||||
Threshold | Target | Maximum | ||||||||||||||||
Hubertus M. Muehlhaeuser | STIP | $ | — | $ | 800,000 | $ | 1,600,000 | |||||||||||
Stock Options | 8/6/2015 | 117,096 | $ | 16.79 | $ | 1,000,000 | ||||||||||||
John O. Stewart | STIP | $ | — | $ | 378,000 | $ | 756,000 | |||||||||||
Stock Options | 11/9/2015 | 83,135 | $ | 15.78 | $ | 700,000 | ||||||||||||
Josef Matosevic | STIP | $ | — | $ | 301,000 | $ | 602,000 | |||||||||||
Restricted Stock Unit | 1/4/2015 | 2,000 | $ | 43,760 | ||||||||||||||
Stock Options | 2/17/2015 | 12,580 | $ | 21.80 | $ | 142,657 | ||||||||||||
Restricted Stock Unit | 2/17/2015 | 6,910 | $ | 150,638 | ||||||||||||||
Restricted Stock Award | 4/8/2015 | 15,244 | (2) | |||||||||||||||
Maurice D. Jones | STIP | $ | — | $ | 271,817 | $ | 543,634 | |||||||||||
Stock Options | 2/17/2015 | 32,666 | $ | 21.80 | $ | 370,432 | ||||||||||||
Restricted Stock Unit | 2/17/2015 | 17,945 | $ | 391,201 | ||||||||||||||
Restricted Stock Award | 4/8/2015 | 29,422 | (2) | |||||||||||||||
Richard Caron | STIP | $ | — | $ | 137,166 | $ | 274,333 | |||||||||||
Stock Options | 2/17/2015 | 7,695 | $ | 21.80 | $ | 87,261 | ||||||||||||
Restricted Stock Unit | 2/17/2015 | 4,230 | $ | 92,214 | ||||||||||||||
(1) | Reflects the grant date fair value of the awards granted in 2015 as computed under ASC 718. The options expire ten years from the grant date and vest in 25% increments annually beginning on the first anniversary of the grant date and continuing on each subsequent anniversary until the fourth anniversary. The restricted stock units vest 100% on the third anniversary of the grant date. The restricted stock awards, which are the retention awards described in the Compensation Discussion and Analysis, vest on the second anniversary of the Spin-Off. |
(2) | The retention awards in the form of Restricted Stock Awards, which are described above in the Compensation Discussion and Analysis, had no grant date fair value in 2015 under ASC 718 because they were contingent on the Spin-Off and therefore are not considered granted for purposes of ASC 718 until the completion of the Spin-Off. We have voluntarily disclosed them in this year’s Grants of Plan-Based Awards Table but will also include them in the Grants of Plan-Based Awards Table for the year in which they are considered granted for purposes of ASC 718. |
OUTSTANDING EQUITY AWARDS AT 2015 FISCAL YEAR END
The following table sets forth the stock option, performance share, restricted stock and restricted stock unit awards previously granted to the named executive officers relating to MTW common stock that were outstanding at the end of 2015. As disclosed above under the heading “Treatment of Equity-Based Awards in the Spin-Off,” in connection with the Spin-Off, each outstanding MTW stock option, restricted share, restricted stock unit and performance share was treated in a manner similar to that experienced by MTW shareholders with respect to their MTW common stock. More specifically, each of these awards was deemed bifurcated into two separate awards: (1) a modified award covering MTW common stock; and (2) a new award of the same type covering MFS common stock. Each of these two awards is subject to the same terms and conditions after the Spin-Off as the terms and conditions applicable to the original MTW award prior to the Spin-Off, except for the adjustments disclosed under “Treatment of Equity-Based Awards in the Spin-Off.” Pursuant to applicable SEC regulations, the table below reflects outstanding awards at the end of 2015 and does not take into account any of the adjustments in connection with the Spin-Off.
-116-
Name | Option Awards | Stock Awards | |||||
Number of Securities Underlying Unexercised Options (#) Unexercisable | Option Exercise Price ($) | Option Expiration Date | Number of Shares or Units of Stock That Have Not Vested (#) | Market Value of Shares or Units of Stock That Have Not Vested ($) | Equity Incentive Plan Awards: Number of Unearned Shares, Units or Other Rights that Have Not Vested (#) | Equity Incentive Plan Awards: Market or Payout Value of Unearned Shares, Units or Other Rights That Have Not Vested ($) | |
Hubertus M. Muehlhaeuser | 117,096 | $16.79 | August 6, 2025 | 0 | 0 | 0 | 0 |
John O. Stewart | 83,135 | $15.78 | November 9, 2025 | 0 | 0 | 0 | 0 |
Josef Matosevic | 1,575 | $16.28 | February 28, 2022 | 21,154(2) | $324,714(2) | 2,306(1) 4,180(3) | $35,397(1) $64,163(3) |
1,958 | $18.14 | February 26, 2023 | |||||
4,175 | $29.07 | February 14, 2024 | |||||
12,580 | $21.80 | February 17, 2025 | |||||
Maurice D. Jones | 0 | $26.10 | May 3, 2016 | 47,367(2) | $727,083(2) | 14,934(1) 15,210(3) | $229,237(1) $233,474(3) |
0 | $29.52 | February 27, 2017 | |||||
0 | $39.13 | February 15, 2018 | |||||
0 | $4.41 | February 24, 2019 | |||||
0 | $11.35 | February 11, 2020 | |||||
0 | $19.78 | February 14, 2021 | |||||
10,080 | $16.28 | February 28, 2022 | |||||
12,650 | $18.14 | February 26, 2023 | |||||
15,210 | $29.07 | February 14, 2024 | |||||
32,666 | $21.80 | February 17, 2025 | |||||
Richard Caron | 0 | $11.35 | February 11, 2010 | 4,230(2) | $64,931(2) | 2,306(1) 3,800(3) | $35,397(1) $58,330(3) |
0 | $19.78 | February 14, 2011 | |||||
1,675 | $16.28 | February 28, 2012 | |||||
1,958 | $18.14 | February 26, 2013 | |||||
3,795 | $29.07 | February 14, 2014 | |||||
7,695 | $21.80 | February 17, 2015 | |||||
(1) | Consists of the performance share awards granted in 2013 under the 2003 Incentive Stock and Awards Plan. The performance period concluded at the end of 2015. The market value is calculated based on the unvested award amount noted in the preceding column multiplied by the closing stock price on December 31, 2015 of $15.35. |
(2) | Consists of the restricted stock awards and restricted stock units granted in 2015 under the 2013 Omnibus Incentive Plan. The market value is calculated based on the unvested award amount noted in the preceding column multiplied by the closing stock price on December 31, 2015 of $15.35. These restricted stock units will vest on the third anniversary of the grant date. The restrictions on the restricted stock awards lapse on the second anniversary of the Distribution Date. As described in the text preceding the table above, pursuant to applicable SEC regulations, the table above reflects outstanding awards relating to MTW stock at the end of 2015 and does not take into account any of the adjustments in connection with the Spin-Off. The modified awards relating to MFS |
-117-
stock following the Spin-Off will be reflected in the Outstanding Equity Awards Table at 2016 Fiscal Year End table that will be included in MFS’ proxy statement for its 2017 annual meeting.
(3) | Consists of the performance share awards granted in 2014 under the 2013 Omnibus Incentive Plan. The performance period expires at the end of 2016. In view of the Spin-Off, the Board of MTW prior to the Spin-Off agreed that the 2014 performance share award would be paid-out at target at the end of the three-year performance period. Therefore, in projecting performance as of December 31, 2015, the number of shares appearing here is the number of shares that would be awarded assuming target performance (100%) is achieved. The market value is calculated based on the unvested award amount noted in the preceding column multiplied by the closing stock price on December 31, 2015 of $15.35. |
OPTION EXERCISES AND STOCK VESTED IN FISCAL 2015
The following table presents, for each named executive officer, the stock options exercised and the performance shares vested during 2015. These stock options and performance shares were granted to the named executive officers prior to 2015; consequently, the value realized by the executives was actually earned over several years.
Name | Option Awards (1) | Stock Awards | ||||||||
Number of Shares Acquired on Exercise (#) | Value Realized on Exercise ($) | Number of Shares Acquired on Vesting (#) | Value Realized on Vesting ($) | |||||||
Hubertus M. Muehlhaeuser | — | — | — | — | ||||||
John O. Stewart | — | — | — | — | ||||||
Josef Matosevic | — | — | 2,523 | $ | 54,926 | |||||
Maurice D. Jones | 29,268 | $ | 355,899 | 16,068 | $ | 349,800 | ||||
Richard Caron | — | — | 2,686 | $ | 58,252 | |||||
(1) The dollar value realized by stock option exercises in 2015 represents the total pre-tax value realized by the named executive officers upon exercise. The realized amount represents the fair market value of the shares on the date exercised minus the exercise price.
RETIREMENT AND NON-QUALIFIED DEFERRED COMPENSATION PLANS
Pension Benefits for Fiscal 2015
(Supplemental Executive Retirement Plan)
The following table sets forth information with respect to the MTW Supplemental Executive Retirement Plan as of December 31, 2015. Of the named executive officers, only Mr. Jones was eligible to participate in this Plan during 2015. In connection with the Spin-Off, we assumed the responsibility for providing Mr. Jones his benefit under the MTW Supplemental Executive Retirement Plan and adopted a similar plan document for purposes of providing the benefit. However, no other employees are or will become eligible to participate in the plan.
Name | Plan Name | Number of Years of Credited Service (#) (1) | Present Value of Accumulated Benefit ($) | Payments During Last Fiscal Year ($) | ||||
Maurice D. Jones | SERP | 11 | $ | 2,283,510 | $ | — | ||
(1) Reflects the number of years since the participant began participating in the plan.
Under MTW’s Supplemental Executive Retirement Plan, Mr. Jones was entitled to receive retirement benefits which were intended to fund an annuity based on a percentage of his final average pay at the earlier of normal retirement (age 65) or the first of the month following the date on which his attained age plus years of service with MTW equals eighty (80). Mr. Jones’s final five-year average pay would be computed by averaging his projected base salary (including elective deferrals) and non-equity incentive plan compensation payable for each year for the five consecutive calendar year period when he would receive his highest average compensation prior to the earlier of normal retirement (age 65) or the first of the month following the date on which his attained age plus years of service with MTW equaled eighty (80). Benefits would be computed using a straight-life annuity and would not be reduced for social security or other offsets. Under the Plan, an account balance was maintained for Mr. Jones, which account reflected (a) an annual contribution credit determined by calculating the present value of the lump-sum actuarial equivalent a specified percentage of his five-year final average pay payable as a life annuity, at the earlier of (i) normal retirement (age 65) or (ii) the first of the month following the date on which his attained age plus years of service with MTW equaled eighty (80); and (b) an annual increase in the account balance at the end of each year equal to nine percent (9%) of the account balance at the beginning of the year. The account balance is distributed in a lump-sum or over a fixed number of years not to exceed ten (10) years. In connection with the Spin-Off, we assumed the responsibility for providing Mr. Jones his benefit under the MTW Supplemental Executive Retirement Plan and adopted a similar plan document for purposes of providing the benefit. However, no other employees are or will become eligible to participate in the plan.
-118-
Non-Qualified Deferred Compensation for Fiscal 2015
The following table sets forth information with respect to MTW’s Deferred Compensation Plan, a non-qualified plan, as of December 31, 2015:
Name | Executive Contributions in Last FY | Registrant Contributions in Last FY | Aggregate Earnings in Last FY | Aggregate Withdrawals/ Distributions | Aggregate Balance at Last FYE | ||||||||||
Hubertus M. Muehlhaeuser | $ | — | $ | — | $ | — | $ | — | $ | — | |||||
John O. Stewart | $ | — | $ | — | $ | — | $ | — | $ | — | |||||
Josef Matosevic | $ | — | $ | — | $ | — | $ | — | $ | — | |||||
Maurice D. Jones | $ | 20,909 | $ | — | $ | (55,689 | ) | $ | 62,726 | $ | 234,969 | ||||
Richard Caron | $ | — | $ | — | $ | — | $ | — | $ | 2,971 | |||||
Post-Employment Compensation
MTW entered into Contingent Employment Agreements with each of the named executive officers prior to the Spin-Off. Following the Spin-Off, those Contingent Employment Agreements have been replaced with similar agreements between MFS and the named executive officers. These Agreements provide generally that in the event of a “change in control” (as defined in the Agreements) of MFS, Mr. Muehlhaeuser will continue to be employed for three years and each other named executive officer will continue to be employed for two years. Under the Contingent Employment Agreements, each executive would remain employed at the same position held as of the change in control date, and would receive a salary at least equal to the salary in effect as of such date, plus all bonuses, incentive compensation, and other benefits extended by MFS to its executive officers and key employees, provided that the plans and bonus opportunity are no less favorable than those that were available prior to a change in control. After a change in control, the executive’s compensation would be subject to upward adjustment at least annually based upon the executive’s contributions and the level of increases provided to other officers and employees. Each Contingent Employment Agreement would terminate prior to the end of the applicable employment period if the executive voluntarily retired or were terminated “for cause,” as defined in the Contingent Employment Agreement.
Under the form of Contingent Employment Agreement with Messrs. Muehlhaeuser, Stewart, Matosevic and Jones prior to the Spin-Off:
• | In the event the executive were terminated without cause following a change in control, the executive would be entitled to receive a payment equal to the base salary and benefits the executive would have otherwise been paid but for the termination, and the annual incentive compensation the executive would have otherwise been paid but for the termination, calculated on the basis of the average of the executive's bonus payouts during the last three fiscal years prior to the termination, through the applicable employment period. |
• | Upon a change in control, stock options would fully vest, restrictions on restricted stock or similar securities lapse, and each holder of performance shares would have the right to receive, in exchange for the performance shares, cash equal to a pro-rated amount of performance shares based on the amount of time that had lapsed during the performance period up to the change in control. In the event the executive were terminated for cause, the executive would be entitled only to the salary and benefits accrued and vested as of the effective date of the termination. The Contingent Employment Agreements are terminable by either party at any time prior to a change in control. |
Under the form of Contingent Employment Agreement between MFS and the named executive officers after the Spin-Off:
• | In the event the named executive officer were terminated without cause following a change in control, he would be entitled to receive a payment equal to the base salary and benefits the executive would have otherwise been paid but for the termination, and the annual incentive compensation the executive would have otherwise been paid but for the termination, calculated on the basis of his target bonus for the year of termination, through the applicable employment period. |
• | The named executive officer’s equity-based awards would not automatically vest upon a change in control if his employment continued. However, if his employment is subsequently terminated by the surviving entity without cause, or by him for good reason, in either case within 24 months following a change of control, all of his equity-based awards that are in effect as of the date of such termination will be vested in full or deemed earned in full (assuming the maximum performance goals provided under such award were met, if applicable) effective on the date of such termination (i.e., a "double trigger"). In addition, to the extent that equity-based awards are not assumed by the purchaser, successor or surviving entity in the change in control, or a more favorable outcome is not provided in the applicable plan or award agreement, upon a change of control: (1) stock options, stock-appreciation rights and time-based restricted stock (including restricted stock units) will vest and may be paid out in cash; (2) performance-based awards will be pro-rated and paid out in cash assuming the greater of target or projected actual performance (based on the assumption that the applicable performance goals continue to be achieved at the same rate through the end of the performance period as they are at the time of the change of control); and (3) each other type of equity-based award not mentioned above will be paid out in cash based on the value of the award as of the date of the change of control. |
Under all of the Contingent Employment Agreements, in the event the executive were terminated for cause, the executive would be entitled only to the salary and benefits accrued and vested as of the effective date of the termination. The Contingent Employment Agreements are terminable by either party at any time prior to a change in control.
-119-
If a named executive officer were terminated without cause within six months prior to a change in control and it was reasonably demonstrated by the employee that the termination (i) was at the request of a third party who has taken steps reasonably calculated to effect a change in control; or (ii) otherwise arose in connection with or in anticipation of a change in control, the employee would be entitled to the severance payment and benefits that he would have otherwise have received if he were terminated without cause following a change in control.
If any of the payments to a named executive officer would constitute an “excess parachute payment” under Section 280G of the Internal Revenue Code and would result in the imposition on the executive of an excise tax under Section 4999 of the Internal Revenue Code (the “Excise Tax”), the executive would not be entitled to any tax gross up amount; however, the executive would be entitled to receive the “best net” treatment. Under the “best net” treatment, if the after-tax amount (taking into account all federal, state and local excise, income and other taxes) that would be retained by the executive is less than the after-tax amount that would be retained by the executive if the executive were instead to be paid or provided (as the case may be) the maximum amount that the executive could receive without being subject to the Excise Tax (the “Reduced Amount”), then the executive would be entitled to receive the Reduced Amount instead of the full amount that would have been subject to the Excise Tax.
The Contingent Employment Agreements also provide that if the executive was terminated (i) without cause prior to the end of the employment period; or (ii) within six months prior to a change in control in anticipation of a change in control as explained above, the executive will be prohibited from competing with us for (y) the lesser of two years (three years, in the case of Mr. Muehlhaeuser) or the unexpired term of the employment period or (z) two years (three years, in the case of Mr. Muehlhaeuser) in the case of a termination within six months prior to a change in control in anticipation of a change in control as described above.
In addition to the Contingent Employment Agreements, MTW entered into employment agreements with Mr. Muehlhaeuser and Mr. Stewart that provide severance benefits upon certain types of termination of employment. Under his agreement, if Mr. Muehlhaeuser’s employment were terminated by MTW without cause (as defined in the agreement) or if he terminated his employment with good reason (as defined in the agreement), subject to the execution of a release of any and all claims or potential claims against MTW, he would be entitled to receive two years of base salary plus an amount equal to 200% of his target annual incentive compensation for the year of termination (regardless of whether the targeted performance was achieved or exceeded) (the “Muehlhaeuser Severance Payment”), paid over a two-year period (the “Muehlhaeuser Severance Period”). The Muehlhaeuser Severance Payment would be subject to offset (but not below zero) by the amount of any base salary, short-term incentive compensation or cash compensation earned by Mr. Muehlhaeuser or to which he is entitled during the Muehlhaeuser Severance Period and which is actually paid to him: (1) from any subsequent employer following the termination of his employment with MTW, or (2) from MTW under any Contingent Employment Agreement. If Mr. Muehlhaeuser is terminated for cause, payment of all compensation from MTW will immediately cease, except for any compensation accrued but unpaid through the date of termination. We assumed Mr. Muehlaeuser’s employment agreement from MTW in connection with the Spin-Off, and references to MTW in the agreement are now deemed to be references to MFS.
Mr. Stewart’s agreement provided that, if his employment were terminated by MTW without cause (as defined in the agreement) or if he terminated his employment with good reason (as defined in the agreement), subject to the execution of a release of any and all claims or potential claims against MTW, he would be entitled to receive one year of base salary plus an amount equal to 100% of his target annual incentive compensation for the year of termination (regardless of whether the targeted performance was achieved or exceeded) (the “Stewart Severance Payment”), paid over a one-year period (the “Stewart Severance Period”). The Stewart Severance Payment would be subject to offset (but not below zero) by the amount of any base salary, short-term incentive compensation or cash compensation earned by Mr. Stewart or to which he is entitled during the Stewart Severance Period and which is actually paid to him: (1) from any subsequent employer following the termination of his employment with MTW, or (2) from MTW under any Contingent Employment Agreement. If Mr. Stewart is terminated for cause, payment of all compensation from MTW will immediately cease, except for any compensation accrued but unpaid through the date of termination. We assumed Mr. Stewart’s employment agreement from MTW in connection with the Spin-Off, and references to MTW in the agreement are now deemed to be references to MFS.
The employment agreements define “cause” generally as any conviction for, or entry of a plea of guilty or nolo contendere with respect to, any felony or any crime involving an act of moral turpitude; engaging in any act involving fraud or theft; neglect or breach of duties or intentional misconduct in discharging such duties; continued absence from duties without consent after receipt of notification, other than absence due to bona fide illness or disability; failure or refusal to comply with the directions of the chairperson of the board or with the policies, standards and regulations of MTW (MFS after the Spin-Off), provided that such directions, policies, standards or regulations do not require any action which is illegal or the omission of any action required by applicable law, regulations or licensing standards; conduct, actions, or performance that violates policies concerning ethics or employee conduct; or breach of the agreement.
The employment agreements define “good reason” generally as a material diminution in position, authority or title, or the assignment of duties that are materially inconsistent with the executive’s position or title as described in the agreement; a material diminution in base salary or incentive/bonus opportunities except for across-the-board temporary salary reductions of twenty percent (20%) or less similarly affecting other employees; a change required by our Board of Directors of MFS’ principal offices of more than 50 miles from the location of MFSs’ principal offices at the time of the Spin-Off; a material breach of the agreement by us or our successors or assigns; or a failure of a successor to assume the agreement. In addition, Mr. Muehlaeuser’s agreement defines “good reason” to include the failure of the executive to be elected and maintained as a director of MFS after the Spin-Off. His agreement also defined “good reason” to include a failure to appoint him as a director of MFS at its formation (or immediately following the commencement date under the agreement), but Mr. Muehlaeuser was so appointed and this element of the “good reason” definition therefore can no longer be triggered.
If the executive is unable to perform his duties due to his disability, he will continue to receive his standard compensation, reduced by any disability payment to which he may be entitled in lieu of such compensation, until the last day of the term of the employment agreement. At
-120-
the expiration of the term provided for in the agreement, payment of all compensation to the executive under the employment agreement will immediately cease (except for any payment of compensation accrued but unpaid through that date, COBRA benefits and other benefits to which the executive may be entitled notwithstanding the termination of his employment). If the executive dies during the term, all payments and rights to compensation and benefits under the employment agreement will immediately cease, except for any compensation and benefits accrued but unpaid through the date of his death.
MTW also has made equity-based retention awards to certain key employees, including Messrs. Matosevic and Jones, to provide additional incentive for the employees to continue in employment and contribute toward the successful completion of the contemplated Spin-Off. The retention awards consisted of shares of MTW common stock that would vest on the second anniversary of the Spin-Off if the employee was continuously employed with MTW or an affiliate through the second anniversary of the effective date of the Spin-Off. The shares would earlier vest in full upon termination of the employee as a result of death, disability or retirement upon or following the Spin-Off. The shares would also vest in full upon an involuntary termination of the employee, other than for cause, by MTW, or a termination by the employee for good reason, regardless of whether the Spin-Off had then occurred.
Estimated Payments upon a Change in Control
The following table presents the estimated payouts that would have been made to the named executive officers upon a change in control of MTW coupled with an executive’s termination of employment (other than for cause or retirement), assuming the change in control occurred as of December 31, 2015. The calculations are intended to provide reasonable estimates, based on the noted assumptions, of the potential benefits payable. The actual amount of benefits, if any, would depend upon the executive’s pay, terms of a change in control transaction and the subsequent impact on the executive’s employment.
Name | Base Salary (1) | Annual Incentive-Based Compensation (2) | Stock Options (3) | Restricted Stock Units (4) | Performance Shares (4) | Benefits (5) | Total | ||||||||||||||
Hubertus M. Muehlhaeuser | $ | 2,400,000 | $ | 2,400,000 | $ | — | $ | — | $ | — | $ | 70,979 | $ | 4,870,979 | |||||||
John O. Stewart | $ | 1,080,000 | $ | 756,000 | $ | — | $ | — | $ | — | $ | 47,319 | $ | 1,883,319 | |||||||
Josef Matosevic | $ | 860,000 | $ | 602,000 | $ | — | $ | 370,764 | $ | 61,078 | $ | 47,319 | $ | 1,941,161 | |||||||
Maurice D. Jones | $ | 836,360 | $ | 543,634 | $ | — | $ | 727,083 | $ | 446,723 | $ | 47,319 | $ | 2,601,119 | |||||||
Richard Caron(6) | $ | 685,832 | $ | 274,333 | $ | — | $ | 64,931 | $ | 59,619 | $ | 47,319 | $ | 1,132,034 | |||||||
(1) | Represents three times Mr. Muehlhaeuser’s and two times each of the other executive's base salary on December 31, 2015. |
(2) | Represents three times Mr. Muehlhaeuser’s and two times each of the other executive's incentive compensation under MTW’s Short-Term Incentive Plan at target. |
(3) | Intrinsic value of unvested stock options based on the closing trading price ($15.35) of MTW’s Common Stock at December 31, 2015, the last trading day of 2015. |
(4) | For restricted stock units, represents the value of unvested units based on the closing price ($15.35) of MTW’s common stock on December 31, 2015, the last trading day of 2015. For performance shares, represents the value of unvested shares, prorated and based on performance at year-end which for the 2013-2015 performance cycle was then projected between threshold and target and thus included at target (100%), and the 2014-2016 performance cycle was then projected below threshold and thus included at threshold (25%). These projections were based on the closing price ($15.35) of MTW’s common stock on December 31, 2015, the last trading day of 2015. The actual level of achievement for the 2013-2015 performance cycle was subsequently determined to be at 78.6% of target. For each of the executives other than Mr. Caron, these benefits would be received upon a change in control regardless of whether the executive’s employment was terminated in connection with the change in control. For Mr. Caron, these benefits would be received only upon a qualifying termination of employment following a change in control unless his equity-based awards were not assumed or replaced in the change in control transaction. |
(5) | Represents three times Mr. Muehlhaeser’s and two times each of the other executive's value of the annual benefits provided to the executive. |
(6) | Mr. Caron’s Contingent Employment Agreement did not become effective until the Spin-Off. However, for purposes of this disclosure, the amounts shown for Mr. Caron assume the Agreement was in effect as of December 31, 2015. |
As stated in the Compensation Discussion and Analysis, MTW also has maintained a formal severance pay plan that establishes a discretionary severance program across MTW whereby all severance benefits are provided at MTW’s sole discretion and will be designed to meet the specific facts and circumstances of each termination. The Board of Directors of MTW has the sole authority to authorize any benefits under the plan to any elected officer of MTW. Other than this discretionary severance pay plan and the employment agreements with Messrs. Muehlhaeuser and Stewart, MTW does not have a formal severance plan or other forms of employment termination benefits that apply to the named executive officers except in the event of a change in control as described above. Following the Spin-Off, MFS adopted a
-121-
severance plan similar to that of MTW, and we expect initially to implement similar practices, although we may modify such plans or practices, or adopt different plans or practices, in the future.
-122-
Item 12. SECURITY OWNERSHIP OF CERTAIN BENEFICIAL OWNERS AND MANAGEMENT
The following tables provide information regarding the beneficial ownership of our common stock as of March 4, 2016 by:
• | each of our directors; |
• | each Named Executive Officer; |
• | all of our directors and executive officers as a group; and |
• | each of our stockholders whom we believe, based on the assumptions described below, beneficially own more than 5% of our outstanding common stock as of March 4, 2016. |
Except as otherwise noted below, for information based on Schedule 13D or Schedule 13G filings, we based the share amounts on each person or entity’s beneficial ownership of MTW common stock on December 31, 2015, giving effect to a distribution ratio of one share of our common stock for every one share of MTW common stock he, she or it held.
Except as otherwise noted in the footnotes below, each person or entity identified in the table has sole voting and investment power with respect to the securities he, she or it holds. Each of the persons listed below is, the beneficial owner of less than 1% of the outstanding shares of our common stock, and the executive officers and directors as a group own less than 1% of the outstanding shares of our common stock. The table also reflects for each person, where applicable, the number of common stock units associated with compensation deferred under the MFS Deferred Compensation Plan. None of the persons named below has pledged any of his or her shares as security.
As of March 4, 2016, approximately 137,016,712 shares of our common stock were issued and outstanding.
Total Shares to Be Beneficially Owned | ||||
Director or Named Executive Officer | Number of Shares of Common Stock Beneficially Owned (1) | Number of Deferred Common Stock Units Beneficially Owned (2) | ||
Directors | ||||
Dino J. Bianco | 4,914 (3) | 0 | ||
Joan K. Chow | 16,936 (4) | 0 | ||
Thomas D. Davis | 0 | 0 | ||
Cynthia M. Egnotovich | 64,755 (4)(5) | 13,769 | ||
Timothy J. Fenton | 0 | 0 | ||
Andrew Langham | 0 | 0 | ||
Named Executive Officers | ||||
Hubertus M. Muehlhaeuser | 0 | 0 | ||
John O. Stewart | 0 | 0 | ||
Josef Matosevic | 35,215 (6) | 0 | ||
Maurice D. Jones | 533,423 (7) | 8,063 | ||
Richard N. Caron | 48,439 (8) | 0 | ||
All directors, named executive officers and current executive officers as a group (12 persons) | 703,682 | 21,832 | ||
(1) | Unless otherwise noted, the specified persons have sole voting power and sole dispositive power as to the indicated shares. Each of the persons listed is the beneficial owner of less than 1% of the outstanding shares of common stock. |
(2) | The Company has the sole right to vote all shares of Common Stock underlying the Common Stock units held in the Deferred Compensation Plan Trust. The independent trustee of the Trust has dispositive power as to such shares. |
(3) | Includes 4,914 restricted stock units. |
(4) | Includes 9,640 restricted stock units. |
(5) | Includes 2,000 shares under stock option awards that Ms. Egnotovich has the right to acquire within sixty days following March 4, 2016. |
(6) | Includes 9,461 shares under stock option awards that Mr. Matosevic has the right to acquire within sixty days following March 4, 2016. Also includes (a) 8,910 restricted stock units, and (b) 15,244 shares of restricted stock. |
(7) | Includes 365,701 shares under stock option awards that Mr. Jones has the right to acquire within sixty days following March 4, 2016. Also includes (a) 17,945 restricted stock units, (b) 29,422 shares of restricted stock, and (c) 5,708 shares held in Mr. Jones’ 401(k) Retirement Plan. |
-123-
(8) | Includes 42,609 shares under stock option awards that Mr. Caron has the right to acquire within sixty days following March 4, 2016. Also includes 4,230 restricted stock units. |
Total Shares to Be Beneficially Owned | ||||
Principal Stockholder and Address | # of Shares | % of Class | ||
Carl C. Icahn(1) c/o Icahn Capital LP 767 Fifth Avenue, 47th Floor New York, NY 10153 | 10,582,660 | 7.74% | ||
The Vanguard Group, Inc.(2) 100 Vanguard Boulevard Malvern, PA 19355 | 8,196,433 | 6.00% | ||
Glenview Capital Management, LLC(3) 767 Fifth Avenue, 44th Floor New York, NY 10153 | 9,614,197 | 7.03% | ||
Luxor Capital Partners, LP(4) 1114 Avenue of the Americas, 29th Floor New York, NY 10036 | 8,186,425 | 5.99% | ||
Abrams Capital Management, LP(5) 222 Berkeley Street, 21st Floor Boston, MA 02116 | 8,738,242 | 6.40% | ||
(1) | The information is based solely on a Schedule 13D/A regarding MTW filed with the SEC by Carl C. Icahn and his affiliated entities on January 16, 2015, as most recently amended on February 9, 2015. According to the filing, as of January 16, 2015: (i) High River Limited Partnership, a Delaware limited partnership, has sole voting power and sole dispositive power with respect to 2,116,531 shares of MTW common stock; (ii) Hopper Investments LLC, a Delaware limited liability company, has shared voting power and shared dispositive power with respect to 2,116,531 shares of MTW common stock; (iii) Barberry Corp., a Delaware corporation, has shared voting power and shared dispositive power with respect to 2,116,531 shares of MTW common stock; (iv) Icahn Partners Master Fund LP, a Delaware limited partnership, has sole voting power and sole dispositive power with respect to 3,438,929 shares of MTW common stock; (v) Icahn Offshore LP, a Delaware limited partnership, has shared voting power and shared dispositive power with respect to 3,438,629 shares of MTW common stock; (vi) Icahn Partners LP, a Delaware limited partnership, has sole voting power and sole dispositive power with respect to 5,027,500 shares of MTW common stock; (vii) Icahn Onshore LP, a Delaware limited partnership, has shared voting power and shared dispositive power with respect to 5,027,500 shares of MTW common stock; (viii) Icahn Capital LP, a Delaware limited partnership, has shared voting power and shared dispositive power with respect to 8,466,129 shares of MTW common stock; (ix) IPH GP LLC, a Delaware limited liability company, has shared voting power and shared dispositive power with respect to 8,466,129 shares of MTW common stock; (x) Icahn Enterprises Holdings L.P., a Delaware limited partnership, has shared voting power and shared dispositive power with respect to 8,466,129 shares of MTW common stock; (xi) Icahn Enterprises G.P. Inc., a Delaware corporation, has shared voting power and shared dispositive power with respect to 8,466,129 shares of MTW common stock; (xii) Beckton Corp., a Delaware corporation, has shared voting power and shared dispositive power with respect to 8,466,129 shares of MTW common stock; and (xiii) Carl C. Icahn has shared voting power and shared dispositive power with respect to 10,582,660 shares of MTW common stock. Mr. Icahn is in a position indirectly to determine the investment and voting decisions made by each of the affiliated entities. |
(2) | This information is based solely on a Schedule 13G regarding MTW filed with the SEC by The Vanguard Group, Inc. (“Vanguard”) on February 11, 2015. Vanguard reported that it may be deemed to have sole voting power as to 92,088 shares of MTW common stock, sole dispositive power with respect to 8,075,349 shares of MTW common stock and shared dispositive power with respect to 80,288 shares of MTW common stock as of December 31, 2014. |
(3) | This information is based solely on a Schedule 13G regarding MTW filed with the SEC by Glenview Capital Management, LLC (“Glenview”) and Lawrence M. Robbins on November 18, 2015. According to the filing, as of November 18, 2015, Glenview and Mr. Robbins have shared voting power and shared dispositive power with respect to 9,614,197 shares of MTW common stock. |
(4) | This information is based solely on a Schedule 13G regarding MTW filed with the SEC by Luxor Capital Partners, LP and certain affiliated parties on August 10, 2015. According to the filing, as of August 10, 2015, (i) Luxor Capital Partners, LP has shared voting power and shared dispositive power with respect to 3,033,474 shares of MTW common stock, (ii) Luxor Wavefront, LP has shared voting power and shared dispositive power with respect to 625,526 shares of MTW common stock, (iii) Luxor Capital Partners Offshore Master Fund, LP has shared voting power and shared dispositive power with respect to 3,016,251 shares of MTW common stock, (iv) Luxor Capital Partners Offshore, Ltd. has shared voting power and shared dispositive power with respect to 3,016,251 shares of MTW common stock, (v) Thebes Offshore Master Fund, LP has shared voting power and shared dispositive power with respect to 153,085 shares of MTW common stock, (vi) Thebes Partners Offshore, Ltd. has shared voting power and shared dispositive power with respect to 153,085 shares of MTW common stock, (vii) LCG Holdings, LLC has shared voting power and shared dispositive power with respect to 6,828,336 shares of MTW common stock, (viii) Luxor Capital Group, LP has shared voting power and shared dispositive power with respect to 6,828,336 shares of MTW common stock, (ix) Luxor |
-124-
Management, LLC has shared voting power and shared dispositive power with respect to 6,828,336 shares of MTW common stock and (x) Christian Leone has shared voting power and shared dispositive power with respect to 6,828, 336 shares of MTW common stock.
(5) | This information is based solely on a Schedule 13G/A regarding MTW filed with the SEC by Abrams Capital Management, L.P. and certain affiliated parties on January 22, 2016. According to the filing, as of January 12, 2016, (i) Abrams Capital Partners II, L.P. has shared voting power and shared dispositive power with respect to 7,042,376 shares of MTW common stock, (ii) Abrams Capital, LLC has shared voting power and shared dispositive power with respect to 8,270,011 shares of MTW common stock, (iii) Abrams Capital Management, LLC has shared voting power and shared dispositive power with respect to 8,738,242 shares of MTW common stock, (iv) Abrams Capital Management, L.P. has shared voting power and shared dispositive power with respect to 8,738,242 shares of MTW common stock and (v) David Abrams has shared voting power and shared dispositive power with respect to 8,738,242 shares of MTW common stock. |
-125-
Item 13. CERTAIN RELATIONSHIPS AND RELATED TRANSACTIONS, AND DIRECTOR INDEPENDENCE
Agreements with MTW
We entered into a Master Separation and Distribution Agreement with MTW. In connection with the Spin-Off, we also entered into various other agreements to effect the Spin-Off and provide a framework for our relationship with MTW after the separation, including a transition services agreement, a tax matters agreement, an employee matters agreement and an intellectual property matters agreement. These agreements provide for the allocation between us and MTW of MTW’s assets, employees, liabilities and obligations (including investments, property and employee benefits, and tax-related assets and liabilities) attributable to periods prior to, at and after our separation from MTW and will govern certain relationships between us and MTW after the Spin-Off.
Master Separation and Distribution Agreement
We entered into the Master Separation and Distribution Agreement with MTW, pursuant to which we and MTW have legally and structurally separated. The Master Separation and Distribution Agreement identifies the assets that were transferred, the liabilities that were assumed and the contracts that were assigned to each party as part of the separation. Except as expressly set forth in the Master Separation and Distribution Agreement, neither we nor MTW made any representation or warranty as to the assets, businesses or liabilities transferred or assumed in the Spin-Off, as to any consents required in connection with the transfers, as to the value of or the freedoms from any security interests of any of the assets transferred, as to the absence or presence of any defenses or rights of setoff or freedom from counterclaim with respect to any claim or other asset of either party, or as to the legal sufficiency of any assignment, document or instrument to convey title to any asset or thing of value to be transferred in connection with the Spin-Off. All assets were transferred on an “as-is, where-is” basis, and the respective transferees bear the economic and legal risks that any conveyance will prove to be insufficient to vest in the transferee good and marketable title, free and clear of all security interests.
Under the Master Separation and Distribution Agreement:
l | Generally, each party has assumed liability for all pending, threatened and unasserted legal matters related to its own business or its assumed or retained liabilities, and will indemnify the other party for any liability, to the extent arising out of or resulting from such assumed or retained legal matters. |
l | Each party (together with its affiliates) has released and discharged the other party (and the other party’s affiliates) from all liabilities existing or arising from acts occurring or failing to occur on or before the Distribution Date, including in connection with the implementation of the separation, except as set forth in the Master Separation and Distribution Agreement. The releases do not extend to obligations or liabilities under any agreements between the parties that remain in effect following the Spin-Off, including the Separation Agreements. |
l | We have agreed to indemnify, defend and hold harmless MTW, MTW’s affiliates and the directors, officers and employees of MTW and its affiliates from and against all liabilities relating to, arising out of or resulting from (i) our failure to pay, perform or otherwise promptly discharge any of our liabilities or, (ii) any breach by us of the Master Separation and Distribution Agreement or any of the other Separation Agreements. |
l | MTW has agreed to indemnify, defend and hold harmless us, our affiliates and our and our affiliates’ directors, officers and employees from and against all liabilities relating to, arising out of or resulting from (i) MTW’s failure to pay, perform or otherwise promptly discharge any of its liabilities, or (ii) any breach by MTW of the Master Separation and Distribution Agreement or any of the other Separation Agreements. |
l | We and MTW have allocated the rights and obligations under existing insurance policies with respect to occurrences prior to the Distribution and established procedures for the administration of insured claims. |
l | We and MTW have agreed to use commercially reasonable efforts to take all actions as the other party may reasonably request, consistent with the Separation Agreements, to effect the provisions and purposes of the Separation Agreements and the transactions contemplated therein. |
l | We and MTW have agreed to procedures for the resolution of disputes that arise under the Separation Agreements related to the Spin-Off. Except as provided in the other Separation Agreements, we and MTW have agreed to attempt to resolve any disputes through good-faith discussions between our executives and MTW’s executives. If these efforts are not successful, either we or MTW may submit the dispute to nonbinding mediation or, if the nonbinding mediation is not successful, to binding alternative dispute resolution, subject to the provisions of the Master Separation and Distribution Agreement. |
l | We and MTW have agreed that, under the Master Separation and Distribution Agreement, we, our affiliates and MTW and its affiliates will not be liable for any punitive, indirect, incidental, consequential or special damages. |
l | We and MTW have allocated responsibility for the costs, fees and expenses incurred in connection with the Spin-Off. We are responsible for any costs, fees and expenses incurred in connection with the financing transactions we undertook in connection with the Spin-Off and any other costs, fees and expenses specifically incurred by us prior to the Distribution, while MTW is responsible for all other costs, fees and expenses prior to the Distribution. Following the Distribution, each party is responsible for paying its own costs, fees and expenses. |
-126-
l | We and MTW have agreed to certain other matters, including access to financial and other information, confidentiality and access to and provision of records |
Transition Services Agreement
We entered into the Transition Services Agreement with MTW, pursuant to which we and MTW will, on an interim, transitional basis, provide each other with various services. MTW has agreed to provide us with certain services related to supply chain management, information technology, sales, administrative support for certain employees, access to certain shared facilities and shared office space, finance, treasury, accounting, tax, legal, audit and payroll. We have agreed to provide MTW with certain services related to information technology and finance. Under the Transition Services Agreement, we and MTW may also provide each other with certain other mutually agreed-upon services. In each case, the company providing the services will perform the services in a manner and on a basis that is substantially similar to that during the twelve-month period immediately prior to the date of the Transition Services Agreement.
The Transition Services Agreement specifies the term during which we and MTW will provide the services described above, which terms generally begin on the Distribution Date and expire no later than December 31, 2016 (and in some cases earlier). The Transition Services Agreement also specifies when and how a company receiving services may terminate different categories of service, the cost of the services to the party receiving the services, and certain additional obligations that we and MTW have to assist in transitioning services to each other’s control.
Under the Transition Services Agreement, each party’s liability is generally limited to the aggregate amount of fees actually received for services provided under the agreement. The Transition Services Agreement also provides that we, our affiliates and MTW and its affiliates will not be liable for any punitive, indirect, incidental, consequential or special damages.
Tax Matters Agreement
We entered into the Tax Matters Agreement with MTW that governs each party’s respective rights, responsibilities and obligations with respect to the allocation of tax liabilities, the preparation and filing of tax returns, tax payments, the parties’ entitlements to tax refunds, the parties’ maintenance of the tax-free status of the Spin-Off, the control of audits and other tax proceedings, assistance and cooperation with respect to tax matters, the maintenance of tax-related records and other tax-related activities.
In addition, the Tax Matters Agreement imposes certain restrictions on us and our subsidiaries (including restrictions on business combinations, sales of assets, liquidations, stock issuances or repurchases and modifications of the voting rights of our stock, among others). The Tax Matters Agreement provides special rules allocating tax liabilities in the event the Spin-Off, together with certain related transactions, is not treated as tax-free. In general, under the Tax Matters Agreement, we and MTW will each be responsible for taxes that arise from the failure of the Spin-Off to qualify as a transaction that is generally tax-free, for U.S. federal income tax purposes, under Sections 355, 368 and related provisions of the Code, to the extent that such failure to qualify is attributable to the actions, events or transactions related to each party’s respective stock, assets or business, or a breach of the relevant representations or covenants made by that party in the Tax Matters Agreement.
Employee Matters Agreement
We entered into the Employee Matters Agreement with MTW to allocate liabilities and responsibilities relating to employment matters, employee compensation and benefits plans and programs, and other related matters. The Employee Matters Agreement governs certain compensation and employee benefit obligations with respect to the current and former employees and non-employee directors of each party.
The Employee Matters Agreement provides that, unless otherwise specified, MTW will be responsible for liabilities associated with employees who are employed by MTW following the Spin-Off and former employees whose last employment was with MTW, and we will be responsible for liabilities associated with employees who are employed by us following the Spin-Off and former employees whose last employment was with us.
In addition, the Employee Matters Agreement addresses the treatment of MTW’s outstanding equity-based incentive awards held by employees who will be employed by MFS in connection with the Spin-Off.
Intellectual Property Matters Agreement
We entered into the Intellectual Property Matters Agreement with MTW that confirms the ownership of our and MTW’s respective intellectual property assets, provides for licensing of certain intellectual property assets and includes consents to use certain intellectual property assets (subject to certain limitations regarding field of use or certain change-of-control events in which we or MTW are acquired by a competitor), steps to avoid any confusion in the marketplace with respect to the use of various trademarks and other arrangements of cooperation between MTW and us in implementing the terms of the Intellectual Property Matters Agreement.
Settlement Agreement
On March 28, 2016, we entered into a Joinder Agreement to the Settlement Agreement entered into by MTW with Carl C. Icahn, Icahn Partners Master Fund LP, Icahn Offshore LP, Icahn Partners LP, Icahn Onshore LP, Beckton Corp., Hopper Investments LLC, Barberry Corp., High River Limited Partnership, Icahn Capital LP, IPH GP LLC, Icahn Enterprises Holdings L.P. and Icahn Enterprises G.P. Inc. (collectively, the “Icahn Shareholders”). The Icahn Shareholders have disclosed beneficial ownership exceeding 5% of MTW’s common stock.
-127-
The Settlement Agreement provided the Icahn Shareholders with the option to cause MTW to appoint one designee of the Icahn Shareholders to our Board, subject to the approval of MTW’s Board of Directors, in connection with the Spin-Off. The Icahn Shareholders designated Mr. Langham, who was appointed to our Board. Mr. Langham will be entitled to serve until our first annual meeting of stockholders. That annual meeting must be held no earlier than December 4, 2017 and no later than May 15, 2017. Mr. Langham must promptly resign from our Board if the Icahn Shareholders cease to own a net long position in our voting securities of at least 5% of our voting shares.
The Settlement Agreement also requires that we satisfy certain corporate governance requirements for the duration of a standstill period, which runs until the later of (1) the earlier of (A) the day that is 15 days prior to the advance notice deadline set forth in our Bylaws with respect to our first annual meeting of stockholders and (B) December 4, 2017, and (2) 25 days after the date that no Icahn designee serves on our Board.
In addition to and separate from the Icahn Shareholders’ right under the Settlement Agreement to designate Mr. Langham to serve on our Board, another member of our Board, Mr. Thomas D. Davis, serves as Chairman, President and Chief Executive Officer of Viskase Companies, Inc., which is majority owned by Icahn Enterprises, L.P., one of the Icahn Shareholders.
Procedures for Approval of Related Party Transactions
Our Board of Directors will review and approve or ratify the material terms of any transaction involving MFS in which a director, a nominee for director, an executive officer, an immediate family member of one of these individuals or a principal stockholder (each of whom is known as a “related party”) has a direct or indirect material interest. Our Board will review to determine whether the terms of the transaction are any less favorable than those generally available from unaffiliated third parties and the extent of the related party’s interest in the transaction.
Director Independence
Currently the Board is comprised of seven directors. Under MFS’ Bylaws, the number of directors may not be more than twelve. The Board of Directors has determined that the following non-employee directors - Dino J. Bianco, Joan K. Chow, Thomas D. Davis, Cynthia M. Egnotovich, Timothy J. Fenton and Andrew Langham do not have any material relationship with MFS, other than serving as directors, and that each is independent as defined in MFS’ Corporate Governance Guidelines (which may be viewed on the Company’s website at www.manitowocfoodservice.com), under applicable law, and the New York Stock Exchange listing standards. In determining whether a director has a material relationship with MFS, the Board has adopted nine criteria. Those criteria may be viewed on MFS’ website at www.manitowocfoodservice.com. Any director who meets all of the nine criteria will be presumed by the Board to have no material relationship with MFS.
-128-
Item 14. PRINCIPAL ACCOUNTING FEES AND SERVICES
Our Audit Committee, in accordance with authority granted in its charter by the Board of Directors, have appointed PricewaterhouseCoopers LLP (“PWC”) as MFS' independent registered public accounting firm for the fiscal year ending December 31, 2016. PwC has served as MTW's independent auditor for over 20 years. The Board of Directors and the Audit Committee believe that the approval of PwC to serve as independent auditor is in the best interests of Manitowoc Foodservice, Inc. and its shareholders. In making this determination, the Board of Directors and the Audit Committee considered a number of factors, including:
• | Audit Committee members’ assessment of PwC’s performance |
• | Management’s assessment of PwC’s performance |
• | PwC’s independence and integrity |
• | PwC’s fees and the quality of services provided to the Company |
• | PwC’s global capabilities and knowledge of our global operations |
A representative of PwC will be present at the 2017 Annual Meeting and will have an opportunity to make a statement, if desired, as well as to respond to appropriate questions.
Information on independent auditor fees for the last two fiscal years is set forth in the following table:
Fees Paid to PricewaterhouseCoopers LLP(1)
(in thousands)
FY 14 (1) | FY 15 (1) | ||
Audit Fees | N/A | N/A | |
Audit-Related Fees | N/A | N/A | |
Tax Fees | |||
Tax Compliance/preparation | N/A | N/A | |
All Other Fees | N/A | N/A | |
Total Fees | N/A | N/A | |
(1) | Due to the Spin-Off on March 4, 2016, there are no fees reflected for MFS for fiscal years of 2015 and 2014. However, the audit fees associated with the consolidated MTW audit are included in the allocated corporate expenses within MFS' historical financial statements. |
Audit fees include fees for services performed to comply with the standards of the Public Company Accounting Oversight Board (United States), including the recurring audit of the MFS' consolidated financial statements. This category also includes fees for audits provided in connection with statutory filings or services that generally only the principal auditor reasonably can provide to a client, such as procedures related to consents and assistance with a review of documents filed with the SEC.
Audit related fees include fees associated with assurance and related services that are reasonably related to the performance of the audit or review of MFS’ financial statements.
Tax fees primarily include fees associated with tax compliance, tax consulting, as well as domestic and international tax planning.
MFS’ policy and procedures for preapproval of nonaudit services to be performed by MFS’ independent registered public accounting firm are set forth in Section III of the Audit Committee Charter. A copy of the Audit Committee Charter may be viewed on MFS’ website at http://www.manitowocfoodservice.com. All services performed by PricewaterhouseCoopers LLP that are encompassed in the audit related fees, tax fees, and all other fees were approved by the Audit Committee in advance in accordance with the preapproval policy and process set forth in the Audit Committee Charter.
-129-
Item 15. EXHIBITS AND FINANCIAL STATEMENT SCHEDULES
(a) Documents filed as part of this Report.
(1) | Financial Statements: | ||
The following Combined Financial Statements are filed as part of this report under Item 8, “Financial Statements and Supplementary Data.” | |||
Report of Independent Registered Public Accounting Firm | |||
Combined Statements of Operations | |||
Combined Statements of Comprehensive Income (Loss) | |||
Combined Balance Sheets | |||
Combined Statements of Cash Flows | |||
Combined Statements of Equity | |||
Notes to Combined Financial Statements | |||
(2) | Financial Statement Schedule: | ||
Schedule II - Valuation and Qualifying Accounts | |||
Schedule | Description | Filed Herewith | ||
II | Valuation and Qualifying Accounts | X | ||
All other financial statement schedules not listed have been omitted since the required information is included in the Combined Financial Statements or the Notes thereto, or is not applicable or required under rules of Regulation S-X.
(b) Exhibits:
See Index to Exhibits immediately following the signature page of this report, which is incorporated herein by reference.
-130-
MANITOWOC FOODSERVICE, INC
AND SUBSIDIARIES
Schedule II: Valuation and Qualifying Accounts
For The Years Ended December 31, 2015, 2014 and 2013
(dollars in millions)
(in millions) | Balance at Beginning of Year | Charge to Costs and Expenses | Utilization of Reserve | Other, Primarily Impact of Foreign Exchange Rates | Balance at end of Year | |||||||||||||||
Year End December 31, 2013 | ||||||||||||||||||||
Allowance for doubtful accounts | $ | 3.3 | $ | 1.7 | $ | (1.9 | ) | $ | — | $ | 3.1 | |||||||||
Deferred tax valuation allowance | 85.9 | (5.4 | ) | (0.2 | ) | (0.1 | ) | 80.2 | ||||||||||||
Year End December 31, 2014 | ||||||||||||||||||||
Allowance for doubtful accounts | 3.1 | 4.2 | (3.2 | ) | (0.2 | ) | 3.9 | |||||||||||||
Deferred tax valuation allowance | 80.2 | $ | 36.3 | $ | (0.4 | ) | $ | (3.0 | ) | 113.1 | ||||||||||
Year End December 31, 2015 | ||||||||||||||||||||
Allowance for doubtful accounts | 3.9 | 2.5 | (2.2 | ) | (0.2 | ) | 4.0 | |||||||||||||
Deferred tax valuation allowance | 113.1 | (0.5 | ) | (28.2 | ) | (4.3 | ) | 80.1 | ||||||||||||
-131-
SIGNATURES
Pursuant to the requirements of Section 13 or 15(d) of the Securities Exchange Act of 1934, the registrant has duly caused this Report to be signed on its behalf by the undersigned, thereunto duly authorized:
Date: March 30, 2016
Manitowoc Foodservice, Inc. | |
/s/ Hubertus M. Muehlhaeuser | |
Hubertus M. Muehlhaeuser | |
President and Chief Executive Officer | |
/s/ John O. Stewart | |
John O. Stewart | |
Senior Vice President and Chief Financial Officer | |
Pursuant to the requirements of the Securities Exchange Act of 1934, this Report has been signed below by the following persons on behalf of the registrant and in the capacities and on the dates indicated:
/s/ Hubertus M. Muehlhaeuser | ||
Hubertus M. Muehlhaeuser , President and Chief Executive Officer | March 30, 2016 | |
/s/ John O. Stewart | ||
John O. Stewart, Senior Vice President and Chief Financial Officer | March 30, 2016 | |
/s/ Dino J. Bianco | ||
Dino J. Bianco, Director | March 30, 2016 | |
/s/ Andrew Langham | ||
Andrew Langham, Director | March 30, 2016 | |
/s/ Joan K. Chow | ||
Joan K. Chow, Director | March 30, 2016 | |
/s/ Thomas D. Davis | ||
Thomas D. Davis, Director | March 30, 2016 | |
/s/ Timothy J. Fenton | ||
Timothy J. Fenton, Director | March 30, 2016 | |
/s/ Cynthia M. Egnotovich | ||
Cynthia M. Egnotovich, Director and Chairperson of the Board | March 30, 2016 | |
-132-
MANITOWOC FOODSERVICE, INC.
ANNUAL REPORT ON FORM 10-K
FOR THE YEAR ENDED DECEMBER 31, 2015
INDEX TO EXHIBITS
Exhibit No. | Description | Filed/Furnished Herewith | ||
2.1 | Master Separation and Distribution Agreement, dated March 4, 2016, between The Manitowoc Company, Inc. and Manitowoc Foodservice, Inc. (filed as Exhibit 2.1 to the Company’s Current Report on Form 8-K filed on March 9, 2016 and incorporated herein by reference) (File No. 001-37548). | |||
3.1 | Amended and Restated Certificate of Incorporation of Manitowoc Foodservice, Inc. (filed as Exhibit 3.1 to Amendment No. 3 to the Company’s Registration Statement on Form 10, filed on December 21, 2015 and incorporated herein by reference) (File No. 001-37548). | |||
3.2 | Bylaws of Manitowoc Foodservice, Inc., effective as of October 23, 2015 (filed as Exhibit 3.2 to Amendment No. 3 to the Company’s Registration Statement on Form 10, filed on December 21, 2015 and incorporated herein by reference) (File No. 001-37548). | |||
4.1(a) | Indenture (including Form of Note), dated February 18, 2016, between MTW Foodservice Escrow Corp. and Wells Fargo Bank, National Association, as trustee (filed as Exhibit 4.1 to the Company’s Current Report on Form 8-K filed on February 24, 2016 and incorporated herein by reference) (File No. 001-37548). | |||
4.1(b) | First Supplemental Indenture, dated March 3, 2016, by and among MTW Foodservice Escrow Corp., Manitowoc Foodservice, Inc., the guarantors party thereto and Wells Fargo Bank, National Association, as trustee (filed as Exhibit 4.1 to the Company’s Current Report on Form 8-K filed on March 9, 2016 and incorporated herein by reference) (File No. 001-37548). | |||
4.2(a) | Exchange and Registration Rights Agreement, dated February 18, 2016, between MTW Foodservice Escrow Corp. and Goldman, Sachs & Co., as representative of the initial purchasers (filed as Exhibit 4.3 to the Company’s Current Report on Form 8-K filed on February 24, 2016 and incorporated herein by reference) (File No. 001-37548). | |||
4.2(b) | Joinder Agreement to Exchange and Registration Rights Agreement, dated March 3, 2016, by Manitowoc Foodservice, Inc. and the guarantors party thereto (filed as Exhibit 10.5 to the Company’s Current Report on Form 8-K filed on March 9, 2016 and incorporated herein by reference) (File No. 001-37548). | |||
10.1(a) | Settlement Agreement, dated February 6, 2015, among The Manitowoc Company, Inc., Carl C. Icahn, Icahn Partners Master Fund LP, Icahn Offshore LP, Icahn Partners LP, Icahn Onshore LP, Beckton Corp., Hopper Investments LLC, Barberry Corp., High River Limited Partnership, Icahn Capital LP, IPH GP LLC, Icahn Enterprises Holdings L.P. and Icahn Enterprises G.P. Inc. (filed as Exhibit 10.5 to the Company’s Registration Statement on Form 10, filed on September 1, 2015 and incorporated herein by reference) (File No. 001-37548). | |||
10.1(b) | Amendment, dated December 31, 2015, among The Manitowoc Company, Inc., Carl C. Icahn, Icahn Partners Master Fund LP, Icahn Offshore LP, Icahn Partners LP, Icahn Onshore LP, Beckton Corp., Hopper Investments LLC, Barberry Corp., High River Limited Partnership, Icahn Capital LP, IPH GP LLC, Icahn Enterprises Holdings L.P. and Icahn Enterprises G.P. Inc. (filed as Exhibit 10.8 to Amendment No. 4 to the Company’s Registration Statement on Form 10, filed on January 19, 2016 and incorporated herein by reference) (File No. 001-37548). | |||
10.1(c) | Joinder Agreement to Settlement Agreement, dated March 28, 2016 among The Manitowoc Company, Inc., Manitowoc Foodservice, Inc., Carl C. Icahn, Icahn Partners Master Fund LP, Icahn Offshore LP, Icahn Partners LP, Icahn Onshore LP, Beckton Corp., Hopper Investments LLC, Barberry Corp., High River Limited Partnership, Icahn Capital LP, IPH GP LLC, Icahn Enterprises Holdings L.P. and Icahn Enterprises G.P. Inc. | X(1) | ||
10.2** | Employment Agreement, dated July 28, 2015, by and between Hubertus M. Muehlhaeuser and The Manitowoc Company, Inc. (filed as Exhibit 10.6 to Amendment No. 2 to the Company’s Registration Statement on Form 10, filed on November 9, 2015 and incorporated herein by reference) (File No. 001-37548). | |||
10.3 | Tax Matters Agreement, dated March 4, 2016, between The Manitowoc Company, Inc. and Manitowoc Foodservice, Inc. (filed as Exhibit 10.2 to the Company’s Current Report on Form 8-K filed on March 9, 2016 and incorporated herein by reference) (File No. 001-37548). | |||
10.4 | Transition Services Agreement, dated March 4, 2016, between the The Manitowoc Company, Inc. and Manitowoc Foodservice, Inc. (filed as Exhibit 10.1 to the Company’s Current Report on Form 8-K filed on March 9, 2016 and incorporated herein by reference) (File No. 001-37548). | |||
-133-
10.5(a) | Employee Matters Agreement, dated March 4, 2016, between The Manitowoc Company, Inc. and Manitowoc Foodservice, Inc. (filed as Exhibit 10.3 to the Company’s Current Report on Form 8-K filed on March 9, 2016 and incorporated herein by reference) (File No. 001-37548). | |||
10.5(b) | Amendment, dated March 28, 2016, to the Employee Matters Agreement, effective as of March 4, 2016, by and between The Manitowoc Company, Inc. and Manitowoc Foodservice, Inc. (filed as Exhibit 10.1 to the Company’s Current Report on Form 8-K filed on March 29, 2016 and incorporated herein by reference) (File No. 001-37548). | |||
10.6 | Intellectual Property Matters Agreement, dated March 4, 2016, between The Manitowoc Company, Inc. and Manitowoc Foodservice, Inc. (filed as Exhibit 10.4 to the Company’s Current Report on Form 8-K filed on March 9, 2016 and incorporated herein by reference) (File No. 001-37548). | |||
10.7** | Manitowoc Foodservice, Inc. 2016 Omnibus Incentive Plan (filed as Exhibit 10.7 to Amendment No. 3 to the Company’s Registration Statement on Form 10, filed on December 21, 2015 and incorporated herein by reference) (File No. 001-37548). | |||
10.8 | Credit Agreement, dated March 3, 2016, among Manitowoc Foodservice, Inc., the subsidiary borrowers party thereto, the lenders party thereto, JPMorgan Chase Bank, N.A., as administrative agent, Goldman Sachs Bank USA, as syndication agent, HSBC Bank USA, N.A., Citibank, N.A. and Coöperatieve Rabobank U.A., New York Branch, as co-documentation agents and J.P. Morgan Securities LLC, Goldman Sachs Bank USA, HSBC Securities (USA) Inc. and Citigroup Global Markets Inc., as joint lead arrangers and joint bookrunners (filed as Exhibit 10.6 to the Company’s Current Report on Form 8-K filed on March 9, 2016 and incorporated herein by reference) (File No. 001-37548). | |||
10.9 | Sixth Amended and Restated Receivables Purchase Agreement, dated March 3, 2016, by and among Manitowoc Cayman Islands Funding LTD., as seller, Manitowoc Foodservice and certain of its subsidiaries, as servicers, and Wells Fargo Bank, N.A., as purchaser and as agent (filed as Exhibit 10.7 to the Company’s Current Report on Form 8-K filed on March 9, 2016 and incorporated herein by reference) (File No. 001-37548). | |||
10.10** | Manitowoc Foodservice, Inc. Deferred Compensation Plan, as amended and restated through March 4, 2016 (filed as Exhibit 10.8 to the Company’s Current Report on Form 8-K filed on March 9, 2016 and incorporated herein by reference) (File No. 001-37548). | |||
10.11** | Manitowoc Foodservice, Inc. Supplemental Executive Retirement Plan, as amended and restated through March 4, 2016 (filed as Exhibit 10.9 to the Company’s Current Report on Form 8-K filed on March 9, 2016 and incorporated herein by reference) (File No. 001-37548). | |||
10.12** | Manitowoc Foodservice, Inc. Severance Pay Plan, effective as of March 4, 2016 (filed as Exhibit 10.10 to the Company’s Current Report on Form 8-K filed on March 9, 2016 and incorporated herein by reference) (File No. 001-37548). | |||
10.13** | Employment Agreement, dated November 9, 2015, by and between John O. Stewart and The Manitowoc Company, Inc. | X(1) | ||
10.14** | Assignment and Assumption Agreement, dated March 4, 2016, by and between The Manitowoc Company, Inc. and Manitowoc Foodservice, Inc. | X(1) | ||
10.15** | Form of Contingent Employment Agreement between the Company and the following executive officers of the Company: Hubertus M. Muehlhaeuser, John O. Stewart, Josef Matosevic, Maurice D. Jones and Richard N. Caron (filed as Exhibit 10.1 to the Company’s Current Report on Form 8-K filed on March 14, 2016 and incorporated herein by reference) (File No. 001-37548). | |||
10.16** | Form of Performance Share Award Agreement under the Manitowoc Foodservice, Inc. 2016 Omnibus Incentive Plan. | X(1) | ||
10.17** | Form of Restricted Stock Award Agreement for Directors under the Manitowoc Foodservice, Inc. 2016 Omnibus Incentive Plan. | X(1) | ||
10.18** | Form of Restricted Stock Award Agreement for Employees under the Manitowoc Foodservice, Inc. 2016 Omnibus Incentive Plan. | X(1) | ||
10.19** | Form of Restricted Stock Unit Award Agreement for Directors under the Manitowoc Foodservice, Inc. 2016 Omnibus Incentive Plan. | X(1) | ||
10.20** | Form of Restricted Stock Unit Award Agreement for Employees under the Manitowoc Foodservice, Inc. 2016 Omnibus Incentive Plan. | X(1) | ||
10.21** | Form of Non-Qualified Stock Option Award Agreement under the Manitowoc Foodservice, Inc. 2016 Omnibus Incentive Plan. | X(1) | ||
10.22** | Form of Incentive Stock Option Award Agreement under the Manitowoc Foodservice, Inc. 2016 Omnibus Incentive Plan. | X(1) | ||
10.23** | Employment Agreement, dated February 1, 2016, by and between Andreas G. Weishaar and Manitowoc Foodservice, Inc. | X(1) | ||
12.1 | Statement of Computation of Ratio of Earnings to Fixed Charges | X(1) | ||
-134-
21 | List of subsidiaries of Manitowoc Foodservice, Inc. | X(1) | ||
23.1 | Consent of PricewaterhouseCoopers LLP, the Company’s Independent Registered Public Accounting Firm | X(1) | ||
31.1 | Rule 13a - 14(a)/15d - 14(a) - Chief Executive Officer Certification | X(1) | ||
31.2 | Rule 13a - 14(a)/15d - 14(a) - Chief Financial Officer Certification | X(1) | ||
32.1 | Certification of CEO pursuant to 18 U.S.C. Section 1350 | X(2) | ||
32.2 | Certification of CFO pursuant to 18 U.S.C. Section 1350 | X(2) | ||
(1) Filed Herewith
(2) Furnished Herewith
** Management contracts and executive compensation plans and arrangements required to be filed as exhibits pursuant to item 15(b) of Form 10-K.
-135-