Attached files
| file | filename |
|---|---|
| EX-3.5 - ARTICLES OF AMENDMENT TO CERTIFICATE OF INCORPORATION - Freeze Tag, Inc. | frzt_ex35.htm |
| EX-31.2 - CERTIFICATION - Freeze Tag, Inc. | frzt_ex312.htm |
| EX-31.1 - CERTIFICATION - Freeze Tag, Inc. | frzt_ex311.htm |
| EX-32.2 - CERTIFICATION - Freeze Tag, Inc. | frzt_ex322.htm |
| EX-32.1 - CERTIFICATION - Freeze Tag, Inc. | frzt_ex321.htm |
UNITED STATES
SECURITIES AND EXCHANGE COMMISSION
Washington, D.C. 20549
Form 10-K
x ANNUAL REPORT UNDER SECTION 13 OR 15(d) OF THE SECURITIES EXCHANGE ACT OF 1934
For the fiscal year ended December 31, 2015
OR
¨ TRANSITION REPORT UNDER SECTION 13 OR 15(d) OF THE SECURITIES EXCHANGE ACT OF 1934
For the transition period from _______________ to _______________.
Commission file Number 000-54267
FREEZE TAG, Inc. |
(Exact name of registrant as specified in its charter) |
Delaware |
| 20-4532392 |
(State or other jurisdiction of incorporation or organization) |
| (I.R.S. Employer Identification No.) |
|
|
|
18062 Irvine Blvd., Suite 103 Tustin, California |
| 92780 |
(Address of principal executive offices) |
| (Zip Code) |
Registrant's telephone number, including area code (714) 210-3850
Securities registered pursuant to Section 12(b) of the Act:
Title of each class | Name of each exchange on which registered | |
None | None |
Securities registered pursuant to Section 12(g) of the Act:
Common Stock, par value $0.00001
(Title of class)
Indicate by check mark if the registrant is a well-known seasoned issuer, as defined in Rule 405 of the Securities Act. Yes ¨ No x
Indicate by check mark if the registrant is not required to file reports pursuant to Section 13 or 15(d) of the Act. Yes ¨ No x
Indicate by check mark whether the registrant (1) has filed all reports required to be filed by Section 13 or 15(d) of the Securities Exchange Act of 1934 during the preceding 12 months (or for such shorter period that the registrant was required to file such reports), and (2) has been subject to such filing requirements for the past 90 days. Yes x No ¨
Indicate by check mark whether the registrant has submitted electronically and posted on its corporate Website, if any, every Interactive Data File required to be submitted and posted pursuant to Rule 405 of Regulation S-T (§232.405 of this chapter) during the preceding 12 months (or for such shorter period that the registrant was required to and post such files). Yes x No ¨
Indicate by check mark if disclosure of delinquent filers pursuant to Item 405 of Regulation S K is not contained herein, and will not be contained, to the best of registrant's knowledge, in definitive proxy or information statements incorporated by reference in Part III of this Form 10 K or any amendment to this Form 10 K. ¨
Indicate by check mark whether the registrant is a large accelerated filer, an accelerated filer, a non-accelerated filer, or a smaller reporting company. See definitions of "large accelerated filer," "accelerated filer" and "smaller reporting company" in Rule 12b-2 of the Exchange Act. (Check one):
Large accelerated filer | ¨ | Accelerated filer | ¨ |
Non-accelerated filer | ¨ | Smaller reporting company | x |
Indicate by check mark whether the registrant is a shell company (as defined in Rule 12b-2 of the Act). Yes ¨ No x
Aggregate market value of the voting stock held by non-affiliates as of June 30, 2015: $347,437 as based on the closing price of $0.0027 on June 30, 2015 of our common stock. The voting stock held by non-affiliates on that date consisted of 128,680,269 shares of common stock.
Applicable Only to Registrants Involved in Bankruptcy Proceedings During the Preceding Five Years:
Indicate by check mark whether the registrant has filed all documents and reports required to be filed by Sections 12, 13 or 15(d) of the Exchange Act of 1934 subsequent to the distribution of securities under a plan confirmed by a court. Yes ¨ No ¨
Indicate the number of shares outstanding of each of the registrant's classes of common stock, as of the latest practicable date. As of March 22, 2016, there were 292,357,620 shares of common stock, par value $0.00001, issued and outstanding.
Documents Incorporated by Reference
List hereunder the following documents if incorporated by reference and the Part of the Form 10-K (e.g., Part I, Part II, etc.) into which the document is incorporated: (1) Any annual report to security holders; (2) Any proxy or information statement; and (3) Any prospectus filed pursuant to rule 424(b) or (c) of the Securities Act of 1933. The listed documents should be clearly described for identification purposes (e.g., annual report to security holders for fiscal year ended December 24, 1980). None.
Freeze Tag, Inc.
TABLE OF CONTENTS
PART I | |||||
|
|
|
| ||
ITEM 1 – | BUSINESS |
|
| 3 |
|
ITEM 1A – | RISK FACTORS. |
|
| 16 |
|
ITEM 1B – | UNRESOLVED STAFF COMMENTS |
|
| 27 |
|
ITEM 2 – | PROPERTIES |
|
| 27 |
|
ITEM 3 – | LEGAL PROCEEDINGS |
|
| 27 |
|
ITEM 4 – | MINE SAFETY DISCLOSURES |
|
| 27 |
|
|
|
|
|
| |
PART II | |||||
|
|
|
|
| |
ITEM 5 – | MARKET FOR REGISTRANT'S COMMON EQUITY, RELATED STOCKHOLDER MATTERS AND ISSUER PURCHASES OF EQUITY SECURITIES |
|
| 28 |
|
ITEM 6 – | SELECTED FINANCIAL DATA |
|
| 30 |
|
ITEM 7 – | MANAGEMENT'S DISCUSSION AND ANALYSIS OF FINANCIAL CONDITION AND RESULTS OF OPERATION |
|
| 30 |
|
ITEM 7A – | QUANTITATIVE AND QUALITATIVE DISCLOSURES ABOUT MARKET RISK |
|
| 39 |
|
ITEM 8 – | FINANCIAL STATEMENTS AND SUPPLEMENTARY DATA |
|
| 40 |
|
ITEM 9 – | CHANGES IN AND DISAGREEMENTS WITH ACCOUNTANTS ON ACCOUNTING AND FINANCIAL DISCLOSURE |
|
| 41 |
|
ITEM 9A – | CONTROLS AND PROCEDURES |
|
| 41 |
|
ITEM 9B – | OTHER INFORMATION |
|
| 42 |
|
|
|
|
|
| |
PART III | |||||
|
|
|
|
| |
ITEM 10 – | DIRECTORS, EXECUTIVE OFFICERS AND CORPORATE GOVERNANCE |
|
| 43 |
|
ITEM 11 – | EXECUTIVE COMPENSATION |
|
| 44 |
|
ITEM 12 – | SECURITY OWNERSHIP OF CERTAIN BENEFICIAL OWNERS AND MANAGEMENT AND RELATED STOCKHOLDER MATTERS |
|
| 46 |
|
ITEM 13 – | CERTAIN RELATIONSHIPS AND RELATED TRANSACTIONS, AND DIRECTOR INDEPENDENCE |
|
| 47 |
|
ITEM 14 – | PRINCIPAL ACCOUNTING FEES AND SERVICES |
|
| 49 |
|
|
|
|
|
| |
PART IV | |||||
|
|
|
|
| |
ITEM 15 – | EXHIBITS, FINANCIAL STATEMENT SCHEDULES |
|
| 50 |
|
| 2 |
PART I
Explanatory Note
This Annual Report includes forward looking statements within the meaning of the Securities Exchange Act of 1934 (the "Exchange Act"). These statements are based on management's beliefs and assumptions, and on information currently available to management. Forward looking statements include the information concerning possible or assumed future results of operations of the Company set forth under the heading "Management's Discussion and Analysis of Financial Condition or Plan of Operation." Forward looking statements also include statements in which words such as "expect," "anticipate," "intend," "plan," "believe," "estimate," "consider" or similar expressions are used.
Forward looking statements are not guarantees of future performance. They involve risks, uncertainties and assumptions. The Company's future results and shareholder values may differ materially from those expressed in these forward looking statements. Readers are cautioned not to put undue reliance on any forward looking statements.
ITEM 1 – BUSINESS
Corporate History
We were incorporated as Freeze Tag, Inc. in February 2006 in the State of Delaware. In March 2006, Freeze Tag, LLC, our predecessor which was formed in October 2005, was merged with and into Freeze Tag, Inc.
Business Overview
Freeze Tag, Inc. is a creator of mobile social games that are fun and engaging for all ages. Based on a free-to-play business model that has propelled games built and marketed by some of our competitors to worldwide success, we employ state-of-the-art data analytics and proprietary technology to dynamically optimize the gaming experience for revenue generation. Players can download and enjoy our games for free, or they can purchase virtual items and additional features within the game to increase the fun factor. Our games encourage players to compete and engage with their friends on major social networks such as Facebook and Twitter. Founded by gaming industry veterans, Freeze Tag has launched several successful mobile games including the number one hit series Victorian MysteriesÒ and Unsolved Mystery ClubÒ, as well as digital entertainment like Etch A SketchÒ. Freeze Tag games have been downloaded millions of times on the Apple, Amazon and Google app stores.
Our mission is to design, develop and deliver innovative digital entertainment that surprises and delights. Our products bring families together by providing fun to kids of all ages. We also strive to create a workplace environment where creativity and fun can thrive in a demanding industry.
Business Strategy
In recent years, we have shifted our business strategy to focus our efforts on creating free-to-play social games for the mobile market. We've made this change because we believe that games that are social and mobile will provide the greatest revenue opportunities now and in the foreseeable future. This change in direction has not been an easy one as we've had to deploy resources differently, learn new techniques, and experiment with new game designs and marketing processes. Our financial statements reflect the investment in this new direction in expenses and losses, but we have yet to realize the fruits of our labors on the revenue side of the equation. However, we do believe this strategy will reap the highest returns for the company and its shareholders going forward.
| 3 |
We have also announced our intention to grow the Company through acquisition. We feel that the time is right to build an alliance of mobile game developers who can become stronger and more successful by working together to build a company that can leverage market intelligence, development expertise and cross-promotional opportunities to achieve great results for our customers and shareholders. As noted in detail below, we currently do not have any business opportunities or ventures under contemplation for acquisition or merger. In the event we do enter into any such transactions, such transactions will likely be accomplished with shares of our stock and/or in connection with a strategic financial investor, and not with cash directly from us unless and until our cash position improves.
Free-to-play Business Model
The free-to-play business model for games was pioneered on the PC platform and has exploded globally on the mobile platform. The free-to-play model allows users to download and play an enjoyable, but limited, portion of a game for free. If the user wants to access premium features or special virtual items to increase the fun factor, then the user is required to pay, usually $0.99 per feature or item or $0.99 for a bundle of virtual items. For example, if a player has run out of "lives" or "moves" in a game, the player is given two options: 1) Wait for the lives to re-charge which involves waiting but no expense of money or virtual currency; 2) Spend money or virtual currency to buy additional "lives" and keep playing immediately.
In a just a few years, the free-to-play business model has proven to be a very successful model for mobile games. The revenue potential of a game largely depends on the fun-factor of the game and the game creator's proprietary techniques for encouraging the player to make a purchase decision – without overly offending the player. The potential for rapidly spreading the game through social networks and small in-game purchases can add up to a very sizeable business opportunity. One of the top grossing games since it was launched in 2012, owned and marketed by King Digital, one of our competitors, is called Candy Crush Saga, a seemingly simple game where a user combines 3 or more color candies on a puzzle board to get points. Think Gaming, a service that analyzes and consults to mobile "freemium" game makers, publishers and investors, estimates that Candy Crush Saga grossed over $425,000 per day in 2015, or over $150 million per year, with a lifetime user revenue of merely $3.00 from in-game purchases.

Candy Crush Saga Estimated Revenue
(Source: ThinkGaming.com)
While the success of Candy Crush Saga illustrates the potential market of so called "free-to-play" games, we have no relationship with King Digital or any of its games, and cannot expect and cannot predict that any of our launched games or games in development can have anywhere close to the success of games of our competitors. We have historically been unable to break even, much less ever enjoyed success of a game that generates multi-millions of dollars in revenues. Nevertheless, our business model is to attempt to develop and launch successful games. However, there is no expectation or assurance that we ever can do so.
| 4 |
In the future, we plan on the majority of Freeze Tag's mobile games to be based on the free-to-play model. In addition, we believe that games are more fun with friends, so we connect our players with major social networks such as Facebook and Twitter to enhance the games' addictiveness, enjoyment and world-of-mouth referrals. In executing our business model, we have previously employed a proprietary game engine and real-time data analytics to dynamically optimize the gaming experience for revenue generation. In the future, we plan to continue to employ our game engine, but in an effort to more quickly develop games by using outside studios and outside talent, we have made a shift to developing games using the Unity Development platform. Unity (www.unity3d.com) has become the development platform of choice for many game studios, and allows us to quickly access additional talent in game development. We will also utilize other technologies in their native development environment (such as HTML5) as circumstances dictate. This shift will allow us to find the best development teams, engineering teams, and partners to help us quickly deploy our games.
Explosive Growth for Mobile Games
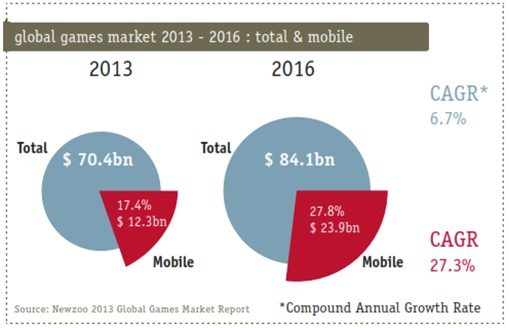
According to a 2013 report from Newzoo (a global market research firm with a primary focus on games), in 2013 the mobile games market generated $12.3 billion, or 17.4% of all global game revenues. By 2016, mobile games are forecast to account for 27.8% of global game revenues, or $23.9 billion, translating into a compound annual growth rate (CAGR) of 27.3%. This is almost four times higher than the game industry as a whole (6.7%), which includes traditional blockbuster titles such as Grand Theft Auto, Call of Duty and Super Mario.
According to Newzoo, there are 5 key reasons why the mobile game segment has and will continue to experience impressive growth.
Two Screens – As it turns out, consumers view smartphones and tablets as having their own right of existence. They play games on both devices, which increases their play time and fuels the mobile games segment simultaneously on more than one screen.
Accessibility – Gaming on mobile screens is pushing time spent on games up dramatically as consumers can play at anytime and anywhere.
Global reach – As smartphones and tablets penetrate every corner of the world, developers can launch titles into any country they choose. Countries that were previously hard to penetrate are now appearing on the opportunity radar.
Free-to-play – It is the dominant business model for mobile taking over 90% of global revenues.
Hardware innovation – Driven by fierce competition, the pace of innovation on smartphones and tablets goes unmatched. This continuously provides developers with new opportunities as consumer's interest in purchasing new devices fuels their consumption of new applications, and gaming is the number one category of applications new device owners download.
| 5 |
A Truly Global Market
With the ability to play games anytime and anywhere on powerful smartphones and tablets running primarily Apple iOS or Google Android, the mobile game market is truly a scalable global business opportunity.
These 2013 market statistics from Newzoo describe a very exciting and growing global mobile game market:
| · | Of the 1.2 billion gamers worldwide, 966 million, or 78%, already play mobile games. |
|
|
|
| · | 368 million consumers worldwide, or 38% of all mobile gamers, spend a monthly average of $2.78 on or in mobile games. By 2016, it is forecast these figures will amount to, respectively, 50% and $3.07. |
|
|
|
| · | With 48% of the global revenue, the Asia-Pacific region is by far the biggest market for mobile games. |
|
|
|
| · | Western & Eastern Europe will grow fastest with compound annual growth rates (CAGR) of over 33%. |
|
|
|
| · | Average monthly spend per paying mobile gamer is highest in Western Europe with $4.40. In comparison, in North America this figure stands at $3.87, with however the highest share of payers amongst players worldwide (45%). |

Mobile Games Market to Double in Size
(Source: http://www.newzoo.com/insights/infographic-mobile-games-market-to-double-in-size-until-2016-and-reach-23-9bn/)
| 6 |
The Female Player
The explosive growth of the mobile games market can be partly attributed to a relative increase in the number of female players. Gaming is historically a male dominated market with action-based games. But the modern female with disposable income, a smartphone and time on her hands has changed everything. This market development has opened the door wide for a previously niche category of games referred to as "casual" games. Candy Crush Saga is an example of a casual game, and clearly, this is no longer a niche category.

The Freeze Tag Strategy
In targeting the global market for mobile games, we are highly focused on developing mobile social games that are casual, fun and engaging for all ages and gender. The free-to-play business model combined with the use of best-in-class development environments (be it the Freeze Tag Game Engine, Unity3D, or Native HTML5 or other technology) and Analytics and Deployment tools, allows us to systematically launch, optimize and monetize our games. We design our games to be never ending entertainment that our users will enjoy playing and be willing to pay us $0.99 or more from time-to-time for special features and virtual items to keep having fun. We believe that the free-to-play model should not be run as a sprint but rather as a marathon. Over the span of several months, or even years, each game is continuously subject to this optimization process to increase user enjoyment and financial return to the company.
Distribution and Marketing
We market, sell and distribute our games primarily through direct-to-consumer digital storefronts, such as Apple's App Store, the Google Play Store and Amazon's App Store. In addition to publishing our smartphone games on direct-to-consumer digital storefronts, we also publish some of our titles on other platforms, such as the Facebook App Store, the Mac App Store and PC Download portals such as Big Fish Games and Gamehouse.
| 7 |
The fragmentation in the Android platform continues to drive porting costs to new levels. Porting costs relate to expenses incurred in changing our games so that they can operate on other hardware and software platforms. For this reason, we usually launch our new titles on the iOS platform first to save the trouble and expense of porting over and over again on multiple devices. Once a game is tuned properly on the iOS platform, then we will invest the time and effort necessary to port the title to the Android platform. Our porting efforts will be reduced somewhat, as we employ the use of the Unity3D Game Engine to do our development work. We do not envision the fragmentation of the Android market to change any time soon, so we anticipate that we will continue to incur porting costs and evaluate business opportunities on the various Android storefronts on a case-by-case basis.
User Acquisition
In the free-to-play business model, a constant stream of new players is necessary to be successful. So, we have partnered with advertising networks and lead generation companies such as Supersonic, Badge Media, Tapjoy, Ad Colony and Facebook (to name a few). We also employ data analytics to determine which creative messages and which lead referral sources are bringing in the most players who spend money in our games.
To help reduce the cost of acquiring downloads, we have embedded social networking mechanisms into our games to enable our best customers to do the marketing for us. Every time a satisfied player invites her friend to play one of our games, we have been introduced to a new potential customer without incurring a cost to entice that player to download the game. We will continue to design methods to encourage our players to invite their friends and spread the word about our games. Each time a user downloads one of our games from a friend referral without a direct expense from us, our user acquisition cost is lower, and therefore our profitability is potentially higher.
Technology and Tools
Free-to-play Revenue Model
The game industry, like many other forms of entertainment (music, TV, books, etc.) is undergoing a major shift. The free-to-play business model increased in appeal to game players of every genre and platform. Nowhere has this been felt more deeply than the mobile market. Free is a very powerful marketing approach that is irresistible to game players. The top grossing charts on popular mobile app stores like Apple, Google, and Amazon continually show that "free" games earn the most revenue for their developers. So with all this "free-ness," how does a game creator make any money?
Optimizing Customer Lifetime Value
The key business metric of any free-to-play game is the Customer Lifetime Value (CLV). A free-to-play gamer starts out as a zero revenue customer, but he or she may become a paying customer throughout the customer's life of playing the game. The game creator's business is an ongoing engagement with the game players to get them to buy things in the game, without ruining the fun. Optimizing this delicate balance is where the most revenue can be extracted.
| 8 |
The following graphic, developed by XEODesign identifies the approach to creating free-to-play games that are fun and engaging to consumers.
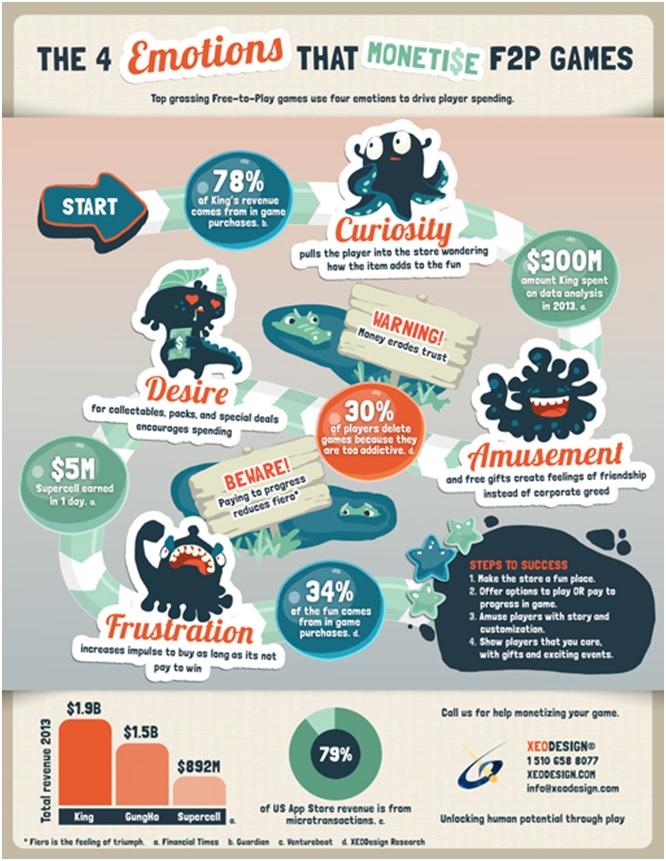
| 9 |
There are many techniques for generating free-to-play revenue. They range from a simple static "pay to access more levels" model to a more dynamic model where player behaviors are systematically analyzed to strategically introduce purchase options to help the user enjoy more of the game. Freeze Tag dynamically optimizes a game's CLV by integrating two important elements: (1) Data Analytics and (2) a Dynamic Game Engine (whether it be the Freeze Tag Game Engine, Unity3D, or other native development environment).
This combination allows us to optimize the features of our games to refresh and update the content so that players are happily engaged and invite their friends to play with them. When players invite their friends, they lower our user acquisition costs. The longer and more often players come back to play, the more likely they are to spend money on virtual goods (through in-game purchases). The net result is a customer with a greater lifetime value. The happier customers are, the more they share with their friends and the more often they come back to spend money. Everything we do is geared to our players having more fun because ultimately customer fun translates into revenue.
Data Analytics
By using commercial and proprietary data analytics tools, we analyze various aspects of the game across the entire pool of players to determine what modifications can be made to the game, which allows us to: (1) make it more fun, and (2) induce a purchase.
Some of the analysis we perform regularly are:
| · | Analyze the number of users that complete the tutorial process |
|
|
|
| · | Identify the Day 1, Day 7, and Day 30 retention metrics of how many players are returning to play |
|
|
|
| · | Quantify the ARPDAU (average revenue per daily active user) to determine the monetization effectiveness of each game |
|
|
|
| · | Determine the percentage of overall users that are converting to spenders |
|
|
|
| · | Quantify the ARPPDAU (average revenue per paying daily active user) |
|
|
|
| · | Determine what parts of the game users are playing most |
|
|
|
| · | Identify where in the game users are dropping out, and find out why |
|
|
|
| · | Average play time per day and per session |
|
|
|
| · | Importance of social networks, like Facebook and Twitter, to the game and how many players login to social networks |
|
|
|
| · | Frequency of users playing against friends |
|
|
|
| · | Identify what events most correlate with purchase events |
|
|
|
| · | Identify how many invites a user is sending out, how long it takes them to send the first invite out, and how many of those players are coming in. |
Dynamic Game Engine(s)
Over the years, we have developed a proprietary dynamic game engine (Freeze Tag Engine) that allows us to make changes to game play and game economies on-the-fly, in most cases, without requiring the download of another update. We also integrate several business analytics packages, and other key game management tools into our games that provide us with real time data to measure detailed player behavior, and respond directly to that behavior. Starting in 2014 and continuing forward, we have also begun to use the Unity3D Development Engine (www.unity3d.com). We have optimized and are continuing to optimize this engine in many of the same ways that our own engine was optimized. Using Unity3D has allowed us to shift from focus on developing our own engine to acquiring and allocating our resources mainly on game development.
| 10 |
Platform Portability - Dynamic Game Engine(s)
Over the years, the Freeze Tag Game Engine has allowed us to the ability to port across multiple platforms using a single codebase. In 2015, and now into 2016, we continue to look to contract with outside teams and outside contractors, allowing us to maintain a smaller internal team. In 2015, we also made the decision to switch a larger portion of our development efforts to a different engine (Unity3D was our choice), one that was widely used, and one that we could draw from a larger pool of talent to quickly develop games. Unity3D also offers platform portability, with the ability to build games that can quickly be ported to iOS, Android, Mac, PC, and HTML5 (still limited). Throughout all of 2015 and into the foreseeable future, all of our products were and will be created using the Unity game engine.
As we continue our development efforts in 2016, our approach is to review the technical requirements of the game we want to develop, then make a decision as to which Game Engine is the most appropriate to implement for that development effort. Currently, we are using Unity3D for most of our efforts, and for the foreseeable future, we will continue to use Unity.
As we make decisions about which Game Engine to employ, here are a few of the things that we look to have:
| · | A single codebase that can be easily ported to other platforms |
|
|
|
| · | Ability to "bolt on" other technologies and codes to easily integrate with other SDK's, platforms and special needs |
|
|
|
| · | Interface easily with scalable backend databases and architecture |
|
|
|
| · | Easily localized into new languages |
|
|
|
| · | Updates can be pushed to the game allowing us to change things like: |
| o | adding new characters |
|
|
|
| o | changing the values in the economy |
|
|
|
| o | updating text |
|
|
|
| o | messaging users (in game) about new features |
|
|
|
| o | instigating a social network based contest |
Integrated Feedback Mechanisms
In addition, we aim to integrate feedback mechanisms into our games to provide incentive for our players to communicate their favorite features and any technical difficulties they may be experiencing. By combining dynamic gaming technology and data analytics into one integrated business process, we can optimize the "fun" factor for our players and maximize our revenue potential.
Product Development
We have learned that establishing and following a fairly rigid process is essential to producing commercially successful products, regardless of the platform. The process all begins with the creative development process. The chart below describes the approach we use to filter ideas and make final decisions on which games we will actually produce. After choosing the game that we will focus on, we write a detailed design document. A thorough design document ensures that all of those involved in the creation of the game have a common reference source throughout the production process. Also critical to producing high quality games, a test plan accompanies every design document. Not only do we test for bugs, but also we test the game for usability. Since most casual gamers do not want to read instructions, it is critical that the finished game be easy to play by just tapping at objects on the screen.
| 11 |

As a developer of mobile social games, we have developed expertise in three core aspects of game production. These core competencies help to give us a competitive advantage in the industry. They are listed below, with the resulting benefit also identified.
Create High Quality Products (including art and sound assets). Benefit: Provides high value to distribution partners and consumers, resulting in increased downloads and purchases. Maintain Flexible Engineering Tools and Processes. Benefit: Decreases time-to-market delivery of products. Minimize Risk by doing the following: 1) selecting proven genres, 2) keeping development costs low, and 3) modifying designs "on the fly" based on consumer feedback. Benefit: Increases the number of games released per year and decreases reliance on any one title's success, ultimately improving return on investment for each game.
1. 2. 3.
How Long Does it Take to Develop a Mobile Social Game?
Shifting our strategy from traditional game development to the free-to-play model has had a dramatic impact on the way we view the development cycle. In the past, we would look at a game as having four distinct steps: design, production, test, and launch. In the free-to-play environment, the production of a game never stops. Instead of launching a finished and polished game, we introduce a beta version into test markets, capture live data, make adjustments and release updates on a regular basis. In the free-to-play business model, the players must stay engaged over long periods of time for the developer to earn revenue. The majority of players who use free-to-play games do not make any purchases, but they are an important part of the ecosystem because they do invite their friends to play, many of whom may pay for in-app purchases to further their progress or "win" against their friends. To keep these players engaged over time, we must constantly update the game, adding new features and content, providing many reasons for the faithful players to keep coming back over and over again to spend time playing our game. The more time spent, the more likely those players are to buy virtual goods, which is one of the main methods a free-to-play game earns revenue. The other method is through showing advertisements during game play which earn money for the developer based on the cost per impression or cost per install measurement technique.
| 12 |
From a technology standpoint, we use a development methodology referred to as "agile development," which focuses on short development and feedback cycles, leading to shortened development times. Because of this, our costs are reduced, and the availability of an almost unlimited number of engineers and programmers makes our development time shorter than most development studios. We use technologies (such as our own Freeze Tag Game Engine and Unity3D) that allow us to build games that will run on multiple platforms, including Apple iOS, Android, Facebook, PC and other opportunities.
Competition
The business of mobile games is very competitive. New products are introduced frequently and the platforms and devices change rapidly. To be successful in this crowded marketplace, we have to entice consumers to play our games based on the quality and "fun" of the experience. Players evaluate our games based on the game play, graphics quality, the music and sound effects and the efficiency and clarity of our software engineering and user interface design.
We compete with a continually increasing number of successful mobile game companies, including Glu (GLUU), King.com (KING), Kabam, Big Fish Games, DeNA, Gameloft, GREE, GungHo Online Entertainment, Nexon, Zynga (ZYNG), Rovio, Storm 8/Team Lava, Supercell and others. We also compete with traditional game companies who have mobile game divisions such as Activision, Electronic Arts, Square Enix, Take Two Interactive, Ubisoft, and more.
In addition, given the open nature of the development and distribution for mobile devices, we also compete or will compete with a vast number of small companies and individuals who are able to create and launch games and other content for these devices using relatively limited resources and with relatively limited start-up time or expertise. As evidenced by the recent Flappy Bird phenomenon, it is possible for a one-man development team to build and launch a game that is able to achieve millions of downloads.
Some of our competitors and our potential competitors have one or more advantages over us, either globally or in particular geographic markets, which include:
| · | significantly greater financial resources; |
|
|
|
| · | greater experience with the free-to-play games and games-as-a-service (GAAS) business models and more effective game monetization; |
|
|
|
| · | stronger brand and consumer recognition regionally or worldwide; |
|
|
|
| · | greater experience and effectiveness integrating community features into their games and increasing the revenues derived from their users; |
|
|
|
| · | larger installed customer bases from their existing mobile games; |
|
|
|
| · | the capacity to leverage their marketing expenditures across a broader portfolio of mobile and non-mobile products; |
|
|
|
| · | larger installed customer bases from related platforms, such as console gaming or social networking websites, to which they can market and sell mobile games; |
|
|
|
| · | more substantial intellectual property of their own from which they can develop games without having to pay royalties; |
|
|
|
| · | better overall economies of scale; |
|
|
|
| · | greater platform-specific focus, experience and expertise; and |
|
|
|
| · | broader global distribution and presence. |
| 13 |
Intellectual Property
Our intellectual property is an essential element of our business. We use a combination of trademark, patent, copyright, trade secret and other intellectual property laws, confidentiality agreements and license agreements to protect our intellectual property. We have also registered a number of domain names, which we believe will be important to the branding and success of our games. Our employees and independent contractors are required to sign agreements acknowledging that all inventions, trade secrets, works of authorship, developments and other processes generated by them on our behalf are our property, and assigning to us any ownership that they may claim in those works. Despite our precautions, it may be possible for third parties to obtain and use without consent intellectual property that we own or license. Unauthorized use of our intellectual property by third parties, and the expenses incurred in protecting our intellectual property rights, may adversely affect our business.
We intend to register ownership of software copyrights in the United States as well as seek registration of various trademarks associated with the Company's name and mobile social games that we will develop.
Wherever possible, we own registered trademark protection for properties we develop. As the digital markets evolve, there are and will continue to be many competitors who will imitate successful game properties. We are investing in trademark protection to create game brands and protect them. For example, we have received approval from the United States Patent and Trademark office to register Party AnimalsÒ, Unsolved MysteryÒ, Unsolved Mystery ClubÒ, Ancient AstronautsÒ, Victorian MysteriesÒ, Grimm ReaperÒ and Rocket WeaselÒ for all gaming platforms. These marks will assist us in defending against copycats who may try to incorporate these terms into their game titles.
From time to time, we may encounter disputes over rights and obligations concerning intellectual property. While we believe that our product and service offerings do not infringe the intellectual property rights of any third party, we cannot be assured that we will prevail in any intellectual property dispute. If we do not prevail in such disputes, we may lose some or all of our intellectual property protection, be enjoined from further sales of the applications determined to infringe the rights of others, and/or be forced to pay substantial royalties to a third party.
Partner Publishing
Another initiative we began in 2015 and will continue to pursue in 2016 is to partner with developers who have completed the production of a game. Occasionally, developers complete production of a free-to-play game but lack the experience in fine tuning the game or lack the funds to promote the game to build a user base. We believe that we can offer significant value to game developers through our experience in tuning free-to-play games to increase key performance indicators such as retention, monetization and engagement. We see partnering with game developers who lack the expertise or funds for user acquisition as an opportunity to increase our revenue and the revenue of our partners.
Business Acquisitions
In addition to our current operations, we propose to seek, investigate and, if warranted, acquire an interest in one or more businesses. However, as of the date hereof, we have no business opportunities or ventures under contemplation for acquisition or merger. We propose to investigate potential opportunities, particularly focusing upon existing privately held businesses whose owners are willing to consider merging their businesses into our company in order to establish a public trading market for their common stock, and whose managements are willing to operate the acquired businesses as divisions or subsidiaries of our company. The businesses we acquire may or may not need an injection of cash to facilitate their future operations. Presently, if we acquire any businesses we envision such acquisition being completed either with our shares of our stock or with the assistance of a strategic funding partner. We currently do not have substantial funds, or a revenue stream, to make acquisitions utilizing our cash.
| 14 |
We are primarily interested in other technology opportunities, but we currently do not intend to restrict our search for investment opportunities to any particular industry or geographical location and may, therefore, engage in essentially any business. Our executive officers will review material furnished to them by the proposed merger or acquisition candidates and will ultimately decide if a merger or acquisition is in our best interests and the interests of our shareholders. We intend to source business opportunities through our officers and directors and their contacts. Those contacts include professional advisors such as attorneys and accountants, securities broker dealers, venture capitalists, members of the financial community, other businesses and others who may present solicited and unsolicited proposals. Management believes that business opportunities and ventures may become available to it due to a number of factors, including, among others: (1) management's willingness to consider a wide variety of businesses; (2) management's contacts and acquaintances; and (3) our flexibility with respect to the manner in which we may be able to structure, finance, merge with or acquire any business opportunity.
The analysis of new business opportunities will be undertaken by or under the supervision of our executive officers and directors. Inasmuch as we will have limited funds available to search for business opportunities and ventures, we will not be able to expend significant funds on a complete and exhaustive investigation of such business or opportunity. We will, however, investigate, to the extent believed reasonable by our management, such potential business opportunities or ventures by conducting a so-called "due diligence investigation".
In a so-called "due diligence investigation", we intend to obtain and review materials regarding the business opportunity. Typically such materials will include information regarding a target business' products, services, contracts, management, ownership, and financial information. In addition, we intend to cause our officers or agents to meet personally with management and key personnel of target businesses, ask questions regarding our prospects, tour facilities, and conduct other reasonable investigation of the target business to the extent of our limited financial resources and management and technical expertise.
Our Employees
We have 10 employees and/or contractors, 2 of which are our officers, 7 of which are engaged in art production, publishing and development, and 1 of which is engaged in administrative functions. We have a team of over 40 engineers, artists, and developers available to us on an independent contract basis around the world.
Description of Property
Our executive offices are located in Tustin, California, at 18062 Irvine Blvd, Suite 103, Tustin, CA 92780 and are leased on a month-to-month basis.
Available Information
We are a fully reporting issuer, subject to the Securities Exchange Act of 1934. Our Quarterly Reports, Annual Reports, and other filings can be obtained from the SEC's Public Reference Room at 100 F Street, NE., Washington, DC 20549, on official business days during the hours of 10 a.m. to 3 p.m. You may also obtain information on the operation of the Public Reference Room by calling the Commission at 1-800-SEC-0330. The Commission maintains an Internet site that contains reports, proxy and information statements, and other information regarding issuers that file electronically with the Commission at http://www.sec.gov.
Our Internet website address is http://www.freezetag.com.
| 15 |
ITEM 1A – RISK FACTORS
As a smaller reporting company we are not required to provide a statement of risk factors. However, we believe this information may be valuable to our shareholders for this filing. We reserve the right to not provide risk factors in our future filings. We face risks in developing our games and products and eventually bringing them to market. The following risks are material risks that we face. If any of these risks occur, our business, our ability to achieve revenues, our operating results and our financial condition could be seriously harmed. Our primary risk factors and other considerations include:
Risk Factors Related to the Business of the Company
We have incurred losses in every year of our operations, and we may never generate substantial revenue or become profitable.
We have incurred losses in every year of our operations, including net losses of $1,870,677 and $1,355,030 for the years ended December 31, 2015 and 2014, respectively. As of December 31, 2015, our accumulated deficit was $8,984,510. We received convertible debt financing during 2015 and 2014, which in effect, saved our company, but could cause us to issue substantial shares of our common stock to satisfy our obligations under the notes. We expect to incur increasing operating losses for the foreseeable future as we continue to incur costs for development, marketing and hosting of our games. Our ability to generate revenue and achieve profitability depends upon our ability, alone or with others, to complete the development and commercialization of our games. These activities are costly and require significant investment.
Our ability to generate revenues from any of our games will depend on a number of factors, including our ability to satisfy consumer demand identify appropriate commercialization strategies, and successfully market and sell our games. Our ultimate success will depend on many factors, including factors outside of our control. We may never successfully commercialize or achieve and sustain market acceptance of any of our games, our game operations may not generate sufficient revenue to support our business, and we may never reach the level of sales and revenues necessary to achieve and sustain profitability.
If we are unable to meet our future capital needs, we may be required to reduce or curtail operations.
To date we have relied on cash flow from operations, funding from our founders, and debt financing to fund operations. We have limited cash liquidity and capital resources. Our cash on hand as of December 31, 2015, was $42,052, and our monthly cash flow burn rate is approximately $55,000. For the year ended December 31, 2015, our revenues were $43,968.
Our future capital requirements will depend on many factors, including our ability to market our products successfully, cash flow from operations, and competing market developments. Based on our current financial situation we may have difficulty continuing our operations at their current level, or at all, if we do not receive additional financing in the near future. Consequently, although we currently have no specific plans or arrangements for financing, we intend to raise funds through private placements, public offerings or other financings. Any equity financings would result in dilution to our then-existing stockholders. Sources of debt financing may result in higher interest expense. Any financing, if available, may be on unfavorable terms. If adequate funds are not obtained, we may be required to reduce or curtail operations. We anticipate that our existing capital resources will not be adequate to satisfy our operating expenses and capital requirements for any length of time. However, this estimate of expenses and capital requirements may prove to be inaccurate.
Debt financing is difficult to obtain.
Debt financing is difficult to obtain in the current credit markets. This difficulty may make future acquisitions either unlikely, or too difficult and expensive. This could materially adversely affect our company and the trading price of our common stock.
| 16 |
Raising capital by borrowing could be risky.
If we were to raise capital by borrowing to fund our operations or acquisitions, it could be risky. Borrowing through non-convertible instruments typically results in less dilution than in connection with equity financings, but it also would increase our risk, in that cash is required to service the debt, ongoing covenants are typically employed which can restrict the way in which we operate our business, and if the debt comes due either upon maturity or an event of default, we may lack the resources at that time to either pay off or refinance the debt, or if we are able to refinance, the refinancing may be on terms that are less favorable than those originally in place, and may require additional equity or quasi equity accommodations. These risks could materially adversely affect our company and the trading price of our common stock.
Our financing decisions may be made without stockholder approval.
Our financing decisions and related decisions regarding levels of debt, capitalization, distributions, acquisitions and other key operating parameters, are determined by our board of directors in its discretion, in many cases without any notice to or vote by our stockholders. This could materially adversely affect our company and the trading price of our common stock.
Our independent registered public accounting firm has expressed doubts about our ability to continue as a going concern.
As a result of our financial condition, we have received a report from our independent registered public accounting firm for our financial statements for the year ended December 31, 2015 that includes an explanatory paragraph describing the uncertainty as to our ability to continue as a going concern. In order to continue as a going concern we must effectively balance many factors and increase our revenues to a point where we can fund our operations from our sales and revenues. If we are not able to do this we may not be able to continue as an operating company.
Because we face intense competition, we may not be able to operate profitably in our markets.
The market for casual games is highly competitive and is becoming more so, which could hinder our ability to successfully market our products. We may not have the resources, expertise or other competitive factors to compete successfully in the future. We expect to face additional competition from existing competitors and new market entrants in the future. Many of our competitors have greater name recognition and more established relationships in the industry than we do. As a result, these competitors may be able to:
· develop and expand their product offerings more rapidly; · adapt to new or emerging changes in customer requirements more quickly; · take advantage of acquisition and other opportunities more readily; and · devote greater resources to the marketing and sale of their products and adopt more aggressive pricing policies than we can.
If we are unable to maintain brand image or product quality, our business may suffer.
Our success depends on our ability to maintain and build brand image for our existing products, new products and brand extensions. We have no assurance that our advertising, marketing and promotional programs will have the desired impact on our products' brand image and on consumer preferences.
| 17 |
If we are unable to attract and retain key personnel, we may not be able to compete effectively in our market.
Our success will depend, in part, on our ability to attract and retain key management, including primarily Craig Holland and Mick Donahoo, technical experts, and sales and marketing personnel. We attempt to enhance our management and technical expertise by recruiting qualified individuals who possess desired skills and experience in certain targeted areas. Our inability to retain employees and attract and retain sufficient additional employees, and information technology, engineering and technical support resources, could have a material adverse effect on our business, financial condition, results of operations and cash flows. The loss of key personnel could limit our ability to develop and market our products.
Because our officers and directors control our common stock vote, they have the ability to influence matters affecting our shareholders.
As of December 31, 2015, there were 280,442,125 outstanding shares of Common Stock and no outstanding shares of Series A Preferred Stock ("Series A Preferred"). Our officers and directors own a significant portion of the common stock vote. As a result, they have the ability to influence matters affecting our shareholders, including the election of our directors, the acquisition or disposition of our assets, and the future issuance of our shares. Because they control such shares, investors may find it difficult to replace our management if they disagree with the way our business is being operated. Because the influence by these insiders could result in management making decisions that are in the best interest of those insiders and not in the best interest of the investors, you may lose some or all of the value of your investment in our common stock.
Our business may be negatively impacted by a slowing economy or by unfavorable economic conditions or developments in the United States and/or in other countries in which we operate.
A general slowdown in the economy in the United States or unfavorable economic conditions or other developments may result in decreased consumer demand, business disruption, foreign currency devaluation, inflation or deflation. A slowdown in the economy or unstable economic conditions in the United States or in the countries in which we operate could have an adverse impact on our business results or financial condition.
We may not be able to effectively manage our growth and operations, which could materially and adversely affect our business.
We may experience rapid growth and development in a relatively short period of time by aggressively marketing our casual games. The management of this growth will require, among other things, continued development of our financial and management controls and management information systems, stringent control of costs, increased marketing activities, the ability to attract and retain qualified management personnel and the training of new personnel. We intend to hire additional personnel in order to manage our expected growth and expansion. Failure to successfully manage our possible growth and development could have a material adverse effect on our business and the value of our common stock.
Failure to renew our existing licenses or to obtain additional licenses could harm our business.
Some of our game products are or will be based on or incorporate intellectual properties that we license from third parties. Our current licenses to use these properties do not extend beyond terms of two to three years. We may be unable to renew these licenses on terms favorable to us, or at all, and we may be unable to secure alternatives in a timely manner. We expect that licenses we obtain in the future may impose development, distribution and marketing obligations on us. If we breach our obligations, our licensors may have the right to terminate the license or change an exclusive license to a non-exclusive license.
Competition for licenses may also increase the advances, guarantees and royalties that we must pay to the licensor, which could significantly increase our costs. Failure to maintain our existing licenses or obtain additional licenses with significant commercial value could impair our ability to introduce new applications or continue our current game products and applications, which could materially harm our business.
| 18 |
If we fail to develop and introduce new casual games and other applications that achieve market acceptance, our sales could suffer.
Our business depends on providing casual games and applications that consumers initially want to download to their devices and then make subsequent in-game purchases. We must invest significant resources in research and development to enhance our offering of casual games and other applications and introduce new games and other applications. Our operating results would suffer if our games and other applications are not responsive to the preferences of our customers or are not effectively brought to market.
The planned timing or introduction of new casual games is subject to risks and uncertainties. Unexpected technical, operational, deployment, distribution or other problems could delay or prevent the introduction of new casual games, which could result in a loss of, or delay in, revenues or damage to our reputation and brand. If any of our applications is introduced with defects, errors or failures, we could experience decreased sales, loss of customers and damage to our reputation and brand. In addition, new applications may not achieve sufficient market acceptance to offset the costs of development. Our success depends, in part, on unpredictable and volatile factors beyond our control, including customer preferences, competing applications and the availability of other entertainment activities. A shift in Internet or mobile device usage or the entertainment preferences of our customers could cause a decline in our applications' popularity that could materially reduce our revenues and harm our business.
We intend to continuously develop and introduce new games and other applications for use on next-generation Internet and mobile devices. We must make product development decisions and commit significant resources well in advance of the anticipated introduction of new mobile devices. New mobile devices for which we will develop applications may be delayed, may not be commercially successful, may have a shorter life cycle than anticipated or may not be adequately promoted by wireless carriers or the manufacturer. If the mobile devices for which we are developing games and other applications are not released when expected or do not achieve broad market penetration, our potential revenues will be limited and our business will suffer.
If our independent, third-party developers cease development of new applications for us and we are unable to find comparable replacements, our competitive position may be adversely impacted.
We rely on independent third-party developers to develop some of our game products which subjects us to the following risks:
· key developers who work for us may choose to work for or be acquired by our competitors; · developers currently under contract may try to renegotiate our agreements with them on terms less favorable to us; and · our developers may be unable or unwilling to allocate sufficient resources to complete our applications on a timely or satisfactory basis or at all.
If our developers terminate their relationships with us or negotiate agreements with terms less favorable to us, we may have to increase our internal development staff, which would be a time consuming and potentially costly process. If we are unable to increase our internal development staff in a cost-effective manner or if our current internal development staff fails to create successful applications, our earnings could be materially diminished.
In addition, although we require our third-party developers to sign agreements acknowledging that all inventions, trade secrets, works of authorship, development and other processes generated by them are our property and to assign to us any ownership they may have in those works, it may still be possible for third parties to obtain and use our intellectual properties without our consent.
| 19 |
Our industry is experiencing consolidation that may cause us to lose key relationships and intensify competition.
The Internet and media distribution industries are undergoing substantial change, which has resulted in increasing consolidation and formation of strategic relationships. We expect this consolidation and strategic partnering to continue. Acquisitions or other consolidating transactions could harm us in a number of ways, including:
· we could lose strategic relationships if our strategic partners are acquired by or enter into relationships with a competitor (which could cause us to lose access to distribution, content, technology and other resources); · we could lose customers if competitors or users of competing technologies consolidate with our current or potential customers; and · our current competitors could become stronger, or new competitors could form, from consolidations.
Any of these events could put us at a competitive disadvantage, which could cause us to lose customers, revenue and market share. Consolidation could also force us to expend greater resources to meet new or additional competitive threats, which could also harm our operating results.
We rely on the continued reliable operation of third parties' systems and networks and, if these systems and networks fail to operate or operate poorly, our business and operating results will be harmed.
Our operations are in part dependent upon the continued reliable operation of the information systems and networks of third parties. If these third parties do not provide reliable operation, our ability to service our customers will be impaired and our business, reputation and operating results could be harmed.
The Internet and our network are subject to security risks that could harm our business and reputation and expose us to litigation or liability.
Online commerce and communications depend on the ability to transmit confidential information and licensed intellectual property securely over private and public networks. Any compromise of our ability to transmit and store such information and data securely, and any costs associated with preventing or eliminating such problems, could damage our business, hurt our ability to distribute products and services and collect revenue, threaten the proprietary or confidential nature of our technology, harm our reputation, and expose us to litigation or liability. We also may be required to expend significant capital or other resources to protect against the threat of security breaches or hacker attacks or to alleviate problems caused by such breaches or attacks. Any successful attack or breach of our security could hurt consumer demand for our products and services, expose us to consumer class action lawsuits and harm our business.
We may be unable to adequately protect our proprietary rights.
Our ability to compete partly depends on the superiority, uniqueness and value of our intellectual property and technology, including both internally developed technology and technology licensed from third parties. To the extent we are able to do so, in order to protect our proprietary rights, we will rely on a combination of trademark, copyright and trade secret laws, confidentiality agreements with our employees and third parties, and protective contractual provisions and licensing agreement. Despite these efforts, any of the following occurrences may reduce the value of our intellectual property:
· Our applications for trademarks and copyrights relating to our business may not be granted and, if granted, may be challenged or invalidated; · Issued trademarks and registered copyrights may not provide us with any competitive advantages; · Our efforts to protect our intellectual property rights may not be effective in preventing misappropriation of our technology; · Our efforts may not prevent the development and design by others of products or technologies similar to or competitive with, or superior to those we develop; · Another party may obtain a blocking patent and we would need to either obtain a license or design around the patent in order to continue to offer the contested feature or service in our products; or · We may not be able to afford to pay the costs associated with protecting our intellectual property rights.
| 20 |
We may be forced to litigate to defend our intellectual property rights, or to defend against claims by third parties against us relating to intellectual property rights.
We may be forced to litigate to enforce or defend our intellectual property rights, to protect our trade secrets or to determine the validity and scope of other parties' proprietary rights. Any such litigation could be very costly and could distract our management from focusing on operating our business. The existence and/or outcome of any such litigation could harm our business.
Interpretation of existing laws that did not originally contemplate the Internet could harm our business and operating results.
The application of existing laws governing issues such as property ownership, copyright and other intellectual property issues to the Internet is not clear. Many of these laws were adopted before the advent of the Internet and do not address the unique issues associated with the Internet and related technologies. In many cases, the relationship of these laws to the Internet has not yet been interpreted. New interpretations of existing laws may increase our costs, require us to change business practices or otherwise harm our business.
It is not yet clear how laws designed to protect children that use the Internet may be interpreted, and such laws may apply to our business in ways that may harm our business.
The Child Online Protection Act and the Child Online Privacy Protection Act impose civil and criminal penalties on persons distributing material harmful to minors (e.g., obscene material) over the Internet to persons under the age of 17, or collecting personal information from children under the age of 13. We do not knowingly distribute harmful materials to minors or collect personal information from children under the age of 13. The manner in which these Acts may be interpreted and enforced cannot be fully determined, and future legislation similar to these Acts could subject us to potential liability if we were deemed to be non-compliant with such rules and regulations, which in turn could harm our business.
We may be subject to market risk and legal liability in connection with the data collection capabilities of our products and services.
Many of our products are interactive Internet applications that by their very nature require communication between a client and server to operate. To provide better consumer experiences and to operate effectively, our products send information to our servers. Many of the services we provide also require that a user provide certain information to us. We post an extensive privacy policy concerning the collection, use and disclosure of user data involved in interactions between our client and server products.
Risk Factors Relating to Future Acquisitions
We may not be able to identify, negotiate, finance or close future acquisitions.
A significant component of our growth strategy focuses on acquiring additional companies or assets. We may not, however, be able to identify, audit, or acquire companies or assets on acceptable terms, if at all. Additionally, we may need to finance all or a portion of the purchase price for an acquisition by incurring indebtedness. There can be no assurance that we will be able to obtain financing on terms that are favorable, if at all, which will limit our ability to acquire additional companies or assets in the future. Failure to acquire additional companies or assets on acceptable terms, if at all, would have a material adverse effect on our ability to increase assets, revenues and net income and on the trading price of our common Stock.
| 21 |
We may acquire businesses without any apparent synergies with our casual games related operations.
In an effort to diversify our sources of revenue and profits, we may decide to acquire businesses without any apparent synergies with our casual games related operations. For example, we believe that the acquisition of technologies unrelated to games and leisure may be an important way for us to enhance our stockholder value. Notwithstanding the critical importance of diversification, some members of the investment community and research analysts would prefer that micro-cap or small-cap companies restrict the scope of their activity to a single line of business, and may not be willing to make an investment in, or recommend an investment in, a micro-cap or small-cap company that undertakes multiple lines of business. This situation could materially adversely impact our company and the trading price of our stock.
We may not be able to properly manage multiple businesses.
We may not be able to properly manage multiple businesses. Managing multiple businesses would be more complicated than managing a single line of business, and would require that we hire and manage executives with experience and expertise in different fields. We can provide no assurance that we will be able to do so successfully. A failure to properly manage multiple businesses could materially adversely affect our company and the trading price of our stock.
We may not be able to successfully integrate new acquisitions.
Even if we are able to acquire additional companies or assets, we may not be able to successfully integrate those companies or assets. For example, we may need to integrate widely dispersed operations with different corporate cultures, operating margins, competitive environments, computer systems, compensation schemes, business plans and growth potential requiring significant management time and attention. In addition, the successful integration of any companies we acquire will depend in large part on the retention of personnel critical to our combined business operations due to, for example, unique technical skills or management expertise. We may be unable to retain existing management, finance, engineering, sales, customer support, and operations personnel that are critical to the success of the integrated company, resulting in disruption of operations, loss of key information, expertise or know-how, unanticipated additional recruitment and training costs, and otherwise diminishing anticipated benefits of these acquisitions, including loss of revenue and profitability. Failure to successfully integrate acquired businesses could have a material adverse effect on our company and the trading price of our stock.
Our acquisitions of businesses may be extremely risky and we could lose all of our investments.
We may invest in software companies, other technology businesses, or other risky industries. An investment in these companies may be extremely risky because, among other things, the companies we are likely to focus on: (1) typically have limited operating histories, narrower product lines and smaller market shares than larger businesses, which tend to render them more vulnerable to competitors' actions and market conditions, as well as general economic downturns; (2) tend to be privately-owned and generally have little publicly available information and, as a result, we may not learn all of the material information we need to know regarding these businesses; (3) are more likely to depend on the management talents and efforts of a small group of people; and, as a result, the death, disability, resignation or termination of one or more of these people could have an adverse impact on the operations of any business that we may acquire; (4) may have less predicable operating results; (5) may from time to time be parties to litigation; (6) may be engaged in rapidly changing businesses with products subject to a substantial risk of obsolescence; and (7) may require substantial additional capital to support their operations, finance expansion or maintain their competitive position. Our failure to make acquisitions efficiently and profitably could have a material adverse effect on our business, results of operations, financial condition and the trading price of our stock.
| 22 |
Future acquisitions may fail to perform as expected.
Future acquisitions may fail to perform as expected. We may overestimate cash flow, underestimate costs, or fail to understand risks. This could materially adversely affect our company and the trading price of our Stock.
Competition may result in overpaying for acquisitions.
Other investors with significant capital may compete with us for attractive investment opportunities. These competitors may include publicly traded companies, private equity firms, privately held buyers, individual investors, and other types of investors. Such competition may increase the price of acquisitions, or otherwise adversely affect the terms and conditions of acquisitions. This could materially adversely affect our company and the trading price of our stock.
We may have insufficient resources to cover our operating expenses and the expenses of raising money and consummating acquisitions.
We have limited cash to cover our operating expenses and to cover the expenses incurred in connection with money raising and a business combination. It is possible that we could incur substantial costs in connection with money raising or a business combination. If we do not have sufficient proceeds available to cover our expenses, we may be forced to obtain additional financing, either from our management or third parties. We may not be able to obtain additional financing on acceptable terms, if at all, and neither our management nor any third party is obligated to provide any financing. This could have a negative impact on our company and our stock price.
The nature of our proposed future operations is speculative and will depend to a great extent on the businesses which we acquire.
While management typically intends to seek a merger or acquisition of privately held entities with established operating histories, there can be no assurance that we will be successful in locating an acquisition candidate meeting such criteria. In the event we complete a merger or acquisition transaction, of which there can be no assurance, our success if any will be dependent upon the operations, financial condition and management of the acquired company, and upon numerous other factors beyond our control. If the operations, financial condition or management of the acquired company were to be disrupted or otherwise negatively impacted following an acquisition, our company and our stock price would be negatively impacted.
We may make actions that will not require our stockholders' approval.
The terms and conditions of any acquisition could require us to take actions that would not require stockholder approval. In order to acquire certain companies or assets, we may issue additional shares of common or preferred stock, borrow money or issue debt instruments including debt convertible into capital stock. Not all of these actions would require our stockholders' approval even if these actions dilute our shareholders' economic or voting interest.
| 23 |
Our investigation of potential acquisitions will be limited.
Our analysis of new business opportunities will be undertaken by or under the supervision of our executive officers and directors. Inasmuch as we will have limited funds available to search for business opportunities and ventures, we will not be able to expend significant funds on a complete and exhaustive investigation of such business or opportunity. We will, however, investigate, to the extent believed reasonable by our management, such potential business opportunities or ventures by conducting a so-called "due diligence investigation". In a so-called "due diligence investigation", we intend to obtain and review materials regarding the business opportunity. Typically such materials will include information regarding a target business' products, services, contracts, management, ownership, and financial information. In addition, we intend to cause our officers or agents to meet personally with management and key personnel of target businesses, ask questions regarding the company's prospects, tour facilities, and conduct other reasonable investigation of the target business to the extent of our limited financial resources and management and technical expertise. Any failure of our typical "due diligence investigation" to uncover issues and problems relating to potential acquisition candidates could materially adversely affect our company and the trading price of our stock.
We will have only a limited ability to evaluate the directors and management of potential acquisitions.
We may make a determination that our current directors and officers should not remain, or should reduce their roles, following money raising or a business combination, based on an assessment of the experience and skill sets of new directors and officers and the management of target businesses. We cannot assure you that our assessment of these individuals will prove to be correct. This could have a negative impact on our company and our stock price.
We will be dependent on outside advisors to assist us.
In order to supplement the business experience of management, we may employ accountants, technical experts, appraisers, attorneys or other consultants or advisors. The selection of any such advisors will be made by management and without any control from shareholders. Additionally, it is anticipated that such persons may be engaged by us on an independent basis without a continuing fiduciary or other obligation to us.
We may be unable to protect or enforce the intellectual property rights of any target business that we acquire or the target business may become subject to claims of intellectual property infringement.
After completing a business combination, theprocurement and protection of trademarks, copyrights, patents, domain names, and trade secrets may be critical to our success.We will likely rely on a combination of copyright, trademark, trade secret laws and contractual restrictions to protect any proprietary technology and rights that we may acquire. Despite our efforts to protect those proprietary technology and rights, we may not be able to prevent misappropriation of those proprietary rights or deter independent development of technologies that compete with the business we acquire. Litigation may be necessary in the future to enforce our intellectual property rights, to protect our trade secrets, or to determine the validity and scope of the proprietary rights of others. It is also possible that third parties may claim we have infringed their patent, trademark, copyright or other proprietary rights. Claims or litigation, with or without merit, could result in substantial costs and diversions of resources, either of which could have an adverse effect on our competitive position and business. Further, depending on the target business or businesses that we acquire, it is likely that we will have to protect trademarks, patents, and domain names in an increasing number of jurisdictions, a process that is expensive and may not be successful in every location. These factors could negatively impact our company and the trading price of our stock.
Integrating acquired businesses may divert our management's attention away from our day-to-day operations and harm our business.
Acquisitions generally involve significant risks, including the risk of overvaluation of potential acquisitions and risks in regard to the assimilation of personnel, operations, products, services, technologies, and corporate culture of acquired companies. Dealing with these risks may place a significant burden on our management and other internal resources. This could materially adversely affect our business and the trading price of our stock.
| 24 |
We may fail to manage our growth effectively.
Future growth through acquisitions and organic expansion would place a significant strain on our managerial, operational, technical, training, systems and financial resources. We can give you no assurance that we will be able to manage our expanding operations properly or cost effectively. A failure to properly and cost-effectively manage our expansion could materially adversely affect our company and the trading price of our stock.
The management of companies we acquire may lose their enthusiasm or entrepreneurship after the sale of their businesses.
We can give no assurance that the management of future companies we acquire will have the same level of enthusiasm for the operation of their businesses following their acquisition by us, or if they cease performing services for the acquired businesses that we will be able to install replacement management with the same skill sets and determination. There also is always a risk that management will attempt to reenter the market and possibly seek to recruit some of the former employees of the business, who may continue to be key employees of ours. This could materially adversely affect our business and the trading price of our Stock.
If we are deemed to be an investment company, we may be required to institute burdensome compliance requirements and our activities may be restricted, which may make it difficult for us to complete a business combination.
We believe we will not be subject to regulation underthe Investment Company Act insofar as we will not be engaged in the business of investing or trading in securities. However, in the event that we engage in businesscombinations which result in us holding passive investment interests in a number of entities, we may become subject to regulation under the Investment Company Act. In such event, we may be required to register as an investment company and may incur significant registration and compliance costs. We have obtained no formal determination from the government as to our status under the Investment Company Act, and consequently, any violation of such Act might subject us to material adverse consequences.
Risks Related To Our Common Stock
There is a limited public trading market for our common stock, which may impede our shareholders' ability to sell our shares.
Currently, there is a limited trading market for our common stock, and there can be no assurance that a more robust market will be achieved in the future. There can be no assurance that an investor will be able to liquidate his or her investment without considerable delay, if at all. If the trading market for our common stock does increase, the price may be highly volatile. Factors discussed herein may have a significant impact on the market price of our shares. Moreover, due to the relatively low price of our securities, many brokerage firms may not effect transactions in our common stock if a market is established. Rules enacted by the SEC increase the likelihood that most brokerage firms will not participate in a potential future market for our common stock. Those rules require, as a condition to brokers effecting transactions in certain defined securities (unless such transaction is subject to one or more exemptions), that the broker obtain from its customer or client a written representation concerning the customer's financial situation, investment experience and investment objectives. Compliance with these procedures tends to discourage most brokerage firms from participating in the market for certain low-priced securities.
| 25 |
If we are unable to pay the costs associated with being a public, reporting company, we may not be able to continue trading on the OTC Bulletin Board and/or we may be forced to discontinue operations.
We have significant costs associated with being a public, reporting company, which adds to the substantial doubt about our ability to continue trading on the OTC Bulletin Board and/or continue as a going concern. These costs include compliance with the Sarbanes-Oxley Act of 2002, which will be difficult given the limited size of our management, and we will have to rely on outside consultants. Accounting controls, in particular, are difficult and can be expensive to comply with.
Our ability to continue trading on the OTC Bulletin Board and/or continue as a going concern will depend on positive cash flow, if any, from future operations and on our ability to raise additional funds through equity or debt financing. If we are unable to achieve the necessary product sales or raise or obtain needed funding to cover the costs of operating as a public, reporting company, our common stock may be deleted from the OTC Bulletin Board and/or we may be forced to discontinue operations.
We do not intend to pay dividends in the foreseeable future.
We do not intend to pay any dividends in the foreseeable future. We do not plan on making any cash distributions in the manner of a dividend or otherwise. Our Board presently intends to follow a policy of retaining earnings, if any.
We have the right to issue additional shares of common stock and preferred stock without consent of stockholders. This would have the effect of diluting investors' ownership and could decrease the value of their investment.
We have additional authorized, but unissued shares of our common stock that may be issued by us for any purpose without the consent or vote of our stockholders that would dilute stockholders' percentage ownership of our company.
In addition, our certificate of incorporation authorizes the issuance of shares of preferred stock, the rights, preferences, designations and limitations of which may be set by the Board of Directors. Our certificate of incorporation has authorized issuance of up to 10,000,000 shares of preferred stock in the discretion of our Board. The shares of authorized but undesignated preferred stock may be issued upon filing of an amended certificate of incorporation and the payment of required fees; no further stockholder action is required. In addition, other shares of preferred stock could be designated and, if issued, the rights, preferences, designations and limitations of such preferred stock would be set by our Board and could operate to the disadvantage of the outstanding common stock. Such terms could include, among others, preferences as to dividends, voting, and distributions on liquidation.
As of the end of the period covered by this report, we have current outstanding non-affiliate debt obligations totaling approximately $1,405,361, which are convertible into our common stock. In the event the holder(s) of such instruments convert amounts owed to them into common stock and/or we default on the convertible instruments, significant dilution could occur to the other holders of our common stock and could significantly decrease the value of our common stock.
As of the end of the period covered by this report, we have outstanding non-affiliate debt obligations totaling approximately $1,405,361, net of discount of $180,208, which are convertible into our common stock. Although under the terms of the agreement, the number of shares of common stock issuable upon the conversion of any portion of the notes, cannot exceed an amount that would cause the beneficial ownership of the debt holder and its affiliates to own more than 4.99% of our outstanding shares of Common Stock, the issuance of almost 5% of our outstanding common stock in a short period time, possibly happening multiple times, would cause substantial dilution to our shareholders. In the event the holder(s) of such instruments convert amounts owed to them into common stock and/or we default on the convertible instruments, significant dilution could occur to the other holders of our common stock and could significantly decrease the value of our common stock. We evaluated the convertible notes and determined that the shares issuable pursuant to the conversion option were determinate due to the Fixed Conversion Price and, as such, do not constitute a derivative liability as we have obtained authorization from a majority of our shareholders such that should conversion occur at the Fixed Conversion Price the appropriate number of shares will be made available or issuable for settlement to occur.
| 26 |
Sales of our stock could cause the trading price of our stock to fall.
Sellers of our stock might include convertible debt securities as discussed above, our existing stockholders who have held our stock for years, persons and entities who acquire our stock as consideration for services they provide to our company, or our directors, officers or employees who might receive and then exercise stock options and simultaneously sell our stock. Since the trading volume of our stock is typically very low, any sales or attempts to sell our stock, or the perception that sales or attempts to sell our stock could occur, could adversely affect the trading price of our stock.
Our common stock is governed under The Securities Enforcement and Penny Stock Reform Act of 1990.
The Securities Enforcement and Penny Stock Reform Act of 1990 requires additional disclosure relating to the market for penny stocks in connection with trades in any stock defined as a penny stock. The Commission has adopted regulations that generally define a penny stock to be any equity security that has a market price of less than $5.00 per share, subject to certain exceptions. Such exceptions include any equity security listed on NASDAQ and any equity security issued by an issuer that has (i) net tangible assets of at least $2,000,000, if such issuer has been in continuous operation for three years, (ii) net tangible assets of at least $5,000,000, if such issuer has been in continuous operation for less than three years, or (iii) average annual revenue of at least $6,000,000, if such issuer has been in continuous operation for less than three years. Unless an exception is available, the regulations require the delivery, prior to any transaction involving a penny stock, of a disclosure schedule explaining the penny stock market and the risks associated therewith.
ITEM 1B – UNRESOLVED STAFF COMMENTS
This Item is not applicable to us as we are not an accelerated filer, a large accelerated filer, or a well-seasoned issuer; however, we have not received written comments from the Commission staff regarding our periodic or current reports under the Securities Exchange Act of 1934 within the last 180 days before the end of our last fiscal year.
ITEM 2 – PROPERTIES
Our executive offices are located in Tustin, California, at 18062 Irvine Blvd, Suite 103, Tustin, CA 92780. We currently lease approximately 900 sq. ft. of office space on a month-to-month basis for $0.83 sq/ft.
ITEM 3 – LEGAL PROCEEDINGS
We are not a party to or otherwise involved in any legal proceedings.
In the ordinary course of business, we are from time to time involved in various pending or threatened legal actions. The litigation process is inherently uncertain and it is possible that the resolution of such matters might have a material adverse effect upon our financial condition and/or results of operations. However, in the opinion of our management, other than as set forth herein, matters currently pending or threatened against us are not expected to have a material adverse effect on our financial position or results of operations.
ITEM 4 – MINE SAFETY DISCLOSURES
There is no information required to be disclosed by this Item.
| 27 |
PART II
ITEM 5 – MARKET FOR REGISTRANT'S COMMON EQUITY, RELATED STOCKHOLDER MATTERS AND ISSUER PURCHASES OF EQUITY SECURITIES
Market Information
Our common stock has been quoted for trading on the OTC Bulletin Board and now OTC Markets / OTC Pink tier since June 2011. Our current trading symbol is "FRZT." Since our stock has been quoted, there has been limited volume.
The following table sets forth the high and low bid information for each quarter within the fiscal years ended December 31, 2015 and 2014, as provided by the Nasdaq Stock Markets, Inc. The information reflects prices between dealers, and does not include retail markup, markdown, or commission, and may not represent actual transactions.
Fiscal Year Ended |
|
|
| Bid Prices | ||||||
December 31, |
| Period |
| High |
|
| Low |
| ||
|
|
|
|
|
|
|
| |||
2014 |
| First Quarter |
| $ | 0.0116 |
|
| $ | 0.0010 |
|
| Second Quarter |
| $ | 0.0140 |
|
| $ | 0.0031 |
| |
| Third Quarter |
| $ | 0.0075 |
|
| $ | 0.0016 |
| |
| Fourth Quarter |
| $ | 0.0056 |
|
| $ | 0.0016 |
| |
|
|
|
|
|
|
|
|
|
| |
2015 |
| First Quarter |
| $ | 0.0150 |
|
| $ | 0.0018 |
|
| Second Quarter |
| $ | 0.0100 |
|
| $ | 0.0017 |
| |
| Third Quarter |
| $ | 0.0045 |
|
| $ | 0.0010 |
| |
| Fourth Quarter |
| $ | 0.0016 |
|
| $ | 0.0007 |
| |
The Securities Enforcement and Penny Stock Reform Act of 1990 requires additional disclosure relating to the market for penny stocks in connection with trades in any stock defined as a penny stock. The Commission has adopted regulations that generally define a penny stock to be any equity security that has a market price of less than $5.00 per share, subject to a few exceptions which we do not meet. Unless an exception is available, the regulations require the delivery, prior to any transaction involving a penny stock, of a disclosure schedule explaining the penny stock market and the risks associated therewith.
Holders
As of December 31, 2015, there were 280,442,125 shares of our common stock outstanding held by approximately 126 holders of record of our common stock. Aggregate market value of the voting stock held by non-affiliates as of June 30, 2015: $347,437 as based on the closing price of $0.0027 on June 30, 2015 of our common stock. The voting stock held by non-affiliates on that date consisted of 128,680,289 shares of common stock.
Dividends
We have not declared or paid a cash dividend on our capital stock in our last two fiscal years and we do not expect to pay cash dividends on our common stock in the foreseeable future. We currently intend to retain our earnings, if any, for use in our business. Any dividends declared in the future will be at the discretion of our Board of Directors and subject to any restrictions that may be imposed by our lenders.
| 28 |
Securities Authorized for Issuance Under Equity Compensation Plans
There are currently 560,000 options outstanding, to purchase shares of our common stock.
Non-Qualified Stock Option Plan
On March 20, 2006, our Board of Directors and shareholders approved the Freeze Tag, Inc. 2006 Stock Plan. Pursuant to the Plan, we reserved 2,920,500 shares (post-split) of our common stock to be issued to employees and consultants for services rendered to the company. As of December 31, 2008, we had issued options to acquire a total of 1,247,850 shares (post-split) of our common stock to seven of our employees and/or consultants. Effective as of October 15, 2009, all seven of the option holders converted their options into a total of 1,123,065 shares of our common stock. Because of the 5.31-for-one forward stock split of our common stock on October 15, 2009, there are now 1,512,650 shares available for issuance as a part of this stock plan. As of the period ended December 31, 2015, there were 560,000 options outstanding to purchase shares of common stock, and no shares of common stock had been issued pursuant to stock purchase rights under the 2006 Plan.
Under the 2006 Plan, options may be granted to employees, directors, and consultants. Only employees may receive "incentive stock options," which are intended to qualify for certain tax treatment, and consultants and directors may receive "non-statutory stock options," which do not qualify for such treatment. A holder of more than 10% of the outstanding voting shares may only be granted options with an exercise price of at least 110% of the fair market value of the underlying stock on the date of the grant, and if such holder has incentive stock options, the term of the options must not exceed five years.
Options and stock purchase rights granted under the 2006 Plan generally vest ratably over a four year period (typically 1⁄4 or 25% of the shares vest after the 1st year and 1/48 of the remaining shares vest each month thereafter); however, alternative vesting schedules may be approved by our Board of Directors in its sole discretion. Any unvested portion of an option or stock purchase right will accelerate and become fully vested if a holder's service with the company is terminated by us without cause within twelve months following a Change in Control (as defined in the 2006 Plan).
All options must be exercised within ten years after the date of grant. Upon a holder's termination of service for any reason prior to a Change in Control, we may repurchase any shares issued to such holder upon the exercise of options or stock purchase rights. The Board of Directors may amend the 2006 Plan at any time. The 2006 Plan will terminate in 2016, unless terminated sooner by the Board of Directors.
As of December 31, 2015, we had the following options outstanding:
Plan Category |
| Number of Securities to be issued upon exercise of outstanding options, warrants and rights |
|
| Weighted-average exercise price of outstanding options, warrants and rights |
|
| Number of securities remaining available for future issuance under equity compensation plans (excluding securities reflected in column (a)) |
| |||
| (a) |
|
| (b) |
|
| (c) |
| ||||
Equity compensation plans approved by security holders |
|
| 560,000 |
|
| $ | 0.10 |
|
|
| 952,650 |
|
Equity compensation plans not approved by security holders |
|
| - |
|
|
| - |
|
|
| - |
|
Total |
|
| 560,000 |
|
| $ | 0.10 |
|
|
| 952,650 |
|
| 29 |
Recent Issuance of Unregistered Securities
Unless otherwise noted, the use of proceeds for the following sales of equity securities was to sustain our business operations. During the quarter ended December 31, 2015, we issued the following unregistered securities:
On October 8, 2015, Craig Holland converted $4,607 principal and $2,028 accrued interest into 12,637,860 shares of the Company's common stock at a conversion price of $0.000525 per share.
On October 8, 2015, Mick Donahoo converted $4,607 principal and $2,028 accrued interest into 12,637,860 shares of the Company's common stock at a conversion price of $0.000525 per share.
All of the issuances of securities described above were restricted share issuances and deemed to be exempt from registration in reliance on Rule 506 of Regulation D and/or Section 4(a)(2) of the Securities Act as transactions by an issuer not involving a public offering. Many investors represented that they were accredited investors, as defined in Rule 501 of Regulation D and, there was no general solicitation or general advertising used to market the securities. In most cases, we made available to each investor with disclosure of all aspects of our business, including providing the investor with press releases, access to our auditors, and other financial, business, and corporate information. All securities issued were restricted with an appropriate restrictive legend on certificates issued stating that the securities have not been registered under the Securities Act and cannot be sold or otherwise transferred without an effective registration or an exemption therefrom.
If our stock is listed on an exchange we will be subject to the Securities Enforcement and Penny Stock Reform Act of 1990 requires additional disclosure relating to the market for penny stocks in connection with trades in any stock defined as a penny stock. The Commission has adopted regulations that generally define a penny stock to be any equity security that has a market price of less than $5.00 per share, subject to a few exceptions which we do not meet. Unless an exception is available, the regulations require the delivery, prior to any transaction involving a penny stock, of a disclosure schedule explaining the penny stock market and the risks associated therewith.
ITEM 6 – SELECTED FINANCIAL DATA
As a smaller reporting company we are not required to provide the information required by this Item.
ITEM 7 – MANAGEMENT'S DISCUSSION AND ANALYSIS OF FINANCIAL CONDITION AND RESULTS OF OPERATION
Forward-Looking Statements
This Annual Report on Form 10-K of Freeze Tag, Inc. for the year ended December 31, 2015 contains forward-looking statements, principally in this Section and "Business." Generally, you can identify these statements because they use words like "anticipates," "believes," "expects," "future," "intends," "plans," and similar terms. These statements reflect only our current expectations. Although we do not make forward-looking statements unless we believe we have a reasonable basis for doing so, we cannot guarantee their accuracy and actual results may differ materially from those we anticipated due to a number of uncertainties, many of which are unforeseen, including, among others, the risks we face as described in this filing. You should not place undue reliance on these forward-looking statements, which apply only as of the date of this annual report. To the extent that such statements are not recitations of historical fact, such statements constitute forward-looking statements that, by definition, involve risks and uncertainties. In any forward-looking statement where we express an expectation or belief as to future results or events, such expectation or belief is expressed in good faith and believed to have a reasonable basis, but there can be no assurance that the statement of expectation of belief will be accomplished.
| 30 |
We believe it is important to communicate our expectations to our investors. There may be events in the future; however, that we are unable to predict accurately or over which we have no control. The risk factors listed in this filing, as well as any cautionary language in this annual report, provide examples of risks, uncertainties and events that may cause our actual results to differ materially from the expectations we describe in our forward-looking statements. Factors that could cause actual results or events to differ materially from those anticipated, include, but are not limited to: distributors not accepting our games; price reductions; unforeseen delays in game production; changes in product strategies; general economic, financial and business conditions; changes in and compliance with governmental regulations; changes in various tax laws; and the availability of key management and other personnel.
Summary Overview
Freeze Tag, Inc. is a leading creator of mobile social games that are fun and engaging for all ages. Based on a free-to-play business model that has propelled games built and marketed by some of our competitors to worldwide to worldwide success, we employ state-of-the-art data analytics and proprietary technology to dynamically optimize the gaming experience for revenue generation. Players can download and enjoy our games for free, or they can purchase virtual items and additional features within the game to increase the fun factor. Our games encourage players to compete and engage with their friends on major social networks such as Facebook and Twitter.
During our most recent fiscal year ended December 31, 2015, we generated revenues of $43,968 from the sales of our games or in-app purchases in our games compared to $53,677 for the year ended December 31, 2014. Going forward, with our shift to free-to-play games, we anticipate the vast majority of our revenue in future years will be derived from consumers making in-game purchases in one of our free-to-play games and that revenue from consumers paying to download a game will be minimal.
Our business strategy is now focused on free-to-play games that require constant updates and new content to keep players engaged. Therefore, we no longer measure our success based upon the quantity of titles we launch, but rather on the metrics we receive as we monitor and try to improve upon our games in the market. We recently launched a new Apple Watch game entitled, Black Forest™: Puzzle Tiles for Watch. It was our first Apple Watch game and is a companion game to the iPad game, Black Forest™: Hidden Objects Fairy Tale Mystery. We continued our process of updating Black Forest™: Hidden Objects Fairy Tale Mystery in select countries around the world and gathering player data on retention, engagement, and monetization metrics to ensure that the game can be profitable considering the amount of money required to acquire new users to play the game. In addition, we geo-soft launched our game Kitty Pawp™: Bubble Shooter in select countries to gather player data on retention and engagement metrics.
We have also announced our intention to grow the company through acquisition. We feel that the time is right to build an alliance of mobile game developers who can become stronger and more successful by working together to build a company that can leverage market intelligence, development expertise and cross-promotional opportunities to achieve great results for our customers and shareholders.
During the year ended December 31, 2015, we generated a net loss of $1,870,677, primarily attributable to increases in cost of sales and loss on change in derivative liabilities, as described below.
| 31 |
Going Concern Uncertainty
As shown in the accompanying financial statements, we incurred net losses of $1,870,677 and $1,355,030 for the years ended December 31, 2015 and 2014, respectively. As of December 31, 2015, our accumulated deficit was $8,984,510. During the years ended December 3l, 2015 and 2014, we experienced negative cash flows from operations largely due to continued investment spending for product development of game titles for smartphones and tablets that are expected to benefit future periods. Those facts, along with our lack of access to a significant bank credit facility, create an uncertainty about our ability to continue as a going concern. Accordingly, we are currently evaluating alternatives to secure financing sufficient to support the operating requirements of its current business plan, as well as continuing to execute its business strategy of distributing game titles to digital distribution outlets, including mobile gaming app stores, online PC and Mac gaming portals, and opportunities for new devices such as tablet (mobile internet device) applications, mobile gaming platforms and international licensing opportunities.
Our ability to continue as a going concern is dependent upon our success in securing sufficient financing and in successfully executing our plans to return to positive cash flows during fiscal 2016. Our financial statements do not include any adjustments that might be necessary if we were unable to continue as a going concern.
Critical Accounting Estimates
Revenue Recognition
Our revenues are derived primarily by licensing software products in the form of online and downloadable games for PC, Mac and smartphone platforms. We distribute our products primarily through online games portals and smartphone device manufacturers ("distribution partners"), which market the games to end-users. The nature of our business is such that we sell games basically through four distribution outlets – web portals, brick and mortar retail distributors, mobile distributors and publishers, and our own web portal, www.freezetag.com. However, going forward, the majority of our revenue will be derived from mobile distribution partners such as Apple, Google and Amazon.
Product Sales (web and mobile revenues)
We recognize revenue from the sale of our products upon the transfer of title and risk of loss to our customers, and once any performance obligations have been completed. Revenue from product sales is recognized after deducting the estimated allowance for returns and price protection.
Licensing Revenues (retail revenues- royalties)
Third-party licensees distribute games under license agreements with us. We receive royalties from the licensees as a result. We recognize these royalties as revenues upon receipt of the monthly or quarterly (varies per distribution partner) revenue reports provided by the partner. Revenue from licensing/royalties is recognized after deducting the estimated allowance for returns and price protection.
Some license agreements require a royalty advance from the licensee/distributor in which case the original advance is recognized as a liability and royalty revenue is deducted from the advance as earned.
Other Revenues
Other revenues primarily include Ad game revenue and work-for-hire game related revenue. We derive our advertising game revenue from certain of our partners that offer our games free of charge to consumers in exchange for the consumers being exposed to advertising embedded in our games. In this way, we do not receive revenue for the sale of our games, but rather a percentage of the "advertising" revenue generated by these player views. This method of generating revenue is essentially the same as traditional radio or television advertising where consumers are allowed to enjoy content for "free" but are forced to watch (or listen) to advertising before, in between and at the end of the programming content.
| 32 |
Additionally, we derive some revenue from "work-for-hire" projects. Some of our partners occasionally ask us to render "work-for-hire" services for them such as preparing packaging materials. For example, a retail game and DVD publisher hired us to create several designs for printed packages that were used for games published by the publisher but not developed by us. For this work, we charge a one-time, fixed fee for each package design.
We recognize this revenue once all performance obligations have been completed. In addition, persuasive evidence of an arrangement must exist and collection of the related receivable must be probable.
We recognize revenue in accordance with current accounting standards when an arrangement exists, delivery has occurred, the price is fixed and determinable, and collectability is probable.
Cash and Cash Equivalents
For purposes of the Statement of Cash Flows, we consider liquid investments with an original maturity of three months or less to be cash equivalents. We place our cash and cash equivalents with large commercial banks. The Federal Deposit Insurance Corporation ("FDIC") insures these balances, up to $250,000. All of our cash balances at December 31, 2015 and December 31, 2014 were insured. At December 31, 2015 and 2014, there were no cash equivalents.
Allowances for Returns, Price Protection, and Doubtful Accounts
Because the majority of our business is derived through online portals (such as Big Fish Games) and wireless online app stores (such as Apple), there is no physical product, other than the downloadable bits of our games that is involved in the customer purchase. In the digital environment, the customer cannot 'return' a digital download product. Therefore, there are no returns. The customer can ask for a refund of a digital product, and if there are any, then they are reconciled or netted out by our distribution partners before we receive the corresponding payments and royalty statements. As such, we do not allow for returns, bad debts or price protection of digital download products.
However, we derive a small portion of our revenues from sales of physical packaged software for personal computers through distribution partners who sell through traditional retail channels. Product revenue is recognized net of allowances for price protection and returns and various customer discounts. Our distribution partners who sell to retailers may allow returns for our packaged personal computer products; these partners may decide to provide price protection or allow returns for personal computer products after they analyze: (1) inventory remaining in the retail channel, (2) the rate of inventory sell-through in the retail channel, and (3) the remaining inventory on hand of our games. To allow for these returns, price protection and various customer discounts, some of our distribution partners who sell to retailers will hold back a percentage of our revenue. These "hold-back" amounts, typically a percentage of revenue, are then reconciled on a quarterly basis and detailed on the statements we receive from our distribution partners. As of December 31, 2015 and 2014, the allowance for doubtful accounts was $5,600.
Property and Equipment
Property and equipment are recorded at cost and are depreciated using the straight-line method over the estimated useful lives of the related assets. All assets are currently depreciated over 3 years. Maintenance and repairs are charged to expense as incurred. Renewals and improvements of a major nature are capitalized. At the time of retirement or other disposition of property and equipment, the cost and accumulated depreciation are removed from the accounts, and any resulting gains or losses are reflected in the statement of operations.
| 33 |
Concentrations of Credit Risk, Major Customers and Major Vendors
Our customers are the end-consumers that purchase its games from the websites where we have our games listed for sale. Therefore, we do not have any individual customers that represent any more than a fraction of its revenue. However, we do have primary distribution partners, which are the owners of the websites where it sells its games. Under our distribution agreements we are not obligated to make, distribute or sell any games. However, for any games we do make and wish to distribute we can list them on one or more of these websites under a revenue sharing arrangement where we shares the revenue from any of our games that sell. The sharing arrangement varies greatly depending on the distributor with the Company generally keeping between 35% and 70% of the revenue and the distributor keeping the remainder of the revenue generated by each sale. At times we enter into "exclusivity options" whereby if a distributor wishes to have an exclusive period carrying our games (normally 30-90 days) we will agree to that in exchange for the distributor marketing the game in their newsletter and other marketing programs. Due to the fact we have a number of distribution partners and a variety of different websites where we can sell our games, we are not substantially dependent on any of our distribution partners or agreements. In addition to the distribution agreements, we currently have licensing agreements with Ohio Art Company and CMG Worldwide, which allow us to develop and distribute games around third party intellectual property in exchange for paying royalty payments. We are not substantially dependent on either of those licensing agreements.
For the year ended December 31, 2015, our primary distributors that represented 10% or more of our revenues were: Big Fish Games – 23.67%, Wired Media – 22.74%, Apple – 18.08% and S.A.D. – 13.51%. For the year ended December 31, 2014, our primary distributors that represented 10% or more of our revenues were: Big Fish Games – 25.29%, RealNetworks – 18.90%, Exent – 13.35%, Apple – 11.53% and Amazon – 11.01%.
At December 31, 2015, our primary distributors and partners that represented 10% or more of our accounts receivable were: Apple – 16.93%, Big Fish Games – 10.00% and Exent – 48.81%%. At December 31, 2014, our primary distributors and partners that represented 10% or more of our accounts receivable were: Exent – 71.43%.
Income Taxes
We account for income taxes using ASC Topic 740, Income Taxes. Under ASC Topic 740, income taxes are accounted for under the asset and liability method. Deferred tax assets and liabilities are recognized for the future tax consequences attributable to differences between the financial statement carrying amounts of existing assets and liabilities and their respective tax bases and operating loss and tax credit carry forwards. Deferred tax assets and liabilities are measured using enacted tax rates expected to apply to taxable income in the years in which those temporary differences are expected to be recovered or settled. The effect on deferred tax assets and liabilities of a change in tax rates is recognized in income in the period that includes the enactment date.
ASC Topic 740 includes accounting guidance which clarifies the accounting for the uncertainty in recognizing income taxes in an organization by providing detailed guidance for financial statement recognition, measurement and disclosure involving uncertain tax positions. This guidance requires an uncertain tax position to meet a more-likely-than-not recognition threshold at the effective date to be recognized both upon the adoption of the related guidance and in subsequent periods.
We have no uncertain tax positions at any of the dates presented.
Foreign Currency Translation
We derive a portion of our revenue from foreign countries, which report to us in foreign currency, but pay in U.S. Dollars. Because of the fluctuations between the reporting time and the payment period (up to 60 days), it is necessary to make adjustments to our accounting records. These adjustments are recorded under a Foreign Currency Translation expense account, and shown in the Statement of Operations as a General & Administrative expense.
| 34 |
Accounting for Stock-Based Compensation
We account for stock-based compensation in accordance with ASC Topic 718-10, Compensation-Stock Compensation and ASC Subtopic 505-50, Equity-Based Payments to Non-Employees ("ASC stock-based compensation guidance"). Stock-based compensation expense recognized during the requisite services period is based on the value of share-based payment awards after reduction for estimated forfeitures. Forfeitures are estimated at the time of grant and are revised, if necessary, in subsequent periods if actual forfeitures differ from those estimates.
We did not have any stock-based compensation expense recognized in its statements of operations for the years ended December 31, 2015 and 2014.
Impairment of Long-Lived Assets
We have adopted Accounting Standards Codification subtopic 360-10, Property, Plant and Equipment ("ASC 360-10"). ASC 360-10 requires that long-lived assets and certain identifiable intangibles held and used by us be reviewed for impairment whenever events or changes in circumstances indicate that the carrying amount of an asset may not be recoverable. We evaluate our long-lived assets for impairment annually or more often if events and circumstances warrant. Events relating to recoverability may include significant unfavorable changes in business conditions, recurring losses or a forecasted inability to achieve break-even operating results over an extended period. We evaluate the recoverability of long-lived assets based upon forecasted undiscounted cash flows. Should impairment in value be indicated, the carrying value of long-lived assets will be adjusted, based on estimates of future discounted cash flows resulting from the use and ultimate disposition of the asset. ASC 360-10 also requires assets to be disposed of be reported at the lower of the carrying amount or the fair value less costs to sell.
Fair Value of Financial Instruments
Effective January 1, 2009, we adopted Accounting Standards Codification subtopic 820-10, Fair Value Measurements and Disclosures ("ASC 820-10") and Accounting Standards Codification subtopic 825-10, Financial Instruments ("ASC 825-10"), which permits entities to choose to measure many financial instruments and certain other items at fair value. Neither of these statements had an impact on our financial position, results of operations or cash flows. The carrying value of cash and cash equivalents, accounts payable, accrued expenses and notes payable, as reflected in the balance sheets, approximate fair value because of the short-term maturity of these instruments.
Inputs used in the valuation to derive fair value are classified based on a fair value hierarchy which distinguishes between assumptions based on market data (observable inputs) and an entity's own assumptions (unobservable inputs). The hierarchy consists of three levels:
| · | Level one — Quoted market prices in active markets for identical assets or liabilities; |
|
|
|
| · | Level two — Inputs other than level one inputs that are either directly or indirectly observable; and |
|
|
|
| · | Level three — Unobservable inputs developed using estimates and assumptions, which are developed by the reporting entity and reflect those assumptions that a market participant would use. |
Determining the category in which an asset or liability falls within the hierarchy requires significant judgment. The Company evaluates its hierarchy disclosures each period.
| 35 |
The following tables provide a summary of the fair values of assets and liabilities measured on a non-recurring basis at December 31, 2015 and 2014:
2015 |
| Total |
|
| Level 1 |
|
| Level 2 |
|
| Level 3 |
|
| Losses |
| ||||||
|
|
|
|
|
|
|
|
|
|
|
|
|
|
|
| ||||||
Derivative liabilities |
| $ | 841,677 |
|
| $ | - |
|
| $ | - |
|
| $ | 841,677 |
|
| $ | 106,543 |
| |
2014 |
| Total |
|
| Level 1 |
|
| Level 2 |
|
| Level 3 |
|
| Losses |
| |||||
|
|
|
|
|
|
|
|
|
|
|
|
|
|
| ||||||
Derivative liabilities |
| $ | 438,374 |
|
| $ | - |
|
| $ | - |
|
| $ | 438,374 |
|
| $ | (241,154 | ) |
Use of Estimates
The preparation of financial statements and related disclosures in conformity with U.S. generally accepted accounting principles ("U.S. GAAP") requires our management to make judgments, assumptions and estimates that affect the amounts reported in its consolidated financial statements and accompanying notes. Management bases its estimates on historical experience and on various other assumptions it believes to be reasonable under the circumstances, the results of which form the basis for making judgments about the carrying values of assets and liabilities. Actual results may differ from these estimates and these differences may be material.
Research and Development Costs
We charge costs related to research & development of products to general and administrative expense as incurred. The types of costs included in research and development expenses include research materials, salaries, contractor fees, and support materials.
Intellectual Property Licenses (Prepaid Royalties)
Intellectual property license costs represent license fees paid to intellectual property rights holders for use of their trademarks or copyrights in the development of the Company's products. Intellectual property license costs represent license fees paid to intellectual property rights holders for use of their trademarks, copyrights, software, technology, music or other intellectual property or proprietary rights in the development of our products. Depending upon the agreement with the rights holder, we may obtain the rights to use acquired intellectual property in multiple products over multiple years, or alternatively, for a single product. Minimum guaranteed royalty payments for intellectual property licenses are initially recorded as an asset (prepaid royalties or prepaid licensing fees), and a current liability, (accrued royalties payable) at the contractual amount upon execution of the contract when no significant performance remains with the licensor. Commencing upon the related product's release date, intellectual property licenses costs are amortized to "Cost of Sales – Licensing" based upon the percentage of revenue outlined in the contract with each specific licensor. Generally, our intellectual property licensing contracts call for licensors to be paid a percentage of revenue actually received by us, with allowances for minimum guarantees. Sometimes, the terms of the specific licensing contracts allow for us to re-capture expenses before licensing out royalties are calculated.
Capitalized intellectual property costs for those products that are cancelled or abandoned are charged to product development expense in the period of cancellation.
As of December 31, 2015 and 2014, prepaid royalties (or prepaid licensing fees) were $4,507 and $4,936, respectively.
| 36 |
Recent Accounting Pronouncements
In May 2014, the FASB issued ASU 2014-09, "Revenue from Contracts with Customers (Topic 606)". ASU 2014-09 amends the guidance for revenue recognition to replace numerous, industry-specific requirements and converges areas under this topic with those of the International Financial Reporting Standards. The ASU implements a five-step process for customer contract revenue recognition that focuses on transfer of control, as opposed to transfer of risk and rewards. The amendment also requires enhanced disclosures regarding the nature, amount, timing and uncertainty of revenues and cash flows from contracts with customers. Other major provisions include the capitalization and amortization of certain contract costs, ensuring the time value of money is considered in the transaction price, and allowing estimates of variable consideration to be recognized before contingencies are resolved in certain circumstances. The amendments in this ASU are effective for reporting periods beginning after December 15, 2016; however, in July 2015, the FASB agreed to delay the effective date by one year. The proposed deferral may permit early adoption, but would not allow adoption any earlier than the original effective date of the standard. Entities can transition to the standard either retrospectively or as a cumulative-effect adjustment as of the date of adoption. We are currently assessing the impact the adoption of ASU 2014-09, including possible transition alternatives, will have on our financial statements.
In February 2016, the FASB issued ASU No. 2016-02, "Leases (Topic 842)". The amendments in this ASU revise the accounting related to lessee accounting. Under the new guidance, lessees will be required to recognize a lease liability and a right-of-use asset for all leases. The new lease guidance also simplifies the accounting for sale and leaseback transactions primarily because lessees must recognize lease assets and lease liabilities. The amendments in this ASU are effective for public companies for fiscal years beginning after December 15. 2018 and are to be applied through a modified retrospective transition approach for leases existing at, or entered into after, the beginning of the earliest comparative period presented in the financial statements. Early adoption is permitted. We are currently unable to determine the impact on our financial statements of the adoption of this new accounting pronouncement.
Results of Operations for the Year Ended December 31, 2015 Compared to the Year Ended December 31, 2014
Revenues
Our revenues decreased $9,709 to $43,968 for the year ended December 31, 2015 from $53,677 for the year ended December 31, 2014. Our revenues decreased due to our focused efforts on building games in the free-to-play game genre. Previously, the majority of our released game titles were "pay-per-download", where the consumer paid to download the game onto their device, leading to revenue per download. Now our games are free to download and play, but have built-in features that require the consumer to pay if they want to access the feature, which means our revenue is tied to when the consumer pays to access the features, if they do. Our revenue can typically fluctuate based on when we release our games and the popularity of the games we release.
Our strategy was to release games more frequently during 2015. We recently launched Black Forest™: Puzzle Tiles for Watch (Apple Watch), and we continued our soft launch of Black Forest: Hidden Objects Fairy Tale Mystery in specific geographic territories. In addition, we continued development on Etch A Sketch, with a major update in new content launched in the fourth quarter of 2015. Lastly, we geo-soft launched Kitty Pawp™: Bubble Shooter in select countries and began acquiring users to gather player data on retention and engagement metrics.
| 37 |
Operating Costs and Expenses
Our cost of sales increased $203,278 to $43,968 for the year ended December 31, 2015 from $165,768 for the year ended December 31, 2014. Our cost of sales includes royalties, subcontractors and internal costs of programming, analytics, and design. The increase in cost of sales is due primarily to the increase in programming costs for recent game launches, including Black Forest, Etch A Sketch and Kitty Pawp™.
Our selling, general and administrative expenses remained somewhat constant, decreasing $15,079 to $551,209 for the year ended December 31, 2015 from $566,288 for the year ended December 31, 2014.
Our depreciation and amortization expense decreased $12,429 to $0 for the year ended December 31, 2015 from $12,429 for the year ended December 31, 2014. The decrease in depreciation and amortization in 2015 was due to our property and equipment being fully depreciated and not owning technology subject to amortization.
Other Income (Expense)
Our interest expense decreased $16,364 to $887,447 for the year ended December 31, 2015 from $903,811 for the year ended December 31, 2014. During the year ended December 31, 2015, we significantly increased our convertible debt and the related debt discount that is amortized to interest expense. However, the increased interest expense attributable to the new debt was offset by decreased interest expense attributable to prior years' debt resulting from debt discount being fully amortized in 2015.
Our estimate of the fair value of the derivative liability for the conversion feature of our convertible notes payable is based on multiple inputs, including the market price of our stock, interest rates, our stock price volatility, and variable conversion prices based on market prices as defined in the respective loan agreements. These inputs are subject to significant changes from period to period; therefore, the estimated fair value of the derivative liability will fluctuate from period to period and the fluctuation may be material. We reported a loss on change in derivative liabilities of $106,543 for the year ended December 31, 2015 and a gain on change in derivative liabilities of $241,154 for the year ended December 31, 2014.
Provision for Income Taxes
Currently our provision for income taxes is not material to our operations, and is comprised of minimum state income taxes.
Net Loss
As a result of the above, our net loss increased to $1,870,677 for the year ended December 31, 2015 from $1,355,030 for the year ended December 31, 2014.
| 38 |
Liquidity and Capital Resources
Introduction
As of December 31, 2015, we had current assets of $51,805 and current liabilities of $4,869,673, resulting in a working capital deficit and total stockholders' deficit of $4,817,868. In addition, we had an accumulated deficit of $8,984,510 at December 31, 2015.
During the year ended December 31, 2015, because of our operating losses, we did not generate positive operating cash flows. Our cash balance as of December 31, 2015 was $42,052, and our monthly cash flow burn rate is approximately $55,000. As a result, we have significant short-term cash needs. These needs are currently being satisfied primarily from the proceeds from short-term convertible debt. We intend to raise additional capital through the issuance of debt from third parties and other related parties until such time as our cash flows from operations will satisfy our cash flow needs. There can be no assurance that we will be successful in these efforts.
Sources and Uses of Cash
We used net cash of $865,636 in operating activities for the year ended December 31, 2015 as a result of our net loss of $1,870,677, decrease in accrued expenses of $3,303 and a decrease in unearned royalties of $7,466, partially offset by non-cash expenses totaling $725,378, decreases in accounts receivable, net of $11,693 and prepaid expenses and other current assets of $2,996, and increases in accounts payable of $8,013, accrued interest payable – related party of $145,412 and accrued interest payable of $122,318.
By comparison, we used net cash of $675,159 in operating activities for the year ended December 31, 2014 as a result of our net loss of $1,355,030, non-cash gain of $241,154, an increase in prepaid and other current assets of $61, and a decrease in unearned royalties of $9,447, partially offset by non-cash expenses totaling $728,727, decreases in accounts receivable, net of $1,512 and other assets of $319, and increases in accounts payable of $8,849, accrued expenses of $3,620 and accrued interest payable of $187,506.
We had no net cash provided by or used in investing activities for the years ended December 31, 2015 and 2014.
We had net cash provided by financing activities of $893,000 and $650,000 for the years ended December 31, 2015 and 2014, respectively, comprised of borrowings of debt – proceeds from the issuance of short-term convertible notes payable to non-related parties.
Debt Instruments, Guarantees, and Related Covenants
We have no disclosures required by this item.
ITEM 7A – QUANTITATIVE AND QUALITATIVE DISCLOSURES ABOUT MARKET RISK
As a smaller reporting company we are not required to provide the information required by this Item.
| 39 |
ITEM 8 – FINANCIAL STATEMENTS AND SUPPLEMENTARY DATA
FREEZE TAG, INC.
INDEX TO FINANCIAL STATEMENTS
Report of Independent Registered Public Accounting Firm |
| F-1 |
|
|
|
|
|
Balance Sheets as of December 31, 2015 and 2014 |
| F-2 |
|
|
|
|
|
Statements of Operations for the Years Ended December 31, 2015 and 2014 |
| F-3 |
|
|
|
|
|
Statements of Stockholders' Deficit for the Years Ended December 31, 2015 and 2014 |
| F-4 |
|
|
|
|
|
Statements of Cash Flows for the Years Ended December 31, 2015 and 2014 |
| F-5 |
|
|
|
|
|
Notes to Financial Statements |
| F-6 |
|
| 40 |
REPORT OF INDEPENDENT REGISTERED PUBLIC ACCOUNTING FIRM
To the Board of Directors and
Shareholders of Freeze Tag, Inc.
We have audited the accompanying balance sheets of Freeze Tag, Inc. ("the "Company") as of December 31, 2015 and 2014 and the related statements of operations, cash flows and shareholders' equity for the years then ended. These financial statements are the responsibility of the Company's management. Our responsibility is to express an opinion on these financial statements based on our audits.
We conducted our audits in accordance with standards of the Public Company Accounting Oversight Board (United States). Those standards require that we plan and perform the audit to obtain reasonable assurance about whether the financial statements are free of material misstatement. The Company is not required to have, nor were we engaged to perform, an audit of its internal control over financial reporting. Our audits included consideration of internal control over financial reporting as a basis for designing audit procedures that are appropriate in the circumstances, but not for the purpose of expressing an opinion on the effectiveness of the Company's internal control over financial reporting. Accordingly, we express no such opinion. An audit includes examining, on a test basis, evidence supporting the amounts and disclosures in the financial statements, assessing the accounting principles used and significant estimates made by management, as well as evaluating the overall financial statement presentation. We believe that our audits provide a reasonable basis for our opinion.
In our opinion, the financial statements referred to above present fairly, in all material respects, the financial position of Freeze Tag, Inc. as of December 31, 2015 and 2014, and the results of its operations and its cash flows for the years then ended in conformity with U.S. generally accepted accounting principles.
The accompanying financial statements have been prepared assuming that the Company will continue as a going concern. As discussed in Note 3 to the financial statements, the Company has insufficient working capital and reoccurring losses from operations, all of which raises substantial doubt about its ability to continue as a going concern. Management's plans regarding those matters also are described in Note 3. The financial statements do not include any adjustments that might result from the outcome of this uncertainty.
/s/ M&K CPAS, PLLC | |
www.mkacpas.com | |
Houston, Texas | |
March 30, 2016 |
| F-1 |
FREEZE TAG, INC.
(A DELAWARE CORPORATION)
BALANCE SHEETS
| December 31, |
| ||||||
| 2015 |
|
| 2014 |
| |||
|
|
|
|
|
| |||
ASSETS | ||||||||
|
|
|
|
|
| |||
Current assets: |
|
|
|
|
|
| ||
Cash |
| $ | 42,052 |
|
| $ | 14,688 |
|
Accounts receivable, net of allowance of $5,600 |
|
| 4,504 |
|
|
| 16,197 |
|
Prepaid expenses and other current assets |
|
| 5,249 |
|
|
| 8,245 |
|
Total current assets |
|
| 51,805 |
|
|
| 39,130 |
|
|
|
|
|
|
|
|
| |
Total assets |
| $ | 51,805 |
|
| $ | 39,130 |
|
|
|
|
|
|
|
|
| |
LIABILITIES AND STOCKHOLDERS' DEFICIT | ||||||||
|
|
|
|
|
|
|
| |
Current liabilities: |
|
|
|
|
|
|
|
|
Accounts payable |
| $ | 124,163 |
|
| $ | 116,150 |
|
Accrued expenses |
|
| 492,012 |
|
|
| 495,315 |
|
Accrued interest payable – related party |
|
| 209,461 |
|
|
| 68,106 |
|
Accrued interest payable |
|
| 154,925 |
|
|
| 41,385 |
|
Unearned royalties |
|
| 195,033 |
|
|
| 202,499 |
|
Convertible notes payable, related party |
|
| 1,447,041 |
|
|
| 1,456,254 |
|
Convertible notes payable, net of discount of $180,208 and $343,902, respectively |
|
| 1,405,361 |
|
|
| 412,841 |
|
Derivative liabilities |
|
| 841,677 |
|
|
| 438,374 |
|
Total current liabilities |
|
| 4,869,673 |
|
|
| 3,230,924 |
|
|
|
|
|
|
|
|
| |
Total liabilities |
|
| 4,869,673 |
|
|
| 3,230,924 |
|
|
|
|
|
|
|
|
| |
Commitments and contingencies |
|
|
|
|
|
|
|
|
|
|
|
|
|
|
|
| |
Stockholders' deficit: |
|
|
|
|
|
|
|
|
Preferred stock; $0.001 par value, 10,000,000 shares authorized, no shares issued and outstanding |
|
| - |
|
|
| - |
|
Common stock; $0.00001 par value, 2,000,000,000 shares authorized, 280,442,125 and 184,518,250 shares issued and outstanding, respectively |
|
| 2,804 |
|
|
| 1,845 |
|
Additional paid-in capital |
|
| 4,147,038 |
|
|
| 3,903,394 |
|
Common stock payable |
|
| 16,800 |
|
|
| 16,800 |
|
Accumulated deficit |
|
| (8,984,510 | ) |
|
| (7,113,833 | ) |
Total stockholders' deficit |
|
| (4,817,868 | ) |
|
| (3,191,794 | ) |
|
|
|
|
|
|
|
| |
Total liabilities and stockholders' deficit |
| $ | 51,805 |
|
| $ | 39,130 |
|
The accompanying notes are an integral part of the financial statements
| F-2 |
FREEZE TAG, INC.
(A DELAWARE CORPORATION)
STATEMENTS OF OPERATIONS
| Years Ended December 31, |
| ||||||
| 2015 |
|
| 2014 |
| |||
|
|
|
|
|
| |||
Revenues |
| $ | 43,968 |
|
| $ | 53,677 |
|
|
|
|
|
|
|
|
| |
Operating costs and expenses: |
|
|
|
|
|
|
|
|
Cost of sales |
|
| 369,046 |
|
|
| 165,768 |
|
Selling, general and administrative expenses |
|
| 551,209 |
|
|
| 566,288 |
|
Depreciation and amortization expense |
|
| - |
|
|
| 12,429 |
|
|
|
|
|
|
|
|
| |
Total operating costs and expenses |
|
| 920,255 |
|
|
| 744,485 |
|
|
|
|
|
|
|
|
| |
Loss from operations |
|
| (876,287 | ) |
|
| (690,808 | ) |
|
|
|
|
|
|
|
| |
Other income (expense): |
|
|
|
|
|
|
|
|
Interest expense, net |
|
| (887,447 | ) |
|
| (903,811 | ) |
Gain (loss) on change in derivative liabilities |
|
| (106,543 | ) |
|
| 241,154 |
|
|
|
|
|
|
|
|
| |
Total other income (expense) |
|
| (993,990 | ) |
|
| (662,657 | ) |
|
|
|
|
|
|
|
| |
Loss before income taxes |
|
| (1,870,277 | ) |
|
| (1,353,465 | ) |
Provision for income taxes |
|
| (400 | ) |
|
| (1,565 | ) |
|
|
|
|
|
|
|
| |
Net loss |
| $ | (1,870,677 | ) |
| $ | (1,355,030 | ) |
|
|
|
|
|
|
|
| |
Weighted average number of common shares outstanding – basic and diluted |
|
| 238,762,747 |
|
|
| 116,049,114 |
|
|
|
|
|
|
|
|
| |
Loss per common share – basic and diluted |
| $ | (0.01 | ) |
| $ | (0.01 | ) |
The accompanying notes are an integral part of the financial statements
| F-3 |
FREEZE TAG, INC.
(A DELAWARE CORPORATION)
STATEMENTS OF STOCKHOLDERS' DEFICIT
Years Ended December 31, 2015 and 2014
|
|
|
|
|
|
|
| Additional |
|
| Preferred Stock |
|
|
|
|
| Accumulated |
|
|
|
| |||||||||||||||
|
| Shares |
|
| Amount |
|
| Shares |
|
| Amount |
|
| Capital |
|
| Party |
|
| Payable |
|
| Deficit |
|
| Total |
| |||||||||
|
|
|
|
|
|
|
|
|
|
|
|
|
|
|
|
|
|
|
|
|
|
|
|
|
|
| ||||||||||
Balance, December 31, 2013 |
|
| - |
|
| $ | - |
|
|
| 99,938,817 |
|
| $ | 999 |
|
| $ | 3,833,502 |
|
| $ | 30,700 |
|
| $ | 16,800 |
|
| $ | (5,758,803 | ) |
| $ | (1,876,802 | ) |
|
|
|
|
|
|
|
|
|
|
|
|
|
|
|
|
|
|
|
|
|
|
|
|
|
|
|
|
|
|
|
|
|
|
|
|
|
Issuance and retirement of preferred stock for preferred stock payable |
|
| - |
|
|
| - |
|
|
| - |
|
|
| - |
|
|
| 30,700 |
|
|
| (30,700 | ) |
|
| - |
|
|
| - |
|
|
| - |
|
Issuance of common stock for conversion of debt |
|
| - |
|
|
| - |
|
|
| 4,919,735 |
|
|
| 50 |
|
|
| 14,312 |
|
|
| - |
|
|
| - |
|
|
| - |
|
|
| 14,362 |
|
Issuance of common stock for conversion of related party debt |
|
| - |
|
|
| - |
|
|
| 39,829,849 |
|
|
| 398 |
|
|
| 37,440 |
|
|
| - |
|
|
| - |
|
|
| - |
|
|
| 37,838 |
|
Issuance of common stock for conversion of related party debt |
|
| - |
|
|
| - |
|
|
| 39,829,849 |
|
|
| 398 |
|
|
| 37,440 |
|
|
| - |
|
|
| - |
|
|
| - |
|
|
| 37,838 |
|
Beneficial conversion feature |
|
| - |
|
|
| - |
|
|
| - |
|
|
| - |
|
|
| (50,000 | ) |
|
| - |
|
|
| - |
|
|
| - |
|
|
| (50,000 | ) |
Net loss |
|
| - |
|
|
| - |
|
|
| - |
|
|
| - |
|
|
| - |
|
|
| - |
|
|
| - |
|
|
| (1,355,030 | ) |
|
| (1,355,030 | ) |
|
|
|
|
|
|
|
|
|
|
|
|
|
|
|
|
|
|
|
|
|
|
|
|
|
|
|
|
|
|
|
|
|
|
|
|
|
Balance, December 31, 2014 |
|
| - |
|
|
| - |
|
|
| 184,518,250 |
|
|
| 1,845 |
|
|
| 3,903,394 |
|
|
| - |
|
|
| 16,800 |
|
|
| (7,113,833 | ) |
|
| (3,191,794 | ) |
|
|
|
|
|
|
|
|
|
|
|
|
|
|
|
|
|
|
|
|
|
|
|
|
|
|
|
|
|
|
|
|
|
|
|
| |
Issuance of common stock for conversion of debt |
|
| - |
|
|
| - |
|
|
| 70,648,155 |
|
|
| 706 |
|
|
| 230,627 |
|
|
| - |
|
|
| - |
|
|
| - |
|
|
| 231,333 |
|
Issuance of common stock for conversion of related party debt |
|
| - |
|
|
| - |
|
|
| 25,275,720 |
|
|
| 253 |
|
|
| 13,017 |
|
|
| - |
|
|
| - |
|
|
| - |
|
|
| 13,270 |
|
Net loss |
|
| - |
|
|
| - |
|
|
| - |
|
|
| - |
|
|
| - |
|
|
| - |
|
|
| - |
|
|
| (1,870,677 | ) |
|
| (1,870,677 | ) |
|
|
|
|
|
|
|
|
|
|
|
|
|
|
|
|
|
|
|
|
|
|
|
|
|
|
|
|
|
|
|
|
|
|
|
|
|
Balance, December 31, 2015 |
|
| - |
|
| $ | - |
|
|
| 280,442,125 |
|
| $ | 2,804 |
|
| $ | 4,147,038 |
|
| $ | - |
|
| $ | 16,800 |
|
| $ | (8,984,510 | ) |
| $ | (4,817,868 | ) |
See accompanying notes to consolidated financial statements.
| F-4 |
FREEZE TAG, INC.
(A DELAWARE CORPORATION)
STATEMENTS OF CASH FLOWS
| Years Ended December 31, |
| ||||||
| 2015 |
|
| 2014 |
| |||
Cash flows from operating activities: |
|
|
|
|
|
| ||
Net loss |
| $ | (1,870,677 | ) |
| $ | (1,355,030 | ) |
Adjustments to reconcile net loss to net cash used by operating activities: |
|
|
|
|
|
|
|
|
Amortization of debt discount to interest expense |
|
| 618,835 |
|
|
| 716,298 |
|
(Gain) loss on change in derivative liabilities |
|
| 106,543 |
|
|
| (241,154 | ) |
Depreciation and amortization expense |
|
| - |
|
|
| 12,429 |
|
Changes in operating assets and liabilities: |
|
|
|
|
|
|
|
|
Accounts receivable, net |
|
| 11,693 |
|
|
| 1,512 |
|
Prepaid expenses and other current assets |
|
| 2,996 |
|
|
| (61 | ) |
Other assets |
|
| - |
|
|
| 319 |
|
Accounts payable |
|
| 8,013 |
|
|
| 8,849 |
|
Accrued expenses |
|
| (3,303 | ) |
|
| 3,620 |
|
Accrued interest payable – related party |
|
| 145,412 |
|
|
| 145,888 |
|
Accrued interest payable |
|
| 122,318 |
|
|
| 41,618 |
|
Unearned royalties |
|
| (7,466 | ) |
|
| (9,447 | ) |
|
|
|
|
|
|
|
| |
Net cash used by operating activities |
|
| (865,636 | ) |
|
| (675,159 | ) |
|
|
|
|
|
|
|
| |
Cash flows from investing activities |
|
| - |
|
|
| - |
|
|
|
|
|
|
|
|
| |
Net cash provided by investing activities |
|
| - |
|
|
| - |
|
|
|
|
|
|
|
|
| |
Cash flows from financing activities: |
|
|
|
|
|
|
|
|
Borrowings of debt |
|
| 893,000 |
|
|
| 650,000 |
|
|
|
|
|
|
|
|
| |
Net cash provided by financing activities |
|
| 893,000 |
|
|
| 650,000 |
|
|
|
|
|
|
|
|
| |
Net increase (decrease) in cash |
|
| 27,364 |
|
|
| (25,159 | ) |
Cash at the beginning of the year |
|
| 14,688 |
|
|
| 39,847 |
|
|
|
|
|
|
|
|
| |
Cash at the end of the year |
| $ | 42,052 |
|
| $ | 14,688 |
|
|
|
|
|
|
|
|
|
|
Non-cash transactions: |
|
|
|
|
|
| ||
Conversion of related party debt and accrued interest to common shares |
| $ | 13,270 |
|
| $ | 75,676 |
|
Conversion of debt and accrued interest to common shares |
| $ | 72,952 |
|
| $ | 14,362 |
|
Conversion of accrued interest to convertible debt – related party |
| $ | - |
|
| $ | 72,107 |
|
Issuance and retirement of preferred shares for preferred stock payable |
| $ | - |
|
| $ | 30,700 |
|
Beneficial conversion feature |
| $ | - |
|
| $ | 50,000 |
|
Debt discount due to derivative liabilities |
| $ | 455,141 |
|
| $ | 638,806 |
|
The accompanying notes are an integral part of the financial statements
| F-5 |
FREEZE TAG, INC.
(A DELAWARE CORPORATION)
NOTES TO FINANCIAL STATEMENTS
Year Ended December 31, 2015
NOTE 1 – THE COMPANY AND NATURE OF BUSINESS
Freeze Tag, Inc. (the "Company") is a leading creator of mobile social games that are fun and engaging for all ages. Based on a free-to-play business model that has propelled games like Candy Crush Saga to worldwide success, the Company employs state-of-the-art data analytics and proprietary technology to dynamically optimize the gaming experience for revenue generation. Players can download and enjoy the Company's games for free, or they can purchase virtual items and additional features within the game to increase the fun factor. Our games encourage players to compete and engage with their friends on major social networks such as Facebook and Twitter.
NOTE 2 – SUMMARY OF SIGNIFICANT ACCOUNTING POLICIES
Revenue Recognition
The Company's revenues are derived primarily by licensing software products in the form of online and downloadable games for PC, Mac and smartphone platforms. The Company distributes its products primarily through online games portals and smartphone device manufacturers ("distribution partners"), which market the games to end-users. The nature of our business is such that we sell games basically through four distribution outlets – web portals, brick and mortar retail distributors, mobile distributors and publishers, and our own web portal, www.freezetag.com.
Product Sales (web and mobile revenues)
The Company recognizes revenue from the sale of our products upon the transfer of title and risk of loss to its customers, and once any performance obligations have been completed. Revenue from product sales is recognized after deducting the estimated allowance for returns and price protection.
Licensing Revenues (retail revenues- royalties)
Third-party licensees distribute games under license agreements with the Company. We receive royalties from the licensees as a result. We recognize these royalties as revenues upon receipt of the monthly or quarterly (varies per distribution partner) revenue reports provided by the partner. Revenue from licensing/royalties is recognized after deducting the estimated allowance for returns and price protection.
Some license agreements require a royalty advance from the licensee/distributor in which case the original advance is recognized as a liability and royalty revenue is deducted from the advance as earned.
Other Revenues
Other revenues primarily include Ad game revenue and work-for-hire game related revenue. We derive our advertising game revenue from certain of our partners that offer our games free of charge to consumers in exchange for the consumers being exposed to advertising embedded in our games. In this way, we do not receive revenue for the sale of our games, but rather a percentage of the "advertising" revenue generated by these player views. This method of generating revenue is essentially the same as traditional radio or television advertising where consumers are allowed to enjoy content for "free" but are forced to watch (or listen) to advertising before, in between and at the end of the programming content.
Additionally, we derive some revenue from "work-for-hire" projects. Some of our partners occasionally ask us to render "work-for-hire" services for them such as preparing packaging materials. For example, a retail game and DVD publisher hired us to create several designs for printed packages that were used for games published by the publisher but not developed by us. For this work, we charge a one-time, fixed fee for each package design.
| F-6 |
The Company recognizes this revenue once all performance obligations have been completed. In addition, persuasive evidence of an arrangement must exist and collection of the related receivable must be probable.
The Company recognizes revenue in accordance with current accounting standards when an arrangement exists, delivery has occurred, the price is fixed and determinable, and collectability is probable.
Cash and Cash Equivalents
For purposes of the Statement of Cash Flows, the Company considers liquid investments with an original maturity of three months or less to be cash equivalents. The Company places its cash and cash equivalents with large commercial banks. The Federal Deposit Insurance Corporation ("FDIC") insures these balances, up to $250,000. All of the Company's cash balances at December 31, 2015 and December 31, 2014 were insured. At December 31, 2015 and December 31, 2014 there were no cash equivalents.
Allowances for Returns, Price Protection, and Doubtful Accounts
Because the majority of the Company's business is derived through online portals (such as Big Fish Games) and wireless online app stores (such as Apple), there is no physical product, other than the downloadable bits of our games that is involved in the customer purchase. In the digital environment, the customer cannot 'return' a digital download product. Therefore, there are no returns. The customer can ask for a refund of a digital product, and if there are any, then they are reconciled or netted out by our distribution partners before we receive the corresponding payments and royalty statements. As such, we do not allow for returns, bad debts or price protection of digital download products.
However, the Company derives a small portion of our revenues from sales of physical packaged software for personal computers through distribution partners who sell through traditional retail channels. Product revenue is recognized net of allowances for price protection and returns and various customer discounts. Our distribution partners who sell to retailers may allow returns for our packaged personal computer products; these partners may decide to provide price protection or allow returns for personal computer products after they analyze: (1) inventory remaining in the retail channel, (2) the rate of inventory sell-through in the retail channel, and (3) the remaining inventory on hand of our games. To allow for these returns, price protection and various customer discounts, some of our distribution partners who sell to retailers will hold back a percentage of our revenue. These "hold-back" amounts, typically a percentage of revenue, are then reconciled on a quarterly basis and detailed on the statements we receive from our distribution partners. As of December 31, 2015 and December 31, 2014, the allowance for doubtful accounts was $5,600.
Concentrations of Credit Risk, Major Customers and Major Vendors
The Company's customers are the end-consumers that purchase its games from the websites where the Company has its games listed for sale. Therefore, the Company does not have any individual customers that represent any more than a fraction of its revenue. However, the Company does have primary distribution partners, which are the owners of the websites where it sells its games. Under the Company's distribution agreements it is not obligated to make, distribute or sell any games. However, for any games the Company does make and wishes to distribute it can list them on one or more of these websites under a revenue sharing arrangement where it shares the revenue from any of its games that sell. The sharing arrangement varies greatly depending on the distributor with the Company generally keeping between 35% and 70% of the revenue and the distributor keeping the remainder of the revenue generated by each sale. At times the Company enters into "exclusivity options" whereby if a distributor wishes to have an exclusive period carrying the Company's games (normally 30-90 days) it will agree to that in exchange for the distributor marketing the game in their newsletter and other marketing programs. Due to the fact the Company has a number of distribution partners and a variety of different websites where it can sell its games, the Company is not substantially dependent on any of its distribution partners or agreements. In addition to the distribution agreements, the Company currently has licensing agreements with Ohio Art Company and CMG Worldwide, which allow it to develop and distribute games around third party intellectual property in exchange for paying royalty payments. The Company is not substantially dependent on either of those licensing agreements.
| F-7 |
For the year ended December 31, 2015, the Company's primary distributors that represented 10% or more of its revenues were: Big Fish Games – 23.67%, Wired Media – 22.74%, Apple – 18.08% and S.A.D. – 13.51%. For the year ended December 31, 2014, the Company's primary distributors that represented 10% or more of its revenues were: Big Fish Games – 25.29%, RealNetworks – 18.90%, Exent – 13.35%, Apple – 11.53% and Amazon – 11.01%.
At December 31, 2015, the Company's primary distributors and partners that represented 10% or more of its accounts receivable were: Apple – 16.93%, Big Fish Games – 10.00% and Exent – 48.81%. At December 31, 2014, the Company's primary distributors and partners that represented 10% or more of its accounts receivable were: Exent – 71.43%.
Income Taxes
We account for income taxes using ASC Topic 740, Income Taxes. Under ASC Topic 740, income taxes are accounted for under the asset and liability method. Deferred tax assets and liabilities are recognized for the future tax consequences attributable to differences between the financial statement carrying amounts of existing assets and liabilities and their respective tax bases and operating loss and tax credit carry forwards. Deferred tax assets and liabilities are measured using enacted tax rates expected to apply to taxable income in the years in which those temporary differences are expected to be recovered or settled. The effect on deferred tax assets and liabilities of a change in tax rates is recognized in income in the period that includes the enactment date.
ASC Topic 740 includes accounting guidance which clarifies the accounting for the uncertainty in recognizing income taxes in an organization by providing detailed guidance for financial statement recognition, measurement and disclosure involving uncertain tax positions. This guidance requires an uncertain tax position to meet a more-likely-than-not recognition threshold at the effective date to be recognized both upon the adoption of the related guidance and in subsequent periods.
The Company has no uncertain tax positions at any of the dates presented.
Foreign Currency Translation
The Company derives a portion of its revenue from foreign countries, which report to the Company in foreign currency, but pay in U.S. Dollars. Because of the fluctuations between the reporting time and the payment period (up to 60 days), it is necessary to make adjustments to the Company's accounting records. These adjustments are recorded under a Foreign Currency Translation expense account, and shown in the Statement of Operations as a General& Administrative expense.
Accounting for Stock-Based Compensation
The Company accounts for stock-based compensation in accordance with ASC Topic 718-10, Compensation-Stock Compensation and ASC Subtopic 505-50, Equity-Based Payments to Non-Employees ("ASC stock-based compensation guidance"). Stock-based compensation expense recognized during the requisite services period is based on the value of share-based payment awards after reduction for estimated forfeitures. Forfeitures are estimated at the time of grant and are revised, if necessary, in subsequent periods if actual forfeitures differ from those estimates.
The Company had no stock-based compensation expense recognized in its statements of operations for the years ended December 31, 2015 and 2014.
| F-8 |
Fair Value of Financial Instruments
The Company adopted FASB ASC 820 on October 1, 2008. Under this FASB, fair value is defined as the price that would be received to sell an asset or paid to transfer a liability in an orderly transaction between market participants at the measurement date (an exit price). The standard outlines a valuation framework and creates a fair value hierarchy in order to increase the consistency and comparability of fair value measurements and the related disclosures. Under GAAP, certain assets and liabilities must be measured at fair value, and FASB ASC 820-10-50 details the disclosures that are required for items measured at fair value.
The Company has various financial instruments that must be measured under the new fair value standard including cash and debt. The Company currently does not have non-financial assets or non-financial liabilities that are required to be measured at fair value on a recurring basis. The Company's financial assets and liabilities are measured using inputs from the three levels of the fair value hierarchy. The three levels are as follows:
Level 1 - Inputs are unadjusted quoted prices in active markets for identical assets or liabilities that the Company has the ability to access at the measurement date. The fair value of the Company's cash is based on quoted prices and therefore classified as Level 1.
Level 2 - Inputs include quoted prices for similar assets and liabilities in active markets, quoted prices for identical or similar assets or liabilities in markets that are not active, inputs other than quoted prices that are observable for the asset or liability (e.g., interest rates, yield curves, etc.), and inputs that are derived principally from or corroborated by observable market data by correlation or other means (market corroborated inputs).
Level 3 - Unobservable inputs that reflect our assumptions about the assumptions that market participants would use in pricing the asset or liability.
Cash, accounts receivable, capitalized production costs, prepaid royalties, prepaid expenses, accounts payable, accrued compensation, accrued royalties, accrued interest, accrued expenses, unearned royalties, notes payable – related party and technology payables reported on the balance sheet are estimated by management to approximate fair market value due to their short term nature.
The following tables provide a summary of the fair values of assets and liabilities measured on a non-recurring basis at December 31, 2015 and 2014:
2015 |
| Total |
|
| Level 1 |
|
| Level 2 |
|
| Level 3 |
|
| Gains |
| |||||
|
|
|
|
|
|
|
|
|
|
|
|
|
|
|
|
| ||||
Derivative liabilities |
| $ | 841,677 |
|
| $ | - |
|
| $ | - |
|
| $ | 841,677 |
|
| $ | (106,543 | ) |
| 2014 |
|
| Total |
|
| Level 1 |
|
| Level 2 |
|
| Level 3 |
|
| Losses |
| |||||
|
|
|
|
|
|
|
|
|
|
|
|
|
|
|
|
| |||||
Derivative liabilities |
|
| $ | 438,374 |
|
| $ | - |
|
| $ | - |
|
| $ | 438,374 |
|
| $ | 241,154 |
|
The Company believes that the market rate of interest as of December 31, 2015 and 2014 was not materially different to the rate of interest at which the convertible notes payable were issued. Accordingly, the Company believes that the fair value of the convertible notes payable approximated their carrying value at December 31, 2015 and 2014.
| F-9 |
Use of Estimates
The preparation of financial statements and related disclosures in conformity with U.S. generally accepted accounting principles ("U.S. GAAP") requires the Company's management to make judgments, assumptions and estimates that affect the amounts reported in its financial statements and accompanying notes. Management bases its estimates on historical experience and on various other assumptions it believes to be reasonable under the circumstances, the results of which form the basis for making judgments about the carrying values of assets and liabilities. Actual results may differ from these estimates and these differences may be material.
Research and Development Costs
The Company charges costs related to research & development of products to general and administrative expense as incurred. The types of costs included in research and development expenses include research materials, salaries, contractor fees, and support materials.
Intellectual Property Licenses (Prepaid Royalties)
Intellectual property license costs represent license fees paid to intellectual property rights holders for use of their trademarks or copyrights in the development of the Company's products. Intellectual property license costs represent license fees paid to intellectual property rights holders for use of their trademarks, copyrights, software, technology, music or other intellectual property or proprietary rights in the development of the Company's products. Depending upon the agreement with the rights holder, the Company may obtain the rights to use acquired intellectual property in multiple products over multiple years, or alternatively, for a single product. Minimum guaranteed royalty payments for intellectual property licenses are initially recorded as an asset (prepaid royalties or prepaid licensing fees), and a current liability, (accrued royalties payable) at the contractual amount upon execution of the contract when no significant performance remains with the licensor. Commencing upon the related product's release date, intellectual property licenses costs are amortized to "Cost of Sales – Licensing" based upon the percentage of revenue outlined in the contract with each specific licensor. Generally, the Company's intellectual property licensing contracts call for licensors to be paid a percentage of revenue actually received by the Company, with allowances for minimum guarantees. Sometimes, the terms of the specific licensing contracts allow for the Company to re-capture expenses before licensing out royalties are calculated.
Capitalized intellectual property costs for those products that are cancelled or abandoned are charged to product development expense in the period of cancellation.
As of December 31, 2015 and 2014, prepaid royalties (or prepaid licensing fees) were $4,507 and $4,936, respectively.
Recent Accounting Pronouncements
In May 2014, the FASB issued ASU 2014-09, "Revenue from Contracts with Customers (Topic 606)". ASU 2014-09 amends the guidance for revenue recognition to replace numerous, industry-specific requirements and converges areas under this topic with those of the International Financial Reporting Standards. The ASU implements a five-step process for customer contract revenue recognition that focuses on transfer of control, as opposed to transfer of risk and rewards. The amendment also requires enhanced disclosures regarding the nature, amount, timing and uncertainty of revenues and cash flows from contracts with customers. Other major provisions include the capitalization and amortization of certain contract costs, ensuring the time value of money is considered in the transaction price, and allowing estimates of variable consideration to be recognized before contingencies are resolved in certain circumstances. The amendments in this ASU are effective for reporting periods beginning after December 15, 2016; however, in July 2015, the FASB agreed to delay the effective date by one year. The proposed deferral may permit early adoption, but would not allow adoption any earlier than the original effective date of the standard. Entities can transition to the standard either retrospectively or as a cumulative-effect adjustment as of the date of adoption. We are currently assessing the impact the adoption of ASU 2014-09, including possible transition alternatives, will have on our financial statements.
| F-10 |
In February 2016, the FASB issued ASU No. 2016-02, "Leases (Topic 842)". The amendments in this ASU revise the accounting related to lessee accounting. Under the new guidance, lessees will be required to recognize a lease liability and a right-of-use asset for all leases. The new lease guidance also simplifies the accounting for sale and leaseback transactions primarily because lessees must recognize lease assets and lease liabilities. The amendments in this ASU are effective for public companies for fiscal years beginning after December 15, 2018 and are to be applied through a modified retrospective transition approach for leases existing at, or entered into after, the beginning of the earliest comparative period presented in the financial statements. Early adoption is permitted. We are currently unable to determine the impact on our financial statements of the adoption of this new accounting pronouncement.
NOTE 3 – GOING CONCERN
As shown in the accompanying financial statements, the Company incurred net losses of $1,870,677 and $1,355,030 for the years ended December 31, 2015 and 2014, respectively. As of December 31, 2015, the Company's accumulated deficit was $8,984,510. During the years ended December 3l, 2015 and 2014, the Company experienced negative cash flows from operations largely due to its continued investment spending for product development of game titles for smartphones and tablets that are expected to benefit future periods. Those facts, along with our lack of access to a significant bank credit facility, create an uncertainty about the Company's ability to continue as a going concern. Accordingly, the Company is currently evaluating its alternatives to secure financing sufficient to support the operating requirements of its current business plan, as well as continuing to execute its business strategy of distributing game titles to digital distribution outlets, including mobile gaming app stores, online PC and Mac gaming portals, and opportunities for new devices such as tablet (mobile internet device) applications, mobile gaming platforms and international licensing opportunities.
The Company's ability to continue as a going concern is dependent upon its success in securing sufficient financing and in successfully executing its plans to return to positive cash flows during fiscal year 2016. The Company's financial statements do not include any adjustments that might be necessary if it were unable to continue as a going concern.
NOTE 4 – ACCRUED EXPENSES
Accrued expenses consisted of the following at December 31:
| 2015 |
|
| 2014 |
| |||
|
|
|
|
|
| |||
Accrued vacation |
| $ | 64,461 |
|
| $ | 68,344 |
|
Accrued royalties |
|
| 408,134 |
|
|
| 406,790 |
|
Technology payable |
|
| 18,000 |
|
|
| 18,000 |
|
Other |
|
| 1,417 |
|
|
| 2,181 |
|
|
|
|
|
|
|
|
| |
| $ | 492,012 |
|
| $ | 495,315 |
| |
| F-11 |
Accrued royalties consist of amounts owed to other parties with whom the Company has revenue-sharing agreements or from whom it licenses certain trademarks or copyrights.
Unearned royalties consist of royalties received from licensees, which have not yet been earned. Unearned royalties were $195,033 and $202,499 at December 31, 2015 and 2014, respectively.
As of December 31, 2015 and 2014, the Company had technology payable of $18,000 resulting from a technology transfer agreement with an unrelated party entered into in June 2011, payable in 24 installments of $1,500 without interest.
NOTE 5 – DEBT
Convertible Notes Payable – Related Party
Convertible notes payable, related party consisted of the following at December 31:
| 2015 |
|
| 2014 |
| |||
|
|
|
|
|
|
|
|
|
Convertible note payable to the Holland Family Trust, maturing on September 30, 2016, with interest at 10% |
| $ | 222,572 |
|
| $ | 222,572 |
|
Convertible note payable to Craig Holland, maturing on September 30, 2016, with interest at 10% |
|
| 813,602 |
|
|
| 813,602 |
|
Convertible note payable to Craig Holland, maturing on December 31, 2016, with interest at 10% |
|
| 186,450 |
|
|
| 186,450 |
|
Convertible note payable to Mick Donahoo, maturing on December 31, 2016, with interest at 10% |
|
| 186,450 |
|
|
| 186,450 |
|
Convertible note payable to Craig Holland, maturing on December 31, 2016, with interest at 10% |
|
| 6,925 |
|
|
| 11,532 |
|
Convertible note payable to Mick Donahoo, maturing on December 31, 2016, with interest at 10% |
|
| 31,042 |
|
|
| 35,648 |
|
|
|
|
|
|
|
|
| |
Total |
| $ | 1,447,041 |
|
| $ | 1,456,254 |
|
The "Holland Family Trust Convertible Note" is convertible into Company common stock at the greater of (i) the Variable Conversion Price and (ii) the Fixed Conversion Price. The "Variable Conversion Price" shall mean 50% multiplied by the Market Price (representing a discount rate of 50%). "Market Price" means the average of the three lowest trading prices for the Company's common stock during the twenty-five (25) trading-day period ending on the latest complete trading day prior to the date of conversion. "Fixed Conversion Price" shall mean $0.00005.
| F-12 |
The Company evaluated the Holland Family Trust Convertible Note and determined that the shares issuable pursuant to the conversion option were determinate due to the Fixed Conversion Price and, as such, does not constitute a derivative liability as the Company has obtained authorization from a majority of shareholders such that should conversion occur at the Fixed Conversion Price the appropriate number of shares will be available or issuable for settlement to occur. The note payable is convertible into common stock at the discretion of the Holland Family Trust. Furthermore, at any time, the Company may pay the balance of the unconverted note payable in cash.
As of September 30, 2014, $72,107 of accrued interest was added to the note principal and $813,602 of the note was transferred to Craig Holland. A new convertible note for $222,572 was issued to the Holland Family Trust with the same terms as the previous note, with the exception of the maturity date, which was extended to September 30, 2016. As of December 31, 2015 and 2014, accrued interest related to the Holland Family Trust Convertible Note was $27,867 and $5,610, respectively.
On September 30, 2014, $813,602 principal balance (including interest) of the Holland Family Trust Convertible Note was transferred to Craig Holland (the "Holland Transferred Convertible Note"). The Holland Transferred Convertible Note retains the same terms as the original Holland Family Trust Convertible Note with the exception of the maturity date, which was extended to December 31, 2016. As of December 31, 2015 and 2014, accrued interest related to the Holland Transferred Convertible Note was $101,867 and $20,507, respectively.
On December 31, 2013, the Company converted $186,450 of accrued salaries due to Craig Holland into a convertible note (the "Holland Accrued Salary Note") and converted $186,450 of accrued salaries due to Mick Donahoo into a convertible note (the "Donahoo Accrued Salary Note"). The Holland Accrued Salary Note and the Donahoo Accrued Salary Note are convertible into Company common stock at the greater of (i) the Variable Conversion Price and (ii) the Fixed Conversion Price. The "Variable Conversion Price" shall mean 50% multiplied by the Market Price (representing a discount rate of 50%). "Market Price" means the average of the three lowest trading prices for the Company's common stock during the twenty-five (25) trading-day period ending on the latest complete trading day prior to the Conversion Date. "Fixed Conversion Price" shall mean $0.00005.
The Company evaluated the Holland Accrued Salary Note and the Donahoo Accrued Salary Note and determined that the shares issuable pursuant to the conversion option were determinate due to the Fixed Conversion Price and, as such, the conversion feature does not constitute a derivative liability as the Company has obtained authorization from a majority of shareholders such that should conversion occur at the Fixed Conversion Price the appropriate number of shares will be available or issuable for settlement to occur. As of December 31, 2015 and December 31, 2014, there was accrued interest related to each of these notes of $37,290 and $18,645, respectively.
On December 31, 2013, the Company converted a note payable to Mick Donahoo of $55,250 and accrued interest of $15,399 into a new convertible related party note in the amount of $70,649 (the "Mick Donahoo Convertible Note").
On December 31, 2013, the Company converted a note payable to Craig Holland of $35,100 and accrued interest of $11,432 into a new convertible related party note in the amount of $46,532 (the "Craig Holland Convertible Note").
The Mick Donahoo Convertible Note and the Craig Holland Convertible Note are convertible into Company common stock at the greater of (i) the Variable Conversion Price and (ii) the Fixed Conversion Price. The "Variable Conversion Price" shall mean 50% multiplied by the Market Price (representing a discount rate of 50%). "Market Price" means the average of the three lowest trading prices for the Company's common stock during the twenty-five (25) trading-day period ending on the latest complete trading day prior to the Conversion Date. "Fixed Conversion Price" shall mean $0.00005.
| F-13 |
The Company evaluated the Mick Donahoo Convertible Note and the Craig Holland Convertible Note and determined that the shares issuable pursuant to the conversion option were determinate due to the Fixed Conversion Price and, as such, does not constitute a derivative liability as the Company has obtained authorization from a majority of shareholders such that should conversion occur at the Fixed Conversion Price the appropriate number of shares will be available or issuable for settlement to occur. The agreements modified the debt to make it convertible into common stock of the Company. As of December 31, 2015 and December 31, 2014, there was accrued interest payable related to these notes totaling of $5,146 and $4,699, respectively.
On October 23, 2014, Craig Holland converted $35,000 principal and $2,836 accrued interest into 39,829,849 shares of the Company's common stock.
On October 23, 2014, Mick Donahoo converted $35,000 principal and $2,836 accrued interest into 39,829,849 shares of the Company's common stock.
On October 8, 2015, Craig Holland converted $4,607 principal and $2,028 accrued interest into 12,637,860 shares of the Company's common stock.
On October 8, 2015, Mick Donahoo converted $4,607 principal and $2,028 accrued interest into 12,637,860 shares of the Company's common stock.
Effective October 15, 2015, we entered into an Amendment to Convertible Promissory Note with each of Craig Holland and Mick Donahoo with respect to the Craig Holland Convertible Note and the Mick Donahoo Convertible Note. The parties agreed to modify the terms of the notes such that in the event the lender issues a valid conversion notice and the conversion notice results in a conversion price less than the then-par value of the Company's common stock, the conversion will be effected at par value with additional principal amounts added to the note equal to the value of the common shares that were not able to be issued due to the conversion price being less than the par value of the Company's common stock. As the amendment did not alter the shares received by converting the notes, no additional value was recorded by the Company as a result of these amendments.
Total accrued interest payable for the related party convertible notes was $209,461 and $68,106 as of December 31, 2015 and December 31, 2014, respectively.
Convertible Notes Payable – Non-Related Party
Convertible notes payable – non-related party consisted of the following at December 31:
| 2015 |
|
| 2014 |
| |||
Convertible note payable to Robert Cowdell, maturing on December 31, 2016, with interest at 10% |
| $ | 61,443 |
|
| $ | 61,443 |
|
Convertible note payable to an accredited investor, with interest at 10% |
|
| - |
|
|
| 45,300 |
|
Convertible note payable to an accredited investor, maturing on September 30, 2016, with interest at 10% |
|
| 31,126 |
|
|
| 50,000 |
|
Convertible note payable to an accredited investor, maturing on September 30, 2016, with interest at 10% |
|
| 50,000 |
|
|
| 50,000 |
|
Convertible note payable to an accredited investor, maturing on September 30, 2016, with interest at 10% |
|
| 50,000 |
|
|
| 50,000 |
|
| F-14 |
Convertible note payable to an accredited investor, maturing on September 30, 2016, with interest at 10% |
|
| 50,000 |
|
|
| 50,000 |
|
Convertible note payable to an accredited investor, maturing on September 30, 2016, with interest at 10% |
|
| 50,000 |
|
|
| 50,000 |
|
Convertible note payable to an accredited investor, maturing on June 25, 2017, with interest at 10% |
|
| 50,000 |
|
|
| 50,000 |
|
Convertible note payable to an accredited investor, maturing on June 25, 2017, with interest at 10% |
|
| 50,000 |
|
|
| 50,000 |
|
Convertible note payable to an accredited investor, maturing on June 25, 2017, with interest at 10% |
|
| 50,000 |
|
|
| 50,000 |
|
Convertible note payable to an accredited investor, maturing on June 25, 2017, with interest at 10% |
|
| 50,000 |
|
|
| 50,000 |
|
Convertible note payable to an accredited investor, maturing on June 25, 2017, with interest at 10% |
|
| 50,000 |
|
|
| 50,000 |
|
Convertible note payable to an accredited investor, maturing on June 25, 2017, with interest at 10% |
|
| 100,000 |
|
|
| 100,000 |
|
Convertible note payable to an accredited investor, maturing on June 25, 2017, with interest at 10% |
|
| 50,000 |
|
|
| 50,000 |
|
Convertible note payable to an accredited investor, maturing on June 25, 2017, with interest at 10% |
|
| 70,000 |
|
| - |
| |
Convertible note payable to an accredited investor, maturing on June 25, 2017, with interest at 10% |
|
| 30,000 |
|
| - |
| |
Convertible note payable to an accredited investor, maturing on November 11, 2016, with interest at 10% |
|
| 30,000 |
|
| - |
| |
Convertible note payable to an accredited investor, maturing on November 11, 2016, with interest at 10% |
|
| 40,000 |
|
| - |
| |
Convertible note payable to an accredited investor, maturing on November 11, 2016, with interest at 10% |
|
| 110,000 |
|
| - |
| |
Convertible note payable to an accredited investor, maturing on November 11, 2016, with interest at 10% |
|
| 88,000 |
|
| - |
| |
Convertible note payable to an accredited investor, maturing on November 11, 2016, with interest at 10% |
|
| 90,000 |
|
| - |
| |
Convertible note payable to an accredited investor, maturing on November 11, 2016, with interest at 10% |
|
| 90,000 |
|
| - |
| |
Convertible note payable to an accredited investor, maturing on April 28, 2017, with interest at 10% |
|
| 65,000 |
|
| - |
| |
Convertible note payable to an accredited investor, maturing on April 28, 2017, with interest at 10% |
|
| 65,000 |
|
| - |
| |
Convertible note payable to an accredited investor, maturing on April 28, 2017, with interest at 10% |
|
| 60,000 |
|
| - |
| |
Convertible note payable to an accredited investor, maturing on April 28, 2017, with interest at 10% |
|
| 50,000 |
|
| - |
| |
Convertible note payable to an accredited investor, maturing on April 28, 2017, with interest at 10% |
|
| 50,000 |
|
| - |
| |
Convertible note payable to an accredited investor, maturing on April 28, 2017, with interest at 10% |
|
| 50,000 |
|
| - |
| |
Total |
|
| 1,585,569 |
|
|
| 756,743 |
|
Less discount |
| (180,208 | ) |
| (343,902 | ) | ||
|
|
|
|
|
|
|
| |
Net convertible notes payable |
| $ | 1,405,361 |
|
| $ | 412,841 |
|
| F-15 |
On December 31, 2013, the Company converted $55,429 of convertible debt and $6,014 in accrued interest due to Robert Cowdell (the "Convertible Cowdell Note") into a convertible note. The Convertible Cowdell Note is convertible into Company common stock at the greater of (i) the Variable Conversion Price and (ii) the Fixed Conversion Price. The "Variable Conversion Price" shall mean 50% multiplied by the Market Price (representing a discount rate of 50%). "Market Price" means the average of the three lowest trading prices for the Company's common stock during the twenty-five (25) trading-day period ending on the latest complete trading day prior to the Conversion Date. "Fixed Conversion Price" shall mean $0.00005. The Convertible Cowdell Note had accrued interest of $12,289 and $6,144 as of December 31, 2015 and 2014, respectively.
The Company evaluated the Convertible Cowdell Note and determined that the shares issuable pursuant to the conversion option were determinate due to the Fixed Conversion Price and, as such, does not constitute a derivative liability as the Company has obtained authorization from a majority of shareholders such that should conversion occur at the Fixed Conversion Price the appropriate number of shares will be available or issuable for settlement to occur. The agreement modified the debt to make it convertible into common stock of the Company.
The convertible notes to an accredited investor (the "Accredited Investor") with outstanding balances at December 31, 2015 were issued in $50,000 tranches in January, February, March, April, May, June, July, August, September, October and December 2014, and tranches of $100,000 in November 2014, $70,000 in January 2015, two $30,000 tranches in February 2015, $40,000 in February 2015, $110,000 in March 2015, $88,000 in April 2015, $90,000 in May and June 2015, $65,000 in July and August 2015, $60,000 in September 2015 and $50,000 in October, November and December 2015. Each note is convertible into Company common stock at the greater of (i) the Variable Conversion Price and (ii) the Fixed Conversion Price. The "Variable Conversion Price" shall mean 50% multiplied by the Market Price (representing a discount rate of 50%). "Market Price" means the average of the three lowest trading prices for the Company's common stock during the twenty-five (25) trading-day period ending on the latest complete trading day prior to the Conversion Date. "Fixed Conversion Price" shall mean $0.00005. The notes also include conversion price reset features that are triggered when new equity issuances are made by the Company; as a result, this feature caused the Company to consider this feature a derivative liability. The maturity date of the notes is generally one year from the date of funding, with the maturity date of the tranches issued in February 2015 through December 2015 nine months from the date of funding. The due date of the note that includes tranches funded through May 2014 with outstanding principal balances totaling $231,126 as of December 31, 2015 was extended to September 30, 2015. The due date of the note that includes tranches funded from June 2014 through February 2015 with outstanding principal balances totaling $500,000 as of December 31, 2015 was extended to June 25, 2016.
The January 2014 derivative was valued as of January 6, 2014 at $44,493, which was recorded as a debt discount. During the year ended December 31, 2015, $731 was amortized from the debt discount. The debt discount was fully amortized at December 31, 2015. The January 2014 note had accrued interest of $5,814 and $4,863 as of December 31, 2015 and 2014, respectively.
The February 2014 derivative was valued as of February 18, 2014 at $44,556, which was recorded as a debt discount. During year ended December 31, 2015, $5,981 was amortized from the debt discount. The debt discount was fully amortized at December 31, 2015. The February 2014 note had accrued interest of $9,329 and $5,981 as of December 31, 2015 and 2014, respectively.
The March 2014 derivative was valued as of March 26, 2014 at $77,884, of which $50,000 was recorded as a debt discount with the remaining amount that exceeded the face value of the note expensed. During the year ended December 31, 2015, $11,644 was amortized from the debt discount. The debt discount was fully amortized at December 31, 2015. The March 2014 note had accrued interest of $8,836 and $3,836 as of December 31, 2015 and 2014, respectively.
The April 2014 derivative was valued as of April 25, 2014 at $90,605, of which $50,000 was recorded as a debt discount with the remaining amount that exceeded the face value of the note expensed. During the year ended December 31, 2015, $15,753 was amortized from the debt discount. The debt discount was fully amortized at December 31, 2015. The April 2014 note had accrued interest of $8,425 and $3,425 as of December 31, 2015 and 2014, respectively.
| F-16 |
The May 2014 derivative was valued as of May 21, 2014 at $95,029, of which $50,000 was recorded as a debt discount with the remaining amount that exceeded the face value of the note expensed. During the year ended December 31, 2015, $19,315 was amortized from the debt discount. The debt discount was fully amortized at December 31, 2015. The May 2014 note had accrued interest of $8,068 and $3,068 as of December 31, 2015 and 2014, respectively.
The June 2014 derivative was valued as of June 25, 2014 at $83,184, of which $50,000 was recorded as a debt discount with the remaining amount that exceeded the face value of the note expensed. During the year ended December 31, 2015, $24,110 was amortized from the debt discount. The debt discount was fully amortized at December 31, 2015. The June 2014 note had accrued interest of $7,575 and $2,575 as of December 31, 2015 and 2014, respectively.
The July 2014 derivative was valued as of July 15, 2014 at $73,999, of which $50,000 was recorded as a debt discount with the remaining amount that exceeded the face value of the note expensed. During the year ended December 31, 2015, $26,849 was amortized from the debt discount. The debt discount was fully amortized at December 31, 2015. The July 2014 note had accrued interest of $7,301 and $2,301 as of December 31, 2015 and 2014, respectively.
The August 2014 derivative was valued as of August 19, 2014 at $64,104, of which $50,000 was recorded as a debt discount with the remaining amount that exceeded the face value of the note expensed. During the years ended December 31, 2015, $31,644 was amortized from the debt discount. The debt discount was fully amortized at December 31, 2015. The August 2014 note had accrued interest of $6,836 and $1,822 as of December 31, 2015 and 2014, respectively.
The September 2014 derivative was valued as of September 17, 2014 at $62,915, of which $50,000 was recorded as a debt discount with the remaining amount that exceeded the face value of the note expensed. During the year ended December 31, 2015, $35,616 was amortized from the debt discount. The debt discount was fully amortized at December 31, 2015. The September 2014 note had accrued interest of $6,438 and $1,438 as of December 31, 2015 and 2014, respectively.
The October 2014 derivative was valued as of October 13, 2014 at $63,347, of which $50,000 was recorded as a debt discount with the remaining amount that exceeded the face value of the note expensed. During the year ended December 31, 2015, $39,178 was amortized from the debt discount. The debt discount was fully amortized at December 31, 2015. The October 2014 note had accrued interest of $6,069 and $1,068 as of December 31, 2015 and 2014, respectively.
The November 2014 derivative was valued as of November 7, 2014 at $99,757, which was recorded as a debt discount. During the year ended December 31, 2015, $84,998 was amortized from the debt discount. The debt discount was fully amortized at December 31, 2015. The November 2014 note had accrued interest of $11,644 and $1,671 as of December 31, 2015 and 2014, respectively.
The December 2014 derivative was valued as of December 17, 2014 at $58,456, of which $50,000 was recorded as a debt discount with the remaining amount that exceeded the face value of the note expensed. During the year ended December 31, 2015, $48,082 was amortized from the debt discount. The debt discount was fully amortized at December 31, 2015. The December 2014 note had accrued interest of $5,178 and $178 as of December 31, 2015 and 2014, respectively.
The January 2015 derivative was valued as of January 14, 2015 at $29,360, which was recorded as a debt discount. During the year ended December 31, 2015, $28,234 was amortized from the debt discount. The debt discount had a balance at December 31, 2015 of $1,126. The January 2015 note had accrued interest of $6,751 as of December 31, 2015.
| F-17 |
The first February 2015 derivative was valued as of February 10, 2015 at $23,984, which was recorded as a debt discount. During the year ended December 31, 2015, $21,290 was amortized from the debt discount. The debt discount had a balance at December 31, 2015 of $2,694. The first February 2015 note had accrued interest of $2,671 as of December 31, 2015.
The second February 2015 derivative was valued as of February 11, 2015 at $18,003, which was recorded as a debt discount. During the year ended December 31, 2015, $18,003 was amortized from the debt discount. The debt discount was fully amortized at December 31, 2015. The second February 2015 note had accrued interest of $2,663 as of December 31, 2015.
The third February 2015 derivative was valued as of February 25, 2015 at $19,494, which was recorded as a debt discount. During the year ended December 31, 2015, $19,494 was amortized from the debt discount. The debt discount was fully amortized at December 31, 2015. The third February 2015 note had accrued interest of $5,096 as of December 31, 2015.
The March 2015 derivative was valued as of March 10, 2015 at $31,885, which was recorded as a debt discount. During the year ended December 31, 2015, $31,885 was amortized from the debt discount. The debt discount was fully amortized at December 31, 2015. The March 2015 note had accrued interest of $8,951 as of December 31, 2015.
The April 2015 derivative was valued as of April 17, 2015 at $31,397, which was recorded as a debt discount. During year ended December 31, 2015, $29,456 was amortized from the debt discount. The debt discount had a balance at December 31, 2015 of $1,941. The April 2015 note had accrued interest of $6,244 as of December 31, 2015.
The May 2015 derivative was valued as of May 22, 2015 at $36,550, which was recorded as a debt discount. During the year ended December 31, 2015, $29,531 was amortized from the debt discount. The debt discount had a balance at December 31, 2015 of $7,019. The May 2015 note had accrued interest of $5,523 as of December 31, 2015.
The June 2015 derivative was valued as of June 23, 2015 at $41,878, which was recorded as a debt discount. During the year ended December 31, 2015, $29,192 was amortized from the debt discount. The debt discount had a balance at December 31, 2015 of $12,686. The June 2015 note had accrued interest of $4,734 as of December 31, 2015.
The July 2015 derivative was valued as of July 28, 2015 at $38,600, which was recorded as a debt discount. During the year ended December 31, 2015, $21,897 was amortized from the debt discount. The debt discount had a balance at December 31, 2015 of $16,703. The July 2015 note had accrued interest of $2,796 as of December 31, 2015.
The August 2015 derivative was valued as of August 21, 2015 at $37,269, which was recorded as a debt discount. During the year ended December 31, 2015, $17,954 was amortized from the debt discount. The debt discount had a balance at December 31, 2015 of $19,315. The August 2015 note had accrued interest of $2,369 as of December 31, 2015.
The September 2015 derivative was valued as of September 24, 2015 at $37,820, which was recorded as a debt discount. During the year ended December 31, 2015, $13,527 was amortized from the debt discount. The debt discount had a balance at December 31, 2015 of $24,293. The September 2015 note had accrued interest of $1,763 as of December 31, 2015.
The October 2015 derivative was valued as of October 23, 2015 at $35,290, which was recorded as a debt discount. During the year ended December 31, 2015, $8,887 was amortized from the debt discount. The debt discount had a balance at December 31, 2015 of $26,403. The September 2015 note had accrued interest of $959 as of December 31, 2015.
The November 2015 derivative was valued as of November 30, 2015 at $36,448, which was recorded as a debt discount. During the year ended December 31, 2015, $4,232 was amortized from the debt discount. The debt discount had a balance at December 31, 2015 of $32,216. The September 2015 note had accrued interest of $438 as of December 31, 2015.
| F-18 |
The December 2015 derivative was valued as of December 21, 2015 at $37,163, which was recorded as a debt discount. During the year ended December 31, 2015, $1,351 was amortized from the debt discount. The debt discount had a balance at December 31, 2015 of $35,812. The September 2015 note had accrued interest of $166 as of December 31, 2015.
Total accrued interest payable for the non-related party convertible notes was $154,925 and $41,385 as of December 31, 2015 and 2014, respectively.
The Company recorded total interest expense, including debt discount and beneficial conversion feature amortization, for all debt of $887,447 and $903,811 for the years ended December 31, 2015 and 2014, respectively.
NOTE 6 – DERIVATIVE FINANCIAL INSTRUMENTS
As discussed in Note 5, the Company issued convertible notes payable to non-related parties that contain anti-dilutive, or down round, price protection. Pursuant to ASC 815-15 Embedded Derivatives and ASC 815-40 Contracts in Entity's Own Equity, the Company recorded a derivative liability for the price protection provisions issued within the convertible debt transactions.
The fair values of the Company's derivative liabilities are estimated at the issuance date and are revalued at each subsequent reporting date using a multinomial lattice model simulation discussed below. At December 31, 2015 and 2014, the Company recorded current derivative liabilities of $841,677 and $438,374, respectively. The net change in fair value of the derivative liabilities resulted in a loss of $106,543 for the year ended December 31, 2015 and a gain of $241,154 for the year ended December 31, 2014, which are reported as other income/(expense) in the statements of operations.
The following table presents details of the Company's derivative liabilities for the years ended December 31, 2015 and 2014:
Balance, December 31, 2013 |
| $ | - |
|
Increases in derivative value due to new issuances of notes |
|
| 638,806 |
|
Derivative adjustment to beneficial conversion feature |
|
| 50,000 |
|
Derivative adjustment due to debt conversion |
|
| (9,278 | ) |
Change in fair value of derivative liabilities |
|
| (241,154 | ) |
|
|
|
| |
Balance, December 31, 2014 |
|
| 438,374 |
|
|
|
|
| |
Increases in derivative value due to new issuances of notes |
|
| 455,141 |
|
Derivative adjustment due to debt conversion |
|
| (158,381 | ) |
Change in fair value of derivative liabilities |
|
| 106,543 |
|
|
|
|
| |
Balance, December 31, 2015 |
| $ | 841,677 |
|
| F-19 |
The Company calculated the fair value of the compound embedded derivatives using a multinomial lattice model simulation. The model is based on a probability weighted discounted cash flow model using projections of the various potential outcomes.
Key inputs and assumptions used in valuing the Company's derivative liabilities are as follows for issuances of notes:
| · | Stock prices on all measurement dates were based on the fair market value |
|
|
|
| · | Down round protection is based on the subsequent issuance of common stock at prices less than the conversion feature |
|
|
|
| · | The probability of future financing was estimated at 100% |
|
|
|
| · | Computed volatility ranging from 284% to 299% |
NOTE 7 – STOCKHOLDERS' DEFICIT
Certificate of Amendment
On October 23, 2015, holders of a majority of the Company's outstanding voting securities and the Company's Board of Directors approved an amendment to the Company's Certificate of Incorporation (the "Certificate of Amendment") to: (i) increase the total number of authorized shares of the Company's capital stock from 510,000,000 shares to 2,010,000,000 shares, of which 2,000,000,000 will be available for issuance as Common Stock and 10,000,000 will be available for issuance as preferred stock; and (ii) change the par value of the Company's authorized capital stock from $0.001 per share to $0.00001 per share. The Certificate of Amendment became effective upon the filing of the Certificate of Amendment with the Delaware Secretary of State. The change in par value has been given retroactive effect in the accompanying financial statements.
Stock Issuances
As of December 31, 2015 and 2014, the Company had common stock payable of $16,800 resulting from a technology transfer agreement with an unrelated party that obligated the Company to issue a total of 96,000 shares of its common stock, payable in 8 quarterly installments of 12,000 shares.
On October 14, 2014, an accredited investor converted $4,700 principal and $384 accrued interest into 4,919,735 shares of our common stock at a conversion price of $0.00103 per share.
On October 23, 2014, Craig Holland converted $35,000 principal and $2,838 accrued interest into 39,829,849 shares of our common stock at a conversion price of $0.00095 per share.
On October 23, 2014, Mick Donahoo converted $35,000 principal and $2,838 accrued interest into 39,829,849 shares of our common stock at a conversion price of $0.00095 per share.
During the year ended December 31, 2015, the Company issued a total of 70,648,155 shares of its common stock to an accredited investor in conversion of $64,174 principal and $8,778 accrued interest payable at conversion prices ranging from $0.00088 to $0.00135 per share, and settled $158,381 of derivative liabilities.
On October 8, 2015, Craig Holland converted $4,607 principal and $2,028 accrued interest into 12,637,860 shares of the Company's common stock.
On October 8, 2015, Mick Donahoo converted $4,607 principal and $2,028 accrued interest into 12,637,860 shares of the Company's common stock.
| F-20 |
2006 Stock Option Plan
The 2006 Stock Option Plan was adopted by our Board of Directors in March of 2006. A total of 550,000 shares of Common Stock have been reserved for issuance to employees, consultants and directors upon exercise of incentive and non-statutory options and stock purchase rights which may be granted under the Company's 2006 Stock Plan (the "2006 Plan"). On October 15, 2009, 235,000 of those options were exercised, leaving 315,000 shares available for issuance to employees. Because of the 5.31-for-one forward stock split of the Company's common stock on October 15, 2009, there are now 1,512,650 shares available for issuance as a part of this stock plan. As of December 31, 2014, there were 560,000 options outstanding to purchase shares of Common Stock, and no shares of Common Stock had been issued pursuant to stock purchase rights under the 2006 Plan.
Under the 2006 Plan, options may be granted to employees, directors, and consultants. Only employees may receive "incentive stock options," which are intended to qualify for certain tax treatment, and consultants and directors may receive "non-statutory stock options," which do not qualify for such treatment. A holder of more than 10% of the outstanding voting shares may only be granted options with an exercise price of at least 110% of the fair market value of the underlying stock on the date of the grant, and if such holder has incentive stock options, the term of the options must not exceed five years.
Options and stock purchase rights granted under the 2006 Plan generally vest ratably over a four year period (typically 1⁄4 or 25% of the shares vest after the 1st year and 1/48 of the remaining shares vest each month thereafter); however, alternative vesting schedules may be approved by the Board of Directors in its sole discretion. Any unvested portion of an option or stock purchase right will accelerate and become fully vested if a holder's service with the Company is terminated by the Company without cause within twelve months following a Change in Control (as defined in the 2006 Plan).
All options must be exercised within ten years after the date of grant. Upon a holder's termination of service for any reason prior to a Change in Control, the Company may repurchase any shares issued to such holder upon the exercise of options or stock purchase rights. The Board of Directors may amend the 2006 Plan at any time. The 2006 Plan will terminate in 2016, unless terminated sooner by the Board of Directors.
The Company did not grant any stock options or warrants during the years ended December 31, 2015 and 2014. The Company did not record any stock-based compensation expense during the years ended December 31, 2015 and 2014.
A summary of the status of the options and warrants issued by the Company as of December 31, 2015, and changes during the years ended December 31, 2015 and 2014 is presented below:
|
|
|
| Weighted Average |
| |||
| Shares |
|
| Exercise Price |
| |||
|
|
|
|
|
| |||
Outstanding, December 31, 2013 |
|
| 560,000 |
|
| $ | 0.10 |
|
|
|
|
|
|
|
|
| |
Granted |
|
| - |
|
|
| - |
|
Canceled / Expired |
|
| - |
|
|
| - |
|
Exercised |
|
| - |
|
|
| - |
|
|
|
|
|
|
|
|
| |
Outstanding, December 31, 2014 |
|
| 560,000 |
|
| $ | 0.10 |
|
|
|
|
|
|
|
|
| |
Granted |
|
| - |
|
|
| - |
|
Canceled / Expired |
|
| - |
|
|
| - |
|
Exercised |
|
| - |
|
|
| - |
|
|
|
|
|
|
|
|
| |
Outstanding, December 31, 2015 |
|
| 560,000 |
|
| $ | 0.10 |
|
| F-21 |
NOTE 8 – LOSS PER COMMON SHARE
The computation of basic earnings per common share is based on the weighted average number of shares outstanding during the period. The computation of diluted earnings per common share is based on the weighted average number of shares outstanding during the period plus the weighted average common stock equivalents which would arise from the exercise of stock options, warrants and rights outstanding using the treasury stock method and the average market price per share during the period.
For the years ended December 31, 2015 and 2014, the diluted weighted average number of shares is the same as the basic weighted average number of shares as the conversion of debt, options and warrants would be anti-dilutive.
NOTE 9 – RELATED PARTY TRANSACTIONS
The Company had convertible notes payable to related parties totaling $1,447,041 and $1,456,254 as of December 31, 2015 and 2014, respectively. See Note 5 for a detailed disclosure of this related party debt, including interest rates, terms of conversion and other repayment terms. Accrued interest payable to related parties was $209,461 and $68,106 as of December 31, 2015 and 2014, respectively.
As further discussed in Note 5, on September 30, 2014, $72,107 of accrued interest was added to the principal of a convertible note payable to the Holland Family Trust and $813,602 of the note was transferred to Craig Holland. A new convertible note for $222,572 was issued to the Holland Family Trust with the same terms as the previous note, with the exception of the maturity date, which was extended to September 30, 2016.
On October 23, 2014, Craig Holland converted $35,000 principal and $2,838 accrued interest into 39,829,849 shares of our common stock at a conversion price of $0.00095 per share.
On October 23, 2014, Mick Donahoo converted $35,000 principal and $2,838 accrued interest into 39,829,849 shares of our common stock at a conversion price of $0.00095 per share.
On October 8, 2015, Craig Holland converted $4,607 principal and $2,028 accrued interest into 12,637,860 shares of the Company's common stock at a conversion price of $0.000525 per share.
On October 8, 2015, Mick Donahoo converted $4,607 principal and $2,028 accrued interest into 12,637,860 shares of the Company's common stock at a conversion price of $0.000525 per share.
NOTE 10 – COMMITMENTS AND CONTINGENCIES
Leases
We the lease our office facilities on a month-to-month lease with either party having the option to terminate with 30 days notice. The Company or Company employees or contractors own all of the computer and office equipment that is used in the course of business. We do not have any lease agreements for any office equipment.
| F-22 |
NOTE 11 – INCOME TAXES
The Company accounts for income taxes in accordance with standards of disclosure propounded by the FASB, and any related interpretations of those standards sanctioned by the FASB. Accordingly, deferred tax assets and liabilities are determined based on differences between the financial statement and tax bases of assets and liabilities, as well as a consideration of net operating loss and credit carry forwards, using enacted tax rates in effect for the period in which the differences are expected to impact taxable income. A valuation allowance is established, when necessary, to reduce deferred tax assets to the amount that is more likely than not to be realized. Due to the uncertainty as to the utilization of net operating loss carry forwards, a valuation allowance has been made to the extent of any tax benefit that net operating losses may generate.
The provision for income taxes consists primarily of state minimum franchise taxes and totaled $400 and $1,565 for the years ended December 31, 2015 and 2014, respectively. For Federal and California income tax purposes, the Company has net operating loss carry forwards that expire through 2029. The net operating loss as of December 31, 2015 and 2013 were $2,845,460 and $1,700,527, respectively. No tax benefit has been reported in the financial statements because after evaluating our own potential tax uncertainties, the Company has determined that there are no material uncertain tax positions that have a greater than 50% likelihood of reversal if the Company were to be audited.
The deferred tax asset and the valuation allowance consist of the following at December 31:
| 2015 |
|
| 2014 |
| |||
|
|
|
|
|
| |||
Deferred tax asset |
| $ | 967,456 |
|
| $ | 578,179 |
|
Valuation allowance |
|
| (967,456 | ) |
|
| (578,179 | ) |
|
|
|
|
|
|
|
| |
Net |
| $ | - |
|
| $ | - |
|
NOTE 12 – SUBSEQUENT EVENTS
Subsequent to December 31, 2015, we issued a total of 11,915,495 shares of our common stock in the conversion of convertible notes payable principal totaling $4,400 and accrued interest payable totaling $962.
| F-23 |
ITEM 9 – CHANGES IN AND DISAGREEMENTS WITH ACCOUNTANTS ON ACCOUNTING AND FINANCIAL DISCLOSURE
There are no items required to be reported under this Item.
ITEM 9A – CONTROLS AND PROCEDURES
(a) Evaluation of Disclosure Controls and Procedures
We carried out an evaluation, under the supervision and with the participation of our management, including our Chief Executive Officer and Chief Financial Officer, of the effectiveness of our disclosure controls and procedures (as defined) in Exchange Act Rules 13a – 15(c) and 15d – 15(e)). Based upon that evaluation, our Chief Executive Officer and Chief Financial Officer, who are our principal executive officer and principal financial officers, respectively, concluded that, as of the end of the period ended December 31, 2015, our disclosure controls and procedures were effective (1) to ensure that information required to be disclosed by us in reports that we file or submit under the Exchange Act is recorded, processed, summarized and reported, within the time periods specified in the SEC's rules and forms and (2) to ensure that information required to be disclosed by us in the reports that we file or submit under the Exchange Act is accumulated and communicated to us, including our chief executive and chief financial officers, as appropriate to allow timely decisions regarding required disclosure.
Our Chief Executive Officer and Chief Financial Officer do not expect that our disclosure controls or internal controls will prevent all error and all fraud. No matter how well conceived and operated, our disclosure controls and procedures can provide only a reasonable level of assurance regarding the reliability of financial reporting and the preparation of financial statements for external purposes in accordance with generally accepted accounting principles. Further, the design of a control system must reflect the fact that there are resource constraints, and the benefits of controls must be considered relative to their costs. Because of the inherent limitations in all control systems, no evaluation of controls can provide absolute assurance that all control issues and instances of fraud, if any, within the Company have been detected. These inherent limitations include the realities that judgments in decision-making can be faulty, and that breakdowns can occur because of a simple error or mistake. Additionally, controls can be circumvented if there exists in an individual a desire to do so. There can be no assurance that any design will succeed in achieving its stated goals under all potential future conditions.
Furthermore, smaller reporting companies face additional limitations. Smaller reporting companies employ fewer individuals and find it difficult to properly segregate duties. Often, one or two individuals control every aspect of the company's operation and are in a position to override any system of internal control. Additionally, smaller reporting companies tend to utilize general accounting software packages that lack a rigorous set of software controls.
| 41 |
(b) Management's Annual Report on Internal Control Over Financial Reporting
Our management is responsible for establishing and maintaining adequate internal control over financial reporting. Internal control over financial reporting is defined in Rules 13a-15(f) and 15d-15(f) promulgated under the Exchange Act, as amended, as a process designed by, or under the supervision of, our Chief Executive Officer and Chief Financial Officer, and effected by our board of directors, management and other personnel, to provide reasonable assurance regarding the reliability of financial reporting and the preparation of financial statements for external purposes in accordance with generally accepted accounting principles in the United States and includes those policies and procedures that:
| · | Pertain to the maintenance of records that in reasonable detail accurately and fairly reflect our transactions and any disposition of our assets; |
|
|
|
| · | Provide reasonable assurance that transactions are recorded as necessary to permit preparation of financial statements in accordance with generally accepted accounting principles, and that our receipts and expenditures are being made only in accordance with authorizations of our management and directors; and |
|
|
|
| · | Provide reasonable assurance regarding prevention or timely detection of unauthorized acquisition, use or disposition of our assets that could have a material effect on the financial statements. |
A material weakness is a deficiency, or a combination of deficiencies, in internal control over financial reporting, such that there is a reasonable possibility that a material misstatement of our annual or interim financial statements will not be prevented or detected on a timely basis. Our management assessed the effectiveness of our internal control over financial reporting as of December 31, 2015. In making this assessment, our management used the criteria set forth by the Committee of Sponsoring Organizations of the Treadway Commission (COSO) in Internal Control-Integrated Framework. Based on this assessment, Management did not identify any material weaknesses that have caused management to conclude that, as of December 31, 2015, our disclosure controls and procedures, and our internal control over financial reporting, were not effective at the reasonable assurance level.
(c) Changes in Internal Control over Financial Reporting
There are no changes to report during our fiscal quarter ended December 31, 2015.
ITEM 9B – OTHER INFORMATION
There are no events required to be disclosed by the Item.
| 42 |
PART III
ITEM 10 – DIRECTORS, EXECUTIVE OFFICERS AND CORPORATE GOVERNANCE
Directors and Executive Officers
The following table sets forth the names, ages, and biographical information of each of our current directors and executive officers, and the positions with the Company held by each person, and the date such person became a director or executive officer of the Company. Our executive officers are elected annually by the Board of Directors. The directors serve one-year terms until their successors are elected. The executive officers serve terms of one year or until their death, resignation or removal by the Board of Directors. Family relationships among any of the directors and officers are described below.
Name | Age | Position | ||
Craig Holland | 55 | President, Chief Executive Officer, Chief Creative Officer, and Director | ||
Mick Donahoo | 46 | Chief Operating Officer, Secretary, Chief Financial Officer, Treasurer, and Director |
Craig Holland co-founded Freeze Tag in October 2005. Prior to founding Freeze Tag, Craig founded Thumbworks, a publisher of mobile gaming applications, in January 2002 and served as the CEO of Thumbworks from its formation until its acquisition by In-Fusio, a mobile game publisher and mobile entertainment platform provider in January 2005. As CEO of Thumbworks, Mr. Holland drove the organization's strategic direction, overseeing carrier relations, business development and licensing initiatives which led to partnerships with some of the world's leading brands such as Etch A SketchÒ, Nickelodeon, Suzuki, Paramount Pictures, and Honda. Prior to founding Thumbworks, Mr. Holland founded Nine Dots, an interactive marketing firm in North America whose clients included a number of high profile consumer brands such as Nestle, Quaker Oats, Qualcomm and General Motors, in 1992. Mr. Holland served as the CEO of Nine Dots from its formation until its sale to CyberSight, a Canadian-based interactive marketing company, in September 2000. Mr. Holland holds an MBA with an emphasis in Marketing from the University of Southern California (USC) and a Bachelor of Arts in English Literature from the University of California at Los Angeles (UCLA).
Mick Donahoo co-founded Freeze Tag in October 2005 and in his role as COO, Mr. Donahoo oversees product planning, design, and software development of all games and technology. With over 19 years of technology experience, Mr. Donahoo has produced over 25 mobile games distributed via 20 worldwide wireless carriers. Prior to founding Freeze Tag, Mr. Donahoo led North American development for Thumbworks and following its acquisition, by In-Fusio, oversaw overseas engineering teams located in Taiwan, Thailand, India, Russia, and Korea. Prior to In-Fusio, Mick was a consulting executive at Ernst & Young, LLP in the Financial Services and Aerospace and Defense industries architecting and developing large-scale, three-tiered client/server applications. Mick holds a Bachelor of Science degree in Business and Management Information Systems from Brigham Young University.
Family Relationships
There are no family relationships among any of our officers, directors, or shareholders.
Historical Compensation of Directors
Other than as set forth herein no compensation has been given to any of the directors, although they may be reimbursed for any pre-approved out-of-pocket expenses.
| 43 |
Compliance with Section 16(a) of the Securities Exchange Act of 1934
Section 16(a) of the Securities Exchange Act of 1934 requires the Company's directors and executive officers and persons who own more than ten percent of a registered class of the Company's equity securities to file with the SEC initial reports of ownership and reports of changes in ownership of common stock and other equity securities of the Company. Officers, directors and greater than ten percent shareholders are required by SEC regulations to furnish the Company with copies of all Section 16(a) forms they file.
During the most recent fiscal year, to the Company's knowledge, the following delinquencies occurred:
Name |
| No. of Late |
|
| No. of Transactions |
|
| No. of Failures |
| |||
|
|
|
|
|
|
|
|
|
|
|
|
|
Craig Holland |
|
| 0 |
|
|
| 0 |
|
|
| 1 |
|
|
|
|
|
|
|
|
|
|
|
|
|
|
Mick Donahoo |
|
| 0 |
|
|
| 0 |
|
|
| 1 |
|
Board Meetings and Committees
During the 2015 fiscal year to date, the Board of Directors met on a regular basis and took written action on numerous other occasions. All the members of the Board attended the meetings. The written actions were by unanimous consent.
Code of Ethics
We have not adopted a written code of ethics, because we believe and understand that our officers and directors adhere to and follow ethical standards without the necessity of a written policy.
Audit Committee
We do not currently have an audit committee.
Compensation Committee
We do not currently have a compensation committee.
ITEM 11 - EXECUTIVE COMPENSATION
Executive Officers and Directors
We do not currently have written employment agreements with our executives, Craig Holland and Mick Donahoo. Both are at-will employees whose compensation is set forth in the Summary Compensation Table below.
| 44 |
Summary Compensation Table
The following table sets forth information with respect to compensation earned by our Chief Executive Officer and Chief Financial Officer for the fiscal years ended December 31, 2015, 2014 and 2013.
Name and |
| Year |
| Salary ($) |
|
| Bonus ($) |
|
| Stock Awards ($) |
|
| Option Awards ($) |
|
| Non-Equity Incentive Plan Compensation ($) |
|
| Nonqualified Deferred Compensation ($) |
|
| All Other Compensation ($) |
|
| Total ($) |
| ||||||||
|
|
|
|
|
|
|
|
|
|
|
|
|
|
|
|
|
|
|
|
|
|
|
|
|
| |||||||||
Craig Holland |
| 2015 |
|
| 159,600 |
|
|
| - |
|
|
| - |
|
|
| - |
|
|
| - |
|
|
| - |
|
|
| - |
|
|
| 159,600 |
|
President, CEO |
| 2014 |
|
| 159,600 |
|
|
| - |
|
|
| - |
|
|
| - |
|
|
| - |
|
|
| - |
|
|
| - |
|
|
| 159,600 |
|
| 2013 |
|
| 19,950 |
|
|
| - |
|
|
| - |
|
|
| - |
|
|
| - |
|
|
| - |
|
|
| - |
|
|
| 19,950 |
| |
|
|
|
|
|
|
|
|
|
|
|
|
|
|
|
|
|
|
|
|
|
|
|
|
|
|
|
|
|
|
|
|
|
| |
Mick Donahoo |
| 2015 |
|
| 159,600 |
|
|
| - |
|
|
| - |
|
|
| - |
|
|
| - |
|
|
| - |
|
|
| - |
|
|
| 159,600 |
|
COO, VP |
| 2014 |
|
| 159,600 |
|
|
| - |
|
|
| - |
|
|
| - |
|
|
| - |
|
|
| - |
|
|
| - |
|
|
| 159,600 |
|
| 2013 |
|
| 19,950 |
|
|
| - |
|
|
| - |
|
|
| - |
|
|
| - |
|
|
| - |
|
|
| - |
|
|
| 19,950 |
| |
Director Compensation
The following table sets forth director compensation as of for the fiscal year ended December 31, 2015:
Name |
| Fees Earned or Paid in Cash ($) |
|
| Stock Awards ($) |
|
| Option Awards ($) |
|
| Non-Equity Incentive Plan Compensation ($) |
|
| Nonqualified Deferred Compensation Earnings ($) |
|
| All Other Compensation ($) |
|
| Total ($) |
| |||||||
|
|
|
|
|
|
|
|
|
|
|
|
|
|
|
|
|
|
|
|
| ||||||||
Craig Holland |
|
| - |
|
|
| - |
|
|
| - |
|
|
| - |
|
|
| - |
|
|
| - |
|
|
| - |
|
|
|
|
|
|
|
|
|
|
|
|
|
|
|
|
|
|
|
|
|
|
|
|
|
|
|
|
| |
Mick Donahoo |
|
| - |
|
|
| - |
|
|
| - |
|
|
| - |
|
|
| - |
|
|
| - |
|
|
| - |
|
Outstanding Equity Awards at Fiscal Year-End
On March 20, 2006, our Board of Directors and shareholders approved the Freeze Tag, Inc. 2006 Stock Plan. Pursuant to the Plan, we reserved 2,920,500 shares (post-split) of our common stock to be issued to employees and consultants for services rendered to the company. As of December 31, 2008, we had issued options to acquire a total of 1,247,850 shares (post-split) of our common stock to seven of our employees and/or consultants. Effective as of October 15, 2009, all seven of the option holders converted their options into a total of 1,123,065 shares of our common stock.
| 45 |
The following table sets forth certain information concerning outstanding stock awards held by the Named Executive Officers as of December 31, 2015:
Option Awards | Stock Awards | |||||||||||||||||||||||||||||||||||
Name |
| Number of Securities Underlying Unexercised Options (#) Exercisable |
|
| Number of Securities Underlying Unexercised Options (#) Unexercisable |
|
| Equity Incentive Plan Awards: Number of Securities Underlying Unexercised Unearned Options (#) |
|
| Option Exercise Price ($) |
|
| Option Expiration Date |
|
| Number of Shares or Units of Stock That Have Not Vested (#) |
|
| Market Value of Shares or Units of Stock That Have Not Vested ($) |
|
| Equity Incentive Plan Awards: Number of Unearned Shares, Units or Other Rights That Have Not Vested (#) |
|
| Equity Incentive Plan Awards: Market or Payout Value of Unearned Shares, Units or Other Rights That Have Not Vested ($) |
| |||||||||
|
|
|
|
|
|
|
|
|
|
|
|
|
|
|
|
|
|
|
|
|
|
|
|
|
|
| ||||||||||
Craig Holland |
|
| - |
|
|
| 115,000 |
|
|
| - |
|
|
| 0.11 |
|
| 8/02/20 |
|
|
| - |
|
|
| - |
|
|
| - |
|
|
| - |
| |
|
|
|
|
|
|
|
|
|
|
|
|
|
|
|
|
|
|
|
|
|
|
|
|
|
|
|
|
|
|
|
|
|
|
| ||
Mick Donahoo |
|
| - |
|
|
| - |
|
|
| - |
|
|
| - |
|
|
| - |
|
|
| - |
|
|
| - |
|
|
| - |
|
|
| - |
|
ITEM 12 - SECURITY OWNERSHIP OF CERTAIN BENEFICIAL OWNERS AND MANAGEMENT AND RELATED STOCKHOLDER MATTERS
The following table sets forth, as of March 9, 2016, certain information with respect to our equity securities owned of record or beneficially by (i) each of our Officers and Directors; (ii) each person who owns beneficially more than 5% of each class of our outstanding equity securities; and (iii) all Directors and Executive Officers as a group.
Common Stock
Title of Class |
| Name and Address |
| Amount and Beneficial Ownership |
|
| Percentof |
| ||
|
|
|
|
|
|
|
|
| ||
Common Stock |
| Craig Holland (2) |
|
| 66,340,084 | (4) |
|
| 22.70 | %(4) |
|
|
|
|
|
|
|
|
|
|
|
Common Stock |
| Mick Donahoo (2) |
|
| 52,945,609 | (6) |
|
| 18.11 | %(6) |
|
|
|
|
|
|
|
|
|
| |
Common Stock |
| Holland Family Trust (5) |
|
| 10,680,356 | (5) |
|
| 5.79 | %(5) |
|
|
|
|
|
|
|
|
|
| |
Common Stock |
| All Directors and Officers As a Group (2 persons) |
|
| 119,285,683 | (4)(6) |
|
| 40.81 | %(4)(5)(6) |
_________________
| (1) | Unless otherwise indicated, based on 292,357,620 shares of common stock issued and outstanding. Shares of common stock subject to options or warrants currently exercisable, or exercisable within 60 days, are deemed outstanding for purposes of computing the percentage of the person holding such options or warrants, but are not deemed outstanding for the purposes of computing the percentage of any other person. |
| (2) | Indicates one of our officers or directors. |
| (3) | Unless indicated otherwise, the address of the shareholder is Freeze Tag, Inc., 18062 Irvine Blvd., Suite 103, Tustin, California 92780. |
46 |
| (4) | Includes options to purchase 115,000 shares of common stock that are exercisable on February 2, 2011. Mr. Holland is also the holder of promissory notes issued by us (as more fully-described in Item 13, below) that are convertible into shares of our common stock. However, because the promissory notes contain a limiter that disallows conversion if such conversions would cause the holder to own more than 4.99% of our outstanding common stock after the conversion and because Mr. Holland already owns more than 4.99% of our outstanding common stock, Mr. Holland is not deemed to beneficially own the conversion shares and no additional shares have been added to his share ownership in the above table. |
| (5) | The trustee for the Holland Family Trust is Craig Holland. The Holland Family Trust is also the holder of promissory notes issued by us (as more fully-described in Item 13, below) that are convertible into shares of our common stock. However, because the promissory notes contain a limiter that disallows conversion if such conversions would cause the holder to own more than 4.99% of our outstanding common stock after the conversion and because the Holland Family Trust already owns more than 4.99% of our outstanding common stock, the Holland Family Trust is not deemed to beneficially own the conversion shares and no additional shares have been added to his share ownership in the above table. |
| (6) | Mr. Donahoo is also the holder of promissory notes issued by us (as more fully-described in Item 13, below) that are convertible into shares of our common stock. However, because the promissory notes contain a limiter that disallows conversion if such conversions would cause the holder to own more than 4.99% of our outstanding common stock after the conversion and because Mr. Donahoo already owns more than 4.99% of our outstanding common stock, Mr. Donahoo is not deemed to beneficially own the conversion shares and no additional shares have been added to his share ownership in the above table. |
We are not aware of any person who owns of record, or is known to own beneficially, five percent or more of the outstanding securities of any class of the issuer, other than as set forth above. We are not aware of any person who controls the issuer as specified in Section 2(a)(1) of the 1940 Act. There are no classes of stock other than common stock issued or outstanding. We do not have an investment advisor.
There are no current arrangements which will result in a change in control.
ITEM 13 CERTAIN RELATIONSHIPS AND RELATED TRANSACTIONS, AND DIRECTOR INDEPENDENCE
Convertible Notes Payable – Related Party
As of December 31, 2015 and 2014, we had a convertible note payable to the Holland Family Trust (the "Holland Family Trust Convertible Note") with a balance of $222,572. The Holland Family Trust Convertible Note is convertible into Company common stock at the greater of (i) the Variable Conversion Price and (ii) the Fixed Conversion Price. The "Variable Conversion Price" shall mean 50% multiplied by the Market Price (representing a discount rate of 50%). "Market Price" means the average of the three lowest trading prices for the Company's common stock during the twenty-five (25) trading-day period ending on the latest complete trading day prior to the date of conversion. "Fixed Conversion Price" shall mean $0.00005. The promissory note contains a limiter that disallows conversion if such conversions would cause the holder to own more than 4.99% of our outstanding common stock after the conversion. Furthermore, at any time, the Company may pay the balance of the unconverted note payable in cash.
As of September 30, 2014, $72,107 of accrued interest was added to the note principal and $813,602 of the note was transferred to Craig Holland. A new convertible note for $222,572 was issued to the Holland Family Trust with the same terms as the previous note, with the exception of the maturity date, which was extended to September 30, 2015 and has since been extended to September 30, 2016. As of December 31, 2015 and 2014, accrued interest related to the Holland Family Trust Convertible Note was $27,867 and $5,610, respectively.
| 47 |
On September 30, 2014, $813,602 principal balance (including interest) of the Holland Family Trust Convertible Note was transferred to Craig Holland (the "Holland Transferred Convertible Note"). The Holland Transferred Convertible Note retains the same terms as the original Holland Family Trust Convertible Note with the exception of the maturity date, which was extended to September 30, 2015 and has since been extended to September 30, 2016. As of December 31, 2015 and 2014, accrued interest related to the Holland Transferred Convertible Note was $101,867 and $20,507, respectively.
On December 31, 2013, the Company converted $186,450 of accrued salaries due to Craig Holland into a convertible note (the "Holland Accrued Salary Note") and converted $186,450 of accrued salaries due to Mick Donahoo into a convertible note (the "Donahoo Accrued Salary Note"). The Holland Accrued Salary Note and the Donahoo Accrued Salary Note are convertible into Company common stock at the greater of (i) the Variable Conversion Price and (ii) the Fixed Conversion Price. The "Variable Conversion Price" shall mean 50% multiplied by the Market Price (representing a discount rate of 50%). "Market Price" means the average of the three lowest trading prices for the Company's common stock during the twenty-five (25) trading-day period ending on the latest complete trading day prior to the Conversion Date. "Fixed Conversion Price" shall mean $0.00005. The promissory notes contain a limiter that disallows conversion if such conversions would cause the holder to own more than 4.99% of our outstanding common stock after the conversion. As of December 31, 2015 and December 31, 2014, there was accrued interest related to each of these notes of $37,290 and $18,645, respectively.
On December 31, 2013, the Company converted a note payable to Mick Donahoo of $55,250 and accrued interest of $15,399 into a new convertible related party note in the amount of $70,649 (the "Mick Donahoo Convertible Note").
On December 31, 2013, the Company converted a note payable to Craig Holland of $35,100 and accrued interest of $11,432 into a new convertible related party note in the amount of $46,532 (the "Craig Holland Convertible Note").
The Mick Donahoo Convertible Note and the Craig Holland Convertible Note are convertible into Company common stock at the greater of (i) the Variable Conversion Price and (ii) the Fixed Conversion Price. The "Variable Conversion Price" shall mean 50% multiplied by the Market Price (representing a discount rate of 50%). "Market Price" means the average of the three lowest trading prices for the Company's common stock during the twenty-five (25) trading-day period ending on the latest complete trading day prior to the Conversion Date. "Fixed Conversion Price" shall mean $0.00005. Both promissory notes contain a limiter that disallows conversion if such conversions would cause the holder to own more than 4.99% of our outstanding common stock after the conversion. As of December 31, 2015 and December 31, 2014, there was accrued interest payable related to these notes totaling of $5,146 and $4,699, respectively.
On October 23, 2014, Craig Holland converted $35,000 principal and $2,836 accrued interest into 39,829,849 shares of our common stock.
On October 23, 2014, Mick Donahoo converted $35,000 principal and $2,836 accrued interest into 39,829,849 shares of our common stock.
On October 8, 2015, Craig Holland converted $4,607 principal and $2,028 accrued interest into 12,637,860 shares of the Company's common stock.
On October 8, 2015, Mick Donahoo converted $4,607 principal and $2,028 accrued interest into 12,637,860 shares of the Company's common stock.
Total accrued interest payable for the related party convertible notes was $209,461 and $68,106 as of December 31, 2015 and 2014, respectively.
Stock Options
On August 2, 2010, we granted Craig Holland, our President, Chief Executive Officer, and a Director, options to purchase up to 115,000 shares of our common stock at an exercise price of $0.11 per share. The options were granted under the Freeze Tag, Inc. 2006 Stock Plan.
| 48 |
ITEM 14 – PRINCIPAL ACCOUNTING FEES AND SERVICES
Audit and Related Fees
During the years ended December 31, 2015 and 2014, M&K CPAS, PLLC charged us $27,200 and $32,250, respectively, in fees for professional services for the audit of our financial statements included in our annual report and for reviews of our quarterly reports.
Tax Fees
During the years ended December 31, 2015 and 2014, M&K CPAS, PLLC did not charge us for professional services for tax preparation.
All Other Fees
During the years ended December 31, 2015 and 2014, M&K CPAS, PLLC did not charge us for any other fees.
Of the fees described above for the years ended December 31, 2015 and 2014, 100% was approved by the entire Board of Directors.
| 49 |
PART IV
ITEM 15 – EXHIBITS, FINANCIAL STATEMENT SCHEDULES
(a)(1) Financial Statements
The following financial statements are filed as part of this report:
Report of Independent Registered Public Accounting Firm |
|
| F-1 |
|
|
|
|
| |
Balance Sheets as of December 31, 2015 and December 31, 2014 |
|
| F-2 |
|
|
|
|
| |
Statements of Operations for the Years Ended December 31, 2015 and 2014 |
|
| F-3 |
|
|
|
|
| |
Statement of Shareholders' Deficit for the Years Ended December 31, 2015 and December 31, 2014 |
|
| F-4 |
|
|
|
|
| |
Statements of Cash Flows for the Years Ended December 31, 2015 and 2014 |
|
| F-5 |
|
|
|
|
| |
Notes to Financial Statements |
|
| F-6 |
|
(a)(2) Financial Statement Schedules
We do not have any financial statement schedules required to be supplied under this Item.
(a)(3) Exhibits
Refer to (b) below.
(b) Exhibits
3.1 (1) | Articles of Incorporation of Freeze Tag, Inc. | |
3.2 (1) | Articles of Amendment to Articles of Incorporation | |
3.3 (1) | Bylaws of Freeze Tag, Inc. | |
3.4 (10) | Articles of Amendment to Certificate of Incorporation February 4, 2014 | |
3.5* | Articles of Amendment to Certificate of Incorporation filed February 18, 2016 | |
|
|
|
4.1 (1) |
| Freeze Tag, Inc. 2006 Stock Plan |
10.1 (1) | 10% Convertible Promissory Note dated July 1, 2010 with The Holland Family Trust |
| 50 |
10.2 (1) | Support Services Agreement with Cardiff Partners, LLC dated October 12, 2009 | |
10.3 (1) | Amendment No. 1 to Support Services Agreement with Cardiff Partners, LLC dated March 2, 2010 | |
10.4 (1) | Amendment No. 2 to Support Services Agreement with Cardiff Partners, LLC dated March 3, 2010 | |
10.5 (1) | Form of Conversion Agreement for October 2009 Conversions | |
10.6 (1) | Form of Option Conversion Agreement for October 2009 Conversions | |
10.7 (1) | Placement Agent and Advisory Services Agreement with Monarch Bay Associates, LLC dated October 12, 2009 | |
10.8 (1) | Corporate Communications Consulting Agreement Michael Southworth dated September 25, 2009 | |
10.9 (1) | Lock-Up Agreement dated November 10, 2009 | |
10.10 (2) | Loan Agreement with Sunwest Bank dated October 20, 2006, as amended | |
10.11 (3) | Securities Purchase Agreement with Asher Enterprises, Inc. dated July 21, 2011 | |
10.12 (3) | Convertible Promissory Note with Asher Enterprises, Inc. dated July 21, 2011 | |
10.13 (4) | Technology Transfer Agreement dated June 22, 2011 | |
10.14 (5) | Securities Purchase Agreement with Asher Enterprises, Inc. dated September 16, 2011 | |
10.15 (5) | Convertible Promissory Note with Asher Enterprises, Inc. dated September 16, 2011 | |
10.16 (6) | Securities Purchase Agreement with Asher Enterprises, Inc. dated December 6, 2011 | |
10.16 (6) | Convertible Promissory Note with Asher Enterprises, Inc. dated December 6, 2011 | |
10.17 (7) | Letter Agreement with Crucible Capital, Inc. dated February 29, 2012 | |
10.18 (8) | Amendment No. 1 to Securities Purchase Agreement with Asher Enterprises, Inc. dated July 21, 2011 | |
10.19 (8) | Amendment No. 1 to Securities Purchase Agreement with Asher Enterprises, Inc. dated September 16, 2011 | |
10.20 (8) | Amendment No. 1 to Securities Purchase Agreement with Asher Enterprises, Inc. dated December 6, 2011 |
| 51 |
10.21 (8) | Amendment No. 1 to Promissory Note with The Lebrecht Group, APLC dated November 17, 2011 | |
|
|
|
10.22 (9) |
| Convertible Promissory Note (10%) dated December 20, 2013 – Accredited Investor |
|
|
|
10.23 (9) |
| Convertible Promissory Note (10%) dated December 31, 2013 - Holland Family Trust |
|
|
|
10.24 (9) |
| Convertible Promissory Note (10%) dated December 31, 2013 – Craig Holland Debt |
|
|
|
10.25 (9) |
| Convertible Promissory Note (10%) dated December 31, 2013 – Craig Holland Salary |
|
|
|
10.26 (9) |
| Convertible Promissory Note (10%) dated December 31, 2013 – Mick Donahoo Salary |
|
|
|
10.27 (9) |
| Convertible Promissory Note (10%) dated December 31, 2013 – Mick Donahoo Debt |
|
|
|
10.28 (9) | Convertible Promissory Note (10%) dated December 31, 2013 – Robert Cowdell | |
|
|
|
31.1* | Rule 13a-14(a)/15d-14(a) Certification of Chief Executive Officer | |
31.2* | Rule 13a-14(a)/15d-14(a) Certification of Chief Financial Officer | |
32.1* | Section 1350 Certification of Chief Executive Officer | |
32.2* | Section 1350 Certification of Chief Financial Officer. | |
|
|
|
101.INS** |
| XBRL Instance Document |
|
|
|
101.SCH** |
| XBRL Taxonomy Extension Schema Document |
|
|
|
101.CAL** |
| XBRL Taxonomy Extension Calculation Linkbase Document |
|
|
|
101.DEF** |
| XBRL Taxonomy Extension Definition Linkbase Document |
|
|
|
101.LAB** |
| XBRL Taxonomy Extension Label Linkbase Document |
|
|
|
101.PRE** |
| XBRL Taxonomy Extension Presentation Linkbase Document |
Filed herewith. Pursuant to Rule 406T of Regulation S-T, these interactive data files are deemed not filed or part of a registration statement or prospectus for purposes of Sections 11 or 12 of the Securities Act of 1933 or Section 18 of the Securities Act of 1934 and otherwise are not subject to liability. Incorporated by reference from our Registration Statement on Form S-1, filed with the Commission on August 16, 2010. Incorporated by reference from Amendment No. 2 to our Registration Statement on Form S-1/A2, filed with the Commission on October 25, 2010. Incorporated by reference from Current Report on Form 8-K filed with the Commission on August 3, 2011. Incorporated by reference from Quarterly Report on Form 10-Q for the period ended June 30, 2011 filed with the Commission on August 15, 2011. Incorporated by reference from Current Report on Form 8-K filed with the Commission on September 21, 2011. Incorporated by reference from Current Report on Form 8-K filed with the Commission on December 23, 2011. Incorporated by reference from Current Report on Form 8-K filed with the Commission on March 8, 2012. Incorporated by reference from Annual Report on Form 10-K filed with the Commission on March 30, 2012. Incorporated by reference from Current Report on Form 8-K filed with the Commission on February 4, 2014. Incorporated by reference from Current Report on Form 14C filed with the Commission on December 31, 2013.
* ** (1) (2) (3) (4) (5) (6) (7) (8) (9) (10)
| 52 |
SIGNATURES
In accordance with Section 13 or 15(d) of the Exchange Act, the registrant caused this report to be signed on its behalf by the undersigned, thereunto duly authorized.
Freeze Tag, Inc. | |||
| |||
Dated: March 30, 2016 | By: | /s/ Craig Holland |
|
Name: | Craig Holland |
| |
Its: | President and Chief Executive Officer |
| |
| |||
Dated: March 30, 2016 | By: | /s/ Mick Donahoo |
|
| Name: | Mick Donahoo |
|
Its: | Chief Financial Officer, Chief Accounting Officer, |
| |
In accordance with the Exchange Act, this report has been signed below by the following persons on behalf of the registrant and in the capacities and on the dates indicated.
Dated: March 30, 2016 | By: | /s/ Craig Holland |
|
Name: | Craig Holland |
| |
Its: | Director, President and Chief Executive Officer |
| |
| |||
Dated: March 30, 2016 | By: | /s/ Mick Donahoo |
|
Name: | Mick Donahoo |
| |
Its: | Director, Chief Financial Officer, |
|
53