Attached files
| file | filename |
|---|---|
| 8-K - FORM 8-K - ADVANCED DRAINAGE SYSTEMS, INC. | d148159d8k.htm |
| EX-99.1 - EX-99.1 - ADVANCED DRAINAGE SYSTEMS, INC. | d148159dex991.htm |
| Exhibit 99.2
|
Restatement & FY2016 Update
LEADERSHIP GROWTH MOMENTUMTHROUGH STRENGTH
|
|
Management Presenters
Joe Chlapaty
Chairman and Chief Executive Officer
Scott Cottrill
Executive Vice President, Chief Financial Officer, Secretary and Treasurer
Mike Higgins
Director, Investor Relations & Business Strategy
LEADERSHIP GROWTH MOMENTUM
THROUGH STRENGTH
2
|
|
Safe Harbor and Non-GAAP Financial Metrics
Certain statements in this presentation may be deemed to be forward-looking statements within the meaning of Section 27A of the Securities Act of 1933, as amended, and Section 21E of the Securities Exchange Act of 1934, as amended. Such statements include, but are not limited to, statements regarding the anticipated timing for the issuance of additional historic and future financial information and related filings. These statements are not historical facts but rather are based on the Companys current expectations, estimates and projections regarding the Companys business, operations and other factors relating thereto. Words such as _may,” “ will,” “ could,” “ would,” “ should,” “ anticipate,” “ predict,” “ potential,” “continue,” ”expects,” “ intends,” “ plans,” “ projects,” “ believes,” “ estimates,” “ confident_ and similar expressions are used to identify these forward-looking statements. Factors that could cause actual results to differ from those reflected in forward-looking statements relating to our operations and business include: fluctuations in the price and availability of resins and other raw materials and our ability to pass any increased costs of raw materials on to our customers in a timely manner; volatility in general business and economic conditions in the markets in which we operate, including, without limitation, factors relating to availability of credit, interest rates, fluctuations in capital and business and consumer confidence; cyclicality and seasonality of the non-residential and residential construction markets and infrastructure spending; the risks of increasing competition in our existing and future markets, including competition from both manufacturers of high performance thermoplastic corrugated pipe and manufacturers of products using alternative materials; our ability to continue to convert current demand for concrete, steel and PVC pipe products into demand for our high performance thermoplastic corrugated pipe and Allied Products; the effect of weather or seasonality; the loss of any of our significant customers; the risks of doing business internationally; the risks of conducting a portion of our operations through joint ventures; our ability to expand into new geographic or product markets; our ability to achieve the acquisition component of our growth strategy; the risk associated with manufacturing processes; our ability to manage our assets; the risks associated with our product warranties; our ability to manage our supply purchasing and customer credit policies; the risks associated with our self-insured programs; our ability to control labor costs and to attract, train and retain highly-qualified employees and key personnel; our ability to protect our intellectual property rights; changes in laws and regulations, including environmental laws and regulations; our ability to project product mix; the risks associated with our current levels of indebtedness; our ability to meet future capital requirements and fund our liquidity needs; the risk that additional information may arise during the course of the Companys ongoing accounting review that would require the Company to make additional adjustments or revisions or to restate further the financial statements and other financial data for certain prior periods and any future periods; a conclusion that the Companys disclosure controls and procedures (as defined in Rules 13a-15(e) and 15d-15(e) of the Exchange Act) were ineffective; the review of potential weaknesses or deficiencies in the Companys disclosure controls and procedures, and discovering further weaknesses of which we are not currently aware or which have not been detected; additional uncertainties related to accounting issues generally and other risks and uncertainties described in the Companys filings with the Securities and Exchange Commission. New risks and uncertainties emerge from time to time and it is not possible for the Company to predict all risks and uncertainties that could have an impact on the forward-looking statements contained in this press release. In light of the significant uncertainties inherent in the forward-looking information included herein, the inclusion of such information should not be regarded as a representation by the Company or any other person that the Companys expectations, objectives or plans will be achieved in the timeframe anticipated or at all. Investors are cautioned not to place undue reliance on the Companys forward-looking statements and the Company undertakes no obligation to publicly update or revise any forward-looking statements, whether as a result of new information, future events or otherwise, except as required by law.
This presentation includes certain non-GAAP financial measures to describe the Companys performance. The reconciliation of those measures to GAAP measures are provided within the appendix of the presentation. Those disclosures should not be viewed as a substitute for operating results determined in accordance with GAAP, nor are they necessarily comparable to non-GAAP performance measures that may be presented by other companies.
LEADERSHIP GROWTH MOMENTUMTHROUGH STRENGTH 3
|
|
Opening Remarks
The leading player in the industry.
The only complete solutions provider for the water management industry,
with a history of product innovation.
Track record of market share gains with material conversion growing
steadily over time.
Large addressable opportunity across diverse construction markets.
Demonstrated ability to deliver above market growth, EBITDA margin
expansion and strong cash flows.
Experienced management team with significant ownership stake.
LEADERSHIP GROWTH MOMENTUM
THROUGH STRENGTH
4
|
|
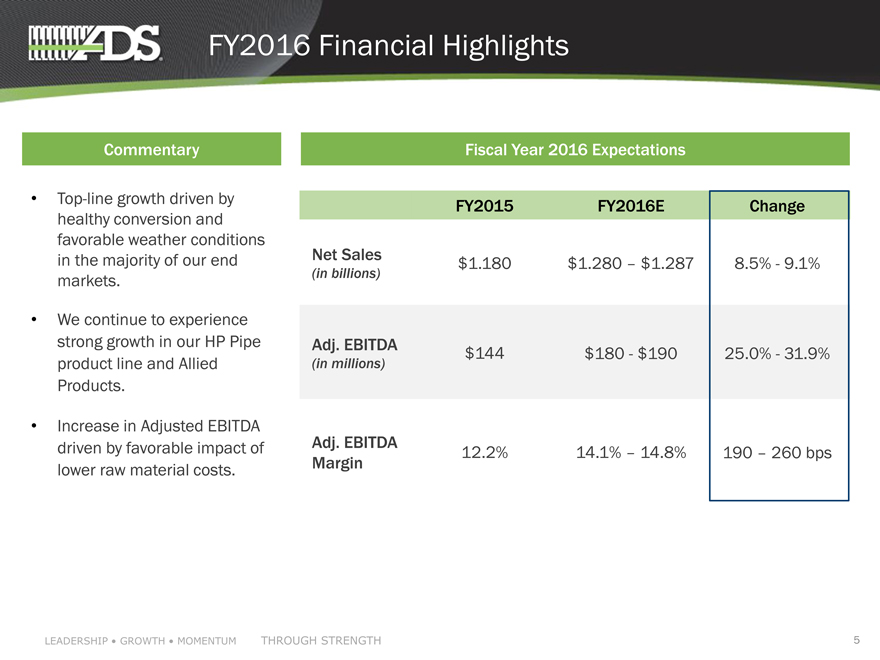
FY2016 Financial Highlights
Commentary
Top-line growth driven by
healthy conversion and
favorable weather conditions
in the majority of our end
markets.
We continue to experience
strong growth in our HP Pipe
product line and Allied
Products.
Increase in Adjusted EBITDA
driven by favorable impact of
lower raw material costs.
Fiscal Year 2016 Expectations
FY2015 FY2016E Change
Net Sales $1.180 $1.280 $1.287 8.5%—9.1%
(in billions)
Adj. EBITDA $144 $180—$190 25.0%—31.9%
(in millions)
Adj. EBITDA 12.2% 14.1% 14.8% 190 260 bps
Margin
LEADERSHIP GROWTH MOMENTUM
THROUGH STRENGTH
5
|
|
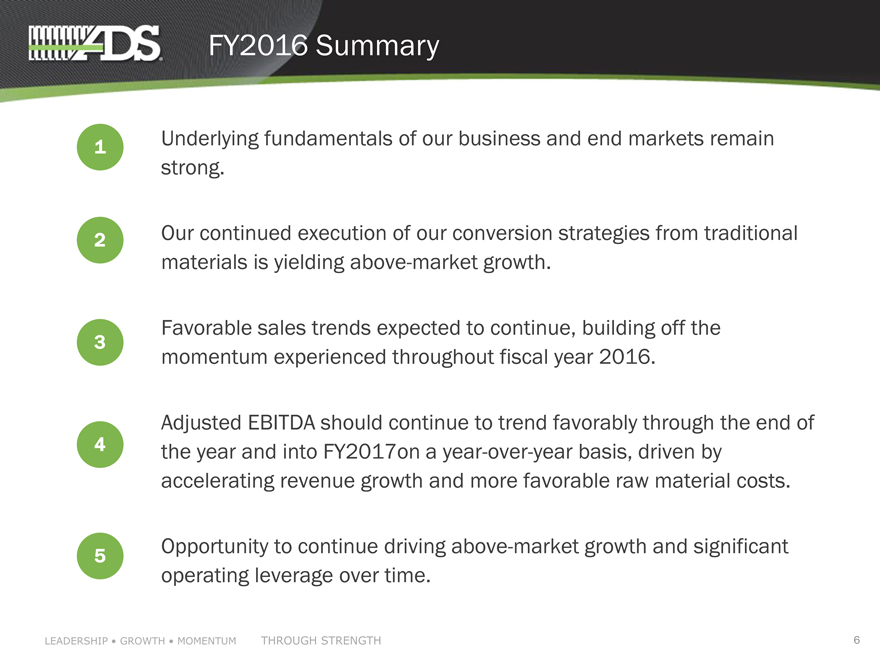
FY2016 Summary
1 Underlying fundamentals of our business and end markets remain
strong.
2 Our continued execution of our conversion strategies from traditional
materials is yielding above-market growth.
Favorable sales trends expected to continue, building off the
3
momentum experienced throughout fiscal year 2016.
Adjusted EBITDA should continue to trend favorably through the end of
4 the year and into FY2017on a year-over-year basis, driven by
accelerating revenue growth and more favorable raw material costs.
5 Opportunity to continue driving above-market growth and significant operating leverage over time.
LEADERSHIP GROWTH MOMENTUM
THROUGH STRENGTH
6
|
|
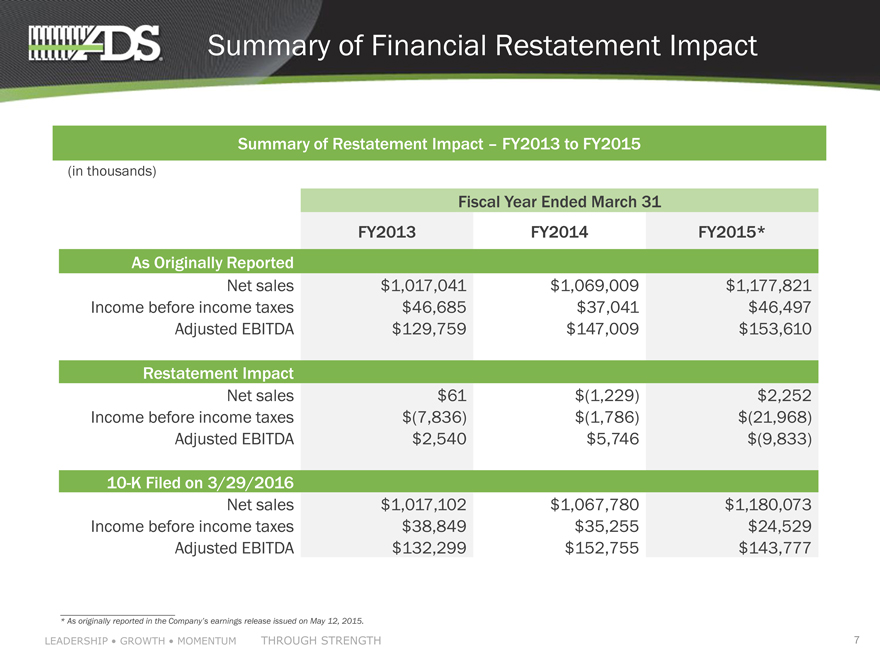
Summary of Financial Restatement Impact
Summary of Restatement Impact FY2013 to FY2015
(in thousands)
Fiscal Year Ended March 31
FY2013 FY2014 FY2015*
As Originally Reported
Net sales $1,017,041 $1,069,009 $1,177,821
Income before income taxes $46,685 $37,041 $46,497
Adjusted EBITDA $129,759 $147,009 $153,610
Restatement Impact
Net sales $61 $(1,229) $2,252
Income before income taxes $(7,836) $(1,786) $(21,968)
Adjusted EBITDA $2,540 $5,746 $(9,833)
10-K Filed on 3/29/2016
Net sales $1,017,102 $1,067,780 $1,180,073
Income before income taxes $38,849 $35,255 $24,529
Adjusted EBITDA $132,299 $152,755 $143,777
* As originally reported in the Companys earnings release issued on May 12, 2015.
LEADERSHIP GROWTH MOMENTUM
THROUGH STRENGTH
7
|
|
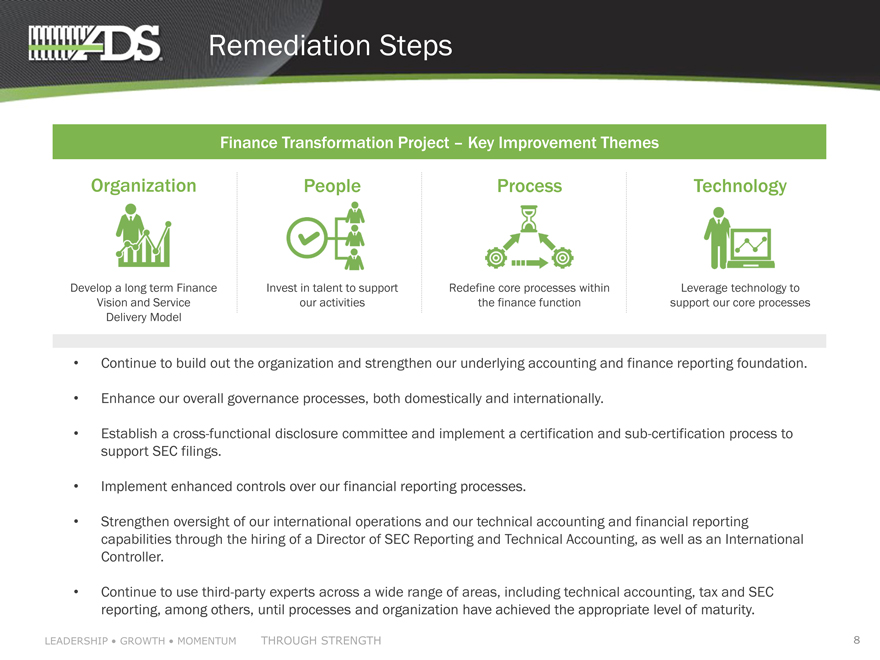
Remediation Steps
Finance Transformation Project Key Improvement Themes
Organization People Process Technology
Develop a long term Finance Invest in talent to support Redefine core processes within Leverage technology to
Vision and Service our activities the finance function support our core processes
Delivery Model
Continue to build out the organization and strengthen our underlying accounting and finance reporting foundation.
Enhance our overall governance processes, both domestically and internationally.
Establish a cross-functional disclosure committee and implement a certification and sub-certification process to
support SEC filings.
Implement enhanced controls over our financial reporting processes.
Strengthen oversight of our international operations and our technical accounting and financial reporting
capabilities through the hiring of a Director of SEC Reporting and Technical Accounting, as well as an International
Controller.
Continue to use third-party experts across a wide range of areas, including technical accounting, tax and SEC
reporting, among others, until processes and organization have achieved the appropriate level of maturity.
LEADERSHIP GROWTH MOMENTUM
THROUGH STRENGTH
8
|
|
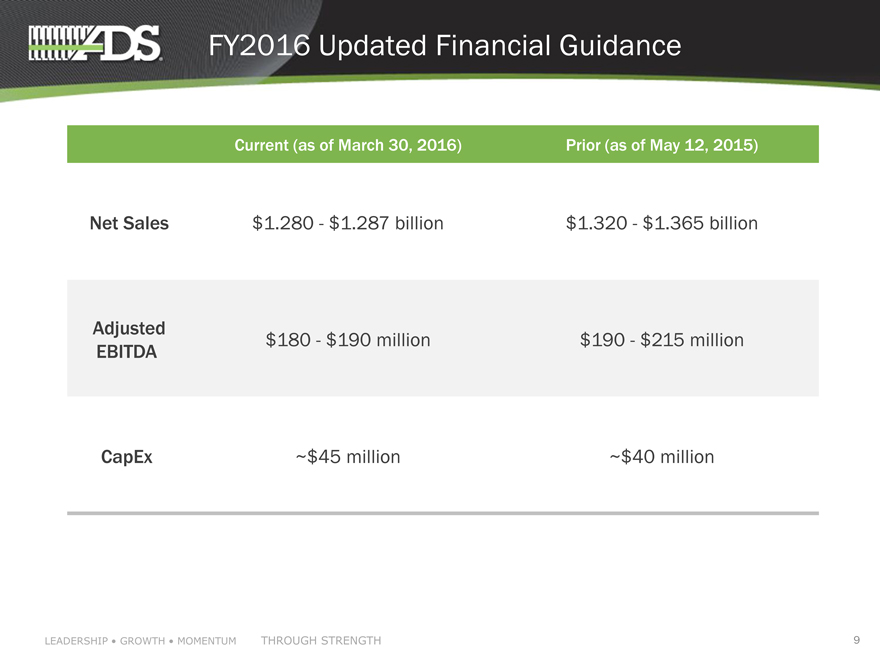
FY2016 Updated Financial Guidance
Current (as of March 30, 2016)
Prior (as of May 12, 2015)
Net Sales
$1.280—$1.287 billion
$1.320—$1.365 billion
Adjusted $180—$190 million $190—$215 million
EBITDA
CapEx
~$45 million
~$40 million
LEADERSHIP GROWTH MOMENTUM
THROUGH STRENGTH
9
|
|
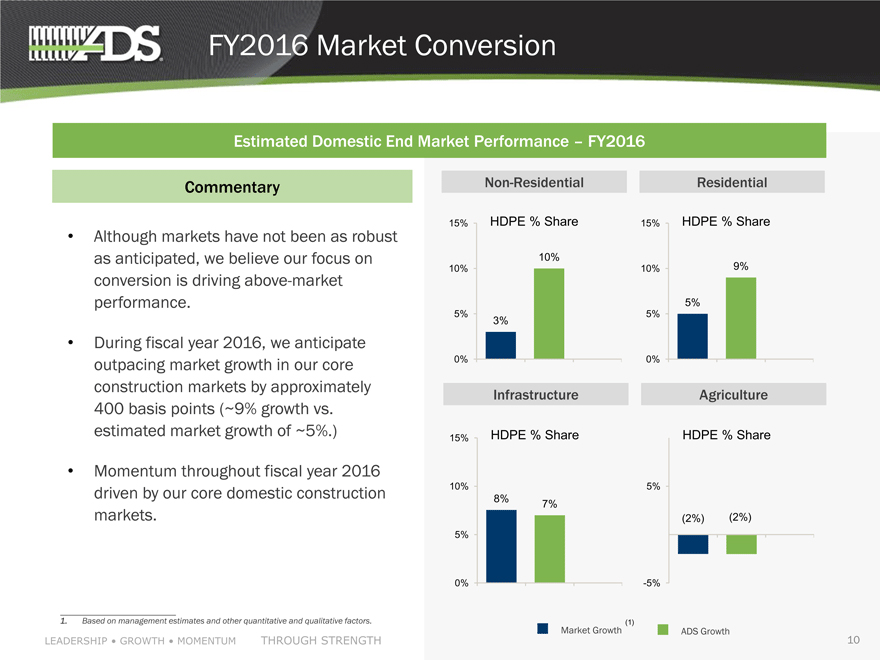
FY2016 Market Conversion
Estimated Domestic End Market Performance FY2016
Commentary Non-Residential Residential
Although markets have not been as robust as anticipated, we believe our focus on conversion is driving above-market performance.
During fiscal year 2016, we anticipate outpacing market growth in our core construction markets by approximately 400 basis points (~9% growth vs. estimated market growth of ~5%.)
Momentum throughout fiscal year 2016 driven by our core domestic construction markets.
1. Based on management estimates and other quantitative and qualitative factors.
LEADERSHIP GROWTH MOMENTUMTHROUGH STRENGTH
15% 15%
10%
10% 10% 9%
5%
5% 5%
3%
0% 0%
Infrastructure Agriculture
15%
10% 5%
8% 7%
(2%)(2%)
5%
0% -5%
Market Growth (1) ADS Growth
10
|
|
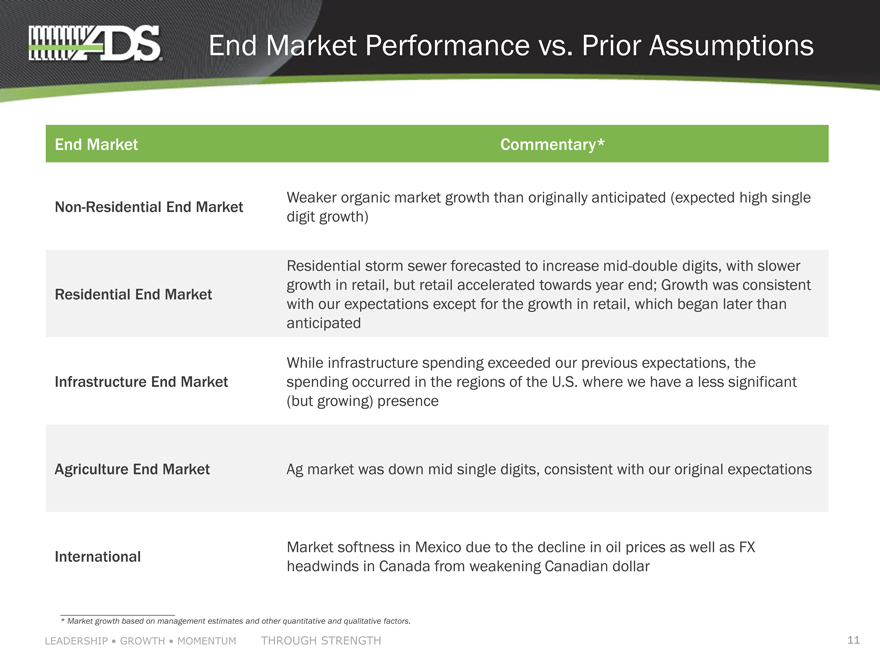
End Market Performance vs. Prior Assumptions
End Market
Non-Residential End Market
Residential End Market
Infrastructure End Market
Agriculture End Market
International
Commentary*
Weaker organic market growth than originally anticipated (expected high single digit growth)
Residential storm sewer forecasted to increase mid-double digits, with slower growth in retail, but retail accelerated towards year end; Growth was consistent with our expectations except for the growth in retail, which began later than anticipated
While infrastructure spending exceeded our previous expectations, the spending occurred in the regions of the U.S. where we have a less significant (but growing) presence
Ag market was down mid single digits, consistent with our original expectations
Market softness in Mexico due to the decline in oil prices as well as FX headwinds in Canada from weakening Canadian dollar
* Market growth based on management estimates and other quantitative and qualitative factors.
LEADERSHIP GROWTH MOMENTUM
THROUGH STRENGTH
11
|
|
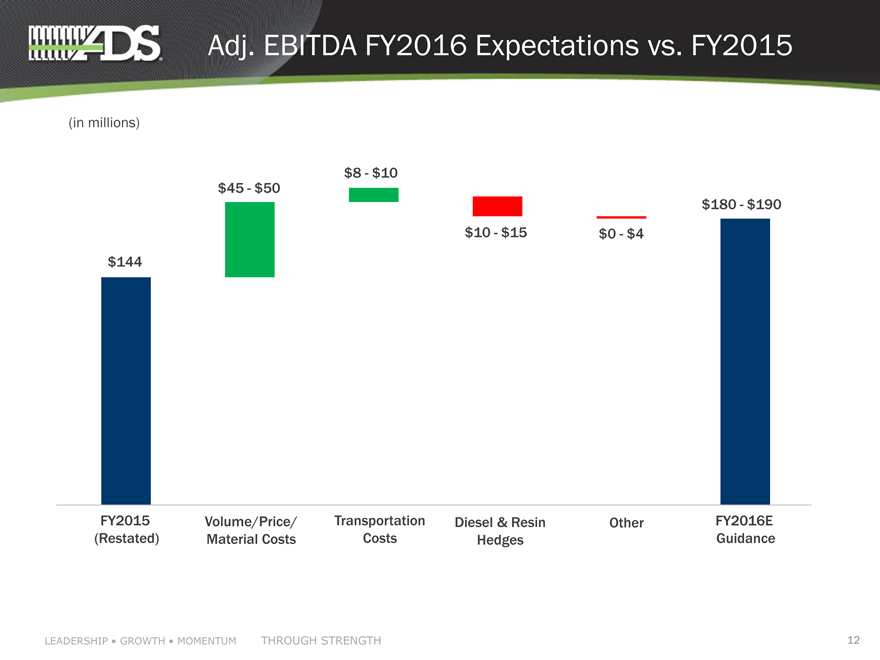
Adj. EBITDA FY2016 Expectations vs. FY2015
(in millions)
$8—$10
$45—$50
$180—$190
$10—$15
$0—$4
$144
FY2015 Volume/Price/ Transportation Diesel & Resin Other FY2016E
(Restated) Material Costs Costs Hedges Guidance
LEADERSHIP GROWTH MOMENTUM
THROUGH STRENGTH
12
|
|
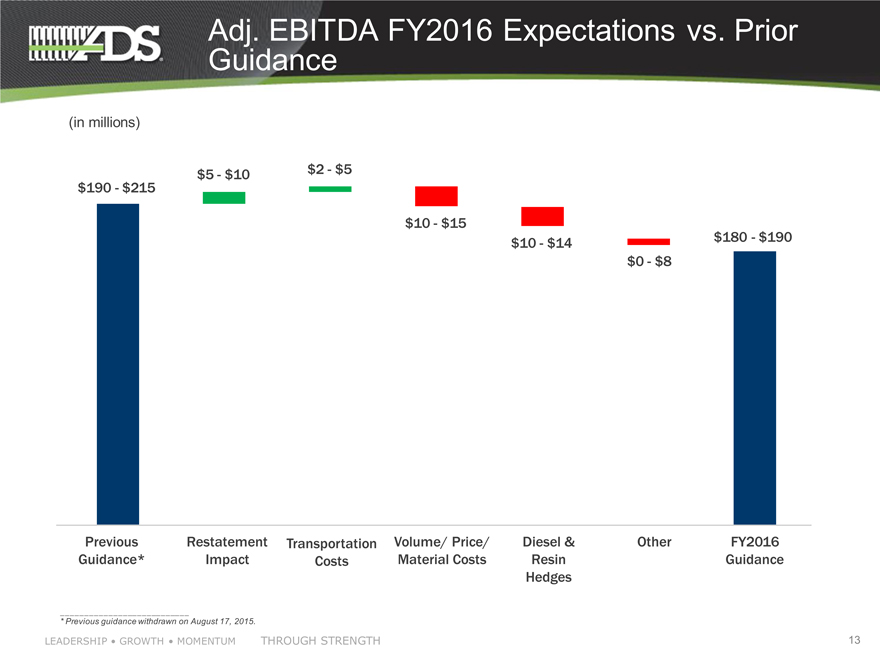
Adj. EBITDA FY2016 Expectations vs. Prior
Guidance
(in millions)
$5—$10 $2—$5 $190—$215
$10—$15
$10—$14
$180—$190
$0—$8
Previous Restatement Transportation Volume/ Price/ Diesel & Other FY2016
Guidance* Impact Costs Material Costs Resin Guidance
Hedges
* Previous guidance withdrawn on August 17, 2015.
LEADERSHIP GROWTH MOMENTUM
THROUGH STRENGTH
13
|
|
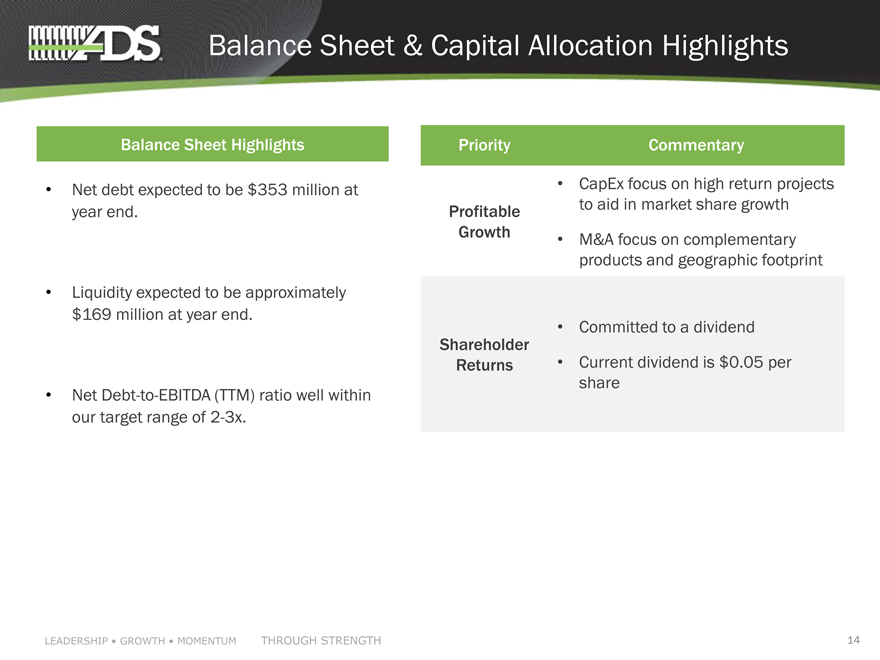
Balance Sheet & Capital Allocation Highlights
Balance Sheet Highlights
Net debt expected to be $353 million at
year end.
Liquidity expected to be approximately
$169 million at year end.
Net Debt-to-EBITDA (TTM) ratio well within
our target range of 2-3x.
Priority
Profitable
Growth
Shareholder Returns
Commentary
CapEx focus on high return projects
to aid in market share growth
M&A focus on complementary
products and geographic footprint
Committed to a dividend
Current dividend is $0.05 per
share
LEADERSHIP GROWTH MOMENTUM
THROUGH STRENGTH
14
|
|
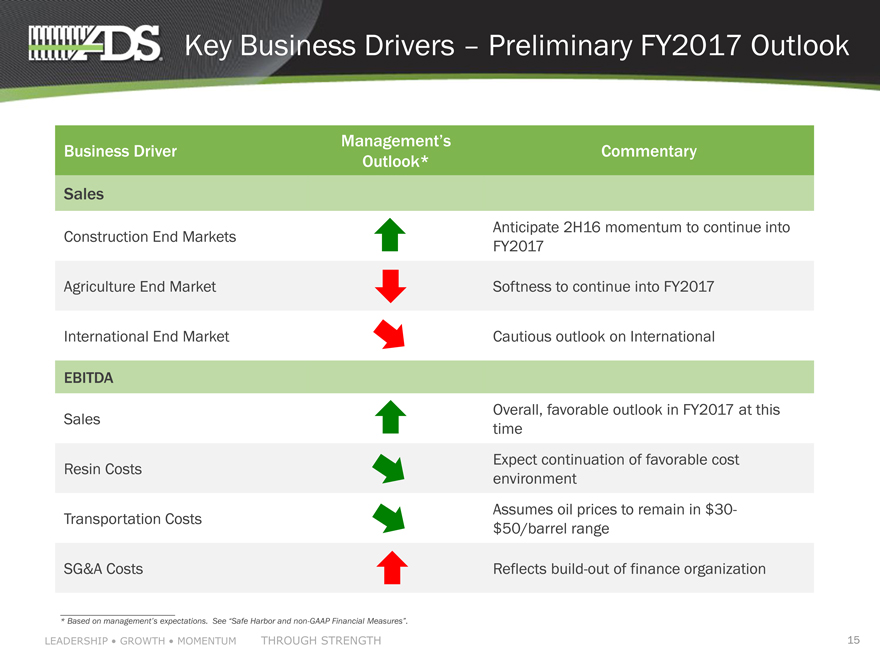
Key Business Drivers Preliminary FY2017 Outlook
Business Driver Managements
Outlook*
Sales
Construction End Markets
Agriculture End Market
International End Market
EBITDA
Sales
Resin Costs
Transportation Costs
SG&A Costs
[Graphic Appears Here]
* Based on managements expectations. See _Safe Harbor and non-GAAP Financial Measures_.
Commentary
Anticipate 2H16 momentum to continue into
FY2017
Softness to continue into FY2017
Cautious outlook on International
Overall, favorable outlook in FY2017 at this time Expect continuation of favorable cost environment Assumes oil prices to remain in $30- $50/barrel range
Reflects build-out of finance organization
LEADERSHIP GROWTH MOMENTUM
THROUGH STRENGTH
15
|
|
Q&A Session
LEADERSHIP GROWTH MOMENTUM
THROUGH STRENGTH
16
|
|
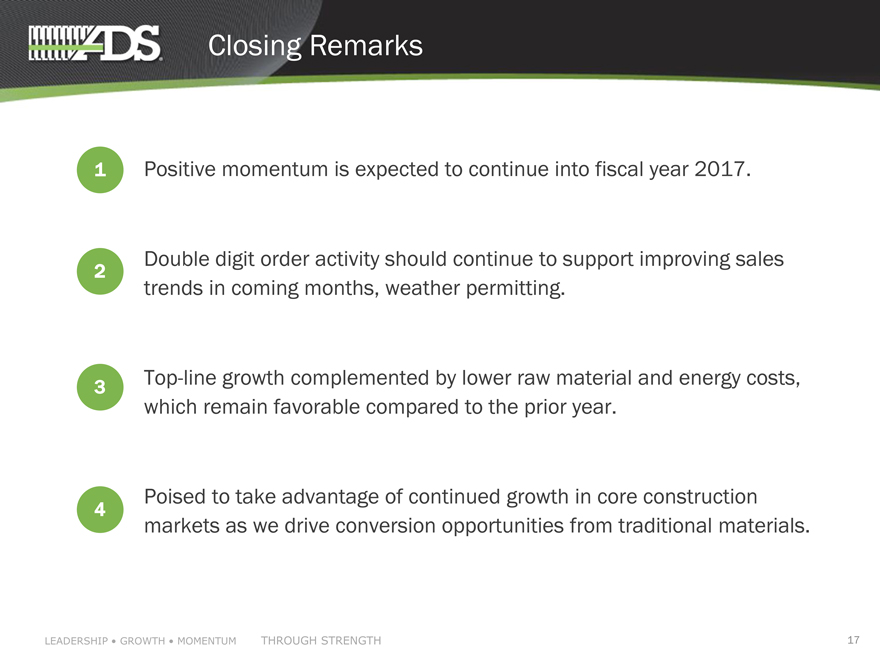
Closing Remarks
1 Positive momentum is expected to continue into fiscal year 2017.
2 Double digit order activity should continue to support improving sales trends in coming months, weather permitting.
3 Top-line growth complemented by lower raw material and energy costs, which remain favorable compared to the prior year.
4 Poised to take advantage of continued growth in core construction markets as we drive conversion opportunities from traditional materials.
LEADERSHIP GROWTH MOMENTUM
THROUGH STRENGTH
17
|
|
Appendix
LEADERSHIP GROWTH MOMENTUM
THROUGH STRENGTH
18
|
|
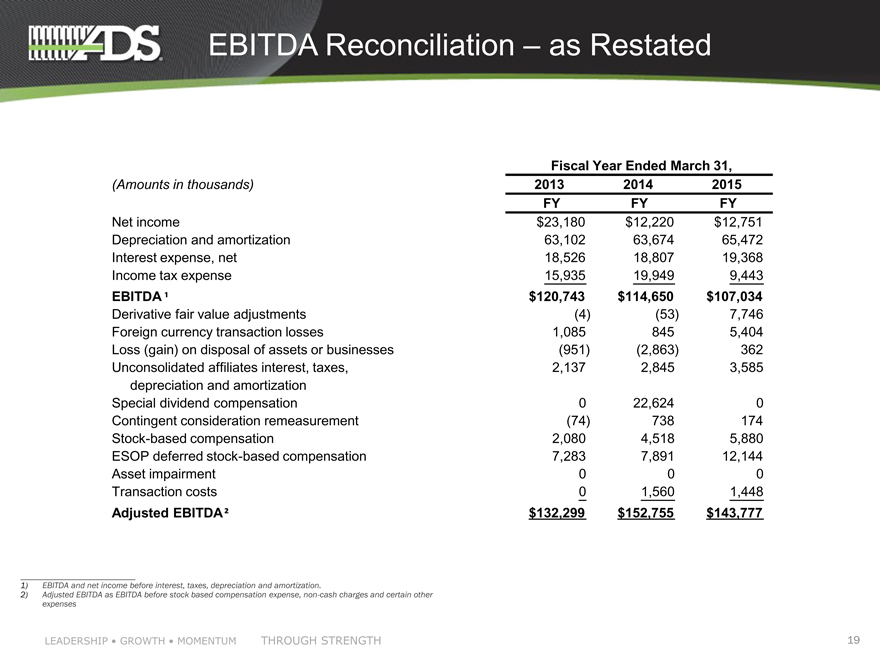
EBITDA Reconciliation as Restated
Fiscal Year Ended March 31,
(Amounts in thousands) 2013 2014 2015
FY FY FY
Net income $23,180 $12,220 $12,751
Depreciation and amortization 63,102 63,674 65,472
Interest expense, net 18,526 18,807 19,368
Income tax expense 15,935 19,949 9,443
EBITDA1 $120,743 $114,650 $107,034
Derivative fair value adjustments(4)(53) 7,746
Foreign currency transaction losses 1,085 845 5,404
Loss (gain) on disposal of assets or businesses(951)(2,863) 362
Unconsolidated affiliates interest, taxes, 2,137 2,845 3,585
depreciation and amortization
Special dividend compensation 0 22,624 0
Contingent consideration remeasurement(74) 738 174
Stock-based compensation 2,080 4,518 5,880
ESOP deferred stock-based compensation 7,283 7,891 12,144
Asset impairment 0 0 0
Transaction costs 0 1,560 1,448
Adjusted EBITDA ² $132,299 $152,755 $143,777
1) EBITDA and net income before interest, taxes, depreciation and amortization.
2) Adjusted EBITDA as EBITDA before stock based compensation expense, non-cash charges and certain other expenses
LEADERSHIP GROWTH MOMENTUM
THROUGH STRENGTH
19