Attached files
| file | filename |
|---|---|
| 8-K - 8-K - Element Solutions Inc | a8kearningsrelease20151231.htm |
| EX-99.1 - EXHIBIT 99.1 - Element Solutions Inc | a8kearningsreleaseex991201.htm |
Fourth Quarter and Year End 2015 March 29, 2016
2 Safe Harbor Please note that in this presentation, we may discuss events or results that have not yet occurred or been realized, commonly referred to as forward-looking statements. The Private Securities Litigation Reform Act of 1995 provides a safe harbor for forward-looking statements made by or on behalf of the Company. Such discussion and statements will often contain words such as expect, anticipate, believe, intend, plan and estimate. Such forward looking statements include statements regarding the Company's earnings per share and adjusted diluted earnings per share, expected or estimated revenue, meeting financial goals, segment earnings, net interest expense, income tax provision, cash flow from operations, restructuring costs and other non-cash charges, the outlook for the Company's markets and the demand for its products, consistent profitable growth, free cash flow, future revenues and gross, operating and EBITDA margin improvement requirement and expansion, organic net sales growth, performance trends, bank leverage ratio, the success of new product introductions, growth in costs and expenses, the impact of commodities and currencies costs, and the Company's ability to manage its risk in these areas, the company’s ability to identify, hire and retain executives and other qualified employees, the Company’s assessment over its internal control over financial reporting, and the impact of acquisitions, divestitures, restructurings, and other unusual items, including the Company's ability to raise new debt and equity and to integrate and obtain the anticipated results and synergies from its consummated acquisitions. These projections and statements are based on management's estimates and assumptions with respect to future events and financial performance and are believed to be reasonable, though are inherently uncertain and difficult to predict. Actual results could differ materially from those projected as a result of certain factors. A discussion of factors that could cause results to vary is included in the Company's periodic and other reports filed with the Securities and Exchange Commission. Unless required by law, the Company undertakes no obligation to update any forward-looking statement, whether as a result of new information, future events or otherwise. This presentation also contains certain non-GAAP financial measures. Pursuant to the requirements of Regulation G, a reconciliation of such non-GAAP financial measures to the most directly comparable GAAP financial measures is provided herein. These non-GAAP financial measures are provided because management uses such measures in monitoring and evaluating the Company’s ongoing financial results, as well as to reflect its acquisitions. Management believes these measures provide a more complete understanding of the Company’s operational results and a meaningful comparison of the Company’s performance between periods. These non-GAAP measures may not, however, reflect the actual financial results the Company would have achieved absent such acquisitions, and may not be indicative of the results that the Company expects to recognize for future periods. These non-GAAP measures should be considered in addition to, not a substitute for, measures of financial performance prepared in accordance with GAAP. Finally, this presentation contains unaudited pro forma financial information which assumes full period contribution of all the Company’s acquired businesses to date: the Chemura Agrosolutions business of Chemtura Corporation and Percival S.A., or Agriphar, in 2014; Alent plc, Arysta LifeScience Ltd, and the Electronic Chemicals and Photomasks businesses of OM Group, Inc. in 2015; and OMG Electronic Chemicals (M) Sdn Bhd in 2016. This pro forma information is provided for informational purposes only and is not necessarily, and should not be assumed to be, an indication of the results that would have been achieved had the Company’s acquisitions been completed as of the dates indicated, or that may be achieved in the future. Historical financial results and information included herein relating to these acquired businesses were derived from public filings, when applicable, and/or information provided by management of these businesses prior to their acquisitions by the Company. Although we believe it is reliable, this information has not been verified, internally or independently. In addition, financial information for some of these acquired businesses were historically prepared in accordance with non-GAAP accounting methods and may or may not be comparable to the Company’s financial statements. Consequently, there is no assurance that the financial results and information for these legacy businesses included herein are accurate or complete, or representative in any way of the Company’s actual and future results as a consolidated company.
3 Note: Updates to Presentation This presentation, originally released on February 29, 2016, has been updated to reflect our final financial results following the filing of our Form 10-K on March 11, 2016. The only changes from the presentation dated February 29, 2016 are the addition of a full reconciliation from Adjusted EBITDA to Net loss attributable to stockholders and the removal of references to “unaudited and preliminary results”, as applicable.
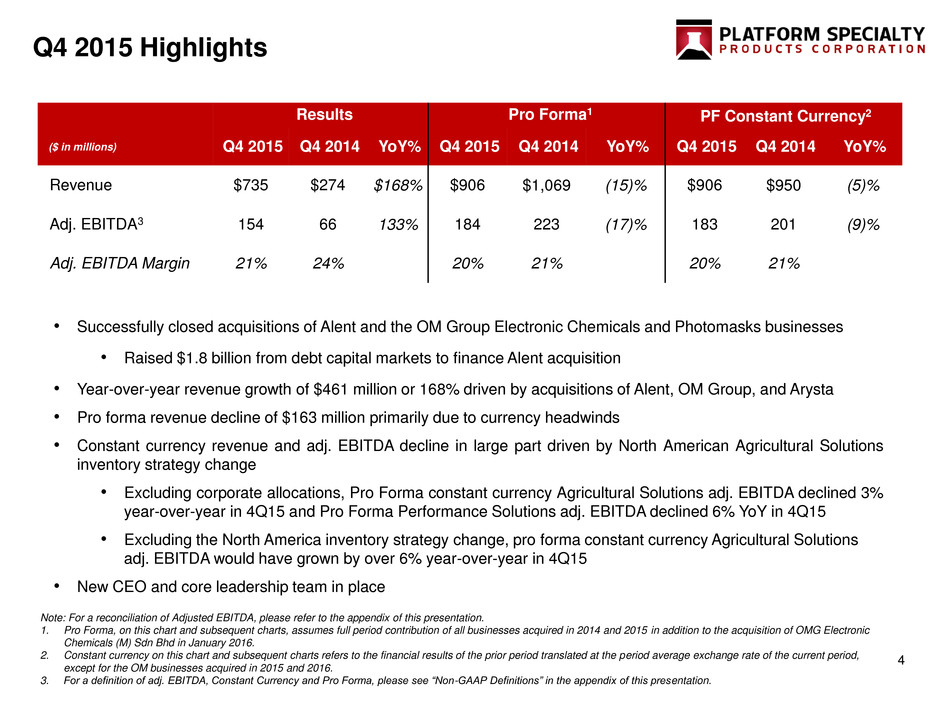
4 Q4 2015 Highlights • Successfully closed acquisitions of Alent and the OM Group Electronic Chemicals and Photomasks businesses • Raised $1.8 billion from debt capital markets to finance Alent acquisition • Year-over-year revenue growth of $461 million or 168% driven by acquisitions of Alent, OM Group, and Arysta • Pro forma revenue decline of $163 million primarily due to currency headwinds • Constant currency revenue and adj. EBITDA decline in large part driven by North American Agricultural Solutions inventory strategy change • Excluding corporate allocations, Pro Forma constant currency Agricultural Solutions adj. EBITDA declined 3% year-over-year in 4Q15 and Pro Forma Performance Solutions adj. EBITDA declined 6% YoY in 4Q15 • Excluding the North America inventory strategy change, pro forma constant currency Agricultural Solutions adj. EBITDA would have grown by over 6% year-over-year in 4Q15 • New CEO and core leadership team in place Note: For a reconciliation of Adjusted EBITDA, please refer to the appendix of this presentation. 1. Pro Forma, on this chart and subsequent charts, assumes full period contribution of all businesses acquired in 2014 and 2015 in addition to the acquisition of OMG Electronic Chemicals (M) Sdn Bhd in January 2016. 2. Constant currency on this chart and subsequent charts refers to the financial results of the prior period translated at the period average exchange rate of the current period, except for the OM businesses acquired in 2015 and 2016. 3. For a definition of adj. EBITDA, Constant Currency and Pro Forma, please see “Non-GAAP Definitions” in the appendix of this presentation. Results Pro Forma1 PF Constant Currency2 ($ in millions) Q4 2015 Q4 2014 YoY% Q4 2015 Q4 2014 YoY% Q4 2015 Q4 2014 YoY% Revenue $735 $274 $168% $906 $1,069 (15)% $906 $950 (5)% Adj. EBITDA3 154 66 133% 184 223 (17)% 183 201 (9)% Adj. EBITDA Margin 21% 24% 20% 21% 20% 21%
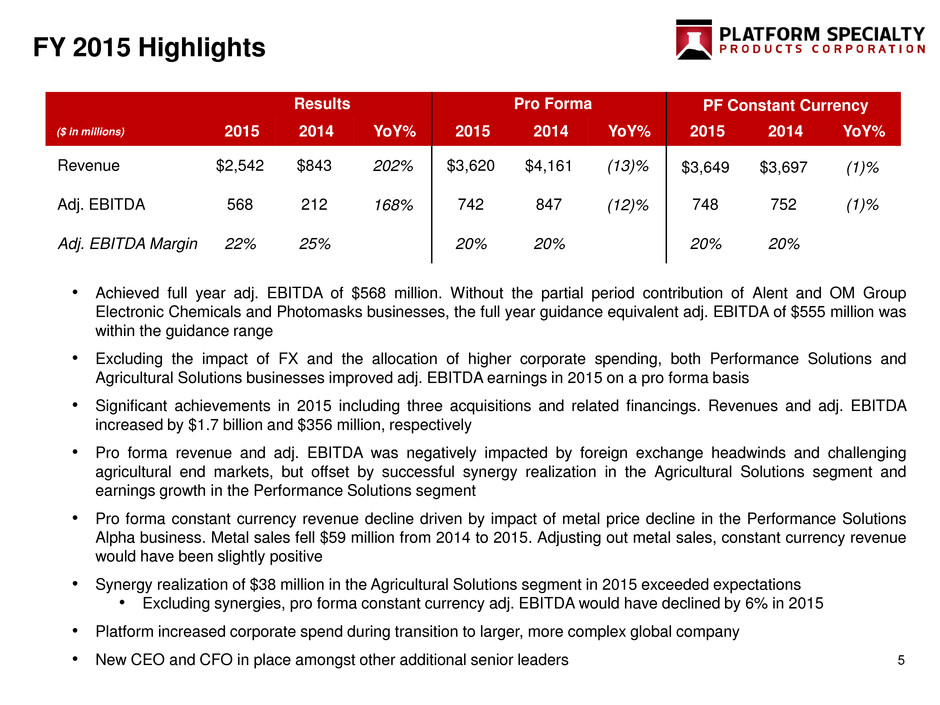
5 FY 2015 Highlights • Achieved full year adj. EBITDA of $568 million. Without the partial period contribution of Alent and OM Group Electronic Chemicals and Photomasks businesses, the full year guidance equivalent adj. EBITDA of $555 million was within the guidance range • Excluding the impact of FX and the allocation of higher corporate spending, both Performance Solutions and Agricultural Solutions businesses improved adj. EBITDA earnings in 2015 on a pro forma basis • Significant achievements in 2015 including three acquisitions and related financings. Revenues and adj. EBITDA increased by $1.7 billion and $356 million, respectively • Pro forma revenue and adj. EBITDA was negatively impacted by foreign exchange headwinds and challenging agricultural end markets, but offset by successful synergy realization in the Agricultural Solutions segment and earnings growth in the Performance Solutions segment • Pro forma constant currency revenue decline driven by impact of metal price decline in the Performance Solutions Alpha business. Metal sales fell $59 million from 2014 to 2015. Adjusting out metal sales, constant currency revenue would have been slightly positive • Synergy realization of $38 million in the Agricultural Solutions segment in 2015 exceeded expectations • Excluding synergies, pro forma constant currency adj. EBITDA would have declined by 6% in 2015 • Platform increased corporate spend during transition to larger, more complex global company • New CEO and CFO in place amongst other additional senior leaders Results Pro Forma PF Constant Currency ($ in millions) 2015 2014 YoY% 2015 2014 YoY% 2015 2014 YoY% Revenue $2,542 $843 202% $3,620 $4,161 (13)% $3,649 $3,697 (1)% Adj. EBITDA 568 212 168% 742 847 (12)% 748 752 (1)% Adj. EBITDA Margin 22% 25% 20% 20% 20% 20%
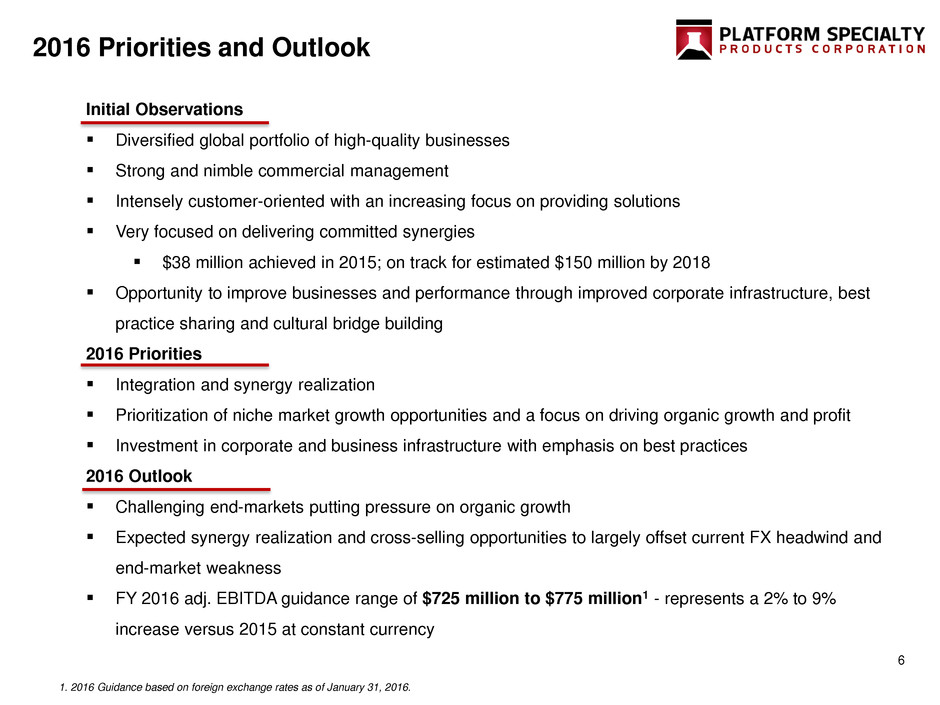
6 2016 Priorities and Outlook Initial Observations Diversified global portfolio of high-quality businesses Strong and nimble commercial management Intensely customer-oriented with an increasing focus on providing solutions Very focused on delivering committed synergies $38 million achieved in 2015; on track for estimated $150 million by 2018 Opportunity to improve businesses and performance through improved corporate infrastructure, best practice sharing and cultural bridge building 2016 Priorities Integration and synergy realization Prioritization of niche market growth opportunities and a focus on driving organic growth and profit Investment in corporate and business infrastructure with emphasis on best practices 2016 Outlook Challenging end-markets putting pressure on organic growth Expected synergy realization and cross-selling opportunities to largely offset current FX headwind and end-market weakness FY 2016 adj. EBITDA guidance range of $725 million to $775 million1 - represents a 2% to 9% increase versus 2015 at constant currency 1. 2016 Guidance based on foreign exchange rates as of January 31, 2016.
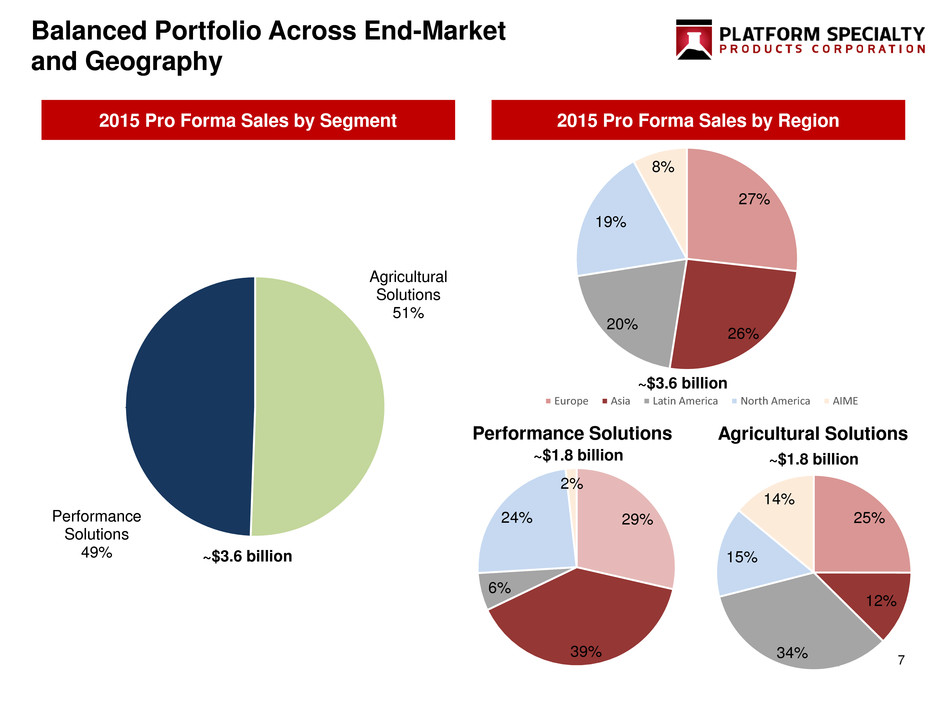
7 Balanced Portfolio Across End-Market and Geography 2015 Pro Forma Sales by Region2015 Pro Forma Sales by Segment Agricultural Solutions 51% Performance Solutions 49% Performance Solutions Agricultural Solutions 27% 26% 20% 19% 8% Europe Asia Latin America North America AIME 25% 12% 34% 15% 14% 29% 39% 6% 24% 2% ~$3.6 billion ~$1.8 billion ~$1.8 billion ~$3.6 billion
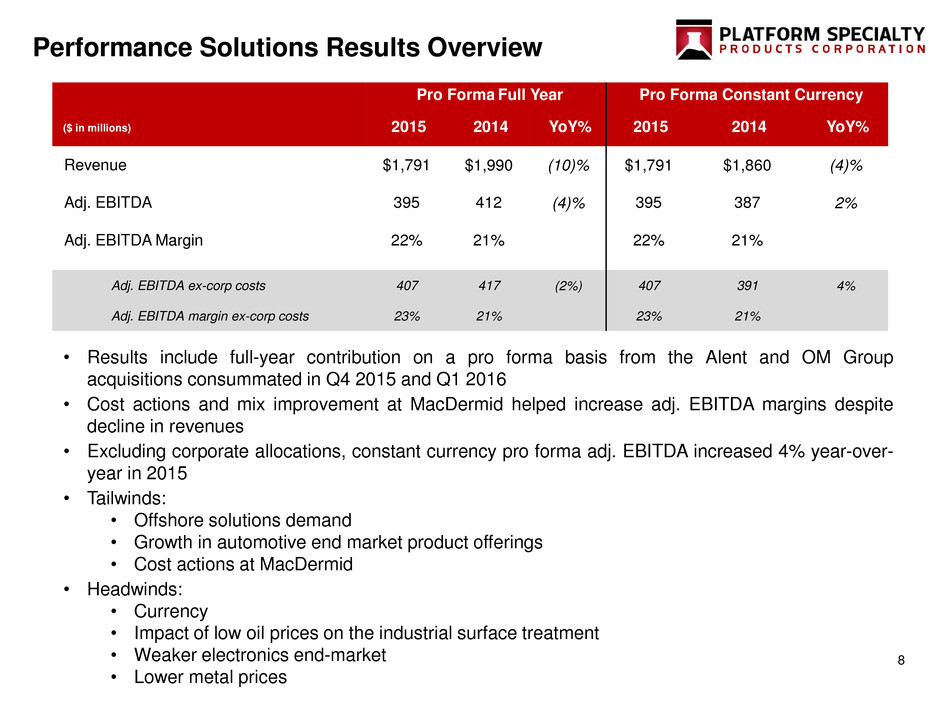
8 Performance Solutions Results Overview • Results include full-year contribution on a pro forma basis from the Alent and OM Group acquisitions consummated in Q4 2015 and Q1 2016 • Cost actions and mix improvement at MacDermid helped increase adj. EBITDA margins despite decline in revenues • Excluding corporate allocations, constant currency pro forma adj. EBITDA increased 4% year-over- year in 2015 • Tailwinds: • Offshore solutions demand • Growth in automotive end market product offerings • Cost actions at MacDermid • Headwinds: • Currency • Impact of low oil prices on the industrial surface treatment • Weaker electronics end-market • Lower metal prices Pro Forma Full Year Pro Forma Constant Currency ($ in millions) 2015 2014 YoY% 2015 2014 YoY% Revenue $1,791 $1,990 (10)% $1,791 $1,860 (4)% Adj. EBITDA 395 412 (4)% 395 387 2% Adj. EBITDA Margin 22% 21% 22% 21% Adj. EBITDA ex-corp costs 407 417 (2%) 407 391 4% Adj. EBITDA margin ex-corp costs 23% 21% 23% 21%
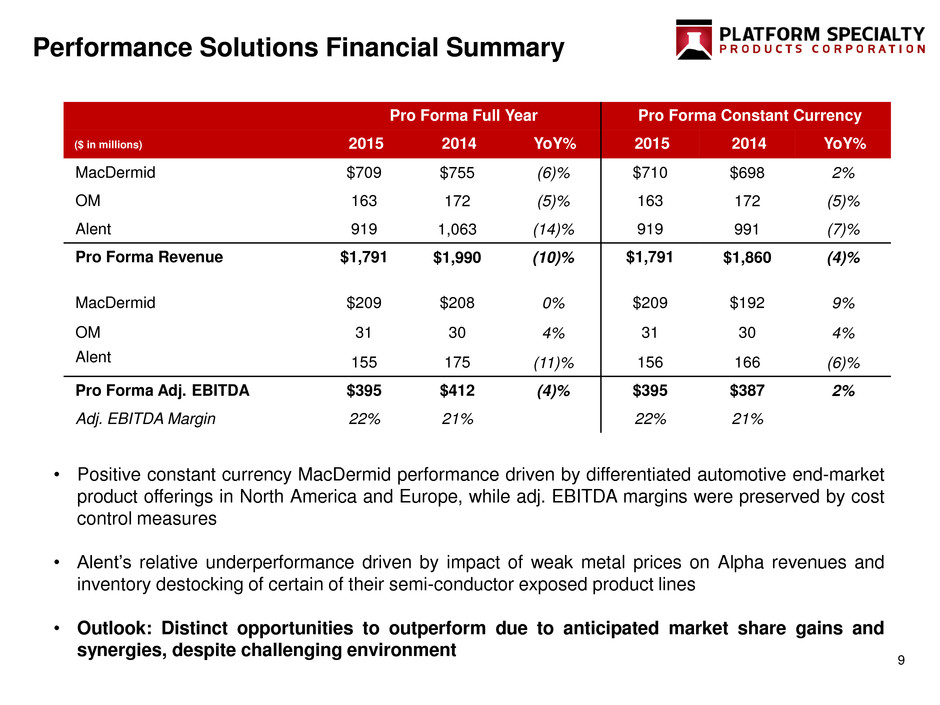
9 Performance Solutions Financial Summary • Positive constant currency MacDermid performance driven by differentiated automotive end-market product offerings in North America and Europe, while adj. EBITDA margins were preserved by cost control measures • Alent’s relative underperformance driven by impact of weak metal prices on Alpha revenues and inventory destocking of certain of their semi-conductor exposed product lines • Outlook: Distinct opportunities to outperform due to anticipated market share gains and synergies, despite challenging environment Pro Forma Full Year Pro Forma Constant Currency ($ in millions) 2015 2014 YoY% 2015 2014 YoY% MacDermid $709 $755 (6)% $710 $698 2% OM 163 172 (5)% 163 172 (5)% Alent 919 1,063 (14)% 919 991 (7)% Pro Forma Revenue $1,791 $1,990 (10)% $1,791 $1,860 (4)% MacDermid $209 $208 0% $209 $192 9% OM 31 30 4% 31 30 4% Alent 155 175 (11)% 156 166 (6)% Pro Forma Adj. EBITDA $395 $412 (4)% $395 $387 2% Adj. EBITDA Margin 22% 21% 22% 21%
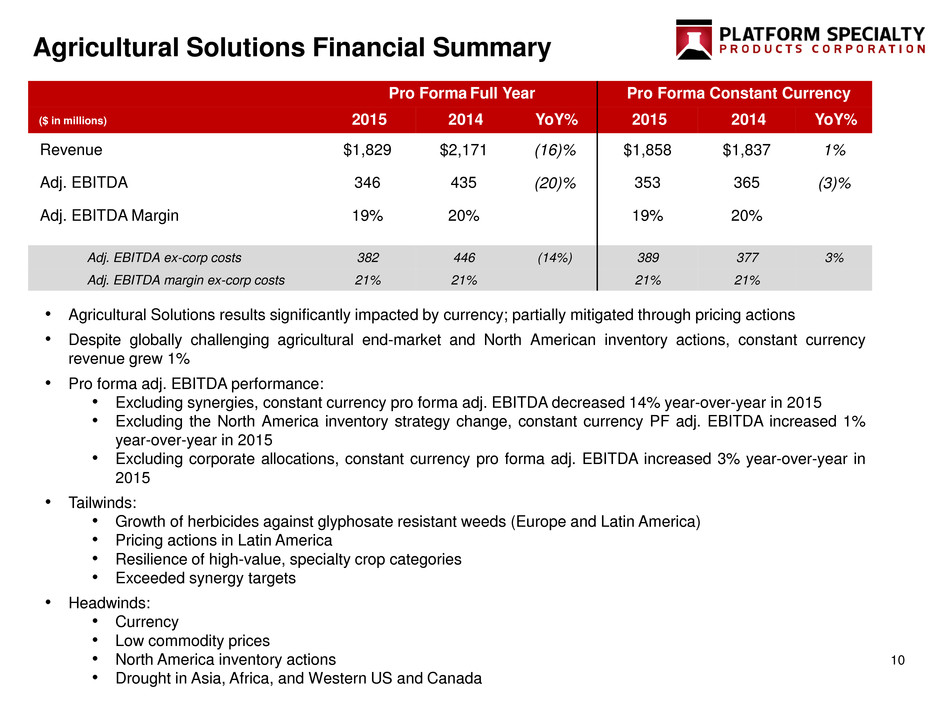
10 Agricultural Solutions Financial Summary • Agricultural Solutions results significantly impacted by currency; partially mitigated through pricing actions • Despite globally challenging agricultural end-market and North American inventory actions, constant currency revenue grew 1% • Pro forma adj. EBITDA performance: • Excluding synergies, constant currency pro forma adj. EBITDA decreased 14% year-over-year in 2015 • Excluding the North America inventory strategy change, constant currency PF adj. EBITDA increased 1% year-over-year in 2015 • Excluding corporate allocations, constant currency pro forma adj. EBITDA increased 3% year-over-year in 2015 • Tailwinds: • Growth of herbicides against glyphosate resistant weeds (Europe and Latin America) • Pricing actions in Latin America • Resilience of high-value, specialty crop categories • Exceeded synergy targets • Headwinds: • Currency • Low commodity prices • North America inventory actions • Drought in Asia, Africa, and Western US and Canada Pro Forma Full Year Pro Forma Constant Currency ($ in millions) 2015 2014 YoY% 2015 2014 YoY% Revenue $1,829 $2,171 (16)% $1,858 $1,837 1% Adj. EBITDA 346 435 (20)% 353 365 (3)% Adj. EBITDA Margin 19% 20% 19% 20% Adj. EBITDA ex-corp costs 382 446 (14%) 389 377 3% Adj. EBITDA margin ex-corp costs 21% 21% 21% 21%
11 Agricultural Solutions Business Update • Weak global commodity prices and strengthening US dollar created significant headwinds in 2015; cross-selling and pricing gains in export driven markets helped offset these pressures • Latin America • Flat volume driven by strong performance of herbicides, offset by soft insecticide demand • Effective cross-selling of Chemtura / Arysta portfolio • Europe • Grew pro forma adj. EBITDA despite FX headwinds • Early spring benefiting fungicide and herbicide applications • North America • Inventory actions created meaningful year-on-year headwind • Drought on U.S. West Coast and Western Canada • Weakness in seed treatment • Asia • Strong performance of BioControl products and Seed Treatments • Drought in South East Asia (El Niño) • AIME • Strong performance in private market offset by weak India • Outlook: Similar macro trends, agricultural market weakness and FX headwinds persist; expect flat-to-slightly-down volumes offset by synergy opportunity and price in export- driven markets
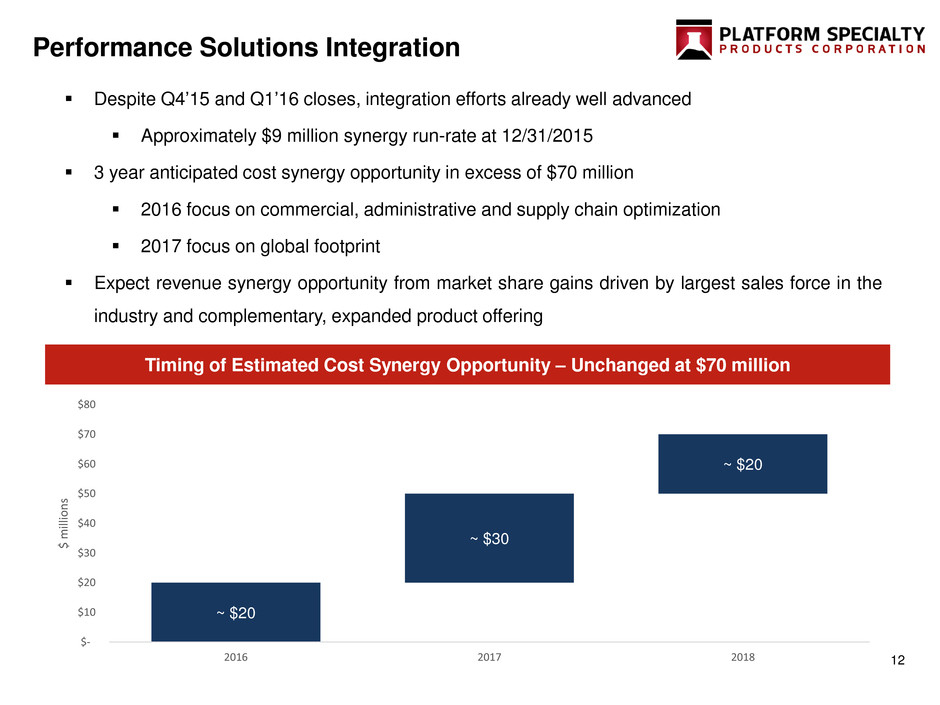
12 Performance Solutions Integration Despite Q4’15 and Q1’16 closes, integration efforts already well advanced Approximately $9 million synergy run-rate at 12/31/2015 3 year anticipated cost synergy opportunity in excess of $70 million 2016 focus on commercial, administrative and supply chain optimization 2017 focus on global footprint Expect revenue synergy opportunity from market share gains driven by largest sales force in the industry and complementary, expanded product offering Timing of Estimated Cost Synergy Opportunity – Unchanged at $70 million ~$25 ~$20 ~ $20 ~ $30 ~ $20 $- $10 $20 $30 $40 $50 $60 $70 $80 2016 2017 2018 $ mi llio n s
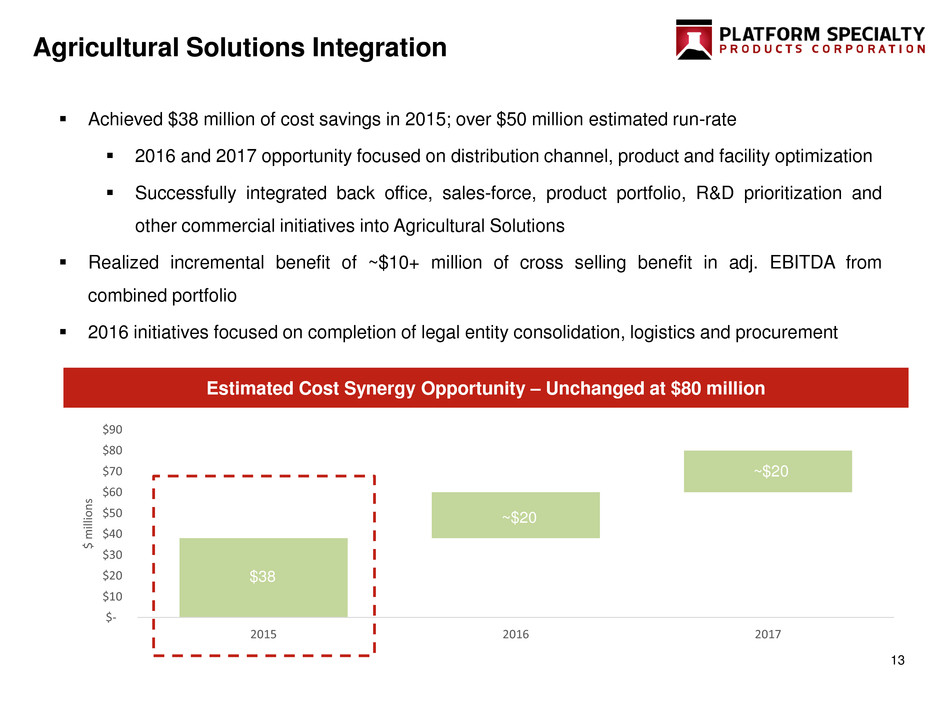
13 Achieved $38 million of cost savings in 2015; over $50 million estimated run-rate 2016 and 2017 opportunity focused on distribution channel, product and facility optimization Successfully integrated back office, sales-force, product portfolio, R&D prioritization and other commercial initiatives into Agricultural Solutions Realized incremental benefit of ~$10+ million of cross selling benefit in adj. EBITDA from combined portfolio 2016 initiatives focused on completion of legal entity consolidation, logistics and procurement Agricultural Solutions Integration Estimated Cost Synergy Opportunity – Unchanged at $80 million $- $10 $20 $30 $40 $50 $60 $70 $80 $90 2015 2016 2017 $ mi llio n s ~$20 ~$20 $38
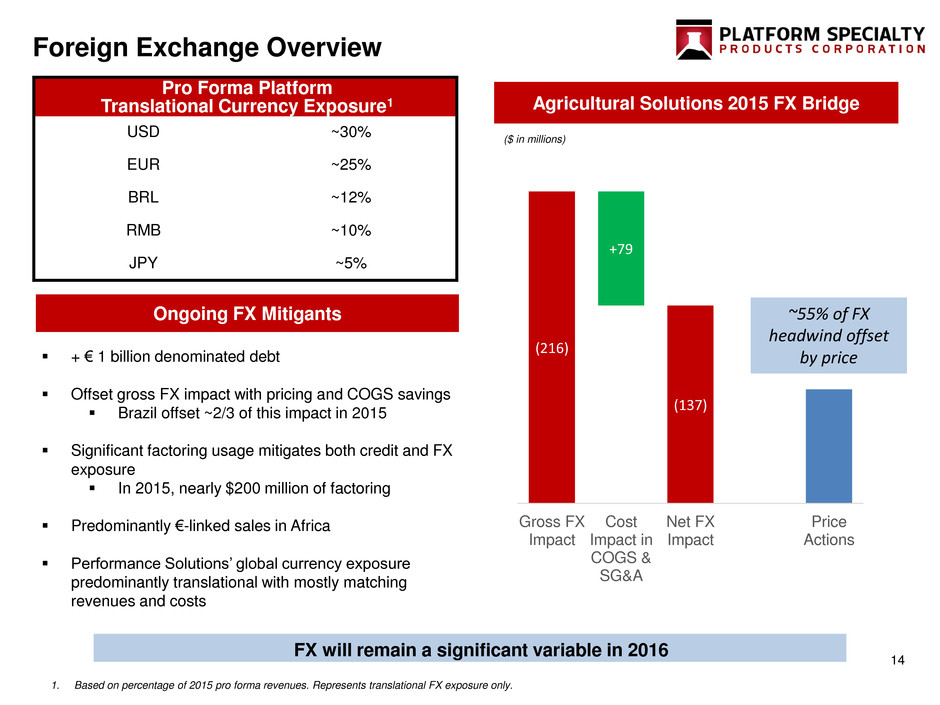
14 Foreign Exchange Overview Pro Forma Platform Translational Currency Exposure1 USD ~30% EUR ~25% BRL ~12% RMB ~10% JPY ~5% + € 1 billion denominated debt Offset gross FX impact with pricing and COGS savings Brazil offset ~2/3 of this impact in 2015 Significant factoring usage mitigates both credit and FX exposure In 2015, nearly $200 million of factoring Predominantly €-linked sales in Africa Performance Solutions’ global currency exposure predominantly translational with mostly matching revenues and costs Agricultural Solutions 2015 FX Bridge (216) (137) +79 Gross FX Impact Cost Impact in COGS & SG&A Net FX Impact Price Actions ~55% of FX headwind offset by price FX will remain a significant variable in 2016 1. Based on percentage of 2015 pro forma revenues. Represents translational FX exposure only. Ongoing FX Mitigants ($ in millions)
15 Financial Performance
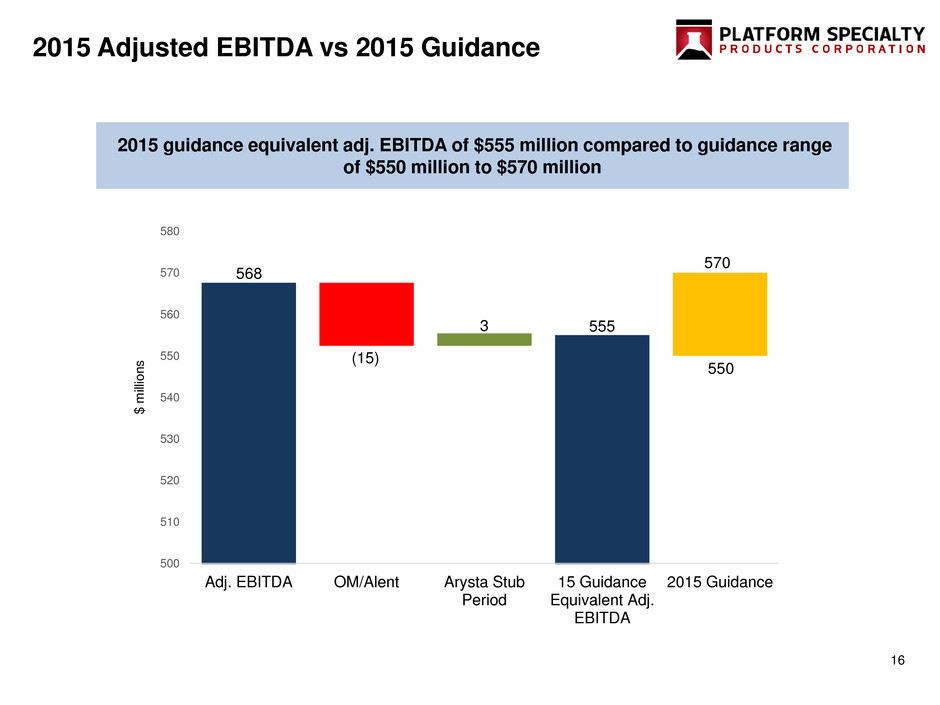
16 2015 Adjusted EBITDA vs 2015 Guidance 2015 guidance equivalent adj. EBITDA of $555 million compared to guidance range of $550 million to $570 million (15) 3 568 555 500 510 520 530 540 550 560 570 580 Adj. EBITDA OM/Alent Arysta Stub Period 15 Guidance Equivalent Adj. EBITDA 2015 Guidance 550 570 $ m ill io n s
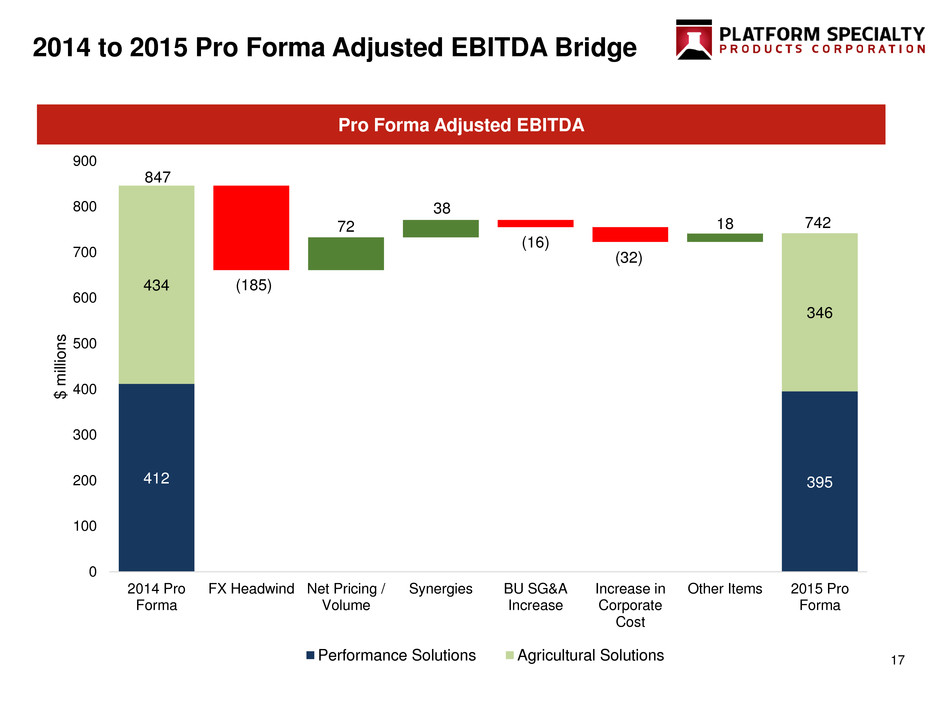
17 2014 to 2015 Pro Forma Adjusted EBITDA Bridge (185) (16) (32) 72 38 18 412 395 434 346 0 100 200 300 400 500 600 700 800 900 2014 Pro Forma FX Headwind Net Pricing / Volume Synergies BU SG&A Increase Increase in Corporate Cost Other Items 2015 Pro Forma $ m ill io n s Performance Solutions Agricultural Solutions 847 742 Pro Forma Adjusted EBITDA
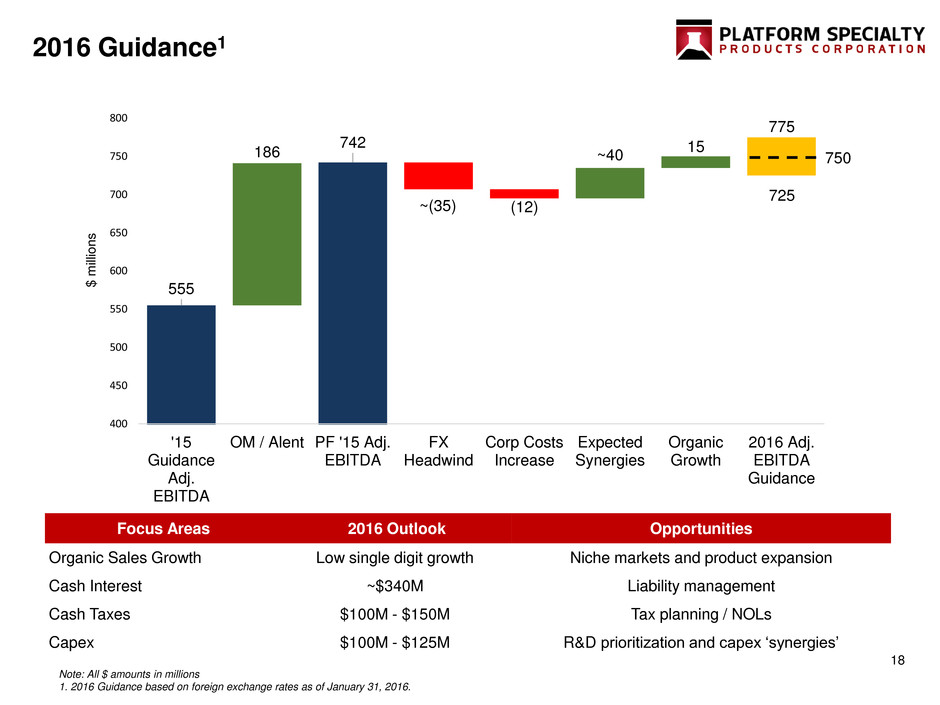
18 2016 Guidance1 Focus Areas 2016 Outlook Opportunities Organic Sales Growth Low single digit growth Niche markets and product expansion Cash Interest ~$340M Liability management Cash Taxes $100M - $150M Tax planning / NOLs Capex $100M - $125M R&D prioritization and capex ‘synergies’ Note: All $ amounts in millions 1. 2016 Guidance based on foreign exchange rates as of January 31, 2016. ~(35) (12) 186 ~40 15 555 742 400 450 500 550 600 650 700 750 800 '15 Guidance Adj. EBITDA OM / Alent PF '15 Adj. EBITDA FX Headwind Corp Costs Increase Expected Synergies Organic Growth 2016 Adj. EBITDA Guidance 725 775 750 $ m ill io n s
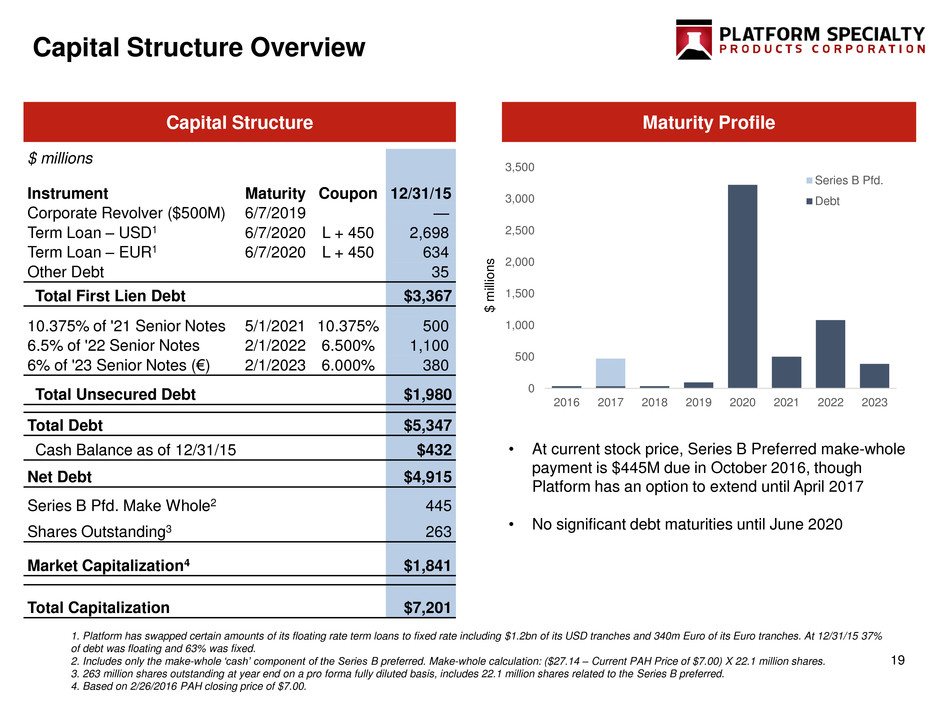
19 Capital Structure Overview 1. Platform has swapped certain amounts of its floating rate term loans to fixed rate including $1.2bn of its USD tranches and 340m Euro of its Euro tranches. At 12/31/15 37% of debt was floating and 63% was fixed. 2. Includes only the make-whole ‘cash’ component of the Series B preferred. Make-whole calculation: ($27.14 – Current PAH Price of $7.00) X 22.1 million shares. 3. 263 million shares outstanding at year end on a pro forma fully diluted basis, includes 22.1 million shares related to the Series B preferred. 4. Based on 2/26/2016 PAH closing price of $7.00. $ millions Instrument Maturity Coupon 12/31/15 Corporate Revolver ($500M) 6/7/2019 — Term Loan – USD1 6/7/2020 L + 450 2,698 Term Loan – EUR1 6/7/2020 L + 450 634 Other Debt 35 Total First Lien Debt $3,367 10.375% of '21 Senior Notes 5/1/2021 10.375% 500 6.5% of '22 Senior Notes 2/1/2022 6.500% 1,100 6% of '23 Senior Notes (€) 2/1/2023 6.000% 380 Total Unsecured Debt $1,980 Total Debt $5,347 Cash Balance as of 12/31/15 $432 Net Debt $4,915 Series B Pfd. Make Whole2 445 Shares Outstanding3 263 Market Capitalization4 $1,841 Total Capitalization $7,201 Capital Structure Maturity Profile 0 500 1,000 1,500 2,000 2,500 3,000 3,500 2016 2017 2018 2019 2020 2021 2022 2023 Series B Pfd. Debt • At current stock price, Series B Preferred make-whole payment is $445M due in October 2016, though Platform has an option to extend until April 2017 • No significant debt maturities until June 2020 $ m ill io n s

20 Covenant Overview Our capital structure is subject to only one quarterly maintenance test - 6.25x First Lien Net Debt to PF adj. EBITDA Covenant EBITDA is defined as LTM PF adj. EBITDA plus synergies expected to be realized based on actions to be taken over the next 12 months1 We have significant headroom under the maintenance covenant The Gross First Lien Leverage ratio only limits our ability to incur debt if we would not satisfy a 2x Fixed Charge Coverage Ratio test, tested at the time of incurrence LTM PF adj. EBITDA $742 (+) Announced Synergies 150 (-) Realized Synergies (38) (+) Synergy Adjustment 112 Covenant EBITDA $854 Covenant Calculations3 Leverage Covenants as of 12/31/15 Covenant EBITDA Headroom Headroom % Maintenance Covenant: Net First Lien Leverage 3.44x < 6.25x $384 45% Incurrence Covenants: Gross First Lien Leverage 3.94x < 4.50x $106 12% Total Net Leverage 5.76x < 6.75x – 7.00x2 $126 – $152 15% - 18% Covenant EBITDA Note: All $ amounts in millions 1. Synergy credit is limited to 15% of underlying EBITDA. 2. This covenant varies based on use of proceeds – 6.75x applies to acquisitions while 7.00x applies to other uses of debt. 3. The covenants are un-impacted any potential Series B preferred make-whole payment.
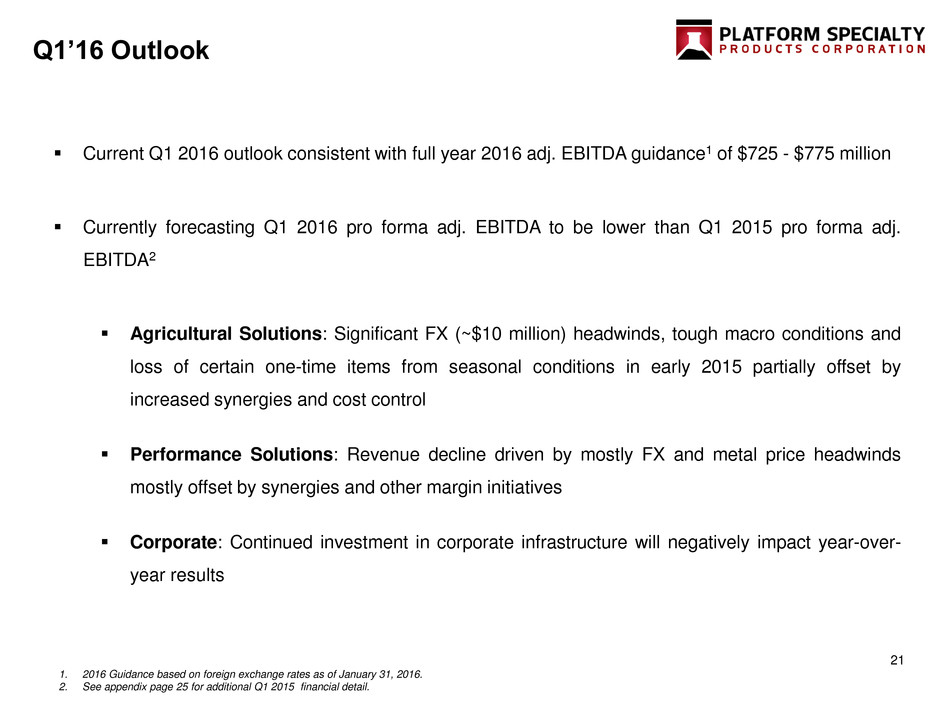
21 Q1’16 Outlook Current Q1 2016 outlook consistent with full year 2016 adj. EBITDA guidance1 of $725 - $775 million Currently forecasting Q1 2016 pro forma adj. EBITDA to be lower than Q1 2015 pro forma adj. EBITDA2 Agricultural Solutions: Significant FX (~$10 million) headwinds, tough macro conditions and loss of certain one-time items from seasonal conditions in early 2015 partially offset by increased synergies and cost control Performance Solutions: Revenue decline driven by mostly FX and metal price headwinds mostly offset by synergies and other margin initiatives Corporate: Continued investment in corporate infrastructure will negatively impact year-over- year results 1. 2016 Guidance based on foreign exchange rates as of January 31, 2016. 2. See appendix page 25 for additional Q1 2015 financial detail.
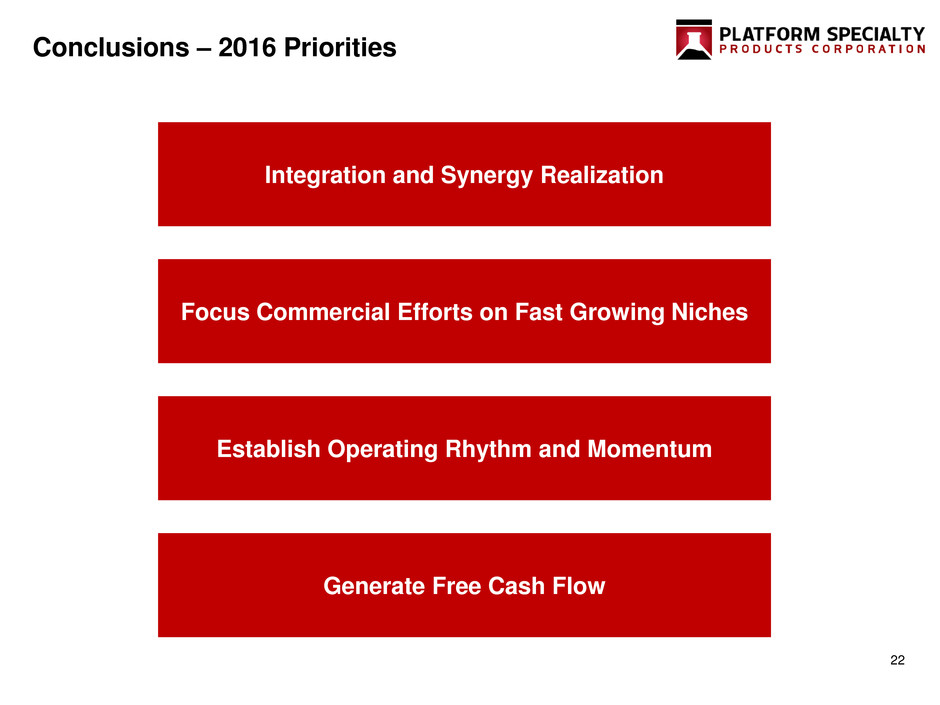
22 Conclusions – 2016 Priorities Integration and Synergy Realization Focus Commercial Efforts on Fast Growing Niches Establish Operating Rhythm and Momentum Generate Free Cash Flow
23 Appendix
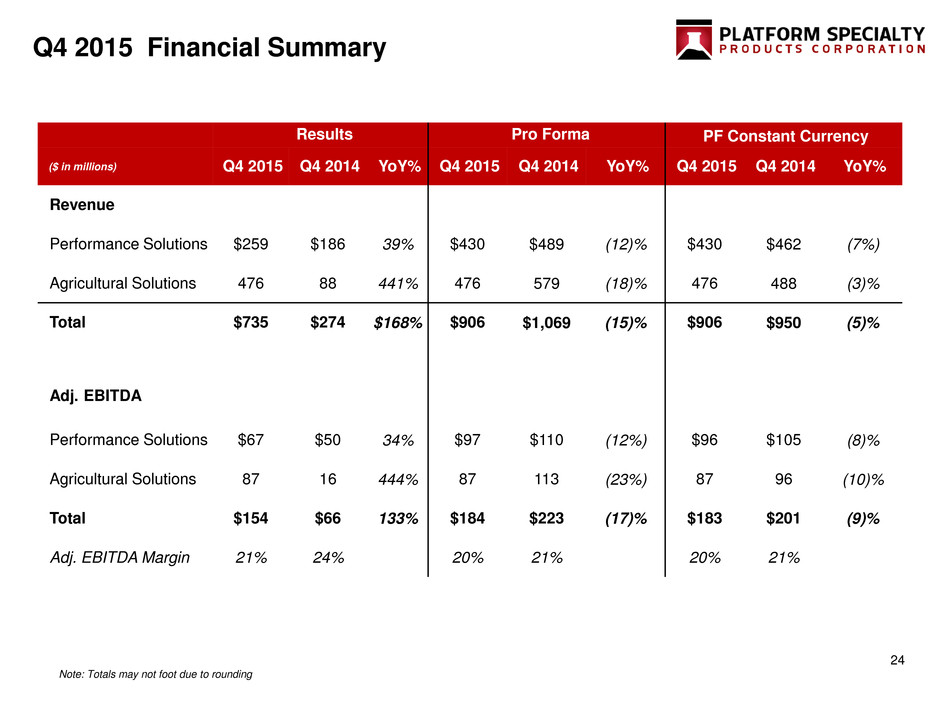
24 Q4 2015 Financial Summary Results Pro Forma PF Constant Currency ($ in millions) Q4 2015 Q4 2014 YoY% Q4 2015 Q4 2014 YoY% Q4 2015 Q4 2014 YoY% Revenue Performance Solutions $259 $186 39% $430 $489 (12)% $430 $462 (7%) Agricultural Solutions 476 88 441% 476 579 (18)% 476 488 (3)% Total $735 $274 $168% $906 $1,069 (15)% $906 $950 (5)% Adj. EBITDA Performance Solutions $67 $50 34% $97 $110 (12%) $96 $105 (8)% Agricultural Solutions 87 16 444% 87 113 (23%) 87 96 (10)% Total $154 $66 133% $184 $223 (17)% $183 $201 (9)% Adj. EBITDA Margin 21% 24% 20% 21% 20% 21% Note: Totals may not foot due to rounding
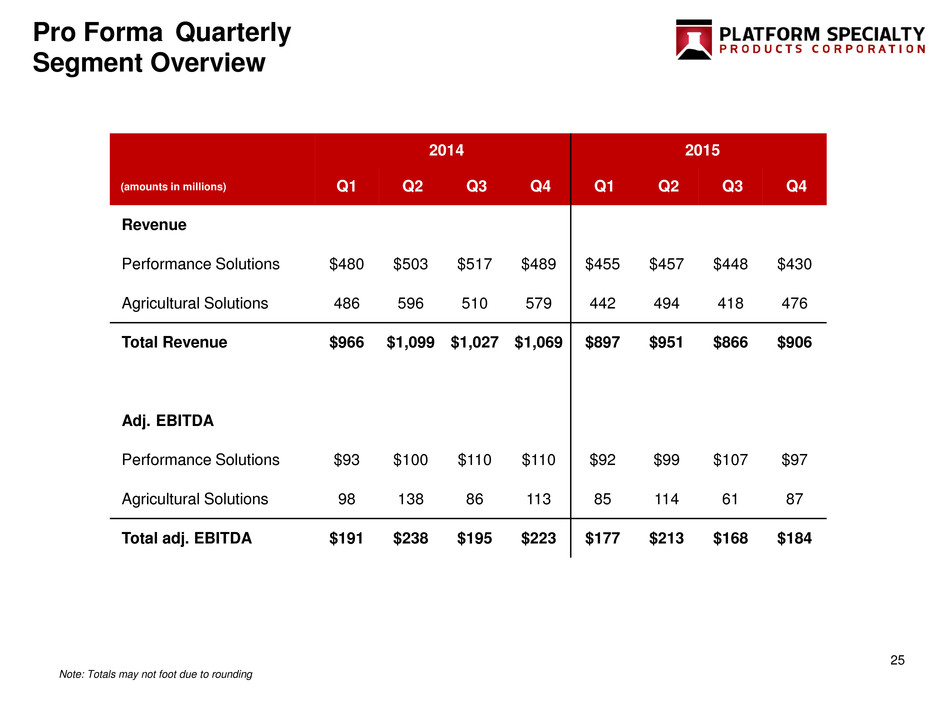
25 Pro Forma Quarterly Segment Overview 2014 2015 (amounts in millions) Q1 Q2 Q3 Q4 Q1 Q2 Q3 Q4 Revenue Performance Solutions $480 $503 $517 $489 $455 $457 $448 $430 Agricultural Solutions 486 596 510 579 442 494 418 476 Total Revenue $966 $1,099 $1,027 $1,069 $897 $951 $866 $906 Adj. EBITDA Performance Solutions $93 $100 $110 $110 $92 $99 $107 $97 Agricultural Solutions 98 138 86 113 85 114 61 87 Total adj. EBITDA $191 $238 $195 $223 $177 $213 $168 $184 Note: Totals may not foot due to rounding

26 2015 Q1 Results ($ in millions) As Reported Pro Forma @ Jan-16 FX Revenue $535 $897 $840 Adj. EBITDA $31 177 $167 Q1 2015 Foreign Exchange Impact
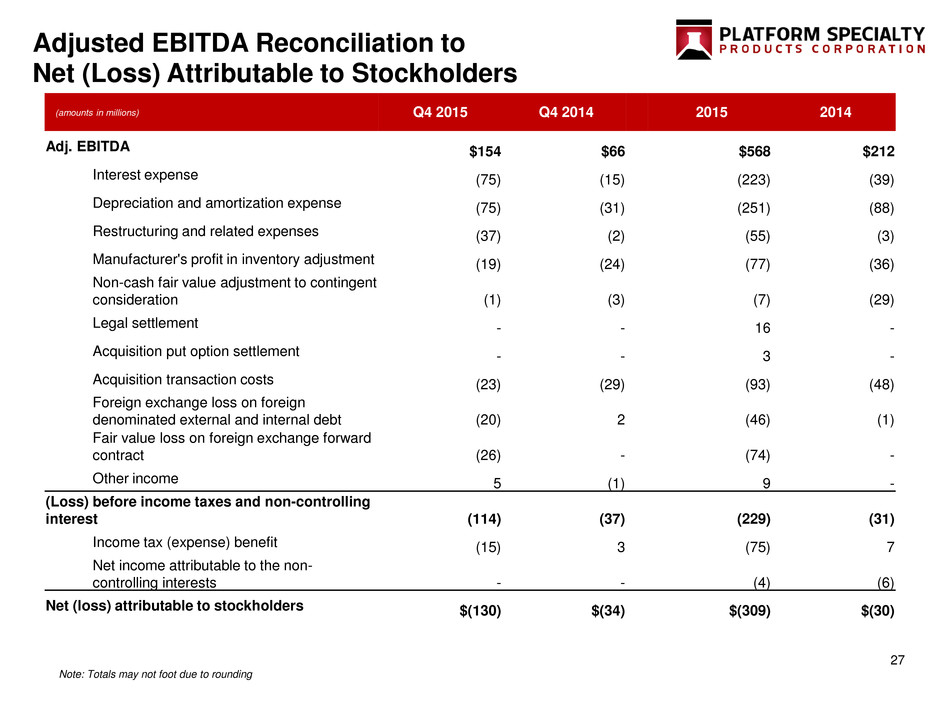
27 Adjusted EBITDA Reconciliation to Net (Loss) Attributable to Stockholders (amounts in millions) Q4 2015 Q4 2014 2015 2014 Adj. EBITDA $154 $66 $568 $212 Interest expense (75) (15) (223) (39) Depreciation and amortization expense (75) (31) (251) (88) Restructuring and related expenses (37) (2) (55) (3) Manufacturer's profit in inventory adjustment (19) (24) (77) (36) Non-cash fair value adjustment to contingent consideration (1) (3) (7) (29) Legal settlement - - 16 - Acquisition put option settlement - - 3 - Acquisition transaction costs (23) (29) (93) (48) Foreign exchange loss on foreign denominated external and internal debt (20) 2 (46) (1) Fair value loss on foreign exchange forward contract (26) - (74) - Other income 5 (1) 9 - (Loss) before income taxes and non-controlling interest (114) (37) (229) (31) Income tax (expense) benefit (15) 3 (75) 7 Net income attributable to the non- controlling interests - - (4) (6) Net (loss) attributable to stockholders $(130) $(34) $(309) $(30) Note: Totals may not foot due to rounding
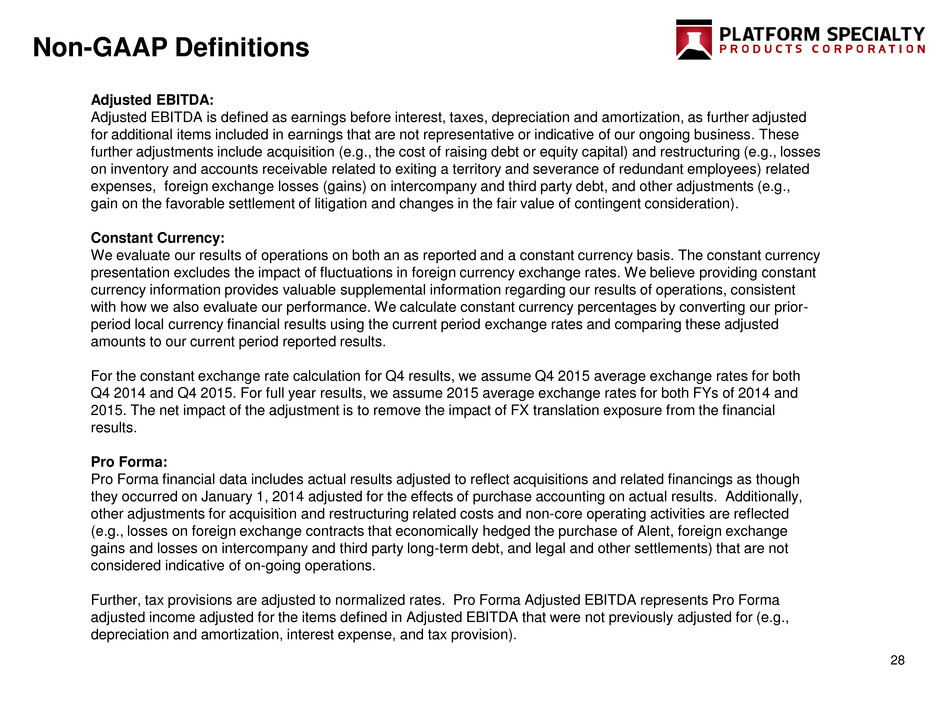
28 Non-GAAP Definitions Adjusted EBITDA: Adjusted EBITDA is defined as earnings before interest, taxes, depreciation and amortization, as further adjusted for additional items included in earnings that are not representative or indicative of our ongoing business. These further adjustments include acquisition (e.g., the cost of raising debt or equity capital) and restructuring (e.g., losses on inventory and accounts receivable related to exiting a territory and severance of redundant employees) related expenses, foreign exchange losses (gains) on intercompany and third party debt, and other adjustments (e.g., gain on the favorable settlement of litigation and changes in the fair value of contingent consideration). Constant Currency: We evaluate our results of operations on both an as reported and a constant currency basis. The constant currency presentation excludes the impact of fluctuations in foreign currency exchange rates. We believe providing constant currency information provides valuable supplemental information regarding our results of operations, consistent with how we also evaluate our performance. We calculate constant currency percentages by converting our prior- period local currency financial results using the current period exchange rates and comparing these adjusted amounts to our current period reported results. For the constant exchange rate calculation for Q4 results, we assume Q4 2015 average exchange rates for both Q4 2014 and Q4 2015. For full year results, we assume 2015 average exchange rates for both FYs of 2014 and 2015. The net impact of the adjustment is to remove the impact of FX translation exposure from the financial results. Pro Forma: Pro Forma financial data includes actual results adjusted to reflect acquisitions and related financings as though they occurred on January 1, 2014 adjusted for the effects of purchase accounting on actual results. Additionally, other adjustments for acquisition and restructuring related costs and non-core operating activities are reflected (e.g., losses on foreign exchange contracts that economically hedged the purchase of Alent, foreign exchange gains and losses on intercompany and third party long-term debt, and legal and other settlements) that are not considered indicative of on-going operations. Further, tax provisions are adjusted to normalized rates. Pro Forma Adjusted EBITDA represents Pro Forma adjusted income adjusted for the items defined in Adjusted EBITDA that were not previously adjusted for (e.g., depreciation and amortization, interest expense, and tax provision).
