UNITED STATES
SECURITIES AND EXCHANGE COMMISSION
Washington, D.C. 20549
FORM 10-K/A
(Amendment No. 1)
ý | ANNUAL REPORT PURSUANT TO SECTION 13 OR 15(d) OF THE SECURITIES EXCHANGE ACT OF 1934 |
For the Fiscal Year Ended November 30, 2015
or
¬ | TRANSITION REPORT PURSUANT TO SECTION 13 OR 15(d) OF THE SECURITIES EXCHANGE ACT OF 1934 |
Commission File Number: 0-19417
PROGRESS SOFTWARE CORPORATION
(Exact name of registrant as specified in its charter)
DELAWARE (State or other jurisdiction of incorporation or organization) | 04-2746201 (I.R.S. Employer Identification No.) | |
14 Oak Park
Bedford, Massachusetts 01730
(Address of Principal Executive Offices)
Telephone Number: (781) 280-4000
Securities registered pursuant to Section 12(b) of the Act:
Title of Each Class | Name of Each Exchange on Which Registered | |
Common Stock $.01 par value | The NASDAQ Global Select Market | |
Securities registered pursuant to Section 12(g) of the Act: None
Indicate by check mark if the registrant is a well-known seasoned issuer, as defined in Rule 405 of the Securities Act. Yes [x] No [ ]
Indicate by check mark if the registrant is not required to file reports pursuant to Section 13 or Section 15(d) of the Exchange Act.
Yes [ ] No [x]
Indicate by check mark whether the registrant (1) has filed all reports required to be filed by Section 13 or 15(d) of the Securities Exchange Act of 1934 during the preceding 12 months (or for such shorter period that the registrant was required to file such reports), and (2) has been subject to such filing requirements for the past 90 days. Yes [x] No [ ]
Indicate by check mark whether the registrant has submitted electronically and posted on its corporate Web site, if any, every Interactive Data File required to be submitted and posted pursuant to Rule 405 of Regulation S-T during the preceding 12 months (or for such shorter period that the registrant was required to submit and post such files). Yes [x] No [ ]
Indicate by check mark if disclosure of delinquent filers pursuant to Item 405 of Regulation S-K is not contained herein, and will not be contained, to the best of registrant’s knowledge, in definitive proxy or information statements incorporated by reference in Part III of this Form 10-K or any amendment to this Form 10-K. [x]
Indicate by check mark whether the registrant is a large accelerated filer, an accelerated filer, a non-accelerated filer, or a smaller reporting company. See definitions of “large accelerated filer,” ”accelerated filer” and “smaller reporting company” in Rule 12b-2 of Exchange Act.
Large accelerated filer [x] Accelerated filer [ ] Non-accelerated filer [ ] Smaller reporting company [ ]
Indicate by check mark whether the registrant is a shell company (as defined in Rule 12b-2 of the Exchange Act). Yes [ ] No [x]
As of May 31, 2015 (the last business day of the registrant’s most recently completed second fiscal quarter), the aggregate market value of voting stock held by non-affiliates of the registrant was approximately $1,292,000,000.
As of March 2, 2016, there were 50,370,516 common shares outstanding.
Documents Incorporated by Reference
None
PROGRESS SOFTWARE CORPORATION
FORM 10-K/A
For the year ended November 30, 2015
TABLE OF CONTENTS
Explanatory Note
PART III
Item 10. Directors, Executive Officers and Corporate Governance
Item 11. Executive Compensation
Item 12. Security Ownership of Certain Beneficial Owners and Management and Related Stockholder Matters
Item 13. Certain Relationships and Related Transactions, and Director Independence
Item 14. Principal Accountant Fees and Services
PART IV
Item 15. Exhibits and Financial Statement Schedules
Signatures
EX-31.1 Certification Pursuant to Section 302 of the Sarbanes-Oxley Act of 2002 - Principal Executive Officer
EX-31.2 Certification Pursuant to Section 302 of the Sarbanes-Oxley Act of 2002 - Principal Financial Officer
EXPLANATORY NOTE
Progress Software Corporation (referred to as Progress, the company, we, us or our) is filing this Amendment No. 1 on Form 10-K/A (this “Amendment”) to its Annual Report on Form 10-K for the year ended November 30, 2015, originally filed on January 29, 2016 (the “Original Report”), for the sole purpose of including the information required by Part III of Form 10-K. Accordingly, Items 10, 11, 12, 13, and 14 of Part III of our Original Report are replaced in their entirety with the information provided herein. This Form 10-K/A does not amend, update or change any other items or disclosure in the Original Report or reflect events that occurred after the date of the Original Report. Therefore, this Amendment should be read in conjunction with our Original Report and our other filings made with the United States Securities and Exchange Commission (“SEC”) subsequent to the filing of the Original Report.
This Form 10-K/A also includes as exhibits the certifications required by Rule 13a-14(a) of the Securities Exchange Act of 1934.
PART III
ITEM 10. DIRECTORS, EXECUTIVE OFFICERS, AND CORPORATE GOVERNANCE
Board of Directors | ||||
Currently, our Board of Directors is comprised of seven members. Each director has been elected to hold office until the next annual meeting of shareholders or special meeting in lieu of such annual meeting or until his successor has been duly elected and qualified, or until his earlier death, resignation or removal. There are no family relationships among any of our executive officers or directors.
The following table sets forth our directors, their ages, and the positions currently held by each person with our company. In addition, for each person we have included information regarding the business or other experience, qualifications, attributes or skills considered in determining that each person should serve as a director.
Name | Age | Position | ||
Barry N. Bycoff | 67 | Director | ||
John R. Egan (2)(3) | 58 | Non-Executive Chairman of the Board | ||
Ram Gupta (1)(2) | 54 | Director | ||
Charles F. Kane (1)(3) | 58 | Director | ||
David A. Krall (2)(3) | 55 | Director | ||
Michael L. Mark (1)(2) | 70 | Director | ||
Philip M. Pead | 63 | President and Chief Executive Officer and Director | ||
(1) | Member of Audit Committee |
(2) | Member of Nominating and Corporate Governance Committee |
(3) | Member of Compensation Committee |
Mr. Bycoff has been a director since May 2007. Mr. Bycoff was our Executive Chairman from March 2009 until April 2011. From May 2005 to July 2007, Mr. Bycoff was a venture partner of Pequot Ventures, the venture capital arm of Pequot Capital Management, Inc. Mr. Bycoff has also served as Chairman of Aveksa Inc, Chairman of Day Software Holding AG, and on the Board of Directors of StubHub Inc.
As the founder and former Chief Executive Officer of Netegrity, Inc., a public technology company, Mr. Bycoff demonstrated leadership, management, and strategic experience, as well as significant financial, operational, and corporate governance experience. Mr. Bycoff also has significant management experience from working in a variety of software companies. Mr. Bycoff also has valuable experience as a current and former board member of a number of public and private technology-related companies. Mr. Bycoff also brings to the Board of Directors his investing experience from his tenure at Pequot Ventures.
Mr. Egan became our Non-Executive Chairman of the Board in December 2012. Mr. Egan has been a director since September 2011. Mr. Egan is managing partner of Carruth Management, LLC, a Boston based venture capital fund he founded in October 1998 that specializes in technology and early stage investments. From October 1986 until September 1998, Mr. Egan served in a number of executive positions with EMC Corporation (NYSE: EMC), a publicly-held global leader in information technology, including Executive Vice President, Products and Offerings, Executive Vice President, Sales and Marketing, Executive Vice President, Operations and Executive Vice President, International Sales. Mr. Egan serves on the Board of Directors for other publicly-traded and privately-held companies. They include: EMC Corporation (NYSE: EMC), VMWare, Inc. (NYSE: VMW), a publicly-traded leader in virtualization and cloud infrastructure, Verint Systems, Inc. (NASDAQ: VRNT), a publicly-held provider of systems to the internet security market, and NetScout Systems, Inc. (NASDAQ: NTCT), a publicly-held network performance management company, where he serves as Lead Director.
Mr. Egan brings to our Board of Directors extensive understanding and expertise in the information technology industry as a result of his service on other boards of directors combined with his executive leadership roles at EMC Corp. His broad experience ranges from venture capital investments in early-stage technology companies to extensive sales and marketing experience, to executive leadership and management roles. Mr. Egan brings to the Board business acumen, substantial operational experience, and expertise in corporate strategy and development. Mr. Egan also has extensive experience serving as director of publicly-traded companies.
Mr. Gupta has been a director since May 2008. From May 2007 until May 2010, Mr. Gupta was Executive Chairman of CAST Iron Systems, Inc., a leading software-as-a-service (SaaS) and cloud application integration provider. Prior to that
-4-
time, from November 2005 until May 2007, Mr. Gupta was President and Chief Executive Officer of CAST Iron Systems, Inc. Mr. Gupta was previously a director of S1 Corp. and Source Forge, Inc. Mr. Gupta also has served in a variety of leadership roles within the Board of Directors of several privately-held technology companies including Platform Computing Corporation, Persistent Systems Limited, Accruent Inc., and Yodlee Inc.
Mr. Gupta has extensive strategic marketing and management expertise at global technology companies, including responsibility for strategy, marketing, development, customer support, alliances, and mergers and acquisitions. As a former executive and board member of several technology-related public companies, Mr. Gupta offers industry specific, public company board experience to our Board of Directors. His extensive experience in the software industry, particularly in the area of strategy and marketing, is a significant asset to the Board of Directors.
Mr. Kane has been a director since November 2006. Mr. Kane is an adjunct professor of International Finance at the MIT Sloan Graduate Business School of Management. Mr. Kane is currently a Director and Strategic Advisor of One Laptop Per Child, a non-profit organization that provides computing and internet access for students in the developing world, for whom he served as President and Chief Operating Officer from 2008 until 2009. Mr. Kane served as Executive Vice President and Chief Administrative Officer of Global BPO Services Corp., a special purpose acquisition corporation, from July 2007 until March 2008, and as Chief Financial Officer of Global BPO from August 2007 until March 2008. Prior to joining Global BPO, he served as Chief Financial Officer of RSA Security Inc., a provider of e-security solutions, from May 2006 until RSA was acquired by EMC Corporation in October 2006. From July 2003 until May 2006, he served as Chief Financial Officer of Aspen Technology, Inc. (NYSE: AZPN), a publicly-traded provider of supply chain management software and professional services. Mr. Kane is currently a director of Demandware, Inc. (NYSE: DWRE), a publicly-traded leading provider of software-as-a-service (SaaS) ecommerce solutions that enable companies to deliver customized shopping experiences to consumers in the digital world, Carbonite, Inc. (NASDAQ: CARB), a publicly-traded leading provider of online backup solutions for consumers and small and medium sized businesses, and Realpage Inc. (NASDAQ: RP), a publicly-traded company providing on-demand software solutions for the rental housing industry. Mr. Kane was previously a director of Netezza Corporation, Borland Software Corporation, and Applix Inc.
As our Audit Committee financial expert and Chairman of the Audit Committee, Mr. Kane provides a high level of expertise and leadership experience in the areas of finance, accounting, audit oversight, and risk analysis derived from his experience as the chief financial officer of publicly-traded technology companies. Mr. Kane also offers substantial public company board experience to our Board of Directors.
Mr. Krall has been a director since February 2008. Mr. Krall has served as a strategic advisor to Roku, Inc., a leading manufacturer of media players for streaming entertainment since December 2010, and to Avegant Corp., a privately-held leading developer of the next generation of wearable devices since February, 2016. From February 2010 to November 2010, he served as President and Chief Operating Officer of Roku, where he was responsible for managing all functional areas of the company. Prior to that, Mr. Krall spent two years as President and Chief Executive Officer of QSecure, Inc., a privately-held developer of secure credit cards based on micro-electro-mechanical-system technology. From 1995 to July 2007, he held a variety of positions of increasing responsibility and scope at Avid Technology, Inc. (NYSE: AVID), a publicly-traded leading provider of digital media creation tools for the media and entertainment industry. His tenure at Avid included serving seven years as the company’s President and Chief Executive Officer. Mr. Krall also currently serves on the Board of Directors for Universal Audio, Inc., a privately-held manufacturer of audio hardware and software plug-ins, WeVideo, Inc., privately-held a provider of a collaborative video editing platform, Audinate Pty Ltd., a creator of the industry-leading media networking technology, and Quantum Corp. (NYSE: QTM), a publicly-traded global expert in data protection and big data management.
Mr. Krall has significant leadership, management, and operational experience through his service in a broad range of executive positions within the software and technology industries. From working in companies ranging from small startups to public companies with thousands of employees serving worldwide marketplaces, Mr. Krall brings experience in the areas of new product development, integration of complex software and hardware solutions, strategy formation, and general management.
Mr. Mark has been a director since July 1987. He was our Non-Executive Chairman of the Board from April 2011 until May 2012 and also from December 2006 until March 2009. From March 2009 until April 2011, Mr. Mark served as Lead Independent Director. Mr. Mark is a private investor and member of Walnut Venture Associates, an investment group seeking opportunities in early-stage and emerging high-tech companies in New England. Mr. Mark was a founder of several high-tech companies, including Intercomp Company, American Energy Services, Inc., and Cadmus Computer Systems Corporation. Mr. Mark is also an investor in numerous early-stage companies and serves on several private boards of directors.
Mr. Mark has served on our Board of Directors for almost thirty years, spanning the entire time that we have been a public company. As a result, Mr. Mark provides our Board of Directors with critical historical knowledge and insights on our
-5-
business and the software industry generally. Mr. Mark also has extensive experience as a director of public and private companies.
Mr. Pead became our President and Chief Executive Officer on December 7, 2012. Prior to that time, Mr. Pead was our Interim Chief Executive Officer, a position he assumed on November 2, 2012. Mr. Pead served as Executive Chairman of the Board from October 8, 2012 until December 7, 2012. Mr. Pead was our Non-Executive Chairman of the Board from May 2012 until October 2012. Mr. Pead has been a director since July 2011. Mr. Pead was formerly the Chairman of the Board of Directors of Allscripts Health Solutions Inc. (NASDAQ: MDRX), a publicly-traded leading health care information technology company. Mr. Pead was also the President and Chief Executive Officer of Eclipsys Corporation, a leading provider of enterprise clinical and financial software for hospitals, which was merged with Allscripts in August 2010. From March 2007 to May 2009, Mr. Pead served as the Managing Partner of Beacon Point Partners LLC, a healthcare consulting firm. Mr. Pead served as President and Chief Executive Officer of Per-Se Technologies Inc., a provider of healthcare information technology services, from November 2000 until its acquisition by McKesson Corporation in January 2007.
As our Chief Executive Officer, Mr. Pead provides key insight and advice with respect to corporate strategy and management development and a deeper understanding of our products, technology, and market opportunities. Furthermore, Mr. Pead provides our company with industry insight and knowledge as a result of his many years of experience in the software industry, working in executive roles in several publicly- and privately-held companies, including Per-Se Technologies, Dun & Bradstreet Corporation, and Attachmate Corporation. In addition to Progress Software Corporation, Mr. Pead serves on the board of directors of Change Healthcare Holdings, Inc. (f/k/a/ Emdeon Inc.), which was a publicly-traded company until it was acquired by The Blackstone Group L.P. and Hellman & Friedman LLC., and aLabs Corp., doing business as Accumen, a privately-held technology company focused on partnering with health systems to deliver lab excellence.
Executive and Other Key Officers of the Registrant | ||||
The following table sets forth certain information regarding our executive and other key officers.
Name | Age | Position | ||
Michael Benedict | 43 | Chief Product Officer | ||
Stephen Faberman | 46 | Chief Legal Counsel | ||
Svetozar Georgiev | 38 | Senior Vice President, Application Platforms | ||
Philip Pead | 62 | President and Chief Executive Officer | ||
Chris Perkins | 52 | Chief Financial Officer | ||
Melissa Puls | 41 | Chief Marketing Officer | ||
Matthew Robinson | 42 | Chief Technology Officer | ||
Jerry Rulli | 58 | Chief Operating Officer | ||
Robert Steward | 45 | Chief Product Development Officer | ||
Dimitre Taslakov | 38 | Chief Talent Officer | ||
Vassil Terziev | 36 | Chief Innovation Officer | ||
Mr. Benedict became Chief Product Officer in October 2015. Prior to that time, beginning in September 2014, Mr. Benedict was President, Data Connectivity and Integration Business Unit. Prior to that time, Mr. Benedict was Vice President, Pacific Cloud Platform and OpenEdge Product Line, a position he assumed in June 2013. Prior to that time, Mr. Benedict was Vice President, Data Connectivity Business Line Leader since May 2012. From March 2011 to May 2012, Mr. Benedict was Vice President of Product Management.
Mr. Faberman became Chief Legal Counsel in December 2015. Prior to that time, Mr. Faberman was Senior Vice President, General Counsel. Mr. Faberman became General Counsel in December 2012 and a Senior Vice President in January 2014. Prior to that time, from October 2012 to December 2012, Mr. Faberman was Vice President, Acting General Counsel, and from January 2012 to October 2012, Mr. Faberman was Vice President, Deputy General Counsel.
Mr. Georgiev became Senior Vice President, Application Platforms in December 2014 upon our acquisition of Telerik, Inc. Prior to the acquisition, Mr. Georgiev was co-Chief Executive Officer of Telerik, Inc. which he co-founded in 2002.
Mr. Pead became President and Chief Executive Officer in December 2012. Prior to that time, from November 2012 to December 2012, Mr. Pead was Executive Chairman and Interim Chief Executive Officer. Prior to that time, from May 2012 until November 2012, Mr. Pead served as non-Executive Chairman of the Board. Mr. Pead joined our Board of Directors in July 2011.
-6-
Mr. Perkins became Chief Financial Officer in February 2013. Prior to that time, Mr. Perkins was a member of the Board of Directors of Immucor, Inc. from August 2008 until August 2011, when it was acquired by an affiliate of TPG Capital, L.P.
Ms. Puls became Chief Marketing Officer in October 2014. Prior to that time, Ms. Puls held various executive marketing positions at Iron Mountain, Inc., the most recent of which was Vice President, Global Demand Center, a position she held from January 2014 until October 2014. Ms. Puls joined Iron Mountain, Inc. in March 2011.
Mr. Robinson became Chief Technology Officer in May 2015. Prior to that time, Mr. Robinson was Vice President, Technology within our Application Development and Deployment business unit. Mr. Robinson joined our company in June 2013 in connection with the acquisition of Rollbase Inc., which Mr. Robinson co-founded in 2007.
Mr. Rulli became Chief Operating Officer in July 2015. Prior to that time, Mr. Rulli was President, OpenEdge Business Unit from August 2014 when he joined us. Prior to that time, from June 2010 to May 2014, Mr. Rulli was Executive Vice President, Worldwide Sales at Iron Mountain, Inc.
Mr. Steward became Chief Product Development Officer in October 2015. Prior to that time, Mr. Steward was Acting Chief Product Development Officer and Vice President, Engineering from April 2015 until October 2015. From June 2013 until April 2015, Mr. Steward was Vice President, Product Development. Prior to that time, Mr. Steward held several other senior positions within our development organization.
Mr. Taslakov became Chief Talent Officer in December 2014 upon our acquisition of Telerik, Inc. Prior to the acquisition, Mr. Taslakov was Chief Talent Officer of Telerik, Inc. a position he assumed in January 2014. Prior to that time, from November 2012 until December 2013, he was Telerik’s Chief Revenue Officer. Prior to November 2012, Mr. Taslakov was Vice President of Business Development.
Mr. Terziev became Chief Innovation Officer in December 2014 upon our acquisition of Telerik, Inc. Prior to the acquisition, Mr. Terziev was co-Chief Executive Officer of Telerik, Inc. which he co-founded in 2002.
Audit Committee | ||||
The Audit Committee of our Board of Directors during 2015 consisted of Messrs. Gupta, Kane, and Mark, with Mr. Kane serving as Chairman. The Audit Committee met eight times during 2015.
Our Board of Directors has determined that each member of the Audit Committee meets the independence requirements promulgated by NASDAQ and the SEC, including Rule 10A-3(b)(1) under the Securities Exchange Act of 1934, as amended, or the Exchange Act. In addition, our Board of Directors has determined that each member of the Audit Committee is financially literate and that Mr. Kane qualifies as an “audit committee financial expert” under the rules of the SEC.
The Audit Committee operates under a written charter adopted by our Board of Directors, a copy of which can be found on our website at www.progress.com under the heading “Corporate Governance” located on the “Company Info/Who We Are” page.
The Audit Committee assists our Board of Directors in fulfilling its oversight responsibilities for accounting and financial reporting compliance. The Audit Committee meets with management and with our independent registered public accounting firm to discuss our financial reporting policies and procedures, our internal control over financial reporting, the results of the independent registered public accounting firm’s examinations, our critical accounting policies and the overall quality of our financial reporting, and the Audit Committee reports on these matters to our Board of Directors. The Audit Committee meets with the independent registered public accounting firm with and without our management present.
-7-
For 2015, among other functions, the Audit Committee:
• | appointed the independent registered public accounting firm; |
• | reviewed with our independent registered public accounting firm the scope of the audit for the year and the results of the audit when completed; |
• | reviewed the independent registered public accounting firm’s fees for services performed; |
• | reviewed with management and the independent registered public accounting firm the annual audited financial statements and the quarterly financial statements, prior to the filing of reports containing those financial statements with the SEC; |
• | reviewed with management our major financial risks and the steps management has taken to monitor and control those risks; and |
• | reviewed with management various matters related to our internal controls. |
Section 16(a) Beneficial Ownership Reporting Compliance | ||||
Section 16(a) of the Exchange Act requires our directors, executive officers, and holders of more than 10% of our common stock to file with the SEC initial reports of ownership and reports of changes in ownership of our common stock. These reporting persons are required by regulations of the SEC to furnish us with copies of all such filings. Based solely on a review of the copies of such forms that we have received, and on written representations from certain reporting persons, we believe that, with respect to the fiscal year ended November 30, 2015, our directors, officers, and 10% stockholders complied with all applicable Section 16(a) filing requirements.
Code of Conduct and Business Ethics | ||||
Our Board of Directors has adopted a Code of Conduct and Business Ethics that applies to all of our officers, directors, and employees. A copy of the Code of Conduct and Business Ethics can be found on our website at www.progress.com under the heading “Corporate Governance” located on the “Company Info/Who We Are” page.
-8-
ITEM 11. EXECUTIVE COMPENSATION
COMPENSATION DISCUSSION AND ANALYSIS
Introduction | ||||
This “Compensation Discussion and Analysis” section describes the elements of our compensation programs for our executive officers. This section also provides an overview of our executive compensation philosophy and analyzes how and why the Compensation Committee of our Board of Directors arrives at specific compensation decisions and policies.
We describe below our compensation philosophy, policies, and practices relating to the fiscal year ended November 30, 2015 with respect to the following “named executive officers,” whose compensation is set forth in the Summary Compensation Table and other compensation tables contained in this Form 10-K/A:
• | Philip Pead, our Chief Executive Officer; |
• | Chris Perkins, our Chief Financial Officer; |
• | Jerry Rulli, our Chief Operating Officer; |
• | Matthew Robinson, our Chief Technology Officer; |
• | Michael Benedict, our Chief Product Officer; and |
• | Karen Tegan Padir, who served as our President, Application Development and Deployment Business Unit until October 16, 2015. |
We present our Compensation Discussion and Analysis in the following sections:
1. Executive Summary. In this section, we discuss our 2015 corporate performance and certain governance aspects of our executive compensation program. | p. 9 |
2. Executive Compensation Program. In this section, we describe our executive compensation philosophy and process and the material elements of our executive compensation program. | p. 14 |
3. 2015 Executive Compensation Decisions. In this section, we provide an overview of our Compensation Committee’s executive compensation decisions for 2015 and certain actions taken before or after 2015 when doing so enhances the understanding of our executive compensation program. | p. 18 |
4. Other Executive Compensation Matters. In this section, we describe our other compensation policies and review the accounting and tax treatment of compensation. | p. 29 |
Executive Summary | ||||
Business Overview
We are a global software company that simplifies the development, deployment and management of business applications on premise or in the cloud, on any platform or device, to any data source, with enhanced performance, minimal IT complexity and low total cost of ownership. Our comprehensive portfolio of products provides leading solutions for rapid application development, broad data integration and efficient data analysis.
Execution of Transformational Strategic Plan
Beginning in 2012, we embarked on a major shift in our strategy by refocusing our efforts on our core strengths in application development with the ultimate goal of becoming a leading provider of next-generation application development capabilities in the cloud. Our vision is to become the leading destination for developers and our foundation for future growth is built upon executing this vision. At the beginning of fiscal 2015, we took a significant step forward in achieving our vision by acquiring Telerik, a leading provider of application development tools. Telerik enables its 1.7 million strong developer community to create compelling user experiences across cloud, web, mobile and desktop applications. The Telerik acquisition strengthened our capabilities so that we now provide comprehensive cloud and on-premise platform offerings that enable developers to rapidly create beautiful applications, driven by data for any web, desktop or mobile platform.
During fiscal 2015, by leveraging products and solutions acquired as part of Telerik, we further refined our strategy by focusing our efforts on addressing the needs of businesses that are undergoing digital transformation. Developers play an integral role in helping businesses undergo digital transformation, and our products and solutions align with the needs of
-9-
those businesses. Web, mobile, rules, and data connectivity are all critical to this rapidly evolving space, and our technologies excel in all of these areas. Our digital transformation strategy is a multi-year one and requires that we make investments in those product lines and technologies that address this growing challenge.
As reflected in the chart below, our strategic transformation has been a multi-year journey. Although we have completed the major elements of the new strategic plan, our transformation is on-going. As described below, our executive compensation programs have been designed with this transformation in mind by tying the outcomes of our executive incentive compensation awards to the achievement of aggressive strategic and financial performance objectives designed to build sustainable long-term stockholder value.
FY12 | FY13 | FY14 | FY15 |
April 2012 Announce new strategic plan, covering new product strategy, divestitures and share buyback October 2012 Launch $350M share buyback, completed in November 2013 November/December 2012 Phil Pead becomes CEO | January 2013 Focus on OpenEdge base, new product releases with mobile, BPM and rules June 2013 Acquire high-productivity PaaS Rollbase July 2013 Complete last divestiture of 11 non-core products August 2013 Launch DataDirect Cloud | January 2014 Visionary in aPaaS Gartner Magic Quadrant, only behind Salesforce.com and Microsoft June 2014 Launch Rollbase Mobile; acquire control PaaS Modulus, enter fast-growing Node.js ecosystem September 2014 Reorganization into 3 business units | December 2014 Acquire Telerik - attract more developers, complete the offering for all phases of the development lifecycle, growing opportunity in web content mgmt. July 2015 Jerry Rulli becomes COO November 2015 Launch Telerik Platform for OpenEdge, providing for integration of OpenEdge with the Telerik mobile application development platform |
2015 Organizational Transformation
In fiscal 2015, we operated as three distinct business units: OpenEdge, Data Connectivity and Integration (DCI), and Application Development and Deployment (AD&D), each with dedicated sales, product management, and product marketing functions. This organizational change, which was designed to more closely align our operational structure with our strategic plan, allowed us to provide greater focus and agility in the delivery of next generation application development, deployment, and integration solutions. It also enabled the business to better deliver against the fast paced requirements in the on-premise and cloud application development and data connectivity and integration markets. Each business unit was led by a President, Mr. Rulli, in the case of OpenEdge, Mr. Benedict, in the case of DCI, and Ms. Padir, in the case of AD&D.
In July 2015, Mr. Rulli became our Chief Operating Officer. As Chief Operating Officer, Mr. Rulli assumed responsibility for driving the operations of the three business units while continuing to manage the OpenEdge Business Unit on a day-to-day basis. We made this decision because we saw opportunities to better align business unit priorities and go-to-market strategies and to ensure operational excellence across the company.
In October 2015, we further refined our business unit structure to enhance integration and collaboration across our product divisions in order to address expanding market opportunities around customer experiences and to further advance our growth strategy. The organizational changes were designed to align our company’s operations around a cohesive, audience-centered approach and a strategic product management organization. As described below, we retained our business unit focus and segment reporting.
However, as part of these organizational changes, we eliminated the role of Business Unit President. In place of the Business Unit Presidents, we unified our product management and product marketing functions under Mr. Benedict, as Chief Product Officer, reporting to Mr. Rulli. We retained our business unit focus within the Chief Product Office organization, with dedicated product teams for each business segment, each under the leadership of a general manager reporting directly to Mr. Benedict.
In order to ensure tighter integration between the company’s product management, marketing, and development functions, we also realigned corporate marketing and engineering and development to report to Mr. Rulli. Our sales resources report directly into the company’s geographic regions under Mr. Rulli, while retaining the dedicated business segment sales teams for each of the products.
With the elimination of the role of Business Unit President, Ms. Padir left our company in October 2015.
-10-
2015 Financial Results
In fiscal 2015, we achieved solid performance across all key areas of our business. For fiscal 2015:
Fiscal 2014 | Fiscal 2015 | % increase | |
Total Non-GAAP Revenue | $332.5 million | $412.4 million | 24% |
Net Income | $77.9 million | $80.6 million | 3% |
Non-GAAP Operating Income | $117.4 million | $120.4 million | 3% |
Non-GAAP Earnings Per Share | $1.51 | $1.58 | 5% |
Adjusted Free Cash Flow | $99.0 million | $102 million | 3% |
A reconciliation between the Non-GAAP measures and GAAP results is located at the end of this Compensation Discussion & Analysis section.
However, despite our strong performance, our financial results fell short of our aggressive expectations. We were adversely impacted by weakness in economic conditions in certain international markets such as Brazil and within parts of Europe. We were also adversely impacted by a slower first half of 2015 in certain product lines, including the Telerik products as we worked to integrate Telerik with our other operations. As a result of our financial results falling short of our expectations, Mr. Pead and Mr. Perkins did not receive any portion of their target bonus in fiscal 2015.
2015 Executive Compensation Program Design
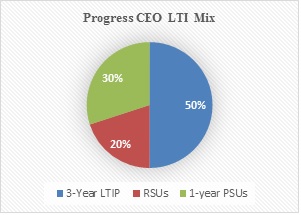
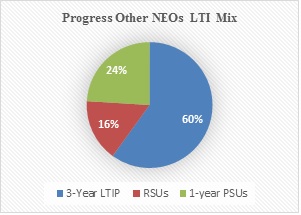
Consistent with its pay-for-performance philosophy, the Compensation Committee, in designing our executive compensation programs for fiscal 2015, emphasized alignment with our aggressive short- and long-term business goals. As shown in the following chart, for 2015, 70% of our named executive officers’ target total direct compensation was performance-based. In addition, approximately 80% of Mr. Pead’s and the other named executive officers’ long term equity incentive compensation was delivered in the form of performance-based awards.

2015 Executive Compensation Results - Commitment to Pay-for-Performance Philosophy
Our executive compensation programs are designed to directly tie the outcomes of our compensation programs for our executive officers to the achievement of our key financial performance objectives and returns to our stockholders, and drive the creation of sustainable long-term stockholder value. When results do not meet our expectations, as was the case in
-11-
2015 (and 2014), our named executive officers’ receive compensation that is below our target levels and may be below market in comparison to our peer group.
• | No Corporate Bonus Payout for Performance Below Threshold. Our fiscal 2015 financial results fell short of the threshold level of performance applicable to the named executive officers under the Corporate Bonus Plan. As a result, Mr. Pead and the other named executive officers subject to the Corporate Bonus Plan did not receive any portion of their annual cash bonus under that plan. |
• | Achievement Under Business Unit Bonus Plans. Mr. Rulli and Mr. Benedict received 38% and 79%, respectively, of their annual cash bonus based on performance under their respective Business Unit Bonus Plans. Ms. Padir received 29% of her annual cash bonus based on the performance of the AD&D business unit pursuant to the separation agreement we entered into in connection with her termination of employment. |
• | Strong EPS Performance. Our 2015 annual performance equity program applicable to named executive officers was tied to our earnings per share performance. Based on our achievement of non-GAAP earnings per share of $1.74 against a target of $1.77, our named executive officers earned 84% of their performance share units. |
CEO Pay and Performance Alignment
We believe our executive compensation program has been effective at driving the achievement of our target financial and strategic results, appropriately aligning executive pay and corporate performance and enabling us to attract and retain top executives within our industry. When results do not meet our expectations, as was the case in 2015 (and 2014), our named executive officers’ receive compensation that is below our target levels and may be below market in comparison to our peer group. As shown in the table below, fiscal 2015 marked the second consecutive year that Mr. Pead’s total target and realizable compensation decreased year-over-year.
Fiscal Year | Total Target Compensation ($)(1) | % Performance-Based | Total Realizable Compensation ($)(2) | % of Target Compensation Realized |
2013 | 13,150,000 | 41% | 14,275,640 | 109% |
2014 | 6,100,000 | 61% | 2,411,754 | 40% |
2015 | 3,800,000 | 70% | 1,595,278 | 42% |
_____________
(1) | Total Target Compensation is defined as the sum of (a) base salary, (b) target bonus, (c) the value of restricted stock units awarded equal to the number of RSUs granted multiplied by the closing price of our stock on the grant date, (d) the value of performance share units awarded relating to annual performance equal to the number of PSUs granted multiplied by the closing price of our stock on the grant date, and (e) in the case of fiscal 2014 and 2015, the value of the PSUs awarded under the Long Term Incentive Plan equal to the number of PSUs granted multiplied by the closing price of our stock on the grant date. |
(2) | Total Realizable Compensation is defined as the sum of (a) base salary, (b) in the case of fiscal 2013, the bonus paid to Mr. Pead under the 2013 Corporate Bonus Plan, (c) the value of restricted stock units awarded equal to the number of RSUs granted multiplied by the closing price of our stock on November 30, 2015, which was $23.99, and (d) in the case of fiscal 2013 and fiscal 2015, the value of the PSUs awarded relating to annual performance equal to the number of PSUs finally awarded multiplied by the closing price of our stock on November 30, 2015, which was $23.99. We exclude the value of the PSUs awarded under the Long Term Incentive Plan in fiscal 2014 and fiscal 2015 because as of the end of our fiscal year ended November 30, 2015, none of those PSUs would vest. |
As a result of our financial performance in fiscal 2014, Mr. Pead did not earn any portion of his annual bonus or his $1.75 million PSU award. As a result of our financial performance in fiscal 2015, Mr. Pead did not earn any portion of his annual bonus.
In November 2012, Mr. Pead became our Interim Chief Executive Officer after the sudden departure of our prior Chief Executive Officer. At that time, we were in the midst of substantial change in our strategy, management team, organization, product lines, and operations. Although our Board commenced a search process to recruit a permanent replacement, ultimately, our Board determined that Mr. Pead was the best candidate to serve as our President and Chief Executive Officer in light of his experience, knowledge of our company, and relationship with our shareholders and the investment community generally.
To recruit Mr. Pead to serve as Chief Executive Officer, we developed a compensation package that included a new hire equity award with a value in excess of the typical annual award for which Mr. Pead would otherwise have been eligible under our annual equity program. The Compensation Committee’s philosophy with respect to new hire awards is that they should be larger than awards under our annual equity program in order to recruit executives during challenging transition periods and to align the interests of new executives with the interests of our shareholders. In line with our pay-for-performance philosophy, 40% of the value of Mr. Pead’s new hire equity award was delivered in the form of PSUs that vested
-12-
based on achievement of the pre-determined revenue and non-GAAP operating income goals in our 2013 budget and operating plan.
Following fiscal 2013, the amount and mix of Mr. Pead’s compensation has changed significantly:
• | For fiscal 2014, Mr. Pead’s annual equity award was reduced to a value of $3.5 million, with 50% of the award in the form of RSUs and 50% in the form of PSUs. |
• | For fiscal 2015, Mr. Pead’s annual equity award was reduced to a value of $1.2 million, with 40% in the form of RSUs and 60% in the form of PSUs. |
• | For each of fiscal 2014 and 2015, Mr. Pead received an award under our long-term performance based equity program based on our total relative stockholder return over a three-year performance period. |
• | 80% of Mr. Pead’s total equity compensation awarded in 2015 (annual and long-term) was performance-based. |
• | Mr. Pead’s base salary and annual target bonus have not changed since 2013. |
• | Excluding Mr. Pead’s fiscal 2013 new hire award, Mr. Pead’s aggregate realizable pay since he became Chief Executive Officer is less than the 25th percentile among the chief executive officers of our peer companies. |
Response to 2015 Say-on-Pay Vote
We value the input of our stockholders on our compensation programs. We hold an advisory vote on executive compensation on an annual basis. We also regularly communicate with our stockholders to better understand their opinions on governance issues, including compensation. The Compensation Committee carefully considers stockholder feedback and the outcome of each vote when reviewing our executive compensation programs each year.
At our 2015 annual stockholders meeting, over 90% of the votes cast approved, on an advisory basis, our executive compensation for fiscal year 2014. This represented a substantial improvement from the 58% stockholder approval received in 2014 with respect to our 2013 executive compensation. We were pleased with this level of support and believe the improvement in the vote is reflective of the changes in our executive compensation programs adopted by the Compensation Committee during the past two years, including the following:
• | Multi-Year Performance Period - reduction of performance-based equity tied to one-year performance periods and adoption of a long-term performance based equity program based on our relative total stockholder return over a three-year performance period; |
• | Pay-for-Performance - substantial increase in proportion of total target compensation that is performance based; |
• | Varied Performance Metrics -use of different metrics in our annual cash bonus program and equity plans; |
• | Responsible Recruiting Practices - issuance of new hire awards to executives that are at least 50% performance based; and |
• | Rigorous Performance Goals - design of our annual bonus plans so that no payout would occur unless we achieve financial objectives that are over 95% of our aggressive operating plan and budget. |
Before and after implementing these changes, we contacted stockholders to discuss and obtain feedback on the various components of our executive compensation program. In addition to taking stockholder feedback into account, the Compensation Committee has evaluated a number of other factors discussed below in making decisions about our executive compensation approach.
Compensation Governance
What We Do:
• | Pay-for-performance (page 18) |
• | Grant performance-based equity awards with performance measures that span up to three years (page 27) |
• | Use a balanced mix of fixed and variable cash incentives and long-term equity (page 17) |
• | Maintain stock ownership guidelines (page 29) |
• | Maintain a compensation recovery (or “clawback”) policy (page 30) |
• | Limit payments and benefits following a change in control of our company to situations involving an involuntary termination of employment (a so-called “double trigger” arrangement) (page 38) |
-13-
• | Design our annual incentive plans so that payout of awards does not occur if we fail to achieve growth in the applicable financial metrics over the prior year and if we do not achieve at least 95% of our annual operating plan and budget (page 24) |
• | Cap the amounts our executives can earn under our annual incentive plans (page 24) |
• | Aim to mitigate the potential dilutive effect of equity awards and to return capital to stockholders through a share repurchase program |
What We Don’t Do:
• | We don’t provide perquisites or other personal benefits that are not available to all of our employees (page 17) |
• | We don’t allow unvested and unexercised equity awards to be transferred |
• | We don’t guarantee salary increases or non-performance-based bonuses (page 31) |
• | We don’t provide excise tax gross-ups (page 39) |
• | We don’t allow hedging transactions or pledging of company stock by directors and executive officers (page 30) |
Executive Compensation Program | ||||
Philosophy and Objectives
Our philosophy is to reward executive officers based upon corporate performance, as well as to provide long-term incentives for the achievement of future financial and strategic goals. We use a combination of cash compensation, composed of base salary and an annual cash bonus program, long-term equity incentive compensation programs, and a broad-based benefits program to create a competitive compensation package for our executive management team. We tie the payment of cash and equity incentive compensation to executive officers exclusively to the achievement of financial objectives.
In recent years, including fiscal 2015, the Compensation Committee has structured our executive compensation programs to reflect an appropriate risk/reward balance in light of the transformational change in our strategy we have undertaken. As such, our philosophy is to provide substantial rewards/incentives to our executive team for achieving challenging results that are aligned with stockholder goals. For example, in structuring our performance-based compensation programs, such as our annual Corporate Bonus Plan, our philosophy is to set financial targets that are difficult to attain and require achievement of financial objectives closely linked to our annual operating plan and budget. If those targets are not met within 90% (or for 2015, 95%) of our budget, no bonus is paid. However, if we meet or exceed our aggressive goals, bonuses in excess of target can be earned subject to maximum payouts. In either case, our interests are aligned with those of our stockholders.
Compensation Review Process
Role of Compensation Committee
Each year, the Compensation Committee begins the process of reviewing executive officer compensation for the next fiscal year. The Compensation Committee is provided with reports from its independent compensation consultant comparing our executive compensation and equity granting practices relative to the market and to our peer group. The Compensation Committee reviews recommendations from management on the current fiscal year annual and long-term incentive compensation programs. The Compensation Committee then reviews and approves changes to executive officers’ total target cash compensation, which includes base salary and target incentive compensation, and long-term equity incentive compensation. The Compensation Committee reviews all recommendations in light of our compensation philosophy and generally seeks input from its independent compensation consultant prior to making any final decisions.
Role of Chief Executive Officer
As our Chief Executive Officer, Mr. Pead makes recommendations to the Compensation Committee with respect to compensation for his direct reports (including our other named executive officers), including the terms of these executives’ annual incentive compensation and long-term equity compensation. Mr. Pead considers factors such as tenure, individual performance, responsibilities, and experience levels of the executives, as well as the compensation of the executives relative to one another, when making recommendations regarding appropriate total compensation of our executives.
Mr. Pead typically discusses his initial recommendations with the Chairman of the Compensation Committee or has management present them at Compensation Committee meetings. The Total Rewards group within our Human Capital
-14-
Department and individuals within our Finance and Legal Departments support the Compensation Committee in the performance of its responsibilities. During 2015, our Chief Financial Officer, Chief Legal Officer, and Chief Talent Officer and other representatives of the Human Capital and Finance departments regularly attended the Compensation Committee meetings to provide perspectives on the competitive landscape, the needs of the business, information about our financial performance and relevant legal and regulatory developments. The Compensation Committee meets in executive session without management to deliberate on executive compensation matters. The Compensation Committee considers, but does not always accept, Mr. Pead’s recommendations regarding executive compensation. None of our executive officers participate in the Compensation Committee’s deliberations or decisions with regard to their own compensation.
Role of Compensation Consultant
Our Compensation Committee retained Towers Watson to advise it on matters related to executive compensation in fiscal 2015 until October 2015. In October 2015, our Compensation Committee retained Pay Governance to advise it on matters related to executive compensation for the remainder of fiscal 2015 and for fiscal 2016. Towers Watson did not provide advice to the Compensation Committee after the retention of Pay Governance.
Other than providing limited guidance regarding our broad-based equity plan design for all employees, neither Towers Watson nor Pay Governance provided any services for management in fiscal 2015. Towers Watson and Pay Governance consulted with our management when requested by the Compensation Committee and only as necessary to obtain relevant compensation and performance data for the executives as well as essential business information so that it could effectively support the Compensation Committee with appropriate competitive market information and relevant analyses.
During 2015, Towers Watson and Pay Governance provided a range of services to the Compensation Committee to support the Compensation Committee’s agenda and obligations, including providing regulatory updates, peer group compensation data so that the Compensation Committee could set compensation for executives in accordance with our policies, advice on the structure and competitiveness of our compensation programs, and advice on the consistency of our programs with our executive compensation philosophy.
Representatives of Towers Watson and Pay Governance attended Compensation Committee meetings and provided advice to the Compensation Committee upon its request. The Compensation Committee assessed the independence of Towers Watson and Pay Governance and determined that Towers Watson was, and Pay Governance is, independent of our company and has no relationships that could create a conflict of interest with us. As part of its assessment, the Compensation Committee considered the fact that neither Towers Watson nor Pay Governance provide any other services to us and consults with our management only as necessary to provide the services described above.
-15-
Peer Group
To assist the Compensation Committee in making decisions on total compensation for executives and company-wide equity grants, the Compensation Committee utilizes peer and industry group data and analyses. Each year, the Compensation Committee reviews with its external compensation consultant the list of peer companies as points of comparison, as necessary, to ensure that comparisons are meaningful. For fiscal 2015, Towers Watson provided recommendations on the composition of our peer group. Based on the facts described in the table below and management’s input, for fiscal 2015, Towers Watson recommended, and the Compensation Committee approved, the following peer group:
General Description | Criteria Considered | Peer Group List |
Software and high technology companies which operate in similar or related businesses and with which Progress competes for talent | Revenues and market capitalization within 0.3x to 3.0x of Progress | ANSYS Inc. Advent Software, Inc. Avid Technology, Inc. Bottomline Technologies, Inc. CommVault Systems, Inc. Concur Technologies, Inc. Epiq Systems, Inc. Informatica Corporation Manhattan Associates, Inc. MicroStrategy, Inc NetScout Systems, Inc. Pegasystems, Inc. Qlik Technologies, Inc. Riverbed Technology Inc. Rovi Corporation ServiceNow, Inc. Splunk, Inc, SolarWinds, Inc. The Ultimate Software Group, Inc. |
Towers Watson then prepared a compensation analysis compiled from both an executive compensation survey and data gathered from publicly available information for our peer group companies. The executive compensation analysis prepared by Towers Watson also included survey data from the Towers Watson Top Management Executive Compensation Report and the Radford High Technology Executive Compensation Survey that contained between 65-135 companies (depending upon position) with revenues between $200 million and $500 million. The Compensation Committee used this data to compare the current compensation of our named executive officers to the peer group and to determine the relative market value for position, based on direct, quantitative comparisons of pay levels. The survey data was used when there was a lack of public peer data for an executive’s position and to obtain a general market understanding of current compensation practices.
Competitive Positioning
The fiscal 2015 target total direct compensation for our named executive officers was set by the Compensation Committee based predominantly on competitive pay practices, as reflected in the peer group and survey data. The Compensation Committee reviews market data at the 25th, 50th, and 75th percentile and for fiscal 2015, generally targeted aggregate total direct compensation for the named executive officers as a group at the 50th percentile of our peer group in setting our executive compensation programs. Additional adjustments were considered based on an individual importance to our company, tenure, company and individual performance, anticipated future contributions, internal pay equity, and historical pay levels, as well as the level of an executive officer’s unvested equity awards and incentives.
-16-
Components of Executive Officer Compensation
Compensation for our named executive officers currently consists of three primary components that are designed to reward performance in a simple and straightforward manner-base salaries, annual cash bonuses, and long-term equity awards. The purpose and key characteristics of each of these components and how each element accomplishes the goals and objectives of our program are summarized below.
Compensation Element | Objective | Key Features | 2015 Performance Metrics |
Cash Compensation | To attract, motivate and reward executives whose knowledge, skills, and performance are critical to our success | ||
Base Salary | To secure and retain services of key executive talent by providing a fixed level of cash compensation for performing essential elements of position | Adjustments may be made to reflect market conditions for a position, changes in the status or duties associated with a position, individual performance or internal equity | Not applicable |
Annual Cash Bonus | To encourage and reward annual corporate performance that enhances short and long-term stockholder value | Cash bonuses are based on percentage of base salary, with actual awards based exclusively on attainment of objective corporate and/or business unit goals Business unit goals align the leadership of the business unit to the revenue and operating margin goals of the specific business unit | Total non-GAAP revenue and non-GAAP operating income For fiscal 2016, added free cash flow metric For 2016, all named executive officers subject to Corporate Bonus Plan |
Equity Compensation | To align executives’ interests with those of stockholders | ||
Performance Share Units (PSUs) | To encourage and reward annual corporate performance that enhances long-term stockholder value | Subject to one-year performance criteria aligned with annual business plan, with three-year vesting period | Total non-GAAP earnings per share |
Long-Term Incentive Plan (LTIP) | To align interests of management with those of our stockholders with the goal of creating long-term growth and value | Equity grant value equal to two times base salary Three-year performance period | Relative TSR in comparison to NASDAQ Software Index No payout occurs unless TSR above 50th percentile 70th percentile performance required for target payout |
Restricted Stock Units (RSUs) | To retain executive talent | Service-based vesting over three-year period | Not applicable |
Other Compensation | To provide benefits that promote employee health and welfare, which assists in attracting and retaining our executive officers | Indirect compensation element consisting of programs such as medical, dental, and vision insurance, a 401(k) plan with up to a 3% matching contribution, an employee stock purchase plan program, and other plans and programs made available to eligible employees | |
-17-
Severance and Change in Control Benefits | To serve our retention and motivational objectives helping our named executive officers maintain continued focus, dedication to their responsibilities and objectivity to maximize stockholder value, including in the event of a transaction that could result in a change in control of our company; particularly important in a time of increased consolidation in our industry and increased competition for executive talent. | Provides protection in the event of an involuntary termination of employment under specified circumstances, including following a change in control of our company as described below under “Potential Payments Upon Termination or Change in Control” and “Executive Compensation-Severance and Change in Control Agreements.” | |
2015 Executive Compensation Decisions | ||||
2015 Program Design
Consistent with its pay-for-performance philosophy, the Compensation Committee, in designing our executive compensation programs for fiscal 2015, emphasized alignment with our aggressive short- and long-term business goals. Among the highlights of our executive compensation design for fiscal 2015:
• | Base salaries for our named executive officers targeted at market competitive levels. |
• | Annual bonus plans in which the payout of bonuses was tied exclusively to financial performance and payout would not occur if we failed to achieve total revenue and operating income of at least 95% of our annual operating plan and budget. |
• | Business Unit Bonus Plans applicable to the Business Unit Presidents in which we tied payout of bonuses to achievement of both corporate measures and specific business unit metrics to ensure alignment with our new organizational structure. |
• | Payouts under the Corporate and Business Unit Bonus Plans capped at 150% of target amounts. |
• | Equity plans in which a greater proportion of executives’ compensation was tied to long-term performance. |
• | Reduced annual performance equity awards that utilized a different one-year performance metric than the annual cash bonus plan. |
• | 70% of our named executive officers’ target total direct compensation was performance-based. |
• | 80% of Mr. Pead’s and our other named executive officers’ long term equity incentive compensation was delivered in the form of performance-based awards. |
Pay Mix
In setting the mix among the different elements of executive compensation, we do not target specific allocations, but generally weight target compensation more heavily toward performance-based compensation, both cash and equity. The percentage of performance-based compensation for our executive officers and other employees increases with job responsibility, reflecting our view of internal pay equity and the ability of a given employee to contribute to our results. We also generally align our compensation mix with the practices of our peer group when possible and to the extent consistent with our compensation strategy and business plan.
-18-
As shown in the tables below, the total direct compensation mix for Mr. Pead and our other named executive officers in fiscal 2015 was consistent with our peer group.
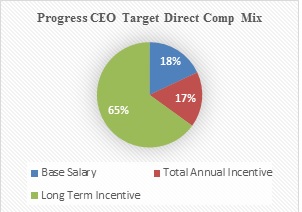
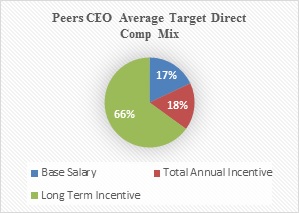
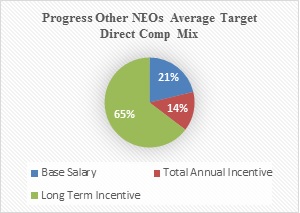
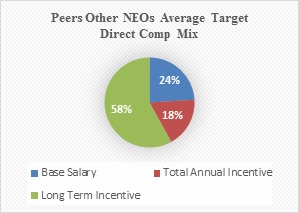
However, in designing our equity compensation program for fiscal 2015, the Compensation Committee placed significantly greater emphasis on performance-based equity than our peer companies.

-19-

These allocations reflect our belief that a significant portion of our named executive officers’ compensation should be performance-based and therefore “at risk” based on company performance, as well as subject to service requirements. Since our cash incentive opportunities and equity incentive awards have both upside opportunities and downside risks and our actual performance can deviate from the target goals, the amount of compensation actually earned will differ from the target allocations.
Individual Considerations
Below is a summary of the fiscal 2015 compensation decisions and changes for each individual named executive officer.
Philip Pead, President and Chief Executive Officer
Fiscal 2014 Pay ($) | Fiscal 2015 Pay ($) | Change | ||||
Target Cash Compensation | 1,300,000 | 1,300,000 | (4) | — | ||
Base Salary | 650,000 | 650,000 | — | |||
Target Bonus | 650,000 | (1) | 650,000 | (1) | — | |
Target Equity Compensation | 4,800,000 | 2,500,000 | down 48% | |||
Target Annual Equity | 3,500,000 | (2) | 1,200,000 | (5) | down 66% | |
Target Long-Term Equity | 1,300,000 | (3) | 1,300,000 | (3) | — | |
Total Target Compensation | 6,100,000 | 3,800,000 | down 38% | |||
_____________
(1) | Represents cash payable upon achievement of target performance under our Corporate Bonus Plan. Based on company performance, Mr. Pead earned no bonus in either fiscal 2014 or fiscal 2015. |
(2) | 50% of Mr. Pead’s fiscal 2014 annual equity award was in the form of PSUs and 50% in the form of time-based RSUs. Mr. Pead did not earn any of the annual PSUs based on company performance in fiscal 2014. |
(3) | Represents PSUs issued to our executive officers under our Long Term Incentive Plan with a grant date value of two-times base salary and subject to three-year relative total shareholder return performance measures. |
(4) | We evaluated Mr. Pead’s fiscal 2015 total target compensation against our compensation peer group, as to individual elements and as to total compensation to determine whether any changes should be made to his fiscal 2015 total target compensation. We determined that his target cash compensation was in line with the market data. |
(5) | At Mr. Pead’s recommendation, we reduced Mr. Pead’s fiscal 2015 target annual equity award by two-thirds in light of company performance in fiscal 2014, including in comparison to our peer companies. 60% of Mr. Pead’s fiscal 2015 annual equity award was in the form PSUs and 40% in the form of time-based RSUs. Mr. Pead earned 84% of the annual PSUs based on company performance in fiscal 2015. |
-20-
Chris Perkins, Chief Financial Officer
Fiscal 2014 Pay ($) | Fiscal 2015 Pay ($) | Change | ||||
Target Cash Compensation | 675,000 | 675,000 | (4) | — | ||
Base Salary | 375,000 | 375,000 | — | |||
Target Bonus | 300,000 | (1) | 300,000 | (1) | — | |
Target Equity Compensation | 1,450,000 | 1,250,000 | down 10% | |||
Target Annual Equity | 700,000 | (2) | 500,000 | (5) | down 21% | |
Target Long-Term Equity | 750,000 | (3) | 750,000 | (3) | — | |
Total Target Compensation | 2,125,000 | 1,925,000 | down 7% | |||
_____________
(1) | Represents cash payable upon achievement of target performance under our Corporate Bonus Plan. Based on company performance, Mr. Perkins earned no bonus in either fiscal 2014 or fiscal 2015. |
(2) | 50% of Mr. Perkins’ fiscal 2014 annual equity award was in the form of PSUs and 50% in the form of time-based RSUs. Mr. Perkins did not earn any of the annual PSUs based on company performance in fiscal 2014. |
(3) | Represents PSUs issued to our executive officers under our Long Term Incentive Plan with a grant-date value of two-times base salary and subject to three-year relative total shareholder return performance measures. |
(4) | We evaluated Mr. Perkins’ fiscal 2015 total target compensation against our compensation peer group, as to individual elements and as to total compensation to determine whether any changes should be made to his fiscal 2015 total target compensation. We determined that his target cash compensation was in line with the market data. |
(5) | We reduced Mr. Perkins’ target annual equity award in fiscal 2015 based on internal pay equity considerations. 60% of Mr. Perkins’ fiscal 2015 annual equity award was in the form PSUs and 40% in the form of time-based RSUs. Mr. Perkins earned 84% of the annual PSUs based on company performance in fiscal 2015. |
Jerry Rulli, Chief Operating Officer
Fiscal 2014 Pay ($)(1) | Fiscal 2015 Pay ($) | Change | |||||
Target Cash Compensation | 650,000 | 740,000 | 14% | ||||
Base Salary | 350,000 | 400,000 | (4) | 14% | |||
Target Bonus | 300,000 | (2) | 340,000 | (5) | 13% | ||
Target Equity Compensation | 500,000 | 1,200,000 | 240% | ||||
Target Annual Equity | 500,000 | (3) | 500,000 | (6) | — | ||
Target Long-Term Equity | — | 700,000 | (7) | N/A | |||
Total Target Compensation | 1,150,000 | 1,940,000 | 69% | ||||
_____________
(1) | Mr. Rulli joined our company in August 2014. His initial compensation was determined pursuant to an employment letter we entered into with Mr. Rulli. |
(2) | Represents cash payable upon achievement of target performance under our Corporate Bonus Plan. Based on company performance, Mr. Rulli earned no bonus in fiscal 2014. |
(3) | Mr. Rulli received a new hire equity award consisting of RSUs with a value of $500,000, which were issued in September 2014, and PSUs with a value of $500,000, which were issued in January 2015 and based on company performance in fiscal 2015. The PSU portion of Mr. Rulli’s new hire equity award is shown in the Fiscal 2015 Pay column. |
(4) | In July 2015, Mr. Rulli was promoted to Chief Operating Officer. In connection with this promotion, we evaluated Mr. Rulli’s fiscal 2015 total target compensation against our compensation peer group, as to individual elements and as to total compensation to determine whether any changes should be made to his fiscal 2015 total target compensation. Based on this comparison and the increased responsibilities Mr. Rulli assumed as Chief Operating Officer, the Compensation Committee increased Mr. Rulli’s base salary to $400,000, which was below the 50th percentile of the market data among chief operating officers at our peer companies to reflect differences in responsibilities. In January 2016, the Compensation Committee increased Mr. Rulli’s base salary to $450,000. The Compensation Committee approved this increase in light of Mr. Rulli’s increased responsibilities following the reorganization of our operations in October 2015. |
(5) | For fiscal 2015, as President of the OpenEdge Business Unit, Mr. Rulli was subject to the OpenEdge Business Unit Bonus Plan. In July 2015, in connection with his promotion to Chief Operating Officer, Mr. Rulli’s target bonus was increased to $340,000. Based on the performance under the OpenEdge Business Unit Bonus Plan, Mr. Rulli earned 38% of his fiscal 2015 target bonus. In January 2016, Mr. Rulli’s target bonus was increased to $382,500. |
(6) | Represents the PSU portion of Mr. Rulli’s new hire award. Mr. Rulli earned 84% of the annual PSUs based on company performance in fiscal 2015. Mr. Rulli did not receive an award of time-based RSUs in fiscal 2015 because he received time-based RSUs in September 2014 as part of his new hire award. |
(7) | Represents PSUs issued to our executive officers under our Long Term Incentive Plan with a grant date value of two-times base salary and subject to three-year relative total shareholder return performance measures. Mr. Rulli did not receive a PSU award under our Long Term Incentive Plan in fiscal 2014 because he did not join our company until September 2014. |
-21-
Matthew Robinson, Chief Technology Officer
Fiscal 2014 Pay ($)(1) | Fiscal 2015 Pay ($)(4) | Change | ||||
Target Cash Compensation | 341,600 | 487,500 | 43% | |||
Base Salary | 244,000 | 325,000 | 33% | |||
Target Bonus | 97,600 | (2) | 162,500 | (5) | 66% | |
Target Equity Compensation | 140,000 | 1,100,000 | 786% | |||
Target Annual Equity | 140,000 | (3) | 450,000 | (6) | 320% | |
Target Long-Term Equity | — | 650,000 | (7) | N/A | ||
Total Target Compensation | 481,600 | 1,587,500 | 330% | |||
_____________
(1) | Mr. Robinson was not an executive officer in fiscal 2014. In fiscal 2014, Mr. Robinson was Vice President, Technology within the AD&D Business Unit. |
(2) | Represents cash payable upon achievement of target performance under our Corporate Bonus Plan. |
(3) | 50% of Mr. Robinson’s fiscal 2014 annual equity award was in the form of PSUs and 50% in the form of time-based RSUs. Mr. Robinson did not earn any of the annual PSUs based on company performance in fiscal 2014. |
(4) | In May 2015, Mr. Robinson was promoted to Chief Technology Officer and became an executive officer. In connection with his promotion, we evaluated Mr. Robinson’s fiscal 2015 total target compensation against our compensation peer group, as to individual elements and as to total compensation to determine whether any changes should be made to his fiscal 2015 total target compensation. The changes to the individual elements of Mr. Robinson’s fiscal 2015 compensation shown in this column reflect this comparison as well as the increased responsibilities Mr. Robinson assumed as Chief Technology Officer and internal pay equity considerations. |
(5) | For fiscal 2015, Mr. Robinson was subject to the AD&D Business Unit Bonus Plan until his promotion to Chief Technology Officer, at which time he became subject to the Corporate Bonus Plan. Mr. Robinson earned 13% of his target bonus based on business unit performance under the AD&D Business Unit Bonus Plan. Mr. Robinson did not receive any portion of his annual bonus under the Corporate Business Plan. Mr. Robinson was awarded a discretionary cash bonus of $84,890 for fiscal 2015. |
(6) | Mr. Robinson received an annual equity award in January 2015 prior to his promotion to Chief Technology consisting of 50% PSUs and 50% time-based RSUs. The PSUs awarded in January 2015 were subject to the same performance measures as our Corporate Bonus Plan. In connection with his promotion to Chief Technology Officer, Mr. Robinson received an additional annual equity award consisting of 60% PSUs and 40% time-based RSUs. These PSUs were subject to the same earnings per share performance measures as applicable to other named executive officers. Mr. Robinson earned 70% of the annual PSUs based on company performance in fiscal 2015. |
(7) | Represents PSUs issued to our executive officers under our Long Term Incentive Plan with a grant date value of two-times base salary and subject to three-year relative total shareholder return performance measures. Mr. Robinson was not eligible to receive an award of PSUs under the Long Term Incentive Plan in fiscal 2014 because he was not an executive officer at that time. |
Michael Benedict, Chief Product Officer
Fiscal 2014 Pay ($) | Fiscal 2015 Pay ($)(4) | Change | ||||
Target Cash Compensation | 400,000 | 410,000 | up 3% | |||
Base Salary | 260,000 | 270,000 | (5) | up 4% | ||
Target Bonus | 140,000 | (1) | 140,000 | (6) | — | |
Target Equity Compensation | 840,000 | 890,000 | up 6% | |||
Target Annual Equity | 320,000 | (2) | 350,000 | (7) | up 17% | |
Target Long-Term Equity | 520,000 | (3) | 540,000 | (3) | — | |
Total Target Compensation | 1,240,000 | 1,300,000 | up 5% | |||
_____________
(1) | Represents cash payable upon achievement of target performance under our Corporate Bonus Plan. Based on company performance, Mr. Benedict earned no bonus in fiscal 2014. |
(2) | 50% of Mr. Benedict’s fiscal 2014 annual equity award was in the form of PSUs and 50% in the form of time-based RSUs. Mr. Benedict did not earn any of the annual PSUs based on company performance in fiscal 2014. |
(3) | Represents PSUs issued to our executive officers under our Long Term Incentive Plan with a value of two-times base salary and subject to three-year relative total shareholder return performance measures. |
(4) | In September 2014, Mr. Benedict became President, DCI Business Unit. We evaluated Mr. Benedict’s fiscal 2015 total target compensation against our compensation peer group, as to individual elements and as to total compensation to determine whether any changes should be made to his fiscal 2015 total target compensation. The changes to the individual elements of Mr. Benedict’s fiscal 2015 compensation shown in this column reflect this comparison as well as the increased responsibilities Mr. Benedict assumed as Business Unit President and internal pay equity considerations. |
(5) | In January 2015, the Compensation Committee increased Mr. Benedict’s base salary from $260,000 to $270,000 to reflect market competitive levels. In January 2016, the Compensation Committee increased Mr. Benedict’s base salary to $310,000. The |
-22-
Compensation Committee approved this increase in light of Mr. Benedict’s increased responsibilities as a result of his promotion to Chief Product Officer in October 2015.
(6) | For fiscal 2015, as President of the DCI Business Unit, Mr. Benedict was subject to the DCI Business Unit Bonus Plan. Based on business unit performance under the DCI Business Unit Bonus Plan, Mr. Benedict earned 79% of his fiscal 2015 target bonus. In January 2016, Mr. Benedict’s target bonus was increased to $155,000. |
(7) | 60% of Mr. Benedict’s fiscal 2015 annual equity award was in the form PSUs and 40% in the form of time-based RSUs. Mr. Benedict earned 84% of the annual PSUs based on company performance in fiscal 2015. |
Karen Tegan Padir, Former President, AD&D Business Unit
Fiscal 2014 Pay ($) | Fiscal 2015 Pay ($)(4) | Change | ||||
Target Cash Compensation | 495,000 | 495,000 | — | |||
Base Salary | 330,000 | 330,000 | — | |||
Target Bonus | 165,000 | (1) | 165,000 | (5) | — | |
Target Equity Compensation | 900,000 | 1,100,000 | up 22% | |||
Target Annual Equity | 240,000 | (2) | 450,000 | (6) | up 88% | |
Target Long-Term Equity | 660,000 | (3) | 660,000 | (3) | — | |
Total Target Compensation | 1,395,000 | 1,605,000 | up 16% | |||
_____________
(1) | Represents cash payable upon achievement of target performance under our Corporate Bonus Plan. Based on company performance, Ms. Padir earned no bonus in fiscal 2014. |
(2) | 50% of Ms. Padir’s fiscal 2014 annual equity award was in the form of PSUs and 50% in the form of time-based RSUs. Ms. Padir did not earn any of the annual PSUs based on company performance in fiscal 2014. |
(3) | Represents PSUs issued to our executive officers under our Long Term Incentive Plan with a grant date value of two-times base salary and subject to three-year relative total shareholder return performance measures. In October 2015, Ms. Padir’s employment terminated and, as a result, all of the PSUs issued under the Long Term Incentive Plan to Ms. Padir were canceled. |
(4) | In September 2014, Ms. Padir became President, AD&D Business Unit. We evaluated Ms. Padir’s fiscal 2015 total target compensation against our compensation peer group, as to individual elements and as to total compensation to determine whether any changes should be made to her fiscal 2015 total target compensation. We determined that her target cash compensation was in line with the market data. However, we increased her target equity compensation to reflect the market data comparison as well as the increased responsibilities Ms. Padir assumed as Business Unit President and internal pay equity considerations. |
(5) | For fiscal 2015, as President of the AD&D Business Unit, Ms. Padir was subject to the AD&D Business Unit Bonus Plan. Based on business unit performance under the AD&D Business Unit Bonus Plan, Ms. Padir earned 29% of her fiscal 2015 target bonus. |
(6) | 60% of Ms. Padir’s fiscal 2015 annual equity award was in the form PSUs and 40% in the form of time-based RSUs. Ms. Padir’s employment terminated in October 2015 and, as a result, she did not earn any PSUs based on company performance in fiscal 2015. |
Cash Incentive Compensation
Annual Cash Bonus
It is our philosophy to base a significant portion of each executive officer’s total compensation opportunity on performance incentives. Our annual bonus plans are intended to motivate eligible participants toward overall business results, to tie their goals and interests to those of the company and its stockholders, and to enable the company to attract and retain highly qualified executives. These bonus plans are administered by our Compensation Committee.
The Compensation Committee sets the target annual cash incentive opportunity for fiscal 2015 (expressed as a percentage of base salary earned during the year) for each named executive officer in January 2015. In setting the target levels, the Compensation Committee considered each named executive officer’s fiscal 2015 target total cash opportunity against the peer group data provided by our independent compensation consultant, internal pay equity and the roles and responsibilities of the named executive officers. The Compensation Committee set the fiscal 2015 cash bonus targets for each of the named executive officers at the same percentage as their target opportunities in fiscal 2014 except with respect to Mr. Robinson, whose fiscal 2015 cash bonus target was increased to 50% of his base salary in connection with his promotion to Chief Technology Officer. The Compensation Committee believes that the target annual cash bonus opportunity should make up a larger portion of an executive officer’s total target cash compensation as the executive’s level of responsibility increases.
2015 Plan Design
In January 2015, the Compensation Committee approved the 2015 Corporate Bonus Plan and the Business Unit Bonus Plans. In fiscal 2015, Mr. Pead, Mr. Perkins and, following his appointment as Chief Technology Officer, Mr. Robinson, participated in our Corporate Bonus Plan. For fiscal 2015, personnel within our general and administrative
-23-
functions (finance, legal, human capital and information technology) and corporate marketing participated in the Corporate Bonus Plan.
In fiscal 2015, Mr. Rulli, Mr. Benedict and Ms. Padir participated in Business Unit Bonus Plans, which tied participants’ annual cash bonus to both business unit and corporate objectives. For fiscal 2015, personnel within our product management, product marketing, and development functions participated in the applicable Business Unit Bonus Plan. By tying a significant portion of participants’ cash bonus to business unit objectives, this supported our goals in implementing our new organizational structure and ensured that personnel within each business unit were properly incentivized to drive performance within his/her business unit.
Consistent with prior years, the Compensation Committee adopted two plan metrics for the bonus plans, both of which would be utilized to determine funding and payout under the cash bonus plans. These two plan metrics were total non-GAAP corporate revenue and total adjusted non-GAAP operating income, with total non-GAAP corporate revenue being weighted 60% and total non-GAAP operating income weighted 40%. Each metric was measured separately and not impacted by performance with respect to the other metric. The performance measures selected for our cash bonus plans were designed to support our goals of expanding our non-GAAP operating income and achieving meaningful growth in total revenue, both of which would result in increased stockholder value.
For participants’ subject to a Business Unit Bonus Plan, such as Mr. Rulli, Mr. Benedict, and Ms. Padir, 50% of his or her bonus was tied to the corporate objectives of the Corporate Bonus Plan, and 50% was tied to non-GAAP revenue and operating margin metrics relating exclusively to the applicable business unit, with business unit non-GAAP revenue being weighted 60% and business unit operating margin weighted 40%.
Non-GAAP revenue differs from revenue determined under GAAP by including acquisition-related revenue, which constitutes revenue reflected as pre-acquisition deferred revenue by Telerik that would otherwise have been recognized but for the purchase accounting treatment of the acquisition of Telerik. Since GAAP accounting requires the elimination of this revenue, GAAP results alone do not fully capture all of our economic activities. Non-GAAP operating income differs from operating income determined under GAAP by excluding amortization of acquired intangibles, stock-based compensation, restructuring and transition expense and acquisition-related expenses. We use non-GAAP measures to make operational and investment decisions because we believe the costs and expenses that we exclude from GAAP operating income are not tied to our core results. For these reasons, we use non-GAAP operating income as a performance goal.
For 2015, the Compensation Committee determined that, for purposes of earning any award under the Corporate and Business Unit Bonus Plans, it was necessary to achieve threshold total non-GAAP revenue and total non-GAAP operating income goals in excess of 95% of the corresponding goals in our 2015 operating plan and budget at both the corporate and business unit level. If the threshold goals were not achieved, none of the participants in the Corporate and Business Unit Bonus Plans would be eligible to earn any annual cash award. The steep entry point under the Corporate and Business Unit Bonus Plans were designed to ensure that no bonus would be earned if we did not exceed the total revenue and total non-GAAP operating income results achieved in 2014. Similarly, the slope of the targets was set such that our named executive officers could earn significantly higher than target bonuses for performance that exceeded our 2015 operating plan and budget although the maximum payout was capped at 150% of the target.
The targets established with respect to the total revenue goal reflected the challenge we faced in growing our core revenues while implementing a new strategy. The targets established with respect to the non-GAAP operating income metric were consistent with maintaining the strong operating margins we established in fiscal 2013.
Corporate Bonus Plan Criteria and Achievement
As shown in the table below, no portion of the annual bonus under the Corporate Bonus Plan would be earned by the named executive officers unless the threshold of $421 million in total non-GAAP revenue and $133 million in total non-GAAP operating income were achieved, at which point 50% of the bonus would be earned. Thereafter, up to the remaining 50% of the bonus could be earned based on the extent to which revenue between the threshold of $421 million and the target of $437 million and operating income between the threshold of $133 million and the target of $140 million were achieved. Additional amounts could be earned to the extent of overachievement, subject to the cap of 150% of target.
In September 2015, we lowered our revenue expectations for fiscal 2015 from our original fiscal 2015 budget and operating plan. As a result, our revised revenue outlook was below the threshold level of achievement under our fiscal 2015 Corporate Bonus Plan, meaning that participants would not earn any portion of their target bonus under the plan if we met our revised revenue outlook. In September 2015, at management’s recommendation, the Compensation Committee modified the Corporate Bonus Plan to lower the threshold level of performance to 40% (from 50%) to reflect the revised revenue outlook for fiscal 2015. This decision was made to lessen the adverse retention impact of our performance under the corporate business plan with respect to employees below the executive officer level. Accordingly, the Compensation Committee determined that this reduction in the threshold level of performance would not apply to Mr. Pead, Mr. Perkins or
-24-
any of our other executive officers whose bonus was tied exclusively to the Corporate Bonus Plan.
2015 Annual Bonus Plan Criteria and Achievement (applicable to Named Executive Officers)
Metric | Threshold (50%) | Target (100%) | Maximum (150%) | Actual Achievement | Funding Percentage |
Non-GAAP Corp. Revenue (1) | $421 million | $437 million | $453 million | $420 million | 0% |
Non-GAAP Operating Income (1) | $133 million | $140 million | $150 million | $132 million | 0% |
_____________
(1) Targets and actual achievement figures shown in the table above are based on budgeted exchange rates. For purposes of computing Non-GAAP Operating Income, bonus expense is added back to the Threshold, Target, Maximum, and Actual achievement amounts.
As shown in the table above, because we did not achieve at least threshold performance under either metric, no bonuses were earned or paid under the 2015 Corporate Bonus Plan to Mr. Pead, Mr. Perkins or any of our other executive offices subject to the Corporate Bonus Plan. Mr. Pead and Mr. Perkins also did not receive any portion of their target bonuses in fiscal 2014.
Business Unit Bonus Plan Criteria and Achievement
The tables below show the targets, slopes and achievement under the three Business Unit Bonus Plans and achievement with respect to the corporate objectives. The Compensation Committee did not reduce the threshold level of performance under the Business Unit Bonus Plans although it did apply the reduction for purposes of determining the funding percentage applicable to the corporate objectives under each Business Unit Bonus Plan.
Corporate Measures (applicable to Business Unit Plan Participants)
Metric | Threshold (40%) | Target (100%) | Maximum (150%) | Actual Achievement | Funding Percentage |
Non-GAAP Corp. Revenue (1) | $417 million | $437 million | $453 million | $420 million | 47% |
Non-GAAP Operating Income (1) | $130 million | $140 million | $150 million | $132 million | 49% |
Corporate Measures Achievement Percentage | 48% | ||||
_____________
(1) Targets and actual achievement figures shown in the table above are based on budgeted exchange rates. For purposes of computing Non-GAAP Operating Income, bonus expense is added back to the Threshold, Target, Maximum, and Actual achievement amounts.
2015 OpenEdge Business Unit Criteria and Achievement
Metric | Weight Factor | Threshold (50%) | Target (100%) | Maximum (150%) | Actual Achievement | Funding Percentage |
Non-GAAP Revenue (1) | 30% | $304 million | $314 million | $324 million | $303 million | 0% |
Operating Margin (1) | 20% | $224 million | $230 million | $243 million | $225 million | 58% |
Corporate Measures | 50% | 48% | ||||
OpenEdge Business Unit Achievement Percentage | 38% | |||||
_____________
(1) Targets and actual achievement figures shown in the table above are based on budgeted exchange rates.
-25-
2015 DCI Business Unit Criteria and Achievement
Metric | Weight Factor | Threshold (50%) | Target (100%) | Maximum (150%) | Actual Achievement | Funding Percentage |
Revenue (1) | 30% | $36 million | $38 million | $43 million | $38 million | 108% |
Operating Margin (1) | 20% | $23 million | $24 million | $28 million | $24 million | 115% |
Corporate Measures | 50% | 48% | ||||
DCI Business Unit Achievement Percentage | 79% | |||||
_____________
(1) Targets and actual achievement figures shown in the table above are based on budgeted exchange rates.
2015 AD&D Business Unit Criteria and Achievement
Metric | Weight Factor | Threshold (50%) | Target (100%) | Maximum (150%) | Actual Achievement | Funding Percentage |
Revenue (1) | 30% | $82 million | $86 million | $95 million | $79 million | 0% |
Operating Margin (1) | 20% | $44 million | $46 million | $52 million | $40 million | 0% |
Corporate Measures | 50% | 48% | ||||
AD&D Business Unit Achievement Percentage | 29% | |||||
_____________
(1) Targets and actual achievement figures shown in the table above are based on budgeted exchange rates.
Amounts Earned under the 2015 Corporate and Business Unit Bonus Plans
As shown in the 2015 Annual Bonus Plan Criteria and Achievement table on page 26, because we did not achieve at least threshold performance under either metric, no bonuses were earned or paid under the 2015 Corporate Bonus Plan to Mr. Pead and Mr. Perkins. The following table shows the bonuses earned by our named executive officers under the Corporate and Business Unit Bonus Plans in fiscal 2015.
Executive Officer | Target Annual Bonus ($) | Bonus Plan | Percentage of Target Actually Earned | Amount Earned ($) |
Philip Pead | 650,000 | Corporate | 0% | — |
Chris Perkins | 300,000 | Corporate | 0% | — |
Jerry Rulli (1) | 340,000 | OpenEdge BU | 38% | 128,860 |
Matthew Robinson (2) | 162,500 | AD&D BU/Corporate | 13% | 20,735 |
Michael Benedict | 140,000 | DCI BU | 79% | 110,600 |
Karen Tegan Padir | 165,000 | AD&D BU | 29% | 47,850 |
_____________
(1) | Mr. Rulli’s target annual bonus prior to July 2015 was $300,000. In July 2015, Mr. Rulli’s target annual bonus was increased to $340,000 in connection with his promotion to Chief Operating Officer. |
(2) | Mr. Robinson was subject to the AD&D Business Unit Bonus Plan until May 2015 when he was promoted to Chief Technology Officer. Following his promotion, Mr. Robinson was subject to the Corporate Bonus Plan and his target annual bonus was increased to $162,500. The amounts shown in the table above for Mr. Robinson reflect the portion of his bonus he earned under the AD&D Business Unit Bonus Plan. |
(3) | Ms. Padir received a portion of her target bonus pursuant to the separation agreement we entered into with Ms. Padir in connection with her employment in October 2015 based on the performance of the AD&D Business Unit Bonus Plan in fiscal 2015. |
Other Cash Incentives
In December 2015, Mr. Robinson was awarded a discretionary cash bonus of $84,890 by the Compensation Committee. This cash bonus was part of a discretionary bonus pool adopted by the Compensation Committee at Mr. Pead’s recommendation to reward key employees for individual achievement in fiscal 2015. Mr. Robinson was the only named
-26-
executive officer who received a cash bonus under this discretionary bonus pool. In recommending Mr. Robinson to receive a discretionary cash bonus, Mr. Pead considered the transition Mr. Robinson made to the Chief Technology Officer position and the role he played in further refining our strategic direction.
Equity Compensation
We use equity compensation to attract, retain, motivate and reward our named executive officers. We issue annual and new hire equity awards based on guidelines for awards commensurate with position levels and that reflect grant practices within our peer group and the broader software industry generally. The Compensation Committee reviews the mix of equity awards to our named executive officers on an annual basis.
During the past few years, the Compensation Committee has altered the mix of equity compensation to executive officers so that a greater proportion of equity compensation is awarded in the form of performance-based restricted stock units (PSUs) rather than time-based restricted stock units (RSUs).
PSUs are subject to performance criteria aligned with our business plan and are earned only to the extent the performance criteria are achieved, with any PSUs earned being subject to subsequent time-based vesting (one-third vests upon determination of achievement of the performance goals established for that year with the remaining two-thirds vesting over the next two years if the executive remains employed on each vesting date).
RSUs typically vest in six equal installments over three years beginning six months after issuance. In a volatile stock market, RSUs continue to provide value when stock options may not, which the Compensation Committee believes is useful in retaining talented executives in unpredictable economic times.
Target Value and Award Determination
The Compensation Committee’s decisions regarding the amount and type of equity incentive compensation, the allocation of equity and relative weighting of these awards within total executive compensation have been based on advice provided by our external compensation consultant and the Compensation Committee’s understanding and individual experiences with market practices of similarly-situated companies. Equity-based incentive awards are intended to be the longer-term components of our overall executive compensation program and are designed to encourage performance by our executive officers over several years.
To determine the size of the equity awards, the Compensation Committee first determined the total number of shares that would be available for the annual equity awards to all proposed recipients. The total number of shares was determined by consideration of the potential dilution to our stockholders and average burn rate of other companies in our industry. The Compensation Committee utilized the grant data from the peer group and other information provided by Towers Watson to assist it in determining the size of the overall equity pool for our company as well as the individual grants to the named executive officers.
To determine the size of the individual annual equity awards, the Compensation Committee, with the assistance of data provided by Towers Watson, compared the long-term equity incentive compensation levels of our executives with similar positions within our peer group and survey data to determine the long-term equity incentive compensation amount for each executive. The Compensation Committee evaluated the total value delivered by the annual equity grant against the average of the 50th and the 75th percentile of the value of long-term incentive compensation of our peer group and broader software industry. In finalizing the amounts of the fiscal 2015 annual equity awards, the Compensation Committee considered this market data, Mr. Pead’s recommendations, the burn rate of the executive grants, and the degree to which those amounts would be aligned with our goals of motivating and retaining key employees. With respect to Mr. Pead, the Compensation Committee considered Mr. Pead’s recommendation that his fiscal 2015 annual equity award be reduced by two-thirds in light of our company performance in fiscal 2014, including as compared to our peer companies.
Long-Term Incentive Plan
Beginning in 2014, the Compensation Committee made fundamental changes to the equity program applicable to our named executive officers. In January 2014, the Compensation Committee approved a new long-term equity incentive compensation plan consisting of the grant of PSUs, the vesting of which would be entirely based on performance over a three-year measurement period. In January 2015, the Compensation Committee approved a second award of PSUs under the LTIP.
The number of PSUs awarded was equal to two times each recipient’s base salary. The number of shares actually earned is determined by comparing our relative total stockholder return (TSR) for the relevant period to the relative TSR of the component companies of the NASDAQ Software Index.
Under the LTIP, participants can earn between 0% and 200% (the payout cap under the LTIP) of the target amount of PSUs. The cumulative three-year TSR measure compares the TSR of our common stock against the TSR of companies
-27-
included in the NASDAQ Software Index as of December 1, 2014 during the course of the three-year period. As shown in the table below, none of the PSUs will be earned unless we outperform the median of the index.
Relative Performance (TSR Percentile Rank) | % of Target PSU Earned |
Less than 50th Percentile | 0% |
60th Percentile | 50% |
70th Percentile | 100% |
80th Percentile | 150% |
90th Percentile | 200% (Maximum) |
Awards interpolated for performance within stated percentiles | |
Additionally, regardless of our relative position with respect to the NASDAQ Software Index, the award will be reduced by 50% if our absolute TSR over the measurement period is negative.
The PSUs align our named executive officers’ interests with those of our stockholders over the long term, while also providing key retention incentives, as the shares will only be awarded if a named executive officer remains with our company for the entire three-year measurement period. Moreover, the economics of the LTIP will result in strengthened retention incentives for our named executive officers during periods over which we are delivering favorable returns to our investors.
For illustrative purposes only, based on the price of our common stock for the thirty-day trading period ending November 30, 2015, the end of our fiscal 2015, our TSR compared to the NASDAQ Software Index for the same period would have placed us below the 50th percentile, meaning that none of the 2014 and 2015 PSUs awarded as the LTIP would have been earned. Because the LTIP is based on a three-year performance period, none of the 2015 PSUs will be able to be earned until the performance period closes at the end of our 2017 fiscal year.
2015 Annual Equity Program
Simultaneously with the adoption of the LTIP, the Compensation Committee also determined that our named executive officers should receive an annual equity award separate from the LTIP. Consistent with prior years, these annual awards consisted of time-based RSUs and performance-based PSUs tied to one-year performance measures consistent with our 2015 financial objectives and three-year vesting. In contrast to the LTIP, which provides incentives for delivering favorable returns to investors over a multi-year period, the Compensation Committee viewed the award of PSUs tied to 2015 financial objectives as an important component of our pay for performance philosophy during a time of transition in our strategy.
For 2015, the Compensation Committee made the following modifications to the annual equity awards issued to our named executive officers:
• | The size of the annual equity awards was reduced. |
• | At his recommendation, Mr. Pead’s annual equity award was reduced by two-thirds from his 2014 award. In fiscal 2015, Mr. Pead received an annual equity award of $1.2 million from $3.5 million, the value of his 2014 annual equity award. |
• | The proportion of equity compensation awarded in the form of PSUs was increased from 50% to 60%. |
• | The performance metric applicable to the annual PSUs was earnings per share, which is a separate metric from the metrics used for the Corporate Bonus Plan. |
2015 Annual PSU Program. In January 2015, the Compensation Committee adopted the metric that would apply to the Annual PSUs. The Compensation Committee determined to utilize earnings per share, a different metric than utilized under the Corporate Bonus Plan.
Metric | Threshold (50%) | Target (100%) | Maximum (150%) | Actual Achievement | Funding Percentage |
Non-GAAP Earnings Per Share | $1.68 | $1.77 | $1.94 | $1.74 | 84% |
A reconciliation between the Non-GAAP measures and GAAP results is located at the end of this Compensation Discussion & Analysis section. For purposes of computing Non-GAAP earnings per share, bonus expense is added back to the Threshold, Target, Maximum, and Actual achievement amounts.
-28-
PSUs Earned under the 2015 Annual PSU Program. The following table shows the portion of the 2015 Annual PSU award earned by our named executive officers. Once the number of PSUs earned is determined, one-third vest on April 1, 2016 and the remainder vest in six-month installments over two years.
Performance-Based Annual Equity Earned for Fiscal 2015
Executive Officer | Target PSU Value ($) | Target PSUs (#) (1) | PSU Value Earned at 84% ($) | PSUs Earned (#)(2) |
Philip M. Pead | 720,000 | 26,154 | 604,752 | 21,967 |
Chris E. Perkins | 300,000 | 11,633 | 251,917 | 9.768 |
Jerry Rulli (3) | 500,000 | 19,388 | 419,964 | 16,284 |
Matthew Robinson | 250,000 | 8,971 | 174,679 | 6,091 |
Michael Benedict | 210,000 | 8,143 | 176,300 | 6,836 |
Karen Tegan Padir (4) | 270,000 | 10,470 | — | — |
_____________
(1) | Target PSUs was determined by dividing Target PSU Value by our closing price on the date of issuance, which (i), in the case of Mr. Pead, was $27.53 on March 2, 2015, (ii), in the case of Mr. Perkins, Mr. Rulli, Mr. Benedict and Ms. Padir was $25.79 on January 29, 2015, and (iii), in the case of Mr. Robinson was $25.01 on January 15, 2015, with respect to 3,999 PSUs, and $30.16 on July 6, 2015, with respect to 4,972 PSUs. Mr. Pead’s PSU award was approved by the Compensation Committee on January 29, 2015 and ratified by the Board of Directors on March 2, 2015. The Compensation Committee approved fiscal 2015 compensation and equity awards applicable to executive officers on January 29, 2015. Mr. Robinson initially received a PSU award on January 15, 2015, which was the date we issued fiscal 2015 equity awards to non-executives. Mr. Robinson received an additional PSU award in July 2015 following his promotion to Chief Technology Officer in May 2015. |
(2) | Except in the case of Mr. Robinson, the number of PSUs earned for fiscal 2015 performance was determined by multiplying the Target PSUs by 84%. Mr. Robinson was promoted to Chief Technology Officer in May 2015. Mr. Robinson received a PSU award in January 2015 and an additional PSU award in July in connection with his promotion to Chief Technology Officer. The PSUs awarded in January 2015 were subject to the same performance measures as our Corporate Bonus Plan, with 48% of those PSUs being earned. The PSUs awarded in July were subject to the same earnings per share performance measures as applicable to other named executive officers, with 84% of those PSUs being earned. On a blended basis, Mr. Robinson earned 70% of the annual PSUs based on company performance in fiscal 2015. |
(3) | PSUs awarded as part of new hire equity award. |
(4) | Ms. Padir’s employment terminated in October 2015. As a result, Ms. Padir did not earn any portion of her Annual PSU award in fiscal 2015. |
2015 Annual RSU Program
Recognizing that a substantial portion of our named executive officers’ compensation is performance-based, and therefore, inherently at risk, the Compensation Committee granted time-based RSUs to our named executive officers in order to promote retention and continuity in our business during periods where our executives may not realize any value from other forms of performance-based compensation. These RSUs vest in six-month installments over three years.
Other Executive Compensation Matters | ||||
Timing of Equity Grants
We do not time grants either to take advantage of a depressed stock price or in anticipation of an increase in stock price and have limited the amount of discretion that can be exercised in connection with the timing of awards. We generally make awards only on pre-determined dates to ensure that awards cannot be timed to take advantage of material non-public information.
Equity awards may be made only by the Compensation Committee. The Compensation Committee makes awards only at Committee meetings and awards are generally not effective in trading blackout periods (the period encompassing ten days prior to the end of each fiscal quarter through 48 hours after the earnings for that quarter are announced).
Stock Ownership Guidelines
In January 2013, our Board of Directors adopted revised stock retention guidelines for non-employee directors. These guidelines provide for all non-employee directors to hold an amount of our common stock, restricted shares, stock options and/or deferred stock units having a value equal to at least three times the annual cash retainer ($50,000). Directors have five years to attain this ownership threshold. Our Corporate Governance Guidelines require that our executive officers maintain direct ownership of at least 1,000 shares of our common stock.
-29-
Compensation Recovery Policy
We have adopted a clawback policy providing that in the event of a material restatement of financial statements triggered by executive-level misconduct, we may require that the bonuses and other incentive compensation paid to that executive be forfeited. The amount of incentive compensation subject to recovery would be the amount in excess of what the executive officer would have earned in accordance with the restatement, as determined by the Compensation Committee.
Hedging and Pledging Policy
Our policies explicitly prohibit our directors and executive officers from “hedging” their ownership by engaging in short sales or trading in any derivatives involving our securities. Our policies also prohibit our directors and executive officers from “pledging” their ownership by holding our stock in a margin account or pledging our stock as collateral for a loan.
Tax and Accounting Considerations and Compensation Recovery Policies
Deductibility of Executive Compensation. Section 162(m) of the Internal Revenue Code places a limit of $1 million on the amount of compensation that public companies may deduct in any one year with respect to certain of their named executive officers. Certain performance-based compensation approved by stockholders is not subject to this deduction limit. The Compensation Committee’s strategy in this regard is to be cost and tax effective. Therefore, the Compensation Committee intends to preserve corporate tax deductions, while maintaining the flexibility in the future to approve arrangements that it deems to be in our best interests and the best interests of our stockholders and so we may pay compensation to our executive officers that is not deductible.
Section 409A of the Internal Revenue Code. Section 409A of the Internal Revenue Code imposes additional significant taxes in the event that an executive officer, director or service provider receives “deferred compensation” that does not satisfy the requirements of Section 409A. Our severance and change in control agreements described below, including the Employee Retention and Motivation Agreements we entered into with our named executive officers, contain provisions that are intended to either avoid the application of Section 409A or, to the extent doing so is not possible, comply with the applicable Section 409A requirements. The Compensation Committee has the sole discretion to change the severance guidelines applicable to executive officers to the extent necessary to avoid the application of Section 409A or comply with applicable Section 409A requirements.
Accounting for Stock-Based Compensation. Stock-based compensation expense reflects the fair value of stock- based awards measured at the grant date and recognized over the relevant service period. We estimate the fair value of each stock-based award on the measurement date using either the current market price of the stock, the Black-Scholes option valuation model, or the Monte Carlo Simulation valuation model.
Compensation Committee Report | ||||
This report is submitted by the Compensation Committee of our Board of Directors. The Compensation Committee has reviewed the Compensation Discussion and Analysis included in this Form 10-K/A and discussed it with management. Based on that review and discussions, the Compensation Committee has recommended to our Board of Directors that the Compensation Discussion and Analysis be included in this Form 10-K/A and.
No portion of this Compensation Committee Report shall be deemed to be incorporated by reference into any filing under the Securities Act of 1933 or the Securities Exchange Act of 1934, through any general statement incorporating by reference in its entirety the Form 10-K/A and in which this report appears, except to the extent that the company specifically incorporates this report or a portion of it by reference. In addition, this report shall not be deemed filed under either the Securities Act or the Exchange Act.
Respectfully submitted by the Compensation Committee,
David A. Krall, Chairman
John R. Egan
Charles F. Kane
-30-
Compensation Committee Interlocks and Insider Participation | ||||
The members of our Compensation Committee during 2015 were Messrs. Egan, Kane, and Krall. Messrs. Egan, Kane, and Krall are not, nor have they ever been, an officer or employee of our company or of any of its subsidiaries, or had any relationship with us requiring disclosure in this Form 10-K/A and. There are no compensation committee interlocks amongst any of our directors.
Analysis of Risk Associated with Our Compensation Plans | ||||
In setting compensation, the Compensation Committee considers the risks to our stockholders and to the achievement of our goals that may be inherent in the compensation plans and programs for all employees, including our executives. When evaluating our executive compensation program, the Compensation Committee considers whether the program is based on the appropriate philosophy, benchmarked against the appropriate peer group and balanced between long and short-term performance targets, company and individual performance. Although a significant portion of our executives' compensation is performance-based and “at-risk,” we believe our compensation plans and programs are appropriately structured so as not to encourage our employees to take excessive or unreasonable risks.
We considered the following elements of our compensation plans and policies when evaluating whether such plans and policies are structured to encourage our employees to take unreasonable risks:
• | A detailed planning process with executive or Compensation Committee oversight exists for all compensation programs. |
• | The proportion of an employee’s performance-based pay increases as the responsibility and potential impact of the employee’s position increases, which structure is in line with market practices. |
• | Compensation consists of both fixed and variable components. The fixed portion (i.e., base salary) and variable portion (i.e., performance-based bonus and equity awards) provide a mix of compensation intended to produce corporate performance without encouraging excessive risks. |
• | We set performance goals that we believe are aggressive and consistent with building long-term shareholder value. |
• | We use consistent corporate performance metrics from year-to-year rather than changing the metric to take advantage of changing market conditions. |
• | Our short-term incentive plans are capped as to the maximum potential payout, which we believe mitigates excessive risk taking by limiting bonus payments even if we dramatically exceed the performance targets. |
• | We use a combination of PSUs and RSUs for equity awards because RSUs retain value even in a depressed market, which makes our executives less likely to take unreasonable risks to earn PSU awards or get, or keep, stock options “in-the-money.” |
• | The time-based vesting for RSUs (including a portion of PSU awards earned) ensures that our executives' interests align with those of our stockholders for the long-term performance of our company. |
• | Assuming achievement of at least a minimum level of performance, payouts under our performance-based plans result in some compensation at levels below full target achievement, rather than an “all-or-nothing” approach. |
• | In accordance with our written stock option grant policy, all equity grants must occur at a meeting of the Compensation Committee and management has no authority to issue equity. |
• | The Compensation Committee retains and does not delegate any of its power to determine matters of executive compensation. |
• | We maintain a system of controls and procedures designed to ensure that amounts are earned and paid in accordance with our plans and programs. |
• | We do not allow our executives and directors to hedge their exposure to ownership of, or interest in, our stock. We also do not allow them to engage in speculative transactions with respect to our stock. |
-31-
Reconciliations of GAAP to Non-GAAP Selected Financial Measures-Fiscal 2015 | |||||||||||||||||||||||||||
Fiscal Year Ended November 30, | % Change | ||||||||||||||||||||||||||
2015 | 2014 | ||||||||||||||||||||||||||
(In thousands, except per share data) | GAAP | Adj. | Non-GAAP | GAAP | Adj. | Non-GAAP | Non-GAAP | ||||||||||||||||||||
TOTAL REVENUE | $ | 377,554 | $ | 34,852 | $ | 412,406 | $ | 332,533 | $ | — | $ | 332,533 | 24 | % | |||||||||||||
Software licenses (1) | 130,250 | 9 | 8,751 | 139,001 | 117,801 | — | 117,801 | 18 | % | ||||||||||||||||||
Maintenance and services (1) | 247,304 | 26,101 | 273,405 | 214,732 | — | 214,732 | 27 | % | |||||||||||||||||||
TOTAL COSTS OF REVENUE | $ | 63,742 | $ | (17,447 | ) | $ | 46,295 | $ | 34,259 | $ | (3,611 | ) | $ | 30,648 | 51 | % | |||||||||||
Amortization of acquired intangibles | 16,830 | (16,830 | ) | — | 2,999 | (2,999 | ) | — | |||||||||||||||||||
Stock-based compensation (2) | 617 | (617 | ) | — | 612 | (612 | ) | — | |||||||||||||||||||
GROSS MARGIN % | 83 | % | 89 | % | 90 | % | 91 | % | (2 | )% | |||||||||||||||||
TOTAL OPERATING EXPENSES | $ | 299,058 | $ | (53,360 | ) | $ | 245,698 | $ | 217,534 | $ | (33,042 | ) | $ | 184,492 | 33 | % | |||||||||||
Amortization of acquired intangibles | 12,745 | (12,745 | ) | — | 653 | (653 | ) | — | |||||||||||||||||||
Restructuring expenses | 12,989 | (12,989 | ) | — | 2,266 | (2,266 | ) | — | |||||||||||||||||||
Acquisition-related expenses | 4,239 | (4,239 | ) | — | 5,862 | (5,862 | ) | — | |||||||||||||||||||
Stock-based compensation (2) | 23,387 | (23,387 | ) | — | 24,261 | (24,261 | ) | — | |||||||||||||||||||
(LOSS) INCOME FROM OPERATIONS | $ | 14,754 | $ | 105,659 | $ | 120,413 | $ | 80,740 | $ | 36,653 | $ | 117,393 | 3 | % | |||||||||||||
OPERATING MARGIN | 4 | % | 29 | % | 24 | % | 35 | % | (6 | )% | |||||||||||||||||
TOTAL OTHER (EXPENSE) INCOME, NET (3) | $ | (2,400 | ) | $ | 266 | $ | (2,134 | ) | $ | (2,936 | ) | $ | 2,554 | $ | (382 | ) | (459 | )% | |||||||||
(BENEFIT) PROVISION FOR INCOME TAXES | $ | 21,155 | $ | 16,574 | $ | 37,729 | $ | 28,346 | $ | 10,768 | $ | 39,114 | (4 | )% | |||||||||||||
NET INCOME | $ | (8,801 | ) | $ | 89,351 | $ | 80,550 | $ | 49,458 | $ | 28,439 | $ | 77,897 | 3 | % | ||||||||||||
DILUTED EARNINGS PER SHARE | $ | (0.17 | ) | $ | 1.75 | $ | 1.58 | $ | 0.96 | $ | 0.55 | $ | 1.51 | 5 | % | ||||||||||||
WEIGHTED AVERAGE SHARES OUTSTANDING - DILUTED | 50,391 | 729 | 51,120 | 51,466 | — | 51,466 | (1 | )% | |||||||||||||||||||
(1) Adjustments to revenue relate to acquisition-related revenue, which constitutes revenue reflected as pre-acquisition deferred revenue by Telerik that would otherwise have been recognized but for the purchase accounting treatment of the acquisition of Telerik. Since GAAP accounting requires the elimination of this revenue, GAAP results alone do not fully capture all of our economic activities. Note that acquisition-related revenue adjustments entirely relate to Progress' Application Development and Deployment business unit. | |||||||||||||||||||||||||||
(2) Stock-based compensation is included in the GAAP statements of income, as follows: | |||||||||||||||||||||||||||
Cost of revenue | 617 | 612 | |||||||||||||||||||||||||
Sales and marketing | 4,805 | 4,642 | |||||||||||||||||||||||||
Product development | 5,433 | 5,289 | |||||||||||||||||||||||||
General and administrative | 13,149 | 14,330 | |||||||||||||||||||||||||
Total | $ | 24,004 | $ | 24,873 | |||||||||||||||||||||||
(3) Adjustment to other income (expense), net relates to the termination of Progress' prior revolving credit facility with JPMorgan Chase Bank, N.A. and the other lenders party to the credit facility in connection with entering into the new credit facility, which was used to partially fund the acquisition of Telerik. Upon termination, the outstanding debt issuance costs related to the prior revolving credit facility were written off to other income (expense) in the GAAP statements of income. | |||||||||||||||||||||||||||
-32-
Summary of Executive Compensation | ||||
The following table sets forth certain information with respect to compensation for the fiscal years ended November 30, 2015, 2014, and 2013, earned by:
(a) | Mr. Pead, who served as Chief Executive Officer during fiscal 2015. |
(b) | Mr. Perkins, who served as our Chief Financial Officer during fiscal 2015. |
(c) | Mr. Robinson, Mr. Rulli, and Mr. Benedict, who were our three other most highly compensated executive officers. |
(d) | Ms. Padir, who would have been one of our three other most highly compensated executive officers had her employment not terminated in October 2015. |
SUMMARY COMPENSATION TABLE - FISCAL YEARS 2015, 2014, AND 2013
Name and Principal Position | Year | Salary | Bonus | Stock Awards (1) | Option Awards (2) | Non-Equity Incentive Plan Compensation (3) | All Other Compensation (4) | Total | ||||
Philip Pead, President & Chief Executive Officer(5) | 2015 2014 2013 | $650,000 650,000 637,885 | $— — — 0 0 | $2,247,370 2,537,218 12,738,276 | $— — — - | $— — — — 767,000 | $103,836 103,678 96,074 | $3,001,206 3,290,896 14,239,235 | ||||
Chris Perkins, Chief Financial Officer(6) | 2015 2014 2013 | 375,000 375,000 331,730 | — — — | 1,138,835 804,170 4,082,176 | — — — | — — 293,868 | 126,561 126,404 115,057 | 1,640,396 1,305,574 4,822,831 | ||||
Jerry Rulli, Chief Operating Officer(8) | 2015 | 369,808 | — | 1,061,082 | — | 128,860 | 8,532 | 1,568,282 | ||||
Matthew Robinson, Chief Technology Officer(7) | 2015 | 282,401 | — | 928,629 | — | 105,625 | 8,078 | 1,324,733 | ||||
Michael Benedict, Chief Product Officer(9) | 2015 | 268,077 | — | 810,894 | — | 110,600 | 8,348 | 1,197,918 | ||||
Karen Tegan Padir, President, AD&D Business Unit(10) | 2015 2014 | 298,269 330,000 | — | 180,014 519,676 | — | 47,850 — | 55,953 8,275 | 582,086 857,951 | ||||
______________
(1) | These amounts do not reflect the actual economic value realized by the named executive officer. In accordance with FASB ASC Topic 718, we estimate the fair value of each stock-based award on the measurement date using either the current market price of the stock or the Monte Carlo Simulation valuation model, assuming the probable outcome of related performance conditions at target levels. See the description of our 2015 Annual Equity Program described in “Compensation Discussion and Analysis” in this Form 10-K/A. |
(2) | Represents the grant date fair value of options on the date of grant. The grant date fair value of our options is equal to the number of shares subject to the option multiplied by the fair value of our options on the date of grant determined using the Black-Scholes option valuation model. The methodology and assumptions used to calculate the Black-Scholes value of our options are described in Note 12 of the consolidated financial statements contained in our Annual Report on Form 10-K for the fiscal year ended November 30, 2015. |
(3) | Except as described in Note 7 below, the amounts listed reflect the amounts earned under our Corporate and Business Unit Bonus Plans as described in “Compensation Discussion and Analysis” in this Form 10-K/A. For all individuals, bonus payments were accrued and earned in the year indicated and paid in the succeeding fiscal year. |
-33-
(4) | Amounts listed in this column for 2015 include: |
Name | Company Contributions (401(k)) | Insurance Premiums | Taxable Relocation | Termination Related | ||||||||||
Mr. Pead | $ | 7,950 | $ | 728 | $ | 95,158 | $ | — | ||||||
Mr. Perkins | 7,950 | 547 | 118,064 | — | ||||||||||
Mr. Robinson | 7,605 | 473 | — | — | ||||||||||
Mr. Rulli | 7,950 | 582 | — | — | ||||||||||
Mr. Benedict | 7,954 | 394 | — | — | ||||||||||
Ms. Padir | 7,950 | 407 | — | 47,596 | ||||||||||
Included in the amounts shown under the column “Taxable Relocation” with respect to Mr. Pead and Mr. Perkins are taxes paid by us on behalf of Mr. Pead and Mr. Perkins relating to taxable commuting expenses incurred by Mr. Pead and Mr. Perkins and reimbursed by us during 2015. Included in the column “Termination Related” with respect to Ms. Padir are amounts paid to Ms. Padir upon termination of employment as described in Note 10 below.
(5) | On December 7, 2012, Mr. Pead became our President and Chief Executive Officer. The amount shown in the Stock Awards column for 2013 with respect to Mr. Pead includes the grant date fair value of 1,480 RSUs Mr. Pead was awarded in January 2013 in connection with his service as Executive Chairman from October 2012 until November 2012. |
(6) | Mr. Perkins became our Chief Financial Officer on February 1, 2013. The amounts shown for Mr. Perkins in 2013 are base salary and non-equity incentive plan compensation for the period from February 1, 2013 until November 30, 2013. |
(7) | On May 1, 2015, Mr. Robinson became our Chief Technology Officer. Mr. Robinson was not a named executive officer in fiscal 2014 or fiscal 2013. Included in “Non-Equity Plan Incentive Compensation” for Mr. Robinson is a discretionary cash bonus of $84,890 paid to Mr. Robinson for individual achievement in fiscal 2015. Excluded from Mr. Robinson’s fiscal 2015 compensation is an earn-out payment subject to milestones of $1,366,504 in connection with our acquisition or Rollbase, of which, Mr. Robinson was the founder, Chief Executive Officer and a stockholder, in fiscal 2014. |
(8) | On July 1, 2015, Mr. Rulli became our Chief Operating Officer. Mr. Rulli was not a named executive officer in fiscal 2014 or fiscal 2013. |
(9) | On October 1, 2015, Mr. Benedict became our Chief Product Officer. Mr. Benedict was not a named executive officer in fiscal 2014 or fiscal 2013. |
(10) | Ms. Padir was not a named executive officer in fiscal 2013. In October, 2015, Ms. Padir’s employment with our company terminated. The amount shown in the Summary Compensation Table under “All Other Compensation” applicable to Ms. Padir is severance paid to her between October 16, 2015 and November 30, 2015 pursuant to the terms of the severance agreement we entered into with Ms. Padir in connection with her termination of employment. See “Severance and Change in Control Agreements.” |
-34-
Grants of Plan-Based Awards | ||||
GRANTS OF PLAN-BASED AWARDS TABLE - 2015
Estimated Possible Payouts Under Non-Equity Incentive Plan Awards | Estimated Possible Payouts Under Equity Incentive Plan Awards | All Other Stock Awards: Number of Shares of Stock or Units | All Other Stock Awards: Number of Securities Underlying Options | Grant Date Fair Value of Stock and Option Awards | ||||||||||||||||||||
Name | Grant Date | Threshold ($)(1) | Target ($)(1) | Maximum ($)(1) | Threshold (#)(2)(3) | Target (#)(2)(3) | Maximum (#)(2)(3) | (#)(4) | (#) | ($)(5) | ||||||||||||||
Philip Pead | — | 325,000 | 650,000 | 1,300,000 | — | — | — | — | — | — | ||||||||||||||
3/2/2015 | — | — | — | 13,077 | 26,154 | 52,308 | — | — | 720,020 | |||||||||||||||
3/2/2015 | — | — | — | 23,611 | 47,222 | 94,444 | — | — | 1,300,022 | |||||||||||||||
3/2/2015 | — | — | — | — | — | — | 17,436 | — | 480,013 | |||||||||||||||
Chris Perkins | — | 150,000 | 300,000 | 600,000 | — | — | — | — | — | — | ||||||||||||||
1/29/2015 | — | — | — | 5,817 | 11,633 | 23,326 | — | — | 300,015 | |||||||||||||||
1/29/2015 | — | — | — | 14,541 | 29,082 | 58,164 | — | — | 750,025 | |||||||||||||||
1/29/2015 | — | — | — | — | — | — | 7,755 | — | 200,001 | |||||||||||||||
Jerry Rulli | — | 170,000 | 340,000 | 680,000 | — | — | — | — | — | — | ||||||||||||||
1/29/2015 | — | — | — | 9,694 | 19,388 | 38,776 | — | — | 500,017 | |||||||||||||||
1/29/2015 | — | — | — | 13,572 | 27,143 | 54,286 | — | — | 700,018 | |||||||||||||||
Matthew Robinson | — | 81,250 | 162,500 | 325,000 | — | — | — | — | — | — | ||||||||||||||
1/15/2015 | — | — | — | 2,000 | 3,999 | 7,998 | — | — | 100,015 | |||||||||||||||
1/15/2015 | — | — | — | — | — | — | 3,999 | — | 100,015 | |||||||||||||||
7/6/2015 | — | — | — | 2,486 | 4,972 | 9,944 | — | — | 150,005 | |||||||||||||||
7/6/2015 | — | — | — | 10,773 | 21,545 | 43,090 | — | — | 650,013 | |||||||||||||||
7/6/2015 | — | — | — | — | — | — | 3,315 | — | 100,032 | |||||||||||||||
Michael Benedict | — | 70,000 | 140,000 | 280,000 | — | — | — | — | — | — | ||||||||||||||
1/29/2015 | — | — | — | 4,072 | 8,143 | 16,286 | — | — | 210,008 | |||||||||||||||
1/29/2015 | — | — | — | 10,470 | 20,939 | 41,878 | — | — | 540,017 | |||||||||||||||
1/29/2015 | — | — | — | — | — | — | 5,429 | — | 140,014 | |||||||||||||||
Karen Tegan Padir | — | 82,500 | 165,000 | 330,000 | — | — | — | — | — | — | ||||||||||||||
1/29/2015 | — | — | — | 5,235 | 10,470 | 20,940 | — | — | 270,021 | |||||||||||||||
1/29/2015 | — | — | — | 12,796 | 25,592 | 51,184 | — | — | 660,018 | |||||||||||||||
1/29/2015 | — | — | — | — | — | — | 6,980 | — | 180,014 | |||||||||||||||
______________
(1) | These columns indicate the range of payouts targeted for fiscal 2015 performance under our Corporate Bonus Plan as described in “Compensation Discussion and Analysis” in this Form 10-K/A. The actual payout with respect to fiscal 2015 for each named executive officer is shown in the Summary Compensation Table in the column titled “Non-Equity Incentive Plan Compensation.” |
(2) | The second row of these columns with respect to each named executive officer indicates the range of payouts with respect to performance share units subject to fiscal 2015 performance criteria and subsequent time-based restrictions. These performance shares units could be earned only to the extent the established criteria were met. For Mr. Robinson, the second and fourth rows of these columns indicate the range of payouts with respect to performance share units subject to 2015 performance criteria and subsequent time-based restrictions. Mr. Robinson received an award of performance share units in January 2015 prior to his promotion to Chief Technology Officer and received a second award of performance share units subject to fiscal 2015 performance criteria in July 2015 following his promotion. |
(3) | The third row of these columns with respect to each named executive officer, except for Mr. Robinson, represents performance share units awarded under our Long Term Incentive Plan. For Mr. Robinson, the fifth row of these columns represents performance share units awarded under our Long Term Incentive Plan. These columns show the performance share units that could be earned at threshold, target and maximum levels of performance. If we do not achieve the threshold performance metric, zero performance share units will be earned. Because the LTIP is based on a three-year performance period, none of the performance share units will be earnable until the performance period closes following our 2017 fiscal year. See “Compensation Discussion and Analysis” section of this Form 10-K/A for additional discussion of the LTIP. |
(4) | Represents RSUs that vest, so long as the executive continues to be employed with us, in six equal installments over three years beginning approximately six months after date of issuance. Dividends are not payable on unvested RSUs. |
-35-
(5) | Represents the grant date fair value of the award, which is equal to the number of RSUs granted multiplied by the closing price of our stock on the grant date. In the case of PSUs, represents the number of PSUs granted at target performance multiplied by the closing price of our stock on the date awarded. The closing price of our stock on (i) January 15, 2015 was $25.01, (ii) January 29, 2015 was $25.79, (iii) March 2, 2015 was $27.53, and (iv) July 6, 2015 was $30.17. |
Narrative Summary to Summary Compensation Table and Grants of Plan-Based Awards in 2015 Table | ||||
The material terms of our named executive officers’ annual compensation, including base salaries, cash incentive plan, annual PSU program, time-based RSUs, and Long Term Incentive Plan and the explanations of the amounts of salary, cash incentives, and equity values in proportion to total compensation are described under “Compensation Discussion and Analysis” in this Form 10-K/A.
As discussed in greater detail in “Compensation Discussion and Analysis,” the 2015 non-equity incentive awards were granted pursuant to the Fiscal 2015 Corporate Bonus Plan, in the case of Mr. Pead, Mr. Perkins and, following his appointment as Chief Technology Officer, Mr. Robinson, and the Fiscal 2015 Business Unit Bonus Plans, in the case of Mr. Rulli, Mr. Robinson (until his promotion to Chief Technology Officer), Mr. Benedict, and Ms. Padir, in each case, with amounts to be earned based on the achievement of certain financial targets. In 2015, we did not achieve the financial targets under the Corporate Bonus Plan and, as a result, Mr. Pead and Mr. Perkins did not earn any portion of their non-equity incentive awards.
As discussed in greater detail in “Compensation Discussion and Analysis,” the PSUs awarded as the 2015 PSU Award were subject to the achievement of certain one-year financial targets.
As discussed in greater detail in “Compensation Discussion and Analysis,” the PSUs awarded under the Long Term Incentive Plan will be earned based on the results achieved during the three year performance period as determined following our 2017 fiscal year, contingent upon each named executive officer’s continued service.
The RSUs granted to our named executive officers at the outset of 2015 vest in equal installments every six months over three years, subject to continued employment. There is no purchase price associated with performance share or RSU awards. We did not pay dividends on our common stock during 2015.
-36-
Outstanding Equity Awards | ||||
The following table sets forth certain information with respect to the outstanding equity awards at November 30, 2015 for each of the named executive officers.
OUTSTANDING EQUITY AWARDS AT FISCAL YEAR-END 2015
Option Awards | Stock Awards | ||||||||||||||||||||
Number of Securities Underlying Unexercisable Options | Option Exercise Price ($) | Option Expiration Date | Number of Shares or Units of Stock That Have Not Vested (#)(1) | Market Value of Shares or Units of Stock That Have Not Vested ($)(2) | |||||||||||||||||
Name | Exercisable | Unexercisable | |||||||||||||||||||
Philip Pead | |||||||||||||||||||||
15,069 | — | 20.73 | 10/14/2018 | ||||||||||||||||||
268,512 | 6,441,603 | ||||||||||||||||||||
Chris Perkins | |||||||||||||||||||||
— | — | — | — | ||||||||||||||||||
114,582 | 2,748,822 | ||||||||||||||||||||
Jerry Rulli | |||||||||||||||||||||
— | — | — | — | ||||||||||||||||||
60,232 | 1,444,966 | ||||||||||||||||||||
Matthew Robinson | |||||||||||||||||||||
— | — | — | — | ||||||||||||||||||
40,302 | 966,845 | ||||||||||||||||||||
Michael Benedict | |||||||||||||||||||||
4,500 | — | 21.32 | 4/26/2017 | ||||||||||||||||||
1,500 | — | 29.64 | 4/27/2018 | ||||||||||||||||||
63,044 | 1,512,426 | ||||||||||||||||||||
Karen Tegan Padir (3) | |||||||||||||||||||||
— | — | — | — | — | — | ||||||||||||||||
______________
(1) | The unvested shares shown in this column are RSU awards that are subject to time-based vesting and PSU awards that are subject to performance-based and time-based vesting. |
(2) | The market value of unvested RSUs and PSUs was calculated as of November 30, 2015 based on closing price of our common stock on NASDAQ of $23.99 on that date. |
(3) | Ms. Padir’s employment with our company terminated on October 16, 2015. As of November 30, 2015, Ms. Padir did not hold any stock options or unvested stock. |
-37-
Option Exercises and Stock Vested | ||||
The following table sets forth certain information regarding the number of stock options exercised and RSUs that vested in the fiscal year ended November 30, 2015 under our equity incentive plans and the corresponding amounts realized by the named executive officers. The value realized on exercise for stock option awards is calculated as the difference between the closing price of our common stock on the NASDAQ Global Select Market on the exercise date and the exercise price of the applicable stock option award. The value realized on vesting for RSUs is calculated as the product of the number of shares subject to the RSUs that vested and the closing price of our common stock on the NASDAQ Global Select Market on the vesting date.
Option Exercises and Stock Vested - Fiscal 2015
Option Awards | Stock Awards | |||||||||||||||||||||||||||
Name | Number of Shares Acquired on Exercise (#) | Value Realized on Exercise ($) | Number of Shares Acquired on Vesting (#) | Value Realized on Vesting ($) | ||||||||||||||||||||||||
Philip Pead | — | — | 206,053 | $ | 5,388,022 | |||||||||||||||||||||||
Chris Perkins | — | — | 63,362 | 1,656,587 | ||||||||||||||||||||||||
Jerry Rulli | — | — | 6,850 | 179,179 | ||||||||||||||||||||||||
Matthew Robinson | — | — | 3,311 | 86,192 | ||||||||||||||||||||||||
Michael Benedict | 6,669 | 69,657 | 14,112 | 369,926 | ||||||||||||||||||||||||
Karen Tegan Padir | — | — | 29,415 | 755,366 | ||||||||||||||||||||||||
Severance and Change in Control Agreements | ||||
We have agreements with, or guidelines applicable to, our executive officers that provide the benefits described below in connection with certain terminations of employment or a change in control of our company. We do not provide excise tax gross-ups to our executive officers under these or any other agreements.
Mr. Pead's Executive Employment Agreement
In connection with his appointment as our President and Chief Executive Officer, we and Mr. Pead entered into an employment agreement, effective as of December 7, 2012, setting forth Mr. Pead's compensation and certain other terms. Mr. Pead's employment agreement provides that in the event that his employment is terminated as a result of an “involuntary termination,” he will be entitled to:
• | the payment of cash severance equal to 18 months of total target cash compensation as of the date of termination, which will be paid over 18 months; |
• | the continuation, for a period of 18 months, of benefits that are substantially equivalent to the benefits (medical, dental, and vision) that were in effect immediately prior to termination; and |
• | 18 months of acceleration of unvested stock options and RSUs. |
Receipt of the severance and benefits is subject to the execution of a standard separation and release agreement. Separation payments upon any involuntary termination within twelve months following a change in control would be governed by the Employee Retention and Motivation Agreement described below and not by Mr. Pead's employment agreement.
An “involuntary termination” is defined in the employment agreement as a termination of employment by us other than for cause, disability or death or a termination by Mr. Pead as a result of certain events occurring without his consent such as an assignment to him of duties, a significant reduction of his duties, either of which is materially inconsistent with his position prior to the assignment or reduction, or the removal of Mr. Pead from that position, a material reduction in Mr. Pead's base salary or target bonus, a relocation of Mr. Pead to a facility or location more than fifty miles from his then present location, or a material breach of the employment agreement by us.
Mr. Pead's employment agreement also includes non-competition and related covenants. The non-competition covenant will be in effect for the duration of the period in which severance and other benefits are paid. The non-competition covenant relates to certain businesses with similar product areas and activities as our company.
-38-
Mr. Pead's Employee Retention and Motivation Agreement
We and Mr. Pead have also entered into an Employee Retention and Motivation Agreement (“Pead ERMA”), which provides certain compensation and benefits if his employment is involuntarily terminated within 12 months of a change in control of our company. If an involuntary termination of Mr. Pead's employment occurs under other circumstances, the severance terms of his employment agreement, as described above, would control and not the Pead ERMA.
Change in Control Benefits. Under the Pead ERMA, upon a change in control of our company, Mr. Pead would be entitled to:
• | the payment of his annual target cash bonus on a pro-rata basis with respect to the elapsed part of the relevant fiscal year; and |
• | accelerated vesting of all unvested stock options and RSUs, unless the acquirer assumes all such options and restricted equity. If such outstanding stock options and shares of restricted equity held by Mr. Pead are continued by us or assumed by our successor entity, then vesting will continue in its usual course. |
Involuntary Termination Following Change in Control. In the event of an involuntary termination within twelve (12) months following a change in control, Mr. Pead would be entitled to:
• | the payment of cash severance equal to 18 months of total target cash compensation as of the date of termination, which will be paid over 18 months; |
• | the continuation, for a period of 18 months, of benefits that are substantially equivalent to the benefits (medical, dental, and vision) that were in effect immediately prior to termination; and |
• | accelerated vesting of all unvested stock options and RSUs. |
In the event that any amounts provided for under the Pead ERMA or otherwise payable to Mr. Pead would constitute “parachute payments” within the meaning of Section 280G of the Internal Revenue Code and be subject to the related excise tax, Mr. Pead would be entitled to receive either full payment of the benefits under the agreement or such lesser amount which would result in no portion of the benefits being subject to the excise tax, whichever results in the greatest amount of after-tax benefits to Mr. Pead.
Mr. Perkins’ Executive Employment Agreement
In connection with his appointment as our Chief Financial Officer, we and Mr. Perkins entered into an employment agreement, effective as of February 1, 2013, setting forth Mr. Perkins’ compensation and certain other terms. Mr. Perkins’ employment agreement provides that in the event that his employment is terminated as a result of an “involuntary termination,” he will be entitled to:
• | the payment of cash severance equal to 12 months of total target cash compensation as of the date of termination, which will be paid over 12 months; |
• | the continuation, for a period of 12 months, of benefits that are substantially equivalent to the benefits (medical, dental, and vision) that were in effect immediately prior to termination; and |
• | 12 months of acceleration of unvested stock options and RSUs. |
Receipt of the severance and benefits is subject to the execution of a standard separation and release agreement. Separation payments upon any involuntary termination within twelve months following a change in control would be governed by the Employee Retention and Motivation Agreement described below and not by Mr. Perkins’ employment agreement.
An “involuntary termination” is defined in the employment agreement as a termination of employment by us other than for cause, disability or death or a termination by Mr. Perkins as a result of certain events occurring without his consent such as an assignment to him of duties, a significant reduction of his duties, either of which is materially inconsistent with his position prior to the assignment or reduction, or the removal of Mr. Perkins from that position, a material reduction in Mr. Perkins’ base salary or target bonus, a relocation of Mr. Perkins to a facility or location more than fifty miles from his then present location, or a material breach of the employment agreement by us.
Mr. Perkins’ employment agreement also includes non-competition and related covenants. The non-competition covenant will be in effect for the duration of the period in which severance and other benefits are paid. The non-competition covenant relates to certain businesses with similar product areas and activities as our company.
-39-
Ms. Padir’s Executive Severance Agreement
On October 16, 2015, Ms. Padir’s employment terminated and, in connection with that termination, we entered into an executive severance agreement with Ms. Padir. Consistent with the Executive Severance Policy described below, Ms. Padir severance agreement provided for:
• | the payment of cash severance equal to 12 months of her total target cash compensation as of the date of termination, which will be paid over 12 months; |
• | the continuation, for a period of 12 months, of benefits that are substantially equivalent to the benefits (medical, dental, and vision) that were in effect immediately prior to termination; and |
• | 12 months of acceleration of unvested and RSUs. |
Ms. Padir’s severance agreement included a release of claims, non-competition, non-disparagement, and related covenants. In connection with her termination of employment, all PSUs awarded to Ms. Padir relating to fiscal 2015 or under our Long Term Incentive Plan were canceled.
Executive Severance Guidelines
We have adopted severance guidelines applicable to our executive officers, including the named executive officers other than Mr. Pead and Mr. Perkins. Any severance payable to Mr. Pead or Mr. Perkins is governed by the employment agreements described above. Our executive severance guidelines provide that upon an involuntary termination and the execution of a standard release of claims, an executive officer is entitled to:
• | the payment of cash severance equal to 12 months of total target cash compensation as of the date of termination, which will be paid over 12 months; |
• | the continuation, for a period of 12 months, of benefits that are substantially equivalent to the benefits (medical, dental, and vision) that were in effect immediately prior to termination; and |
• | 12 months of acceleration of unvested stock options and RSUs. |
Severance payments and benefits upon any involuntary termination within 12 months following a change in control are governed by the Employee Retention and Motivation Agreement described below.
The payment of severance and other benefits is conditioned upon the executive agreeing to non-competition, non-disparagement and related covenants. The non-competition covenant would be in effect for one year following the termination of employment. In connection with the termination of employment of an executive officer, all PSUs awarded to that executive officer relating to annual performance or under our Long Term Incentive Plan are canceled.
Other Employee Retention and Motivation Agreements
In addition to the agreement with Mr. Pead, we have entered into an ERMA with each of the other named executive officers. Each agreement is substantially identical to the Pead ERMA except that upon the involuntary termination of the executive officer within 12 months following a change of control, the executive officer will be entitled to receive a lump sum payment equal to 15 months of his total target compensation and his benefits will continue for 15 months. In addition, for all ERMAs entered into after October 2014, including Mr. Robinson’s ERMA, accelerated vesting upon a change in control is limited to twelve months of accelerated vesting. Under no circumstances would any of our executive officers be entitled to a gross-up payment under the ERMAs for any excise taxes to which he or she may be subject if any of the above payments and benefits are considered to be “parachute payments.”
Estimate of Severance and Change in Control Benefits
The following table indicates the estimated payments and benefits that each of Messrs. Pead, Perkins, Robinson, Rulli, and Benedict would have received under (a) their respective employment agreements, in the case of Messrs. Pead and Perkins, (b) our severance guidelines applicable to executive officers, in the case of Messrs. Robinson, Rulli, and Benedict, and (c) their respective ERMAs, assuming that the change of control of our company and/or termination of his employment occurred at November 30, 2015. Ms. Padir’s employment terminated on October 16, 2015 and she received the severance and other benefits provided under her severance agreement described above.
These amounts are estimates only and do not necessarily reflect the actual amounts that would be paid to the named executive officer, which would only be known at the time that he becomes entitled to such payment.
-40-
Circumstances of Termination or Event | |||||||||||||||||
Involuntary Termination (1)($) | Change in Control Only (2)($) | Involuntary Termination Within 12 Months Following Change of Control ($) | |||||||||||||||
Philip Pead | |||||||||||||||||
Cash Severance | 1,950,000 | — | 1,950,000 | ||||||||||||||
Pro Rata Bonus | 650,000 | 650,000 | — | ||||||||||||||
Stock Options | — | — | — | ||||||||||||||
Restricted Stock Units | 3,584,466 | — | 3,899,551 | ||||||||||||||
Benefits (3) | 14,960 | — | 14,960 | ||||||||||||||
Total | 6,199,426 | 650,000 | 5,864,511 | ||||||||||||||
Chris Perkins | |||||||||||||||||
Cash Severance | 675,000 | — | 843,750 | ||||||||||||||
Pro Rata Bonus | 300,000 | 300,000 | — | ||||||||||||||
Stock Options | — | — | — | ||||||||||||||
Restricted Stock Units | 982,391 | — | 1,251,366 | ||||||||||||||
Benefits (3) | 17,590 | — | 17,590 | ||||||||||||||
Total | 1,974,981 | 300,000 | 2,112,706 | ||||||||||||||
Jerry Rulli | |||||||||||||||||
Cash Severance | 1,020,000 | — | 1,275,000 | ||||||||||||||
Pro Rata Bonus | 340,000 | 340,000 | — | ||||||||||||||
Stock Options | — | — | — | ||||||||||||||
Restricted Stock Units | 359,658 | — | 719,340 | ||||||||||||||
Benefits (3) | 9,974 | — | 9,974 | ||||||||||||||
Total | 1,729,632 | 340,000 | 2,004,314 | ||||||||||||||
Matthew Robinson | |||||||||||||||||
Cash Severance | 487,500 | — | 609,375 | ||||||||||||||
Pro Rata Bonus | 162,500 | 162,500 | — | ||||||||||||||
Stock Options | — | — | — | ||||||||||||||
Restricted Stock Units | 194,991 | — | 194,991 | ||||||||||||||
Benefits (3) | — | — | — | ||||||||||||||
Total | 844,491 | 162,500 | 804,366 | ||||||||||||||
Michael Benedict | |||||||||||||||||
Cash Severance | 420,000 | — | 525,000 | ||||||||||||||
Pro Rata Bonus | 140,000 | 140,000 | — | ||||||||||||||
Stock Options | — | — | — | ||||||||||||||
Restricted Stock Units | 282,914 | — | 455,234 | ||||||||||||||
Benefits (3) | 16,427 | — | 16,427 | ||||||||||||||
Total | 859,341 | 140,000 | 996,661 | ||||||||||||||
______________
(1) | The amounts shown in the first column, with respect to stock options and RSUs, represent the value of certain unvested options and RSUs becoming fully vested and are calculated using the exercise price for each unvested stock option and the closing price of our common stock on November 30, 2015, which was $23.99. In the event of an Involuntary Termination, all unvested performance share units awarded to an individual relating to fiscal year performance or under our Long Term Incentive Plan are canceled. |
(2) | In the event of a change in control, there is no accelerated vesting of options or RSUs provided that the acquirer assumes all existing, outstanding stock options and RSUs of the individual. These tables have been prepared under that assumption. However, if the acquirer does not assume all existing, outstanding stock options and RSUs of the individual, all unvested stock options and RSUs become fully vested (except in the case of Mr. Robinson) and the value indicated in the third column would apply upon a change in control. In the case of Mr. Robinson, his ERMA provides for 12 months accelerated vesting of unvested equity upon a change in control. The amounts shown in the third column are calculated using the exercise price for each unvested stock option and the closing price of our common stock on November 30, 2015, which was $23.99. For purposes of computing amounts attributable to accelerated vesting, the second and third columns exclude all unvested performance share units awarded relating to fiscal year performance or under our Long Term Incentive Plan as those amounts are undeterminable. |
(3) | Represents the estimated value (based on the cost as of November 30, 2015) of continuing benefits (medical, dental, and vision) for: |
• | 18 months in the case of an involuntary termination of Mr. Pead's employment; |
-41-
• | 12 months in the case of an involuntary termination of employment of Messrs. Perkins, Robinson, Rulli, and Benedict, other than in connection with a change in control; and |
• | 15 months, in the case of the third column, with respect to Messrs. Perkins, Robinson, Rulli, and Benedict. |
Director Compensation | ||||
We pay our directors a mix of cash and equity compensation. Employee directors receive no compensation for their service as directors.
In accordance with the 2015 Director Compensation Plan adopted by the Board, for 2015, our non-employee directors were paid an annual retainer of $250,000. This annual retainer was paid $50,000 in cash and $200,000 in equity (with the equity paid in the form of restricted stock units (RSUs) or stock options or any combination of the two, at the election of the individual director). The non-executive Chairman of the Board was paid an additional cash retainer of $30,000. Prior to adopting the 2015 Director Compensation Plan, the Compensation Committee received market data from its external compensation consultant and considered whether any changes in director compensation were required. Based on the market data, the Compensation Committee recommended to the Board that there should be no changes to the director compensation plan then in effect.
For purposes of the equity compensation paid to our directors, the number of options was determined by dividing the compensation amount by the grant date Black-Scholes value. The number of RSUs was determined by dividing the compensation amount by the grant date closing price of our common stock as reported by NASDAQ. Upon issuance, the options and RSUs vested in a single installment on December 1, 2015, subject to continued service on our Board of Directors.
With respect to service on the committees of our Board of Directors, the following fees were paid:
• | Audit Committee - $25,000 for the Chairman and $20,000 for the other members; |
• | Compensation Committee - $20,000 for the Chairman and $15,000 for the other members; and |
• | Nominating and Corporate Governance Committee - $12,500 for the Chairman and $10,000 for the other members. |
The fees paid for service on the committees of our Board of Directors were paid in cash.
The fiscal 2015 director compensation was paid to our non-employee directors in one installment on April 5, 2015.
In January 2013, our Board of Directors adopted revised stock retention guidelines for non-employee directors. These guidelines provide for all non-employee directors to hold an amount of our common stock, restricted shares, stock options and/or deferred stock units having a value equal to at least three times the annual cash retainer. Directors have five years to attain this ownership threshold.
Each newly elected director receives an initial director appointment grant of $300,000 of option equivalent shares at the first April or October grant date following his or her election to our Board of Directors. This initial grant may be received in the form of options, deferred stock units or a combination of the two. The split between options and deferred stock units is determined by each director individually by written election made prior to the newly elected director’s appointment to our Board of Directors. The election will be expressed as a percentage of the initial director appointment grant (e.g., 50% in options and 50% in deferred stock units) and may consist of all options, all deferred stock units or any combination thereof. Options and deferred stock units vest over a 48-month period, beginning on the first day of the month following the month the director joins our Board of Directors, with full acceleration of vesting upon a change in control.
-42-
Director Compensation Table - Fiscal 2015
The following table sets forth a summary of the compensation earned by or paid to our non-employee directors in 2015.
Name | Fees Earned or Paid in Cash ($) | Stock Awards (1) (2) ($) | Option Awards (3)(4) ($) | Total ($) | |||
Barry N. Bycoff | 50,000 | 200,001 | — | 250,001 | |||
John R. Egan | 95,000 | 196,701 | 39,986 | 331,687 | |||
Ram Gupta | 82,500 | 200,001 | — | 282,501 | |||
Charles F. Kane | 90,000 | 200,001 | — | 290,001 | |||
David A. Krall | 80,000 | 200,001 | — | 280,001 | |||
Michael L. Mark | 80,000 | 200,001 | — | 280,001 | |||
______________
(1) | Represents RSUs issued to the named directors electing to receive RSUs in the following amounts: |
Name | Total RSUs Granted in 2015 |
Mr. Bycoff | 7,764 |
Mr. Egan | 6,212 |
Mr. Gupta | 7,764 |
Mr. Kane | 7,764 |
Mr. Krall | 7,764 |
Mr. Mark | 7,764 |
The RSUs to the named directors in the table above vested on December 1, 2015.
(2) | Represents the grant date fair value of RSUs granted on April 6, 2015. The grant date fair value is equal to the number of RSUs granted multiplied by $25.76, the closing price on the date of grant. In the case of Mr. Egan, also includes the fair value of deferred stock units that vested during 2015 that he received in connection with his initial appointment to the Board in September 2011. |
(3) | Mr. Egan elected to receive 20% of the equity compensation portion of his annual retainer in the form of stock options. As a result, Mr. Egan was granted an option to purchase 5,889 shares of our common stock with an exercise price of $25.76 on April 6, 2015, which became fully exercisable on December 1, 2015. The aggregate grant date fair value of these options was approximately $40,000. |
Each non-employee director had the following unexercised stock options outstanding as of the record date:
Name | Unexercised Stock Options Outstanding at Record Date | ||
Mr. Bycoff | 5,664 | ||
Mr. Egan | 72,632 | ||
Mr. Gupta | — | ||
Mr. Kane | 7,705 | ||
Mr. Krall | 7,705 | ||
Mr. Mark | 146,649 | ||
(4) | Represents the grant date fair value of options granted on April 6, 2015. The grant date fair value of our options is equal to the number of shares subject to the option by the fair value of our options on the date of grant determined by using the Black-Scholes option valuation model. The Black-Scholes value of our options on April 6, 2015 was $6.79. The methodology and assumptions used to calculate the Black-Scholes value of our options are described in Note 12 of the consolidated financial statements contained in our Annual Report on Form 10-K for the fiscal year ended November 30, 2015. |
-43-
ITEM 12. SECURITY OWNERSHIP OF CERTAIN BENEFICIAL OWNERS AND MANAGEMENT AND RELATED STOCKHOLDER MATTERS
The following table sets forth certain information regarding beneficial ownership as of March 2, 2016:
• | by each person who is known by us to beneficially own more than 5% of the outstanding shares of our common stock; |
• | by each director of our company; |
• | by each of the named executive officers and |
• | by all directors and executive officers of our company as a group. |
Amount and Nature of Beneficial Ownership | |||
Name and Address of Beneficial Owner (1) | Number | Percent | |
Praesidium Investment Management Company, LLC (2) 747 Third Avenue, 35th floor New York, NY 10017 | 6,786,324 | 13.5% | |
BlackRock, Inc. (3) 40 East 52nd Street New York, NY 10022 | 5,459,059 | 10.9% | |
The Vanguard Group, Inc. (4) 1000 Vanguard Blvd. Malvern, PA 19355 | 3,690,506 | 7.3% | |
T. Rowe Price Associates, Inc. (5) 100 East Pratt Street Baltimore, MD 21202 | 2,993,037 | 5.9% | |
Michael Benedict (6) | 43,273 | * | |
Barry N. Bycoff (7) | 48,344 | * | |
John R. Egan (8) | 106,175 | * | |
Ram Gupta (9) | 12,394 | * | |
Charles F. Kane (10) | 85,651 | * | |
David A. Krall (11) | 70,611 | * | |
Michael L. Mark (12) | 323,832 | * | |
Philip M. Pead (13) | 469,487 | * | |
Chris E. Perkins (14) | 124,940 | * | |
Matthew Robinson (15) | 5,567 | * | |
Jerry Rulli (16) | 8,021 | * | |
All executive officers and directors as a group (11 persons) (17) | 1,298,295 | 2.6% | |
______________
* Less than 1%
(1) | All persons named in the table have sole voting and investment power with respect to all shares of our common stock shown as beneficially owned by them, subject to community property laws where applicable and subject to the other information contained in the footnotes to this table. Unless otherwise noted the address of such person is c/o Progress Software Corporation, 14 Oak Park, Bedford, Massachusetts 01730. |
(2) | Derived from Form 3 and Schedule 13D filed on January 11, 2016. The Schedule 13D reported that Praesidium, in its capacity as investment manager to certain managed accounts and investment fund vehicles on behalf of investment advisory clients, has sole power to vote 6,430,842 shares and sole power to dispose of 6,786,324 shares. Kevin Oram and Peter Uddo, as managing members of Praesidium, may be deemed to control Praesidium. |
(3) | Derived from Schedule 13G/A filed on January 8, 2016. The Schedule 13G/A reported that BlackRock, Inc. had sole voting power over 5,321,222, shares and sole dispositive power with respect to all shares reported. |
(4) | Derived from Schedule 13G/A filed on February 10, 2016. The Schedule 13G/A reported that The Vanguard Group held sole voting power over 66,382 shares, sole dispositive power over 3,625,367 shares and shared dispositive power over 65,139 shares. |
(5) | Derived from Schedule 13G/A filed on February 10, 2016. The Schedule 13G/A reported that T. Rowe Price held sole voting power over 657,320 shares and sole dispositive power over 2,993,037 shares. According to the Schedule 13G/A, these shares are owned by various individual and institutional investors which T. Rowe Price serves as investment adviser with power to direct investments and/or sole power to vote the shares. |
(6) | Includes 6,000 shares issuable upon the exercise of outstanding options that are exercisable within 60 days of March 2, 2016 and 6,421 shares issuable upon vesting of RSUs that will vest within 60 days of March 2, 2016. |
-44-
(7) | Includes 5,664 shares issuable upon the exercise of outstanding options that are exercisable within 60 days of March 2, 2016 and 16,420 fully vested deferred stock units. |
(8) | Includes 72,632 shares issuable upon the exercise of outstanding options that are exercisable within 60 days of March 2, 2016 and 7,236 fully vested deferred stock units. |
(9) | Includes 4,630 fully vested deferred stock units. |
(10) | Includes 7,705 shares issuable upon the exercise of outstanding options that are exercisable within 60 days of March 2, 2016 and 19,483 fully vested deferred stock units. |
(11) | Includes 7,705 shares issuable upon the exercise of outstanding options that are exercisable within 60 days of March 2, 2016 and 5,547 fully vested deferred stock units. |
(12) | Includes 146,649 shares issuable upon the exercise of outstanding options that are exercisable within 60 days of March 2, 2016 and 7,110 fully vested deferred stock units. |
(13) | Includes 15,069 shares issuable upon the exercise of outstanding options that are exercisable within 60 days of March 2, 2016, 104,478 shares issuable upon vesting of RSUs that will vest within 60 days of March 2, 2016 and 14,472 fully vested deferred stock units. |
(14) | Includes 32,327 shares issuable upon vesting of RSUs that will vest within 60 days of March 2, 2016. |
(15) | Includes 2,542 shares issuable upon vesting of RSUs that will vest within 60 days of March 2, 2016. |
(16) | Includes 3,425 shares issuable upon vesting of RSUs that will vest within 60 days of March 2, 2016. |
(17) | Includes 261,424 shares issuable upon the exercise of outstanding options that are exercisable within 60 days of March 2, 2016, 149,193 shares issuable upon vesting of RSUs that will vest within 60 days of March 2, 2016 and 74,898 fully vested deferred stock units. |
Information related to securities authorized for issuance under equity compensation plans as of November 30, 2015 is as follows (in thousands, except per share data):
Plan Category | Number of Securities to be Issued Upon Exercise of Outstanding Options, Warrants, and Rights | Weighted-average Exercise Price of Outstanding Options, Warrants and Rights | Number of Securities Remaining Available for Future Issuance | ||||
Equity compensation plans approved by stockholders (1) | 2,278 | (2) | 20.24 | 6,180 | (3) | ||
Equity compensation plans not approved by stockholders (4) | 200 | 27.99 | 1,441 | ||||
Total | 2,478 | 22.35 | 7,621 | ||||
______________
(1) | Consists of the 1992 Incentive and Nonqualified Stock Option Plan, 1994 Stock Incentive Plan, 1997 Stock Incentive Plan, 2008 Stock Option and Incentive Plan, and 1991 Employee Stock Purchase Plan (ESPP). |
(2) | Includes 1,743,000 restricted stock units under our 2008 Plan. Does not include purchase rights accruing under the ESPP because the purchase price (and therefore the number of shares to be purchased) will not be determined until the end of the purchase period. |
(3) | Includes 501,000 shares available for future issuance under the ESPP. |
(4) | Consists of the 2002 Nonqualified Stock Plan and the 2004 Inducement Plan described below. |
We have adopted two equity compensation plans, the 2002 Nonqualified Stock Plan and the 2004 Inducement Stock Plan, for which the approval of stockholders was not required. We intend that the 2004 Inducement Stock Plan be reserved for persons to whom we may issue securities as an inducement to become employed by us pursuant to the rules and regulations of NASDAQ. Executive officers and members of the Board of Directors are not eligible for awards under the 2002 Nonqualified Stock Plan. An executive officer would be eligible to receive an award under the 2004 Inducement Stock Plan only as an inducement to join us. Awards under the 2002 Nonqualified Stock Plan and the 2004 Inducement Stock Plan may include nonqualified stock options, grants of conditioned stock, unrestricted grants of stock, grants of stock contingent upon the attainment of performance goals and stock appreciation rights. A total of 11,250,000 shares are issuable under the two plans, of which 1,440,994 shares are available for future issuance as of November 30, 2015.
-45-
ITEM 13. CERTAIN RELATIONSHIPS AND RELATED TRANSACTIONS, AND DIRECTOR INDEPENDENCE
Review, Approval or Ratification of Transactions with Related Persons | ||||
Pursuant to the Audit Committee’s Charter, which can be found at www.progress.com under the Corporate Governance page located on the “Company Info/Who We Are” page, the Audit Committee is responsible for the review and approval of related person transactions. A related person is a director, executive officer, nominee for director or certain stockholders of our company since the beginning of the last fiscal year and their respective immediate family members. A related person transaction is a transaction involving: (1) our company and any related person when the amount involved exceeds $120,000, and (2) the related person has a material direct or indirect interest.
We identify transactions for review and approval through our Code of Ethics and Business Conduct which can be found at www.progress.com under the Corporate Governance page located on the “Company Info/Who We Are” page. The Code of Ethics and Business Conduct requires our employees to disclose any potential or actual conflicts of interest to his or her manager, our human capital department or our Chief Compliance Officer. This disclosure also applies to potential conflicts involving immediate family members of employees. We require our directors to complete a questionnaire intended to identify any transactions or potential transactions that must be reported according to SEC rules and regulations. This questionnaire also requires our directors to promptly notify us of any changes during the course of the year.
Transactions with Related Persons | ||||
Neither the company nor its subsidiaries engaged in any transactions or series of similar transactions in which the amount involved exceeded $120,000 and in which any of our directors or executive officers, any holder of more than 5% of any class of our voting securities or any member of the immediate family of any of the foregoing persons had a direct or indirect material interest, nor are any such transactions currently proposed.
Independence of Members of our Board of Directors | ||||
We have determined that all of our current directors except Mr. Pead (our current President and Chief Executive Officer) are independent within the meaning of the director independence standards of NASDAQ and the applicable rules of the SEC. In making this determination, we solicited information from each of the directors regarding whether that director, or any member of his immediate family, had a direct or indirect material interest in any transactions involving our company, was involved in a debt relationship with our company or received personal benefits outside the scope of the director’s normal compensation. We considered the responses of the directors, and independently considered the commercial agreements, acquisitions and other material transactions entered into by us during 2015, and determined that none of our non-employee directors had a material interest in those transactions.
-46-
ITEM 14. PRINCIPAL ACCOUNTING FEES AND SERVICES
Selection of Independent Registered Public Accounting Firm | ||||
The Audit Committee has selected the firm of Deloitte & Touche LLP, independent registered public accounting firm, to serve as our independent registered public accounting firm for the fiscal year ending November 30, 2015.
Independent Registered Public Accounting Firm Fees | ||||
Aggregate fees billed to us for services performed for the fiscal years ended November 30, 2015 and November 30, 2014 by our independent registered public accounting firm, Deloitte & Touche LLP, were as follows:
2015 | 2014 | ||||
Audit Fees (1) | $ | 2,394,392 | $ | 1,945,917 | |
Tax Fees (2) | 57,829 | 310,468 | |||
Audit-Related Fees(3) | 532,256 | 405,200 | |||
All Other Fees(4) | 0 | 2,600 | |||
__________
(1) | Represents fees billed for each of the last two fiscal years for professional services rendered for the audit of our annual financial statements included in Form 10-K and reviews of financial statements included in our interim filings on Form 10-Q, as well as statutory audit fees related to our wholly-owned foreign subsidiaries. In accordance with the policy on Audit Committee pre-approval, 100% of audit services provided by the independent registered public accounting firm are pre-approved. |
(2) | Includes fees primarily for tax services. In accordance with the policy on Audit Committee pre-approval, 100% of tax services provided by the independent registered public accounting firm are pre-approved. |
(3) | Represents fees billed for due diligence services in connection with the acquisition of Telerik AD. |
(4) | Represents fees billed for the subscription to an online accounting tool. |
Policy on Audit Committee Pre-Approval of Audit and Permissible Non-Audit Services of Independent Registered Public Accounting Firm | ||||
The Audit Committee is responsible for appointing, setting compensation, and overseeing the work of our independent registered public accounting firm. The Audit Committee has established a policy regarding pre-approval of all audit and permissible non-audit services provided by the independent registered public accounting firm.
Requests for specific services by the independent registered public accounting firm which comply with the auditor services policy are reviewed by our Finance, Tax, and Internal Audit departments. Requests approved by the group are aggregated and submitted to the Audit Committee in one of the following ways:
• | Request for approval of services at a meeting of the Audit Committee; or |
• | Request for approval of services by the Chairman of the Audit Committee and then the approval by the full committee at the next meeting of the Audit Committee. |
The request may be made with respect to either specific services or a type of service for predictable or recurring services.
-47-
PART IV
ITEM 15. EXHIBITS, FINANCIAL STATEMENT SCHEDULES
(b) Exhibits
Documents listed below, except for documents followed by parenthetical numbers, are being filed as exhibits. Documents followed by parenthetical numbers are not being filed herewith and, pursuant to Rule 12b-32 of the General Rules and Regulations promulgated by the SEC under the Securities Exchange Act of 1934 (the Act), reference is made to such documents as previously filed as exhibits with the SEC. Our file number under the Act is 0-19417.
-48-
2.1 | Securities Purchase Agreement, dated October 21, 2014, by and among Progress Software Corporation, Telerik AD, the Sellers identified therein, and the Securityholder Representative (1) |
2.2 | Plan of Domestication (2) |
3.1 | Certificate of Conversion from Non-Delaware Corporation to Delaware Corporation (3) |
3.2 | Certificate of Incorporation (4) |
3.2.1 | Certificate of Correction to Certification of Incorporation |
3.3 | Amended and Restated By-Laws (5) |
4.1 | Specimen certificate for the Common Stock (6) |
10.1* | 1992 Incentive and Nonqualified Stock Option Plan (7) |
10.2* | 1994 Stock Incentive Plan (8) |
10.3* | 1997 Stock Incentive Plan, as amended and restated (9) |
10.4* | Employee Retention and Motivation Agreement as amended and restated, executed by each of the Executive Officers (other than the Chief Executive Officer) (10) |
10.5*+ | 2002 Nonqualified Stock Plan, as amended and restated |
10.6*+ | 2004 Inducement Stock Plan, as amended and restated |
10.7* | Progress Software Corporation 1991 Employee Stock Purchase Plan, as amended and restated (11) |
10.8* | Progress Software Corporation 2008 Stock Option and Incentive Plan, as amended and restated (12) |
10.9* | Form of Notice of Grant of Stock Options and Grant Agreement under the Progress Software Corporation 2008 Stock Option and Incentive Plan (13) |
10.10* | Progress Software Corporation Corporate Executive Bonus Plan (14) |
10.11* | Progress Software Corporation 2015 Fiscal Year Non-Employee Directors Compensation Program (15) |
10.12* | Form of Deferred Stock Unit Agreement under the Progress Software Corporation 2008 Stock Option and Incentive Plan (16) |
10.13* | Form of Non-Qualified Stock Option Agreement for Non-Employee Directors under the Progress Software Corporation 2008 Stock Option and Incentive Plan (Initial Grant) (17) |
10.14* | Form of Non-Qualified Stock Option Agreement for Non-Employee Directors under the Progress Software Corporation 2008 Stock Option and Incentive Plan (Annual Grant) (18) |
10.15* | Form of Restricted Stock Unit Agreement under the Progress Software Corporation 2008 Stock Option and Incentive Plan (19) |
10.16* | Credit Agreement, dated as of December 2, 2014, by and among Progress Software Corporation, each of the lenders party thereto, JPMorgan Chase Bank, N.A., as Administrative Agent, Wells Fargo Bank, N.A. and Citizens Bank, N.A., as Syndication Agents, and Bank of America, N.A., Citibank, N.A. and Silicon Valley Bank, as Documentation Agents, and J.P. Morgan Securities LLC, as Sole Bookrunner and Sole Lead Arranger (20) |
10.17* | Employment Agreement, dated December 7, 2012, by and between Progress Software Corporation and Philip M. Pead (21) |
10.18* | Employee Retention and Motivation Agreement, dated as of December 7, 2012, by and between Progress Software Corporation and Philip M. Pead (22) |
10.19* | Employment Agreement, dated January 1, 2013, by and between Progress Software Corporation and Chris E. Perkins (23) |
21.1+ | List of Subsidiaries of the Registrant |
23.1+ | Consent of Deloitte & Touche LLP, Independent Registered Public Accounting Firm |
31.1 | Certification Pursuant to Section 302 of the Sarbanes-Oxley Act of 2002 - Philip M. Pead |
31.2 | Certification Pursuant to Section 302 of the Sarbanes-Oxley Act of 2002 - Chris E. Perkins |
32.1+ | Certification Pursuant to Section 906 of the Sarbanes-Oxley Act of 2002 |
101++ | The following materials from Progress Software Corporation’s Annual Report on Form 10-K for the year ended November 30, 2013, formatted in XBRL (eXtensible Business Reporting Language): (i) Consolidated Balance Sheets as of November 30, 2013 and 2012, (ii) Consolidated Statements of Income for the years ended November 30, 2013, 2012 and 2011, (iii) Consolidated Statements of Comprehensive Income for the years ended November 30, 2013, 2012 and 2011, (iv) Consolidated Statements of Shareholders’ Equity for the years ended November 30, 2013, 2012 and 2011, and (v) Consolidated Statements of Cash Flows for the years ended November 30, 2013, 2012 and 2011. |
-49-
(1) | Incorporated by reference to Exhibit 2.1 of our Current Report on Form 8-K filed on October 27, 2014. |
(2) | Incorporated by reference to Exhibit 2.1 of our Current Report on Form 8-K filed on May 14, 2015. |
(3) | Incorporated by reference to Exhibit 3.1 of our Current Report on Form 8-K filed on May 14, 2015. |
(4) | Incorporated by reference to Exhibit 3.2 of our Current Report on Form 8-K filed on May 14, 2015. |
(5) | Incorporated by reference to Exhibit 3.4 of our Current Report on Form 8-K filed on May 14, 2015. |
(6) | Incorporated by reference to Exhibit 4.1 of our Annual Report on Form 10-K for the year ended November 30, 2011. |
(7) | Incorporated by reference to Exhibit 10.1 of our Annual Report on Form 10-K for the year ended November 30, 2009. |
(8) | Incorporated by reference to Exhibit 10.2 of our Annual Report on Form 10-K for the year ended November 30, 2009. |
(9) | Incorporated by reference to Exhibit 10.3 of our Annual Report on Form 10-K for the year ended November 30, 2012. |
(10) | Incorporated by reference to Exhibit 10.4 of our Annual Report on Form 10-K for the year ended November 30, 2013. |
(11) | Incorporated by reference to Annex B to our definitive Proxy Statement filed April 20, 2012. |
(12) | Incorporated by reference to Annex A to our definitive Proxy Statement filed May 7, 2013. |
(13) | Incorporated by reference to Exhibit 10.9 of our Annual Report on Form 10-K for the year ended November 30, 2013. |
(14) | Incorporated by reference to Exhibit 10.10 of our Annual Report on Form 10-K for the year ended November 30, 2012. |
(15) | Incorporated by reference to Exhibit 10.1 of our Quarterly Report on Form 10-Q for the quarter ended February 28, 2015. |
(16) | Incorporated by reference to Exhibit 10.12 of our Annual Report on Form 10-K for the year ended November 30, 2013. |
(17) | Incorporated by reference to Exhibit 10.13 of our Annual Report on Form 10-K for the year ended November 30, 2013. |
(18) | Incorporated by reference to Exhibit 10.14 of our Annual Report on Form 10-K for the year ended November 30, 2013. |
(19) | Incorporated by reference to Exhibit 10.15 of our Annual Report on Form 10-K for the year ended November 30, 2014. |
(20) | Incorporated by reference to Exhibit 10.1 to our Current Report on Form 8-K filed December 5, 2014. |
(21) | Incorporated by reference to Exhibit 10.1 to Form 8-K filed on December 13, 2012. |
(22) | Incorporated by reference to Exhibit 10.2 to Form 8-K filed on December 13, 2012. |
(23) | Incorporated by reference to Exhibit 10.1 to Form 8-K filed on January 8, 2013. |
* | Management contract or compensatory plan or arrangement in which an executive officer or director of Progress Software Corporation participates. |
** | Pursuant to Rule 406T of Regulations S-T, the Interactive Data Files on Exhibit 101 hereto are deemed not filed or part of a registration statement or prospectus of Sections 11 or 12 of the Securities Act of 1933, as amended, are deemed not filed for purposes of Section 18 of the Securities and Exchange Act of 1934, as amended, and otherwise are not subject to liability under those sections. |
-50-
SIGNATURES
Pursuant to the requirements of Section 13 or 15(d) of the Securities Exchange Act of 1934, the registrant has duly caused this report to be signed on its behalf by the undersigned, thereunto duly authorized, on the 29th day of March, 2016.
PROGRESS SOFTWARE CORPORATION
By: /s/ Philip M. Pead
Philip M. Pead
President and Chief Executive Officer
-51-
Exhibit 31.1
CERTIFICATION
I, Philip M. Pead, certify that:
1. I have reviewed this annual report on Form 10-K/A of Progress Software Corporation;
2. Based on my knowledge, this report does not contain any untrue statement of a material fact or omit to state a material fact necessary to make the statements made, in light of the circumstances under which such statements were made, not misleading with respect to the period covered by this report;
Date: March 29, 2016
By: /s/ Philip M. Pead
Philip M. Pead
President and Chief Executive Officer
(Principal Executive Officer)
-52-
Exhibit 31.2
CERTIFICATION
I, Chris E. Perkins, certify that:
1. I have reviewed this annual report on Form 10-K/A of Progress Software Corporation;
2. Based on my knowledge, this report does not contain any untrue statement of a material fact or omit to state a material fact necessary to make the statements made, in light of the circumstances under which such statements were made, not misleading with respect to the period covered by this report;
Date: March 29, 2016
By: /s/ Chris E. Perkins
Chris E. Perkins
Chief Financial Officer
-53-
EXHIBIT INDEX | |
2.1 | Securities Purchase Agreement, dated October 21, 2014, by and among Progress Software Corporation, Telerik AD, the Sellers identified therein, and the Securityholder Representative (1) |
2.2 | Plan of Domestication (2) |
3.1 | Certificate of Conversion from Non-Delaware Corporation to Delaware Corporation (3) |
3.2 | Certificate of Incorporation (4) |
3.2.1 | Certificate of Correction to Certification of Incorporation |
3.3 | Amended and Restated By-Laws (5) |
4.1 | Specimen certificate for the Common Stock (6) |
10.1* | 1992 Incentive and Nonqualified Stock Option Plan (7) |
10.2* | 1994 Stock Incentive Plan (8) |
10.3* | 1997 Stock Incentive Plan, as amended and restated (9) |
10.4* | Employee Retention and Motivation Agreement as amended and restated, executed by each of the Executive Officers (other than the Chief Executive Officer) (10) |
10.5*+ | 2002 Nonqualified Stock Plan, as amended and restated |
10.6*+ | 2004 Inducement Stock Plan, as amended and restated |
10.7* | Progress Software Corporation 1991 Employee Stock Purchase Plan, as amended and restated (11) |
10.8* | Progress Software Corporation 2008 Stock Option and Incentive Plan, as amended and restated (12) |
10.9* | Form of Notice of Grant of Stock Options and Grant Agreement under the Progress Software Corporation 2008 Stock Option and Incentive Plan (13) |
10.10* | Progress Software Corporation Corporate Executive Bonus Plan (14) |
10.11* | Progress Software Corporation 2015 Fiscal Year Non-Employee Directors Compensation Program (15) |
10.12* | Form of Deferred Stock Unit Agreement under the Progress Software Corporation 2008 Stock Option and Incentive Plan (16) |
10.13* | Form of Non-Qualified Stock Option Agreement for Non-Employee Directors under the Progress Software Corporation 2008 Stock Option and Incentive Plan (Initial Grant) (17) |
10.14* | Form of Non-Qualified Stock Option Agreement for Non-Employee Directors under the Progress Software Corporation 2008 Stock Option and Incentive Plan (Annual Grant) (18) |
10.15* | Form of Restricted Stock Unit Agreement under the Progress Software Corporation 2008 Stock Option and Incentive Plan (19) |
10.16* | Credit Agreement, dated as of December 2, 2014, by and among Progress Software Corporation, each of the lenders party thereto, JPMorgan Chase Bank, N.A., as Administrative Agent, Wells Fargo Bank, N.A. and Citizens Bank, N.A., as Syndication Agents, and Bank of America, N.A., Citibank, N.A. and Silicon Valley Bank, as Documentation Agents, and J.P. Morgan Securities LLC, as Sole Bookrunner and Sole Lead Arranger (20) |
10.17* | Employment Agreement, dated December 7, 2012, by and between Progress Software Corporation and Philip M. Pead (21) |
10.18* | Employee Retention and Motivation Agreement, dated as of December 7, 2012, by and between Progress Software Corporation and Philip M. Pead (22) |
10.19* | Employment Agreement, dated January 1, 2013, by and between Progress Software Corporation and Chris E. Perkins (23) |
21.1+ | List of Subsidiaries of the Registrant |
23.1+ | Consent of Deloitte & Touche LLP, Independent Registered Public Accounting Firm |
31.1 | Certification Pursuant to Section 302 of the Sarbanes-Oxley Act of 2002 - Philip M. Pead |
31.2 | Certification Pursuant to Section 302 of the Sarbanes-Oxley Act of 2002 - Chris E. Perkins |
32.1+ | Certification Pursuant to Section 906 of the Sarbanes-Oxley Act of 2002 |
101++ | The following materials from Progress Software Corporation’s Annual Report on Form 10-K for the year ended November 30, 2013, formatted in XBRL (eXtensible Business Reporting Language): (i) Consolidated Balance Sheets as of November 30, 2013 and 2012, (ii) Consolidated Statements of Income for the years ended November 30, 2013, 2012 and 2011, (iii) Consolidated Statements of Comprehensive Income for the years ended November 30, 2013, 2012 and 2011, (iv) Consolidated Statements of Shareholders’ Equity for the years ended November 30, 2013, 2012 and 2011, and (v) Consolidated Statements of Cash Flows for the years ended November 30, 2013, 2012 and 2011. |
-54-
(1) | Incorporated by reference to Exhibit 2.1 of our Current Report on Form 8-K filed on October 27, 2014. |
(2) | Incorporated by reference to Exhibit 2.1 of our Current Report on Form 8-K filed on May 14, 2015. |
(3) | Incorporated by reference to Exhibit 3.1 of our Current Report on Form 8-K filed on May 14, 2015. |
(4) | Incorporated by reference to Exhibit 3.2 of our Current Report on Form 8-K filed on May 14, 2015. |
(5) | Incorporated by reference to Exhibit 3.4 of our Current Report on Form 8-K filed on May 14, 2015. |
(6) | Incorporated by reference to Exhibit 4.1 of our Annual Report on Form 10-K for the year ended November 30, 2011. |
(7) | Incorporated by reference to Exhibit 10.1 of our Annual Report on Form 10-K for the year ended November 30, 2009. |
(8) | Incorporated by reference to Exhibit 10.2 of our Annual Report on Form 10-K for the year ended November 30, 2009. |
(9) | Incorporated by reference to Exhibit 10.3 of our Annual Report on Form 10-K for the year ended November 30, 2012. |
(10) | Incorporated by reference to Exhibit 10.4 of our Annual Report on Form 10-K for the year ended November 30, 2013. |
(11) | Incorporated by reference to Annex B to our definitive Proxy Statement filed April 20, 2012. |
(12) | Incorporated by reference to Annex A to our definitive Proxy Statement filed May 7, 2013. |
(13) | Incorporated by reference to Exhibit 10.9 of our Annual Report on Form 10-K for the year ended November 30, 2013. |
(14) | Incorporated by reference to Exhibit 10.10 of our Annual Report on Form 10-K for the year ended November 30, 2012. |
(15) | Incorporated by reference to Exhibit 10.1 of our Quarterly Report on Form 10-Q for the quarter ended February 28, 2015. |
(16) | Incorporated by reference to Exhibit 10.12 of our Annual Report on Form 10-K for the year ended November 30, 2013. |
(17) | Incorporated by reference to Exhibit 10.13 of our Annual Report on Form 10-K for the year ended November 30, 2013. |
(18) | Incorporated by reference to Exhibit 10.14 of our Annual Report on Form 10-K for the year ended November 30, 2013. |
(19) | Incorporated by reference to Exhibit 10.15 of our Annual Report on Form 10-K for the year ended November 30, 2014. |
(20) | Incorporated by reference to Exhibit 10.1 to our Current Report on Form 8-K filed December 5, 2014. |
(21) | Incorporated by reference to Exhibit 10.1 to Form 8-K filed on December 13, 2012. |
(22) | Incorporated by reference to Exhibit 10.2 to Form 8-K filed on December 13, 2012. |
(23) | Incorporated by reference to Exhibit 10.1 to Form 8-K filed on January 8, 2013. |
* | Management contract or compensatory plan or arrangement in which an executive officer or director of Progress Software Corporation participates. |
** | Pursuant to Rule 406T of Regulations S-T, the Interactive Data Files on Exhibit 101 hereto are deemed not filed or part of a registration statement or prospectus of Sections 11 or 12 of the Securities Act of 1933, as amended, are deemed not filed for purposes of Section 18 of the Securities and Exchange Act of 1934, as amended, and otherwise are not subject to liability under those sections. |
-55-