Attached files
| file | filename |
|---|---|
| 8-K - 8-K - OGLETHORPE POWER CORP | a2228043z8-k.htm |
Exhibit 99.1
Fourth Quarter and Year End 2015 Investor Briefing
Notice to Recipients Cautionary Note Regarding Forward Looking Statements Certain of the information contained in this presentation, including certain of the statements made by representatives of Oglethorpe Power Corporation (An Electric Membership Corporation) (“Oglethorpe”), that are not historical facts are forward-looking statements. Although Oglethorpe believes that in making these forward-looking statements its expectations are based on reasonable assumptions, Oglethorpe cautions the reader not to put undue reliance on these forward-looking statements, which are not guarantees of future performance. Forward-looking statements involve uncertainties and there are important factors, many of which are outside management’s control, which could cause actual results to differ materially from those expressed or implied by these forward-looking statements. Some of the risks, uncertainties and assumptions that may cause actual results to differ from these forward-looking statements are described under the headings “Cautionary Statement Regarding Forward-Looking Statements” and “Item 1A – Risk Factors” in our Annual Report on Form 10-K for the fiscal year ended December 31, 2015, filed with the Securities and Exchange Commission on March 29, 2016. This electronic presentation is provided as of March 29, 2016. If you are viewing this presentation after that date, there may have been events that occurred subsequent to such date that would have a material adverse effect on the information that was presented. Oglethorpe undertakes no obligation to publicly update any forward-looking statements. Non-GAAP Financial Measures This electronic presentation contains certain non-GAAP financial measures, as defined under Regulation G of the rules and regulations of the SEC. For purposes of Regulation G, a “non-GAAP financial measure” is a numerical measure of a registrant’s historical or future financial performance, financial position or cash flows that excludes amounts, or is subject to adjustments that have the effect of excluding amounts, that are included in the most directly comparable measure calculated and presented in accordance with GAAP in the statement of operations, balance sheet or statement of cash flows of the registrant; or includes amounts, or is subject to adjustments that have the effect of including amounts, that are excluded from the most directly comparable measure so calculated and presented. For purposes of the definition, GAAP refers to generally accepted accounting principles in the United States. Pursuant to the requirements of Regulation G, Oglethorpe has provided, as a part of this electronic presentation, a reconciliation of each of the non-GAAP financial measures to the most directly comparable GAAP financial measure. 2
System Overview 2015 Highlights Clean Power Plan Vogtle 3 & 4 Construction Update Operations Update Member Power Supply and System Update Financing & Liquidity Update 2015 Financial and Operational Results Presenters and Agenda Mike Price Executive Vice President and Chief Operating Officer Betsy Higgins Executive Vice President and Chief Financial Officer Mike Smith President and Chief Executive Officer 3

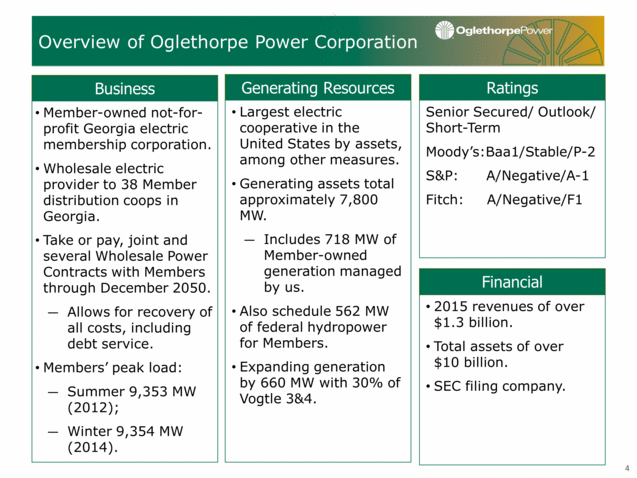
Overview of Oglethorpe Power Corporation Business Generating Resources Ratings Member-owned not-for-profit Georgia electric membership corporation. Wholesale electric provider to 38 Member distribution coops in Georgia. Take or pay, joint and several Wholesale Power Contracts with Members through December 2050. Allows for recovery of all costs, including debt service. Members’ peak load: Summer 9,353 MW (2012); Winter 9,354 MW (2014). Largest electric cooperative in the United States by assets, among other measures. Generating assets total approximately 7,800 MW. Includes 718 MW of Member-owned generation managed by us. Also schedule 562 MW of federal hydropower for Members. Expanding generation by 660 MW with 30% of Vogtle 3&4. Senior Secured/ Outlook/ Short-Term Moody’s:Baa1/Stable/P-2 S&P: A/Negative/A-1 Fitch: A/Negative/F1 Financial 2015 revenues of over $1.3 billion. Total assets of over $10 billion. SEC filing company. 4
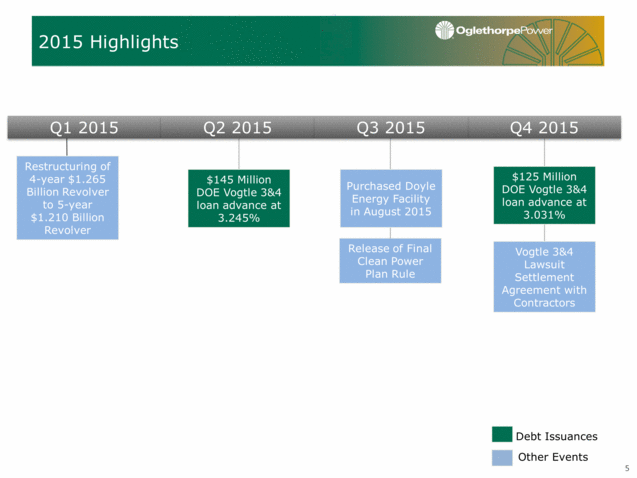
2015 Highlights Debt Issuances Other Events Q1 2015 Q4 2015 Q2 2015 Q3 2015 5 $145 Million DOE Vogtle 3&4 loan advance at 3.245% $125 Million DOE Vogtle 3&4 loan advance at 3.031% Restructuring of 4-year $1.265 Billion Revolver to 5-year $1.210 Billion Revolver Vogtle 3&4 Lawsuit Settlement Agreement with Contractors Release of Final Clean Power Plan Rule Purchased Doyle Energy Facility in August 2015
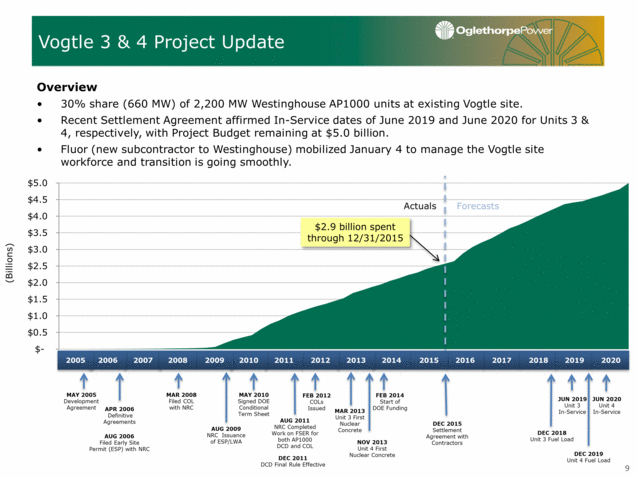
Oglethorpe has a team in place which began analyzing and responding to this rule (released in August 2015). The final rule is generally better than draft rule for Georgia. Supreme Court stayed implementation of the CPP on February 9th. Oral arguments in D.C. Circuit Court scheduled for June; could rule by end of June. Decision expected to be appealed to Supreme Court – Fall 2016. Unlike some states who were “just saying no”, Georgia plans to develop a state implementation plan, although these efforts are now on hold pending litigation. Oglethorpe is a named party in litigation of the CPP (through NRECA) and is supporting litigation through other organizations. Clean Power Plan Lowest Highest Georgia Rank Draft Rule 215 1,783 834 6th Final Rule 771 1,305 1,049 28th Range of State Targets (2030) lbs CO2 / MWh 6
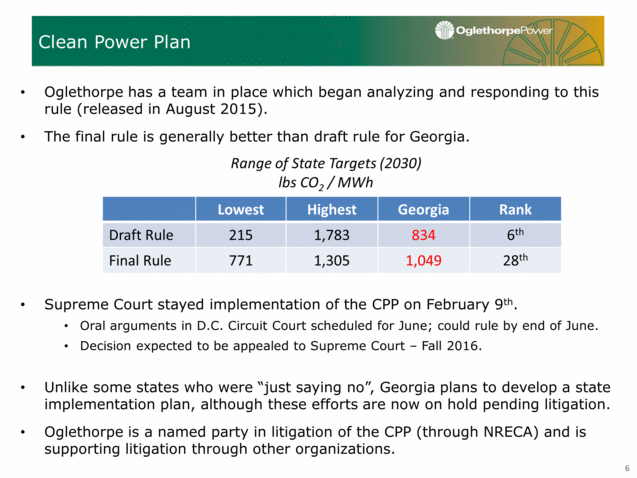
2015 Capacity Fuel Mix Has Shifted Away From Coal Towards Gas and Nuclear Note: Capacity and energy includes Oglethorpe and Smarr EMC resources. Capacity reflects summer reserve planning capacity. Member Sales Member & Non-Member Sales 2011 Energy 2008 Capacity 2011 Capacity Other Other 2008 Energy (100% Member Sales) 7 2015 Energy 20% 50% 25% 5% 33% 42% 20% 5% 14% 45% 36% 5% 24% 40% 32% 4% 40% 20% 25% 12% 3% 55% 15% 20% 10% 7% 39% 45% 5% 4%
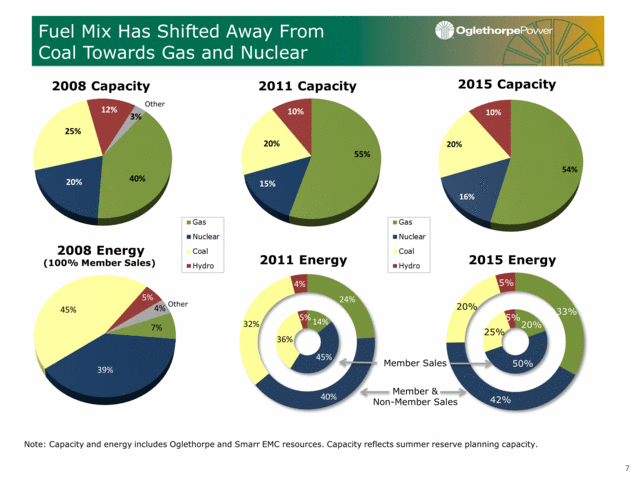
MWh Renewable Resources 8 Members’ Total Renewable Portfolio 0 100,000 200,000 300,000 400,000 500,000 600,000 700,000 800,000 900,000 2005 2006 2007 2008 2009 2010 2011 2012 2013 2014 2015 2016 2017 Taylor County-Landfill Wolf Creek-Landfill Pecan Row-Landfill Other Landfill Tallassee-Hydro Rabun GAP-Biomass Rooker-Solar Clean Control-Solar Chem-Nut-Solar 20MW Hazlehurst-Solar 52MW Hazlehurst-Solar Azalea-Solar Sandy Hills-Solar Local Solar
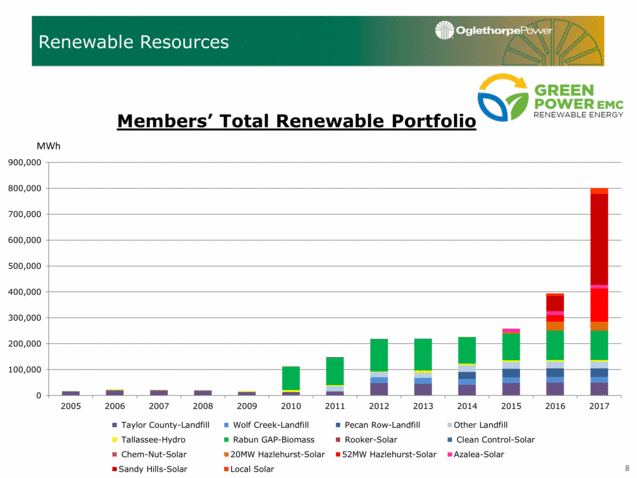
Overview 30% share (660 MW) of 2,200 MW Westinghouse AP1000 units at existing Vogtle site. Recent Settlement Agreement affirmed In-Service dates of June 2019 and June 2020 for Units 3 & 4, respectively, with Project Budget remaining at $5.0 billion. Fluor (new subcontractor to Westinghouse) mobilized January 4 to manage the Vogtle site workforce and transition is going smoothly. Vogtle 3 & 4 Project Update $2.9 billion spent through 12/31/2015 Actuals Forecasts DEC 2011 DCD Final Rule Effective MAY 2005 Development Agreement MAR 2008 Filed COL with NRC APR 2006 Definitive Agreements MAY 2010 Signed DOE Conditional Term Sheet AUG 2006 Filed Early Site Permit (ESP) with NRC AUG 2009 NRC Issuance of ESP/LWA AUG 2011 NRC Completed Work on FSER for both AP1000 DCD and COL FEB 2012 COLs Issued MAR 2013 Unit 3 First Nuclear Concrete FEB 2014 Start of DOE Funding NOV 2013 Unit 4 First Nuclear Concrete 2017 2016 2015 2014 2013 2012 2011 2010 2009 2007 2008 2018 2006 2005 2019 2020 JUN 2020 Unit 4 In-Service DEC 2015 Settlement Agreement with Contractors DEC 2018 Unit 3 Fuel Load DEC 2019 Unit 4 Fuel Load JUN 2019 Unit 3 In-Service 9 $- $0.5 $1.0 $1.5 $2.0 $2.5 $3.0 $3.5 $4.0 $4.5 $5.0 (Billions)
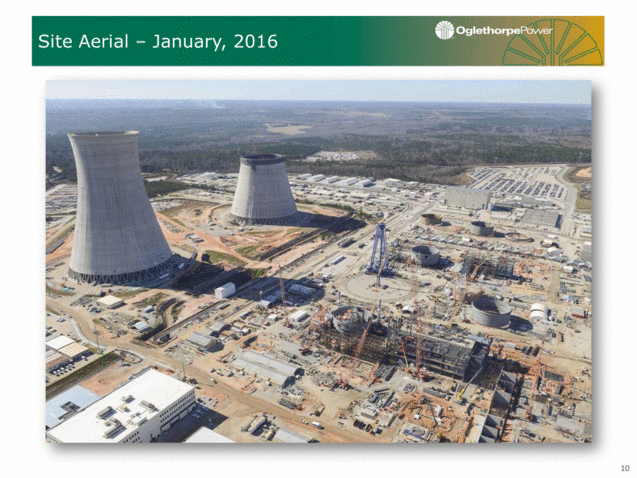
Site Aerial – January, 2016 500kV Switchyard 10
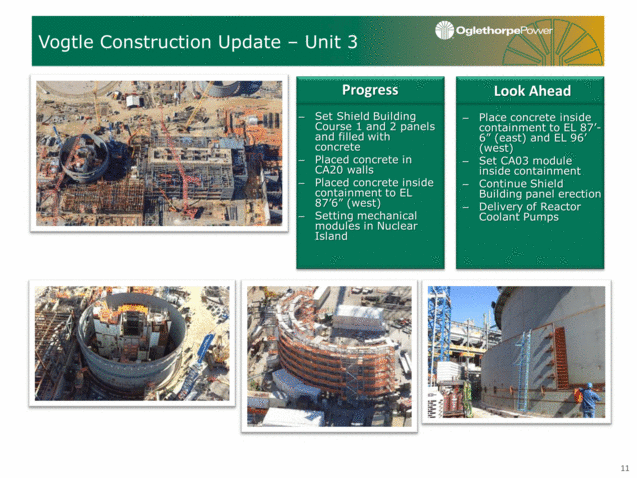
Vogtle Construction Update – Unit 3 Set Shield Building Course 1 and 2 panels and filled with concrete Placed concrete in CA20 walls Placed concrete inside containment to EL 87’6” (west) Setting mechanical modules in Nuclear Island Progress Look Ahead Place concrete inside containment to EL 87’-6” (east) and EL 96’ (west) Set CA03 module inside containment Continue Shield Building panel erection Delivery of Reactor Coolant Pumps 11
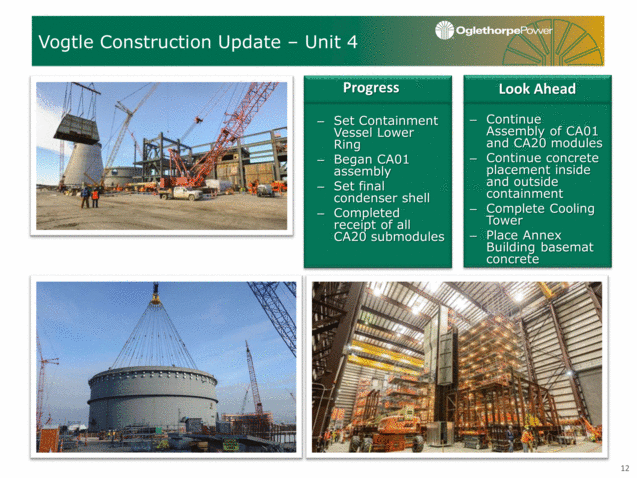
Vogtle Construction Update – Unit 4 Progress Look Ahead Set Containment Vessel Lower Ring Began CA01 assembly Set final condenser shell Completed receipt of all CA20 submodules Continue Assembly of CA01 and CA20 modules Continue concrete placement inside and outside containment Complete Cooling Tower Place Annex Building basemat concrete 12
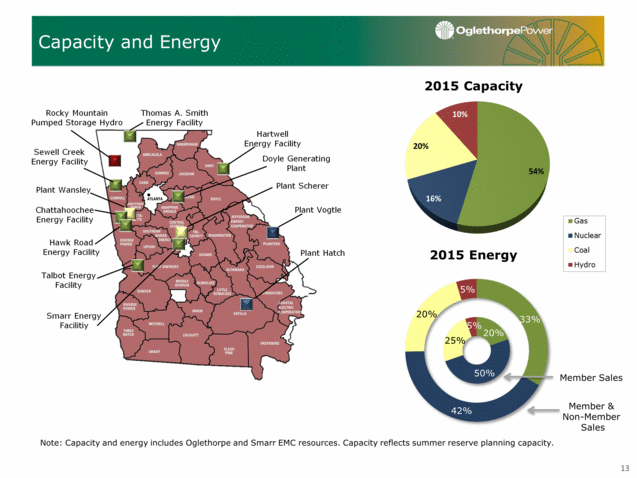
Capacity and Energy Note: Capacity and energy includes Oglethorpe and Smarr EMC resources. Capacity reflects summer reserve planning capacity. Member Sales 2015 Energy 2015 Capacity 13 Member & Non-Member Sales 20% 50% 25% 5% 33% 42% 20% 5% Rocky Mountain Pumped Storage Hydro Sewell Creek Energy Facility Chattahoochee Energy Facility Hawk Road Energy Facility Plant Wansley Talbot Energy Facility Hartwell Energy Facility Plant Vogtle Plant Hatch Doyle Generating Plant Smarr Energy Facilitiy Plant Scherer Thomas A. Smith Energy Facility 54% 16% 20% 10%
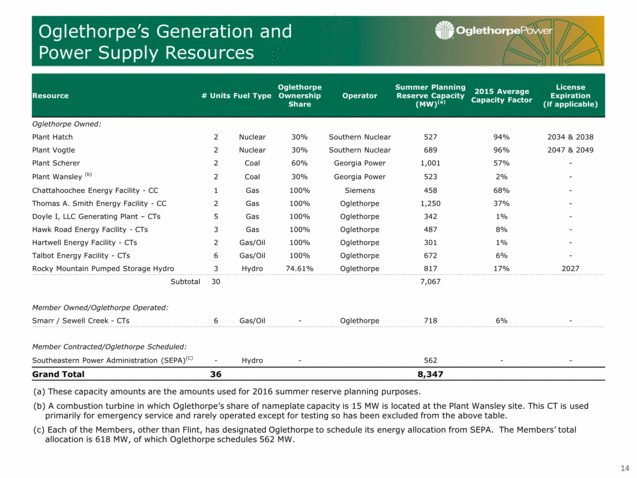
Oglethorpe’s Generation and Power Supply Resources (a) These capacity amounts are the amounts used for 2016 summer reserve planning purposes. (b) A combustion turbine in which Oglethorpe’s share of nameplate capacity is 15 MW is located at the Plant Wansley site. This CT is used primarily for emergency service and rarely operated except for testing so has been excluded from the above table. (c) Each of the Members, other than Flint, has designated Oglethorpe to schedule its energy allocation from SEPA. The Members’ total allocation is 618 MW, of which Oglethorpe schedules 562 MW. Resource # Units Fuel Type Oglethorpe Ownership Share Operator Summer Planning Reserve Capacity (MW)(a) 2015 Average Capacity Factor License Expiration (if applicable) Oglethorpe Owned: Plant Hatch 2 Nuclear 30% Southern Nuclear 527 94% 2034 & 2038 Plant Vogtle 2 Nuclear 30% Southern Nuclear 689 96% 2047 & 2049 Plant Scherer 2 Coal 60% Georgia Power 1,001 57% - Plant Wansley (b) 2 Coal 30% Georgia Power 523 2% - Chattahoochee Energy Facility - CC 1 Gas 100% Siemens 458 68% - Thomas A. Smith Energy Facility - CC 2 Gas 100% Oglethorpe 1,250 37% - Doyle I, LLC Generating Plant – CTs 5 Gas 100% Oglethorpe 342 1% - Hawk Road Energy Facility - CTs 3 Gas 100% Oglethorpe 487 8% - Hartwell Energy Facility - CTs 2 Gas/Oil 100% Oglethorpe 301 1% - Talbot Energy Facility - CTs 6 Gas/Oil 100% Oglethorpe 672 6% - Rocky Mountain Pumped Storage Hydro 3 Hydro 74.61% Oglethorpe 817 17% 2027 Subtotal 30 7,067 Member Owned/Oglethorpe Operated: Smarr / Sewell Creek - CTs 6 Gas/Oil - Oglethorpe 718 6% - Member Contracted/Oglethorpe Scheduled: Southeastern Power Administration (SEPA)(C) - Hydro - 562 - - Grand Total 36 8,347 14
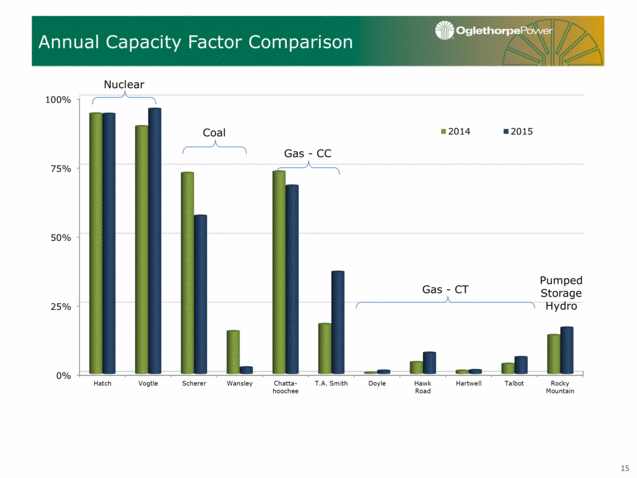
Annual Capacity Factor Comparison Nuclear Coal Gas - CC Gas - CT Pumped Storage Hydro 15 0% 25% 50% 75% 100% Hatch Vogtle Scherer Wansley Chatta- hoochee T.A. Smith Doyle Hawk Road Hartwell Talbot Rocky Mountain 2014 2015
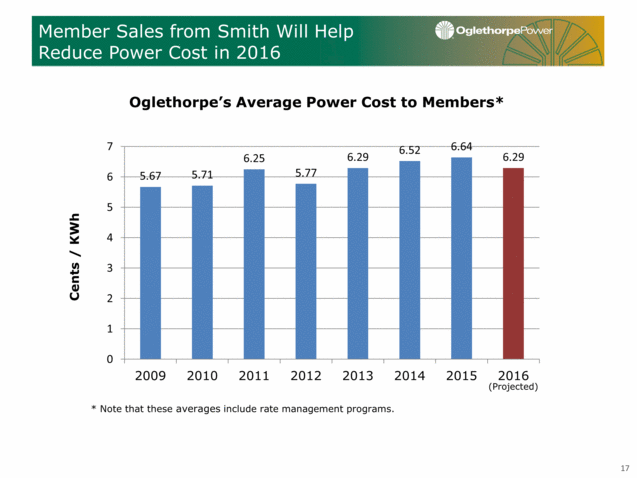
Impact of T.A. Smith Energy Facility Oglethorpe acquired Smith in 2011 at a favorable price even though Members would not need the power until 2016. During this time, Smith was not used to serve Member load but rather was marketed off-system to defray carrying costs, which would be deferred. Smith’s total carrying cost was $237 million and Members elected to expense $59 million of this, resulting in only $178 million being deferred, which we began recovering in 2016. Starting in 2016, Oglethorpe’s megawatt-hour sales to members are projected to increase by ~30% compared to 2015 due to additional Smith generation, which is displacing Member third-party power purchases. T.A. Smith Generation Off-system sales helped reduce the total carrying cost to $237 million from an originally projected $469 million. 2011 2012 2013 2014 2015 2016 Projected MWh ( in millions) T.A. Smith Cost / KW (millions) Projected Actual Initial Purchase Price $530 $530 Carrying Cost Deferral $469 $178 Member Expensed - $59 Total $999 $767 $/KW $799/KW $614/KW Note: Self-build cost for combined cycle ~$1100/KW at the time of purchase.16

Member Sales from Smith Will Help Reduce Power Cost in 2016 * Note that these averages include rate management programs. (Projected) 17 5.67 5.71 6.25 5.77 6.29 6.52 6.64 6.29 0 1 2 3 4 5 6 7 2009 2010 2011 2012 2013 2014 2015 2016 Cents / KWh Oglethorpe’s Average Power Cost to Members*
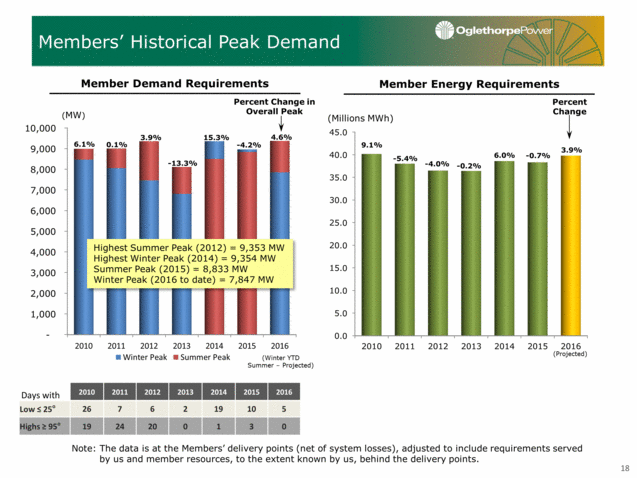
Members’ Historical Peak Demand Member Demand Requirements Member Energy Requirements Percent Change -0.2% Note: The data is at the Members’ delivery points (net of system losses), adjusted to include requirements served by us and member resources, to the extent known by us, behind the delivery points. 9.1% -5.4% -4.0% 6.0% (Projected) 18 -0.7% Days with 2010 2011 2012 2013 2014 2015 2016 Low < 25o 26 7 6 2 19 10 5 Highs > 95o 19 24 20 0 1 3 0 (MW) Percent Change in Overall Peak 6.1% -13.3% 0.1% 3.9% 15.3% -4.2% Highest Summer Peak (2012) = 9,353 MW Highest Winter Peak (2014) = 9,354 MW Summer Peak (2015) = 8,833 MW Winter Peak (2016 to date) = 7,847 MW 4.6% 3.9% (Winter YTD Summer – Projected) - 1,000 2,000 3,000 4,000 5,000 6,000 7,000 8,000 9,000 10,000 2010 2011 2012 2013 2014 2015 2016 Winter Peak Summer Peak 2010 2011 2012 2013 2014 2015 2016 (Millions MWh)
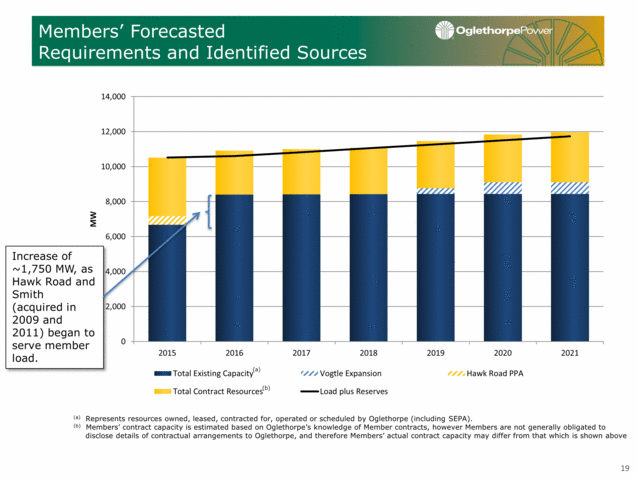
Members’ Forecasted Requirements and Identified Sources (a) Represents resources owned, leased, contracted for, operated or scheduled by Oglethorpe (including SEPA). (b) Members’ contract capacity is estimated based on Oglethorpe’s knowledge of Member contracts, however Members are not generally obligated to disclose details of contractual arrangements to Oglethorpe, and therefore Members’ actual contract capacity may differ from that which is shown above (a) (b) Increase of ~1,750 MW, as Hawk Road and Smith (acquired in 2009 and 2011) began to serve member load. 19 0 2,000 4,000 6,000 8,000 10,000 12,000 14,000 2015 2016 2017 2018 2019 2020 2021 MW Total Existing Capacity Vogtle Expansion Hawk Road PPA Total Contract Resources Load plus Reserves
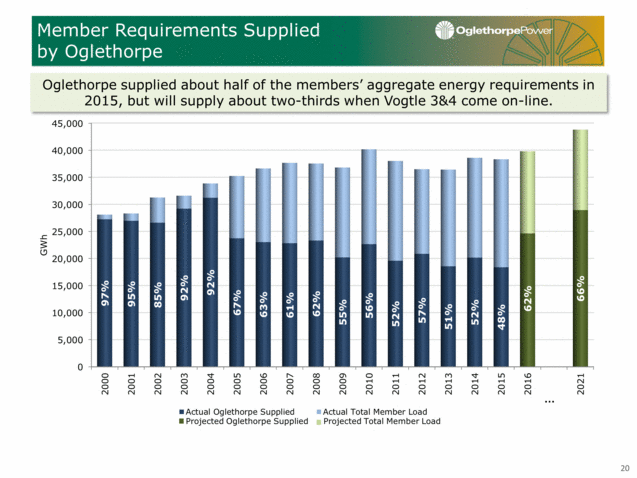
Member Revenue Summary Member Requirements Supplied by Oglethorpe Oglethorpe supplied about half of the members’ aggregate energy requirements in 2015, but will supply about two-thirds when Vogtle 3&4 come on-line. Projected Oglethorpe Supplied Projected Total Member Load 20 0 5,000 10,000 15,000 20,000 25,000 30,000 35,000 40,000 45,000 2000 2001 2002 2003 2004 2005 2006 2007 2008 2009 2010 2011 2012 2013 2014 2015 2016 2021 97% 95% 85% 92% 92% 67% 63% 61% 62% 55% 56% 52% 57% 51% 52% 48% 62% 66% GWh Actual Oglethorpe Supplied Actual Total Member Load
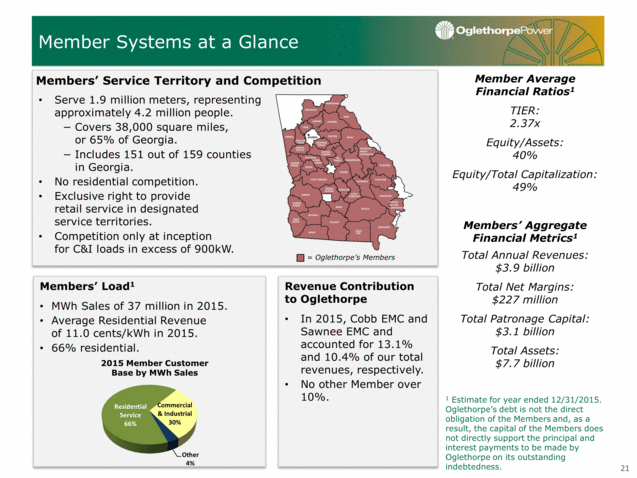
Members’ Load1 MWh Sales of 37 million in 2015. Average Residential Revenue of 11.0 cents/kWh in 2015. 66% residential. Serve 1.9 million meters, representing approximately 4.2 million people. Covers 38,000 square miles, or 65% of Georgia. Includes 151 out of 159 counties in Georgia. No residential competition. Exclusive right to provide retail service in designated service territories. Competition only at inception for C&I loads in excess of 900kW. Member Systems at a Glance = Oglethorpe’s Members Members’ Service Territory and Competition Member Average Financial Ratios1 TIER: 2.37x Equity/Assets: 40% Equity/Total Capitalization: 49% Members’ Aggregate Financial Metrics1 Total Annual Revenues: $3.9 billion Total Net Margins: $227 million Total Patronage Capital: $3.1 billion Total Assets: $7.7 billion 1 Estimate for year ended 12/31/2015. Oglethorpe’s debt is not the direct obligation of the Members and, as a result, the capital of the Members does not directly support the principal and interest payments to be made by Oglethorpe on its outstanding indebtedness. Revenue Contribution to Oglethorpe In 2015, Cobb EMC and Sawnee EMC and accounted for 13.1% and 10.4% of our total revenues, respectively. No other Member over 10%. 21 2015 Member Customer Base by MWh Sales Residential Service 66% Commercial & Industrial 30% Other 4%
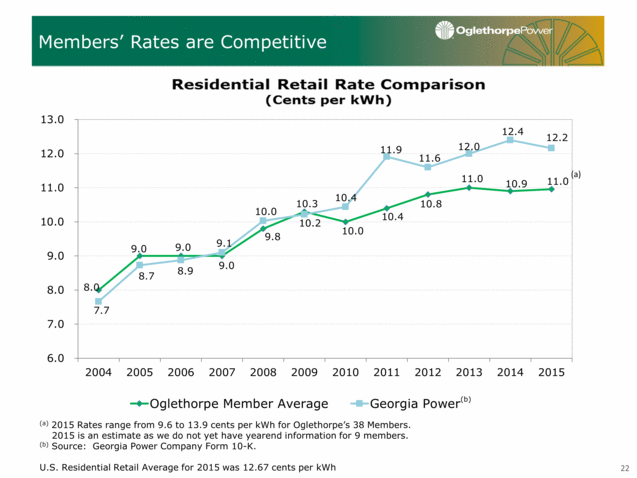
Members’ Rates are Competitive (b) (a) 2015 Rates range from 9.6 to 13.9 cents per kWh for Oglethorpe’s 38 Members. 2015 is an estimate as we do not yet have yearend information for 9 members. (b) Source: Georgia Power Company Form 10-K. U.S. Residential Retail Average for 2015 was 12.67 cents per kWh 22 8.0 9.0 9.0 9.0 9.8 10.3 10.0 10.4 10.8 11.0 10.9 11.0 7.7 8.7 8.9 9.1 10.0 10.2 10.4 11.9 11.6 12.0 12.4 12.2 6.0 7.0 8.0 9.0 10.0 11.0 12.0 13.0 2004 2005 2006 2007 2008 2009 2010 2011 2012 2013 2014 2015 Oglethorpe Member Average Georgia Power (a)
Cornerstones of Our Credit Strength: Contracts, Rate Structure and Members Rates not Subject to Georgia PSC Regulation Mostly (2/3) Residential Customer Base Diversified Power Supply Portfolio Significant Equity at Member Level Strong Liquidity 23 Long-Term Wholesale Power Contracts with Members (Take or Pay / Joint & Several / Unlimited Step-Up) Members’ Financial Strength Wholesale Power Contract’s Formulary Rate Assures Cost Recovery New Resources Require Broad Support (“75/75/75”) and 100% Member Subscription
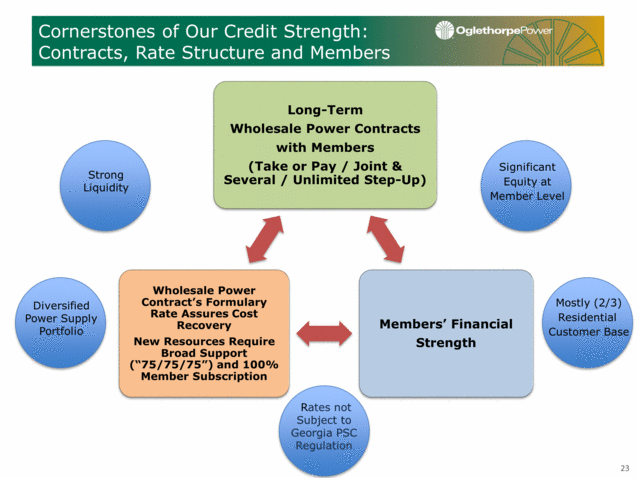
Rate Structure Assures Recovery of All Costs + Margin Formulary Rate under Wholesale Power Contract Minimum MFI requirement of 1.10x under First Mortgage Indenture Expense Type Components Recovery Timeframe Variable Fuel, Variable O&M 30 – 60 days Fixed Margin, Interest, Depreciation, Fixed O&M, A&G Billed on levelized annual budget Trued up to actuals at year end Oglethorpe budgets conservatively Key Points: Cost inputs not subject to any regulatory approvals Formula changes subject to RUS & DOE approval Prior period adjustment mechanism covers any year-end shortfall below required 1.10 MFI (board approval not required). Margin Coverage 24 (projected) 1.10 1.10 1.12 1.14 1.14 1.14 1.14 1.14 1.14 1.14 $19.1 $19.3 $26.4 $33.7 $37.7 $39.3 $41.5 $46.6 $48.3 $51.4 $0.0 $20.0 $40.0 $60.0 1.05 1.10 1.15 1.20 2007 2008 2009 2010 2011 2012 2013 2014 2015 2016 Net Margin (MM) MFI Coverage
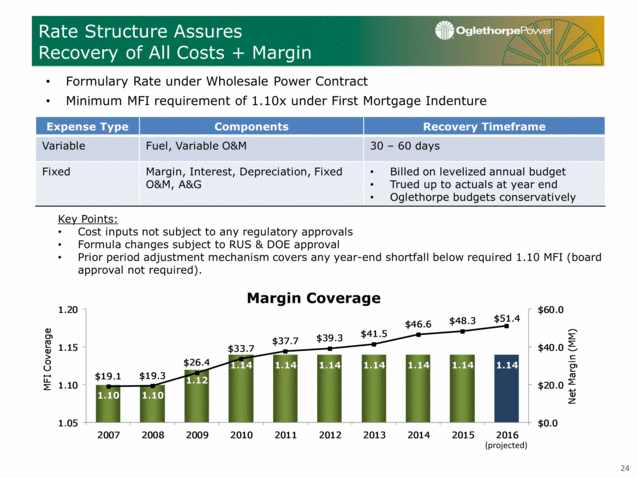
History of Conservative Budget Projections 1.10 1.12 1.14 1.14 1.14 MFI: Note: Oglethorpe develops budgets to target a margins for interest ratio (MFI) approved annually by its board. Because these budgets are conservative, they generally lead to excess revenue collections over the course of each fiscal year. Amounts collected in excess of our board approved MFI ratio, if any, are returned to our members at the end of each fiscal year. The amounts reflected in this graph as sum of “Net Margin” and “Amounts Collected in Excess of MFI Target and Subsequently Returned” constitute non-GAAP financial measures. The amounts “Amounts Collected in Excess of MFI Target and Subsequently Returned” constitute a reconciliation of these measures to the most directly comparable GAAP measures. 1.14 25 1.14 1.14 $- $10 $20 $30 $40 $50 $60 $70 $80 2008 2009 2010 2011 2012 2013 2014 2015 19.3 26.4 33.7 37.7 39.3 41.5 46.6 48.3 9.1 20.7 10.3 17.7 24.7 38.4 16.9 8.9 $ millions Net Margin Amounts Collected in Excess of MFI Target and Subsequently Returned
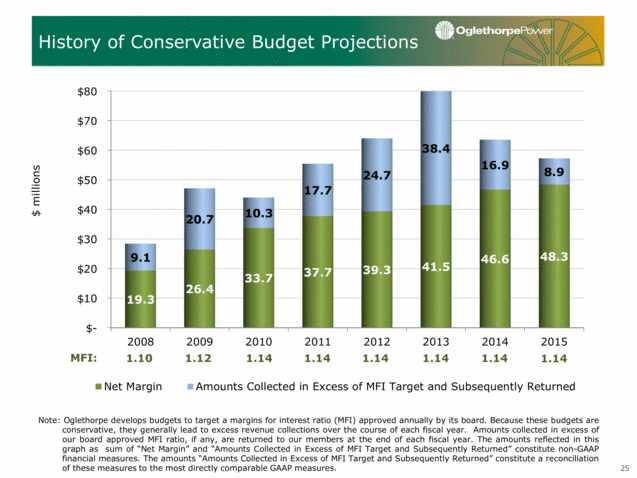
Capital Expenditures (a) Includes allowance for funds used during construction. 26 2016-2018 Capital Expenditures(a) In addition to the amounts above, Oglethorpe has budgeted costs of approximately $600 million to complete construction of Vogtle Units 3 & 4. 0 100 200 300 400 500 600 700 800 900 2016 2017 2018 $ millions Additions & Replacements Environmental Nuclear Fuel Vogtle 3 & 4
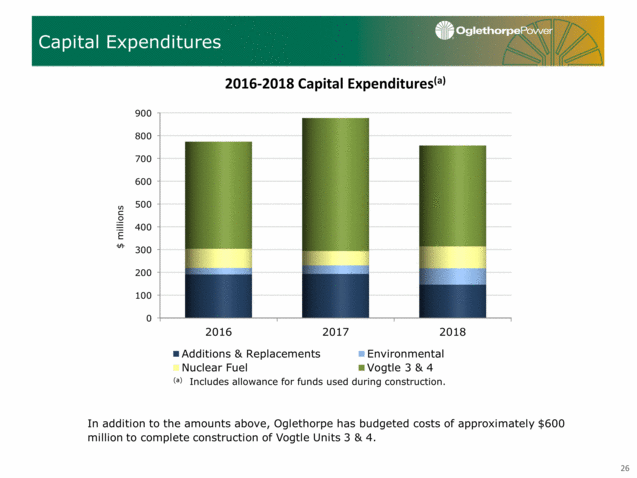
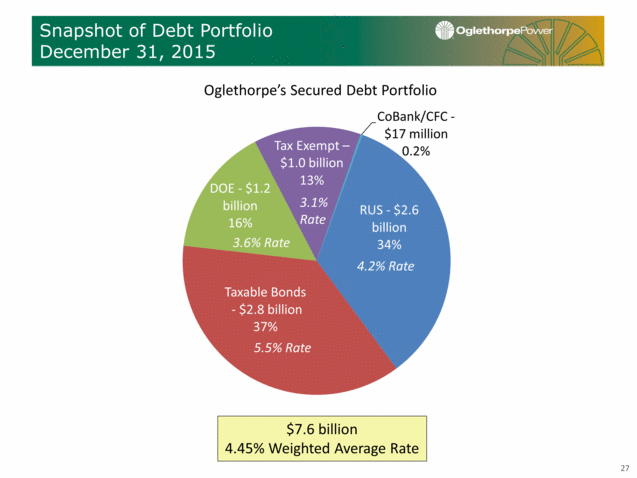
Snapshot of Debt Portfolio December 31, 2015 Oglethorpe’s Secured Debt Portfolio $7.6 billion 4.45% Weighted Average Rate 4.2% Rate 5.5% Rate 3.6% Rate 3.1% Rate 27 5.5% Rate 4.2% Rate 3.6% Rate 3.1% Rate RUS - $2.6 billion 34% Taxable Bonds - $2.8 billion 37% DOE - $1.2 billion 16% Tax Exempt – $1.0 billion 13% CoBank /CFC - $17 million 0.2%
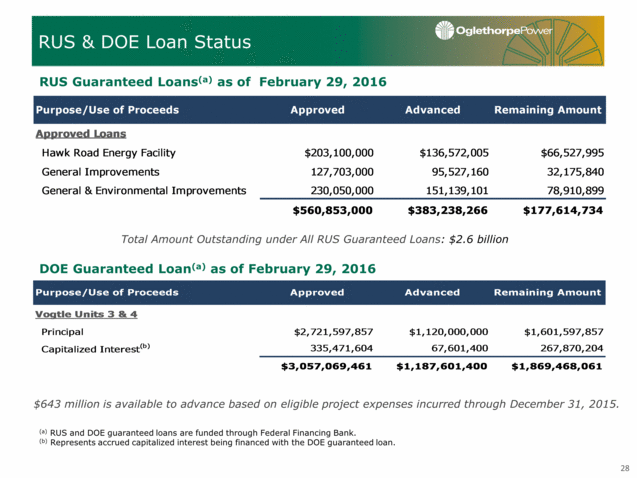
RUS & DOE Loan Status Total Amount Outstanding under All RUS Guaranteed Loans: $2.6 billion 28 (a) RUS and DOE guaranteed loans are funded through Federal Financing Bank. (b) Represents accrued capitalized interest being financed with the DOE guaranteed loan. RUS Guaranteed Loans(a) as of February 29, 2016 DOE Guaranteed Loan(a) as of February 29, 2016 $643 million is available to advance based on eligible project expenses incurred through December 31, 2015. Hawk Road Energy Facility General Improvements Purpose/Use of Proceeds Approved Advanced Remaining Amount Vogtle Units 3 & 4 Principal $2,721,597,857 $1,120,000,000 $1,601,597,857 Capitalized Interest(b) 335,471,604 67,601,400 267,870,204 $3,057,069,461 $1,187,601,400 $1,869,468,061 Purpose/Use of Proceeds Approved Advanced Remaining Amount Vogtle Units 3 & 4 Principal $2,721,597,857 $1,120,000,000 $1,601,597,857 Capitalized Interest 335,471,604 60,627,989 274,843,615 $3,057,069,461 $1,180,627,989 $1,876,441,472
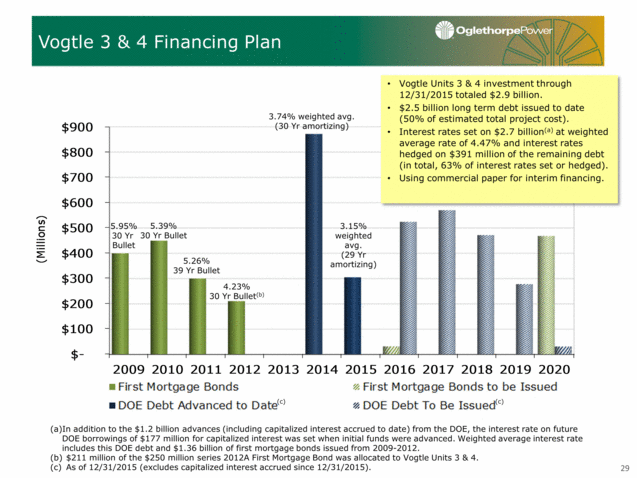
Vogtle 3 & 4 Financing Plan 5.95% 30 Yr Bullet 5.39% 30 Yr Bullet 5.26% 39 Yr Bullet Vogtle Units 3 & 4 investment through 12/31/2015 totaled $2.9 billion. $2.5 billion long term debt issued to date (50% of estimated total project cost). Interest rates set on $2.7 billion(a) at weighted average rate of 4.47% and interest rates hedged on $391 million of the remaining debt (in total, 63% of interest rates set or hedged). Using commercial paper for interim financing. 4.23% 30 Yr Bullet(b) (a)In addition to the $1.2 billion advances (including capitalized interest accrued to date) from the DOE, the interest rate on future DOE borrowings of $177 million for capitalized interest was set when initial funds were advanced. Weighted average interest rate includes this DOE debt and $1.36 billion of first mortgage bonds issued from 2009-2012. $211 million of the $250 million series 2012A First Mortgage Bond was allocated to Vogtle Units 3 & 4. As of 12/31/2015 (excludes capitalized interest accrued since 12/31/2015). 29 3.74% weighted avg. (30 Yr amortizing) (c) (c) 3.15% weighted avg. (29 Yr amortizing) First Mortgage Bonds First Mortgage Bonds to be Issued DOE Debt Advanced to Date DOE Debt To Be Issued Note: Manually change the colors as necessary, use the chart below for the legend 1 1 1 1 2009 $400.0 2010 $450.0 2011 $300.0 2012 $211.0 2013 2014 $872.0 2015 $305.2 2016 $32.0 $524.6 2017 $570.6 2018 $471.9 2019 $277.7 2020 $468.7 $31.6 $- $100 $200 $300 $400 $500 $600 $700 $800 $900 2009 2010 2011 2012 2013 2014 2015 2016 2017 2018 2019 2020 (Millions)
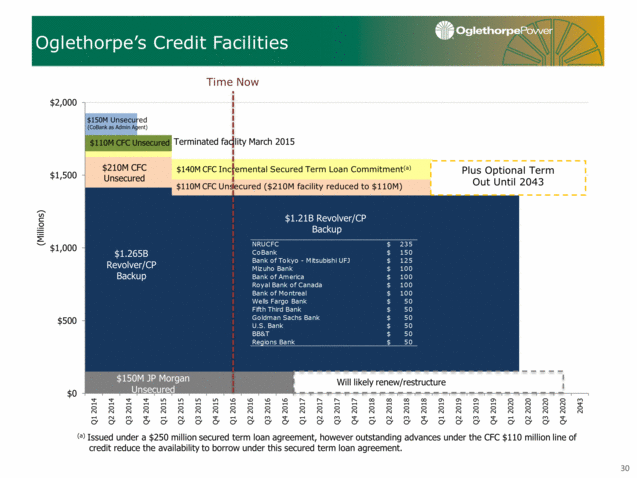
$110M CFC Unsecured ($210M facility reduced to $110M) $140M CFC Incremental Secured Term Loan Commitment(a) $1.21B Revolver/CP Backup Time Now Terminated facility March 2015 Plus Optional Term Out Until 2043 (a) Issued under a $250 million secured term loan agreement, however outstanding advances under the CFC $110 million line of credit reduce the availability to borrow under this secured term loan agreement. Oglethorpe’s Credit Facilities Will likely renew/restructure 30 NRUCFC $ 235 CoBank $ 150 Bank of Tokyo - Mitsubishi UFJ $ 125 Mizuho Bank $ 100 Bank of America $ 100 Royal Bank of Canada $ 100 Bank of Montreal $ 100 Wells Fargo Bank $ 50 Fifth Third Bank $ 50 Goldman Sachs Bank $ 50 U.S. Bank $ 50 BB&T $ 50 Regions Bank $ 50
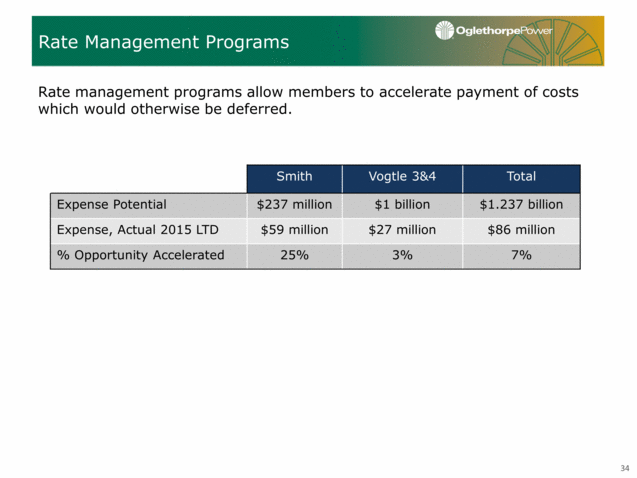
Oglethorpe’s Available Liquidity as of March 21, 2016 Borrowings Detail $251.5 MM Letter of Credit Support for VRDBs/T.A. Smith $103.6 MM Vogtle Interest Rate Hedging $242.2 MM Vogtle Interim Financing Represents 571 days of liquidity on hand (excluding Cushion of Credit). 31 In addition, as of March 21, Oglethorpe had $394 million on deposit in the RUS Cushion of Credit Account. The RUS Cushion of Credit Account is designated as restricted cash and investments and can only be used to pay debt service on RUS guaranteed loans. (a) - 500 1,000 1,500 2,000 Total Credit Facilities Less Borrowings Available Credit Facilities Capacity Cash Total Liquidity $1,610 $603 $1,007 $212 $1,219 (Millions)
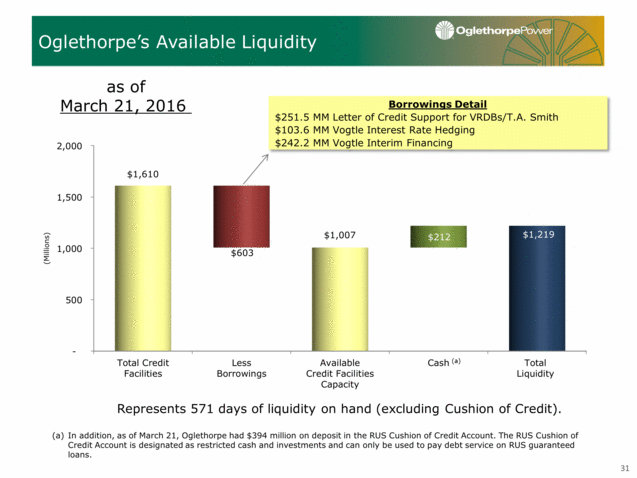
Income Statement Excerpts 32 Year Ended December 31, ($ in thousands) 2015 2014 2013 Statement of Revenues and Expenses: Operating Revenues: Sales to Members $1,219,052 $1,314,869 $1,166,618 Sales to Non-Members 130,773 93,294 78,758 Operating Expenses 1,092,367 1,148,766 1,013,852 Other Income 52,030 46,371 43,433 Net Interest Charges 261,147 259,133 233,477 Net Margin $48,341 $46,635 $41,480 Margins for Interest Ratio(a) 1.14x 1.14x 1.14x Sales to Members Average Power Cost (cents/kWh) 6.64 6.52 6.29 Sales to Members (MWh) 18,371,588 20,154,108 18,549,886 Margins for Interest ratio is calculated on an annual basis and is determined by dividing Oglethorpe’s Margins for Interest by Interest Charges, both as defined in Oglethorpe’s First Mortgage Indenture. The Indenture obligates Oglethorpe to establish and collect rates that, subject to any necessary regulatory approvals, are reasonably expected to yield a Margins for Interest ratio equal to at least 1.10x for each fiscal year. In addition, the Indenture requires Oglethorpe to show that it has met this requirement for certain historical periods as a condition for issuing additional obligations under the Indenture. Oglethorpe increased its Margins for Interest ratio to 1.14x each year, starting in 2010, above the minimum 1.10x ratio required by the Indenture, and the 2016 budget also includes a 1.14x MFI ratio. Oglethorpe’s Board of Directors will continue to evaluate margin coverage throughout the Vogtle construction period and may chose to further increase, or decrease, the Margins for Interest ratio in the future, although not below 1.10.
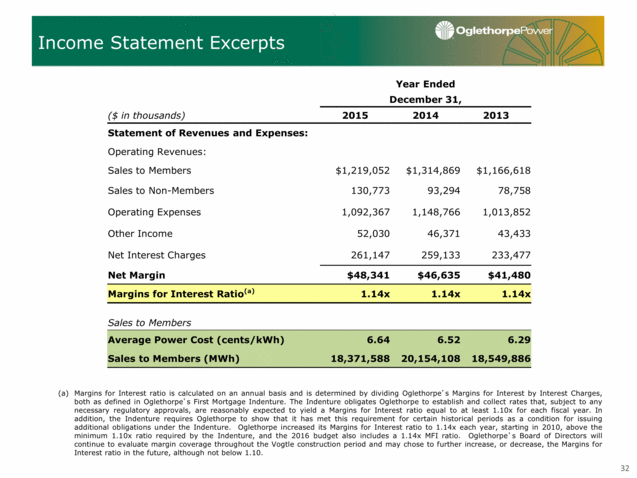
Balance Sheet Excerpts (a) The equity ratio is calculated, pursuant to Oglethorpe’s First Mortgage Indenture, by dividing patronage capital and membership fees by total capitalization plus unamortized debt issuance costs and bond discounts and long-term debt due within one year (Total Long-Term Debt and Equities in the table above). Oglethorpe has no financial covenant that requires it to maintain a minimum equity ratio; however, a covenant in the Indenture restricts distributions of equity (patronage capital) to its Members if its equity ratio is below 20%. Oglethorpe also has a covenant in a credit agreement that currently requires a minimum total patronage capital of $675 million. The equity ratio is less than that of many investor-owned utilities because Oglethorpe operates on a not-for-profit basis and has a significant amount of authority to set and change rates to ensure sufficient cost recovery to produce margins to meet financial coverage requirements. 33 December 31, ($ in thousands) 2015 2014 2013 Balance Sheet Data: Assets: Electric Plant: Net Plant in Service $4,670,310 $4,582,551 $4,434,728 CWIP 2,868,669 2,374,392 2,212,224 Nuclear Fuel 373,145 369,529 341,012 Total Electric Plant 7,912,124 7,326,472 6,987,964 Cash and Cash Equivalents 213,038 237,391 408,193 Total Assets $10,059,783 $9,448,820 $9,048,453 Capitalization: Patronage Capital and Membership Fees $809,465 $761,124 $714,489 Accumulated Other Comprehensive Margin (Deficit) 58 468 (549) Subtotal $809,523 $761,592 $713,940 Long-term Debt and Obligations under Capital Leases 7,387,655 7,116,033 6,892,490 Other 17,561 16,434 15,379 Total Capitalization $8,214,739 $7,894,059 $7,621,809 Plus: Unamortized debt issuance costs and bond discounts on LT debt 97,988 101,939 49,862 Plus: Long-term debt and capital leases due within one year 189,840 160,754 152,153 Total Long-Term Debt and Equities $8,502,567 $8,156,752 $7,823,824 Equity Ratio(a) 9.5% 9.3% 9.1%
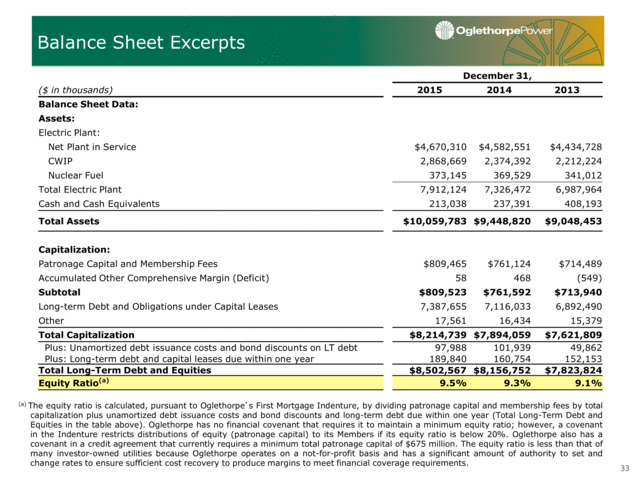
Rate Management Programs Rate management programs allow members to accelerate payment of costs which would otherwise be deferred. 34 Smith Vogtle 3&4 Total Expense Potential $237 million $1 billion $1.237 billion Expense, Actual 2015 LTD $59 million $27 million $86 million % Opportunity Accelerated 25% 3% 7%
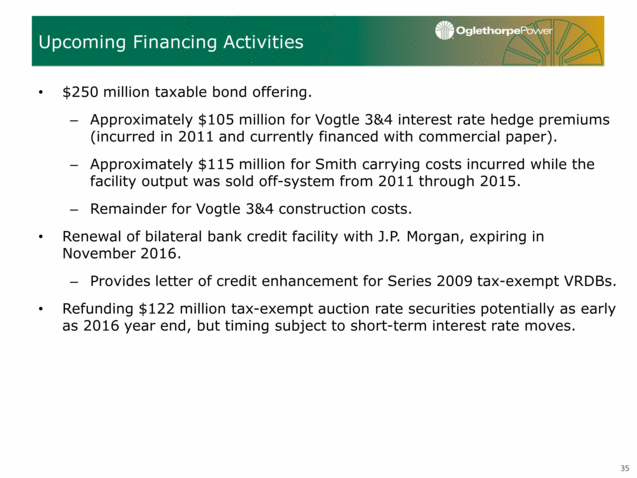
$250 million taxable bond offering. Approximately $105 million for Vogtle 3&4 interest rate hedge premiums (incurred in 2011 and currently financed with commercial paper). Approximately $115 million for Smith carrying costs incurred while the facility output was sold off-system from 2011 through 2015. Remainder for Vogtle 3&4 construction costs. Renewal of bilateral bank credit facility with J.P. Morgan, expiring in November 2016. Provides letter of credit enhancement for Series 2009 tax-exempt VRDBs. Refunding $122 million tax-exempt auction rate securities potentially as early as 2016 year end, but timing subject to short-term interest rate moves. Upcoming Financing Activities 35
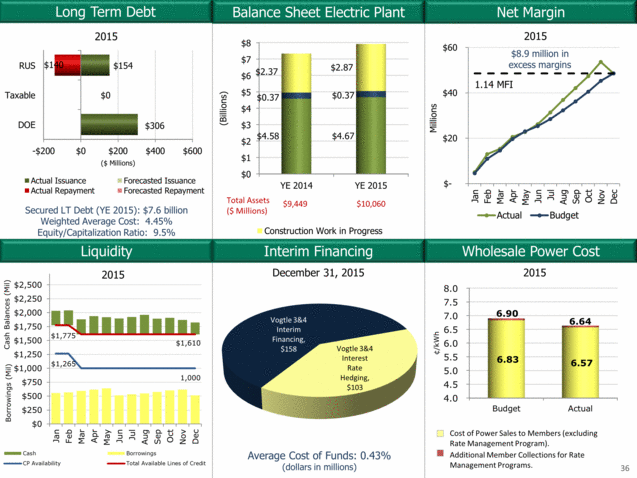
Liquidity Net Margin Wholesale Power Cost Interim Financing Balance Sheet Electric Plant Average Cost of Funds: 0.43% (dollars in millions) Secured LT Debt (YE 2015): $7.6 billion Weighted Average Cost: 4.45% Equity/Capitalization Ratio: 9.5% 2015 1.14 MFI December 31, 2015 2015 Cost of Power Sales to Members (excluding Rate Management Program). Additional Member Collections for Rate Management Programs. 36 2015 $8.9 million in excess margins 2015 Long Term Debt $- $20 $40 $60 Jan Feb Mar Apr May Jun Jul Aug Sep Oct Nov Dec Millions Actual Budget $1,265 1,000 $1,775 $1,610 $0 $250 $500 $750 $1,000 $1,250 $1,500 $1,750 $2,000 $2,250 $2,500 Jan Feb Mar Apr May Jun Jul Aug Sep Oct Nov Dec Borrowings (Mil) Cash Borrowings CP Availability Total Available Lines of Credit Cash Balances (Mil) Cash Balances (Mil) Cash Balances (Mil) Cash Balances (Mil ) 4.0 4.5 5.0 5.5 6.0 6.5 7.0 7.5 8.0 Budget Actual 6.83 6.57 6.90 6.64 ¢/kWh $0 $1 $2 $3 $4 $5 $6 $7 $8 YE 2014 YE 2015 $4.58 $4.67 $0.37 $0.37 $2.37 $2.87 (Billions) Construction Work in Progress Total Assets ($ Millions) $9,449 $10,060 Vogtle 3&4 Interest Rate Hedging , $103 Vogtle 3&4 Interim Financing, $158 -$200 $0 $200 $400 $600 DOE Taxable RUS $0 $306 $154 $140 ($ Millions) Actual Issuance Forecasted Issuance Actual Repayment Forecasted Repayment
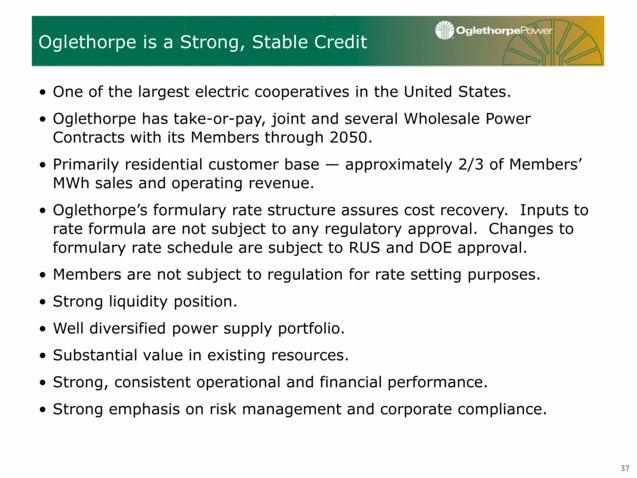
One of the largest electric cooperatives in the United States. Oglethorpe has take-or-pay, joint and several Wholesale Power Contracts with its Members through 2050. Primarily residential customer base — approximately 2/3 of Members’ MWh sales and operating revenue. Oglethorpe’s formulary rate structure assures cost recovery. Inputs to rate formula are not subject to any regulatory approval. Changes to formulary rate schedule are subject to RUS and DOE approval. Members are not subject to regulation for rate setting purposes. Strong liquidity position. Well diversified power supply portfolio. Substantial value in existing resources. Strong, consistent operational and financial performance. Strong emphasis on risk management and corporate compliance. Oglethorpe is a Strong, Stable Credit 37
A link to this presentation will be posted on Oglethorpe’s website www.opc.com. Oglethorpe’s SEC filings, including its annual reports on Form 10-K, quarterly reports on Form 10-Q, current reports on Form 8-K are made available on its website. Member information is filed as an exhibit to Form 10-Q for the first quarter of each year. (Exhibits are available on EDGAR but not on Oglethorpe’s website.) For additional information please contact: Additional Information 38 Betsy Higgins Executive Vice President and Chief Financial Officer betsy.higgins@opc.com 770-270-7168

