Attached files
| file | filename |
|---|---|
| EX-21.1 - FORM 10-K, EXHIBIT 21.1 - Associated Capital Group, Inc. | form10k2015ex211.htm |
| EX-32.1 - EXHIBIT 32.1 - Associated Capital Group, Inc. | form10kac2015ex321.htm |
| EX-32.2 - EXHIBIT 32.2 - Associated Capital Group, Inc. | form10kac2015ex322.htm |
| EX-31.2 - EXHIBIT 31.2 - Associated Capital Group, Inc. | form10kac2015ex312.htm |
| EX-31.1 - EXHIBIT 31.1 - Associated Capital Group, Inc. | form10kac2015ex311.htm |
UNITED STATES
SECURITIES AND EXCHANGE COMMISSION
Washington, D.C. 20549
FORM 10-K
| | ANNUAL REPORT PURSUANT TO SECTION 13 OR 15(D) OF THE SECURITIES EXCHANGE ACT OF 1934 |
For the fiscal year ended December 31, 2015
or
| | TRANSITION REPORT PURSUANT TO SECTION 13 OR 15(D) OF THE SECURITIES EXCHANGE ACT OF 1934 |
For the transition period from ______ to ______
Commission file number 001-37387
Associated Capital Group, Inc.
(Exact name of registrant as specified in its charter)
|
Delaware
|
47-3965991
|
|
|
(State or other jurisdiction of incorporation or organization)
|
(I.R.S. Employer Identification No.)
|
|
|
One Corporate Center, Rye, NY
|
10580-1422
|
|
|
(Address of principal executive offices)
|
(Zip Code)
|
Registrant's telephone number, including area code (203) 629-9595
Securities registered pursuant to Section 12(b) of the Act:
|
Title of each class
|
Name of each exchange on which registered
|
|
|
Class A Common Stock, par value $0.001 per share
|
New York Stock Exchange
|
Securities registered pursuant to Section 12(g) of the Act: None
Indicate by check mark if the registrant is a well-known seasoned issuer, as defined in Rule 405 of the Securities Act Yes No .
Indicate by check mark if the registrant is not required to file reports pursuant to Section 13 or Section 15(d) of the Act Yes No .
Indicate by check mark whether the registrant (1) has filed all reports required to be filed by Section 13 or 15(d) of the Securities Exchange Act of 1934 during the preceding 12 months (or for such shorter period that the registrant was required to file such reports), and (2) has been subject to such filing requirements for the past 90 days Yes No .
Indicate by check mark whether the registrant has submitted electronically and posted on its corporate Website, if any, every Interactive Data File required to be submitted and posted pursuant to Rule 405 of Regulation S-T during the preceding 12 months (or for such shorter period that the registrant was required to submit and post such files). Yes No
Indicate by check mark if disclosure of delinquent filers pursuant to Item 405 of Regulation S-K is not contained herein, and will not be contained, to the best of registrant's knowledge, in definitive proxy or information statements incorporated by reference in Part III of this Form 10-K or any amendment to this Form 10-K .
Indicate by check mark whether the registrant is a large accelerated filer, an accelerated filer, a non-accelerated filer, or a smaller reporting company. See the definitions of "large accelerated filer", "accelerated filer", and "smaller reporting company" in Rule 12b-2 of the Exchange Act. (Check one):
|
Large accelerated filer
|
Accelerated filer
|
|
Non-accelerated filer (Do not check if a smaller reporting company)
|
Smaller reporting company
|
Indicate by check mark whether the registrant is a shell company (as defined in Exchange Act Rule 12b-2) Yes No .
The aggregate market value of the class A common stock held by non-affiliates of the registrant as of June 30, 2015 was $0 as the registrant is a newly public company. The registrant had annual revenues of less than $50 million upon becoming a public company.
As of March 1, 2016, 6,211,564 shares of class A common stock and 19,196,792 shares of class B common stock were outstanding. 18,423,741 shares of class B common stock were held by a subsidiary of GGCP, Inc.
DOCUMENTS INCORPORATED BY REFERENCE: Portions of the registrant's definitive proxy statement relating to the 2016 Annual Meeting of Shareholders are incorporated by reference in Items 10, 11, 12, 13 and 14 of Part III of this report.
2
|
GAMCO Investors, Inc.
|
||||
|
Annual Report on Form 10-K For the Fiscal Year Ended December 31, 2015
|
||||
|
Part I
|
||||
|
Item 1
|
Business
|
4
|
||
|
Business Strategy
|
7
|
|||
|
Competition
|
8
|
|||
|
Intellectual Property
|
8
|
|||
|
Regulation
|
9
|
|||
|
Employees
|
12
|
|||
|
Item 1A
|
Risk Factors
|
13
|
||
|
Item 1B
|
Unresolved Staff Comments
|
26
|
||
|
Item 2
|
Properties
|
26
|
||
|
Item 3
|
Legal Proceedings
|
26
|
||
|
Item 4
|
Mine Safety Disclosures
|
26
|
||
|
Part II
|
||||
|
Item 5
|
Market For The Registrant's Common Equity, Related Stockholder Matters And Issuer Purchases Of Equity Securities
|
27
|
||
|
Item 6
|
Selected Financial Data
|
28
|
||
|
Item 7
|
Management's Discussion And Analysis Of Financial Condition And Results Of Operations
|
28
|
||
|
Item 7A
|
Quantitative And Qualitative Disclosures About Market Risk
|
39
|
||
|
Item 8
|
Financial Statements And Supplementary Data
|
40
|
||
|
Item 9
|
Changes In And Disagreements With Accountants On Accounting And Financial Disclosure
|
78
|
||
|
Item 9A
|
Controls And Procedures
|
78
|
||
|
Item 9B
|
Other Information
|
78
|
||
|
Part III
|
||||
|
Item 10
|
Directors, Executive Officers and Corporate Governance
|
79
|
||
|
Item 11
|
Executive Compensation
|
79
|
||
|
Item 12
|
Security Ownership Of Certain Beneficial Owners And Management And Related
|
|||
|
Stockholder Matters
|
79
|
|||
|
Item 13
|
Certain Relationships And Related Transactions, and Director Independence
|
79
|
||
|
Item 14
|
Principal Accountant Fees And Services
|
79
|
||
|
Part IV
|
||||
|
Item 15
|
Exhibits, Financial Statement Schedules
|
80
|
||
|
Signatures
|
82
|
|||
|
Power of Attorney
|
83
|
|||
|
Subsidiaries of Associated Capital Group, Inc.
|
|
|||
|
Certifications
|
Exhibit 31.1
|
|||
|
Exhibit 31.2
|
||||
|
Exhibit 32.1
|
||||
|
Exhibit 32.2
|
||||
3
PART I
Forward-Looking Statements
Our disclosure and analysis in this report and in documents that are incorporated by reference contain some forward-looking statements within the meaning of Section 27A of the Securities Act of 1933 and Section 21E of the Securities Exchange Act of 1934. Forward-looking statements give our current expectations or forecasts of future events. You can identify these statements because they do not relate strictly to historical or current facts. You should not place undue reliance on these statements. They use words such as "anticipate," "estimate," "expect," "project," "intend," "plan," "believe," and other words and terms of similar meaning. They also appear in any discussion of future operating or financial performance. In particular, these include statements relating to future actions, future performance of our products, expenses, the outcome of any legal proceedings, and financial results.
Although we believe that we are basing our expectations and beliefs on reasonable assumptions within the bounds of what we currently know about our business and operations, there can be no assurance that our actual results will not differ materially from what we expect or believe. Some of the factors that could cause our actual results to differ from our expectations or beliefs include, without limitation: the adverse effect from a decline in the securities markets; a decline in the performance of our products; a general downturn in the economy; changes in government policy or regulation; changes in our ability to attract or retain key employees; and unforeseen costs and other effects related to legal proceedings or investigations of governmental and self-regulatory organizations. We also direct your attention to any more specific discussions of risk contained in Item 1A below and in our other public filings or in documents incorporated by reference here or in prior filings or reports.
We are providing these statements as permitted by the Private Litigation Reform Act of 1995. We do not undertake to update publicly any forward-looking statements if we subsequently learn that we are unlikely to achieve our expectations or if we receive any additional information relating to the subject matters of our forward-looking statements.
Unless we have indicated otherwise, or the context otherwise requires, references in this report to "Associated Capital Group, Inc.," "AC Group," "the Company," "AC," "we," "us" and "our" or similar terms are to Associated Capital Group, Inc., its predecessors and its subsidiaries.
Our principal executive offices are located at One Corporate Center, Rye, New York 10580. We post or provide a link on our website, www.associated-capital-group.com, to the following filings as soon as reasonably practicable after they are electronically filed with or furnished to the Securities and Exchange Commission ("Commission" or "SEC"): our annual report on Form 10-K, quarterly reports on Form 10-Q, current reports on Form 8-K, and any amendments to those reports filed or furnished pursuant to Section 13(a) or 15(d) of the Securities Exchange Act of 1934. All such filings on our website are available free of charge.
The Spin-off and Related Transactions
We are a newly formed Delaware corporation organized to be the parent operating company for the Spin-off of GAMCO Investors, Inc.'s ("GAMCO's") alternative investment management business, institutional research services operations and certain cash and other assets.
On November 30, 2015, GAMCO distributed all the outstanding shares of each class of common stock of AC Group on a pro rata one-for-one basis to the holders of each class of GAMCO's common stock. Prior to the distribution, GAMCO contributed the 93.9% interest it held in Gabelli Securities, Inc. ("GSI") and certain cash and other assets to AC Group. GSI is an investment adviser registered with the Securities and Exchange Commission under the Investment Advisers Act of 1940, as amended.
GSI and its wholly owned subsidiary, Gabelli & Partners, LLC ("Gabelli & Partners"), collectively serve as general partners, co-general partners or investment managers to investment funds including limited partnerships and offshore companies (collectively, "Investment Partnerships"), and separate accounts. We primarily manage assets in equity event-driven value strategies, across a range of risk and event arbitrage portfolios. The business earns fees from its advisory assets, and income (loss) from trading and investment portfolio activities. The advisory fees include management and incentive fees. Management fees are largely based on a percentage of the portfolios' levels of assets under management. Incentive fees are based on the percentage of profits derived from the investment performance delivered to clients' invested assets.
We operate our institutional research services operations through G.research, LLC ("G.research"), a wholly owned subsidiary of GSI. G.research is a broker-dealer registered under the Securities Exchange Act of 1934, as amended (the "Exchange Act"). Through G.research, we provide institutional research services as well as act as an underwriter. G.research is regulated by the Financial Industry Regulatory Authority ("FINRA"). G.research's revenues are derived primarily from institutional research services.
4
In addition, the following transactions were also undertaken in connection with the Spin-off:
GAMCO issued a promissory note (the "GAMCO Note") to AC Group in the original principal amount of $250.0 million used to partially capitalize the Company in connection with the Spin-off. The GAMCO Note bears interest at 4.0% per annum and has a maturity date of November 30, 2020 with respect to the original principal amount of the GAMCO Note. Interest on the GAMCO Note will accrue from the most recent date for which interest has been paid, or if no interest has been paid, from the effective date of the GAMCO Note; provided, however, that at the election of GAMCO, payment of interest on the GAMCO Note may, in lieu of being paid in cash, be paid, in whole or in part, in kind on the then-outstanding principal amount (a "PIK Amount"). GAMCO will repay the original principal amount of the GAMCO Note to AC Group, in cash, in five equal annual installments of $50 million on each interest payment date up to and including the maturity date and will repay all PIK Amounts added to the outstanding principal amount of the GAMCO Note, in cash, on the fifth anniversary of the date on which each such PIK Amount was added to the outstanding principal amount of the GAMCO Note. In no event may any interest be paid in kind subsequent to November 30, 2019. GAMCO may prepay the GAMCO Note prior to maturity without penalty.
In addition, AC Group, through its majority-owned GSI subsidiary, owns 4,393,055 shares of GAMCO Class A common stock. The sale was made from GAMCO to GSI in advance of the Spin-off. GSI paid the purchase price by issuing a note to GAMCO in the principal amount of $150 million (the "GSI Note"). In connection with the Spin-off, AC Group received the GSI Note from GAMCO and GSI became a majority-owned subsidiary of AC Group. The GSI Note is thus now an intercompany note within the AC Group.
Alternative Investment Management
We primarily manage assets in equity event-driven value strategies, across a range of risk and event arbitrage portfolios. The business earns fees from its advisory assets, and income (loss) from trading and investment portfolio activities. The advisory fees include management and incentive fees. Management fees are largely based on a percentage of the portfolios' levels of assets under management ("AUM"). Incentive fees are based on the percentage of profits derived from the investment performance. As of December 31, 2015, we managed a total of $1.08 billion in assets.
In our event-driven value funds we seek investments trading at prices that differ from those determined using our proprietary "Private Market Value (PMV) with a Catalyst" methodology where we have identified a near-term catalyst to narrow the market difference to PMV. Catalysts can include a spin-off, stock buyback, asset sale, management change, regulatory change or accounting change.
Event merger arbitrage is a subset of event-driven value investing where the catalyst, for example, an acquisition of the company, has been announced. In event merger arbitrage, the goal is to capture the difference between the market value of a security and what the acquirer is paying in the acquisition. Returns in merger arbitrage are primarily driven by the successful completion of the announced transactions in the portfolio. Other factors that can affect returns include short-term interest rates and the availability of investable deals. While merger arbitrage returns have historically been non-market correlated and deal-specific, event-driven value returns are more correlated to broader equity markets.
We generally manage assets on a discretionary basis and invest in a variety of U.S. and foreign securities utilizing a bottom up value investment style. Our managed funds primarily employ absolute return strategies such that we strive to generate positive returns regardless of market cycles or performance.
We introduced our first alternative fund, a merger arbitrage partnership, Gabelli Arbitrage (renamed Gabelli Associates), in February 1985. We then launched the Gabelli Rosenthal partnership in July 1985 to focus on leveraged buyout opportunities. An offshore version of the event merger arbitrage strategy was added in 1989. Building on our strengths in global event-driven value investing, several new Investment Partnerships have been added to balance investors' geographic, strategy and sector needs. Today, we offer Investment Partnerships in multiple categories, including event merger arbitrage, event-driven value and others across a broad range of absolute return products. Within our event merger arbitrage strategy, as of December 31, 2015, we managed approximately $869 million of assets for investors who seek positive returns not correlated to fluctuations of the general market. These funds seek to drive returns by investing mostly in announced merger and acquisition transactions that are primarily dependent on deal closure and less on the overall market environment. In event-driven value, as of December 31, 2015, we managed approximately $145 million of assets focused on the U.S. and non-U.S. Markets. We also manage $66 million of assets in a variety of other series of Investment Partnerships designed to offer investors a mechanism to diversify their portfolios by global economic and sectoral opportunities. These include sector, high yield, capital structure and venture capital or merchant banking portfolios. Since our inception, we have been closely identified with, and have enhanced, the "value" style of investing consistent with our fundamental objective of providing an absolute return for our clients. Our investment objective is to earn a superior risk-adjusted return over the long-term through our proprietary fundamental research. We serve a wide variety of investors including private wealth management accounts, corporations, corporate pension and profit-sharing plans, foundations and endowments, as well as serving as sub-advisor to certain third-party investment funds.
5
The following table sets forth AC's total AUM for the dates shown.
|
Assets Under Management (a)
|
||||||||||||||||||||
|
(in millions)
|
||||||||||||||||||||
|
Year Ended December 31,
|
||||||||||||||||||||
|
2015
|
2014
|
2013
|
2012
|
2011
|
||||||||||||||||
|
Event-Driven Arb
|
$ |
|
869
|
$ |
|
796
|
$ |
|
691
|
$ |
|
721
|
$ |
|
513
|
|||||
|
Event-Driven Value (b)
|
145
|
167
|
140
|
124
|
132
|
|||||||||||||||
|
Other (c)
|
66
|
77
|
76
|
75
|
65
|
|||||||||||||||
|
Total AUM
|
$ |
|
1,080
|
$ |
|
1,040
|
$ |
|
907
|
$ |
|
920
|
$ |
|
710
|
|||||
| (a) | Asset levels include managed accounts, partnerships and offshore companies. |
| (b) | Excluding event merger arbitrage. |
| (c) | Includes investment vehicles focused on private equity, merchant banking, non-investment-grade credit and capital structure arbitrage. |
Through G.research, we provide institutional research services and act as an underwriter. G.research is regulated by FINRA. G.research's revenues are derived primarily from institutional research services, underwriting fees and selling concessions. As noted below, a significant portion of our institutional research services and underwriting revenues are from GAMCO and its affiliates. While the Spin-off is not expected to have any impact on our provision of these services to GAMCO and its affiliates, we can provide no assurance that GAMCO and its affiliates will continue use our institutional research and underwriting services to the same extent after the Spin-off. G.research provides institutional investors with investment ideas in numerous industries and special situations. Our research analysts are industry-focused, following sectors based on our core competencies. They research companies of all market capitalizations on a global basis, with a particular emphasis on small-cap and mid-cap companies. The primary function of the research team is to gather data, array the data, and then project and interpret data from which investment decisions can be made. Analysts publish their insights in the form of research reports and daily notes. In addition, G.research hosts selected conferences each year which bring together industry leaders and institutional investors. The objective of institutional research services is to provide superior investment ideas to investment decision makers.
Analysts are generally assigned to research platforms, coordinated by a senior analyst, in order to ensure a consistent process, enhance idea cross-fertilization and knowledge-sharing. Our research platforms include Digital, which includes cable, telecommunications, broadcasting, publishing, advertising, entertainment and technology; utilities and renewable energy; Consumer, Health and Wellness, Autos, Aerospace and Capital Goods; Natural Resources; and Financial Services.
G.research generates institutional research services revenues via hard dollar payments or through securities transactions executed on an agency basis on behalf of clients. Clients include institutional investors, such as hedge funds and asset managers, as well as affiliated mutual funds and client accounts. Institutional research services revenues totaled $8.4 million and $9.2 million for the years ended December 31, 2015 and 2014, respectively. G.research earned $4.9 million and $4.7 million, or approximately 59% and 54%, of its commission revenue from transactions executed on behalf of funds advised by Gabelli Funds, LLC, and clients advised by GAMCO Asset Management Inc. for the years ended December 31, 2015 and 2014, respectively. Additionally, for the years ended December 31, 2015 and 2014, Gabelli Funds, LLC and GAMCO Asset Management Inc. paid $0.8 million and $0.7 million, respectively, to G.research pursuant to research services agreements. Gabelli Funds, LLC and GAMCO Asset Management Inc. are both wholly owned subsidiaries of GAMCO. G.research continues to pursue expansion of third party and affiliated activities.
6
Certain employees of the Company or its affiliates own 1.9% of GSI, and the remaining 4.2% of GSI is owned by investors unrelated to the Company. Stockholders of GSI who are employees of the Company or its affiliates must sell their GSI shares to GSI at the book value per share of the previous fiscal year end when they leave the firm. The book value per share of GSI was $88.64 and $102.18 at December 31, 2015 and 2014, respectively.
Proprietary Trading
We received a substantial portfolio of cash and investments held by GAMCO prior to the Spin-off. We expect to use this proprietary investment portfolio to provide seed capital in introducing new products, expand our geographic presence, develop new markets and pursue strategic acquisitions, alliances and lift-outs, as well as for shareholder compensation in the form of share repurchases and dividends. Our proprietary portfolios are largely invested in products we manage or that are managed by GAMCO.
Our business strategy targets global growth of the business through continued leveraging of our proven asset management strengths including the long-term performance record of our alternative investment funds, diverse product offerings and experienced investment, research and client relationship professionals. In order to achieve performance and growth in AUM and profitability, we are pursuing a strategy which includes the following key elements:
Continuing an Active Fundamental Investment Approach
We have been managing hedge fund assets since 1985, when we launched our first merger arbitrage fund which still exists today, with an unparalleled thirty year track record. Our results through a multitude of market cycles clearly demonstrates our core competence in event driven investing. Our legacy of Gabelli "Private Market Value (PMV) with a Catalyst™" investing remains the principal management philosophy guiding our business operations. This method is based on investing principles articulated by Graham & Dodd, and has been further augmented by our founder Mario J. Gabelli. This approach, however, will not necessarily be utilized in connection with all products.
Growing our Investment Partnerships Advisory Business
We intend to grow our Investment Partnerships advisory business by gaining share in existing products and introducing new products within our core competencies, such as event and merger arbitrage. In addition, we intend to grow internationally.
Capitalizing on Acquisitions, Alliances and Lift-outs
We intend to leverage our research and investment capabilities to selectively and opportunistically pursue acquisitions, alliances and lift-outs that will broaden our product offerings and add new sources of distribution.
Pursuing Partnerships and Joint Ventures
We plan to pursue partnerships and joint ventures with partners that we believe have a strong fit with AC with respect to product quality and that might provide Asian/European distribution capabilities that would complement our U.S. equity product expertise. We expect to pursue investments in operating businesses based on our principal management philosophy, targeting opportunities with non-market correlated returns.
We intend to grow our Institutional Research Services business by increasing the breadth of our client base and by increasing our touch points and interactions with existing clientele in an effort to increase trading activity and payment flow.
Continuing Our Sponsorship of Industry Conferences
G.research, our institutional research services business, sponsors industry conferences and management events throughout the year. At these conferences and events, senior management from leading companies share their thoughts on the industry, competition, regulation and the challenges and opportunities in their businesses with portfolio managers and securities analysts. These meetings are an important component of the research services provided to institutional clients. In 2015, G.research hosted 7 such meetings:
7
|
●
|
39th Annual Automotive Aftermarket Symposium
|
|
●
|
25th Annual Pump, Valve & Water Systems Conference
|
|
●
|
21st Annual Aircraft Supplier Conference
|
|
●
|
7th Annual Movie & Entertainment Conference
|
|
●
|
6th Annual Specialty Chemicals Conference
|
|
●
|
3rd Television Broadcast Symposium
|
|
●
|
Inaugural Waste & Environmental Services Conference
|
We also have a tradition of sponsoring institutional investor symposiums that bring together prominent portfolio managers, members of academia and other leading business professionals to present, discuss and debate current issues and topics in the investment industry. These symposiums have included:
|
2015:
|
"Capital Allocation – The Tug of War"
|
|
2013:
|
"Value Investing 20 Years Later: A Celebration of the Roger Murray Lecture Series"
|
|
2006:
|
"Closed-End Funds: Premiums vs. Discounts, Dividends and Distributions"
|
|
2003:
|
"Dividends, Taxable versus Non-Taxable Issues"
|
|
2001:
1998:
|
"Virtues of Value Investing"
"The Role of Hedge Funds as a Way of Generating Absolute Returns"
|
|
1997:
|
"Active vs. Passive Stock Selection"
|
Attracting and Retaining Experienced Professionals
We offer significant variable compensation that provides opportunities to our staff. We expect to increase the scope of our investment management capabilities by adding portfolio managers and other investment personnel in order to expand our product offerings. Our ability to attract and retain highly experienced investment and other professionals with a long-term commitment to us and our clients has been, and will continue to be, a significant factor in our long-term growth.
Competition
The alternative asset management industry is intensively competitive and is expected to remain so. We face competition in all aspects of our business and in each of our investment strategies from other managers in the United States and globally. We compete with other alternative investment management firms, insurance companies, banks, brokerage firms and other financial institutions that offer products that have similar features and investment objectives. Many of these investment management firms are subsidiaries of large diversified financial companies and may have access to greater resources, including liquidity sources, not available to us. Many others are much larger in terms of AUM and revenues and, accordingly, have much larger sales organizations and marketing budgets. Historically, we have competed primarily on the basis of the long-term investment performance of many of our investment products. However, we have recently taken steps to increase our distribution channels, brand name awareness and marketing efforts.
The market for providing investment management services to institutional and private wealth management clients is also highly competitive. Selection of investment advisors by U.S. institutional investors is often subject to a screening process and to favorable recommendations by investment industry consultants. Many of these investors require their investment advisors to have a successful and sustained performance record, often five years or longer, with focus also on one-year and three-year performance records. We have significantly increased our AUM on behalf of U.S. institutional investors since our entry into the institutional asset management business. At the current time, we believe that our investment performance record would be attractive to potential new institutional and private wealth management clients. However, no assurance can be given that our efforts to obtain new business will be successful.
Intellectual Property
Service marks and brand name recognition are important to our business. We have rights to the service marks under which our products are offered. We have rights to use the "Gabelli" name, and the "GAMCO" name, pursuant to a Service Mark and Name License Agreement, a non-exclusive, royalty-free perpetual license agreement we have entered into with GAMCO (the "Service Mark and Name License Agreement"). GAMCO has licensed to us its rights to the "Gabelli" name and the "GAMCO" name for use with respect to our funds, collective investment vehicles, investment partnerships and other investment products pursuant to the Service Mark and Name License Agreement. The Service Mark and Name License Agreement has a perpetual term, subject to termination only in the event we are not in compliance with the quality control provisions in the Service Mark and Name License Agreement. Pursuant to an assignment agreement signed in 1999, Mario J. Gabelli had assigned to GAMCO all of his rights, title and interests in and to the "Gabelli" name for use in connection with investment management services and institutional research services. In addition, the funds managed by Mario J. Gabelli outside GAMCO and AC have entered into a license agreement with GAMCO permitting them to continue limited use of the "Gabelli" name under specified circumstances.
8
Regulation
Virtually all aspects of our businesses are subject to various federal, state and foreign laws and regulations. These laws and regulations are primarily intended to protect investment advisory clients and investors, the markets and customers of broker-dealers. Under such laws and regulations, agencies that regulate investment advisors and broker-dealers have broad powers, including the power to limit, restrict or prohibit such an advisor or broker-dealer from carrying on its business in the event that it fails to comply with such laws and regulations. In such an event, the possible sanctions that may be imposed include civil and criminal liability, the suspension of individual employees, injunctions, limitations on engaging in certain lines of business for specified periods of time, revocation of the investment advisor and other registrations, censures and fines.
Global Regulatory Reform
We are subject to numerous regulatory reform initiatives in each country in which we do business. Any such initiative, or any new laws or regulations or changes in enforcement of existing laws or regulations, could materially and adversely impact the scope or profitability of AC's business activities, lead to business disruptions, require AC to change certain business practices and expose AC to additional costs (including compliance and legal costs), as well as reputational harm. AC's profitability also could be materially and adversely affected by modification of the rules and regulations that impact the business and financial communities in general, including changes to the laws governing taxation, antitrust regulation and electronic commerce.
Dodd-Frank Wall Street Reform and Consumer Protection Act. In July 2010, the Dodd-Frank Wall Street Reform and Consumer Protection Act (the "DFA") was signed into law in the United States. The DFA is expansive in scope and requires the adoption of extensive regulations and numerous regulatory decisions, many of which have been adopted. As the impact of these rules will become evident over time, it is not yet possible to predict the ultimate effects that the DFA, or subsequent implementing regulations and decisions, will have upon AC's business, financial condition and results of operations.
Securities and Exchange Commission Review of Asset Managers. Our business may also be impacted by the SEC regulatory initiatives. For example, on December 11, 2014 the Chair of the SEC announced that she is recommending that the SEC enhance its oversight of asset managers by (i) expanding and updating data requirements with which asset managers must comply, (ii) improving fund level controls, including those related to liquidity levels and the nature of specific instruments and (iii) ensuring that asset management firms have appropriate transition plans in place to deal with market stress events or situations where an investment adviser is no longer able to serve its clients. Although these recommendations have not yet resulted in any proposed rules, any additional SEC oversight or the introduction of any new reporting, disclosure or control requirements could expose us to additional compliance costs and may require us to change how we operate our business.
Taxation. Our global business may be impacted by the Foreign Account Tax Compliance Act ("FATCA"), which was enacted in 2010 and introduced expansive new investor onboarding, withholding and reporting rules aimed at ensuring U.S. persons with financial assets outside of the United States pay appropriate taxes. In many instances, however, the precise nature of what needs to be implemented will be governed by bilateral Intergovernmental Agreements ("IGAs") between the United States and the countries in which we do business or have accounts. While many of these IGAs have been put into place, others have yet to be concluded. The FATCA rules will impact both U.S. and non-U.S. Funds and subject us to extensive additional administrative burdens. The Organization for Economic Co-operation and Development has also recently launched the business erosion and profit shifting ("BEPS") proposal that aims to rationalize tax treatment across jurisdictions. If the BEPS proposal becomes the subject of legislative action in the format proposed, it could have unintended taxation consequences for collective investment vehicles and our tax position, which could adversely affect our financial condition.
In addition, certain individual EU Member States, such as France and Italy, have enacted national financial transaction taxes ("FTTs"). There has also been renewed momentum by several other Member States to introduce FTTs, which would impose taxation on a broad range of financial instrument and derivatives transactions. In general, any tax on securities and derivatives transactions would impact investors and would likely have a negative impact on the liquidity of the securities and derivatives markets, could diminish the attractiveness of certain types of products that we manage in those countries and could cause clients to shift assets away from such products. An FTT could significantly increase the operational costs of our entering into, on behalf of our clients, securities and derivatives transactions that would be subjected to an FTT, which could adversely impact our financial results and clients' performance results.
9
Our business could also be impacted to the extent there are other changes to tax laws. For example, the administration recently announced its proposed U.S. federal budget, which called for new industry fees for financial firms. To the extent such fees are adopted and found to apply to us; such fees could adversely affect our financial results.
Alternative Investment Fund Managers Directive. Our European business is impacted by the EU Alternative Investment Fund Managers Directive ("AIFMD"), which became effective on July 21, 2011. The AIFMD regulates managers of, and service providers to, a broad range of alternative investment funds ("AIFs") domiciled within and (depending on the precise circumstances) outside the EU. The AIFMD also regulates the marketing of all AIFs inside the European Economic Area ("EEA"). The AIFMD is being implemented in stages, which run through 2018. Compliance with the AIFMD's requirements restrict alternative investment fund marketing and impose additional compliance and disclosure obligations regarding remuneration, capital requirements, leverage, valuation, stakes in EU companies, depositaries, the domicile of custodians and liquidity management on AC. These new compliance and disclosure obligations and the associated risk management and reporting requirements will subject us to additional expenses.
Undertakings for Collective Investment in Transferable Securities. The EU has also adopted directives on the coordination of laws, regulations and administrative provisions relating to undertakings for collective investment in transferable securities ("UCITS") as regards depositary functions, remuneration policies and sanctions. The latest initiative in this area, UCITS V, which became effective in September 2014, seeks to align the depositary regime, remuneration rules and sanctioning powers of regulators under the UCITS Directive with the requirements of the AIFMD. UCITS V is required to be adopted in the national law of each EU member state during the second quarter of 2016. Similarly, in August 2014 ESMA revised the guidelines it initially published in 2012 on exchange-traded funds and other UCITS funds. The guidelines introduced new collateral management requirements for UCITS funds concerning collateral received in the context of derivatives using Efficient Portfolio Management ("EPM") techniques (including securities lending) and over-the-counter derivative transactions. These rules, which are now in effect, required us to make a series of changes to its collateral management arrangements applicable to the EPM of its UCITS fund ranges. Compliance with the UCITS directives will cause us to incur additional expenses associated with new risk management and reporting requirements.
Existing U.S. Regulation Overview
AC and certain of its U.S. subsidiaries are currently subject to extensive regulation, primarily at the federal level, by the SEC, the Department of Labor, FINRA and other government agencies and regulatory bodies. Certain of our U.S. subsidiaries are also subject to various anti-terrorist financing, privacy, anti-money laundering regulations and economic sanctions laws and regulations established by various agencies.
The Investment Advisers Act of 1940
GSI is registered with the SEC under the Advisers Act and is regulated by and subject to examination by the SEC. The Advisers Act imposes numerous obligations on registered investment advisors including fiduciary duties, disclosure obligations and record keeping, operational and marketing requirements. The SEC is authorized to institute proceedings and impose sanctions for violations of the Advisers Act, ranging from censure to termination of an investment advisor's registration. The failure of GSI to comply with the requirements of the SEC could have a material adverse effect on us.
We derive a substantial majority of our revenues from investment advisory services through our various investment management agreements. Under the Advisers Act, our investment management agreements may not be assigned without the client's consent.
Broker-Dealer and Trading and Investment Regulation
G.research is registered as broker-dealer with the SEC and is subject to regulation by FINRA and various states. In its capacity as a broker-dealer, G.research is required to maintain certain minimum net capital amounts. These requirements also provide that equity capital may not be withdrawn, advances to affiliates may not be made or cash dividends paid if certain minimum net capital requirements are not met. G.research's net capital, as defined, met or exceeded all minimum requirements as of December 31, 2015. As a registered broker-dealer, G.research is also subject to periodic examination by FINRA, the SEC and the state regulatory authorities.
Our trading and investment activities for client accounts are regulated under the Exchange Act, as well as the rules of various U.S. and non-U.S. securities exchanges and self-regulatory organizations, including laws governing trading on inside information, market manipulation and a broad number of technical requirements (e.g., short sale limits, volume limitations and reporting obligations) and market regulation policies in the United States and globally. Violation of any of these laws and regulations could result in restrictions on our activities and damage our reputation.
10
Potential Legislation Relating to Private Pools of Capital
We manage a variety of private pools of capital, including hedge funds. Congress, regulators, tax authorities and others continue to explore, on their own and in response to demands from the investment community and the public, increased regulation related to private pools of capital, including changes with respect to investor eligibility, certain limitations on trading activities, record-keeping and reporting, the scope of anti- fraud protections, safekeeping of client assets and a variety of other matters. AC may be materially and adversely affected by new legislation, rule-making or changes in the interpretation or enforcement of existing rules and regulations imposed by various regulators.
Employee Retirement Income Security Act of 1974 ("ERISA")
Subsidiaries of AC are subject to ERISA and to regulations promulgated thereunder, insofar as they are "fiduciaries" under ERISA with respect to certain of their clients ERISA and applicable provisions of the Code, impose certain duties on persons who are fiduciaries under ERISA and prohibit certain transactions involving ERISA plan clients. Our failure to comply with these requirements could have a material adverse effect on us.
The Patriot Act
The USA Patriot Act of 2001 contains anti-money laundering and financial transparency laws and mandates the implementation of various new regulations applicable to broker-dealers and other financial services companies, including standards for verifying client identification at account opening, and obligations to monitor client transactions and report suspicious activities. Anti-money laundering laws outside of the United States contain some similar provisions. Our failure to comply with these requirements could have a material adverse effect on us.
Laws and Other Issues Relating to Taking Significant Equity Stakes in Companies
Investments by AC and on behalf of our advisory clients and Investment Partnerships often represent a significant equity ownership position in an issuer's class of stock. As of December 31, 2015, we had five percent or more beneficial ownership with respect to 116 equity securities (this is partially due to the fact that we may be deemed to be a member of "group" with GAMCO and therefore may be deemed to beneficially own the securities owned by that group). This activity raises frequent regulatory, legal and disclosure issues regarding our aggregate beneficial ownership level with respect to portfolio securities, including issues relating to issuers' stockholder rights plans or "poison pills," and various federal and state regulatory limitations, including state gaming laws and regulations, federal communications laws and regulations and federal and state public utility laws and regulations, as well as federal proxy rules governing stockholder communications and federal laws and regulations regarding the reporting of beneficial ownership positions. Our failure to comply with these requirements could have a material adverse effect on us.
Existing International Regulation Overview
Our international operations are subject to the laws and regulations of a number of international jurisdictions, as well as oversight by numerous regulatory agencies and bodies in those jurisdictions. In some instances, they are also affected by U.S. laws and regulations that have extra-territorial application.
Below is a summary of certain international regulatory standards to which AC is subject. It is not meant to be comprehensive as there are parallel legal and regulatory arrangements in force in many jurisdictions where AC's subsidiaries conduct business.
Of note among the various other international regulations to which AC is subject, are the extensive and increasingly stringent regulatory reporting requirements that necessitate the monitoring and reporting of issuer exposure levels (thresholds) across the holdings of managed funds and accounts and those of AC.
European Regulation
The Financial Conduct Authority ("FCA") currently regulates AC in the United Kingdom. It also regulates those U.K. subsidiaries' branches established in other European countries and the U.K. branches of certain of AC's U.S. subsidiaries. Authorization by the FCA is required to conduct certain financial services related business in the United Kingdom under the Financial Services and Markets Act 2000. The FCA's rules adopted under that Act govern the majority of a firm's capital resources requirements, senior management arrangements, and conduct of business, interaction with clients and systems and controls. The FCA supervises AC through a combination of proactive engagement, event-driven and reactive supervision and thematic based reviews in order to monitor our compliance with regulatory requirements. Breaches of the FCA's rules may result in a wide range of disciplinary actions against our U.K.-regulated subsidiaries and/or its employees.
11
In addition, our U.K.-regulated subsidiaries and other European subsidiaries and branches must comply with the pan-European regulatory regime established by the Markets in Financial Instruments Directive ("MiFID"), which became effective on November 1, 2007 and regulates the provision of investment services and activities throughout the wider EEA. MiFID, the scope of which is being enhanced through MiFID 2 which is described more particularly under "—Global Regulatory Reform" above, sets out detailed requirements governing the organization and conduct of business of investment firms and regulated markets. It also includes pre- and post-trade transparency requirements for equity markets and extensive transaction reporting requirements. In addition, relevant entities must comply with revised obligations on capital resources for banks and certain investment firms (the Capital Requirements Directive), which became effective in January 2014. These include requirements not only on capital, but address matters of governance and remuneration as well. The obligations introduced through these directives will have a direct effect on some of our European operations.
Our EU-regulated subsidiaries are additionally subject to an EU regulation on OTC derivatives, central counterparties and trade repositories, which was adopted in August 2012 and which requires (i) the central clearing of standardized OTC derivatives, (ii) the application of risk-mitigation techniques to non-centrally cleared OTC derivatives and (iii) the reporting of all derivative contracts from February 2014.
Regulatory Matters
The investment management industry is likely to continue facing a high level of regulatory scrutiny and become subject to additional rules designed to increase disclosure, tighten controls and reduce potential conflicts of interest. In addition, the Commission has substantially increased its use of focused inquiries which request information from investment advisors and a number of fund complexes regarding particular practices or provisions of the securities laws. We participate in some of these inquiries in the normal course of our business. Changes in laws, regulations and administrative practices by regulatory authorities, and the associated compliance costs, have increased our cost structure and could in the future have a material adverse impact. Although we have installed procedures and utilize the services of experienced administrators, accountants and lawyers to assist us in adhering to regulatory guidelines and satisfying these requirements, and maintain insurance to protect ourselves in the case of client losses, there can be no assurance that the precautions and procedures that we have instituted and installed, or the insurance that we maintain to protect ourselves in case of client losses, will protect us from all potential liabilities.
Employees
On February 29, 2016, we had a full-time staff of 72 teammates, of whom 45 served in the portfolio management, research and trading areas, 19 served in the marketing and shareholder servicing areas and 8 served in the administrative area. We also avail ourselves of services provided by GAMCO employees in accordance with the Transitional Services Agreement that were entered into with GAMCO as part of the Spin-off.
Status as an Emerging Growth Company and a Smaller Reporting Company
We are an "emerging growth company," as defined in the JOBS Act, and we are eligible to take advantage of certain exemptions from various reporting requirements that are applicable to other public companies that are not "emerging growth companies." These exemptions include not being required to comply with the auditor attestation requirements of Section 404 of the Sarbanes-Oxley Act, reduced disclosure obligations regarding executive compensation in our periodic reports and proxy statements and exemptions from the requirements of holding a nonbinding advisory vote on executive compensation and stockholder approval of any golden parachute payments not previously approved.
We may take advantage of some or all of the reduced regulatory and reporting requirements that will be available to us as long as we qualify as an emerging growth company, except that we have irrevocably elected not to take advantage of the extension of time to comply with new or revised financial accounting standards available under Section 107(b) of the JOBS Act.
We will, in general, remain as an emerging growth company for up to five full fiscal years following the Spin-off. We would cease to be an emerging growth company and, therefore, become ineligible to rely on the above exemptions, if we:
|
●
|
have more than $1 billion in annual revenue in a fiscal year;
|
|
●
|
issue more than $1 billion of non-convertible debt during the preceding three-year period; or
|
12
|
●
|
become a "large accelerated filer" as defined in Exchange Act Rule 12b-2, which would occur after: (i) we have filed at least one annual report pursuant to the Exchange Act; (ii) we have been an SEC-reporting company for at least 12 months; and (iii) the market value of AC common stock that is held by non-affiliates exceeds $700 million as of the last business day of our most recently completed second fiscal quarter.
|
In addition, we qualify as a "smaller reporting company" under the Exchange Act. As a smaller reporting company, we enjoy many of the same exemptions as emerging growth companies, in addition to scaled disclosures. We will likely cease to be a smaller reporting company beginning in the year after our public float at the end of the second quarter of our fiscal year (June 30) exceeds $75 million. We expect this to occur on June 30, 2016, and as such we would be required to transition out of the scaled disclosure system for "smaller reporting companies" by the time we filed our quarterly report on Form 10-Q covering the first fiscal quarter of the fiscal year 2017, which would be due in May 2017. However, we would still be able to avail ourselves of the "emerging growth company" exemptions.
We caution the reader that the following risks and those risks described elsewhere in this report and in our other SEC filings could have a material adverse effect on our business, prospects, financial condition, results of operations or cash flow or could cause a decline in the Company's stock price.
Risks Related to the Spin-off
We may not achieve the benefits expected from our Spin-off from GAMCO and may be more susceptible to adverse events.
We expect that, as a company independent from GAMCO, we will be able to grow organically and through acquisitions. Nonetheless, we may not be able to achieve either of these goals. Furthermore, by separating from GAMCO, there is a risk that we may be more susceptible to adverse events than we would have otherwise experienced as a subsidiary of GAMCO. As a subsidiary of GAMCO, we enjoyed certain benefits, including economies of scope and scale in costs, employees and business relationships. These benefits may not be as readily achievable as a smaller, stand-alone company.
Certain of our directors and officers may have actual or potential conflicts of interest because of their positions or relationships with GAMCO.
Mario J. Gabelli serves as our Chairman and Chief Executive Officer and also continues to serve as Chairman and Chief Executive Officer of GAMCO. Our President, Marc Gabelli, is a son of Mario J. Gabelli and also serves on the GAMCO Board. Marc Gabelli continues to have responsibilities relating to GAMCO, including continuing to serve on the GAMCO Board and participating on GAMCO's portfolio management team. Kevin Handwerker, Associated Capital's Executive Vice President, General Counsel and Secretary also serves in the same capacities for GAMCO. In addition, some of our portfolio managers and employees will initially be provided pursuant to the Transitional Services Agreement with GAMCO and will be officers or employees of GAMCO. Such dual assignments could create, or appear to create, potential conflicts of interest when our and GAMCO's officers and directors face decisions that could have different implications for the two companies.
Associated Capital has renounced its rights to certain business opportunities, and our certificate of incorporation will provide that no director or officer of Associated Capital will breach their fiduciary duty and therefore be liable to Associated Capital or its stockholders by reason of the fact that any such individual directs a corporate opportunity to another person or entity (including GAMCO) instead of Associated Capital, or does not refer or communicate information regarding such corporate opportunity to Associated Capital, unless (x) such opportunity was expressly offered to such person solely in his or her capacity as a director or officer of Associated Capital or as a director or officer of any of our subsidiaries, and (y) such opportunity relates to a line of business in which Associated Capital or any of its subsidiaries is then directly engaged; provided, however, if the conditions specified in the immediately preceding clauses (x) and (y) are satisfied, any officer or director of Associated Capital may pursue such corporate opportunity (or direct it to another person or entity) if either (i) Associated Capital renounces its interest in the potential business opportunity in writing or (ii) Associated Capital does not within a reasonable period of time, begin to pursue, or thereafter continue to pursue, such corporate opportunity diligently and in good faith. Our certificate of incorporation specifically provides that any person purchasing, receiving or otherwise becoming an owner of any shares of our capital stock, or any interest therein, will be deemed to have notice of and to have consented to the corporate opportunity policy contained in our certificate of incorporation.
Also, some of our directors, executive officers, portfolio managers and teammates own shares of GAMCO common stock and GAMCO restricted stock awards ("RSAs") or other GAMCO equity awards. At the time of the Spin-off, these equity awards were supplemented by the awarding of Associated Capital RSAs. Specifically, outstanding RSAs relating to GAMCO remain unchanged, with each RSA holder also receiving an equal number of RSAs relating to Associated Capital. The terms of the new Associated Capital RSAs are the same as the terms of the pre-Spin-off GAMCO RSAs. The purpose of the issuance was to ensure that any employee who had GAMCO RSAs was granted an equal number of AC RSAs so that the total value of the RSAs post-spin-off was equivalent to the total value pre-spin-off. The ownership of these RSAs may create, or may create the appearance of, conflicts of interest.
13
In addition, potential conflicts of interest could arise in connection with the resolution of any dispute that may arise between GAMCO and Associated Capital regarding the terms of the agreements governing the separation and the relationship thereafter between the companies. The executive officers and other personnel of GAMCO who serve as directors or executive management of Associated Capital may interpret these agreements in their capacity as GAMCO employees in a manner that would adversely affect the business of Associated Capital.
Also, certain subsidiaries of GAMCO and GSI are investment advisers. The executive officers and other personnel of GAMCO who also serve as directors or executive management of Associated Capital may be confronted with the possibility of making decisions in their GAMCO capacity that would adversely affect the business of Associated Capital.
Associated Capital and GAMCO expect to be vigilant in attempting to identify and resolve any potential conflicts of interest, including but not limited to the types described above, at the earliest possible time. However, there can be no guarantee that the interests of Associated Capital may not be adversely affected at some point by such a conflict.
The separation from GAMCO may adversely affect the level of our assets under management ("AUM").
Our revenues are dependent on the amount of our AUM as well as the performance of our products. Many investors may have invested assets in alternative investment products (the "Alternative Investments") in part because GSI was a subsidiary of GAMCO. There can be no assurance that we will be able to attract investors to the Alternative Investments at the same rate as in prior years. In addition, we can make no assurance that current investors will not redeem their investments from the Alternative Investments as a result of our changed relationship with GAMCO. The occurrence of either of these events could adversely affect our business, results of operations and financial condition.
Concerns about our prospects as a stand-alone company could affect our ability to attract and retain employees or individuals whom we are attempting to recruit as employees.
Our employees or individuals whom we are attempting to recruit as employees may have concerns about our prospects as a stand-alone company, including our ability to maintain our independence and our inability to continue our current reliance on GAMCO's resources. If we are not successful in assuring our employees or individuals whom we are attempting to recruit as employees of our prospects as an independent company, our employees or recruits may seek or accept other employment, which could adversely affect our business and our results of operations.
We may have been able to receive better terms from unaffiliated third parties than the terms provided in our agreements with GAMCO.
The agreements related to our separation from GAMCO, including, but not limited to, the Separation Agreement, the Transitional Services Agreement and the Service Mark and Name License Agreement, were negotiated in the context of our separation from GAMCO while Associated Capital was still majority-owned by GAMCO. Accordingly, they may not reflect terms that would have been reached between unaffiliated parties. The terms of the agreements we negotiated in the context of our separation related to, among other things, indemnities and other obligations between GAMCO and us. Had these agreements been negotiated with unaffiliated third parties, they might have been more favorable to us.
In connection with the Spin-off, GAMCO has indemnified us for certain liabilities. There can be no assurance that the indemnity will be sufficient to insure us against the full amount of such liabilities, or that GAMCO's ability to satisfy its indemnification obligations will not be impaired in the future.
Pursuant to the Separation Agreement, GAMCO will agree to indemnify us from certain liabilities. Third parties could seek to hold us responsible for any of the liabilities that GAMCO has agreed to retain, and there can be no assurance that the indemnity from GAMCO will be sufficient to protect us against the full amount of such liabilities or that GAMCO will be able to fully satisfy its indemnification obligations. Moreover, even if we ultimately succeed in recovering from GAMCO any amounts for which we are held liable, we may be temporarily required to bear those losses until such recovery. Each of these risks could adversely affect our business, results of operations and financial condition.
14
Risks Related to Our Industry
Changes in laws or regulations or in governmental policies and compliance with existing laws or regulations could limit the sources and amounts of our revenues, increase our costs of doing business, decrease our profitability and materially and adversely affect our business.
Our business is subject to extensive regulation in the United States, primarily at the federal level, including regulation by the SEC under the Advisers Act as well as other securities laws, by the Department of Labor under ERISA, and regulation by FINRA and state regulators. The Advisers Act imposes numerous obligations on investment advisors, including record-keeping, advertising and operating requirements, fiduciary and disclosure obligations, custodial requirements and prohibitions on fraudulent activities. In addition, our businesses are also subject to regulation by the FCA in the United Kingdom, and we are also subject to the laws of other non-U.S. jurisdictions and non-U.S. regulatory agencies or bodies.
Our failure to comply with applicable laws or regulations could result in fines, censure, suspensions of personnel or other sanctions, including revocation of our subsidiaries' registrations as an investment advisor or broker-dealer. Industry regulations are designed to protect our clients and investors in our funds and other third parties who deal with us and to ensure the integrity of the financial markets. Our industry is frequently altered by new laws or regulations and by revisions to, and evolving interpretations of, existing laws and regulations, both in the United States and in other nations. Changes in laws or regulations or in governmental policies could limit the sources and amounts of our revenues, increase our costs of doing business, decrease our profitability and materially and adversely affect our business.
We are subject to extensive and pervasive regulation around the world.
Our business is subject to extensive regulation around the world. These regulations subject our business activities to a pervasive array of increasingly detailed operational requirements, compliance with which is costly, time-consuming and complex. We may be adversely affected by our failure to comply with current laws and regulations or by changes in the interpretation or enforcement of existing laws and regulations. Challenges associated with interpreting regulations issued in numerous countries in a globally consistent manner may add to such risks if regulators in different jurisdictions have inconsistent views or provide only limited regulatory guidance. In particular, violation of applicable laws or regulations could result in fines, temporary or permanent prohibition of certain activities, reputational harm and related client terminations, suspensions of employees or revocation of their licenses, suspension or termination of investment adviser, broker-dealer or other registrations or other sanctions, which could have a material adverse effect on our reputation or business and may cause our AUM, revenue and earnings to decline.
New tax legislation or changes in U.S. and foreign tax laws and regulations or challenges to Associated Capital's historical taxation practices may adversely affect Associated Capital's effective tax rate, business and overall financial condition.
Our businesses may be affected by new tax legislation or regulations, or the modification of existing tax laws and regulations, by U.S. or non-U.S. authorities. In particular, the Foreign Account Tax Compliance Act ("FATCA") has introduced expansive new investor onboarding, withholding and reporting rules aimed at ensuring U.S. persons with financial assets outside of the United States pay appropriate taxes. The FATCA rules will impact both U.S. and non-U.S. funds and subject Associated Capital to extensive additional administrative burdens. Certain of our FATCA compliance are done by third parties, and we cannot be certain that they will always comply with applicable FATCA rules. Similarly, there has been renewed momentum by several European Union ("EU") Member States to introduce national FTTs, which would impose taxation on a broad range of financial instrument and derivatives transactions. If introduced as proposed, FTTs could have an adverse effect on Associated Capital's financial results and on clients' performance results. In addition, the Organization for Economic Co-operation and Development recently launched a BEPS proposal that aims to rationalize tax treatment across jurisdictions. If the BEPS proposal becomes the subject of legislative action in the format proposed, it could have unintended taxation consequences for collective investment vehicles and our tax position, which could adversely affect our financial condition.
We also manage significant assets in products and accounts that have specific tax and after-tax related objectives, which could be adversely impacted by changes in tax policy. Additionally, any new legislation, modification or interpretation of tax laws could impact Associated Capital's corporate tax position. The application of complex tax regulations involves numerous uncertainties and in the normal course of business, U.S. and non-U.S. tax authorities may review and challenge Associated Capital's historical tax positions. These challenges may result in adjustments to Associated Capital's tax position, or impact the timing or amount of, taxable income, deductions or other tax allocations, which may adversely affect Associated Capital's effective tax rate and overall financial condition.
15
To the extent we are forced to compete on the basis of price, we may not be able to maintain our current fee structure.
The investment management business is highly competitive and has relatively low barriers to entry. To the extent we are forced to compete on the basis of price, we may not be able to maintain our current fee structure. Although our investment management fees vary from product to product, historically we have competed primarily on the performance of our products and not on the level of our investment management fees relative to those of our competitors. In recent years, however, there has been a trend toward lower fees in the investment management industry. In order to maintain our fee structure in a competitive environment, we must be able to continue to provide clients with investment returns and service that make investors willing to pay our fees. We cannot be assured that we will succeed in providing investment returns and service that will allow us to maintain our current fee structure. Fee reductions on existing or new business could have an adverse effect on our profit margins and results of operations.
Catastrophic and unpredictable events could have a material adverse effect on our business.
A terrorist attack, political unrest, war (whether or not directly involving the United States), power failure, cyber-attack, technology failure, natural disaster or many other possible catastrophic or unpredictable events could adversely affect our future revenues, expenses and earnings by, among other things: causing disruptions in United States, regional or global economic conditions; interrupting our normal business operations; inflicting employee casualties, including loss of our key executives; requiring substantial expenditures and expenses to repair, replace and restore normal business operations; and reducing investor confidence.
Pursuant to the Transitional Services Agreement with GAMCO, we have a disaster recovery plan to address certain contingencies, but we cannot assure you that this plan will be effective or sufficient in responding to, eliminating or ameliorating the effects of all disaster scenarios. If our employees or vendors we rely upon for support in a catastrophic event are unable to respond adequately or in a timely manner, we may lose clients resulting in a decrease in AUM which may have a material adverse effect on revenues and net income.
The soundness of other financial institutions could adversely affect our business.
Financial services institutions are interrelated as a result of trading, clearing, counterparty or other relationships. We and the investments we manage may have exposure to many different industries and counterparties, and we routinely execute transactions with counterparties in the financial services industry, including: brokers and dealers, commercial banks, investment banks, clearing organizations, mutual and hedge funds and other institutions. Many of these transactions expose us and the accounts we manage to credit risk in the event of the counterparty's default. There is no assurance that any such losses would not materially and adversely impact Associated Capital's revenues and earnings.
Risks Related to Our Business
Control by Mario J. Gabelli of a majority of the combined voting power of Associated Capital common stock may give rise to conflicts of interests.
Mario J. Gabelli, through his control and majority ownership of GGCP and his individual ownership of Associated Capital common stock, will beneficially own a majority of our outstanding Associated Capital Class B Stock, representing approximately 94.7% voting control. As long as Mario J. Gabelli indirectly beneficially owns a majority of the combined voting power of Associated Capital common stock, he will have the ability to elect all of the members of our Board and thereby control our management and affairs, including determinations with respect to acquisitions, dispositions, borrowings, issuances of common stock or other securities, and the declaration and payment of dividends on the Associated Capital common stock. In addition, Mario J. Gabelli will be able to determine the outcome of all matters submitted to a vote of our stockholders for approval and will be able to cause or prevent a change in control of Associated Capital. As a result of Mario J. Gabelli's control, none of our agreements with Mario J. Gabelli and other companies controlled by him can be assumed to have been arrived at through "arm's-length" negotiations, although the parties endeavor to implement market-based terms. There can be no assurance that we would not have received more favorable terms, or offered less favorable terms to, an unaffiliated party.
In addition, Mario J. Gabelli, through his control and majority ownership of GGCP, controls GAMCO, and he could take actions that favor GAMCO over Associated Capital.
We may compete with GAMCO for clients and investment opportunities.
Although our business is expected to focus primarily on alternative investment management and institutional services, while GAMCO is expected to focus primarily on its mutual fund and institutional and private wealth management businesses, situations may arise where we find ourselves directly competing with GAMCO for investment clients and opportunities. For example, it is possible that a potential investor might consider investing in Associated Capital and GAMCO investment products and that such potential investor will have to choose between our investment products and those offered by GAMCO. In addition, Associated Capital and GAMCO could pursue the same investment opportunities in the future.
16
Investors in our products have the right to redeem their investments in our products on a regular basis and could redeem a significant amount of AUM during any given quarterly period, which would result in significantly decreased revenues.
Subject to any specific redemption provisions applicable to a product, investors may generally redeem their investments in our products on an annual or quarterly basis following the expiration of a specified period of time. In a declining market, the pace of redemptions and consequent reduction in our AUM potentially could accelerate. Furthermore, investors in our products may also invest in products managed by other alternative asset managers that have restricted or suspended redemptions or may in the future do so. Such investors may redeem capital from our products, even if our performance is superior to such other alternative asset managers' performance, if they are restricted or prevented from redeeming capital from those other managers.
The decrease in revenues that would result from significant redemptions in our products could have a material adverse effect on our results of operations, cash flows and business. In 2009, due to factors related to the financial crisis, investors redeemed approximately $62 million invested in Associated Capital's products which represented approximately 20% of Associated Capital's AUM at that time. If economic and market conditions remain uncertain or worsen, we may once again experience significant redemptions.
Our business and financial condition may be materially adversely impacted by the highly variable nature of our revenues, results of operations and cash flows. In a typical year, a substantial portion of our incentive allocation income is determined and recorded in the fourth quarter of each year, which means that our interim results are not expected to be indicative of our results for a full year.
Our revenues are influenced by the combination of the amount of AUM and the investment performance of our products. Asset flows, whether inflows or outflows, can be highly variable from month to month and quarter to quarter. Furthermore, our products' investment performance, which affects the amount of AUM, can be volatile due to, among other things, general market and economic conditions. Accordingly, our revenues, results of operations and cash flows may be highly variable. This variability is exacerbated during the fourth quarter of each fiscal year, primarily due to the fact that a substantial portion of our revenues historically has been, and we expect will continue to be, derived from incentive allocation income from our products. Incentive allocation income is contingent on the investment performance of the products as of the relevant measurement period, which generally is as of the end of each calendar year. We may also experience fluctuations in our results from quarter to quarter due to a number of other factors, including changes in management fees resulting from changes in the values of our products' investments, other changes in the amount of AUM, changes in our operating expenses, unexpected business developments and initiatives and, as discussed above, general economic and market conditions. Such variability and unpredictability may lead to volatility or declines in the price of the our Stock and cause our results for a particular period not to be indicative of our performance in a future period or meaningful as a basis of comparison against results for a prior period.
The amount of incentive allocation income that may be generated by our products is uncertain until it is determined and realized at a particular point in time. We generally do not record incentive allocation income in our interim financial statements other than incentive allocation income earned as a result of investor redemptions during the period. As a result of these and other factors, our interim results may not be indicative of historical performance or the results that may be expected for a full year.
In addition, a substantial portion of our products' AUM have "high-water marks." This means that if an investor experiences losses in a given year, we will not be able to earn incentive allocation income with respect to such investor's investment unless and until our investment performance surpasses the high-water mark. The incentive allocation income we earn is therefore dependent on the net asset value of each investor's investment in our products. As of December 31, 2015, approximately 5% of our AUM was below a high-water mark, with a loss carryforward amount that was approximately 0.3% of AUM. We can make no assurances that our investors will not experience losses in future years and, as a result, we may not earn incentive allocation income in those or subsequent years until such losses are earned back.
A decline in the prices of securities generally could lead to a decline in our AUM, revenues and earnings.
Substantially all of our revenues are directly related to both the amount of our AUM and the performance of our investment products. Under our investment advisory contracts, the investment advisory fees we receive are typically based on the market value of AUM. Accordingly, a decline in the prices of securities generally may cause our revenues and net income to decline by either causing the value of our AUM to decrease, which would result in lower investment advisory fees, or causing our clients to withdraw funds in favor of investments they perceive to offer greater opportunity or lower risk, which would also result in lower fees. The securities markets are highly volatile, and securities prices may increase or decrease for many reasons beyond our control, including but not limited to economic and political events, war (whether or not directly involving the United States), acts of terrorism, unanticipated changes in currency exchange rates, interest rates, inflation rates, the yield curve, defaults by derivative counterparties, bond default risks, decreases in commodity prices, slowing growth in other countries, particularly China, the sovereign debt crisis in Europe and other factors that are difficult or impossible to predict or even to identify. If a decline in securities prices caused our revenues to decline, it could have a material adverse effect on our earnings.
17
The loss of the services of Mario J. Gabelli and other key personnel could have a material adverse effect on our business.
We are dependent on the efforts of Mario J. Gabelli, our Executive Chairman and Chief Executive Officer. In this regard, it is expected that Mario J. Gabelli will resign as our Chief Executive Officer approximately one year after the date of the Spin-off. However, it is expected that he will remain our Executive Chairman after he resigns as Chief Executive Officer. The loss of the services of Mario J. Gabelli could have a material adverse effect on our business, and we cannot provide assurance that we will be able to find a suitable replacement as Chief Executive Officer if Mario J. Gabelli resigns in a year as expected.
Our future success depends to a substantial degree on our ability to retain and attract other qualified personnel to conduct our investment management business. The market for qualified portfolio managers is extremely competitive and has grown more so in recent periods as the investment management industry has experienced growth. We anticipate that it will be necessary for us to add portfolio managers and investment analysts as we further diversify our investment products and strategies. There can be no assurance, however, that we will be successful in our efforts to recruit and retain the required personnel. In addition, our investment professionals and senior marketing personnel have direct contact with our clients, which can lead to strong client relationships. The loss of these personnel could jeopardize our relationships with certain clients, and result in the loss of such accounts. The loss of key management professionals or the inability to recruit and retain sufficient portfolio managers and marketing personnel could have a material adverse effect on our business.
We have experienced and may again experience periods of rapid growth and significant declines in AUM, which place significant demands on our legal, compliance, accounting, risk management, administrative and operational resources.
Our AUM grew from approximately $230 million as of December 31, 1999 to $814 million as of December 31, 2004. Between December 31, 2004 and December 31, 2008, our AUM had declined to $295 million due to investment losses and redemptions experienced by our funds over that period. As of December 31, 2015, our AUM had grown to approximately $1.08 billion.
Rapid changes in our AUM impose significant demands on our legal, compliance, accounting, risk management, administrative and operational infrastructure. The complexity of these demands and the time and expense required to address them, is a function not simply of the amount by which our AUM have changed, but also of significant differences in the investing strategies employed within our funds and the time periods during which these changes occur. Furthermore, our future growth will depend on, among other things, our ability to develop and maintain highly reliable operating platforms, management systems and financial reporting and compliance infrastructures that are also sufficiently flexible to promptly and appropriately address our business needs, applicable legal and regulatory requirements and relevant market and other operating conditions, all of which can change rapidly.
There may be adverse effects on our business from a decline in the performance of the securities markets.
Our results of operations are affected by many economic factors, including the performance of the securities markets. During the 1990s, unusually favorable and sustained performance of the U.S. securities markets, and the U.S. equity market in particular, attracted substantial inflows of new investments in these markets. That contributed to significant market appreciation which, in turn, led to an increase in our AUM and revenues. More recently, the securities markets in general have experienced significant volatility, and such volatility may continue or increase in the future. At December 31, 2015, our AUM are primarily invested in equity securities. Any decline in the securities markets, in general, and the equity markets, in particular, could reduce our AUM and consequently reduce our revenues. In addition, any such decline in the equity markets, failure of these markets to sustain their prior levels of growth, or continued short-term volatility in these markets could result in investors withdrawing from the equity markets or decreasing their rate of investment, either of which would be likely to adversely affect us. Also, from time to time, a relatively high proportion of the assets we manage may be concentrated in particular economic or industry sectors. A general decline in the performance of securities in those industry sectors could have an adverse effect on our AUM and revenues.
There is a possibility of losses associated with proprietary investment activities.
Currently, we maintain large proprietary investment positions in securities. Market fluctuations and other factors may result in substantial losses in our proprietary accounts, which could have an adverse effect on our balance sheet, reduce our ability or willingness to make new investments or impair our credit ratings.
18
Future investment performance could reduce revenues and other income.
Success in the investment management business is dependent on investment performance as well as distribution and client servicing. Good performance generally stimulates sales of our investment products and tends to keep withdrawals and redemptions low, which generates higher management fees (which are based on the amount of AUM). Conversely, poor performance, both in absolute terms and/or relative to peers and industry benchmarks, tends to result in decreased sales, increased withdrawals and redemptions and in the loss of clients, with corresponding decreases in revenues to us. Failure of our investment products to perform well could, therefore, have a material adverse effect on us.
In addition, when our investment products experience strong results relative to the market or other asset classes, clients' investments in our products may increase beyond their target levels, and we could, therefore, suffer withdrawals as our clients rebalance their investments to fit their asset allocation preferences.
There is a possibility of losses associated with underwriting and trading activities.
We undertake limited underwriting activities through our subsidiary, G.research and also conduct proprietary trading activities. Such activities subject our capital to significant risks of loss. The risks of loss include those resulting from ownership of securities, extension of credit, leverage, liquidity, counterparty failure to meet commitments, client fraud, employee errors, misconduct and fraud (including unauthorized transactions by traders), failures in connection with the processing of securities transactions and litigation. We have procedures and internal controls to address such risks, but there can be no assurance that these procedures and controls will prevent losses from occurring.
The loss of institutional research services and underwriting revenues from GAMCO and its affiliates would have an adverse effect on our results of operations, and we can provide no assurance that these revenues will continue after the Spin-off.
Institutional research services revenues totaled $8.4 million and $9.2 million, and for the years ended December 31, 2015 and 2014, respectively. G.research earned $4.9 million and $4.7 million or approximately 59% and 54%, of its commission revenue from transactions executed on behalf of funds advised by Gabelli Funds, LLC, and clients advised by GAMCO. In addition, G.research earned $0.0 million and $0.6 million in underwriting revenues for the years ended December 31, 2015 and 2014, respectively. All of these underwriting revenues related to funds affiliated with GAMCO. We can provide no assurance that these institutional research and underwriting revenues from GAMCO and its affiliates will continue after the Spin-off, and the loss of these revenues would have an adverse effect on our results of operations.
We may have liability as a general partner or otherwise with respect to our Alternative Investments.
We act as general partner for Investment Partnerships, including arbitrage, event-driven long/short, sector focused and merchant banking limited partnerships. As a general partner of these partnerships, we may be held liable for the partnerships' liabilities in excess of their ability to pay such liabilities. In addition, in certain circumstances, we may be liable as a control person for the acts of our Investment Partnerships. As of December 31, 2015, our AUM included approximately $512 million in Investment Partnerships. A substantial adverse judgment or other liability with respect to our Investment Partnerships could have a material adverse effect on us.
Our organizational documents do not limit our ability to enter into new lines of businesses, and we may expand into new investment strategies, geographic markets and businesses, each of which may result in additional risks and uncertainties in our businesses.
Our plan, to the extent that market conditions permit, is to continue to grow our investment businesses and expand into new investment strategies, geographic markets and businesses. Our organizational documents do not limit us to the investment management and financial advisory businesses. Accordingly, we may pursue growth through acquisitions of other investment management or advisory companies, acquisitions of critical business partners or other strategic initiatives. In addition, we expect opportunities will arise to acquire other alternative or traditional asset managers. To the extent we make strategic investments or acquisitions, undertake other strategic initiatives or enter into a new line of business, we will face numerous risks and uncertainties, including risks associated with (a) the required investment of capital and other resources, (b) the possibility that we have insufficient expertise to engage in such activities profitably or without incurring inappropriate amounts of risk, (c) the diversion of management's attention from our core businesses, (d) assumption of liabilities in any acquired business, (e) the disruption of our ongoing businesses, (f) the increasing demands on or issues related to the combining or integrating operational and management systems and controls, (g) compliance with additional regulatory requirements, and (h) the broadening of our geographic footprint, including the risks associated with conducting operations in non-U.S. jurisdictions. Entry into certain lines of business may subject us to new laws and regulations with which we are not familiar, or from which we are currently exempt, and may lead to increased litigation and regulatory risk. For example, our recent and planned business initiatives include offering registered investment products and the creation of investment products open to retail investors. These activities have and will continue to impose additional compliance burdens on us and could also subject us to enhanced regulatory scrutiny and expose us to greater reputation and litigation risk. See "— We are subject to substantial litigation risks and may face significant liabilities and damage to our professional reputation as a result of litigation allegations and negative publicity." In addition, if a new business generates insufficient revenues or if we are unable to efficiently manage our expanded operations, our results of operations will be adversely affected. Our strategic initiatives may include joint ventures, in which case we will be subject to additional risks and uncertainties in that we may be dependent upon, and subject to liability, losses or reputational damage relating to systems, controls and personnel that are not under our control.
19
If we are unable to consummate or successfully integrate additional development opportunities, acquisitions or joint ventures, we may not be able to implement our growth strategy successfully.
Our growth strategy is based, in part, on the selective development or acquisition of asset management businesses, or other businesses complementary to our business where we think we can add substantial value or generate substantial returns. The success of this strategy will depend on, among other things: (a) the availability of suitable opportunities, (b) the level of competition from other companies that may have greater financial resources, (c) our ability to value potential development or acquisition opportunities accurately and negotiate acceptable terms for those opportunities, (d) our ability to obtain requisite approvals and licenses from the relevant governmental authorities and to comply with applicable laws and regulations without incurring undue costs and delays and (e) our ability to identify and enter into mutually beneficial relationships with venture partners. Moreover, even if we are able to identify and successfully complete an acquisition, we may encounter unexpected difficulties or incur unexpected costs associated with integrating and overseeing the operations of the new businesses. If we are not successful in implementing our growth strategy, our business, financial results and the market price for our common units may be adversely affected.
Risk management activities may materially adversely affect the return on our and our clients' investments.
When managing our and our clients' exposure to market risks, we may from time to time use hedging strategies and various forms of derivative instruments to limit the funds' exposure to changes in the relative values of investments that may result from market developments, including changes in prevailing interest rates, currency exchange rates and commodity prices. The success of any hedging transactions generally will depend on our ability to correctly assess the degree of correlation between price movements of the hedging instrument, the position being hedged, the creditworthiness of the counterparty and other factors. As a result, while we may enter into a transaction in order to reduce our exposure to market risks, the transaction may result in poorer overall investment performance than if it had not been executed. Such transactions may also limit the opportunity for gain if the value of a hedged position increases. In addition, the degree of correlation between price movements of the instruments used in connection with hedging activities and price movements in a position being hedged may vary. For a variety of reasons, we may not seek or be successful in establishing a perfect correlation between the instruments used in a hedging or other derivative transaction and the position being hedged. An imperfect correlation could prevent us from achieving the intended result and could give rise to a loss. In addition, it may not be possible to fully or perfectly limit our exposure against all changes in the value of our investment because the value of investments is likely to fluctuate as a result of a number of factors, some of which will be beyond our control or ability to hedge.
If our risk management processes and systems are ineffective, we may be exposed to material unanticipated losses.
We continue to refine and implement our risk management techniques, strategies and assessment methods, such as the use of statistical and other quantitative and qualitative tools to identify, observe, measure and analyze the risks to which our funds are exposed. These methods, even if properly implemented, may not allow us to fully mitigate the risk exposure of our funds in all economic or market environments, or against all types of risk, including risks that we might fail to identify or anticipate. Some of our strategies for anticipating and managing risk in our funds are based upon our use of historical market behavior statistics, which may not be an accurate predictor of current or future market risks. We apply statistical and other tools to these observations to measure and analyze the risks to which our funds are exposed. Any failure in our risk management systems, whether in design or implementation, to accurately identify and quantify such risk exposure could limit our ability to manage risks in the funds, identify appropriate investment opportunities or realize positive, risk-adjusted returns. Because neither our quantitative nor qualitative risk management processes can anticipate for every investment the economic and financial outcome or timing and other specifics of the outcome, we will, in the course of our activities, incur losses.
Operational risks may disrupt our businesses, result in regulatory action against us or limit our growth.
We face operational risk arising from errors made in the execution, confirmation or settlement of transactions or from transactions not being properly recorded, evaluated or accounted for. Our business is highly dependent on our ability to process, on a daily basis, transactions across markets in an efficient and accurate manner. Consequently, we rely heavily on our financial, accounting and other data processing systems. Despite the reliability of these systems and the training and skill of our teammates and third parties we rely on, it remains likely that errors may occasionally occur due to the extremely large number of transactions we process. In addition, if systems we use are unable to accommodate an increasing volume of transactions, our ability to expand our businesses could be constrained. If any of these systems do not operate properly or are disabled, we could suffer financial loss, a disruption of our businesses, liability to clients, regulatory intervention or reputational damage.
20
Failure to maintain adequate infrastructure could impede our productivity and growth. Additionally, failure to maintain effective information and cyber security policies, procedures and capabilities could disrupt operations and cause financial losses that could result in a decrease in our earnings or stock price.
Our infrastructure, including information systems, hardware, software, networks and other technology, is vital to the competitiveness of our business. Our information systems and technology is currently provided by GAMCO pursuant to the Transitional Services Agreement. The failure of GAMCO to maintain an adequate infrastructure commensurate with the size and scope of our business could impede our productivity and growth, which could cause our earnings or stock price to decline.
GAMCO outsources a significant portion of our information systems operations to third parties, who are responsible for providing the management, maintenance and updating of such systems. Technology is subject to rapid change, and we cannot guarantee that our competitors may not implement more advanced technology platforms for their products than we do for ours. In addition, there can be no assurance that the cost of maintaining such outsourcing arrangements will not increase from its current level, which could have a material adverse effect on us.
In addition, any inaccuracies, delays, system failures or security breaches in these and other systems could subject us to client dissatisfaction and losses. Our technology systems may be subject to unauthorized access, computer viruses or other malicious code or other events that could have a security impact. There can be no assurance that breach of our technology systems could result in material losses (such material losses including the loss of valuable information, liability for stolen assets or information, remediation costs to repair damage caused by the breach, additional security costs to mitigate against future incidents and litigation costs resulting from the incident) relating to such security breach of our technology systems.
If a successful cyber-attack or other security breach were to occur, our confidential or proprietary information, or the confidential or proprietary information of our clients or their counterparties, that is stored in, or transmitted through, such technology systems could be compromised or misappropriated. Moreover, loss of confidential customer identification information could harm our reputation and subject us to liability under laws that protect confidential personal data, resulting in increased costs or loss of revenues. Further, although we take precautions to password protect and encrypt our laptops and other mobile electronic hardware; there can be no assurance that these measures will always provide sufficient protection. If such hardware is stolen, misplaced or left unattended, it may become vulnerable to hacking or other unauthorized use, creating a possible security risk and resulting in potentially costly actions by us.
The failure of one of our vendors to fulfill its obligations to us could have a material adverse effect on us and our clients.
We and GAMCO depend on a number of key vendors for various fund administration, accounting, custody and transfer agent roles and other operational needs. Our or GAMCO's failure or inability to diversify sources for key services or the failure of any key vendors to fulfill their obligations could lead to operational issues for us and, with respect to certain products, could result in financial losses for us and our clients.
We face exposure to legal actions, including litigation and arbitration claims and regulatory and governmental examinations and/or investigations. Insurance coverage for these matters may be inadequate.
The volume of litigation and arbitration claims against financial services firms and the amount of damages claimed has increased over the past several years. The types of claims that we may face are varied. For example, we may face claims against us for purchasing securities that are inconsistent with a client's investment objectives or guidelines or arising from an employment dispute. The risk of litigation is difficult to predict, assess or quantify, and may occur years after the activities or events at issue. In addition, from time to time we may become the subject of governmental or regulatory investigations and/or examinations. Even if we prevail in a legal or regulatory action, the costs alone of defending against the action or the harm to our reputation could have a material adverse effect on us. The insurance coverage that we maintain with respect to legal and regulatory actions may be inadequate or may not cover certain proceedings.
21
Compliance failures could adversely affect us.
Our investment management activities are subject to client guidelines. A failure to comply with these guidelines could result in damage to our reputation or in our clients seeking to recover losses, withdrawing their investments or terminating their contracts, any of which could cause our revenues and earnings to decline. There can be no assurance that the precautions and procedures that we have instituted and installed or the insurance we maintain to protect ourselves in case of client losses will protect us from potential liabilities.
Our reputation is critical to our success.
Our reputation is critical to acquiring, maintaining and developing relationships with our clients and third-party intermediaries. In recent years, there have been a number of well-publicized cases involving fraud, conflicts of interest or other misconduct by individuals in the financial services industry. Misconduct by our staff, or even unsubstantiated allegations, could result not only in direct financial harm but also in harm to our reputation, causing injury to the value of our brands and our ability to retain or attract AUM. In addition, in certain circumstances, misconduct on the part of our clients or other parties could damage our reputation. Moreover, reputational harm may cause us to lose current employees and we may be unable to attract new employees with similar qualification or skills. Damage to our reputation could substantially reduce our AUM and impair our ability to maintain or grow our business, which could have a material adverse effect on us.
We face strong competition from numerous and sometimes larger companies.
We compete with numerous investment management companies, stock brokerage and investment banking firms, insurance companies, banks, savings and loan associations and other financial institutions. The periodic establishment of new investment management companies and other competitors increases the competition that we face. At the same time, consolidation in the financial services industry has created stronger competitors with greater financial resources and broader distribution channels than our own. Competition is based on various factors, including, among others business reputation, investment performance, product mix and offerings, service quality and innovation, distribution relationships and fees charged. Our competitive success in all of these areas cannot be assured. Additionally, competing securities dealers whom we rely upon to distribute our products also sell their own proprietary investment products, which could limit the distribution of our investment products. To the extent that existing or potential customers, including securities dealers, decide to invest in or distribute the products of our competitors, the sales of our products as well as our market share, revenues and net income could decline. Both GAMCO and Associated Capital have asset management as their principal business and derive most of their revenues through that business and, as such, may compete with each other.
If third-party investors in our funds exercise their right to remove us as investment manager or general partner of our products, we would lose the AUM in such funds, which would eliminate our management fees and incentive allocation income derived from such products.
The governing agreements of most of our investment partnerships and offshore funds provide that, subject to certain conditions, third-party investors in those funds have the right, without cause, to vote to remove us as investment manager or general partner of the investment partnerships or offshore fund by a simple majority vote, resulting in the elimination of the AUM by those products and the management fees and incentive allocation income derived from those products. In addition to having a significant negative impact on our revenues, results of operations and cash flows, the occurrence of such an event would likely result in significant reputational damage to us.
If we were deemed an investment company under the Investment Company Act of 1940, as amended, applicable restrictions could make it impractical for us to continue our business as contemplated and could have a material adverse effect on our business.
We intend to rely on the exclusion from the definition of "investment company" provided by Rule 3a-2 under the Investment Company Act of 1940, as amended (the "Investment Company Act").
Under this rule, an issuer is not deemed to be an "investment company" if the issuer has a bona fide intent to be engaged primarily, as soon as is reasonably possible but in any event by the expiration of a one year time period, in a business other than that of an "investment company". As provided in Rule 3a-2, during the one year period, the issuer must undertake activities that are consistent with an objective to no longer be an "investment company" by the end of this period. In addition, the issuer's board of directors must adopt a resolution that commits the issuer to undertake activities in order to achieve this objective.
22
We are a newly formed company that operates the alternative investment management and institutional research services operations formerly operated by GAMCO. Because we also received cash and securities in the Spin-off to fund our business strategy, we may be deemed to be an "investment company" on the distribution date because we might be deemed to own "investment securities" that exceed 40% of the value of our adjusted total assets on an unconsolidated basis.
We intend to grow our business and expand our product offerings through organic growth and, possibly, acquisitions, alliances and lift-outs. The term "organic growth" in this context means growth by the development of alternative investment products, such as hedge funds and private equity funds that invest in particular alternative asset classes. Associated Capital, through one of its affiliates, may take a general partner or managing member interest in such funds, which may involve the expenditure of a significant amount of capital. In addition, we may acquire other alternative investment managers, including, without limitation, hedge, private equity or real estate fund managers, or enter into joint ventures or other strategic alliances with other managers. We may also seek to build our alternative asset management operations through lift-outs—i.e., by hiring a team of alternative asset portfolio managers.
Although we will explore these various alternatives in the near term, whether and when we may achieve any of these objectives is difficult to predict because our success in doing so will depend on the confluence of a number of factors, such as whether a target company has the resources that we desire in a merger or strategic alliance, the synergy between Associated Capital and any such target company, the state of the alternative investment management business generally, Associated Capital's and the target's competencies at managing a potential collaboration, the overall economic and market conditions, etc. We expect to deploy our cash and securities to build our alternative asset management operations by means of these methods. Our management team will evaluate all such alternatives and seek the best opportunities available to accomplish this goal, while seeking to maximize stockholder value.
We recognize, however, that there is a risk we may not be able to deploy our assets rapidly enough in pursuit of our business strategy so that we would no longer be an "investment company" at the expiration of the one year period permitted by Rule 3a-2. If this were to occur and we could not satisfy the conditions of SEC staff no-action letters that permit a longer period in order to no longer be an investment company (and no other relief from regulation as an investment company were available), we would be required to register under the Investment Company Act. In such case, we would be subject to significant restrictions imposed on our operations by the Investment Company Act, including limitations on our capital structure and our ability to transact business with affiliates. These limitations could make it impractical for us to continue our business as contemplated and would have a material adverse effect on our business.
Risks Related to the Associated Capital Common Stock
The disparity in the voting rights among the classes of shares may have a potential adverse effect on the price of the Associated Capital Class A Stock.
The holders of Associated Capital Class A Stock and Associated Capital Class B Stock have identical rights except that holders of Associated Capital Class A Stock are entitled to one vote per share, while holders of Associated Capital Class B Stock are entitled to ten votes per share on all matters to be voted on by stockholders in general, and holders of Associated Capital Class A Stock are not eligible to vote on matters relating exclusively to Associated Capital Class B Stock and vice versa. Mario J. Gabelli, through his control and majority ownership of GGCP and his individual ownership of Associated Capital common stock, beneficially owns a majority of the outstanding Associated Capital Class B Stock, representing approximately 94.7% voting control. As long as Mario J. Gabelli indirectly beneficially owns a majority of the combined voting power of the Associated Capital common stock, he will have the ability to elect all of the members of our Board and thereby control our management and affairs, including, among other things, any determinations with respect to acquisitions, dispositions, borrowings, issuances of common stock or other securities, and the declaration and payment of dividends on the Associated Capital common stock. The differential in voting rights and the ability of Associated Capital to issue additional Associated Capital Class B Stock could adversely affect the value of the Associated Capital Class A Stock to the extent the investors, or any potential future purchaser of Associated Capital, view the superior voting rights of the Associated Capital Class B Stock to have value. While there is no current intention to issue additional Associated Capital Class B Stock, there is no prohibition on Associated Capital issuing additional shares of Associated Capital Class B Stock in the future.
An active public trading market for the Associated Capital Class A Stock may not develop.
A liquid public market for the Associated Capital Class A Stock may not develop, especially because a large percentage of the Associated Capital common stock is held by a limited number of stockholders. If an active trading market for the Associated Capital Class A Stock does not develop, the market price and liquidity of the Associated Capital Class A Stock may be materially and adversely affected.
23
We cannot predict the prices at which the Associated Capital Class A Stock may trade.
The market price of the Associated Capital Class A Stock may fluctuate significantly due to a number of factors, some of which may be beyond our control, including:
|
●
|
our quarterly or annual earnings, or those of other companies in our industry;
|
|
●
|
actual or anticipated reductions in our revenue, net earnings and cash flow resulting from actual or anticipated decline in AUM;
|
|
●
|
changes in accounting standards, policies, guidance, interpretations or principles;
|
|
●
|
the failure of securities analysts to cover Associated Capital or changes in financial estimates by analysts;
|
|
●
|
changes in earnings estimates by securities analysts or our ability to meet those estimates;
|
|
●
|
the operating and stock price performance of other comparable companies;
|
|
●
|
overall market fluctuations; and
|
|
●
|
general economic conditions.
|
In particular, the realization of any of the risks described in these "Risk Factors" could have a significant and adverse impact on the market price of the Associated Capital Class A Stock. In addition, the stock market in general has experienced extreme price and volume volatility that has often been unrelated to the operating performance of particular companies. This volatility has had a significant impact on the market price of securities issued by many companies, including companies in our industry. The price of the Associated Capital Class A Stock could fluctuate based upon factors that have little or nothing to do with us, and these fluctuations could materially reduce our stock price.
We cannot predict how the investment community will value the GAMCO Note ($250 million) given the GAAP accounting treatment as a reduction to book value.
For GAAP purposes, the amount of the GAMCO Note, which was issued by GAMCO to Associated Capital as part of the Spin-off transaction, will be treated as a reduction in equity, rather than as an asset, during the period all or any portion of the GAMCO Note is outstanding. Management utilizes adjusted economic book value ("AEBV"), a non-GAAP measure, in its analysis of our financial condition. AEBV includes the outstanding value of the GAMCO Note as an asset. Management believes AEBV is useful in analyzing our financial condition during the period in which we build our core operating business. The GAMCO Note will be paid down ratably over five years or sooner at GAMCO's option. As GAMCO pays down the note, Associated Capital's GAAP book value will increase, and once the GAMCO Note is fully paid off by GAMCO, Associated Capital's GAAP book value and AEBV will be the same. It is possible that the investment community will rely on the GAAP treatment of the GAMCO Note rather than on the non-GAAP AEBV, which may have an adverse effect on the value of our stock.
Future sales of Associated Capital Class A Stock in the public market or sales or distributions of Associated Capital Class B Stock could lower our stock price, and any additional capital raised by us through the sale of equity or convertible securities may dilute our stockholders' ownership in us.
We may sell additional shares of Associated Capital Class A Stock in public or private offerings. We also may issue additional shares of Associated Capital Class A Stock or convertible debt securities. In addition, sales by our current stockholders could be perceived negatively. No prediction can be made as to the effect, if any, that future sales or distributions of Associated Capital Class B Stock owned by Holdings will have on the market price of the Associated Capital Class A Stock from time to time. Sales or distributions of substantial amounts of Associated Capital Class A Stock or Associated Capital Class B Stock, or the perception that such sales or distributions are likely to occur, could adversely affect the prevailing market price for the Associated Capital Class A Stock.
The reduced disclosure requirements applicable to us as an "emerging growth company" and a "smaller reporting company" may make Associated Capital common stock less attractive to investors.
We are an "emerging growth company" as defined in the JOBS Act, and we may avail ourselves of certain exemptions from various reporting requirements of public companies that are not "emerging growth companies," including, but not limited to, an exemption from complying with the auditor attestation requirements of Section 404(b) of the Sarbanes-Oxley Act of 2002, as amended (the "Sarbanes-Oxley Act") and, like smaller reporting companies, reduced disclosure obligations regarding executive compensation in our periodic reports and proxy statements, and exemptions from the requirement of holding a nonbinding advisory vote on executive compensation and stockholder approval of any golden parachute payments not previously approved. We may remain an emerging growth company for up to five full fiscal years following the Spin-off. We would cease to be an emerging growth company, and, therefore, become ineligible to rely on the above exemptions, if we (a) have more than $1 billion in annual revenue in a fiscal year, (b) issue more than $1 billion of non-convertible debt over a three-year period or (c) become a "large accelerated filer" as defined in Rule 12b-2 under the Exchange Act, which would occur after: (i) we have filed at least one annual report; (ii) we have been an SEC-reporting company for at least 12 months; and (iii) the market value of Associated Capital Class A Stock that is held by non-affiliates exceeds $700 million as of the last business day of our most recently completed second fiscal quarter. We cannot predict if investors will find Associated Capital common stock less attractive because we may rely on these exemptions.
24
We also qualify as a "smaller reporting company" under the Exchange Act. As a smaller reporting company, we enjoy many of the same exemptions and reduced disclosure requirements as emerging growth companies, and those exemptions would continue to be available to us even after the emerging growth company status expires if we still are a smaller reporting company at such time.
If some investors find Associated Capital Class A Stock less attractive as a result of the exemptions available to us as an emerging growth company and a smaller reporting company, there may be a less active trading market for Associated Capital Class A Stock (assuming a market develops) and our value may be more volatile than that of an otherwise comparable company that does not avail itself of the same or similar exemptions.
We are a "controlled company" within the meaning of NYSE rules and, as a result, will qualify for, and intend to rely on, exemptions from certain corporate governance requirements. You will not have the same protections afforded to stockholders of companies that are subject to such requirements.
Mario J. Gabelli and his affiliates control a majority of the voting power of the Associated Capital common stock. As a result, we are a "controlled company" within the meaning of the corporate governance standards of the NYSE. Under these rules, a company of which more than 50% of the voting power in the election of directors is held by an individual, group or another company is a "controlled company" and may elect not to comply with certain corporate governance requirements, including the requirements that, within one year of the date of the listing of the Associated Capital Class A Stock:
|
·
|
we have a board that is composed of a majority of "independent directors," as defined under the rules of the NYSE;
|
|
·
|
we have a compensation committee that is composed entirely of independent directors; and
|
|
·
|
we have a nominating/corporate governance committee that is composed entirely of independent directors.
|
While a majority of our directors are currently independent, we intend to utilize certain of these exemptions. For example, our Nominating Committee is not comprised of independent directors. Accordingly, you will not have the same protections afforded to stockholders of companies that are subject to all of the corporate governance requirements of the NYSE.
Our certificate of incorporation provides that certain lawsuits must be litigated in Delaware, which may limit your ability to obtain a favorable judicial forum for disputes with us.
Our certificate of incorporation provides that, unless we consent in writing to the selection of an alternative forum, the sole and exclusive forum for (i) any derivative action or proceeding brought on our behalf, (ii) any action asserting a claim of breach of a fiduciary duty owed by any director, officer or other employee of Associated Capital to Associated Capital or its stockholders, (iii) any action asserting a claim arising pursuant to any provision of the Delaware General Corporation Law or our certificate of incorporation or our bylaws or (iv) any action asserting a claim governed by the internal affairs doctrine shall be the Court of Chancery in the State of Delaware (or, if the Court of Chancery does not have jurisdiction, the federal district court for the District of Delaware). Accordingly, it may not be possible for stockholders to litigate any action relating to the foregoing matters outside of the State of Delaware, even though stockholders may view other forums to be more favorable.
25
None.
AC owns no properties. AC currently pays GAMCO an occupancy charge based on headcount with respect to the office space it uses at GAMCO's offices at 401 Theodore Fremd Avenue in Rye, NY. AC's usage of such property is covered under the Transitional Services Agreement with GAMCO.
Currently, we are not subject to any legal proceedings that individually or in the aggregate involved a claim for damages in excess of 10% of our consolidated assets. From time to time, we may be named in legal actions and proceedings. These actions may seek substantial or indeterminate compensatory as well as punitive damages or injunctive relief. We are also subject to governmental or regulatory examinations or investigations. Examinations or investigations can result in adverse judgments, settlements, fines, injunctions, restitutions or other relief. For any such matters, the combined consolidated financial statements include the necessary provisions for losses that we believe are probable and estimable. Furthermore, we evaluate whether there exist losses which may be reasonably possible and, if material, make the necessary disclosures.
ITEM 4: MINE SAFETY DISCLOSURES
Not applicable.
26
ITEM 5: MARKET FOR THE REGISTRANT'S COMMON EQUITY, RELATED STOCKHOLDER MATTERS AND ISSUER PURCHASES OF EQUITY SECURITIES
Market for our Stock, Dividends and Stock Repurchase Program
Our shares of Class A Stock are traded on the NYSE under the symbol AC.
As of February 1, 2016, there were 275 Class A Stockholders of record and 27 Class B Stockholders of record. These figures do not include approximately 3,000 stockholders with shares held under beneficial ownership in nominee name.
The following table sets forth the high and low prices of our Class A Stock since our Spin-off from GAMCO and historical dividends declared per share to both Class A Stock and Class B Stock as reported by the NYSE.
|
|
2015
|
|||||||||||
|
|
Dividend Declared
|
|||||||||||
|
|
High
|
Low
|
Regular
|
Special
|
||||||||
|
Fourth Quarter
|
$
|
36.51
|
$
|
28.05
|
$
|
-
|
$
|
-
|
||||
In December 2015, the Board of Directors established a stock repurchase program authorizing the Company to re-purchase up to 500,000 shares. Our stock repurchase program is not subject to an expiration date. The following table provides information with respect to the shares of our Class A Stock we repurchased during the month ended December 31, 2015:
|
Total Number of
|
Maximum
|
|||||||||||
|
Total
|
Average
|
Shares Repurchased as
|
Number of Shares
|
|||||||||
|
Number of
|
Price Paid Per
|
Part of Publicly
|
That May Yet Be
|
|||||||||
|
Shares
|
Share, net of
|
Announced Plans
|
Purchased Under
|
|||||||||
|
Period
|
Repurchased
|
Commissions
|
or Programs
|
the Plans or Programs
|
||||||||
|
12/01/15 - 12/31/15
|
1,500
|
29.08
|
1,500
|
498,500
|
||||||||
|
Totals
|
1,500
|
$
|
29.08
|
1,500
|
||||||||
We have adopted the 2015 Stock Award and Incentive Plan (the "Equity Compensation Plan"). The following table shows information regarding the number of restricted shares outstanding under our Equity Compensation Plan, as well as the number of outstanding options and shares reserved for future issuance under our equity compensation plans as of December 31, 2015.
|
Number of Securities to be
|
||||||||
|
Issued upon Exercise of
|
Weighted-Average Exercise
|
|||||||
|
Outstanding Options,
|
Price of Outstanding Options,
|
|||||||
|
Plan Category
|
Warrants and Rights
|
Warrants and Rights
|
||||||
|
Equity compensation plans approved
|
||||||||
|
by security holders:
|
||||||||
|
Restricted stock awards
|
553,100
|
|
n/a
|
|
||||
|
Equity compensation plans not approved
|
||||||||
|
by security holders:
|
-
|
n/a
|
|
|||||
|
Total
|
553,100
|
|||||||
The number of securities remaining available for future issuance under equity compensation plans (excluding securities reflected in the first column above) is 346,900. Our Board of Directors has approved an increase of 1,100,000 in the amount of restricted shares outstanding under our Equity Compensation Plans to 2,000,000 in total. That approval is subject to the ratification of shareholders at our 2016 Annual Meeting. Further information on the increase in the number of restricted shares reserved for issuance under the Equity Compensation Plans can be found in our definitive proxy statement for our 2016 Annual Meeting of Shareholders (the "Proxy Statement") expected to be filed with the SEC in April 2016.
27
As a smaller reporting company, this information is not required to be provided.
ITEM 7: MANAGEMENT'S DISCUSSION AND ANALYSIS OF FINANCIAL CONDITION AND RESULTS OF OPERATIONS
Introduction
This MD&A is provided as a supplement to, and should be read in conjunction with, the Consolidated Financial Statements and the notes thereto included in Item 8 to this report. Unless the context otherwise requires, all references to "we," "us," "our," "AC Group" or the "Company" refer collectively to Associated Capital Group, Inc. and its subsidiaries through which our operations are actually conducted.
The Spin-off
On November 30, 2015, GAMCO distributed all the outstanding shares of each class of common stock of AC Group on a pro rata one-for-one basis to the holders of each class of GAMCO's common stock. Prior to the distribution, GAMCO contributed the 93.9% interest it held in Gabelli Securities, Inc. ("GSI") and certain cash and other assets to AC Group.
In addition, the following transactions were also undertaken in connection with the Spin-off:
GAMCO issued a promissory note (the "GAMCO Note") to AC Group that bears interest at 4.0% per annum and has a maturity date of November 30, 2020 with respect to the original principal amount of the GAMCO Note. Interest on the GAMCO Note will accrue from the most recent date for which interest has been paid, or if no interest has been paid, from the effective date of the GAMCO Note; provided, however, that at the election of GAMCO, payment of interest on the GAMCO Note may, in lieu of being paid in cash, be paid, in whole or in part, in kind on the then-outstanding principal amount (a "PIK Amount"). GAMCO will repay the original principal amount of the GAMCO Note to AC, in cash, in five equal annual installments of $50 million on each interest payment date up to and including the maturity date and will repay all PIK Amounts added to the outstanding principal amount of the GAMCO Note, in cash, on the fifth anniversary of the date on which each such PIK Amount was added to the outstanding principal amount of the GAMCO Note. In no event may any interest be paid in kind subsequent to November 30, 2019. GAMCO may prepay the GAMCO Note prior to maturity without penalty.
On November 27, 2015 GSI purchased from GAMCO 4,393,055 shares of GAMCO class A common stock at a price of $34.1448 per share, based on the average of the volume weighted average price for GAMCO class A stock on an "ex-Distribution" basis from November 9, 2015 through and including November 27, 2015. GSI paid for the purchase by issuing a note to GAMCO in the principal amount of $150.0 million (the "GSI Note"). The GSI Note was then contributed by GAMCO to AC and GSI became a majority-owned subsidiary of AC on November 30, 2015 in connection with the completion of the Spin-off. The GSI Note is thus now an intercompany note within the AC Group.
Factors Affecting Financial Condition and Results of Operations
Except for the one month period subsequent to the Spin-off, the Company's combined statements of income for the three months ended December 31, 2015 and 2014 and the Company's combined consolidated statements of income for the twelve months ended December 31, 2015 and 2014 were prepared on a standalone basis derived from the combined financial statements and accounting records of GAMCO and are presented as carve-out financial statements as the Company was not a standalone public company prior to the Spin-off.
The combined consolidated statements of income for the periods ended December 31, 2015 and 2014, respectively, include allocations for certain support functions that were provided on a centralized basis by GAMCO and not historically recorded at the business unit level. These expenses were allocated on the basis of direct usage when identifiable, with the remainder allocated on a pro-rata basis of headcount or other measures. Management believes the assumptions underlying the combined consolidated financial statements, including the assumptions regarding allocating general corporate expenses, are reasonable. Nevertheless, the combined consolidated financial statements may not include all of the actual expenses that would have been incurred by the Company and may not reflect its combined results of operations, financial position and cash flows had it been a separate, standalone company during the periods presented. Actual costs that would have been incurred if the Company had been a separate, standalone company would depend on multiple factors, including organizational structure and strategic decisions made in various areas, including information technology and infrastructure.
28
The Company, through its subsidiaries, provides alternative investment management services and institutional research services, as well as management of the Company's proprietary investment portfolio. In all these endeavors, the Company seeks investments trading at prices that differ from those determined using our proprietary "Private Market Value (PMV) with a CatalystTM" methodology where we have identified a near-term catalyst to narrow the market difference to PMV. Catalysts can include a spin-off, stock buyback, asset sale, management change, regulatory change or accounting change.
In its alternative asset management operations, subsidiaries of the Company serve as general partner or investment manager to investment funds including limited partnerships, offshore companies and separate accounts. The Company primarily manages assets in equity event-driven value strategies, across a range of risk and event arbitrage portfolios, earning management and incentive fees from its assets under management (AUM). The institutional research business offers domain knowledge-driven research and a sales and trading platform for institutional investors, earning fees from its institutional clients via trading commissions or direct payment. The Company manages its proprietary portfolio to maximize shareholder value and to support its other operating businesses.
Organizational Chart
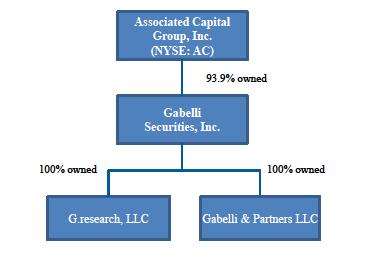
Overview
Combined Consolidated Statements of Income
Investment advisory and incentive fees, which are based on the amount and composition of AUM in our funds and accounts, represent our largest source of revenues. Growth in revenues depends on good investment performance, which influences the value of existing AUM as well as contributes to higher investment and lower redemption rates and facilitates the ability to attract additional investors while maintaining current fee levels. Growth in AUM is also dependent on being able to access various distribution channels, which is usually based on several factors, including performance and service.
Incentive fees generally consist of an incentive allocation on the absolute gain in a portfolio or a fee of 20% of the economic profit, as defined in the agreements governing the investment vehicle. We recognize revenue only when the measurement period has been completed and when the incentive fees have been earned.
Institutional research services revenues consist of brokerage commissions derived from securities transactions executed on an agency basis or direct payments on behalf of institutional clients Commission revenues vary directly with the perceived value of the research, as well as account trading activity and new account generation.
Compensation costs include variable and fixed compensation and related expenses paid to officers, portfolio managers, sales, trading, research and all other professional staff. Variable compensation paid to sales personnel and portfolio management generally represents 40% of revenues and is the largest component of total compensation costs.
29
Management fee is incentive-based and entirely variable compensation in the amount of 10% of the aggregate pre-tax profits which is paid to Mr. Gabelli or his designee for acting as CEO pursuant to his Employment Agreement so long as he is an executive of AC.
Other operating expenses include general and administrative operating costs and clearing charges and fees incurred by the brokerage business.
Other income and expenses include net gains and losses from investments (which include both realized and unrealized gains and losses from trading securities and equity in earnings of investments in partnerships), interest and dividend income, and interest expense. Net gains and losses from investments are derived from our proprietary investment portfolio consisting of various public and private investments.
Net income (loss) attributable to noncontrolling interests represents the share of net income attributable to the minority stockholders, as reported on a separate company basis, of our consolidated majority-owned subsidiaries and net income attributable to third party limited partners of certain partnerships and offshore funds we consolidate. Please refer to Notes A and D in our consolidated financial statements included elsewhere in this report.
Consolidated Statement of Financial Condition
We ended the 2015 year with approximately $753 million in cash and investments, net of securities sold, not yet purchased of $10 million. This includes $306 million of cash and short term US treasuries; $219 million of securities, net, including 4.4 million shares of GAMCO stock; and $228 million invested in affiliated and third party funds and partnerships. Our financial resources underpin our flexibility to pursue strategic objectives that may include acquisitions, lift-outs, seeding new investment strategies, and co-investing, as well as shareholder compensation in the form of share repurchase and dividends.
Total shareholders' equity was $752 million or $29.54 per share on December 31, 2015 compared to $583 million or $22.54 per share on December 31, 2014. The increase in equity from the end of 2014 was largely comprised of an increase in securities, net of $200 million, including 4.4 million shares of GAMCO stock, a reduction of $24 million in liabilities, a reduction of $63 million in redeemable non-controlling interests due to the deconsolidation of an affiliated fund, partially offset by a reduction in cash and cash equivalents by $80 million and receivables by $20 million.
The Company also reviews an analysis of Adjusted Economic book value ("AEBV"), and AEBV per share, a non-GAAP financial measure that management believes is useful for analyzing AC's financial condition. A $250 million note from GAMCO to AC (the "GAMCO Note") that was issued as part of the Spin-off transaction is not treated as an asset for GAAP purposes, but as a reduction in equity, and will continue to be reflected as a reduction in equity in future periods in the amount of the principal then outstanding. The GAMCO Note is expected to be paid down ratably over five years or sooner at GAMCO's option. As the GAMCO Note pays down, the Company's total equity will increase, and once the GAMCO Note is fully paid off by GAMCO, the Company's total equity and AEBV will be the same. At December 31, 2015, AEBV for the Company was $1.002 billion and the AEBV per share was $39.37 per share, a non-GAAP measure reflecting the impact on book value when the GAMCO Note is viewed as an asset as opposed to a reduction in equity. The reconciliation of GAAP book value and GAAP book value per share to AEBV and AEBV per share at December 31, 2015 is shown below (in thousands, except for per share data):
|
Reconciliation of Total Equity to Adjusted Economic Book Value
|
||||||||
|
|
Total
|
Per Share
|
||||||
|
Total equity as reported
|
$
|
751,549
|
$
|
29.54
|
||||
|
Add: GAMCO Note
|
250,000
|
9.83
|
||||||
|
Adjusted Economic book value
|
$
|
1,001,549
|
$
|
39.37
|
||||
Our primary goal is to use our liquid resources to opportunistically and strategically grow book value and net income. While this goal is a priority, if opportunities are not present with what we consider a margin of safety, we will consider alternatives to return capital to our shareholders, including stock repurchases and dividends.
30
Assets Under Management Highlights
We reported assets under management as follows (dollars in millions):
|
|
Year Ended December 31,
|
CAGR (a)
|
|||||||||||||||||||||||
|
|
2015
|
|
2014
|
2013
|
2012
|
2011
|
2015/2011
|
||||||||||||||||||
|
|
|||||||||||||||||||||||||
|
Event Merger Arb
|
$
|
869
|
|
$
|
796
|
$
|
691
|
$
|
721
|
$
|
513
|
14.1
|
%
|
||||||||||||
|
Event-Driven Value
|
145
|
|
167
|
140
|
124
|
132
|
0.02
|
||||||||||||||||||
|
Other
|
66
|
|
77
|
76
|
75
|
65
|
0.0
|
||||||||||||||||||
|
Total AUM
|
$
|
1,080
|
(b)
|
$
|
1,040
|
$
|
907
|
$
|
920
|
$
|
710
|
11.1
|
%
|
||||||||||||
(a) Compound annual growth rate
(b) Includes $89.3 million of proprietary capital.
Our gross cash inflows by product line were as follows (in millions):
|
|
Year Ended December 31,
|
|||||||||||||||||||
|
2015
|
2014
|
2013
|
2012
|
2011
|
||||||||||||||||
|
Event Merger Arb
|
$
|
166
|
$
|
162
|
$
|
79
|
$
|
248
|
$
|
175
|
||||||||||
|
Event-Driven Value
|
39
|
45
|
38
|
29
|
92
|
|||||||||||||||
|
Other
|
2
|
5
|
6
|
23
|
3
|
|||||||||||||||
|
Total Cash Inflows
|
$
|
207
|
$
|
212
|
$
|
123
|
$
|
300
|
$
|
270
|
||||||||||
Our gross cash outflows by product line were as follows (in millions):
|
|
Year Ended December 31,
|
|||||||||||||||||||
|
2015
|
2014
|
2013
|
2012
|
2011
|
||||||||||||||||
|
Event Merger Arb
|
$
|
(119
|
)
|
$
|
(68
|
)
|
$
|
(137
|
)
|
$
|
(58
|
)
|
$
|
(79
|
)
|
|||||
|
Event-Driven Value
|
(54
|
)
|
(21
|
)
|
(36
|
)
|
(42
|
)
|
(9
|
)
|
||||||||||
|
Other
|
(12
|
)
|
(5
|
)
|
(13
|
)
|
(20
|
)
|
-
|
|||||||||||
|
Total Cash Outflows
|
$
|
(185
|
)
|
$
|
(94
|
)
|
$
|
(186
|
)
|
$
|
(120
|
)
|
$
|
(88
|
)
|
|||||
Our net appreciation and depreciation by product line were as follows (in millions):
|
|
Year Ended December 31,
|
|||||||||||||||||||
|
2015
|
2014
|
2013
|
2012
|
2011
|
||||||||||||||||
|
|
||||||||||||||||||||
|
Event Merger Arb
|
$
|
26
|
$
|
11
|
$
|
28
|
$
|
18
|
$
|
16
|
||||||||||
|
Event-Driven Value
|
(7
|
)
|
3
|
14
|
5
|
(6
|
)
|
|||||||||||||
|
Other
|
(1
|
)
|
1
|
8
|
7
|
3
|
||||||||||||||
|
Total Net Appreciation/(Depreciation)
|
$
|
18
|
$
|
15
|
$
|
50
|
$
|
30
|
$
|
13
|
||||||||||
The majority of these assets have calendar year-end measurement periods; therefore, our incentive fees are primarily recognized in the fourth quarter when the uncertainty is removed at the end of the annual measurement period.
31
Operating Results for the Quarter Ended December 31, 2015 as Compared to the Quarter Ended December 31, 2014
Revenues
Total revenues were $9.0 million for the three months ended December 31, 2015, $1.3 million higher than total revenues of $7.7 million for the three months ended December 31, 2014. Total revenues by revenue component were as follows (dollars in thousands):
|
|
Three Months Ended December 31,
|
Increase (decrease)
|
||||||||||
| 2015 | 2014 | $ | % | |||||||||
|
Investment advisory and incentive fees
|
$
|
6,340
|
$
|
4,712
|
$
|
1,628
|
34.6
|
%
|
||||
|
Institutional research services income
|
2,267
|
2,440
|
(173
|
)
|
(7.1
|
)
|
||||||
|
Other income
|
388
|
525
|
(137
|
)
|
(26.1
|
)
|
||||||
|
Total revenues
|
$
|
8,995
|
$
|
7,677
|
$
|
1,318
|
17.2
|
%
|
||||
Investment advisory and incentive fees: Investment advisory income is directly influenced by the level and mix of average AUM. We earn advisory fees based on the level of average AUM in our products.
Advisory fees were $2.1 million for the 2015 period compared to $2.0 million for the 2014 period, an increase of $0.1 million. This increase is correlated to the increase in AUM to $1.08 billion at December 31, 2015 versus $1.04 billion at December 31, 2014.
Incentive fees are directly related to the gains generated for our clients. We earn a percentage, usually 20%, of the economic gains of our clients' AUM. These fees are recorded at the end of the measurement period, which is typically year-end. For the quarter ended December 31, 2015, we recognized $4.2 million in incentive fees versus $2.7 million for the comparable quarter in 2014 due to improved performance in our merger arbitrage funds.
Institutional research services: Institutional research services revenues in the 2015 period were $2.3 million, a decrease from $2.4 million in the 2014 period resulting from lower brokerage commissions derived from securities transactions executed on an agency basis.
Expenses
Compensation: Compensation costs, which include variable compensation, salaries, bonuses and benefits, were $9.5 million for the three months ended December 31, 2015, an increase from $7.5 million for the three months ended December 31, 2014. Fixed compensation costs, which include salaries, bonuses and benefits, increased to $5.2 million in the 2015 period from $4.7 million in the 2014 period primarily due to an increase in research analyst headcount and additional administrative personnel necessary to support our reporting as a stand-alone public company. The remainder of the compensation expense represents variable compensation that fluctuates with management fee and incentive fee revenues. For fourth quarter of 2015, variable payouts on revenues were $4.3 million, an increase of $1.4 million from the $2.9 million in the fourth quarter of 2014. Variable payouts as a percent of revenues are impacted by the mix of products upon which management and performance fees are earned and the extent to which they may exceed their allocated costs.
Stock based compensation: Stock based compensation expense increased to $3.0 million in the fourth quarter of 2015 versus $0.5 million in the fourth quarter of 2014 due to the accelerated vesting of restricted stock that occurred in October of 2015.
Management fees: Management fee expense is incentive-based and entirely variable compensation in the amount of 10% of the aggregate pre-tax profits, which is paid to Mario J. Gabelli or his designees pursuant to his employment agreements with GAMCO and AC. In the fourth quarter of 2015 and 2014, AC recorded management fee expense of $0.6 million and $0.2 million, respectively. Note that the management fee expense for the first two months of the fourth quarter was determined pursuant to Mr.Gabelli's employment agreement with GAMCO and the management fee expense for the month of December, post Spin-off, was determined based on Mr. Gabelli's employment agreement with AC. Going forward, management fee expense will be determined based on Mr. Gabelli's employment agreement with AC.
Other operating expenses: Our other operating expenses were $1.8 million in the 2015 period up slightly from $1.6 million in the 2014 period.
32
Investment and other non-operating income, net
Net gain from investments: Net gain from investments is directly related to the performance of our proprietary capital accounts. For the three months ended December 31, 2015, net gains from investments were $9.1 million, an increase of $6.2 million from the prior year's $2.9 million. Markets were more favorable in 2015 versus 2014, plus we had a gain of $1.4 million from a minority interest we hold in the management company of a third party manager who had stellar results in 2015.
Interest and dividend income: Interest and dividend income increased $0.7 million to $2.4 million in the three months ended December 31, 2015 from $1.7 million in the three months ended December 31, 2014 due primarily to interest income earned in December of $0.8 million from the GAMCO Note.
Interest expense: Interest expense was $0.4 million in the quarter ended December 31, 2015 and $0.3 million on the comparable quarter in 2014.
Income Taxes
The effective tax rate ("ETR") was 27.4% and 61.4% for the periods ended December 31, 2015 and 2014, respectively. The fluctuation in rates in attributable to permanent book versus tax differences that are large relative to the net income base.
Noncontrolling Interest
Net income attributable to noncontrolling interests was $0.3 million in the 2015 period compared to $1.6 million in the 2014 period due to the deconsolidation of certain funds in 2015 that were consolidated into our results in 2014.
Net Income
Net income for the three months ended December 31, 2015 was $4.2 million versus $2.3 million for the three months ended December 31, 2014 substantially the result of the higher gains from AC's proprietary investments partially offset by increased operating losses.
Operating Results for the Year Ended December 31, 2015 as Compared to the Year Ended December 31, 2014
Revenues
Total revenues were $22.8 million for the year ended December 31, 2015, $1.8 million higher than total revenues of $21.0 million for the year ended December 31, 2014. Total revenues by revenue component were as follows (dollars in thousands):
|
Year Ended December 31,
|
Increase (decrease)
|
|||||||||||||||
|
2015
|
2014
|
$
|
%
|
|||||||||||||
|
Investment advisory and incentive fees
|
$
|
12,635
|
$
|
9,779
|
$
|
2,856
|
29.2
|
%
|
||||||||
|
Institutional research services income
|
8,397
|
9,160
|
(763
|
)
|
(8.3
|
)
|
||||||||||
|
Other income
|
1,811
|
2,090
|
(279
|
)
|
(13.3
|
)
|
||||||||||
|
Total revenues
|
$
|
22,843
|
$
|
21,029
|
$
|
1,814
|
8.6
|
%
|
||||||||
Investment advisory and incentive fees: Investment advisory income is directly influenced by the level and mix of average AUM. We earn advisory fees based on the level of average AUM in our products.
Advisory fees were $8.4 million for 2015 compared to $7.1 million for 2014, an increase of $1.3 million, or 18%. This increase is a result of the increase in average AUM to $1.07 billion in 2015 from $982 million in 2014, an increase of $85 million, or 9% and the effect of deconsolidating certain funds in 2015 that were previously consolidated in 2014.
Incentive fees are directly related to the gains generated for our clients. We earn a percentage, usually 20%, of the economic gains of our clients' AUM. Incentive fees were $4.3 million in 2015, up $1.6 million, or 58%, from $2.7 million in 2014 as market appreciation in our clients' accounts were higher in 2015 as compared to 2014.
Institutional research services: Institutional research services revenues in 2015 were $8.4 million, a $0.8 million, or 8%, decrease from $9.2 million in 2014 resulting from lower brokerage commissions derived from securities transactions executed on an agency basis.
33
Other income: Other income was $1.8 million for 2015 versus $2.1 million for 2014, a decrease of $0.3 million.
Expenses
Compensation: Compensation costs, which include variable compensation, salaries, bonuses and benefits, were $26.4 million for the year ended December 31, 2015, an 18% increase from $22.3 million for the year ended December 31, 2014. Fixed compensation costs, which include salaries, bonuses and benefits, increased 10% to $17.3 million in 2015 from $15.8 million in 2014 due primarily to an increase in research analyst headcount and additional administrative personnel necessary to support our reporting as a stand-alone public company. The remainder of the compensation expenses represents variable compensation that fluctuates with management fee and incentive fee revenues. For 2015, variable payouts on revenues were $9.0 million, up $2.5 million from the $6.5 million in 2014. Variable payouts are impacted by the mix of products upon which performance fees are earned and the extent to which they may exceed their allocated costs.
Stock based compensation: Stock based compensation was $4.9 million in 2015, an increase of $3.0 million, as compared to $1.9 million in 2014. The increase was primarily due to the accelerated vesting of restricted stock that occurred in October of 2015.
Management fees: Management fee expense is incentive-based and entirely variable compensation in the amount of 10% of the aggregate pre-tax profits which is paid to Mario J. Gabelli or his designees pursuant to his employment agreements with AC and GAMCO. In 2015 and 2014, AC recorded a management fee contra-expense of $0.3 million and $0.0 million, respectively, as presented in the combined consolidated statements of income. Note that the management fee expense for the first eleven months of 2015 and for all of 2014 was determined on a carve out basis pursuant to Mr.Gabelli's employment agreement with GAMCO and the management fee expense for the month of December, post Spin-off , was determined based on Mr. Gabelli's employment agreement with AC. The management fee expense for the month of December was $0.2 million. Going forward, management fee expense will be determined based on Mr. Gabelli's employment agreement with AC.
Other operating expenses: Our other operating expenses were $6.2 million in 2015 compared to $6.8 million in 2014, a decrease of $0.6 million, or 10% due primarily to the deconsolidation of certain funds in 2015 that were consolidated in our results in 2014 that impacted other expenses.
Other income/(expense)
Net gain from investments: Net gain from investments is directly related to the performance of our proprietary capital accounts. For the year ended December 31, 2015, net gains from investments were $8.3 million versus $6.5 million in the prior year. The current year results include a gain of $1.4 million from a minority interest we hold in the management company of a third party manager who had stellar results in 2015.
Interest and dividend income: Interest and dividend income increased $0.3 million, or 7%, to $4.7 million in 2015 from $4.4 million in 2014 due to an increase in interest income of $0.8 million from the GAMCO Note partially offset by lower dividend income.
Interest expense: Interest expense decreased to $1.3 million in 2015 from $1.4 million in 2014.
Income Taxes
In 2015, we recorded an income tax benefit of $1.7 million with the effective tax rate ("ETR") of 65.4%. The ETR is unusually high because we have favorable permanent tax differences that increase our tax benefit on this relatively small net loss base. In 2014, we recorded an income tax provision of $0.8 million despite a pretax loss of $0.4 million due to $4.2 million of losses attributable to noncontrolling interests. This results because income or losses attributable to noncontrolling interests are included in determining pretax earnings but provide no corporate tax provision or benefit. Excluding noncontrolling interests, ETR was 20.5% in 2014. The decrease in ETR is due have favorable permanent tax differences on a low base of taxable income in 2014.
Noncontrolling Interest
Net income attributable to noncontrolling interests was a loss of $0.8 million in 2015 compared to a loss of $4.2 million in 2014, the result of deconsolidating a fund in 2015 that impacted results in 2014 due to currency fluctuations on Euro denominated share classes in the underlying investment partnerships consolidated for GAAP purposes in that year.
34
Net Income(Loss)
Net loss for the year ended December 31, 2015 was $0.1 million versus net income of $3.0 million for the year ended December 31, 2014 substantially the result of increased operating losses only partially mitigated by gains in Investments and other non-operating income.
Liquidity and Capital Resources
Our principal assets consist of cash and cash equivalents; short-term treasury securities; marketable securities, primarily equities, including 4.4 million shares of GAMCO stock; and interests in affiliated and third party funds and partnerships. Although Investment Partnerships are subject to restrictions as to the timing of distributions, the underlying investments of such Investment Partnerships are, for the most part, liquid, and the valuations of these products reflect that underlying liquidity.
Summary cash flow data is as follows (in thousands):
|
Year Ended December 31,
|
||||||||
|
2015
|
2014
|
|||||||
|
(in thousands)
|
||||||||
|
Cash flows provided by (used in):
|
||||||||
|
Operating activities
|
$
|
(47,350
|
)
|
$
|
(58,642
|
)
|
||
|
Investing activities
|
(41,734
|
)
|
3,839
|
|||||
|
Financing activities
|
9,281
|
140,797
|
||||||
|
Net increase (decrease) in cash and cash equivalents
|
(79,803
|
)
|
85,994
|
|||||
|
Cash and cash equivalents at beginning of year
|
285,530
|
199,536
|
||||||
|
Increase in cash from Consolidation
|
10
|
-
|
||||||
|
Increase in cash from deconsolidation
|
13
|
-
|
||||||
|
Cash and cash equivalents at end of year
|
$
|
205,750
|
$
|
285,530
|
||||
We require relatively low levels of capital expenditures and have a highly variable cost structure where costs increase and decrease based on the level of revenues we receive. Our revenues, in turn, are highly correlated to the level of AUM and to their investment performance. We anticipate that our available liquid assets should be sufficient to meet our cash requirements as we build out our operating businesses. At December 31, 2015, we had cash and cash equivalents of $205.8 million and $557.4 million of Investments.
Net cash used in operating activities was $47.4 million for 2015 and $58.6 million in 2014. In 2015, our sources of cash included $44.5 million increase in payable to brokers, $22.9 million of distributions from partnerships, a $10.5 million decrease in other assets and $1.7 million from an increase in compensation payable. Cash uses included $71.6 million of increases in trading securities, a $30.0 million increase in receivable from brokers, $15.2 million of contributions to partnerships, a $4.7 million decline in payable to affiliates and a $4.3 million decline for income taxes payables and deferred tax liabilities. In 2014, our sources of cash included $33.4 million increase in payable to brokers and $10.5 million of distributions from partnerships. Cash uses included $28.3 million of increases in trading securities, a $25.6 million increase in receivable from brokers, $21.0 million of contributions to partnerships, a $16.0 million increase in other assets, a $5.3 million decline in compensation payable and a $4.7 million decline for income taxes payables and deferred tax liabilities.
Net cash used in investing activities of $41.7 million in 2015 is due to purchases of available for sale securities of $43.3 million less $1.0 million in proceeds from sales of available for sale securities and $0.5 million from return of capital from available for sale securities. Net cash provided by investing activities of $3.8 million in 2014 is due $4.7 million in proceeds from sales of available for sale securities and $0.5 million from return of capital from available for sale securities less $1.4 million from purchases of available for sale securities.
Net cash provided by financing activities was $9.3 million for 2015, largely resulting from $25.2 million in cash transfers from GAMCO less $16.0 million repayment of the GAMCO demand loan. Net cash provided by financing activities was $140.8 million for 2014, due to $65.7 million in net contributions from noncontrolling interests and $85.1 million in cash transfers from GAMCO less $10.0 million for the partial repayment of the GAMCO demand loan.
35
G.research is registered with the SEC as broker-dealers and is regulated by FINRA. As such, G.research is subject to the minimum net capital requirements promulgated by the SEC. G.research's net capital exceeded these minimum requirements at December 31, 2015. G.research computes its net capital under the alternative method permitted by the SEC, which requires minimum net capital of the greater of $250,000 or 2% of the aggregate debit items in the reserve formula for those broker-dealers subject to Rule 15c3-3 promulgated under the Exchange Act. As of December 31, 2015, and 2014, G.research had net capital, as defined, of approximately $7.1 million and $1.6 million, respectively, exceeding the regulatory requirement by approximately $6.9 million and $1.4 million, respectively. Net capital requirements for G.research may increase in accordance with rules and regulations to the extent it engages in other business activities.
Off-Balance Sheet Arrangements
We do not have any off-balance sheet arrangements.
Contractual Obligations
The following table sets forth our significant contractual cash obligations as of December 31, 2015 (in thousands):
|
|
Total
|
2016
|
2017
|
2018
|
2019
|
2020
|
Thereafter
|
||||||||||||||
|
Contractual Obligations:
|
|||||||||||||||||||||
|
Occupancy charge
|
$ |
3,722
|
$ |
314
|
$ |
284
|
$ |
284
|
$ |
284
|
$ |
284
|
$ |
2,272
|
|||||||
|
Total
|
$ |
3,722
|
$ |
314
|
$ |
284
|
$ |
284
|
$ |
284
|
$ |
284
|
$ |
2,272
|
|||||||
Critical Accounting Policies
In the ordinary course of business, we make a number of estimates and assumptions relating to the reporting of results of operations and financial condition in the preparation of our consolidated financial statements in conformity with U.S. generally accepted accounting principles. We base our estimates on historical experience, when available, and on other various assumptions that are believed to be reasonable under the circumstances. Actual results could differ significantly from those estimates under different assumptions and conditions.
We believe the critical assumptions and estimates are those applied to revenue recognition, the accounting for and valuation of investments in securities, partnerships, and offshore funds, income taxes, and stock based compensation accounting.
Major Revenue-Generating Services and Revenue Recognition
The Company's revenues are derived primarily from investment advisory and incentive fees and institutional research services.
Investment advisory and incentive fees are directly influenced by the level and mix of AUM as fees are derived from a contractually-determined percentage of AUM for each account as well as incentive fees earned on certain accounts. Management fees from investment partnerships and offshore funds are computed either monthly or quarterly, and amounts receivable are included in investment advisory fees receivable on the consolidated statements of financial condition. These revenues vary depending upon the level of sales compared with redemptions, financial market conditions, performance and the fee structure for AUM. Revenues derived from the equity-oriented portfolios generally have higher management fee rates than fixed income portfolios.
Revenues from investment partnerships and offshore funds also generally include an incentive allocation or fee on the absolute gain in a portfolio or a fee of 20% of the economic profit as defined in the partnership agreement. The incentive allocation or fee is recognized at the end of the measurement period, which is annually, and amounts receivable are included in investment advisory fees receivable on the consolidated statements of financial condition.
G.research, Inc. provides institutional research services and earns brokerage commission revenues and sales manager fees on a trade-date basis from securities transactions executed on an agency basis on behalf of institutional clients and mutual funds, private wealth management clients and retail customers of affiliated companies. It has also been involved in syndicated underwriting activities that included public equity and debt offerings managed by major investment banks. Underwriting fees include underwriting revenues and syndicate profits and are accrued as earned. Underwriting fees include gains, losses, selling concessions and fees, net of syndicate expenses, arising from securities offerings in which the Company acts as underwriter or agent. It provides institutional investors and investment partnerships with investment ideas on numerous industries and special situations, with a particular focus on small-cap and mid-cap companies. Commission revenue and related clearing charges are recorded on a trade-date basis and are included in commission revenue and other operating expenses, respectively, on the combined consolidated statements of income.
36
Finally, AC also has investment gains or losses generated from its proprietary trading activities which are included in net gain/(loss) from investments on the combined consolidated statements of income.
Investments in Securities Transactions and Other Than Temporary Impairment
Investments in securities are accounted for as either "trading securities" or "available for sale" and are stated at fair value. Management determines the appropriate classification of debt and equity securities at the time of purchase and reevaluates such designations as of each balance sheet date. U.S. Treasury Bills and Notes with maturities of greater than three months at the time of purchase are considered investments in securities. Securities that are not readily marketable are stated at their estimated fair values in accordance with Generally Accepted Accounting Principles ("GAAP"). A substantial portion of investments in securities are held for resale in anticipation of short-term market movements and therefore are classified as trading securities. Trading securities are stated at fair value, with any unrealized gains or losses reported in current period earnings in net gain/(loss) from investments on the combined consolidated statements of income. AFS investments are stated at fair value, with any unrealized gains or losses, net of taxes, reported as a component of other comprehensive loss except for losses deemed to be other than temporary which are recorded as realized losses on the combined consolidated statements of income. Securities transactions and any related gains and losses are recorded on a trade date basis. Realized gains and losses from securities transactions are recorded on the specific identified cost basis and are included in net gain/(loss) from investments on the combined consolidated statements of income.
AFS securities are evaluated for other than temporary impairment each reporting period and any impairment charges are recorded in net gain/(loss) from investments on the combined consolidated statements of income. Management reviews all available for sale securities whose cost exceeds their fair value to determine if the impairment is other than temporary. Management uses qualitative factors such as diversification of the investment, the intent to hold the investment, the amount of time that the investment has been impaired and the severity of the decline in determining whether the impairment is other than temporary.
Securities sold, but not yet purchased are recorded on the trade date, and are stated at fair value and represent obligations of AC to purchase the securities at prevailing market prices. Therefore, the future satisfaction of such obligations may be for an amount greater or less than the amounts recorded on the consolidated statements of financial condition. The ultimate gains or losses recognized are dependent upon the prices at which these securities are purchased to settle the obligations under the sales commitments. Realized gains and losses from covers of securities sold, not yet purchased transactions are included in net gain/(loss) from investments on the combined consolidated statements of income. Securities sold, not yet purchased are stated at fair value, with any unrealized gains or losses reported in current period earnings in net gain/(loss) from investments on the combined consolidated statements of income.
Consolidation
In accordance with the consolidation assessment models set forth in ASC 810-10 and 810-20, the Company consolidates all investments in partnerships and affiliates in which the Company has a controlling interest or is deemed to be the primary beneficiary. In order to make this determination, an analysis is performed to determine if the entity is a variable interest entity ("VIE") or a voting interest entity ("VOE"). If the entity is a VIE, further analysis, as discussed below, is performed to determine if AC is the primary beneficiary of the entity. If the entity is not a VIE, the Company will apply the VOE model as discussed below.
Variable Interest Entities
A VIE is an entity in which either (a) the equity investment at risk is not sufficient to permit the entity to finance its own activities without additional financial support; (b) the equity investors do not have the ability to make decisions about the entities' activities or obligation to absorb the expected losses of the entity or the right to receive the expected residual returns of the entity or (c) the voting rights are not proportional to their obligations to absorb the expected losses of the entity or their rights to receive the expected residual returns of the entity. The Company evaluates whether entities in which it has an interest are VIEs and whether the Company is the primary beneficiary of any VIEs identified in its analysis. The Company is determined to be the primary beneficiary if it absorbs a majority of the VIE's expected losses, expected residual returns, or both. If the Company is the primary beneficiary of a VIE, it consolidates that entity. If the Company is not the primary beneficiary, it accounts for its investment under the equity method.
37
In June 2009 the Financial Accounting Standards Board ("FASB") amended the guidance on VIEs when it issued Accounting Standards Update ("ASU") 2009-17. This guidance requires that if a decision maker has a variable interest in a VIE, the decision maker is not solely acting in a fiduciary capacity and would be required to consolidate the VIE if it has both the power to direct the most significant activities of the VIE and economic exposure that could potentially be significant to the VIE. The Company is general partner or co-general partner of various sponsored partnerships and the investment manager of various sponsored offshore funds whose underlying assets consist primarily of marketable securities (the "affiliated entities"). If the Company were to apply such guidance it would be required to consolidate most of its affiliated entities. In February 2010, the FASB issued ASU 2010-10, which indefinitely deferred the effective date of the amendments to ASC 810-10 made by ASU 2009-17, for a reporting entity's interest in certain entities. Currently, interests in entities that qualify for the deferral are evaluated by applying the VIE model in ASC 810-10 (i.e., before the amendments by ASU 2009-17), while interests in entities that do not qualify for the deferral must be evaluated under the amendments in ASU 2009-17. Because all of the entities with which the Company is involved which would have been subject to the guidance in ASU 2009-17 were determined to qualify for the FASB's deferral of such guidance, the Company applies the guidance for VIEs that existed prior to the issuance of ASU 2009-17.
Voting Interest Entities
If the entity is not considered a VIE, it is treated as a VOE, and the Company applies the guidance in ASC 810-20 in determining whether the entity should be consolidated. Under ASC 810-20, the general partner or investment manager is deemed to control the entity and therefore must consolidate it unless the unaffiliated limited partners or shareholders (a) have the ability to remove the general partner or investment manager, without cause, (b) have the ability to dissolve the entity or (c) have substantive participating rights. If the unaffiliated limited partners or shareholders possess any of the foregoing rights, then the Company does not consolidate the entity, and either the equity or cost method of accounting is applied. If the unaffiliated limited partners or shareholders do not have any such rights, the Company consolidates the entity.
Equity Method Investments
Substantially all of AC's equity method investees are entities that record their underlying investments at fair value. Therefore, under the equity method of accounting, AC's share of the investee's underlying net income predominantly represents fair value adjustments in the investments held by the equity method investees. AC's share of the investee's underlying net income or loss is based upon the most currently available information and is recorded as "Net gain/(loss) from investments" on the combined consolidated statements of income. Capital contributions are recorded as an increase in investments when paid, while withdrawals and distributions are recorded as reductions of the investments when received. Depending on the terms of the investment, the Company may be restricted as to the timing and amounts of withdrawals.
See Note D. Investments in Partnerships, Offshore Funds and Variable Interest Entities ("VIEs") for more detail as to the number and types of entities consolidated as well as the impact on the consolidated statements of financial condition and combined consolidated statements of income.
Investments in Partnerships and Affiliates
The Company is general partner or co-general partner of various affiliated entities. We also have investments in unaffiliated partnerships, offshore funds and other entities ("unaffiliated entities"). Given that we are not a general partner or investment manager in any unaffiliated entities, we do not earn any management or incentive fees and we do not have a controlling financial interest, we do not currently consolidate any unaffiliated entities.
Our balance sheet caption "Investments in partnerships" includes those investments, in both affiliated and unaffiliated entities, which the Company accounts for under the equity method of accounting and certain investments in consolidated feeder funds ("CFFs") that the Company accounts for at fair value, as described below.
For CFFs that own 100% of their offshore master funds, the Company retains the CFF's specialized investment company accounting (i.e., the CFFs account for their investment in master funds at fair value).
The Company records noncontrolling interests in consolidated entities for which the Company's ownership is less than 100%. Refer to Noncontrolling Interests section within Note A for additional disclosures.
38
Income Taxes
Deferred tax assets and liabilities are recorded for temporary differences between the tax basis of assets and liabilities and the reported amounts on the consolidated financial statements using the statutory tax rates in effect for the year when the reported amount of the asset or liability is recovered or settled, respectively. The effect on deferred tax assets and liabilities of a change in tax rates is recognized in the results of operations in the period that includes the enactment date. A valuation allowance is recorded to reduce the carrying values of deferred tax assets to the amount that is more likely than not to be realized. For each tax position taken or expected to be taken in a tax return, the Company determines whether it is more likely than not that the position will be sustained upon examination based on the technical merits of the position, including resolution of any related appeals or litigation. A tax position that meets the more likely than not recognition threshold is measured to determine the amount of benefit to recognize. The tax position is measured at the largest amount of benefit that is greater than 50% likely of being realized upon settlement. The Company recognizes the accrual of interest on uncertain tax positions and penalties in income tax provision on the combined consolidated statements of income.
Stock Based Compensation
The Company has granted RSAs and stock options to staff members which were recommended by the Company's Chairman, who did not receive an RSA or option award, and approved by the Compensation Committee of GAMCO's Board of Directors prior to the Spin-off. We use a fair value based method of accounting for stock-based compensation provided to our employees. The estimated fair value of RSAs is determined by using the closing price of the relevant stock on the day prior to the grant date. The total expense, which is reduced by estimated forfeitures, is recognized over the vesting period for these awards which is either (1) 30% over three years from the date of grant and 70% over five years from the date of grant or (2) 30% over three years from the date of grant and 10% each year over years four through ten from the date of grant. The forfeiture rate is determined by reviewing historical forfeiture rates for previous stock-based compensation grants and is reviewed and updated quarterly, if necessary. During the vesting period, dividends to RSA holders are held for them until the RSA vesting dates and are forfeited if the grantee is no longer employed by the Company on the vesting dates. Dividends declared on these RSAs, less estimated forfeitures, are charged to retained earnings on the declaration date. In connection with the Spin-off of the Company from GAMCO, any GAMCO employee (including GAMCO employees who became AC employees) who had GAMCO RSAs was granted an equal number of AC RSAs so that the total value of the RSAs post-spin was equivalent to the total value pre-spin. In accordance with GAAP, we have allocated the stock compensation costs between GAMCO and AC based upon each employee's individual allocation of their responsibilities between GAMCO and AC.
Recent Accounting Developments
See Footnote B. Significant Accounting Policies – Recent Accounting Developments.
Seasonality and Inflation
We do not believe our operations are subject to significant seasonal fluctuations. We do not believe inflation will significantly affect our compensation costs, as they are substantially variable in nature. However, the rate of inflation may affect our expenses such as information technology and occupancy costs. To the extent inflation results in rising interest rates and has other effects upon the securities markets, it may adversely affect our financial position and results of operations by reducing our AUM, revenues or otherwise.
ITEM 7A: QUANTITATIVE AND QUALITATIVE DISCLOSURES ABOUT MARKET RISK
As a smaller reporting company, this information is not required to be provided.
39
ITEM 8: FINANCIAL STATEMENTS AND SUPPLEMENTARY DATA
ASSOCIATED CAPITAL GROUP, INC. AND SUBSIDIARIES
INDEX TO COMBINED CONSOLIDATED FINANCIAL STATEMENTS
|
Page
|
|
|
Report of Independent Registered Public Accounting Firm
|
41
|
|
Combined Consolidated Financial Statements:
|
|
|
Combined Consolidated Statements of Income for the years ended December 31, 2015 and 2014
|
42
|
|
Combined Consolidated Statements of Comprehensive Income for the years ended December 31, 2015 and 2014
|
43
|
|
Consolidated Statements of Financial Condition at December 31, 2015 and 2014
|
44
|
|
Combined Consolidated Statements of Equity for the years ended December 31, 2015 and 2014
|
45
|
|
Combined Consolidated Statements of Cash Flows for the years ended December 31, 2015 and 2014
|
47
|
|
Notes to Combined Consolidated Financial Statements
|
49
|
All schedules for which provision is made in the applicable accounting regulations of the Securities and Exchange Commission that are not required under the related instructions or are inapplicable have been omitted.
40
REPORT OF INDEPENDENT REGISTERED PUBLIC ACCOUNTING FIRM
To the Board of Directors and Stockholders of
Associated Capital Group, Inc.
Rye, New York
We have audited the accompanying consolidated statements of financial condition of Associated Capital Group, Inc. and subsidiaries (the "Company") as of December 31, 2015 and 2014, and the related combined consolidated statements of income, comprehensive income, equity, and cash flows for each of the two years in the period ended December 31, 2015. These financial statements are the responsibility of the Company's management. Our responsibility is to express an opinion on these financial statements based on our audits.
We conducted our audits in accordance with the standards of the Public Company Accounting Oversight Board (United States). Those standards require that we plan and perform the audit to obtain reasonable assurance about whether the financial statements are free of material misstatement. An audit includes examining, on a test basis, evidence supporting the amounts and disclosures in the financial statements. An audit also includes assessing the accounting principles used and significant estimates made by management, as well as evaluating the overall financial statement presentation. We believe that our audits provide a reasonable basis for our opinion.
In our opinion, such consolidated financial statements present fairly, in all material respects, the financial position of Associated Capital Group, Inc. and subsidiaries at December 31, 2015 and 2014, and the results of their operations and their cash flows for each of the two years in the period ended December 31, 2015, in conformity with accounting principles generally accepted in the United States of America.
As discussed in Note A to the combined consolidated financial statements, the Company separated from GAMCO Investors, Inc. ("GAMCO") on November 30, 2015. The Company did not operate as an independent, stand-alone entity for all periods included in these combined consolidated financial statements. For periods prior to November 30, 2015, the accompanying combined consolidated financial statements were derived from the consolidated financial statements and accounting records of GAMCO.
/s/ DELOITTE & TOUCHE LLP
New York, New York
March 23, 2016
41
ASSOCIATED CAPITAL GROUP, INC. AND SUBSIDIARIES
COMBINED CONSOLIDATED STATEMENTS OF INCOME
(In thousands, except per share data)
|
Year Ended December 31,
|
||||||||
|
2015
|
2014
|
|||||||
|
Revenues
|
||||||||
|
Investment advisory and incentive fees
|
$
|
12,635
|
$
|
9,779
|
||||
|
Institutional research services
|
8,397
|
9,160
|
||||||
|
Other revenues
|
1,810
|
2,090
|
||||||
|
Total revenues
|
22,842
|
21,029
|
||||||
|
Expenses
|
||||||||
|
Compensation
|
26,343
|
22,298
|
||||||
|
Stock based compensation
|
4,931
|
1,921
|
||||||
|
Management fee
|
(309
|
)
|
(37
|
)
|
||||
|
Other operating expenses
|
6,189
|
6,771
|
||||||
|
Total expenses
|
37,154
|
30,953
|
||||||
|
Operating loss
|
(14,312
|
)
|
(9,924
|
)
|
||||
|
Other income (expense)
|
||||||||
|
Net gain from investments
|
8,276
|
6,502
|
||||||
|
Interest and dividend income
|
4,720
|
4,416
|
||||||
|
Interest expense
|
(1,260
|
)
|
(1,376
|
)
|
||||
|
Total other income (expense), net
|
11,736
|
9,542
|
||||||
|
Loss before income taxes
|
(2,576
|
)
|
(382
|
)
|
||||
|
Income tax provision (benefit)
|
(1,685
|
)
|
775
|
|||||
|
Net loss
|
(891
|
)
|
(1,157
|
)
|
||||
|
Net loss attributable to noncontrolling interests
|
(780
|
)
|
(4,157
|
)
|
||||
|
Net income (loss) attributable to Associated Capital Group, Inc.'s shareholders
|
$
|
(111
|
)
|
$
|
3,000
|
|||
|
Net income (loss) per share attributable to Associated Capital Group, Inc.'s shareholders:
|
||||||||
|
Basic
|
$
|
0.00
|
$
|
0.12
|
||||
|
Diluted
|
$
|
0.00
|
$
|
0.12
|
||||
|
Weighted average shares outstanding:
|
||||||||
|
Basic
|
24,887
|
25,335
|
||||||
|
Diluted
|
25,170
|
25,558
|
||||||
|
Actual shares outstanding
|
25,440
|
25,855
|
||||||
See accompanying notes.
42
ASSOCIATED CAPITAL GROUP, INC. AND SUBSIDIARIES
COMBINED CONSOLIDATED STATEMENTS OF COMPREHENSIVE INCOME
(In thousands, except per share data)
|
Year Ended December 31,
|
||||||||
|
2015
|
2014
|
|||||||
|
Net loss
|
$
|
(891
|
)
|
$
|
(1,157
|
)
|
||
|
Other comprehensive loss, net of tax:
|
||||||||
|
Net unrealized losses on securities available for sale (a)
|
(11,035
|
)
|
(2,426
|
)
|
||||
|
Comprehensive loss
|
(11,926
|
)
|
(3,583
|
)
|
||||
|
Less: Comprehensive loss attributable to noncontrolling interests
|
780
|
4,157
|
||||||
|
Comprehensive income (loss) attributable to Associated Capital Group, Inc.
|
$
|
(11,146
|
)
|
$
|
574
|
|||
(a) Net of income tax benefit of ($6,434) and ($1,424) for 2015 and 2014, respectively.
See accompanying notes.
43
ASSOCIATED CAPITAL GROUP, INC. AND SUBSIDIARIES
CONSOLIDATED STATEMENTS OF FINANCIAL CONDITION
(In thousands, except per share data)
|
December 31,
|
December 31,
|
|||||||
|
2015
|
2014
|
|||||||
|
ASSETS
|
||||||||
|
Cash and cash equivalents
|
$
|
205,750
|
$
|
285,530
|
||||
|
Investments in securities (Including GBL stock with a market value of $136.4 million and $0 at
|
||||||||
|
December 31, 2015 and December 31, 2014, respectively)
|
333,624
|
220,595
|
||||||
|
Investments in affiliated registered investment companies
|
118,676
|
39,537
|
||||||
|
Investments in partnerships
|
105,051
|
107,646
|
||||||
|
Receivable from brokers
|
56,510
|
74,407
|
||||||
|
Investment advisory fees receivable
|
4,896
|
4,145
|
||||||
|
Receivable from affiliates
|
7,457
|
402
|
||||||
|
Goodwill
|
3,254
|
3,254
|
||||||
|
Other assets
|
1,530
|
19,178
|
||||||
|
Total assets
|
$
|
836,748
|
$
|
754,694
|
||||
|
LIABILITIES, NONCONTROLLING INTERESTS AND EQUITY
|
||||||||
|
Payable to brokers
|
$
|
50,648
|
$
|
43,397
|
||||
|
Income taxes payable and deferred tax liabilities
|
5,669
|
16,363
|
||||||
|
Compensation payable
|
10,926
|
9,179
|
||||||
|
Securities sold, not yet purchased
|
9,623
|
10,595
|
||||||
|
Mandatorily redeemable noncontrolling interests
|
1,129
|
1,302
|
||||||
|
Payable to affiliates
|
-
|
20,733
|
||||||
|
Accrued expenses and other liabilities
|
1,466
|
1,864
|
||||||
|
Total liabilities
|
79,461
|
103,433
|
||||||
|
Redeemable noncontrolling interests
|
5,738
|
68,334
|
||||||
|
Commitments and contingencies (Note J)
|
||||||||
|
Equity:
|
||||||||
|
Preferred stock, $0.001 par value; 10,000,000 shares authorized; none issued and outstanding
|
-
|
-
|
||||||
|
Class A Common Stock, $0.001 par value; 100,000,000 shares authorized; 6,247,452 shares and none
|
||||||||
|
issued, respectively; 6,242,952 shares and no shares outstanding, respectively
|
6
|
-
|
||||||
|
Class B Common Stock, $0.001 par value; 100,000,000 shares authorized; 19,196,792 shares issued
|
||||||||
|
and 19,196,792 and 0 shares outstanding, respectively
|
19
|
-
|
||||||
|
Additional paid-in capital
|
999,000
|
-
|
||||||
|
Parent Company Equity - pre Spin-off
|
-
|
573,749
|
||||||
|
Retained earnings
|
2,072
|
-
|
||||||
|
GBL 4% PIK Note
|
(250,000
|
)
|
-
|
|||||
|
Accumulated comprehensive income (loss)
|
(1,857
|
)
|
9,178
|
|||||
|
Treasury stock, at cost (1,500 and 0 shares, respectively)
|
(44
|
)
|
-
|
|||||
|
Total Associated Capital Group, Inc. stockholders' equity
|
749,196
|
582,927
|
||||||
|
Noncontrolling interests
|
2,353
|
-
|
||||||
|
Total equity
|
751,549
|
582,927
|
||||||
|
Total liabilities and stockholders' equity
|
$
|
836,748
|
$
|
754,694
|
||||
See accompanying notes.
44
ASSOCIATED CAPITAL GROUP, INC. AND SUBSIDIARIES
COMBINED CONSOLIDATED STATEMENTS OF EQUITY
(continued) (In thousands)
|
Associated Capital Group, Inc. shareholders
|
||||||||||||||||
|
Parent Company
|
Accumulated
|
Redeemable
|
||||||||||||||
|
Equity
|
Comprehensive
|
Noncontrolling
|
||||||||||||||
|
pre Spin-off
|
Income
|
Total
|
Interests
|
|||||||||||||
|
Balance at December 31, 2013
|
$
|
483,771
|
$
|
11,604
|
$
|
495,375
|
$
|
6,751
|
||||||||
|
Redemptions of noncontrolling interests
|
-
|
-
|
-
|
(6,353
|
)
|
|||||||||||
|
Contributions from redeemable noncontrolling
|
||||||||||||||||
|
interests
|
-
|
-
|
-
|
72,093
|
||||||||||||
|
Net income (loss)
|
3,000
|
-
|
3,000
|
(4,157
|
)
|
|||||||||||
|
Net unrealized gains on securities available for sale,
|
||||||||||||||||
|
net of income tax benefit $(328)
|
-
|
(559
|
)
|
(559
|
)
|
-
|
||||||||||
|
Amounts reclassified from accumulated other
|
||||||||||||||||
|
Comprehensive income, net of income tax
|
||||||||||||||||
|
benefit $(1,096)
|
-
|
(1,867
|
)
|
(1,867
|
)
|
-
|
||||||||||
|
Stock based compensation expense
|
1,921
|
-
|
1,921
|
-
|
||||||||||||
|
Net transfer from GBL
|
85,057
|
-
|
85,057
|
-
|
||||||||||||
|
Balance at December 31, 2014
|
$
|
573,749
|
$
|
9,178
|
$
|
582,927
|
$
|
68,334
|
||||||||
See accompanying notes.
45
ASSOCIATED CAPITAL GROUP, INC. AND SUBSIDIARIES
COMBINED CONSOLIDATED STATEMENTS OF EQUITY
(continued) (In thousands)
|
Associated Capital Group, Inc. shareholders
|
||||||||||||||||||||||||||||||||||||||||
|
Parent Company
|
Additional
|
Accumulated
|
Redeemable
|
|||||||||||||||||||||||||||||||||||||
|
Noncontrolling
|
Common
|
Equity
|
Retained
|
Paid-in
|
GBL 4%
|
Comprehensive
|
Treasury
|
Noncontrolling
|
||||||||||||||||||||||||||||||||
|
Interests
|
Stock
|
pre Spin-off
|
Earnings
|
Capital
|
PIK Note
|
Income
|
Stock
|
Total
|
Interests
|
|||||||||||||||||||||||||||||||
|
Balance at December 31, 2014
|
$
|
-
|
$
|
-
|
$
|
573,749
|
$
|
-
|
$
|
-
|
$
|
-
|
$
|
9,178
|
$
|
-
|
$
|
582,927
|
$
|
68,334
|
||||||||||||||||||||
|
Recapitalization
|
-
|
25
|
(522,758
|
)
|
-
|
522,733
|
-
|
-
|
-
|
-
|
-
|
|||||||||||||||||||||||||||||
|
Redemptions of
|
||||||||||||||||||||||||||||||||||||||||
|
noncontrolling interests
|
-
|
-
|
-
|
-
|
-
|
-
|
-
|
-
|
-
|
(901
|
)
|
|||||||||||||||||||||||||||||
|
Contributions from redeemable
|
||||||||||||||||||||||||||||||||||||||||
|
noncontrolling interests
|
-
|
-
|
-
|
-
|
-
|
-
|
-
|
-
|
-
|
1,036
|
||||||||||||||||||||||||||||||
|
Consolidation of a consolidated
|
||||||||||||||||||||||||||||||||||||||||
|
feeder fund and a partnership
|
-
|
-
|
-
|
-
|
-
|
-
|
-
|
-
|
-
|
996
|
||||||||||||||||||||||||||||||
|
Deconsolidation of an offshore
|
||||||||||||||||||||||||||||||||||||||||
|
fund
|
-
|
-
|
-
|
-
|
-
|
-
|
-
|
-
|
-
|
(63,256
|
)
|
|||||||||||||||||||||||||||||
|
Net income (loss)
|
(309
|
)
|
-
|
-
|
(111
|
)
|
-
|
-
|
-
|
-
|
(420
|
)
|
(471
|
)
|
||||||||||||||||||||||||||
|
Net unrealized losses on
|
||||||||||||||||||||||||||||||||||||||||
|
securities available for sale,
|
||||||||||||||||||||||||||||||||||||||||
|
net of income tax benefit $(6,503)
|
-
|
-
|
-
|
-
|
-
|
-
|
(11,157
|
)
|
-
|
(11,157
|
)
|
-
|
||||||||||||||||||||||||||||
|
Amounts reclassified from
|
||||||||||||||||||||||||||||||||||||||||
|
accumulated other
|
||||||||||||||||||||||||||||||||||||||||
|
comprehensive income,
|
||||||||||||||||||||||||||||||||||||||||
|
net of income tax $(69)
|
-
|
-
|
-
|
-
|
-
|
-
|
122
|
-
|
122
|
-
|
||||||||||||||||||||||||||||||
|
Stock based compensation
|
||||||||||||||||||||||||||||||||||||||||
|
expense
|
-
|
-
|
-
|
-
|
4,931
|
-
|
-
|
-
|
4,931
|
-
|
||||||||||||||||||||||||||||||
|
Issuance of GBL 4% PIK Note
|
-
|
-
|
-
|
-
|
250,000
|
(250,000
|
)
|
-
|
-
|
-
|
-
|
|||||||||||||||||||||||||||||
|
Purchase of treasury stock
|
-
|
-
|
-
|
-
|
-
|
-
|
-
|
(44
|
)
|
(44
|
)
|
-
|
||||||||||||||||||||||||||||
|
Net transfer from GBL
|
2,662
|
-
|
(50,991
|
)
|
2,183
|
221,336
|
-
|
-
|
-
|
175,190
|
-
|
|||||||||||||||||||||||||||||
|
Balance at December 31, 2015
|
$
|
2,353
|
$
|
25
|
$
|
-
|
$
|
2,072
|
$
|
999,000
|
$
|
(250,000
|
)
|
$
|
(1,857
|
)
|
$
|
(44
|
)
|
$
|
751,549
|
$
|
5,738
|
|||||||||||||||||
See accompanying notes.
46
ASSOCIATED CAPITAL GROUP, INC. AND SUBSIDIARIES
COMBINED CONSOLIDATED STATEMENTS OF CASH FLOWS
(In thousands)
|
Year Ended December 31,
|
||||||||
|
2015
|
2014
|
|||||||
|
Operating activities
|
||||||||
|
Net income (loss)
|
$
|
(891
|
)
|
$
|
(1,157
|
)
|
||
|
Adjustments to reconcile net income to net cash
|
||||||||
|
provided by (used in) operating activities:
|
||||||||
|
Equity in net gains from partnerships
|
(4,756
|
)
|
(1,169
|
)
|
||||
|
Depreciation and amortization
|
13
|
14
|
||||||
|
Stock based compensation expense
|
4,931
|
1,921
|
||||||
|
Deferred income taxes
|
(6,450
|
)
|
(5,039
|
)
|
||||
|
Other-than-temporary loss on available for sale securities
|
216
|
69
|
||||||
|
Donated securities
|
73
|
56
|
||||||
|
Gains on sales of available for sale securities
|
(25
|
)
|
(2,978
|
)
|
||||
|
(Increase) decrease in assets:
|
||||||||
|
Investments in trading securities
|
(71,552
|
)
|
(28,328
|
)
|
||||
|
Investments in partnerships:
|
||||||||
|
Contributions to partnerships
|
(15,169
|
)
|
(20,998
|
)
|
||||
|
Distributions from partnerships
|
22,857
|
10,510
|
||||||
|
Receivable from affiliates
|
(7,055
|
)
|
-
|
|||||
|
Receivable from brokers
|
(30,008
|
)
|
(25,557
|
)
|
||||
|
Investment advisory fees receivable
|
(949
|
)
|
1,106
|
|||||
|
Other assets
|
17,568
|
(15,977
|
)
|
|||||
|
Increase (decrease) in liabilities:
|
||||||||
|
Payable to affiliates
|
(4,733
|
)
|
1,386
|
|||||
|
Payable to brokers
|
44,516
|
33,396
|
||||||
|
Income taxes payable and deferred tax liabilities
|
2,191
|
362
|
||||||
|
Compensation payable
|
1,747
|
(5,278
|
)
|
|||||
|
Mandatorily redeemable noncontrolling interests
|
(172
|
)
|
(53
|
)
|
||||
|
Accrued expenses and other liabilities
|
298
|
(928
|
)
|
|||||
|
Total adjustments
|
(46,459
|
)
|
(57,485
|
)
|
||||
|
Net cash provided by (used in) operating activities
|
$
|
(47,350
|
)
|
$
|
(58,642
|
)
|
||
47
ASSOCIATED CAPITAL GROUP, INC. AND SUBSIDIARIES
COMBINED CONSOLIDATED STATEMENTS OF CASH FLOWS
(continued) (In thousands)
|
Year Ended December 31,
|
||||||||
|
2015
|
2014
|
|||||||
|
Investing activities
|
||||||||
|
Purchases of available for sale securities
|
$
|
(43,271
|
)
|
$
|
(1,428
|
)
|
||
|
Proceeds from sales of available for sale securities
|
1,013
|
4,748
|
||||||
|
Return of capital on available for sale securities
|
524
|
519
|
||||||
|
Net cash provided by investing activities
|
(41,734
|
)
|
3,839
|
|||||
|
Financing activities
|
||||||||
|
Contributions from redeemable noncontrolling interests
|
1,036
|
72,093
|
||||||
|
Redemptions of redeemable noncontrolling interests
|
(901
|
)
|
(6,353
|
)
|
||||
|
Repayment of demand loan with GBL
|
(16,000
|
)
|
(10,000
|
)
|
||||
|
Net transfer (to) / from GBL
|
25,190
|
85,057
|
||||||
|
Purchase of treasury stock
|
(44
|
)
|
-
|
|||||
|
Net cash provided by (used in) financing activities
|
9,281
|
140,797
|
||||||
|
Net increase (decrease) in cash and cash equivalents
|
(79,803
|
)
|
85,994
|
|||||
|
Cash and cash equivalents at beginning of period
|
285,530
|
199,536
|
||||||
|
Increase in cash from consolidation
|
10
|
-
|
||||||
|
Increase in cash from deconsolidation
|
13
|
-
|
||||||
|
Cash and cash equivalents at end of period
|
$
|
205,750
|
$
|
285,530
|
||||
|
Supplemental disclosures of cash flow information:
|
||||||||
|
Cash paid for interest
|
$
|
1,428
|
$
|
981
|
||||
|
Cash paid for taxes
|
$
|
2
|
$
|
2
|
||||
Non-cash activity:
- On November 28, 2015, the Company's majority owned subsidiary purchased 4.4 million shares of GBL in exchange for a $150 million five-year 4% note ("GAMCO Note Payable").
- On November 30, 2015, in connection with the spin-off of the Company from GAMCO, GAMCO issued the Company a $250 million five-year 4% PIK Note and also contributed the GAMCO Note to the Company.
- On November 30, 2015, in connection with the spin-off of the Company from GAMCO, GAMCO contributed to the Company the GAMCO Note Payable.
- On January 1, 2015, the Company was no longer deemed to have control over a certain offshore fund and a certain consolidated feeder fund which resulted in the deconsolidation of that offshore fund and consolidated feeder fund and an increase of approximately $13 of cash and cash equivalents, a decrease of approximately $63,280 of net assets and a decrease of approximately $63,267 of redeemable noncontrolling interests.
- On April 1, 2015, the Conpany was deemed to have control over a certain offshore fund and a certain consolidated feeder fund which resulted in the consolidation of that one offshore fund and one consolidated feeder fund and an increase of approximately $10 of cash and cash equivalents, an increase of approximately $986 of other net assets and an increase of approximately $996 of redeemable noncontrolling interest.
- On April 1, 2015, the Company launched a new partnership that was funded with $1,000 of proprietary capital and no third party capital and was therefore consolidated.
See accompanying notes.
48
ASSOCIATED CAPITAL GROUP, INC. AND SUBSIDIARIES
NOTES TO COMBINED CONSOLIDATED FINANCIAL STATEMENTS
As of and for the years ended December 31, 2015 and 2014
A. Organization and Spin-off Transaction
Unless we have indicated otherwise, or the context otherwise requires, references in this report to "Associated Capital Group, Inc.," "AC Group," "the Company," "AC," "we," "us" and "our" or similar terms are to Associated Capital Group, Inc., its predecessors and its subsidiaries.
The Spin-off and Related Transactions
We are a newly formed Delaware corporation organized to be the parent operating company for the Spin-off of GAMCO Investors, Inc. ("GAMCO's") alternative investment management business, institutional research services operations and certain cash and other assets.
On November 30, 2015, GAMCO distributed all the outstanding shares of each class of common stock of AC Group on a pro rata one-for-one basis to the holders of each class of GAMCO's common stock. Prior to the distribution, GAMCO contributed the 93.9% interest it held in Gabelli Securities, Inc. ("GSI") and certain cash and other assets to AC Group. GSI is an investment adviser registered with the Securities and Exchange Commission under the Investment Advisers Act of 1940, as amended.
GSI and its wholly owned subsidiary, Gabelli & Partners, LLC ("Gabelli & Partners"), collectively serve as general partners, co-general partners, or investment managers to investment funds including limited partnerships and offshore companies (collectively, "Investment Partnerships"), and separate accounts. We primarily manage assets in equity event-driven value strategies, across a range of risk and event arbitrage portfolios. The business earns fees from its advisory assets, and income (loss) from trading and investment portfolio activities. The advisory fees include management and incentive fees. Management fees are largely based on a percentage of the portfolios' levels of assets under management. Incentive fees are based on the percentage of profits derived from the investment performance delivered to clients' invested assets.
We operate our institutional research services operations through G.research, LLC ("G.research"), a wholly owned subsidiary of GSI. G.research is a broker-dealer registered under the Securities Exchange Act of 1934, as amended (the "Exchange Act"). Through G.research, we provide institutional research services as well as act as an underwriter. G.research is regulated by the Financial Industry Regulatory Authority ("FINRA"). G.research's revenues are derived primarily from institutional research services.
In addition, the following transactions were also undertaken in connection with the Spin-off:
GAMCO issued a promissory note (the "GAMCO Note") to AC Group in the original principal amount of $250.0 million used to partially capitalize the Company in connection with the Spin-off. The GAMCO Note bears interest at 4.0% per annum and has a maturity date of November 30, 2020 with respect to the original principal amount of the GAMCO Note. Interest on the GAMCO Note will accrue from the most recent date for which interest has been paid, or if no interest has been paid, from the effective date of the GAMCO Note; provided, however, that at the election of GAMCO, payment of interest on the GAMCO Note may, in lieu of being paid in cash, be paid, in whole or in part, in kind on the then-outstanding principal amount (a "PIK Amount"). GAMCO will repay the original principal amount of the GAMCO Note to AC Group, in cash, in five equal annual installments of $50 million on each interest payment date up to and including the maturity date and will repay all PIK Amounts added to the outstanding principal amount of the GAMCO Note, in cash, on the fifth anniversary of the date on which each such PIK Amount was added to the outstanding principal amount of the GAMCO Note. In no event may any interest be paid in kind subsequent to November 30, 2019. GAMCO may prepay the GAMCO Note prior to maturity without penalty.
In addition, AC Group, through its majority-owned GSI subsidiary, owns 4,393,055 shares of GAMCO Class A common stock. The sale was made from GAMCO to GSI in advance of the Spin-off. GSI paid the purchase price by issuing a note to GAMCO in the principal amount of $150 million (the "GSI Note"). In connection with the Spin-off, AC Group received the GSI Note from GAMCO and GSI became a majority-owned subsidiary of AC Group.
49
Consolidated Financial Statements
The Company's statement of financial condition at December 31, 2014, and the Company's combined consolidated statements of income for the eleven months ended November 30, 2015 and year ended December 31, 2014 were derived from the combined financial statements and accounting records of GAMCO and are presented as carve-out financial statements as the Company was not a standalone public company prior to the Spin-off. For the periods prior to the spin-off of the Company from GAMCO, the combined consolidated financial statements include allocations from GAMCO. These allocations may not be reflective of the actual level of assets, liabilities, income or costs which would have been incurred had the Company operated as a separate legal entity apart from GAMCO.
The Company's consolidated statement of financial condition at December 31, 2015, and the Company's consolidated statement of income for the one month ended December 31, 2015 are presented based on our actual results as a stand-alone public company subsequent to our Spin-off. References within these Notes to the consolidated statement of financial condition as of December 31, 2015 and the combined consolidated statement of financial condition as of December 31, 2014 shall hereinafter be referred to as the consolidated statements of financial condition.
All intercompany transactions and balances have been eliminated. Subsidiaries are fully consolidated from the date the Company obtains control and continue to be consolidated until the date that such control ceases. The Company's principal market is in the United States. Certain employees of GAMCO own 1.9% of GSI, and the remaining 4.2% of GSI is owned by individual investors unrelated to GAMCO and AC Group.
B. Significant Accounting Policies
Basis of Presentation
Use of Estimates
The preparation of the combined consolidated financial statements in conformity with accounting principles generally accepted in the United States of America ("GAAP") requires management to make estimates and assumptions that affect the reported amounts of assets and liabilities and disclosure of contingent assets and liabilities at the date of the financial statements and the reported amounts of revenues and expenses during the reporting period. Actual results could differ from those estimates.
Cash and Cash Equivalents
Cash equivalents primarily consist of an affiliated money market mutual fund which is highly liquid. U.S. Treasury Bills and Notes with maturities of three months or less at the time of purchase are also considered cash equivalents.
Investments in Securities
Investments in securities are accounted for as either "trading securities" or "available for sale" and are stated at fair value. Management determines the appropriate classification of debt and equity securities at the time of purchase and reevaluates such designations as of each balance sheet date. U.S. Treasury Bills and Notes with maturities of greater than three months at the time of purchase are considered investments in securities. Securities that are not readily marketable are stated at their estimated fair values in accordance with GAAP. A substantial portion of investments in securities are held for resale in anticipation of short-term market movements and therefore are classified as trading securities. Trading securities are stated at fair value, with any unrealized gains or losses reported in current period earnings in net gain from investments on the combined consolidated statements of income. Available for sale ("AFS") investments are stated at fair value, with any unrealized gains or losses, net of taxes, reported as a component of other comprehensive loss on the combined consolidated statements of comprehensive loss except for losses deemed to be other than temporary which are recorded as realized losses on the combined consolidated statements of income. Securities transactions and any related gains and losses are recorded on a trade date basis. Realized gains and losses from securities transactions are recorded on the specific identified cost basis and are included in net gain from investments on the combined consolidated statements of income.
50
AFS securities are evaluated for other than temporary impairments each reporting period, and any impairment charges are recorded in net gain from investments on the combined consolidated statements of income. Management reviews all AFS securities whose cost exceeds their fair value to determine if the impairment is other than temporary. Management uses qualitative factors such as diversification of the investment, the intent to hold the investment, the amount of time that the investment has been impaired and the severity of the decline in determining whether the impairment is other than temporary.
Securities sold, not yet purchased are recorded on the trade date, and are stated at fair value and represent obligations of the Company to purchase the securities at prevailing market prices. Therefore, the future satisfaction of such obligations may be for an amount greater or less than the amounts recorded on the consolidated statements of financial condition. The ultimate gains or losses recognized are dependent upon the prices at which these securities are purchased to settle the obligations under the sales commitments. Realized gains and losses from covers of securities sold, not yet purchased transactions are included in net gain/(loss) from investments on the combined consolidated statements of income. Unrealized gains and losses on securities sold, not yet purchased are reported in current period earnings in net gain from investments on the combined consolidated statements of income.
Fair Value of Financial Instruments
All of the instruments within investments in securities are measured at fair value. Certain investments in partnerships are also measured at fair value.
The Company's assets and liabilities recorded at fair value have been categorized based upon a fair value hierarchy in accordance with the Financial Accounting Standards Board's ("FASB") guidance on fair value measurement. The levels of the fair value hierarchy and their applicability to the Company are described below:
|
●
|
Level 1 inputs utilize quoted prices (unadjusted) in active markets for identical assets or liabilities at the reporting date. Level 1 asset includes cash equivalents, government obligations, open-end mutual funds, closed-end funds and equities.
|
|
●
|
Level 2 inputs utilize inputs other than quoted prices included in Level 1 that are observable for the asset or liability, either directly or indirectly. Level 2 inputs include quoted prices for similar assets and liabilities in active markets, quoted prices for identical or similar assets or liabilities that are not active and inputs other than quoted prices that are observable for the asset or liability, such as interest rates and yield curves that are observable at commonly-quoted intervals. Assets that generally are included in this category may include certain limited partnership interests in private funds and over the counter derivatives that have inputs to the valuations that can generally be corroborated by observable market data.
|
|
●
|
Level 3 inputs are unobservable inputs for the asset or liability, and include situations where there is little, if any, market activity for the asset or liability. Assets included in this category generally include equities that trade infrequently and direct private equity investments held within consolidated partnerships.
|
In certain cases, the inputs used to measure fair value may fall into different levels of the fair value hierarchy. In such cases, the level in the fair value hierarchy within which the fair value measurement in its entirety falls has been determined based on the lowest level input that is significant to the fair value measurement in its entirety. The Company's assessment of the significance of a particular input to the fair value measurement in its entirety requires judgment and considers factors specific to the asset or liability. Investments are transferred into or out of any level at their beginning period values.
The availability of observable inputs can vary from instrument to instrument and is affected by a wide variety of factors, including, for example, the type of instrument, whether the instrument is new and not yet established in the marketplace, and other characteristics particular to the transaction. To the extent that valuation is based on models or inputs that are less observable or unobservable in the market, the determination of fair value requires more judgment. Accordingly, the degree of judgment exercised by the Company in determining fair value is greatest for instruments categorized as Level 3.
51
The valuation process and policies reside with the financial reporting and accounting group which reports to the Chief Financial Officer of the Company. The Company uses the "market approach" valuation technique to value investments in Level 3 investments. The Company's valuation of the Level 3 investments has been based upon either i) the recent sale prices of the issuer's equity securities or ii) the net assets, book value or cost basis of the issuer when there are no recent sales prices available.
In the absence of a closing price, an average of the bid and ask price is used. Bid prices reflect the highest price that the market is willing to pay for an asset. Ask prices represent the lowest price that
The market is willing to accept for an asset.
Cash equivalents—Cash equivalents primarily consist of an affiliated money market mutual fund which is invested solely in U.S. Treasuries and valued based on the net asset value of the fund. Cash equivalents are valued using unadjusted quoted market prices. Accordingly, cash equivalents are categorized in Level 1 of the fair value hierarchy.
Investments in securities—Investments in securities and securities sold not yet purchased are generally valued based on quoted prices from an exchange. To the extent these securities are actively traded, valuation adjustments are not applied, and they are categorized in Level 1 of the fair value hierarchy. Securities categorized in Level 2 investments are valued using other observable inputs. Nonpublic and infrequently traded investments are included in Level 3 of the fair value hierarchy because significant inputs to measure fair value are unobservable.
Investments in Partnerships—The Company's investments include limited partner investments in consolidated feeder funds. The Company considers the net asset value of the master funds held by the consolidated feeder fund to be the best estimate of fair value. Investments in private funds that are redeemable at the measurement date or within the near term are categorized in Level 2 of the fair value hierarchy. We may redeem our investments in these funds monthly with 30 days' notice. Otherwise, funds are categorized in Level 3 of the fair value hierarchy.
Receivables from Affiliates and Payables to Affiliates
Receivables from affiliates consist primarily of incentive fees/allocation and advisory fees due from certain affiliated partnerships. Payables to affiliates primarily consist of loans payable to GAMCO. See Note G.
Receivables from and Payables to Brokers
Receivables from and payables to brokers consist of amounts arising from the purchases and sales of securities as well as cash amounts held in anticipation of investment.
Consolidation
In accordance with the consolidation assessment models set forth in Accounting Standards Codification ("Codification") 810-10 and 810-20, the Company consolidates all investments in partnerships and affiliates in which the Company has a controlling interest or is deemed to be the primary beneficiary. In order to make this determination, an analysis is performed to determine if the entity is a variable interest entity ("VIE") or a voting interest entity ("VOE"). If the entity is a VIE, further analysis, as discussed below, is performed to determine if the Company is the primary beneficiary of the entity. If the entity is not a VIE, the Company will apply the VOE model as discussed below.
Variable Interest Entities
A VIE is an entity in which either (a) the equity investment at risk is not sufficient to permit the entity to finance its own activities without additional financial support; (b) the equity investors do not have the ability to make decisions about the entities' activities or obligation to absorb the expected losses of the entity or the right to receive the expected residual returns of the entity or (c) the voting rights are not proportional to their obligations to absorb the expected losses of the entity or their rights to receive the expected residual returns of the entity. The Company evaluates whether entities in which it has an interest are VIEs and whether the Company is the primary beneficiary of any VIEs identified in its analysis. The Company is the primary beneficiary if it absorbs a majority of the VIE's expected losses, expected residual returns, or both. If the Company is the primary beneficiary of a VIE, it consolidates that entity. If the Company is not the primary beneficiary, it accounts for its investment under the equity method.
52
In June 2009, the FASB amended the guidance on VIEs when it issued ASU 2009-17. This guidance requires that if a decision maker has a variable interest in a VIE, the decision maker is not solely acting in a fiduciary capacity and would be required to consolidate the VIE if it has both the power to direct the most significant activities of the VIE and economic exposure that could potentially be significant to the VIE. The Company is general partner or co-general partner of various sponsored partnerships and the investment manager of various sponsored offshore funds whose underlying assets consist primarily of marketable securities (the "affiliated entities"). If the Company were to apply such guidance, it would be required to consolidate most of its affiliated entities. In February 2010, the FASB issued ASU 2010-10, which indefinitely deferred the effective date of the amendments to Codification 810-10 made by ASU 2009-17, for a reporting entity's interest in certain entities. Currently, interests in entities that qualify for the deferral are evaluated by applying the VIE model in Codification 810-10 (i.e., before the amendments by ASU 2009-17), while interests in entities that do not qualify for the deferral must be evaluated under the amendments in ASU 2009-17. Because all of the entities with which the Company is involved which would have been subject to the guidance in ASU 2009-17 were determined to qualify for the FASB's deferral of such guidance, the Company applies the guidance for VIEs that existed prior to the issuance of ASU 2009-17.
Voting Interest Entities
If the entity is not considered a VIE, it is treated as a VOE, and the Company applies the guidance in Codification 810-20 in determining whether the entity should be consolidated. Under Codification 810-20, the general partner or investment manager is deemed to control the entity and therefore must consolidate it unless the unaffiliated limited partners or shareholders (a) have the ability to remove the general partner or investment manager, without cause; (b) have the ability to dissolve the entity or (c) have substantive participating rights. If the unaffiliated limited partners or shareholders possess any of the foregoing rights, then the Company does not consolidate the entity, and either the equity or cost method of accounting is applied. If the unaffiliated limited partners or shareholders do not have any such rights, the Company consolidates the entity.
Equity Method Investments
Substantially all of the Company's equity method investees are entities that record their underlying investments at fair value. Therefore, under the equity method of accounting, the Company's share of the investee's underlying net income predominantly represents fair value adjustments in the investments held by the equity method investees. The Company's share of the investee's underlying net income or loss is based upon the most currently available information and is recorded as "Net gain from investments" on the combined consolidated statements of income. Capital contributions are recorded as an increase in investments when paid, while withdrawals and distributions are recorded as reductions of the investments when received. Depending on the terms of the investment, the Company may be restricted as to the timing and amounts of withdrawals.
See Note D. Investments in Partnerships, Offshore Funds and Variable Interest Entities for more detail as to the number and types of entities consolidated as well as the impact on the consolidated statements of financial condition and combined consolidated statements of income.
Investments in Partnerships and Affiliates
The Company is general partner or co-general partner of various affiliated entities. We also have investments in unaffiliated partnerships, offshore funds and other entities ("unaffiliated entities"). Given that we are not a general partner or investment manager in any unaffiliated entities, we do not earn any management or incentive fees/allocation and we do not have a controlling financial interest, we do not currently consolidate any unaffiliated entities.
Our balance sheet caption "Investments in partnerships" includes those investments, in both affiliated and unaffiliated entities, which the Company accounts for under the equity method of accounting and certain investments in consolidated feeder funds ("CFFs") that the Company accounts for at fair value, as described below.
For CFFs that own 100% of their offshore master funds, the Company retains the CFF's specialized investment company accounting (i.e., the CFFs account for their investment in master funds at fair value).
The Company records noncontrolling interests in consolidated entities for which the Company's ownership is less than 100%. Refer to Noncontrolling Interests section within Note B for additional disclosures.
53
Derivative Financial Instruments
The Company recognizes all derivatives as either assets or liabilities measured at fair value and are included in either investments in securities or securities sold, not yet purchased on the consolidated statements of financial condition. From time to time, the Company will enter into hedging transactions to manage its exposure to foreign currencies and equity prices related to its proprietary investments. During 2015 and 2014, the Company had derivative transactions which resulted in net gains of $264,000 and $729,000, respectively. At December 31, 2015 and 2014, we held derivative contracts on 0.3 million equity shares and 3.8 million equity shares, respectively, and the net fair value was $149,000 and $262,000, respectively, and is included as investments in securities on the consolidated statements of financial condition. These transactions are not designated as hedges for accounting purposes, and changes in fair values of these derivatives are included in net gain from investments on the combined consolidated statements of income and included in investments in securities or securities sold, not yet purchased on the consolidated statements of financial condition.
Securities Transactions
The Company also generates investment gains or losses from its proprietary trading activities which are included in net gain from investments on the combined consolidated statements of income.
Management determines the appropriate classification of debt and equity securities at the time of purchase and reevaluates such designation as of the date of each consolidated statement of financial condition. Investments in United States Treasury Bills and Notes with maturities of greater than three months at the time of purchase are classified as investments in securities, and those with maturities of three months or less at the time of purchase are classified as cash equivalents. The portion of investments in securities held for resale in anticipation of short-term market movements are classified as trading securities. Trading securities are stated at fair value, with any unrealized gains or losses reported in current period earnings. AFS investments are stated at fair value, with any unrealized gains or losses, net of taxes, reported as a component of equity except for losses deemed to be other than temporary ("OTT") which are recorded as realized losses in the combined consolidated statements of income.
Major Revenue-Generating Services and Revenue Recognition
Advisory fees from investment partnerships and offshore funds are computed either monthly or quarterly, and amounts receivable are included in receivables from affiliates on the consolidated statements of financial condition.
Revenues from investment partnerships and offshore funds also generally include either an incentive fee/allocation on the absolute gain in a portfolio or a fee of 20% of the economic profit as defined in the partnership agreement and is included in investment advisory and incentive fees on the combined consolidated statements of income. The incentive allocation or fee is recognized at the end of the measurement period, which is annually, and amounts receivable are included in either receivables from affiliates or investment advisory fees receivable on the consolidated statements of financial condition.
Institutional research services includes commission revenues, sales manager fees and underwriting fees and amounts receivable are included in receivables from brokers and clearing organizations on the combined consolidated statements of financial condition. Related clearing charges are recorded on a trade-date basis, and are included in other operating expenses on the combined consolidated statements of income. Underwriting fees include underwriting revenues and syndicate profits and are accrued as earned. Underwriting fees include gains, losses, selling concessions and fees, net of syndicate expenses, arising from securities offerings in which the Company acts as underwriter or agent.
Effective January 1, 2014, the Company, through G.research, entered into agreements with two affiliates, GAMCO Asset Management Inc. and Gabelli Funds, LLC, to provide each affiliate with the same types of research services that it provides to its other clients. The agreements call for the two affiliates to pay a research services fee. The annual fee amounts are determined by negotiations between the Company and each entity that utilizes the Company's research.
54
Depreciation
Fixed assets are recorded at cost and depreciated using the straight-line method over their estimated useful lives of four to seven years. For the years ended December 31, 2015 and 2014, depreciation was $13,000 and $14,000, respectively, on fixed assets with a cost of $57,000 and $61,000, respectively, and a net book value of $19,000 and $30,000, respectively. We estimate that depreciation will be approximately $13,000 annually over the next three years. As of December 31, 2015 and 2014, the Company wrote off assets in the amount of $2,000 and $16,000, respectively, that were fully depreciated and had been retired.
Allocated Expenses
The Company is charged or incurs certain overhead expenses that are paid by, or paid on our behalf by other affiliates and are included in other operating expenses on the combined consolidated statements of income. These overhead expenses primarily relate to centralized functions including finance and accounting, legal, compliance, treasury, tax, internal audit, information technology, human resources and risk management functions. These overhead expenses are allocated to the Company by other affiliates or allocated by the Company to other affiliates as the expenses are incurred, based upon direct usage when identifiable, with the remainder allocated based on revenue, headcount, space or other methodologies periodically reviewed by the management of the Company and the affiliates. In addition, the Company serves as paymaster under a compensation payment sharing agreement. This includes compensation expense and related payroll taxes and benefits which are fully paid by the Company for professional staff performing duties related to the Company and affiliates. These compensation expenses are included in compensation on the combined consolidated statements of income. All of the allocations and estimates in these financial statements are based on assumptions that management of AC believes are reasonable. However, these allocations may not be indicative of the actual expenses we would have incurred or may incur in the future.
Management Fee
Management fee expense in the amount of 10% of the aggregate pre-tax profits, before consideration of this fee and before consideration of the various consolidated feeder funds and partnerships, is paid to the Chairman or his designated assignees in accordance with his employment agreement.
Stock Based Compensation
The Company maintains one Plan approved by the shareholders, which is designed to provide incentives which will attract and retain individual's key to the success of AC through direct or indirect ownership of our common stock. Benefits under the Plan may be granted in any one or a combination of stock options, stock appreciation rights, restricted stock, restricted stock units, stock awards, dividend equivalents and other stock or cash based awards. A maximum of 0.9 million shares of Class A Stock have been reserved for issuance under the Plans by a committee of the Board of Directors responsible for administering the Plans ("Compensation Committee"). Under the Plan, the committee may grant RSAs and either incentive or nonqualified stock options with a term not to exceed ten years from the grant date and at an exercise price that the committee may determine.
On November 30, 2015, in connection with the Spin-off of the Company from GAMCO, the Company issued 554,100 AC RSA shares to GAMCO employees (including GAMCO employees who became AC employees) who held 554,100 GAMCO RSA shares at that date. The purpose of the issuance was to ensure that any employee who had GAMCO RSAs were granted an equal number of AC RSAs so that the total value of the RSAs post-spin-off was equivalent to the total value pre-spin-off. In accordance with GAAP, we have allocated the stock compensation costs between GAMCO and AC based upon each employee's individual allocation of their responsibilities between GAMCO and AC. As of December 31, 2015, there were 553,100 AC RSA shares outstanding. All grants of the RSA shares were recommended by the Company's Chairman, who did not receive a RSA, and approved by the Compensation Committee. This expense, net of estimated forfeitures, is recognized over the vesting period for these awards which is either (1) 30% over three years from the date of grant and 70% over five years from the date of grant or (2) 30% over three years from the date of grant and 10% each year over years four through ten from the date of grant. During the vesting period, dividends to RSA holders are held for them until the RSA vesting dates and are forfeited if the grantee is no longer employed by the Company on the vesting dates. Dividends declared on these RSAs, less estimated forfeitures, are charged to retained earnings on the declaration date.
55
Goodwill
Goodwill is initially measured as the excess of the cost of the acquired business over the sum of the fair value assigned to assets acquired less the liabilities assumed. Goodwill is tested for impairment at least annually on November 30th and whenever certain triggering events are met. In assessing the recoverability of goodwill for the subsidiary's annual impairment test on November 30, 2015 and 2014, we performed a qualitative assessment of whether it was more likely than not that an impairment has occurred and concluded that a quantitative analysis was not required. As part of this assessment, it was also determined that there was no risk of failing the quantitative impairment testing step that compares the subsidiary fair value to its carrying value. No impairment was recorded during 2015.
Income Taxes
For purposes of the preparation of the combined consolidated financial statements, the Company accounts for income taxes as if it followed the asset and liability method, which requires the recognition of deferred tax assets and liabilities for the expected future tax consequences of events that have been included in the combined consolidated financial statements. Under this method, deferred tax assets and liabilities are determined based on the differences between the financial statement and tax basis of assets and liabilities using enacted tax rates in effect for the year in which the differences are expected to reverse. The effect of a change in tax rates on deferred tax assets and liabilities is recognized in income tax expense/benefit in the period that includes the enactment date of the change in tax rate.
The Company records net deferred tax assets to the extent the Company believes these assets will more likely than not be realized. A valuation allowance would be recorded to reduce the carrying value of deferred tax assets to the amount that is more likely than not to be realized. In making such a determination of whether a valuation allowance is necessary, the Company considers all available positive and negative evidence, including future reversals of existing taxable temporary differences, projected future taxable income, tax-planning strategies, and results of recent operations. In the event the Company were to determine that the Company would be able to realize the Company's deferred income tax assets in the future in excess of their net recorded amount, the Company would make an adjustment to the deferred tax asset valuation allowance, which would reduce the provision for income taxes.
The Company records uncertain tax positions in accordance with Codification Topic 740 on the basis of a two-step process whereby (1) the Company determines whether it is more likely than not that the tax positions will be sustained based on the technical merits of the position and (2) for those tax positions that meet the more-likely-than-not recognition threshold, the Company recognizes the largest amount of tax benefit that is greater than 50 percent likely to be realized upon ultimate settlement with the related tax authority. The Company recognizes the accrual of interest on uncertain tax positions and penalties in income tax provision on the combined consolidated statements of income. Accrued interest and penalties on uncertain tax positions are included within accrued expenses and other liabilities on the consolidated statements of financial condition.
Noncontrolling Interests
Noncontrolling interests that are mandatorily redeemable upon a certain date or event occurring are classified as liabilities and relate to certain stockholders of GSI who are employed by GAMCO, or its affiliates, who are required to sell their shares back to GSI at book value once they cease being employed by GAMCO, or its affiliates. Noncontrolling interests in investment partnerships and offshore funds that are redeemable at the option of the holder are classified as redeemable noncontrolling interests in the mezzanine section of the combined consolidated statements of financial condition between liabilities and equity.
For the years ended December 31, 2015, and 2014, net income attributable to noncontrolling interests on the combined consolidated statements of income represents income attributable to certain limited partners of investment partnerships and offshore funds that are consolidated. The income attributable to the mandatorily redeemable noncontrolling interests classified as liabilities is included in other operating expenses on the combined consolidated statements of income.
56
Concentration of Credit Risk
Financial instruments that potentially subject the Company to concentrations of credit risk consist primarily of cash and cash equivalents and receivable from brokers. The Company maintains cash and cash equivalents primarily in the Gabelli U.S. Treasury Money Market Fund, which invests fully in instruments issued by the U.S. Government, and has receivables from brokers with various brokers and financial institutions, where these balances can exceed the federally insured limit. The concentration of credit risk with respect to advisory fees and incentive fees/allocation, which are included in receivables from affiliates on the combined consolidated statements of financial condition, is generally limited due to the short payment terms extended to clients by the Company. All investments in securities are held at third party brokers or custodians.
Net transfer to /from Parent
Net transfer to/from Parent in the combined consolidated financial statements represents the net effect of transactions with and allocations from GAMCO prior to the Spin-off.
Business Segment
The Company operates in one business segment, the investment advisory and asset management business. The Company conducts its investment advisory business principally through GSI.
Recent Accounting Developments
In May 2014, the FASB issued ASU No. 2014-09, "Revenue from Contracts with Customers," which supersedes the revenue recognition requirements in the Accounting Standards Codification ("Codification") Topic 605, Revenue Recognition, and most industry-specific guidance throughout the industry topics of the Codification. The core principle of the new ASU No. 2014-09 is for companies to recognize revenue from the transfer of goods or services to customers in amounts that reflect the consideration to which the company expects to be entitled in exchange for those goods or services. The new standard provides a five-step approach to be applied to all contracts with customers and also requires expanded disclosures about revenue recognition. The ASU is effective for annual reporting periods beginning after December 15, 2017, including interim periods and is to be retrospectively applied. Early adoption is not permitted. The Company is currently evaluating this guidance and the impact it will have on its combined consolidated financial statements.
In June 2014, the FASB issued an accounting update clarifying that entities should treat performance targets that could be met after the requisite service period of a share-based payment award as performance conditions that affect vesting. Therefore, an entity would not record compensation expense (measured as of the grant date) for an award where transfer to the employee is contingent upon satisfaction of the performance target until it becomes probable that the performance target will be met. The guidance is effective for the Company beginning January 1, 2016. Early adoption is permitted. This guidance is not expected to have a material impact on the Company's combined consolidated financial statements.
In February 2015, the FASB issued an accounting update amending the consolidation requirements under GAAP. This guidance is effective for the Company beginning January 1, 2016. The Company is currently evaluating this guidance and the impact it will have on its combined consolidated financial statements.
In January 2016, the FASB issued an accounting update amending the guidance on the classification and measurement of financial instruments. This amended guidance significantly revises an entity's accounting related to (1) the classification and measurement of investments in equity securities and (2) the presentation of certain fair value changes for financial liabilities measured at fair value. This guidance is effective for the Company beginning January 1, 2018. The Company is currently evaluating this guidance and the impact it will have on its combined consolidated financial statements.
57
C. Investments in Securities
Investments in securities at December 31, 2015 and 2014 consisted of the following:
|
2015
|
2014
|
|||||||||||||||
|
Cost
|
Fair Value
|
Cost
|
Fair Value
|
|||||||||||||
|
(In thousands)
|
||||||||||||||||
|
Trading securities:
|
||||||||||||||||
|
Government obligations
|
$
|
99,897
|
$
|
99,940
|
$
|
18,994
|
$
|
18,996
|
||||||||
|
Common stocks
|
78,974
|
92,194
|
170,977
|
195,029
|
||||||||||||
|
Mutual funds
|
2,578
|
3,216
|
2,432
|
3,498
|
||||||||||||
|
Other investments
|
570
|
771
|
743
|
1,704
|
||||||||||||
|
Total trading securities
|
182,019
|
196,121
|
193,146
|
219,227
|
||||||||||||
|
Available for sale securities:
|
||||||||||||||||
|
Common stocks
|
150,000
|
136,360
|
-
|
-
|
||||||||||||
|
Mutual funds
|
627
|
1,143
|
681
|
1,368
|
||||||||||||
|
Total available for sale securities
|
150,627
|
137,503
|
681
|
1,368
|
||||||||||||
|
Total investments in securities
|
$
|
332,646
|
$
|
333,624
|
$
|
193,827
|
$
|
220,595
|
||||||||
Securities sold, not yet purchased at December 31, 2015 and 2014 consisted of the following:
|
2015
|
2014
|
|||||||||||||||
|
Cost
|
Fair Value
|
Cost
|
Fair Value
|
|||||||||||||
|
(In thousands)
|
||||||||||||||||
|
Trading securities:
|
||||||||||||||||
|
Common stocks
|
$
|
10,095
|
$
|
9,537
|
$
|
9,835
|
$
|
9,960
|
||||||||
|
Other investments
|
24
|
86
|
1
|
635
|
||||||||||||
|
Total securities sold, not yet purchased
|
$
|
10,119
|
$
|
9,623
|
$
|
9,836
|
$
|
10,595
|
||||||||
Investments in affiliated registered investment companies at December 31, 2015 and 2014 consisted of the following:
|
2015
|
2014
|
|||||||||||||||
|
Cost
|
Fair Value
|
Cost
|
Fair Value
|
|||||||||||||
|
(In thousands)
|
||||||||||||||||
|
Trading securities:
|
||||||||||||||||
|
Mutual funds
|
$
|
40,097
|
$
|
43,133
|
$
|
1
|
$
|
1
|
||||||||
|
Total trading securities
|
40,097
|
43,133
|
1
|
1
|
||||||||||||
|
Available for sale securities:
|
||||||||||||||||
|
Closed-end funds
|
62,070
|
72,591
|
21,962
|
36,323
|
||||||||||||
|
Mutual funds
|
1,846
|
2,952
|
1,898
|
3,213
|
||||||||||||
|
Total available for sale securities
|
63,916
|
75,543
|
23,860
|
39,536
|
||||||||||||
|
Total investments in affiliated
|
||||||||||||||||
|
registered investment companies
|
$
|
104,013
|
$
|
118,676
|
$
|
23,861
|
$
|
39,537
|
||||||||
58
The following table identifies all reclassifications out of accumulated other comprehensive income ("AOCI") and into net income/(loss) for the year ended December 31, 2015 and 2014 (in thousands):
|
Amount
|
Affected Line Item
|
Reason for
|
|||||||||
|
Reclassified
|
in the Statements
|
Reclassification
|
|||||||||
|
from AOCI
|
of Income
|
from AOCI
|
|||||||||
|
Twelve months ended December 31,
|
|||||||||||
|
2015
|
2014
|
||||||||||
|
$
|
25
|
$
|
2,978
|
Net gain/(loss) from investments
|
Realized gains on sale of AFS securities
|
||||||
|
-
|
54
|
Other operating expenses
|
Donation of AFS securities
|
||||||||
|
(216
|
)
|
(69
|
)
|
Net gain/(loss) from investments
|
Other than temporary impairment of AFS securities
|
||||||
|
(191
|
)
|
2,963
|
Income/(loss) before income taxes
|
||||||||
|
69
|
(1,096
|
)
|
Income tax provision/(benefit)
|
||||||||
|
$
|
(122
|
)
|
$
|
1,867
|
Net income/(loss)
|
||||||
The Company recognizes all equity derivatives as either assets or liabilities measured at fair value and includes them in either investments in securities or securities sold, not yet purchased on the consolidated statements of financial condition. From time to time, the Company and/or the partnerships and offshore funds that the Company consolidates will enter into hedging transactions to manage their exposure to foreign currencies and equity prices related to their proprietary investments. At December 31, 2015 and December 31, 2014 we held derivative contracts on 250,000 equity shares and 3.8 million equity shares, respectively, that are included in investments in securities or securities sold, not yet purchased on the consolidated statements of financial condition. We had two foreign exchange contracts and one foreign exchange contract outstanding at December 31, 2015 and December 31, 2014, respectively, that are included in receivable from brokers or payable to brokers on the consolidated statements of financial condition. Aside from one foreign exchange contract, these transactions are not designated as hedges for accounting purposes, and therefore changes in fair values of these derivatives are included in net gain/(loss) from investments on the combined consolidated statements of income. The one foreign exchange contract that is designated as a hedge was for a short of British Pounds to hedge the long investment that we have in our London Stock Exchange listed Gabelli Value Plus+ Trust Ltd. closed-end fund which is denominated in British Pounds. As the underlying investment that is being hedged is an available for sale security, the portion of the change in value of the closed-end fund that is currency related is recorded in net gain/(loss) from investments on the combined consolidated statements of income and not in combined consolidated accumulated comprehensive income.
The following tables identify the fair values and gains and losses of all derivatives and foreign currency positions held by the Company (in thousands):
|
Asset Derivatives
|
Liability Derivatives
|
|||||||||||||||||
|
|
Statement of |
Fair Value
|
Statement of
|
Fair Value
|
||||||||||||||
|
|
Financial Condition |
December 31,
|
December 31,
|
Financial Condition
|
December 31,
|
December 31,
|
||||||||||||
|
|
Location |
2015
|
2014
|
Location
|
2015
|
2014
|
||||||||||||
|
Derivatives designated as hedging
|
||||||||||||||||||
|
instruments under FASB ASC 815-20
|
||||||||||||||||||
|
Foreign exchange contracts
|
Receivable from brokers
|
$
|
-
|
$
|
-
|
Payable to brokers
|
$
|
37,584
|
$
|
-
|
||||||||
|
Sub total
|
$
|
-
|
$
|
-
|
$
|
37,584
|
$
|
-
|
||||||||||
|
Derivatives not designated as hedging
|
||||||||||||||||||
|
instruments under FASB ASC 815-20
|
||||||||||||||||||
|
Equity contracts
|
Investments in
|
Securities sold,
|
||||||||||||||||
|
|
securities
|
$
|
236
|
$
|
896
|
not yet purchased
|
$
|
86
|
$
|
635
|
||||||||
|
Foreign exchange contracts
|
Receivable from brokers
|
-
|
-
|
Payable to brokers
|
5,017
|
5,470
|
||||||||||||
|
Sub total
|
$
|
236
|
$
|
896
|
$
|
5,103
|
$
|
6,105
|
||||||||||
|
Total derivatives
|
$
|
236
|
$
|
896
|
$
|
42,687
|
$
|
6,105
|
||||||||||
59
|
Type of Derivative
|
Income Statement Location
|
Year ended December 31,
|
||||||
|
2015
|
2014
|
|||||||
|
Foreign exchange contracts
|
Net gain/(loss) from investments
|
$
|
2,456
|
$
|
792
|
|||
|
Equity contracts
|
Net gain/(loss) from investments
|
264
|
729
|
|||||
|
Total
|
$
|
2,720
|
$
|
1,521
|
||||
The Company is a party to enforceable master netting arrangements for swaps entered into as part of the Company's investment strategy. They are typically not used as hedging instruments. These swaps, while settled on a net basis with the counterparties, major U.S. financial institutions, are shown gross in assets and liabilities on the consolidated statements of financial condition. The swaps have a firm contract end date and are closed out and settled when each contract expires.
|
Gross Amounts Not Offset in the
|
||||||||||||||||||
|
Statements of Financial Condition
|
||||||||||||||||||
|
Gross
|
Gross Amounts
|
Net Amounts of
|
||||||||||||||||
|
Amounts of
|
Offset in the
|
Assets Presented
|
||||||||||||||||
|
Recognized
|
Statements of
|
in the Statements of
|
Financial
|
Cash Collateral
|
||||||||||||||
|
Assets
|
Financial Condition
|
Financial Condition
|
Instruments
|
Received
|
Net Amount
|
|||||||||||||
|
Swaps:
|
(In thousands)
|
|||||||||||||||||
|
December 31, 2015
|
$
|
177
|
$
|
-
|
$
|
177
|
$
|
(81
|
)
|
$
|
-
|
$
|
96
|
|||||
|
December 31, 2014
|
$
|
896
|
$
|
-
|
$
|
896
|
$
|
(634
|
)
|
$
|
-
|
$
|
262
|
|||||
|
Gross Amounts Not Offset in the
|
||||||||||||||||||
|
Statements of Financial Condition
|
||||||||||||||||||
|
Gross
|
Gross Amounts
|
Net Amounts of
|
||||||||||||||||
|
Amounts of
|
Offset in the
|
Liabilities Presented
|
||||||||||||||||
|
Recognized
|
Statements of
|
in the Statements of
|
Financial
|
Cash Collateral
|
||||||||||||||
|
Liabilities
|
Financial Condition
|
Financial Condition
|
Instruments
|
Pledged
|
Net Amount
|
|||||||||||||
|
Swaps:
|
(In thousands)
|
|||||||||||||||||
|
December 31, 2015
|
$
|
81
|
$
|
-
|
$
|
81
|
$
|
(81
|
)
|
$
|
-
|
$
|
-
|
|||||
|
December 31, 2014
|
$
|
634
|
$
|
-
|
$
|
634
|
$
|
(634
|
)
|
$
|
-
|
$
|
-
|
|||||
The following is a summary of the cost, gross unrealized gains, gross unrealized losses and fair value of AFS investments as of December 31, 2015 and 2014:
|
December 31, 2015
|
||||||||||||||||
|
Gross
|
Gross
|
|||||||||||||||
|
Unrealized
|
Unrealized
|
Fair
|
||||||||||||||
|
Cost
|
Gains
|
Losses
|
Value
|
|||||||||||||
|
(In thousands)
|
||||||||||||||||
|
Common stocks
|
$
|
150,000
|
$
|
-
|
$
|
(13,640
|
)
|
$
|
136,360
|
|||||||
|
Closed-end Funds
|
62,070
|
11,299
|
(778
|
)
|
72,591
|
|||||||||||
|
Mutual funds
|
2,472
|
1,641
|
(18
|
)
|
4,095
|
|||||||||||
|
Total available for sale securities
|
$
|
214,542
|
$
|
12,940
|
$
|
(14,436
|
)
|
$
|
213,046
|
|||||||
|
December 31, 2014
|
||||||||||||||||
|
Gross
|
Gross
|
|||||||||||||||
|
Unrealized
|
Unrealized
|
Fair
|
||||||||||||||
|
Cost
|
Gains
|
Losses
|
Value
|
|||||||||||||
|
(In thousands)
|
||||||||||||||||
|
Closed-end Funds
|
$
|
21,962
|
$
|
14,398
|
$
|
(37
|
)
|
$
|
36,323
|
|||||||
|
Mutual funds
|
2,579
|
2,030
|
(28
|
)
|
4,581
|
|||||||||||
|
Total available for sale securities
|
$
|
24,541
|
$
|
16,428
|
$
|
(65
|
)
|
$
|
40,904
|
|||||||
Increases in unrealized losses, net of taxes, for AFS securities for the years ended December 31, 2015 and 2014 of $11.2 million and $0.6 million, respectively, have been included in other comprehensive income at December 31, 2015 and 2014, respectively.
60
The amount reclassified from other comprehensive loss for the years ended December 31, 2015 and 2014 were gains of $0.1 million and losses of $1.9 million, respectively. Return of capital on AFS securities were $0.5 million and $0.5 million for the years ended December 31, 2015 and 2014, respectively. Proceeds from sales of investments available for sale were approximately $1.0 million and $4.7 million for the years ended December 31, 2015 and 2014, respectively. For the years ended December 31, 2015 and 2014, gross gains on the sale of investments available for sale amounted to $25,000 and $3.0 million, respectively, and were reclassed from other comprehensive loss into the combined consolidated statements of income. There were no losses on the sale of investments available for sale for the years ended December 31, 2015 and 2014. The basis on which the cost of a security sold is determined is specific identification. Accumulated other comprehensive loss on the combined consolidated statements of equity is primarily comprised of unrealized gains/losses, net of taxes, for AFS securities.
The Company has an established accounting policy and methodology to determine other-than-temporary impairment. Under this policy, AFS securities are evaluated for other than temporary impairments and any impairment charges are recorded in net gain from investments on the combined consolidated statements of income. Management reviews all AFS securities whose cost exceeds their market value to determine if the impairment is other than temporary. Management uses qualitative factors such as diversification of the investment, the amount of time that the investment has been impaired, the intent to sell and the severity of the decline in determining whether the impairment is other than temporary.
Investments classified as AFS that are in an unrealized loss position for which other-than-temporary impairment has not been recognized consisted of the following:
|
December 31, 2015
|
December 31, 2014
|
|||||||||||||||||||||||
|
Unrealized
|
Unrealized
|
|||||||||||||||||||||||
|
Cost
|
Losses
|
Fair Value
|
Cost
|
Losses
|
Fair Value
|
|||||||||||||||||||
|
(in thousands)
|
||||||||||||||||||||||||
|
Common Stocks
|
$
|
150,000
|
$
|
(13,640
|
)
|
$
|
136,360
|
$
|
-
|
$
|
-
|
$
|
-
|
|||||||||||
|
Closed-end Funds
|
40,627
|
(778
|
)
|
39,849
|
812
|
(37
|
)
|
775
|
||||||||||||||||
|
Mutual Funds
|
244
|
(18
|
)
|
226
|
303
|
(28
|
)
|
275
|
||||||||||||||||
|
Total avalable for sale securities
|
$
|
190,871
|
$
|
(14,436
|
)
|
$
|
176,435
|
$
|
1,115
|
$
|
(65
|
)
|
$
|
1,050
|
||||||||||
At December 31, 2015, there were six holdings in loss positions which were not deemed to be other-than-temporarily impaired due to the length of time that they had been in a loss position and because they passed scrutiny in our evaluation of issuer-specific and industry-specific considerations. In these specific instances, five of the investments at December 31, 2015 were mutual funds and closed-end funds with diversified holdings across multiple companies and across multiple industries. Of the fund investments, two holdings were impaired for one month, one for six months, and two for seven months at December 31, 2015. The sixth holding was a common stock and was impaired for one month. The value of these holdings at December 31, 2015 was $176.4 million. If these holdings were to continue to be impaired, we may need to record impairment in a future period on the combined consolidated statement of income for the amount of unrealized loss, which at December 31, 2015 was $14.4 million.
At December 31, 2014, there were four holdings in loss positions which were not deemed to be other-than-temporarily impaired due to the length of time that they had been in a loss position and because they passed scrutiny in our evaluation of issuer-specific and industry-specific considerations. In these specific instances, the investments at December 31, 2014 were mutual funds and closed-end funds with diversified holdings across multiple companies and across multiple industries. One holding was impaired for one month, one for three months and two for four months at December 31, 2014. The value of these holdings at December 31, 2014 was $1.1 million.
For the years ended December 31, 2015 and 2014, there were $216,000 and $69,000 of losses, respectively, on AFS securities deemed to be other than temporary.
61
D. Investment in Partnerships, Offshore Funds and Variable Interest Entities
The Company is general partner or co-general partner of various affiliated entities, in which the Company had investments totaling $89.3 million and $94.2 million at December 31, 2015 and 2014, respectively, whose underlying assets consist primarily of marketable securities (the "affiliated entities"). We also had investments in unaffiliated partnerships, offshore funds and other entities of $15.8 million and $13.4 million at December 31, 2015 and 2014, respectively (the "unaffiliated entities"). We evaluate each entity for the appropriate accounting treatment and disclosure. Certain of the affiliated entities, and none of the unaffiliated entities, are consolidated, as discussed in Note B.
For those entities where consolidation is not deemed appropriate, we report them in our combined consolidate statements of financial condition under the caption "Investments in partnerships". The caption includes those investments, in both affiliated and unaffiliated entities, which the Company accounts for under the equity method of accounting, as well as certain investments that the feeder funds hold that are carried at fair value, as described in Note B. The Company reflects the equity in earnings of these equity method investees and the change in fair value of the consolidated feeder funds under the caption net gain from investments on the combined consolidated statements of income.
The following table highlights the number of entities, including VOEs, that we consolidate as well as under which accounting guidance they are consolidated, including CFFs, which retain their specialized investment company accounting, and partnerships and offshore funds which we consolidate as described in Note B.
|
Entities consolidated
|
||||||||||||||||||||||||||||||||
|
CFFs
|
Partnerships
|
Offshore Funds
|
Total
|
|||||||||||||||||||||||||||||
|
VIEs
|
VOEs
|
VIEs
|
VOEs
|
VIEs
|
VOEs
|
VIEs
|
VOEs
|
|||||||||||||||||||||||||
|
Entities consolidated at December 31, 2012
|
1
|
2
|
-
|
1
|
-
|
1
|
1
|
4
|
||||||||||||||||||||||||
|
Additional consolidated entities
|
-
|
-
|
-
|
-
|
-
|
-
|
-
|
-
|
||||||||||||||||||||||||
|
Deconsolidated entities
|
-
|
-
|
-
|
-
|
-
|
-
|
-
|
-
|
||||||||||||||||||||||||
|
Entities consolidated at December 31, 2013
|
1
|
2
|
-
|
1
|
-
|
1
|
1
|
4
|
||||||||||||||||||||||||
|
Additional consolidated entities
|
-
|
-
|
-
|
-
|
-
|
-
|
-
|
-
|
||||||||||||||||||||||||
|
Deconsolidated entities
|
-
|
-
|
-
|
-
|
-
|
-
|
-
|
-
|
||||||||||||||||||||||||
|
Entities consolidated at December 31, 2014
|
1
|
2
|
-
|
1
|
-
|
1
|
1
|
4
|
||||||||||||||||||||||||
|
Additional consolidated entities
|
-
|
1
|
-
|
1
|
1
|
-
|
1
|
2
|
||||||||||||||||||||||||
|
Deconsolidated entities
|
-
|
(1
|
)
|
-
|
-
|
-
|
(1
|
)
|
-
|
(2
|
)
|
|||||||||||||||||||||
|
Entities consolidated at December 31, 2015
|
1
|
2
|
-
|
2
|
1
|
-
|
2
|
4
|
||||||||||||||||||||||||
At and for the year ended December 31, 2015, the one CFF VIE is consolidated, as the Company has been determined to be the primary beneficiary because it has an equity interest and absorbs the majority of the expected losses and/or expected gains. At and for the year ended December 31, 2015, the one CFF VOE and one Partnership VOE are consolidated because the unaffiliated partners or shareholders lack substantive kick-out rights, and the Company, as either the general partner or investment manager, is deemed to have control. During the year ended December, 2015, it was determined that an additional Partnership VOE should be consolidated when the Partnership was created on April 1, 2015 without unaffiliated capital and an Offshore Fund VIE should be consolidated as the last unaffiliated investor withdrew during the second quarter. Additionally, an Offshore Fund VOE was deconsolidated as the Company's ownership percentage fell below 50%, a CFF VOE was deconsolidated when it was closed and a different CFF VOE was consolidated as the last unaffiliated investor withdrew on March 31, 2015.
At and for the year ended December 31, 2014, one CFF VIE is consolidated, as the Company is the primary beneficiary because it has an equity interest and absorbs the majority of the expected losses and/or expected gains. At and for the year ended December 31, 2014, two CFF VOEs, and the one Partnership VOE are consolidated because the unaffiliated partners or stockholders lack substantive rights, and the Company, as either the general partner or investment manager, is deemed to have control.
62
The following table breaks down the investments in partnerships line by accounting method, either fair value or equity method, and investment type (in thousands):
| December 31, 2015 | |||||||||||||||||||||||
|
Investment Type
|
|||||||||||||||||||||||
|
Affiliated
|
Unaffiliated
|
||||||||||||||||||||||
| Consolidated | |||||||||||||||||||||||
|
Accounting method
|
Feeder Funds
|
Partnerships
|
Offshore Funds
|
Partnerships
|
Offshore Funds
|
Total
|
|||||||||||||||||
|
Fair Value
|
$
|
13,953
|
$
|
-
|
$
|
-
|
$
|
-
|
$
|
-
|
$
|
13,953
|
|||||||||||
|
Equity Method
|
-
|
39,552
|
35,746
|
7,911
|
7,889
|
91,098
|
|||||||||||||||||
|
Total
|
$
|
13,953
|
$
|
39,552
|
$
|
35,746
|
$
|
7,911
|
$
|
7,889
|
$
|
105,051
|
|||||||||||
| December 31, 2014 | ||||||||||||||||||||||||
|
Investment Type
|
||||||||||||||||||||||||
|
Affiliated
|
Unaffiliated
|
|||||||||||||||||||||||
| Consolidated | ||||||||||||||||||||||||
|
Accounting method
|
Feeder Funds
|
Partnerships
|
Offshore Funds
|
Partnerships
|
Offshore Funds
|
Total
|
||||||||||||||||||
|
Fair Value
|
$
|
23,815
|
$
|
-
|
$
|
-
|
$
|
-
|
$
|
-
|
$
|
23,815
|
||||||||||||
|
Equity Method
|
-
|
34,382
|
36,033
|
6,552
|
6,864
|
83,831
|
||||||||||||||||||
|
Total
|
$
|
23,815
|
$
|
34,382
|
$
|
36,033
|
$
|
6,552
|
$
|
6,864
|
$
|
107,646
|
||||||||||||
63
The following table includes the net impact by line item on the consolidated statements of financial condition for each category of entity consolidated:
|
December 31, 2015
|
||||||||||||||||||||
|
Prior to
|
||||||||||||||||||||
|
Consolidation
|
CFFs
|
Partnerships
|
Offshore Funds
|
As Reported
|
||||||||||||||||
|
Assets
|
||||||||||||||||||||
|
Cash and cash equivalents
|
$
|
205,708
|
$
|
-
|
$
|
41
|
$
|
1
|
$
|
205,750
|
||||||||||
|
Investments in securities
|
444,368
|
-
|
7,849
|
83
|
452,300
|
|||||||||||||||
|
Investments in partnerships
|
109,274
|
4,506
|
(8,729
|
)
|
-
|
105,051
|
||||||||||||||
|
Receivable from brokers
|
53,921
|
-
|
2,164
|
425
|
56,510
|
|||||||||||||||
|
Investment advisory fees receivable
|
4,881
|
2
|
5
|
8
|
4,896
|
|||||||||||||||
|
Other assets
|
12,614
|
5
|
15
|
(393
|
)
|
12,241
|
||||||||||||||
|
Total assets
|
$
|
830,766
|
$
|
4,513
|
$
|
1,345
|
$
|
124
|
$
|
836,748
|
||||||||||
|
Liabilities and equity
|
||||||||||||||||||||
|
Securities sold, not yet purchased
|
$
|
9,505
|
$
|
-
|
$
|
118
|
$
|
-
|
$
|
9,623
|
||||||||||
|
Accrued expenses and other liabilities
|
69,712
|
28
|
79
|
19
|
69,838
|
|||||||||||||||
|
Redeemable noncontrolling interests
|
-
|
4,485
|
1,148
|
105
|
5,738
|
|||||||||||||||
|
Total equity
|
751,549
|
-
|
-
|
-
|
751,549
|
|||||||||||||||
|
Total liabilities and equity
|
$
|
830,766
|
$
|
4,513
|
$
|
1,345
|
$
|
124
|
$
|
836,748
|
||||||||||
|
December 31, 2014
|
||||||||||||||||||||
|
Prior to
|
||||||||||||||||||||
|
Consolidation
|
CFFs
|
Partnerships
|
Offshore Funds
|
As Reported
|
||||||||||||||||
|
Assets
|
||||||||||||||||||||
|
Cash and cash equivalents
|
$
|
285,455
|
$
|
(11
|
)
|
$
|
86
|
$
|
-
|
$
|
285,530
|
|||||||||
|
Investments in securities
|
201,038
|
-
|
7,801
|
51,293
|
260,132
|
|||||||||||||||
|
Investments in partnerships
|
111,389
|
4,438
|
(8,181
|
)
|
-
|
107,646
|
||||||||||||||
|
Receivable from brokers
|
22,629
|
-
|
623
|
51,155
|
74,407
|
|||||||||||||||
|
Investment advisory fees receivable
|
4,375
|
(6
|
)
|
(2
|
)
|
(222
|
)
|
4,145
|
||||||||||||
|
Other assets
|
22,683
|
-
|
-
|
151
|
22,834
|
|||||||||||||||
|
Total assets
|
$
|
647,569
|
$
|
4,421
|
$
|
327
|
$
|
102,377
|
$
|
754,694
|
||||||||||
|
Liabilities and equity
|
||||||||||||||||||||
|
Securities sold, not yet purchased
|
$
|
9,991
|
$
|
-
|
$
|
-
|
$
|
604
|
$
|
10,595
|
||||||||||
|
Accrued expenses and other liabilities
|
54,651
|
22
|
24
|
38,141
|
92,838
|
|||||||||||||||
|
Redeemable noncontrolling interests
|
-
|
4,399
|
303
|
63,632
|
68,334
|
|||||||||||||||
|
Total equity
|
582,927
|
-
|
-
|
-
|
582,927
|
|||||||||||||||
|
Total liabilities and equity
|
$
|
647,569
|
$
|
4,421
|
$
|
327
|
$
|
102,377
|
$
|
754,694
|
||||||||||
The CFFs, Partnerships and Offshore Funds columns above include only affiliated entities as no unaffiliated entities are consolidated.
64
The following table includes the net impact by line item on the combined consolidated statements of income for each category of entity consolidated (in thousands):
|
Twelve Months Ended December 31, 2015
|
||||||||||||||||||||
|
Prior to
|
||||||||||||||||||||
|
Consolidation
|
CFFs
|
Partnerships
|
Offshore Funds
|
As Reported
|
||||||||||||||||
|
Total revenues
|
$
|
22,883
|
$
|
(34
|
)
|
$
|
(7
|
)
|
$
|
-
|
$
|
22,842
|
||||||||
|
Total expenses
|
36,963
|
114
|
71
|
6
|
37,154
|
|||||||||||||||
|
Operating income
|
(14,080
|
)
|
(148
|
)
|
(78
|
)
|
(6
|
)
|
(14,312
|
)
|
||||||||||
|
Total other income (expense), net
|
11,967
|
(170
|
)
|
(69
|
)
|
8
|
11,736
|
|||||||||||||
|
Income before income taxes
|
(2,113
|
)
|
(318
|
)
|
(147
|
)
|
2
|
(2,576
|
)
|
|||||||||||
|
Income tax provision
|
(1,685
|
)
|
-
|
-
|
-
|
(1,685
|
)
|
|||||||||||||
|
Net income before NCI
|
(428
|
)
|
(318
|
)
|
(147
|
)
|
2
|
(891
|
)
|
|||||||||||
|
Net income attributable to noncontrolling interests
|
(317
|
)
|
(318
|
)
|
(147
|
)
|
2
|
(780
|
)
|
|||||||||||
|
Net income
|
$
|
(111
|
)
|
$
|
-
|
$
|
-
|
$
|
-
|
$
|
(111
|
)
|
||||||||
|
Twelve Months Ended December 31, 2014
|
||||||||||||||||||||
|
Prior to
|
||||||||||||||||||||
|
Consolidation
|
CFFs
|
Partnerships
|
Offshore Funds
|
As Reported
|
||||||||||||||||
|
Total revenues
|
$
|
22,027
|
$
|
(28
|
)
|
$
|
(3
|
)
|
$
|
(967
|
)
|
$
|
21,029
|
|||||||
|
Total expenses
|
29,920
|
62
|
44
|
927
|
30,953
|
|||||||||||||||
|
Operating income
|
(7,893
|
)
|
(90
|
)
|
(47
|
)
|
(1,894
|
)
|
(9,924
|
)
|
||||||||||
|
Total other income (expense), net
|
11,668
|
13
|
50
|
(2,189
|
)
|
9,542
|
||||||||||||||
|
Income before income taxes
|
3,775
|
(77
|
)
|
3
|
(4,083
|
)
|
(382
|
)
|
||||||||||||
|
Income tax provision
|
775
|
-
|
-
|
-
|
775
|
|||||||||||||||
|
Net income before NCI
|
3,000
|
(77
|
)
|
3
|
(4,083
|
)
|
(1,157
|
)
|
||||||||||||
|
Net income attributable to noncontrolling interests
|
-
|
(77
|
)
|
3
|
(4,083
|
)
|
(4,157
|
)
|
||||||||||||
|
Net income
|
$
|
3,000
|
$
|
-
|
$
|
-
|
$
|
-
|
$
|
3,000
|
||||||||||
The CFFs, Partnerships and Offshore Funds columns above include only affiliated entities as no unaffiliated entities are consolidated.
Variable Interest Entities
We also have sponsored a number of investment vehicles where we are the general partner or investment manager. These vehicles are VIEs, but we are not the primary beneficiary, in all but one case, because we do not absorb a majority of the entities' expected losses or expected returns, and they are therefore, not consolidated. We consolidate the one VIE where we are the primary beneficiary. The Company has not provided any financial or other support to these entities. The total assets of these non-consolidated VIEs at December 31, 2015 and 2014 were $70.2 million and $71.6 million, respectively. Our maximum exposure to loss as a result of our involvement with the VIEs is limited to the investment in one VIE and the deferred carried interest that we have in one another.
On December 31, 2015 and 2014, we had an investment in one and two of the non-consolidated VIE offshore funds, respectively, of approximately $9.9 million and $10.6 million, respectively, which was included in investment in partnerships on the consolidated statements of financial condition. On December 31, 2015 and 2014, we had a deferred carried interest in one of the VIE offshore funds of approximately $39,000 and $43,000, respectively, which was included in investments in partnerships on the consolidated statements of financial condition. Additionally, as the general partner or investment manager to these VIEs the Company earns fees in relation to these roles, which given a decline in AUMs of the VIEs would result in lower fee revenues earned by the Company which would be reflected on the combined consolidated statements of income, combined consolidated statements of comprehensive income, consolidated statements of financial condition and combined consolidated statements of cash flows.
65
The assets of these VIEs may only be used to satisfy obligations of the VIEs. The following table presents the balances related to these VIEs that are consolidated and were included on the consolidated statements of financial condition as well as the Company's net interest in these VIEs. Only one VIE is consolidated at both December 31, 2015 and December 31, 2014:
|
December 31,
|
December 31,
|
|||||||
|
2015
|
2014
|
|||||||
|
(In thousands)
|
||||||||
|
Cash and cash equivalents
|
$
|
1
|
$
|
-
|
||||
|
Investments in securities
|
83
|
-
|
||||||
|
Investments in partnerships
|
4,791
|
13,434
|
||||||
|
Receivable from broker
|
425
|
-
|
||||||
|
Payable to brokers
|
(6
|
)
|
-
|
|||||
|
Accrued expenses and other liabilities
|
(404
|
)
|
(12
|
)
|
||||
|
Redeemable noncontrolling interests
|
(350
|
)
|
(794
|
)
|
||||
|
AC's net interests in consolidated VIE
|
$
|
4,540
|
$
|
12,628
|
||||
Equity Method Investments
The Company's equity method investments include its investments in partnerships and offshore funds. These equity method investments are not consolidated but on an aggregate basis exceed 10% of the Company's combined consolidated total assets or income. No single equity method investment held by the Company exceeded 20% of the Company's combined consolidated total assets or income. As such, the Company is not required to present separate financial statements for any of its equity method investees.
The summarized financial information of the Company's equity method investments for December 31, 2015 and 2014 are as follows:
|
December 31,
|
December 31,
|
|||||||
|
2015
|
2014
|
|||||||
|
(In millions)
|
||||||||
|
Total assets
|
$
|
2,414
|
$
|
2,436
|
||||
|
Total liabilities
|
301
|
293
|
||||||
|
Total equity
|
2,113
|
2,143
|
||||||
|
For the year
|
||||||||
|
2015
|
2014
|
|||||||
|
Net income/(loss)
|
(18
|
)
|
49
|
|||||
66
E. Fair Value
The following tables present information about the Company's assets and liabilities by major categories measured at fair value on a recurring basis as of December 31, 2015 and 2014 and indicates the fair value hierarchy of the valuation techniques utilized by the Company to determine such fair value:
Assets and Liabilities Measured at Fair Value on a Recurring Basis as of December 31, 2015 (in thousands)
|
Quoted Prices in Active
|
Significant Other
|
Significant
|
Balance as of
|
|||||||||||||
|
Markets for Identical
|
Observable
|
Unobservable
|
December 31,
|
|||||||||||||
|
Assets
|
Assets (Level 1)
|
Inputs (Level 2)
|
Inputs (Level 3)
|
2015
|
||||||||||||
|
Cash equivalents
|
$
|
205,733
|
$
|
-
|
$
|
-
|
$
|
205,733
|
||||||||
|
Investments in partnerships
|
-
|
13,953
|
-
|
13,953
|
||||||||||||
|
Investments in securities:
|
||||||||||||||||
|
AFS - Common stocks
|
136,360
|
-
|
-
|
136,360
|
||||||||||||
|
AFS - Mutual funds
|
1,143
|
-
|
-
|
1,143
|
||||||||||||
|
Trading - Gov't obligations
|
99,940
|
-
|
-
|
99,940
|
||||||||||||
|
Trading - Common stocks
|
91,686
|
-
|
508
|
92,194
|
||||||||||||
|
Trading - Mutual funds
|
3,216
|
-
|
-
|
3,216
|
||||||||||||
|
Trading - Other
|
230
|
236
|
305
|
771
|
||||||||||||
|
Total investments in securities
|
332,575
|
236
|
813
|
333,624
|
||||||||||||
|
Investments in sponsored
|
||||||||||||||||
|
registered investment companies:
|
||||||||||||||||
|
AFS - Closed-end Funds
|
72,591
|
-
|
-
|
72,591
|
||||||||||||
|
AFS - Mutual Funds
|
2,952
|
-
|
-
|
2,952
|
||||||||||||
|
Trading - Mutual funds
|
43,133
|
-
|
-
|
43,133
|
||||||||||||
|
Total investments in sponsored
|
|
|
|
|
||||||||||||
|
registered investment companies
|
118,676
|
-
|
-
|
118,676
|
||||||||||||
|
Total investments
|
451,251
|
14,189
|
813
|
466,253
|
||||||||||||
|
Total assets at fair value
|
$ | 656,984 | $ | 14,189 | $ | 813 | $ | 671,986 | ||||||||
|
Liabilities
|
||||||||||||||||
|
Trading - Common stocks
|
$
|
9,537
|
$
|
-
|
$
|
-
|
$
|
9,537
|
||||||||
|
Trading - Other
|
-
|
86
|
-
|
86
|
||||||||||||
|
Securities sold, not yet purchased
|
$
|
9,537
|
$
|
86
|
$
|
-
|
$
|
9,623
|
||||||||
Assets and Liabilities Measured at Fair Value on a Recurring Basis as of December 31, 2014 (in thousands)
|
Quoted Prices in Active
|
Significant Other
|
Significant
|
Balance as of
|
|||||||||||||
|
Markets for Identical
|
Observable
|
Unobservable
|
December 31,
|
|||||||||||||
|
Assets
|
Assets (Level 1)
|
Inputs (Level 2)
|
Inputs (Level 3)
|
2014
|
||||||||||||
|
Cash equivalents
|
$
|
285,504
|
$
|
-
|
$
|
-
|
$
|
285,504
|
||||||||
|
Investments in partnerships
|
-
|
23,803
|
-
|
23,803
|
||||||||||||
|
Investments in securities:
|
||||||||||||||||
|
AFS - Mutual funds
|
1,368
|
-
|
-
|
1,368
|
||||||||||||
|
Trading - Gov't obligations
|
18,996
|
-
|
-
|
18,996
|
||||||||||||
|
Trading - Common stocks
|
193,735
|
1
|
1,293
|
195,029
|
||||||||||||
|
Trading - Mutual funds
|
3,498
|
-
|
-
|
3,498
|
||||||||||||
|
Trading - Other
|
513
|
897
|
294
|
1,704
|
||||||||||||
|
Total investments in securities
|
218,110
|
898
|
1,587
|
220,595
|
||||||||||||
|
Investments in sponsored
|
||||||||||||||||
|
registered investment companies:
|
||||||||||||||||
|
AFS - Closed-end Funds
|
36,323
|
-
|
-
|
36,323
|
||||||||||||
|
AFS - Mutual Funds
|
3,213
|
-
|
-
|
3,213
|
||||||||||||
|
Trading - Mutual funds
|
1
|
-
|
-
|
1
|
||||||||||||
|
Total investments in sponsored
|
|
|
|
|
||||||||||||
|
registered investment companies
|
39,537
|
-
|
-
|
39,537
|
||||||||||||
|
Total investments
|
257,647
|
24,701
|
1,587
|
283,935
|
||||||||||||
|
Total assets at fair value
|
$ | 543,151 | $ | 24,701 | $ | 1,587 | $ | 569,439 | ||||||||
|
Liabilities
|
||||||||||||||||
|
Trading - Common stocks
|
$
|
9,960
|
$
|
-
|
$
|
-
|
$
|
9,960
|
||||||||
|
Trading - Other
|
-
|
635
|
-
|
635
|
||||||||||||
|
Securities sold, not yet purchased
|
$
|
9,960
|
$
|
635
|
$
|
-
|
$
|
10,595
|
||||||||
67
The following table presents additional information about assets by major categories measured at fair value on a recurring basis and for which the Company has utilized Level 3 inputs to determine fair value.
Changes in Level 3 Assets Measured at Fair Value on a Recurring Basis for the year ended December 31, 2015 (in thousands)
|
Total
|
||||||||||||||||||||||||||||||||
|
Unrealized
|
||||||||||||||||||||||||||||||||
|
Gains or
|
Total
|
|||||||||||||||||||||||||||||||
|
Total Realized and
|
(Losses)
|
Realized
|
||||||||||||||||||||||||||||||
|
December
|
Unrealized Gains or
|
Included in
|
and
|
Transfers
|
||||||||||||||||||||||||||||
| 31, 2014 | (Losses) in Income | Other | Unrealized | In and/or | ||||||||||||||||||||||||||||
|
Beginning
|
AFS
|
Comprehensive
|
Gains or
|
(Out) of
|
Ending
|
|||||||||||||||||||||||||||
|
Asset
|
Balance
|
Trading
|
Investments
|
Income
|
(Losses)
|
Purchases
|
Sales
|
Level 3
|
Balance
|
|||||||||||||||||||||||
|
Financial
|
||||||||||||||||||||||||||||||||
|
instruments owned:
|
||||||||||||||||||||||||||||||||
|
Trading - Common
|
||||||||||||||||||||||||||||||||
|
stocks
|
$
|
1,293
|
$
|
(195
|
)
|
$
|
-
|
$
|
-
|
$
|
(195
|
)
|
$
|
6
|
$
|
(238
|
)
|
$
|
(358
|
)
|
$
|
508
|
||||||||||
|
Trading - Other
|
294
|
98
|
-
|
-
|
98
|
5
|
(80
|
)
|
(12
|
)
|
305
|
|||||||||||||||||||||
|
Total
|
$
|
1,587
|
$
|
(97
|
)
|
$
|
-
|
$
|
-
|
$
|
(97
|
)
|
$
|
11
|
$
|
(318
|
)
|
$
|
(370
|
)
|
$
|
813
|
||||||||||
During the year ended December 31, 2015, there were no transfers between Level 1 and Level 2 holdings. During the year ended December 31, 2015, the Company reclassed approximately $370,000 of investments from Level 3 to Level 1. The reclassifications were due to increased availability of market price quotations and were based on the values at the beginning of the period in which the reclass occurred.
Changes in Level 3 Assets Measured at Fair Value on a Recurring Basis for the year ended December 31, 2014 (in thousands)
|
Total
|
||||||||||||||||||||||||||||||||||||
|
Unrealized
|
||||||||||||||||||||||||||||||||||||
|
Gains or
|
Total
|
|||||||||||||||||||||||||||||||||||
|
Total Realized and
|
(Losses)
|
Realized
|
||||||||||||||||||||||||||||||||||
|
December
|
Unrealized Gains or
|
Included in
|
and
|
Transfers
|
||||||||||||||||||||||||||||||||
| 31, 2013 | (Losses) in Income | Other | Unrealized | In and/or | ||||||||||||||||||||||||||||||||
|
Beginning
|
AFS
|
Comprehensive
|
Gains or
|
(Out) of
|
Ending
|
|||||||||||||||||||||||||||||||
|
Asset
|
Balance
|
Trading
|
Investments
|
Income
|
(Losses)
|
Purchases
|
Sales
|
Level 3
|
Balance
|
|||||||||||||||||||||||||||
|
Financial
|
||||||||||||||||||||||||||||||||||||
|
instruments owned:
|
||||||||||||||||||||||||||||||||||||
|
Trading - Common
|
||||||||||||||||||||||||||||||||||||
|
stocks
|
$ |
700
|
$ |
|
41
|
$ |
|
-
|
$ |
|
-
|
$ |
|
41
|
$ |
|
-
|
$ |
|
(343
|
)
|
$ |
|
895
|
$ |
|
1,293
|
|||||||||
|
Trading - Other
|
284 |
-
|
-
|
-
|
-
|
10
|
-
|
-
|
294
|
|||||||||||||||||||||||||||
|
Total
|
$ | 984 | $ |
|
41
|
$ |
|
-
|
$ |
|
-
|
$ |
|
41
|
$ |
|
10
|
$ |
|
(343
|
)
|
$ |
|
895
|
$ |
|
1,587
|
|||||||||
During the year ended December 31, 2014, there were no transfers between Level 1 and Level 2 holdings. During the year ended December 31, 2014, the Company reclassed approximately $895,000 of investments from Level 1 to Level 3. The reclassifications were due to decreased availability of market price quotations and were based on the values at the beginning of the period in which the reclass occurred.
F. Income Taxes
Except for the one month period subsequent to our Spin-off, for which we independently determine our tax liability, we calculate the provision for income taxes by using a "separate return" method. Under this method, we are assumed to file a separate return with the tax authority, thereby reporting our taxable income or loss and paying the applicable tax or receiving the appropriate refund from GAMCO.
Our current provision is the amount of tax payable or refundable on the basis of a hypothetical current-year separate return. We provide deferred taxes on temporary differences and on any carryforwards that we could claim on our hypothetical return and assess the need for a valuation allowance.
68
As a result of the Spin-off, the operations of the Company's subsidiaries are included in the consolidated U.S. federal and certain state and local income tax returns of GAMCO for the first eleven months of the 2015. The Company will file consolidated U.S. federal and certain state and local income tax returns for the last month of 2015. The Company's subsidiaries' federal and certain state and local income taxes are calculated as if the Company's subsidiaries filed on a separate return basis, and the amount of current and deferred tax or benefit is either remitted to or received from GAMCO for the first eleven months of 2015 or the Company for December 2015 using a benefits for loss approach such that net operating loss (or other tax attribute) is characterized as realized by the Company's subsidiaries when those tax attributes are utilized in the consolidated tax return of GAMCO or the Company. This is the case even if the Company's subsidiaries would not otherwise have realized those tax attributes.
The provision for income taxes for the years ended December 31, 2015 and 2014 consisted of the following:
|
2015
|
2014
|
|||||||
|
(In thousands)
|
||||||||
|
Federal:
|
||||||||
|
Current
|
$
|
4,540
|
$
|
5,775
|
||||
|
Deferred
|
(6,160
|
)
|
(5,003
|
)
|
||||
|
State and local:
|
||||||||
|
Current
|
225
|
39
|
||||||
|
Deferred
|
(290
|
)
|
(36
|
)
|
||||
|
Total
|
$
|
(1,685
|
)
|
$
|
775
|
|||
The Company has a pre-state apportionment net operating loss of approximately $24.9 million which will expire at varying amounts between 2030 through 2035. Total tax benefit derived from this net operating loss (limited to the three states where the Company files separate tax returns) has been estimated at $166,000. We believe that it is more likely than not that the benefit from the three separate states net operating loss carryforwards will not be realized. In recognizing this risk, we have provided a valuation allowance of $166,000 on the deferred tax assets relating to these net operating losses.
A reconciliation of the Federal statutory rate to the effective tax rate is set forth below:
|
2015
|
2014
|
|||||||
|
Statutory Federal income tax rate
|
34.0
|
%
|
35.0
|
%
|
||||
|
State income tax, net of Federal benefit
|
1.6
|
(0.5
|
)
|
|||||
|
Dividends received deduction
|
26.4
|
133.0
|
||||||
|
Donation of appreciated securities
|
3.2
|
13.5
|
||||||
|
Noncontrolling interests
|
0.0
|
(377.0
|
)
|
|||||
|
Other
|
0.2
|
(6.9
|
)
|
|||||
|
Effective income tax rate
|
65.4
|
%
|
(202.9
|
)%
|
||||
69
Significant components of our deferred tax assets and liabilities are as follows:
|
2015
|
2014
|
|||||||
|
(In thousands)
|
||||||||
|
Deferred tax assets:
|
||||||||
|
Stock compensation expense
|
$
|
77
|
$
|
847
|
||||
|
Deferred compensation
|
871
|
835
|
||||||
|
Investments in securities available for sale
|
5,523
|
-
|
||||||
|
Other
|
-
|
193
|
||||||
|
Total deferred tax assets
|
6,471
|
1,875
|
||||||
|
Deferred tax liabilities:
|
||||||||
|
Investments in securities available for sale
|
-
|
(1,510
|
)
|
|||||
|
Investments in securities and partnerships
|
(9,839
|
)
|
(14,911
|
)
|
||||
|
Deferred gain
|
-
|
(2,000
|
)
|
|||||
|
Other liabilities
|
(41
|
)
|
(34
|
)
|
||||
|
Total deferred tax liabilities
|
(9,880
|
)
|
(18,455
|
)
|
||||
|
Net deferred tax liabilities
|
$
|
(3,409
|
)
|
$
|
(16,580
|
)
|
||
A reconciliation of the beginning and ending amount of gross unrecognized tax benefits related to uncertain tax positions is as follows:
|
(in thousands)
|
||||
|
Balance at January 1, 2014
|
$
|
92.7
|
||
|
Additions based on tax positions related to the current year
|
(34.2
|
)
|
||
|
Additions for tax positions of prior years
|
-
|
|||
|
Reductions for tax positions of prior years
|
(1.4
|
)
|
||
|
Settlements
|
-
|
|||
|
Balance at December 31, 2014
|
57.1
|
|||
|
Additions based on tax positions related to the current year
|
(59.7
|
)
|
||
|
Additions for tax positions of prior years
|
-
|
|||
|
Reductions for tax positions of prior years
|
(1.9
|
)
|
||
|
Settlements
|
(11.2
|
)
|
||
|
Balance at December 31, 2015
|
$
|
(15.7
|
)
|
|
The Company records penalties and interest related to tax uncertainties in income taxes. As of December 31, 2015 and 2014, the Company's had gross unrecognized tax benefits (liabilities) of ($15,678) and $57,054 respectively, of which ($10,347) and $37,085, respectively, if recognized, would impact the Company's effective tax rate. The Company has accrued liabilities of $83,950 and $78,689 as of December 31, 2015 and 2014, respectively, for interest and penalties. These amounts are included in accrued expenses and other liabilities on the consolidated statements of financial condition.
Under the Company's Tax Indemnity and Sharing Agreement with GAMCO, GAMCO is liable for all income taxes of the Company for periods prior to the Spin-off from GAMCO. Income tax expense for such periods is based on the taxable income of the Company on a separate tax return basis. The Company is not currently under audit by any tax jurisdiction.
G. Related Party Transactions
The following is a summary of certain related party transactions.
GGCP Holdings LLC owns a majority of our Class B Stock, representing approximately 93% of the combined voting power and 72% of the outstanding shares of our common stock at December 31, 2015.
70
Loans with GAMCO
GSI entered into a $15 million demand loan with GAMCO on March 15, 2004 at a rate of 5.5% per year. On February 28, 2007, GSI paid back $5 million to GAMCO. GSI entered into an additional demand loan for $16 million with GAMCO on August 17, 2010 at a rate of 5.5% per year. On March 7, 2014, the Company repaid $10 million of the loan to GAMCO. On December 28, 2015, GSI repaid the remaining $16 million balance owed to GAMCO. As of December 31, 2015, there are no demand loans outstanding with GAMCO. The balance at December 31, 2014, which approximates the fair value, was $16 million and was included in payable to affiliates on the consolidated statements of financial condition. The interest was $0.9 million and $1.0 million in 2015 and 2014, respectively, and is included in interest expense on the combined consolidated statements of income.
On November 27, 2015, GSI purchased from GAMCO 4.4 million shares of GAMCO Class A common stock in exchange for a five-year 4% note payable of $150 million ("GSI Note"). As part of the Spin-off of AC from GAMCO on November 30, 2015, GAMCO contributed the GSI Note to AC. During 2015, GSI paid to GAMCO $66,000 of interest which is included in interest expense on the combined consolidated statements of income. The GSI Note is thus now an intercompany note within the AC Group.
GAMCO issued the GAMCO Note to AC Group in the original principal amount of $250.0 million used to partially capitalize the Company in connection with the Spin-off. See Note A. Organization and Spin-off Transaction.
Investment in Securities
At December 31, 2015 and 2014, approximately $41 million and $80 million, respectively, of our proprietary investment accounts, which were included in investments in securities on the consolidated statements of financial condition, were managed by our analysts or portfolio managers other than Mr. Mario Gabelli. The individuals managing these accounts receive 20% of the net profits, if any, earned on the accounts. In August 2006, a son of the Chairman was given responsibility for managing a proprietary investment account, on which he would be paid, on an annual basis, 20% of any net profits earned on the account for the year. The account was initially funded with approximately $40 million during 2006, and subsequent withdrawals have totaled $40 million from 2009 through 2015. The balance in the account at December 31, 2015 was $13.7 million, of which $2.4 million is owed to the portfolio manager representing his earnings that have been re-invested in the account. For 2015 and 2014, this account was up 2.4% and 1.6%, respectively, and therefore he earned approximately $0.1 million and $0.1 million, respectively, for managing this account.
At December 31, 2015 and 2014, the Company had investments of $205.7 million and $285.5 million, respectively, invested in the Gabelli U.S. Treasury Money Market Fund, which is recorded in cash and cash equivalents on the consolidated statements of financial condition. Investments in affiliated equity mutual funds ("Funds"), which are advised by Gabelli Funds, LLC and Teton Advisors, Inc., which is majority-owned by GGCP Holdings, LLC, which is also the majority stockholder of GAMCO, at December 31, 2015 and 2014 totaled $119.8 million and $40.9 million, respectively, and are included in either investments in securities or investments in affiliated registered investment companies on the consolidated statements of financial condition.
Investment in Partnerships
We had an aggregate investment in affiliated partnerships and offshore funds of approximately $89.3 million and $94.2 million at December 31, 2015 and 2014, respectively.
Investment Advisory Services
Gabelli Securities International Limited ("GS International") was formed in 1994 to provide management and investment advisory services to offshore funds and accounts. Marc Gabelli, President and a director of the Company, owns 55% of GS International, and GSI owns the remaining 45%. In 1994, Gabelli International Gold Fund Limited ("GIGFL"), an offshore investment company investing primarily in securities of issuers with gold-related activities, was formed and GS International entered into an agreement to provide management services to GIGFL. GSI in turn entered into an agreement with GS International to provide investment advisory services to GIGFL in return for receiving all investment advisory fees paid by GIGFL. Pursuant to such agreement, GSI earned investment advisory fees of $3,304 and no incentive fees for 2015. Comparable amounts for 2014 were $11,096 and no incentive fee. As of December 31, 2015 and 2014, there were $7,904, and $2,936, respectively, payable to GIGFL included in payables to affiliates on the consolidated statements of financial condition relating to advisory fees.
71
In April 1999, Gabelli Global Partners, Ltd. ("GGP Ltd."), an offshore investment fund, was incorporated. GS International and Gemini Capital Management, LLC ("Gemini"), an entity owned by Marc Gabelli, the President of AC, were engaged by GGP Ltd. as investment advisors as of July 1, 1999. GGP Ltd. paid all of the advisory fees for 2015 and 2014 in the amounts of $56,708 and $286,360, respectively, to GS International. For 2014, GGP Ltd. paid all of the incentive fees in the amount of $20,886, to GS International. There were no incentive fees earned in 2015.
In April 1999, GSI formed Gabelli Global Partners, L.P., an investment limited partnership for which GSI and Gemini are the general partners. In March 2002, Gabelli Global Partners, L.P. changed its name to Gemini Global Partners, L.P. Gemini and GSI each received half of the advisory fee paid by the partnership to the general partners in the amount of $70,345 and $78,288 for 2015 and 2014, respectively. In 2015 and 2014, the incentive fees earned were $0 and $178, respectively. As of December 31, 2015 and 2014, there were $168,311 and $98,144, respectively, receivable from Gemini Global Partners, L.P. included in receivables from affiliates on the consolidated statements of financial condition.
Compensation
Prior to the Spin-off, the amount of management fee reflected on the financial statements is a carve-out from the historical GAMCO consolidated financial statements. Under this methodology, the management fee expense can be a contra-expense. Subsequent to the Spin-off on November 30, 2015, and in accordance with Mr. Gabelli's employment agreement, the Company will pay the Chairman, or his designated assignee, a monthly management fee equal to 10% of the Company's pretax profits before consideration of this fee and before consolidation of the various consolidated feeder funds and partnerships discussed in Note D. In no circumstances will this fee be a contra-expense to the Company subsequent to the Spin-off on November 30, 2015. In 2015 and 2014, the Company recorded management fee expense or (contra-expense) of ($309,000) and ($37,000), respectively. These fees are recorded as management fee on the combined consolidated statements of income. Prior to January 1, 2015, the Company also paid GAMCO an administrative management fee of 2.75% of total brokerage income (as defined in an agreement between the parties). In 2014, the administrative management fee amounted to $235,920. These fees are recorded as other operating expenses on the combined consolidated statements of income.
Income Taxes
As a result of the Spin-off, the operations of the Company's subsidiaries are included in the consolidated U.S. federal and certain state and local income tax returns of GAMCO for the first eleven months of the 2015. The Company will file consolidated U.S. federal and certain state and local income tax returns for the last month of 2015. The Company's subsidiaries' federal and certain state and local income taxes are calculated as if the Company's subsidiaries filed on a separate return basis, and the amount of current and deferred tax or benefit is either remitted to or received from GAMCO for the first eleven months of 2015 or the Company for December 2015 using a benefits for loss approach such that net operating loss (or other tax attribute) is characterized as realized by the Company's subsidiaries when those tax attributes are utilized in the consolidated tax return of GAMCO or the Company. This is the case even if the Company's subsidiaries would not otherwise have realized those tax attributes.
Affiliated Receivables/Payables
At December 31, 2015, the receivable from affiliates consists primarily of cash owed to AC by GAMCO related to the Spin-off. At December 31, 2014, the receivable from affiliates consists primarily of expenses paid on behalf of affiliates by the Company.
At December 31, 2014, the payable to affiliates primarily consisted of the loan payable to GAMCO of $16 million, and compensation and administrative expenses of $4.7 million which is payable on demand.
GAMCO Capital Lease
On December 5, 1997, GAMCO entered into a fifteen-year lease, expiring on April 30, 2013, of office space at 401 Theodore Fremd Ave, Rye, NY from M4E, LLC, an entity owned by the adult children of the GAMCO Chairman, one of whom joined GAMCO's board of directors in June 2014. On September 15, 2008, GAMCO modified and extended this lease to December 31, 2023, and on June 11, 2013, GAMCO further modified and extended this lease to December 31, 2028. The Company paid $310,566 and $312,014 to GAMCO in 2015 and 2014, respectively, for its use of the Rye location. The amounts are included within other operating expenses on the combined consolidated statements of income.
72
Other
In 2015 and 2014, the Company earned $4.9 million and $4.7 million, respectively, or 59% and 54%, respectively, of its commission revenue, which is included in institutional research services on the combined consolidated statements of income, from transactions executed on behalf of Funds and private wealth management clients advised by GAMCO Asset Management Inc., a wholly-owned subsidiary of GAMCO.
As required by the Company's Code of Ethics, staff members are required to maintain their brokerage accounts at G.research unless they receive permission to maintain an outside account. G.research offers its entire staff the opportunity to engage in brokerage transactions at discounted commission rates. Accordingly, many of our staff members, including the executive officers or entities controlled by them, have brokerage accounts at G.research and have engaged in securities transactions at discounted rates.
GAMCO Asset Management Inc. and Gabelli Funds, LLC paid $0.7 million and $0.8 million, respectively, to the Company pursuant to research services agreements (see Note B) for both years ended December 31, 2015 and 2014.
During 2014, the Company participated as agent in the at the market offerings of The Gabelli Global Gold, Natural Resources & Income Trust ("GGN"). Pursuant to sales agreements between the parties, the Company earned sales manager fees related to these offerings of $0.6 million during 2014 which is included in institutional research services on the combined consolidated statements of income. There were no sales manager fees earned from GGN offerings during 2015.
In September 2014, the Company acted as co-underwriter in The Gabelli Healthcare & WellnessRx Trust 5.875% Series B Cumulative Preferred Stock ("GRX Series B") offering. Underwriting fees and selling concessions, net of expenses, related to the GRX Series B launch were approximately $19,000 and are included in institutional research services in the combined consolidated statements of income.
During 2014, the Company also acted as Dealer Manager for The Gabelli Healthcare & WellnessRx Trust, The Gabelli Multimedia Trust, and The Gabelli Equity Trust common stock rights offerings. During 2014, the Company earned no revenue for this role.
On July 27, 2011, the Company entered into a Distribution Agreement with G.distributors, LLC ("G.distributors"). As stated in the Distribution Agreement, the Company is the broker of record for certain ongoing client relationships for which it earns distribution fees. Subsequent to July 31, 2011, the Company recorded distribution fees revenue of $0.3 million and $0.5 million in 2015 and 2014, respectively, in relation to this role. On July 1, 2015, these mutual fund distribution assets were transferred out of the Company. At December 31, 2014, distribution fees of $44,460 are due from G.distributors and are included in the other assets on the consolidated statements of financial condition.
On June 30, 2015, G.research, LLC was formed as a single member LLC of Distributors Holdings, Inc. ("DHI"), a 100% subsidiary of GSI, to transfer the distribution assets of G.research, Inc. through a series of steps to G.distributors. On July 1, 2015, G.research, Inc. was merged into G.research, LLC. As a result of the merger, a deferred tax liability of $1,937,670 was transferred to G.research, LLC's sole member, DHI, resulting in a capital contribution to G.research, LLC. The distribution assets were then transferred from G.research, LLC to DHI for their fair value of $234,000, also resulting in a capital contribution to G.research, LLC. DHI transferred G.research, LLC to GSI resulting in a deferred tax asset of $88,227 (tax effect of the transferred distribution assets of $234,000) to be recorded on DHI's books and a deferred tax liability of $88,227 to be recorded on the books of G.research, LLC. GSI transferred DHI to GAMCO Asset Management Inc. GAMCO Asset Management Inc. subsequently transferred its 100% owned subsidiary, G.distributors, to DHI. DHI then transferred the distribution assets to G.distributors.
Pursuant to an agreement between the Company and Gabelli Funds, LLC, Gabelli Funds, LLC pays to GSI 90% of the net revenues received by Gabelli Funds, LLC related to being the advisor to the SICAV. Net revenues is defined as gross advisory fees less expenses related to payouts and expenses of the SICAV paid by Gabelli Funds, LLC. The amounts paid by Gabelli Funds, LLC to GSI for 2015 and 2014 are $1,007,164 and $252,419, respectively, and are included in management fees on the consolidated statements of operations.
As general partner or co-general partner of various affiliated limited partnerships, the Company receives a management fee based on a percentage of each partnership's net assets and a 20% incentive allocation based on economic profits.
73
H. Stockholder's Equity
During 2014, GAMCO issued 158,600 RSAs. There were no RSAs issued by either GAMCO or AC during 2015, except in relation to the Spin-off. On November 30, 2015, in connection with the Spin-off, the Company issued 554,100 AC RSA shares to GAMCO employees (including GAMCO employees who became AC employees) who held 554,100 GAMCO RSA shares at that date. The purpose of the issuance was to ensure that any employee who had GAMCO RSAs were granted an equal number of AC RSAs so that the total value of the RSAs post-spin-off was equivalent to the total value pre-spin-off. As of December 31, 2015, there were 553,100 AC RSA shares outstanding and 553,100 GAMCO RSA shares outstanding. As of December 31, 2014, there were 710,750 GAMCO RSA shares outstanding. In accordance with GAAP, we have allocated the stock compensation costs between GAMCO and AC based upon each employee's individual allocation of their responsibilities between GAMCO and AC.
The total compensation costs related to non-vested awards not yet recognized is approximately $7.0 million as of December 31, 2015. This will be recognized as expense in the following periods (in thousands):
|
2016
|
2017
|
2018
|
2019
|
2020
|
||||||||||||||
|
$
|
2,270
|
$
|
1,691
|
$
|
1,115
|
$
|
924
|
$
|
423
|
|||||||||
| 2021 | 2022 | 2023 | 2024 | |||||||||||||||
|
$
|
282
|
$
|
172
|
$
|
75
|
$
|
13
|
|||||||||||
For the years ended December 31, 2015 and 2014, the Company recorded approximately $4.9 million and $1.9 million, respectively, in stock based compensation expense which resulted in the recognition of tax benefits of approximately $1.7 million and $0.7 million, respectively. The $4.9 million for the year ended December 31, 2015, includes $2.4 million in stock compensation expense as a result of accelerating the November 2013 RSA grant. There were no comparable accelerations in the year ended December 31, 2014.
I. Retirement Plan
The Company participates in an incentive savings plan (the "Plan"), covering substantially all employees. Company contributions to the Plan are determined annually by management of the Company and (prior to the Spin-off) GAMCO's Board of Directors but may not exceed the amount permitted as a deductible expense under the Internal Revenue Code. The amount expensed for allocated contributions to this Plan amounted to approximately 12,000 in 2015 and is included in compensation on the combined consolidated statements of income. For the year ended December 31, 2014, the Company used unvested contributions that were forfeited from prior year's matching to satisfy the current year's contribution.
J. Guarantees, Contingencies, and Commitments
G.research has agreed to indemnify the clearing brokers for losses they may sustain from the customer accounts that trade on margin introduced by G.research. At December 31, 2015, the total amount of customer balances subject to indemnification (i.e., unsecured margin debits) was immaterial. G.research also has entered into arrangements with various other third parties, many of which provide for indemnification of the third parties against losses, costs, claims and liabilities arising from the performance of G.research's obligations under the agreements. G.research has had no claims or payments pursuant to these or prior agreements, and management believes the likelihood of a claim being made is remote, and therefore, an accrual has not been made on the combined consolidated financial statements.
From time to time, we may be named in legal actions and proceedings. These actions may seek substantial or indeterminate compensatory as well as punitive damages or injunctive relief. We are also subject to governmental or regulatory examinations or investigations. Examinations or investigations can result in adverse judgments, settlements, fines, injunctions, restitutions or other relief. For any such matters, the combined consolidated financial statements include the necessary provisions for losses that we believe are probable and estimable. Furthermore, we evaluate whether there exist losses which may be reasonably possible and, if material, make the necessary disclosures.
74
K. Net Capital Requirements
G.research is a registered broker-dealer, and is subject to the SEC Uniform Net Capital Rule 15c3-1 (the "Rule"), which specifies, among other requirements, minimum net capital requirements for registered broker-dealers. G.research computes its net capital under the alternative method as permitted by the Rule, which requires that minimum net capital be the greater of $250,000 or 2% of the aggregate debit items in the reserve formula for those broker-dealers subject to Rule 15c3-3. G.research, Inc. is exempt from Rule 15c3-3 pursuant to paragraph (k)(2)(ii) of that rule which exempts all customer transactions cleared through another broker-dealer on a fully disclosed basis. In addition, our assets at the clearing broker-dealer are treated as allowable assets for net capital purposes as we have in place Proprietary Accounts of Introducing Firms and Dealers ("PAIB") agreements pursuant to Rule 15c3-3. These requirements also provide that equity capital may not be withdrawn, advances to affiliates may not be made or cash dividends paid if certain minimum net capital requirements are not met. G.research had net capital, as defined, of $7.1 million and $1.6 million, exceeding the required amount of $250,000 by $6.9 million and $1.4 million, at December 31, 2015 and 2014, respectively. There was one subordinated borrowing during the year ended December 31, 2014. There was no subordinated borrowing during the year ended December 31, 2015.
On September 12, 2014, GSI and G.research entered into a subordinated loan agreement to support its underwriting activity with respect to the GRX Series B offering. GSI lent G.research $1,000,000, which was repaid in full including accrued interest of 2.25% per annum or $2,813 on the October 27, 2014 due date.
75
L. Gabelli Securities, Inc.
The Company owns a 93.9% interest in GSI. Certain employees of the Company or its affiliates own 1.9% of GSI, and the remaining 4.2% of GSI is owned by investors unrelated to the Company. Stockholders who are employees of the Company or its affiliates must sell their shares to GSI at the book value per share of the previous fiscal year end when they leave the firm. The book value per share of GSI was $88.64 and $102.18 at December 31, 2015 and 2014, respectively. Below are the consolidated statements of financial condition of GSI at December 31, 2015 and 2014, respectively.
|
December 31,
|
December 31,
|
|||||||
|
2015
|
2014
|
|||||||
|
ASSETS
|
||||||||
|
Cash and cash equivalents
|
$
|
13,153
|
$
|
7,987
|
||||
|
Investments in securities (Including GAMCO stock with a market value of $136.4 million and $0 at
|
||||||||
|
December 31, 2015 and December 31, 2014, respectively)
|
151,995
|
14,756
|
||||||
|
Investments in partnerships
|
75,427
|
84,992
|
||||||
|
Receivable from brokers and clearing organizations
|
4,273
|
4,175
|
||||||
|
Receivable from affiliates
|
3,789
|
3,522
|
||||||
|
Income taxes receivable from parent
|
250
|
247
|
||||||
|
Distribution fees receivable
|
-
|
44
|
||||||
|
Incentive fees receivable
|
1,391
|
836
|
||||||
|
Fixed assets
|
19
|
30
|
||||||
|
Goodwill
|
3,254
|
3,254
|
||||||
|
Other assets
|
939
|
2,203
|
||||||
|
Total assets
|
$
|
254,490
|
$
|
122,046
|
||||
|
LIABILITIES AND EQUITY
|
||||||||
|
Compensation payable
|
$
|
7,410
|
$
|
6,506
|
||||
|
Note payable to parent
|
150,000
|
-
|
||||||
|
Income taxes payable
|
2,050
|
7,738
|
||||||
|
Distribution costs payable
|
407
|
813
|
||||||
|
Securities sold, not yet purchased
|
118
|
-
|
||||||
|
Payables to affiliates
|
24,341
|
20,713
|
||||||
|
Mandatorily redeemable shares (12,741 shares outstanding)
|
1,129
|
1,302
|
||||||
|
Accrued expenses and other liabilities
|
682
|
581
|
||||||
|
Total liabilities
|
186,137
|
37,653
|
||||||
|
Redeemable noncontrolling interests
|
9,948
|
17,070
|
||||||
|
Equity:
|
||||||||
|
Common stock, $0.01 par value; 1,250,000 shares authorized; 726,953 issued; and 658,875 outstanding
|
7
|
7
|
||||||
|
Additional paid-in capital
|
22,869
|
20,786
|
||||||
|
Retained earnings
|
43,644
|
45,482
|
||||||
|
Accumulated other comprehensive income (loss)
|
(8,115
|
)
|
1,048
|
|||||
|
Total Gabelli Securities, Inc. stockholders' equity
|
58,405
|
67,323
|
||||||
|
Total liabilities and equity
|
$
|
254,490
|
$
|
122,046
|
||||
76
M. Quarterly Financial Information (Unaudited)
Quarterly financial information for the years ended December 31, 2015 and 2014 is presented below.
|
2015
|
||||||||||||||||||||
|
1st
|
2nd
|
3rd
|
4th
|
Total
|
||||||||||||||||
|
(In thousands, except per share data)
|
||||||||||||||||||||
|
Revenues
|
$
|
4,567
|
$
|
4,590
|
$
|
4,690
|
$
|
8,995
|
$
|
22,842
|
||||||||||
|
Operating loss
|
(3,880
|
)
|
(3,468
|
)
|
(1,081
|
)
|
(5,883
|
)
|
(14,312
|
)
|
||||||||||
|
Net income (loss) attributable to Associated
|
||||||||||||||||||||
|
Capital Group, Inc.'s shareholders
|
2,385
|
855
|
(7,540
|
)
|
4,189
|
(111
|
)
|
|||||||||||||
|
Net income (loss) attributable to Associated
|
||||||||||||||||||||
|
Capital Group, Inc.'s shareholders per share:
|
||||||||||||||||||||
|
Basic
|
$
|
0.09
|
$
|
0.03
|
$
|
(0.30
|
)
|
$
|
0.17
|
$
|
-
|
|||||||||
|
Diluted
|
$
|
0.09
|
$
|
0.03
|
$
|
(0.30
|
)
|
$
|
0.17
|
$
|
-
|
|||||||||
|
2014
|
||||||||||||||||||||
|
1st
|
2nd
|
3rd
|
4th
|
Total
|
||||||||||||||||
|
Revenues
|
$
|
3,904
|
$
|
4,553
|
$
|
4,895
|
$
|
7,677
|
$
|
21,029
|
||||||||||
|
Operating loss
|
(3,278
|
)
|
(3,645
|
)
|
(748
|
)
|
(2,253
|
)
|
(9,924
|
)
|
||||||||||
|
Net income (loss) attributable to Associated
|
||||||||||||||||||||
|
Capital Group, Inc.'s shareholders
|
422
|
4,015
|
(3,783
|
)
|
2,346
|
3,000
|
||||||||||||||
|
Net income (loss) attributable to Associated
|
||||||||||||||||||||
|
Capital Group, Inc.'s shareholders per share:
|
||||||||||||||||||||
|
Basic
|
$
|
0.02
|
$
|
0.16
|
$
|
(0.15
|
)
|
$
|
0.09
|
$
|
0.12
|
|||||||||
|
Diluted
|
$
|
0.02
|
$
|
0.16
|
$
|
(0.15
|
)
|
$
|
0.09
|
$
|
0.12
|
|||||||||
N. Subsequent Events
On February 18, 2016, the Board of Directors declared a dividend of $0.10 per share to all of its shareholders, payable on June 28, 2016 to shareholders of record on June 14, 2016.
From January 1, 2016 to March 23, 2016, the Company repurchased 40,737 shares at $26.93 per share. As a result, there are 457,763 shares available to be repurchased under our existing buyback plan at March 23, 2016.
77
ITEM 9: CHANGES IN AND DISAGREEMENTS WITH ACCOUNTANTS ON ACCOUNTING AND FINANCIAL DISCLOSURE
None.
(a) Evaluation of Disclosure Controls and Procedures
The Company maintains a system of disclosure controls and procedures that is designed to provide reasonable assurance that information, which is required to be timely disclosed, is recorded, processed, summarized, and reported to management within the time periods specified in Rules 13a-15(e) and 15d-15(e) of the Securities Exchange Act of 1934, as amended (the "Exchange Act"). The Company's Chief Executive Officer and Chief Financial Officer, after evaluating the effectiveness of the Company's disclosure controls and procedures (as defined in the Exchange Act) as of the end of the period covered by this report, have concluded that the Company's disclosure controls and procedures are effective to provide reasonable assurance that information required to be disclosed by the Company in the reports that it files or submits under the Exchange Act is accumulated and communicated to the Company's management, including its principal executive officer and principal financial officer, as appropriate, to allow timely decisions regarding required disclosure and are effective to provide reasonable assurance that such information is recorded, processed, summarized and reported within the time periods specified in the SEC's rules and forms.
(b) Management's Report on Internal Control Over Financial Reporting
This annual report does not include a report on management's assessment regarding internal control over financial reporting or an attestation report of the Company's registered public accounting firm due to a transition period established by the rules of the Securities and Exchange Commission for newly public companies.
(c) Changes in Internal Control Over Financial Reporting
There has been no change in our internal control over financial reporting during the quarter ended December 31, 2015 that has materially affected, or is reasonably likely to materially affect, our internal control over financial reporting.
None.
78
PART III
Information regarding the Directors and Executive Officers of AC and compliance with Section 16(a) of the Securities Exchange Act of 1934 is incorporated herein by reference from Proxy Statement.
AC has adopted a Code of Business Conduct that applies to all of our officers, directors, full-time and part-time employees and a Code of Conduct that sets forth additional requirements for our principal executive officer, principal financial officer, principal accounting officer or controller, or persons performing similar functions (together, the "Codes of Conduct"). The Codes of Conduct are posted on our website (www.associated-capital-group.com) and are available in print free of charge to anyone who requests a copy. Interested parties may address a written request for a printed copy of the Codes of Conduct to: Secretary, Associated Capital Group, Inc., One Corporate Center, Rye, New York 10580-1422. We intend to satisfy the disclosure requirement regarding any amendment to, or a waiver of, a provision of the Codes of Conduct by posting such information on our website.
In addition to the certifications attached as Exhibits to this Form 10-K, following its 2016 Annual Meeting, AC also will submit to the New York Stock Exchange ("NYSE") a certification by our Chief Executive Officer that he is not aware of any violations by AC of the NYSE corporate governance listing standards as of the date of the certification.
Information required by Item 11 is included in our Proxy Statement for the 2016 Annual Meeting of Stockholders and is incorporated herein by reference.
ITEM 12: SECURITY OWNERSHIP OF CERTAIN BENEFICIAL OWNERS AND MANAGEMENT AND RELATED STOCKHOLDER MATTERS
Information required by Item 12 is included in our Proxy Statement for the 2016 Annual Meeting of Stockholders and is incorporated herein by reference.
Information required by Item 13 is included in our Proxy Statement for the 2016 Annual Meeting of Stockholders and is incorporated herein by reference.
The information set forth under the caption "Independent Registered Public Accounting Firm" in our Proxy Statement for the 2016 Annual Meeting of Stockholders is incorporated herein by reference.
79
PART IV
(a) List of documents filed as part of this Report:
(1) Combined Consolidated Financial Statements and Independent Registered Public Accounting Firm's Reports included herein:
See Index on page 40.
(2) Financial Statement Schedules
Financial statement schedules are omitted as not required or not applicable or because the information is included in the Financial Statements or notes thereto.
(3) List of Exhibits:
The agreements included or incorporated by reference as exhibits to this Annual Report on Form 10-K contain representations and warranties by each of the parties to the applicable agreement. These representations and warranties were made solely for the benefit of the other parties to the applicable agreement and (i) were not intended to be treated as categorical statements of fact, but rather as a way of allocating the risk to one of the parties if those statements prove to be inaccurate; (ii) may have been qualified in such agreement by disclosures that were made to the other party in connection with the negotiation of the applicable agreement; (iii) may apply contract standards of "materiality" that are different from "materiality" under the applicable securities laws; and (iv) were made only as of the date of the applicable agreement or such other date or dates as may be specified in the agreement.
The Company acknowledges that, notwithstanding the inclusion of the foregoing cautionary statements, it is responsible for considering whether additional specific disclosures of material information regarding material contractual provisions are required to make the statements in this report not misleading.
| Exhibit | |
| Number | Description of Exhibit |
|
2.1
|
Separation and Distribution Agreement, dated November 30, 2015, between GAMCO Investors, Inc., a Delaware corporation and Associated Capital Group, Inc.., a Delaware corporation. (Incorporated by reference to Exhibit 2.1 to the Company's Form 8-K dated November 30, 2015 filed with the Securities and Exchange Commission on December 4, 2015).
|
|
3.1
|
Amended and Restated Certificate of Incorporation of Associated Capital Group, Inc. (the "Company") (Incorporated by reference to Exhibit 3.1 to the Company's Form 8-K dated November 19, 2015 filed with the Securities and Exchange Commission on November 25, 2015).
|
|
3.2
|
Amended and Restated Bylaws of the Company. (Incorporated by reference to Exhibit 3.2 to the Company's Report on Form 8-K dated November 19, 2015 filed with the Securities and Exchange Commission on November 25, 2015).
|
|
4.1
|
Form of Common Stock Certificate. (Incorporated by reference to Exhibit 4.1 to Amendment No. 4 to the Company's Registration Statement on Form 10 filed with the Securities and Exchange Commission on October 21, 2015).
|
|
10.1
|
Service Mark and Name License Agreement, dated November 30, 2015, by and between the Company and GAMCO Investors, Inc. ("GAMCO"). (Incorporated by reference to Exhibit 10.1 to the Company's Form 8-K dated November 30, 2015 filed with the Commission on December 4, 2015).
|
80
|
10.2
|
Transitional Administrative and Management Services Agreement, dated November 30, 2015, by and between the Company and GAMCO Investors, Inc. ("GAMCO"). (Incorporated by reference to Exhibit 10.2 to the Company's Form 8-K dated November 30, 2015 filed with the Commission on December 4, 2015).
|
|
10.3
|
Employment Agreement between the Company and Mario J. Gabelli dated November 30, 2015 (Incorporated by reference to Exhibit 10.3 to the Company's Form 8-K dated November 30, 2015 filed with the Commission on December 4, 2015).
|
|
10.4
|
Promissory Note in aggregate principal amount of $250,000,000, dated November 30, 2015, issued by GAMCO in favor of the Company (Incorporated by reference to Exhibit 10.4 to the Company's Form 8-K dated November 30, 2015 filed with the Commission on December 4, 2015).
|
|
10.5
|
Tax Indemnity and Sharing Agreement, dated November 30, 2015, by and between the Company and GAMCO Investors, Inc. ("GAMCO"). (Incorporated by reference to Exhibit 10.5 to the Company's Form 8-K dated November 30, 2015 filed with the Commission on December 4, 2015).
|
|
10.6
|
2015 Stock Award Incentive Plan (Incorporated by reference to Exhibit 10.11 to Amendment No. 4 to the Company's Registration Statement on Form 10 filed with the Securities and Exchange Commission on October 21, 2015).
|
|
10.7
|
Form of Indemnification Agreement by and between the Company and the Indemnitee defined therein (Incorporated by reference to Exhibit 10.7 to Amendment No. 4 to the Company's Registration Statement on Form 10 filed with the Securities and Exchange Commission on October 21, 2015).
|
|
21.1
|
Subsidiaries of the Company.
|
|
24.1
|
Powers of Attorney (included on page 83 of this Report).
|
|
31.1
|
Certification of CEO pursuant to Rule 13a-14(a).
|
|
31.2
|
Certification of CFO pursuant to Rule 13a-14(a).
|
|
32.1
|
Certification of CEO pursuant to 18 U.S.C. Section 1350, as adopted pursuant to Section 906 of the Sarbanes-Oxley Act of 2002.
|
|
32.2
|
Certification of CFO pursuant to 18 U.S.C. Section 1350, as adopted pursuant to Section 906 of the Sarbanes- Oxley Act of 2002.
|
|
101.INS
|
XBRL Instance Document
|
|
101.SCH
|
XBRL Taxonomy Extension Schema Document
|
|
101.CAL
|
XBRL Taxonomy Extension Calculation Linkbase Document
|
|
101.DEF
|
XBRL Taxonomy Extension Definition Linkbase Document
|
|
101.LAB
|
XBRL Taxonomy Extension Label Linkbase Document
|
|
101.PRE
|
XBRL Taxonomy Extension Presentation Linkbase Document
|
81
SIGNATURES
Pursuant to the requirements of Section 13 or 15(d) of the Securities Exchange Act of 1934, the registrant has duly caused this report to be signed on its behalf by the undersigned, thereunto duly authorized, in the City of Rye, State of New York, on March 23, 2016.
ASSOCIATED CAPITAL GROUP, INC.
|
By: /s/ Patrick Dennis
|
|
|
Name: Patrick Dennis
|
|
|
Date: March 23, 2016
|
82
POWER OF ATTORNEY
Each person whose signature appears below hereby constitutes and appoints Kevin Handwerker and Patrick Dennis and each of them, their true and lawful attorney-in-fact and agent with full power of substitution and resubstitution, for them in their name, place and stead, in any and all capacities, to sign any and all amendments to this report and to file the same, with all exhibits thereto, and other documents in connection therewith, with the Securities and Exchange Commission, and hereby grants to such attorney-in-fact and agent full power and authority to do and perform each and every act and thing requisite and necessary to be done, as fully to all intents and purposes as he might or could do in person, hereby ratifying and confirming all that said attorney-in-fact and agent or his substitute or substitutes may lawfully do or cause to be done by virtue hereof.
Pursuant to the requirements of the Securities Exchange Act of 1934, this report has been signed by the following persons in the capacities and on the dates indicated.
|
Signature
|
Title
|
Date
|
||
|
/s/ Mario J. Gabelli
|
Chairman of the Board,
|
March 23, 2016
|
||
|
Mario J. Gabelli
|
Chief Executive Officer
|
|||
|
(Principal Executive Officer)
|
||||
|
and Director
|
||||
|
/s/ Marc Gabelli
|
President and Director
|
March 23, 2016
|
||
|
Marc Gabelli
|
||||
|
/s/ Patrick Dennis
|
Executive Vice-President
|
March 23, 2016
|
||
|
Patrick Dennis
|
and Chief Financial Officer
|
|||
|
(Principal Accounting Officer)
|
||||
|
/s/ Richard L. Bready
|
Director
|
March 23, 2016
|
||
|
Richard L. Bready
|
||||
|
/s/ Daniel R. Lee
|
Director
|
March 23, 2016
|
||
|
Daniel R. Lee
|
||||
|
/s/ Bruce M. Lisman
|
Director
|
March 23, 2016
|
||
|
Bruce M. Lisman
|
||||
|
/s/ Salvatore F. Sodano
|
Director
|
March 23, 2016
|
||
|
Salvatore F. Sodano
|
||||
83