Attached files
| file | filename |
|---|---|
| 8-K - 8-K - MARTIN MIDSTREAM PARTNERS L.P. | a8kinvestorpresentation3-2.htm |
A N A LY S T DAY M A R C H 2 3 , 2 0 1 6 Exhibit 99.1

T E X T G O E S H E R E S U B T E X T I S P L A C E D H E R E 2 MMLP Overview Segment & Operational Overview Financial Foundation & Projections Joe McCreery, Vice President – Finance & Head of Investor Relations Bob Bondurant, Executive Vice President & Chief Financial Officer Joe McCreery, Vice President – Finance & Head of Investor Relations MARTIN MIDSTREAM PARTNERS L.P. ANALYST DAY AGENDA – 2016 Welcome & Introductions Joe McCreery, Vice President – Finance & Head of Investor Relations

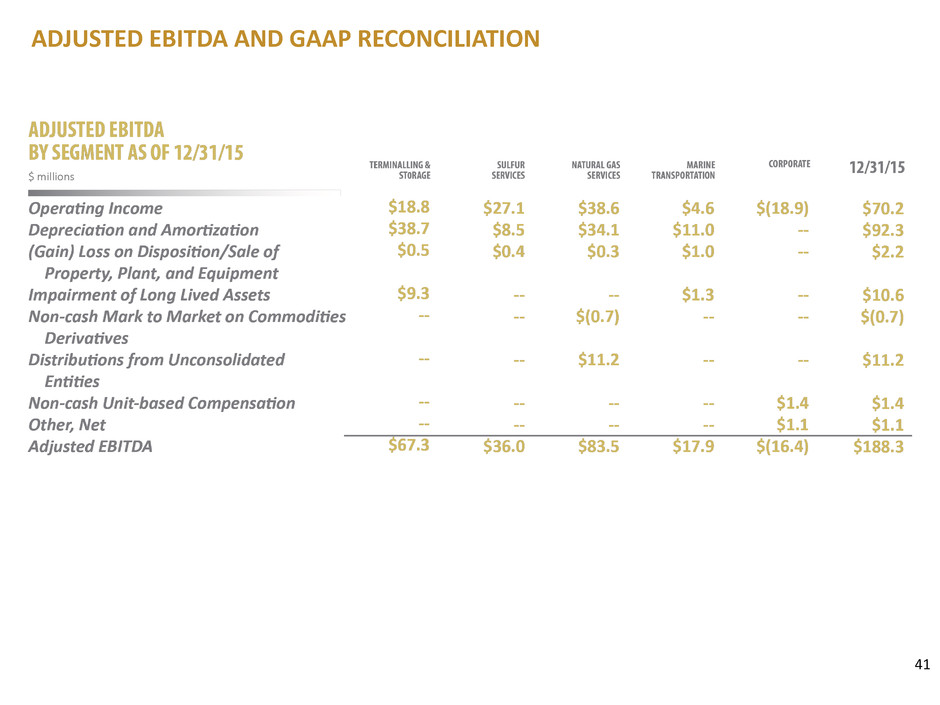
T E X T G O E S H E R E S U B T E X T I S P L A C E D H E R E 3 USE OF NON-GAAP FINANCIAL MEASURES This presentation includes certain non-GAAP financial measures such as EBITDA and Adjusted EBITDA. These non-GAAP financial measures are not meant to be considered in isolation or as a substitute for results prepared in accordance with accounting principles generally accepted in the United States (GAAP). A reconciliation of non-GAAP financial measures included in this presentation to the most directly comparable financial measure calculated and presented in accordance with GAAP is set forth in the Appendix of this presentation or on our web site at www.martinmidstream.com. The GAAP financial measures most comparable to the 2016 non-GAAP financial measures are not accessible on a forward-looking basis and reconciling information is not available without unreasonable effort. The items that impacted our GAAP financial measures in 2015 and are reflected in our reconciliation of 2015 non-GAAP financial measures are the same types of items that could impact our GAAP financial measures in 2016, but the levels and values of such impact are unknown at this time. MMLP’s management believes that these non-GAAP financial measures provide useful information to investors regarding MMLP’s financial condition and results of operations as they provide another measure of the profitability and ability to service its debt and are considered important measures by financial analysts covering MMLP and its peers.

T E X T G O E S H E R E S U B T E X T I S P L A C E D H E R E 4 FORWARD LOOKING STATEMENTS Statements included that are not historical facts (including any statements concerning plans and objectives of management for future operations or economic performance or assumptions or forecasts related thereto), are forward-looking statements. These statements can be identified by the use of forward-looking terminology including “forecast,” “may,” “believe,” “will,” “expect,” “anticipate,” “estimate,” “continue,” or other similar words. These statements discuss future expectations, contain projections of results of operations or of financial condition or state other “forward-looking” information. We and our representatives may from time to time make other oral or written statements that are also forward-looking statements. These forward-looking statements are based upon management’s current plans, expectations, estimates, assumptions and beliefs concerning future events impacting us and therefore involve a number of risks and uncertainties. We caution that forward-looking statements are not guarantees and that actual results could differ materially from those expressed or implied in the forward-looking statements. Because these forward-looking statements involve risks and uncertainties, actual results could differ materially from those expressed or implied by these forward-looking statements for a number of important reasons. A discussion of these factors, including risks and uncertainties, is set forth in Martin Midstream Partners L.P.’s annual and quarterly reports filed from time to time with the Securities and Exchange Commission. Martin Midstream Partners L.P. expressly disclaims any intention or obligation to revise or update any forward-looking statements whether as a result of new information, future events, or otherwise.

2016 M A R T I N M I D S T R E A M PA R T N E R S L . P. O V E R V I E W J o e M c C r e e r y , V i c e P r e s i d e n t – F i n a n c e

T E X T G O E S H E R E S U B T E X T I S P L A C E D H E R E 6 • Based in Kilgore, TX, MRMC is a leading independent provider of storage, manufacturing, marketing, and distribution services to energy, petrochemical and other industrial concerns • MRMC and its legacy companies have been operating since 1951 • Approximately 2,300 employees • MRMC operating entities represent revenue in excess of $1.6 billion • Combined MRMC and MMLP 2015 revenue was in excess of $2.7 billion • Fully employee-owned through ESOP as of December 2013 • IRS approved S-Corp 1/1/2014 • Owns 51% voting interest in the general partner of MMLP • Largest limited partner unitholder of MMLP • 6.3 million units (17.7% limited partnership unit ownership) • Key MRMC Operating Subsidiaries • Martin Energy Services LLC • Martin Transport, Inc. • Cross Oil Refining & Marketing, Inc. • Martin Product Sales LLC • Martin Energy Trading LLC MARTIN RESOURCE MANAGEMENT (MRMC) OVERVIEW

T E X T G O E S H E R E S U B T E X T I S P L A C E D H E R E 7 • NASDAQ Listed: MMLP • Formed October 31, 2002 • MMLP is a publicly traded, diversified master limited partnership with operations including: • Terminalling & Storage • Natural Gas Services • Sulfur Services • Marine Transportation • MMLP Trading Summary (1) • Unit Price: $20.78 • Units Outstanding 35.5 million • Market Cap: $0.74 billion • Quarterly Distribution: $0.8125/$3.25 annualized • Current Yield: 15.6% (1) As of March 18, 2016 close MARTIN MIDSTREAM PARTNERS L.P. (MMLP) OVERVIEW

T E X T G O E S H E R E S U B T E X T I S P L A C E D H E R E 8 • Majority of cash flows generated from fee-based contracts • Significant portions consist of reservation charges or minimum fee arrangements Fee-Based Contracts • Refinery centric, diversified asset base with four complementary business units that create a customer-preferred integrated distribution network • Ability to handle and transport specialty products and by-products with unique requirements Fully Integrated, Diversified Service Provider • Strategically located in areas of high-growth and concentrated customer activity • U.S. Gulf Coast – “Refinery Belt” – centric locations Attractive Operating Footprint • 11 public equity follow-on offerings since IPO for approximately $870 million in net proceeds • Approximately $280 million available under the at-the-market (ATM) equity shelf registration Proven Access to Capital • High quality, stable base of leading industry customers including the largest refiners, major integrated oil and gas companies, independent refiners, large chemical companies and fertilizer manufacturers Stable, Diversified Customer Base • Vested executive management team with 30+ years average industry experience Experienced Management KEY INVESTMENT HIGHLIGHTS

9 Natural Gas Services $83.5 Sulfur Services $36.0 Marine Transportation $17.9 $188.3 Adjusted EBITDA ($204.7 million before $16.4 million unallocated SG&A and other non-operating income) UNIQUELY DIVERSIFIED OPERATING MIX Terminalling & Storage $67.3

10 UNIQUELY DIVERSIFIED OPERATING MIX $183.6 Adjusted EBITDA ($199.7 million before $16.1 million unallocated SG&A and other non-operating income) Natural Gas Services $84.2 Terminalling & Storage $72.0 Sulfur Services $29.3 Marine Transportation $14.2

11 MMLP ASSET LOCATIONS – ALL SEGMENTS
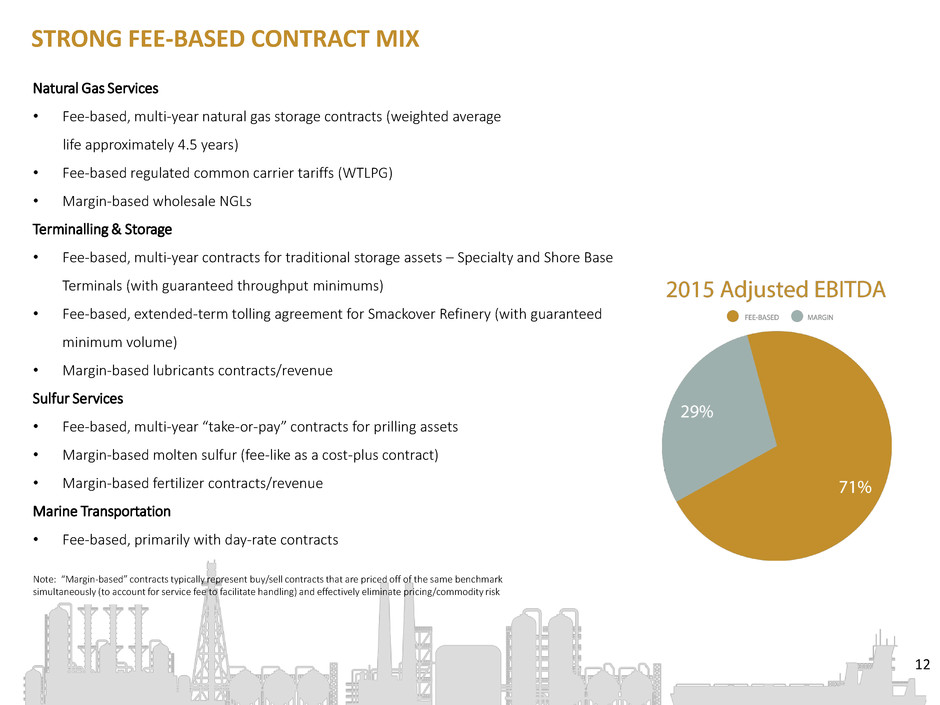
T E X T G O E S H E R E S U B T E X T I S P L A C E D H E R E 12 Natural Gas Services • Fee-based, multi-year natural gas storage contracts (weighted average life approximately 4.5 years) • Fee-based regulated common carrier tariffs (WTLPG) • Margin-based wholesale NGLs Terminalling & Storage • Fee-based, multi-year contracts for traditional storage assets – Specialty and Shore Base Terminals (with guaranteed throughput minimums) • Fee-based, extended-term tolling agreement for Smackover Refinery (with guaranteed minimum volume) • Margin-based lubricants contracts/revenue Sulfur Services • Fee-based, multi-year “take-or-pay” contracts for prilling assets • Margin-based molten sulfur (fee-like as a cost-plus contract) • Margin-based fertilizer contracts/revenue Marine Transportation • Fee-based, primarily with day-rate contracts Note: “Margin-based” contracts typically represent buy/sell contracts that are priced off of the same benchmark simultaneously (to account for service fee to facilitate handling) and effectively eliminate pricing/commodity risk STRONG FEE-BASED CONTRACT MIX
T E X T G O E S H E R E S U B T E X T I S P L A C E D H E R E 13 PROFITABILITY DRIVERS Terminalling & Storage • Corpus Christi Crude and Specialty Terminals • Eagle Ford production (CCCT) • Refinery dependency on moving by-products such as asphalt, fuel oil, molten sulfur, ammonia, sulfuric acid • Shore-Based Terminals • Consistent cash flow derived from MVC with MRMC • Gulf of Mexico exploration and production activity • Smackover Refinery • Long-term MVC with MRMC as counterparty • Naphthenic base oil and lubricant demand • Martin Lubricants • Expand product offerings (greases) to existing customers • Available supply of base oils • Macro economic growth driver in manufacturing, construction and agriculture Natural Gas Services • Cardinal Gas Storage • Natural Gas production/supply • Geographical basis differentials • Seasonal demand • Natural Gas price volatility • Butane • Refinery utilization • Refined product/Gasoline demand • Seasonal differentials given EPA fuel mandates (RVP) • Access to storage/transportation • Relationships with refineries • Legacy NGL Businesses (including propane) • Drilling/production activity • Seasonal demand/storage & transportation capabilities • Volatility in commodity prices

T E X T G O E S H E R E S U B T E X T I S P L A C E D H E R E 14 PROFITABILITY DRIVERS Sulfur Services • Fertilizer • Macro agricultural demand (forecast calls for a slight increase in corn acreage planted for 2016) • Long-term diminishing and inadequate sulfur levels in U.S. soil, thus requiring greater use of sulfur-based fertilizer in the U.S. agriculture market • Impact of weather and seasonal conditions • Molten & Prilled Sulfur • Refinery utilization/Crude diet (heavy sour bias) • Long-term take or pay contracts provide stability • Global impact of phosphate (fertilizer) supply/demand • Provides insurance policy–like security for refining customers Marine Transportation • Refinery utilization • North American oil & gas production (shale plays)

T E X T G O E S H E R E S U B T E X T I S P L A C E D H E R E 15 • Long-term customer relationships are a key driver of our success • Full value chain solutions for handling and logistics • Customers include some of the largest, most profitable businesses in the energy industry. These include major oil and gas companies, independent refiners, larger chemical companies, and fertilizer manufacturers • Long-term contracts, providing stable revenue and cash flow generation, commonly from 1 to 5 years. Contracts with MRMC are generally greater in length and designed to be perpetual • Top ten customers by revenue shown to the right HIGH QUALITY LONG-TERM CUSTOMER BASE

T E X T G O E S H E R E S U B T E X T I S P L A C E D H E R E 16 • MRMC businesses help support MMLP • MRMC’s distinct assets and business units are complementary to MMLP • Approximately 25% of 2015 MMLP Adjusted EBITDA derived from contracts with MRMC • MRMC has significantly assisted in MMLP’s growth • MMLP is not a “financially engineered” conduit for MRMC to extract value – just the opposite • Over $400 million invested through unit purchases and drop down acquisitions • Business value chains designed to keep volatility associated with commodity prices away from MMLP • Alinda Capital Partners (“Alinda”) has a 49% voting/50% economic interest in the general partner of MMLP STRONG GENERAL PARTNER SUPPORT

2016 S E G M E N T & O P E R AT I O N A L O V E R V I E W B o b B o n d u r a n t , C h i e f F i n a n c i a l O f f i c e r

T E X T G O E S H E R E S U B T E X T I S P L A C E D H E R E 18 MMLP provides wholesale distribution of natural gas liquids (NGLs) to propane retailers, refineries and industrial NGL users in Texas and the southeastern U.S. MMLP owns Cardinal Gas Storage Partners LLC, which is focused on the operation and management of 50 Bcf in natural gas storage facilities across northern Louisiana and Mississippi. MMLP owns or leases approximately 2.4 million barrels of combined NGL storage capacity in Louisiana, Mississippi and Texas. MMLP owns a 20% interest in West Texas LPG Pipeline L.P., an approximate 2,300 mile common-carrier pipeline system that transports NGLs from New Mexico and Texas to Mont Belvieu, TX for fractionation. MMLP also owns an NGL pipeline that runs approximately 200 miles from Kilgore, TX to Beaumont, TX. Additionally, MMLP added a NGL rail terminal to its Arcadia, Louisiana storage facility in June 2015. This facility will broaden the geographic footprint of the NGL business segment. $ millions Key Assets 2015 Adj. EBITDA 2016E Adj. EBITDA Cardinal $44.3 $38.1 Butane $19.9 $23.5 WTLPG $11.2 $14.4 NGLs $4.1 $4.1 Propane $4.0 $4.1 Total NGS $83.5 $84.2 NATURAL GAS SERVICES OVERVIEW

T E X T G O E S H E R E S U B T E X T I S P L A C E D H E R E 19 • Firm contract model for natural gas storage • Long term contracts – Cardinal’s weighted average contract protects against significant cash flow deterioration from re- contracting risk near term while demand drivers continue to develop • Potential demand growth – Over the next 5 to 10 years growing demand drivers from LNG exports and Mexican exports, increasing industrial and petrochemical use and coal-fired conversions to natural gas production seem probable • Increased volatility – Due to demand drivers above, natural gas price volatility should enhance the value of storage assets Cardinal Contract Summary (1) Type Working Gas Capacity Currently Contracted Arcadia Salt Cavern 17.5 86% Cadevill Depleted Reservoir 17.0 100% Perryville Salt Cavern 8.5 100% Monroe Depleted Reservoir 7.0 94% Total 50.0 94% Firm Contracted Storage/Fee-Based Cash Flow (1) As of January 1, 2016 NATURAL GAS SERVICES Cardinal Gas Storage $ millions (1) Partial year acquisition closed August 29, 2014 (1) $16.0 $44.3 $38.1 $- $10.0 $20.0 $30.0 $40.0 $50.0 2014 2015 2016E Cardinal Gas Storage Adjusted EBITDA

20 Arcadia Gas Storage • Salt dome facility (Arcadia, LA) – 17.5 bcf Perryville Gas Storage • Salt dome facility (Delhi, LA) – 8.5 bcf Cadeville Gas Storage • Depleted reservoir facility (Monroe, LA) – 17.0 bcf Monroe Gas Storage • Depleted reservoir facility (Amory, MS) – 7.0 bcf NATURAL GAS SERVICES Cardinal Gas Storage Asset Locations

21 Butane Optimization NATURAL GAS SERVICES Butanes & Underground Storage • New rail rack at Arcadia, LA operational June 1, 2015 – creating dual capabilities (truck and rail) plus a broadened (national) geographic product footprint • EPA regulates the vapor pressure (RVP) of gasoline in order to reduce evaporative emissions • Refineries adjust RVP to meet EPA standards and maintain vehicles’ engine reliability; higher vaporization is desired during the winter months and therefore more refinery grade butane is utilized in gasoline production • MMLP owns and leases a network of underground storage assets and utilizes transportation equipment owned by Martin Transport, Inc. (MRMC) to facilitate butane optimization as shown below: $15.7 $19.9 $23.5 $- $5.0 $10.0 $15.0 $20.0 $25.0 2014 2015 2016E Butanes Adjusted EBITDA $ millions

T E X T G O E S H E R E S U B T E X T I S P L A C E D H E R E 22 • WTLPG includes approximately 2,300 miles of Y-grade pipeline extending from eastern New Mexico to Mt. Belvieu, Texas • MMLP owns 20% interests in West Texas LPG Pipeline L.P. (OKS is owner/operator of remaining 80%) • Nameplate capacity of approximately 240 MBbls/day; 2015 volume approximately 220MBbls/day • Revised tariff construct implemented July 2015 created additional distribution of approximately $5.0 million annually • Connection to Cajun Sibon pipeline provides delivery alternative to Mt. Belvieu • WTLPG is connected to MAPL system for further NGL supply from the Rockies region • Moves West to East/Southeast across multiple producing regions • Permian Basin • Barnett Shale • East Texas/Cotton Valley • 2015A distributions to MMLP of $11.2 million • 2016E distributions to MMLP of $14.4 million System Map NATURAL GAS SERVICES West Texas LPG Pipeline L.P.

T E X T G O E S H E R E S U B T E X T I S P L A C E D H E R E 23 NGLs • Assets include 200-mile East Texas Pipeline providing Y- grade deliveries (Kilgore to Beaumont) for fractionation; East Texas market volumes gathered by truck for pipeline injection • Spindeltop terminal supplies natural gasoline to a Beaumont area specialty chemical manufacturer • Wholesale propane distribution to approximately 100 regional (Southeastern U.S.) customers • Propane division has no PPE; utilizes underground storage capacity to handle inventory • Base business in decline (for several decades) as propane distributors are consolidated and alternative heat sources are utilized Propane NATURAL GAS SERVICES NGLs & Propane $8.2 $4.1 $4.1 $- $2.0 $4.0 $6.0 $8.0 $10.0 2014 2015 2016E NGLs Adjusted EBITDA $4.9 $4.0 $4.1 $- $1.0 $2.0 $3.0 $4.0 $5.0 $6.0 2014 2015 2016E Propane Adjusted EBITDA $ millions $ millions

T E X T G O E S H E R E S U B T E X T I S P L A C E D H E R E 24 T&S Segment 2015A Adj. EBITDA 2016E Adj. EBITDA Specialty Terminals - CCCT $17.1 $12.6 Shore-Based Terminals $19.5 $19.7 Martin Lubricants $8.5 $12.3 Smackover Refinery $15.4 $18.5 Specialty Terminals - Other $6.8 $8.9 Total T&S $67.3 $72.0 MMLP owns or operates 45 terminal facilities with an aggregate storage capacity of 4.2 million barrels. These facilities are located across the U.S. Gulf Coast region and provide storage, refining, blending, packaging, and handling services for producers and suppliers of petroleum products and by-products through 29 marine shore-based terminals and 16 specialty terminals. The location and composition of these terminals are structured to complement MMLP’s other businesses and reflect MMLP’s strategy to provide a broad range of integrated services in the handling and transportation of various products and by-products. $ millions TERMINALLING & STORAGE

T E X T G O E S H E R E S U B T E X T I S P L A C E D H E R E 25 Specialty Terminals Overview • Network of 16 owned or operated terminals facilitate the movement of petroleum products and by-products to and from oil refiners and natural gas processing facilities • Specialized capabilities include the ability to store and handle products with a wide range of temperature requirements (-30° to +400°F) and receive products transported by vessel, barge, rail or truck • Products handled include: • Anhydrous ammonia (temp requirement: -30°F) • Asphalt (temp requirement: up to 400°F) • Crude oil • Fuel oil • Molten sulfur (temp requirement: 270°F) • Sulfuric acid • Other assorted petroleum products and by-products Port of Tampa, Tampa, FL TERMINALLING & STORAGE Specialty Terminals $ millions $26.9 $23.9 $21.5 $- $5.0 $10.0 $15.0 $20.0 $25.0 $30.0 2014 2015 2016E Specialty Terminals Adjusted EBITDA

T E X T G O E S H E R E S U B T E X T I S P L A C E D H E R E 26 Expertise In Crude Oil Transloading and “Hard to Handle” Product and By-Product Logistics • Integral Eagle Ford Shale crude oil transloading facility • 900,000 barrel capacity crude storage facility • Transloading connection capabilities with two deep- water docks • Terminal point of Harvest Pipeline • Multi-year contract with major integrated refiner • 117.5 bbls forecasted for 2016. TERMINALLING & STORAGE Specialty Terminals • Beaumont Neches • Multi-service facility – recent lease of 96 additional acres • Sulfur offtake and gathering point for Texas and Louisiana refiners • Deep water and barge dock access • Serviced by 3 rail lines (BNSF, KCS, UP) • Beaumont Stanolind • Multi-product handling facility (sulfuric acid, asphalt, sulfur & fuel oil) • Corpus Christi Barge Terminal • Storage facility with barge access • Services large refineries • Tampa • Primary U.S. molten sulfur delivery point • Multi-product handling facility (sulfuric acid, asphalt, sulfur & fuel oil) • South Houston and Omaha • Asphalt terminalling and processing facilities backed with minimum throughput guarantee • Dunphy • Elko, NV sulfuric acid terminal serving the mining industry • Minimum throughput guarantee • Beaumont Spindletop • Natural gasoline terminal providing feedstock to petrochemical manufacturers Specialized Sites (continued) Corpus Christi Crude Terminal Specialized Sites

T E X T G O E S H E R E S U B T E X T I S P L A C E D H E R E 27 Gulf Coast Fuel and Lubricant Distribution Network • 29 owned or operated terminals along the Gulf Coast from Blakeley Island, AL to Corpus Christi, TX • Terminalling assets utilized by Martin Energy Services (MRMC) to facilitate the distribution and marketing of fuel and lubricants to oil and gas exploration and production companies, oilfield service companies, marine transportation companies and offshore construction companies • Additional logistical support services provided: • Storage and handling of tubular goods • Loading and unloading bulk materials • Providing facilities and equipment to store and mix drilling fluids • Strategically-located asset base well-positioned to support the exploration and production activity in the Gulf of Mexico • Fee-based contract structure provides stable cash flow • Long-term fuel throughput contract with guaranteed minimums (MRMC) TERMINALLING & STORAGE Marine Shore-Based Terminals $ millions $18.3 $19.5 $19.7 $- $5.0 $10.0 $15.0 $20.0 $25.0 2014 2015 2016E Shore-Based Terminals Adjusted EBITDA

T E X T G O E S H E R E S U B T E X T I S P L A C E D H E R E 28 Specialized Naphthenic Refinery • 7,500 bpd capacity naphthenic lube refinery located in Smackover, AR • Specialized facility processes crude oil into finished products including naphthenic lubricants, distillates and asphalt • Naphthenic lubricants have customized industrial uses including • Transformer oils • Rubber extenders • Base oil for lubricants • Fee-based contract structure provides stable cash flow • Long-term tolling agreement with MRMC leaving MMLP with no commodity exposure • Throughput fee to MRMC increases as growth capital is spent TERMINALLING & STORAGE Smackover Refinery $11.3 $15.4 $18.5 $- $5.0 $10.0 $15.0 $20.0 2014 2015 2016E Smackover Refinery Adjusted EBITDA $ millions
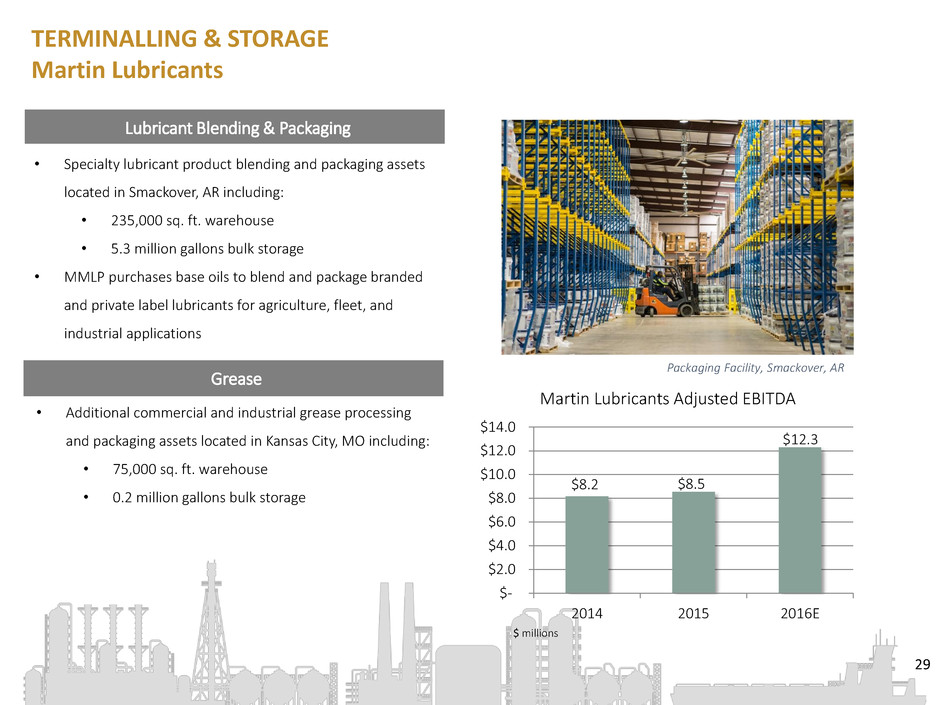
T E X T G O E S H E R E S U B T E X T I S P L A C E D H E R E 29 Lubricant Blending & Packaging • Specialty lubricant product blending and packaging assets located in Smackover, AR including: • 235,000 sq. ft. warehouse • 5.3 million gallons bulk storage • MMLP purchases base oils to blend and package branded and private label lubricants for agriculture, fleet, and industrial applications Grease • Additional commercial and industrial grease processing and packaging assets located in Kansas City, MO including: • 75,000 sq. ft. warehouse • 0.2 million gallons bulk storage Packaging Facility, Smackover, AR TERMINALLING & STORAGE Martin Lubricants $8.2 $8.5 $12.3 $- $2.0 $4.0 $6.0 $8.0 $10.0 $12.0 $14.0 2014 2015 2016E Martin Lubricants Adjusted EBITDA $ millions

T E X T G O E S H E R E S U B T E X T I S P L A C E D H E R E 30 MMLP has an integrated system of sulfur aggregation facilities and transportation assets. MMLP gathers molten sulfur from refiners, primarily located on the Gulf Coast. Molten sulfur is either marketed to fertilizer and industrial companies on a fixed margin basis or prilled for a fee to provide export capabilities to refiners. Through its sulfur facilities and assets, MMLP is also able to manufacture and market sulfur-based fertilizers and related sulfur products to wholesale fertilizer distributors and industrial users. $ millions Sulfur Services Segment 2015 Adj. EBITDA 2016E Adj. EBITDA Fertilizer $19.5 $18.0 Molten Sulfur $9.8 $6.2 Sulfur Prilling $6.7 $5.1 Total Sulfur Services $36.0 $29.3 SULFUR SERVICES OVERVIEW

31 • Provides transportation, processing and marketing services necessary to move product from producer to consumer • Intermodal transportation offers multiple fee opportunities for the Partnership SULFUR SERVICES Integrated Value Chain

T E X T G O E S H E R E S U B T E X T I S P L A C E D H E R E 32 • MMLP manufactures and markets sulfur-based fertilizer and related sulfur products for agricultural and industrial use from manufacturing plants in Texas, Illinois and Utah • Typical customers include large distributors that own or control local retail and wholesale distribution outlets • Fertilizer prices are based on competitive price lists that vary by state and according to seasonality Fertilizer Overview Supply/Demand • The single largest factor influencing fertilizer demand in the U.S. is corn acres planted and harvested • While acres planted have trended lower since 2012, the approximately 88 million acres planted in 2015 still represents a level well above historical averages. Continued global population growth is expected to further increase demand for corn from the U.S. • 2016 corn acres forecasted to be planted in 90 million acres SULFUR SERVICES Fertilizer $16.2 $19.5 $18.0 $- $5.0 $10.0 $15.0 $20.0 $25.0 2014 2015 2016E Fertilizer Adjusted EBITDA $ millions

T E X T G O E S H E R E S U B T E X T I S P L A C E D H E R E 33 • Performance risk is minimal as refiners require security of offtake and customers need stable supply • Contracts often have evergreen provisions and most relationships have been in place 5+ years Refinery Supply Agreements Supply/Demand • Sulfur production is driven by refinery utilization and demand for refined products • Demand for sulfur is primarily driven by sulfuric acid, the most widely produced/consumed chemical worldwide; thus revenue is correlated with the health of the global economy Assets Capacity Products Offshore Tank Barge 10,450 tons Molten Sulfur Offshore Tugboat 7,200 horsepower N/A Inland Push Boat 1,200 horsepower N/A MGM 101 2,450 tons Molten Sulfur MGM 102 2,450 tons Molten Sulfur Note: MMLP has molten sulfur storage in Tampa, FL, Beaumont, TX and Plainview, TX SULFUR SERVICES Molten Sulfur $8.7 $9.8 $6.2 $- $2.0 $4.0 $6.0 $8.0 $10.0 $12.0 2014 2015 2016E Molten Sulfur Adjusted EBITDA $ millions

T E X T G O E S H E R E S U B T E X T I S P L A C E D H E R E 34 • Refinery customers pay MMLP minimum reservation fees and operating fees per ton of sulfur for its prilling services • Most contracts consist of 3 to 5 year service agreements with evergreen provisions • Most customer relationships have been in place for 5+ years Prilling Agreements • Security of sulfur offtake is critical to operational stability of all refiners • Prilled sulfur enables large scale transportation for export on dry bulk vessels • At Beaumont, TX the export option provides pricing leverage for Gulf Coast refiners selling sulfur into the domestic market • At Stockton, CA, export is the primary option of disposal for a refinery’s residual sulfur production Supply/Demand Terminal Location Production Capacity Products Stored Neches Beaumont, TX 5,500 tons/day Molten, prilled & granulated sulfur Stockton Stockton, CA 1,000 tons/day Molten & prilled sulfur SULFUR SERVICES Prilled Sulfur $8.9 $6.7 $5.1 $- $2.0 $4.0 $6.0 $8.0 $10.0 $12.0 2014 2015 2016E Sulfur Prilling Adjusted EBITDA $ millions
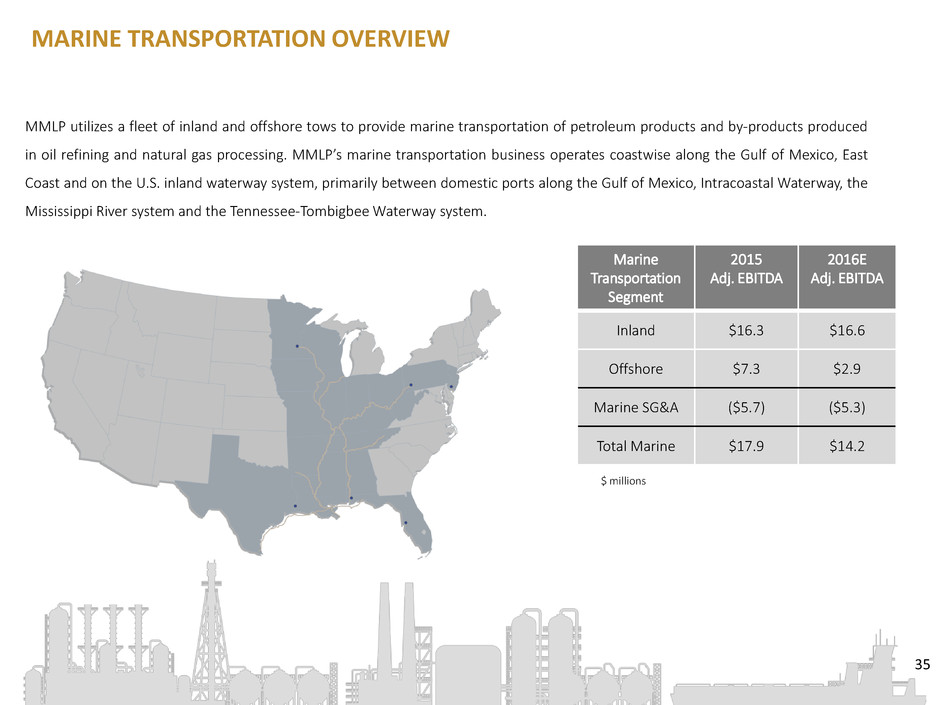
T E X T G O E S H E R E S U B T E X T I S P L A C E D H E R E 35 MMLP utilizes a fleet of inland and offshore tows to provide marine transportation of petroleum products and by-products produced in oil refining and natural gas processing. MMLP’s marine transportation business operates coastwise along the Gulf of Mexico, East Coast and on the U.S. inland waterway system, primarily between domestic ports along the Gulf of Mexico, Intracoastal Waterway, the Mississippi River system and the Tennessee-Tombigbee Waterway system. Marine Transportation Segment 2015 Adj. EBITDA 2016E Adj. EBITDA Inland $16.3 $16.6 Offshore $7.3 $2.9 Marine SG&A ($5.7) ($5.3) Total Marine $17.9 $14.2 $ millions MARINE TRANSPORTATION OVERVIEW

T E X T G O E S H E R E S U B T E X T I S P L A C E D H E R E 36 • 45 inland marine tank barges • 25 inland push-boats • 3 offshore tug barge units • Ability to handle specialty products (asphalt, fuel oil, gasoline, sulfur and other bulk liquids), which complements the MMLP Specialty Terminals • The segment contracts with other MMLP segments, MRMC, major and independent oil and gas refining companies, and select international and domestic trading companies • Fee-based day-rate contracts • Assets held for seller Insulated Hot Oil Barge Launch Marine Transportation MARINE TRANSPORTATION Assets
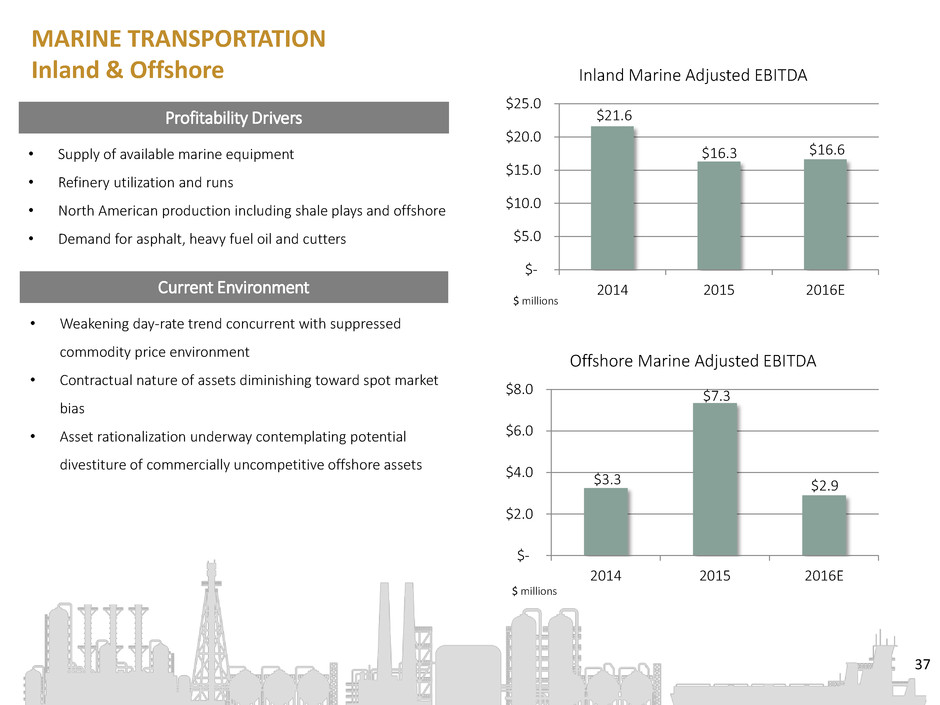
T E X T G O E S H E R E S U B T E X T I S P L A C E D H E R E 37 Profitability Drivers • Supply of available marine equipment • Refinery utilization and runs • North American production including shale plays and offshore • Demand for asphalt, heavy fuel oil and cutters Current Environment • Weakening day-rate trend concurrent with suppressed commodity price environment • Contractual nature of assets diminishing toward spot market bias • Asset rationalization underway contemplating potential divestiture of commercially uncompetitive offshore assets MARINE TRANSPORTATION Inland & Offshore $ millions $ millions $21.6 $16.3 $16.6 $- $5.0 $10.0 $15.0 $20.0 $25.0 2014 2015 2016E Inland Marine Adjusted EBITDA $3.3 $7.3 $2.9 $- $2.0 $4.0 $6.0 $8.0 2014 2015 2016E Offshore Marine Adjusted EBITDA

2016 F I N A N C I A L F O U N DAT I O N & P R O J E C T I O N S E T J o e M c C r e e r y , V i c e P r e s i d e n t – F i n a n c e
39 CAPITALIZATION

T E X T G O E S H E R E S U B T E X T I S P L A C E D H E R E 40 RECENT MMLP UNIT PURCHASES BY KEY INSIDERS Total Period Total Q3 2014 Q4 2014 2014 Q1 2015 Q2 2015 Q3 2015 Q4 2015 2015 Q1 2016 2016 Purchases Ownership General Partner Martin Resource Management Corporation (51%) 1,171,265 - 1,171,265 - - - - - - - 1,171,265 6,264,532 Alinda Capital Partners (49%) - - - - - - - - - - - - Management Ruben S. Martin III President, CEO and Director 10,630 407 11,037 13,485 446 1,985 6,275 22,191 13,311 13,311 46,540 113,218 Robert D. Bondurant EVP, CFO and Director 1,233 315 1,548 3,379 336 1,383 498 5,596 6,073 6,073 13,217 33,304 Randall L. Tauscher EVP and COO 147 191 338 3,228 202 241 296 3,968 8,655 8,655 12,961 25,982 Chris H. Booth EVP, General Counsel and Secretary 127 3 130 2,503 3 404 4 2,914 4,207 4,207 7,251 9,243 Stephen W. Martin VP, Corporate Development - - - - - - - - 2,000 2,000 2,000 14,850 Joseph M. McCreery VP, Finance/Head of Investor Relations 1,597 132 1,729 2,160 142 231 214 2,748 6,610 6,610 11,087 15,186 Outside Directors James Collingsworth Director, appointed October 2014 - 2,000 2,000 2,400 - - - 2,400 5,375 5,375 9,775 10,775 Byron Kelley Director - - - 2,400 - - - 2,400 4,600 4,600 7,000 12,600 C. Scott Massey Director 400 - 400 2,400 - 1,000 500 3,900 4,850 4,850 9,150 27,000 Affiliated Directors (Alinda) Alexander W.F. Black Former Director, resigned February 2016 - - - - - - - - - - - - Sean P. Dolan Director - - - - - - - - - - - - Zachary Stanton Director, appointed February 2016 - - - - - - - - - - - - Total 1,186,399 3,049 1,189,447 31,956 1,129 5,244 7,787 46,117 55,681 55,681 1,291,245 6,527,690
41 ADJUSTED EBITDA AND GAAP RECONCILIATION

2 0 1 6 | M A R T I N M I D S T R E A M P A R T N E R S S U B T E X T I S P L A C E D H E R E
