Attached files
| file | filename |
|---|---|
| 8-K - 8-K - KEY ENERGY SERVICES INC | d135504d8k.htm |
Exhibit 99.1

Get More
WITH KEY ENERGY
SERVICES
Key
Scotia Howard Weil 2016 Energy Conference
March 23, 2016
Robert Drummond
President and Chief Executive Officer
+safe harbor
This press
release contains “forward-looking statements” within the meaning of the Private Securities Litigation Reform Act of 1995. Any statements as to matters that are not of historic fact are forward-looking statements. The forward-looking
statements include a description of our intention to consider alternatives to cure the NYSE continued listing requirement deficiency. These forward-looking statements are based on Key’s current expectations, estimates and projections about
Key, its industry, its management’s beliefs and certain assumptions made by management, and include statements regarding estimated capital expenditures, future operational and activity expectations, international growth, and anticipated
financial performance for 2015 and the first quarter of 2016. No assurance can be given that such expectations, estimates or projections will prove to have been correct. Whenever possible, these “forward-looking statements” are identified
by words such as “expects,” “believes,” “anticipates” and similar phrases.
Readers are cautioned that any such forward-looking
statements are not guarantees of future performance and are subject to certain risks, uncertainties and assumptions that are difficult to predict, including, but not limited to: risks that Key will be unable to achieve its financial, capital
expenditure and operational projections, including quarterly and annual projections of revenue and/or operating income and risks that Key’s expectations regarding future activity levels, customer demand, and pricing stability may not
materialize (whether for Key as a whole or for geographic regions and/or business segments individually); risks that fundamentals in the U.S. oil and gas markets may not yield anticipated future growth in Key’s businesses, or could further
deteriorate or worsen from the recent market declines, and/or that Key could experience further unexpected declines in activity and demand for its rig service, fluid management service, coiled tubing service, and fishing and rental service
businesses; risks relating to Key’s ability to implement technological developments and enhancements; risks relating to compliance with environmental, health and safety laws and regulations, as well as actions by governmental and regulatory
authorities; risks relating to compliance with the FCPA and anti-corruption laws, including risks related to costs in connection with FCPA investigations; risks regarding the timing or conclusion of the FCPA investigations, including the risk of
fines or penalties imposed by government agencies for violations of the FCPA; risks affecting Key’s international operations, including risks affecting Key’s ability to execute its plans to withdraw from its international markets outside
North America; risks that Key may be unable to achieve the benefits expected from acquisition and disposition transactions, and risks associated with integration of the acquired operations into Key’s operations; risks, in responding to changing
or declining market conditions, that Key may not be able to reduce, and could even experience increases in, the costs of labor, fuel, equipment and supplies employed and used in Key’s businesses; risks relating to changes in the demand for or
the price of oil and natural gas; risks that Key may not be able to execute its capital expenditure program and/or that any such capital expenditure investments, if made, will not generate adequate returns; risks relating to Key’s ability to
satisfy listing requirements for its equity securities; risks that Key may not have sufficient liquidity; risks relating to Key’s ability to comply with covenants under its current credit facilities; and other risks affecting Key’s ability
to maintain or improve operations, including its ability to maintain prices for services under market pricing pressures, weather risks, and the impact of potential increases in general and administrative expenses.
Because such statements involve risks and uncertainties, many of which are outside of Key’s control, Key’s actual results and performance may differ materially from the
results expressed or implied by such forward-looking statements. Given these risks and uncertainties, readers are cautioned not to place undue reliance on such forward-looking statements. Other important risk factors that may affect Key’s
business, results of operations and financial position are discussed in its most recently filed Annual Report on Form 10-K, recent Quarterly Reports on Form 10-Q, recent Current Reports on Form 8-K and in other Securities and Exchange Commission
filings. Unless otherwise required by law, Key also disclaims any obligation to update its view of any such risks or uncertainties or to announce publicly the result of any revisions to the forward-looking statements made here. However, readers
should review carefully reports and documents that Key files periodically with the Securities and Exchange Commission.
+overview
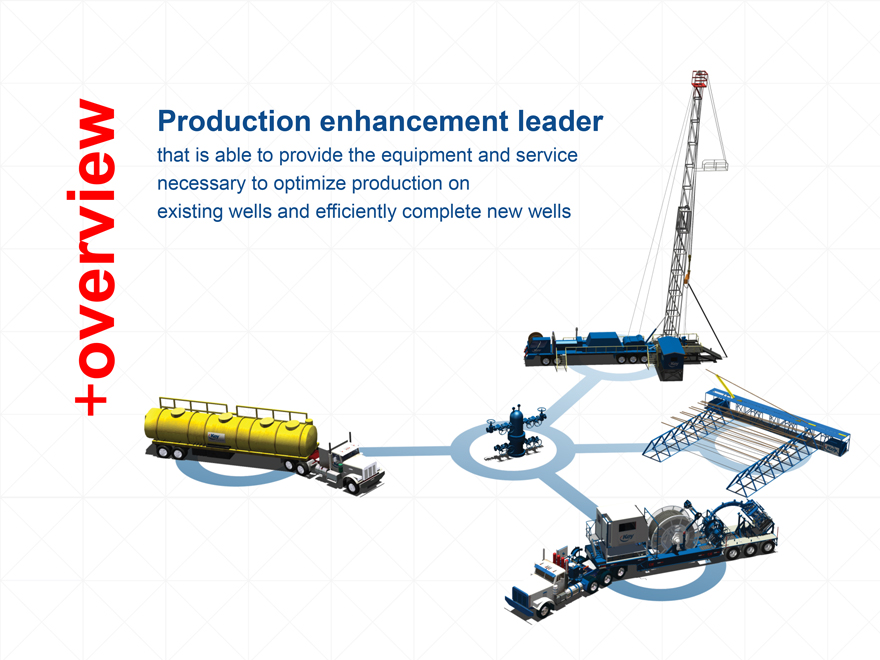
Production
enhancement leader
that is able to provide the equipment and service necessary to optimize production on existing wells and efficiently complete new wells
+profile
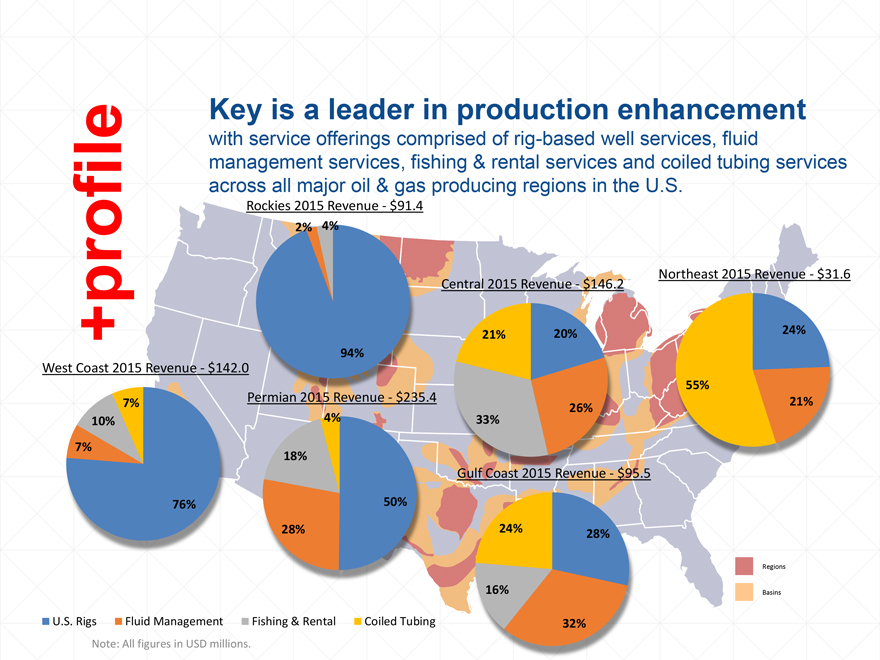
Key is a leader
in production enhancement
with service offerings comprised of rig-based well services, fluid management services, fishing & rental services and coiled tubing
services across all major oil & gas producing regions in the U.S.
Rockies 2015 Revenue - $91.4
2% 4% 94%
West Coast 2015 Revenue - $142.0 7% 10% 7% 76%
Permian 2015 Revenue - $235.4
4% 18% 28% 50%
Central 2015 Revenue - $146.2
21% 20% 26% 33%
Northeast 2015 Revenue - $31.6
55% 24% 21%
Gulf Coast 2015- Revenue - $95.5
24% 28% 16% 32%
Regions
Basins
U.S. Rigs Fluid Management Fishing & Rental Coiled Tubing
Note: All figures in USD
millions.
+rig services
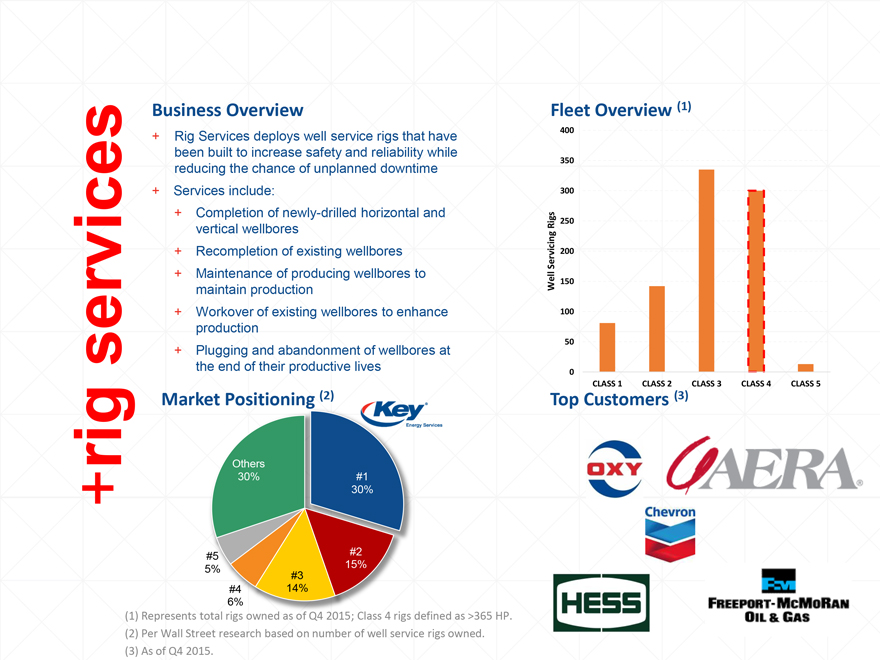
Business
Overview
+ Rig Services deploys well service rigs that have been built to increase safety and reliability while reducing the chance of unplanned downtime
+ Services include:
+ Completion of newly-drilled horizontal and vertical
wellbores
+ Recompletion of existing wellbores
+ Maintenance of producing
wellbores to maintain production
+ Workover of existing wellbores to enhance production
+ Plugging and abandonment of wellbores at the end of their productive lives
Market
Positioning (2)
Key Energy Services
Others
30%
#1
30%
#2
15%
#3
14%
#4
6%
#5
5%
(1) Represents total rigs owned as of Q4 2015; Class 4 rigs defined as >365 HP.
(2) Per Wall Street research based on number of well service rigs owned.
(3) As of Q4 2015.
Fleet Overview (1)
Well Servicing Rigs
400 350 300 250 200 150 100 50 0
CLASS 1 CLASS 2 CLASS 3 CLASS 4 CLASS 5
Top Customers (3)
OXY
GAERA
Chevron
HESS
FM FREEPORT-MCMORAN OIL & GAS
+rig services
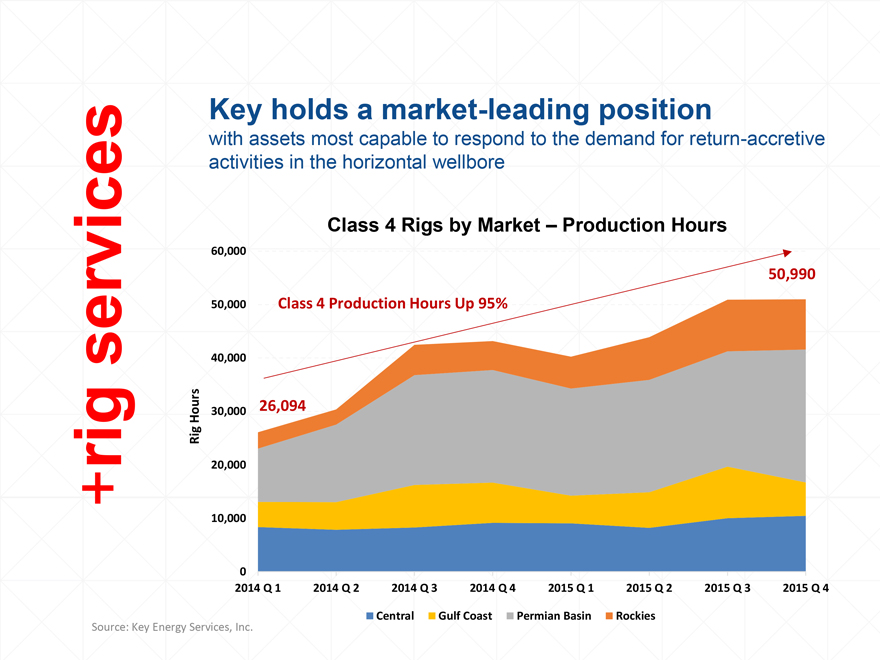
Key holds a
market-leading position
with assets most capable to respond to the demand for return-accretive activities in the horizontal wellbore
Class 4 Rigs by Market – Production Hours
Right Hours
60,000 50,000 40,000 30,000 20,000 10,000 0
Class 4 Production Hours Up 95%
50,990
26,094
2014 Q 1 2014 Q 2 2014 Q 3 2014 Q 4 2015 Q 1 2015 Q 2 2015 Q 3 2015 Q 4
Central Gulf Coast
Permian Basin Rockies
Source: Key Energy Services, Inc.
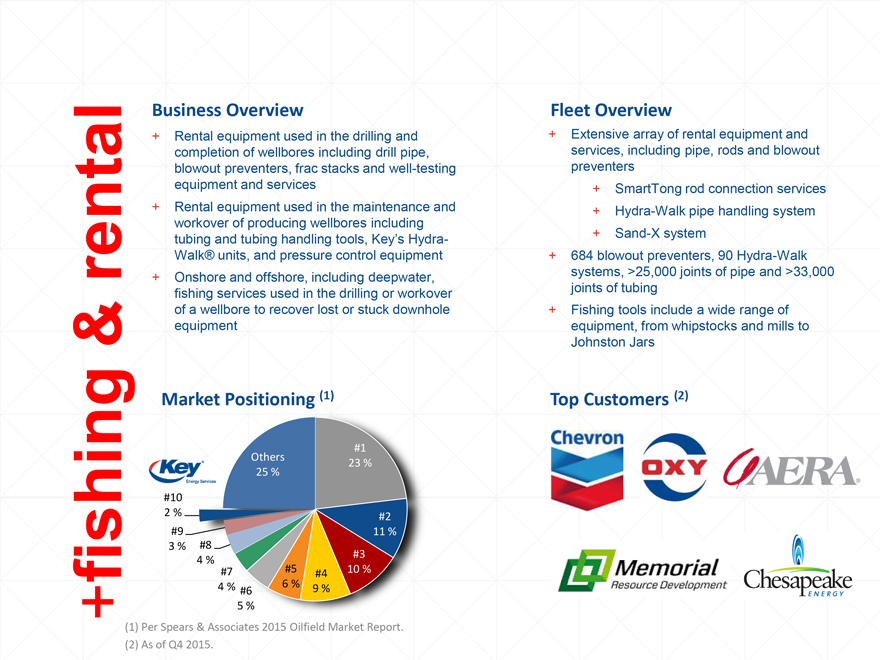
+fishing & rental
Business Overview
+ Rental equipment used in the drilling and completion of
wellbores including drill pipe, blowout preventers, frac stacks and well-testing equipment and services
+ Rental equipment used in the maintenance and workover of
producing wellbores including tubing and tubing handling tools, Key’s Hydra-Walk® units, and pressure control equipment
+ Onshore and offshore, including
deepwater, fishing services used in the drilling or workover of a wellbore to recover lost or stuck downhole equipment
Market Positioning (1)
Key Energy Services
Others 25 %
#1
23 %
#2
11 %
#3
10 %
#4
9 %
#5
6 %
#6
5 %
#7
4 %
#8
4 %
#9
3 %
#10
2 %
(1) Per Spears & Associates 2015 Oilfield Market Report.
(2) As of Q4 2015.
Fleet Overview
+ Extensive array of rental equipment and services, including pipe, rods and
blowout preventers
+ SmartTong rod connection services
+ Hydra-Walk pipe
handling system
+ Sand-X system
+ 684 blowout preventers, 90 Hydra-Walk
systems, >25,000 joints of pipe and >33,000 joints of tubing
+ Fishing tools include a wide range of equipment, from whipstocks and mills to Johnston Jars
Top Customers (2)
Chevron
OXY
GAERA
Memorial Resource Development
Chesapeake ENERGY
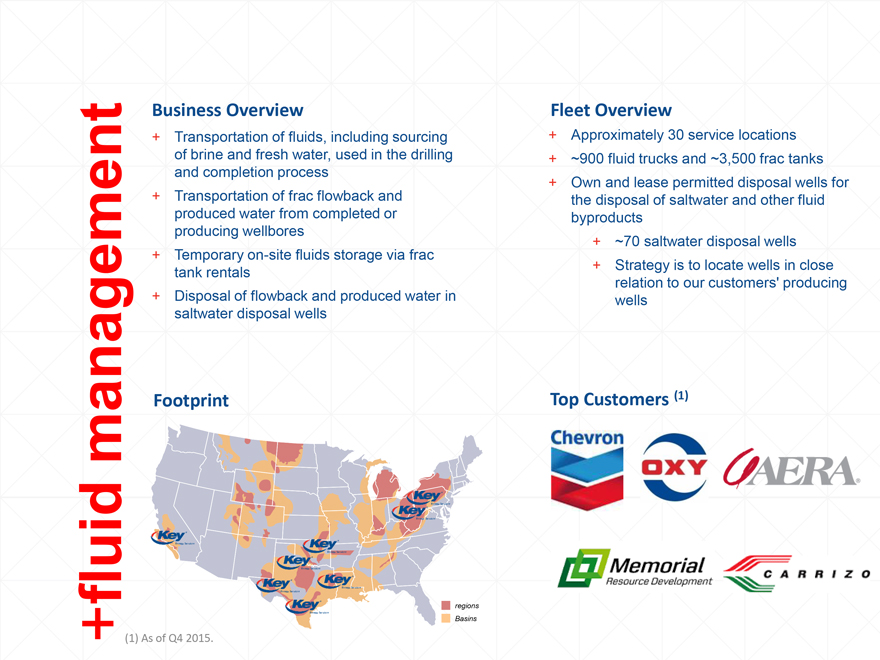
+fluid management
Business Overview
+ Transportation of fluids, including sourcing of brine and
fresh water, used in the drilling and completion process
+ Transportation of frac flowback and produced water from completed or producing wellbores
+ Temporary on-site fluids storage via frac tank rentals
+ Disposal of flowback and produced
water in saltwater disposal wells
Footprint
Key Energy Services
Key Energy Services
Key Energy Services
Key Energy Services
Key Energy Services
Key Energy Services
Key Energy Services
Key Energy Services
regions
Basins
(1) As of Q4 2015.
Fleet Overview
+ Approximately 30 service locations
+ ~900 fluid trucks and ~3,500 frac tanks
+ Own and lease permitted disposal wells for the
disposal of saltwater and other fluid byproducts
+ ~70 saltwater disposal wells
+ Strategy is to locate wells in close relation to our customers’ producing wells
Top Customers (1)
Chevron
OXY
GAERA
Memorial Resource Development
CARRIZO
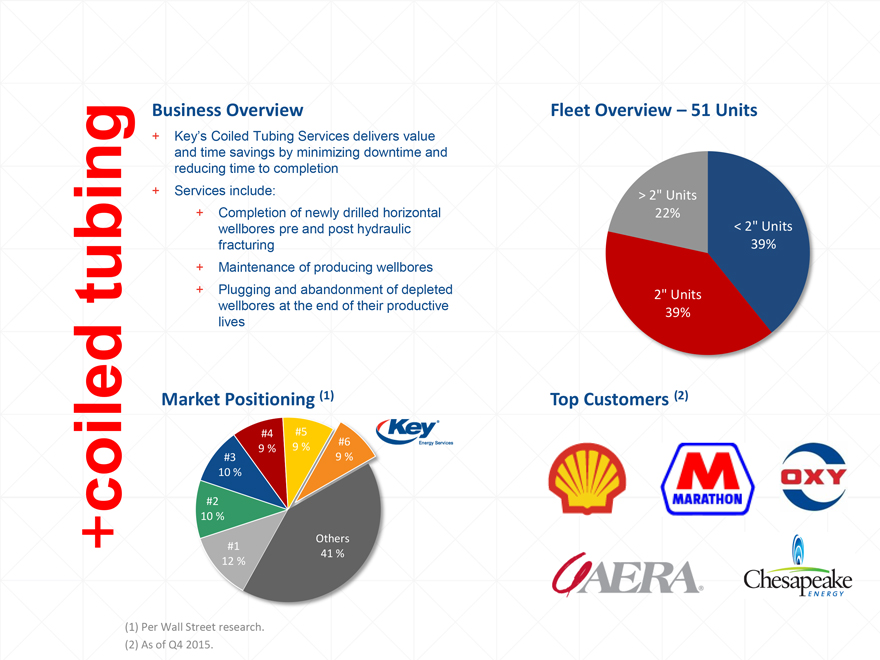
+coiled tubing
Business
Overview
+ Key’s Coiled Tubing Services delivers value and time savings by minimizing downtime and reducing time to completion
+ Services include:
+ Completion of newly drilled horizontal wellbores pre and post hydraulic
fracturing
+ Maintenance of producing wellbores
+ Plugging and abandonment of
depleted wellbores at the end of their productive lives
Market Positioning (1)
#1 12% #2 10% #3 10% #4 9% #5 9% #6 9% Others 41%
Key Energy Services
(1) Per Wall Street research.
(2) As of Q4 2015.
Fleet Overview – 51 Units
> 2” Units
22%
< 2” Units
39%
2” Units
39%
Top Customers (2)
MARATHON
OXY
GAERA
Chesapeake ENERGY
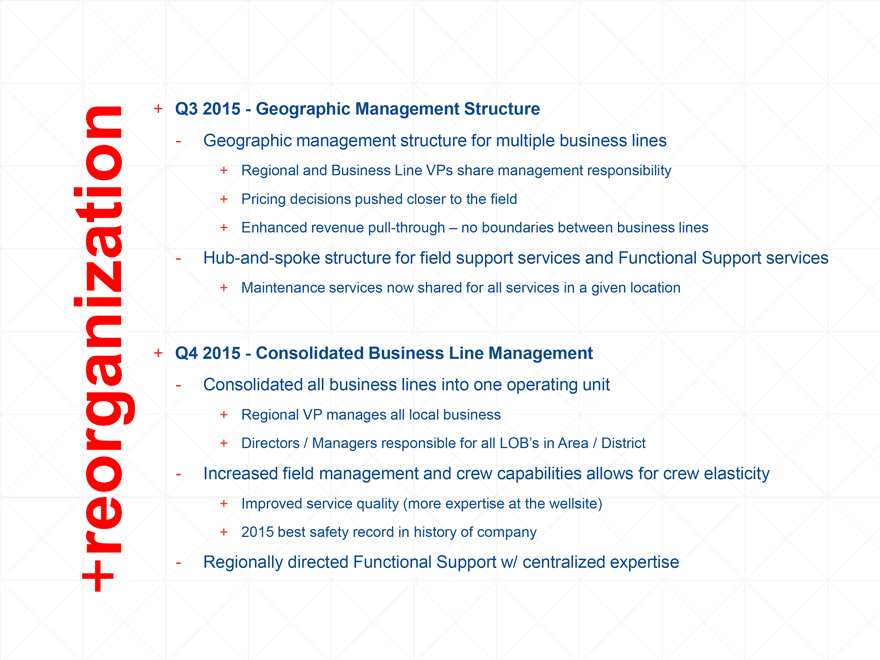
+reorganization
+ Q3 2015
- Geographic Management Structure
- Geographic management structure for multiple business lines
+ Regional and Business Line VPs share management responsibility
+ Pricing decisions pushed
closer to the field
+ Enhanced revenue pull-through – no boundaries between business lines
- Hub-and-spoke structure for field support services and Functional Support services
+
Maintenance services now shared for all services in a given location
+ Q4 2015 - Consolidated Business Line Management
- Consolidated all business lines into one operating unit
+ Regional VP manages all local
business
+ Directors / Managers responsible for all LOB’s in Area / District
- Increased field management and crew capabilities allows for crew elasticity
+ Improved
service quality (more expertise at the wellsite)
+ 2015 best safety record in history of company
- Regionally directed Functional Support w/ centralized expertise
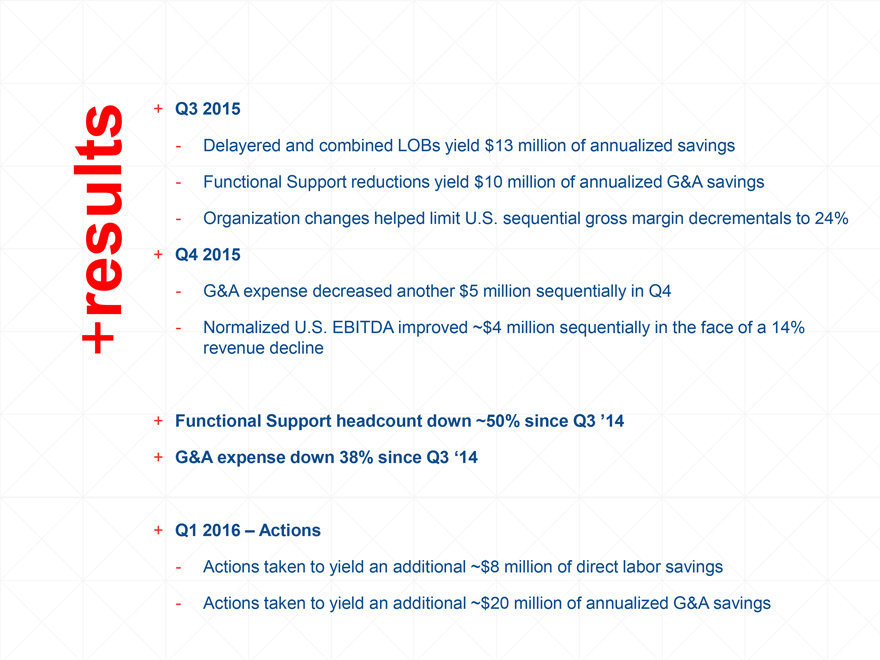
+results
+ Q3 2015
- Delayered and combined LOBs yield $13 million of annualized savings
-
Functional Support reductions yield $10 million of annualized G&A savings
- Organization changes helped limit U.S. sequential gross margin decrementals to 24%
+ Q4 2015
- G&A expense decreased another $5 million sequentially in Q4
- Normalized U.S. EBITDA improved ~$4 million sequentially in the face of a 14% revenue decline
+ Functional Support headcount down ~50% since Q3 ’14
+ G&A expense down 38% since Q3
‘14
+ Q1 2016 – Actions
- Actions taken to yield an additional ~$8
million of direct labor savings
- Actions taken to yield an additional ~$20 million of annualized G&A savings
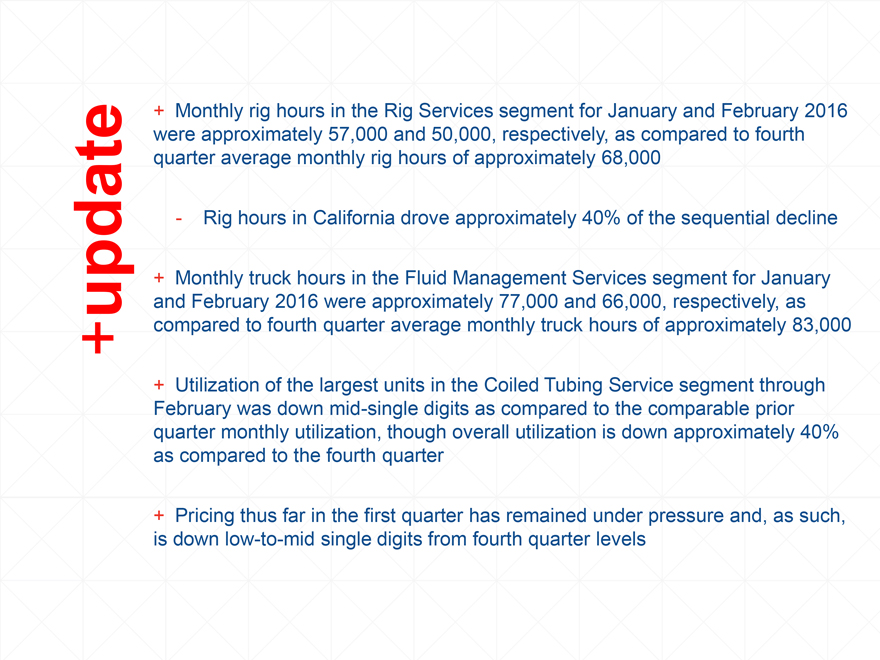
+update
+ Monthly rig
hours in the Rig Services segment for January and February 2016 were approximately 57,000 and 50,000, respectively, as compared to fourth quarter average monthly rig hours of approximately 68,000
- Rig hours in California drove approximately 40% of the sequential decline
+ Monthly truck
hours in the Fluid Management Services segment for January and February 2016 were approximately 77,000 and 66,000, respectively, as compared to fourth quarter average monthly truck hours of approximately 83,000
+ Utilization of the largest units in the Coiled Tubing Service segment through February was down mid-single digits as compared to the comparable prior quarter monthly utilization,
though overall utilization is down approximately 40% as compared to the fourth quarter
+ Pricing thus far in the first quarter has remained under pressure and, as
such, is down low-to-mid single digits from fourth quarter levels
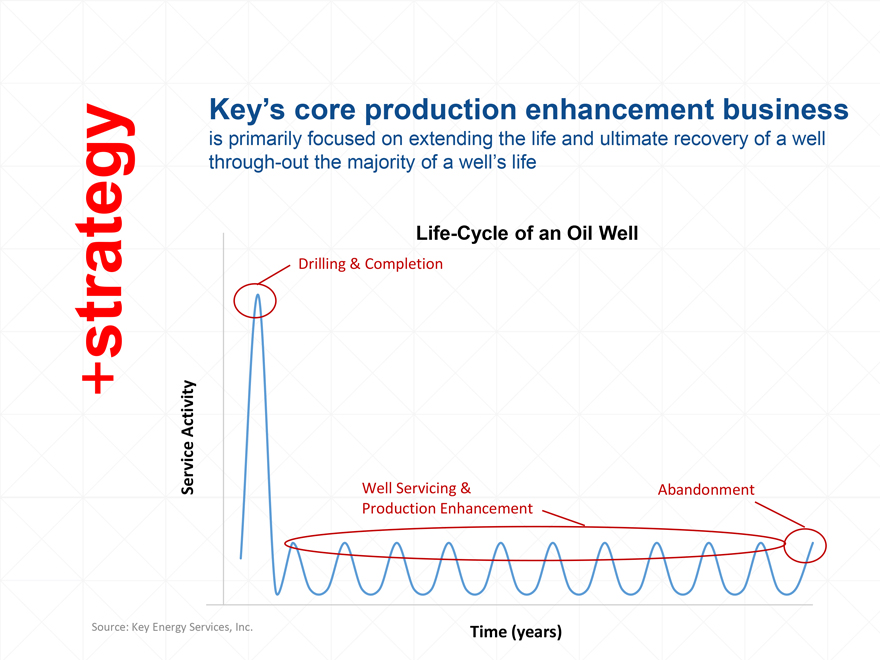
+ strategy
Key’s
core production enhancement business
is primarily focused on extending the life and ultimate recovery of a well through-out the majority of a well’s life
Life-Cycle of an Oil Well
Service Activity
Drilling & Completion
Well Servicing & Production Enhancement
Abandonment
Time (years)
Source: Key Energy Services, Inc.
+ economics
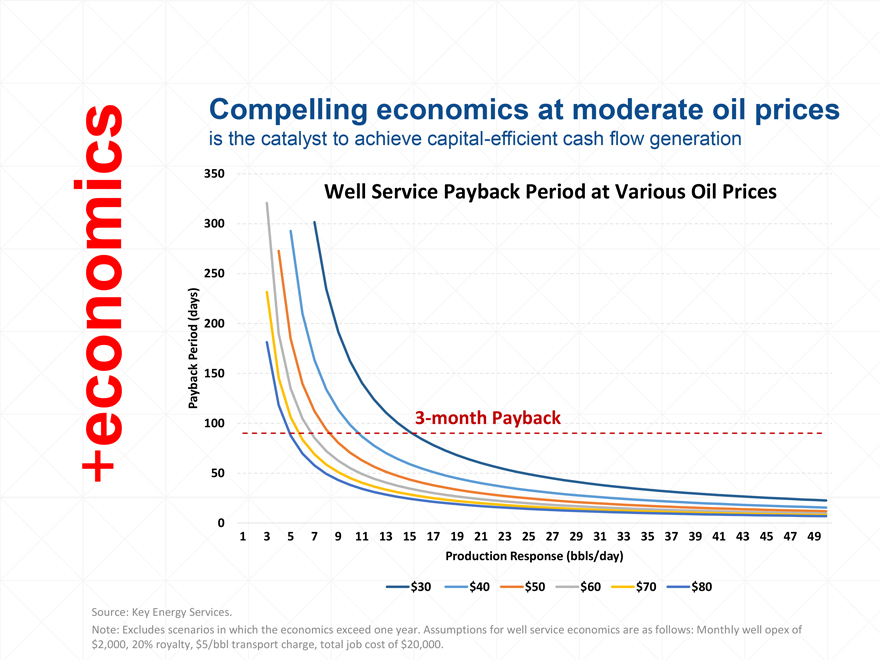
Compelling
economics at moderate oil prices is the catalyst to achieve capital-efficient cash flow generation
Well Service Payback Period at Various Oil Prices
Payback Period (days)
0 50 100 150 200 250 300 350
3-month Payback
1 3 5 7 9 11 13 15 17 19 21 23 25 27 29 31 33 35 37 39 41 43 45 47 49
Production Response (bbls/day)
$30 $40 $50 $60 $70 $80
Source: Key Energy Services.
Note: Excludes scenarios in which the economics exceed one year.
Assumptions for well service economics are as follows: Monthly well opex of $2,000, 20% royalty, $5/bbl transport charge, total job cost of $20,000.
+conventional
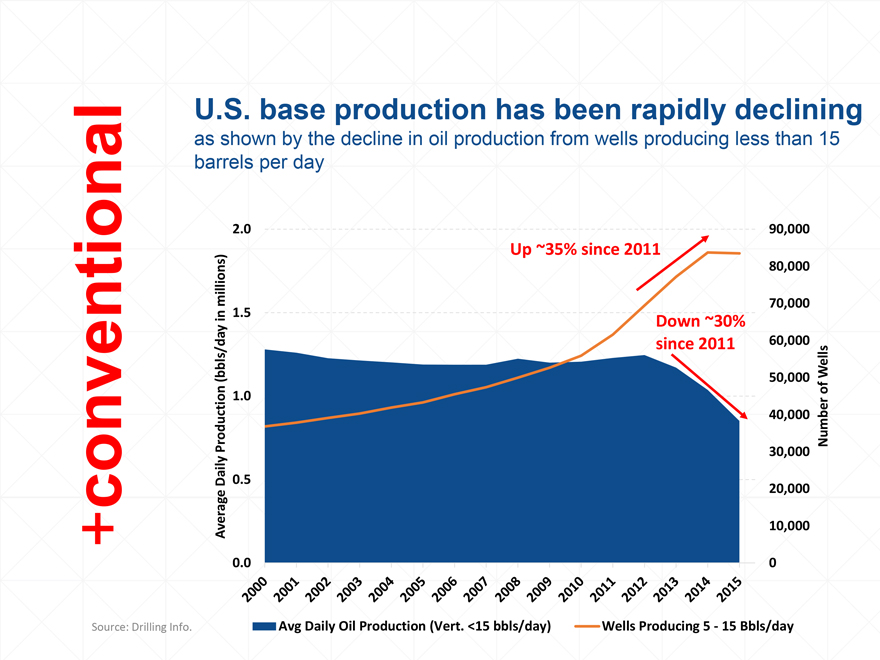
U.S. base
production has been rapidly declining
as shown by the decline in oil production from wells producing less than 15 barrels per day
Average Daily Production (bbls/day in millions)
0.0 0.5 1.0 1.5 2.0
Up ~35% since 2011
Down ~30% since 2011
0 10,000 20,000 30,000 40,000 50,000 60,000 70,000 80,000 90,000
Number of Wells
2000 2001 2002 2003 2004 2005 2006 2007 2008 2009 2010 2011 2012 2014 2015
Avg Daily Oil
Production (Vert. <15 bbls/day) Wells Producing 5 - 15 Bbls/day
Source: Drilling Info.
+horizontal
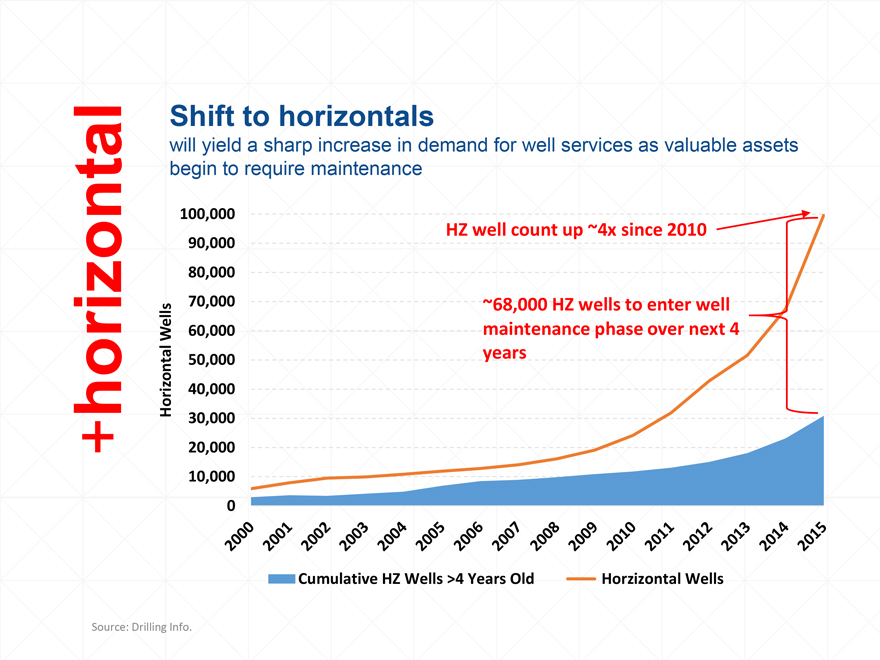
Shift to
horizontals
will yield a sharp increase in demand for well services as valuable assets begin to require maintenance
Horizontal Wells
0 10,000 20,000 30,000 40,000 50,000 60,000 70,000 80,000 90,000 100,000
HZ well count up ~4x since 2010
~68,000 HZwells to enter well maintenance
phase over next 4 years
2000 2001 2002 2003 2004 2005 2006 2007 2008 2009 2010 2011 2012 2014 2015
Cumulative HZ Wells >4 Years Old Horzizontal Wells
Source: Drilling Info.
+balance sheet
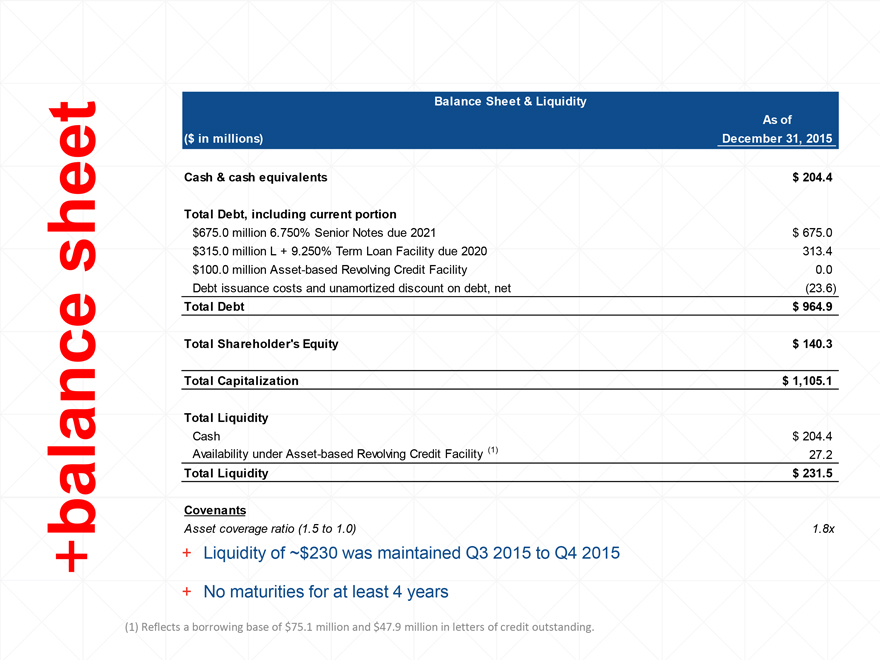
Balance
Sheet & Liquidity
($ in millions) As of December 31, 2015
Cash & cash
equivalents $ 204.4
Total Debt, including current portion
$675.0 million
6.750% Senior Notes due 2021 $ 675.0
$315.0 million L + 9.250% Term Loan Facility due 2020 313.4
$100.0 million Asset-based Revolving Credit Facility 0.0
Debt issuance costs and unamortized
discount on debt, net (23.6)
Total Debt $ 964.9
Total Shareholder’s
Equity $ 140.3
Total Capitalization $ 1,105.1
Total Liquidity
Cash $ 204.4
Availability under Asset-based Revolving Credit Facility (1) 27.2
Total Liquidity $ 231.5
Covenants
Asset coverage ratio (1.5 to 1.0) 1.8x
+ Liquidity of ~$230 was maintained Q3 2015 to Q4 2015
+ No maturities for at least 4 years
(1) Reflects a borrowing base of $75.1
million and $47.9 million in letters of credit outstanding.
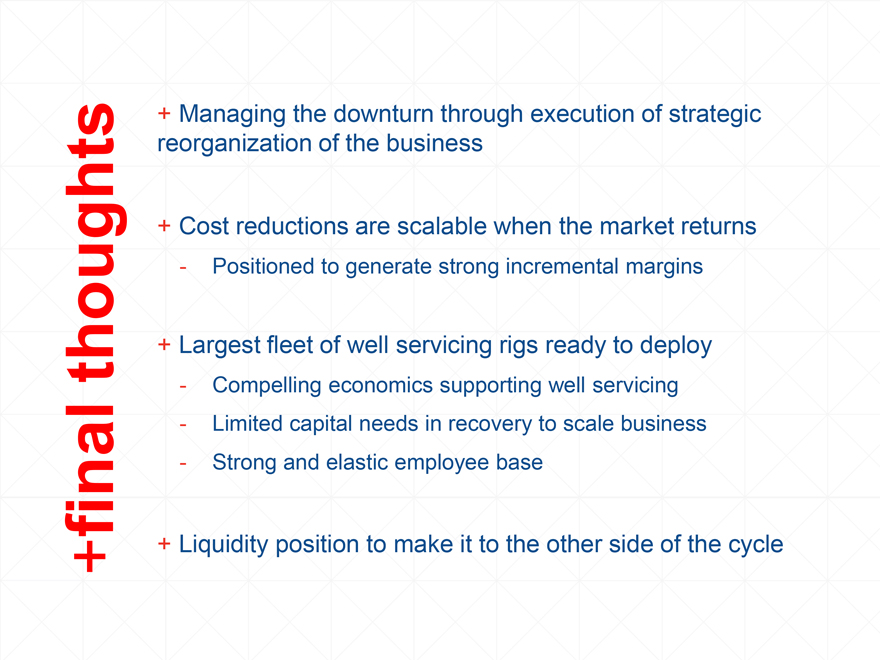
+ final thoughts
+
Managing the downturn through execution of strategic reorganization of the business
+ Cost reductions are scalable when the market returns
- Positioned to generate strong incremental margins
+ Largest fleet of well servicing rigs
ready to deploy
- Compelling economics supporting well servicing
- Limited
capital needs in recovery to scale business
- Strong and elastic employee base
+ Liquidity position to make it to the other side of the cycle

Get More
WITH KEY
ENERGY SERVICES
Key