Attached files
| file | filename |
|---|---|
| 8-K - 8-K - NABORS INDUSTRIES LTD | a16-6268_28k.htm |
Exhibit 99.1
Scotia Howard Weil 44th Annual Energy Conference March 21-23, 2016 Presented by: Anthony G. Petrello, Chairman & CEO
2 Forward-Looking Statements We often discuss expectations regarding our markets, demand for our products and services, and our future performance in our annual and quarterly reports, press releases, and other written and oral statements. Such statements, including statements in this document incorporated by reference that relate to matters that are not historical facts are “forward-looking statements” within the meaning of the safe harbor provisions of Section 27A of the Securities Act of 1933 and Section 21E of the Securities Exchange Act of 1934. These “forward-looking statements” are based on our analysis of currently available competitive, financial and economic data and our operating plans. They are inherently uncertain, and investors must recognize that events and actual results could turn out to be significantly different from our expectations. Factors to consider when evaluating these forward-looking statements include, but are not limited to: fluctuations and volatility in worldwide prices and demand for natural gas and oil; fluctuations in levels of natural gas and oil exploration and development activities; fluctuations in the demand for our services; competitive and technological changes and other developments in the oilfield services industry; changes in the market value of investments accounted for using the equity method of accounting; the existence of operating risks inherent in the oilfield services industry; the possibility of changes in tax laws and other laws and regulations; the possibility of political or economic instability, civil disturbance, war or acts of terrorism in any of the countries in which we ---do business; and general economic conditions including the capital and credit markets. Our businesses depend, to a large degree, on the level of spending by oil and gas companies for exploration, development and production activities. Therefore, a continued decrease in the price of natural gas or oil, which could have a material impact on exploration and production activities, could also materially affect our financial position, results of operations and cash flows. The above description of risks and uncertainties is by no means all inclusive, but is designed to highlight what we believe are important factors to consider.
3 Market Update Balance Sheet and Liquidity C&J Energy Services Investment Technology Initiatives Presentation Overview
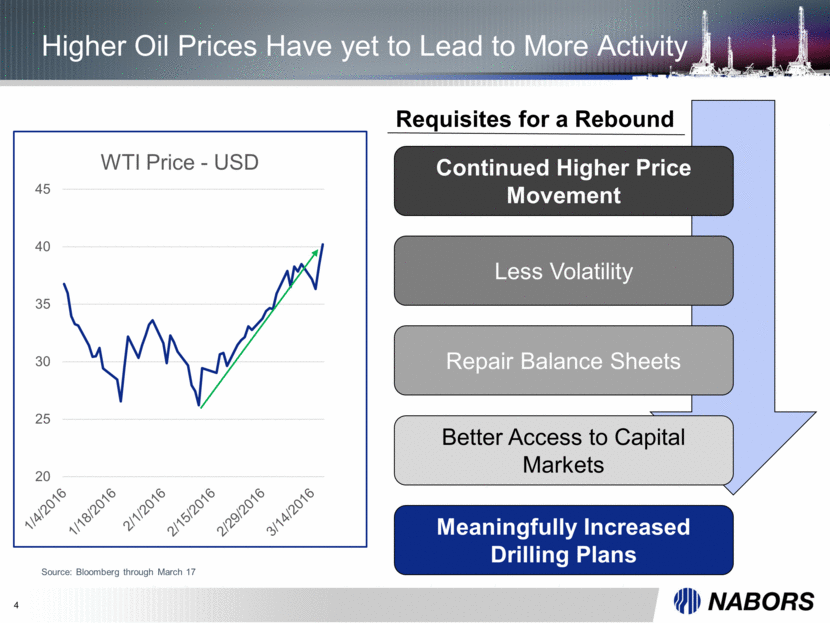
Continued Higher Price Movement Less Volatility Repair Balance Sheets Better Access to Capital Markets Meaningfully Increased Drilling Plans 4 Higher Oil Prices Have yet to Lead to More Activity Source: Bloomberg through March 17 Requisites for a Rebound 20 25 30 35 40 45 WTI Price - USD
5 Market Overview: Global Source: BHI Rig Count as of March 18, Nabors Internal Global Asset Positioning Supporting Rig Count Vs. Competitors Rig Count Trend Since 3Q14 Industry U.S. L48: -76% NBR INT’L: -11% NBR U.S. L48: -79% Nabors Global: -56% -90% -80% -70% -60% -50% -40% -30% -20% -10% 0% 10% 20% Oct-14 Dec-14 Feb-15 Apr-15 Jun-15 Aug-15 Oct-15 Dec-15 Feb-16

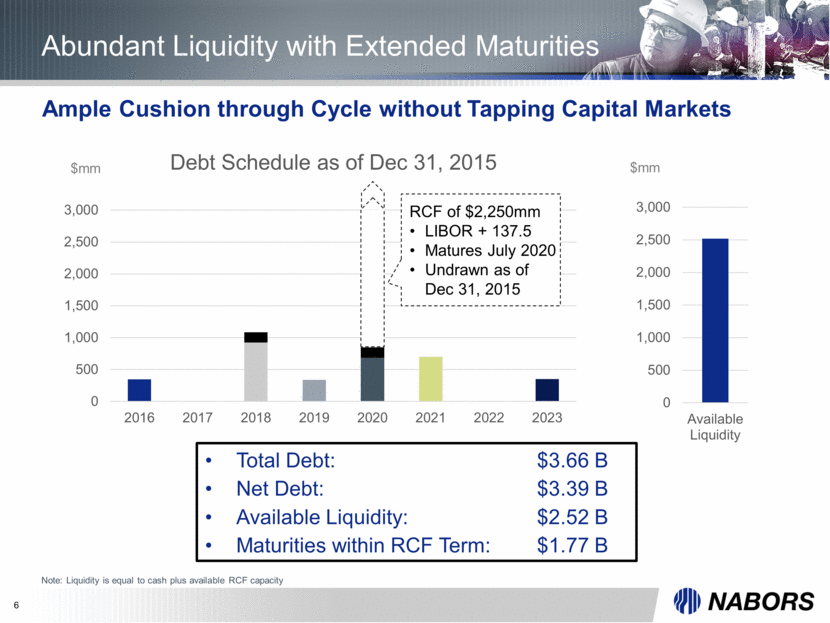
6 Abundant Liquidity with Extended Maturities Ample Cushion through Cycle without Tapping Capital Markets Total Debt: $3.66 B Net Debt: $3.39 B Available Liquidity: $2.52 B Maturities within RCF Term: $1.77 B $mm RCF of $2,250mm LIBOR + 137.5 Matures July 2020 Undrawn as of Dec 31, 2015 Note: Liquidity is equal to cash plus available RCF capacity 0 500 1,000 1,500 2,000 2,500 3,000 2016 2017 2018 2019 2020 2021 2022 2023 Debt Schedule as of Dec 31, 2015 $mm 0 500 1,000 1,500 2,000 2,500 3,000 Available Liquidity
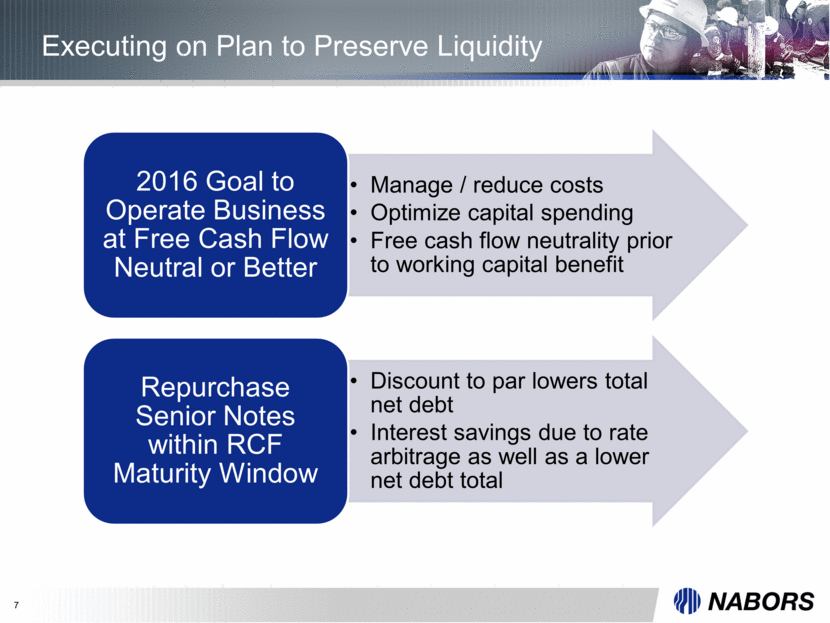
7 Executing on Plan to Preserve Liquidity Manage / reduce costs Optimize capital spending Free cash flow neutrality prior to working capital benefit 2016 Goal to Operate Business at Free Cash Flow Neutral or Better Discount to par lowers total net debt Interest savings due to rate arbitrage as well as a lower net debt total Repurchase Senior Notes within RCF Maturity Window
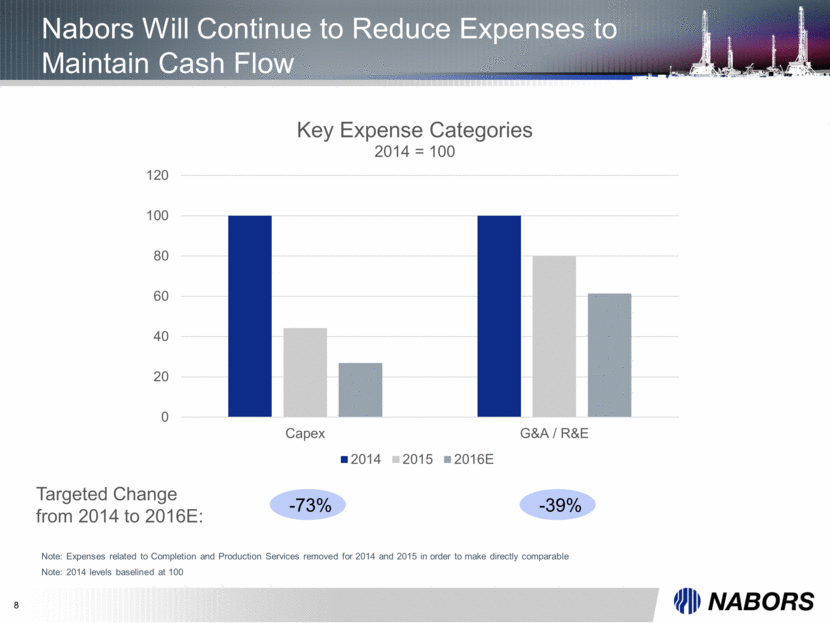
8 Nabors Will Continue to Reduce Expenses to Maintain Cash Flow Note: Expenses related to Completion and Production Services removed for 2014 and 2015 in order to make directly comparable Note: 2014 levels baselined at 100 Targeted Change from 2014 to 2016E: -73% -39% 0 20 40 60 80 100 120 Capex G&A / R&E Key Expense Categories 2014 = 100 2014 2015 2016E
9 Committed to Maximizing Value of C&J Investment Founder and visionary Josh Comstock assembled a talented, successful management team with a strong operating history We merged our Completion & Production Services business with C&J Energy Services in March, 2015 Retain approximately 52% ownership of the combined company We will assess and evaluate options as the market evolves Our guiding principle is to do what is right for Nabors shareholders, within the confines of appropriately managing the risk to Nabors
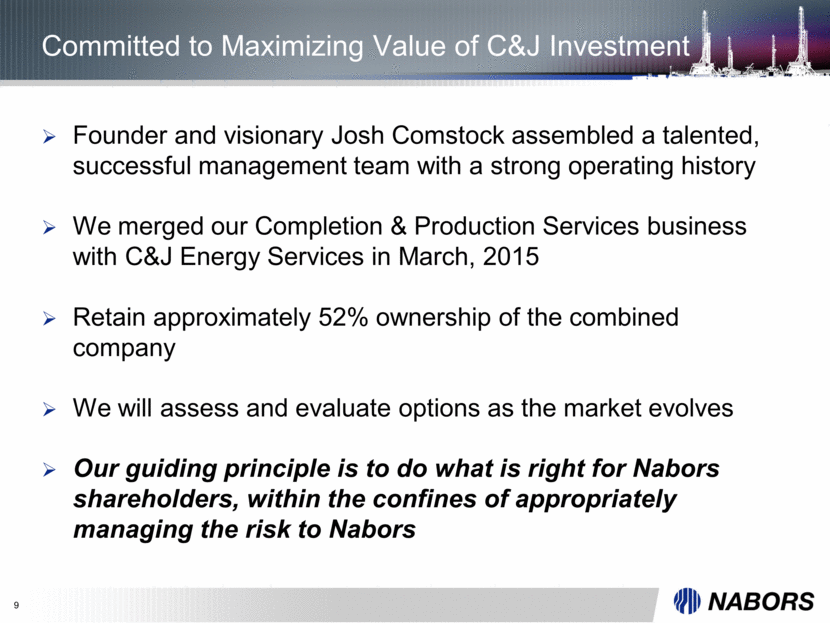
10 PACE®-X Rig The Leading Solution for High Density Pad Drilling
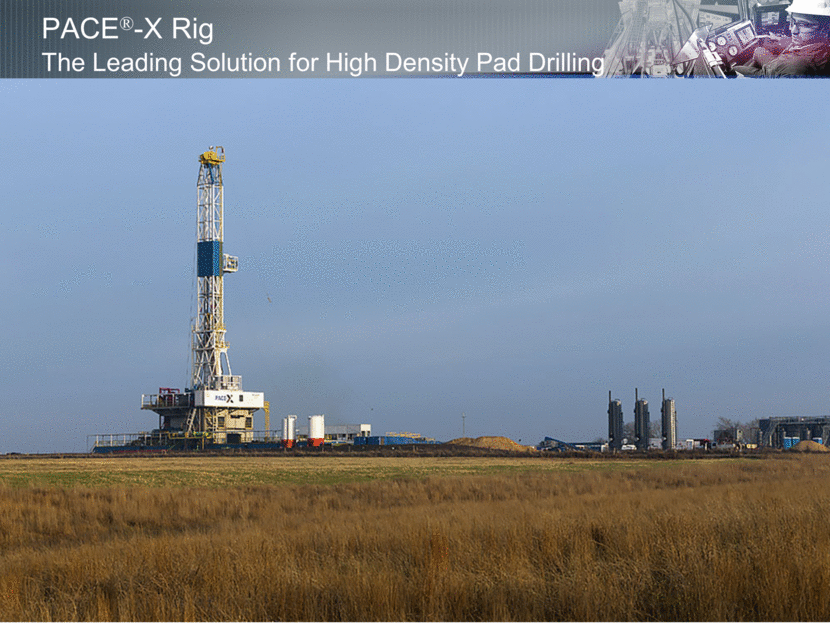
11 PACE®-X Rig Continuing to Revolutionize Multi-Well Pad Drilling Faster Drilling Times Repeatedly under 9 days from Spud to TD Recent well under 6 days Faster Move Times 5 days when introduced Now consistently 3 days or fewer
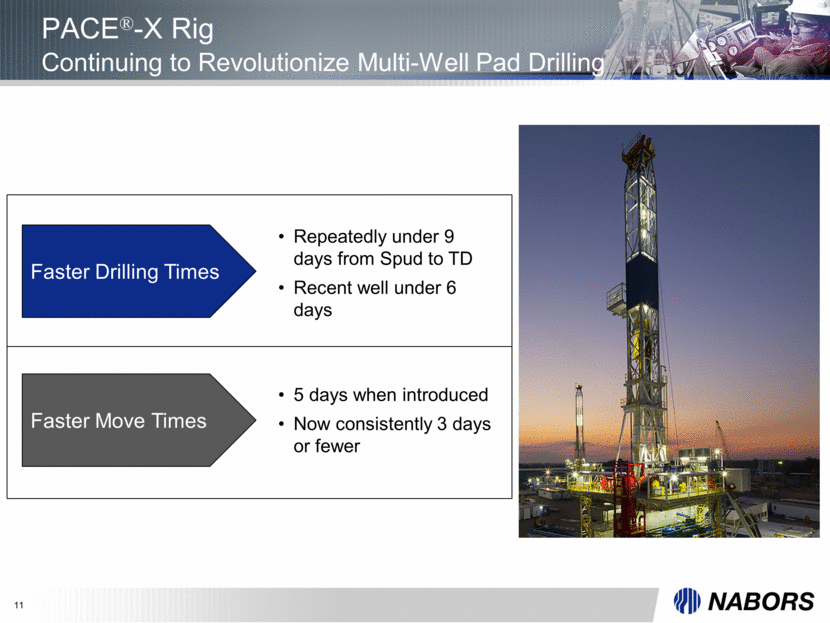
12 M800 Features 1500HP Walking Rig (3000HP Drawworks) 800–kip hookload @ 8 lines, rated to 25,000 ft Three 7,500 PSI pumps with 4 engines RigtelligentTM controls – advanced software, sensing, decoding Highly mobile pad-to-pad, integrated Top Drive and Block Targets both Lower 48 and International markets First unit now complete
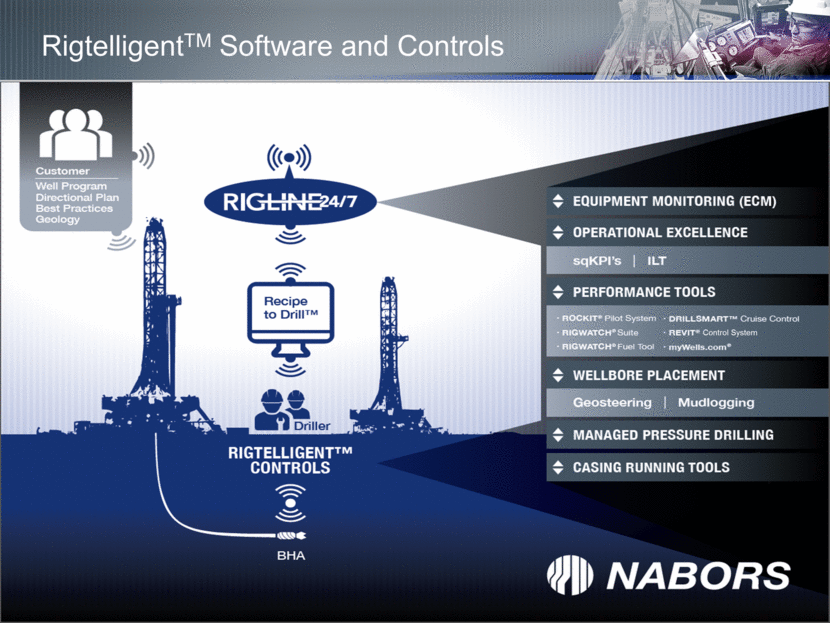
13 RigtelligentTM Software and Controls Control System
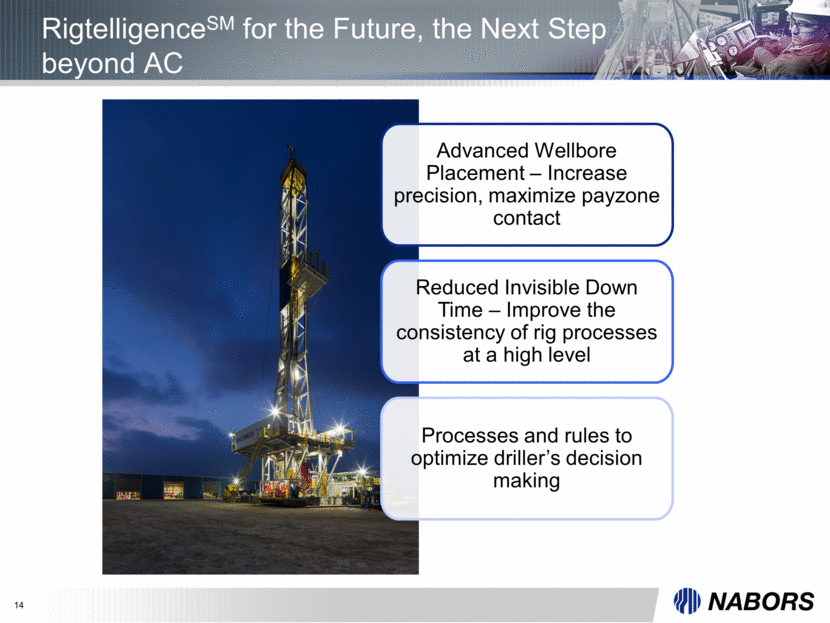
14 RigtelligenceSM for the Future, the Next Step beyond AC Advanced Wellbore Placement – Increase precision, maximize payzone contact Reduced Invisible Down Time – Improve the consistency of rig processes at a high level Processes and rules to optimize driller’s decision making
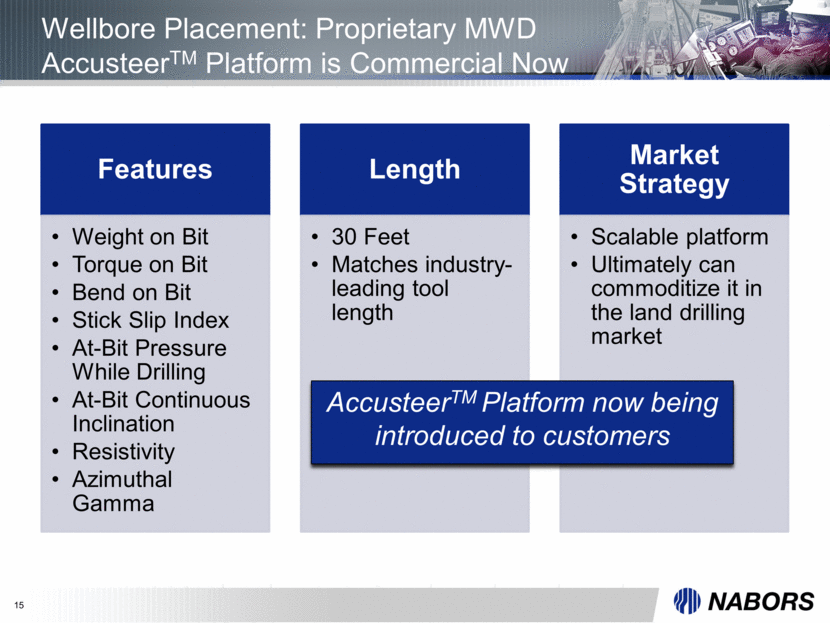
15 Wellbore Placement: Proprietary MWD AccusteerTM Platform is Commercial Now AccusteerTM Platform now being introduced to customers Features Weight on Bit Torque on Bit Bend on Bit Stick Slip Index At-Bit Pressure While Drilling At-Bit Continuous Inclination Resistivity Azimuthal Gamma Length 30 Feet Matches industry-leading tool length Market Strategy Scalable platform Ultimately can commoditize it in the land drilling market
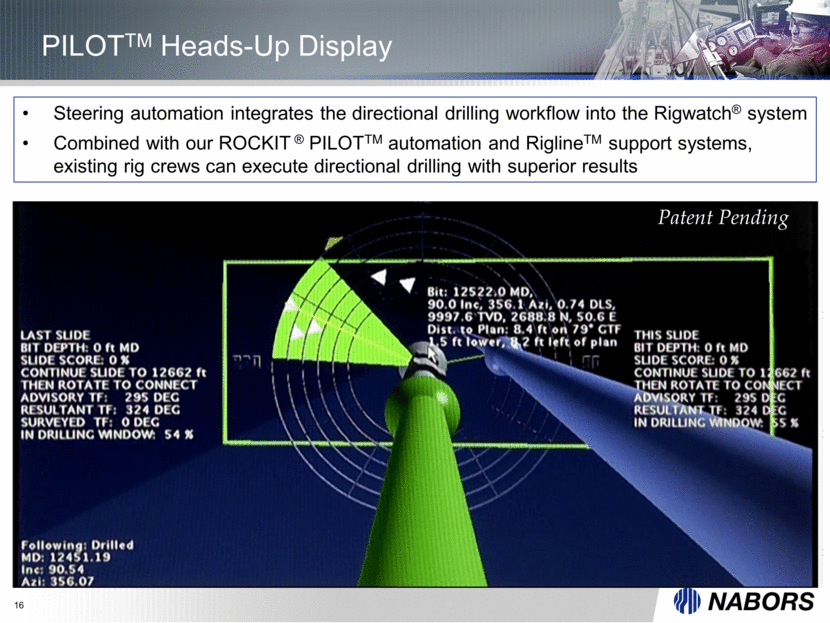
16 PILOTTM Heads-Up Display Steering automation integrates the directional drilling workflow into the Rigwatch® system Combined with our ROCKIT ® PILOTTM automation and RiglineTM support systems, existing rig crews can execute directional drilling with superior results Patent Pending
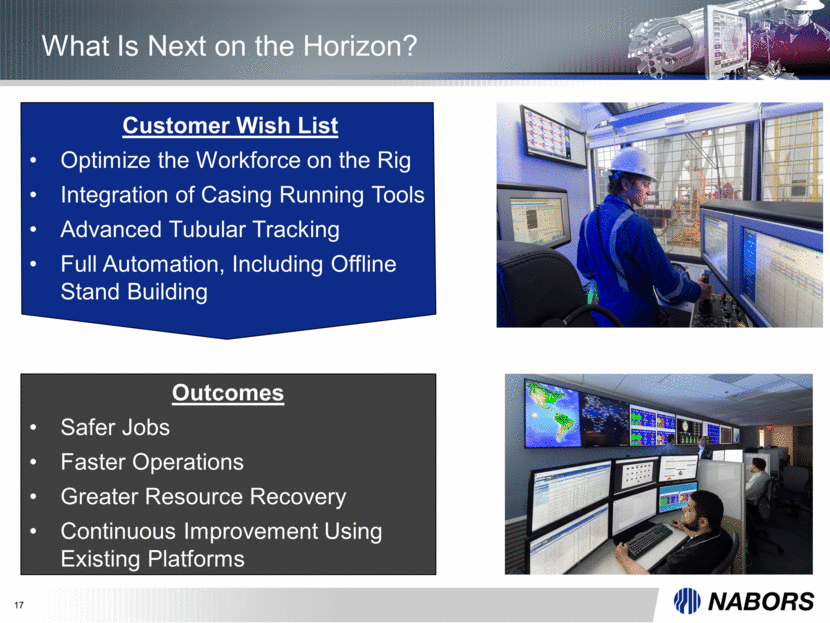
17 What Is Next on the Horizon? Customer Wish List Optimize the Workforce on the Rig Integration of Casing Running Tools Advanced Tubular Tracking Full Automation, Including Offline Stand Building Outcomes Safer Jobs Faster Operations Greater Resource Recovery Continuous Improvement Using Existing Platforms
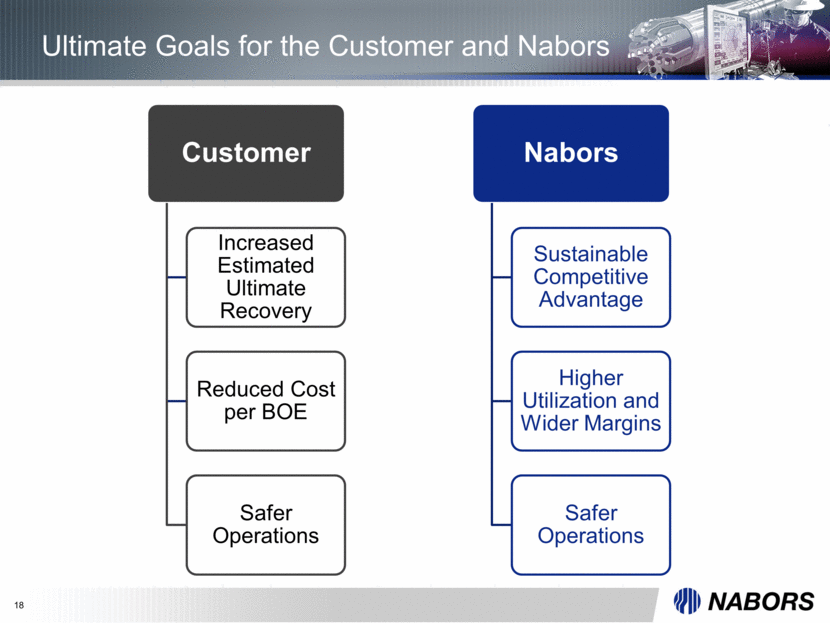
18 Ultimate Goals for the Customer and Nabors Customer Increased Estimated Ultimate Recovery Reduced Cost per BOE Safer Operations Nabors Sustainable Competitive Advantage Higher Utilization and Wider Margins Safer Operations
