Attached files
| file | filename |
|---|---|
| 8-K - 8-K - JPMORGAN CHINA REGION FUND, INC. | form8k-15508_jfc.htm |
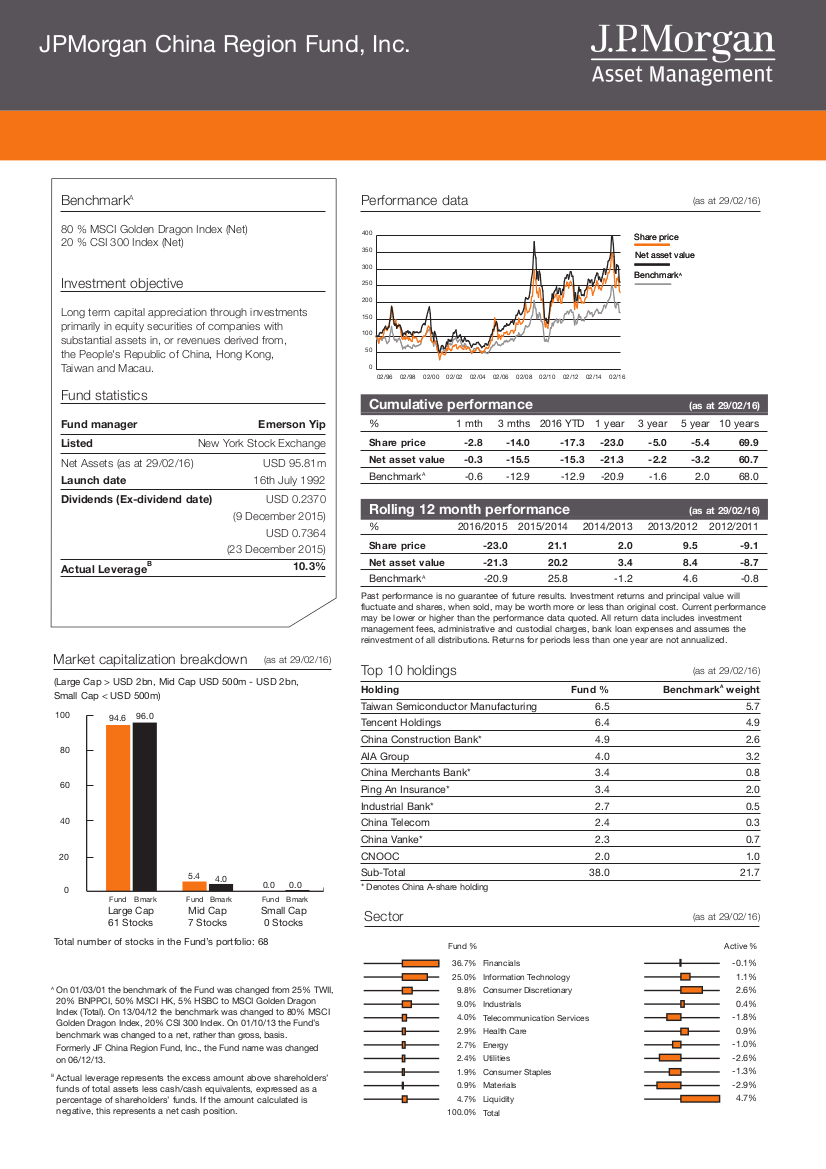
JPMorganChinaRegionFund,Inc.JPMorganChinaRegionFund,Inc. BenchmarkA Performance data (as at 29/02/16) 80 ! MSCI Golden Dragon Index (Net) 400 20 ! CSI 300 Index (Net) 350 300 Investment objective 250 200 Long term capital appreciation through investments 150 primarily in equity securities of companies with 100 substantial assets in, or revenues derived from, the People's Republic of China, Hong Kong, 50 Taiwan and Macau. 0 02/02 02/96 02/98 02/00 02/04 02/06 02/08 02/10 02/12 02/14 02/16 Fund statistics S SSh hha aar rre ee p ppr rri iic cce ee N NNet asset v et asset vet asset value aluealue Ben BenBenc cch hhm mma aar rrk kkA AA Cumulativeperformance(asat29/02/16) Fund manager Emerson Yip % 1 mth 3 mths 2016 YTD 1 year 3 year 5 year 10 years Listed New York Stock Exchange Share price -2.8 -14.0 -17.3 -23.0 -5.0 -5.4 69.9 Net asset value -0.3 -15.5 -15.3 -21.3 -2.2 -3.2 60.7 Net Assets (as at 29/02/16) USD 95.81m BenchmarkA -0.6 -12.9 -12.9 -20.9 -1.6 2.0 68.0 Launch date 16th July 1992 Dividends (Ex-dividend date) USD 0.2370 (9 December 2015) Rolling12monthperformance(asat29/02/16) % 2016/2015 2015/2014 2014/2013 2013/2012 2012/2011 USD 0.7364 Share price -23.0 21.1 2.0 9.5 -9.1 (23 December 2015) B Net asset value -21.3 20.2 3.4 8.4 -8.7 10.3% Actual Leverage BenchmarkA -20.9 25.8 -1.2 4.6 -0.8 Market capitalization breakdown (as at 29/02/16) (Large Cap > USD 2bn, Mid Cap USD 500m -USD 2bn, Small Cap USD 500m) 100 Past performance is no guarantee of future results. Investment returns and principal value will fluctuate and shares, when sold, may be worth more or less than original cost. Current performance may be lower or higher than the performance data quoted. All return data includes investment management fees, administrative and custodial charges, bank loan expenses and assumes the reinvestment of all distributions. Returns for periods less than one year are not annualized. Top 10 holdings (as at 29/02/16) Holding Fund ! BenchmarkA weight Taiwan Semiconductor Manufacturing 6.5 5.7 Tencent Holdings 6.4 4.9 China Construction Bank* 4.9 2.6 80 AIA Group 4.0 3.2 94.6 96.0 5.4 4.0 0.00.0 Fund Bmark Fund Bmark Fund Bmark China Merchants Bank* 3.4 0.8 60 Ping An Insurance* 3.4 2.0 Industrial Bank* 2.7 0.5 40 China Telecom 2.4 0.3 China Vanke* 2.3 0.7 CNOOC 2.0 1.0 20 Sub-Total 38.0 21.7 * Denotes China A-share holding 0 Large Cap Mid Cap Small Cap Sector (as at 29/02/16) 61 Stocks 7 Stocks 0 Stocks Total number of stocks in the Fund’s portfolio: 68 A On 01/03/01 the benchmark of the Fund was changed from 25% TWII, 20% BNPPCI, 50% MSCI HK, 5% HSBC to MSCI Golden Dragon Index (Total). On 13/04/12 the benchmark was changed to 80% MSCI Golden Dragon Index, 20% CSI 300 Index. On 01/10/13 the Fund’s benchmark was changed to a net, rather than gross, basis. Formerly JF China Region Fund, Inc., the Fund name was changed on 06/12/13. B Actual leverage represents the excess amount above shareholders’ funds of total assets less cash/cash equivalents, expressed as a percentage of shareholders’ funds. If the amount calculated is negative, this represents a net cash position. Fund % 36.7% 25.0% 9.8% 9.0% 4.0% 2.9% 2.7% 2.4% 1.9% 0.9% 4.7% 100.0% Financials Information Technology Consumer Discretionary Industrials Telecommunication Services Health Care Energy Utilities Consumer Staples Materials Liquidity Total Active % -0.1% 1.1% 2.6% 0.4% -1.8% 0.9% -1.0% -2.6% -1.3% -2.9% 4.7%
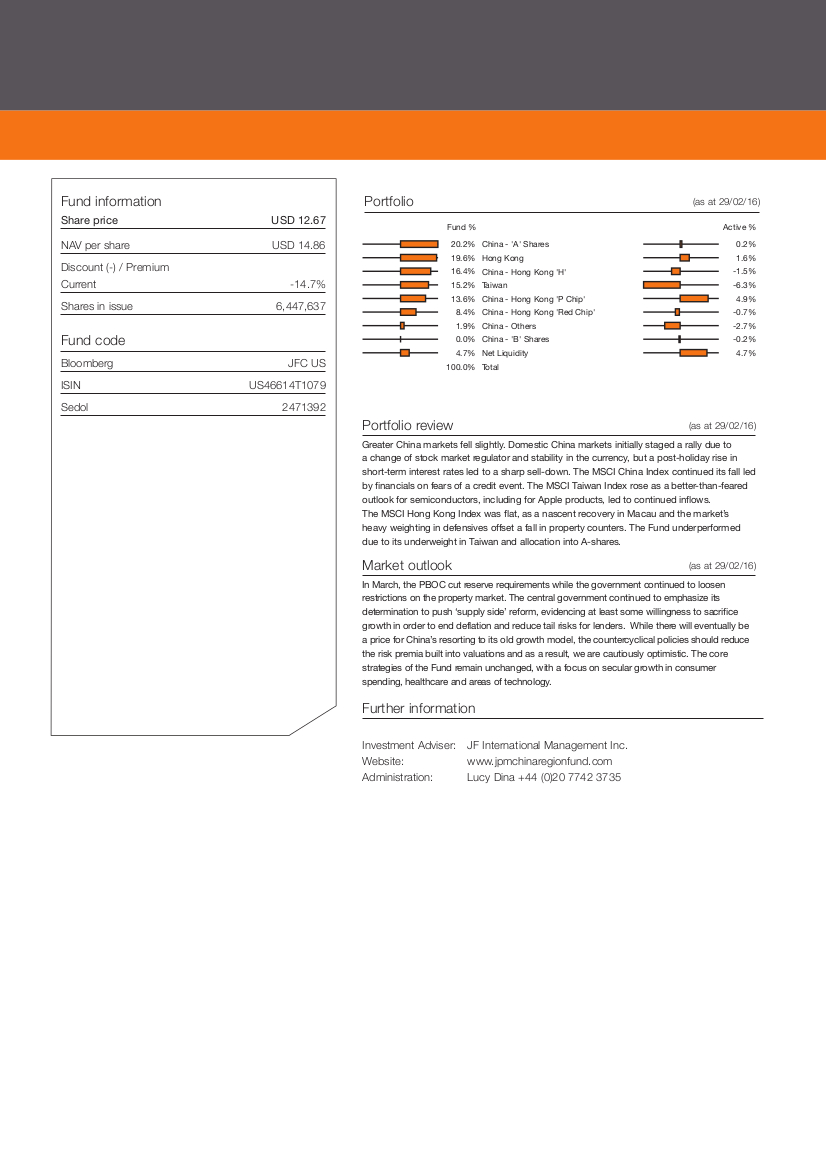
Fund information Portfolio (as at 29/02/16) Share price USD 12.67 NAV per share USD 14.86 Discount (-) / Premium Current -14.7! Shares in issue 6,447,637 Fund code Bloomberg JFC US ISIN US46614T1079 Sedol 2471392 Fund % 20.2% 19.6% 16.4% 15.2% 13.6% 8.4% 1.9% 0.0% 4.7% 100.0% Portfolio review China - 'A' Shares Hong Kong China - Hong Kong 'H' Taiwan China - Hong Kong 'P Chip' China - Hong Kong 'Red Chip' China - Others China - 'B' Shares Net Liquidity Total Active % 0.2% 1.6% -1.5% -6.3% 4.9% -0.7% -2.7% -0.2% 4.7% (as at 29/02/16) Greater China markets fell slightly. Domestic China markets initially staged a rally due to a change of stock market regulator and stability in the currency, but a post-holiday rise in short-term interest rates led to a sharp sell-down. The MSCI China Index continued its fall led by financials on fears of a credit event. The MSCI Taiwan Index rose as a better-than-feared outlook for semiconductors, including for Apple products, led to continued inflows. The MSCI Hong Kong Index was flat, as a nascent recovery in Macau and the market’s heavy weighting in defensives offset a fall in property counters. The Fund underperformed due to its underweight in Taiwan and allocation into A-shares. Market outlook (as at 29/02/16) In March, the PBOC cut reserve requirements while the government continued to loosen restrictions on the property market. The central government continued to emphasize its determination to push ‘supply side’ reform, evidencing at least some willingness to sacrifice growth in order to end deflation and reduce tail risks for lenders. While there will eventually be a price for China’s resorting to its old growth model, the countercyclical policies should reduce the risk premia built into valuations and as a result, we are cautiously optimistic. The core strategies of the Fund remain unchanged, with a focus on secular growth in consumer spending, healthcare and areas of technology. Further information Investment Adviser: JF International Management Inc. Website: www.jpmchinaregionfund.com Administration: Lucy Dina +44 (0)20 7742 3735
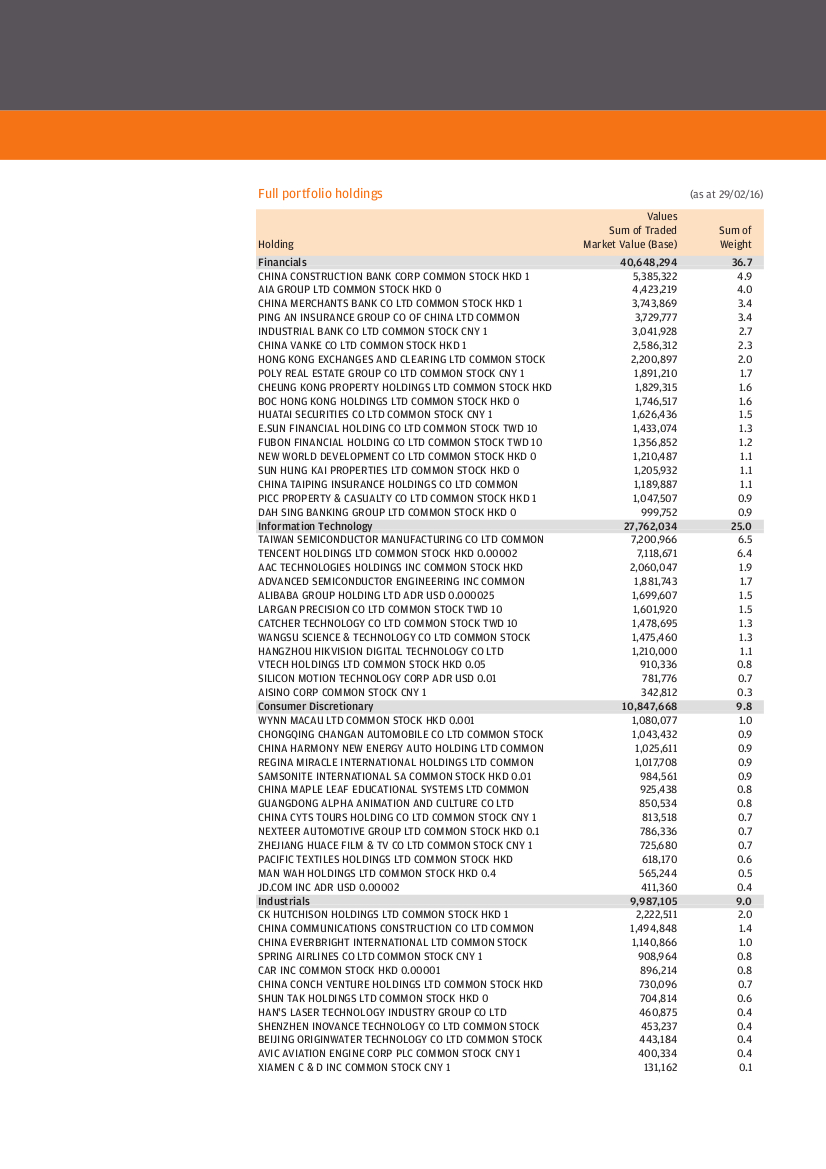
Full portfolio holdings (as at 29/02/16) Values Sum of Traded Sum of Holding Market Value (Base) Weight Financials 40,648,294 CHINA CONSTRUCTION BANK CORP COMMON STOCK HKD 1 AIA GROUP LTD COMMON STOCK HKD 0 CHINA MERCHANTS BANK CO LTD COMMON STOCK HKD 1 PING AN INSURANCE GROUP CO OF CHINA LTD COMMON INDUSTRIAL BANK CO LTD COMMON STOCK CNY 1 CHINA VANKE CO LTD COMMON STOCK HKD 1 HONG KONG EXCHANGES AND CLEARING LTD COMMON STOCK POLY REAL ESTATE GROUP CO LTD COMMON STOCK CNY 1 CHEUNG KONG PROPERTY HOLDINGS LTD COMMON STOCK HKD BOC HONG KONG HOLDINGS LTD COMMON STOCK HKD 0 HUATAI SECURITIES CO LTD COMMON STOCK CNY 1 E.SUN FINANCIAL HOLDING CO LTD COMMON STOCK TWD 10 FUBON FINANCIAL HOLDING CO LTD COMMON STOCK TWD 10 NEW WORLD DEVELOPMENT CO LTD COMMON STOCK HKD 0 SUN HUNG KAI PROPERTIES LTD COMMON STOCK HKD 0 CHINA TAIPING INSURANCE HOLDINGS CO LTD COMMON PICC PROPERTY & CASUALTY CO LTD COMMON STOCK HKD 1 DAH SING BANKING GROUP LTD COMMON STOCK HKD 0 5,385,322 4.9 4,423,219 4.0 3,743,869 3.4 3,729,777 3.4 3,041,928 2.7 2,586,312 2.3 2,200,897 2.0 1,891,210 1.7 1,829,315 1.6 1,746,517 1.6 1,626,436 1.5 1,433,074 1.3 1,356,852 1.2 1,210,487 1.1 1,205,932 1.1 1,189,887 1.1 1,047,507 0.9 999,752 0.9 Information Technology 27,762,034 25.0 TAIWAN SEMICONDUCTOR MANUFACTURING CO LTD COMMON TENCENT HOLDINGS LTD COMMON STOCK HKD 0.00002 AAC TECHNOLOGIES HOLDINGS INC COMMON STOCK HKD ADVANCED SEMICONDUCTOR ENGINEERING INC COMMON ALIBABA GROUP HOLDING LTD ADR USD 0.000025 LARGAN PRECISION CO LTD COMMON STOCK TWD 10 CATCHER TECHNOLOGY CO LTD COMMON STOCK TWD 10 WANGSU SCIENCE & TECHNOLOGY CO LTD COMMON STOCK HANGZHOU HIKVISION DIGITAL TECHNOLOGY CO LTD VTECH HOLDINGS LTD COMMON STOCK HKD 0.05 SILICON MOTION TECHNOLOGY CORP ADR USD 0.01 AISINO CORP COMMON STOCK CNY 1 7,200,966 6.5 7,118,671 6.4 2,060,047 1.9 1,881,743 1.7 1,699,607 1.5 1,601,920 1.5 1,478,695 1.3 1,475,460 1.3 1,210,000 1.1 910,336 0.8 781,776 0.7 342,812 0.3 Consumer Discretionary 10,847,668 9.8 WYNN MACAU LTD COMMON STOCK HKD 0.001 CHONGQING CHANGAN AUTOMOBILE CO LTD COMMON STOCK CHINA HARMONY NEW ENERGY AUTO HOLDING LTD COMMON REGINA MIRACLE INTERNATIONAL HOLDINGS LTD COMMON SAMSONITE INTERNATIONAL SA COMMON STOCK HKD 0.01 CHINA MAPLE LEAF EDUCATIONAL SYSTEMS LTD COMMON GUANGDONG ALPHA ANIMATION AND CULTURE CO LTD CHINA CYTS TOURS HOLDING CO LTD COMMON STOCK CNY 1 NEXTEER AUTOMOTIVE GROUP LTD COMMON STOCK HKD 0.1 ZHEJIANG HUACE FILM & TV CO LTD COMMON STOCK CNY 1 PACIFIC TEXTILES HOLDINGS LTD COMMON STOCK HKD MAN WAH HOLDINGS LTD COMMON STOCK HKD 0.4 JD.COM INC ADR USD 0.00002 1,080,077 1.0 1,043,432 0.9 1,025,611 0.9 1,017,708 0.9 984,561 0.9 925,438 0.8 850,534 0.8 813,518 0.7 786,336 0.7 725,680 0.7 618,170 0.6 565,244 0.5 411,360 0.4 Industrials 9,987,105 CK HUTCHISON HOLDINGS LTD COMMON STOCK HKD 1 CHINA COMMUNICATIONS CONSTRUCTION CO LTD COMMON CHINA EVERBRIGHT INTERNATIONAL LTD COMMON STOCK SPRING AIRLINES CO LTD COMMON STOCK CNY 1 CAR INC COMMON STOCK HKD 0.00001 CHINA CONCH VENTURE HOLDINGS LTD COMMON STOCK HKD SHUN TAK HOLDINGS LTD COMMON STOCK HKD 0 HAN'S LASER TECHNOLOGY INDUSTRY GROUP CO LTD SHENZHEN INOVANCE TECHNOLOGY CO LTD COMMON STOCK BEIJING ORIGINWATER TECHNOLOGY CO LTD COMMON STOCK AVIC AVIATION ENGINE CORP PLC COMMON STOCK CNY 1 XIAMEN C & D INC COMMON STOCK CNY 1 2,222,511 2.0 1,494,848 1.4 1,140,866 1.0 908,964 0.8 896,214 0.8 730,096 0.7 704,814 0.6 460,875 0.4 453,237 0.4 443,184 0.4 400,334 0.4 131,162 0.1
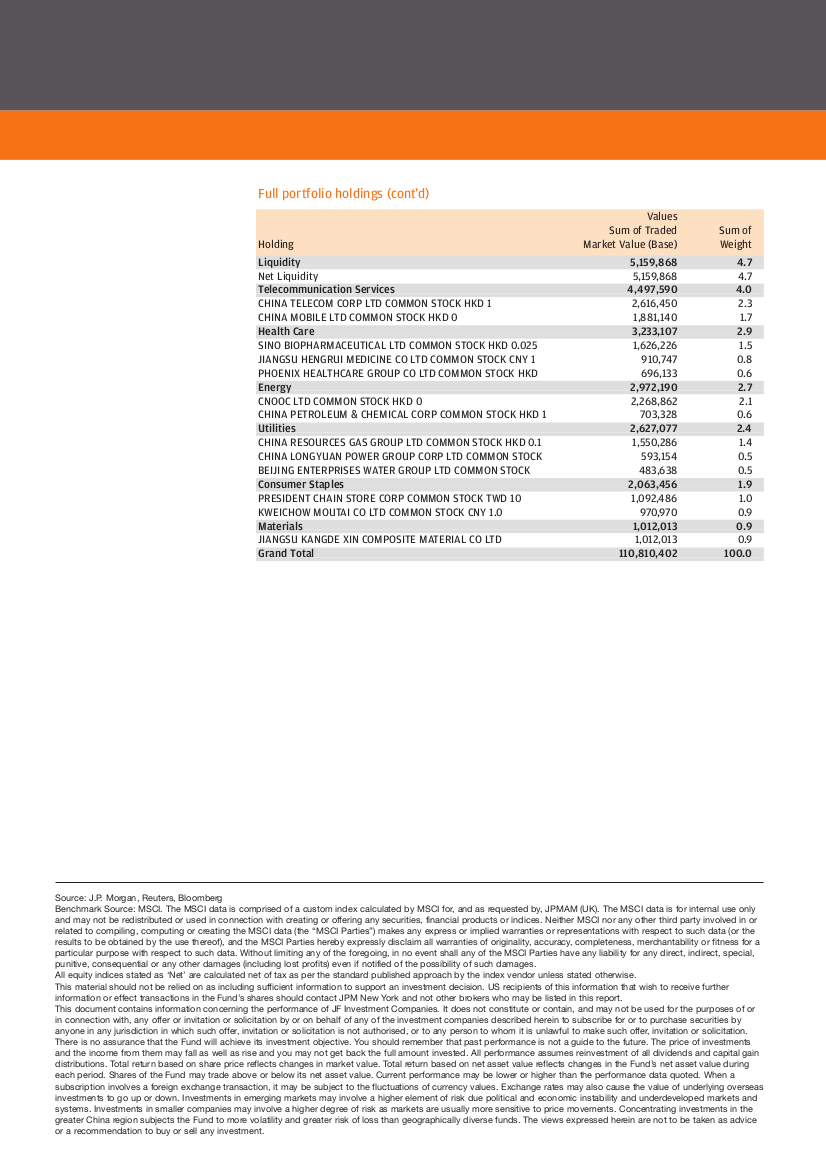
Full portfolio holdings (cont’d) Values Sum of Traded Sum of Holding Market Value (Base) Weight Liquidity 5,159,868 4.7 Net Liquidity 5,159,868 4.7 Telecommunication Services 4,497,590 4.0 CHINA TELECOM CORP LTD COMMON STOCK HKD 1 2,616,450 2.3 CHINA MOBILE LTD COMMON STOCK HKD 0 1,881,140 1.7 Health Care 3,233,107 2.9 SINO BIOPHARMACEUTICAL LTD COMMON STOCK HKD 0.025 1,626,226 1.5 JIANGSU HENGRUI MEDICINE CO LTD COMMON STOCK CNY 1 910,747 0.8 PHOENIX HEALTHCARE GROUP CO LTD COMMON STOCK HKD 696,133 0.6 Energy 2,972,190 2.7 CNOOC LTD COMMON STOCK HKD 0 2,268,862 2.1 CHINA PETROLEUM & CHEMICAL CORP COMMON STOCK HKD 1 703,328 0.6 Utilities 2,627,077 2.4 CHINA RESOURCES GAS GROUP LTD COMMON STOCK HKD 0.1 1,550,286 1.4 CHINA LONGYUAN POWER GROUP CORP LTD COMMON STOCK 593,154 0.5 BEIJING ENTERPRISES WATER GROUP LTD COMMON STOCK 483,638 0.5 Consumer Staples 2,063,456 1.9 PRESIDENT CHAIN STORE CORP COMMON STOCK TWD 10 1,092,486 1.0 KWEICHOW MOUTAI CO LTD COMMON STOCK CNY 1.0 970,970 0.9 Materials 1,012,013 0.9 JIANGSU KANGDE XIN COMPOSITE MATERIAL CO LTD 1,012,013 0.9 Grand Total 110,810,402 100.0 Source: J.P. Morgan, Reuters, Bloomberg Benchmark Source: MSCI. The MSCI data is comprised of a custom index calculated by MSCI for, and as requested by, JPMAM (UK). The MSCI data is for internal use only and may not be redistributed or used in connection with creating or offering any securities, financial products or indices. Neither MSCI nor any other third party involved in or related to compiling, computing or creating the MSCI data (the “MSCI Parties”) makes any express or implied warranties or representations with respect to such data (or the results to be obtained by the use thereof), and the MSCI Parties hereby expressly disclaim all warranties of originality, accuracy, completeness, merchantability or fitness for a particular purpose with respect to such data. Without limiting any of the foregoing, in no event shall any of the MSCI Parties have any liability for any direct, indirect, special, punitive, consequential or any other damages (including lost profits) even if notified of the possibility of such damages. All equity indices stated as ‘Net’ are calculated net of tax as per the standard published approach by the index vendor unless stated otherwise. This material should not be relied on as including sufficient information to support an investment decision. US recipients of this information that wish to receive further information or effect transactions in the Fund’s shares should contact JPM New York and not other brokers who may be listed in this report. This document contains information concerning the performance of JF Investment Companies. It does not constitute or contain, and may not be used for the purposes of or in connection with, any offer or invitation or solicitation by or on behalf of any of the investment companies described herein to subscribe for or to purchase securities by anyone in any jurisdiction in which such offer, invitation or solicitation is not authorised, or to any person to whom it is unlawful to make such offer, invitation or solicitation. There is no assurance that the Fund will achieve its investment objective. You should remember that past performance is not a guide to the future. The price of investments and the income from them may fall as well as rise and you may not get back the full amount invested. All performance assumes reinvestment of all dividends and capital gain distributions. Total return based on share price reflects changes in market value. Total return based on net asset value reflects changes in the Fund’s net asset value during each period. Shares of the Fund may trade above or below its net asset value. Current performance may be lower or higher than the performance data quoted. When a subscription involves a foreign exchange transaction, it may be subject to the fluctuations of currency values. Exchange rates may also cause the value of underlying overseas investments to go up or down. Investments in emerging markets may involve a higher element of risk due political and economic instability and underdeveloped markets and systems. Investments in smaller companies may involve a higher degree of risk as markets are usually more sensitive to price movements. Concentrating investments in the greater China region subjects the Fund to more volatility and greater risk of loss than geographically diverse funds. The views expressed herein are not to be taken as advice or a recommendation to buy or sell any investment.