Attached files
| file | filename |
|---|---|
| 8-K - CHINA FUND INC | fp0018641_8k.htm |

Manager’s Commentary
Market Review
In February, the Greater China equity market, as measured by the MSCI Golden Dragon Index (the "benchmark index"), was down by 0.28% in US dollar terms. Post Lunar New Year celebrations, Chinese equity markets saw a brief rally before a bout of profit-taking quickly doused the positive sentiment. Although Hong Kong stocks continued to trade at generally attractive valuations, we believe lingering concerns of a hard landing in China will put a stop to any hopes of a sharp recovery. The People's Bank of China ("PBoC") announced another 0.5% cut to the reserve requirement ratio ("RRR") at the end of February to lend additional support to the economy. Fears of further significant depreciation in the Renminbi were allayed when Zhou Xiaochuan, governor of the PBoC, stated at the G-20 Forum that "there is no basis for persistent devaluation" of the Renminbi. We expect the equity markets to remain volatile for quite some time, as China continues its slow and eventful transition to a services economy.
Fund Review
During the month of February, the Fund's Net Asset Value ("NAV") price outperformed the benchmark index. We experienced a cyclical rally that increased the performance of materials and energy stocks. The Fund's performance was slightly hurt due to our underweight position within these deep cyclical sectors. This however was more than offset by successful stock selection within the consumer, Information Technology ("IT") and property sectors; with small and mid-cap names contributing the most.
Among the top contributors this month was Digital China Holdings Ltd., a small cap IT service provider. The company's plans to spin off its distribution business to concentrate fully on internet services have been well received by investors, and its share price continued its appreciation which began in January. Strong performance has pushed Digital China Holdings Ltd. to a weighting of 4.44%, making it the sixth largest stock in the portfolio. The share price is likely to remain well supported ahead of an expected special dividend in the coming months.
As for detractors, Ping An Insurance Group Co., of China Ltd. underperformed the market. While full year results showed healthy insurance premium growth, the stock price was impacted by expectations of weak investment returns amid the rout in the A share market and declining onshore interest rates. Having trimmed the position in prior months to control risk, we feel comfortable with the current exposure to the insurance space, as risk/reward has become more favorable after the correction.
Key Transactions
In line with our strategy of identifying unloved companies with growth potential, we began adding to the Chinese property sector. China Overseas Land & Investment Ltd. is our preferred name with a strong brand and key projects in top tier cities. We expect the Chinese property names to benefit from the recovery of the property market, as well as receive favor from supportive government policies.
Outlook
China, the most dominant economy in Asia, is clearly facing slowing economic growth. It will continue to be a tale of a two tiered economy. The 'old economy' that consists of heavy manufacturing, materials and energy companies will need to deal with overcapacity issues, while 'new economy' industries such as services, tourism, high-end manufacturing and the internet should continue to offer attractive growth prospects. The key question is whether the economic conditions will continue to worsen. While expectations of a pick-up in economic growth are premature; a 'hard landing' scenario is equally unlikely, especially with the service industry now responsible for close to half of the gross domestic product. Furthermore, market valuations are close to two standard deviations below the mean, which should provide some support to stock prices. However, we reiterate that expectations of a near term growth recovery are premature.
As top line growth becomes challenging, companies with sustainable earnings growth and strong balance sheets to withstand external shocks and deliver attractive dividend yields, should stand out. We continue to find good opportunities in IT services, railway, environment protection areas, as well as in leisure and entertainment.
In Brief
Fund Data
|
Description
|
Seeks to achieve longterm capital appreciation through investments in China companies.
|
|
Listing Date (NYSE)
|
July 10, 1992
|
|
Total Fund Assets (millions)
|
$243.7
|
|
Median Market Cap (in billions)
|
$8.0
|
|
Distribution Frequency
|
Annual
|
|
Management Firm
|
Allianz Global Investors U.S. LLC
|
|
Portfolio Management
|
Christina Chung, CFA, CMA Lead Portfolio Manager
|
Performance (US$ Returns)
(as of 2/29/16)
|
|
Fund
|
Benchmark1
|
|
One Month
|
10.32%
|
-0.28%
|
|
Three Month
|
-12.36%
|
-10.88%
|
|
One Year
|
-19.97%
|
-20.76%
|
|
Three Year
|
0.13%
|
-1.60%
|
Net Asset Value / Market Price
|
Net Asset Value (NAV) / Market Price at Inception
|
$13.15 / $14.26
|
|
NAV / Market Price (as of 2/29/16)
|
$15.50 / $13.46
|
|
High / Low Ranges (52-Week)
|
|
|
High / Low NAV
|
$26.04 / $14.65
|
|
High / Low Market Price
|
$22.22 / $12.85
|
|
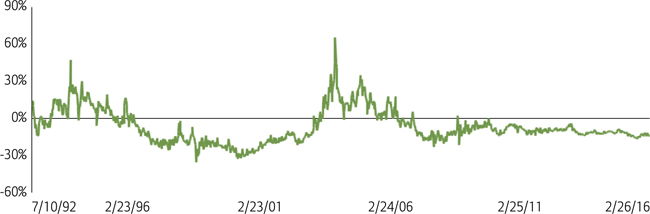
Premium/Discount to NAV (as of 2/29/16)
|
-13.16%
|
|
Fund Data (Common Shares)
|
|
|
Shares Outstanding
|
15,722,674
|
|
Average Daily Volume
|
49,223
|
|
Expense Ratio
|
1.34%
|
Fund Manager

Christina Chung, CFA, CMA
Lead Portfolio Manager
1. MSCI Golden Dragon Index.
The China Fund, Inc.
Investment Objective
The investment objective of the Fund is to achieve long-term capital appreciation. The Fund seeks to achieve its objective through investment in the equity securities of companies and other entities with significant assets, investments, production activities, trading or other business interests in China or which derive a significant part of their revenue from China.
The Fund has an operating policy that the Fund will invest at least 80% of its assets in China companies. For this purpose, 'China companies' are (i) companies for which the principal securities trading market is in China; (ii) companies for which the principal securities trading market is outside of China or in companies organized outside of China, that in both cases derive at least 50% of their revenues from goods or services sold or produced, or have a least 50% of their assets in China; or (iii) companies organized in China. Under the policy, China means the People's Republic of China, including Hong Kong, and Taiwan. The Fund will provide its stockholders with at least 60 days' prior notice of any change to this policy.
|
Returns For Periods Ending February 29, 2016*
|
||||||||
|
1 Month
|
3 Month
|
YTD
|
1 Year
|
3 Year
|
5 Year
|
10 Year
|
Inception
|
|
|
NAV
|
0.32%
|
-12.36%
|
-12.73%
|
-19.97%
|
0.13%
|
-1.06%
|
10.35%
|
9.48%
|
|
Market Price
|
-0.37%
|
-12.72%
|
-13.27%
|
-22.05%
|
-1.31%
|
-2.36%
|
7.60%
|
8.46%
|
|
MSCI Golden Dragon Index
|
-0.28%
|
-10.88%
|
-10.23%
|
-20.76%
|
-1.60%
|
0.01%
|
5.27%
|
—
|
|
Calendar Year Returns
|
||||||||
|
2008
|
2009
|
2010
|
2011
|
2012
|
2013
|
2014
|
2015
|
|
|
NAV
|
-46.95%
|
72.83%
|
27.26%
|
-24.37%
|
12.12%
|
18.31%
|
7.82%
|
-5.51%
|
|
Market Price
|
-40.65%
|
72.19%
|
23.60%
|
-27.51%
|
20.52%
|
12.70%
|
5.29%
|
-6.38%
|
|
MSCI Golden Dragon Index
|
-49.37%
|
67.12%
|
13.60%
|
-18.35%
|
22.65%
|
7.25%
|
8.06%
|
-7.12%
|
Past performance is not a guide to future returns.
|
*
|
Annualized for periods greater than one year.
|
Source: State Street Bank and Trust Company. Source for index data: MSCI as at February 29, 2016. Investment returns are historical and do not guarantee future results. Investment returns reflect changes in net asset value and market price per share during each period and assumes that dividends and capital gains distributions, if any, were reinvested. The net asset value (NAV) percentages are not an indication of the performance of a shareholder's investment in the Fund, which is based on market price. NAV performance includes the deduction of management fees and other expenses. Market price performance does not include the deduction of brokerage commissions and other expenses of trading shares and would be lower had such commissions and expenses been deducted. It is not possible to invest directly in an index.
Premium/Discount
Sector Allocation
|
Fund
|
Benchmark1
|
|
|
Information Technology
|
31.37%
|
27.79%
|
|
Financials
|
22.86%
|
35.40%
|
|
Industrials
|
17.30%
|
7.75%
|
|
Consumer Discretionary
|
12.99%
|
6.31%
|
|
Telecom Services
|
5.01%
|
6.97%
|
|
Health Care
|
3.48%
|
1.17%
|
|
Energy
|
2.16%
|
3.81%
|
|
Consumer Staples
|
1.69%
|
2.46%
|
|
Materials
|
0.34%
|
3.24%
|
|
Utilities
|
0.00%
|
5.09%
|
|
Other assets & liabilities
|
2.82%
|
0.00%
|
Source: IDS GmbH - Analysis and Reporting Services, a subsidiary of Allianz SE.
Country Allocation
|
Fund
|
Benchmark1
|
|
|
China
|
76.47%
|
73.28%
|
|
Hong Kong Red Chips
|
31.36%
|
11.44%
|
|
Hong Kong 'H' shares
|
11.38%
|
22.25%
|
|
Equity linked securities ('A' shares)
|
3.45%
|
0.00%
|
|
China 'A' & 'B' shares
|
0.00%
|
0.21%
|
|
Other Hong Kong securities
|
30.28%
|
32.49%
|
|
Others
|
0.00%
|
6.88%
|
|
Taiwan
|
20.71%
|
26.72%
|
|
Other assets & liabilities
|
2.82%
|
0.00%
|
Top 10 Holdings
|
TAIWAN SEMIC CO LTD (Taiwan)
|
8.21%
|
|
TENCENT HOLDINGS LTD (China)
|
5.68%
|
|
CHINA OVERSEAS LAND & INV (China)
|
5.30%
|
|
CK HUTCHISON HOLDINGS LTD (H.K.)
|
5.29%
|
|
CHINA MOBILE LTD (China)
|
5.02%
|
|
DIGITAL CHINA HOLDINGS LTD (China)
|
4.44%
|
|
HONG KONG EXCHANGES AND CLEARING LTD (H.K.)
|
3.75%
|
|
PING AN INSURANCE (China)
|
3.68%
|
|
QINGLING MOTORS CO LTD (China)
|
3.41%
|
|
CHINA MERCHANTS BANK CO LTD (China)
|
3.33%
|
Portfolio Characteristics
|
Fund
|
Benchmark1
|
|
|
P/E Ratio
|
12.22
|
10.60
|
|
P/B Ratio
|
1.44
|
1.21
|
|
Issues in Portfolio
|
37
|
287
|
|
Foreign Holdings (%)
|
97.18
|
100.00
|
|
Other assets & liabilities (%)
|
2.82
|
0.00
|
|
Yield (%)
|
3.38
|
3.69
|
1. MSCI Golden Dragon Index.
The China Fund, Inc.
Distribution History (10 Year)
|
Declaration Date
|
Ex-dividend Date
|
Record Date
|
Payable Date
|
Distribution/
Share
|
Income
|
Long-term Capital Gain
|
Short-term Capital Gain
|
|
12/8/06
|
12/19/06
|
12/21/06
|
12/29/06
|
$4.01170
|
$0.29960
|
$2.73090
|
$0.98120
|
|
12/7/07
|
12/19/07
|
12/21/07
|
1/25/08
|
$12.12000
|
$0.28000
|
$9.00000
|
$2.84000
|
|
12/8/08
|
12/22/08
|
12/24/08
|
1/23/09
|
$5.81740
|
$0.48130
|
$5.33610
|
—
|
|
12/9/09
|
12/22/09
|
12/24/09
|
12/29/09
|
$0.25570
|
$0.25570
|
—
|
—
|
|
12/8/10
|
12/21/10
|
12/24/10
|
12/29/10
|
$2.27420
|
$0.37460
|
$1.89960
|
—
|
|
12/8/11
|
12/21/11
|
12/23/11
|
12/29/11
|
$2.99640
|
$0.17420
|
$2.82220
|
—
|
|
12/10/12
|
12/20/12
|
12/24/12
|
12/28/12
|
$3.25170
|
$0.34730
|
$2.90440
|
—
|
|
12/13/13
|
12/19/13
|
12/23/13
|
12/27/13
|
$3.31400
|
$0.43870
|
$2.87530
|
—
|
|
12/8/14
|
12/18/14
|
12/22/14
|
1/5/15
|
$3.76510
|
$0.29820
|
$3.46690
|
—
|
|
12/16/15
|
12/23/15
|
12/28/15
|
1/6/16
|
$1.49580
|
$0.21330
|
$0.84620
|
$0.43630
|
Distribution/Share includes Income, Long-term Capital gains and Short-term Capital gains.
The China Fund NAV Performance of $10,000 since inception
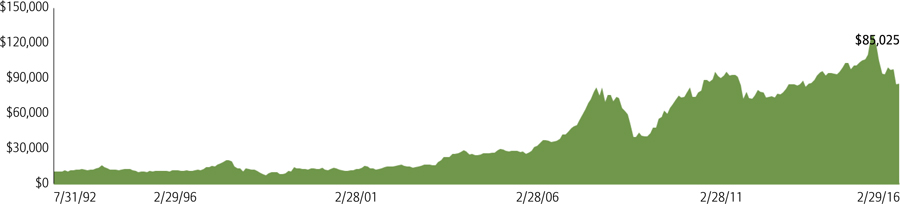
Past performance is not a guide to future returns.
Index Description
MSCI Golden Dragon Index
The MSCI Golden Dragon Index captures the equity market performance of large and mid cap China securities (H shares, B shares, Red-Chips and P-Chips) and non-domestic China securities listed in Hong Kong and Taiwan.
It is not possible to invest directly in an index.
The China Fund, Inc.
|
Portfolio in Full
|
|
Sector
|
Company (exchange ticker)
|
Market Price
|
Holding
|
Value US$
|
% of net assets
|
|
Information Technology
|
31.38
|
||||
|
TAIWAN SEMICONDUCTOR MANUFACTURING CO LTD
|
2330
|
149.00
|
4,461,000
|
20,001,474
|
8.21
|
|
TENCENT HOLDINGS LTD
|
700
|
142.00
|
757,500
|
13,831,436
|
5.68
|
|
DIGITAL CHINA HOLDINGS LTD
|
861
|
8.99
|
9,360,000
|
10,820,114
|
4.44
|
|
DELTA ELECTRONICS INC
|
2308
|
134.50
|
1,680,359
|
6,800,923
|
2.79
|
|
ADVANTECH CO LTD
|
2395
|
230.00
|
798,841
|
5,528,810
|
2.27
|
|
ALIBABA GROUP HOLDING LTD
|
BABA
|
68.81
|
60,998
|
4,197,272
|
1.72
|
|
BAIDU INC
|
BIDU
|
173.42
|
23,473
|
4,070,688
|
1.67
|
|
SEMICONDUCTOR MANUFACTURING INTERNATIONAL CORP
|
981
|
0.64
|
48,792,000
|
4,015,364
|
1.65
|
|
LARGAN PRECISION CO LTD
|
3008
|
2,535.00
|
41,000
|
3,127,558
|
1.28
|
|
CATCHER TECHNOLOGY CO LTD
|
2474
|
260.00
|
304,000
|
2,378,430
|
0.98
|
|
GOLDPAC GROUP LTD
|
3315
|
2.35
|
5,521,000
|
1,668,330
|
0.68
|
|
Financials
|
22.88
|
||||
|
CHINA OVERSEAS LAND & INVESTMENT LTD
|
688
|
23.20
|
4,324,000
|
12,899,413
|
5.30
|
|
HONG KONG EXCHANGES AND CLEARING LTD
|
388
|
169.00
|
420,600
|
9,140,127
|
3.75
|
|
PING AN INSURANCE GROUP CO OF CHINA LTD
|
2318
|
33.00
|
2,112,000
|
8,961,983
|
3.68
|
|
CHINA MERCHANTS BANK CO LTD
|
3968
|
14.56
|
4,337,500
|
8,120,769
|
3.33
|
|
SUN HUNG KAI PROPERTIES LTD
|
16
|
86.65
|
688,000
|
7,665,726
|
3.15
|
|
FUBON FINANCIAL HOLDING CO LTD
|
2881
|
39.45
|
4,270,000
|
5,068,955
|
2.08
|
|
CATHAY FINANCIAL HOLDING CO LTD
|
2882
|
37.30
|
3,462,000
|
3,885,791
|
1.60
|
|
Industrials
|
17.27
|
||||
|
CK HUTCHISON HOLDINGS LTD
|
1
|
94.10
|
1,064,000
|
12,874,416
|
5.29
|
|
CHINA EVERBRIGHT INTERNATIONAL LTD
|
257
|
8.22
|
7,256,000
|
7,669,470
|
3.15
|
|
ZHUZHOU CSR TIMES ELECTRIC CO LTD
|
3898
|
38.00
|
1,511,500
|
7,385,638
|
3.03
|
|
BEIJING ENTERPRISES HOLDINGS LTD
|
392
|
36.05
|
1,281,000
|
5,938,143
|
2.44
|
|
CN STATE CONSTRUCTION INTERNATIONAL HOLDINGS LTD
|
3311
|
11.90
|
2,110,000
|
3,228,685
|
1.33
|
|
ZHENGZHOU YUTONG BUS CO A
|
600066
|
18.92
|
910,530
|
2,631,276
|
1.08
|
|
QINGDAO PORT INTERNATIONAL CO LTD
|
6198
|
2.76
|
6,596,000
|
2,340,917
|
0.96
|
|
Consumer Discretionary
|
13.00
|
||||
|
QINGLING MOTORS CO LTD
|
1122
|
2.23
|
28,960,000
|
8,304,236
|
3.41
|
|
SANDS CHINA LTD
|
1928
|
27.15
|
1,634,800
|
5,707,301
|
2.34
|
|
LI & FUNG LTD
|
494
|
4.41
|
9,798,000
|
5,556,129
|
2.28
|
|
CITIGROUP GLOBAL MARKETS HOLD
(exch. for CHINA CYTS TOURS HOLDIN) |
N/A
|
2.84
|
1,635,575
|
4,645,033
|
1.91
|
|
MERIDA INDUSTRY CO LTD
|
9914
|
152.00
|
805,000
|
3,681,993
|
1.51
|
|
CLSA GLOBAL MARKETS PTE LTD
(exch. for CHONG QING CHANGAN AUTO) |
N/A
|
2.11
|
739,970
|
1,564,232
|
0.64
|
|
CITIGROUP GLOBAL MARKETS HOLD
(exch. for CHONG QING CHANGAN AUTO) |
N/A
|
2.11
|
558,897
|
1,179,273
|
0.48
|
|
HSBC BANK PLC (exch. for CHONG QING CHANGAN AUTO)
|
N/A
|
2.11
|
487,000
|
1,028,544
|
0.42
|
|
Telecom Services
|
5.02
|
||||
|
CHINA MOBILE LTD
|
941
|
82.40
|
1,153,500
|
12,221,966
|
5.02
|
|
Health Care
|
3.48
|
||||
|
CSPC PHARMACEUTICAL GROUP LTD
|
1093
|
6.19
|
5,804,000
|
4,619,706
|
1.90
|
|
3SBIO INC
|
1530
|
9.43
|
3,175,500
|
3,850,526
|
1.58
|
|
Energy
|
2.16
|
||||
|
CNOOC LTD
|
883
|
7.95
|
5,143,000
|
5,257,508
|
2.16
|
|
Consumer Staples
|
1.69
|
||||
|
WANT WANT CHINA HOLDINGS LTD
|
151
|
5.15
|
6,204,000
|
4,108,424
|
1.69
|
|
Materials
|
0.34
|
||||
|
TIANGONG INTERNATIONAL CO LTD
|
826
|
0.57
|
11,240,000
|
823,830
|
0.34
|
Source: State Street Bank and Trust Company, IDS GmbH - Analysis and Reporting Services, a subsidiary of Allianz SE.
The China Fund, Inc.
Important Information:
Holdings are subject to change daily. The Fund seeks to achieve its objective through investment in the equity securities of companies and other entities with significant assets, investments, production activities, trading or other business interests in China or which derive a significant part of their revenue from China. Investing in non-U.S. securities entails additional risks, including political and economic risk and the risk of currency fluctuations, as well as lower liquidity. These risks, which can result in greater price volatility, will generally be enhanced in less diversified funds that concentrate investments in a particular geographic region.
The information contained herein has been obtained from sources believed to be reliable but Allianz Global Investors U.S. LLC and its affiliates do not warrant the information to be accurate, complete or reliable. The opinions expressed herein are subject to change at any time and without notice. Past performance is not indicative of future results. This material is not intended as an offer or solicitation for the purchase or sale of any financial instrument. Investors should consider the investment objectives, risks, charges and expenses of any mutual fund carefully before investing. This and other information is contained in the fund's annual and semiannual reports, proxy statement and other fund information, which may be obtained by contacting your financial advisor or visiting the fund's website at www.chinafundinc.com. This information is unaudited and is intended for informational purposes only. It is presented only to provide information on the Fund's holdings, performance and strategies. The Fund is a closed-end exchange traded management investment company. This material is presented only to provide information and is not intended for trading purposes. Closed-end funds, unlike open-end funds, are not continuously offered. After the initial public offering by a closed-end fund, its shares can be purchased and sold on the open market through a stock exchange, where shares may trade at a premium or a discount. The market price of holdings is subject to change daily.
P/E is a ratio of security price to earnings per share. Typically, an undervalued security is characterized by a low P/E ratio, while an overvalued security is characterized by a high P/E ratio. P/B is a ratio of the current stock price to the book value. This is used to identify undervalued stocks. Dividend yield is the annual percentage of return earned by an investor on a common or preferred stock. The average dividend yield is the dividend rate divided by current share price.
©2016 Allianz Global Investors Distributors LLC.
| Investment Products: Not FDIC Insured | May Lose Value | Not Bank Guaranteed |
FS-CHN-0216
|