Attached files
| file | filename |
|---|---|
| 8-K - 8-K - Conifer Holdings, Inc. | nyssa8-k.htm |

NYSSA INSURANCE INDUSTRY CONFERENCE PRESENTATION March 21, 2016 Our mission is to exceed our clients’ needs with tailored insurance products delivered with exceptional customer service.

1 SAFE HARBOR STATEMENT This presentation contains “forward-looking” statements within the meaning of Section 27A of the Securities Act of 1933, as amended, and Section 21E of the Securities Exchange Act of 1934, as amended, that are based on our management’s beliefs and assumptions and on information currently available to management. These forward-looking statements include, without limitation, statements regarding our industry, business strategy, plans, goals and expectations concerning our market position, product expansion, future operations, margins, profitability, future efficiencies, and other financial and operating information. When used in this discussion, the words “may,” “believes,” “intends,” “seeks,” “anticipates,” “plans,” “estimates,” “expects,” “should,” “assumes,” “continues,” “potential,” “could,” “will,” “future” and the negative of these or similar terms and phrases are intended to identify forward-looking statements. Forward-looking statements involve known and unknown risks, uncertainties, inherent risks and other factors that may cause our actual results, performance or achievements to be materially different from any future results, performance or achievements expressed or implied by the forward-looking statements. Forward-looking statements represent our management’s beliefs and assumptions only as of the date of this presentation. Our actual future results may be materially different from what we expect due to factors largely outside our control, including the occurrence of severe weather conditions and other catastrophes, the cyclical nature of the insurance industry, future actions by regulators, our ability to obtain reinsurance coverage at reasonable rates and the effects of competition. These and other risks and uncertainties associated with our business are described under the heading “Risk Factors” in our Annual Report on Form 10-K for the year ended December 31, 2015, which should be read in conjunction with this presentation. The company and subsidiaries operate in a dynamic business environment, and therefore the risks identified are not meant to be exhaustive. Risk factors change and new risks emerge frequently. Except as required by law, we assume no obligation to update these forward-looking statements publicly, or to update the reasons actual results could differ materially from those anticipated in the forward-looking statements, even if new information becomes available in the future. 1

2 BROAD & FLEXIBLE UNDERWRITING PLATFORM • Well-developed underwriting platform overall • Ability to pivot between Excess & Surplus lines and Admitted opportunities Surplus lines eligible in 44 states Admitted in 28 states with 10 pending • Writing policies in all 50 states – utilizing a fronting carrier where we are as yet unlicensed • Goal is to be licensed on both E&S and Admitted basis in all 50 states 2

3 ORGANIZATION STRUCTURE: EXPERIENCED MANAGEMENT TEAM • Executives have an average of over 20 years of insurance industry experience • All Senior Executives are significant investors in Conifer – considerable percentage of individuals’ net worth • As of 12/31/2015, insider ownership in CNFR was as follows: Senior Executives: 33% (26.4% owned by Jim Petcoff) Board of Directors Members: 15% • Significant inside ownership purchases in 2016, as evidenced by recent Form 4 filings • Talented underwriting group with over 25 years of insurance industry experience and strong track record of growing specialty insurance businesses: 3 Title Industry Experience Underwriting Product Specialty SVP, Commercial Lines 42 years Hospitality, Artisan Contractors & Auto Facilities President, Blue Spruce Underwriting 26 years Quick Service Restaurants President, Home Value 29 years Low-value Dwellings President, Venture Agency Holdings 27 years Security Services SVP, Personal Lines 10 years Homeowners

ANNUAL GROSS WRITTEN PREMIUM VOLUME • Gross written premium: Volume was up 11.8% for the twelve months ended December 31, 2015 Up 21.6% excluding Personal Auto / Florida Homeowners • Total gross written premium was $93.8 million for the twelve months ended December 31, 2015 • Net Written Premium – up 20.2% for 2015 Net earned premium up 16.1% for same period • Factors driving premium growth include: Strong commercial lines experience in hospitality & small business accounts Particularly in commercial multi-peril and other liability lines Personal lines focus on wind-exposed homeowners (away from personal auto) 4 $13.9 $27.3 $55.0 $68.2 $8.9 $16.8 $28.8 $25.6 $0 $10 $20 $30 $40 $50 $60 $70 $80 $90 $100 2012 2013 2014 2015 M I L L I O N S Commercial Lines Personal Lines

COMMERCIAL LINES: HOSPITALITY & SECURITY BUSINESS • 23.9% growth in gross written premium to $68.2 million for the twelve months ended December 31, 2015 • Expansion of hospitality and security services business • Focus on niche underserved markets • Writing in all 50 states Florida, Michigan and Pennsylvania each generated more than 15% of twelve-month gross written premium 5 15 to 25% of GWP 2 to 14.9% of GWP 1 to 1.9% of GWP Less than 1% of GWP $0 $10 $20 $30 $40 $50 $60 $70 $80 2012 2013 2014 2015 M I L L I O N S Commercial Multi-Peril Other Liability Commercial Auto Other Commercial

PERSONAL LINES: LOW-VALUE DWELLING & WIND-EXPOSED HOMEOWNERS ($ in thousands) YE December 31, 2015 Florida $8,694 34% Texas 8,374 33% Indiana 4,706 19% Hawaii 2,657 10% Illinois 874 3% Pennsylvania 264 1% Total $ 25,589 100.0 % 6 • $25.6 million in gross written premium for the twelve months ended December 31, 2015, down 11.2% from 2014 • Premiums down as a segment mainly due to the personal auto run-off • Increase in Wind-exposed Homeowners (up 40%) focusing on coastal exposures in Florida, Hawaii and Texas • Low-value Dwelling ramp up primarily in southern states, such as Texas and northern Louisiana - 5 10 15 20 25 30 35 2012 2013 2014 2015 M I L L I O N S Low-value Dwelling Wind-exposed Personal Auto (run-off)

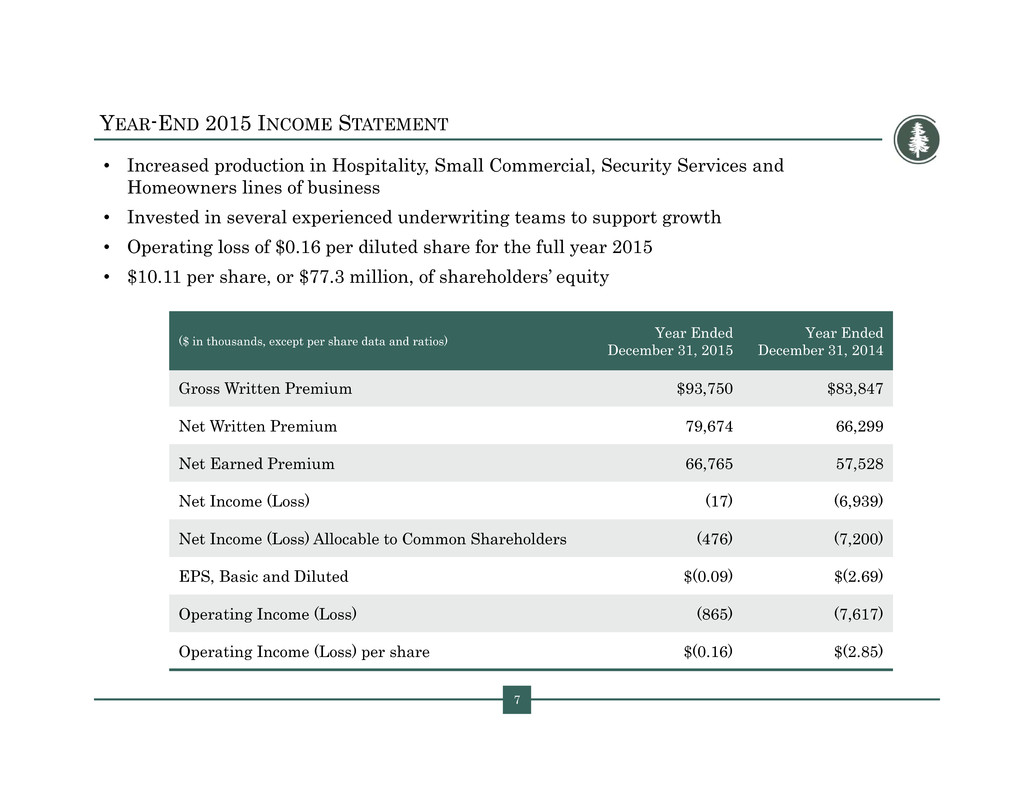
7 YEAR-END 2015 INCOME STATEMENT • Increased production in Hospitality, Small Commercial, Security Services and Homeowners lines of business • Invested in several experienced underwriting teams to support growth • Operating loss of $0.16 per diluted share for the full year 2015 • $10.11 per share, or $77.3 million, of shareholders’ equity ($ in thousands, except per share data and ratios) Year Ended December 31, 2015 Year Ended December 31, 2014 Gross Written Premium $93,750 $83,847 Net Written Premium 79,674 66,299 Net Earned Premium 66,765 57,528 Net Income (Loss) (17) (6,939) Net Income (Loss) Allocable to Common Shareholders (476) (7,200) EPS, Basic and Diluted $(0.09) $(2.69) Operating Income (Loss) (865) (7,617) Operating Income (Loss) per share $(0.16) $(2.85) 7

8 COMBINED RATIO REFLECTS BUSINESS MIX • Over time, expect to achieve combined ratio target through incremental underwriting profitability and improved fixed-cost utilization • Enhanced mix of business and premium growth should help drive combined ratio improvement • Scalable technology possesses high capacity / bandwidth for growth • 11.7 percentage point improvement in combined ratio for the year ended December 31, 2015, compared to the same period in 2014 8 64.8% 59.1% 45.2% 45.3% 44.0% 55.6% 68.6% 56.8% 2012 2013 2014 2015 Expense Ratio Loss Ratio 108.8% 114.7% 113.8% 102.1% Combined Ratio Target: 90%

9 EXPENSE RATIO: CALCULATED TO GENERATE LONG-TERM GROWTH • Infrastructure to support long-term growth Scalable technology possesses high capacity / bandwidth for growth • Recently hired several experienced underwriting teams Select security guard business roll out - nationally Low-value dwelling homeowners expansion in the southwest Hospitality-related book of business – focused on quick service restaurants 9 64.8% 59.1% 45.2% 45.3% 2012 2013 2014 2015 Expense Ratio Target: 35%

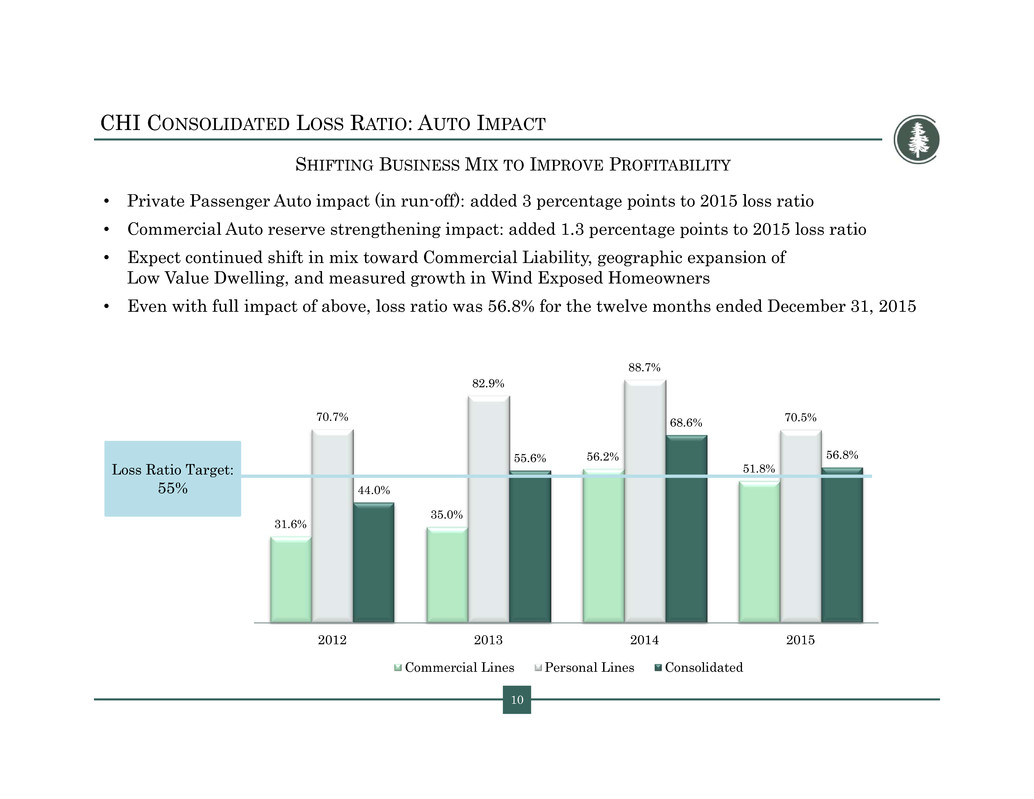
10 CHI CONSOLIDATED LOSS RATIO: AUTO IMPACT SHIFTING BUSINESS MIX TO IMPROVE PROFITABILITY • Private Passenger Auto impact (in run-off): added 3 percentage points to 2015 loss ratio • Commercial Auto reserve strengthening impact: added 1.3 percentage points to 2015 loss ratio • Expect continued shift in mix toward Commercial Liability, geographic expansion of Low Value Dwelling, and measured growth in Wind Exposed Homeowners • Even with full impact of above, loss ratio was 56.8% for the twelve months ended December 31, 2015 10 31.6% 35.0% 56.2% 51.8% 70.7% 82.9% 88.7% 70.5% 44.0% 55.6% 68.6% 56.8% 2012 2013 2014 2015 Commercial Lines Personal Lines Consolidated Loss Ratio Target: 55%

11 LOSS RESERVES: RESERVING PHILOSOPHY • Conservative reserving practices Based on experience and industry-standard actuarial methods Consistent favorable reserve development for each of the years 2010 to 2014 • The table below represents the prior year reserve development from 2011 through 2015 by entity. CIC’s adverse development in 2015 is mostly due to personal automobile business, which is in runoff, and to greater than expected claim frequency and severity in commercial auto: TOTAL RESERVE REDUNDANCY (dollars in thousands) (Favorable) / Unfavorable Development Reported in: 2011 2012 2013 2014 2015 Total CIC (151) (1,615) (1,521) (61) 1,633 (1,715) WPIC (2,579) (3,852) (3,639) (367) (345) (10,782) ACIC - - - (723) 417 (306) CHI (2,223) (4,356) (5,021) (1,193) 1,458 (11,335) CONSOLIDATED

12 CONSERVATIVE INVESTMENT STRATEGY • Investment philosophy is to maintain a highly liquid portfolio of investment-grade fixed income securities • Total investment securities of $117.7M at December 31, 2015: Average duration: 3.09 years Average tax-equivalent yield: ~2.1% Average credit quality: AA • At December 31, 2015 CMBS represents 6.5% of fixed income portfolio Almost all super senior tranches – rated AAA High performing: 30% credit enhancement FIXED INCOME PORTFOLIO CREDIT RATING ($ in thousands) December 31, 2015 Fair Value % of Total AAA $ 33,180 29.2% AA 42,032 37.1% A 23,362 20.6% BBB 14,891 13.1% TOTAL FIXED INCOME INVESTMENTS $ 113,465 100.0% 5% 13% 33% 41% 4% 5% PORTFOLIO ALLOCATION U.S. Government Obligations State & Local Governments Corporate Debt Commercial Mortgage & Asset-Backed Securities Equity Securities Short-Term Investments

