Attached files
| file | filename |
|---|---|
| EX-21.1 - EX-21.1 - EQUITY BANCSHARES INC | d122073dex211.htm |
| EX-23.1 - EX-23.1 - EQUITY BANCSHARES INC | d122073dex231.htm |
| EX-31.2 - EX-31.2 - EQUITY BANCSHARES INC | d122073dex312.htm |
| EX-31.1 - EX-31.1 - EQUITY BANCSHARES INC | d122073dex311.htm |
| EX-32.2 - EX-32.2 - EQUITY BANCSHARES INC | d122073dex322.htm |
| EX-32.1 - EX-32.1 - EQUITY BANCSHARES INC | d122073dex321.htm |
Table of Contents
UNITED STATES
SECURITIES AND EXCHANGE COMMISSION
Washington, D.C. 20549
FORM 10-K
| x | ANNUAL REPORT PURSUANT TO SECTION 13 OR 15(d) OF THE SECURITIES EXCHANGE ACT OF 1934 |
For the fiscal year ended December 31, 2015
OR
| ¨ | TRANSITION REPORT PURSUANT TO SECTION 13 OR 15(d) OF THE SECURITIES EXCHANGE ACT OF 1934 |
For the transition period from to
Commission File Number 001-37624
EQUITY BANCSHARES, INC.
(Exact name of registrant as specified in its charter)
| Kansas | 72-1532188 | |
| (State or other jurisdiction of incorporation or organization) |
(I.R.S. Employer Identification No.) | |
| 7701 East Kellogg Drive, Suite 200 Wichita, KS |
67207 | |
| (Address of principal executive offices) | (Zip Code) | |
Registrant’s telephone number, including area code: 316.612.6000
Securities registered pursuant to Section 12(b) of the Act:
| Title of each class |
Name of exchange on which registered | |
| Class A Common Stock, par value $0.01 per share | NASDAQ Stock Market LLC |
Securities registered pursuant to section 12(g) of the Act: None
Indicate by check mark if the registrant is a well-known seasoned issuer, as defined in Rule 405 of the Securities Act. Yes ¨ No x
Indicate by check mark if the registrant is not required to file reports pursuant to Section 13 or Section 15(d) of the Act. Yes ¨ No x
Indicate by check mark whether the registrant (1) has filed all reports required to be filed by Section 13 or 15(d) of the Securities Exchange Act of 1934 during the preceding 12 months (or for such shorter period that the registrant was required to file such reports), and (2) has been subject to such filing requirements for the past 90 days. Yes x No ¨
Indicate by check mark whether the registrant has submitted electronically and posted on its corporate Web site, if any, every Interactive Data File required to be submitted and posted pursuant to Rule 405 of Regulation S-T (§232.405 of this chapter) during the preceding 12 months (or for such shorter period that the registrant was required to submit and post such files). Yes x No ¨
Indicate by check mark if disclosure of delinquent filers pursuant to Item 405 of Regulation S-K (§ 229.405 of this chapter) is not contained herein, and will not be contained, to the best of registrant’s knowledge, in definitive proxy or information statements incorporated by reference in Part III of this Form 10-K or any amendment to this Form 10-K. ¨
Indicate by check mark whether the registrant is a large accelerated filer, an accelerated filer, a non-accelerated filer, or a smaller reporting company. See the definitions of “large accelerated filer,” “accelerated filer” and “smaller reporting company” in Rule 12b-2 of the Exchange Act.
| Large accelerated filer | ¨ | Accelerated filer | ¨ | |||
| Non-accelerated filer | x | Smaller reporting company | ¨ | |||
Indicate by check mark whether the registrant is a shell company (as defined in Rule 12b-2 of the Act). Yes ¨ No x
The registrant did not have a public float on the last business day of its most recently completed fiscal quarter because there was no public market for the registrant’s common equity as of such date.
Indicate the number of shares outstanding of each of the registrant’s classes of common stock, as of the latest practicable date.
| Shares outstanding as of March 11, 2016 | ||
| Class A Common Stock, par value $0.01 per share |
7,150,017 | |
| Class B Non-Voting Common Stock, par value $0.01 per share |
1,061,710 |
DOCUMENTS INCORPORATED BY REFERENCE:
Portions of the registrant’s Proxy Statement relating to the 2016 Annual Meeting of Stockholders, which will be filed within 120 days after December 31, 2015, are incorporated by reference into Part III of this Annual Report on Form 10-K.
Table of Contents
Table of Contents
Important Notice about Information in this Annual Report on Form 10-K
Unless we state otherwise or the context otherwise requires, references in this Annual Report on Form 10-K to “we,” “our,” “us,” “the Company” and “Equity” refer to Equity Bancshares, Inc. and its consolidated subsidiaries, including Equity Bank, which we sometimes refer to as “Equity Bank,” “the Bank” or “our Bank.”
The information contained in this Annual Report on Form 10-K is accurate only as of the date of this annual report and as of the dates specified herein.
CAUTIONARY NOTE REGARDING FORWARD-LOOKING STATEMENTS
This Annual Report on Form 10-K contains “forward-looking statements within the meaning of Section 27A of the Securities Act of 1933, as amended (the “Securities Act”), and Section 21E of the Securities Exchange Act of 1934, as amended (the “Exchange Act”).” These forward-looking statements reflect our current views with respect to, among other things, future events and our financial performance. These statements are often, but not always, made through the use of words or phrases such as “may,” “should,” “could,” “predict,” “potential,” “believe,” “will likely result,” “expect,” “continue,” “will,” “anticipate,” “seek,” “estimate,” “intend,” “plan,” “project,” “forecast,” “goal,” “target,” “would” and “outlook,” or the negative variations of those words or other comparable words of a future or forward-looking nature. These forward-looking statements are not historical facts, and are based on current expectations, estimates and projections about our industry, management’s beliefs and certain assumptions made by management, many of which, by their nature, are inherently uncertain and beyond our control. Accordingly, we caution you that any such forward-looking statements are not guarantees of future performance and are subject to risks, assumptions and uncertainties that are difficult to predict. Although we believe that the expectations reflected in these forward-looking statements are reasonable as of the date made, actual results may prove to be materially different from the results expressed or implied by the forward-looking statements. When considering forward-looking statements, you should keep in mind the risk factors and other cautionary statements described in “Item 1A – Risk Factors” of this Annual Report on Form 10-K.
There are or will be important factors that could cause our actual results to differ materially from those indicated in these forward-looking statements, including, but not limited to, the following:
| • | an economic downturn, especially one affecting our core market areas; |
| • | the occurrence of various events that negatively impact the real estate market, since a significant portion of our loan portfolio is secured by real estate; |
| • | difficult or unfavorable conditions in the market for financial products and services generally; |
| • | interest rate fluctuations, which could have an adverse effect on our profitability; |
| • | external economic and/or market factors, such as changes in monetary and fiscal policies and laws, including the interest rate policies of the Board of Governors of the Federal Reserve System, or the Federal Reserve, inflation or deflation, changes in the demand for loans, and fluctuations in consumer spending, borrowing and savings habits, which may have an adverse impact on our financial condition; |
| • | continued or increasing competition from other financial institutions, credit unions, and non-bank financial services companies, many of which are subject to different regulations than we are; |
| • | costs arising from the environmental risks associated with making loans secured by real estate; |
| • | losses resulting from a decline in the credit quality of the assets that we hold; |
| • | inadequacies in our allowance for loan losses, which could require us to take a charge to earnings and thereby adversely affect our financial condition; |
| • | inaccuracies or changes in the appraised value of real estate securing the loans that we originate, which could lead to losses if the real estate collateral is later foreclosed upon and sold at a price lower than the appraised value; |
1
Table of Contents
| • | the costs of integrating the businesses we acquire, which may be greater than expected; |
| • | challenges arising from unsuccessful attempts to expand into new geographic markets, products, or services; |
| • | a lack of liquidity resulting from decreased loan repayment rates, lower deposit balances, or other factors; |
| • | restraints on the ability of Equity Bank to pay dividends to us, which could limit our liquidity; |
| • | the loss of our largest loan and depositor relationships; |
| • | limitations on our ability to lend and to mitigate the risks associated with our lending activities as a result of our size and capital position; |
| • | additional regulatory requirements and restrictions on our business, which could impose additional costs on us; |
| • | increased capital requirements imposed by banking regulators, which may require us to raise capital at a time when capital is not available on favorable terms or at all; |
| • | a failure in the internal controls we have implemented to address the risks inherent to the business of banking; |
| • | inaccuracies in our assumptions about future events, which could result in material differences between our financial projections and actual financial performance; |
| • | the departure of key members of our management personnel or our inability to hire qualified management personnel; |
| • | disruptions, security breaches, or other adverse events, failures or interruptions in, or attacks on, our information technology systems; |
| • | unauthorized access to nonpublic personal information of our customers, which could expose us to litigation or reputational harm; |
| • | disruptions, security breaches, or other adverse events affecting the third-party vendors who perform several of our critical processing functions; |
| • | the occurrence of adverse weather or manmade events, which could negatively affect our core markets or disrupt our operations; |
| • | an increase in FDIC deposit insurance assessments, which could adversely affect our earnings; |
| • | an inability to keep pace with the rate of technological advances due to a lack of resources to invest in new technologies; and |
| • | other factors that are discussed in “Item 1A – Risk Factors.” |
The foregoing factors should not be construed as exhaustive and should be read in conjunction with other cautionary statements that are included in this Annual Report on Form 10-K. If one or more events related to these or other risks or uncertainties materialize, or if our underlying assumptions prove to be incorrect, actual results may differ materially from what we anticipate. Accordingly, you should not place undue reliance on any such forward-looking statements. Any forward-looking statement speaks only as of the date on which it is made, and we do not undertake any obligation to publicly update or review any forward-looking statement, whether as a result of new information, future developments or otherwise. New risks and uncertainties arise from time to time, and it is not possible for us to predict those events or how they may affect us. In addition, we cannot assess the impact of each factor on our business or the extent to which any factor, or combination of factors, may cause actual results to differ materially from those contained in any forward-looking statements. All forward-looking statements, expressed or implied, included in this Annual Report on Form 10-K are expressly qualified in their entirety by this cautionary statement. This cautionary statement should also be considered in connection with any subsequent written or oral forward-looking statements that we or persons acting on our behalf may issue.
2
Table of Contents
Part I
Our Company
We are a bank holding company headquartered in Wichita, Kansas. Our wholly-owned banking subsidiary, Equity Bank, provides a broad range of financial services primarily to businesses and business owners as well as individuals through our network of 29 full service branches located in Kansas and Missouri. As of December 31, 2015, we had, on a consolidated basis, total assets of $1.6 billion, total deposits of $1.2 billion, total loans net of allowance of $954.8 million and total stockholders’ equity of $167.2 million.
Our principal objective is to increase stockholder value and generate consistent earnings growth by expanding our commercial banking franchise both organically and through strategic acquisitions. We strive to provide an enhanced banking experience for our customers by providing them with a comprehensive suite of sophisticated banking products and services tailored to meet their needs, while delivering the high-quality, relationship-based customer service of a community bank.
Our History and Growth
We were founded in November 2002 by our Chairman and CEO, Brad S. Elliott. Mr. Elliott believed that, as a result of in-market consolidation, there existed an opportunity to build an attractive commercial banking franchise and create long-term value for our stockholders. Following thirteen years’ experience as a finance executive, including serving as a Regional President for a Kansas bank with over $1.0 billion in assets, Mr. Elliott implemented his banking vision of developing a strategic consolidator of community banks and a destination for seasoned bankers and business persons who share our entrepreneurial spirit. In 2003, we raised capital from 23 local investors to finance the acquisition of National Bank of Andover in Andover, Kansas. At the time of our acquisition, National Bank of Andover had $32 million in assets and was subject to a regulatory enforcement agreement with the Office of the Comptroller of the Currency, or the OCC. Subsequent to our acquisition of National Bank of Andover, we changed its name to Equity Bank and instilled in its commercial and retail staff our entrepreneurial spirit and disciplined credit culture. Within eight months of the acquisition, the enforcement action with the OCC was terminated.
We believe we have a successful track record of selectively acquiring, integrating and consolidating community banks and branch networks. Our acquisition activity includes the following:
| • | June 2003 – Acquired National Bank of Andover in Andover, Kansas for $3 million. At the time of our acquisition, National Bank of Andover had $32 million in total assets. |
| • | February 2005 – Acquired two branches of Hillcrest Bank, N.A. in Wichita, Kansas, which increased our deposits by $66 million. In conjunction with this acquisition, we relocated our headquarters to our current principal executive offices in Wichita. |
| • | June 2006 – Acquired the Mortgage Centre of Wichita and integrated it into our Bank as a department to expand our mortgage loan platform. |
| • | October 2006 – Acquired a Missouri charter from First National Bank in Sarcoxie, Missouri, which allowed us to subsequently open a full service branch in Lee’s Summit, Missouri in 2007. |
| • | November 2007 – Acquired Signature Bancshares, Inc. in Spring Hill, Kansas, which provided us entry into the Overland Park, Kansas market. |
| • | August 2008 – Acquired Ellis State Bank with locations in Ellis and Hays, Kansas. |
| • | December 2011 – Acquired four branches of Citizens Bank and Trust in Topeka, Kansas, which increased our deposits by $110 million. |
3
Table of Contents
| • | October 2012 – Acquired First Community Bancshares, Inc. in Overland Park, Kansas, which increased our deposits by approximately $515 million. At the time of acquisition, First Community had total assets of approximately $595 million, which significantly increased our total asset size and provided us with ten additional branches in Western Missouri and five additional branches in Kansas City. |
| • | October 2015 – Acquired First Independence Corporation of Independence, the registered savings and loan holding company for First Federal Savings & Loan of Independence, based in Independence, Kansas. First Independence operated four full service branches in Southeastern Kansas, which represents a new market for us. At the time of acquisition, First Independence had consolidated total assets of $135.0 million, total deposits of $87.1 million and total loans of $89.9 million. |
In conjunction with our strategic acquisition growth, we strive to reposition and improve the loan portfolio and deposit mix of the banks we acquire. Following our acquisitions, we focus on identifying and disposing of problematic loans and replacing them with higher quality loans generated organically. In addition, we have focused on growth in our commercial loan portfolio, which we believe generally offers higher return opportunities than our consumer loan portfolio, primarily by hiring additional talented bankers, particularly in our metropolitan markets, and incentivizing our bankers to expand their commercial banking relationships. We also seek to increase our most attractive deposit accounts, primarily by growing deposits in our community markets and cross-selling our depository products to our loan customers.
As a result of these strategic and organic growth efforts, since our inception through December 31, 2015, we have expanded our team of full-time equivalent employees from 19 to 297, and our network of branches from two to 29. We believe that we are well positioned to continue to be a strategic consolidator of community banks, while maintaining our history of attracting experienced and entrepreneurial bankers and organically growing our loans and deposits.
Our Initial Public Offering
We completed the underwritten initial public offering (“IPO”) of our common stock on November 16, 2015, where we sold an aggregate of 2,231,000 shares of our common stock at a price to the public of $22.50 per share. Our common stock began trading on the NASDAQ Global Select Market on November 11, 2015 under the ticker symbol “EQBK.”
Our Strategies
We believe we are a leading provider of commercial and personal banking services to businesses and business owners as well as individuals in our targeted Midwestern markets. Our strategy is to continue strategically consolidating community banks within such markets and maintaining our organic growth, while preserving our asset quality through disciplined lending practices.
| • | Strategic Consolidation of Community Banks. We believe our strategy of selectively acquiring and integrating community banks has provided us with economies of scale and improved our overall franchise efficiency. We expect to continue to pursue strategic acquisitions and believe our targeted market areas present us with many and varied acquisition opportunities. The following map illustrates the headquarters of potential acquisition opportunities broken out by asset size between $50.0 million and $1.5 billion within our target footprint. |
4
Table of Contents
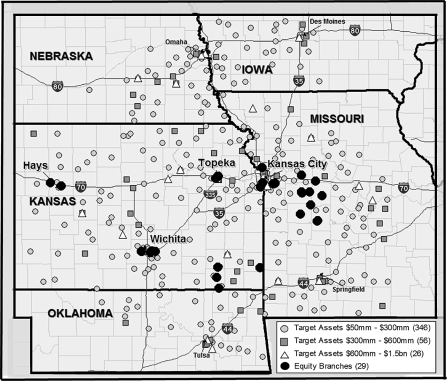
We believe many of these banks will continue to be burdened by new and more complex banking regulations, resource constraints, competitive limitations, rising technological and other business costs, management succession issues and liquidity concerns.
Despite the significant number of opportunities, we intend to continue to employ a disciplined approach to our acquisition strategy and only seek to identify and partner with financial institutions that possess attractive market share, low-cost deposit funding and compelling noninterest income-generating businesses. We believe consolidation will lead to organic growth opportunities for us following the integration of businesses we acquire. We also expect to continue to manage our branch network in order to ensure effective coverage for customers while minimizing any geographic overlap and driving corporate efficiency.
| • | Enhance the Performance of the Banks We Acquire. We strive to successfully integrate the banks we acquire into our existing operational platform and enhance stockholder value through the creation of efficiencies within the combined operations. As a result of our acquisition history, we believe we have developed an experienced approach to integration that seeks to identify and execute on such synergies, particularly in the areas of technology, data processing, compliance and human resources, while generating earnings growth. We believe that our experience and reputation as a successful integrator and acquiror will allow us to continue to capitalize on additional opportunities within our markets in the future. |
| • | Focus on Lending Growth in Our Metropolitan Markets While Increasing Deposits in Our Community Markets. We are focused on continuing to grow organically and believe the markets in which we operate currently provide meaningful opportunities to expand our commercial customer base and increase our current market share. We believe our branch network is strategically split between growing metropolitan markets, such as Kansas City and Wichita, and stable community markets within Western Kansas, Western Missouri and Topeka. We believe this diverse geographic footprint provides us with access to low cost, stable core deposits in community markets that we can use to fund commercial loan growth in our metropolitan markets. The following table shows our total deposits and |
5
Table of Contents
| loans (net of allowances) in our community markets and our metropolitan markets as of December 31, 2015, which we believe illustrates our execution of this strategy. |
| Deposits | Loans | |||||||||||||||
| Amount(1) | Overall % | Amount(1) | Overall % | |||||||||||||
| Metropolitan markets(2) |
$ | 436,338 | 36 | % | $ | 671,630 | 70 | % | ||||||||
| Community markets(3) |
$ | 779,576 | 64 | % | $ | 283,219 | 30 | % | ||||||||
| (1) | Amounts in thousands. |
| (2) | Represents 10 branches located in the Wichita and Kansas City metropolitan statistical areas, or MSAs. |
| (3) | Represents 19 branches located outside of the Wichita and Kansas City MSAs. |
Our team of seasoned bankers represents an important driver of our organic growth by expanding banking relationships with current and potential customers. We expect to continue to make opportunistic hires of talented and entrepreneurial bankers, particularly in our metropolitan markets, to further augment our growth. Our bankers are incentivized to increase the size of their loan and deposit portfolios and generate fee income while maintaining strong credit quality. We also seek to cross-sell our various banking products, including our deposit and treasury wealth management products, to our commercial loan customers, which we believe provides a basis for expanding our banking relationships as well as a stable, low-cost deposit base. We believe we have built a scalable platform that will support this continued organic growth.
| • | Preserve Our Asset Quality Through Disciplined Lending Practices. Our approach to credit management uses well-defined policies and procedures, disciplined underwriting criteria and ongoing risk management. We believe we are a competitive and effective commercial and industrial lender, supplementing ongoing and active loan servicing with early-stage credit review provided by our bankers. This approach has allowed us to maintain loan growth with a diversified portfolio of high quality assets. We believe our credit culture supports accountable bankers, who maintain an ability to expand our customer base as well as make sound decisions for our Company. We believe our success in managing asset quality is illustrated by our aggregate net charge-off history. |
Our Competitive Strengths
We believe the following competitive strengths will allow us to continue to achieve our principal objective of increasing stockholder value and generating consistent earnings growth through the organic and strategic expansion of our commercial banking franchise:
| • | Experienced Leadership and Management Team. Our seasoned and experienced executive management team, senior leaders and board of directors have exhibited the ability to deliver stockholder value by consistently growing profitably while expanding our commercial banking franchise through acquisition and integration. The members of our executive management team have, on average, more than twenty years’ experience working for large, billion-dollar-plus financial institutions in our markets during various economic cycles and have significant mergers and acquisitions experience in the financial services industry. Our executive management team has instilled a transparent and entrepreneurial culture that rewards leadership, innovation, and problem solving. |
| • | Focus on Commercial Banking. We are primarily a commercial bank. As measured by outstanding balances as of December 31, 2015, commercial loans composed over 70.5% of our loan portfolio, and within our commercial loan portfolio, 61.3% of such loans were commercial real estate loans and 38.7% were commercial and industrial loans. We believe we have developed strong commercial relationships in our markets across a diversified range of sectors, including key areas supporting regional and local economic activity and growth, such as manufacturing, freight/transportation, |
6
Table of Contents
| consumer services, franchising and commercial real estate. We believe we have also been successful in attracting customers from larger competitors because of our flexible and responsive approach in providing banking solutions tailored to meet our customers’ needs while maintaining disciplined underwriting standards. Our relationship-based approach seeks to grow lending relationships with our customers as they expand their businesses, including geographically and through cross-selling our various other banking products, such as our deposit and treasury management products. We have a growing presence in attractive commercial banking markets, such as Wichita and Kansas City, which we believe present significant opportunities to continue to increase our business banking activities. |
| • | Our Ability to Consolidate. Our branches are strategically located within metropolitan markets, such as Kansas City and Wichita as well as stable community markets that present opportunities to expand our market share. Our executive management team has identified significant acquisition and consolidation opportunities, ranging from small to large community banking institutions. We believe our track record of strategic acquisitions and effective integrations, combined with our expertise in our markets and scalable platform, will allow us to capitalize on these growth opportunities. |
| • | Disciplined Acquisition Approach. Our disciplined approach to acquisitions, consolidations and integrations, includes the following: (i) selectively acquiring community banking franchises only at appropriate valuations, after taking into account risks that we perceive with respect to the targeted bank; (ii) completing comprehensive due diligence and developing an appropriate plan to address any legacy credit problems of the targeted institution; (iii) identifying an achievable cost savings estimate and holding our management accountable for achieving such estimates; (iv) executing definitive acquisition agreements that we believe provide adequate protections to us; (v) installing our credit procedures, audit and risk management policies and procedures and compliance standards upon consummation of the acquisition; (vi) collaborating with the target’s management team to execute on synergies and cost saving opportunities related to the acquisition; (vii) involving a broader management team across multiple departments in order to help ensure the successful integration of all business functions; and (viii) scheduling the acquisition closing date to occur simultaneously with the platform conversion date. We believe this approach allows us to realize the benefits of the acquisition and create stockholder value, while appropriately managing risk. |
| • | Efficient and Scalable Platform with Capacity to Support Our Growth. Through significant investments in technology and staff, our management team has built an efficient and scalable corporate infrastructure within our commercial banking franchise, including in the areas of banking processes, technology, data processing, underwriting and risk management, which we believe will support our continued growth. While expanding our infrastructure, several departmental functions have been outsourced to gain the experience of outside professionals while at the same time achieving more favorable economics and cost-effective solutions. Such outsourced areas include the internal audit function, investment securities management, and select loan review. This outsourcing strategy has proven to control costs while adding enhanced controls and/or service levels. We believe that this scalable infrastructure will continue to allow us to efficiently and effectively manage our anticipated growth. |
| • | Culture Committed to Talent Development, Transparency and Accountability. We have invested in professional talent since our inception by building a team of “business persons first and bankers second” and economically aligned them with our stockholders, primarily through our stock purchase opportunities. In our efforts to become a destination for seasoned bankers with an entrepreneurial spirit, we have developed numerous leadership development programs. For example, “Equity University” is a year-long program we designed for our promising company-wide leaders. In addition, in 2014 Equity Bank was named one of the “Best Places to Work” by the Wichita Business Journal, and in 2015, the Wichita Business Journal named Equity Bank a “Best in Business” winner. We believe our well-trained and motivated professionals work most effectively in a corporate environment that emphasizes transparency, respect, innovation and accountability. Our culture provides our professionals with the empowerment to better serve our clients and our communities. |
7
Table of Contents
| • | Sophisticated and Customized Banking Products with High-Quality Customer Service. We strive to offer our customers the sophisticated commercial banking products of large financial institutions with the personalized service of a community bank. Our management team’s significant banking and lending experience in our markets has provided us with an understanding of the commercial banking needs of our customers, which allows us to tailor our products and services to meet our customers’ needs. In addition to offering a diverse array of banking products and services, we offer our customers the high-touch, relationship-based customer service experience of a community bank. For example, we utilize Flight, a customized customer relationship management system, to assign relationship officers to enhance our relationships with our customers and to identify and meet their particular needs. |
| • | Strong Risk Management Practices. We place significant emphasis on risk management as an integral component of our organizational culture without sacrificing growth. We believe our comprehensive risk management system is designed to make sure that we have sound policies, procedures, and practices for the management of key risks under our risk framework (which includes market, operational, liquidity, interest rate sensitivity, credit, insurance, regulatory, legal and reputational risk) and that any exceptions are reported by senior management to our board of directors or audit committee. Our risk management practices are overseen by the Chairmen of our audit and risk committees, who have more than 60 years of combined banking experience, and our Chief Risk Officer, who has more than 30 years of banking experience. We believe that our enterprise risk management philosophy has been important in gaining and maintaining the confidence of our various constituencies and growing our business and footprint within our markets. We also believe our strong risk management practices are manifested in our asset quality statistics. |
Recent Developments
On January 4, 2016, a portion of the proceeds of the IPO were used to redeem the Series C preferred stock at a liquidation amount of $16.4 million and to repay the bank stock loan in the amount of $18.6 million.
On January 28, 2016, the Company entered into an agreement that provides for a maximum borrowing facility of $20.0 million, secured by the Company’s stock in Equity Bank. The borrowing facility will mature on January 26, 2017. Each draw of funds on the facility will create a separate note that is repayable over a term of five years. Each note will bear interest at a variable interest rate equal to the prime rate published in the “Money Rates” section of the Wall Street Journal (or any generally recognized successor), floating daily. Accrued interest and principal payments will be due quarterly with one final payment of unpaid principal and interest due at the end of the five year term of each separate note. The Company is also required to pay an unused commitment fee in an amount equal to twenty basis points per annum on the unused portion of the maximum borrowing facility.
Our Banking Services
A general description of the range of commercial banking products and other services we offer follows.
Lending Activities
We offer a variety of loans, including commercial and industrial, commercial real estate-backed loans (including loans secured by owner occupied commercial properties), commercial lines of credit, working capital loans, term loans, equipment financing, acquisition, expansion and development loans, borrowing base loans, real estate construction loans, homebuilder loans, agricultural, government guaranteed loans, letters of credit and other loan products to national and regional companies, restaurant franchisees, hoteliers, real estate developers, manufacturing and industrial companies, agribusiness companies and other businesses. We also offer various consumer loans to individuals and professionals including residential real estate loans, home equity loans, home equity lines of credit ( “HELOCs”), installment loans, unsecured and secured personal lines of credit, overdraft protection and letters of credit. Lending activities originate from the relationships and efforts of our bankers, with an emphasis on providing banking solutions tailored to meet our customers’ needs while maintaining our underwriting standards.
8
Table of Contents
At December 31, 2015, we had total loans of $954.8 million (net of allowances), representing 60.2% of our total assets. For additional information concerning our loan portfolio, see “Item 7 – Management’s Discussion and Analysis of Financial Condition and Results of Operations – Financial Condition – Loan Portfolio.”
Concentrations of Credit Risk. Most of our lending activity is conducted with businesses and individuals in metropolitan Kansas City and Wichita. Our loan portfolio consists primarily of commercial and industrial loans, which were $260.7 million and constituted 27.3% of our total loans net of allowances as of December 31, 2015, commercial real estate loans, which were $395.0 million and constituted 41.4% of our total loans net of allowances as of December 31, 2015, and residential real estate loans, which were $248.4 million and constituted 26.0% of our total loans net of allowances as of December 31, 2015. Our commercial real estate loans are generally secured by first liens on real property. The remaining commercial and industrial loans are typically secured by general business assets, accounts receivable inventory and/or the corporate guaranty of the borrower and personal guaranty of its principals. The geographic concentration subjects the loan portfolio to the general economic conditions within Kansas and Missouri. The risks created by such concentrations have been considered by management in the determination of the adequacy of the allowance for loan losses. Management believes the allowance for loan losses is adequate to cover incurred losses in our loan portfolio as of December 31, 2015.
Sound risk management practices and appropriate levels of capital are essential elements of a sound commercial real estate lending program. Concentrations of commercial real estate exposures add a dimension of risk that compounds the risk inherent in individual loans. Interagency guidance on commercial real estate concentrations describe sound risk management practices which include board and management oversight, portfolio management, management information systems, market analysis, portfolio stress testing and sensitivity analysis, credit underwriting standards, and credit risk review functions. Management believes these practices allow us to monitor concentrations in commercial real estate in our loan portfolio.
Large Credit Relationships. As of December 31, 2015, the aggregate amount of loans to our ten largest borrowers (including related entities) amounted to approximately $160.3 million, or 16.7% of total loans. See “Item 1A – Risk Factors – Risks Related to Our Business – Our largest loan relationships currently make up a material percentage of our total loan portfolio.”
Loan Underwriting and Approval. Historically, we believe we have made sound, high quality loans while recognizing that lending money involves a degree of business risk. We have loan policies designed to assist us in managing this business risk. These policies provide a general framework for our loan origination, monitoring and funding activities, while recognizing that not all risks can be anticipated. Our board of directors delegates loan authority up to board-approved hold limits collectively to our Directors’ credit committee, which is comprised of members of our board of directors. Our board of directors also delegates limited lending authority to our internal loan committee, which is comprised of members of our executive management team. In addition, our board of directors also delegates more limited lending authority to our Chief Executive Officer, Chief Credit Officer, credit risk personnel, and, on a further limited basis, to selected lending managers in each of our target markets. Lending officers and relationship managers, including our bankers, have further limited individual loan authority. When the total relationship exceeds an individual’s loan authority, a higher authority or credit committee approval is required. The objective of our approval process is to provide a disciplined, collaborative approach to larger credits while maintaining responsiveness to client needs.
Loan decisions are documented as to the borrower’s business, purpose of the loan, evaluation of the repayment source and the associated risks, evaluation of collateral, covenants and monitoring requirements, and the risk rating rationale. Our strategy for approving or disapproving loans is to follow conservative loan policies and consistent underwriting practices which include:
| • | maintaining close relationships among our customers and their designated banker to ensure ongoing credit monitoring and loan servicing; |
| • | granting credit on a sound basis with full knowledge of the purpose and source of repayment for such credit; |
9
Table of Contents
| • | ensuring that primary and secondary sources of repayment are adequate in relation to the amount of the loan; |
| • | developing and maintaining targeted levels of diversification for our loan portfolio as a whole and for loans within each category; and |
| • | ensuring that each loan is properly documented and that any insurance coverage requirements are satisfied. |
Managing credit risk is a Company-wide process. Our strategy for credit risk management includes well-defined, centralized credit policies, uniform underwriting criteria and ongoing risk monitoring and review processes for all credit exposures. Our processes emphasize early-stage review of loans, regular credit evaluations and management reviews of loans, which supplement the ongoing and proactive credit monitoring and loan servicing provided by our bankers. Our Chief Credit Officer provides Company-wide credit oversight and periodically reviews all credit risk portfolios to ensure that the risk identification processes are functioning properly and that our credit standards are followed. In addition, a third-party loan review is performed to assist in the identification of problem assets and to confirm our internal risk rating of loans. We attempt to identify potential problem loans early in an effort to seek aggressive resolution of these situations before the loans become a loss, record any necessary charge-offs promptly and maintain adequate allowance levels for probable loan losses incurred in the loan portfolio.
Our loan policies generally include other underwriting guidelines for loans collateralized by real estate. These underwriting standards are designed to determine the maximum loan amount that a borrower has the capacity to repay based upon the type of collateral securing the loan and the borrower’s income. Such loan policies include maximum amortization schedules and loan terms for each category of loans collateralized by liens on real estate.
In addition, our loan policies provide guidelines for personal guarantees; an environmental review; loans to employees, executive officers and directors; problem loan identification; maintenance of an adequate allowance for loan losses and other matters relating to lending practices.
Lending Limits. Our lending activities are subject to a variety of lending limits imposed by federal law. In general, the Bank is subject to a legal lending limit on loans to a single borrower based on the Bank’s capital level. The dollar amounts of the Bank’s lending limit increases or decreases as the Bank’s capital increases or decreases. The Bank is able to sell participations in its larger loans to other financial institutions, which allows it to manage the risk involved in these loans and to meet the lending needs of its customers requiring extensions of credit in excess of these limits.
The Bank’s legal lending limit as of December 31, 2015 on loans to a single borrower was $34.8 million. However, we typically maintain an in-house limit of $15.0 million for loans to a single borrower. We have strict policies and procedures in place for the establishment of hold limits with respect to specific products and businesses and evaluating exceptions to the hold limits for individual relationships.
Our loan policies provide general guidelines for loan-to-value ratios that restrict the size of loans to a maximum percentage of the value of the collateral securing the loans, which percentage varies by the type of collateral. Our internal loan-to-value limitations follow limits established by applicable law.
Loan Types. We provide a variety of loans to meet our customers’ needs. The section below discusses our general loan categories.
Commercial and Industrial Loans. We make commercial and industrial loans, including commercial lines of credit, working capital loans, commercial real estate-backed loans (including loans secured by owner occupied commercial properties), term loans, equipment financing, acquisition, expansion and development loans, borrowing base loans, real estate construction loans, homebuilder loans, restaurant franchisees, hoteliers,
10
Table of Contents
government guaranteed loans, letters of credit and other loan products, primarily in our target markets that are underwritten on the basis of the borrower’s ability to service the debt from income. We take as collateral a lien on general business assets including, among other things, available real estate, accounts receivable, inventory and equipment and generally obtain a personal guaranty of the borrower or principal. Our commercial and industrial loans generally have variable interest rates and terms that typically range from one to five years depending on factors such as the type and size of the loan, the financial strength of the borrower/guarantor and the age, type and value of the collateral. Fixed rate commercial and industrial loan maturities are generally short-term, with three-to-five year maturities, or include periodic interest rate resets. Terms greater than five years may be appropriate in some circumstances, based upon the useful life of the underlying asset being financed or if some form of credit enhancement, such as a government guarantee is obtained.
We also participate in syndicated loans (loans made by a group of lenders, including us, who share or participate in a specific loan) with a larger regional financial institution as the lead lender. Syndicated loans are typically made to large businesses (which are referred to as shared national credits) or middle market companies (which do not meet the regulatory definition of shared national credits), both of which are secured by business assets or equipment, and also commercial real estate. The syndicate group for both types of loans usually consists of two to three other financial institutions. In particular, we frequently work with a large regional financial institution, which is often the lead lender with respect to these loans. We have grown this portfolio to diversify our balance sheet, increase our yield and mitigate interest rate risk due to the variable rate pricing structure of the loans. We have a defined set of credit guidelines that we use when evaluating these credits. Although other large financial institutions are the lead lenders on these loans, our credit department does its own independent review of these loans and the approval process of these loans is consistent with our underwriting of loans and our lending policies. We expect to continue our syndicated lending program for the foreseeable future.
In 2015, we began to participate in mortgage finance loans with another institution, “the originator.” These mortgage finance loans consist of ownership interests purchased in single family residential mortgages funded through the originator’s mortgage finance group. These loans are typically on our balance sheet for 10 to 20 days. We have grown this portfolio with the intent to diversify our balance sheet, increase our yield compared to other short term investment opportunities and mitigate interest rate risk due to the variable rate pricing structure of the loans. We have a defined set of credit guidelines we use when evaluating these loans, our credit department does its own independent review of these loans and the approval process of these loans is consistent with our underwriting of loans and our lending policies. We expect to continue our mortgage finance lending program for the foreseeable future.
In general, commercial and industrial loans may involve increased credit risk and, therefore, typically yield a higher return. The increased risk in commercial and industrial loans derives from the expectation that such loans generally are serviced principally from the operations of the business, and those operations may not be successful. Any interruption or discontinuance of operating cash flows from the business, which may be influenced by events not under the control of the borrower such as economic events and changes in governmental regulations, could materially affect the ability of the borrower to repay the loan. In addition, the collateral securing commercial and industrial loans generally includes moveable property such as equipment and inventory, which may decline in value more rapidly than we anticipate exposing us to increased credit risk. As a result of these additional complexities, variables and risks, commercial and industrial loans require extensive underwriting and servicing.
Commercial Real Estate Loans. We make commercial mortgage loans collateralized by real estate, which may be owner occupied or non-owner occupied real estate. Commercial real estate lending typically involves higher loan principal amounts and the repayment is dependent, in large part, on sufficient income from the properties securing the loans to cover operating expenses and debt service. We require our commercial real estate loans to be secured by well-managed property with adequate margins and generally obtain a guarantee from responsible parties. Our commercial mortgage loans generally are collateralized by first liens on real estate, have variable or fixed interest rates and amortize over a 10-to-20 year period with balloon payments or rate adjustments due at the
11
Table of Contents
end of three to seven years. Periodically, we will utilize an interest rate swap to hedge against long term fixed rate exposures. Commercial mortgage loans considered for interest rate swap hedging typically have terms of greater than five years.
Payments on loans secured by such properties are often dependent on the successful operation (in the case of owner occupied real estate) or management (in the case of non-owner occupied real estate) of the properties. Accordingly, repayment of these loans may be subject to adverse conditions in the real estate market or the economy to a greater extent than other types of loans. In underwriting commercial real estate loans, we seek to minimize these risks in a variety of ways, including giving careful consideration to the property’s age, condition, operating history, future operating projections, current and projected market rental rates, vacancy rates, location and physical condition. The underwriting analysis also may include credit verification, reviews of appraisals, environmental hazards or reports, the borrower’s liquidity and leverage, management experience of the owners or principals, economic condition and industry trends.
Real Estate Construction Loans. We make loans to finance the construction of residential and non-residential properties. Construction loans generally are collateralized by first liens on real estate and have floating interest rates. We conduct periodic inspections, either directly or through an agent, prior to approval of periodic draws on these loans. Underwriting guidelines similar to those described above also are used in our construction lending activities. Our construction loans have terms that typically range from six months to two years depending on factors such as the type and size of the development and the financial strength of the borrower/guarantor. Loans are typically structured with an interest only construction period. Loans are underwritten to either mature at the completion of construction, or transition to a traditional amortizing commercial real estate facility at the completion of construction, in line with other commercial real estate loans held at the bank.
Construction loans generally involve additional risks attributable to the fact that loan funds are advanced upon the security of a project under construction, and the project is of uncertain value prior to its completion. Because of uncertainties inherent in estimating construction costs, the market value of the completed project and the effects of governmental regulation on real property, it can be difficult to accurately evaluate the total funds required to complete a project and the related loan-to-value ratio. As a result of these uncertainties, construction lending often involves the disbursement of substantial funds with repayment dependent, in part, on the success of the ultimate project rather than the ability of a borrower or guarantor to repay the loan. If we are forced to foreclose on a project prior to completion, there is no assurance that we will be able to recover the entire unpaid portion of the loan. In addition, we may be required to fund additional amounts to complete a project and it may be necessary to hold the property for an indeterminate period of time subject to the regulatory limitations imposed by local, state or federal laws.
1 – 4 Family Residential Mortgages. We make residential real estate loans collateralized by owner occupied properties located in our market areas. We offer a variety of mortgage loan products with amortization periods up to 30 years including traditional 30-year fixed loans and various adjustable rate mortgages. Typically, loans with a fixed interest rate of greater than 10 years are held for sale and sold on the secondary market, and adjustable rate mortgages are held for investment. However, in connection with the acquisition of First Independence, we acquired $71 million in residential real estate loans, with a substantial amount having fixed interest rate terms of greater than 10 years. Loans collateralized by one-to-four family residential real estate generally are originated in amounts of no more than 80% of appraised value. Home equity loans and HELOCs are generally limited to a combined loan-to-value ratio of 80%, including the subordinate lien. We retain a valid lien on real estate, obtain a title insurance policy that insures that the property is free from encumbrances and require hazard insurance.
From time to time we have purchased pools of residential mortgages originated by other financial institutions to hold for investment with the intent to diversify our residential mortgage loan portfolio, and increase our yield. These loans purchased typically have an adjustable rate with a fixed period of no more than 10-years, and are collateralized by one-to-four family residential real estate. We have a defined set of credit guidelines that we use
12
Table of Contents
when evaluating these credits. Although these loans were originated and underwritten by another institution, our mortgage and credit departments do their own independent review of these loans.
Agricultural Loans. We offer both fixed-rate and adjustable-rate agricultural real estate loans to our customers. We also make loans to finance the purchase of machinery, equipment and breeding stock, seasonal crop operating loans used to fund the borrower’s crop production operating expenses, livestock operating and revolving loans used to purchase livestock for resale and related livestock production expense.
Generally, our agricultural real estate loans amortize over periods not in excess of 20 years and have a loan-to-value ratio of 80%. We also originate agricultural real estate loans directly and through programs sponsored by the Farmers Home Administration, an agency of the United States Department of Agriculture (“FHA”), which provides a partial guarantee on loans underwritten to FHA standards. Agricultural real estate loans generally carry higher interest rates and have shorter terms than 1-4 family residential real estate loans. Agricultural real estate loans, however, entail additional credit risks compared to one- to four-family residential real estate loans, as they typically involve larger loan balances concentrated with single borrowers or groups of related borrowers We generally require farmers to obtain multi-peril crop insurance coverage through a program partially subsidized by the Federal government to help mitigate the risk of crop failures.
Agricultural operating loans are generally originated at an adjustable- or fixed-rate of interest and generally for a term of up to 7 years. In the case of agricultural operating loans secured by breeding livestock and/or farm equipment, such loans are originated at fixed rates of interest for a term of up to 5 years. We typically originate agricultural operating loans on the basis of the borrower’s ability to make repayment from the cash flow of the borrower’s agricultural business. As a result, the availability of funds for the repayment of agricultural operating loans may be substantially dependent on the success of the business itself and the general economic environment. A significant number of agricultural borrowers with these types of loans may qualify for relief under a chapter of the U.S. Bankruptcy Code that is designed specifically for the reorganization of financial obligations of family farmers and which provides certain preferential procedures to agricultural borrowers compared to traditional bankruptcy proceedings pursuant to other chapters of the U.S. Bankruptcy Code.
Consumer Loans. We make a variety of loans to individuals for personal and household purposes, including secured and unsecured term loans and home improvement loans. Consumer loans are underwritten based on the individual borrower’s income, current debt level, past credit history and the value of any available collateral. The terms of consumer loans vary considerably based upon the loan type, nature of collateral and size of the loan. Consumer loans entail greater risk than do residential real estate loans because they may be unsecured or, if secured, the value of the collateral, such as an automobile or boat, may be more difficult to assess and more likely to decrease in value than real estate. In such cases, any repossessed collateral for a defaulted consumer loan may not provide an adequate source of repayment for the outstanding loan balance. The remaining deficiency often will not warrant further substantial collection efforts against the borrower beyond obtaining a deficiency judgment. In addition, consumer loan collections are dependent on the borrower’s continuing financial stability, and thus are more likely to be adversely affected by job loss, divorce, illness or personal bankruptcy. Furthermore, the application of various federal and state laws may limit the amount which can be recovered on such loans.
Deposit Products
Our lending and investing activities are primarily funded by deposits. We offer a variety of deposit accounts with a wide range of interest rates and terms including demand, savings, money market and time deposits with the goal of attracting a wide variety of customers, including small to medium-sized businesses. We employ customer acquisition strategies to generate new account and deposit growth, such as customer referral incentives, search engine optimization, targeted direct mail and email campaigns, in addition to conventional marketing initiatives and advertising. Our goal is to emphasize our Signature Deposits and cross-sell our deposit products to our loan customers.
13
Table of Contents
We design our consumer deposit products specifically for the lifestyles of clients in the communities we serve. Some accounts emphasize and reward debit card usage, while others appeal to higher deposit customers. We also utilize Flight, which is our customer relationship management system, to assist our personnel in deepening and expanding current relationships by providing timely identification of potential needs. It also serves as a methodical tool to track customer onboarding and retention actions by account officers. While we do not actively solicit wholesale deposits for funding purposes and do not partner with deposit brokers, we do participate in the CDARS service via Promontory Interfinancial Network an as option for our customers to place funds.
We also from time to time bid for, and accept, deposits from public entities in our markets.
Other Products and Services
We offer banking products and services that are competitively priced with a focus on convenience and accessibility. We offer a full suite of online banking solutions including access to account balances, online transfers, online bill payment and electronic delivery of customer statements, mobile banking solutions for iPhone and Android phones, including remote check deposit with mobile bill pay. We offer extended drive-through hours, ATMs and banking by telephone, mail and personal appointment. We offer debit cards with no ATM surcharges or foreign ATM fees for checking customers, plus night depository, direct deposit, cashier’s and travelers checks and letters of credit, as well as treasury management services, wire transfer services and automated clearing house (“ACH”) services.
We offer a full array of commercial treasury management services designed to be competitive with banks of all sizes. Treasury Management Services include balance reporting (including current day and previous day activity), transfers between accounts, wire transfer initiation, ACH origination and stop payments. Cash management deposit products consist of lockbox, remote deposit capture, positive pay, reverse positive pay, account reconciliation services, zero balance accounts and sweep accounts including loan sweep.
Our Markets
We currently conduct banking operations through our 29 full service branches located in Kansas and Missouri. We believe that an important factor contributing to our historical performance and our ability to execute our strategy is the attractiveness and specific characteristics of our existing and target markets. In particular, we believe our markets provide us with access to low cost, stable core deposits in smaller community markets that we can use to fund commercial loan growth in metropolitan areas.
We believe our existing and target markets are among some of the most attractive in the Midwestern United States. Our markets are home to thousands of manufacturing and trade jobs, and have experienced recent growth in the healthcare, consumer services and technology sectors. We believe the central geographic footprint of our markets provides numerous industrial plants, facilities and manufacturing businesses with a central shipping location from which they can distribute their products. In addition, many of the jobs within these industries in our market are highly specialized, and as a result, employees receive a premium in wages. For example, according to the Bureau of Labor Statistics, during 2014 manufacturing employees in Kansas City, one of our largest markets, received an annual average salary that was 10% higher than the annual average salary received by aerospace engineers in the United States. Our markets also serve as the corporate headquarters for Koch Industries Inc., Hallmark Cards, Inc., H&R Block, Inc., Sprint Corporation, Cerner Corporation, AMC Entertainment Holdings, Inc., Garmin International, Inc., Cessna Aircraft Company, Seaboard Corporation, Cargill Meat Solutions and The Coleman Company and host a major presence for companies across a variety of industries, including Spirit AeroSystems, Inc., Bombardier Learjet, Collective Brands, Inc., Hills Pet Nutrition, Inc., Beechcraft Corporation, Bayer Corporation and Dean & Deluca, Inc. We understand the community banking needs of the businesses and individuals within our markets and have focused on developing a commercial and personal banking platform to service such needs.
14
Table of Contents
The markets in which we operate have generally experienced stable population growth over the past five years, with modest population growth expected over the next five years. Wichita is the largest MSA in Kansas with a population of over 640,000, and Kansas City is the 29th largest MSA in the U.S. with a population of more than 2 million. In addition, over the next five years our markets are projected to experience moderate compounded annual growth in consumer and commercial deposits. Our markets are stable and have weathered various economic cycles relatively well. According to the FDIC, the aggregate noncurrent loans as a percentage of loans for all reporting institutions in both Kansas and Missouri were less than those of the United States during pre-recession periods (2005-2007), the most recent recession years (2008-2011) and post-recession years (2012-2014). More specifically, reporting banks nationwide posted average quarterly figures of 0.85%, 4.12% and 3.02% in the respective aforementioned time periods, while Kansas posted average quarterly figures of 0.78%, 2.76%, 1.53%, respectively, and Missouri posted average quarterly figures of 0.70%, 2.86%, and 1.77%, respectively.
We compete for loans, deposits and financial services in our markets against many other bank and nonbank institutions, including community banks, regional banks, national banks, Internet-based banks, money market and mutual funds, brokerage houses, credit unions, mortgage companies and insurance companies. We believe that our comprehensive suite of sophisticated banking products provides us with a competitive advantage over smaller community banks within our markets while our high-quality, relationship-based customer service will allow us to take market share from larger regional and national banks. In addition, our markets present significant acquisition, integration and consolidation opportunities, and we expect to continue to pursue strategic acquisitions in our markets. We believe that many small to mid-sized banking organizations that currently serve our markets are acquisition opportunities for us, either because of scale and operational challenges, regulatory pressures, management succession issues or stockholder liquidity needs. We think we offer an attractive solution for such banks because we retain the community banking feel and services upon which their customers expect and rely.
Information Technology Systems
We have made and continue to make significant investments in our information technology systems and staff for our banking and lending operations and treasury management activities. We believe this investment will support our continued growth and enable us to enhance our capabilities to offer new products and overall customer experience, and to provide scale for future growth and acquisitions. We utilize a nationally recognized software vendor, and their support allows us to operate our data processing and core systems in-house. Our internal network and e-mail systems are maintained in-house and we recently enhanced our back-up site at a decentralized location. This back-up site provides for redundancy and disaster recovery capabilities.
The majority of our other systems including our electronic funds transfer, transaction processing and our online banking services are hosted by third-party service providers. The scalability of this infrastructure will support our growth strategy. In addition, the tested capability of these vendors to automatically switch over to standby systems should allow us to recover our systems and provide business continuity quickly in case of a disaster.
Competition
The financial services industry is highly competitive. We compete for loans, deposits, and financial services in all of our principal markets. We compete directly with other bank and nonbank institutions located within our markets, Internet-based banks, out-of-market banks, and bank holding companies that advertise in or otherwise serve our markets, along with money market and mutual funds, brokerage houses, mortgage companies, and insurance companies or other commercial entities that offer financial services products. Competition involves efforts to retain current customers, obtain new loans and deposits, increase the scope and type of services offered, and offer competitive interest rates paid on deposits and charged on loans. Many of our competitors enjoy competitive advantages, including greater financial resources, a wider geographic presence, more accessible branch office locations, the ability to offer additional services, more favorable pricing alternatives, and lower
15
Table of Contents
origination and operating costs. Some of our competitors have been in business for a long time and have an established customer base and name recognition. We believe that our competitive pricing, personalized service, and community involvement enable us to effectively compete in the communities in which we operate.
Employees
As of December 31, 2015, we had approximately 297 full-time equivalent employees. None of our employees are represented by any collective bargaining unit or is a party to a collective bargaining agreement.
Available Information
The Company files reports, proxy statements and other information with the Securities and Exchange Commission, or SEC, under the Securities Exchange Act of 1934, as amended. You may read and copy this information at the SEC’s Public Reference Room, 100 F Street, N.E., Washington, D.C. 20549. You may obtain information on the operation of the Public Reference Room by calling the SEC at 1-800-SEC-0330. The SEC also maintains an internet site that contains reports, proxy and information statements and other information about issuers, like the Company, who file electronically with the SEC. The address of the site is http://www.sec.gov.
Documents filed by the Company with the SEC are available from the Company without charge (except for exhibits to the documents). You may obtain documents filed by the Company with the SEC by requesting them in writing or by telephone from the Company at the following address:
Equity Bancshares, Inc.
7701 East Kellogg Drive , Suite 200
Wichita, Kansas 67207
Attention: Investor Relations
Telephone: (316) 612-6000
Documents filed by the Company with the SEC are also available on the Company’s website, http://investor.equitybank.com. Information furnished by the Company and information on, or accessible through, the SEC’s or the Company’s website is not part of this Annual Report on Form 10-K.
Supervision and Regulation
Banking is a complex, highly regulated industry. Consequently, our growth and earnings performance can be affected, not only by management decisions and general and local economic conditions, but also by the statutes administered by and the regulations and policies of, various governmental regulatory authorities. These authorities include, but are not limited to, the Federal Reserve, the FDIC, the Office of the Comptroller of the Currency (“OCC”), the Kansas Office of State Bank Commissioner (“OSBC”), the Consumer Financial Protection Bureau (“CFPB”), the IRS, and state taxing authorities. The effect of these statutes, regulations and policies and any changes to any of them can be significant and cannot be predicted.
The primary goals of the bank regulatory scheme are to maintain a safe and sound banking system and to facilitate the conduct of sound monetary policy. In furtherance of those goals, the U.S. Congress and the individual states have created numerous regulatory agencies and enacted numerous laws, such as the Dodd-Frank Act, that govern banks and the banking industry. The system of supervision and regulation applicable to us establishes a comprehensive framework for our operations and is intended primarily for the protection of the FDIC’s deposit insurance funds, our depositors and the public, rather than the stockholders and creditors.
New regulations and statutes are regularly proposed that contain wide-ranging proposals for altering the structures, regulations and competitive relationships of financial institutions operating in the United States. The federal banking agencies have issued a number of significant new regulations as a result of the Dodd-Frank Act
16
Table of Contents
and a number of additional regulations are pending or may be proposed. We cannot predict whether or in what form any proposed regulation or statute will be adopted or the extent to which our businesses may be affected by any new regulation or statute.
The following is an attempt to summarize some of the relevant laws, rules and regulations governing banks and bank holding companies, but does not purport to be a complete summary of all applicable laws, rules and regulations governing banks. The descriptions are qualified in their entirety by reference to the specific statutes and regulations discussed.
Bank Holding Company Regulation
We are a bank holding company registered under the Bank Holding Company Act of 1956, as amended, or the BHC Act, and are subject to supervision and regulation by the Federal Reserve. Federal laws subject bank holding companies to particular restrictions on the types of activities in which they may engage and to a range of supervisory requirements and activities, including regulatory enforcement actions, for violation of laws and policies.
Activities Closely Related to Banking
The BHC Act prohibits a bank holding company, with certain limited exceptions, from acquiring direct or indirect ownership or control of more than five percent of the voting shares of any company that is not a bank or from engaging in any activities other than those of banking, managing or controlling banks and certain other subsidiaries or furnishing services to or performing services for its subsidiaries. Bank holding companies also may engage in or acquire interests in companies that engage in a limited set of activities that are so closely related to banking as to be a proper incident thereto. If a bank holding company has become a financial holding company, or an FHC, it may engage in a broader set of activities, including insurance underwriting and broker-dealer services as well as activities that are jointly determined by the Federal Reserve and the U.S. Treasury to be financial in nature or incidental to such financial activity. FHCs may also engage in activities that are determined by the Federal Reserve to be complementary to financial activities. We have not elected to be an FHC at this time. To maintain FHC status, the bank holding company and all subsidiary depository institutions must be “well managed” and “well capitalized.” Additionally, all subsidiary depository institutions must have received at least a “Satisfactory” rating on its most recent CRA examination. Failure to meet these requirements may result in limitations on activities and acquisitions.
Safe and Sound Banking Practices
Bank holding companies are not permitted to engage in unsafe and unsound banking practices. The Federal Reserve may order a bank holding company to terminate an activity or control of a non-bank subsidiary if such activity or control constitutes a significant risk to the financial safety, soundness or stability of a subsidiary bank and is inconsistent with sound banking principles. Regulation Y also requires a holding company to give the Federal Reserve prior notice of any redemption or repurchase of its own equity securities if the consideration to be paid, together with the consideration paid for any repurchases or redemptions in the preceding year, is equal to 10% or more of the company’s consolidated net worth.
Consistent with the Dodd-Frank Act codification of the Federal Reserve’s policy that bank holding companies must serve as a source of financial strength for their subsidiary banks, the Federal Reserve has stated that, as a matter of prudence, a bank holding company generally should not maintain a rate of distributions to stockholders unless its available net income has been sufficient to fully fund the distributions and the prospective rate of earnings retention appears consistent with a bank holding company’s capital needs, asset quality and overall financial condition.
In addition, the Federal Reserve Supervisory Letter SR 09-4 provides guidance on the declaration and payment of dividends, capital redemptions and capital repurchases by a bank holding company. Supervisory Letter SR 09-4 provides that, as a general matter, a bank holding company should eliminate, defer or significantly reduce its
17
Table of Contents
dividends if: (i) the bank holding company’s net income available to stockholders for the past four quarters, net of dividends previously paid during that period, is not sufficient to fully fund the dividends, (ii) the bank holding company’s prospective rate of earnings retention is not consistent with the bank holding company’s capital needs and overall current and prospective financial condition or (iii) the bank holding company will not meet, or is in danger of not meeting, its minimum regulatory capital adequacy ratios. Failure to do so could result in a supervisory finding that the bank holding company is operating in an unsafe and unsound manner.
Limitations on Equity Bank’s ability to pay dividends could, in turn, affect our ability to pay dividends to our stockholders. For more information concerning Equity Bank’s ability to pay dividends, see “Bank Regulation” below.
The Federal Reserve has broad authority to prohibit activities of bank holding companies and their non-banking subsidiaries which represent unsafe and unsound banking practices or which constitute violations of laws or regulations. Notably, the Financial Institutions Reform, Recovery and Enforcement Act of 1989, or FIRREA, provides that the Board of Governors of the Federal Reserve can assess civil money penalties for such practices or violations which can be as high as $1 million per day. FIRREA contains expansive provisions regarding the scope of individuals and entities against which such penalties may be assessed.
Annual Reporting and Examinations
We are required to file annual and quarterly reports with the Federal Reserve and such additional information as the Federal Reserve may require pursuant to the BHC Act. The Federal Reserve may examine a bank holding company or any of its subsidiaries and charge the company for the cost of such an examination. We are also subject to reporting and disclosure requirements under state and federal securities laws.
Rules on Regulatory Capital
Regulatory capital rules released in July 2013 pursuant to the Basel III requirements, or the Basel III rules, implement higher minimum capital requirements for bank holding companies and banks. The Basel III rules include a new common equity Tier 1 capital requirement and establish criteria that instruments must meet to be considered common equity Tier 1 capital, additional Tier 1 capital or Tier 2 capital. These enhancements are designed to both improve the quality and increase the quantity of capital required, on a fully phased-in basis, to be held by banking organizations, better equipping the U.S. banking system to deal with adverse economic conditions. The Basel III rules require banks and bank holding companies to maintain a minimum common equity Tier 1, or CET1, capital ratio of 4.5%, a total Tier 1 capital ratio of 6%, a total capital ratio of 8% and a leverage ratio of 4%. Once fully phased in, bank holding companies will also be required to hold a capital conservation buffer of CET1 capital of 2.5% to avoid limitations on capital distributions and executive compensation payments. Under the Basel III rules, bank holding companies must maintain a total risk-based capital ratio of 10% and a total Tier 1 risk-based capital ratio of 6% to be considered “well capitalized” for purposes of certain rules and requirements.
The Basel III rules also require banks to maintain a CET1 capital ratio of 6.5%, a total Tier 1 capital ratio of 8%, a total capital ratio of 10% and a leverage ratio of 5% to be deemed “well capitalized” for purposes of certain rules and prompt corrective action requirements. The risk-based ratios include a “capital conservation buffer” of 2.5%. The new capital conservation buffer requirement is to be phased in beginning in January 2016 at 0.625% of risk-weighted assets and will increase by that amount each year until fully implemented in January 2019. An institution would be subject to limitations on certain activities, including payment of dividends, share repurchases and discretionary bonuses to executive officers, if its capital level is below the buffer amount.
The Basel III rules attempt to improve the quality of capital by implementing changes to the definition of capital. Among the most important changes are stricter eligibility criteria for regulatory capital instruments that would disallow the inclusion of instruments, such as trust preferred securities, in Tier 1 capital going forward and new
18
Table of Contents
constraints on the inclusion of minority interests, mortgage-servicing assets, deferred tax assets and certain investments in the capital of unconsolidated financial institutions. In addition, the Basel III rules require that most regulatory capital deductions be made from CET1 capital.
Under the Basel III rules, to avoid limitations on capital distributions, including dividend payments and certain discretionary bonus payments to executive officers, a banking organization must hold a capital conservation buffer composed of common equity Tier 1 capital above its minimum risk-based capital requirements. This buffer will help to ensure that banking organizations conserve capital when it is most needed, allowing them to better weather periods of economic stress. The buffer is measured relative to risk-weighted assets.
The Federal Reserve may also set higher capital requirements for holding companies whose circumstances warrant it. For example, holding companies experiencing internal growth or making acquisitions are expected to maintain strong capital positions substantially above the minimum supervisory levels, without significant reliance on intangible assets. At this time, the bank regulatory agencies are more inclined to impose higher capital requirements to meet well capitalized standards and future regulatory change could impose higher capital standards as a routine matter. Our regulatory capital ratios and those of Equity Bank are in excess of the levels established for well capitalized institutions under the Basel III rules.
The Basel III rules also set forth certain changes in the methods of calculating certain risk-weighted assets, which in turn will affect the calculation of risk-based ratios. Under the Basel III rules, higher or more sensitive risk weights would be assigned to various categories of assets, including certain credit facilities that finance the acquisition, development or construction of real property, certain exposures or credits that are 90 days past due or on non-accrual, foreign exposures and certain corporate exposures. In addition, the Basel III rules include (i) alternative standards of credit worthiness consistent with the Dodd-Frank Act, (ii) greater recognition of collateral and guarantees and (iii) revised capital treatment for derivatives and repo-style transactions.
In addition, the Basel III rules include certain exemptions to address concerns about the regulatory burden on community banks. For example, banking organizations with less than $15 billion in consolidated assets as of December 31, 2009 are permitted to include in Tier 1 capital trust preferred securities and cumulative perpetual preferred stock issued and included in Tier 1 capital prior to May 19, 2010 on a permanent basis, without any phase out. Community banks were also permitted to make a one-time election in their March 31, 2015 quarterly filings to opt-out of the requirement to include most accumulated other comprehensive income, or AOCI, components in the calculation of CET1 capital and, in effect, retain the AOCI treatment under the current capital rules. Under the Basel III rules, we made the one-time, permanent election to continue to exclude AOCI from capital.
Imposition of Liability for Undercapitalized Subsidiaries
The Federal Deposit Insurance Corporation Improvement Act of 1991, or the FDICIA, required each federal banking agency to revise its risk-based capital standards to ensure that those standards take adequate account of interest rate risk, concentration of credit risk and the risks of nontraditional activities, as well as reflect the actual performance and expected risk of loss on multifamily mortgages.
Pursuant to the FDICIA, each federal banking agency has specified, by regulation, the levels at which an insured institution would be considered well capitalized, adequately capitalized, undercapitalized, significantly undercapitalized and critically undercapitalized. As of December 31, 2015, Equity Bank exceeded the capital levels required to be deemed well capitalized.
Additionally, FDICIA requires bank regulators to take prompt corrective action to resolve problems associated with insured depository institutions. In the event an institution becomes undercapitalized, it must submit a capital restoration plan.
19
Table of Contents
Under these prompt corrective action provisions of FDICIA, if a controlled bank is undercapitalized, then the regulators could require the bank to submit a capital restoration plan. If an institution becomes significantly undercapitalized or critically undercapitalized, additional and significant limitations are placed on the institution. The capital restoration plan of an undercapitalized institution will not be accepted by the regulators unless each company having control of the undercapitalized institution guarantees the subsidiary’s compliance with the capital restoration plan until it becomes adequately capitalized. We have control of Equity Bank for the purpose of this statute.
Further, by statute and regulation, a bank holding company must serve as a source of financial and managerial strength to each bank that it controls and, under appropriate circumstances, may be required to commit resources to support each such controlled bank. This support may be required at times when the bank holding company may not have the resources to provide the support. In addition, if the Federal Reserve believes that a bank holding company’s activities, assets or affiliates represent a significant risk to the financial safety, soundness or stability of a controlled bank, then the Federal Reserve could require the bank holding company to terminate the activities, liquidate the assets or divest the affiliates. The regulators may require these and other actions in support of controlled banks even if such actions are not in the best interests of the bank holding company or its stockholders.
Acquisitions by Bank Holding Companies
The BHC Act requires every bank holding company to obtain the prior approval of the Federal Reserve before it may acquire all or substantially all of the assets of any bank or ownership or control of any voting shares of any bank if after such acquisition it would own or control, directly or indirectly, more than 5% of the voting shares of such bank. In approving bank acquisitions by bank holding companies, the Federal Reserve is required to consider the financial and managerial resources and future prospects of the bank holding company and banks concerned, the convenience and needs of the communities to be served, the effect on competition as well as the financial stability of the United States. The Attorney General of the United States may, within 30 days after approval of an acquisition by the Federal Reserve, bring an action challenging such acquisition under the federal antitrust laws, in which case the effectiveness of such approval is stayed pending a final ruling by the courts. Under certain circumstances, the 30-day period may be shortened to 15 days.
Control Acquisitions
The Change in Bank Control Act, or the CBCA, prohibits a person or group of persons from acquiring “control” of a bank holding company unless the Federal Reserve has been notified and has not objected to the transaction. Under a rebuttable presumption established by the Federal Reserve, the acquisition of 10% or more of a class of voting stock of a bank holding company with a class of securities registered under Section 12 of the Exchange Act, such as ourselves, would, under the circumstances set forth in the presumption, constitute acquisition of control of us.
In addition, the CBCA prohibits any entity from acquiring 25% (the BHC Act has a lower limit for acquirers that are existing bank holding companies) or more of a bank holding company’s or bank’s voting securities, or otherwise obtaining control or a controlling influence over a bank holding company or bank without the approval of the Federal Reserve. On September 22, 2008, the Board of Managers of the Federal Reserve issued a policy statement on equity investments in bank holding companies and banks, which states the Federal Reserve generally will not consider an entity’s investment to be “controlling” if the entity owns or controls less than 25% of the voting shares and less than 33% total equity of the bank holding company or bank and has limited business relationships, director representation or other indicia of control. Depending on the nature of the overall investment and the capital structure of the banking organization, the Federal Reserve will permit, based on the policy statement, noncontrolling investments in the form of voting and nonvoting shares that represent in the aggregate (i) less than one-third of the total equity of the banking organization (and less than one-third of any class of voting securities, assuming conversion of all convertible nonvoting securities held by the entity) and (ii) less than 15% of any class of voting securities of the banking organization.
20
Table of Contents
Interstate Branching
The Dodd-Frank Act permits a national or state bank, with the approval of its regulator, to open a branch in any state if the law of the state in which the branch is located would permit the establishment of the branch if the bank were a bank chartered in that state.
Anti-Tying Restrictions
Bank holding companies and their affiliates are prohibited from tying the provision of certain services, such as extensions of credit, to other services offered by a holding company or its affiliates.
Bank Regulation
Equity Bank operates under a Kansas state bank charter and is subject to regulation by the OSBC and the Federal Reserve. The OSBC and the Federal Reserve regulate or monitor all areas of Equity Bank’s operations, including capital requirements, issuance of stock, declaration of dividends, interest rates, deposits, loans, investments, borrowings, record keeping, establishment of branches, acquisitions, mergers, information technology and employee responsibility and conduct. The OSBC places limitations on activities of Equity Bank, including the issuance of capital notes or debentures and the holding of real estate and personal property, and requires Equity Bank to maintain a certain ratio of reserves against deposits. The OSBC requires Equity Bank to file a report annually, in addition to any periodic report requested.
The Federal Reserve and the OSBC regularly examine Equity Bank and its records. The FDIC may also periodically examine and evaluate insured banks.
Standards for Safety and Soundness
As part of FDICIA’s efforts to promote the safety and soundness of depository institutions and their holding companies, appropriate federal banking regulators are required to have in place regulations specifying operational and management standards (addressing internal controls, loan documentation, credit underwriting and interest rate risk), asset quality and earnings. As discussed above, the Federal Reserve and the FDIC have extensive authority to police unsafe or unsound practices and violations of applicable laws and regulations by depository institutions and their holding companies. For example, the FDIC may terminate the deposit insurance of any institution that it determines has engaged in an unsafe or unsound practice. The agencies can also assess civil money penalties of up to $1 million per day, issue cease-and-desist or removal orders, seek injunctions and publicly disclose such actions.
The ability of Equity Bank, as a Kansas state bank, to pay dividends is restricted under the Kansas Banking Code. Pursuant to the Kansas Banking Code, a Kansas state bank may declare and pay a dividend out of undivided profits after deducting losses to the holders of record of the stock outstanding on the date the dividend is declared. However, prior to the declaration of any dividend, a Kansas state bank must transfer 25% of its net profits since the last preceding dividend to its surplus fund until the surplus fund is equal to its total capital stock. In addition, no dividend may be declared without the approval of the OSBC, if such dividend would reduce the surplus fund to an amount less than 30% of the resulting total capital of the bank.
Equity Bank is also subject to certain restrictions on the payment of dividends as a result of the requirement that it maintain an adequate level of capital in accordance with guidelines promulgated from time to time by the federal regulators.
The present and future dividend policy of Equity Bank is subject to the discretion of its boards of directors. In determining whether to pay dividends to us and, if made, the amount of the dividends, the board of directors of Equity Bank considers many of the same factors discussed above. Equity Bank cannot guarantee that it will have the financial ability to pay dividends to us, or if dividends are paid, that they will be sufficient for us to make distributions to our stockholders. Equity Bank is not obligated to pay dividends.
21
Table of Contents
Insider Transactions
A bank is subject to certain restrictions on extensions of credit to insiders of the bank or of any affiliate. Insiders include executive officers, directors, certain principal stockholders, and their related interests. Extensions of credit include derivative transactions, repurchase and reverse repurchase agreements, and securities borrowing and lending transactions to the extent that such transactions cause a bank to have credit exposure to an insider. Any extension of credit to an insider must:
| • | Be made on substantially the same terms, including interest rates and collateral, as those prevailing at the time for comparable transactions with third parties; and |
| • | Involve no more than the normal risk of repayment or present other unfavorable features. |
For loans above certain threshold amounts, board approval is required, and the interested insider may not be involved. In addition, a bank may purchase an asset from or sell an asset to an insider only if the transaction is on market terms and, if representing more than 10% of capital, is approved in advance by the majority of disinterested directors.
Additional and more stringent limits apply to a bank’s transactions with its own executive officers and certain directors. These limits do not apply to transactions with all directors nor to insiders of the bank’s affiliates.
Restrictions on Transactions with Affiliates
Section 23A of the Federal Reserve Act imposes quantitative and qualitative limits on transactions between a bank and any affiliate and requires certain levels of collateral for any such loans. It also limits the amount of advances to third parties which are collateralized by the securities or obligations of a holding company. Section 23B of the Federal Reserve Act requires that certain transactions between Equity Bank and its affiliates must be on terms substantially the same, or at least as favorable, as those prevailing at the time for comparable transactions with or involving other nonaffiliated companies. In the absence of such comparable transactions, any transaction between Equity Bank and its affiliates must be on terms and under circumstances, including credit standards, which in good faith would be offered to or would apply to nonaffiliated companies.
Capital Adequacy
In addition to the capital rules applicable to both banks and bank holding companies discussed above, under the prompt corrective action regulations, the federal bank regulators are required and authorized to take supervisory actions against undercapitalized banks. For this purpose, a bank is placed in one of the following five categories based on the bank’s capital (as of the new capital rules discussed above):
| • | well capitalized (at least 5% leverage capital, 6.5% common equity Tier 1 risk-based capital, 8% Tier 1 risk-based capital and 10% total risk-based capital); |
| • | adequately capitalized (at least 4% leverage capital, 4.5% common equity Tier 1 risk-based capital, 6% Tier 1 risk-based capital and 8% total risk-based capital); |
| • | undercapitalized (less than 4% leverage capital, 4.5% common equity Tier 1 risk-based capital, 6% Tier 1 risk-based capital and 8% total risk-based capital); |
| • | significantly undercapitalized (less than 3% leverage capital, 3% common equity Tier 1 risk-based capital, 4% Tier 1 risk-based capital and 6% total risk-based capital); and |
| • | critically undercapitalized (less than 2% tangible capital). |
Federal banking regulators are required to take various mandatory supervisory actions and are authorized to take other discretionary actions with respect to institutions in the three undercapitalized categories. The severity of the action depends upon the capital category in which the institution is placed. The regulators have the discretion to
22
Table of Contents
downgrade a bank from one category to a lower category. Generally, subject to a narrow exception, banking regulators must appoint a receiver or conservator for an institution that is “critically undercapitalized.” An institution that is categorized as “undercapitalized,” “significantly undercapitalized,” or “critically undercapitalized” is required to submit an acceptable capital restoration plan to its appropriate federal banking agency.
Failure to meet capital guidelines could subject Equity Bank to a variety of enforcement remedies, including issuance of a capital directive, the termination of deposit insurance by the FDIC, a prohibition on accepting brokered deposits and other restrictions on our business.
As of December 31, 2015, Equity Bank exceeded the capital levels required to be deemed well capitalized.
Deposit Insurance
The FDIC insures the deposits of federally insured banks up to prescribed statutory limits for each depositor, through the Deposit Insurance Fund (“DIF”), and safeguards the safety and soundness of the banking and thrift industries. The Dodd-Frank Act permanently raised the standard maximum deposit insurance amount to $250,000. The amount of FDIC assessments paid by each insured depository institution is based on its relative risk of default as measured by regulatory capital ratios and other supervisory factors.
In connection with the Dodd Frank Act’s requirement that insurance assessments be based on assets, the FDIC has redefined its deposit insurance premium assessment base to be an institution’s average consolidated total assets minus average tangible equity. The FDIC also has revised its deposit insurance assessment rate schedule in light of this change to the assessment base. The revised rate schedule and other revisions to the assessment rules became effective April 1, 2011.
We are generally unable to control the amount of premiums that we are required to pay for FDIC insurance. At least semi-annually, the FDIC will update its loss and income projections for the DIF and, if needed, will increase or decrease assessment rates, following notice-and-comment rulemaking, if required. If there are additional bank or financial institution failures or if the FDIC otherwise determines to increase assessment rates, Equity Bank may be required to pay higher FDIC insurance premiums. Any future increases in FDIC insurance premiums may have a material and adverse effect on our earnings.
In addition, all FDIC-insured institutions are required to pay assessments to the FDIC to fund interest payments on bonds issued by the Financing Corporation, or FICO, an agency of the federal government established to recapitalize the predecessor to DIF. These assessments, which are included in Deposit Insurance Premiums on the Consolidated Statements of Income, will continue until the FICO bonds mature between 2017 and 2019.
Consumer Financial Protection Bureau
The Dodd-Frank Act created the Consumer Financial Protection Bureau, or the CFPB, which is granted broad rulemaking, supervisory and enforcement powers under various federal consumer financial protection laws, including the Equal Credit Opportunity Act, Truth in Lending Act, Real Estate Settlement Procedures Act, Fair Credit Reporting Act, Fair Debt Collection Act, the Consumer Financial Privacy provisions of the Gramm-Leach-Bliley Act and certain other statutes. The CFPB has examination and primary enforcement authority with respect to depository institutions with $10 billion or more in assets. Depository institutions with less than $10 billion in assets, such as Equity Bank, are subject to rules promulgated by the CFPB, which may increase their compliance risk and the costs associated with their compliance efforts, but such banks will continue to be examined and supervised by federal banking regulators for consumer compliance purposes. The CFPB has authority to prevent unfair, deceptive or abusive practices in connection with the offering of consumer financial products.
23
Table of Contents
The Dodd-Frank Act authorizes the CFPB to establish certain minimum standards for the origination of residential mortgages, including a determination of the borrower’s ability to repay. In addition, the Dodd-Frank Act allows borrowers to raise certain defenses to foreclosure if they receive any loan other than a “qualified mortgage” as defined by the CFPB. The CFPB has opened inquiries into whether additional rule-making would be appropriate for overdraft protection programs.
The CFPB has issued a number of regulations related to the origination of mortgages, foreclosure and overdrafts as well as many other consumer issues. Additionally, the CFPB has proposed, or will be proposing, additional regulations on issues that directly relate to our business. Although it is difficult to predict at this time the extent to which the CFPB’s final rules impact the operations and financial condition of Equity Bank, such rules may have a material impact on Equity Bank’s compliance costs, compliance risk and fee income.
Privacy
Under the Right to Financial Privacy Act, which imposes a duty to maintain confidentiality of consumer financial records and prescribes procedures for complying with administrative subpoenas of financial records, financial institutions are required to disclose their policies for collecting and protecting confidential information. Customers generally may prevent financial institutions from sharing personal financial information with nonaffiliated third parties except for third parties that market the institutions’ own products and services. Additionally, financial institutions generally may not disclose consumer account numbers to any nonaffiliated third party for use in telemarketing, direct mail marketing or other marketing through electronic mail to consumers.
Recent cyber attacks against bank and other institutions that resulted in unauthorized access to confidential customer information have prompted the federal banking agencies to issue extensive guidance on cyber security. The regulatory agencies may devote more resources to this part of their safety and soundness examination than they may have in the past.
Like other lending institutions, our subsidiary bank uses credit bureau data in its underwriting activities. Use of that data is regulated under the Federal Credit Reporting Act on a uniform, nationwide basis. The act and its implementing regulation, Regulation V, cover credit reporting, prescreening, sharing of information between affiliates, and the use of credit data. The Fair and Accurate Credit Transactions Act of 2003 allows states to enact identity theft laws that are not inconsistent with the conduct required by the provisions of the act.
The Patriot Act, International Money Laundering Abatement and Financial Anti-Terrorism Act and Bank Secrecy Act
A major focus of governmental policy on financial institutions has been aimed at combating money laundering and terrorist financing. The Patriot Act and the International Money Laundering and Financial Anti-Terrorism Act of 2001 substantially broadened the scope of U.S. anti-money laundering laws and penalties, specifically related to the Bank Secrecy Act and expanded the extra-territorial jurisdiction of the United States. The U.S. Treasury has issued a number of implementing regulations that apply various requirements of the Patriot Act to financial institutions, such as Equity Bank. These regulations impose obligations on financial institutions to maintain appropriate policies, procedures and controls to detect, prevent and report money laundering and terrorist financing and to verify the identity of their customers.
Failure of a financial institution and its holding company to maintain and implement adequate programs to combat money laundering and terrorist financing, or to comply with relevant laws and regulations, could have serious legal, reputational and financial consequences for the institution. Because of the significance of regulatory emphasis on these requirements, Equity Bank will continue to expend significant staffing, technology and financial resources to maintain programs designed to ensure compliance with applicable laws and regulations and an effective audit function for testing of Equity Bank’s compliance with the Bank Secrecy Act on an ongoing basis.
24
Table of Contents
Community Reinvestment Act
The CRA requires that, in connection with examinations of financial institutions within its jurisdiction, the federal and the state banking regulators, as applicable, evaluate the record of each financial institution in meeting the credit needs of its local community, including low and moderate-income neighborhoods. These facts are also considered in evaluating mergers, acquisitions and applications to open a branch or facility. Failure to adequately meet these criteria could impose additional requirements and limitations on us. Additionally, we must publicly disclose the terms of various CRA-related agreements.
Other Regulations
Interest and other charges that Equity Bank collects or contracts for are subject to state usury laws and federal laws concerning interest rates. Equity Bank’s loan operations are also subject to federal laws applicable to credit transactions, such as:
| • | the Federal Truth-In-Lending Act, governing disclosures of credit terms to consumer borrowers; |
| • | the Home Mortgage Disclosure Act, requiring financial institutions to provide information to enable the public and public officials to determine whether a financial institution is fulfilling its obligation to help meet the housing needs of the community it serves; |
| • | the Equal Credit Opportunity Act, prohibiting discrimination on the basis of race, creed or other prohibited factors in extending credit; |
| • | the Fair Credit Reporting Act, governing the use and provision of information to credit reporting agencies; |
| • | the Fair Debt Collection Act, governing the manner in which consumer debts may be collected by collection agencies; and |
| • | the rules and regulations of the various governmental agencies charged with the responsibility of implementing these federal laws. |
In addition, Equity Bank’s deposit operations are subject to the Electronic Funds Transfer Act and Regulation E issued by the Federal Reserve to implement such act, which govern automatic deposits to and withdrawals from deposit accounts and customers’ rights and liabilities arising from the use of automated teller machines and other electronic banking services.
Concentrated Commercial Real Estate Lending Regulations
The Federal Reserve and other federal banking regulatory agencies have promulgated guidance governing financial institutions with concentrations in commercial real estate lending. The guidance provides that a bank has a concentration in commercial real estate lending if (i) total reported loans for construction, land development and other land represent 100% or more of total capital or (ii) total reported loans secured by multifamily and non-farm residential properties and loans for construction, land development and other land represent 300% or more of total capital and the bank’s commercial real estate loan portfolio has increased 50% or more during the prior 36 months. If a concentration is present, management must employ heightened risk management practices including board and management oversight and strategic planning, development of underwriting standards, risk assessment and monitoring through market analysis and stress testing and increasing capital requirements.
All of the above laws and regulations add significantly to the cost of operating us and Equity Bank and thus have a negative impact on profitability. We would also note that there has been a tremendous expansion experienced in recent years by certain financial service providers that are not subject to the same rules and regulations as us and Equity Bank. These institutions, because they are not so highly regulated, have a competitive advantage over us and Equity Bank and may continue to draw large amounts of funds away from banking institutions, with a continuing adverse effect on the banking industry in general.
25
Table of Contents
Effect of Governmental Monetary Policies
The commercial banking business is affected not only by general economic conditions but also by both U.S. fiscal policy and the monetary policies of the Federal Reserve. Some of the instruments of fiscal and monetary policy available to the Federal Reserve include changes in the discount rate on member bank borrowings, the fluctuating availability of borrowings at the “discount window,” open market operations, the imposition of and changes in reserve requirements against member banks’ deposits and assets of foreign branches, the imposition of and changes in reserve requirements against certain borrowings by banks and their affiliates and the placing of limits on interest rates that member banks may pay on time and savings deposits. Such policies influence to a significant extent the overall growth of bank loans, investments and deposits and the interest rates charged on loans or paid on time and savings deposits. We cannot predict the nature of future fiscal and monetary policies and the effect of such policies on the future business and our earnings.
26
Table of Contents
Our business and results of operations are subject to numerous risks and uncertainties, many of which are beyond our control. The material risks and uncertainties that management believes affect the Company are described below. Additional risks and uncertainties that management is not aware of or that management currently deems immaterial may also impair the Company’s business operations. This report is qualified in its entirety by these risk factors. If any of the following risks actually occur, our business, financial condition and results of operations could be materially and adversely affected. If this were to happen, the value of our securities could decline significantly, and you could lose all or part of your investment. Some statements in the following risk factors constitute forward-looking statements. Please refer to “Cautionary Note Regarding Forward-Looking Statements” elsewhere in this Annual Report on Form 10-K.
Risks Relating to Our Business
Our business is concentrated in, and largely dependent upon, the continued growth and welfare of the general geographic markets in which we operate.
Our commercial banking operations are primarily concentrated in Kansas and Missouri. As a result, our financial condition and results of operations and cash flows are affected by changes in the economic conditions of our markets. Our success depends to a significant extent upon the business activity, population, income levels, deposits, and real estate activity in these markets. Although our customers’ business and financial interests may extend well beyond these market areas, adverse conditions that affect these market areas could reduce our growth rate, affect the ability of our customers to repay their loans, affect the value of collateral underlying loans, impact our ability to attract deposits, and generally affect our financial conditions and results of operations. Because of our geographic concentration, we may be less able than other regional or national financial institutions to diversify our credit risks across multiple markets.
A return of recessionary conditions could result in increases in our level of nonperforming loans and/or reduced demand for our products and services, which could have an adverse effect on our results of operations.
Economic recession or other economic problems, including those affecting our markets and regions, but also those affecting the U.S. or world economies, could have a material adverse impact on the demand for our products and services. Since the conclusion of the last recession, economic growth has been slow and uneven, and unemployment levels remain high. If economic conditions deteriorate, or if there are negative developments affecting the domestic and international credit markets, the value of our loans and investments may be harmed, which in turn would have an adverse effect on our financial performance, and our financial condition may be adversely affected. In addition, although deteriorating market conditions could adversely affect our financial condition, results of operations, and cash flows, we may not benefit from any market growth or favorable economic conditions, either in our primary market areas or nationally, even if they do occur.
Difficult conditions in the market for financial products and services may materially and adversely affect our business and results of operations.
Dramatic declines in the housing market during the previous recessionary period, along with increased foreclosures and unemployment, resulted in significant write-downs of asset values by financial institutions, including government-sponsored entities and major commercial and investment banks. These write-downs, initially of mortgage-backed securities but spreading to credit default swaps and other derivative securities, caused many financial institutions to seek additional capital, to merge with larger and stronger institutions, and, in some cases, to fail. This market turmoil and tightening of credit led to an increased level of commercial and consumer delinquencies, lack of consumer confidence, increased market volatility, and widespread reduction of business activity generally. Although conditions have improved, a return of these trends could have a material
27
Table of Contents
adverse effect on our business and operations. Negative market developments may affect consumer confidence levels and may cause adverse changes in payment patterns, causing increases in delinquencies and default rates, which may impact our charge-offs and provisions for loan and credit losses. Economic deterioration that affects household and/or corporate incomes could also result in reduced demand for credit or fee-based products and services. These conditions would have adverse effects on us and others in the financial services industry.
We rely heavily on our management team and could be adversely affected by the unexpected loss of key officers.
We are led by an experienced management team with substantial experience in the markets that we serve and the financial products that we offer. Our operating strategy focuses on providing products and services through long-term relationship managers. Accordingly, our success depends in large part on the performance of our key personnel, as well as on our ability to attract, motivate and retain highly qualified senior and middle management. Competition for employees is intense, and the process of locating key personnel with the combination of skills and attributes required to execute our business plan may be lengthy. We may not be successful in retaining our key employees and the unexpected loss of services of one or more of our key personnel could have a material adverse effect on our business because of their skills, knowledge of our market and financial products, years of industry experience, long-term customer relationships and the difficulty of promptly finding qualified replacement personnel. If the services of any of our key personnel should become unavailable for any reason, we may not be able to identify and hire qualified persons on terms acceptable to us, which could have an adverse effect on our business, financial condition and results of operations.
Our ability to grow our loan portfolio may be limited by, among other things, economic conditions, competition within our market areas, the timing of loan repayments and seasonality.
Our ability to continue to improve our operating results is dependent upon, among other things, growing our loan portfolio. While we believe that our strategy to grow our loan portfolio is sound and our growth targets are achievable over an extended period of time, competition within our market areas is significant, particularly for borrowers whose businesses have been less negatively impacted by the challenging economic conditions of the last few years. We compete with both large regional and national financial institutions, who are sometimes able to offer more attractive interest rates and other financial terms than we choose to offer, as well as other community-based banks who seek to offer a similar level of service to that which we offer. This competition can make loan growth challenging, particularly if we are unwilling to price loans at levels that would cause unacceptable levels of compression of our net interest margin or if we are unwilling to structure a loan in a manner that we believe results in a level of risk to us that we are not willing to accept. Moreover, loan growth throughout the year can fluctuate due in part to seasonality of the businesses of our borrowers and potential borrowers and the timing on loan repayments, particularly those of our borrowers with significant relationships with us, resulting from, among other things, excess levels of liquidity. To the extent that we are unable to increase loans, we may be unable to successfully implement our growth strategy, which could materially and adversely affect us.
Our financial performance will be negatively impacted if we are unable to execute our growth strategy.
Our current growth strategy is to grow organically and supplement that growth with select acquisitions. Our ability to grow organically depends primarily on generating loans and deposits of acceptable risk and expense, and we may not be successful in continuing this organic growth. Our ability to identify appropriate markets for expansion, recruit and retain qualified personnel, and fund growth at a reasonable cost depends upon prevailing economic conditions, maintenance of sufficient capital, competitive factors, and changes in banking laws, among other factors. Conversely, if we grow too quickly and are unable to control costs and maintain asset quality, such growth, whether organic or through select acquisitions, could materially and adversely affect our financial condition and results of operations.
28
Table of Contents
We may not be able to identify and acquire other financial institutions, which could hinder our ability to continue to grow.
A substantial part of our historical growth has been a result of acquisitions of other financial institutions. We intend to continue our strategy of evaluating and selectively acquiring other financial institutions that serve customers or markets we find desirable. However, the market for acquisitions remains highly competitive, and we may be unable to find satisfactory acquisition candidates in the future that fit our acquisition strategy. To the extent that we are unable to find suitable acquisition candidates, an important component of our strategy may be lost. If we are able to identify attractive acquisition opportunities, we must generally satisfy a number of conditions prior to completing any such transaction, including certain bank regulatory approvals, which has become substantially more difficult, time-consuming and unpredictable as a result of the recent financial crisis. Additionally, any future acquisitions may not produce the revenue, earnings or synergies that we anticipated.
Our strategy of pursuing acquisitions exposes us to financial, execution, compliance and operational risks that could have a material adverse effect on our business, financial condition, results of operations and growth prospects.
We intend to continue pursuing a strategy that includes acquisitions. An acquisition strategy involves significant risks, including the following:
| • | finding suitable candidates for acquisition; |
| • | attracting funding to support additional growth within acceptable risk tolerances; |
| • | maintaining asset quality; |
| • | retaining customers and key personnel, including bankers; |
| • | obtaining necessary regulatory approvals, which we may have difficulty obtaining or be unable to obtain; |
| • | conducting adequate due diligence and managing known and unknown risks and uncertainties; |
| • | integrating acquired businesses; and |
| • | maintaining adequate regulatory capital. |
The market for acquisition targets is highly competitive, which may adversely affect our ability to find acquisition candidates that fit our strategy and standards. We face significant competition in pursuing acquisition targets from other banks and financial institutions, many of which possess greater financial, human, technical and other resources than we do. Our ability to compete in acquiring target institutions will depend on our available financial resources to fund the acquisitions, including the amount of cash and cash equivalents we have and the liquidity and market price of our Class A common stock. In addition, increased competition may also drive up the acquisition consideration that we will be required to pay in order to successfully capitalize on attractive acquisition opportunities. To the extent that we are unable to find suitable acquisition targets, an important component of our growth strategy may not be realized.
Acquisitions of financial institutions also involve operational risks and uncertainties, such as unknown or contingent liabilities with no available manner of recourse, exposure to unexpected problems such as asset quality, the retention of key employees and customers, and other issues that could negatively affect our business. We may not be able to complete future acquisitions or, if completed, we may not be able to successfully integrate the operations, technology platforms, management, products and services of the entities that we acquire or to realize our attempts to eliminate redundancies. The integration process may also require significant time and attention from our management that would otherwise be directed toward servicing existing business and developing new business. Failure to successfully integrate the entities we acquire into our existing operations in a timely manner may increase our operating costs significantly and adversely affect our business, financial
29
Table of Contents
condition and results of operations. Further, acquisitions typically involve the payment of a premium over book and market values and, therefore, some dilution of our tangible book value and net income per common share may occur in connection with any future acquisition, and the carrying amount of any goodwill that we currently maintain or may acquire may be subject to impairment in future periods.
If we continue to grow, we will face risks arising from our increased size. If we do not manage such growth effectively, we may be unable to realize the benefit from the investments in technology, infrastructure and personnel that we have made to support our expansion. In addition, we may incur higher costs and realize less revenue growth than we expect, which would reduce our earnings and diminish our future prospects, and we may not be able to continue to implement our business strategy and successfully conduct our operations. Risks associated with failing to maintain effective financial and operational controls as we grow, such as maintaining appropriate loan underwriting procedures, information technology systems, determining adequate allowances for loan losses and complying with regulatory accounting requirements, including increased loan losses, reduced earnings and potential regulatory penalties and restrictions on growth, all could have a negative effect on our business, financial condition and results of operations.
Acquisitions may disrupt our business and dilute stockholder value, and integrating acquired companies may be more difficult, costly, or time-consuming than we expect.
Our pursuit of acquisitions may disrupt our business, and any equity that we issue as merger consideration may have the effect of diluting the value of your investment. In addition, we may fail to realize some or all of the anticipated benefits of completed acquisitions. We anticipate that the integration of businesses that we may acquire in the future will be a time-consuming and expensive process, even if the integration process is effectively planned and implemented.
In addition, our acquisition activities could be material to our business and involve a number of significant risks, including the following:
| • | incurring time and expense associated with identifying and evaluating potential acquisitions and negotiating potential transactions, resulting in our attention being diverted from the operation of our existing business; |
| • | using inaccurate estimates and judgments to evaluate credit, operations, management, and market risks with respect to the target company or the assets and liabilities that we seek to acquire; |
| • | exposure to potential asset quality issues of the target company; |
| • | intense competition from other banking organizations and other potential acquirers, many of which have substantially greater resources than we do; |
| • | potential exposure to unknown or contingent liabilities of banks and businesses we acquire, including, without limitation, liabilities for regulatory and compliance issues; |
| • | inability to realize the expected revenue increases, cost savings, increases in geographic or product presence, and other projected benefits of the acquisition; |
| • | incurring time and expense required to integrate the operations and personnel of the combined businesses; |
| • | inconsistencies in standards, procedures, and policies that would adversely affect our ability to maintain relationships with customers and employees; |
| • | experiencing higher operating expenses relative to operating income from the new operations; |
| • | creating an adverse short-term effect on our results of operations; |
| • | losing key employees and customers; |
30
Table of Contents
| • | significant problems relating to the conversion of the financial and customer data of the entity; |
| • | integration of acquired customers into our financial and customer product systems; |
| • | potential changes in banking or tax laws or regulations that may affect the target company; or |
| • | risks of impairment to goodwill. |
If difficulties arise with respect to the integration process, the economic benefits expected to result from acquisitions might not occur. As with any merger of financial institutions, there also may be business disruptions that cause us to lose customers or cause customers to move their business to other financial institutions. Failure to successfully integrate businesses that we acquire could have an adverse effect on our profitability, return on equity, return on assets, or our ability to implement our strategy, any of which in turn could have a material adverse effect on our business, financial condition, and results of operations.
Our largest loan relationships currently make up a material percentage of our total loan portfolio.
As of December 31, 2015, our ten largest loan relationships totaled over $160.3 million in loan exposure, or 16.7% of the total loan portfolio. The concentration risk associated with having a small number of large loan relationships is that, if one or more of these relationships were to become delinquent or suffer default, we could be at serious risk of material losses. The allowance for loan losses may not be adequate to cover losses associated with any of these relationships, and any loss or increase in the allowance would negatively affect our earnings and capital. Even if the loans are collateralized, the large increase in classified assets could harm our reputation with our regulators, investors and potential investors and inhibit our ability to execute our business plan.
Several of our large depositors have relationships with each other, which creates a higher risk that one customer’s withdrawal of its deposit could lead to a loss of other deposits from customers within the relationship, which, in turn, could force us to fund our business through more expensive and less stable sources.
As of December 31, 2015, our ten largest non-brokered depositors accounted for $218.8 million in deposits, or approximately 15.9% of our total deposits. Further, our non-brokered deposit account balance was $1.2 billion, or approximately 99.3% of our total deposits, as of December 31, 2015. Several of our large depositors have business, family, or other relationships with each other, which creates a risk that any one customer’s withdrawal of its deposit could lead to a loss of other deposits from customers within the relationship.
Withdrawals of deposits by any one of our largest depositors or by one of our related customer groups could force us to rely more heavily on borrowings and other sources of funding for our business and withdrawal demands, adversely affecting our net interest margin and results of operations. We may also be forced, as a result of any withdrawal of deposits, to rely more heavily on other, potentially more expensive and less stable funding sources. Consequently, the occurrence of any of these events could have a material adverse effect on our business, results of operations, financial condition, and future prospects.
Our ability to retain bankers and recruit additional successful bankers is critical to the success of our business strategy, and any failure to do so could adversely affect our business, financial condition, results of operations and growth prospects.
Our ability to retain and grow our loans, deposits and fee income depends upon the business generation capabilities, reputation and relationship management skills of our bankers. If we were to lose the services of any of our bankers, including successful bankers employed by banks that we may acquire, to a new or existing competitor or otherwise, we may not be able to retain valuable relationships and some of our customers could choose to use the services of a competitor instead of our services.
31
Table of Contents
Our growth strategy also relies on our ability to attract and retain additional profitable bankers. We may face difficulties in recruiting and retaining bankers of our desired caliber, including as a result of competition from other financial institutions. In particular, many of our competitors are significantly larger with greater financial resources, and may be able to offer more attractive compensation packages and broader career opportunities. Additionally, we may incur significant expenses and expend significant time and resources on training, integration and business development before we are able to determine whether a new banker will be profitable or effective. If we are unable to attract and retain successful bankers, or if our bankers fail to meet our expectations in terms of customer relationships and profitability, we may be unable to execute our business strategy and our business, financial condition, results of operations and growth prospects may be adversely affected.
Any expansion into new markets or new lines of business might not be successful.
As part of our ongoing strategic plan, we may consider expansion into new geographic markets. Such expansion might take the form of the establishment of de novo branches or the acquisition of existing banks or bank branches. There are considerable costs associated with opening new branches, and new branches generally do not generate sufficient revenues to offset costs until they have been in operation for some time. Additionally, we may consider expansion into new lines of business through the acquisition of third parties or organic growth and development. There are substantial risks associated with such efforts, including risks that (i) revenues from such activities might not be sufficient to offset the development, compliance, and other implementation costs, (ii) competing products and services and shifting market preferences might affect the profitability of such activities, and (iii) our internal controls might be inadequate to manage the risks associated with new activities. Furthermore, it is possible that our unfamiliarity with new markets or lines of business might adversely affect the success of such actions. If any such expansions into new geographic or product markets are not successful, there could be an adverse effect on our financial condition and results of operations.
Our small to medium-sized business and entrepreneurial customers may have fewer financial resources than larger entities to weather a downturn in the economy, which may impair a borrower’s ability to repay a loan, and such impairment could adversely affect our financial condition and results of operations.
We focus our business development and marketing strategy primarily to serve the banking and financial services needs of small to medium-sized businesses and entrepreneurs. These small to medium-sized businesses and entrepreneurs may have fewer financial resources in terms of capital or borrowing capacity than larger entities. If economic conditions negatively impact our markets generally, and small to medium-sized businesses are adversely affected, our financial condition and results of operations may be negatively affected.
In our business, we must effectively manage our credit risk.
As a lender, we are exposed to the risk that our loan customers may not repay their loans according to the terms of these loans and the collateral securing the payment of these loans may be insufficient to fully compensate us for the outstanding balance of the loan plus the costs to dispose of the collateral. We may experience significant loan losses, which could have a material adverse effect on our operating results and financial condition. Management makes various assumptions and judgments about the collectability of our loan portfolio, including the diversification by industry of our commercial loan portfolio, the amount of nonperforming loans and related collateral, the volume, growth and composition of our loan portfolio, the effects on the loan portfolio of current economic indicators and their probable impact on borrowers and the evaluation of our loan portfolio through our internal loan review process and other relevant factors.
We maintain an allowance for credit losses, which is an allowance established through a provision for loan losses charged to expense that represents management’s best estimate of probable incurred losses in our loan portfolio. Additional credit losses will likely occur in the future and may occur at a rate greater than we have experienced to date. In determining the amount of the allowance, we rely on an analysis of our loan portfolio, our
32
Table of Contents
experience and our evaluation of general economic conditions. If our assumptions prove to be incorrect, our current allowance may not be sufficient and adjustments may be necessary to allow for different economic conditions or adverse developments in our loan portfolio. Material additions to the allowance could materially decrease our net income.
In addition, banking regulators periodically review our allowance for credit losses and may require us to increase our provision for credit losses or recognize further charge-offs, based on judgments different than those of our management. Any increase in our allowance for credit losses or charge-offs as required by these regulatory agencies could have a material negative effect on our operating results, financial condition and liquidity.
We may not be able to adequately measure and limit the credit risk associated with our loan portfolio, which could adversely affect our profitability.
As a part of the products and services that we offer, we make commercial and commercial real estate loans. The principal economic risk associated with each class of loans is the creditworthiness of the borrower, which is affected by the strength of the relevant business market segment, local market conditions, and general economic conditions. Additional factors related to the credit quality of commercial loans include the quality of the management of the business and the borrower’s ability both to properly evaluate changes in the supply and demand characteristics affecting our market for products and services, and to effectively respond to those changes. Additional factors related to the credit quality of commercial real estate loans include tenant vacancy rates and the quality of management of the property. A failure to effectively measure and limit the credit risk associated with our loan portfolio could have an adverse effect on our business, financial condition, and results of operations.
External economic factors, such as changes in monetary policy and inflation and deflation, may have an adverse effect on our business, financial condition and results of operations.
Our financial condition and results of operations are affected by credit policies of monetary authorities, particularly the Board of Governors of the Federal Reserve System, or the Federal Reserve. Actions by monetary and fiscal authorities, including the Federal Reserve, could lead to inflation, deflation, or other economic phenomena that could adversely affect our financial performance. The primary impact of inflation on our operations most likely will be reflected in increased operating costs. Conversely, deflation generally will tend to erode collateral values and diminish loan quality. Virtually all of our assets and liabilities are monetary in nature. As a result, interest rates have a more significant impact on our performance than general levels of inflation or deflation. Interest rates do not necessarily move in the same direction or by the same magnitude as the prices of goods and services.
Our profitability is vulnerable to interest rate fluctuations.
Our profitability depends substantially upon our net interest income. Net interest income is the difference between the interest earned on assets (such as loans and securities held in our investment portfolio) and the interest paid for liabilities (such as interest paid on savings and money market accounts and time deposits).
Income associated with interest-earning assets and costs associated with interest-bearing liabilities may not be affected uniformly by fluctuations in interest rates. The magnitude and duration of changes in interest rates are events over which we have no control, and such changes may have an adverse effect on our net interest income. Prepayment and early withdrawal levels, which are also impacted by changes in interest rates, can significantly affect our assets and liabilities. For example, an increase in interest rates could, among other things, reduce the demand for loans and decrease loan repayment rates. Such an increase could also adversely affect the ability of our floating-rate borrowers to meet their higher payment obligations, which could in turn lead to an increase in nonperforming assets and net charge-offs. Conversely, a decrease in the general level of interest rates could affect us by, among other things, leading to greater competition for deposits and incentivizing borrowers to prepay or refinance their loans more quickly or frequently than they otherwise would. The primary tool that management uses to measure interest rate risk is a simulation model that evaluates the impact of varying levels of
33
Table of Contents
prevailing interest rates and the impact on net interest income and the economic value of equity. Generally, the interest rates on our interest-earning assets and interest-bearing liabilities do not change at the same rate, to the same extent or on the same basis. Even assets and liabilities with similar maturities or re-pricing periods may react in different degrees to changes in market interest rates. Interest rates on certain types of assets and liabilities may fluctuate in advance of changes in general market interest rates, while interest rates on other types of assets and liabilities may lag behind changes in general market rates. Certain assets, such as fixed and adjustable rate mortgage loans, have features that limit changes in interest rates on a short-term basis and over the life of the asset. Changes in interest rates could materially and adversely affect our financial condition and results of operations. See “Item 7A – Quantitative and Qualitative Disclosure About Market Risk” for a discussion of interest rate risk modeling and the inherent risks in modeling assumptions.
Market interest rates for loans, investments, and deposits are highly sensitive to many factors beyond our control.
Generally, interest rate spreads (the difference between interest rates earned on assets and interest rates paid on liabilities) have narrowed in recent years as a result of changing market conditions, policies of various government and regulatory authorities, and competitive pricing pressures, and we cannot predict whether these rate spreads will narrow even further. This narrowing of interest rate spreads could adversely affect our financial condition and results of operations. In addition, we cannot predict whether interest rates will continue to remain at present levels. Changes in interest rates may cause significant changes, up or down, in our net interest income.
We attempt to minimize the adverse effects of changes in interest rates by structuring our asset-liability composition in order to obtain the maximum spread between interest income and interest expense. However, there can be no assurance that we will be successful in minimizing the adverse effects of changes in interest rates. Depending on our portfolio of loans and investments, our financial condition and results of operations may be adversely affected by changes in interest rates.
We could suffer losses from a decline in the credit quality of the assets that we hold.
We could sustain losses if borrowers, guarantors, and related parties fail to perform in accordance with the terms of their loans. We have adopted underwriting and credit monitoring procedures and policies that we believe are appropriate to minimize this risk, including the establishment and review of the allowance for credit losses, periodic assessment of the likelihood of nonperformance, tracking loan performance, and diversifying our credit portfolio. These policies and procedures, however, may not prevent unexpected losses that could materially adversely affect our financial condition and results of operations. In particular, we face credit quality risks presented by past, current, and potential economic and real estate market conditions.
Changes in economic conditions could cause an increase in delinquencies and nonperforming assets, including loan charge-offs, which could depress our net income and growth.
Our loan portfolio includes many real estate secured loans, demand for which may decrease during economic downturns as a result of, among other things, an increase in unemployment, a decrease in real estate values and, a slowdown in housing. If we see negative economic conditions develop in the United States as a whole or our Kansas and Missouri markets, we could experience higher delinquencies and loan charge-offs, which would reduce our net income and adversely affect our financial condition. Furthermore, to the extent that real estate collateral is obtained through foreclosure, the costs of holding and marketing the real estate collateral, as well as the ultimate values obtained from disposition, could reduce our earnings and adversely affect our financial condition.
The value of real estate collateral may fluctuate significantly resulting in an under-collateralized loan portfolio.
The market value of real estate, particularly real estate held for investment, can fluctuate significantly in a short period of time as a result of market conditions in the geographic area in which the real estate is located. If
34
Table of Contents
the value of the real estate serving as collateral for our loan portfolio were to decline materially, a significant part of our loan portfolio could become under-collateralized. If the loans that are collateralized by real estate become troubled during a time when market conditions are declining or have declined, then, in the event of foreclosure, we may not be able to realize the amount of collateral that we anticipated at the time of originating the loan. This could have a material adverse effect on our provision for loan losses and our operating results and financial condition.
A significant portion of our loan portfolio is secured by real estate, and events that negatively impact the real estate market could negatively impact our business.
There are significant risks associated with real estate-based lending. Real estate collateral may deteriorate in value during the time that credit is extended, in which case we might not be able to sell such collateral for an amount necessary to satisfy a defaulting borrower’s obligation to us. In that event, there could be a material adverse effect on our financial condition and results of operations. Additionally, commercial real estate loans are subject to unique risks. These types of loans are often viewed as having more risks than residential real estate or other consumer loans, primarily because relatively large amounts are loans to a relatively small number of borrowers. Thus, the deterioration of even a small number of these loans could cause a significant increase in the loan loss allowance or loan charge-offs, which in turn could have a material adverse effect on our financial condition and results of operations. Furthermore, commercial real estate loans depend on cash flows from the property securing the debt. Cash flows may be affected significantly by general economic conditions, and a downturn in a local economy in one of our markets or in occupancy rates where a property is located could increase the likelihood of default.
The foregoing risks are enhanced as a result of the limited geographic scope of our principal markets. Most of the real estate securing our loans is located in our Kansas and Missouri markets. Because the value of this collateral depends upon local real estate market conditions and is affected by, among other things, neighborhood characteristics, real estate tax rates, the cost of operating the properties, and local governmental regulation, adverse changes in any of these factors in our markets could cause a decline in the value of the collateral securing a significant portion of our loan portfolio. Further, the concentration of real estate collateral in these two markets limits our ability to diversify the risk of such occurrences.
A large portion of our loan portfolio is comprised of commercial loans, which are secured by accounts receivable, inventory, equipment or other asset-based collateral, and a deterioration in the value of such collateral could increase our exposure to future probable losses.
These commercial loans are typically larger in amount than loans to individuals, and therefore, have the potential for larger losses on a single loan basis. Additionally, asset-based borrowers are often highly leveraged and have inconsistent historical earnings and cash flows. Historically, losses in our commercial credits have been higher than losses in other classes of our loan portfolio. Significant adverse changes in our borrowers’ industries and businesses could cause rapid declines in values of, and collectability associated with, those business assets, which could result in inadequate collateral coverage for our commercial loans and expose us to future losses. An increase in specific reserves and charge-offs related to our commercial loan portfolio could have a material adverse effect on our business, financial condition, results of operations and future prospects.
Our use of appraisals in deciding whether to make a loan secured by real property does not ensure the value of the real property collateral.
In considering whether to make a loan secured by real property, we generally require an appraisal. However, an appraisal is only an estimate of the value of the property at the time the appraisal is made. If the appraisal does not reflect the amount that may be obtained upon any sale or foreclosure of the property, we may not realize an amount equal to the indebtedness secured by the property.
35
Table of Contents
A substantial portion of our loan portfolio is comprised of participation and syndicated transaction interests, which could have an adverse effect on our ability to monitor the lending relationships and lead to an increased risk of loss.
We participate in loans originated by other institutions and in syndicated transactions (including shared national credits) in which other lenders serve as the agent bank. Our reduced control over the monitoring and management of these relationships, particularly participations in large bank groups, could lead to increased risk of loss, which could have a material adverse effect on our business, financial condition, results of operations and future prospects.
A lack of liquidity could adversely affect our financial condition and results of operations.
Liquidity is essential to our business. We rely on our ability to generate deposits and effectively manage the repayment and maturity schedules of our loans to ensure that we have adequate liquidity to fund our operations. An inability to raise funds through deposits, borrowings, the sale of loans and other sources could have a substantial negative effect on our liquidity. Our most important source of funds is deposits. Deposit balances can decrease when customers perceive alternative investments as providing a better risk/return tradeoff. If customers move money out of bank deposits and into other investments such as money market funds, we would lose a relatively low-cost source of funds, increasing our funding costs and reducing our net interest income and net income.
Other primary sources of funds consist of cash flows from operations, maturities and sales of investment securities, and proceeds from the issuance and sale of our equity securities to investors. Additional liquidity is provided by the ability to borrow from the Federal Home Loan Bank of Topeka. We also may borrow funds from third-party lenders, such as other financial institutions. Our access to funding sources in amounts adequate to finance or capitalize our activities, or on terms that are acceptable to us, could be impaired by factors that affect us directly or the financial services industry or economy in general, such as disruptions in the financial markets or negative views and expectations about the prospects for the financial services industry. Our access to funding sources could also be affected by a decrease in the level of our business activity as a result of a downturn in our markets or by one or more adverse regulatory actions against us.
Any decline in available funding could adversely impact our ability to originate loans, invest in securities, meet our expenses, or to fulfill obligations such as repaying our borrowings or meeting deposit withdrawal demands, any of which could have a material adverse impact on our liquidity, business, financial condition and results of operations.
As a bank holding company, the sources of funds available to us are limited.
Any future constraints on liquidity at the holding company level could impair our ability to declare and pay dividends on our Class A common stock. In some instances, notice to, or approval from, the Federal Reserve may be required prior to our declaration or payment of dividends. Further, our operations are primarily conducted by our subsidiary, Equity Bank, which is subject to significant regulation. Federal and state banking laws restrict the payment of dividends by banks to their holding companies, and Equity Bank will be subject to these restrictions in paying dividends to us. Because our ability to receive dividends or loans from Equity Bank is restricted, our ability to pay dividends to our stockholders is also restricted.
Additionally, the right of a bank holding company to participate in the assets of its subsidiary bank in the event of a bank-level liquidation or reorganization is subject to the claims of the bank’s creditors, including depositors, which take priority, except to the extent that the holding company may be a creditor with a recognized claim.
36
Table of Contents
We operate in a highly competitive industry and face significant competition from other financial institutions and financial services providers, which may decrease our growth or profits.
Consumer and commercial banking are highly competitive industries. Our market areas contain not only a large number of community and regional banks, but also a significant presence of the country’s largest commercial banks. We compete with other state and national financial institutions, as well as savings and loan associations, savings banks, and credit unions, for deposits and loans. In addition, we compete with financial intermediaries, such as consumer finance companies, commercial finance companies, mortgage banking companies, insurance companies, securities firms, mutual funds, and several government agencies, as well as major retailers, all actively engaged in providing various types of loans and other financial services. Some of these competitors may have a long history of successful operations in our market areas and greater ties to local businesses and more expansive banking relationships, as well as more established depositor bases, fewer regulatory constraints, and lower cost structures than we do. Competitors with greater resources may possess an advantage through their ability to maintain numerous banking locations in more convenient sites, to conduct more extensive promotional and advertising campaigns, or to operate a more developed technology platform. Due to their size, many competitors may offer a broader range of products and services, as well as better pricing for certain products and services than we can offer. For example, in the current low interest rate environment, competitors with lower costs of capital may solicit our customers to refinance their loans with a lower interest rate. Further, increased competition among financial services companies due to the recent consolidation of certain competing financial institutions may adversely affect our ability to market our products and services. Technology has lowered barriers to entry and made it possible for banks to compete in our market areas without a retail footprint by offering competitive rates, and for non-banks to offer products and services traditionally provided by banks.
The financial services industry could become even more competitive as a result of legislative, regulatory, and technological changes and continued consolidation. Banks, securities firms, and insurance companies can merge under the umbrella of a financial holding company, which can offer virtually any type of financial service, including banking, securities underwriting, insurance (both agency and underwriting), and merchant banking.
Our ability to compete successfully depends on a number of factors, including:
| • | our ability to develop, maintain, and build upon long-term customer relationships based on quality service and high ethical standards; |
| • | our ability to attract and retain qualified employees to operate our business effectively; |
| • | our ability to expand our market position; |
| • | the scope, relevance, and pricing of products and services that we offer to meet customer needs and demands; |
| • | the rate at which we introduce new products and services relative to our competitors; |
| • | customer satisfaction with our level of service; and |
| • | industry and general economic trends. |
Failure to perform in any of these areas could significantly weaken our competitive position, which could adversely affect our growth and profitability, which, in turn, could harm our business, financial condition, and results of operations.
As a community bank, our ability to maintain our reputation is critical to the success of our business, and the failure to do so may materially adversely affect our performance.
We are a community bank, and our reputation is one of the most valuable components of our business. As such, we strive to conduct our business in a manner that enhances our reputation. This is done, in part, by recruiting, hiring, and retaining employees who share our core values of being an integral part of the communities we serve, delivering superior service to our customers, and caring about our customers and
37
Table of Contents
associates. If our reputation is negatively affected, by the actions of our employees or otherwise, our business and, therefore, our operating results may be materially adversely affected. Further, negative public opinion can expose us to litigation and regulatory action as we seek to implement our growth strategy.
As a community banking institution, we have lower lending limits and different lending risks than certain of our larger, more diversified competitors.
We are a community banking institution that provides banking services to the local communities in the market areas in which we operate. Our ability to diversify our economic risks is limited by our own local markets and economies. We lend primarily to individuals and to small to medium-sized businesses, which may expose us to greater lending risks than those of banks that lend to larger, better-capitalized businesses with longer operating histories. In addition, our legally mandated lending limits are lower than those of certain of our competitors that have more capital than we do. These lower lending limits may discourage borrowers with lending needs that exceed our limits from doing business with us. We may try to serve such borrowers by selling loan participations to other financial institutions; however, this strategy may not succeed.
Our financial projections are based upon numerous assumptions about future events, and our actual financial performance may differ materially from our projections if our assumptions are inaccurate.
If the communities in which we operate do not grow, or if the prevailing economic conditions locally or nationally are less favorable than we have assumed, then our ability to reduce our nonperforming loans and other real estate owned portfolios and to implement our business strategies may be adversely affected, and our actual financial performance may be materially different from our projections.
Moreover, we cannot give any assurance that we will benefit from any market growth or favorable economic conditions in our market areas even if they do occur. If our senior management team is unable to provide the effective leadership necessary to implement our strategic plan, our actual financial performance may be materially adversely different from our projections. Additionally, to the extent that any component of our strategic plan requires regulatory approval, if we are unable to obtain necessary approval, we will be unable to completely implement our strategy, which may adversely affect our actual financial results. Our inability to successfully implement our strategic plan could adversely affect the price of our Class A common stock.
Volatility in commodity prices may adversely affect our financial condition and results of operations.
In addition to the geographic concentration of our markets, certain industry-specific economic factors also affect us. For example, while we do not have a concentration in energy lending, the industry is cyclical and recently has experienced a significant drop in crude oil and natural gas prices. In addition, we make loans to customers involved in the agricultural industry, many of whom are also impacted by fluctuations in commodity prices. Volatility in commodity prices could adversely impact the ability of borrowers in these industries to perform under the terms of their borrowing arrangements with us, and as a result, a severe and prolonged decline in commodity prices may adversely affect our financial condition and results of operations. It is also difficult to project future commodity prices as they are dependent upon many different factors beyond our control.
We depend on the accuracy and completeness of information about customers and counterparties.
In deciding whether to extend credit or enter into other transactions with customers and counterparties, we may rely on information furnished to us by or on behalf of customers and counterparties, including financial statements and other financial information. We also may rely on representations of customers and counterparties as to the accuracy and completeness of that information and, with respect to financial statements, on reports of independent auditors. In deciding whether to extend credit, we may rely upon our customers’ representations that their financial statements conform to GAAP and present fairly, in all material respects, the financial condition, results of operations, and cash flows of the customer. We also may rely on customer representations and
38
Table of Contents
certifications, or other audit or accountants’ reports, with respect to the business and financial condition of our clients. Our financial condition, results of operations, financial reporting, and reputation could be negatively affected if we rely on materially misleading, false, inaccurate, or fraudulent information.
We are subject to environmental risk in our lending activities.
Because a significant portion of our loan portfolio is secured by real property, we may foreclose upon and take title to such property in the ordinary course of business. If hazardous substances are found on such property, we could be liable for remediation costs, as well as for personal injury and property damage. Environmental laws might require us to incur substantial expenses, materially reduce the property’s value, or limit our ability to use or sell the property. Although management has policies requiring environmental reviews before loans secured by real property are made and before foreclosure is commenced, it is still possible that environmental risks might not be detected and that the associated costs might have a material adverse effect on our financial condition and results of operations.
We continually encounter technological change and may have fewer resources than our competitors to continue to invest in technological improvements.
The banking and financial services industries are undergoing rapid technological changes, with frequent introductions of new technology-driven products and services. In addition to enhancing the level of service provided to customers, the effective use of technology increases efficiency and enables financial institutions to reduce costs. Our future success will depend, in part, upon our ability to address the needs of our customers by using technology to provide products and services that enhance customer convenience and create additional efficiencies in operations. Many of our competitors have greater resources to invest in technological improvements, and we may not be able to effectively implement new technology-driven products and services, which could reduce our ability to effectively compete.
Our information systems may experience a failure or interruption.
We rely heavily on communications and information systems to conduct our business. Any failure or interruption in the operation of these systems could impair or prevent the effective operation of our customer relationship management, general ledger, deposit, lending, or other functions. While we have policies and procedures designed to prevent or limit the effect of a failure or interruption in the operation of our information systems, there can be no assurance that any such failures or interruptions will not occur or, if they do occur, that they will be adequately addressed. The occurrence of any failures or interruptions impacting our information systems could damage our reputation, result in a loss of customer business, and expose us to additional regulatory scrutiny, civil litigation, and possible financial liability, any of which could have a material adverse effect on our financial condition and results of operations.
We use information technology in our operations and offer online banking services to our customers, and unauthorized access to our or our customers’ confidential or proprietary information as a result of a cyber-attack or otherwise could expose us to reputational harm and litigation and adversely affect our ability to attract and retain customers.
Information security risks for financial institutions have generally increased in recent years, in part because of the proliferation of new technologies, the use of the internet and telecommunications technologies to conduct financial transactions, and the increased sophistication and activities of organized crime, hackers, terrorists, activists, and other external parties. We are under continuous threat of loss due to hacking and cyber-attacks, especially as we continue to expand customer capabilities to utilize internet and other remote channels to transact business. Our risk and exposure to these matters remains heightened because of the evolving nature and complexity of these threats from cybercriminals and hackers, our plans to continue to provide internet banking and mobile banking channels, and our plans to develop additional remote connectivity solutions to serve our customers. Therefore, the secure processing, transmission, and storage of information in connection with our online banking services are critical elements of our operations. However, our network could be vulnerable to
39
Table of Contents
unauthorized access, computer viruses and other malware, phishing schemes, or other security failures. In addition, our customers may use personal smartphones, tablet PCs, or other mobile devices that are beyond our control systems in order to access our products and services. Our technologies, systems and networks, and our customers’ devices, may become the target of cyber-attacks, electronic fraud, or information security breaches that could result in the unauthorized release, gathering, monitoring, misuse, loss, or destruction of our or our customers’ confidential, proprietary, and other information, or otherwise disrupt our or our customers’ or other third parties’ business operations. As cyber threats continue to evolve, we may be required to spend significant capital and other resources to protect against these threats or to alleviate or investigate problems caused by such threats. To the extent that our activities or the activities of our customers involve the processing, storage, or transmission of confidential customer information, any breaches or unauthorized access to such information could present significant regulatory costs and expose us to litigation and other possible liabilities. Any inability to prevent these types of security threats could also cause existing customers to lose confidence in our systems and could adversely affect our reputation and ability to generate deposits. While we have not experienced any material losses relating to cyber-attacks or other information security breaches to date, we may suffer such losses in the future. The occurrence of any cyber-attack or information security breach could result in potential liability to clients, reputational damage, damage to our competitive position, and the disruption of our operations, all of which could adversely affect our financial condition or results of operations.
We are dependent upon outside third parties for the processing and handling of our records and data.
We rely on software developed by third-party vendors to process various transactions. In some cases, we have contracted with third parties to run their proprietary software on our behalf. These systems include, but are not limited to, general ledger, payroll, employee benefits, loan and deposit processing, and securities portfolio accounting. While we perform a review of controls instituted by the applicable vendors over these programs in accordance with industry standards and perform our own testing of user controls, we must rely on the continued maintenance of controls by these third-party vendors, including safeguards over the security of customer data. In addition, we maintain, or contract with third parties to maintain, daily backups of key processing outputs in the event of a failure on the part of any of these systems. Nonetheless, we may incur a temporary disruption in our ability to conduct business or process transactions, or incur damage to our reputation, if the third-party vendor fails to adequately maintain internal controls or institute necessary changes to systems. Such a disruption or breach of security may have a material adverse effect on our business.
We are subject to losses due to the errors or fraudulent behavior of employees or third parties.
We are exposed to many types of operational risk, including the risk of fraud by employees and outsiders, clerical record-keeping errors and transactional errors. Our business is dependent on our employees as well as third-party service providers to process a large number of increasingly complex transactions. We could be materially adversely affected if someone causes a significant operational breakdown or failure, either as a result of human error or where an individual purposefully sabotages or fraudulently manipulates our operations or systems. When we originate loans, we rely upon information supplied by loan applicants and third parties, including the information contained in the loan application, property appraisal and title information, if applicable, and employment and income documentation provided by third parties. If any of this information is misrepresented and such misrepresentation is not detected prior to loan funding, we generally bear the risk of loss associated with the misrepresentation. Any of these occurrences could result in a diminished ability of us to operate our business, potential liability to customers, reputational damage and regulatory intervention, which could negatively impact our business, financial condition and results of operations.
If our enterprise risk management framework is not effective at mitigating risk and loss to us, we could suffer unexpected losses and our results of operations could be materially adversely affected.
Our enterprise risk management framework seeks to achieve an appropriate balance between risk and return, which is critical to optimizing stockholder value. We have established processes and procedures intended to
40
Table of Contents
identify, measure, monitor, report and analyze the types of risk to which we are subject, including credit, liquidity, operational, regulatory compliance and reputational. However, as with any risk management framework, there are inherent limitations to our risk management strategies as there may exist, or develop in the future, risks that we have not appropriately anticipated or identified. For example, the recent financial and credit crisis and resulting regulatory reform highlighted both the importance and some of the limitations of managing unanticipated risks. If our risk management framework proves ineffective, we could suffer unexpected losses and our business and results of operations could be materially adversely affected.
Changes in accounting standards could materially impact our financial statements.
From time to time, the Financial Accounting Standards Board or the SEC may change the financial accounting and reporting standards that govern the preparation of our financial statements. Such changes may result in us being subject to new or changing accounting and reporting standards. In addition, the bodies that interpret the accounting standards (such as banking regulators, outside auditors or management) may change their interpretations or positions on how these standards should be applied. These changes may be beyond our control, can be hard to predict, and can materially impact how we record and report our financial condition and results of operations. In some cases, we could be required to apply a new or revised standard retrospectively, or apply an existing standard differently, also retrospectively, in each case resulting in our needing to revise or restate prior period financial statements.
Adverse weather or manmade events could negatively affect our markets or disrupt our operations, which could have an adverse effect upon our business and results of operations.
A significant portion of our business is generated in our Kansas and Missouri markets, which have been, and may continue to be, susceptible to natural disasters, such as tornadoes, droughts, floods and other severe weather events. These natural disasters could negatively impact regional economic conditions, cause a decline in the value or destruction of mortgaged properties and increase the risk of delinquencies, foreclosures, or loss on loans originated by us, damage our banking facilities and offices, and negatively impact our growth strategy. Such weather events could disrupt operations, result in damage to properties, and negatively affect the local economies in the markets where we operate. We cannot predict whether or to what extent damage that may be caused by future weather or manmade events will affect our operations or the economies in our current or future market areas, but such events could negatively impact economic conditions in these regions and result in a decline in local loan demand and loan originations, a decline in the value or destruction of properties securing our loans, and an increase in delinquencies, foreclosures, or loan losses. Our business or results of operations may be adversely affected by these and other negative effects of natural or manmade disasters. Further, severe weather, natural disasters, acts of war or terrorism, and other external events could adversely affect us in a number of ways, including an increase in delinquencies, bankruptcies, or defaults that could result in a higher level of nonperforming assets, net charge-offs, and provision for loan losses. Such risks could also impair the value of collateral securing loans and hurt our deposit base.
We are or may become involved from time to time in suits, legal proceedings, information-gathering requests, investigations, and proceedings by governmental and self-regulatory agencies that may lead to adverse consequences.
Many aspects of our business involve substantial risk of legal liability. We have been named or threatened to be named as defendants in various lawsuits arising from our business activities (and in some cases from the activities of companies that we have acquired), including, but not limited to, consumer residential real estate mortgages. In addition, from time to time, we are, or may become, the subject of governmental and self-regulatory agency information-gathering requests, reviews, investigations and proceedings, and other forms of regulatory inquiry, including by bank regulatory agencies, the Consumer Financial Protection Bureau, the SEC, and law enforcement authorities. The results of such proceedings could lead to significant civil or criminal penalties, including monetary penalties, damages, adverse judgments, settlements, fines, injunctions, restrictions on the way in which we conduct our business, or reputational harm.
41
Table of Contents
We are subject to claims and litigation pertaining to intellectual property.
We rely on technology companies to provide information technology products and services necessary to support our day-to-day operations. Technology companies frequently enter into litigation based on allegations of patent infringement or other violations of intellectual property rights. In addition, patent holding companies seek to monetize patents they have purchased or otherwise obtained. Competitors of our vendors, or other individuals or companies, have from time to time claimed to hold intellectual property sold to us by its vendors. Such claims may increase in the future as the financial services sector becomes more reliant on information technology vendors. The plaintiffs in these actions frequently seek injunctions and substantial damages.
Regardless of the scope or validity of such patents or other intellectual property rights, or the merits of any claims by potential or actual litigants, we may have to engage in litigation that could be expensive, time-consuming, disruptive to our operations, and distracting to management. If we are found to infringe one or more patents or other intellectual property rights, we may be required to pay substantial damages or royalties to a third-party. In certain cases, we may consider entering into licensing agreements for disputed intellectual property, although no assurance can be given that such licenses can be obtained on acceptable terms or that litigation will not occur. These licenses may also significantly increase our operating expenses. If legal matters related to intellectual property claims were resolved against us or settled, we could be required to make payments in amounts that could have a material adverse effect on our business, financial condition and results of operations.
If the goodwill that we have recorded or may record in connection with a business acquisition becomes impaired, it could require charges to earnings, which would adversely affect on our business, financial condition and results of operations.
Goodwill represents the amount by which the cost of an acquisition exceeded the fair value of net assets we acquired in connection with the purchase of another financial institution. We review goodwill for impairment at least annually, or more frequently if a triggering event occurs which indicates that the carrying value of the asset might be impaired.
Our goodwill impairment test involves a two-step process. Under the first step, the estimation of fair value of the reporting unit is compared to its carrying value including goodwill. If step one indicates a potential impairment, the second step is performed to measure the amount of impairment, if any. If the carrying amount of the reporting unit goodwill exceeds the implied fair value of that goodwill, an impairment loss is recognized in an amount equal to that excess. Any such adjustments are reflected in our results of operations in the periods in which they become known. While we have not recorded any impairment charges since we initially recorded the goodwill, there can be no assurance that our future evaluations of our existing goodwill or goodwill we may acquire in the future will not result in findings of impairment and related write-downs, which could adversely affect our business, financial condition and results of operations.
We have pledged all of the stock of Equity Bank as collateral for a loan and if the lender forecloses, you could lose your investment.
We have pledged all of the stock of Equity Bank as collateral for a third-party loan, which had a balance of $18.6 million as of December 31, 2015. On January 4, 2016, this loan was repaid and on January 28, 2016 we entered into another third-party loan with a maximum lending commitment of $20.0 million. If we were to default on this indebtedness, the lender of such loan could foreclose on Equity Bank’s stock and we would lose our principal asset. In that event, if the value of Equity Bank’s stock is less than the amount of the indebtedness, you would lose the entire amount of your investment.
We may be required to repurchase mortgage loans or indemnify buyers against losses in some circumstances, which could harm liquidity, results of operations and financial condition.
When mortgage loans are sold, whether as whole loans or pursuant to a securitization, we are required to make customary representations and warranties to purchasers, guarantors and insurers, including
42
Table of Contents
government-sponsored enterprises, about the mortgage loans and the manner in which they were originated. We may be required to repurchase or substitute mortgage loans, or indemnify buyers against losses, in the event we breach these representations or warranties. In addition, we may be required to repurchase mortgage loans as a result of early payment default of the borrower on a mortgage loan. With respect to loans that are originated through Equity Bank or correspondent channels, the remedies available against the originating broker or correspondent, if any, may not be as broad as the remedies available to purchasers, guarantors and insurers of mortgage loans against us. We face further risk that the originating broker or correspondent, if any, may not have financial capacity to perform remedies that otherwise may be available. Therefore, if a purchaser, guarantor or insurer enforces its remedies against us, we may not be able to recover losses from the originating broker or correspondent. If repurchase and indemnity demands increase and such demands are valid claims and are in excess of our provision for potential losses, our liquidity, results of operations and financial condition may be adversely affected.
Risks Related to the Regulation of Our Industry
We are subject to extensive regulation in the conduct of our business, which imposes additional costs on us and adversely affects our profitability.
As a bank holding company, we are subject to federal regulation under the Bank Holding Company Act of 1956, as amended, or the BHC Act, and the examination and reporting requirements of the Federal Reserve. Federal regulation of the banking industry, along with tax and accounting laws, regulations, rules, and standards, may limit our operations significantly and control the methods by which we conduct business, as they limit those of other banking organizations. Banking regulations are primarily intended to protect depositors, deposit insurance funds, and the banking system as a whole, and not stockholders or other creditors. These regulations affect lending practices, capital structure, investment practices, dividend policy, and overall growth, among other things. For example, federal and state consumer protection laws and regulations limit the manner in which we may offer and extend credit. In addition, the laws governing bankruptcy generally favor debtors, making it more expensive and more difficult to collect from customers who become subject to bankruptcy proceedings.
We also may be required to invest significant management attention and resources to evaluate and make any changes necessary to comply with applicable laws and regulations, particularly as a result of regulations adopted under the Dodd-Frank Act. This allocation of resources, as well as any failure to comply with applicable requirements, may negatively impact our financial condition and results of operations.
Changes in laws, government regulation, and monetary policy may have a material effect on our results of operations.
Financial institutions have been the subject of significant legislative and regulatory changes and may be the subject of further significant legislation or regulation in the future, none of which is within our control. New proposals for legislation continue to be introduced in the United States Congress that could further substantially increase regulation of the bank and non-bank financial services industries, impose restrictions on the operations and general ability of firms within the industry to conduct business consistent with historical practices, including in the areas of compensation, interest rates, financial product offerings, and disclosures, and have an effect on bankruptcy proceedings with respect to consumer residential real estate mortgages, among other things. Federal and state regulatory agencies also frequently adopt changes to their regulations or change the manner in which existing regulations are applied. Changes to statutes, regulations, or regulatory policies, including changes in their interpretation or implementation by regulators, could affect us in substantial and unpredictable ways. Such changes could, among other things, subject us to additional costs and lower revenues, limit the types of financial services and products that we may offer, ease restrictions on non-banks and thereby enhance their ability to offer competing financial services and products, increase compliance costs, and require a significant amount of management’s time and attention. Failure to comply with statutes, regulations, or policies could result in sanctions by regulatory agencies, civil monetary penalties, or reputational damage, each of which could have a material adverse effect on our business, financial condition, and results of operations.
43
Table of Contents
Banking agencies periodically conduct examinations of our business, including compliance with laws and regulations, and our failure to comply with any supervisory actions to which we become subject as a result of such examinations could materially and adversely affect us.
We are subject to supervision and regulation by federal and state banking agencies that periodically conduct examinations of our business, including compliance with laws and regulations – specifically, our subsidiary, Equity Bank, is subject to examination by the Federal Reserve and the Office of the State Bank Commissioner of Kansas, or (“the OSBC”), and we are subject to examination by the Federal Reserve. Accommodating such examinations may require management to reallocate resources, which would otherwise be used in the day-to-day operation of other aspects of our business. If, as a result of an examination, any such banking agency was to determine that the financial condition, capital resources, allowance for loan losses, asset quality, earnings prospects, management, liquidity, or other aspects of our operations had become unsatisfactory, or that we or our management were in violation of any law or regulation, such banking agency may take a number of different remedial actions as it deems appropriate. These actions include the power to enjoin “unsafe or unsound” practices, to require affirmative actions to correct any conditions resulting from any violation or practice, to issue an administrative order that can be judicially enforced, to direct an increase in our capital, to restrict our growth, to assess civil monetary penalties against us, our officers, or directors, to remove officers and directors, and, if it is concluded that such conditions cannot be corrected or there is an imminent risk of loss to depositors, to terminate our deposit insurance. If we become subject to such a regulatory action, it could have a material adverse effect on our business, financial condition, and results of operations.
FDIC deposit insurance assessments may continue to materially increase in the future, which would have an adverse effect on earnings.
As a member institution of the FDIC, our subsidiary, Equity Bank, is assessed a quarterly deposit insurance premium. Failed banks nationwide have significantly depleted the insurance fund and reduced the ratio of reserves to insured deposits. The FDIC has adopted a Deposit Insurance Fund, or DIF, Restoration Plan, which requires the DIF to attain a 1.35% reserve ratio by September 30, 2020. As a result of this requirement, Equity Bank could be required to pay significantly higher premiums or additional special assessments that would adversely affect its earnings, thereby reducing the availability of funds to pay dividends to us.
We are subject to certain capital requirements by regulators.
Applicable regulations require us to maintain specific capital standards in relation to the respective credit risks of our assets and off-balance sheet exposures. Various components of these requirements are subject to qualitative judgments by regulators. We maintain a “well capitalized” status under the current regulatory framework. Our failure to maintain a “well capitalized” status could affect our customers’ confidence in us, which could adversely affect our ability to do business. In addition, failure to maintain such status could also result in restrictions imposed by our regulators on our growth and other activities. Any such effect on customers or restrictions by our regulators could have a material adverse effect on our financial condition and results of operations.
We will become subject to more stringent capital requirements, which may adversely impact our return on equity or constrain us from paying dividends or repurchasing shares.
The Dodd-Frank Act requires the federal banking agencies to establish stricter risk-based capital requirements and leverage limits to apply to banks and bank and savings and loan holding companies. In July 2013, the federal banking agencies published the final Basel III rules (as defined in “Item 1 – Business – Supervision and Regulation – Bank Holding Company Regulation”) that revised their risk-based and leverage capital requirements and their method for calculating risk-weighted assets. The Basel III rules will apply to all bank holding companies with $1.0 billion or more in consolidated assets and all banks regardless of size.
44
Table of Contents
As a result of the enactment of the Basel III rules, we will become subject to increased required capital levels. The Basel III rules became effective as applied to us on January 1, 2015, with a phase-in period that generally extends from January 1, 2015 through January 1, 2019. The application of more stringent capital requirements on us could, among other things, result in lower returns on equity, require the raising of additional capital, and result in regulatory actions such as the inability to pay dividends or repurchase shares if we were to be unable to comply with such requirements.
We may need to raise additional capital in the future, including as a result of potential increased minimum capital thresholds established by regulators, but that capital may not be available when it is needed or may be dilutive to stockholders.
We are required by federal and state regulatory authorities to maintain adequate capital levels to support our operations. New regulations implementing minimum capital standards could require financial institutions to maintain higher minimum capital ratios and may place a greater emphasis on common equity as a component of “Tier 1 capital,” which consists generally of stockholders’ equity and qualifying preferred stock, less certain goodwill items and other intangible assets. In order to support our operations and comply with regulatory standards, we may need to raise capital in the future. Our ability to raise additional capital will depend on conditions in the capital markets at that time, which are outside of our control, and on our financial performance. Accordingly, we cannot assure you of our ability to raise additional capital, if needed, on favorable terms. The capital and credit markets have experienced significant volatility in recent years. In some cases, the markets have produced downward pressure on stock prices and credit availability for certain issuers without regard to those issuers’ underlying financial strength. If we cannot raise additional capital when needed, our financial condition and results of operations may be adversely affected, and our banking regulators may subject us to regulatory enforcement action, including receivership. Furthermore, our issuance of additional shares of our Class A common stock could dilute the economic ownership interest of our Class A stockholders.
We are subject to numerous laws designed to protect consumers, including the Community Reinvestment Act and fair lending laws, and failure to comply with these laws could lead to a wide variety of sanctions.
The Community Reinvestment Act, or CRA, the Equal Credit Opportunity Act, the Fair Housing Act, and other fair lending laws and regulations impose nondiscriminatory lending requirements on financial institutions. The U.S. Department of Justice and other federal agencies are responsible for enforcing these laws and regulations. A successful regulatory challenge to an institution’s performance under the CRA or fair lending laws and regulations could result in a wide variety of sanctions, including damages and civil money penalties, injunctive relief, restrictions on mergers and acquisitions activity, restrictions on expansion, and restrictions on entering new business lines. Private parties may also have the ability to challenge an institution’s performance under fair lending laws in private class action litigation. Such actions could have a material adverse effect on our business, financial condition, results of operations, and future prospects.
We are subject to the Bank Secrecy Act and other anti-money laundering statutes and regulations, and any deemed deficiency by us with respect to these laws could result in significant liability.
The Bank Secrecy Act, the USA PATRIOT Act of 2001, or the Patriot Act, and other laws and regulations require financial institutions, among other duties, to institute and maintain an effective anti-money laundering program and file suspicious activity and currency transaction reports when appropriate. In addition to other bank regulatory agencies, the federal Financial Crimes Enforcement Network of the U.S. Treasury, is authorized to impose significant civil money penalties for violations of those requirements and has recently engaged in coordinated enforcement efforts with the state and federal banking regulators, as well as the U.S. Department of Justice, Consumer Financial Protection Bureau, Drug Enforcement Administration, and Internal Revenue Service, or the IRS. We are also subject to increased scrutiny of compliance with the rules enforced by the Office of Foreign Assets Control of the U.S. Treasury regarding, among other things, the prohibition of transacting business with, and the need to freeze assets of, certain persons and organizations identified as a threat to the
45
Table of Contents
national security, foreign policy, or economy of the United States. If our policies, procedures, and systems are deemed deficient, we would be subject to liability, including fines and regulatory actions, which may include restrictions on our ability to pay dividends and the necessity to obtain regulatory approvals to proceed with certain aspects of our business plan, including our acquisition plans. Failure to maintain and implement adequate programs to combat money laundering and terrorist financing could also have serious reputational consequences for us. Any of these results could have a material adverse effect on our business, financial condition, results of operations, and future prospects.
Many of our new activities and expansion plans require regulatory approvals, and failure to obtain them may restrict our growth.
We intend to complement and expand our business by pursuing strategic acquisitions of financial institutions and other complementary businesses. Generally, we must receive state and federal regulatory approval before we can acquire an FDIC-insured depository institution or related business. In determining whether to approve a proposed acquisition, federal banking regulators will consider, among other factors, the effect of the acquisition on competition, our financial condition, our future prospects, and the impact of the proposal on U.S. financial stability. The regulators also review current and projected capital ratios and levels, the competence, experience and integrity of management and its record of compliance with laws and regulations, the convenience and needs of the communities to be served (including the acquiring institution’s record of compliance under the CRA) and the effectiveness of the acquiring institution in combating money laundering activities. Such regulatory approvals may not be granted on terms that are acceptable to us, or at all. We may also be required to sell branches as a condition to receiving regulatory approval, which condition may not be acceptable to us or, if acceptable to us, may reduce the benefit of any acquisition.
The Federal Reserve may require us to commit capital resources to support our subsidiary, Equity Bank.
The Federal Reserve requires a bank holding company to act as a source of financial and managerial strength to its subsidiary banks and to commit resources to support its subsidiary banks. Under the “source of strength” doctrine, the Federal Reserve may require a bank holding company to make capital injections into a troubled subsidiary bank at times when the bank holding company may not be inclined to do so and may charge the bank holding company with engaging in unsafe and unsound practices for failure to commit resources to such a subsidiary bank. Accordingly, we could be required to provide financial assistance to our subsidiary, Equity Bank, if it experiences financial distress.
Such a capital injection may be required at a time when our resources are limited and we may be required to borrow the funds to make the required capital injection. In the event of a bank holding company’s bankruptcy, the bankruptcy trustee will assume any commitment by the holding company to a federal bank regulatory agency to maintain the capital of a subsidiary bank. Moreover, bankruptcy law provides that claims based on any such commitment will be entitled to a priority of payment over the claims of the holding company’s general unsecured creditors, including the holders of any note obligations.
We could be adversely affected by the soundness of other financial institutions.
Financial services institutions are interrelated as a result of trading, clearing, counterparty or other relationships. We have exposure to many different industries and counterparties, and routinely execute transactions with counterparties in the financial services industry, including commercial banks, brokers and dealers, investment banks and other institutional clients. Many of these transactions expose us to credit risk in the event of a default by a counterparty or client. In addition, our credit risk may be exacerbated when our collateral cannot be foreclosed upon or is liquidated at prices not sufficient to recover the full amount of the credit or derivative exposure due. Any such losses could adversely affect our business, financial condition and results of operations.
46
Table of Contents
Stockholders may be deemed to be acting in concert or otherwise in control of us and our bank subsidiary, which could impose prior approval requirements and result in adverse regulatory consequences for such holders.
We are a bank holding company regulated by the Federal Reserve. Any entity (including a “group” composed of natural persons) owning 25% or more of a class of our outstanding shares of voting stock, or a lesser percentage if such holder or group otherwise exercises a “controlling influence” over us, may be subject to regulation as a “bank holding company” in accordance with the Bank Holding Company Act of 1956, as amended. In addition, (i) any bank holding company or foreign bank with a U.S. presence is required to obtain the approval of the Federal Reserve under the Bank Holding Company Act to acquire or retain 5% or more of a class of our outstanding shares of voting stock, and (ii) any person other than a bank holding company may be required to obtain prior regulatory approval under the Change in Bank Control Act to acquire or retain 10% or more of our outstanding shares of voting stock. Any stockholder that is deemed to “control” the Company for bank regulatory purposes would become subject to prior approval requirements and ongoing regulation and supervision. Such a holder may be required to divest amounts equal to or exceeding 5% of the voting shares of investments that may be deemed incompatible with bank holding company status, such as an investment in a company engaged in non-financial activities. Regulatory determination of “control” of a depository institution or holding company is based on all of the relevant facts and circumstances. Potential investors are advised to consult with their legal counsel regarding the applicable regulations and requirements.
Shares of our common stock owned by holders determined by a bank regulatory agency to be acting in concert would be aggregated for purposes of determining whether those holders have control of a bank or bank holding company. Each stockholder obtaining control that is a “company” would be required to register as a bank holding company. “Acting in concert” generally means knowing participation in a joint activity or parallel action towards the common goal of acquiring control of a bank or a parent company, whether or not pursuant to an express agreement. The manner in which this definition is applied in individual circumstances can vary and cannot always be predicted with certainty. Many factors can lead to a finding of acting in concert, including where: (i) the stockholders are commonly controlled or managed; (ii) the stockholders are parties to an oral or written agreement or understanding regarding the acquisition, voting or transfer of control of voting securities of a bank or bank holding company; (iii) the stockholders are immediate family members; or (iv) both a stockholder and a controlling stockholder, partner, trustee or management official of such stockholder own equity in the bank or bank holding company.
Risks Related to Our Class A Common Stock
The market price of our Class A common stock may be subject to substantial fluctuations, which may make it difficult for you to sell your shares at the volumes, prices, and times desired.
The trading price of our Class A common stock may be volatile, which may make it difficult for you to resell your shares at the volume, prices and times desired. There are many factors that may impact the market price and trading volume of our Class A common stock, including:
| • | actual or anticipated fluctuations in our operating results, financial condition, or asset quality; |
| • | market conditions in the broader stock market in general, or in our industry in particular; |
| • | publication of research reports about us, our competitors, or the bank and non-bank financial services industries generally, or changes in, or failure to meet, securities analysts’ estimates of our financial and operating performance, or lack of research reports by industry analysts or ceasing of coverage; |
| • | future issuances of our Class A common stock or other securities; |
| • | significant acquisitions or business combinations, strategic partnerships, joint ventures, or capital commitments by or involving our competitors or us; |
47
Table of Contents
| • | additions or departures of key personnel; |
| • | trades of large blocks of our Class A common stock; |
| • | economic and political conditions or events; |
| • | regulatory developments; and |
| • | other news, announcements, or disclosures (whether by us or others) related to us, our competitors, our core markets, or the bank and non-bank financial services industries. |
The stock market and, in particular, the market for financial institution stocks, have experienced substantial fluctuations in recent years, which in many cases have been unrelated to the operating performance and prospects of particular companies. In addition, significant fluctuations in the trading volume in our Class A common stock may cause significant price variations to occur. Increased market volatility may materially and adversely affect the market price of our Class A common stock, which could make it difficult to sell your shares at the volume, prices and times desired.
The obligations associated with being a public company require significant resources and management attention.
As a public company, we face increased legal, accounting, administrative and other costs and expenses that are not incurred by private companies, particularly after we are no longer an emerging growth company. We are subject to the reporting requirements of the Exchange Act, which requires that we file annual, quarterly and current reports with respect to our business and financial condition and proxy and other information statements, and the rules and regulations implemented by the SEC, the Sarbanes-Oxley Act, the Dodd-Frank Act, the PCAOB and the NASDAQ Global Select Market, each of which imposes additional reporting and other obligations on public companies. As a public company, we are required to:
| • | prepare and distribute periodic reports, proxy statements and other stockholder communications in compliance with the federal securities laws and rules; |
| • | expand the roles and duties of our board of directors and committees thereof; |
| • | maintain an enhanced internal audit function; |
| • | institute more comprehensive financial reporting and disclosure compliance procedures; |
| • | involve and retain to a greater degree outside counsel and accountants in the activities listed above; |
| • | enhance our investor relations function; |
| • | establish new internal policies, including those relating to trading in our securities and disclosure controls and procedures; |
| • | retain additional personnel; |
| • | comply with the NASDAQ Global Select Market listing standards; and |
| • | comply with the Sarbanes-Oxley Act. |
We expect these rules and regulations and changes in laws, regulations and standards relating to corporate governance and public disclosure, which have created uncertainty for public companies, to increase legal and financial compliance costs and make some activities more time consuming and costly. These laws, regulations and standards are subject to varying interpretations, in many cases due to their lack of specificity, and, as a result, their application in practice may evolve over time as new guidance is provided by regulatory and governing bodies. This could result in continuing uncertainty regarding compliance matters and higher costs necessitated by ongoing revisions to disclosure and governance practices. Our investment in compliance with existing and evolving regulatory requirements will result in increased administrative expenses and a diversion of management’s time and attention from revenue-generating activities to compliance activities, which could have a
48
Table of Contents
material adverse effect on our business, financial condition and results of operations. These increased costs may require us to divert a significant amount of money that we could otherwise use to expand our business and achieve our strategic objectives
We have not historically declared or paid cash dividends on our common stock and we do not expect to pay dividends on our common stock in the foreseeable future. Consequently, your only opportunity to achieve a return on your investment is if the price of our Class A common stock appreciates.
The holders of our common stock will receive dividends if and when declared by our board of directors out of legally available funds. Our board of directors has not declared a dividend on our common stock since our inception. Any future determination relating to our dividend policy will be made at the discretion of our board of directors and will depend on a number of factors, including our future earnings, capital requirements, financial condition, future prospects, regulatory restrictions, and other factors that our board of directors may deem relevant.
Our principal business operations are conducted through our subsidiary, Equity Bank. Cash available to pay dividends to our stockholders is derived primarily, if not entirely, from dividends paid by Equity Bank to us. The ability of Equity Bank to pay dividends to us, as well as our ability to pay dividends to our stockholders, will continue to be subject to, and limited by, certain legal and regulatory restrictions. Further, any lenders making loans to us may impose financial covenants that may be more restrictive with respect to dividend payments than the regulatory requirements.
If a substantial number of shares become available for sale and are sold in a short period of time, the market price of our Class A common stock could decline.
If our existing stockholders sell substantial amounts of our Class A common stock in the public market, the market price of our Class A common stock could decrease significantly. The perception in the public market that our existing stockholders might sell shares of Class A common stock could also depress our market price. Our directors, executive officers and certain additional other holders of our Class A common stock are subject to the lock-up agreements that expire on May 7, 2016. After all of the lock-up periods have expired and the holding periods have elapsed, additional shares will be eligible for sale in the public market. In addition, the underwriters from our IPO may, at any time and without notice, release all or a portion of the shares subject to lock-up agreements. The market price of shares of our Class A common stock may drop significantly when the restrictions on resale by our existing stockholders lapse. A decline in the price of shares of our Class A common stock might impede our ability to raise capital through the issuance of additional shares of our Class A common stock or other equity securities and could result in a decline in the value of the shares of our Class A common stock.
Securities analysts may not initiate or continue coverage on our Class A common stock, which could adversely affect the market for our Class A common stock.
The trading market for our Class A common stock may depend in part on the research and reports that securities analysts publish about us and our business. We do not have any control over these securities analysts and they may not cover our Class A common stock. If securities analysts do not cover our Class A common stock, the lack of research coverage may adversely affect our market price. If we are covered by securities analysts and our Class A common stock is the subject of an unfavorable report, the price of our Class A common stock may decline. If one or more of these analysts cease to cover us or fail to publish regular reports on us, we could lose visibility in the financial markets, which could cause the price or trading volume of our Class A common stock to decline.
The trading volume in our common stock is less than other larger financial institutions.
Although our Class A common stock is listed for trading on the Nasdaq Global Select Market, the trading volume in our common stock is less than that of other, larger financial services companies. A public trading
49
Table of Contents
market having the desired characteristics of depth, liquidity and orderliness depends on the presence in the marketplace of willing buyers and sellers of our Class A common stock at any given time. This presence depends on the individual decisions of investors and general economic and market conditions over which we have no control. Given the lower trading volume of our Class A common stock, significant sales of our Class A common stock, or the expectation of these sales, could cause the price of our Class A common stock to decline.
Use of our common stock for future acquisitions or to raise capital may be dilutive to existing stockholders.
When we determine that appropriate strategic opportunities exist, we may acquire other financial institutions and related businesses, subject to applicable regulatory requirements. We may use our common stock for such acquisitions. We may also seek to raise capital for such acquisitions through selling additional common stock. It is possible that the issuance of additional common stock in such acquisitions or capital transactions may be dilutive to the interests of our existing stockholders.
A future issuance of stock could dilute the value of our Class A common stock.
We may sell additional shares of Class A common stock, or securities convertible into or exchangeable for such shares, in subsequent public or private offerings. Future issuance of any new shares could cause further dilution in the value of our outstanding shares of Class A common stock. We cannot predict the size of future issuances of our Class A common stock, or securities convertible into or exchangeable for such shares, or the effect, if any, that future issuances and sales of shares of our Class A common stock will have on the market price of our Class A common stock. Sales of substantial amounts of our Class A common stock (including shares issued in connection with an acquisition), or the perception that such sales could occur, may adversely affect prevailing market prices of our Class A common stock.
We have significant institutional investors whose interests may differ from yours.
A significant portion of our outstanding equity is currently held by various investment funds. These funds could have a significant level of influence because of their level of ownership and representation on our board of directors, including a greater ability than you and our other stockholders to influence the election of directors and the potential outcome of other matters submitted to a vote of our stockholders, such as mergers, the sale of substantially all of our assets and other extraordinary corporate matters and affect the votes of our board of directors. These funds also have certain rights, such as access rights and registration rights that our other stockholders do not have. The interests of these funds could conflict with the interests of our other stockholders, including you, and any future transfer by these funds of their shares of Class A common stock to other investors who have different business objectives could have a material adverse effect on our business, financial condition, results of operations and future prospects, and the market value of our Class A common stock.
Our directors and executive officers beneficially own a significant portion of our Class A common stock and have substantial influence over us.
Our directors and executive officers, as a group, beneficially owned approximately 27.8% of our outstanding Class A common stock as of December 31, 2015. As a result of this level of ownership, our directors and executive officers have the ability, by taking coordinated action, to exercise significant influence over our affairs and policies. The interests of our directors and executive officers may not be consistent with your interests as a stockholder. This influence may also have the effect of delaying or preventing changes of control or changes in management, or limiting the ability of our other stockholders to approve transactions that they may deem to be in the best interests of our Company.
Shares of our Class A common stock are not insured deposits and may lose value.
Shares of our Class A common stock are not savings or deposit accounts and are not insured by the FDIC’s DIF, or any other agency or private entity. Such shares are subject to investment risk, including the possible loss of some or all of the value of your investment.
50
Table of Contents
The laws that regulate our operations are designed for the protection of depositors and the public, not our stockholders.
The federal and state laws and regulations applicable to our operations give regulatory authorities extensive discretion in connection with their supervisory and enforcement responsibilities, and generally have been promulgated to protect depositors and the FDIC’s DIF and not for the purpose of protecting stockholders. These laws and regulations can materially affect our future business. Laws and regulations now affecting us may be changed at any time, and the interpretation of such laws and regulations by bank regulatory authorities is also subject to change.
We have the ability to incur debt and pledge our assets, including our stock in Equity Bank, to secure that debt and holders of any such debt obligations will generally have priority over holders of our Class A common stock with respect to certain payment obligations.
We have the ability to incur debt and pledge our assets to secure that debt. Absent special and unusual circumstances, a holder of indebtedness for borrowed money has rights that are superior to those of holders of Class A common stock. For example, interest must be paid to the lender before dividends can be paid to stockholders, and loans must be paid off before any assets can be distributed to stockholders if we were to liquidate. Furthermore, we would have to make principal and interest payments on our indebtedness, which could reduce our profitability or result in net losses on a consolidated basis.
We are an emerging growth company under the JOBS Act, and we cannot be certain whether the reduced disclosure requirements applicable to emerging growth companies will make our Class A common stock less attractive to investors.
We are an emerging growth company under the JOBS Act, and we therefore are permitted to, and we intend to, take advantage of exemptions from certain disclosure requirements. We are an emerging growth company until the earliest of: (i) the last day of the fiscal year during which we had total annual gross revenues of $1.0 billion or more; (ii) the last day of the fiscal year following the fifth anniversary of our initial public offering; (iii) the date on which we have, during the previous three-year period, issued more than $1.0 billion in non-convertible debt; or (iv) the date on which we are deemed a “large accelerated filer,” as defined under the federal securities laws. For so long as we remain an emerging growth company, we may take advantage of certain exemptions from various reporting requirements that are applicable to other public companies that are not emerging growth companies, including, but not limited to, not being required to comply with the auditor attestation requirements of Section 404 of the Sarbanes-Oxley Act, reduced disclosure obligations regarding executive compensation in our periodic reports and proxy statements, and exemptions from the requirements of holding a nonbinding advisory vote on certain executive compensation matters, such as “say on pay” and “say on frequency.” As a result, our stockholders may not have access to certain information that they may deem important. Although we intend to rely on certain of the exemptions provided in the JOBS Act, the exact implications of the JOBS Act for us are still subject to interpretations and guidance by the SEC and other regulatory agencies.
We cannot predict whether investors will find our Class A common stock less attractive as a result of our taking advantage of these exemptions. If some investors find our Class A common stock less attractive as a result of these choices, there may be a less active trading market for our Class A common stock, and our stock price may be more volatile.
If we fail to maintain an effective system of disclosure controls and procedures and internal control over financial reporting, we may not be able to accurately report our financial results or prevent fraud.
Ensuring that we have adequate disclosure controls and procedures, including internal control over financial reporting, in place so that we can produce accurate financial statements on a timely basis is costly and time-consuming and needs to be reevaluated frequently. We are in the process of documenting, reviewing and, if
51
Table of Contents
appropriate, improving our internal controls and procedures in anticipation of being subject to the requirements of Section 404 of the Sarbanes-Oxley Act, which will require annual management assessments of the effectiveness of our internal control over financial reporting and, when we cease to be an emerging growth company under the JOBS Act, a report by our independent auditors addressing these assessments. Our management may conclude that our internal control over financial reporting are not effective due to our failure to cure any identified material weakness or otherwise. Moreover, even if our management concludes that our internal control over financial reporting are effective, our independent registered public accounting firm may not conclude that our internal control over financial reporting are effective. In the future, our independent registered public accounting firm may not be satisfied with our internal control over financial reporting or the level at which our controls are documented, designed, operated or reviewed, or it may interpret the relevant requirements differently from us. In addition, during the course of the evaluation, documentation and testing of our internal control over financial reporting, we may identify deficiencies that we may not be able to remediate in time to meet the deadline imposed by the SEC for compliance with the requirements of Section 404 of the Sarbanes-Oxley Act. Any such deficiencies may also subject us to adverse regulatory consequences. If we fail to achieve and maintain the adequacy of our internal control over financial reporting, as these standards are modified, supplemented or amended from time to time, we may be unable to report our financial information on a timely basis, we may not be able to conclude on an ongoing basis that we have effective internal control over financial reporting in accordance with the Sarbanes-Oxley Act, and we may suffer adverse regulatory consequences or violations of listing standards. There could also be a negative reaction in the financial markets due to a loss of investor confidence in the reliability of our financial statements.
Our corporate governance documents, and certain corporate and banking laws applicable to us, could make a takeover more difficult.
Certain provisions of our Articles of Incorporation and our Bylaws, and applicable corporate and federal banking laws, could make it more difficult for a third party to acquire control of us or conduct a proxy contest, even if those events were perceived by many of our stockholders as beneficial to their interests. These provisions, and the corporate and banking laws and regulations applicable to us, among others:
| • | empower our board of directors, without stockholder approval, to issue preferred stock, the terms of which, including voting power, are set by our board of directors; |
| • | only permit stockholder action to be taken at an annual or special meeting of stockholders and not by written consent in lieu of such a meeting; |
| • | provide for a classified board of directors, so that only approximately one-third of or directors are elected each year; |
| • | prohibit us from engaging in certain business combinations with “interested stockholders” (generally defined as a holder of 15% or more of the corporation’s outstanding voting stock); |
| • | require at least 120 days’ advance notice of nominations for the election of directors and the presentation of stockholder proposals at meetings of stockholders; and |
| • | require prior regulatory application and approval of any transaction involving control of our organization. |
These provisions may discourage potential acquisition proposals and could delay or prevent a change in control, including under circumstances in which our stockholders might otherwise receive a premium over the market price of our shares.
Our board of directors may issue shares of preferred stock that would adversely affect the rights of our Class A common stockholders.
Our authorized capital stock includes 10,000,000 shares of preferred stock of which none were issued and outstanding as of March 11, 2016. Our board of directors, in its sole discretion, may designate and issue one or
52
Table of Contents
more series of preferred stock from the authorized and unissued shares of preferred stock. Subject to limitations imposed by law or our Articles of Incorporation, our board of directors is empowered to determine:
| • | the designation of, and the number of, shares constituting each series of preferred stock; |
| • | the dividend rate for each series; |
| • | the terms and conditions of any voting, conversion and exchange rights for each series; |
| • | the amounts payable on each series on redemption or our liquidation, dissolution or winding-up; |
| • | the provisions of any sinking fund for the redemption or purchase of shares of any series; and |
| • | the preferences and the relative rights among the series of preferred stock. |
We could issue preferred stock with voting and conversion rights that could adversely affect the voting power of the shares of our Class A common stock and with preferences over our Class A common stock with respect to dividends and in liquidation.
The return on your investment in our Class A common stock is uncertain.
We cannot provide any assurance that an investor in our Class A common stock will realize a substantial return on his or her investment, or any return at all. Further, as a result of the uncertainty and risks associated with our operations, many of which are described in this “Item 1A—Risk Factors” section, it is possible that an investor could lose his or her entire investment.
Item 1B: Unresolved Staff Comments
None
53
Table of Contents
Our principal executive offices are located at 7701 East Kellogg Drive, Wichita, Kansas 67207. Including our principal executive offices, as of December 31, 2015, we operated a total of 29 branches, consisting of four branches in the Wichita, Kansas metropolitan area, six branches in the Kansas City metropolitan area, three branches in Topeka, Kansas, ten branches in Western Missouri, two branches in Western Kansas and four branches in Southeast Kansas. Most of Equity Bank’s branches are equipped with automated teller machines and drive-through facilities. We believe all of our facilities are suitable for our operational needs. The following table summarizes pertinent details of our principal executive offices and branches, as of December 31, 2015:
| Address |
Owned/Leased | |
| Principal Executive Office and Wichita Branch: |
||
| 7701 East Kellogg Drive Wichita, Kansas 67207 |
Owned | |
| Other Wichita Branches: |
||
| 225 West Central Andover, Kansas 67002 |
Leased | |
|
1555 North Webb Road Wichita, Kansas 67206 |
Owned | |
|
10222 West Central Wichita, Kansas 67212 |
Owned | |
| Kansas City Branches: |
||
| 6200 Northwest 63rd Terrace Kansas City, Missouri 64151 |
Owned | |
|
8880 West 151st Street Overland Park, Kansas 66221 |
Owned | |
|
4551 West 107th Street, Suite 210 Overland Park, Kansas 66207 |
Leased | |
|
909 Northeast Rice Road Lee’s Summit, Missouri 64086 |
Leased | |
|
301 Southeast Main Street Lee’s Summit, Missouri 64063 |
Owned | |
|
1251 Southwest Oldham Parkway Lee’s Summit, Missouri 64081 |
Owned | |
| Western Missouri Branches: |
||
| 1919 Highway 13 Higginsville, Missouri 64037 |
Owned | |
|
300 South Miller Street Sweet Springs, Missouri 65351 |
Owned | |
|
612 North Maguire Warrensburg, Missouri 64093 |
Owned | |
|
1110 South Mitchell Street Warrensburg, Missouri 64093 |
Leased | |
|
200 North State Street Knob Noster, Missouri 65336 |
Owned | |
|
920 Thompson Boulevard Sedalia, Missouri 65301 |
Owned | |
54
Table of Contents
| Address |
Owned/Leased | |
|
504 West Benton Street Windsor, Missouri 65360 |
Owned | |
|
615 East Ohio Street Clinton, Missouri 64735 |
Owned | |
|
100 East Main Street Warsaw, Missouri 65355 |
Owned | |
|
1601 Commercial Street Warsaw, Missouri 65355 |
Owned | |
| Topeka Branches: |
||
| 701 South Kansas Avenue Topeka, Kansas 66603 |
Owned | |
|
507 West 8th Street Topeka, Kansas 66603 |
Owned | |
|
3825 Southwest 29th Street Topeka, Kansas 66614 |
Leased | |
| Western Kansas Branches: |
||
| 2428 Vine Street Hays, Kansas 67601 |
Owned | |
|
916 Washington Street Ellis, Kansas 67637 |
Owned | |
| Southeast Kansas Branches: |
||
| 902 McArthur Rd Coffeyville, Kansas 67337 |
Owned | |
|
112 East Myrtle Street Independence, Kansas 67301 |
Owned | |
|
801 Main Neodesha, Kansas 66757 |
Owned | |
|
102 North Broadway Street Pittsburg, Kansas 66762 |
Owned | |
From time to time we are party to various litigation matters incidental to the conduct of our business. See “NOTE 23 – LEGAL MATTERS” of the Notes to Consolidated Financial Statements under Item 8 to this Annual Report on Form 10-K for a complete discussion of litigation matters.
Item 4: Mine Safety Disclosures
Not applicable.
55
Table of Contents
Part II
Item 5: Market for Registrant’s Common Equity, Related Stockholder Matters and Issuer Purchases of Equity Securities
Market Information and Common Equity Holders
Our common stock is listed on the NASDAQ Global Select Markets under the symbol “EQBK”. Our common stock has no public trading history prior to November 11, 2015. At March 11, 2016, there were 7,150,017 shares of our Class A common stock, outstanding, 1,061,710 shares our Class B common stock outstanding, and 165 stockholders of record for the Company’s common stock.
The following table sets forth, for the periods indicated, the high and low intraday sales prices for our Class A common stock as reported by the NASDAQ Global Select Market:
| High | Low | |||||||
| Quarter ended December 31, 2015 (beginning November 11, 2015) |
$ | 24.93 | $ | 16.00 | ||||
| Quarter ended March 31, 2015 (through March 11, 2016) |
$ | 24.10 | $ | 19.72 | ||||
Dividend Policy
We have not historically declared or paid cash dividends on our common stock and we do not expect to pay dividends on our common stock for the foreseeable future. Instead, we anticipate that all of our future earnings will be retained to support our operations and to finance the growth and development of our business. Any future determination to pay dividends on our common stock will be made by our board of directors and will depend on a number of factors, including:
| • | our historical and projected financial condition, liquidity and results of operations; |
| • | our capital levels and requirements; |
| • | statutory and regulatory prohibitions and other limitations; |
| • | any contractual restriction on our ability to pay cash dividends, including pursuant to the terms of any of our credit agreements or other borrowing arrangements; |
| • | our business strategy; |
| • | tax considerations; |
| • | any acquisitions or potential acquisitions that we may examine; |
| • | general economic conditions; and |
| • | other factors deemed relevant by our board of directors. |
We are not obligated to pay dividends on our common stock.
As a Kansas corporation, we are subject to certain restrictions on dividends under the Kansas General Corporation Code. Generally, a Kansas corporation may pay dividends to its stockholders out of its surplus or, if there is no surplus, out of its net profits for the fiscal year in which the dividend is declared or the preceding fiscal year, or both. In addition, if the capital of a Kansas corporation is diminished by depreciation in the value of its property, or by losses, or otherwise, to an amount less than the aggregate amount of the capital represented by the issued and outstanding stock of all classes having a preference upon the distribution of assets, the directors of such corporation cannot declare and pay out of such net profits any dividends upon any shares of any classes of its capital stock until the deficiency in the amount of capital represented by the issued and outstanding stock of all classes having a preference upon the distribution of assets is repaired. We are also subject to certain restrictions on the payment of cash dividends as a result of banking laws, regulations and policies. For more information, see “Item 1 – Supervision and Regulation – Banking Regulation – Standards for Safety and Soundness.”
56
Table of Contents
Since we are a bank holding company and do not engage directly in business activities of a material nature, our ability to pay dividends to our stockholders depends, in large part, upon our receipt of dividends from Equity Bank, which is also subject to numerous limitations on the payment of dividends under federal and state banking laws, regulations and policies. The present and future dividend policy of Equity Bank is subject to the discretion of its board of directors. Equity Bank is not obligated to pay dividends.
If Equity Bank is “significantly undercapitalized” under the applicable federal bank capital standards, or if Equity Bank is “undercapitalized” and has failed to submit an acceptable capital restoration plan or has materially failed to implement such a plan, the FDIC may choose to require Equity Bank to receive prior approval for any capital distribution from the Federal Reserve. In addition, Equity Bank generally is prohibited from making a capital distribution if such a distribution would cause Equity Bank to be “undercapitalized” under applicable federal bank capital standards. For more information, see “Item 7 – Supervision and Regulation – Banking Regulation – Standards for Safety and Soundness.”
Securities Authorized for Issuance Under Equity Compensation Plans
The following table presents shares of our common stock that may be issued with respect to compensation plans at December 31, 2015:
| Plan category |
Number of securities to be issued upon exercise of outstanding options, warrants and rights (a) |
Weighted average exercise price of outstanding options, warrants and rights (b) |
Number of securities remaining available for future issuance under equity compensation plans (excluding securities reflected in column a) (c) |
|||||||||
| Equity compensation plans approved by security holders |
— | — | — | |||||||||
| Equity compensation plans not approved by security holders(2) |
561,995 | (1) | 15.93 | 368,705 | ||||||||
|
|
|
|
|
|
|
|||||||
| Total |
561,995 | $ | 15.93 | 368,705 | ||||||||
|
|
|
|
|
|
|
|||||||
| (1) | Includes 205,700 options to purchase common stock outstanding under our 2006 Non-Qualified Stock Option Plan and 356,295 options to purchase common stock outstanding under our 2013 Stock Incentive Plan as of December 31, 2015. |
| (2) | All securities remaining available for future issuance were available under our 2013 Stock Incentive Plan as of December 31, 2015. No securities remained available for future issuance under our 2006 Non-Qualified Stock Option Plan. |
57
Table of Contents
Performance Graph
The following performance graph compares total stockholders return on the Company’s common stock for the period beginning at the close of trading November 11, 2015 to December 31, 2015, with the cumulative total return of the NASDAQ Composite Index and the NASDAQ Bank Index for the same period. Cumulative total return is computed by dividing the difference between the Company’s share price at the end and the beginning of the measurement period by the share price at the beginning of the measurement period. The performance graph assumes $100 is invested on November 11, 2015, in the Company’s common stock, the NASDAQ Composite Index and the NASDAQ Bank Index. Historical stock price performance is not necessarily indicative of future stock price performance.
Total Return Performance
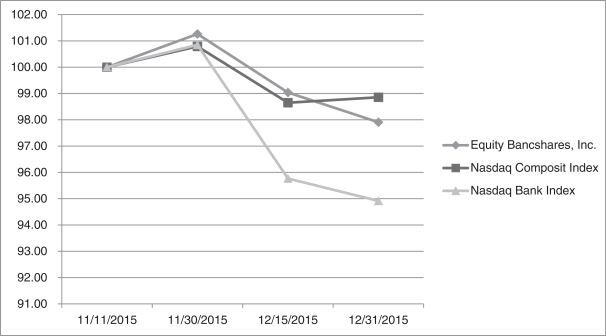
| November 11, 2015 |
November 30, 2015 |
December 15, 2015 |
December 31, 2015 |
|||||||||||||
| Equity Bancshares, Inc. |
$ | 100.00 | $ | 101.26 | $ | 99.04 | $ | 97.91 | ||||||||
| Nasdaq Global Select Market Index |
100.00 | 100.79 | 98.65 | 98.86 | ||||||||||||
| Nasdaq Bank Index |
100.00 | 100.85 | 95.77 | 94.92 | ||||||||||||
Recent Sales of Unregistered Equity Securities
None
Purchases of equity securities by the issuer and affiliated purchasers
None
58
Table of Contents
Item 6: Selected Financial Data
The following table sets forth selected historical consolidated financial and other data as of and for the years ended December 31, 2015, 2014 and 2013. Selected consolidated financial data as of and for the years ended December 31, 2015, 2014 and 2013 have been derived from our audited financial statements included elsewhere in this Annual Report on Form 10-K. Our historical results are not necessarily indicative of any future period. The performance, asset quality and capital ratios are unaudited and derived from our audited and unaudited financial statements as of and for the periods presented. Average balances have been calculated using daily averages, unless otherwise denoted.
You should read the selected consolidated financial data set forth below in conjunction with “Item 7 – Management’s Discussion and Analysis of Financial Condition and Results of Operations” and our consolidated financial statements and the related notes included elsewhere in this Annual Report on Form 10-K.
59
Table of Contents
Selected Financial Data for the periods indicated (dollars in thousands, except per share amounts):
| Years Ended December 31, | ||||||||||||
| 2015 | 2014 | 2013 | ||||||||||
| Statement of Income Data |
||||||||||||
| Interest and dividend income |
$ | 53,028 | $ | 46,794 | $ | 46,845 | ||||||
| Interest expense |
6,766 | 5,433 | 5,610 | |||||||||
| Net interest income |
46,262 | 41,361 | 41,235 | |||||||||
| Provision for loan losses |
3,047 | 1,200 | 2,583 | |||||||||
| Net gain on acquisition |
682 | — | — | |||||||||
| Net gain on sale and settlement of securities |
756 | 986 | 500 | |||||||||
| Other non-interest income |
8,364 | 7,688 | 7,392 | |||||||||
| Merger expense |
1,691 | — | — | |||||||||
| Loss on extinguishment of debt |
316 | — | — | |||||||||
| Other non-interest expense |
36,568 | 35,645 | 35,137 | |||||||||
| Income before income taxes |
14,442 | 13,190 | 11,407 | |||||||||
| Provision for income taxes |
4,142 | 4,203 | 3,534 | |||||||||
| Net income |
10,300 | 8,987 | 7,873 | |||||||||
| Dividends and discount accretion on preferred Stock |
(177 | ) | (708 | ) | (978 | ) | ||||||
| Net income allocable to common stockholders |
10,123 | 8,279 | 6,895 | |||||||||
| Basic earnings per share |
1.55 | 1.31 | 0.93 | |||||||||
| Diluted earnings per share |
1.54 | 1.30 | 0.92 | |||||||||
| Balance Sheet Data (at period end) |
||||||||||||
| Cash and cash equivalents |
$ | 56,829 | $ | 31,707 | $ | 20,620 | ||||||
| Securities available-for-sale |
130,810 | 52,985 | 65,450 | |||||||||
| Securities held-to-maturity |
310,539 | 261,017 | 284,407 | |||||||||
| Loans held for sale |
3,504 | 897 | 347 | |||||||||
| Gross loans held for investment |
960,355 | 725,876 | 660,294 | |||||||||
| Allowance for loan losses |
5,506 | 5,963 | 5,614 | |||||||||
| Loans held for investment, net of allowance for loan losses |
954,849 | 719,913 | 654,680 | |||||||||
| Goodwill and core deposit intangibles, net |
19,679 | 19,237 | 19,600 | |||||||||
| Mortgage servicing asset |
29 | — | — | |||||||||
| Total assets |
1,585,727 | 1,174,515 | 1,139,897 | |||||||||
| Total deposits |
1,215,914 | 981,177 | 947,319 | |||||||||
| Borrowings |
194,064 | 70,370 | 43,365 | |||||||||
| Total liabilities |
1,418,494 | 1,056,786 | 1,000,024 | |||||||||
| Total stockholders’ equity |
167,233 | 117,729 | 139,873 | |||||||||
| Tangible common equity |
131,153 | 82,133 | 88,381 | |||||||||
| Performance ratios |
||||||||||||
| Return on average assets (ROAA) |
0.75 | % | 0.78 | % | 0.67 | % | ||||||
| Return on average equity (ROAE) |
8.19 | % | 7.30 | % | 5.71 | % | ||||||
| Return on average tangible common equity (ROATCE) |
9.66 | % | 9.99 | % | 8.27 | % | ||||||
| Yield on loans |
5.31 | % | 5.63 | % | 5.63 | % | ||||||
| Cost of interest-bearing deposits |
0.55 | % | 0.49 | % | 0.53 | % | ||||||
| Net interest margin |
3.65 | % | 3.92 | % | 3.87 | % | ||||||
| Efficiency ratio |
66.94 | % | 72.67 | % | 72.26 | % | ||||||
| Non-interest income / average assets |
0.71 | % | 0.75 | % | 0.67 | % | ||||||
| Non-interest expense / average assets |
2.80 | % | 3.08 | % | 2.99 | % | ||||||
| Capital Ratios |
||||||||||||
| Tier 1 Leverage Ratio |
9.47 | % | 9.62 | % | 11.59 | % | ||||||
| Common Equity Tier 1 Capital Ratio |
12.35 | % | N/A | N/A | ||||||||
| Tier 1 Risk Based Capital Ratio |
13.85 | % | 13.16 | % | 17.01 | % | ||||||
| Total Risk Based Capital Ratio |
14.35 | % | 13.86 | % | 17.74 | % | ||||||
| Equity / Assets |
10.55 | % | 10.02 | % | 12.27 | % | ||||||
| Book value per share |
$ | 18.37 | $ | 16.71 | $ | 14.62 | ||||||
| Tangible book value per share |
$ | 15.97 | $ | 13.54 | $ | 11.97 | ||||||
| Tangible common equity to tangible assets |
8.37 | % | 7.11 | % | 7.89 | % | ||||||
60
Table of Contents
Item 7: Management’s Discussion and Analysis of Financial Condition and Results of Operations
The following discussion and analysis of our financial condition and results of operations should be read in conjunction with our audited consolidated financial statements and the accompanying notes included elsewhere in this Annual Report on Form 10-K. The following discussion contains “forward-looking statements” that reflect our future plans, estimates, beliefs and expected performance. We caution that assumptions, expectations, projections, intentions or beliefs about future events may, and often do, vary from actual results and the differences can be material. See “Cautionary Statement Regarding Forward-Looking Statements.” Also, see the risk factors and other cautionary statements described under the heading “Item 1A – Risk Factors” included in Item 1A of this Annual Report on Form 10-K. We do not undertake any obligation to publicly update any forward-looking statements except as otherwise required by applicable law.
This discussion and analysis of our financial condition and results of operation includes the following sections:
| • | Overview |
| • | Critical Accounting Policies – a discussion of accounting policies that require critical estimates and assumptions; |
| • | Results of Operations – an analysis of our operating results, including disclosures about the sustainability of our earnings; |
| • | Financial Condition – an analysis of our financial position; |
| • | Liquidity and Capital Resources – an analysis of our cash flows and capital position; and |
| • | Non-GAAP Financial Measures – reconciliation of non-GAAP measures. |
Overview
We are a bank holding company headquartered in Wichita, Kansas. Our wholly-owned banking subsidiary, Equity Bank, provides a broad range of financial services primarily to businesses and business owners as well as individuals through our network of 29 full service branches located in Kansas and Missouri. As of December 31, 2015, we had, on a consolidated basis, total assets of $1.59 billion, total deposits of $1.22 billion, total loans held for investment of $954.8 million (net of allowances) and total stockholders’ equity of $167.2 million. Net income for the year ended December 31, 2015 was $10.3 million compared to $9.0 million for the prior year ended December 31, 2014, an increase of $1.3 million, or 14.6%.
History and Background
Since 2003, we have completed a series of nine acquisitions and two charter consolidations. We have sought to integrate the banks we acquire into our existing operational platform and enhance stockholder value through the creation of efficiencies within the combined operations. In conjunction with our strategic acquisition growth, we strive to reposition and improve the loan portfolio and deposit mix of the banks we acquire. Following our acquisitions, we focus on identifying and disposing of problematic loans and replacing them with higher quality loans generated organically. In addition, we have focused on growth in our commercial loan portfolio, which we believe generally offers higher return opportunities than our consumer loan portfolio, primarily by hiring additional talented bankers, particularly in our metropolitan markets, and incentivizing our bankers to expand their commercial banking relationships. We also seek to increase our most attractive deposit accounts primarily by growing deposits in our community markets and cross-selling our depository products to our loan customers.
Our principal objective is to continue to increase stockholder value and generate consistent earnings growth by expanding our commercial banking franchise both organically and through strategic acquisitions. We believe our strategy of selectively acquiring and integrating community banks has provided us with economies of scale and improved our overall franchise efficiency. We expect to continue to pursue strategic acquisitions and believe
61
Table of Contents
our targeted market areas present us with many and varied acquisition opportunities. We are also focused on continuing to grow organically and believe the markets in which we operate currently provide meaningful opportunities to expand our commercial customer base and increase our current market share. We believe our geographic footprint, which is strategically split between growing metropolitan markets, such as Kansas City and Wichita, and stable community markets within Western Kansas, Western Missouri and Topeka, provides us with access to low cost, stable core deposits in community markets that we can use to fund commercial loan growth in our metropolitan markets. We strive to provide an enhanced banking experience for our customers by providing them with a comprehensive suite of sophisticated banking products and services tailored to meet their needs, while delivering the high-quality, relationship-based customer service of a community bank.
Highlights for the Year Ended December 31, 2015
| • | Net income allocable to common stockholders of $10.1 million for the year ended December 31, 2015, compared to $8.3 million for the previous year ended December 31, 2014, a 22.3% increase. |
| • | Earnings per diluted share of $1.54 for the year ended December 31, 2015, compared to $1.30 for the year ended December 31, 2014, an 18.5% increase. |
| • | Total loans held for investment of $960.4 million at December 31, 2015, an increase of $234.5 million as compared to December 31, 2014, a 32.3% increase. |
| • | Total deposits of $1.22 billion at December 31, 2015, an increase of $234.7 million as compared to December 31, 2014, a 23.9% increase. |
| • | Total assets of $1.59 billion at December 31, 2015, an increase of $411.2 million as compared to December 31, 2014, a 35.0% increase. |
| • | Book value per common share of $18.37 and tangible book value per common share of $15.97 at December 31, 2015. |
We completed the underwritten IPO of our common stock on November 16, 2015, where we sold an aggregate of 2,231,000 shares of our common stock at a price to the public of $22.50 per share. Our common stock began trading on the NASDAQ Global Select Market on November 11, 2015 under the ticker symbol “EQBK.”
We also completed our acquisition of First Independence Corporation (“First Independence”), and its wholly-owned subsidiary, First Federal Savings & Loan of Independence, Kansas on October 9, 2015. First Independence had consolidated total assets of $135.0 million, net loans of $89.9 million (net of allowances), and total deposits of $87.1 million.
Critical Accounting Policies
Our significant accounting policies are integral to understanding the results reported. Our accounting policies are described in the December 31, 2015 notes to consolidated financial statements “NOTE 1 – NATURE OF OPERATIONS AND SUMMARY OF SIGNIFICANT ACCOUNTING POLICIES”. We believe that of our significant accounting policies, the following may involve a higher degree of judgement and complexity.
Loans: Loans that management has the intent and ability to hold for the foreseeable future or until maturity or payoff are reported at the principal balance outstanding, net of previous charge-offs and an allowance for loan losses. Interest income is accrued on the unpaid principal balance.
Purchased Credit Impaired Loans: As a part of previous acquisitions, we acquired certain loans for which there was, at acquisition, evidence of deterioration of credit quality since origination. These purchased credit impaired loans were recorded at the amount paid, such that there is no carryover of the seller’s allowance for loan losses. After acquisition, losses are recognized by an increase in the allowance for loan losses. Such purchased
62
Table of Contents
credit impaired loans are accounted for individually. We estimate the amount and timing of expected cash flows for each loan, and the expected cash flows in excess of the amount paid are recorded as interest income over the remaining life of the loan (accretable yield). The excess of the loan’s contractual principal and interest over expected cash flows is not recorded (non-accretable difference). Over the life of the loan, expected cash flows continue to be estimated. If the present value of the expected cash flows is less than the carrying amount, a loss is recorded. If the present value of the expected cash flows is greater than the carrying amount, it is recognized as part of future interest income.
Nonaccrual Loans: Generally, loans are designated as nonaccrual when either principal or interest payments are 90 days or more past due based on contractual terms unless the loan is well secured and in the process of collection. Consumer loans are typically charged off no later than 180 days past due. In all cases, loans are placed on nonaccrual or charged off at an earlier date if collection of principal or interest is considered doubtful. When a loan is placed on nonaccrual status, unpaid interest credited to income is reversed against income. Future interest income may be recorded on a cash basis after recovery of principal is reasonably assured. Nonaccrual loans are returned to accrual status when all the principal and interest amounts contractually due are brought current and future payments are reasonably assured.
Impaired Loans: A loan is considered impaired when, based on current information and events, it is probable that we will be unable to collect all contractual principal and interest due according to the terms of the loan agreement. All loans are individually evaluated for impairment. Impaired loans are measured based on the present value of expected future cash flows discounted at the loan’s effective interest rate or on the value of the underlying collateral if the loan is collateral dependent. We evaluate the collectability of both principal and interest when assessing the need for a loss accrual.
Factors considered by management in determining impairment include payment status, collateral value, and the probability of collecting scheduled principal and interest payments when due. Loans that experience insignificant payment delays and payment shortfalls generally are not classified as impaired. Management determines the significance of payment delays and payment shortfalls on a case-by-case basis, taking into consideration all of the circumstances surrounding the loan and the borrower, including the length of the delay, the reasons for the delay, the borrower’s prior payment record, and the amount of the shortfall in relation to the principal and interest owed.
Troubled Debt Restructurings: In cases where a borrower experiences financial difficulties and we make certain concessionary modifications to contractual terms, the loan is classified as a troubled debt restructured loan and classified as impaired. Generally, a nonaccrual loan that is a troubled debt restructuring remains on nonaccrual until such time that repayment of the remaining principal and interest is not in doubt, and the borrower has a period of satisfactory repayment performance.
Allowance for Loan Losses: The allowance for loan losses is a valuation allowance for probable incurred credit losses. Loan losses are charged against the allowance when management believes the collectability of a loan balance is unlikely. Subsequent recoveries, if any, are credited to the allowance. Management estimates the allowance balance required using past loan loss experience, the nature and volume of the portfolio, information about specific borrower situations and estimated collateral values, economic conditions, and other factors. A loan review process, independent of the loan approval process, is utilized by management to verify loans are being made and administered in accordance with Company policy, to review loan risk grades and potential losses, to verify that potential problem loans are receiving adequate and timely corrective measures to avoid or reduce losses, and to assist in the verification of the adequacy of the loan loss reserve. Allocations of the allowance may be made for specific loans, but the entire allowance is available for any loan that, in management’s judgment, should be charged off.
63
Table of Contents
The allowance consists of specific and general components. The specific component relates to loans that are individually classified as impaired. If a loan is impaired, a portion of the allowance is allocated so that the loan is reported net at the present value of estimated future cash flows using the loan’s existing rate or at the fair value of collateral if repayment is expected solely from the sale of the collateral. Troubled debt restructurings are separately identified for impairment disclosures and are measured at the present value of estimated future cash flows using the loan’s effective rate at inception. If a troubled debt restructuring is considered to be a collateral dependent loan, the loan is reported, net, at the fair value of the collateral. For troubled debt restructurings that subsequently default, we determine the amount of reserve in accordance with the accounting policy for the allowance for loan losses.
The general component of the allowance for loan losses covers non-impaired loans and is based on historical loss experience adjusted for current factors. The historical loss experience is determined by portfolio and class and is based on the actual loss history experienced by us. This actual loss experience is then adjusted by comparing current conditions to the conditions that existed during the loss history. We consider the changes related to (i) lending policies, (ii) economic conditions, (iii) nature and volume of the loan portfolio and class, (iv) lending staff, (v) volume and severity of past due, non-accrual, and risk graded loans, (vi) loan review system, (vii) value of underlying collateral for collateral dependent loans, (viii) concentration levels and (ix) effects of other external factors.
Goodwill: Goodwill results from business acquisitions and represents the excess of the purchase price over the fair value of acquired tangible assets and liabilities and identifiable intangible assets.
Core deposit intangibles: Core deposit intangibles are acquired customer relationships arising from whole bank and branch acquisitions. Core deposit intangibles are initially measured at fair value and then are amortized over their estimated useful lives using an accelerated method. The useful lives of the core deposits are estimated to generally be between seven and ten years.
Goodwill and core deposit intangibles are assessed at least annually for impairment and any such impairment is recognized and expensed in the period identified. We have selected December 31, as the date to perform our annual goodwill impairment test. Goodwill is the only intangible asset with an indefinite useful life.
Emerging Growth Company: Pursuant to the JOBS Act, an emerging growth company is provided the option to adopt new or revised accounting standards that may be issued by the Financial Accounting Standards Board (“FASB”) or the SEC either (i) within the same periods as those otherwise applicable to non-emerging growth companies or (ii) within the same time periods as private companies. We have irrevocably elected to adopt new accounting standards within the public company adoption period.
We may take advantage of some of the reduced regulatory and reporting requirements that are available to us so long as the Company qualifies as an emerging growth company, including, but not limited to, not being required to comply with the auditor attestation requirements of Section 404(b) of the Sarbanes-Oxley Act, reduced disclosure obligations regarding executive compensation, and exemptions from the requirements of holding non-binding advisory votes on executive compensation and golden parachute payments.
Results of Operations
We generate most of our revenue from interest income and fees on loans, interest and dividends on investment securities and non-interest income, such as service charges and fees, debit card income and mortgage banking income. We incur interest expense on deposits and other borrowed funds and non-interest expense, such as salaries and employee benefits and occupancy expenses.
Changes in interest rates earned on interest-earning assets or incurred on interest-bearing liabilities, as well as the volume and types of interest-earning assets, interest-bearing and non-interest-bearing liabilities and
64
Table of Contents
stockholders’ equity, are usually the largest drivers of periodic change in net interest income. Fluctuations in interest rates are driven by many factors, including governmental monetary policies, inflation, deflation, macroeconomic developments, changes in unemployment, the money supply, political and international conditions and conditions in domestic and foreign financial markets. Periodic changes in the volume and types of loans in our loan portfolio are affected by, among other factors, economic and competitive conditions in Kansas and Missouri, as well as developments affecting the consumer, commercial and real estate sectors within these markets.
Net Income
Year ended December 31, 2015 compared with year ended December 31, 2014:
Net income for the year ended December 31, 2015 was $10.3 million compared to $9.0 million for year ended December 31, 2014. Net income allocable to common stockholders was $10.1 million for the year ended December 31, 2015, compared to $8.3 million for the year ended December 31, 2014, an increase of $1.8 million, or 22.3%. In July 2014, we redeemed $15.5 million of preferred stock which reduced dividends on preferred stock by $531 thousand in 2015 as compared to 2014. This redemption replaced preferred stock that had a 9.0% dividend rate with a bank stock loan carrying a 4.0% interest rate. During the year ended December 31, 2015, increases in net interest income of $4.9 million and non-interest income of $1.1 million were partially offset by $2.9 million in higher non-interest expenses and an increase of $1.8 million in the provision for loan loss when compared to the year ended December 31, 2014. The changes in the components of net income are discussed in more detail in the following sections of “Results of Operations.”
Year ended December 31, 2014 compared with year ended December 31, 2013:
Net Income for the year ended December 31, 2014 was $9.0 million compared to $7.9 million for the year ended December 31, 2013, an increase of $1.1 million. Net income allocable to common stockholders was $8.3 million and $6.9 million for the years ended December 31, 2014 and 2013. Dividends and discount accretion on preferred stock were $270 thousand less for the year ended December 31, 2014 as compared to the year of 2013. The benefit to 2014 net income allocable to common stockholders of the July 2014 redemption of $15.5 million in preferred stock was partially offset by the May 2014 increase, from 5% to 9%, in the dividend rate on $14.8 million of preferred stock prior to its redemption. During 2014, increases in net interest income of $126 thousand and non-interest income of $782 thousand were offset by $1.2 million in higher non-interest expenses and the provision for income taxes as compared to the year ended December 31, 2013. The provision for loan losses for the year ended December 31, 2014 was $1.2 million compared with $2.6 million for the prior year. The decrease in the provision for loan losses was, in the opinion of management, the result of improvement in the credit quality of the loan portfolio. The changes in the components of net income are discussed in more detail in the following sections of “Results of Operations.”
Net Interest Income and Net Interest Margin Analysis
Net interest income is the difference between interest income on interest-earning assets, including loans and securities, and interest expense incurred on interest-bearing liabilities, including deposits and other borrowed funds. To evaluate net interest income, management measures and monitors (1) yields on loans and other interest-earning assets, (2) the costs of deposits and other funding sources, (3) the net interest spread and (4) net interest margin. Net interest spread is the difference between rates earned on interest-earning assets and rates paid on interest-bearing liabilities. Net interest margin is calculated as net interest income divided by average interest-earning assets. Because non-interest-bearing sources of funds, such as non-interest-bearing deposits and stockholders’ equity also fund interest-earning assets, net interest margin includes the benefit of these non-interest-bearing sources of funds. Net interest income is affected by changes in the amount and mix of interest-earning assets and interest-bearing liabilities, referred to as a “volume change,” and it is also affected by changes in yields earned on interest-earning assets and rates paid on interest-bearing deposits and other borrowed funds, referred to as a “yield/rate change.”
65
Table of Contents
The following table shows the average balance of each principal category of assets, liabilities, and stockholders’ equity and the average yields on interest-earning assets and average rates on interest-bearing liabilities for the years ended December 31, 2015, 2014 and 2013. The yields and rates are calculated by dividing income or expense by the average daily balances of the associated assets or liabilities.
Average Balance Sheets and Net Interest Analysis
| December 31, 2015 | December 31, 2014 | December 31, 2013 | ||||||||||||||||||||||||||||||||||
| (dollars in thousands) |
Average Outstanding Balance |
Interest Income/ Expense |
Average Yield/ Rate(3)(4) |
Average Outstanding Balance |
Interest Income/ Expense |
Average Yield/ Rate(3)(4) |
Average Outstanding Balance |
Interest Income/ Expense |
Average Yield/ Rate(3)(4) |
|||||||||||||||||||||||||||
| Interest-earning assets: |
||||||||||||||||||||||||||||||||||||
| Loans(1) |
$ | 816,127 | $ | 43,361 | 5.31 | % | $ | 682,717 | $ | 38,406 | 5.63 | % | $ | 699,853 | $ | 39,396 | 5.63 | % | ||||||||||||||||||
| Taxable securities |
336,905 | 7,634 | 2.27 | % | 310,936 | 7,204 | 2.32 | % | 297,247 | 6,294 | 2.12 | % | ||||||||||||||||||||||||
| Nontaxable securities |
43,769 | 1,057 | 2.41 | % | 36,900 | 839 | 2.27 | % | 36,981 | 828 | 2.24 | % | ||||||||||||||||||||||||
| Federal funds sold and other |
71,224 | 976 | 1.37 | % | 23,770 | 345 | 1.45 | % | 31,983 | 327 | 1.02 | % | ||||||||||||||||||||||||
|
|
|
|
|
|
|
|
|
|
|
|
|
|||||||||||||||||||||||||
| Total interest-earning assets |
1,268,025 | $ | 53,028 | 4.18 | % | 1,054,323 | $ | 46,794 | 4.44 | % | 1,066,064 | $ | 46,845 | 4.39 | % | |||||||||||||||||||||
|
|
|
|
|
|
|
|||||||||||||||||||||||||||||||
| Non-interest-earning assets |
||||||||||||||||||||||||||||||||||||
| Other real estate owned, net |
5,742 | 6,054 | 9,971 | |||||||||||||||||||||||||||||||||
| Premises and equipment, net |
36,983 | 35,400 | 34,980 | |||||||||||||||||||||||||||||||||
| Bank owned life insurance |
29,816 | 28,225 | 26,366 | |||||||||||||||||||||||||||||||||
| Goodwill and core deposit intangible, net |
19,505 | 19,423 | 18,816 | |||||||||||||||||||||||||||||||||
| Other non-interest-earning assets |
14,139 | 15,352 | 18,352 | |||||||||||||||||||||||||||||||||
|
|
|
|
|
|
|
|||||||||||||||||||||||||||||||
| Total assets |
$ | 1,374,210 | $ | 1,158,777 | $ | 1,174,549 | ||||||||||||||||||||||||||||||
|
|
|
|
|
|
|
|||||||||||||||||||||||||||||||
| Interest-bearing liabilities: |
||||||||||||||||||||||||||||||||||||
| Interest-bearing demand deposits |
$ | 259,007 | $ | 655 | 0.25 | % | $ | 224,009 | $ | 556 | 0.25 | % | $ | 209,696 | $ | 585 | 0.28 | % | ||||||||||||||||||
| Savings and money market |
261,195 | 896 | 0.34 | % | 241,291 | 640 | 0.27 | % | 235,388 | 615 | 0.26 | % | ||||||||||||||||||||||||
|
|
|
|
|
|
|
|
|
|
|
|
|
|||||||||||||||||||||||||
| Savings, NOW and money market |
520,202 | 1,551 | 0.30 | % | 465,300 | 1,196 | 0.26 | % | 445,084 | 1,200 | 0.27 | % | ||||||||||||||||||||||||
| Certificates of deposit |
374,846 | 3,375 | 0.90 | % | 366,168 | 2,888 | 0.79 | % | 386,459 | 3,182 | 0.82 | % | ||||||||||||||||||||||||
|
|
|
|
|
|
|
|
|
|
|
|
|
|||||||||||||||||||||||||
| Total interest-bearing deposits |
895,048 | 4,926 | 0.55 | % | 831,468 | 4,084 | 0.49 | % | 831,543 | 4,382 | 0.53 | % | ||||||||||||||||||||||||
| FHLB term and line of credit advances |
157,810 | 495 | 0.31 | % | 23,328 | 345 | 1.48 | % | 29,710 | 494 | 1.66 | % | ||||||||||||||||||||||||
| Bank stock loan |
15,581 | 641 | 4.11 | % | 7,097 | 295 | 4.16 | % | — | — | — | % | ||||||||||||||||||||||||
| Subordinated borrowings |
9,102 | 643 | 7.06 | % | 8,793 | 634 | 7.22 | % | 8,484 | 642 | 7.56 | % | ||||||||||||||||||||||||
| Other borrowings |
24,853 | 61 | 0.24 | % | 28,516 | 75 | 0.26 | % | 31,608 | 92 | 0.29 | % | ||||||||||||||||||||||||
|
|
|
|
|
|
|
|
|
|
|
|
|
|||||||||||||||||||||||||
| Total interest-bearing liabilities |
1,102,394 | $ | 6,766 | 0.61 | % | 899,202 | $ | 5,433 | 0.60 | % | 901,345 | $ | 5,610 | 0.62 | % | |||||||||||||||||||||
|
|
|
|
|
|
|
|||||||||||||||||||||||||||||||
| Non-interest-bearing liabilities and stockholders’ equity |
||||||||||||||||||||||||||||||||||||
| Non-interest-bearing checking accounts |
138,933 | 129,007 | 127,741 | |||||||||||||||||||||||||||||||||
| Non-interest-bearing liabilities |
7,075 | 7,387 | 7,527 | |||||||||||||||||||||||||||||||||
| Stockholders’ equity |
125,808 | 123,181 | 137,936 | |||||||||||||||||||||||||||||||||
|
|
|
|
|
|
|
|||||||||||||||||||||||||||||||
| Total liabilities and stockholders’ equity |
$ | 1,374,210 | $ | 1,158,777 | $ | 1,174,549 | ||||||||||||||||||||||||||||||
|
|
|
|
|
|
|
|||||||||||||||||||||||||||||||
| Net interest income |
$ | 46,262 | $ | 41,361 | $ | 41,235 | ||||||||||||||||||||||||||||||
|
|
|
|
|
|
|
|||||||||||||||||||||||||||||||
| Interest rate spread |
3.57 | % | 3.84 | % | 3.77 | % | ||||||||||||||||||||||||||||||
|
|
|
|
|
|
|
|||||||||||||||||||||||||||||||
| Net interest margin(2) |
3.65 | % | 3.92 | % | 3.87 | % | ||||||||||||||||||||||||||||||
|
|
|
|
|
|
|
|||||||||||||||||||||||||||||||
| Total cost of deposits, including non-interest bearing deposits |
$ | 1,033,981 | $ | 4,926 | 0.48 | % | $ | 960,475 | $ | 4,084 | 0.43 | % | $ | 959,284 | $ | 4,382 | 0.46 | % | ||||||||||||||||||
|
|
|
|
|
|
|
|
|
|
|
|
|
|
|
|
|
|
|
|||||||||||||||||||
| Average interest-earning assets to interest-bearing liabilities |
115.02 | % | 117.25 | % | 118.27 | % | ||||||||||||||||||||||||||||||
|
|
|
|
|
|
|
|||||||||||||||||||||||||||||||
66
Table of Contents
| (1) | Average loan balances include nonaccrual loans. |
| (2) | Net interest margin is calculated by dividing net interest income by average interest-earning assets for the period. |
| (3) | Tax exempt income is not included in the above table on a tax equivalent basis. |
| (4) | Actual unrounded values are used to calculate the reported yield or rate disclosed. Accordingly, recalculations using the amounts in thousands as disclosed in this report may not produce the same amounts. |
Increases and decreases in interest income and interest expense result from changes in average balances (volume) of interest-earning assets and interest-bearing liabilities, as well as changes in average interest yields/rates. The following table analyzes the change in volume variances and yield/rate variances for the year ended December 31, 2015 as compared to the year ended December 31, 2014, and the year ended December 31, 2014 as compared to the year ended December 31, 2013.
Analysis of Changes in Net Interest Income
| 2015 vs. 2014 | 2014 vs. 2013 | |||||||||||||||||||||||
| Increase (Decrease) Due to: | Increase (Decrease) Due to: | |||||||||||||||||||||||
| (dollars in thousands) |
Volume(1) | Yield/Rate(1) | Total | Volume(1) | Yield/Rate(1) | Total | ||||||||||||||||||
| Interest-earning assets: |
||||||||||||||||||||||||
| Loans |
$ | 7,180 | $ | (2,225 | ) | $ | 4,955 | $ | (964 | ) | $ | (26 | ) | $ | (990 | ) | ||||||||
| Taxable securities |
591 | (161 | ) | 430 | 299 | 611 | 910 | |||||||||||||||||
| Nontaxable securities |
163 | 55 | 218 | (2 | ) | 13 | 11 | |||||||||||||||||
| Federal funds sold and other |
651 | (20 | ) | 631 | (97 | ) | 115 | 18 | ||||||||||||||||
|
|
|
|
|
|
|
|
|
|
|
|
|
|||||||||||||
| Total interest-earning assets |
$ | 8,585 | $ | (2,351 | ) | $ | 6,234 | $ | (764 | ) | $ | 713 | $ | (51 | ) | |||||||||
|
|
|
|
|
|
|
|
|
|
|
|
|
|||||||||||||
| Interest-bearing liabilities: |
||||||||||||||||||||||||
| Savings, NOW and money market |
$ | 151 | $ | 204 | $ | 355 | $ | 53 | $ | (57 | ) | $ | (4 | ) | ||||||||||
| Certificates of deposit |
70 | 417 | 487 | (163 | ) | (131 | ) | (294 | ) | |||||||||||||||
|
|
|
|
|
|
|
|
|
|
|
|
|
|||||||||||||
| Total interest-bearing deposits |
221 | 621 | 842 | (110 | ) | (188 | ) | (298 | ) | |||||||||||||||
| FHLB term and line of credit advances |
610 | (460 | ) | 150 | (98 | ) | (51 | ) | (149 | ) | ||||||||||||||
| Bank stock loan |
349 | (3 | ) | 346 | 295 | — | 295 | |||||||||||||||||
| Subordinated borrowings |
22 | (13 | ) | 9 | 22 | (30 | ) | (8 | ) | |||||||||||||||
| Other borrowings |
(9 | ) | (5 | ) | (14 | ) | (8 | ) | (9 | ) | (17 | ) | ||||||||||||
|
|
|
|
|
|
|
|
|
|
|
|
|
|||||||||||||
| Total interest-bearing liabilities |
$ | 1,193 | $ | 140 | $ | 1,333 | $ | 101 | $ | (278 | ) | $ | (177 | ) | ||||||||||
|
|
|
|
|
|
|
|
|
|
|
|
|
|||||||||||||
| Net Interest Income |
$ | 7,392 | $ | (2,491 | ) | $ | 4,901 | $ | (865 | ) | $ | 991 | $ | 126 | ||||||||||
|
|
|
|
|
|
|
|
|
|
|
|
|
|||||||||||||
| (1) | The effect of changes in volume is determined by multiplying the change in volume by the previous year’s average rate. Similarly, the effect of rate changes is calculated by multiplying the change in average rate by the prior year’s volume. The changes attributable to both volume and rate, which cannot be segregated, have been allocated to the volume variance and the rate variance in proportion to the relationship of the absolute dollar amount of the change in each. |
Year ended December 31, 2015 compared with year ended December 31, 2014:
Net interest income before the provision for loan losses for the year ended December 31, 2015 was $46.3 million compared with $41.4 million for the year ended December 31, 2014, an increase of $4.9 million, or 11.8%. The increase in net interest income is primarily due the increase in the volume of interest-earnings assets partially offset by a decrease in yields on interest-earning assets. The increase in average volume of interest-earning assets was primarily due to increases in loans, investment securities and Federal funds sold and other. Interest expense for the year ended December 31, 2015 was $6.8 million, an increase of $1.3 million, or 24.5%, from the interest expense of $5.4 million for the year ended December 31, 2014. The increase in interest expense was primarily due to an increase in the average volume of interest bearing liabilities incurred to fund the increased volume of interest-earning assets.
67
Table of Contents
Interest income was $53.0 million for the year ended December 31, 2015 and $46.8 million for the year ended December 31, 2014, an increase of $6.2 million, or 13.3%. Interest income on loans, including loan fees which consist of fees for loan origination, renewal, prepayment, covenant breakage and loan modification, was $43.4 million for the year ended December 31, 2015, an increase of $5.0 million, or 12.9%, compared to the year ended December 31, 2014. The increase in loan interest income was driven by the increase in average loan volume; however, the yield on the loan portfolio decreased 32 basis points from 5.63% for the year ended December 31, 2014 to 5.31% for the year ended December 31, 2015. One of the factors that lessened the decrease in loan yields was the increase in loan fees included in interest income. Loan fees for the year ended December 31, 2015 were $3.4 million compared to $2.4 million for the year ended December 31, 2014. The increase in loan fees was primarily due to increases in fees on mortgage loans due to increased mortgage origination and agricultural loans which were primarily prepayment and covenant breakage fees associated with a single relationship. The primary driver of the decrease in loan yields is the origination or purchase of commercial, commercial real estate and mortgage loans in a continually low interest rate environment.
Interest expense was $6.8 million for the year ended December 31, 2015, an increase of $1.3 million from the $5.4 million for the year ended December 31, 2014. Interest expense on savings, NOW and money market deposits was $1.6 million for the year ended December 31, 2015, an increase of $355 thousand from $1.2 million for the year ended December 31, 2014. Average certificates of deposit increased $8.7 million for the year ended December 31, 2015 compared to the year ended December 31, 2014 and the average rate increased from 0.79% to 0.90% for the same time period resulting in an increase in related interest expense of $487 thousand. Average balances of borrowings from the FHLB increased by $134.5 million from an average balance of $23.3 million for the year ended December 31, 2014 to an average balance of $157.8 million for the year ended December 31, 2015, resulting in an increase in interest expense of $150 thousand. In February 2015, we prepaid older higher cost FHLB term advances and began using the FHLB line of credit or LOC advance option, which is pre-payable without a fee and resulted in a much lower funding cost. Interest expense on our bank stock loan for the year ended December 31, 2015 was $641 thousand compared to $295 thousand for the year ended December 31, 2014. In July 2014, we borrowed $15.5 million secured by our stock in Equity Bank. The purpose of this bank stock loan was to redeem a like amount of preferred stock, which carried a 9.0% after-tax dividend rate. Total cost of interest-bearing liabilities increased one basis point to 0.61% for the year ended December 31, 2015 from 0.60% for the year ended December 31, 2014.
Net interest margin, for the year ended December 31, 2015 was 3.65%, a decrease of 27 basis points compared with 3.92% for the year ended December 31, 2014. The decrease in net interest margin is largely the result of changes in mix and yield of interest-earning assets and cost of interest-bearing liabilities. The decline in our net interest margin for the year ended December 31, 2015 relates to our purchase of additional investment securities, our utilization of an available “spread opportunity” and the increase in our 1-4 family loan portfolio, which contributed to a decline in yield on our loan portfolio. In anticipation of consummating the acquisition of First Independence, we purchased approximately $30.0 million in investment securities to replace First Independence’s investment portfolio of similar size that did not meet our investment criteria. We have since liquidated First Independence’s investment portfolio. The “spread opportunity” involves borrowing overnight on our line of credit with the FHLB and investing the proceeds in FHLB stock, federal funds sold and other overnight assets, such as money market accounts in other financial institutions, resulting in a positive spread of approximately 25 basis points. We utilized the spread opportunity to generate income to help offset the costs associated with the First Independence merger and our initial public offering. We can reduce or terminate the spread opportunity each business day and we do not presently anticipate that this opportunity would be part of our core earnings stream or strategy. These changes for the year ended December 31, 2015 resulted in an increase in net interest income of $4.9 million, an increase in average interest-earning assets of $213.7 million and a decrease in net interest margin of 27 basis points.
Year ended December 31, 2014 compared with year ended December 31, 2013:
Net interest income before the provision for loan losses for the year ended December 31, 2014 was $41.4 million compared with $41.2 million for the prior year, an increase of $126 thousand, or 0.3%. The increase in net interest income is primarily due to a $177 thousand decrease in interest expense. The decrease in interest
68
Table of Contents
expense is due to lower average balances and rates paid on certificates of deposit and lower average balances and rates paid on FHLB term and LOC advances, partially offset by interest expense incurred in the last six months of 2014 on the $15.5 million bank stock loan. The $51 thousand decrease in interest income is due to decreased average balances and yields on the loan portfolio, partially offset by increases in average balances and yield on the investment portfolio. The decrease in the average loan volume is associated with our efforts to improve the loan portfolio’s credit quality following the merger with First Community.
Interest income was $46.8 million in each of 2014 and 2013. Interest income on loans, including loan fees which consist of fees for loan origination, renewal, prepayment, covenant breakage and loan modification, was $38.4 million for 2014, a decrease of $990 thousand, or 2.5%, compared with 2013. The decrease in loan interest income was driven by the decrease in average loan volume; however, the yield on the loan portfolio remained unchanged at 5.63%. One of the factors that caused the yield on loans to remain unchanged was the increase in loan fees included in interest income. Loan fees for the year ended December 31, 2014 were $2.4 million compared to $1.9 million for the year ended December 31, 2013. The increase in loan fees was primarily due to increases in fees on mortgage loans and agricultural loans. Interest income on securities was $8.0 million during 2014, an increase of $921 thousand over 2013 due to an 18 basis point increase in the average yield on the total securities portfolio and an increase in the average total securities portfolio of $13.6 million. The increases in the average yield and average volume of investment securities were primarily due to additional average volume of mortgage-backed securities of $8.0 million with an average yield of 2.20% for the year ended December 31, 2014 compared to the average yield of 2.00% for the year ended December 31, 2013. We purchased additional mortgage-backed securities because this investment option provided us with a competitive yield.
Interest expense was $5.4 million for 2014, a decrease of $177 thousand from the $5.6 million expensed in 2013. Interest expense on savings, NOW and money market deposits was $1.2 million for both 2014 and 2013. Average certificates of deposit decreased $20.3 million for 2014 compared to 2013 and the average rate decreased from 0.82% to 0.79% for the same time period resulting in a decrease in related interest expense of $294 thousand. Average balances of borrowings from the FHLB decreased by $6.4 million, or 21.5%, from an average balance of $29.7 million in 2013 to an average balance of $23.3 million in 2014, resulting in a decrease in interest expense of $149 thousand. In July 2014, we borrowed $15.5 million secured by our stock in Equity Bank. The purpose of this bank stock loan was to redeem a like amount of preferred stock, which carried a 9.0% after-tax dividend rate. Interest expense on the bank stock loan for the year of 2014 was $295 thousand. Total cost of interest-bearing liabilities decreased two basis points to 0.60% for the year ended December 31, 2014 from 0.62% for the year ended December 31, 2013.
Net interest margin, for 2014 was 3.92%, an increase of five basis points compared with 3.87% for 2013. The increase in net interest margin is largely the result of changes in mix and yield of interest-earning assets and cost of interest-bearing liabilities. As discussed in more detail above, net interest margin was positively impacted by the increase in loan fee income that is reflected in interest income, decreases in the rate paid on deposits and FHLB advances, and was negatively impacted by the decrease in the average loan volume for the twelve months ended December 31, 2014. These changes for the year ended December 31, 2014 resulted in an increase in net interest income of $126 thousand, a decrease in average interest-earning assets of $11.7 million and an increase in net interest margin.
Provision for Loan Losses
We maintain an allowance for loan losses for probable incurred credit losses. The allowance for loan losses is increased by a provision for loan losses, which is a charge to earnings, and subsequent recoveries of amounts previously charged-off, but is decreased by charge-offs when the collectability of a loan balance is unlikely. Management estimates the allowance balance required using past loan loss experience, the nature and volume of the loan portfolio, information about specific borrower situations and estimated collateral values, discounted cash flows, economic conditions, and other factors including regulatory guidance. As these factors change, the amount of the loan loss provision changes.
69
Table of Contents
Year ended December 31, 2015 compared with year ended December 31, 2014:
The provision for loan losses for the year ended December 31, 2015 was $3.0 million compared with $1.2 million for the year ended December 31, 2014. The increased provision of $1.8 million was primarily related to increased charge-offs on loans, which were partially offset by changes in the composition of the loan portfolio and the reduction in the allowance for loan losses allocated to loans individually evaluated for impairment. Net charge-offs for the year ended December 31, 2015 were $3.5 million compared to net charge-offs of $851 thousand for the year ended December 31, 2014. For the year ended December 31, 2015, gross charge-offs were $3.7 million offset by gross recoveries of $237 thousand. In comparison, gross charge-offs were $1.3 million for the year ended December 31, 2014 offset by gross recoveries of $483 thousand.
Year ended December 31, 2014 compared with year ended December 31, 2013:
The provision for loan losses for the year ended December 31, 2014 was $1.2 million compared with $2.6 million for the year ended December 31, 2013. The decrease in the provision for loan losses was due to management’s assessment as to the improved credit quality of the loan portfolio. Net charge-offs for the years ended December 31, 2014 and 2013 were $851 thousand and $1.4 million. The decrease of $589 thousand reflected decreases in both gross charge-offs and gross recoveries when comparing the years of 2014 and 2013. Loans charged-off in 2014 totaled $1.3 million offset by $483 thousand of recoveries, compared to $2.0 million of gross charge-offs and $545 thousand of recoveries in 2013.
Non-Interest Income
The primary sources of non-interest income are service charges and fees, debit card income, mortgage banking income, increases in the value of bank owned life insurance, investment referral income, the recovery of zero-basis purchased loans, and net gains on the sale of available-for-sale securities and other securities transactions. Non-interest income does not include loan origination or other loan fees which are recognized as an adjustment to yield using the interest method.
The following table provides a comparison of the major components of non-interest income for the years ended December 31, 2015, 2014 and 2013:
Non-Interest Income
For the Years Ended December 31,
| 2015 vs. 2014 | 2014 vs. 2013 | |||||||||||||||||||||||||||
| (Dollars in thousands) |
2015 | 2014 | 2013 | Change | % | Change | % | |||||||||||||||||||||
| Service charges and fees |
$ | 2,708 | $ | 2,737 | $ | 3,063 | $ | (29 | ) | (1.1 | )% | $ | (326 | ) | (10.6 | )% | ||||||||||||
| Debit card income |
2,161 | 1,462 | 1,336 | 699 | 47.8 | % | 126 | 9.4 | % | |||||||||||||||||||
| Mortgage banking |
1,088 | 894 | 701 | 194 | 21.7 | % | 193 | 27.5 | % | |||||||||||||||||||
| Increase in value of bank owned life insurance |
957 | 960 | 953 | (3 | ) | (0.3 | )% | 7 | 0.7 | % | ||||||||||||||||||
| Investment referral income |
571 | 475 | 472 | 96 | 20.2 | % | 3 | 0.6 | % | |||||||||||||||||||
| Recovery on zero-basis purchased loans |
393 | 500 | 382 | (107 | ) | (21.4 | )% | 118 | 30.9 | % | ||||||||||||||||||
| Other |
486 | 660 | 485 | (174 | ) | (26.4 | )% | 175 | 36.1 | % | ||||||||||||||||||
|
|
|
|
|
|
|
|
|
|
|
|
|
|
|
|||||||||||||||
| Sub-Total |
8,364 | 7,688 | 7,392 | 676 | 8.8 | % | 296 | 4.0 | % | |||||||||||||||||||
| Net gain on acquisition |
682 | — | — | 682 | 100.0 | % | — | — | % | |||||||||||||||||||
| Net gains on sales of and settlement of securities |
756 | 986 | 500 | (230 | ) | (23.3 | )% | 486 | 97.2 | % | ||||||||||||||||||
|
|
|
|
|
|
|
|
|
|
|
|
|
|
|
|||||||||||||||
| Total non-interest income |
$ | 9,802 | $ | 8,674 | $ | 7,892 | $ | 1,128 | 13.0 | % | $ | 782 | 9.9 | % | ||||||||||||||
|
|
|
|
|
|
|
|
|
|
|
|
|
|
|
|||||||||||||||
70
Table of Contents
Year ended December 31, 2015 compared with year ended December 31, 2014:
For the year ended December 31, 2015, non-interest income totaled $9.8 million, an increase of $1.1 million, or 13.0%, from $8.7 million for the year ended December 31, 2014. The increase was primarily due to increases in debit card income, the net gain on acquisition and mortgage banking income, partially offset by decreases in net gains on securities’ transactions, other non-interest income and recovery of zero-basis purchased loans. In our experience, favorable customer economic conditions are inversely related to non-sufficient fund charges, the largest component of service charges and fees, and are directly associated with debit card income. As economic conditions improve, increased debit card transaction volume associated with favorable economic conditions result in increased debit card income while non-sufficient fund charges generally decrease because customers typically have more disposable income. Our mortgage banking fees increased due to greater mortgage loan sales during the year ended December 31, 2015 as compared to the year ended December 31, 2014. The recognized amounts of the identifiable net assets acquired, including deferred tax assets associated with NOL and tax credit carryforwards, exceeded the cash consideration exchanged in the First Independence acquisition resulting in the net gain on acquisition. Included in 2015 net gains on sales of and settlement of securities is $386 thousand received in connection with the bankruptcy settlement related to a political subdivision security written off in 2011. Net gains from the sales of available-for-sale securities were $370 thousand for the year ended December 31, 2015 as compared to $986 thousand for the year ended December 31, 2014. In connection with acquisitions, we received the rights to certain loans that were previously charged off by the acquired bank. At acquisition, there was no expectation of future cash flows from these previously charged-off loans and thus they were assigned a zero basis. Subsequent to the acquisitions, we have received cash payments on several of these loans. No interest has been accrued as cash flow payments have not been expected prior to receipt. Cash receipts on these zero-basis loans totaled $393 thousand and $500 thousand for the years ended December 31, 2015 and 2014.
Year ended December 31, 2014 compared with year ended December 31, 2013:
For the year ended December 31, 2014, non-interest income totaled $8.7 million, an increase of $782 thousand, or 9.9%, from $7.9 million in 2013. The increase was primarily due to increases in net gains on the sale of available-for-sale securities, mortgage banking income, other non-interest income, debit card income and recovery of zero-basis purchased loans, partially offset by a decrease in service charges and fees. Service charges and fees are primarily impacted by non-sufficient fund charges, which are cyclical in nature, generally fluctuate with the change in volume of transactional deposit accounts and economic conditions impacting our customers and represent a significant portion of the decrease in our service charges and fees. Service charges and fees declined $326 thousand from $3.1 million for the year ended December 31, 2013 to $2.7 million for the comparable period of 2014, and debit card income and mortgage banking increased $126 thousand and $193 thousand for the same period. In our experience, as economic conditions improve, increased debit card transaction volume associated with favorable economic conditions result in increased debit card income while non-sufficient fund charges generally decrease because customers typically have more disposable income. Our mortgage banking fees increased due to greater mortgage loan originations during 2014 as compared to 2013. Cash receipts on zero-basis acquired loans totaled $500 thousand and $382 thousand for the years ended December 31, 2014 and 2013. Net gains from the sales of available-for-sale securities were $986 thousand for the year ended December 31, 2014 as compared to $500 thousand for the year ended December 31, 2013.
71
Table of Contents
Non-Interest Expense
The following table provides a comparison of the major components of non-interest expense for the years ended December 31, 2015, 2014 and 2013.
Non-Interest Expense
For the Year Ended December 31,
| 2015 vs. 2014 | 2014 vs. 2013 | |||||||||||||||||||||||||||
| (Dollars in thousands) |
2015 | 2014 | 2013 | Change | % | Change | % | |||||||||||||||||||||
| Salaries and employee benefits |
$ | 19,202 | $ | 19,621 | $ | 17,776 | $ | (419 | ) | (2.1 | )% | $ | 1,845 | 10.4 | % | |||||||||||||
| Net occupancy and equipment |
4,155 | 4,536 | 4,572 | (381 | ) | (8.4 | )% | (36 | ) | (0.8 | )% | |||||||||||||||||
| Data processing |
2,939 | 2,530 | 2,437 | 409 | 16.2 | % | 93 | 3.8 | % | |||||||||||||||||||
| Professional fees |
2,086 | 2,279 | 1,811 | (193 | ) | (8.5 | )% | 468 | 25.8 | % | ||||||||||||||||||
| Advertising and business development |
1,199 | 1,057 | 952 | 142 | 13.4 | % | 105 | 11.0 | % | |||||||||||||||||||
| Telecommunications |
811 | 755 | 793 | 56 | 7.4 | % | (38 | ) | (4.8 | )% | ||||||||||||||||||
| FDIC insurance |
840 | 727 | 922 | 113 | 15.5 | % | (195 | ) | (21.1 | )% | ||||||||||||||||||
| Courier and postage |
544 | 562 | 552 | (18 | ) | (3.2 | )% | 10 | 1.8 | % | ||||||||||||||||||
| Amortization of core deposit intangible |
275 | 363 | 487 | (88 | ) | (24.2 | )% | (124 | ) | (25.5 | )% | |||||||||||||||||
| Loan expense |
388 | 327 | 366 | 61 | 18.7 | % | (39 | ) | (10.7 | )% | ||||||||||||||||||
| Other real estate owned |
287 | 21 | 1,125 | 266 | 1,266.7 | % | (1,104 | ) | (98.1 | )% | ||||||||||||||||||
| Loss on sale of buildings held for sale |
— | — | 197 | — | — | % | (197 | ) | (100.0 | )% | ||||||||||||||||||
| Other |
3,842 | 2,867 | 3,147 | 975 | 34.0 | % | (280 | ) | (8.9 | )% | ||||||||||||||||||
|
|
|
|
|
|
|
|
|
|
|
|
|
|
|
|||||||||||||||
| Sub-Total |
36,568 | 35,645 | 35,137 | 923 | 2.6 | % | 508 | 1.4 | % | |||||||||||||||||||
| Merger expenses |
1,691 | — | — | 1,691 | 100.0 | % | — | — | % | |||||||||||||||||||
| Loss on extinguishment of debt |
316 | — | — | 316 | 100.0 | % | — | — | % | |||||||||||||||||||
|
|
|
|
|
|
|
|
|
|
|
|
|
|
|
|||||||||||||||
| Total non-interest expense |
$ | 38,575 | $ | 35,645 | $ | 35,137 | $ | 2,930 | 8.2 | % | $ | 508 | 1.4 | % | ||||||||||||||
|
|
|
|
|
|
|
|
|
|
|
|
|
|
|
|||||||||||||||
Year ended December 31, 2015 compared with year ended December 31, 2014:
For the year ended December 31, 2015, non-interest expense totaled $38.6 million, an increase of $2.9 million, or 8.2%, compared to December 31, 2014. This increase was primarily due to merger expenses of $1.7 million, an increase of $975 thousand in other expense, an increase of $409 thousand in data processing and a loss on extinguishment of debt of $316 thousand, partially offset by a decrease of $419 thousand in salaries and employee benefits, a decrease of $381 thousand in net occupancy expense and a decrease of $193 thousand in professional fees. These items and other changes in the various components of non-interest expense are discussed in more detail below.
Salaries and employee benefits: Salaries and benefits were $19.2 million for the year ended December 31, 2015, a decrease of $419 thousand compared to the year ended December 31, 2014. Included in salaries and employee benefits is stock based compensation expense of $162 thousand in the year ended December 31, 2015 and $1.8 million for the year ended December 31, 2014. The decrease of $1.7 million in stock based compensation is principally attributable to the 2014 termination of the restricted stock unit plan, or RSUP. There was no expense associated with the RSUP for the year ended December 31, 2015, compared with $1.5 million for the year ended December 31, 2014. The $419 thousand decrease in total salaries and benefits expense when comparing the year ended December 31, 2015 with the year ended December 31, 2014 reflects increases in salaries, commissions, incentives, bonuses and benefits totaling $1.3 million, offset by the $1.7 million reduction in stock based compensation and $55 thousand reduction in contract labor costs. The $753 thousand increase in salaries and the $239 thousand increase in commissions, incentives and bonuses reflect cost-of-living raises, increased loan production, the achievement of performance targets and an increase in the number of employees subsequent to the October 9, 2015 merger with First Independence.
72
Table of Contents
Net occupancy and equipment: Net occupancy and equipment includes expenses related to the use of premises and equipment, such as depreciation, operating lease payments, repairs and maintenance, insurance, property taxes and utilities, net of incidental rental income of excess facilities. Occupancy expenses were $4.2 million for the year ended December 31, 2015, compared to $4.5 million for the year ended December 31, 2014. The majority of the decrease is due to the purchase of the corporate headquarters building in April 2015 and the construction of a new branch building in Wichita, which replaced rented space and was completed in November 2014, resulting in decreases in building rent that were partially offset by an increase in depreciation expense. Depreciation expense, repairs and maintenance, property taxes, and other occupancy costs increased $66 thousand in the year ended December 31, 2015 in connection with the acquisition of First Independence and the addition of four branches in Southeast Kansas.
Data processing: Data processing expenses were $2.9 million for the year ended December 31, 2015, an increase of $409 thousand, or 16.2%, from the year ended December 31, 2014. The increase was principally due to increased debit card processing costs as usage increased.
Professional fees: Professional fees, including regulatory assessments, were $2.1 million for the year ended December 31, 2015 and $2.3 million for the year ended December 31, 2014. The decrease of $193 thousand, or 8.5%, principally is due to a decrease in legal fees of $505 thousand, offset by an increase in accounting fees of $92 thousand and an increase in other professional fees of $215 thousand. The decrease in legal fees was primarily due to the settlement of the lawsuit with U.S. Bank in June 2015, as discussed in the Notes to Consolidated Financials Statements, “NOTE 23 – LEGAL MATTERS.” The offsetting increases in professional fees are principally attributable to preparing for SEC registration and the reporting requirements of a public company.
Other real estate owned: As detailed in “NOTE 5 – OTHER REAL ESTATE OWNED” in the Notes to Consolidated Financial Statements other real estate owned expenses, including provision for unrealized losses were $418 thousand for the year ended December 31, 2015, offset by gains on the sale of other real estate owned of $131 thousand. For the year ended December 31, 2014 other real estate owned expenses, including provision for unrealized losses were $526 thousand offset by gains on the sale of other real estate owned of $505 thousand.
Other: Other non-interest expenses, which consist of subscriptions; memberships and dues; employee expenses including travel, meals, entertainment and education; supplies; printing; insurance; account related losses; correspondent bank fees; customer program expenses; losses net of gains on the sale of fixed assets, losses net of gains on the sale of repossessed assets other than real estate; and other operating expenses such as settlement of claims, were $3.8 million for the year ended December 31, 2015 and $2.9 million for the year ended December 31, 2014.
Merger expenses: Merger expenses include legal, advisory and accounting fees associated with services to facilitate the acquisition of other banks. Merger expenses also include data processing conversion costs and costs associated with the integration of personnel, processes and facilities. On October 9, 2015, we acquired 100% of the outstanding common stock of First Independence Corporation and its subsidiary, First Federal Savings & Loan of Independence, based in Independence, Kansas. Merger expenses of $1.7 million for the year ended December 31, 2015 are related to this merger.
Loss on extinguishment of debt: We chose to incur a $316 thousand loss on extinguishment of debt in February 2015 due to the prepayment of all our FHLB term advances. The weighted average rate of the FHLB term advances was 3.82%. To the extent that additional funding is needed our FHLB line of credit has a lower cost of funds, 0.48% at December 31, 2015.
Year ended December 31, 2014 compared with year ended December 31, 2013:
For the year ended December 31, 2014, non-interest expense totaled $35.6 million, an increase of $508 thousand, or 1.4%, compared with 2013. This increase was primarily due to an increase of $1.8 million in salaries
73
Table of Contents
and employee benefits, and an increase of $468 thousand in professional fees, partially offset by a decrease of $1.1 million in expenses and losses, net of gains, related to other real estate owned. These items and other changes in the various components of non-interest expense are discussed in more detail below.
Salaries and employee benefits: Salaries and benefits were $19.6 million for the year ended December 31, 2014, an increase of $1.8 million compared to the year ended December 31, 2013. Included in salaries and employee benefits is stock based compensation expense of $1.8 million for 2014 and $401 thousand for 2013. The increase of $1.4 million in stock based compensation is principally attributable to the May 2014 termination of the RSUP. Upon termination of the RSUP the vesting of the RSU’s outstanding was accelerated, the service period was shortened, and the remaining unrecognized compensation was expensed. The expense associated with the RSUP was $1.5 million for the year ended December 31, 2014 compared to $303 thousand for the year ended December 31, 2013. Incentives and bonuses of $1.1 million for 2014 were up $393 thousand over the $747 thousand in incentives and bonuses expense for 2013, accounting for the remaining increase in salaries and employee benefit expense.
Net occupancy and equipment: Net occupancy and equipment includes expenses related to the use of premises and equipment, such as depreciation, operating lease payments, repairs and maintenance, insurance, property taxes and utilities, net of incidental rental income of excess facilities. Occupancy expenses were $4.5 million for the year ended December 31, 2014, a decrease of $36 thousand compared to the year ended December 31, 2013.
Data processing: Data processing expenses were $2.5 million for 2014. An increase of $93 thousand, or 3.8%, from 2013 was due to technology enhancements during 2014.
Professional fees: Professional fees, including regulatory assessments were $2.3 million and $1.8 million for the years ended December 31, 2014 and 2013. The increase of $468 thousand, or 25.8%, is related to legal matters discussed in “NOTE 23 – LEGAL MATTERS” in the Notes to Consolidated Financial Statements and additional accounting and other professional services related to SEC registration.
Other real estate owned: As detailed in the Notes to Consolidated Financial Statements, NOTE 5 – OTHER REAL ESTATE OWNED, other real estate owned expenses were $331 thousand for the year ended December 31, 2015, offset by gains on the sale of other real estate owned, including provision for unrealized losses of $44 thousand. For the year ended December 31, 2014 other real estate owned expenses were $397 thousand offset by gains on the sale of other real estate owned, including provision for unrealized losses of $375 thousand. For the year ended December 31, 2013 other real estate owned expenses were $641 thousand and gains on the sale of other real estate owned, offset by provision for unrealized losses were $484 thousand.
Other: Other non-interest expenses, which consist of subscriptions; memberships and dues; employee expenses including travel, meals, entertainment and education; supplies; printing; insurance; account related losses; correspondent bank fees; customer program expenses; losses net of gains on the sale of fixed assets, losses net of gains on the sale of repossessed assets other than real estate; and other operating expenses such as settlement of claims, were $2.9 million and $3.1 million for the years ended December 31, 2014 and 2013.
Efficiency Ratio
The efficiency ratio is a supplemental financial measure utilized in the internal evaluation of our performance and is not defined under GAAP. Our efficiency ratio is computed by dividing non-interest expense, excluding merger expenses and loss on debt extinguishment by the sum of net interest income and non-interest income, excluding net gains on sales of and settlement of securities and gain on acquisition. Generally, an increase in the efficiency ratio indicates that more resources are being utilized to generate the same volume of income, while a decrease would indicate a more efficient allocation of resources.
74
Table of Contents
Our efficiency ratio was 66.9% for the year ended December 31, 2015, compared with 72.7% for the year ended December 31, 2014. This decrease was primarily due to increased net interest income and non-interest income as discussed in “Results of Operations – Net Interest Income and Net Interest Margin Analysis” and “Results of Operations – Non-Interest Income.”
Our efficiency ratio was 72.7% for the year ended December 31, 2014, compared with 72.3% for the year ended December 31, 2013. This increase was due to increased non-interest expenses, primarily stock-based compensation associated with the RSUP termination in 2014 as discussed in “Results of Operation – Non-Interest Expense.”
Income Taxes
The amount of income tax expense is influenced by the amount of pre-tax income, the amount of tax-exempt income, the amount non-deductible expenses and available tax credits.
Year ended December 31, 2015 compared with year ended December 31, 2014:
For the year ended December 31, 2015, income tax expense was $4.1 million compared with $4.2 million for the year ended December 31, 2014. The effective income tax rates for the years ended December 31, 2015 and 2014 were 28.7% and 31.9%, as compared to the U.S. statutory rate of 35.0%. As detailed in “NOTE 15 – INCOME TAXES” in the Notes to Consolidated Financial Statements, the income tax rate differed from the U.S. statutory rate primarily due to non-taxable income, non-deductible expenses and tax credits.
Year ended December 31, 2014 compared with year ended December 31, 2013:
For the year ended December 31, 2014, income tax expense was $4.2 million compared with $3.5 million for the year ended December 31, 2013. The effective income tax rates for the years ended December 31, 2014 and 2013 were 31.9% and 31.0%, as compared to U.S. statutory rates of 35.0% and 34.0%. The effective income tax rates differed from the U.S. statutory rate primarily due to non-taxable income, non-deductible expenses and tax credits. Beginning in 2014, our federal taxable income exceeded $10.0 million resulting in a higher U.S. statutory rate.
Impact of Inflation
Our consolidated financial statements and related notes included elsewhere in this annual report have been prepared in accordance with GAAP. These require the measurement of financial position and operating results in terms of historical dollars, without considering changes in the relative value of money over time due to inflation or recession.
Unlike many industrial companies, substantially all of our assets and liabilities are monetary in nature. As a result, interest rates have a more significant impact on our performance than the effects of general levels of inflation. Interest rates may not necessarily move in the same direction or in the same magnitude as the prices of goods and services. However, other operating expenses do reflect general levels of inflation.
Financial Condition
Overview
Our total assets increased $411.2 million, or 35.0%, from $1.17 billion at December 31, 2014, to $1.59 billion at December 31, 2015. The increase in total assets was primarily from increases in net loans of $234.9 million, $127.3 million in investment securities, $25.1 million in cash and equivalents and $6.7 million in Federal Reserve Bank and FHLB stock. Included in the above changes are the assets of First Independence, which totaled $135 million at acquisition. Our total liabilities increased $361.7 million, or 34.2%, from $1.06 billion at December 31, 2014 to $1.42 billion at December 31, 2015. The increase in total liabilities was
75
Table of Contents
primarily from increases in FHLB advances of $124.5 million, $234.7 million in total deposits, and a $3.5 million net increase in the bank stock loan; and were partially offset by decreases of $4.5 million in federal funds purchased and retail repurchase agreements. Our total stockholders’ equity increased $49.5 million, or 42.0%, from $117.7 million at December 31, 2014 to $167.2 million at December 31, 2015. The increase in total stockholders’ equity was primarily from net proceeds from the initial public offering of $38.9 million and retained earnings of $10.1 million.
Loan Portfolio
Loans are our largest category of earning assets and typically provide higher yields than other types of earning assets. At December 31, 2015, our gross loans held for investment portfolio totaled $960.4 million, an increase of $234.5 million, or 32.3%, compared with December 31, 2014. Excluding the acquisition of First Independence, gross loans held for investment increased by $144.6 million, or 19.9%, compared with December 31, 2014. Overall growth consisted of $115.8 million or 49.4% from residential real estate; $78.9 million or 33.7% from commercial and industrial; $19.4 million or 8.3% from commercial real estate; $13.5 million or 5.8% from real estate construction; $9.2 million or 3.9% from consumer, $1.1 million or 0.5% from agricultural real estate; but were partially offset by a decrease of $3.5 million or 1.5% from agricultural. We also had loans classified as held for sale totaling $3.5 million at December 31, 2015.
Our loan portfolio consists of various types of loans, most of which are made to borrowers located in the Wichita and Kansas City MSAs, as well as various community markets throughout Kansas and Missouri. Although the portfolio is diversified and generally secured by various types of collateral, the majority of our loan portfolio consists of commercial and industrial and commercial real estate loans and a substantial portion of our borrowers’ ability to honor their obligations is dependent on local economic conditions in Kansas and Missouri. As of December 31, 2015, there was no concentration of loans to any one type of industry exceeding 10% of total loans.
At December 31, 2014, our gross loan held for investment portfolio totaled $725.9 million, an increase of $65.6 million, or 9.9%, compared with $660.3 million at December 31, 2013. This overall growth consisted of $43.7 million, or 66.7% from commercial and industrial; $13.5 million or 20.6% from commercial real estate; $9.1 million or 13.8% from real estate construction; and $9.1 million or 13.8% from residential real estate. Growth in our gross loans held for investment portfolio was partially offset by decreases of $5.0 million or 7.6% from agricultural real estate; $4.7 million or 7.2% from agricultural; and $86 thousand or 0.1% from consumer. Other loans classified as held for sale totaled $897 thousand at December 31, 2014.
At December 31, 2015, gross total loans were 79.0% of deposits and 60.6% of total assets. At December 31, 2014, gross total loans were 74.0% of deposits and 61.8% of total assets.
The organic, or non-acquired, growth in our loan portfolio is attributable to our ability to attract new customers from other financial institutions and overall growth in our markets. Our lending staff has been successful in building banking relationships with new customers. Several new lenders have been hired in our markets, and these employees have been successful in transitioning their former clients and attracting new clients. Lending activities originate from the efforts of our lenders, with an emphasis on lending to individuals, professionals, small to medium-sized businesses and commercial companies located in the Wichita and Kansas City MSAs, as well as community markets in both Kansas and Missouri.
We provide commercial lines of credit, working capital loans, commercial real estate-backed loans (including loans secured by owner occupied commercial properties), term loans, equipment financing, acquisition, expansion and development loans, borrowing base loans, real estate construction loans, homebuilder loans, SBA loans, agricultural and agricultural real estate loans, letters of credit and other loan products to national and regional companies, real estate developers, mortgage lenders, manufacturing and industrial companies and other businesses. The types of loans we make to consumers include residential real estate loans, home equity loans, home equity lines of credit, installment loans, unsecured and secured personal lines of credit, overdraft protection and letters of credit.
76
Table of Contents
The following table summarizes our loan portfolio by type of loan as of the dates indicated:
Composition of Loan Portfolio
| December 31, | ||||||||||||||||||||||||
| 2015 | 2014 | 2013 | ||||||||||||||||||||||
| Amount | Percent | Amount | Percent | Amount | Percent | |||||||||||||||||||
| (Dollars in thousands) | ||||||||||||||||||||||||
| Commercial and industrial |
$ | 262,032 | 27.3 | % | $ | 183,100 | 25.2 | % | $ | 139,365 | 21.1 | % | ||||||||||||
| Real estate loans: |
||||||||||||||||||||||||
| Commercial real estate |
343,096 | 35.7 | % | 323,676 | 44.6 | % | 310,165 | 47.0 | % | |||||||||||||||
| Real estate construction |
53,921 | 5.6 | % | 40,420 | 5.6 | % | 31,347 | 4.8 | % | |||||||||||||||
| Residential real estate |
250,216 | 26.1 | % | 134,455 | 18.5 | % | 125,395 | 19.0 | % | |||||||||||||||
| Agricultural real estate |
18,180 | 1.9 | % | 17,083 | 2.3 | % | 22,092 | 3.3 | % | |||||||||||||||
|
|
|
|
|
|
|
|
|
|
|
|
|
|||||||||||||
| Total real estate loans |
665,413 | 69.3 | % | 515,634 | 71.0 | % | 488,999 | 74.1 | % | |||||||||||||||
| Consumer |
17,103 | 1.8 | % | 7,875 | 1.1 | % | 7,961 | 1.2 | % | |||||||||||||||
| Agricultural |
15,807 | 1.6 | % | 19,267 | 2.7 | % | 23,969 | 3.6 | % | |||||||||||||||
|
|
|
|
|
|
|
|
|
|
|
|
|
|||||||||||||
| Total loans held for investment |
$ | 960,355 | 100.0 | % | $ | 725,876 | 100.0 | % | $ | 660,294 | 100.0 | % | ||||||||||||
|
|
|
|
|
|
|
|
|
|
|
|
|
|||||||||||||
| Total loans held for sale |
$ | 3,504 | 100.0 | % | $ | 897 | 100.0 | % | $ | 347 | 100.0 | % | ||||||||||||
|
|
|
|
|
|
|
|
|
|
|
|
|
|||||||||||||
| Total loans held for investment (net of allowances) |
$ | 954,849 | 100.0 | % | $ | 719,913 | 100.0 | % | $ | 654,680 | 100.0 | % | ||||||||||||
|
|
|
|
|
|
|
|
|
|
|
|
|
|||||||||||||
Commercial and industrial: Commercial and industrial loans include loans used to purchase fixed assets, to provide working capital, or meet other financing needs of the business. Our commercial and industrial portfolio totaled $262.0 million at December 31, 2015, an increase of $78.9 million, or 43.1%, compared to December 31, 2014. Of this growth, $31.4 million, or 39.8%, was a result of broadly syndicated shared national credit originations and $18.9 million, or 23.9%, was a result of mortgage finance loan participation. The remainder was a combination of loan originations within our target markets, principal repayment, changes in the balances of revolving lines of credit, and loans acquired through First Independence.
Commercial real estate: Commercial real estate loans include all loans secured by nonfarm nonresidential properties and by multifamily residential properties, as well as 1-4 family investment-purpose real estate loans. Our commercial real estate loans were $343.1 million at December 31, 2015, an increase of $19.4 million, or 6.0%, compared to December 31, 2014. The increase was primarily due to $13.0 million in commercial real estate loans acquired through First Independence. The remainder was a combination of loan originations within our target markets and principal repayment.
Real estate construction: Real estate construction loans include loans made for the purpose of acquisition, development, or construction of real property, both commercial and consumer. Our real estate construction portfolio totaled $53.9 million at December 31, 2015, an increase of $13.5 million, or 33.4%, compared to December 31, 2014. The increase in real estate construction loans is primarily related to increased originations.
Residential real estate: Residential real estate loans include loans secured by primary or secondary personal residences. Our residential real estate portfolio totaled $250.2 million at December 31, 2015, an increase of $115.8 million, or 86.1%, compared to December 31, 2014. During 2015, we purchased three pools of mortgage loans that represent $60.6 million of the increase that was partially offset by net payment activity in the existing residential real estate loans. During 2014, we purchased one pool of residential real estate loans totaling $26.2 million. These pools of mortgages were purchased to expand our loan portfolio and provide additional loan income. Additionally, the acquisition of First Federal added $71.3 million in residential real estate loans as of December 31, 2015.
77
Table of Contents
Agricultural real estate, Agricultural, Consumer and other: Agricultural real estate loans are loans related to farmland. Agricultural loans are primarily operating lines subject to annual farming revenues including productivity/yield of the agricultural commodities produced. Consumer loans are generally secured by consumer assets, but may be unsecured. These three loan pools represent 5.3% of our overall loan portfolio.
The contractual maturity ranges of loans in our loan portfolio and the amount of such loans with predetermined interest rates and floating rates in each maturity range as of December 31, 2015 are summarized in the following table:
Loan Maturity and Sensitivity to Changes in Interest Rates
| As of December 31, 2015 | ||||||||||||||||
| One year or less |
After one year through five years |
After five years |
Total | |||||||||||||
| (Dollars in thousands) | ||||||||||||||||
| Commercial and industrial |
$ | 125,800 | $ | 93,842 | $ | 42,390 | $ | 262,032 | ||||||||
| Real Estate: |
||||||||||||||||
| Commercial real estate |
66,576 | 184,759 | 91,761 | 343,096 | ||||||||||||
| Real estate construction |
23,455 | 22,537 | 7,929 | 53,921 | ||||||||||||
| Residential real estate |
5,080 | 11,497 | 233,639 | 250,216 | ||||||||||||
| Agricultural real estate |
4,984 | 6,452 | 6,744 | 18,180 | ||||||||||||
|
|
|
|
|
|
|
|
|
|||||||||
| Total real estate |
100,095 | 225,245 | 340,073 | 665,413 | ||||||||||||
| Consumer |
2,097 | 10,013 | 4,993 | 17,103 | ||||||||||||
| Agricultural |
9,871 | 3,785 | 2,151 | 15,807 | ||||||||||||
|
|
|
|
|
|
|
|
|
|||||||||
| Total |
$ | 237,863 | $ | 332,885 | $ | 389,607 | $ | 960,355 | ||||||||
|
|
|
|
|
|
|
|
|
|||||||||
| Loans with a predetermined fixed interest rate |
110,401 | 231,026 | 125,579 | 467,006 | ||||||||||||
| Loans with an adjustable/floating interest rate |
127,462 | 101,859 | 264,028 | 493,349 | ||||||||||||
|
|
|
|
|
|
|
|
|
|||||||||
| Total |
$ | 237,863 | $ | 332,885 | $ | 389,607 | $ | 960,355 | ||||||||
|
|
|
|
|
|
|
|
|
|||||||||
78
Table of Contents
The contractual maturity ranges of loans in our loan portfolio and the amount of such loans with predetermined interest rates and floating rates in each maturity range as of December 31, 2014 are summarized in the following table:
Loan Maturity and Sensitivity to Changes in Interest Rates
| As of December 31, 2014 | ||||||||||||||||
| One year or less |
After one year through five years |
After five years |
Total | |||||||||||||
| (Dollars in thousands) | ||||||||||||||||
| Commercial and industrial |
$ | 96,751 | $ | 61,268 | $ | 25,081 | $ | 183,100 | ||||||||
| Real Estate: |
||||||||||||||||
| Commercial real estate |
52,425 | 187,757 | 83,494 | 323,676 | ||||||||||||
| Real estate construction |
14,224 | 18,660 | 7,536 | 40,420 | ||||||||||||
| Residential real estate |
10,282 | 12,705 | 111,468 | 134,455 | ||||||||||||
| Agricultural real estate |
3,616 | 6,399 | 7,068 | 17,083 | ||||||||||||
|
|
|
|
|
|
|
|
|
|||||||||
| Total real estate |
80,547 | 225,521 | 209,566 | 515,634 | ||||||||||||
| Consumer |
2,080 | 4,733 | 1,062 | 7,875 | ||||||||||||
| Agricultural |
12,924 | 4,343 | 2,000 | 19,267 | ||||||||||||
|
|
|
|
|
|
|
|
|
|||||||||
| Total |
$ | 192,302 | $ | 295,865 | $ | 237,709 | $ | 725,876 | ||||||||
|
|
|
|
|
|
|
|
|
|||||||||
| Loans with a predetermined fixed interest rate |
104,142 | 197,142 | 38,147 | 339,431 | ||||||||||||
| Loans with an adjustable/floating interest rate |
88,160 | 98,723 | 199,562 | 386,445 | ||||||||||||
|
|
|
|
|
|
|
|
|
|||||||||
| Total |
$ | 192,302 | $ | 295,865 | $ | 237,709 | $ | 725,876 | ||||||||
|
|
|
|
|
|
|
|
|
|||||||||
Nonperforming Assets
The following table presents information regarding nonperforming assets at the dates indicated:
Nonperforming Assets
| As of December 31, | ||||||||||||
| 2015 | 2014 | 2013 | ||||||||||
| Nonaccrual loans |
$ | 8,197 | $ | 10,790 | $ | 12,985 | ||||||
| Accruing loans 90 or more days past due |
35 | 39 | 174 | |||||||||
| Restructured loans-accruing |
— | — | — | |||||||||
| OREO acquired through foreclosure, net |
5,811 | 4,754 | 7,332 | |||||||||
|
|
|
|
|
|
|
|||||||
| Total nonperforming assets |
$ | 14,043 | $ | 15,583 | $ | 20,491 | ||||||
|
|
|
|
|
|
|
|||||||
| Ratios: |
||||||||||||
| Nonperforming assets to total assets |
0.89 | % | 1.33 | % | 1.80 | % | ||||||
|
|
|
|
|
|
|
|||||||
| Nonperforming assets to total loans plus OREO |
1.45 | % | 2.13 | % | 3.07 | % | ||||||
|
|
|
|
|
|
|
|||||||
Nonperforming assets (“NPAs”) include loans on nonaccrual status, accruing loans 90 or more days past due, restructured loans, and other real estate acquired through foreclosure. Impaired loans do not include purchased loans that were identified upon acquisition as having experienced credit deterioration since origination (“purchased credit impaired loans” or “PCI loans”). See the “Critical Accounting Policies” section for information regarding the review of loans for determining the allowance for loan loss and impairment.
79
Table of Contents
We had $8.2 million in nonperforming loans at December 31, 2015, compared with $10.8 million at December 31, 2014. The nonperforming loans at December 31, 2015 consisted of 74 separate credits and 61 separate borrowers. We had two nonperforming loan relationships each with outstanding balances exceeding $1.0 million as of December 31, 2015.
There are several procedures in place to assist us in maintaining the overall quality of our loan portfolio. We have established underwriting guidelines to be followed by lenders, and also monitor delinquency levels for any negative or adverse trends. There can be no assurance, however, that our loan portfolio will not become subject to increasing pressures from deteriorating borrower credit due to general economic conditions.
Potential Problem Loans
We categorize loans into risk categories based on relevant information about the ability of borrowers to service their debt such as: current financial information, historical payment experience, credit documentation, public information, and current economic trends, among other factors. Loans are analyzed individually and classified based on credit risk. Consumer loans are considered pass credits unless downgraded due to payment status or reviewed as part of a larger credit relationship. We use the following definitions for risk ratings:
Pass: Loans classified as pass do not have any noted weaknesses and repayment of the loan is expected.
Special Mention: Loans classified as special mention have a potential weakness that deserves management’s close attention. If left uncorrected, these potential weaknesses may result in deterioration of the repayment prospects for the loan or of our credit position at some future date.
Substandard: Loans classified as substandard are inadequately protected by the current net worth and paying capacity of the obligor or of the collateral pledged, if any. Loans so classified have a well-defined weakness or weaknesses that jeopardize the liquidation of the debt. They are characterized by the distinct possibility that the institution will sustain some loss if the deficiencies are not corrected.
Doubtful: Loans classified as doubtful have all the weaknesses inherent in those classified as substandard, with the added characteristic that the weaknesses make collection or liquidation in full, on the basis of currently existing facts, conditions, and values, highly questionable and improbable.
Potential problem loans consist of loans that are performing in accordance with contractual terms, but for which management has concerns about the borrower’s ability to comply with repayment terms because of the borrower’s potential financial difficulties. Potential problem loans are assigned a grade of special mention or substandard . At December 31, 2015, the Company had $7.1 million in potential problem loans which were not included in either non-accrual or 90 days past due categories, compared to $20.7 million at December 31, 2014.
80
Table of Contents
The risk category of loans by class of loans is as follows as of December 31, 2015:
Risk Category of Loans by Class
| As of December 31, 2015 | ||||||||||||||||||||
| Pass | Special Mention | Substandard | Doubtful | Total | ||||||||||||||||
| (Dollars in thousands) | ||||||||||||||||||||
| Commercial and industrial |
$ | 260,669 | $ | — | $ | 1,363 | $ | — | $ | 262,032 | ||||||||||
| Real estate: |
||||||||||||||||||||
| Commercial real estate |
333,609 | — | 9,487 | — | 343,096 | |||||||||||||||
| Real estate construction |
53,308 | — | 613 | — | 53,921 | |||||||||||||||
| Residential real estate |
246,901 | — | 3,315 | — | 250,216 | |||||||||||||||
| Agricultural real estate |
17,810 | — | 370 | — | 18,180 | |||||||||||||||
|
|
|
|
|
|
|
|
|
|
|
|||||||||||
| Total real estate |
651,628 | — | 13,785 | — | 665,413 | |||||||||||||||
| Consumer |
17,000 | — | 103 | — | 17,103 | |||||||||||||||
| Agricultural |
15,707 | — | 100 | — | 15,807 | |||||||||||||||
|
|
|
|
|
|
|
|
|
|
|
|||||||||||
| Total |
$ | 945,004 | $ | — | $ | 15,351 | $ | — | $ | 960,355 | ||||||||||
|
|
|
|
|
|
|
|
|
|
|
|||||||||||
The risk category of loans by class of loans is as follows as of December 31, 2014:
Risk Category of Loans by Class
| As of December 31, 2014 | ||||||||||||||||||||
| Pass | Special Mention | Substandard | Doubtful | Total | ||||||||||||||||
| (Dollars in thousands) | ||||||||||||||||||||
| Commercial and industrial |
$ | 181,272 | $ | — | $ | 1,828 | $ | — | $ | 183,100 | ||||||||||
| Real estate: |
||||||||||||||||||||
| Commercial real estate |
302,511 | 147 | 21,018 | — | 323,676 | |||||||||||||||
| Real estate construction |
38,342 | — | 2,078 | — | 40,420 | |||||||||||||||
| Residential real estate |
132,285 | — | 2,170 | — | 134,455 | |||||||||||||||
| Agricultural real estate |
16,708 | — | 375 | — | 17,083 | |||||||||||||||
|
|
|
|
|
|
|
|
|
|
|
|||||||||||
| Total real estate |
489,846 | 147 | 25,641 | — | 515,634 | |||||||||||||||
| Consumer |
7,846 | — | 29 | — | 7,875 | |||||||||||||||
| Agricultural |
15,432 | — | 3,835 | — | 19,267 | |||||||||||||||
|
|
|
|
|
|
|
|
|
|
|
|||||||||||
| Total |
$ | 694,396 | $ | 147 | $ | 31,333 | $ | — | $ | 725,876 | ||||||||||
|
|
|
|
|
|
|
|
|
|
|
|||||||||||
At December 31, 2015, loans considered pass rated credits increased to 98.4% of total loans from 95.7% of total loans at December 31, 2014. Classified loans were $15.4 million at December 31, 2015, a decrease of $16.1 million, or 51.2%, from $31.5 million at December 31, 2014. The decrease primarily resulted from our continued focus on resolving classified loans in a timely manner as well as economic improvement in our principal markets.
Generally, loans are designated as nonaccrual when either principal or interest payments are 90 days or more past due based on contractual terms, unless the loan is well secured and in the process of collection. Consumer loans are typically charged off no later than 180 days past due. In all cases, loans are placed on nonaccrual or charged off at an earlier date if collection of principal or interest is considered doubtful. When a loan is placed on nonaccrual status, unpaid interest credited to income is reversed against income. Future interest income may be recorded on a cash basis after recovery of principal is reasonably assured. Nonaccrual loans are returned to accrual status when all the principal and interest amounts contractually due are brought current and future payments are reasonably assured.
81
Table of Contents
In accordance with applicable regulation, appraisals or evaluations are required to independently value real estate and, as an important element, to consider when underwriting loans secured in part or in whole by real estate. The value of real estate collateral provides additional support to the borrower’s credit capacity.
With respect to potential problem loans, all monitored and under-performing loans are reviewed and evaluated to determine if they are impaired. If we determine that a loan is impaired, then we evaluate the borrower’s overall financial condition to determine the need, if any, for possible write downs or appropriate additions to the allowance for loan losses based on the unlikelihood of full repayment of principal and interest in accordance with the contractual terms or the net realizable value of the pledged collateral.
Allowance for loan losses
Please see “Critical Accounting Policies – Allowance for Loan Losses” for additional discussion of our allowance policy.
In connection with our review of the loan portfolio, risk elements attributable to particular loan types or categories are considered when assessing the quality of individual loans. Some of the risk elements include:
| • | Commercial and industrial loans are dependent on the strength of the industries of the related borrowers and the success of their businesses. Commercial and industrial loans are advanced for equipment purchases, to provide working capital, or meet other financing needs of the business. These loans may be secured by accounts receivable, inventory, equipment, or other business assets. Financial information is obtained from the borrower to evaluate the debt service coverage and ability to repay the loans. |
| • | Commercial real estate loans are dependent on the industries tied to these loans as well as the local commercial real estate market. The loans are secured by the real estate, and appraisals are obtained to support the loan amount. An evaluation of the project’s cash flows is performed to evaluate the borrower’s ability to repay the loan at the time of origination and periodically updated during the life of the loan. Residential real estate loans are affected by the local residential real estate market, the local economy, and movement in interest rates. We evaluate the borrower’s repayment ability through a review of credit reports and debt to income ratios. Appraisals are obtained to support the loan amount. |
| • | Agricultural real estate loans are real estate loans related to farmland, and are affected by the value of farmland. We evaluate the borrower’s ability to repay based on cash flows from farming operations. |
| • | Consumer loans are dependent on the local economy. Consumer loans are generally secured by consumer assets, but may be unsecured. We evaluate the borrower’s repayment ability through a review of credit scores and an evaluation of debt to income ratios. |
| • | Agricultural loans are primarily operating lines subject to annual farming revenues including productivity/yield of the agricultural commodities produced and the market pricing at the time of sale. |
Purchased credit impaired loans: We have acquired loans, for which there was, at acquisition, evidence of deterioration of credit quality since origination and it was probable, at acquisition, that all required payments would not be collected. These purchased credit impaired loans were recorded at fair value, such that there is no carryover of the seller’s allowance for loan losses. After acquisition, losses are recognized by an increase in the allowance for loan losses. Purchased credit impaired loans are accounted for individually. We estimate the amount and timing of expected cash flows for each loan, and the expected cash flows in excess of the amount paid are recorded as interest income over the remaining life of the loan (accretable yield). The excess of the loan’s contractual principal and interest over expected cash flows is not recorded (non-accretable difference). Over the life of the loan, expected cash flows continue to be estimated. If the present value of the expected cash flows is less than the carrying amount, a loss is recorded. If the present value of the expected cash flows is greater than the carrying amount, it is recognized as part of future interest income.
82
Table of Contents
The table below shows the contractually required principal loan payments and the associated purchase discount on our purchased credit impaired portfolio.
Recorded Investment in Purchased Credit Impaired Loans
| December 31, | December 31, | December 31, | ||||||||||
| 2015 | 2014 | 2013 | ||||||||||
| (Dollars in thousands) | ||||||||||||
| Contractually required payments |
$ | 7,550 | $ | 7,278 | $ | 9,063 | ||||||
| Discount |
(1,794 | ) | (2,167 | ) | (2,536 | ) | ||||||
|
|
|
|
|
|
|
|||||||
| Recorded investment |
$ | 5,756 | $ | 5,111 | $ | 6,527 | ||||||
|
|
|
|
|
|
|
|||||||
Analysis of allowance for loan and lease losses: At December 31, 2015, the allowance for loan losses totaled $5.5 million, or 0.57% of total loans. At December 31, 2014 the allowance for loan losses aggregated $6.0 million, or 0.82% of total loans.
The allowance for loan losses on loans collectively evaluated for impairment totaled $5.2 million, or 0.55%, of the $948.9 million in loans collectively evaluated for impairment at December 31, 2015, compared to an allowance for loan losses of $4.3 million, or 0.60%, of the $711.0 million in loans collectively evaluated for impairment at December 31, 2014, and an allowance for loan losses of $4.5 million, or 0.69%, of the $647.7 million in loans collectively evaluated for impairment at December 31, 2013. The decrease was primarily related to a change in applied loss factors which are based in part on historical loss experience as well as changes in the composition and quality of our loan portfolio collectively evaluated for impairment. The changes in composition included purchases of broadly syndicated loans, mortgage finance loans, and residential real estate mortgage pools which have different characteristics than our originated loan portfolio at December 31, 2014.
Net losses as a percentage of average loans increased to 0.43% for the twelve months ended December 31, 2015 as compared to 0.13% for the twelve months ended December 31, 2014, and 0.21% for the twelve months ended December 31, 2013. While net charge-offs increased during 2015, $1.5 million of these gross charge-offs had been previously identified and specifically reserved for in the allowance for loan losses as of December 31, 2014.
There have been no material changes to our accounting policies related to our allowance for loan loss methodology during 2015 and 2014.
83
Table of Contents
The following table presents, as of and for the periods indicated, an analysis of the allowance for loan losses and other related data:
Allowance for Loan and Lease Losses
| As of and for the Twelve Months Ended December 31, |
||||||||||||
| 2015 | 2014 | 2013 | ||||||||||
| (Dollars in thousands) | ||||||||||||
| Average loans outstanding(1) |
$ | 813,970 | $ | 680,982 | $ | 698,447 | ||||||
|
|
|
|
|
|
|
|||||||
| Gross loans outstanding at end of period(1) |
$ | 960,355 | $ | 725,876 | $ | 660,295 | ||||||
|
|
|
|
|
|
|
|||||||
| Allowance for loan losses at beginning of the period |
$ | 5,963 | $ | 5,614 | $ | 4,471 | ||||||
| Provision for loan losses |
3,047 | 1,200 | 2,583 | |||||||||
| Charge-offs: |
||||||||||||
| Commercial and industrial |
(1,468 | ) | (46 | ) | (126 | ) | ||||||
| Real estate: |
||||||||||||
| Commercial real estate |
(1,668 | ) | (241 | ) | (920 | ) | ||||||
| Real estate construction |
— | — | (6 | ) | ||||||||
| Residential real estate |
(296 | ) | (668 | ) | (522 | ) | ||||||
| Agricultural real estate |
— | — | — | |||||||||
| Consumer |
(309 | ) | (360 | ) | (374 | ) | ||||||
| Agricultural |
— | (19 | ) | (37 | ) | |||||||
|
|
|
|
|
|
|
|||||||
| Total charge-offs |
(3,741 | ) | (1,334 | ) | (1,985 | ) | ||||||
| Recoveries: |
||||||||||||
| Commercial and industrial |
23 | 36 | 39 | |||||||||
| Real estate: |
||||||||||||
| Commercial real estate |
126 | 72 | 29 | |||||||||
| Real estate construction |
2 | 16 | 30 | |||||||||
| Residential real estate |
31 | 139 | 292 | |||||||||
| Agricultural real estate |
— | — | — | |||||||||
| Consumer |
53 | 218 | 154 | |||||||||
| Agricultural |
2 | 2 | 1 | |||||||||
|
|
|
|
|
|
|
|||||||
| Total recoveries |
237 | 483 | 545 | |||||||||
|
|
|
|
|
|
|
|||||||
| Net recoveries (charge-offs) |
(3,504 | ) | (851 | ) | (1,440 | ) | ||||||
|
|
|
|
|
|
|
|||||||
| Allowance for loan losses at end of the period |
$ | 5,506 | $ | 5,963 | $ | 5,614 | ||||||
|
|
|
|
|
|
|
|||||||
| Ratio of ALLL to end of period loans |
0.57 | % | 0.82 | % | 0.85 | % | ||||||
| Annualized ratio of net charge-offs (recoveries) to average loans |
0.43 | % | 0.13 | % | 0.21 | % | ||||||
| (1) | Excluding loans held for sale. |
84
Table of Contents
The following table shows the allocation of the allowance for loan losses among our loan categories and certain other information as of the dates indicated. The total allowance is available to absorb losses from any loan category.
Analysis of the Allowance for Loan and Lease Losses
| December 31, | ||||||||||||||||||||||||
| 2015 | 2014 | 2013 | ||||||||||||||||||||||
| Amount | % of Total Loans |
Amount | % of Total Loans |
Amount | % of Total Loans |
|||||||||||||||||||
| (Dollars in thousands) | ||||||||||||||||||||||||
| Balance of allowance for loan losses applicable to: |
||||||||||||||||||||||||
| Commercial and industrial |
$ | 1,366 | 24.8 | % | $ | 1,559 | 26.1 | % | $ | 990 | 17.6 | % | ||||||||||||
| Real estate: |
||||||||||||||||||||||||
| Commercial real estate |
1,728 | 31.4 | % | 2,298 | 38.5 | % | 2,378 | 42.4 | % | |||||||||||||||
| Real estate construction |
323 | 5.9 | % | 599 | 10.0 | % | 488 | 8.7 | % | |||||||||||||||
| Residential real estate |
1,824 | 33.1 | % | 1,190 | 20.0 | % | 1,360 | 24.2 | % | |||||||||||||||
| Agricultural real estate |
29 | 0.5 | % | 148 | 2.5 | % | 217 | 3.9 | % | |||||||||||||||
| Consumer |
187 | 3.4 | % | 81 | 1.4 | % | 63 | 1.1 | % | |||||||||||||||
| Agricultural |
49 | 0.9 | % | 88 | 1.5 | % | 118 | 2.1 | % | |||||||||||||||
|
|
|
|
|
|
|
|
|
|
|
|
|
|||||||||||||
| Total allowance for loan losses |
$ | 5,506 | 100.0 | % | $ | 5,963 | 100.0 | % | $ | 5,614 | 100.0 | % | ||||||||||||
|
|
|
|
|
|
|
|
|
|
|
|
|
|||||||||||||
Management believes that the allowance for loan losses at December 31, 2015 was adequate to cover probable incurred losses in the loan portfolio as of such date. There can be no assurance, however, that we will not sustain losses in future periods, which could be substantial in relation to the size of the allowance at December 31, 2015.
Securities
We use our securities portfolio to provide a source of liquidity, to provide an appropriate return on funds invested, to manage interest rate risk, to meet pledging requirements and to meet regulatory capital requirements. At December 31, 2015, the carrying amount of investment securities totaled $441.3 million, an increase of $127.3 million, or 40.6%, compared with December 31, 2014. At December 31, 2015, securities represented 27.8% of total assets compared with 26.7% at December 31, 2014.
At the date of purchase, debt and equity securities are classified into one of two categories, held-to-maturity or available-for-sale. We do not purchase securities for trading purposes. At each reporting date, the appropriateness of the classification is reassessed. Investments in debt securities are classified as held-to-maturity and carried at cost, adjusted for the amortization of premiums and the accretion of discounts, in the financial statements only if management has the positive intent and ability to hold those securities to maturity. Debt securities not classified as held-to-maturity are classified as available-for-sale and measured at fair value in the financial statements with unrealized gains and losses reported, net of tax, as accumulated comprehensive income or loss until realized. Interest earned on securities is included in total interest and dividend income. Also included in total interest and dividend income are dividends received on stock investments in the Federal Reserve Bank of Kansas City and the FHLB of Topeka. These stock investments are stated at cost.
85
Table of Contents
The following table summarizes the amortized cost and fair value by classification of available-for-sale securities as of the dates shown:
Available-For-Sale Securities
| December 31, 2015 | December 31, 2014 | December 31, 2013 | ||||||||||||||||||||||
| Amortized Cost |
Fair Value |
Amortized Cost |
Fair Value |
Amortized Cost |
Fair Value |
|||||||||||||||||||
| U.S. government-sponsored entities |
$ | 17,090 | $ | 17,036 | $ | 10,546 | $ | 10,400 | $ | 16,684 | $ | 16,842 | ||||||||||||
| Residential mortgage-backed securities (issued by government-sponsored entities) |
109,784 | 109,521 | 35,867 | 36,529 | 39,492 | 40,162 | ||||||||||||||||||
| Corporate |
3,000 | 2,954 | 3,000 | 3,011 | 7,509 | 7,561 | ||||||||||||||||||
| Small Business Administration loan pools |
275 | 297 | 332 | 356 | 371 | 401 | ||||||||||||||||||
| State and political subdivisions |
504 | 508 | 2,169 | 2,193 | — | — | ||||||||||||||||||
| Equity securities |
500 | 494 | 500 | 496 | 500 | 484 | ||||||||||||||||||
|
|
|
|
|
|
|
|
|
|
|
|
|
|||||||||||||
| Total available-for-sale securities |
$ | 131,153 | $ | 130,810 | $ | 52,414 | $ | 52,985 | $ | 64,556 | $ | 65,450 | ||||||||||||
|
|
|
|
|
|
|
|
|
|
|
|
|
|||||||||||||
The following table summarizes the amortized cost and fair value by classification of held-to-maturity securities as of the dates shown:
Held-To-Maturity Securities
| December 31, 2015 | December 31, 2014 | December 31, 2013 | ||||||||||||||||||||||
| Amortized Cost |
Fair Value |
Amortized Cost |
Fair Value |
Amortized Cost |
Fair Value |
|||||||||||||||||||
| U.S. government-sponsored entities |
$ | 2,669 | $ | 2,643 | $ | 2,800 | $ | 2,809 | $ | — | $ | — | ||||||||||||
| Residential mortgage-backed securities (issued by government-sponsored entities) |
230,554 | 230,993 | 195,458 | 198,171 | 217,627 | 213,416 | ||||||||||||||||||
| Corporate |
12,983 | 12,758 | 12,976 | 12,779 | 19,138 | 18,290 | ||||||||||||||||||
| Small Business Administration loan pools |
2,863 | 2,875 | 3,220 | 3,224 | 3,450 | 3,316 | ||||||||||||||||||
| State and political subdivisions |
61,470 | 63,533 | 46,563 | 48,206 | 44,192 | 44,726 | ||||||||||||||||||
|
|
|
|
|
|
|
|
|
|
|
|
|
|||||||||||||
| Total held-to-maturity securities |
$ | 310,539 | $ | 312,802 | $ | 261,017 | $ | 265,189 | $ | 284,407 | $ | 279,748 | ||||||||||||
|
|
|
|
|
|
|
|
|
|
|
|
|
|||||||||||||
At December 31, 2015, 2014 and 2013, we did not own securities of any one issuer (other than the U.S. government and its agencies or sponsored entities) for which aggregate adjusted cost exceeded 10% of the consolidated stockholders’ equity at the reporting dates noted.
86
Table of Contents
The following tables summarize the contractual maturity of debt securities and their weighted average yields as of December 31, 2015 and December 31, 2014. Expected maturities will differ from contractual maturities because issuers may have the right to call or prepay obligations with or without call or prepayment penalties. Securities not due at a single maturity date, primarily mortgage-backed securities, are shown separately. Available-for-sale securities are shown at fair value and held-to-maturity securities are shown at cost, adjusted for the amortization of premiums and the accretion of discounts.
| December 31, 2015 | ||||||||||||||||||||||||||||||||||||||||
| Due in one year or less |
Due after one year through five years |
Due after five years through 10 years |
Due after 10 years |
Total | ||||||||||||||||||||||||||||||||||||
| Carrying Value |
Yield | Carrying Value |
Yield | Carrying Value |
Yield | Carrying Value |
Yield | Carrying Value |
Yield | |||||||||||||||||||||||||||||||
| Available-for-sale securities: |
||||||||||||||||||||||||||||||||||||||||
| U.S. government-sponsored entities |
$ | 100 | 1.26 | % | $ | 12,204 | 1.47 | % | $ | 4,732 | 2.02 | % | $ | — | — | % | $ | 17,036 | 1.63 | % | ||||||||||||||||||||
| Residential mortgage-backed securities (issued by government-sponsored entities) |
— | — | % | 3,719 | 1.91 | % | 456 | 2.47 | % | 105,346 | 2.89 | % | 109,521 | 2.86 | % | |||||||||||||||||||||||||
| Corporate |
— | — | % | — | — | % | 2,954 | 1.51 | % | — | — | % | 2,954 | 1.51 | % | |||||||||||||||||||||||||
| Small Business Administration loan pools |
— | — | % | — | — | % | — | — | % | 297 | 5.21 | % | 297 | 5.21 | % | |||||||||||||||||||||||||
| State and political subdivisions(1) |
— | — | % | 508 | 1.50 | % | — | — | % | — | — | % | 508 | 1.50 | % | |||||||||||||||||||||||||
|
|
|
|
|
|
|
|
|
|
|
|
|
|
|
|
|
|
|
|
|
|||||||||||||||||||||
| Total available-for-sale securities |
$ | 100 | 1.26 | % | $ | 16,431 | 1.57 | % | $ | 8,142 | 1.86 | % | $ | 105,643 | 2.90 | % | $ | 130,316 | 2.67 | % | ||||||||||||||||||||
|
|
|
|
|
|
|
|
|
|
|
|
|
|
|
|
|
|
|
|
|
|||||||||||||||||||||
| Held-to-maturity securities: |
||||||||||||||||||||||||||||||||||||||||
| U.S. government-sponsored entities |
$ | — | — | % | $ | 2,669 | 2.46 | % | $ | — | — | % | $ | — | — | % | $ | 2,669 | 2.46 | % | ||||||||||||||||||||
| Residential mortgage-backed securities (issued by government-sponsored entities) |
— | — | % | 4,257 | 2.50 | % | 5,869 | 2.68 | % | 220,428 | 2.89 | % | 230,554 | 2.87 | % | |||||||||||||||||||||||||
| Corporate |
— | — | % | — | — | % | 5,370 | 2.74 | % | 7,613 | 2.06 | % | 12,983 | 2.34 | % | |||||||||||||||||||||||||
| Small Business Administration loan pools |
— | — | % | — | — | % | — | — | % | 2,863 | 2.61 | % | 2,863 | 2.61 | % | |||||||||||||||||||||||||
| State and political subdivisions(1) |
3,741 | 2.41 | % | 12,084 | 2.60 | % | 22,731 | 2.90 | % | 22,914 | 3.16 | % | 61,470 | 2.91 | % | |||||||||||||||||||||||||
|
|
|
|
|
|
|
|
|
|
|
|
|
|
|
|
|
|
|
|
|
|||||||||||||||||||||
| Total held-to-maturity securities |
$ | 3,741 | 2.41 | % | $ | 19,010 | 2.55 | % | $ | 33,970 | 2.84 | % | $ | 253,818 | 2.88 | % | $ | 310,539 | 2.85 | % | ||||||||||||||||||||
|
|
|
|
|
|
|
|
|
|
|
|
|
|
|
|
|
|
|
|
|
|||||||||||||||||||||
| Total debt securities |
$ | 3,841 | 2.38 | % | $ | 35,441 | 2.10 | % | $ | 42,112 | 2.65 | % | $ | 359,461 | 2.89 | % | $ | 440,855 | 2.80 | % | ||||||||||||||||||||
|
|
|
|
|
|
|
|
|
|
|
|
|
|
|
|
|
|
|
|
|
|||||||||||||||||||||
| (1) | The calculated yield is not calculated on a tax equivalent basis. |
87
Table of Contents
| December 31, 2014 | ||||||||||||||||||||||||||||||||||||||||
| Due in one year or less |
Due after one year through five years |
Due after five years through 10 years |
Due after 10 years |
Total | ||||||||||||||||||||||||||||||||||||
| Carrying Value |
Yield | Carrying Value |
Yield | Carrying Value |
Yield | Carrying Value |
Yield | Carrying Value |
Yield | |||||||||||||||||||||||||||||||
| Available-for-sale securities: |
||||||||||||||||||||||||||||||||||||||||
| U.S. government-sponsored entities |
$ | 85 | 1.83 | % | $ | 2,354 | 1.82 | % | $ | 7,961 | 2.07 | % | $ | — | — | % | $ | 10,400 | 2.01 | % | ||||||||||||||||||||
| Residential mortgage-backed securities (issued by government-sponsored entities) |
— | — | % | 4,200 | 1.93 | % | 6,634 | 2.52 | % | 25,695 | 2.63 | % | 36,529 | 2.53 | % | |||||||||||||||||||||||||
| Corporate |
— | — | % | — | — | % | 3,011 | 1.24 | % | — | — | % | 3,011 | 1.24 | % | |||||||||||||||||||||||||
| Small Business Administration loan pools |
— | — | % | — | — | % | — | — | % | 356 | 4.49 | % | 356 | 4.49 | % | |||||||||||||||||||||||||
| State and political subdivisions(1) |
— | — | % | 567 | 1.33 | % | 1,626 | 1.74 | % | — | — | % | 2,193 | 1.64 | % | |||||||||||||||||||||||||
|
|
|
|
|
|
|
|
|
|
|
|
|
|
|
|
|
|
|
|
|
|||||||||||||||||||||
| Total available-for-sale securities |
$ | 85 | 1.83 | % | $ | 7,121 | 1.85 | % | $ | 19,232 | 2.07 | % | $ | 26,051 | 2.65 | % | $ | 52,489 | 2.33 | % | ||||||||||||||||||||
|
|
|
|
|
|
|
|
|
|
|
|
|
|
|
|
|
|
|
|
|
|||||||||||||||||||||
| Held-to-maturity securities: |
||||||||||||||||||||||||||||||||||||||||
| U.S. government-sponsored entities |
$ | — | — | % | $ | 2,800 | 2.47 | % | $ | — | — | % | $ | — | — | % | $ | 2,800 | 2.47 | % | ||||||||||||||||||||
| Residential mortgage-backed securities (issued by government-sponsored entities) |
— | — | % | 4,431 | 2.01 | % | 13,651 | 2.51 | % | 177,376 | 2.58 | % | 195,458 | 2.56 | % | |||||||||||||||||||||||||
| Corporate |
— | — | % | — | — | % | 5,433 | 2.72 | % | 7,543 | 1.92 | % | 12,976 | 2.26 | % | |||||||||||||||||||||||||
| Small Business Administration loan pools |
— | — | % | — | — | % | — | — | % | 3,220 | 2.49 | % | 3,220 | 2.49 | % | |||||||||||||||||||||||||
| State and political subdivisions(1) |
4,426 | 1.83 | % | 12,147 | 2.52 | % | 23,677 | 2.85 | % | 6,313 | 3.53 | % | 46,563 | 2.76 | % | |||||||||||||||||||||||||
|
|
|
|
|
|
|
|
|
|
|
|
|
|
|
|
|
|
|
|
|
|||||||||||||||||||||
| Total held-to-maturity securities |
$ | 4,426 | 1.83 | % | $ | 19,378 | 2.39 | % | $ | 42,761 | 2.73 | % | $ | 194,452 | 2.58 | % | $ | 261,017 | 2.58 | % | ||||||||||||||||||||
|
|
|
|
|
|
|
|
|
|
|
|
|
|
|
|
|
|
|
|
|
|||||||||||||||||||||
| Total debt securities |
$ | 4,511 | 1.83 | % | $ | 26,499 | 2.25 | % | $ | 61,993 | 2.52 | % | $ | 220,503 | 2.59 | % | $ | 313,506 | 2.54 | % | ||||||||||||||||||||
|
|
|
|
|
|
|
|
|
|
|
|
|
|
|
|
|
|
|
|
|
|||||||||||||||||||||
| (1) | The calculated yield is not calculated on a tax equivalent basis. |
Mortgage-backed securities are securities that have been developed by pooling a number of real estate mortgages and which are principally issued by federal agencies such as Ginnie Mae, Fannie Mae and Freddie Mac. Unlike U.S. Treasury and U.S. government agency securities, which have a lump sum payment at maturity, mortgage-backed securities provide cash flows from regular principal and interest payments and principal prepayments throughout the lives of the securities. Premiums and discounts on mortgage-backed securities are amortized and accreted over the expected life of the security and may be impacted by prepayments. As such, mortgage-backed securities which are purchased at a premium will generally produce decreasing net yields as interest rates drop because home owners tend to refinance their mortgages resulting in prepayments and an acceleration of premium amortization. Securities purchased at a discount will reflect higher net yields in a decreasing interest rate environment as prepayments result in an acceleration of discount accretion.
The contractual maturity of mortgage-backed securities is not a reliable indicator of their expected lives because borrowers have the right to prepay their obligations at any time. Monthly pay downs on mortgage-backed securities cause the average lives of these securities to be much different than their stated lives. At December 31, 2015 and December 31, 2014, 95.8% and 87.5% of the mortgage-backed securities held by us had contractual final maturities of more than ten years with a weighted average life of 5.2 years and 4.6 years and a modified duration of 4.6 years and 4.2 years.
Deposits
Our lending and investing activities are primarily funded by deposits. A variety of deposit accounts are offered with a wide range of interest rates and terms including demand, savings, money market and time deposits. We rely primarily on competitive pricing policies, convenient locations, comprehensive marketing strategy and personalized service to attract and retain these deposits.
88
Table of Contents
The following table shows our composition of deposits at December 31, 2015, 2014 and 2013 (dollars in thousands):
Composition of Deposits
| 2015 | 2014 | 2013 | ||||||||||||||||||||||
| Amount | Percent of Total |
Amount | Percent of Total |
Amount | Percent of Total |
|||||||||||||||||||
| Non-interest-bearing demand |
$ | 157,834 | 13.0 | % | $ | 128,919 | 13.1 | % | $ | 131,527 | 13.9 | % | ||||||||||||
| Interest-bearing demand and NOW accounts |
316,965 | 26.0 | % | 271,117 | 27.6 | % | 220,115 | 23.3 | % | |||||||||||||||
| Savings and money market |
302,503 | 24.9 | % | 238,981 | 24.4 | % | 232,467 | 24.5 | % | |||||||||||||||
| Time |
438,612 | 36.1 | % | 342,160 | 34.9 | % | 363,210 | 38.3 | % | |||||||||||||||
|
|
|
|
|
|
|
|
|
|
|
|
|
|||||||||||||
| Total deposits |
$ | 1,215,914 | 100.0 | % | $ | 981,177 | 100.0 | % | $ | 947,319 | 100.0 | % | ||||||||||||
|
|
|
|
|
|
|
|
|
|
|
|
|
|||||||||||||
The following table shows the average deposit balance and average rate paid on deposits for the year ended December 31, 2015, 2014 and 2013 (dollars in thousands):
Average Deposit Balances and Average Rate Paid
| 2015 | 2014 | 2013 | ||||||||||||||||||||||
| Average Balance |
Average Rate Paid |
Average Balance |
Average Rate Paid |
Average Balance |
Average Rate Paid |
|||||||||||||||||||
| Non-interest-bearing demand |
$ | 138,933 | — | % | $ | 129,007 | — | % | $ | 127,741 | — | % | ||||||||||||
| Interest-bearing demand and NOW accounts |
259,007 | 0.25 | % | 224,009 | 0.25 | % | 209,696 | 0.28 | % | |||||||||||||||
| Savings and money market |
261,195 | 0.34 | % | 241,291 | 0.27 | % | 235,388 | 0.26 | % | |||||||||||||||
| Time |
374,846 | 0.90 | % | 366,168 | 0.79 | % | 386,459 | 0.82 | % | |||||||||||||||
|
|
|
|
|
|
|
|||||||||||||||||||
| Total deposits |
$ | 1,033,981 | $ | 960,475 | $ | 959,284 | ||||||||||||||||||
|
|
|
|
|
|
|
|||||||||||||||||||
Total deposits at December 31, 2015 were $1.22 billion, an increase of $234.7 million, or 23.9%, compared to December 31, 2014. All deposit categories reflect increases including: time deposits of $96.5 million, or 28.2%, savings and money market deposits of $63.5 million, or 26.6%, interest-bearing demand and NOW accounts of $45.8 million, or 16.9%, and non-interest bearing demand deposits of $28.9 million, or 22.4%. As part of the First Independence merger we assumed non-interest-bearing demand deposits of $15.2 million, interest-bearing demand and now accounts of $12.5 million, savings and money market deposits of $32.0 million and time deposits of $27.4 million. The increases in time deposits and interest-bearing demand and NOW accounts, excluding the impact of the merger, are primarily due to the addition of new public-fund customers and the increase in existing public-fund customer balances in these deposit products. The increases in savings and money market deposits and non-interest-bearing demand deposits, excluding the impact of the merger, are due to our ongoing business development efforts.
Total deposits at December 31, 2014 were $981.2 million, an increase of $33.9 million, or 3.6%, compared to December 31, 2013. Increases in interest-bearing demand and NOW accounts of $51.0 million, or 23.2%, and savings and money market deposits of $6.5 million, or 2.8%, were partially offset by decreases in time deposits of $21.1 million, or 5.8%, and non-interest bearing demand deposits of $2.6 million, or 2.0%. The increase in interest-bearing demand and NOW accounts is primarily from the addition of new public-fund customers and the increase in existing public-fund customer balances in these deposit products. The increase in savings and money market deposits was due to the increase in customer demand for shorter duration deposits and our business development efforts. The decrease in time deposits is primarily due to $13.6 million of brokered certificates of deposit maturing during 2014 and not being replaced.
89
Table of Contents
Included in savings and money market deposits at December 31, 2015, 2014 and 2013 are brokered deposit balances of $3.9 million, $7.8 million, and $5.9 million. These balances represent customer funds placed in the Insured Cash Sweep (“ICS”) service that allows Equity Bank to break large money-market deposits into smaller amounts and place them in a network of other ICS banks to ensure that FDIC insurance coverage is gained on the entire deposit. Although classified as brokered deposits for regulatory purposes, funds placed through the ICS service are Equity Bank’s customer relationships that management views as core funding. Brokered certificates of deposit as of December 31, 2015, 2014, and 2013 were $4.2 million, $12.9 million, and $36.9 million. Of these balances, $4.2 million at December 31, 2015, $5.8 million at December 31, 2014 and $16.3 million at December 31, 2013 were customer funds placed in the Certificate of Deposit Account Registry Service (“CDARS”) program. CDARS allows Equity Bank to break large deposits into smaller amounts and place them in a network of other CDARS banks to ensure that FDIC insurance coverage is gained on the entire deposit. Although classified as brokered deposits for regulatory purposes, funds placed through the CDARS program are Equity Bank’s customer relationships that management views as core funding.
The following table provides information on the maturity distribution of time deposits of $100,000 or more as of December 31, 2015 and December 31, 2014 (dollars in thousands):
| December 31, 2015 |
December 31, 2014 |
|||||||
| 3 months or less |
$ | 39,837 | $ | 57,152 | ||||
| Over 3 through 6 months |
42,803 | 27,943 | ||||||
| Over 6 through 12 months |
96,888 | 47,896 | ||||||
| Over 12 months |
99,086 | 86,733 | ||||||
|
|
|
|
|
|||||
| Total Time Deposits |
$ | 278,614 | $ | 219,724 | ||||
|
|
|
|
|
|||||
Other Borrowed Funds
We utilize borrowings to supplement deposits to fund our lending and investing activities. Short-term borrowing and long-term borrowing consist of funds from the FHLB, federal funds purchased and retail repurchase agreements, a bank stock loan and subordinated debentures.
90
Table of Contents
The following table presents our short-term borrowings at the dates indicated (dollars in thousands):
| (Dollars in thousands) |
Federal funds purchased and retail repurchase agreements |
FHLB Line of Credit |
||||||
| December 31, 2015: |
||||||||
| Amount outstanding at year-end |
$ | 20,762 | $ | 145,439 | ||||
| Weighted average interest rate at year-end |
0.24 | % | 0.48 | % | ||||
| Maximum month-end balance during the year |
$ | 27,951 | $ | 260,939 | ||||
| Average balance outstanding during the year |
$ | 24,853 | $ | 156,085 | ||||
| Weighted average interest rate during the year |
0.24 | % | 0.29 | % | ||||
| December 31, 2014: |
||||||||
| Amount outstanding at year-end |
$ | 25,301 | $ | 16,544 | ||||
| Weighted average interest rate at year-end |
0.25 | % | 0.25 | % | ||||
| Maximum month-end balance during the year |
$ | 31,159 | $ | 43,150 | ||||
| Average balance outstanding during the year |
$ | 28,516 | $ | 14,841 | ||||
| Weighted average interest rate during the year |
0.26 | % | 0.24 | % | ||||
| December 31, 2013: |
||||||||
| Amount outstanding at year-end |
$ | 25,450 | $ | — | ||||
| Weighted average interest rate at year-end |
0.26 | % | 0.19 | % | ||||
| Maximum month-end balance during the year |
$ | 43,278 | $ | 34,124 | ||||
| Average balance outstanding during the year |
$ | 31,608 | $ | 13,178 | ||||
| Weighted average interest rate during the year |
0.29 | % | 0.20 | % | ||||
Federal funds purchased and retail repurchase agreements: We have available federal funds lines of credit with our correspondent banks. As of December 31, 2015 and December 31, 2014, there were no federal funds purchased outstanding. Retail repurchase agreements outstanding represent the purchase of interests in securities by banking customers. Retail repurchase agreements are stated at the amount of cash received in connection with the transaction. We do not account for any of our repurchase agreements as sales for accounting purposes in our financial statements. Repurchase agreements with banking customers are settled on the following business day. Retail repurchase agreements are secured by investment securities held by us totaling $25.8 million at December 31, 2015 and $33.0 million at December 31, 2014. The agreements are on a day-to-day basis and can be terminated on demand. At December 31, 2015 and December 31, 2014, we had retail repurchase agreements with banking customers of $20.8 million and $25.3 million.
FHLB advances: FHLB advances include both draws against our line of credit and fixed rate term advances. Each term advance is payable in full at its maturity date and contains provision for prepayment penalties. At December 31, 2015 we had no term advances with the FHLB. All term advances were paid in full during the first quarter of 2015 incurring $316 thousand in prepayment penalties in order to decrease future costs of funds. Our FHLB borrowings are used for operational liquidity needs for originating and purchasing loans, purchasing investments and general operating cash requirements. Our FHLB borrowings were collateralized by certain qualifying loans totaling $318.8 million at December 31, 2015. Based on this collateral and our holdings of FHLB stock, we were eligible to borrow an additional $172.6 million at December 31, 2015.
Bank stock loan: In July 2014, we borrowed $15.5 million from an unaffiliated financial institution, secured by our stock in Equity Bank. In September 2015, we amended and restated this loan and borrowed an additional $5.0 million. The original borrowing was to redeem the Series A and Series B preferred stock and the purpose of the additional borrowing was to provide liquidity for the purchase of First Independence Corporation. The terms of the original loan mirror the amended loan with the exception of the quarterly and final payment amounts. The loan bears interest at a fixed rate of 4.00% until July 2019, at which time the interest rate adjusts to Prime Rate,
91
Table of Contents
as designated as such in the “Money Rates” section of The Wall Street Journal (or any generally recognized successor), floating daily. Accrued interest and principal payments are due quarterly on the first day of January, April, July and October, with one final payment of unpaid principal and interest due in July 2021. The terms of the loan require the Company and Equity Bank to maintain minimum capital ratios and other covenants. The loan and accrued interest may be pre-paid at any time without penalty. In the event of default, the lender has the option to declare all outstanding balances as immediately due. The bank stock loan balance was $18.6 million at December 31, 2015 and $15.2 million at December 31, 2014. A portion of the proceeds of our IPO were used to repay this borrowing in full on January 4, 2016.
Subordinated debentures: In conjunction with the 2012 acquisition of First Community, we assumed certain subordinated debentures owed to special purpose unconsolidated subsidiaries that are controlled by us, FCB Capital Trust II and FCB Capital Trust III, (“CTII” and “CTIII,” respectively). The trust preferred securities issued by CTII accrue and pay distributions quarterly at three-month LIBOR plus 2.00% on the stated liquidation amount of the trust preferred securities. These trust preferred securities are mandatorily redeemable upon maturity on April 15, 2035 or upon earlier redemption. The trust preferred securities issued by CTIII accrue and pay distributions quarterly at three-month LIBOR plus 1.89% on the stated liquidation amount of the trust preferred securities. These trust preferred securities are mandatorily redeemable upon maturity on June 15, 2037 or upon earlier redemption. The subordinated debentures balance was $9.3 million at December 31, 2015 and $8.9 million at December 31, 2014.
Liquidity and Capital Resources
Liquidity
Market and public confidence in our financial strength and financial institutions in general will largely determine access to appropriate levels of liquidity. This confidence is significantly dependent on our ability to maintain sound asset quality and appropriate levels of capital reserves.
Liquidity is defined as the ability to meet anticipated customer demands for future funds under credit commitments and deposit withdrawals at a reasonable cost and on a timely basis. We measure our liquidity position by giving consideration to both on- and off-balance sheet sources of and demands for funds on a daily, weekly, and monthly basis.
Liquidity risk involves the risk of being unable to fund assets with the appropriate duration and rate-based liabilities, as well as the risk of not being able to meet unexpected cash needs. Liquidity planning and management are necessary to ensure the ability to fund operations in a cost-effective manner and to meet current and future potential obligations such as loan commitments, lease obligations, and unexpected deposit outflows. In this process, we focus on both assets and liabilities and on the manner in which they combine to provide adequate liquidity to meet our needs.
During the years ended December 31, 2015, 2014, and 2013 our liquidity needs have primarily been met by core deposits, security and loan maturities and amortizing investment and loan portfolios. Other funding sources include federal funds purchased, retail repurchase agreements, brokered certificates of deposit, borrowings from the FHLB and in 2015 the issuance of common stock in our initial public offering or IPO.
Our largest sources of funds are FHLB borrowings and deposits and our largest uses of funds are the origination or purchases of loans and securities purchases. Average loans were $816.1 million for the year ended December 31, 2015, an increase of 19.5% over average loans of $682.7 million for the year ended December 31, 2014. Excess deposits are primarily invested in our interest-bearing deposit account with the Kansas City Federal Reserve Bank, investment securities, federal funds sold or other short-term liquid investments until the funds are needed to fund loan growth. Our securities portfolio has a weighted average life of 5.3 years and a modified duration of 4.7 years at December 31, 2015. In January 2016, $35.0 million of the proceeds from the November 2015 IPO were used to repay the bank stock loan of $18.6 million and to repurchase the Series C Preferred Stock
92
Table of Contents
at liquidation preference of $16.4 million. We believe that our daily funding needs can be met through cash provided by operating activities, payments and maturities on loans and investment securities, our core deposit base and FHLB advances and other borrowing relationships. In January 2016, we entered into a lending agreement with another financial institution providing for a maximum borrowing capacity of $20.0 million. This agreement, which is secured by Equity Bank stock, can be used to fund future acquisitions and for general corporate purposes.
Cash Flow Overview
Cash and cash equivalents were $56.8 million at December 31, 2015, an increase of $25.1 million from the $31.7 million cash and cash equivalents at December 31, 2014. The net cash provided by operating activities of $13.6 million and the net cash provided by financing activities of $278.4 million were offset by the $266.9 million use of cash and cash equivalents for investing purposes, resulting in net proceeds of cash and cash equivalents of $25.1 million for the year ended December 31, 2015. The net cash used in investing activities was principally related to loan portfolio growth and the purchase of investment securities in excess of the cash follows generated by maturities, pay-downs, calls and sales of and settlement of securities During 2015 liquidity provided by operating activities, FHLB borrowings and deposit growth were used to grow loans by $150.6 million and purchase additional investment securities of $99.7 million, purchase additional FHLB and Federal Reserve Bank stock of $4.9 million and purchase premise and equipment of $5.7 million. The purchase of net non-cash assets of First Independence used $9.0 million cash and cash equivalents which was funded by available cash and $5.0 million additional borrowings on the bank stock loan
Cash and cash equivalents were $31.7 million at December 31, 2014, an increase of $11.1 million from the $20.6 million cash and cash equivalents at December 31, 2013. The net cash provided by operating activities of $13.7 million plus the net cash provided by financing activities of $44.0 million were partially used in investing activities, with the remainder resulting in the increase in cash and cash equivalents. During 2014, proceeds of the $15.5 million from the bank stock loan were used to redeem a like amount of Series A and Series B preferred stock. Other funding activities, including the increase in deposits of $51.9 million and the increase in FHLB advances of $11.7 million were used for the first-quarter-2014 purchase of treasury shares and to provide funds for investing activities. Net cash used in investing activities was principally for loan portfolio growth. However, an additional use of funds was the November 2014 transfer of $13.8 million to an unaffiliated financial institution in connection with the sale of two Kansas branches.
During 2013, cash and cash equivalents decreased $79.8 million from $100.4 million at December 31, 2012 to $20.6 million at December 31, 2013. This decrease was principally the result of repositioning both assets and liabilities following the October 2012 acquisition of First Community Bancshares, Inc. or First Community. This repositioning included the use of $45.2 million in investing activities and the use of $50.6 million in financing activities partially offset by the $16.1 million net cash provided by operations. During 2013, we invested $101.9 million in investment securities in excess of the net cash provided by the investment securities portfolios from maturities, pay-down, calls and sales. This use of cash was partially funded by a $57.7 million decrease in the loan portfolio as we identified and disposed of First Community’s problem loans. Cash was also used for repositioning liabilities, including the decrease in deposits of $43.0 million and the decrease in FHLB advances of $8.6 million.
Off-Balance Sheet Items
In the normal course of business, we enter into various transactions, which, in accordance with GAAP, are not included in our consolidated balance sheets. We enter into these transactions to meet the financing needs of our customers. These transactions include commitments to extend credit and standby and commercial letters of credit, which involve, to varying degrees, elements of credit risk and interest rate risk in excess of the amounts recognized in the consolidated balance sheets. Our exposure to credit loss is represented by the contractual amounts of these commitments. The same credit policies and procedures are used in making these commitments as for on-balance sheet instruments.
93
Table of Contents
Our commitments associated with outstanding standby and performance letters of credit and commitments to extend credit expiring by period as of December 31, 2015 are summarized below. Since commitments associated with letters of credit and commitments to extend credit may expire unused, the amounts shown do not necessarily reflect the actual future cash funding requirements:
Credit Extensions Commitments
As of December 31, 2015
| 1 Year or Less |
More Than 1 Year but Less Than 3 Years |
3 Years or More but Less Than 5 Years |
5 Years or More |
Total | ||||||||||||||||
| Standby and performance letters of credit |
$ | 2,140 | $ | 2,696 | $ | 5 | $ | — | $ | 4,841 | ||||||||||
| Commitments to extend credit |
93,724 | 31,565 | 31,922 | 35,962 | 193,173 | |||||||||||||||
|
|
|
|
|
|
|
|
|
|
|
|||||||||||
| Total |
$ | 95,864 | $ | 34,261 | $ | 31,927 | $ | 35,962 | $ | 198,014 | ||||||||||
|
|
|
|
|
|
|
|
|
|
|
|||||||||||
Standby and Performance Letters of Credit: Standby letters of credit are irrevocable commitments issued by us to guarantee the performance of a customer to a third party once specified pre-conditions are met. Financial standby letters of credit are primarily issued to support public and private borrowing arrangements, including commercial paper, bond financing, and similar transactions. Performance standby letters of credit are issued to guarantee performance of certain customers under non-financial contractual obligations. The credit risk involved in issuing standby letters of credit is essentially the same as that involved in extending loans to customers.
Commitments to Extend Credit: Commitments to originate loans and available lines of credit are agreements to lend to a customer as long as there is no violation of any condition established in the contract. Commitments and lines of credit generally have fixed expiration dates or other termination clauses and may require payment of a fee. Since a portion of the commitments and lines of credit may expire without being drawn upon, the total commitment and lines of credit amounts do not necessarily represent future cash requirements. Each customer’s creditworthiness is evaluated on a case-by-case basis. The amount of collateral obtained, if deemed necessary, is based on management’s credit evaluation of the counterparty. Collateral held varies, but may include accounts receivable, inventory, property, plant and equipment, commercial real estate, and residential real estate. Mortgage loans in the process of origination represent amounts that we plan to fund within a normal period of 60 to 90 days, and which are intended for sale to investors in the secondary market.
Contractual Obligations
The following table summarizes our contractual obligations and other commitments to make future payments as of December 31, 2015 (other than securities sold under repurchase agreements). These obligations consist of our future cash payments associated with contractual obligations pursuant to FHLB advances, time deposit contracts, borrowed funds, and non-cancelable future operating leases. Payments related to leases are based on actual payments specified in underlying contracts.
Other contractual obligations represent commitments made by us to make capital investments in limited-liability entities that invest in qualified affordable housing projects. Payments on these obligations are made as requested by the managers of the limited-liability entities, however the table below includes an estimate of the anticipated timing of payments pursuant to these commitments .
94
Table of Contents
Contractual Obligations
As of December 31, 2015
| 1 Year or Less |
More Than 1 Year but Less Than 3 Years |
3 Years or More but Less Than 5 Years |
5 Years or More |
Total | ||||||||||||||||
| Certificates and other time deposits |
$ | 266,943 | $ | 112,156 | $ | 56,926 | $ | 2,587 | $ | 438,612 | ||||||||||
| Bank stock loan |
2,172 | 4,344 | 4,344 | 7,752 | 18,612 | |||||||||||||||
| Subordinated debentures |
— | — | — | 15,465 | 15,465 | |||||||||||||||
| FHLB advances |
145,439 | — | — | — | 145,439 | |||||||||||||||
| Other contractual obligation commitments |
690 | 1,068 | 853 | 482 | 3,093 | |||||||||||||||
| Non-cancelable future operating leases |
525 | 745 | 131 | 319 | 1,720 | |||||||||||||||
|
|
|
|
|
|
|
|
|
|
|
|||||||||||
| Total |
$ | 415,769 | $ | 118,313 | $ | 62,254 | $ | 26,605 | $ | 622,941 | ||||||||||
|
|
|
|
|
|
|
|
|
|
|
|||||||||||
Capital Resources
Capital management consists of providing equity to support our current and future operations. The federal bank regulators view capital levels as important indicators of an institution’s financial soundness. As a general matter, FDIC-insured depository institutions and their holding companies are required to maintain minimum capital relative to the amount and types of assets they hold. As a bank holding company and a state-chartered-Fed-member bank, the Company and Equity Bank are subject to regulatory capital requirements.
Capital adequacy guidelines and, additionally for banks, prompt corrective action regulations, involve quantitative measures of assets, liabilities, and certain off-balance-sheet items calculated under regulatory accounting practices. Capital amounts and classifications are also subject to qualitative judgments by regulators. Failure to meet capital requirements can initiate regulatory action. Management believes as of December 31, 2015 and December 31, 2014, the Company and Equity Bank meet all capital adequacy requirements to which they are subject.
Prompt corrective action regulations provide five classifications: well capitalized, adequately capitalized, undercapitalized, significantly undercapitalized, and critically undercapitalized, although these terms are not used to represent overall financial condition. If adequately capitalized, regulatory approval is required to accept brokered deposits. If undercapitalized, capital distributions are limited, as are asset growth and acquisitions, and capital restoration plans are required.
Failure to meet capital guidelines could subject the institution to a variety of enforcement remedies by federal bank regulatory agencies, including termination of deposit insurance by the FDIC, restrictions on certain business activities and appointment of the FDIC as conservator or receiver. As of December 31, 2015, the most recent notifications from the federal regulatory agencies categorized Equity Bank as “well capitalized” under the regulatory framework for prompt corrective action. To be categorized as well capitalized, Equity Bank must maintain minimum total capital, Tier 1 capital, Common Equity Tier 1 capital, and Tier 1 leverage ratios as set forth in the table. There are no conditions or events since that notification that management believes have changed Equity Bank’s category.
Total stockholders’ equity was $167.2 million at December 31, 2015, an increase of $49.5 million, or 42.0%, compared with December 31, 2014. The increase was principally attributable to common stock issuance as part of our IPO of $38.9 million, retained earnings of $10.1 million for the year ended December 31, 2015 and stock based compensation of $531 thousand.
In July 2013, the federal banking agencies published final rules establishing a new comprehensive capital framework for U.S. banking organizations. These rules became effective as applied to the Company and Equity
95
Table of Contents
Bank on January 1, 2015, with a phase in period from January 1, 2015 through January 1, 2019. The following table provides a comparison of the Company’s and Equity Bank’s leverage and risk-weighted capital ratios as of December 31, 2015 to the minimum and well-capitalized regulatory standards.
Capital Adequacy Analysis
As of December 31, 2015
| Actual | Minimum Required for Capital Adequacy Purposes |
To be Categorized as Well Capitalized Under Prompt Corrective Action Provisions |
||||||||||||||||||||||
| Amount | Ratio | Amount | Ratio | Amount | Ratio | |||||||||||||||||||
| (Dollars in thousands) | ||||||||||||||||||||||||
| The Company(1) |
||||||||||||||||||||||||
| Total capital (to risk weighted assets) |
$ | 156,358 | 14.35 | % | $ | 87,146 | 8.00 | % | $ | N/A | N/A | |||||||||||||
| Tier 1 capital (to risk weighted assets) |
150,852 | 13.85 | % | 65,359 | 6.00 | % | N/A | N/A | ||||||||||||||||
| Common equity tier 1 capital (to risk weighted assets) |
134,480 | 12.35 | % | 49,019 | 4.50 | % | N/A | N/A | ||||||||||||||||
| Tier 1 leverage capital (to average assets) |
150,852 | 9.47 | % | 63,728 | 4.00 | % | N/A | N/A | ||||||||||||||||
| The Bank(2) |
||||||||||||||||||||||||
| Total capital (to risk weighted assets) |
$ | 139,275 | 12.77 | % | $ | 87,256 | 8.00 | % | $ | 109,070 | 10.00 | % | ||||||||||||
| Tier 1 capital (to risk weighted assets) |
133,769 | 12.26 | % | 65,442 | 6.00 | % | 87,256 | 8.00 | % | |||||||||||||||
| Common equity tier 1 capital (to risk weighted assets) |
133,769 | 12.26 | % | 49,082 | 4.50 | % | 70,896 | 6.50 | % | |||||||||||||||
| Tier 1 leverage capital (to average assets) |
133,769 | 8.39 | % | 63,790 | 4.00 | % | 79,737 | 5.00 | % | |||||||||||||||
| (1) | The Federal Reserve may require the Company to maintain capital ratios above the required minimums. |
| (2) | The FDIC may require the Equity Bank to maintain capital ratios above the required minimums. |
Non-GAAP Financial Measures
We identify certain financial measures discussed in this Annual Report on Form 10-K as being “non-GAAP financial measures.” In accordance with the SEC’s rules, we classify a financial measure as being a non-GAAP financial measure if that financial measure excludes or includes amounts, or is subject to adjustments that have the effect of excluding or including amounts, that are included or excluded, as the case may be, in the most directly comparable measure calculated and presented in accordance with generally accepted accounting principles as in effect from time to time in the United States in our statements of income, balance sheets or statements of cash flows. Non-GAAP financial measures do not include operating and other statistical measures or ratios or statistical measures calculated using exclusively either financial measures calculated in accordance with GAAP, operating measures or other measures that are not non-GAAP financial measures or both.
The non-GAAP financial measures that we discuss in this Annual Report on Form 10-K should not be considered in isolation or as a substitute for the most directly comparable or other financial measures calculated in accordance with GAAP. Moreover, the manner in which we calculate the non-GAAP financial measures that we discuss in this Annual Report on Form 10-K may differ from that of other companies reporting measures with similar names. You should understand how such other banking organizations calculate their financial measures similar or with names similar to the non-GAAP financial measures we have discussed in this Annual Report on Form 10-K when comparing such non-GAAP financial measures.
Tangible Book Value Per Common Share and Tangible Book Value Per Diluted Common Share: Tangible book value is a non-GAAP measure generally used by financial analysts and investment bankers to evaluate financial institutions. We calculate: (a) tangible common equity as total stockholders’ equity less preferred stock, goodwill, core deposit intangibles, net of accumulated amortization and mortgage servicing asset, net of accumulated amortization; (b) tangible book value per common share as tangible common equity (as described in
96
Table of Contents
clause (a)) divided by shares of common stock outstanding; and (c) tangible book value per diluted common share as tangible common equity (as described in clause (a)) divided by shares of common stock outstanding plus the period-end dilutive effects of vested restricted stock units and the assumed exercise of stock options and redemption of non-vested restricted stock units. For tangible book value, the most directly comparable financial measure calculated in accordance with GAAP is book value.
Management believes that these measures are important to many investors who are interested in changes from period to period in book value per common share exclusive of changes in intangible assets. Goodwill and other intangible assets have the effect of increasing total book value while not increasing our tangible book value.
The following table reconciles, as of the dates set forth below, total stockholders’ equity to tangible common equity, tangible book value per common share, and diluted tangible book value per common share and compares these values with book value per common share (dollars in thousands, except per share data):
| December 31, 2015 |
December 31, 2014 |
December 31, 2013 |
||||||||||
| Total stockholders’ equity |
$ | 167,233 | $ | 117,729 | $ | 139,873 | ||||||
| Less: preferred stock |
16,372 | 16,359 | 31,892 | |||||||||
| Less: goodwill |
18,130 | 18,130 | 18,130 | |||||||||
| Less: core deposit intangibles, net |
1,549 | 1,107 | 1,470 | |||||||||
| Less: mortgage servicing asset |
29 | — | — | |||||||||
|
|
|
|
|
|
|
|||||||
| Tangible common equity |
$ | 131,153 | $ | 82,133 | $ | 88,381 | ||||||
|
|
|
|
|
|
|
|||||||
| Common shares outstanding at period end |
8,211,727 | 6,067,511 | 7,385,603 | |||||||||
|
|
|
|
|
|
|
|||||||
| Diluted common shares outstanding at period end |
8,332,762 | 6,285,628 | 7,464,074 | |||||||||
|
|
|
|
|
|
|
|||||||
| Book value per common share |
$ | 18.37 | $ | 16.71 | $ | 14.62 | ||||||
|
|
|
|
|
|
|
|||||||
| Tangible book value per common share |
$ | 15.97 | $ | 13.54 | $ | 11.97 | ||||||
|
|
|
|
|
|
|
|||||||
| Tangible book value per diluted common share |
$ | 15.74 | $ | 13.07 | $ | 11.84 | ||||||
|
|
|
|
|
|
|
|||||||
Tangible Common Equity to Tangible Assets: Tangible common equity to tangible assets is a non-GAAP measure generally used by financial analysts and investment bankers to evaluate financial institutions. We calculate: (a) tangible common equity as total stockholders’ equity less preferred stock, goodwill, core deposit intangibles, net of accumulated amortization and mortgage servicing asset, net of accumulated amortization; (b) tangible assets as total assets less goodwill, core deposit intangibles, net of accumulated amortization and mortgage servicing asset, net of accumulated amortization; and (c) tangible common equity to tangible assets as tangible common equity (as described in clause (a)) divided by tangible assets (as described in clause (b)). For common equity to tangible assets, the most directly comparable financial measure calculated in accordance with GAAP is total stockholders’ equity to total assets.
Management believes that this measure is important to many investors in the marketplace who are interested in the relative changes from period to period in common equity and total assets, each exclusive of changes in intangible assets. Goodwill and other intangible assets have the effect of increasing both total stockholders’ equity and total assets while not increasing tangible common equity or tangible assets.
97
Table of Contents
The following table reconciles, as of the dates set forth below, total stockholders’ equity to tangible common equity and total assets to tangible assets (dollars in thousands):
| December 31, 2015 |
December 31, 2014 |
December 31, 2013 |
||||||||||
| Total stockholders’ equity |
$ | 167,233 | $ | 117,729 | $ | 139,873 | ||||||
| Less: preferred stock |
16,372 | 16,359 | 31,892 | |||||||||
| Less: goodwill |
18,130 | 18,130 | 18,130 | |||||||||
| Less: core deposit intangibles, net |
1,549 | 1,107 | 1,470 | |||||||||
| Less: mortgage servicing asset |
29 | — | — | |||||||||
|
|
|
|
|
|
|
|||||||
| Tangible common equity |
$ | 131,153 | $ | 82,133 | $ | 88,381 | ||||||
|
|
|
|
|
|
|
|||||||
| Total assets |
$ | 1,585,727 | $ | 1,174,515 | $ | 1,139,897 | ||||||
| Less: goodwill |
18,130 | 18,130 | 18,130 | |||||||||
| Less: core deposit intangibles, net |
1,549 | 1,107 | 1,470 | |||||||||
| Less: mortgage servicing asset |
29 | — | — | |||||||||
|
|
|
|
|
|
|
|||||||
| Tangible assets |
$ | 1,566,019 | $ | 1,155,278 | $ | 1,120,297 | ||||||
|
|
|
|
|
|
|
|||||||
| Equity / assets |
10.55 | % | 10.02 | % | 12.27 | % | ||||||
|
|
|
|
|
|
|
|||||||
| Tangible common equity to tangible assets |
8.37 | % | 7.11 | % | 7.89 | % | ||||||
|
|
|
|
|
|
|
|||||||
Return on Average Tangible Common Equity: Return on average tangible common equity is a non-GAAP measure generally used by financial analysts and investment bankers to evaluate financial institutions. We calculate: (a) average tangible common equity as total average stockholders’ equity less average intangible assets and preferred stock; (b) adjusted net income allocable to common stockholders as net income allocable to common stockholders plus amortization of core deposit intangible less tax effect of amortization of core deposit intangible (tax rates used in this calculation were 35% for 2015 and 2014, and 34% for 2013) (c) return on average tangible common equity as adjusted net income allocable to common stockholders (as described in clause (b)) divided by average tangible common equity (as described in clause (a)). For return on average tangible common equity, the most directly comparable financial measure calculated in accordance with GAAP is return on average equity.
Management believes that this measure is important to many investors in the marketplace because it measures the return on equity equity, exclusive of the effects of intangible assets on earnings and capital. Goodwill and other intangible assets have the effect of increasing average stockholders’ equity and, through amortization, decreasing net income allocable to common stockholders while not increasing average tangible common equity or decreasing adjusted net income allocable to common stockholders.
98
Table of Contents
The following table reconciles, as of the dates set forth below, total average stockholders’ equity to average tangible common equity and net income allocable to common stockholders to adjusted net income allocable to common stockholders (dollars in thousands):
| December 31, 2015 |
December 31, 2014 |
December 31, 2013 |
||||||||||
| Total average stockholders’ equity |
$ | 125,808 | $ | 123,181 | $ | 137,936 | ||||||
| Less: average intangible assets and preferred stock |
19,165 | 37,924 | 50,646 | |||||||||
|
|
|
|
|
|
|
|||||||
| Average tangible common equity |
$ | 106,643 | $ | 85,257 | $ | 87,290 | ||||||
|
|
|
|
|
|
|
|||||||
| Net income allocable to common |
$ | 10,123 | $ | 8,279 | $ | 6,895 | ||||||
| Amortization of core deposit intangible |
275 | 363 | 487 | |||||||||
| Less: Tax effect of core deposit intangible amortization |
96 | 127 | 166 | |||||||||
|
|
|
|
|
|
|
|||||||
| Adjusted net income allocable to common stockholders |
$ | 10,302 | $ | 8,515 | $ | 7,216 | ||||||
|
|
|
|
|
|
|
|||||||
| Return on average equity (ROAE) |
8.19 | % | 7.30 | % | 5.71 | % | ||||||
|
|
|
|
|
|
|
|||||||
| Return on average tangible common equity (ROATCE) |
9.66 | % | 9.99 | % | 8.27 | % | ||||||
|
|
|
|
|
|
|
|||||||
Efficiency Ratio: The efficiency ratio is a non-GAAP measure generally used by financial analysts and investment bankers to evaluate financial institutions. We calculate the efficiency ratio by dividing non-interest expense, excluding merger expenses and loss on debt extinguishment, by the sum of net interest income and non-interest income, excluding net gains on the sale of available-for-sale securities and other securities transactions, and the net gain on acquisition. The GAAP-based efficiency ratio is non-interest expenses divided by net interest income plus non-interest income.
In management’s judgment, the adjustments made to non-interest expense and non-interest income allow investors and analysts to better assess operating expenses in relation to operating revenue by removing merger expenses, loss on debt extinguishment, net gains on the sale of available-for-sale securities and other securities transactions, and the net gain on acquisition.
The following table reconciles, as of the dates set forth below, the efficiency ratio to the GAAP-based efficiency ratio (dollars in thousands):
| December 31, 2015 |
December 31, 2014 |
December 31, 2013 |
||||||||||
| Non-interest expense |
$ | 38,575 | $ | 35,645 | $ | 35,137 | ||||||
| Less: merger expenses |
1,691 | — | — | |||||||||
| Less: loss on debt extinguishment |
316 | — | — | |||||||||
|
|
|
|
|
|
|
|||||||
| Non-interest expense, excluding merger expenses and loss on debt extinguishment |
$ | 36,568 | $ | 35,645 | $ | 35,137 | ||||||
|
|
|
|
|
|
|
|||||||
| Net interest income |
$ | 46,262 | $ | 41,361 | $ | 41,235 | ||||||
|
|
|
|
|
|
|
|||||||
| Non-interest income |
$ | 9,802 | $ | 8,674 | $ | 7,892 | ||||||
| Less: net gains on sales of and settlement of securities |
756 | 986 | 500 | |||||||||
| Less: net gain on acquisition |
682 | — | — | |||||||||
|
|
|
|
|
|
|
|||||||
| Non-interest income, excluding net gains on security transactions and on acquisition |
$ | 8,364 | $ | 7,688 | $ | 7,392 | ||||||
|
|
|
|
|
|
|
|||||||
| Non-interest expense to net interest income plus non-interest income |
68.81 | % | 71.24 | % | 71.52 | % | ||||||
|
|
|
|
|
|
|
|||||||
| Efficiency Ratio |
66.94 | % | 72.67 | % | 72.26 | % | ||||||
|
|
|
|
|
|
|
|||||||
99
Table of Contents
Item 7A: Quantitative and Qualitative Disclosure About Market Risk
Our asset-liability policy provides guidelines to management for effective funds management, and management has established a measurement system for monitoring net interest rate sensitivity position within established guidelines.
As a financial institution, the primary component of market risk is interest rate volatility. Fluctuations in interest rates will ultimately impact both the level of income and expense recorded on most assets and liabilities, and the market value of all interest-earning assets and interest-bearing liabilities, other than those which have a short term to maturity. Interest rate risk is the potential of economic gains or losses due to future interest rate changes. These changes can be reflected in future net interest income and/or fair market values. The objective is to measure the effect on net interest income (“NII”) and economic value of equity (“EVE”) and to adjust the balance sheet to minimize the inherent risk, while at the same time maximizing income.
We manage exposure to interest rates by structuring the balance sheet in the ordinary course of business. We have the ability to enter into instruments such as leveraged derivatives, interest rate swaps, financial options, financial future contracts or forward delivery contracts for the purpose of reducing interest rate risk, however currently we do not have a material exposure to these instruments. We also have the ability to enter into interest rate swaps as an accommodation to our customers in connection with an interest rate swap program. Based upon the nature of its operations, we are not subject to foreign exchange or commodity price risk. We do not own any trading assets.
Our exposure to interest rate risk is managed by the Asset Liability Committee (“ALCO”), which is composed of certain members of senior management, in accordance with policies approved by the Board of Directors. The ALCO formulates strategies based on appropriate levels of interest rate risk. In determining the appropriate level of interest rate risk, the ALCO considers the impact on earnings and capital of the current outlook on interest rates, potential changes in interest rates, regional economies, liquidity, business strategies and other factors. The ALCO meets monthly to review, among other things, the sensitivity of assets and liabilities to interest rate changes, the book and market values of assets and liabilities, unrealized gains and losses, securities purchase and sale activities, commitments to originate loans and the maturities of investment securities and borrowings. Additionally, the ALCO reviews liquidity, projected cash flows, maturities of deposits and consumer and commercial deposit activity.
ALCO uses a simulation analysis to monitor and manage the pricing and maturity of assets and liabilities in order to diminish the potential adverse impact that changes in interest rates could have on net interest income. The simulation tests the sensitivity of NII and EVE. Contractual maturities and repricing opportunities of loans are incorporated in the simulation model as are prepayment assumptions, maturity data and call options within the investment securities portfolio. Assumptions based on past experience are incorporated into the model for non-maturity deposit accounts. The assumptions used are inherently uncertain and, as a result, the model cannot precisely measure the future NII and EVE. Actual results will differ from the model’s simulated results due to timing, magnitude and frequency of interest rate changes as well as changes in market conditions and the application and timing of various management strategies.
The change in the impact of net interest income from the base case for December 31, 2015 and 2014, was primarily driven by the rate and mix of variable and fixed rate financial instruments, the underlying duration of the financial instruments, and the level of response to changes in the interest rate environment. The increase in the level of negative impact to net interest income in the up interest rate shock scenarios are due to the assumed migration of non-term deposit liabilities to higher rate term deposits; the level of fixed rate investments and loans receivable that will not reprice to higher rates; the variable rate Federal Home Loan Bank advances; the variable rate subordinated debentures, and the non-term deposits that are assumed not to migrate to term deposits that are variable rate and will reprice to the higher rates; and a portion of our portfolio of variable rate loans contain restrictions on the amount of repricing and frequency of repricing that limit the amount of repricing to the current higher rates. These factors result in the negative impacts to net interest income in the up interest rate shock
100
Table of Contents
scenarios that are detailed in the table below. In the down interest rate shock scenario the main drivers of the negative impact on net interest income are the decrease in investment income due to the negative convexity features of the fixed rate mortgage backed securities; assumed prepayment of existing fixed rate loans receivable; the downward pricing of variable rate loans receivable; the constraint of the shock on non-term deposits; and the level of term deposit repricing. Our mortgage back security portfolio is comprised of fixed rate investments and as rates decrease the level of prepayments will increase and cause the current higher rate investments to prepay and the assumed reinvestment will be at lower interest rates. Similar to our mortgage backed securities, the model assumes that our fixed rate loans receivable will prepay at a faster rate and reinvestment will occur at lower rates. The level of downward shock on the non-term deposits is constrained to limit the downward shock to a non-zero rate which results in a minimal reduction in the average rate paid. Term deposits repricing will only decrease the average cost paid by a minimal amount due to the assumed repricing occurring at maturity. These factors result in the negative impact to net interest income in the down interest rate shock scenario.
The change in the economic value of equity from the base case for December 31, 2015 and 2014 is due to us being in a liability sensitive position and the level of convexity in our pre-payable assets. Generally, with a liability sensitive position, as interest rates increase the value of your assets decrease faster than the value of liabilities and as interest rates decrease the value of your assets increase at a faster rate than liabilities. However, due to the level of convexity in our fixed rate pre-payable assets we do not experience a similar change in the value of assets in a down interest rate shock scenario. Substantially all investments and approximately 48.6% of loans are pre-payable and fixed rate and as rates decrease the level of modeled prepayments increase. The prepaid principal is assumed to reprice at the assumed current rates, resulting in a smaller positive impact to the economic value of equity.
The following table summarizes the simulated immediate change in net interest income for twelve months as of the dates indicated:
Market Risk
| Impact on Net Interest Income | ||||||||
| Change in prevailing interest rates |
December 31, 2015 | December 31, 2014 | ||||||
| +300 basis points |
(9.8 | )% | (4.3 | )% | ||||
| +200 basis points |
(6.1 | )% | (3.0 | )% | ||||
| +100 basis points |
(2.9 | )% | (1.5 | )% | ||||
| 0 basis points |
— | — | ||||||
| -100 basis points |
(4.0 | )% | (2.7 | )% | ||||
| Impact on Economic Value of Equity | ||||||||
| Change in prevailing interest rates |
December 31, 2015 | December 31, 2014 | ||||||
| +300 basis points |
(22.0 | )% | (12.1 | )% | ||||
| +200 basis points |
(12.3 | )% | (9.1 | )% | ||||
| +100 basis points |
(4.9 | )% | (5.2 | )% | ||||
| 0 basis points |
— | — | ||||||
| -100 basis points |
(3.4 | )% | (0.4 | )% | ||||
101
Table of Contents
Item 8: Financial Statements and Supplementary Data
Our financial statements and accompanying notes, including the Report of Independent Registered Public Accounting Firm, are set forth on pages F-1 to F-50 of this Annual Report on Form 10-K.
Audited Financial Statements
The following tables present supplementary quarterly financial information (unaudited) for the years ended December 31, 2015 and 2014 (in thousands, except per share data). This information should be read in conjunction with the historical consolidated financial statements of the Company and the notes thereto appearing elsewhere in this Annual Report on Form 10-K.
| 2015 | ||||||||||||||||
| 4th Quarter | 3rd Quarter | 2nd Quarter | 1st Quarter | |||||||||||||
| Total interest and dividend income |
$ | 14,405 | $ | 13,217 | $ | 12,970 | $ | 12,436 | ||||||||
| Total interest expense |
2,117 | 1,749 | 1,501 | 1,399 | ||||||||||||
|
|
|
|
|
|
|
|
|
|||||||||
| Net interest income |
12,288 | 11,468 | 11,469 | 11,037 | ||||||||||||
| Provision for loan loss |
1,180 | 537 | 605 | 725 | ||||||||||||
|
|
|
|
|
|
|
|
|
|||||||||
| Net interest income after provision for loan loss |
11,108 | 10,931 | 10,864 | 10,312 | ||||||||||||
| Total non-interest income |
3,350 | 2,014 | 2,045 | 2,393 | ||||||||||||
| Total non-interest expense |
11,664 | 8,866 | 9,027 | 9,018 | ||||||||||||
| Provision for income taxes |
240 | 1,343 | 1,313 | 1,246 | ||||||||||||
|
|
|
|
|
|
|
|
|
|||||||||
| Net income |
$ | 2,554 | $ | 2,736 | $ | 2,569 | $ | 2,441 | ||||||||
|
|
|
|
|
|
|
|
|
|||||||||
| Basic Earnings per share |
$ | 0.35 | $ | 0.43 | $ | 0.40 | $ | 0.38 | ||||||||
|
|
|
|
|
|
|
|
|
|||||||||
| Diluted earnings per share |
$ | 0.34 | $ | 0.43 | $ | 0.40 | $ | 0.38 | ||||||||
|
|
|
|
|
|
|
|
|
|||||||||
102
Table of Contents
| 2014 | ||||||||||||||||
| 4th Quarter | 3rd Quarter | 2nd Quarter | 1st Quarter | |||||||||||||
| Total interest and dividend income |
$ | 11,816 | $ | 11,803 | $ | 11,641 | $ | 11,534 | ||||||||
| Total interest expense |
1,468 | 1,480 | 1,288 | 1,197 | ||||||||||||
|
|
|
|
|
|
|
|
|
|||||||||
| Net interest income |
10,348 | 10,323 | 10,353 | 10,337 | ||||||||||||
| Provision for loan loss |
— | 300 | 450 | 450 | ||||||||||||
|
|
|
|
|
|
|
|
|
|||||||||
| Net interest income after provision for loan loss |
10,348 | 10,023 | 9,903 | 9,887 | ||||||||||||
| Total non-interest income |
2,200 | 2,682 | 1,910 | 1,882 | ||||||||||||
| Total non-interest expense |
9,755 | 9,164 | 8,587 | 8,139 | ||||||||||||
| Provision for income taxes |
1,014 | 1,108 | 937 | 1,144 | ||||||||||||
|
|
|
|
|
|
|
|
|
|||||||||
| Net income |
$ | 1,779 | $ | 2,433 | $ | 2,289 | $ | 2,486 | ||||||||
|
|
|
|
|
|
|
|
|
|||||||||
| Basic Earnings per share |
$ | 0.28 | $ | 0.38 | $ | 0.32 | $ | 0.32 | ||||||||
|
|
|
|
|
|
|
|
|
|||||||||
| Diluted earnings per share |
$ | 0.28 | $ | 0.38 | $ | 0.32 | $ | 0.32 | ||||||||
|
|
|
|
|
|
|
|
|
|||||||||
103
Table of Contents
Item 9: Changes in and Disagreements With Accountants on Accounting and Financial Disclosures
None
Item 9A: Controls and Procedures
Disclosure Controls and Procedures
Management of the Company is responsible for establishing and maintaining adequate internal control over financial reporting as defined under Rules 13a-15(e) and 15d-15(e) of the Exchange Act. The Company’s internal control system is a process designed to provide reasonable assurance regarding the preparation and fair presentation of published financial statements in accordance with GAAP. All internal control systems, no matter how well designed, have inherent limitations and can only provide reasonable assurance with respect to financial reporting.
As of the end of the period covered by this report, management of the Company, under the supervision and with the participation of the Chief Executive Officer and Chief Financial Officer, carried out an evaluation of the effectiveness of the design and operation of the Company’s disclosure controls and procedures. Based upon, and as of the date of that evaluation, the Chief Executive Officer and Chief Financial Officer concluded that the Company’s disclosure controls and procedures were effective, in ensuring the information relating to the Company (and its consolidated subsidiaries) required to be disclosed by the Company in the reports it files or submits under the Exchange Act was recorded, summarized and reported in a timely manner.
Changes in Internal Control Over Financial Reporting
There has been no change in our internal control over financial reporting (as such term is defined in Rules 13a-15(f) and 15d-15(f) under the Exchange Act) during the last fiscal quarter of the fiscal year for which this Annual Report on Form 10-K is filed that has materially affected, or is reasonably likely to materially affect, our internal control over financial reporting.
Report on Management’s Assessment of Internal Control Over Financial Reporting
This Annual Report on Form 10-K does not include a report of management’s assessment regarding internal control over financial reporting or an attestation report of the company’s registered public accounting firm due to a transition period established by rules of the Securities and Exchange Commission for newly public companies.
None
104
Table of Contents
Part III
Item 10: Directors, Executive Officer and Corporate Governance
The information required by this item will be contained in our Proxy Statement for the 2016 Annual Meeting of Stockholders to be held in April 2016, a copy of which will be filed not later than 120 days after the close of the fiscal year, and is incorporated herein by reference.
Our board of directors has adopted a Code of Business Conduct and Ethics that applies to all of our employees, officers and directors, including our Chief Executive Officer, Chief Financial Officer and other executive officers. The full text of our Code of Business Conduct and Ethics is posted on the investor relations page of our website which is located at http://investor.equitybank.com. We will post any amendments to our code of business conduct and ethics, or waivers of its requirements, on our website.
Item 11: Executive Compensation
The information required by this item will be contained in our Proxy Statement for the 2016 Annual Meeting of Stockholders to be held in April 2016, a copy of which will be filed not later than 120 days after the close of the fiscal year, and is incorporated herein by reference.
Item 12: Security Ownership of Certain Beneficial Owners and Management and Related Stockholder Matters
The information required by this item will be contained in our Proxy Statement for the 2016 Annual Meeting of Stockholders to be held in April 2016, a copy of which will be filed not later than 120 days after the close of the fiscal year, and is incorporated herein by reference.
Information relating to securities authorized for issuance under our equity compensation plans is included in Part II of this Annual Report on Form 10-K under “Item 5 – Market for Registrant’s Common Equity, Related Shareholder Matters and Issuer Purchases of Equity Securities.”
Item 13: Certain Relationships and Related Transactions, and Director Independence
The information required by this item will be contained in our Proxy Statement for the 2016 Annual Meeting of Stockholders to be held in April 2016, a copy of which will be filed not later than 120 days after the close of the fiscal year, and is incorporated herein by reference.
Item 14: Principal Accounting Fees and Services
The information required by this item will be contained in our Proxy Statement for the 2016 Annual Meeting of Stockholders to be held in April 2016, a copy of which will be filed not later than 120 days after the close of the fiscal year, and is incorporated herein by reference.
105
Table of Contents
Part IV
Item 15: Exhibits, Financial Statement Schedules
| a) | The following documents are filed as part of this Annual Report on Form 10-K: |
| 1. | Financial Statements |
The financial statements included as part of this Form 10-K are identified in the index to the Audited Financial Statements appearing in Item 8 of this Form 10-K and which index is incorporated in this Item 15 by reference.
| 2. | Financial Statement Schedules |
All supplemental schedules are omitted as inapplicable or because the required information is included in the Consolidated Financial Statements or notes thereto.
| 3. | Exhibits |
The information required by this Item 15(a)(3) is set forth in the Exhibit Index immediately following our signature pages. The exhibits listed herein will be furnished upon written request to Equity Bancshares, Inc., 7701 East Kellogg Drive, Suite 200, Wichita, Kansas 67207, Attention: Investor Relations, and payment of a reasonable fee that will be limited to our reasonable expense in furnishing such exhibits.
| b) | Exhibits |
The exhibits listed in Item 15(a)(3) are incorporated by reference or attached hereto.
| c) | Excluded Financial Statements |
Not Applicable
106
Table of Contents
SIGNATURES
Pursuant to the requirements of Section 13 or 15(d) of the Securities Exchange Act of 1934, the registrant has duly caused this report to be signed on its behalf by the undersigned, thereunto duly authorized.
| EQUITY BANCSHARES, INC. | ||
| By: | /s/ Brad S. Elliott | |
| Name: | Brad S. Elliott | |
| Title: | Chairman and Chief Executive Officer | |
| Date: | March 17, 2016 | |
POWER OF ATTORNEY
Each person whose signature appears below appoints Brad S. Elliott and Gregory H. Kossover, and each of them, any of whom may act without the joinder of the other, as his true and lawful attorneys-in-fact and agents, with full power of substitution and resubstitution, for him and in his name, place and stead, in any and all capacities, to sign any and all amendments to this Annual Report on Form 10-K, and to file the same, with all exhibits thereto, and all other documents in connection therewith, with the Securities and Exchange Commission, granting unto said attorneys-in-fact and agents full power and authority to do and perform each and every act and thing requisite and necessary to be done, as fully to all intents and purposes as he might or would do in person, hereby ratifying and confirming all that said attorneys-in-fact and agents or any of them or their or his substitute or substitutes, may lawfully do or cause to be done by virtue hereof.
Pursuant to the requirements of the Securities Exchange Act of 1934, this report has been signed below by the following persons on behalf of the registrant and in the capacities and on the dates indicated.
| Signature |
Title |
Date | ||
| /s/ Brad S. Elliott Brad S. Elliott |
Chairman and Chief Executive Officer (Principal Executive Officer) |
March 17, 2016 | ||
| /s/ Gregory H. Kossover Gregory H. Kossover |
Director, Executive Vice President and Chief Financial Officer (Principal Financial Officer and Principal Accounting Officer) | March 17, 2016 | ||
| /s/ Gary C. Allerheiligen Gary C. Allerheiligen |
Director | March 17, 2016 | ||
| /s/ James L. Berglund James L. Berglund |
Director | March 17, 2016 | ||
| /s/ Jeff A. Bloomer Jeff A. Bloomer |
Director | March 17, 2016 | ||
| /s/ Roger A. Buller Roger A. Buller |
Director | March 17, 2016 | ||
107
Table of Contents
| Signature |
Title |
Date | ||
| /s/ Michael R. Downing Michael R. Downing |
Director | March 17, 2016 | ||
| /s/ P. John Eck P. John Eck |
Director | March 17, 2016 | ||
| /s/ Gregory L. Gaeddert Gregory L. Gaeddert |
Director | March 17, 2016 | ||
| /s/ Wayne K. Goldstein Wayne K. Goldstein |
Director | March 17, 2016 | ||
| /s/ Michael B. High Michael B. High |
Director | March 17, 2016 | ||
| /s/ Randee R. Koger Randee R. Koger |
Director | March 17, 2016 | ||
| /s/ David B. Moore David B. Moore |
Director | March 17, 2016 | ||
| /s/ Shawn D. Penner Shawn D. Penner |
Director | March 17, 2016 | ||
| /s/ Harvey R. Sorensen Harvey R. Sorensen |
Director | March 17, 2016 | ||
108
Table of Contents
EQUITY BANCSHARES, INC.
INDEX TO EXHIBITS
| Exhibit No. |
Description | |
| 3.1 | Amended and Restated Articles of Incorporation of Equity Bancshares, Inc., as amended (incorporated by reference to Exhibit 3.1 to Equity Bancshares, Inc.’s Registration Statement on Form S-1, filed with the SEC on October 9, 2015, File No. 333-207351). | |
| 3.2 | Amended and Restated Bylaws of Equity Bancshares, Inc. (incorporated by reference to Exhibit 3.2 to Equity Bancshares, Inc.’s Registration Statement on Form S-1, filed with the SEC on October 9, 2015, File No. 333-207351). | |
| 4.1 | Specimen Class A Common Stock Certificate (incorporated by reference to Exhibit 4.1 to Equity Bancshares, Inc.’s Amendment No. 1 to Registration Statement on Form S-1, filed with the SEC on October 27, 2015, File No. 333-207351). | |
| 10.1† | Equity Bancshares, Inc. 2006 Non-Qualified Stock Option Plan, as amended (incorporated by reference to Exhibit 10.1 to Equity Bancshares, Inc.’s Amendment No. 1 to Registration Statement on Form S-1, filed with the SEC on October 27, 2015, File No. 333-207351). | |
| 10.2† | Equity Bancshares, Inc. 2013 Stock Incentive Plan, as amended, and form of stock option agreement (incorporated by reference to Exhibit 10.2 to Equity Bancshares, Inc.’s Amendment No. 1 to Registration Statement on Form S-1, filed with the SEC on October 27, 2015, File No. 333-207351). | |
| 10.3† | Form of Indemnification Agreement (incorporated by reference to Exhibit 10.3 to Equity Bancshares, Inc.’s Registration Statement on Form S-1, filed with the SEC on October 9, 2015, File No. 333-207351). | |
| 10.4† | Amended and Restated Employment Agreement, dated October 10, 2014, between Equity Bank, Equity Bancshares, Inc. and Brad S. Elliott (incorporated by reference to Exhibit 10.4 to Equity Bancshares, Inc.’s Registration Statement on Form S-1, filed with the SEC on October 9, 2015, File No. 333-207351). | |
| 10.5† | Amended and Restated Employment Agreement, dated December 15, 2014, among Equity Bank, Equity Bancshares, Inc. and Gregory H. Kossover (incorporated by reference to Exhibit 10.5 to Equity Bancshares, Inc.’s Registration Statement on Form S-1, filed with the SEC on October 9, 2015, File No. 333-207351). | |
| 10.6† | Amended and Restated Employment Agreement, dated December 15, 2014, among Equity Bank, Equity Bancshares, Inc. and Sam S. Pepper, Jr. (incorporated by reference to Exhibit 10.6 to Equity Bancshares, Inc.’s Registration Statement on Form S-1, filed with the SEC on October 9, 2015, File No. 333-207351). | |
| 10.7 | Loan and Security Agreement, dated January 28, 2016, between Equity Bancshares, Inc. and ServisFirst Bank (incorporated by reference to Exhibit 10.1 to Equity Bancshares, Inc.’s Current Report on Form 8-K, filed with the SEC on February 03, 2016). | |
| 10.8 | Amended and Restated Registration Rights Agreement, dated November 16, 2015, by and between Equity Bancshares, Inc., Patriot Financial Partners, L.P., Patriot Financial Partners Parallel, L.P., Endicott Opportunity Partners III, L.P., Compass Island Investment Opportunities Fund A, L.P. and Compass Island Investment Opportunities Fund C, L.P. (incorporated by reference to Exhibit 10.1 to Equity Bancshares, Inc.’s Current Report on Form 8-K, filed with the SEC on November 19, 2015). | |
| 10.9 | Stock Purchase Agreement, dated October 7, 2010, among Equity Bancshares, Inc., Belfer Investment Partners, L.P. and LIME Partners LLC, as amended (incorporated by reference to Exhibit 10.8 to Equity Bancshares, Inc.’s Registration Statement on Form S-1, filed with the SEC on October 9, 2015, File No. 333-207351). | |
Table of Contents
| Exhibit No. |
Description | |
| 10.10 | Stock Purchase Agreement, dated May 15, 2012, among Equity Bancshares, Inc., Belfer Investment Partners, L.P. and LIME Partners LLC (incorporated by reference to Exhibit 10.9 to Equity Bancshares, Inc.’s Registration Statement on Form S-1, filed with the SEC on October 9, 2015, File No. 333-207351). | |
| 10.11 | Registration Rights Agreement, dated October 7, 2010, among Equity Bancshares, Inc., Belfer Investment Partners, L.P. and LIME Partners LLC (incorporated by reference to Exhibit 10.10 to Equity Bancshares, Inc.’s Registration Statement on Form S-1, filed with the SEC on October 9, 2015, File No. 333-207351). | |
| 10.12 | Management Rights Agreement, dated October 7, 2010, among Equity Bancshares, Inc., Belfer Investment Partners, L.P. and LIME Partners LLC (incorporated by reference to Exhibit 10.11 to Equity Bancshares, Inc.’s Registration Statement on Form S-1, filed with the SEC on October 9, 2015, File No. 333-207351). | |
| 10.13 | Stock Purchase Agreement, dated May 15, 2012, among Equity Bancshares, Inc., Compass Island Investment Opportunities Fund A, L.P. and Compass Island Investment Opportunities Fund C, L.P. (incorporated by reference to Exhibit 10.12 to Equity Bancshares, Inc.’s Registration Statement on Form S-1, filed with the SEC on October 9, 2015, File No. 333-207351). | |
| 10.14 | Stock Purchase Agreement, dated October 13, 2010, between Equity Bancshares, Inc. and Endicott Opportunity Partners III, L.P. (incorporated by reference to Exhibit 10.14 to Equity Bancshares, Inc.’s Registration Statement on Form S-1, filed with the SEC on October 9, 2015, File No. 333-207351). | |
| 10.15 | Stock Purchase Agreement, dated May 15, 2012, between Equity Bancshares, Inc. and Endicott Opportunity Partners III, L.P. (incorporated by reference to Exhibit 10.15 to Equity Bancshares, Inc.’s Registration Statement on Form S-1, filed with the SEC on October 9, 2015, File No. 333-207351). | |
| 10.16 | Management Rights Agreement, dated October 13, 2010, between Equity Bancshares, Inc. and Endicott Opportunity Partners III, L.P. (incorporated by reference to Exhibit 10.17 to Equity Bancshares, Inc.’s Registration Statement on Form S-1, filed with the SEC on October 9, 2015, File No. 333-207351). | |
| 10.17 | Stock Purchase Agreement, dated October 13, 2010, among GEMS Fund, L.P. and GC Partners International LTD (incorporated by reference to Exhibit 10.18 to Equity Bancshares, Inc.’s Registration Statement on Form S-1, filed with the SEC on October 9, 2015, File No. 333-207351). | |
| 10.18 | Registration Rights Agreement, dated October 13, 2010, among GEMS Fund, L.P. and GC Partners International LTD (incorporated by reference to Exhibit 10.19 to Equity Bancshares, Inc.’s Registration Statement on Form S-1, filed with the SEC on October 9, 2015, File No. 333-207351). | |
| 10.19 | Management Rights Agreement, dated October 13, 2010, among GEMS Fund, L.P. and GC Partners International LTD (incorporated by reference to Exhibit 10.20 to Equity Bancshares, Inc.’s Registration Statement on Form S-1, filed with the SEC on October 9, 2015, File No. 333-207351). | |
| 10.20 | Stock Purchase Agreement, dated September 30, 2010, among Equity Bancshares, Inc., Patriot Financial Partners, L.P. and Patriot Financial Partners Parallel, L.P., as amended (incorporated by reference to Exhibit 10.21 to Equity Bancshares, Inc.’s Registration Statement on Form S-1, filed with the SEC on October 9, 2015, File No. 333-207351). | |
| 10.21 | Stock Purchase Agreement, dated May 15, 2012, among Equity Bancshares, Inc., Patriot Financial Partners, L.P. and Patriot Financial Partners Parallel, L.P. (incorporated by reference to Exhibit 10.22 to Equity Bancshares, Inc.’s Registration Statement on Form S-1, filed with the SEC on October 9, 2015, File No. 333-207351). | |
Table of Contents
| Exhibit No. |
Description | |
| 10.22 | Management Rights Agreement, dated September 30, 2010, among Equity Bancshares, Inc., Patriot Financial Partners, L.P. and Patriot Financial Partners Parallel, L.P. (incorporated by reference to Exhibit 10.24 to Equity Bancshares, Inc.’s Registration Statement on Form S-1, filed with the SEC on October 9, 2015, File No. 333-207351). | |
| 10.23† | Form of Market President Incentive Plan (incorporated by reference to Exhibit 10.28 to Equity Bancshares, Inc.’s Registration Statement on Form S-1, filed with the SEC on October 9, 2015, File No. 333-207351). | |
| 21.1* | List of Subsidiaries of Equity Bancshares, Inc. | |
| 23.1* | Consent of Crowe Chizek LLP | |
| 24.1 | Powers of Attorney (included on signature page). | |
| 31.1* | Certification of Chief Executive Officer pursuant to Rule 13a-14(a) of the Exchange Act, as adopted pursuant to Section 302 of the Sarbanes-Oxley Act of 2002. | |
| 31.2* | Certification of Chief Financial Officer pursuant to Rule 13a-14(a) of the Exchange Act as adopted pursuant to Section 302 of the Sarbanes-Oxley Act of 2002. | |
| 32.1** | Certification of Chief Executive Officer pursuant to 18 U.S.C. Section 1350, as adopted pursuant to Section 906 of the Sarbanes-Oxley Act of 2002. | |
| 32.2** | Certification of Chief Financial Officer pursuant to 18 U.S.C. Section 1350, as adopted pursuant to Section 906 of the Sarbanes-Oxley Act of 2002. | |
| 101.INS* | XBRL Instance Document. | |
| 101.SCH* | XBRL Taxonomy Extension Schema Document. | |
| 101.CAL* | XBRL Taxonomy Extension Calculation Linkbase Document. | |
| 101.DEF* | XBRL Taxonomy Extension Definition Linkbase Document. | |
| 101.LAB* | XBRL Taxonomy Extension Label Linkbase Document. | |
| 101.PRE* | XBRL Taxonomy Extension Presentation Linkbase Document. | |
| * | Filed herewith. |
| ** | These exhibits are furnished herewith and shall not be deemed “filed” for purposes of Section 18 of the Exchange Act, or otherwise subject to the liability of that section, and shall not be deemed to be incorporated by reference into any filing under the Securities Act or the Exchange Act. |
| † | Represents a management contract or a compensatory plan or arrangement. |
Table of Contents

REPORT OF INDEPENDENT REGISTERED PUBLIC ACCOUNTING FIRM
Board of Directors
Equity Bancshares, Inc.
Wichita, Kansas
We have audited the accompanying consolidated balance sheets of Equity Bancshares, Inc. (the “Company”) as of December 31, 2015 and 2014, and the related consolidated statements of income, comprehensive income, stockholders’ equity, and cash flows for each of the three years in the period ended December 31, 2015. These consolidated financial statements are the responsibility of the Company’s management. Our responsibility is to express an opinion on these consolidated financial statements based on our audits.
We conducted our audits in accordance with the standards of the Public Company Accounting Oversight Board (United States). Those standards require that we plan and perform the audit to obtain reasonable assurance about whether the financial statements are free of material misstatement. The Company is not required to have, nor were we engaged to perform, an audit of its internal control over financial reporting. Our audit included consideration of internal control over financial reporting as a basis for designing audit procedures that are appropriate in the circumstances, but not for the purpose of expressing an opinion on the effectiveness of the Company’s internal control over financial reporting. Accordingly, we express no such opinion. An audit includes examining, on a test basis, evidence supporting the amounts and disclosures in the financial statements. An audit also includes assessing the accounting principles used and significant estimates made by management, as well as evaluating the overall financial statement presentation. We believe that our audits provide a reasonable basis for our opinion.
In our opinion, the consolidated financial statements referred to above present fairly, in all material respects, the consolidated financial position of the Company as of December 31, 2015 and 2014, and the results of its operations and its cash flows for each of the three years in the period ended December 31, 2015, in conformity with U.S. generally accepted accounting principles.
| /s/ Crowe Chizek LLP |
| Crowe Chizek LLP |
Oak Brook, Illinois
March 17, 2016
F-1
Table of Contents
EQUITY BANCSHARES, INC.
December 31, 2015 and 2014
(Dollar amounts in thousands, except per share data)
| 2015 | 2014 | |||||||
| ASSETS |
||||||||
| Cash and due from banks |
$ | 36,276 | $ | 31,193 | ||||
| Federal funds sold |
20,553 | 514 | ||||||
|
|
|
|
|
|||||
| Cash and cash equivalents |
56,829 | 31,707 | ||||||
| Interest-bearing time deposits in other banks |
5,245 | 5,995 | ||||||
| Available-for-sale securities |
130,810 | 52,985 | ||||||
| Held-to-maturity securities, fair value of $312,802 and $265,189 |
310,539 | 261,017 | ||||||
| Loans held for sale |
3,504 | 897 | ||||||
| Loans, net of allowance for loan losses of $5,506 and $5,963 |
954,849 | 719,913 | ||||||
| Other real estate owned, net |
5,811 | 4,754 | ||||||
| Premises and equipment, net |
39,147 | 33,946 | ||||||
| Bank owned life insurance |
32,555 | 28,729 | ||||||
| Federal Reserve Bank and Federal Home Loan Bank stock |
11,013 | 4,312 | ||||||
| Interest receivable |
4,540 | 3,592 | ||||||
| Goodwill |
18,130 | 18,130 | ||||||
| Core deposit intangible, net |
1,549 | 1,107 | ||||||
| Other |
11,206 | 7,431 | ||||||
|
|
|
|
|
|||||
| Total assets |
$ | 1,585,727 | $ | 1,174,515 | ||||
|
|
|
|
|
|||||
| LIABILITIES AND STOCKHOLDERS’ EQUITY |
||||||||
| Deposits |
||||||||
| Demand |
$ | 157,834 | $ | 128,919 | ||||
|
|
|
|
|
|||||
| Total non-interest-bearing deposits |
157,834 | 128,919 | ||||||
|
|
|
|
|
|||||
| Savings, NOW, and money market |
619,468 | 510,098 | ||||||
| Time |
438,612 | 342,160 | ||||||
|
|
|
|
|
|||||
| Total interest-bearing deposits |
1,058,080 | 852,258 | ||||||
|
|
|
|
|
|||||
| Total deposits |
1,215,914 | 981,177 | ||||||
| Federal funds purchased and retail repurchase agreements |
20,762 | 25,301 | ||||||
| Federal Home Loan Bank advances |
145,439 | 20,976 | ||||||
| Bank stock loan |
18,612 | 15,152 | ||||||
| Subordinated debentures |
9,251 | 8,941 | ||||||
| Contractual obligations |
3,093 | 3,146 | ||||||
| Interest payable and other liabilities |
5,423 | 2,093 | ||||||
|
|
|
|
|
|||||
| Total liabilities |
1,418,494 | 1,056,786 | ||||||
| Commitments and contingent liabilities, see Notes 22 and 23 |
||||||||
| Stockholders’ equity, see Note 14 |
||||||||
| Preferred stock, Series C (liquidation preference of $16,372) |
16,372 | 16,359 | ||||||
| Common stock |
97 | 76 | ||||||
| Additional paid-in capital |
138,077 | 98,398 | ||||||
| Retained earnings |
34,955 | 24,832 | ||||||
| Accumulated other comprehensive loss |
(2,371 | ) | (2,281 | ) | ||||
| Employee stock loans |
(242 | ) | — | |||||
| Treasury stock |
(19,655 | ) | (19,655 | ) | ||||
|
|
|
|
|
|||||
| Total stockholders’ equity |
167,233 | 117,729 | ||||||
|
|
|
|
|
|||||
| Total liabilities and stockholders’ equity |
$ | 1,585,727 | $ | 1,174,515 | ||||
|
|
|
|
|
|||||
See accompanying notes to consolidated financial statements.
F-2
Table of Contents
EQUITY BANCSHARES, INC.
CONSOLIDATED STATEMENTS OF INCOME
Years ended December 31, 2015, 2014 and 2013
(Dollar amounts in thousands, except per share data)
| 2015 | 2014 | 2013 | ||||||||||
| Interest and dividend income |
||||||||||||
| Loans, including fees |
$ | 43,361 | $ | 38,406 | $ | 39,396 | ||||||
| Securities, taxable |
7,634 | 7,204 | 6,294 | |||||||||
| Securities, nontaxable |
1,057 | 839 | 828 | |||||||||
| Federal funds sold and other |
976 | 345 | 327 | |||||||||
|
|
|
|
|
|
|
|||||||
| Total interest and dividend income |
53,028 | 46,794 | 46,845 | |||||||||
| Interest expense |
||||||||||||
| Deposits |
4,926 | 4,084 | 4,382 | |||||||||
| Federal funds purchased and retail repurchase agreements |
61 | 75 | 92 | |||||||||
| Federal Home Loan Bank advances |
495 | 345 | 494 | |||||||||
| Bank stock loan |
641 | 295 | — | |||||||||
| Subordinated debentures |
643 | 634 | 642 | |||||||||
|
|
|
|
|
|
|
|||||||
| Total interest expense |
6,766 | 5,433 | 5,610 | |||||||||
| Net interest income |
46,262 | 41,361 | 41,235 | |||||||||
| Provision for loan losses |
3,047 | 1,200 | 2,583 | |||||||||
|
|
|
|
|
|
|
|||||||
| Net interest income after provision for loan losses |
43,215 | 40,161 | 38,652 | |||||||||
| Non-interest income |
||||||||||||
| Service charges and fees |
2,708 | 2,737 | 3,063 | |||||||||
| Debit card income |
2,161 | 1,462 | 1,336 | |||||||||
| Mortgage banking |
1,088 | 894 | 701 | |||||||||
| Increase in value of bank owned life insurance |
957 | 960 | 953 | |||||||||
| Net gain on acquisition |
682 | — | — | |||||||||
| Net gains on sales of and settlement of securities |
756 | 986 | 500 | |||||||||
| Other |
1,450 | 1,635 | 1,339 | |||||||||
|
|
|
|
|
|
|
|||||||
| Total non-interest income |
9,802 | 8,674 | 7,892 | |||||||||
| Non-interest expense |
||||||||||||
| Salaries and employee benefits |
19,202 | 19,621 | 17,776 | |||||||||
| Net occupancy and equipment |
4,155 | 4,536 | 4,572 | |||||||||
| Data processing |
2,939 | 2,530 | 2,437 | |||||||||
| Professional fees |
2,086 | 2,279 | 1,811 | |||||||||
| Advertising and business development |
1,199 | 1,057 | 952 | |||||||||
| Telecommunications |
811 | 755 | 793 | |||||||||
| FDIC insurance |
840 | 727 | 922 | |||||||||
| Courier and postage |
544 | 562 | 552 | |||||||||
| Amortization of core deposit intangible |
275 | 363 | 487 | |||||||||
| Loan expense |
388 | 327 | 366 | |||||||||
| Other real estate owned |
287 | 21 | 1,125 | |||||||||
| Loss on debt extinguishment |
316 | — | — | |||||||||
| Merger expenses |
1,691 | — | — | |||||||||
| Other |
3,842 | 2,867 | 3,344 | |||||||||
|
|
|
|
|
|
|
|||||||
| Total non-interest expense |
38,575 | 35,645 | 35,137 | |||||||||
|
|
|
|
|
|
|
|||||||
| Income before income tax |
14,442 | 13,190 | 11,407 | |||||||||
| Provision for income taxes |
4,142 | 4,203 | 3,534 | |||||||||
|
|
|
|
|
|
|
|||||||
| Net income |
10,300 | 8,987 | 7,873 | |||||||||
| Dividends and discount accretion on preferred stock |
(177 | ) | (708 | ) | (978 | ) | ||||||
|
|
|
|
|
|
|
|||||||
| Net income allocable to common stockholders |
$ | 10,123 | $ | 8,279 | $ | 6,895 | ||||||
|
|
|
|
|
|
|
|||||||
| Basic earnings per share |
$ | 1.55 | $ | 1.31 | $ | 0.93 | ||||||
|
|
|
|
|
|
|
|||||||
| Diluted earnings per share |
$ | 1.54 | $ | 1.30 | $ | 0.92 | ||||||
|
|
|
|
|
|
|
|||||||
See accompanying notes to consolidated financial statements.
F-3
Table of Contents
EQUITY BANCSHARES, INC.
CONSOLIDATED STATEMENTS OF COMPREHENSIVE INCOME
Years ended December 31, 2015, 2014 and 2013
(Dollar amounts in thousands, except per share data)
| 2015 | 2014 | 2013 | ||||||||||
| Net income |
$ | 10,300 | $ | 8,987 | $ | 7,873 | ||||||
| Other comprehensive income: |
||||||||||||
| Unrealized holding gains (losses) arising during the period on available-for-sale securities |
(544 | ) | 663 | (7,589 | ) | |||||||
| Amortization of unrealized losses on held-to-maturity securities |
767 | 703 | (68 | ) | ||||||||
| Reclassification adjustment for net gains included in net income |
(370 | ) | (986 | ) | (500 | ) | ||||||
|
|
|
|
|
|
|
|||||||
| Total other comprehensive income (loss) |
(147 | ) | 380 | (8,157 | ) | |||||||
| Tax effect |
57 | (55 | ) | 2,993 | ||||||||
|
|
|
|
|
|
|
|||||||
| Other comprehensive income (loss), net of tax |
(90 | ) | 325 | (5,164 | ) | |||||||
|
|
|
|
|
|
|
|||||||
| Comprehensive income |
$ | 10,210 | $ | 9,312 | $ | 2,709 | ||||||
|
|
|
|
|
|
|
|||||||
See accompanying notes to consolidated financial statements.
F-4
Table of Contents
EQUITY BANCSHARES, INC.
CONSOLIDATED STATEMENTS OF STOCKHOLDERS’ EQUITY
Years ended December 31, 2015, 2014 and 2013
(Dollar amounts in thousands, except per share data)
| Preferred Stock | Common Stock | |||||||||||||||||||||||||||||||||||||||
| Series A & B | Series C | Shares Outstanding |
Amount | Additional Paid-In Capital |
Retained Earnings |
Accumulated Other Comprehensive Income (loss) |
Treasury Stock |
Employee Stock Loans |
Total Stockholders’ Equity |
|||||||||||||||||||||||||||||||
| Balance at January 1, 2013 |
$ | 15,540 | $ | 16,344 | 7,431,513 | $ | 76 | $ | 95,856 | $ | 9,658 | $ | 2,558 | $ | (1,863 | ) | $ | — | $ | 138,169 | ||||||||||||||||||||
| Net income |
— | — | — | — | — | 7,873 | — | — | — | 7,873 | ||||||||||||||||||||||||||||||
| Other comprehensive income, net of tax effects |
— | — | — | — | — | — | (5,164 | ) | — | — | (5,164 | ) | ||||||||||||||||||||||||||||
| Accretion of discount on preferred stock |
— | 8 | — | — | — | (8 | ) | — | — | — | — | |||||||||||||||||||||||||||||
| Stock based compensation, see Note 19 |
— | — | — | — | 536 | — | — | — | — | 536 | ||||||||||||||||||||||||||||||
| Purchases of common stock for treasury |
— | — | (45,910 | ) | — | — | — | — | (571 | ) | — | (571 | ) | |||||||||||||||||||||||||||
| Cash dividends declared and accrued on preferred stock |
— | — | — | — | — | (970 | ) | — | — | — | (970 | ) | ||||||||||||||||||||||||||||
|
|
|
|
|
|
|
|
|
|
|
|
|
|
|
|
|
|
|
|
|
|||||||||||||||||||||
| Balance at December 31, 2013 |
$ | 15,540 | $ | 16,352 | 7,385,603 | $ | 76 | $ | 96,392 | $ | 16,553 | $ | (2,606 | ) | $ | (2,434 | ) | $ | — | $ | 139,873 | |||||||||||||||||||
|
|
|
|
|
|
|
|
|
|
|
|
|
|
|
|
|
|
|
|
|
|||||||||||||||||||||
| Net income |
— | — | — | — | — | 8,987 | — | — | — | 8,987 | ||||||||||||||||||||||||||||||
| Other comprehensive income, net of tax effects |
— | — | — | — | — | — | 325 | — | — | 325 | ||||||||||||||||||||||||||||||
| Accretion of discount on preferred stock |
— | 7 | — | — | — | (7 | ) | — | — | — | — | |||||||||||||||||||||||||||||
| Retirement of preferred stock |
(15,540 | ) | — | — | — | — | — | — | — | — | (15,540 | ) | ||||||||||||||||||||||||||||
| Stock based compensation, see Note 19 |
— | — | 2,568 | — | 2,006 | — | — | — | — | 2,006 | ||||||||||||||||||||||||||||||
| Purchases of common stock for treasury |
— | — | (1,320,660 | ) | — | — | — | — | (17,221 | ) | — | (17,221 | ) | |||||||||||||||||||||||||||
| Cash dividends declared and accrued on preferred stock |
— | — | — | — | — | (701 | ) | — | — | — | (701 | ) | ||||||||||||||||||||||||||||
|
|
|
|
|
|
|
|
|
|
|
|
|
|
|
|
|
|
|
|
|
|||||||||||||||||||||
| Balance at December 31, 2014 |
$ | — | $ | 16,359 | 6,067,511 | $ | 76 | $ | 98,398 | $ | 24,832 | $ | (2,281 | ) | $ | (19,655 | ) | $ | — | $ | 117,729 | |||||||||||||||||||
|
|
|
|
|
|
|
|
|
|
|
|
|
|
|
|
|
|
|
|
|
|||||||||||||||||||||
| Net income |
— | — | — | — | — | 10,300 | — | — | — | 10,300 | ||||||||||||||||||||||||||||||
| Other comprehensive income, net of tax effects |
— | — | — | — | — | — | (90 | ) | — | — | (90 | ) | ||||||||||||||||||||||||||||
| Accretion of discount on preferred stock |
— | 13 | — | — | — | (13 | ) | — | — | — | — | |||||||||||||||||||||||||||||
| Stock based compensation, see Note 19 |
— | — | — | — | 531 | — | — | — | — | 531 | ||||||||||||||||||||||||||||||
| Common stock issued upon termination of restricted stock unit plan, net of employee stock loans |
— | — | 203,216 | 2 | 222 | — | — | — | (1,215 | ) | (991 | ) | ||||||||||||||||||||||||||||
| Repayments on employee stock loans |
— | — | — | — | — | — | — | — | 973 | 973 | ||||||||||||||||||||||||||||||
| Common stock issued in initial public offering, net of issuance expenses of $4,728 |
— | — | 1,941,000 | 19 | 38,926 | — | — | — | — | 38,945 | ||||||||||||||||||||||||||||||
| Cash dividends declared and accrued on preferred stock |
— | — | — | — | — | (164 | ) | — | — | — | (164 | ) | ||||||||||||||||||||||||||||
|
|
|
|
|
|
|
|
|
|
|
|
|
|
|
|
|
|
|
|
|
|||||||||||||||||||||
| Balance at December 31, 2015 |
$ | — | $ | 16,372 | 8,211,727 | $ | 97 | $ | 138,077 | $ | 34,955 | $ | (2,371 | ) | $ | (19,655 | ) | $ | (242 | ) | $ | 167,233 | ||||||||||||||||||
|
|
|
|
|
|
|
|
|
|
|
|
|
|
|
|
|
|
|
|
|
|||||||||||||||||||||
See accompanying notes to consolidated financial statements.
F-5
Table of Contents
EQUITY BANCSHARES, INC.
CONSOLIDATED STATEMENTS OF CASH FLOWS
For the Years ended December 31, 2015, 2014 and 2013
(Dollar amounts in thousands, except per share data)
| 2015 | 2014 | 2013 | ||||||||||
| Cash flows from operating activities |
||||||||||||
| Net income |
$ | 10,300 | $ | 8,987 | $ | 7,873 | ||||||
| Adjustments to reconcile net income to net cash from operating activities: |
||||||||||||
| Stock based compensation |
531 | 2,006 | 536 | |||||||||
| Depreciation |
1,672 | 1,499 | 1,411 | |||||||||
| Valuation allowance on buildings held for sale |
— | — | 269 | |||||||||
| Provision for loan losses |
3,047 | 1,200 | 2,583 | |||||||||
| Net accretion of purchase valuation adjustments |
(380 | ) | (123 | ) | (1,100 | ) | ||||||
| Amortization (accretion) of premiums and discounts on securities |
2,309 | 1,268 | (1,296 | ) | ||||||||
| Amortization of core deposits intangible |
275 | 363 | 487 | |||||||||
| Deferred income taxes |
2,427 | 963 | 2,648 | |||||||||
| FHLB stock dividends |
(407 | ) | (43 | ) | (41 | ) | ||||||
| Loss (gain) on sales and valuation adjustments on other real estate owned |
(44 | ) | (376 | ) | 484 | |||||||
| Net loss (gain) on sales of and settlements of securities |
(756 | ) | (986 | ) | (500 | ) | ||||||
| Loss (gain) on disposal of premise and equipment |
11 | (36 | ) | (16 | ) | |||||||
| Loss (gain) on sales of buildings held for sale |
— | (112 | ) | 67 | ||||||||
| Loss (gain) on sales of branches |
— | 20 | — | |||||||||
| Loss (gain) on sales of loans |
(903 | ) | (717 | ) | (481 | ) | ||||||
| Originations of loans held for sale |
(41,407 | ) | (31,845 | ) | (22,400 | ) | ||||||
| Proceeds from the sale of loans held for sale |
39,703 | 32,012 | 24,786 | |||||||||
| Increase in the value of bank owned life insurance |
(957 | ) | (960 | ) | (953 | ) | ||||||
| Change in fair value of derivatives recognized in earnings |
13 | 33 | (22 | ) | ||||||||
| Gain on acquisition |
(682 | ) | — | — | ||||||||
| Net change in: |
||||||||||||
| Interest receivable |
(751 | ) | 176 | 463 | ||||||||
| Other assets |
(2,551 | ) | 3,361 | 3,334 | ||||||||
| Interest payable and other liabilities |
2,170 | (3,015 | ) | (2,049 | ) | |||||||
|
|
|
|
|
|
|
|||||||
| Net cash provided by operating activities |
13,620 | 13,675 | 16,083 | |||||||||
| Cash flows (to) from investing activities |
||||||||||||
| Purchases of available-for-sale securities |
(108,997 | ) | (30,266 | ) | (128,127 | ) | ||||||
| Purchases of held-to-maturity securities |
(97,103 | ) | (15,343 | ) | (44,239 | ) | ||||||
| Proceeds from sales, calls, pay-downs, and maturities of available-for-sale securities |
60,088 | 46,638 | 35,313 | |||||||||
| Proceeds from calls, pay-downs and maturities of held-to-maturity securities |
46,322 | 35,208 | 35,187 | |||||||||
| Net change in interest-bearing time deposits in other banks |
750 | (2,000 | ) | (1,250 | ) | |||||||
| Net change in loans |
(150,625 | ) | (68,566 | ) | 57,662 | |||||||
| Purchase of premises and equipment |
(5,736 | ) | (4,676 | ) | (1,837 | ) | ||||||
| Proceeds from sale of premises and equipment |
15 | 1,054 | 226 | |||||||||
| Proceeds from sale of buildings held for sale |
— | 749 | 809 | |||||||||
| Net redemptions (purchases) of FHLB and FRB stock |
(4,875 | ) | (19 | ) | 343 | |||||||
| Proceeds from sale of other real estate owned |
2,266 | 4,368 | 4,487 | |||||||||
| Purchase of bank owned life insurance |
— | — | (4,000 | ) | ||||||||
| Redemption of bank owned life insurance |
— | 30 | 184 | |||||||||
| Net cash transferred in branch sale |
— | (13,755 | ) | — | ||||||||
| Net cash paid for acquisition of First Independence |
(9,046 | ) | — | — | ||||||||
|
|
|
|
|
|
|
|||||||
| Net cash (used in) investing activities |
(266,941 | ) | (46,578 | ) | (45,242 | ) | ||||||
F-6
Table of Contents
| 2015 | 2014 | 2013 | ||||||||||
| Cash flows (to) from financing activities |
||||||||||||
| Net increase (decrease) in deposits |
147,952 | 51,850 | (42,971 | ) | ||||||||
| Net change in federal funds purchased and retail repurchase agreements |
(4,539 | ) | (149 | ) | 3,380 | |||||||
| Net borrowings (repayments) on Federal Home Loan Bank line of credit |
128,895 | 16,544 | — | |||||||||
| Principal repayments on Federal Home Loan Bank term advances |
(36,035 | ) | (4,852 | ) | (8,602 | ) | ||||||
| Borrowings on bank stock loan |
5,014 | 15,540 | — | |||||||||
| Principal repayments on bank stock loan |
(1,554 | ) | (388 | ) | — | |||||||
| Proceeds from issuance of common stock, net |
38,945 | — | — | |||||||||
| Issuance of employee stock loan |
(1,215 | ) | — | — | ||||||||
| Principal payments on employee stock loan |
973 | — | — | |||||||||
| Redemption of Series A and Series B preferred stock |
— | (15,540 | ) | — | ||||||||
| Purchase of treasury stock |
— | (17,221 | ) | (571 | ) | |||||||
| Net change in contractual obligations |
(53 | ) | (990 | ) | (858 | ) | ||||||
| Dividends paid on preferred stock |
(164 | ) | (804 | ) | (970 | ) | ||||||
| Excess tax benefits as a result of the distribution of common stock in termination of the restricted stock unit plan recognized as an increase in additional paid-in capital |
224 | — | — | |||||||||
|
|
|
|
|
|
|
|||||||
| Net cash provided by (used in) financing activities |
278,443 | 43,990 | (50,592 | ) | ||||||||
|
|
|
|
|
|
|
|||||||
| Net change in cash and cash equivalents |
25,122 | 11,087 | (79,751 | ) | ||||||||
| Cash and cash equivalents, beginning of period |
31,707 | 20,620 | 100,371 | |||||||||
|
|
|
|
|
|
|
|||||||
| Ending cash and cash equivalents |
$ | 56,829 | $ | 31,707 | $ | 20,620 | ||||||
|
|
|
|
|
|
|
|||||||
| Supplemental cash flow information: |
||||||||||||
| Interest paid |
$ | 6,670 | $ | 6,294 | $ | 9,422 | ||||||
| Income taxes paid, net of refunds |
2,938 | 1,623 | — | |||||||||
| Supplemental noncash disclosures: |
||||||||||||
| Other real estate owned acquired in settlement of loans |
3,164 | 1,414 | 2,721 | |||||||||
| Reclassification of assets to held for sale |
— | — | 11 | |||||||||
| Fair value of securities transferred from available-for-sale to held-to-maturity |
— | — | 239,592 | |||||||||
| Fair value of securities transferred from held-to-maturity to available-for-sale |
— | 6,188 | — | |||||||||
| Investment in tax credits (included in other assets) through issuance of committed funding (included in contractual obligations) |
— | — | 2,475 | |||||||||
| Preferred stock dividends payable at period end |
41 | 41 | 144 | |||||||||
| Deposits transferred in branch sale |
— | 17,014 | — | |||||||||
| Premises and equipment transferred in branch sale |
— | 3,085 | — | |||||||||
| Total fair value of assets acquired in purchase of First Independence, net of cash |
129,341 | — | — | |||||||||
| Total fair value of liabilities acquired in purchase of First Independence |
119,613 | — | — | |||||||||
See accompanying notes to consolidated financial statements.
F-7
Table of Contents
EQUITY BANCSHARES, INC.
NOTES TO CONSOLIDATED FINANCIAL STATEMENTS
December 31, 2015, 2014 and 2013
(Dollar amounts in thousands, except per share data)
NOTE 1 – NATURE OF OPERATIONS AND SUMMARY OF SIGNIFICANT ACCOUNTING POLICIES
Nature of Operations: Equity Bancshares, Inc. is a bank holding company, whose principal activity is the ownership and management of its wholly owned subsidiary, Equity Bank (“Equity Bank”). SA Holdings, Inc. is a wholly owned subsidiary of Equity Bank and was established for the purpose of holding and selling other real estate owned. These entities are collectively referred to as the (“Company”). All significant intercompany accounts and transactions have been eliminated in consolidation.
Equity Bank is a Kansas state-chartered bank and member of the Federal Reserve (state Fed member bank, jointly supervised by both the Federal Reserve Bank of Kansas City and the Office of the Kansas State Bank Commissioner).
The Company is primarily engaged in providing a full range of banking, mortgage banking, and financial services to individual and corporate customers in Kansas and Missouri. Equity Bank competes with a variety of other financial institutions including large regional banks, community banks and thrifts as well as credit unions and other non-traditional lenders.
Use of Estimates: To prepare financial statements in conformity with U.S. generally accepted accounting principles, management makes estimates and assumptions based on available information. These estimates and assumptions affect the amounts reported in the financial statements and the disclosures provided, and actual results could differ.
Cash Equivalents: Cash and cash equivalents include cash, deposits with other financial institutions with original maturities less than 90 days, and federal funds sold. Net cash flows are reported for customer loan and deposit transactions, interest-bearing deposits in other financial institutions, federal funds purchased, retail repurchase agreements, Federal Home Loan Bank advances, and contractual obligations.
Securities: Securities are classified as held-to-maturity when management has the positive intent and ability to hold them to maturity. Securities are classified as available-for-sale when they might be sold before maturity. Held-to-maturity securities are carried at amortized cost while securities available-for-sale are carried at fair value, with unrealized holding gains and losses reported in other comprehensive income, net of tax.
Interest income includes amortization of purchase premium or discount. Premiums and discounts on securities are amortized on the level-yield method without anticipating prepayments, except for certain securities where prepayments are anticipated. Gains and losses on sales are recorded on the trade date and determined using the specific identification method.
Management evaluates securities for other-than-temporary impairment (“OTTI”) on at least a quarterly basis, and more frequently when economic or market conditions warrant such an evaluation. For securities in an unrealized loss position, management considers the extent and duration of the unrealized loss and the financial condition and near-term prospects of the issuer. Management also assesses whether it intends to sell, or it is more likely than not that it will be required to sell, a security in an unrealized loss position before recovery of its amortized cost basis. If either of the criteria regarding intent or requirement to sell is met, the entire difference between amortized cost and fair value is recognized as impairment through earnings. For debt securities that do not meet the aforementioned criteria, the amount of impairment is split into two components as follows: 1) OTTI related to credit loss, which must be recognized in the income statement and 2) OTTI related to other factors,
F-8
Table of Contents
which is recognized in other comprehensive income. The credit loss is defined as the difference between the present value of the cash flows expected to be collected and the amortized cost basis. All OTTI related to equity securities is recognized through earnings.
Loans Held for Sale: Mortgage loans originated and intended for sale in the secondary market are carried at the lower of aggregate cost or fair value. Net unrealized losses, if any, are recorded as a valuation allowance and charged to earnings. Mortgage loans held for sale are sold with servicing rights released. Gains or losses on held for sale loans are recognized upon completion of the sale and based on the difference between the net sales proceeds and carrying value of the sold loan.
Loans: Loans that management has the intent and ability to hold for the foreseeable future or until maturity or payoff are reported at the principal balance outstanding, net of previous charge-offs and an allowance for loan losses, and for purchased loans, net of unamortized purchase premiums and discounts. Interest income is accrued on the unpaid principal balance.
Purchased Credit Impaired Loans. As a part of acquisitions, the Company acquired certain loans, for which there was, at acquisition, evidence of deterioration of credit quality since origination. These purchased credit impaired loans were recorded at the amount paid, such that there is no carryover of the seller’s allowance for loan losses. After acquisition, losses are recognized by an increase in the allowance for loan losses. Such purchase credit impaired loans are accounted for individually. The Company estimates the amount and timing of expected cash flows for each loan, and the expected cash flows in excess of the amount paid are recorded as interest income over the remaining life of the loan (accretable yield). The excess of the loan’s contractual principal and interest over expected cash flows is not recorded (non-accretable difference). Over the life of the loan, expected cash flows continue to be estimated. If the present value of the expected cash flows is less than the carrying amount, a loss is recorded. If the present value of the expected cash flows is greater than the carrying amount, it is recognized as part of future interest income.
Nonaccrual Loans. Generally, loans are designated as nonaccrual when either principal or interest payments are 90 days or more past due based on contractual terms unless the loan is well secured and in the process of collection. Consumer loans are typically charged off no later than 180 days past due. In all cases, loans are placed on nonaccrual or charged off at an earlier date if collection of principal or interest is considered doubtful. When a loan is placed on nonaccrual status, unpaid interest credited to income is reversed against income. Future interest income may be recorded on a cash basis after recovery of principal is reasonably assured. Nonaccrual loans are returned to accrual status when all the principal and interest amounts contractually due are brought current and future payments are reasonably assured.
Impaired Loans. A loan is considered impaired when, based on current information and events, it is probable that the Company will be unable to collect all contractual principal and interest due according to the terms of the loan agreement. All loans are individually evaluated for impairment. Impaired loans are measured based on the present value of expected future cash flows discounted at the loan’s effective interest rate or on the value of the underlying collateral if the loan is collateral dependent. The Company evaluates the collectability of both principal and interest when assessing the need for a loss accrual.
Factors considered by management in determining impairment include payment status, collateral value, and the probability of collecting scheduled principal and interest payments when due. Loans that experience insignificant payment delays and payment shortfalls generally are not classified as impaired. Management determines the significance of payment delays and payment shortfalls on a case-by-case basis, taking into consideration all of the circumstances surrounding the loan and the borrower, including the length of the delay, the reasons for the delay, the borrower’s prior payment record, and the amount of the shortfall in relation to the principal and interest owed.
Troubled Debt Restructurings. In cases where a borrower experiences financial difficulties and the Company makes certain concessionary modifications to contractual terms, the loan is classified as a troubled debt
F-9
Table of Contents
restructured loan and classified as impaired. Generally, a nonaccrual loan that is a troubled debt restructuring remains on nonaccrual until such time that repayment of the remaining principal and interest is not in doubt, and the borrower has a period of satisfactory repayment performance.
Allowance for Loan Losses: The allowance for loan losses is a valuation allowance for probable incurred credit losses. Loan losses are charged against the allowance when management believes the collectability of a loan balance is unlikely. Subsequent recoveries, if any, are credited to the allowance. Management estimates the allowance balance required using past loan loss experience, the nature and volume of the portfolio, information about specific borrower situations and estimated collateral values, economic conditions, and other factors. A loan review process, independent of the loan approval process, is utilized by management to verify loans are being made and administered in accordance with Company policy, to review loan risk grades and potential losses, to verify that potential problem loans are receiving adequate and timely corrective measures to avoid or reduce losses, and to assist in the verification of the adequacy of the loan loss reserve. Allocations of the allowance may be made for specific loans, but the entire allowance is available for any loan that, in management’s judgment, should be charged off.
The allowance consists of specific and general components. The specific component relates to loans that are individually classified as impaired. If a loan is impaired, a portion of the allowance is allocated so that the loan is reported net at the present value of estimated future cash flows using the loan’s existing rate or at the fair value of collateral if repayment is expected solely from the sale of the collateral. Troubled debt restructurings are separately identified for impairment disclosures and are measured at the present value of estimated future cash flows using the loan’s effective rate at inception. If a troubled debt restructuring is considered to be a collateral dependent loan, the loan is reported, net, at the fair value of the collateral. For troubled debt restructurings that subsequently default, the Company determines the amount of reserve in accordance with the accounting policy for the allowance for loan losses.
The general component of the allowance for loan losses covers non-impaired loans and is based on historical loss experience adjusted for current factors. The historical loss experience is determined by portfolio and class and is based on the actual loss history experienced by the Company. This actual loss experience is then adjusted by comparing current conditions to the conditions that existed during the loss history. The Company considers the changes related to (i) lending policies, (ii) economic conditions, (iii) nature and volume of the loan portfolio and class, (iv) lending staff, (v) volume and severity of past due, non-accrual, and risk graded loans, (vi) loan review system, (vii) value of underlying collateral for collateral dependent loans, (viii) concentration levels, and (ix) effects of other external factors.
The Company considers loan performance and collateral values in assessing risk for each class in the loan portfolio, as follows:
| • | Commercial and industrial loans are dependent on the strength of the industries of the related borrowers and the success of their businesses. Commercial and industrial loans are advanced for equipment purchases, to provide working capital, or meet other financing needs of the business. These loans may be secured by accounts receivable, inventory, equipment, or other business assets. Financial information is obtained from the borrower to evaluate the debt service coverage and ability to repay the loans. |
| • | Commercial real estate loans are dependent on the industries tied to these loans as well as the local commercial real estate market. The loans are secured by real estate, and typically appraisals are obtained to support the loan amount. Generally, an evaluation of the project’s cash flows is performed to evaluate the borrower’s ability to repay the loan at the time of origination and periodically updated during the life of the loan. |
| • | Residential real estate loans are affected by the local residential real estate market, the local economy, and movement in interest rates. The Company evaluates the borrower’s repayment ability through a review of credit reports and debt to income ratios. Generally, appraisals are obtained to support the loan amount. |
F-10
Table of Contents
| • | Agricultural real estate loans are real estate loans related to farmland, and are affected by the value of farmland. Generally, the Company evaluates the borrower’s ability to repay based on cash flows from farming operations. |
| • | Consumer loans are dependent on the local economy. Consumer loans are generally secured by consumer assets, but may be unsecured. Typically, the Company evaluates the borrower’s repayment ability through a review of credit scores and an evaluation of debt to income ratios. |
| • | Agricultural loans are primary operating lines subject to annual farming revenues including productivity and yield of the farm products and market pricing at the time of sale. |
There have been no material changes to the Company’s accounting policies related to its allowance for loan loss methodology during 2015 and 2014.
Transfers of Financial Assets: Transfers of financial assets are accounted for as sales when control over the assets has been relinquished. Control over transferred assets is deemed to be surrendered when the assets have been isolated from the Company, the transferee obtains the right (free of conditions that constrain it from taking advantage of that right) to pledge or exchange the transferred assets, and the Company does not maintain effective control over the transferred assets through an agreement to repurchase them before their maturity.
Bank Owned Life Insurance: The Company maintains insurance policies on certain key executives as well as policies from acquired institutions. Bank owned life insurance is recorded at the amount that can be realized under the insurance contract at the balance sheet date, which is the cash surrender value adjusted for other charges or other amounts due that are probable at settlement. In some cases, the Company has entered into agreements with the insured which would require it to make one-time payments to the insured’s beneficiaries if certain conditions exist at the time of death.
Other Real Estate Owned: Assets acquired through or instead of loan foreclosure are initially recorded at fair value less estimated cost to sell when acquired, establishing a new cost basis. Generally, collateral properties are recorded as other real estate owned when the Company takes physical possession. Physical possession of residential real estate collateral occurs when legal title is obtained upon completion of foreclosure or when the borrower conveys all interest in the property to satisfy the loan through completion of a deed in lieu of foreclosure or through a similar legal agreement. Other real estate owned properties are subsequently accounted for at the lower of cost or fair value less estimated costs to sell. If fair value declines subsequent to foreclosure a valuation allowance is recorded through expense. Operating costs after acquisition are expensed.
Premises and Equipment: Land is carried at cost. Premises and equipment are carried at cost less accumulated depreciation. Depreciation is an estimate and is charged to expense using the straight-line method over the estimated useful lives of the respective assets. The useful lives of buildings and related components are estimated to be 39 years. The useful lives of furniture, fixtures and equipment are estimated to be 4 to 7 years. Leasehold improvements are capitalized and depreciated using the straight-line method over the terms of the respective leases or the estimated useful lives of the improvements, whichever is shorter. Buildings held for sale are carried at the lower of cost or fair value.
Premises and equipment and other long-term assets are reviewed for impairment when events indicate their carrying amount may not be recoverable from future undiscounted cash flows. If impaired, the assets are recorded at fair value.
Federal Reserve Bank and Federal Home Loan Bank Stock: Federal Reserve Bank (“FRB”) and Federal Home Loan Bank (“FHLB”) stocks are required investments for institutions that are members of the FRB and FHLB systems. FRB and FHLB stocks are carried at cost, considered restricted securities, and are periodically evaluated for impairment based on the ultimate recovery of par value. Both cash and stock dividends are reported as income.
F-11
Table of Contents
Goodwill and Core Deposit Intangibles: Goodwill results from business acquisitions and represents the excess of the purchase price over the fair value of acquired tangible assets and liabilities and identifiable intangible assets. Core deposit intangibles are acquired customer relationships arising from whole bank and branch acquisitions. Core deposit intangibles are initially measured at fair value and then are amortized over their estimated useful lives using an accelerated method. The useful lives of the core deposits are estimated to generally be between seven and ten years. Goodwill and core deposit intangibles are assessed at least annually for impairment and any such impairment is recognized and expensed in the period identified. The Company has selected December 31 as the date to perform its annual goodwill impairment test. Goodwill is the only intangible asset with an indefinite useful life.
Credit Related Financial Instruments: Credit related financial instruments include off-balance-sheet credit instruments, such as commitments to make loans and commercial letters of credit, issued to meet customer financing needs. The face amount for these items represents the exposure to loss, before considering customer collateral or ability to repay. Such financial instruments are recorded when they are funded.
Derivatives: The Company is exposed to interest-rate risk primarily from the effect of interest rate changes on its interest-earning assets and its sources of funding these assets. The Company will periodically enter into interest rate swaps or interest rate caps/floors to manage certain interest rate risk exposure.
An interest rate swap is an agreement between two entities to exchange cash flows in the future. The agreement sets the dates on which the cash flows will be paid and the manner in which the cash flows will be calculated. Typically, an interest rate swap transaction is used as an exchange of cash flows based on a fixed rate for cash flows based on a variable rate.
In an interest rate cap agreement, a cash flow is generated if the price or interest rate of an underlying variable rises above a certain threshold price or interest rate. In an interest rate floor agreement, a cash flow is generated if the price or interest rate of an underlying variable falls below a certain threshold price or interest rate. Caps and floors are designed as protection against the interest rate on a variable rate asset or liability rising above or falling below a certain level.
At the inception of a derivative contract, the Company designates the derivatives as one of three types based on the Company’s intentions and belief as to likely effectiveness as a hedge. These three types are (1) a hedge of the fair value of a recognized asset or liability or of an unrecognized firm commitment (“fair value hedge”), (2) a hedge of a forecasted transaction or the variability of cash flows to be received or paid related to a recognized asset or liability (“cash flow hedge”), or (3) an instrument with no hedging designation (“stand-alone derivative”). For a fair value hedge, the gain or loss on the derivative, as well as the offsetting loss or gain on the hedged item, are recognized in current earnings as fair value changes. For a cash flow hedge, the gain or loss on the derivative is reported in other comprehensive income and is reclassified into earnings in the same periods during which the hedged transaction affects earnings. For both types of hedges, changes in the fair value of derivatives that are not highly effective in hedging the changes in fair value or expected cash flows of the hedged item are recognized immediately in current earnings. Changes in the fair value of derivatives that do not qualify for hedge accounting are reported currently in earnings, as non-interest income.
Net cash settlements on derivatives that qualify for hedge accounting are recorded in interest income or interest expense, based on the item being hedged. Net cash settlements on derivatives that do not qualify for hedge accounting are reported in non-interest income. Cash flows on hedges are classified in the cash flow statement the same as the cash flows of the items being hedged unless the derivative meets the criteria to be a financing derivative. All derivatives are recognized in the consolidated balance sheet at their fair values and are reported as either derivative assets or derivative liabilities net of accrued net settlements and collateral, if any. The individual derivative amounts are netted by counterparty when the netting requirements have been met. If these netted values are positive, they are classified as an asset and, if negative, they are classified as a liability.
F-12
Table of Contents
The Company formally documents the relationship between derivatives and hedged items, as well as the risk-management objective and the strategy for undertaking hedge transactions at the inception of the hedging relationship. This documentation includes linking fair value or cash flow hedges to specific assets and liabilities on the balance sheet or to specific firm commitments or forecasted transactions. The Company also formally assesses, both at the hedge’s inception and on an ongoing basis (at least quarterly), whether the derivative instruments that are used are highly effective in offsetting changes in fair values or cash flows of the hedged items. The Company discontinues hedge accounting when it determines that the derivative is no longer effective in offsetting changes in the fair value or cash flows of the hedged item, the derivative is settled or terminates, a hedged forecasted transaction is no longer probable, a hedged firm commitment is no longer firm, or treatment of the derivative as a hedge is no longer appropriate or intended.
When hedge accounting is discontinued, subsequent changes in fair value of the derivative are recorded as non-interest income. When a fair value hedge is discontinued, the hedged asset or liability is no longer adjusted for changes in fair value and the existing basis adjustment is amortized or accreted over the remaining life of the asset or liability. When a cash flow hedge is discontinued but the hedged cash flows or forecasted transactions are still expected to occur, gains or losses that are accumulated in other comprehensive income are amortized into earnings over the same periods which the hedged transactions will effect earnings.
The Company has entered into interest rate cap derivatives to assist with interest rate risk management. These derivatives are not designated as hedging instruments but rather as stand-alone derivatives. The fair values of stand-alone derivatives are included in other assets and other liabilities. Changes in fair value of stand-alone derivatives are recorded through earnings as non-interest income.
Income Taxes: Income tax expense is the total of the current year income tax due or refundable and the change in deferred tax assets and liabilities. Deferred tax assets and liabilities are the expected future tax amounts for the temporary differences between carrying amounts and tax bases of assets and liabilities, computed using enacted tax rates. A valuation allowance, if needed, reduces deferred tax assets to the amount expected to be realized. A tax position is recognized as a benefit only if it is “more likely than not” that the tax position will be sustained in a tax examination, with a tax examination being presumed to occur. The amount recognized is the largest amount of tax benefit that is more likely than not to be realized on examination. The Company does not expect the total amount of unrecognized tax benefits to materially change in the next twelve months.
The Company recognizes interest and/or penalties related to income tax matters in income tax expense. No such interest or penalties were incurred in 2015, 2014 or 2013.
Earnings Per Common Share: Net income, less dividends and discount accretion on preferred stock, equals net income allocable to common stockholders. Basic earnings per common share is net income allocable to common stockholders divided by the weighted average number of common shares and vested restricted stock units outstanding during the period. Diluted earnings per common share include the dilutive effect of additional potential common shares of unexercised stock options and unvested restricted stock units.
Share-Based Payments: The Company has share-based payments, which are described more fully in a subsequent note. Compensation expense associated with the stock option plan is based on the fair value of the options at the grant date. This compensation is expensed over the periods during which the options vest. Options vest based on the passage of time or the achievement of performance targets, depending on the structure of the related grant.
Compensation expense associated with restricted stock units is based on the fair value of the units at the grant date. This compensation expense is recognized ratably over the service period stipulated in the grant agreement.
Comprehensive Income: Comprehensive income consists of net income and other comprehensive income. Other comprehensive income includes unrealized gains and losses on securities available-for-sale and the amortization of unrealized gains and losses on securities transferred to held-to-maturity from available-for-sale.
F-13
Table of Contents
Loss Contingencies: Loss contingencies, including claims and legal actions arising in the ordinary course of business, are recorded as liabilities when the likelihood of loss is probable and an amount or range of loss can be reasonably estimated. Additional discussion of loss contingencies at December 31, 2015 is presented in a subsequent note.
Restrictions on Cash: Cash on hand or on deposit with the Federal Reserve Bank was required to meet regulatory reserve and clearing requirements. The regulatory reserve and clearing requirements required at both December 31, 2015 and 2014 was $25.
Dividend Restriction: Banking regulations require maintaining certain capital levels and may limit the dividends paid by the wholly owned subsidiaries to the holding company or by the holding company to stockholders.
Fair Value: Fair values of financial instruments, impaired loans, other real estate owned, and buildings held for sale are estimated using relevant market information and other assumptions, as more fully disclosed in a separate note. Fair value estimates involve uncertainties and matters of significant judgment regarding interest rates, credit risk, prepayments, collateral values and other factors, especially in the absence of broad markets for particular items. Changes in assumptions or in market conditions could materially affect the estimates.
Segment Information: As a community-oriented financial institution, substantially all of the Company’s operations involve the delivery of loan and deposit products to customers. Management makes operating decisions and assesses performance based on an ongoing review of these banking operations, which constitute the Company’s only operating segment for financial reporting purposes.
Reclassifications: Some items in the prior year financial statements were reclassified to conform to the current presentation. Management determined the items reclassified are immaterial to the consolidated financial statements taken as a whole and did not result in a change in equity or net income for years ended December 31, 2015, 2014 and 2013.
Initial Public Offering (IPO): On November 16, 2015, the Company completed an IPO of 2,231,000 shares of Class A common stock, $0.01 par value. The Company sold 1,941,000 shares and selling stockholders sold 290,000 shares, which included 273,000 shares of Class A common stock that were issued upon the automatic conversion of an equal number of shares of Class B common stock as a result of the offering. All of the shares issued and sold in the initial public offering were registered under the Securities Act pursuant to a Registration Statement on Form S-1, which was declared effective by the Securities and Exchange Commission (SEC) on November 10, 2015. The Company is an “emerging growth company” as defined in the Jumpstart Our Business Startups Act of 2012 (JOBS Act). Pursuant to the JOBS Act, an emerging growth company is provided the option to adopt new or revised accounting standards that may be issued by the Financial Accounting Standards Board (FASB) or the SEC either (i) within the same periods as those other wise applicable to non-emerging growth companies or (ii) within the same time periods as private companies. The Company has irrevocably elected to adopt new accounting standards within the public company adoption period.
Recent Accounting Pronouncements: In May 2014, the Financial Accounting Standards Board (FASB) issued Accounting Standards Update (ASU) 2014-09, Revenue from Contracts with Customers, which amended existing guidance related to revenue from contracts with customers. This amendment supersedes and replaces nearly all existing revenue recognition guidance, including industry-specific guidance, establishes a new control-based revenue recognition model, changes the basis for deciding when revenue is recognized over time or at a point in time, provides new and more detailed guidance on specific topics and expands and improves disclosures about revenue. In addition, this amendment specifies the accounting for some costs to obtain or fulfill a contract with a customer. These amendments are effective for annual reporting periods beginning after December 15, 2017, including interim periods within that reporting period. Early application is permitted only as of annual
F-14
Table of Contents
reporting periods beginning after December 15, 2016, including interim reporting periods within that period. The amendments should be applied retrospectively to all periods presented or retrospectively with the cumulative effect recognized at the date of initial application. The Company is currently evaluating the impact of this new accounting standard on the consolidated financial statements.
In September 2015, FASB issued ASU 2015-16, Business Combinations-Simplifying the Accounting for Measurement-Period Adjustments, which amends how the change in provisional amounts are accounted for during the measurement period following a business combination. These amendments require that recognized adjustments to provisional amounts that are identified during the measurement period be recognized during the period the adjustments are determined. In addition, disclosure is required of the amount recorded in current-period earnings by financial statement line item that would have been recorded in previous reporting periods if the adjustment to the provisional amounts had been recognized as of the acquisition date. The guidance is effective for fiscal years beginning after December 31, 2015, including interim periods within those fiscal years. The amendments should be applied prospectively with earlier application permitted for financial statements that have not been issued. The Company does not expect the implementation to have a significant impact on the consolidated financial statements.
In January 2016, FASB issued ASU 2016-01, Recognition and Measurement of Financial Assets and Financial Liabilities, which addresses certain aspects of recognition, measurement, presentation, and disclosure of financial instruments. The main provisions of the update are to eliminate the available-for-sale classification of accounting for equity securities and to adjust fair value disclosures for financial instruments carried at amortized costs such that the disclosed fair values represent an exit price as opposed to an entry price. The amendments are effective for fiscal years beginning after December 15, 2017, including interim periods within those years. Generally, early adoption of the amendments in this update is not permitted. An entity should apply the amendments by means of a cumulative-effect adjustment to the balance sheet as of the beginning of the fiscal year of adoption. The Company is currently evaluating the impact of this new accounting standard on the consolidated financial statements.
In February 2016, FASB issued ASU 2016-02, Leases, with the intention of improving financial reporting about leasing transactions. The ASU requires all lessees to recognize lease assets and lease liabilities on the balance sheet. Lessor accounting is largely unchanged by the ASU, however disclosures about the amount, timing, and uncertainty of cash flows arising from leases are required of both lessees and lessors. The ASU is effective for fiscal years, and interim periods within those fiscal years, beginning after December 15, 2018. Lessees and lessors are required to recognize and measure leases at the beginning of the earliest period presented using a modified retrospective approach. The modified retrospective approach provides for optional practical expedients when applying the ASU to leases that commenced before the effective date of the ASU. The Company is currently evaluating the impact of this new accounting standard on the consolidated financial statements.
NOTE 2 – BUSINESS COMBINATION AND BRANCH SALES
Business Combination:
On October 9, 2015, the Company acquired 100% of the outstanding common shares of First Independence Corporation and its subsidiary, First Federal Savings & Loan of Independence, based in Independence, Kansas, collectively referred to as “First Independence”. Results of operations of First Independence were included in the Company’s results of operations beginning October 10, 2015. Acquisition-related costs of $1,691 are included in merger expenses in the Company’s income statement for the year ended December 31, 2015.
F-15
Table of Contents
All information necessary to recognize the fair value of assets acquired and liabilities assumed has been received. The recognized amounts of the identifiable net assets acquired, including deferred tax assets associated with NOL and tax credit carryforwards, exceeded the cash consideration exchanged resulting in a gain on acquisition of $682. The acquisition was an expansion into southeast Kansas with the addition of four branch locations, and the Company believes it will be able to achieve cost savings by integrating the two companies and combining accounting, data processing and other administrative costs. The following table summarizes the consideration paid for First Independence and the amounts of the assets acquired and liabilities assumed recognized at the acquisition date:
| Fair value of consideration: |
||||
| Cash |
$ | 14,741 | ||
|
|
|
|||
| Recognized amounts of identifiable assets acquired and liabilities assumed: |
||||
| Cash and due from banks |
$ | 5,695 | ||
| Available-for-sale securities |
29,355 | |||
| Federal Reserve Bank and Federal Home Loan Bank stock |
1,419 | |||
| Loans |
89,901 | |||
| Premises and equipment |
1,163 | |||
| Core deposit intangible |
717 | |||
| Other real estate owned |
115 | |||
| Deferred tax asset, net |
2,535 | |||
| Interest receivable |
197 | |||
| Other assets |
3,939 | |||
|
|
|
|||
| Total assets acquired |
135,036 | |||
|
|
|
|||
| Deposits |
87,096 | |||
| Federal Home Loan Bank advances |
31,603 | |||
| Interest payable and other liabilities |
914 | |||
|
|
|
|||
| Total liabilities assumed |
119,613 | |||
|
|
|
|||
| Total identifiable net assets |
15,423 | |||
|
|
|
|||
| Gain on acquisition |
(682 | ) | ||
|
|
|
|||
| $ | 14,741 | |||
|
|
|
The fair value of net assets acquired includes fair value adjustments to certain loans that were not considered impaired as of the acquisition date. The fair value adjustments were determined using discounted contractual cash flows. However, the Company believes that all contractual cash flows related to these financial instruments will be collected. As such, these loans were not considered impaired at the acquisition date and were not subject to the guidance relating to purchased credit impaired loans, which have shown evidence of credit deterioration since origination.
The following table presents additional information about the loans acquired in the First Independence acquisition as of the date of acquisition:
| Non-Credit Impaired |
Purchase Credit Impaired |
|||||||
| Contractually required principal |
$ | 88,848 | $ | 2,146 | ||||
| Non-accretable difference (expected losses) |
— | (506 | ) | |||||
|
|
|
|
|
|||||
| Cash flows expected to be collected |
88,848 | 1,640 | ||||||
| Accretable yield |
(587 | ) | — | |||||
|
|
|
|
|
|||||
| Fair value of acquired loans |
$ | 88,261 | $ | 1,640 | ||||
|
|
|
|
|
|||||
F-16
Table of Contents
The following table presents the carrying value of the loans acquired in the First Independence acquisition by class, as of the date of acquisition:
| Non-Credit Impaired |
Purchased Credit Impaired |
Total | ||||||||||
| Commercial real estate |
$ | 12,300 | $ | 718 | $ | 13,018 | ||||||
| Commercial and industrial |
425 | — | 425 | |||||||||
| Residential real estate |
70,368 | 891 | 71,259 | |||||||||
| Agricultural real estate |
— | — | — | |||||||||
| Consumer |
4,994 | 31 | 5,025 | |||||||||
| Agricultural |
174 | — | 174 | |||||||||
|
|
|
|
|
|
|
|||||||
| Fair value of acquired loans |
$ | 88,261 | $ | 1,640 | $ | 89,901 | ||||||
|
|
|
|
|
|
|
|||||||
In connection with the acquisition of First Independence, the Company acquired servicing rights related to $6,317 of residential real estate loans. Residential real estate loans serviced for others are not reported as assets. These loans were sold by First Independence with servicing rights retained and with limited recourse. The Company recorded a mortgage servicing asset of $29 in other assets and a reserve for losses of $77 in other liabilities in conjunction with these serviced residential real estate loans.
The acquisition is not significant to the overall income of the Company; therefore, no pro forma information has been included. The operations of First Independence were merged into the Company as of the date of the acquisition. Separate revenue and earnings of the former First Independence are not available subsequent to the business combination.
Branch Sales:
On November 7, 2014, the Company sold two branches located in Spring Hill, Kansas and De Soto, Kansas to an unaffiliated institution. As a result of the sale of these branches, the Company transferred deposits, including accrued interest, of $17,014. Bank premises and equipment of $3,085 were sold at recorded value. A loss of $20 was recognized on the sale of these branches, and is included in other non-interest expense in the Company’s income statement for the year ended December 31, 2014.
F-17
Table of Contents
NOTE 3 – SECURITIES
The amortized cost and fair value of available-for-sale securities and the related gross unrealized gains and losses recognized in accumulated other comprehensive income were as follows:
| Amortized Cost |
Gross Unrealized Gains |
Gross Unrealized Losses |
Fair Value | |||||||||||||
| December 31, 2015 |
||||||||||||||||
| Available-for-sale securities |
||||||||||||||||
| U.S. government-sponsored entities |
$ | 17,090 | $ | 23 | $ | (77 | ) | $ | 17,036 | |||||||
| Residential mortgage-backed securities (issued by government-sponsored entities) |
109,784 | 234 | (497 | ) | 109,521 | |||||||||||
| Corporate |
3,000 | — | (46 | ) | 2,954 | |||||||||||
| Small Business Administration loan pools |
275 | 22 | — | 297 | ||||||||||||
| State and political subdivisions |
504 | 4 | — | 508 | ||||||||||||
| Equity securities |
500 | — | (6 | ) | 494 | |||||||||||
|
|
|
|
|
|
|
|
|
|||||||||
| $ | 131,153 | $ | 283 | $ | (626 | ) | $ | 130,810 | ||||||||
|
|
|
|
|
|
|
|
|
|||||||||
| December 31, 2014 |
||||||||||||||||
| Available-for-sale securities |
||||||||||||||||
| U.S. government-sponsored entities |
$ | 10,546 | $ | 16 | $ | (162 | ) | $ | 10,400 | |||||||
| Residential mortgage-backed securities (issued by government-sponsored entities) |
35,867 | 680 | (18 | ) | 36,529 | |||||||||||
| Corporate |
3,000 | 11 | — | 3,011 | ||||||||||||
| Small Business Administration loan pools |
332 | 24 | — | 356 | ||||||||||||
| State and political subdivisions |
2,169 | 24 | — | 2,193 | ||||||||||||
| Equity securities |
500 | — | (4 | ) | 496 | |||||||||||
|
|
|
|
|
|
|
|
|
|||||||||
| $ | 52,414 | $ | 755 | $ | (184 | ) | $ | 52,985 | ||||||||
|
|
|
|
|
|
|
|
|
|||||||||
The amortized cost and fair value of held-to-maturity securities and the related gross unrecognized gains and losses were as follows:
| Amortized Cost |
Gross Unrecognized Gains |
Gross Unrecognized Losses |
Fair Value | |||||||||||||
| December 31, 2015 |
||||||||||||||||
| Held-to-maturity securities |
||||||||||||||||
| U.S. Government-sponsored entities |
$ | 2,669 | $ | — | $ | (26 | ) | $ | 2,643 | |||||||
| Residential mortgage-backed securities (issued by government sponsored entities) |
230,554 | 1,208 | (769 | ) | 230,993 | |||||||||||
| Corporate |
12,983 | 135 | (360 | ) | 12,758 | |||||||||||
| Small Business Administration loan pools |
2,863 | 17 | (5 | ) | 2,875 | |||||||||||
| State and political subdivisions |
61,470 | 2,077 | (14 | ) | 63,533 | |||||||||||
|
|
|
|
|
|
|
|
|
|||||||||
| $ | 310,539 | $ | 3,437 | $ | (1,174 | ) | $ | 312,802 | ||||||||
|
|
|
|
|
|
|
|
|
|||||||||
| December 31, 2014 |
||||||||||||||||
| Held-to-maturity securities |
||||||||||||||||
| U.S. Government-sponsored entities |
$ | 2,800 | $ | 9 | $ | — | $ | 2,809 | ||||||||
| Residential mortgage-backed securities (issued by government sponsored entities) |
195,458 | 2,795 | (82 | ) | 198,171 | |||||||||||
| Corporate |
12,976 | 73 | (270 | ) | 12,779 | |||||||||||
| Small Business Administration loan pools |
3,220 | 14 | (10 | ) | 3,224 | |||||||||||
| State and political subdivisions |
46,563 | 1,663 | (20 | ) | 48,206 | |||||||||||
|
|
|
|
|
|
|
|
|
|||||||||
| $ | 261,017 | $ | 4,554 | $ | (382 | ) | $ | 265,189 | ||||||||
|
|
|
|
|
|
|
|
|
|||||||||
F-18
Table of Contents
The tables above present unrecognized losses on held-to-maturity securities since date of designation.
The fair value and amortized cost of debt securities at December 31, 2015, by contractual maturity, is shown below. Expected maturities will differ from contractual maturities because issuers may have the right to call or prepay obligations with or without call or prepayment penalties. Securities not due at a single maturity date, primarily mortgage-backed securities, are shown separately.
| Available-for-Sale | Held-to-Maturity | |||||||||||||||
| Amortized Cost |
Fair Value | Amortized Cost |
Fair Value | |||||||||||||
| Within one year |
$ | 100 | $ | 101 | $ | 3,741 | $ | 3,762 | ||||||||
| One to five years |
12,768 | 12,712 | 14,753 | 15,083 | ||||||||||||
| Five to ten years |
7,725 | 7,686 | 28,101 | 29,418 | ||||||||||||
| After ten years |
276 | 296 | 33,390 | 33,546 | ||||||||||||
| Mortgage-backed securities |
109,784 | 109,521 | 230,554 | 230,993 | ||||||||||||
|
|
|
|
|
|
|
|
|
|||||||||
| Total debt securities |
$ | 130,653 | $ | 130,316 | $ | 310,539 | $ | 312,802 | ||||||||
|
|
|
|
|
|
|
|
|
|||||||||
The carrying value of securities pledged as collateral, to secure public deposits and for other purposes, was approximately $368,926 at December 31, 2015 and $250,114 at December 31, 2014. At year-end 2015 and 2014, there were no holdings of securities of any one issuer, other than the U.S. Government and its agencies, in an amount greater than 10% of stockholders’ equity.
The following tables show gross unrealized losses and fair value, aggregated by investment category, and length of time that individual securities have been in a continuous unrealized loss position at December 31, 2015 and 2014:
| Less Than 12 Months | 12 Months or More | Total | ||||||||||||||||||||||
| Fair Value |
Unrealized Loss |
Fair Value |
Unrealized Loss |
Fair Value |
Unrealized Loss |
|||||||||||||||||||
| December 31, 2015 |
||||||||||||||||||||||||
| Available-for-sale securities |
||||||||||||||||||||||||
| U.S. Government-sponsored entities |
$ | 9,923 | $ | (77 | ) | $ | — | $ | — | $ | 9,923 | $ | (77 | ) | ||||||||||
| Residential mortgage-backed (issued by government-sponsored entities) |
89,235 | (497 | ) | — | — | 89,235 | (497 | ) | ||||||||||||||||
| Corporate |
2,954 | (46 | ) | — | — | 2,954 | (46 | ) | ||||||||||||||||
| Equity securities |
— | — | 494 | (6 | ) | 494 | (6 | ) | ||||||||||||||||
|
|
|
|
|
|
|
|
|
|
|
|
|
|||||||||||||
| Total temporarily impaired securities |
$ | 102,112 | $ | (620 | ) | $ | 494 | $ | (6 | ) | $ | 102,606 | $ | (626 | ) | |||||||||
|
|
|
|
|
|
|
|
|
|
|
|
|
|||||||||||||
| December 31, 2014 |
||||||||||||||||||||||||
| Available-for-sale securities |
||||||||||||||||||||||||
| U.S. Government-sponsored entities |
$ | 6,777 | $ | (162 | ) | $ | — | $ | — | $ | 6,777 | $ | (162 | ) | ||||||||||
| Residential mortgage-backed (issued by government-sponsored entities) |
2,499 | (18 | ) | — | — | 2,499 | (18 | ) | ||||||||||||||||
| Equity securities |
— | — | 496 | (4 | ) | 496 | (4 | ) | ||||||||||||||||
|
|
|
|
|
|
|
|
|
|
|
|
|
|||||||||||||
| Total temporarily impaired securities |
$ | 9,276 | $ | (180 | ) | $ | 496 | $ | (4 | ) | $ | 9,772 | $ | (184 | ) | |||||||||
|
|
|
|
|
|
|
|
|
|
|
|
|
|||||||||||||
F-19
Table of Contents
| Less Than 12 Months | 12 Months or More | Total | ||||||||||||||||||||||
| Fair Value |
Unrealized Loss |
Fair Value |
Unrealized Loss |
Fair Value |
Unrealized Loss |
|||||||||||||||||||
| December 31, 2015 |
||||||||||||||||||||||||
| Held-to-maturity securities |
||||||||||||||||||||||||
| U.S. Government-sponsored entities |
$ | 2,643 | $ | (26 | ) | $ | — | $ | — | $ | 2,643 | $ | (26 | ) | ||||||||||
| Residential mortgage-backed (issued by government-sponsored entities) |
99,181 | (1,077 | ) | 87,992 | (1,629 | ) | 187,173 | (2,706 | ) | |||||||||||||||
| Corporate |
5,505 | (12 | ) | 7,253 | (360 | ) | 12,758 | (372 | ) | |||||||||||||||
| Small Business Administration loan pools |
1,315 | (5 | ) | 1,560 | (40 | ) | 2,875 | (45 | ) | |||||||||||||||
| State and political subdivisions |
3,180 | (29 | ) | 6,300 | (77 | ) | 9,480 | (106 | ) | |||||||||||||||
|
|
|
|
|
|
|
|
|
|
|
|
|
|||||||||||||
| Total temporarily impaired securities |
$ | 111,824 | $ | (1,149 | ) | $ | 103,105 | $ | (2,106 | ) | $ | 214,929 | $ | (3,255 | ) | |||||||||
|
|
|
|
|
|
|
|
|
|
|
|
|
|||||||||||||
| December 31, 2014 |
||||||||||||||||||||||||
| Held-to-maturity securities |
||||||||||||||||||||||||
| Residential mortgage-backed (issued by government-sponsored entities) |
$ | 18,093 | $ | (30 | ) | $ | 121,617 | $ | (1,480 | ) | $ | 139,710 | $ | (1,510 | ) | |||||||||
| Corporate |
4,296 | (141 | ) | 8,483 | (231 | ) | 12,779 | (372 | ) | |||||||||||||||
| Small Business Administration loan pools |
— | — | 1,720 | (58 | ) | 1,720 | (58 | ) | ||||||||||||||||
| State and political subdivisions |
1,930 | (11 | ) | 15,160 | (351 | ) | 17,090 | (362 | ) | |||||||||||||||
|
|
|
|
|
|
|
|
|
|
|
|
|
|||||||||||||
| Total temporarily impaired securities |
$ | 24,319 | $ | (182 | ) | $ | 146,980 | $ | (2,120 | ) | $ | 171,299 | $ | (2,302 | ) | |||||||||
|
|
|
|
|
|
|
|
|
|
|
|
|
|||||||||||||
As of December 31, 2015, the Company held 24 available-for-sale securities and 101 held-to-maturity securities in an unrealized loss position. The tables above present unrealized losses on held-to-maturity securities since the date of the securities purchases, independent of the impact associated with changes in cost basis upon transfer from the available-for-sale designation to the held-to-maturity designation.
Unrealized losses on securities have not been recognized into income because the security issuers are of high credit quality, management does not intend to sell and it is more likely than not that the Company will not be required to sell the securities prior to their anticipated recovery, and the decline in fair value is largely due to changes in interest rates. The fair value is expected to recover as the securities approach maturity.
The proceeds from sales and the associated gains and losses on available-for-sale securities reclassified from other comprehensive income to income are listed below:
| 2015 | 2014 | 2013 | ||||||||||
| Proceeds |
$ | 17,105 | $ | 36,627 | $ | 14,356 | ||||||
| Gross gains |
370 | 986 | 504 | |||||||||
| Gross losses |
— | — | (4 | ) | ||||||||
| Income tax expense on net realized gains |
142 | 377 | 187 | |||||||||
Included in net gains on sales of and settlement of securities in the Company’s consolidated statement of income for 2015 is $386 received in connection with the bankruptcy settlement related to a political subdivision security written off in 2011.
During 2014, the Company reclassified securities with a carrying value of $6,188 from held-to-maturity to available-for-sale. This reclassification was the result of the Basel III final rules regarding regulatory capital, effective January 1, 2015, which restrict the amount of certain investments the Company may own. Because of the change in the capital treatment under Basel III, the reclassification was allowed without requiring the remainder of the held-to-maturity portfolio to be reclassified to available-for-sale. At the time the securities were reclassified, they were immediately sold, with a recognized gain on sale of $149.
F-20
Table of Contents
NOTE 4 – LOANS AND ALLOWANCE FOR LOAN LOSSES
Categories of loans at December 31, 2015 and 2014 include:
| 2015 | 2014 | |||||||
| Commercial real estate |
$ | 397,017 | $ | 364,096 | ||||
| Commercial and industrial |
262,032 | 183,100 | ||||||
| Residential real estate |
250,216 | 134,455 | ||||||
| Agricultural real estate |
18,180 | 17,083 | ||||||
| Consumer |
17,103 | 7,875 | ||||||
| Agricultural |
15,807 | 19,267 | ||||||
|
|
|
|
|
|||||
| Total loans |
960,355 | 725,876 | ||||||
| Allowance for loan losses |
(5,506 | ) | (5,963 | ) | ||||
|
|
|
|
|
|||||
| Net loans |
$ | 954,849 | $ | 719,913 | ||||
|
|
|
|
|
|||||
In 2015, the Company began to participate in mortgage finance loans with another institution, “the originator.” These mortgage finance loans consist of ownership interests purchased in single family residential mortgages funded through the originator’s mortgage finance group. These loans are typically on the Company’s balance sheet for 10 to 20 days. As of December 31, 2015, the Company had balances of $18.9 million in mortgage finance loans classified as commercial and industrial.
During 2015 and 2014, the Company purchased four pools of residential real estate loans totaling $60.6 million and $26.2 million. As of December 31, 2015 and 2014, residential real estate loans include $74.7 million and $23.9 million of purchased residential real estate loans from these pools of residential real estate loans.
Over-draft deposit accounts are reclassified and included in consumer loans above. These accounts totaled $280 and $224 at December 31, 2015 and 2014.
The following tables present the activity in the allowance for loan losses by class for the years ended December 31, 2015, 2014 and 2013:
| December 31, 2015 |
Commercial Real Estate |
Commercial and Industrial |
Residential Real Estate |
Agricultural Real Estate |
Consumer | Agricultural | Total | |||||||||||||||||||||
| Allowance for loan losses: |
||||||||||||||||||||||||||||
| Beginning balance |
$ | 2,897 | $ | 1,559 | $ | 1,190 | $ | 148 | $ | 81 | $ | 88 | $ | 5,963 | ||||||||||||||
| Provision for loan losses |
694 | 1,252 | 899 | (119 | ) | 362 | (41 | ) | 3,047 | |||||||||||||||||||
| Loans charged-off |
(1,668 | ) | (1,468 | ) | (296 | ) | — | (309 | ) | — | (3,741 | ) | ||||||||||||||||
| Recoveries |
128 | 23 | 31 | — | 53 | 2 | 237 | |||||||||||||||||||||
|
|
|
|
|
|
|
|
|
|
|
|
|
|
|
|||||||||||||||
| Total ending allowance balance |
$ | 2,051 | $ | 1,366 | $ | 1,824 | $ | 29 | $ | 187 | $ | 49 | $ | 5,506 | ||||||||||||||
|
|
|
|
|
|
|
|
|
|
|
|
|
|
|
|||||||||||||||
| December 31, 2014 |
Commercial Real Estate |
Commercial and Industrial |
Residential Real Estate |
Agricultural Real Estate |
Consumer | Agricultural | Total | |||||||||||||||||||||
| Allowance for loan losses: |
||||||||||||||||||||||||||||
| Beginning balance |
$ | 2,866 | $ | 990 | $ | 1,360 | $ | 217 | $ | 63 | $ | 118 | $ | 5,614 | ||||||||||||||
| Provision for loan losses |
184 | 579 | 359 | (69 | ) | 160 | (13 | ) | 1,200 | |||||||||||||||||||
| Loans charged-off |
(241 | ) | (46 | ) | (668 | ) | — | (360 | ) | (19 | ) | (1,334 | ) | |||||||||||||||
| Recoveries |
88 | 36 | 139 | — | 218 | 2 | 483 | |||||||||||||||||||||
|
|
|
|
|
|
|
|
|
|
|
|
|
|
|
|||||||||||||||
| Total ending allowance balance |
$ | 2,897 | $ | 1,559 | $ | 1,190 | $ | 148 | $ | 81 | $ | 88 | $ | 5,963 | ||||||||||||||
|
|
|
|
|
|
|
|
|
|
|
|
|
|
|
|||||||||||||||
F-21
Table of Contents
| December 31, 2013 |
Commercial Real Estate |
Commercial and Industrial |
Residential Real Estate |
Agricultural Real Estate |
Consumer | Agricultural | Total | |||||||||||||||||||||
| Allowance for loan losses: |
||||||||||||||||||||||||||||
| Beginning balance |
$ | 2,159 | $ | 1,448 | $ | 745 | $ | 2 | $ | 57 | $ | 60 | $ | 4,471 | ||||||||||||||
| Provision for loan losses |
1,574 | (371 | ) | 845 | 215 | 226 | 94 | 2,583 | ||||||||||||||||||||
| Loans charged-off |
(926 | ) | (126 | ) | (522 | ) | — | (374 | ) | (37 | ) | (1,985 | ) | |||||||||||||||
| Recoveries |
59 | 39 | 292 | — | 154 | 1 | 545 | |||||||||||||||||||||
|
|
|
|
|
|
|
|
|
|
|
|
|
|
|
|||||||||||||||
| Total ending allowance balance |
$ | 2,866 | $ | 990 | $ | 1,360 | $ | 217 | $ | 63 | $ | 118 | $ | 5,614 | ||||||||||||||
|
|
|
|
|
|
|
|
|
|
|
|
|
|
|
|||||||||||||||
The following tables present the recorded investment in loans and the balance in the allowance for loan losses by portfolio and class based on impairment method as of December 31, 2015 and 2014:
| Loan Balance | Allowance for Loan Losses | |||||||||||||||||||||||
| December 31, 2015 |
Individually Evaluated for Impairment |
Collectively Evaluated for Impairment |
Total | Individually Evaluated for Impairment |
Collectively Evaluated for Impairment |
Total | ||||||||||||||||||
| Commercial real estate |
$ | 7,261 | $ | 389,756 | $ | 397,017 | $ | 190 | $ | 1,861 | $ | 2,051 | ||||||||||||
| Commercial and industrial |
1,182 | 260,850 | 262,032 | 6 | 1,360 | 1,366 | ||||||||||||||||||
| Residential real estate |
2,848 | 247,368 | 250,216 | 66 | 1,758 | 1,824 | ||||||||||||||||||
| Agricultural real estate |
— | 18,180 | 18,180 | — | 29 | 29 | ||||||||||||||||||
| Consumer |
103 | 17,000 | 17,103 | 7 | 180 | 187 | ||||||||||||||||||
| Agricultural |
95 | 15,712 | 15,807 | — | 49 | 49 | ||||||||||||||||||
|
|
|
|
|
|
|
|
|
|
|
|
|
|||||||||||||
| Total |
$ | 11,489 | $ | 948,866 | $ | 960,355 | $ | 269 | $ | 5,237 | $ | 5,506 | ||||||||||||
|
|
|
|
|
|
|
|
|
|
|
|
|
|||||||||||||
| Loan Balance | Allowance for Loan Losses | |||||||||||||||||||||||
| December 31, 2014 |
Individually Evaluated for Impairment |
Collectively Evaluated for Impairment |
Total | Individually Evaluated for Impairment |
Collectively Evaluated for Impairment |
Total | ||||||||||||||||||
| Commercial real estate |
$ | 10,694 | $ | 353,402 | $ | 364,096 | $ | 1,044 | $ | 1,853 | $ | 2,897 | ||||||||||||
| Commercial and industrial |
1,710 | 181,390 | 183,100 | 523 | 1,036 | 1,559 | ||||||||||||||||||
| Residential real estate |
2,175 | 132,280 | 134,455 | 95 | 1,095 | 1,190 | ||||||||||||||||||
| Agricultural real estate |
258 | 16,825 | 17,083 | 16 | 132 | 148 | ||||||||||||||||||
| Consumer |
29 | 7,846 | 7,875 | 3 | 78 | 81 | ||||||||||||||||||
| Agricultural |
— | 19,267 | 19,267 | — | 88 | 88 | ||||||||||||||||||
|
|
|
|
|
|
|
|
|
|
|
|
|
|||||||||||||
| Total |
$ | 14,866 | $ | 711,010 | $ | 725,876 | $ | 1,681 | $ | 4,282 | $ | 5,963 | ||||||||||||
|
|
|
|
|
|
|
|
|
|
|
|
|
|||||||||||||
F-22
Table of Contents
The following table presents information related to impaired loans, excluding purchased credit impaired loans which have not deteriorated since acquisition, by class of loans as of and for the year ended December 31, 2015:
| December 31, 2015 |
Unpaid Principal Balance |
Recorded Investment |
Allowance for Loan Losses Allocated |
Average Recorded Investment |
Interest Income Recognized |
|||||||||||||||
| With no related allowance recorded: |
||||||||||||||||||||
| Commercial real estate |
$ | 563 | $ | 536 | $ | — | $ | 803 | $ | 23 | ||||||||||
| Commercial and industrial |
2,668 | 1,119 | — | 648 | 33 | |||||||||||||||
| Residential real estate |
984 | 585 | — | 556 | 3 | |||||||||||||||
| Agricultural real estate |
— | — | — | 51 | — | |||||||||||||||
| Consumer |
— | — | — | 3 | — | |||||||||||||||
| Agricultural |
95 | 95 | — | 7 | 5 | |||||||||||||||
|
|
|
|
|
|
|
|
|
|
|
|||||||||||
| Subtotal |
4,310 | 2,335 | — | 2,068 | 64 | |||||||||||||||
|
|
|
|
|
|
|
|
|
|
|
|||||||||||
| With an allowance recorded: |
||||||||||||||||||||
| Commercial real estate |
4,217 | 3,176 | 190 | 3,792 | 46 | |||||||||||||||
| Commercial and industrial |
93 | 63 | 6 | 1,400 | 3 | |||||||||||||||
| Residential real estate |
697 | 660 | 66 | 790 | 12 | |||||||||||||||
| Agricultural real estate |
— | — | — | 60 | — | |||||||||||||||
| Consumer |
75 | 72 | 7 | 34 | 3 | |||||||||||||||
| Agricultural |
— | — | — | — | — | |||||||||||||||
|
|
|
|
|
|
|
|
|
|
|
|||||||||||
| Subtotal |
5,082 | 3,971 | 269 | 6,076 | 64 | |||||||||||||||
|
|
|
|
|
|
|
|
|
|
|
|||||||||||
| Total |
$ | 9,392 | $ | 6,306 | $ | 269 | $ | 8,144 | $ | 128 | ||||||||||
|
|
|
|
|
|
|
|
|
|
|
|||||||||||
The above table presents interest income for the twelve months ended December 31, 2015. Interest income recognized in the above table was substantially recognized on the cash basis. The recorded investment in loans excludes accrued interest receivable due to immateriality.
The following table presents information related to impaired loans, excluding purchased credit impaired loans which have not deteriorated since acquisition, by portfolio and class of loans as of and for the year ended December 31, 2014:
| December 31, 2014 |
Unpaid Principal Balance |
Recorded Investment |
Allowance for Loan Losses Allocated |
Average Recorded Investment |
Interest Income Recognized |
|||||||||||||||
| With no related allowance recorded: |
||||||||||||||||||||
| Commercial real estate |
$ | 2,496 | $ | 1,837 | $ | — | $ | 1,159 | $ | 64 | ||||||||||
| Commercial and industrial |
553 | 524 | — | 906 | — | |||||||||||||||
| Residential real estate |
778 | 523 | — | 1,055 | — | |||||||||||||||
| Agricultural real estate |
114 | 111 | — | 112 | — | |||||||||||||||
| Consumer |
— | — | — | 5 | — | |||||||||||||||
| Agricultural |
— | — | — | — | — | |||||||||||||||
|
|
|
|
|
|
|
|
|
|
|
|||||||||||
| Subtotal |
3,941 | 2,995 | — | 3,237 | 64 | |||||||||||||||
|
|
|
|
|
|
|
|
|
|
|
|||||||||||
| With an allowance recorded: |
||||||||||||||||||||
| Commercial real estate |
5,717 | 5,430 | 1,044 | 5,504 | 21 | |||||||||||||||
| Commercial and industrial |
1,225 | 1,186 | 523 | 284 | 36 | |||||||||||||||
| Residential real estate |
988 | 896 | 95 | 1,526 | 14 | |||||||||||||||
| Agricultural real estate |
154 | 148 | 16 | 35 | 8 | |||||||||||||||
| Consumer |
30 | 29 | 3 | 11 | 2 | |||||||||||||||
| Agricultural |
— | — | — | 12 | — | |||||||||||||||
|
|
|
|
|
|
|
|
|
|
|
|||||||||||
| Subtotal |
8,114 | 7,689 | 1,681 | 7,372 | 81 | |||||||||||||||
|
|
|
|
|
|
|
|
|
|
|
|||||||||||
| Total |
$ | 12,055 | $ | 10,684 | $ | 1,681 | $ | 10,609 | $ | 145 | ||||||||||
|
|
|
|
|
|
|
|
|
|
|
|||||||||||
F-23
Table of Contents
The above table presents interest income for the twelve months ended December 31, 2014. Interest income recognized in the above table was substantially recognized on the cash basis. The recorded investment in loans excludes accrued interest receivable due to immateriality.
The following tables present the aging of the recorded investment in past due loans as of December 31, 2015 and 2014, by portfolio and class of loans:
| December 31, 2015 |
30 – 59 Days Past Due |
60 – 89 Days Past Due |
Greater Than 90 Days Past Due Still On Accrual |
Nonaccrual | Loans Not Past Due |
Total | ||||||||||||||||||
| Commercial real estate |
$ | 645 | $ | 108 | $ | — | $ | 4,448 | $ | 391,816 | $ | 397,017 | ||||||||||||
| Commercial and industrial |
2 | 164 | — | 1,182 | 260,684 | 262,032 | ||||||||||||||||||
| Residential real estate |
166 | 545 | 35 | 2,369 | 247,101 | 250,216 | ||||||||||||||||||
| Agricultural real estate |
138 | — | — | — | 18,042 | 18,180 | ||||||||||||||||||
| Consumer |
96 | 97 | — | 103 | 16,807 | 17,103 | ||||||||||||||||||
| Agricultural |
— | — | — | 95 | 15,712 | 15,807 | ||||||||||||||||||
|
|
|
|
|
|
|
|
|
|
|
|
|
|||||||||||||
| Total |
$ | 1,047 | $ | 914 | $ | 35 | $ | 8,197 | $ | 950,162 | 960,355 | |||||||||||||
|
|
|
|
|
|
|
|
|
|
|
|
|
|||||||||||||
| December 31, 2014 |
30 – 59 Days Past Due |
60 – 89 Days Past Due |
Greater Than 90 Days Past Due Still On Accrual |
Nonaccrual | Loans Not Past Due |
Total | ||||||||||||||||||
| Commercial real estate |
$ | 1,010 | $ | 1,958 | $ | — | $ | 7,294 | $ | 353,834 | $ | 364,096 | ||||||||||||
| Commercial and industrial |
83 | 165 | 39 | 1,710 | 181,103 | 183,100 | ||||||||||||||||||
| Residential real estate |
765 | 497 | — | 1,499 | 131,694 | 134,455 | ||||||||||||||||||
| Agricultural real estate |
— | — | — | 258 | 16,825 | 17,083 | ||||||||||||||||||
| Consumer |
22 | — | — | 29 | 7,824 | 7,875 | ||||||||||||||||||
| Agricultural |
— | 44 | — | — | 19,223 | 19,267 | ||||||||||||||||||
|
|
|
|
|
|
|
|
|
|
|
|
|
|||||||||||||
| Total |
$ | 1,880 | $ | 2,664 | $ | 39 | $ | 10,790 | $ | 710,503 | $ | 725,876 | ||||||||||||
|
|
|
|
|
|
|
|
|
|
|
|
|
|||||||||||||
Credit Quality Indicators
The Company categorizes loans into risk categories based on relevant information about the ability of borrowers to service their debt such as: current financial information, historical payment experience, credit documentation, public information, and current economic trends, among other factors. The Company analyzes loans individually by classifying the loans as to credit risk. Consumer loans are considered pass credits unless downgraded due to payment status or reviewed as part of a larger credit relationship. The Company uses the following definitions for risk ratings:
Special Mention: Loans classified as special mention have a potential weakness that deserves management’s close attention. If left uncorrected, these potential weaknesses may result in deterioration of the repayment prospects for the loan or of the Company’s credit position at some future date.
Substandard: Loans classified as substandard are inadequately protected by the current net worth and paying capacity of the obligor or of the collateral pledged, if any. Loans so classified have a well-defined weakness or weaknesses that jeopardize the liquidation of the debt. They are characterized by the distinct possibility that the institution will sustain some loss if the deficiencies are not corrected.
Doubtful: Loans classified as doubtful have all the weaknesses inherent in those classified as substandard, with the added characteristic that the weaknesses make collection or liquidation in full, on the basis of currently existing facts, conditions, and values, highly questionable and improbable.
F-24
Table of Contents
The risk category of loans by class of loans is as follows as of December 31, 2015 and 2014:
| December 31, 2015 |
Pass | Special Mention |
Substandard | Doubtful | Total | |||||||||||||||
| Commercial real estate |
$ | 386,917 | $ | — | $ | 10,100 | $ | — | $ | 397,017 | ||||||||||
| Commercial and industrial |
260,669 | — | 1,363 | — | 262,032 | |||||||||||||||
| Residential real estate |
246,901 | — | 3,315 | — | 250,216 | |||||||||||||||
| Agricultural real estate |
17,810 | — | 370 | — | 18,180 | |||||||||||||||
| Consumer |
17,000 | — | 103 | — | 17,103 | |||||||||||||||
| Agricultural |
15,707 | — | 100 | — | 15,807 | |||||||||||||||
|
|
|
|
|
|
|
|
|
|
|
|||||||||||
| Total |
$ | 945,004 | $ | — | $ | 15,351 | $ | — | 960,355 | |||||||||||
|
|
|
|
|
|
|
|
|
|
|
|||||||||||
| December 31, 2014 |
Pass | Special Mention |
Substandard | Doubtful | Total | |||||||||||||||
| Commercial real estate |
$ | 340,853 | $ | 147 | $ | 23,096 | $ | — | $ | 364,096 | ||||||||||
| Commercial and industrial |
181,272 | — | 1,828 | — | 183,100 | |||||||||||||||
| Residential real estate |
132,285 | — | 2,170 | — | 134,455 | |||||||||||||||
| Agricultural real estate |
16,708 | — | 375 | — | 17,083 | |||||||||||||||
| Consumer |
7,846 | — | 29 | — | 7,875 | |||||||||||||||
| Agricultural |
15,432 | — | 3,835 | — | 19,267 | |||||||||||||||
|
|
|
|
|
|
|
|
|
|
|
|||||||||||
| Total |
$ | 694,396 | $ | 147 | $ | 31,333 | $ | — | $ | 725,876 | ||||||||||
|
|
|
|
|
|
|
|
|
|
|
|||||||||||
Purchased Credit Impaired Loans
The Company has acquired loans, for which there was, at acquisition, evidence of deterioration of credit quality since origination and it was probable, at acquisition, that all contractually required payments would not be collected. The recorded investments in purchased credit impaired loans as of December 31, 2015, 2014 and 2013 were as follows:
| 2015 | 2014 | 2013 | ||||||||||
| Contractually required principal payments |
$ | 7,550 | $ | 7,278 | $ | 9,063 | ||||||
| Discount |
(1,794 | ) | (2,167 | ) | (2,536 | ) | ||||||
|
|
|
|
|
|
|
|||||||
| Recorded investment |
$ | 5,756 | $ | 5,111 | $ | 6,527 | ||||||
|
|
|
|
|
|
|
|||||||
The accretable yield associated with these loans as of December 31, 2015 was $935. As of December 31, 2014, the accretable yield was $265, and the accretable yield as of December 31, 2013 was $0. The interest income recognized on these loans for the year ended December 31, 2015 was $866. For the years ended December 31, 2014 and 2013 the interest income recognized was $331 and $0. For the years ended December 31, 2015, 2014 and 2013, no provision for loan losses was recorded for these loans.
Troubled Debt Restructurings
The company had no material loans modified under troubled debt restructurings as of December 31, 2015 and 2014.
F-25
Table of Contents
NOTE 5 – OTHER REAL ESTATE OWNED
Changes in other real estate owned for the years ended December 31, 2015 and 2014 were as follows:
| 2015 | 2014 | |||||||
| Beginning of year |
$ | 4,754 | $ | 7,332 | ||||
| Transfers in |
3,164 | 1,414 | ||||||
| Acquired in acquisition |
115 | — | ||||||
| Gain on sales |
131 | 506 | ||||||
| Proceeds from sales |
(2,266 | ) | (4,368 | ) | ||||
|
|
|
|
|
|||||
| 5,898 | 4,884 | |||||||
| Additions to valuation reserve |
(87 | ) | (130 | ) | ||||
|
|
|
|
|
|||||
| Recorded investment |
$ | 5,811 | $ | 4,754 | ||||
|
|
|
|
|
|||||
Expenses related to other real estate owned for the years ended December 31, 2015, 2014 and 2013 were as follows:
| 2015 | 2014 | 2013 | ||||||||||
| Net loss (gain) on sales |
$ | (131 | ) | $ | (505 | ) | $ | (103 | ) | |||
| Provision for unrealized losses |
87 | 129 | 587 | |||||||||
| Operating expenses, net of rental income |
331 | 397 | 641 | |||||||||
|
|
|
|
|
|
|
|||||||
| $ | 287 | $ | 21 | $ | 1,125 | |||||||
|
|
|
|
|
|
|
|||||||
At December 31, 2015, the balance of real estate owned includes $1,256 of foreclosed residential real estate properties recorded as a result of obtaining physical possession of the property. At December 31, 2015, the recorded investment of consumer mortgage loans secured by residential real estate properties for which formal foreclosure proceedings are in process is $1,896.
NOTE 6 – PREMISES AND EQUIPMENT
Major classifications of premises and equipment, stated at cost, are as follows:
| 2015 | 2014 | |||||||
| Land |
$ | 9,823 | $ | 6,175 | ||||
| Buildings and improvements |
31,597 | 29,640 | ||||||
| Furniture, fixtures and equipment |
7,385 | 6,377 | ||||||
|
|
|
|
|
|||||
| 48,805 | 42,192 | |||||||
| Less: accumulated depreciation |
(9,658 | ) | (8,246 | ) | ||||
|
|
|
|
|
|||||
| Premises and equipment, net |
$ | 39,147 | $ | 33,946 | ||||
|
|
|
|
|
|||||
F-26
Table of Contents
Operating Leases
The Company leases certain branch properties under operating leases. Rent expense was $545, $882 and $958 for 2015, 2014 and 2013. Rent commitments at December 31, 2015, before considering renewal options that generally are present, were as follows:
| Due in one year or less |
$ | 525 | ||
| Due after one year through two years |
494 | |||
| Due after two years through three years |
251 | |||
| Due after three years through four years |
93 | |||
| Due after four years through five years |
38 | |||
| Thereafter |
319 | |||
|
|
|
|||
| Total |
$ | 1,720 | ||
|
|
|
NOTE 7 – GOODWILL AND CORE DEPOSIT INTANGIBLES
The assets and liabilities acquired in business combinations are recorded at their estimated fair values at the acquisition date. The excess of the purchase price over the estimated fair value of the net assets for tax free acquisitions is recorded as goodwill, none of which is deductible for tax purposes. The excess of the purchase price over the estimated fair value of the net assets for taxable acquisitions is recorded as goodwill, and is deductible for tax purposes. In 2014, the Company reduced core deposit intangibles associated with branches sold by $46 through accelerating the amortization related to those branches.
The carrying basis of goodwill and core deposit intangibles as of and for the years ended December 31, 2015 and 2014 were as follows:
| Goodwill | Core Deposit | |||||||
| Balance as of January 1, 2014 |
$ | 18,130 | $ | 1,470 | ||||
| Amortization |
— | (363 | ) | |||||
|
|
|
|
|
|||||
| Balance as of December 31, 2014 |
18,130 | 1,107 | ||||||
| Acquired in acquisition |
— | 717 | ||||||
| Amortization |
— | (275 | ) | |||||
|
|
|
|
|
|||||
| Balance as of December 31, 2015 |
$ | 18,130 | $ | 1,549 | ||||
|
|
|
|
|
|||||
Estimated amortization expense for each of the following five years and thereafter is:
| Expensed in one year or less |
$ | 346 | ||
| Expensed after one year through two years |
309 | |||
| Expensed after two years through three years |
273 | |||
| Expensed after three years through four years |
236 | |||
| Expensed after four years through five years |
142 | |||
| Thereafter |
243 | |||
|
|
|
|||
| Total |
$ | 1,549 | ||
|
|
|
NOTE 8 – QUALIFIED AFFORDABLE HOUSING PROJECT INVESTMENTS
The Company invests in qualified affordable housing projects. At December 31, 2015 and 2014, the balances of the investments in qualified affordable housing projects were $4,939 and $4,280. These balances are reflected in the other assets line in the consolidated balance sheets. Total unfunded commitments related to the investments in qualified affordable housing projects totaled $3,093 and $3,146 at December 31, 2015 and 2014. The Company expects to fulfill these commitments during the years 2016 through 2024.
F-27
Table of Contents
During the years ended December 31, 2015 and 2014, the Company recognized amortization expense of $224 and $248, which was included within pretax income on the consolidated statements of income. Additionally, during the years ended December 31, 2015 and 2014, the Company recognized tax credits from its investment in affordable housing tax credits of $435 and $399.
NOTE 9 – DERIVATIVE FINANCIAL INSTRUMENTS
Interest Rate Swaps Designated as Fair Value Hedges:
The Company periodically enters into interest rate swaps to hedge the fair value of certain commercial real estate loans. These transactions are designated as fair value hedges. In this type of transaction, the Company typically receives from the counterparty a variable-rate cash flow based on the one-month London Interbank Offered Rate (LIBOR) plus a spread to this index and pays a fixed-rate cash flow equal to the customer loan rate. At December 31, 2015, the portfolio of interest rate swaps had a weighted average maturity of 10.0 years, a weighted average pay rate of 4.45% and a weighted average rate received of 2.37%. No interest rate swaps were outstanding at December 31, 2014.
Stand-Alone Derivatives:
In 2009, the Company purchased an interest rate cap derivative to assist with interest rate risk management. This derivative is not designated as a hedging instrument but rather as a stand-alone derivative. At December 31, 2015, the interest rate cap had a term of 3.9 years and a cap rate of 4.50%. At December 31, 2014, the interest rate cap had a term of 4.9 years and a cap rate of 4.50%
Reconciliation of Derivative Fair Values and Gains/(Losses):
The notional amount of a derivative contract is a factor in determining periodic interest payments or cash flows received or paid. The notional amount of derivatives serves as a level of involvement in various types of derivatives. The notional amount does not represent the Company’s overall exposure to credit or market risk, generally, the exposure is significantly smaller.
The following table shows the notional balances and fair values (including net accrued interest) of the derivatives outstanding by derivative type at December 31, 2015 and December 31, 2014:
| December 31, 2015 | December 31, 2014 | |||||||||||||||||||||||
| Notional Amount |
Derivative Assets |
Derivative Liabilities |
Notional Amount |
Derivative Assets |
Derivative Liabilities |
|||||||||||||||||||
| Derivatives designated as hedging instruments: |
||||||||||||||||||||||||
| Interest rate swaps |
$ | 12,284 | $ | — | $ | 246 | $ | — | $ | — | $ | — | ||||||||||||
|
|
|
|
|
|
|
|
|
|
|
|
|
|||||||||||||
| Total derivatives designated as hedging relationships |
12,284 | — | 246 | — | — | — | ||||||||||||||||||
|
|
|
|
|
|
|
|
|
|
|
|
|
|||||||||||||
| Derivatives not designated as hedging instruments: |
||||||||||||||||||||||||
| Interest rate caps/floors |
3,140 | 2 | — | 3,399 | 11 | — | ||||||||||||||||||
|
|
|
|
|
|
|
|
|
|
|
|
|
|||||||||||||
| Total derivatives not designated as hedging instruments |
3,140 | 2 | — | 3,399 | 11 | — | ||||||||||||||||||
|
|
|
|
|
|
|
|
|
|
|
|
|
|||||||||||||
| Total |
$ | 15,424 | 2 | 246 | $ | 3,399 | 11 | — | ||||||||||||||||
|
|
|
|
|
|||||||||||||||||||||
| Cash Collateral |
— | (270 | ) | — | — | |||||||||||||||||||
| Netting adjustments |
24 | 24 | — | — | ||||||||||||||||||||
|
|
|
|
|
|
|
|
|
|||||||||||||||||
| Net amount presented in Balance Sheet |
$ | 26 | $ | — | $ | 11 | $ | — | ||||||||||||||||
|
|
|
|
|
|
|
|
|
|||||||||||||||||
F-28
Table of Contents
For the years ended December 31, 2015, 2014 and 2013, the Company recorded net losses on derivatives and hedging activities:
| 2015 | 2014 | 2013 | ||||||||||
| Derivatives designated as hedging instruments: |
||||||||||||
| Interest rate swaps |
$ | — | $ | — | $ | — | ||||||
|
|
|
|
|
|
|
|||||||
| Total net gain (loss) related to fair value hedge ineffectiveness |
— | — | — | |||||||||
|
|
|
|
|
|
|
|||||||
| Derivatives not designated as hedging instruments: |
||||||||||||
| Economic hedges: |
||||||||||||
| Interest rate caps/floors |
(9 | ) | (33 | ) | 22 | |||||||
|
|
|
|
|
|
|
|||||||
| Total net gains (losses) related to derivatives not designated as hedging instruments |
(9 | ) | (33 | ) | 22 | |||||||
|
|
|
|
|
|
|
|||||||
| Net gains (losses) on derivatives and hedging activities |
$ | (9 | ) | $ | (33 | ) | $ | 22 | ||||
|
|
|
|
|
|
|
|||||||
The following table shows the recorded net gains (losses) on derivatives and the related hedged items in fair value hedging relationships and the impact of those derivatives on the Company’s net interest income for the year ended December 31, 2015. No hedging relationships were outstanding during the years ended December 31, 2014 and 2013.
| December 31, 2015 | ||||||||||||||||
| Gain/(Loss) on Derivatives |
Gain/(Loss) on Hedged Items |
Net Fair Value Hedge Ineffectiveness |
Effect of Derivatives on Net Interest Income |
|||||||||||||
| Commercial real estate loans |
$ | (242 | ) | $ | 242 | $ | — | $ | (82 | ) | ||||||
|
|
|
|
|
|
|
|
|
|||||||||
| Total |
$ | (242 | ) | $ | 242 | $ | — | $ | (82 | ) | ||||||
|
|
|
|
|
|
|
|
|
|||||||||
NOTE 10 – DEPOSITS
Time deposits that met or exceeded the FDIC insurance limit of $250 totaled $150,188 and $111,007 as of December 31, 2015 and 2014.
At December 31, 2015 and 2014, brokered deposits of $4,150 and $12,851 were included in the company’s time deposit balance. Of the $4,150 in brokered deposits at December 31, 2015, all were customer funds placed in the Certificate of Deposit Account Registry Service (“CDARS”) program. CDARS allows Equity Bank to break large deposits into smaller amounts and place them in a network of other CDARS banks to ensure that FDIC insurance coverage is gained on the entire deposit. Although classified as brokered deposits for regulatory purposes, funds placed through the CDARS program are Equity Bank’s customer relationships.
At December 31, 2015, the scheduled maturities of time deposits are as follows:
| Due in one year or less |
$ | 266,943 | ||
| Due after one year through two years |
85,964 | |||
| Due after two years through three years |
26,192 | |||
| Due after three years through four years |
16,464 | |||
| Due after four years through five years |
40,462 | |||
| Thereafter |
2,587 | |||
|
|
|
|||
| Total |
$ | 438,612 | ||
|
|
|
F-29
Table of Contents
NOTE 11 – BORROWINGS
Federal funds purchased and retail repurchase agreements
Federal funds purchased and retail repurchase agreements included the following at December 31, 2015 and 2014:
| 2015 | 2014 | |||||||
| Federal funds purchased |
$ | — | $ | — | ||||
| Retail repurchase agreements |
$ | 20,762 | $ | 25,301 | ||||
Securities sold under agreements to repurchase (retail repurchase agreements) consist of obligations of the Company to other parties. The obligations are secured by residential mortgage-backed securities held by the Company with a fair value of $25,756 and $32,983 at December 31, 2015 and December 31, 2014. The agreements are on a day-to-day basis and can be terminated on demand.
The following table presents the borrowing usage and interest rate information for federal funds purchased and retail repurchase agreements at and for the years ending December 31, 2015 and 2014:
| 2015 | 2014 | |||||||
| Average daily balance during the period |
$ | 24,853 | $ | 28,516 | ||||
| Average interest rate during the period |
0.24 | % | 0.26 | % | ||||
| Maximum month-end balance during the period |
$ | 27,951 | $ | 31,159 | ||||
| Weighted average interest rate at period-end |
0.24 | % | 0.25 | % | ||||
Federal Home Loan Bank advances
Federal Home Loan Bank advances include both draws against the Company’s line of credit and fixed rate term advances. At December 31, 2015 and 2014, the Company had $145,439 and $16,544 drawn against its line of credit at a weighted average rate of 0.48% and 0.25%.
At year end, fixed rate term advances from the Federal Home Loan Bank were as follows:
| 2015 | 2014 | |||||||
| Amount outstanding |
$ | — | $ | 4,432 | ||||
| Weighted average |
— | % | 3.82 | % | ||||
| Interest rate range |
— | % | 1.66 – 5.00 | % | ||||
In February 2015, all of the Company’s Federal Home Loan Bank term advances were prepaid. The Company recorded a loss on debt extinguishment of $316 for the year ended December 31, 2015 in connection with the prepayment of the Federal Home Loan Bank term advances.
At December 31, 2015 and 2014, the Company had undisbursed advance commitments (letters of credit) with the Federal Home Loan Bank of $0 and $32,378. These letters of credit were obtained in lieu of pledging securities to secure public fund deposits that are over the FDIC insurance limit.
The advances, MPF loans and letters of credit were collateralized by certain qualifying loans totaling $318,759 and $199,610 at December 31, 2015 and 2014. Based on this collateral and the Company’s holdings of Federal Home Loan Bank stock, the Company was eligible to borrow an additional $172,557 and $146,256 at December 31, 2015 and 2014.
F-30
Table of Contents
Bank stock loan:
In July 2014, the Company borrowed $15,540 from an unaffiliated financial institution, secured by the Company’s stock in Equity Bank. In September 2015, the Company amended and restated the loan agreement and borrowed an additional $5,014. The loan bears interest at a fixed rate of 4.00% (computed on the basis of a 360-day year and the actual number of days elapsed) until July 2019, at which time the interest rate adjusts to Prime Rate, as designated as such in the “Money Rates” section of the Wall Street Journal (or any generally recognized successor), floating daily. Accrued interest and principal payments are due quarterly on the first day of January, April, July and October, with one final payment of unpaid principal and interest due in July 2021. The terms of the loan require the Company and Equity Bank to maintain minimum capital ratios and other covenants. The loan and accrued interest may be pre-paid at any time without penalty. In the event of default, the lender has the option to declare all outstanding balances as immediately due. The Company believes it is in compliance with the terms of the loan and has not been otherwise notified of noncompliance. The outstanding balance of the bank stock loan was $18,612 as of December 31, 2015 and $15,152 as of December 31, 2014.
Future principal repayments of the December 31, 2015 outstanding balance are as follows:
| Due in one year or less |
$ | 2,172 | ||
| Due after one year through two years |
2,172 | |||
| Due after two years through three years |
2,172 | |||
| Due after three years through four years |
2,172 | |||
| Due after four years through five years |
2,172 | |||
| Thereafter |
7,752 | |||
|
|
|
|||
| Total |
$ | 18,612 | ||
|
|
|
A portion of the proceeds of the IPO were used to repay this borrowing in full on January 4, 2016.
On January 28, 2016, the Company entered into an agreement that provides for a maximum borrowing facility of $20.0 million, secured by the Company’s stock in Equity Bank. The borrowing facility will mature on January 26, 2017. Each draw of funds on the facility will create a separate note that is repayable over a term of five years. Each note will bear interest at a variable interest rate equal to the prime rate published in the “Money Rates” section of the Wall Street Journal (or any generally recognized successor), floating daily. Accrued interest and principal payments will be due quarterly with one final payment of unpaid principal and interest due at the end of the five year term of each separate note. The Company is also required to pay an unused commitment fee in an amount equal to twenty basis points per annum on the unused portion of the maximum borrowing facility.
NOTE 12 – SUBORDINATED DEBENTURES
In conjunction with the 2012 acquisition of First Community Bancshares, Inc. (FCB), the Company assumed certain subordinated debentures owed to special purpose unconsolidated subsidiaries that are controlled by the Company, FCB Capital Trust II and FCB Capital Trust III, (“CTII” and “CTIII”, respectively).
On March 24, 2005, CTII, an unconsolidated subsidiary of the Company, issued $10,000 of variable rate trust preferred securities, all of which are outstanding at December 31, 2015 and 2014. The trust preferred securities issued by CTII accrue and pay distributions quarterly at three-month LIBOR plus 2.00% (2.32% at December 31, 2015 and 2.23% at December 31, 2014) on the stated liquidation amount of the trust preferred securities. As an integral part of the acquisition of FCB, the Company has guaranteed fully and unconditionally all of the obligations of CTII. The guaranty covers the quarterly distributions and payments on liquidation or redemption of the trust preferred securities. These trust preferred securities are mandatorily redeemable upon maturity on April 15, 2035 or upon earlier redemption. The Company has the right to redeem the trust preferred securities in whole or in part, on or after April 15, 2015 at a redemption price specified in the indenture plus any accrued but unpaid interest to the redemption date. The proceeds from the sale of the trust preferred securities
F-31
Table of Contents
and the issuance of $310 in common securities to FCB were used by CTII to purchase $10,310 of floating rate subordinated debentures of FCB which have the same payment terms as the trust preferred securities.
On March 30, 2007, CTIII, an unconsolidated subsidiary of the Company, issued $5,000 of variable rate trust preferred securities, all of which are outstanding at December 31, 2015 and 2014. The trust preferred securities issued by CTIII accrue and pay distributions quarterly at three-month LIBOR plus 1.89% (2.40% at December 31, 2015 and 2.13% at December 31, 2014) on the stated liquidation amount of the trust preferred securities. As an integral part of the acquisition of FCB, the Company has guaranteed fully and unconditionally all of the obligations of CTIII. The guaranty covers the quarterly distributions and payments on liquidation or redemption of the trust preferred securities. These trust preferred securities are mandatorily redeemable upon maturity on June 15, 2037 or upon earlier redemption. The Company has the right to redeem the trust preferred securities in whole or in part at a redemption price specified in the indenture plus any accrued but unpaid interest to the redemption date. The proceeds from the sale of the trust preferred securities and the issuance of $155 in common securities to FCB were used by CTIII to purchase $5,155 of floating rate subordinated debentures of FCB which have the same payment terms as the trust preferred securities.
The common securities issued to the Company by the trusts possess sole voting rights with respect to matters involving those entities. The Company has the right to defer the payment of interest on all of its outstanding trust preferred securities. The Company has the right to declare such a deferral for up to 20 consecutive quarterly periods and deferral may only be declared as long as the Company is not then in default under the provisions of the Amended and Restated Trust Agreements. During the deferral period, interest on the indebtedness continues to accrue and the unpaid interest is compounded. As long as the deferral period continues, the Company is prohibited from: (i) declaring or paying any dividend on any of its capital stock, which would include both its common stock and the outstanding preferred stock issued to the Treasury, or (ii) making any payment on any debt security that is ranked equally with or junior to the securities issued by the trust.
As a part of the acquisition of FCB, the Company recorded the debentures at an estimated fair value of $8,270. The initial fair value adjustment will be amortized against earnings on a prospective basis. At December 31, 2015 and 2014, the contractual balance and the unamortized fair value adjustment were as follows:
| 2015 | 2014 | |||||||
| Contractual balance |
$ | 15,465 | $ | 15,465 | ||||
| Unamortized fair value adjustment |
(6,214 | ) | (6,524 | ) | ||||
|
|
|
|
|
|||||
| Net book value |
$ | 9,251 | $ | 8,941 | ||||
|
|
|
|
|
|||||
Subordinated debentures are included in Tier 1 capital for purposes of determining the Company’s compliance with regulatory capital requirements.
NOTE 13 – CONTRACTUAL OBLIGATIONS
At December 31, 2015 and 2014, the Company had contractual obligations of $3,093 and $3,146. Contractual obligations represent commitments made by the Company to make capital investments in limited-liability entities that invest in qualified affordable housing projects. The Company expects to fulfill these commitments during the years 2016 through 2024.
NOTE 14 – STOCKHOLDERS’ EQUITY
Preferred Stock
The Company’s articles of incorporation provide for the issuance of 10,000,000 shares of preferred stock. At December 31, 2015 and 2014, there were 16,372 shares of senior non-cumulative perpetual preferred stock, Series C (the Series C preferred stock) issued and outstanding.
F-32
Table of Contents
On August 11, 2011, as part of the Small Business Lending Fund (“SBLF”), the Company entered into an SBLF Purchase Agreement with the United States Treasury. Under the SBLF Purchase Agreement, the Company issued the Series C preferred stock having a per share liquidation amount of $1,000 per share. The Series C preferred stock qualifies as Tier 1 capital and pays quarterly dividends at a rate of 1.0% at December 31, 2015 and 2014. A portion of the proceeds of the IPO were used to redeem the Series C preferred stock on January 4, 2016 at liquidation amount of $16,372.
Common stock
The Company’s articles of incorporation provide for the issuance of 45,000,000 shares of Class A voting common stock (“Class A common stock”) and 5,000,000 shares of Class B non-voting common stock (“Class B common stock”), both of which have a par value of $0.01 per share. At December 31, 2015 and 2014, the following table presents shares that were issued and were held in treasury or were outstanding:
| 2015 | 2014 | |||||||
| Class A common stock – issued |
8,421,060 | 6,003,844 | ||||||
| Class A common stock – held in treasury |
(1,271,043 | ) | (1,271,043 | ) | ||||
|
|
|
|
|
|||||
| Class A common stock – outstanding |
7,150,017 | 4,732,801 | ||||||
|
|
|
|
|
|||||
| Class B common stock – issued |
1,296,613 | 1,569,613 | ||||||
| Class B common stock – held in treasury |
(234,903 | ) | (234,903 | ) | ||||
|
|
|
|
|
|||||
| Class B common stock – outstanding |
1,061,710 | 1,334,710 | ||||||
|
|
|
|
|
|||||
Treasury stock is stated at cost, determined by the first-in, first-out method.
On November 16, 2015, the Company completed an initial public offering of 2,231,000 shares of Class A common stock at a price to the public of $22.50 per share. The Company sold 1,941,000 shares of its Class A common stock and the selling stockholders named in the registration statement sold 290,000 shares of the Company’s Class A common stock, which included 273,000 shares of Class A common stock that were issued upon the automatic conversion of an equal number of shares of Class B common stock as a result of the offering. Gross proceeds paid to the Company were $43,673. The Company’s net proceeds were $38,945 after subtraction of underwriting discounts and commissions and offering expenses. All shares issued and sold in the initial public offering were registered under the Securities Act pursuant to a Registration Statement on Form S-1, which was declared effective by the SEC on November 10, 2015.
Agreements with certain owners of Class B common stock require the Company to issue Class A common stock to replace an equal number of shares of Class B common stock in the event of a future transfer from the owner to an unaffiliated party. The Class B common stock owner may require this exchange in certain stipulated transactions including the transfer of shares of Class B common stock to: (1) the Company or its bank subsidiary, (2) in a widespread public distribution, (3) a transfer in which no transferee receives two percent or more of any class of the Company’s voting securities, or (4) to a transferee that would control more than fifty percent of the Company’s voting securities without any transfer from the purchaser.
Restricted stock unit plan termination loans
In connection with termination of the Company’s restricted stock unit plan (“RSUP”), 203,216 shares of Class A common stock were issued in May 2015 to employees with vested restricted stock units. Additional paid-in capital includes $224 of tax benefits in excess of those previously provided in connection with stock compensation expense. Also in connection with the termination of the RSUP, the Company agreed to loan electing participants an amount equal to each participant’s federal and state income tax withholding obligation associated with the stock issuance. These loans totaling $242 at December 31, 2015, are collateralized with the shares received, have a maturity date of December 31, 2016 and an interest rate of 0.56%.
F-33
Table of Contents
Accumulated other comprehensive income (loss)
For the years ending December 31, 2015 and 2014, accumulated other comprehensive income consisted of (i) the after tax effect of unrealized gains (losses) on available-for-sale securities and (ii) the after tax effect of unamortized unrealized gains (losses) on securities transferred from the available-for-sale designation to the held-to-maturity designation.
Components of accumulated other comprehensive income as of December 31, 2015 and 2014 were as follows:
| Available-for-Sale Securities |
Held-to-Maturity Securities |
Accumulated Other Comprehensive Income |
||||||||||
| December 31, 2015 |
||||||||||||
| Net unrealized or unamortized gains (losses) |
$ | (343 | ) | $ | (3,491 | ) | $ | (3,834 | ) | |||
| Tax effect |
128 | 1,335 | 1,463 | |||||||||
|
|
|
|
|
|
|
|||||||
| $ | (215 | ) | $ | (2,156 | ) | $ | (2,371 | ) | ||||
|
|
|
|
|
|
|
|||||||
| December 31, 2014 |
||||||||||||
| Net unrealized or unamortized gains (losses) |
$ | 571 | $ | (4,258 | ) | $ | (3,687 | ) | ||||
| Tax effect |
(222 | ) | 1,628 | 1,406 | ||||||||
|
|
|
|
|
|
|
|||||||
| $ | 349 | $ | (2,630 | ) | $ | (2,281 | ) | |||||
|
|
|
|
|
|
|
|||||||
NOTE 15 – INCOME TAXES
Income tax expense was as follows:
| 2015 | 2014 | 2013 | ||||||||||
| Current |
$ | 1,715 | $ | 3,240 | $ | 886 | ||||||
| Deferred |
2,414 | 854 | 2,511 | |||||||||
| Change in valuation allowance |
13 | 109 | 137 | |||||||||
|
|
|
|
|
|
|
|||||||
| Income tax expense |
$ | 4,142 | $ | 4,203 | $ | 3,534 | ||||||
|
|
|
|
|
|
|
|||||||
A reconciliation of income tax expense at the U.S. federal statutory rate (35% in 2015 and 2014 and 34% in 2013) to the Company’s actual income tax expense is shown below:
| 2015 | 2014 | 2013 | ||||||||||
| Computed at the statutory rate |
$ | 5,055 | $ | 4,617 | $ | 3,878 | ||||||
| Increase (decrease) resulting from: |
||||||||||||
| State and local taxes, net of federal benefit |
457 | 398 | 295 | |||||||||
| Tax-exempt interest |
(370 | ) | (294 | ) | (281 | ) | ||||||
| Non-taxable life insurance income |
(335 | ) | (326 | ) | (324 | ) | ||||||
| Non-deductible expenses |
167 | 90 | 74 | |||||||||
| Federal tax credits |
(435 | ) | (290 | ) | (276 | ) | ||||||
| Gain on acquisition |
(239 | ) | — | — | ||||||||
| Change in valuation allowance |
13 | 109 | 137 | |||||||||
| Other |
(171 | ) | (101 | ) | 31 | |||||||
|
|
|
|
|
|
|
|||||||
| Income tax expense |
$ | 4,142 | $ | 4,203 | $ | 3,534 | ||||||
|
|
|
|
|
|
|
|||||||
F-34
Table of Contents
The deferred tax effects of unrealized or unamortized gains and losses on securities are recorded directly to stockholders’ equity as part of other comprehensive income. In addition, during 2015, in connection with the termination of the Company’s restricted stock unit plan, tax benefits of $224 were recorded directly to additional paid-in capital.
Components of deferred tax assets and liabilities are as follows:
| 2015 | 2014 | |||||||
| Deferred tax assets |
||||||||
| Allowance for loan losses |
$ | 2,106 | $ | 2,281 | ||||
| Net unrealized or unamortized losses on securities |
1,463 | 1,406 | ||||||
| Tax credit carryforwards |
1,111 | 103 | ||||||
| Accrued compensation |
937 | 1,590 | ||||||
| Net operating loss carryforwards |
862 | 129 | ||||||
| Other real estate owned |
560 | 728 | ||||||
| Acquired loans fair market value adjustments |
448 | 409 | ||||||
| Other |
446 | 399 | ||||||
|
|
|
|
|
|||||
| Gross deferred tax assets |
7,933 | 7,045 | ||||||
| Deferred tax liabilities |
||||||||
| Assumed debt fair market value adjustments |
2,336 | 2,453 | ||||||
| Goodwill amortization |
1,551 | 1,417 | ||||||
| Depreciation |
1,383 | 1,603 | ||||||
| Federal Home Loan Bank stock dividends |
596 | 150 | ||||||
| Core deposit intangibles |
476 | 279 | ||||||
| Other |
344 | 115 | ||||||
|
|
|
|
|
|||||
| Gross deferred tax liabilities |
6,686 | 6,017 | ||||||
| State valuation allowance |
(317 | ) | (263 | ) | ||||
|
|
|
|
|
|||||
| Net deferred tax asset |
$ | 930 | $ | 765 | ||||
|
|
|
|
|
|||||
Deferred income tax balances reflect the effects of temporary differences between the carrying amounts of assets and liabilities and their tax bases and are stated at enacted tax rates expected to be in effect when taxes are actually paid or recovered. The 2014 deferred income tax provision includes $35 related to an increase in the expected federal rate to be in effect when taxes are actually paid or recovered from 34% to 35%. In 2015, the Company recognized deferred tax assets, net of state valuation allowance of $3,023 and deferred tax liabilities of $488 for temporary differences, net operating loss carryforwards, and tax credit carryforwards associated with the acquisition of First Independence. The acquired federal net operating losses total $1,470 at December 31, 2015 and will expire between 2030 and 2031. Acquired federal tax credits totaling $1,111 will expire between 2027 and 2034. The utilization of these net operating loss and tax credit carryforwards are not expected to be limited by internal revenue code sections 382 and 383.
The Company and its subsidiaries are subject to U.S. federal income tax as well as income tax of the states of Kansas, Missouri, and Iowa. Commercial banks are not allowed to file consolidated Kansas returns with non-bank consolidated group members. The Company has unused state operating loss carryforwards of approximately $9,121 that expire between 2016 and 2026 resulting from the separate Kansas returns of the Company and SA Holdings, Inc. These operating losses, as well as certain deferred tax assets, have a full valuation allowance recorded against them resulting in a zero carrying value. In connection with the acquisition of First Independence, the Company acquired Kansas net operating losses useable against Kansas bank income. At December 31, 2015, the Kansas net operating loss carryforward useable against Kansas bank income totaled $3,891 with expiration dates between 2019 and 2022. The utilization of this acquired Kansas net operating loss carryforward is expected to be limited, and a valuation allowance has been recorded against the portion which is
F-35
Table of Contents
expected to expire unused. In establishing a valuation allowance management considers whether it is more likely than not that some or all of the deferred tax assets will not be realized. The Company is no longer subject to examination by taxing authorities for years before 2012. At December 31, 2015 there were no examinations in any jurisdiction.
NOTE 16 – REGULATORY MATTERS
Banks and bank holding companies are subject to regulatory capital requirements administered by federal banking agencies. Capital adequacy guidelines and, additionally for banks, prompt corrective action regulations, involve quantitative measures of assets, liabilities, and certain off-balance-sheet items calculated under regulatory accounting practices. Capital amounts and classifications are also subject to qualitative judgments by regulators. Failure to meet capital requirements can initiate regulatory action. The final rules implementing Basel Committee on Banking Supervision’s capital guidelines for U.S. banks (Basel III rules) became effective for the Company on January 1, 2015 with full compliance with all of the requirements being phased in over a multi-year schedule, and fully phased in by January 1, 2019. The net unrealized gain or loss on available-for-sale securities is not included in computing regulatory capital. Capital amounts and rations for December 31, 2014 are calculated using Basel I rules. Management believes as of December 31, 2015, the Company and Bank meet all capital adequacy requirements to which they are subject.
Prompt corrective action regulations provide five classifications: well capitalized, adequately capitalized, undercapitalized, significantly undercapitalized, and critically undercapitalized, although these terms are not used to represent overall financial condition. If adequately capitalized, regulatory approval is required to accept brokered deposits. If undercapitalized, capital distributions are limited, as are asset growth and acquisitions, and capital restoration plans are required.
As of December 31, 2015, the most recent notifications from the federal regulatory agencies categorized Equity Bank as well capitalized under the regulatory framework for prompt corrective action. To be categorized as well capitalized, Equity Bank must maintain minimum total risk-based, Tier 1 risk-based, and Tier 1 leverage ratios as set forth in the table. There are no conditions or events since that notification that management believes have changed Equity Bank’s category.
F-36
Table of Contents
The Company’s and Equity Bank’s capital amounts and ratios at December 31, 2015 and 2014 are presented in the tables below. Ratios provided for Equity Bancshares, Inc. represent the ratios of the Company on a consolidated basis.
| Actual | Minimum Required for Capital Adequacy Purposes |
To Be Well Capitalized Under Prompt Corrective Provisions |
||||||||||||||||||||||
| Amount | Ratio | Amount | Ratio | Amount | Ratio | |||||||||||||||||||
| December 31, 2015 |
||||||||||||||||||||||||
| Total capital to risk weighted assets |
||||||||||||||||||||||||
| Equity Bancshares, Inc. |
$ | 156,358 | 14.35 | % | $ | 87,146 | 8.0 | % | $ | N/A | N/A | |||||||||||||
| Equity Bank |
139,275 | 12.77 | % | 87,256 | 8.0 | % | 109,070 | 10.0 | % | |||||||||||||||
| Tier 1 capital to risk weighted assets |
||||||||||||||||||||||||
| Equity Bancshares, Inc. |
150,852 | 13.85 | % | 65,359 | 6.0 | % | N/A | N/A | ||||||||||||||||
| Equity Bank |
133,769 | 12.26 | % | 65,442 | 6.0 | % | 87,256 | 8.0 | % | |||||||||||||||
| Common equity Tier 1 capital to risk weighted assets |
||||||||||||||||||||||||
| Equity Bancshares, Inc. |
134,480 | 12.35 | % | 49,019 | 4.5 | % | N/A | N/A | ||||||||||||||||
| Equity Bank |
133,769 | 12.26 | % | 49,082 | 4.5 | % | 70,896 | 6.5 | % | |||||||||||||||
| Tier 1 leverage to average assets |
||||||||||||||||||||||||
| Equity Bancshares, Inc. |
150,852 | 9.47 | % | 63,728 | 4.0 | % | N/A | N/A | ||||||||||||||||
| Equity Bank |
133,769 | 8.39 | % | 63,790 | 4.0 | % | 79,737 | 5.0 | % | |||||||||||||||
| December 31, 2014 |
||||||||||||||||||||||||
| Total capital to risk weighted assets |
||||||||||||||||||||||||
| Equity Bancshares, Inc. |
$ | 116,882 | 13.86 | % | $ | 67,409 | 8.0 | % | $ | N/A | N/A | |||||||||||||
| Equity Bank |
124,513 | 14.74 | % | 67,573 | 8.0 | % | 84,466 | 10.0 | % | |||||||||||||||
| Tier 1 capital to risk weighted assets |
||||||||||||||||||||||||
| Equity Bancshares, Inc. |
110,859 | 13.16 | % | 33,704 | 4.0 | % | N/A | N/A | ||||||||||||||||
| Equity Bank |
118,550 | 14.04 | % | 33,786 | 4.0 | % | 50,680 | 6.0 | % | |||||||||||||||
| Tier 1 leverage to average assets |
||||||||||||||||||||||||
| Equity Bancshares, Inc. |
110,859 | 9.62 | % | 46,085 | 4.0 | % | N/A | N/A | ||||||||||||||||
| Equity Bank |
118,550 | 10.28 | % | 46,149 | 4.0 | % | 57,686 | 5.0 | % | |||||||||||||||
Equity Bank is subject to certain restrictions on the amount of dividends that it may declare without prior regulatory approval.
NOTE 17 – RELATED-PARTY TRANSACTIONS
At December 31, 2015 and 2014, the Company had loans outstanding to executive officers, directors, significant stockholders, and their affiliates (related parties), in the amount of $5,032 and $2,754. Changes during 2015 were as follows:
| 2015 | ||||
| Balance at January 1, 2015 |
$ | 2,754 | ||
| New loans/advances |
3,649 | |||
| Effect of changes in composition of related parties |
— | |||
| Repayments |
(1,371 | ) | ||
|
|
|
|||
| Balance at December 31, 2015 |
$ | 5,032 | ||
|
|
|
|||
At December 31, 2015 and 2014, the Company had deposits from executive officers, directors, significant stockholders, and their affiliates (related parties), in the amount of $3,003 and $3,361.
F-37
Table of Contents
NOTE 18 – EMPLOYEE BENEFITS
The Company has a defined contribution profit sharing plan and a retirement savings 401(k) plan covering substantially all employees. Employees may contribute up to $18 of their compensation. Contributions to the profit sharing plan and 401(k) plan are discretionary and are determined annually by the Board of Directors. Employer contributions charged to expense for 2015, 2014 and 2013 were $414, $341 and $302.
As a result of the acquisition of First Independence, the Company assumed the obligations related to First Independence’s participation in the Pentegra Defined Benefit Plan for Financial Institutions, a tax-qualified defined benefit pension plan. The Pentegra Defined Benefit Plan is treated as a multiemployer plan for accounting purposes but operates as a multiple-employer plan under the Employee Retirement Income Security Act of 1974 (ERISA) and the Internal Revenue Code. As a result, certain multiemployer plan disclosures are not applicable to the Pentegra Defined Benefit Plan. Under the Pentegra Defined Benefit Plan, contributions made by a participating employer may be used to provide benefits to employees of other participating employers because assets contributed by an employer are not segregated in a separate account or restricted to provide benefits only to employees of that employer. Also, in the event a participating employer is unable to meet its contribution requirements, the required contributions for the other participating employers could increase proportionately.
The Pentegra Defined Benefit Plan covered substantially all officers and employees of First Independence who began employment prior to December 31, 2009, with 59 participants retaining benefits under the plan.
The Pentegra Defined Benefit Plan operates on a fiscal year from July 1 through June 30 and files one Form 5500 on behalf of all employers who participate in the plan. The Employer Identification Number is 13-5645888 and the three-digit plan number is 333. There are no collective bargaining agreements in place at the Company.
The Pentegra Defined Benefit Plan’s annual valuation process includes calculating the plan’s funded status and separately calculating the funded status of each participating employer. The funded status is defined as the market value of assets divided by the funding target (100 percent of the present value of all benefit liabilities accrued at that date). As permitted by ERISA, the Pentegra Defined Benefit Plan accepts contributions for the prior plan year up to eight and a half months after the asset valuation date. As a result, the fair value of assets at the valuation date (July 1) will increase by any subsequent contributions designated for the immediately preceding plan year ended June 30. The most recent Form 5500 available for the Pentegra Defined Benefit Plan is for the year ended June 30, 2014.
The following table presents the net pension cost and funded status of the Company relating to the Pentegra Defined Benefit Plan since the date of acquisition (dollar amounts in thousands):
| 2015 | ||||
| Net pension cost charged to salaries and employee benefits |
$ | 16 | ||
| Pentegra defined benefit plan funded status as of July 1 |
109.41 | % | ||
| First Independence’s funded status as of July 1 |
100.93 | % | ||
| Contributions paid to the plan |
$ | 50 | ||
The Company’s contributions to the Pentegra Defined Benefit Plan were less than 5.00% of the total contributions to the Pentegra Defined Benefit plan for the plan year ended June 30, 2015.
NOTE 19 – SHARE-BASED PAYMENTS
The Company’s 2013 Stock Incentive Plan (the Plan) permits the grant of non-qualified stock options and shares to its employees and directors for up to 725,000 shares of common stock. The Plan replaced the 2006 Non-qualified Stock Option Plan (2006 Plan). Under the 2006 Plan there were 205,700 fully vested and exercisable options outstanding at December 31, 2015 and 2014. No new grants of options may be made under
F-38
Table of Contents
the 2006 Plan. The Company believes that stock-based awards better align the interests of its employees with those of its stockholders. Under the Company’s director compensation policy, directors may elect to receive all or a portion of their fees in cash, Company stock, or non-qualified stock options. During the year ended December 31, 2014 the Company recognized directors compensation expense of $37 and issued 2,568 shares of Company stock pursuant to certain directors’ elections under the Company’s director compensation policy. There were no directors’ elections for payment of director compensation in Company stock in the years ended December 31, 2015 and 2013.
Stock Option Awards: Options granted to directors and employees under the Plan vest depending on the passage of time or the achievement of performance targets, depending on the terms of the underlying grant.
The following tables summarize stock option activity for the years ended December 31, 2015 and 2014:
| December 31, 2015 |
Options | Weighted Average Exercise Price |
Weighted Average Remaining Contractual Term (Years) |
Aggregate Intrinsic Value |
||||||||||||
| Outstanding at beginning of year |
390,856 | $ | 13.55 | 8 | $ | 428 | ||||||||||
| Granted |
173,889 | 21.25 | 10 | — | ||||||||||||
| Exercised |
— | — | — | — | ||||||||||||
| Forfeited or expired |
(2,750 | ) | (14.25 | ) | (10 | ) | — | |||||||||
|
|
|
|
|
|
|
|
|
|||||||||
| Outstanding at end of year |
561,995 | 15.93 | 8 | 4,194 | ||||||||||||
|
|
|
|
|
|
|
|
|
|||||||||
| Fully vested and expected to vest |
561,995 | 15.93 | 8 | 4,194 | ||||||||||||
|
|
|
|
|
|
|
|
|
|||||||||
| Exercisable at end of year |
351,700 | 14.79 | 7 | 3,024 | ||||||||||||
|
|
|
|
|
|
|
|
|
|||||||||
| December 31, 2014 |
Options | Weighted Average Exercise Price |
Weighted Average Remaining Contractual Term (Years) |
Aggregate Intrinsic Value |
||||||||||||
| Outstanding at beginning of year |
247,889 | $ | 13.29 | 7 | $ | 150 | ||||||||||
| Granted |
142,967 | 13.99 | 10 | — | ||||||||||||
| Exercised |
— | — | — | — | ||||||||||||
| Forfeited or expired |
— | — | — | — | ||||||||||||
|
|
|
|
|
|
|
|
|
|||||||||
| Outstanding at end of year |
390,856 | 13.55 | 8 | 428 | ||||||||||||
|
|
|
|
|
|
|
|
|
|||||||||
| Fully vested and expected to vest |
390,856 | 13.55 | 8 | 428 | ||||||||||||
|
|
|
|
|
|
|
|
|
|||||||||
| Exercisable at end of year |
231,606 | 13.94 | 7 | 225 | ||||||||||||
|
|
|
|
|
|
|
|
|
|||||||||
The fair values of stock options granted during the years ended December 31, 2015, 2014 and 2013 were estimated to be $5.39 per share, $3.58 per share and $3.20 per share. The fair value of each option award is estimated on the date of grant using a closed form option valuation (Black-Scholes) model. Expected stock price volatility is based on the historical volatility of the SNL Bank Index. The expected term of options granted is based on the Simplified Method. The risk-free interest rate for the expected term of the option is based on the U.S. Treasury yield curve in effect at the time of the grant.
F-39
Table of Contents
The fair values of options granted were determined using the following weighted-average assumptions as of grant dates.
| 2015 | 2014 | 2013 | ||||||||||
| Risk free rate |
1.92 | % | 1.84 | % | 1.72 | % | ||||||
| Market value of stock on grant date |
$ | 21.25 | $ | 13.99 | $ | 13.00 | ||||||
| Expected term (in years) |
5.8 | 5.7 | 5.0 | |||||||||
| Expected volatility |
21.49 | % | 22.50 | % | 23.93 | % | ||||||
| Dividend rate |
— | % | — | % | — | % | ||||||
Compensation expense for stock options is recognized as the options vest. Total stock option compensation cost that has been charged against income was $397, $445, and $233 for 2015, 2014, and 2013. The total income tax benefit was $152, $170 and $89. At December 31, 2015 there was $886 of unrecognized compensation expense related to non-vested stock options granted under the Plan. Unrecognized compensation expense at December 31, 2015 will be recognized over a remaining weighted average period of 4 years.
Remaining options available to be granted under the Plan were 336,062 at December 31, 2015.
Restricted Stock Unit Plan:
The Company’s Restricted Stock Unit Plan (RSUP), which was terminated May 22, 2014, provided for the issuance of restricted stock units (“RSUs”) to certain directors and officers. Prior to termination, RSUs vested over a five-year period subject to completion of service; however, no shares vested in the first two years following the RSU issuance. To the extent vested, the RSUs became Class A voting common stock on the later of the fifth anniversary of the issuance date of the RSU or at separation of service. Compensation expense was recognized over the vesting period of the awards based on the estimated fair value of the RSUs at issuance dates.
Upon the 2014 termination of the RSUP, the vesting of 183,472 RSUs outstanding was accelerated and the issuance of Class A voting common stock was authorized to take place on the first business day following the first anniversary of the RSUP termination. In addition, the service period was shortened and the remaining unrecognized compensation was expensed in 2014.
The Company recognized stock based compensation expense attributable to the RSUP of $0, $1,524 and $303 for the years ended December 31, 2015, 2014 and 2013. The total income tax benefit was $0, $590 and $113. As of December 31, 2015, there was $0 unrecognized compensation cost related to non-vested shares granted under the RSUP.
F-40
Table of Contents
NOTE 20 – EARNINGS PER SHARE
Earnings per share were computed as follows:
| 2015 | 2014 | 2013 | ||||||||||
| Basic: |
||||||||||||
| Net income allocable to common stockholders |
$ | 10,123 | $ | 8,279 | $ | 6,895 | ||||||
|
|
|
|
|
|
|
|||||||
| Weighted average common shares outstanding |
6,433,503 | 6,263,867 | 7,417,490 | |||||||||
| Weighted average vested restricted stock units |
81,843 | 35,553 | 9,771 | |||||||||
|
|
|
|
|
|
|
|||||||
| Weighted average shares |
6,515,346 | 6,299,420 | 7,427,261 | |||||||||
|
|
|
|
|
|
|
|||||||
| Basic earnings per common share |
$ | 1.55 | $ | 1.31 | $ | 0.93 | ||||||
|
|
|
|
|
|
|
|||||||
| Diluted: |
||||||||||||
| Net income allocable to common stockholders |
$ | 10,123 | $ | 8,279 | $ | 6,895 | ||||||
|
|
|
|
|
|
|
|||||||
| Weighted average common shares outstanding for: |
||||||||||||
| Basic earnings per common share |
6,515,346 | 6,299,420 | 7,427,261 | |||||||||
| Dilutive effects of the assumed exercise of stock options |
44,675 | 565 | — | |||||||||
| Dilutive effects of the assumed redemption of RSU’s |
— | 73,298 | 64,759 | |||||||||
|
|
|
|
|
|
|
|||||||
| Average shares and dilutive potential common shares |
6,560,021 | 6,373,283 | 7,492,020 | |||||||||
|
|
|
|
|
|
|
|||||||
| Diluted earnings per common share |
$ | 1.54 | $ | 1.30 | $ | 0.92 | ||||||
|
|
|
|
|
|
|
|||||||
Average outstanding stock options of 365; 206,010 and 209,931 for the years ending December 31, 2015, 2014 and 2013 were not included in the computation of diluted earnings per share because the options’ were antidilutive.
NOTE 21 – FAIR VALUE
The Company uses fair value measurements to record fair value adjustments to certain assets and liabilities and to disclose the fair value of its financial instruments. Fair value is the exchange price that would be received for an asset or paid to transfer a liability (exit price) in the principal or most advantageous market for the asset or liability in an orderly transaction between market participants on the measurement date. For disclosure purposes, the Company groups its financial and non-financial assets and liabilities into three different levels based on the nature of the instrument and the availability and reliability of the information that is used to determine fair value. The three levels of inputs that may be used to measure fair values are defined as follows:
Level 1: Quoted prices (unadjusted) for identical assets or liabilities in active markets that the entity has the ability to access as of the measurement date.
Level 2: Significant other observable inputs other than Level 1 prices such as quoted prices for similar assets or liabilities; quoted prices in markets that are not active; or other inputs that are observable or can be corroborated by observable market data.
Level 3: Significant unobservable inputs that reflect a reporting entity’s own assumptions about the assumptions that market participants would use in pricing an asset or liability.
Level 1 inputs are considered to be the most transparent and reliable. The Company assumes the use of the principal market to conduct a transaction of each particular asset or liability being measured and then considers the assumptions that market participants would use when pricing the asset or liability. Whenever possible, the Company first looks for quoted prices for identical assets or liabilities in active markets (level 1 inputs) to value each asset or liability. However, when inputs from identical assets or liabilities on active markets are not available, the Company utilizes market observable data for similar assets and liabilities. The Company
F-41
Table of Contents
maximizes the use of observable inputs and limits the use of unobservable inputs to occasions when observable inputs are not available. The need to use unobservable inputs generally results from the lack of market liquidity of the actual financial instrument or of the underlying collateral. Although, in some instances, third party price indications may be available, limited trading activity can challenge the implied value of those quotations.
The following is a description of the valuation methodologies used for assets and liabilities measured at fair value, as well as the general classification of each instrument under the hierarchy:
Fair Value of Assets and Liabilities Measured on a Recurring Basis
The fair values of securities available-for-sale are carried at fair value on a recurring basis. To the extent possible, observable quoted prices in an active market are used to determine fair value and, as such, these securities are classified as level 1. For securities where quoted prices are not available, fair values are calculated based on market prices of similar securities, generally determined by matrix pricing, which is a mathematical technique widely used in the industry to value securities without relying exclusively on quoted prices for the specific securities but rather by relying on the securities’ relationship to other benchmark quoted securities (Level 2 inputs). The Company’s available-for-sale securities, including U.S. Government sponsored agencies, residential mortgage-backed securities (all of which are issued or guaranteed by government sponsored agencies), corporate securities, Small Business Administration securities, State and Political Subdivision securities, and equity securities are classified as level 2.
The fair values of derivatives are determined based on a valuation pricing model using readily available observable market parameters such as interest rate yield curves (Level 2 inputs) adjusted for credit risk attributable to the seller of the derivative.
F-42
Table of Contents
Assets and liabilities measured at fair value on a recurring basis are summarized below:
| December 31, 2015 | ||||||||||||
| (Level 1) | (Level 2) | (Level 3) | ||||||||||
| Assets: |
||||||||||||
| Available-for-sale securities: |
||||||||||||
| U.S. government-sponsored entities |
$ | — | $ | 17,036 | $ | — | ||||||
| Residential mortgage-backed securities (issued by government-sponsored entities) |
— | 109,521 | — | |||||||||
| Corporate |
— | 2,954 | — | |||||||||
| Small Business Administration loan pools |
— | 297 | — | |||||||||
| State and political subdivisions |
— | 508 | — | |||||||||
| Equity securities |
— | 494 | — | |||||||||
| Derivative assets (included in other assets) |
— | 2 | — | |||||||||
| Cash collateral held by counterparty |
24 | — | — | |||||||||
|
|
|
|
|
|
|
|||||||
| Total derivative assets |
24 | 2 | — | |||||||||
|
|
|
|
|
|
|
|||||||
| Total assets |
24 | 130,812 | — | |||||||||
|
|
|
|
|
|
|
|||||||
| Liabilities: |
||||||||||||
| Derivative liabilities (included in other liabilities) |
— | 246 | — | |||||||||
| Cash collateral held by counterparty |
(246 | ) | — | — | ||||||||
|
|
|
|
|
|
|
|||||||
| Total derivative liabilities |
(246 | ) | 246 | — | ||||||||
|
|
|
|
|
|
|
|||||||
| Total liabilities |
(246 | ) | 246 | — | ||||||||
|
|
|
|
|
|
|
|||||||
| December 31, 2014 | ||||||||||||
| (Level 1) | (Level 2) | (Level 3) | ||||||||||
| Assets: |
||||||||||||
| Available-for-sale securities: |
||||||||||||
| U.S. government-sponsored entities |
$ | — | $ | 10,400 | $ | — | ||||||
| Residential mortgage-backed securities (issued by government-sponsored entities) |
— | 36,529 | — | |||||||||
| Corporate |
— | 3,011 | — | |||||||||
| Small Business Administration loan pools |
— | 356 | — | |||||||||
| State and political subdivisions |
— | 2,193 | — | |||||||||
| Equity securities |
— | 496 | — | |||||||||
| Derivative assets (included in other assets) |
— | 11 | — | |||||||||
|
|
|
|
|
|
|
|||||||
| Total assets |
$ | — | $ | 52,996 | $ | — | ||||||
|
|
|
|
|
|
|
|||||||
There were no transfers between Levels during 2015 or 2014. The Company’s policy is to recognize transfers into or out of a level as of the end of a reporting period.
Fair Value of Assets and Liabilities Measured on a Non-recurring Basis
Certain assets are measured at fair value on a non-recurring basis when there is evidence of impairment. The fair values of impaired loans with specific allocations of the allowance for loan losses are generally based on recent real estate appraisals of the collateral. Declines in the fair values of other real estate owned subsequent to their initial acquisitions are also based on recent real estate appraisals less selling costs.
Real estate appraisals may utilize a single valuation approach or a combination of approaches including comparable sales and the income approach. Adjustments are routinely made in the appraisal process by the
F-43
Table of Contents
appraisers to adjust for differences between the comparable sales and income data available. Such adjustments are typically significant and result in a Level 3 classification of the inputs for determining fair value.
Assets measured at fair value on a non-recurring basis are summarized below:
| December 31, 2015 | ||||||||||||
| (Level 1) | (Level 2) | (Level 3) | ||||||||||
| Impaired loans: |
||||||||||||
| Commercial real estate |
$ | — | $ | — | $ | 2,986 | ||||||
| Commercial and industrial |
— | — | 57 | |||||||||
| Residential real estate |
— | — | 594 | |||||||||
| Other |
— | — | 65 | |||||||||
| Other real estate owned: |
||||||||||||
| Commercial real estate |
— | — | 524 | |||||||||
| Residential real estate |
— | — | 387 | |||||||||
| December 31, 2014 | ||||||||||||
| (Level 1) | (Level 2) | (Level 3) | ||||||||||
| Impaired loans: |
||||||||||||
| Commercial real estate |
$ | — | $ | — | $ | 4,386 | ||||||
| Commercial and industrial |
— | — | 663 | |||||||||
| Residential real estate |
— | — | 801 | |||||||||
| Other |
— | — | 158 | |||||||||
| Other real estate owned: |
||||||||||||
| Commercial real estate |
— | — | 524 | |||||||||
| Residential real estate |
— | — | 646 | |||||||||
The Company did not record any liabilities for which the fair value was measured on a non-recurring basis during the years ended December 31, 2015 and 2014.
Valuations of impaired loans and other real estate owned utilize third party appraisals or broker price opinions, and are classified as Level 3 due to the significant judgment involved. Appraisals may include the utilization of unobservable inputs, subjective factors, and utilize quantitative data to estimate fair market value.
The following table presents additional information about the unobservable inputs used in the fair value measurement of financial assets measured on a nonrecurring basis that were categorized with Level 3 of the fair value hierarchy:
| Fair Value |
Valuation Technique |
Unobservable Input |
Range (weighted average) | |||||||
| December 31, 2015 |
||||||||||
| Impaired loans |
$ | 3,702 | Sales Comparison Approach |
Adjustments for differences between comparable sales |
7% - 29% (18%) | |||||
| December 31, 2014 |
||||||||||
| Impaired loans |
$ | 6,008 | Sales Comparison Approach |
Adjustments for differences between comparable sales |
3% - 15% (7%) | |||||
Measurable inputs for other real estate owned are not material.
F-44
Table of Contents
Carrying amounts and estimated fair values of financial instruments at year end were as follows as of the date indicated:
| December 31, 2015 | ||||||||||||||||||||
| Carrying Amount |
Estimated Fair Value |
Level 1 | Level 2 | Level 3 | ||||||||||||||||
| Financial assets: |
||||||||||||||||||||
| Cash and cash equivalents |
$ | 56,829 | $ | 56,829 | $ | 56,829 | $ | — | $ | — | ||||||||||
| Interest-bearing deposits |
5,245 | 5,245 | — | 5,245 | — | |||||||||||||||
| Available-for-sale securities |
130,810 | 130,810 | — | 130,810 | — | |||||||||||||||
| Held-to-maturity securities |
310,539 | 312,802 | — | 312,802 | — | |||||||||||||||
| Loans held for sale |
3,504 | 3,504 | — | 3,504 | — | |||||||||||||||
| Loans, net of allowance for loan losses |
954,849 | 957,039 | — | — | 957,039 | |||||||||||||||
| Federal Reserve Bank and Federal Home Loan Bank stock |
11,013 | N/A | N/A | N/A | N/A | |||||||||||||||
| Interest receivable |
4,540 | 4,540 | — | 4,540 | — | |||||||||||||||
| Derivative assets |
2 | 2 | — | 2 | — | |||||||||||||||
| Cash collateral held by derivative counterparty |
24 | 24 | 24 | — | — | |||||||||||||||
|
|
|
|
|
|
|
|
|
|
|
|||||||||||
| Total derivative assets |
26 | 26 | 24 | 2 | — | |||||||||||||||
|
|
|
|
|
|
|
|
|
|
|
|||||||||||
| Total assets |
1,477,355 | 1,470,795 | 56,853 | 456,903 | 957,039 | |||||||||||||||
|
|
|
|
|
|
|
|
|
|
|
|||||||||||
| Financial liabilities: |
||||||||||||||||||||
| Deposits |
$ | 1,215,914 | $ | 1,220,657 | $ | — | $ | 1,220,657 | $ | — | ||||||||||
| Federal funds purchased and retail repurchase |
20,762 | 20,762 | — | 20,762 | — | |||||||||||||||
| Federal Home Loan Bank advances |
145,439 | 145,439 | — | 145,439 | — | |||||||||||||||
| Bank stock loan |
18,612 | 18,612 | — | 18,612 | — | |||||||||||||||
| Subordinated debentures |
9,251 | 9,251 | — | 9,251 | — | |||||||||||||||
| Contractual obligations |
3,093 | 3,093 | — | 3,093 | — | |||||||||||||||
| Interest payable |
737 | 737 | — | 737 | — | |||||||||||||||
| Derivative liabilities |
246 | 246 | — | 246 | — | |||||||||||||||
| Cash collateral held by derivative counterparty |
(246 | ) | (246 | ) | (246 | ) | — | — | ||||||||||||
|
|
|
|
|
|
|
|
|
|
|
|||||||||||
| Total derivative liabilities |
— | — | (246 | ) | 246 | — | ||||||||||||||
|
|
|
|
|
|
|
|
|
|
|
|||||||||||
| Total liabilities |
1,413,808 | 1,418,551 | (246 | ) | 1,418,797 | — | ||||||||||||||
|
|
|
|
|
|
|
|
|
|
|
|||||||||||
F-45
Table of Contents
| December 31, 2014 | ||||||||||||||||||||
| Carrying Amount |
Estimated Fair Value |
Level 1 | Level 2 | Level 3 | ||||||||||||||||
| Financial assets: |
||||||||||||||||||||
| Cash and cash equivalents |
$ | 31,707 | $ | 31,707 | $ | 31,707 | $ | — | $ | — | ||||||||||
| Interest-bearing deposits |
5,995 | 5,995 | — | 5,995 | — | |||||||||||||||
| Available-for-sale securities |
52,985 | 52,985 | — | 52,985 | — | |||||||||||||||
| Held-to-maturity securities |
261,017 | 265,189 | — | 265,189 | — | |||||||||||||||
| Loans held for sale |
897 | 897 | — | 897 | — | |||||||||||||||
| Loans, net of allowance for loan losses |
719,913 | 717,141 | — | — | 717,141 | |||||||||||||||
| Federal Reserve Bank and Federal Home Loan Bank stock |
4,312 | N/A | N/A | N/A | N/A | |||||||||||||||
| Interest receivable |
3,589 | 3,589 | — | 3,589 | — | |||||||||||||||
| Derivative assets |
11 | 11 | — | 11 | — | |||||||||||||||
|
|
|
|
|
|
|
|
|
|
|
|||||||||||
| Total assets |
1,080,426 | 1,077,514 | 31,707 | 328,666 | 717,141 | |||||||||||||||
|
|
|
|
|
|
|
|
|
|
|
|||||||||||
| Financial liabilities: |
||||||||||||||||||||
| Deposits |
$ | 981,177 | $ | 982,645 | $ | — | $ | 982,645 | $ | — | ||||||||||
| Federal funds purchased and retail repurchase agreements |
25,301 | 25,301 | — | 25,301 | — | |||||||||||||||
| Federal Home Loan Bank advances |
20,976 | 21,207 | — | 21,207 | — | |||||||||||||||
| Bank stock loan |
15,152 | 15,152 | — | 15,152 | — | |||||||||||||||
| Subordinated debentures |
8,941 | 8,941 | — | 8,941 | — | |||||||||||||||
| Contractual obligations |
3,146 | 3,146 | — | 3,146 | — | |||||||||||||||
| Interest payable |
631 | 631 | — | 631 | — | |||||||||||||||
|
|
|
|
|
|
|
|
|
|
|
|||||||||||
| Total liabilities |
1,055,324 | 1,057,023 | — | 1,057,023 | — | |||||||||||||||
|
|
|
|
|
|
|
|
|
|
|
|||||||||||
The methods and assumptions, not previously presented, used to estimate fair values are described as follows:
Cash and cash equivalents and interest-bearing deposits: The carrying amounts of cash and short-term instruments approximate fair values.
Held-to-maturity securities: The fair value of held-to-maturity securities are determined in a manner consistent with available-for-sale securities which has been previously discussed.
Loans held for sale: The fair values of loans held for sale are based on quoted market prices for loans with similar characteristics.
Loans: Fair values of variable rate loans that reprice frequently and with no significant change in credit risk are based on carrying values. Fair values of other loans are estimated using discounted cash flows analyses, using interest rates currently being offered for loans with similar terms to borrowers of similar credit quality. The methods utilized to estimate the fair value of loans do not necessarily represent an exit price.
Federal Reserve Bank and Federal Home Loan Bank stock: It is not practical to determine the fair value of Federal Reserve Bank and Federal Home Loan Bank stock due to restrictions placed on its transferability.
Interest receivable and interest payable: The carrying amounts of accrued interest receivable and payable approximate their fair values.
Deposits: The fair values disclosed for demand deposits are, by definition, equal to the amount payable on demand at the reporting date (i.e., their carrying amount). The carrying amount of variable rate, fixed-term money market accounts and certificates of deposit approximate their fair values at the reporting date. Fair values for fixed rate certificates of deposit are estimated using a discounted cash flows calculation that applies interest rates currently being offered.
Federal funds purchased and retail repurchase agreements: Federal funds purchased and retail repurchase agreements mature daily and may be terminated at any time. The carrying amounts of these financial instruments approximate their fair values.
F-46
Table of Contents
Federal Home Loan Bank Advances: The carrying amounts of draws against the Company’s line of credit at the Federal Home Loan Bank approximate their fair values. The fair values of fixed rate term advances are determined using discounted cash flow analyses based on the current borrowing rates for similar types of borrowing arrangements.
Bank stock loan: The fair value of the bank stock loan was estimated using a discounted cash flow analysis based on current borrowing rates for similar types of borrowing arrangements.
Subordinated debentures: Subordinated debentures are carried at the outstanding principal balance less an unamortized fair value adjustment from the date of assumption. The outstanding principal balance, net of this adjustment, approximates their fair value.
Contractual obligations: The carrying value of contractual obligations approximate their fair value.
The fair value of off-balance-sheet items is not considered material.
NOTE 22 – COMMITMENTS AND CREDIT RISK
The Company extends credit for commercial real estate mortgages, residential mortgages, working capital financing and loans to businesses and consumers.
Commitments to Originate Loans and Available Lines of Credit:
Commitments to originate loans and available lines of credit are agreements to lend to a customer as long as there is no violation of any condition established in the contract. Commitments and lines of credit generally have fixed expiration dates or other termination clauses and may require payment of a fee. Since a portion of the commitments and lines of credit may expire without being drawn upon, the total commitment and lines of credit amounts do not necessarily represent future cash requirements. Each customer’s creditworthiness is evaluated on a case-by-case basis. The amount of collateral obtained, if deemed necessary, is based on management’s credit evaluation of the counterparty. Collateral held varies, but may include accounts receivable, inventory, property, plant and equipment, commercial real estate, and residential real estate. Mortgage loans in the process of origination represent amounts that the Company plans to fund within a normal period of 60 to 90 days, and which are intended for sale to investors in the secondary market.
The contractual amounts of commitments to originate loans and available lines of credit as of December 31, 2015 and 2014 were as follows:
| December 31, 2015 | December 31, 2014 | |||||||||||||||
| Fixed Rate |
Variable Rate |
Fixed Rate |
Variable Rate |
|||||||||||||
| Commitments to make loans |
$ | 30,261 | $ | 55,694 | $ | 9,791 | $ | 15,776 | ||||||||
| Mortgage loans in the process of origination |
5,116 | 1,941 | 2,175 | 761 | ||||||||||||
| Unused lines of credit |
44,392 | 55,769 | 32,447 | 48,290 | ||||||||||||
The fixed rate loan commitments have interest rates ranging from 2.15% to 8.50% and maturities ranging from 6 months to 24 months.
F-47
Table of Contents
Standby Letters of Credit:
Standby letters of credit are irrevocable commitments issued by the Company to guarantee the performance of a customer to a third party once specified pre-conditions are met. Financial standby letters of credit are primarily issued to support public and private borrowing arrangements, including commercial paper, bond financing, and similar transactions. Performance standby letters of credit are issued to guarantee performance of certain customers under non-financial contractual obligations. The credit risk involved in issuing standby letters of credit is essentially the same as that involved in extending loans to customers. The contractual amounts of standby letters of credit as of December 31, 2015 and 2014 were as follows:
| December 31, 2015 | December 31, 2014 | |||||||||||||||
| Fixed Rate |
Variable Rate |
Fixed Rate |
Variable Rate |
|||||||||||||
| Standby letters of credit |
$ | 3,588 | $ | 1,253 | $ | 2,093 | $ | 616 | ||||||||
NOTE 23 – LEGAL MATTERS
The Company is party to various matters of litigation in the ordinary course of business. The Company periodically reviews all outstanding pending or threatened legal proceedings and determines if such matters will have an adverse effect on the business, financial condition or results of operations or cash flows. A loss contingency is recorded when the outcome is probable and reasonably able to be estimated. The following loss contingencies have been identified by the Company as reasonably possible to result in an unfavorable outcome for the Company .
Equity Bank is a party to a February 3, 2015 lawsuit filed against it by CitiMortgage, Inc. The lawsuit involves an alleged breach of contract related to loan repurchase obligations and damages of $2,700 plus pre-judgment and post-judgment interest. At this stage of the litigation it is difficult to estimate any potential loss, however Equity Bank believes it has numerous and meritorious defenses to the claims and anticipates contesting the matter vigorously.
At December 31, 2014, Equity Bank and U.S. Bank (“USB”) were parties to lawsuits filed against each other. These lawsuits involved loan-repurchase demands made by USB and allegations by Equity Bank that USB withheld servicing release premiums (profits) on loans sold by Equity Bank to USB, and also that USB had interfered with a 2012 business combination. In June 2015, Equity Bank and USB settled the lawsuits filed against each other.
Except for the above mentioned lawsuit and settlement, there have been no other claims for potential repurchase or indemnification demands regarding mortgage loans originated by Equity Bank and sold to investors. However, the Company believes there is possible risk it may face similar demands based on comparable demands loan aggregators are facing from their investors, including Government Sponsored Entities such as Freddie Mac and Fannie Mae, and or settlement agreements loan aggregators have entered into with those investors. The amount of potential loss and outcome of such possible litigation, if it were commenced, is uncertain and the Company would vigorously contest any claims.
The Company currently does not believe that it is probable that these matters will result in a material unfavorable outcome for the Company. An estimate of the potential losses from these matters cannot be made at this time as the Company intends to vigorously defend these matters and believes it has meritorious defenses to these potential claims.
F-48
Table of Contents
NOTE 24 – CONDENSED FINANCIAL INFORMATION (PARENT COMPANY ONLY)
Presented below is the condensed financial information as to financial position, results of operations, and cash flows of the Parent Company:
CONSOLIDATED BALANCE SHEET
| 2015 | 2014 | |||||||
| ASSETS |
||||||||
| Cash and due from banks |
$ | 43,912 | $ | 6,649 | ||||
| Investment in Equity Bank |
150,152 | 134,096 | ||||||
| Other assets |
1,678 | 774 | ||||||
|
|
|
|
|
|||||
| Total assets |
$ | 195,742 | $ | 141,519 | ||||
|
|
|
|
|
|||||
| LIABILITIES AND STOCKHOLDERS’ EQUITY |
||||||||
| Liabilities |
$ | 28,509 | $ | 23,790 | ||||
| Stockholders’ equity |
167,233 | 117,729 | ||||||
|
|
|
|
|
|||||
| Total liabilities and stockholders’ equity |
$ | 195,742 | $ | 141,519 | ||||
|
|
|
|
|
|||||
CONDENSED STATEMENT OF INCOME
| 2015 | 2014 | 2013 | ||||||||||
| Dividend from Equity Bank |
$ | 10,500 | $ | 7,700 | $ | — | ||||||
| Other income |
2 | — | — | |||||||||
|
|
|
|
|
|
|
|||||||
| Total income |
10,502 | 7,700 | — | |||||||||
| Expenses |
||||||||||||
| Interest expense |
1,284 | 929 | 642 | |||||||||
| Other expenses |
1,336 | 744 | 310 | |||||||||
|
|
|
|
|
|
|
|||||||
| Total expenses |
2,620 | 1,673 | 952 | |||||||||
|
|
|
|
|
|
|
|||||||
| Income (loss) before income tax and equity in undistributed income of subsidiaries |
7,882 | 6,027 | (952 | ) | ||||||||
| Income tax benefit |
858 | 529 | 324 | |||||||||
|
|
|
|
|
|
|
|||||||
| Income (loss) before equity in undistributed income (loss) of subsidiaries |
8,740 | 6,556 | (628 | ) | ||||||||
| Equity in undistributed income of Equity Bank |
1,560 | 2,431 | 8,501 | |||||||||
|
|
|
|
|
|
|
|||||||
| Net income |
10,300 | 8,987 | 7,873 | |||||||||
| Dividends and discount accretion on preferred stock |
(177 | ) | (708 | ) | (978 | ) | ||||||
|
|
|
|
|
|
|
|||||||
| Net income allocable to common stockholders |
$ | 10,123 | $ | 8,279 | $ | 6,895 | ||||||
|
|
|
|
|
|
|
|||||||
F-49
Table of Contents
CONDENSED STATEMENT OF CASH FLOWS
| 2015 | 2014 | 2013 | ||||||||||
| Cash flows from operating activities |
||||||||||||
| Net income |
$ | 10,300 | $ | 8,987 | $ | 7,873 | ||||||
| Adjustments to reconcile net income to net cash from operating activities: |
||||||||||||
| Stock based compensation |
531 | 2,006 | 536 | |||||||||
| Equity in undistributed income of Equity Bank |
(1,560 | ) | (2,431 | ) | (8,501 | ) | ||||||
| Net amortization of purchase valuation adjustments |
301 | 301 | 300 | |||||||||
| Net change in: |
||||||||||||
| Other assets |
(344 | ) | (776 | ) | (736 | ) | ||||||
| Interest payable and other liabilities |
397 | (410 | ) | (918 | ) | |||||||
|
|
|
|
|
|
|
|||||||
| Net cash from (to) operating activities |
9,625 | 7,677 | (1,446 | ) | ||||||||
| Cash flows (to) from investing activities |
||||||||||||
| Purchase stock of First Independence, net of holding company cash acquired |
(14,585 | ) | — | — | ||||||||
|
|
|
|
|
|
|
|||||||
| Net cash (used in) investing activities |
(14,585 | ) | — | — | ||||||||
| Cash flows (to) from financing activities |
||||||||||||
| Borrowings on bank stock loan |
5,014 | 15,540 | — | |||||||||
| Principal payments on bank stock loan |
(1,554 | ) | (388 | ) | — | |||||||
| Proceeds from the issuance of common stock, net |
38,945 | — | — | |||||||||
| Issuance of employee stock loan |
(1,215 | ) | — | — | ||||||||
| Principal payments on employee stock loan |
973 | — | — | |||||||||
| Redemption of Series A and Series B preferred stock |
— | (15,540 | ) | — | ||||||||
| Purchase of treasury stock |
— | (17,221 | ) | (571 | ) | |||||||
| Dividends paid on preferred stock |
(164 | ) | (804 | ) | (970 | ) | ||||||
| Excess tax benefits as a result of the distribution of common stock in termination of the restricted stock unit plan recognized as an increase in additional paid-in capital |
224 | — | — | |||||||||
|
|
|
|
|
|
|
|||||||
| Net cash provided by (used in) financing activities |
42,223 | (18,413 | ) | (1,541 | ) | |||||||
|
|
|
|
|
|
|
|||||||
| Net change in cash and cash equivalents |
37,263 | (10,736 | ) | (2,987 | ) | |||||||
| Cash and cash equivalents, beginning of period |
6,649 | 17,385 | 20,372 | |||||||||
|
|
|
|
|
|
|
|||||||
| Ending cash and cash equivalents |
$ | 43,912 | $ | 6,649 | $ | 17,385 | ||||||
|
|
|
|
|
|
|
|||||||
F-50