Attached files
| file | filename |
|---|---|
| 8-K - 8-K - AECOM | a16-6691_18k.htm |
Exhibit 99.1
AECOM March 2016
Safe Harbor Except for historical information contained herein, this presentation contains “forward-looking statements.” All statements other than statements of historical fact are “forward-looking statements” for purposes of federal and state securities laws, including any projections of earnings, revenue, cash flows, tax rate, share count, amortization, acquisition and integration costs, or other financial items; any statements of the plans, strategies and objectives for future operations; any statements regarding future economic conditions or performance; any statements of belief; and any statements of assumptions underlying any of the foregoing. Forward-looking statements may include the words “may,” “will,” “estimate,” “intend,” “continue,” “believe,” “expect” or “anticipate” and other similar words. Although we believe that the expectations reflected in any of our forward-looking statements are reasonable, actual results could differ materially from those projected or assumed in any of our forward-looking statements. Our future financial condition and results of operations, as well as any forward-looking statements, are subject to change and to inherent risks and uncertainties, such as those disclosed in this presentation. Important factors that could cause our actual results, performance and achievements, or industry results to differ materially from estimates or projections contained in forward-looking statements include, among others, the following: demand for our services is cyclical; uncertainties related to government contract appropriations; governmental agencies may modify, curtail or terminate our contracts; government contracts are subject to audits and adjustments of contractual terms; losses under fixed-price contracts; limited control over operations run through our joint venture entities; misconduct by our employees or consultants or our failure to comply with laws or regulations applicable to our business; our leveraged position and ability to service our debt; exposure to legal, political and economic risks in different countries as well as currency exchange rate fluctuations; the failure to retain and recruit key technical and management personnel; our insurance policies may not provide adequate coverage; unexpected adjustments and cancellations related to our backlog; dependence on third party contractors who fail to satisfy their obligations; systems and information technology interruption; and changing client preferences/demands, fiscal positions and payment patterns. Additional factors that could cause actual results to differ materially from our forward-looking statements are set forth in our Quarterly Report on Form 10-Q for the period ended December 31, 2015, and our other filings with the Securities and Exchange Commission. We do not intend, and undertake no obligation, to update any forward-looking statement. Non-GAAP Measures Certain measures contained in this presentation are not calculated in accordance with generally accepted accounting principles (GAAP) and should not be considered a replacement for GAAP results. Non-GAAP financial measures appearing in the presentation are identified in the footnotes. A reconciliation of these non-GAAP measures to the most directly comparable GAAP financial measures is found in the attached appendix and in our earnings releases on the Investors section of our website at: http://investors.aecom.com. Disclosures Page 2 Page 2
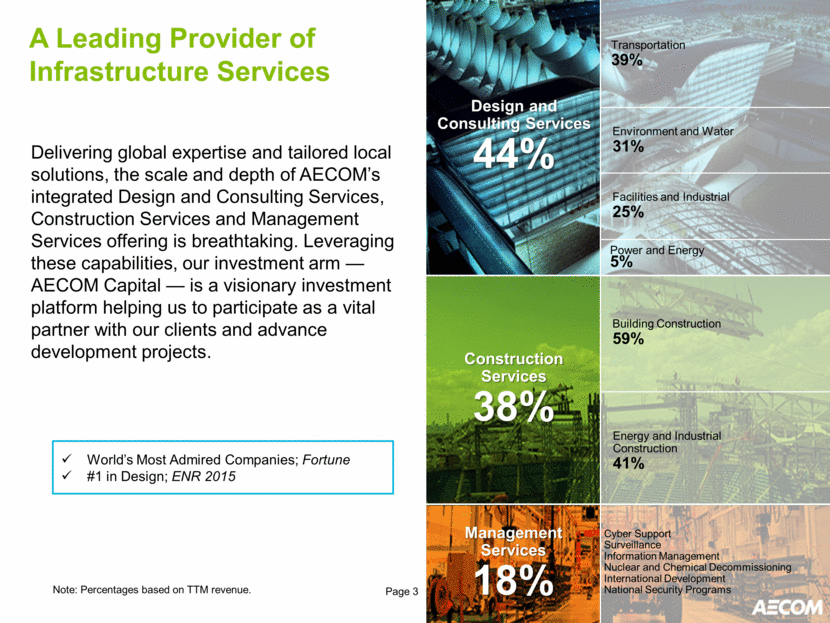
A Leading Provider of Infrastructure Services Design and Consulting Services 44% Construction Services 38% Management Services 18% Transportation 39% Environment and Water 31% Facilities and Industrial 25% Power and Energy 5% Building Construction 59% Energy and Industrial Construction 41% Cyber Support Surveillance Information Management Nuclear and Chemical Decommissioning International Development National Security Programs Delivering global expertise and tailored local solutions, the scale and depth of AECOM’s integrated Design and Consulting Services, Construction Services and Management Services offering is breathtaking. Leveraging these capabilities, our investment arm — AECOM Capital — is a visionary investment platform helping us to participate as a vital partner with our clients and advance development projects. World’s Most Admired Companies; Fortune #1 in Design; ENR 2015 Note: Percentages based on TTM revenue. Page 3
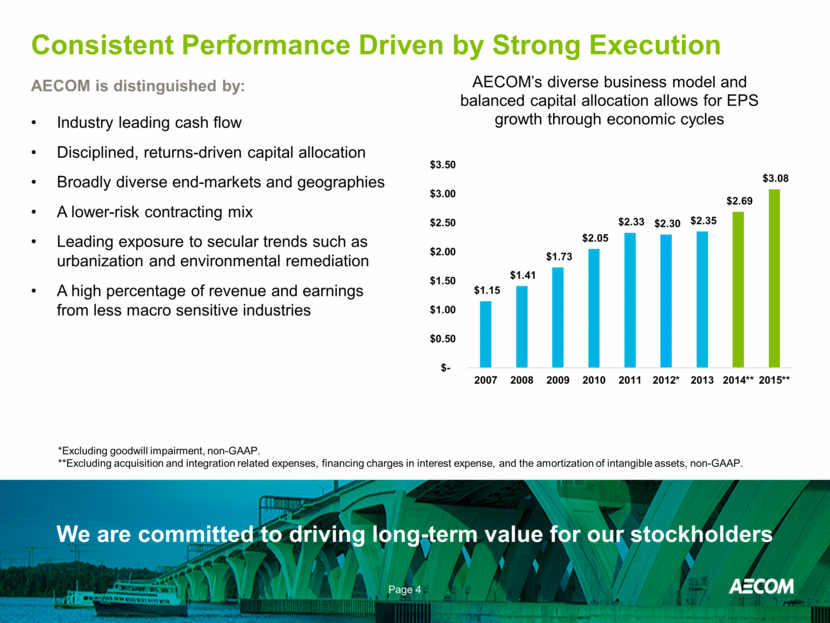
Consistent Performance Driven by Strong Execution AECOM is distinguished by: Industry leading cash flow Disciplined, returns-driven capital allocation Broadly diverse end-markets and geographies A lower-risk contracting mix Leading exposure to secular trends such as urbanization and environmental remediation A high percentage of revenue and earnings from less macro sensitive industries We are committed to driving long-term value for our stockholders Page 4 *Excluding goodwill impairment, non-GAAP. **Excluding acquisition and integration related expenses, financing charges in interest expense, and the amortization of intangible assets, non-GAAP. $1.15 $1.41 $1.73 $2.05 $2.33 $2.30 $2.35 $2.69 $3.08 $- $0.50 $1.00 $1.50 $2.00 $2.50 $3.00 $3.50 2007 2008 2009 2010 2011 2012* 2013 2014** 2015** AECOM’s diverse business model and balanced capital allocation allows for EPS growth through economic cycles
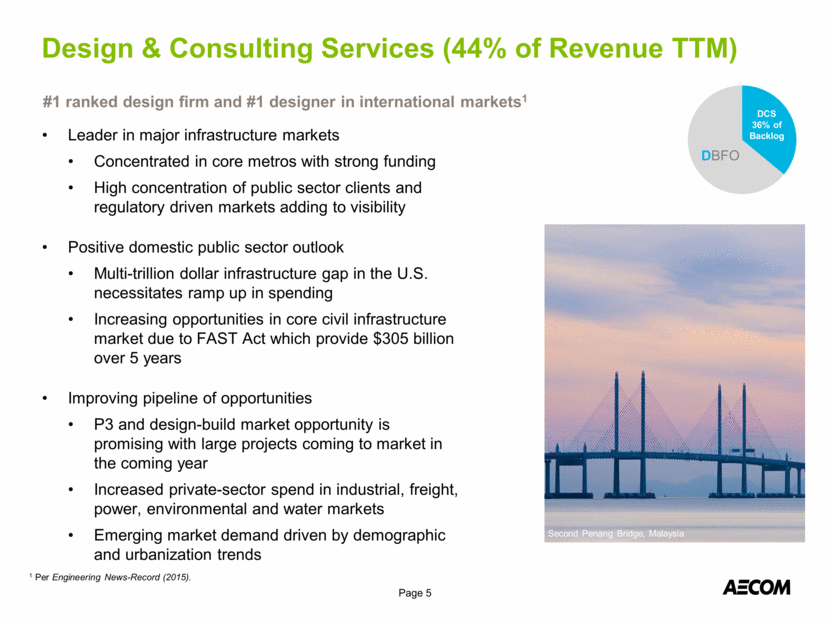
Design & Consulting Services (44% of Revenue TTM) Page 5 1 Per Engineering News-Record (2015). DCS 36% of Backlog DBFO Leader in major infrastructure markets Concentrated in core metros with strong funding High concentration of public sector clients and regulatory driven markets adding to visibility Positive domestic public sector outlook Multi-trillion dollar infrastructure gap in the U.S. necessitates ramp up in spending Increasing opportunities in core civil infrastructure market due to FAST Act which provide $305 billion over 5 years Improving pipeline of opportunities P3 and design-build market opportunity is promising with large projects coming to market in the coming year Increased private-sector spend in industrial, freight, power, environmental and water markets Emerging market demand driven by demographic and urbanization trends #1 ranked design firm and #1 designer in international markets1 Page 5 Second Penang Bridge, Malaysia DCS 35% of Backlog
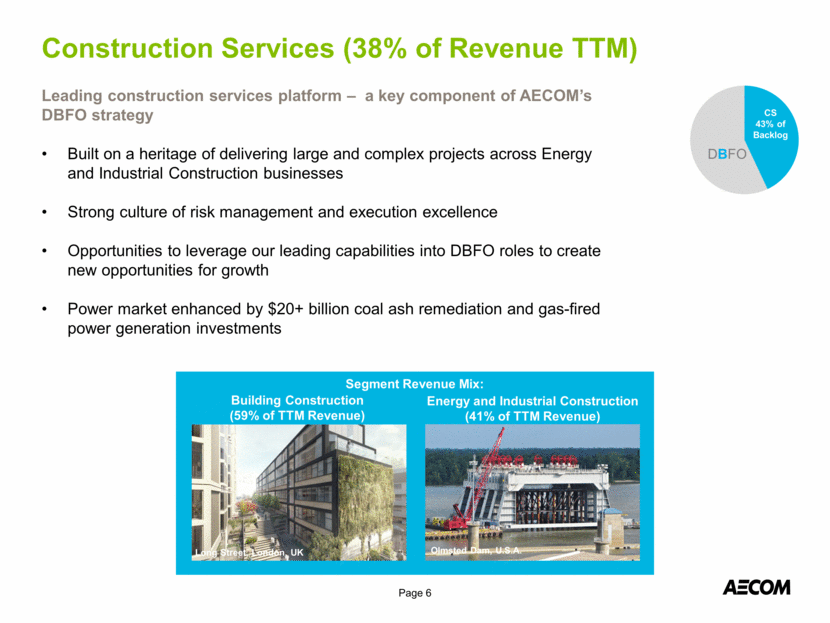
Construction Services (38% of Revenue TTM) Page 6 Leading construction services platform – a key component of AECOM’s DBFO strategy Built on a heritage of delivering large and complex projects across Energy and Industrial Construction businesses Strong culture of risk management and execution excellence Opportunities to leverage our leading capabilities into DBFO roles to create new opportunities for growth Power market enhanced by $20+ billion coal ash remediation and gas-fired power generation investments DBFO CS 43% of Backlog Page 6 Segment Revenue Mix: Energy and Industrial Construction (41% of TTM Revenue) Olmsted Dam, U.S.A. Building Construction (59% of TTM Revenue) Long Street, London, UK CS 40% of Backlog
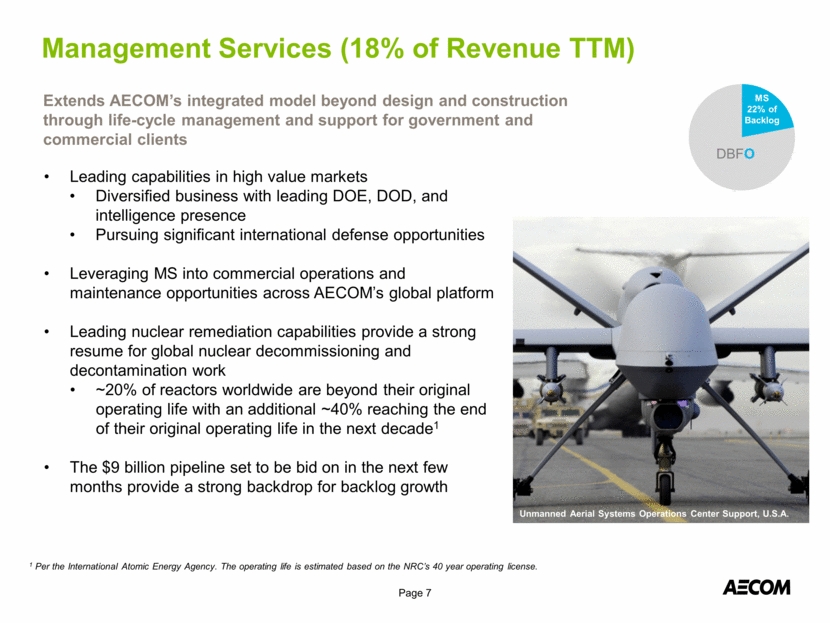
Management Services (18% of Revenue TTM) Page 7 DBFO MS 22% of Backlog Page 7 Leading capabilities in high value markets Diversified business with leading DOE, DOD, and intelligence presence Pursuing significant international defense opportunities Leveraging MS into commercial operations and maintenance opportunities across AECOM’s global platform Leading nuclear remediation capabilities provide a strong resume for global nuclear decommissioning and decontamination work ~20% of reactors worldwide are beyond their original operating life with an additional ~40% reaching the end of their original operating life in the next decade1 The $9 billion pipeline set to be bid on in the next few months provide a strong backdrop for backlog growth Extends AECOM’s integrated model beyond design and construction through life-cycle management and support for government and commercial clients 1 Per the International Atomic Energy Agency. The operating life is estimated based on the NRC’s 40 year operating license. Unmanned Aerial Systems Operations Center Support, U.S.A. MS 25% of Backlog
AECOM Capital Page 8 Founded in 2013, AECOM Capital is a platform for investing in public infrastructure and private real estate opportunities $200 million of capital committed since inception, representing 7.5 million square feet and $3.5 billion in real estate investments Expect to begin realizing embedded gains this year; anticipate continued EPS contribution as our current portfolio matures and we expand our investments Recent investment in Muskingum River Hydro project marks our first private-to-private non-real estate investment; highlights the strength of our broad capabilities ACAP has driven significant backlog to our Construction Services segment DBFO Targeting at least 20% IRR on real estate investments Provost Square, New Jersey, U.S.A. Metropolis, California, U.S.A. Page 8
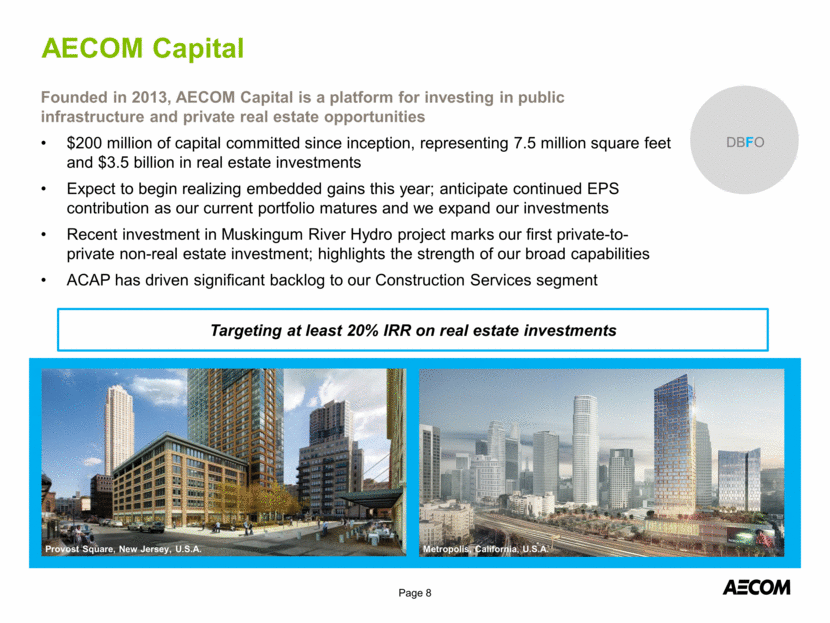
Q1 FY16 Business Highlights & Outlook Construction Services Organic revenue growth of 6% driven by building construction; offset by contemplated reduction in Oil & Gas revenue Expanding building construction into new geographies Regulatory-driven power and coal-ash opportunities Oil & Gas cost reductions drive improved financial performance Design & Consulting Services 5-year domestic transportation bill and better state & local prospects Improving trends in environmental, water and power markets 1.2x TTM book-to-burn1 in the Americas Global urbanization a secular growth driver Management Services Contracted backlog up 6% YoY $35 billion pipeline of pursuits and recent omnibus bill set the table for strong performance in FY16 Project execution driving results Growing cyber, intelligence, and surveillance markets Expanding opportunities with friendly foreign governments and commercial clients Page 9 1 Book-to-burn ratio is defined as the amount of new business divided by the revenue recognized during the period. Cleveland Clinic, Abu Dhabi, UAE VTB Arena Park, Moscow, Russia Hanford Tank Farm, Washington, U.S.A.
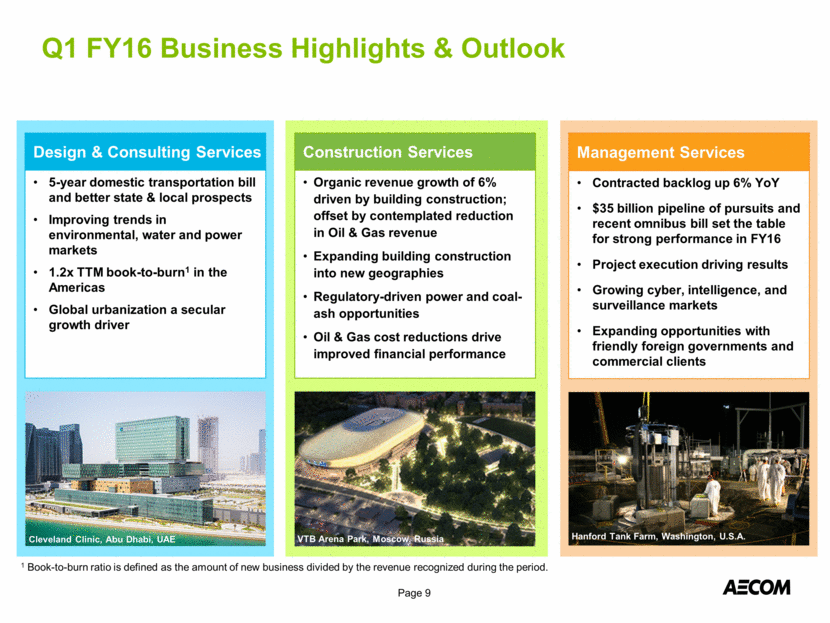
1Q FY16 Highlights Free cash flow1 of $77 million; debt reduction of $84 million Repaid over $800 million in debt subsequent to closing the URS transaction in FY15 $59 million in proceeds from disposals of assets and businesses FY11- 1Q FY16 Highlights Cumulative FCF1,2 of $2.0 billion; exceeded net income Repurchased $660 million of stock Capital Allocation Priorities Expect to generate $600-$800 million of FCF1/year from FY16 to FY17 Maintain flexibility to respond to changes in financial market conditions Page 10 Cash Generation and Capital Allocation Highlights Page 10 1 Free cash flow is defined as cash flow from operations less capital expenditures net of proceeds from disposals and is a non-GAAP measure. 2 Excludes the impact of settlement of the Deferred Compensation Plan in FY11. Stepney Green, Crossrail, London, UK
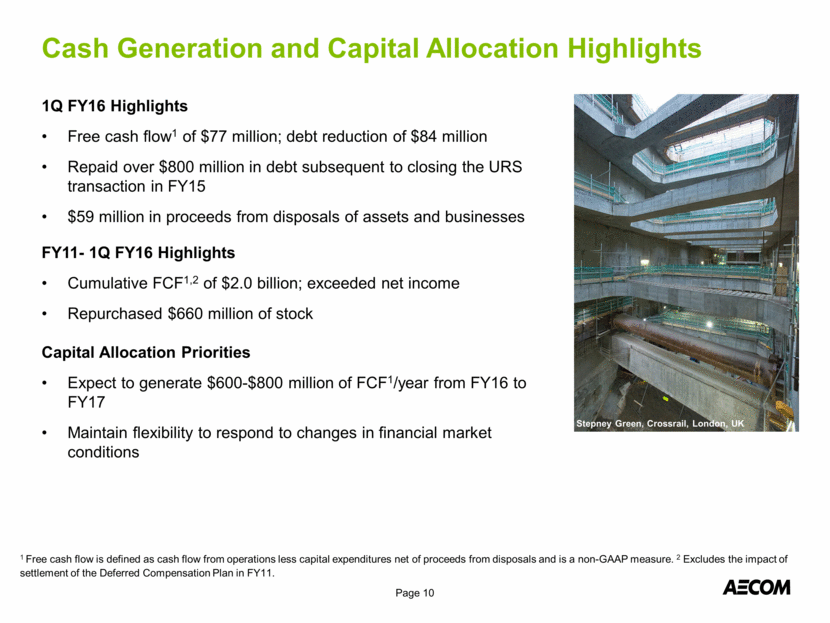
Executing Our Strategy – Diversified Platform Page 11 Page 11 11% 14% 23% 52% Private Non-U.S. Government U.S. State/Local U.S. Federal 9% 71% 14% U.S. Asia-Pacific EMEA Canada 6% 22% 49% 28% GMP Fixed Price Cost Plus Hard Bid 1% Note: End Markets, Geographies and Funding Sources based on Q1 FY16 TTM Revenue where work is performed. Contract Type based on Q1 FY16 Backlog. Funding Sources (Revenue) Geographies (Revenue) Contract Type (Contracted Backlog) 14% 19% 18% 7% 37% Power Environmental/Water Facilities/ Industrial Federal/ Support Services Transportation Oil & Gas 5% End Markets (Revenue)
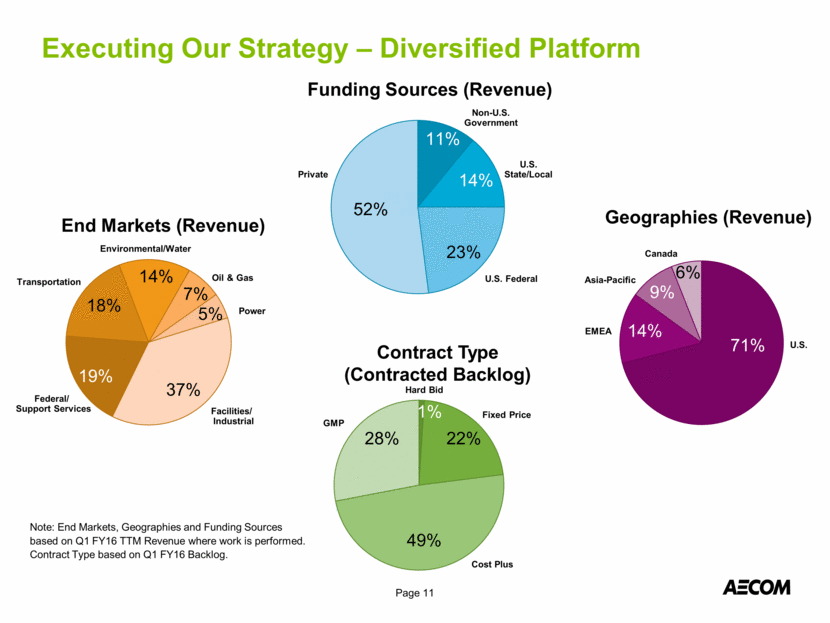
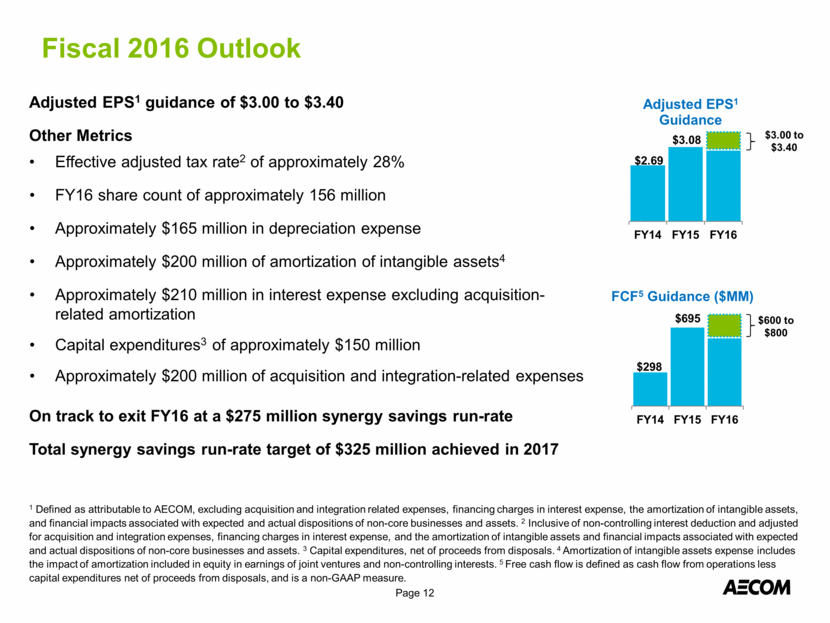
Fiscal 2016 Outlook Page 12 Page 12 Adjusted EPS1 guidance of $3.00 to $3.40 Other Metrics Effective adjusted tax rate2 of approximately 28% FY16 share count of approximately 156 million Approximately $165 million in depreciation expense Approximately $200 million of amortization of intangible assets4 Approximately $210 million in interest expense excluding acquisition-related amortization Capital expenditures3 of approximately $150 million Approximately $200 million of acquisition and integration-related expenses On track to exit FY16 at a $275 million synergy savings run-rate Total synergy savings run-rate target of $325 million achieved in 2017 $3.00 to $3.40 $600 to $800 1 Defined as attributable to AECOM, excluding acquisition and integration related expenses, financing charges in interest expense, the amortization of intangible assets, and financial impacts associated with expected and actual dispositions of non-core businesses and assets. 2 Inclusive of non-controlling interest deduction and adjusted for acquisition and integration expenses, financing charges in interest expense, and the amortization of intangible assets and financial impacts associated with expected and actual dispositions of non-core businesses and assets. 3 Capital expenditures, net of proceeds from disposals. 4 Amortization of intangible assets expense includes the impact of amortization included in equity in earnings of joint ventures and non-controlling interests. 5 Free cash flow is defined as cash flow from operations less capital expenditures net of proceeds from disposals, and is a non-GAAP measure. $2.69 $3.08 FY14 FY15 FY16 Adjusted EPS 1 Guidance $298 $695 FY14 FY15 FY16 FCF 5 Guidance ($ MM)
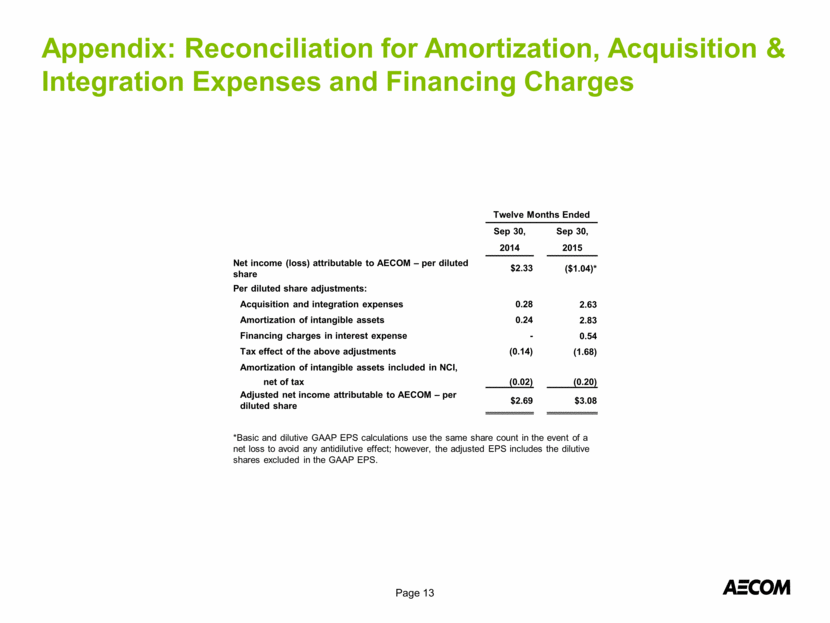
Appendix: Reconciliation for Amortization, Acquisition & Integration Expenses and Financing Charges Page 13 Page 13 Twelve Months Ended Sep 30, Sep 30, 2014 2015 Net income (loss) attributable to AECOM – per diluted share $2.33 ($1.04)* Per diluted share adjustments: Acquisition and integration expenses 0.28 2.63 Amortization of intangible assets 0.24 2.83 Financing charges in interest expense - 0.54 Tax effect of the above adjustments (0.14) (1.68) Amortization of intangible assets included in NCI, net of tax (0.02) (0.20) Adjusted net income attributable to AECOM – per diluted share $2.69 $3.08 *Basic and dilutive GAAP EPS calculations use the same share count in the event of a net loss to avoid any antidilutive effect; however, the adjusted EPS includes the dilutive shares excluded in the GAAP EPS.
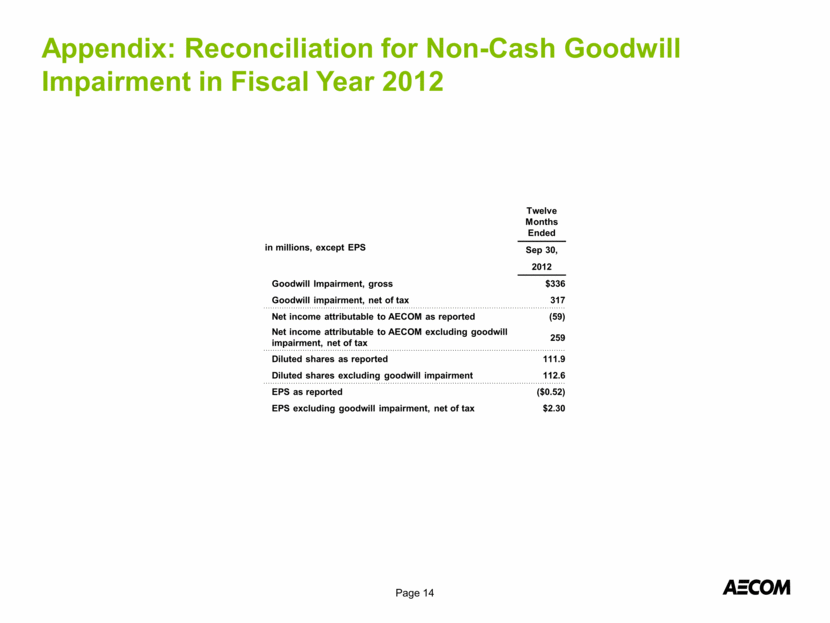
Appendix: Reconciliation for Non-Cash Goodwill Impairment in Fiscal Year 2012 Page 14 Page 14 Twelve Months Ended in millions, except EPS Sep 30, 2012 Goodwill Impairment, gross $336 Goodwill impairment, net of tax 317 Net income attributable to AECOM as reported (59) Net income attributable to AECOM excluding goodwill impairment, net of tax 259 Diluted shares as reported 111.9 Diluted shares excluding goodwill impairment 112.6 EPS as reported ($0.52) EPS excluding goodwill impairment, net of tax $2.30
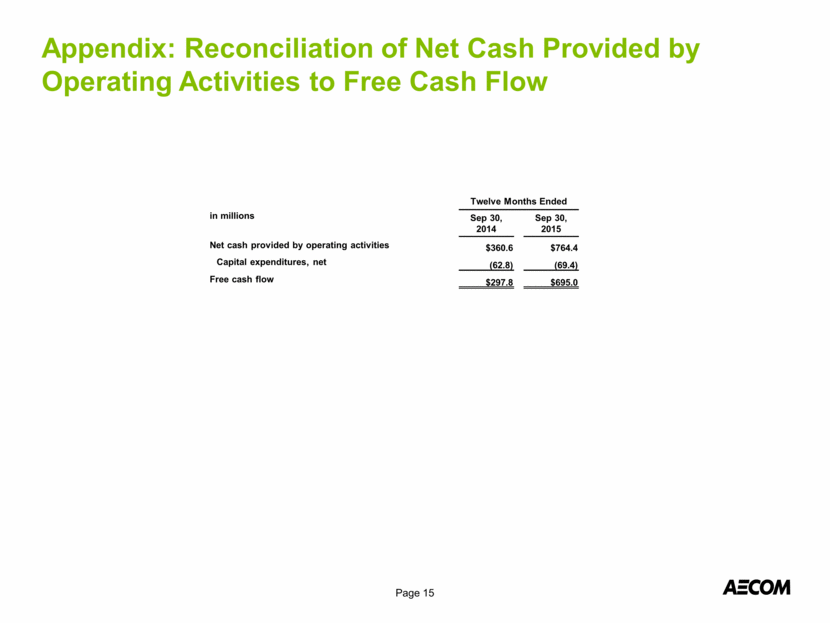
Appendix: Reconciliation of Net Cash Provided by Operating Activities to Free Cash Flow Page 15 Page 15 Twelve Months Ended in millions Sep 30, 2014 Sep 30, 2015 Net cash provided by operating activities $360.6 $764.4 Capital expenditures, net (62.8) (69.4) Free cash flow $297.8 $695.0
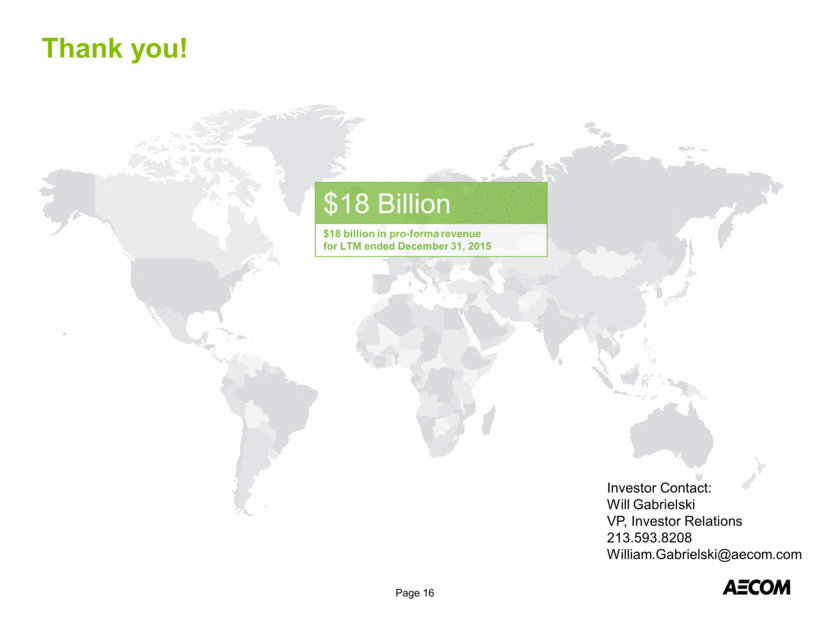
Thank you! Page 16 $18 Billion $18 billion in pro-forma revenue for LTM ended December 31, 2015 Page 16 Investor Contact: Will Gabrielski VP, Investor Relations 213.593.8208 William.Gabrielski@aecom.com
