Attached files
| file | filename |
|---|---|
| 8-K - 8-K - TESARO, Inc. | a16-6379_28k.htm |
Exhibit 99.1
CORPORATE PRESENTATION March 2016

Safe Harbor Statement To the extent that statements contained in this presentation are not descriptions of historical facts regarding TESARO, they are forward-looking statements reflecting the current beliefs and expectations of management made pursuant to the safe harbor provisions of the Private Securities Litigation Reform Act of 1995. Words such as "may," "will," "expect," "anticipate," "estimate," "intend," and similar expressions (as well as other words or expressions referencing future events, conditions, or circumstances) are intended to identify forward-looking statements. Examples of forward-looking statements contained in this press release include, among others, statements regarding our projected VARUBI P&L break-even revenue run rate, our vision of becoming a leading oncology-focused biopharmaceutical company, our plans to expand niraparib development into additional therapeutic areas, our expectation to have NOVA and QUADRA data in the second quarter of 2016, the expected timing of the oral rolapitant MAA submission and other regulatory filings with respect to our product candidates, the expected timing of data from our various clinical trials, our plans regarding future clinical trials with niraparib, statements regarding our various 2016 corporate goals, the estimated time periods when we expect clinical trials to commence or be completed, statements regarding our expectations about the timing of both the selection of clinical candidates from our immuno-oncology programs and the commencement of clinical testing for those candidates, and statements regarding the potential market opportunity for our products or product candidates. Forward-looking statements in this release involve substantial risks and uncertainties that could cause our research and pre-clinical development programs, clinical development programs, future results, performance, or achievements to differ significantly from those expressed or implied by the forward-looking statements. Such risks and uncertainties include, among others, the uncertainties inherent in the execution and completion of clinical trials, uncertainties surrounding the timing of availability of data from our clinical trials, risks regarding ongoing discussions with and actions by regulatory authorities, patient accrual rates for clinical trials, risks from competitors, and other matters that could affect the timing of availability of data from or initiation of our clinical trials, uncertainties regarding regulatory approvals, uncertainties regarding certain expenditures, and other matters that could affect the availability or commercial potential of our drug candidates. TESARO undertakes no obligation to update or revise any forward-looking statements. For a further description of the risks and uncertainties that could cause actual results to differ from those expressed in these forward-looking statements, as well as risks relating to the business of the Company in general, see TESARO's Annual Report on Form 10-K for the year ended December 31, 2015.
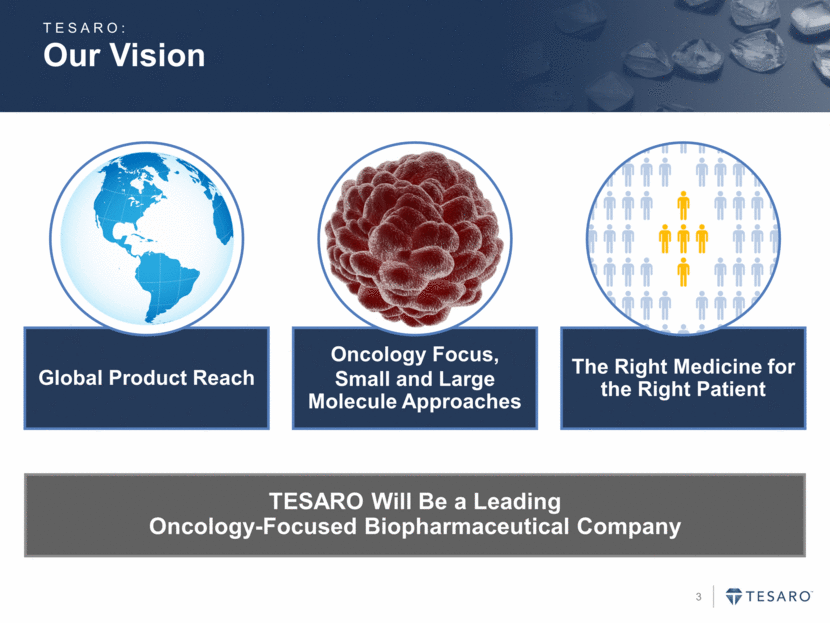
The Right Medicine for the Right Patient Global Product Reach Oncology Focus, Small and Large Molecule Approaches Our Vision TESARO: TESARO Will Be a Leading Oncology-Focused Biopharmaceutical Company
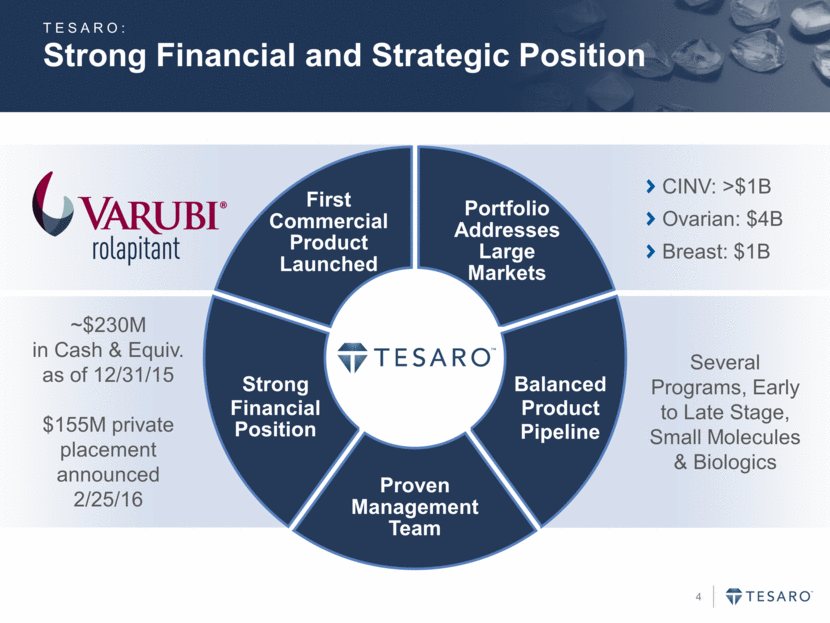
Strong Financial and Strategic Position TESARO: First Commercial Product Launched Portfolio Addresses Large Markets Balanced Product Pipeline Strong Financial Position Proven Management Team CINV: >$1B Ovarian: $4B Breast: $1B Several Programs, Early to Late Stage, Small Molecules & Biologics ~$230M in Cash & Equiv. as of 12/31/15 $155M private placement announced 2/25/16
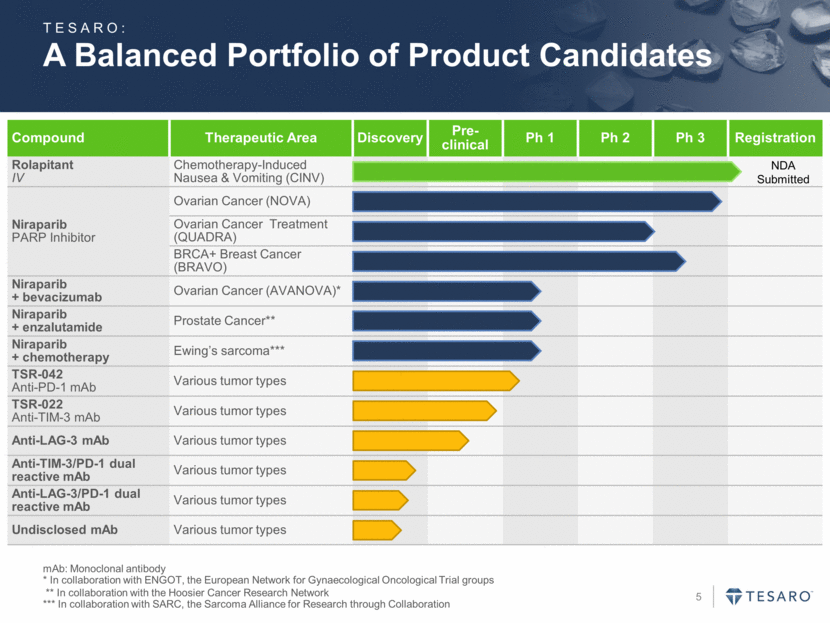
A Balanced Portfolio of Product Candidates mAb: Monoclonal antibody * In collaboration with ENGOT, the European Network for Gynaecological Oncological Trial groups ** In collaboration with the Hoosier Cancer Research Network *** In collaboration with SARC, the Sarcoma Alliance for Research through Collaboration Compound Therapeutic Area Discovery Pre-clinical Ph 1 Ph 2 Ph 3 Registration Rolapitant IV Chemotherapy-Induced Nausea & Vomiting (CINV) Niraparib PARP Inhibitor Ovarian Cancer (NOVA) Ovarian Cancer Treatment (QUADRA) BRCA+ Breast Cancer (BRAVO) Niraparib + bevacizumab Ovarian Cancer (AVANOVA)* Niraparib + enzalutamide Prostate Cancer** Niraparib + chemotherapy Ewing’s sarcoma*** TSR-042 Anti-PD-1 mAb Various tumor types TSR-022 Anti-TIM-3 mAb Various tumor types Anti-LAG-3 mAb Various tumor types Anti-TIM-3/PD-1 dual reactive mAb Various tumor types Anti-LAG-3/PD-1 dual reactive mAb Various tumor types Undisclosed mAb Various tumor types TESARO: NDA Submitted
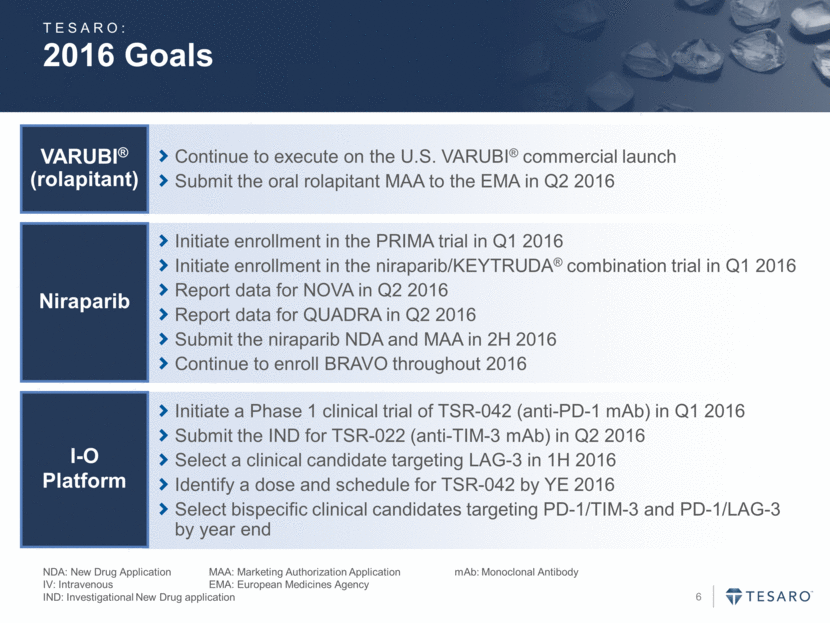
2016 Goals NDA: New Drug Application MAA: Marketing Authorization Application mAb: Monoclonal Antibody IV: Intravenous EMA: European Medicines Agency IND: Investigational New Drug application Continue to execute on the U.S. VARUBI® commercial launch Submit the oral rolapitant MAA to the EMA in Q2 2016 VARUBI® (rolapitant) Initiate a Phase 1 clinical trial of TSR-042 (anti-PD-1 mAb) in Q1 2016 Submit the IND for TSR-022 (anti-TIM-3 mAb) in Q2 2016 Select a clinical candidate targeting LAG-3 in 1H 2016 Identify a dose and schedule for TSR-042 by YE 2016 Select bispecific clinical candidates targeting PD-1/TIM-3 and PD-1/LAG-3 by year end I-O Platform Initiate enrollment in the PRIMA trial in Q1 2016 Initiate enrollment in the niraparib/KEYTRUDA® combination trial in Q1 2016 Report data for NOVA in Q2 2016 Report data for QUADRA in Q2 2016 Submit the niraparib NDA and MAA in 2H 2016 Continue to enroll BRAVO throughout 2016 Niraparib TESARO:
VARUBI® (rolapitant) CINV Opportunity

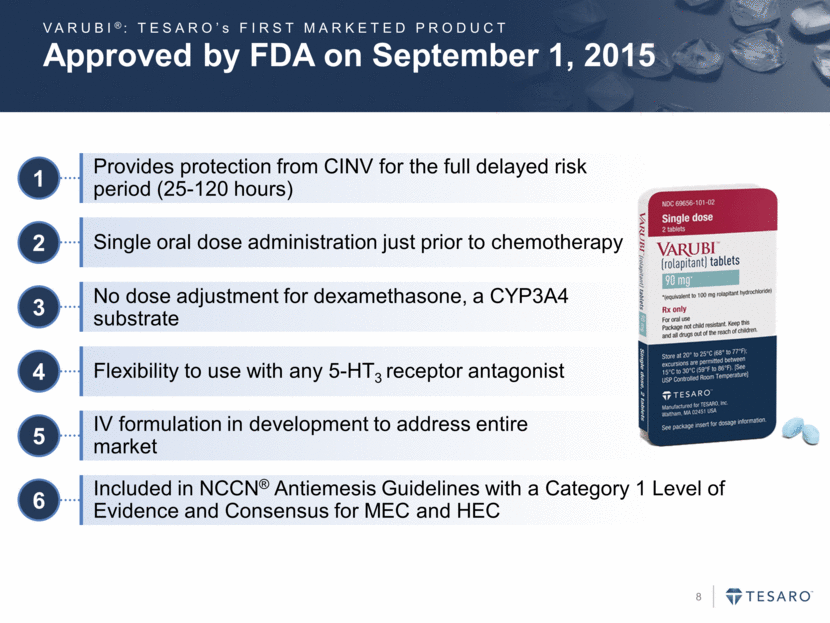
Approved by FDA on September 1, 2015 1 Provides protection from CINV for the full delayed risk period (25-120 hours) 2 Single oral dose administration just prior to chemotherapy 6 Included in NCCN® Antiemesis Guidelines with a Category 1 Level of Evidence and Consensus for MEC and HEC 3 No dose adjustment for dexamethasone, a CYP3A4 substrate 4 Flexibility to use with any 5-HT3 receptor antagonist 5 IV formulation in development to address entire market VARUBI®: TESARO’s FIRST MARKETED PRODUCT
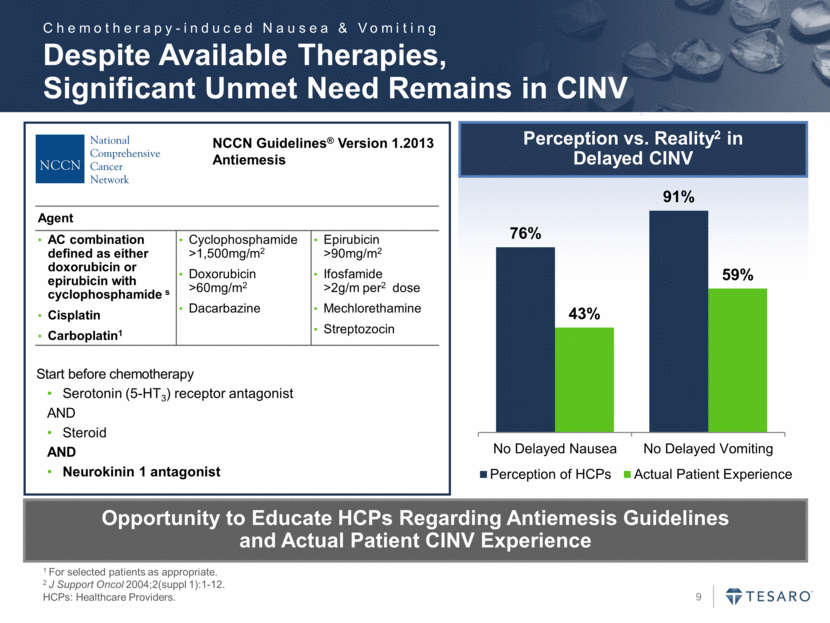
Despite Available Therapies, Significant Unmet Need Remains in CINV 1 For selected patients as appropriate. 2 J Support Oncol 2004;2(suppl 1):1-12. HCPs: Healthcare Providers. Start before chemotherapy Serotonin (5-HT3) receptor antagonist AND Steroid AND Neurokinin 1 antagonist NCCN Guidelines® Version 1.2013 Antiemesis Opportunity to Educate HCPs Regarding Antiemesis Guidelines and Actual Patient CINV Experience Agent AC combination defined as either doxorubicin or epirubicin with cyclophosphamide s Cisplatin Carboplatin1 Cyclophosphamide >1,500mg/m2 Doxorubicin >60mg/m2 Dacarbazine Epirubicin >90mg/m2 Ifosfamide >2g/m per2 dose Mechlorethamine Streptozocin Perception vs. Reality2 in Delayed CINV Chemotherapy-induced Nausea & Vomiting 76% 91% 43% 59% No Delayed Nausea No Delayed Vomiting Perception of HCPs Actual Patient Experience
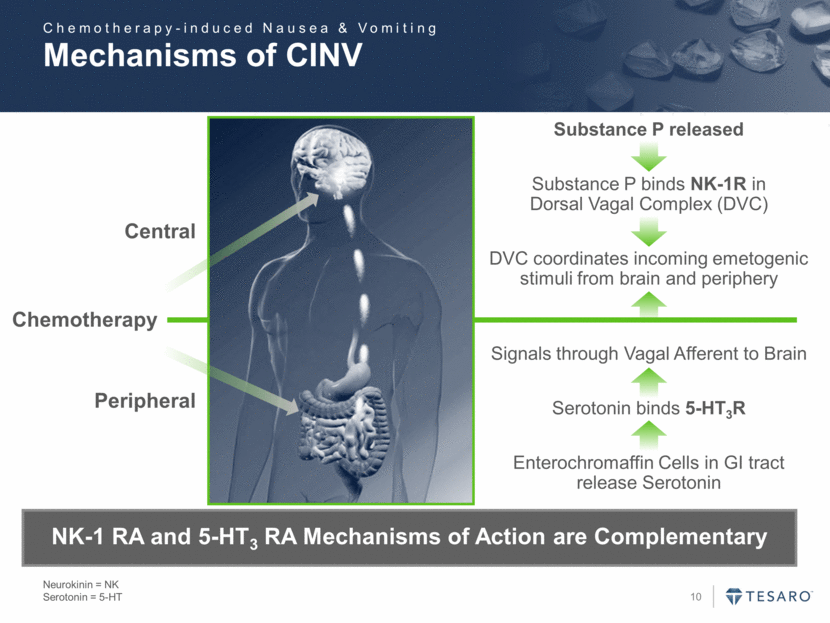
Mechanisms of CINV Neurokinin = NK Serotonin = 5-HT Chemotherapy Peripheral Central Substance P released Substance P binds NK-1R in Dorsal Vagal Complex (DVC) DVC coordinates incoming emetogenic stimuli from brain and periphery Signals through Vagal Afferent to Brain Serotonin binds 5-HT3R Enterochromaffin Cells in GI tract release Serotonin NK-1 RA and 5-HT3 RA Mechanisms of Action are Complementary Chemotherapy-induced Nausea & Vomiting
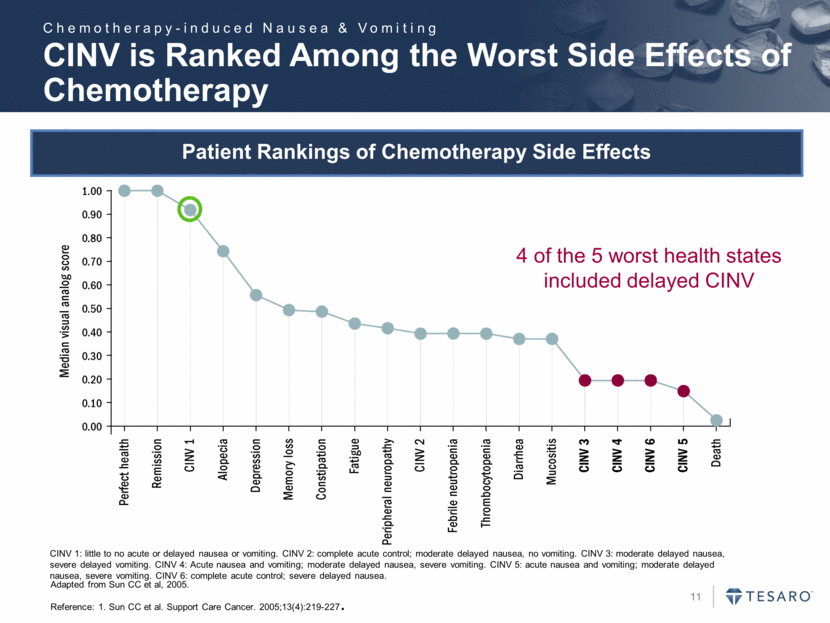
CINV 1: little to no acute or delayed nausea or vomiting. CINV 2: complete acute control; moderate delayed nausea, no vomiting. CINV 3: moderate delayed nausea, severe delayed vomiting. CINV 4: Acute nausea and vomiting; moderate delayed nausea, severe vomiting. CINV 5: acute nausea and vomiting; moderate delayed nausea, severe vomiting. CINV 6: complete acute control; severe delayed nausea. 4 of the 5 worst health states included delayed CINV Adapted from Sun CC et al, 2005. Reference: 1. Sun CC et al. Support Care Cancer. 2005;13(4):219-227. CINV is Ranked Among the Worst Side Effects of Chemotherapy Chemotherapy-induced Nausea & Vomiting Patient Rankings of Chemotherapy Side Effects
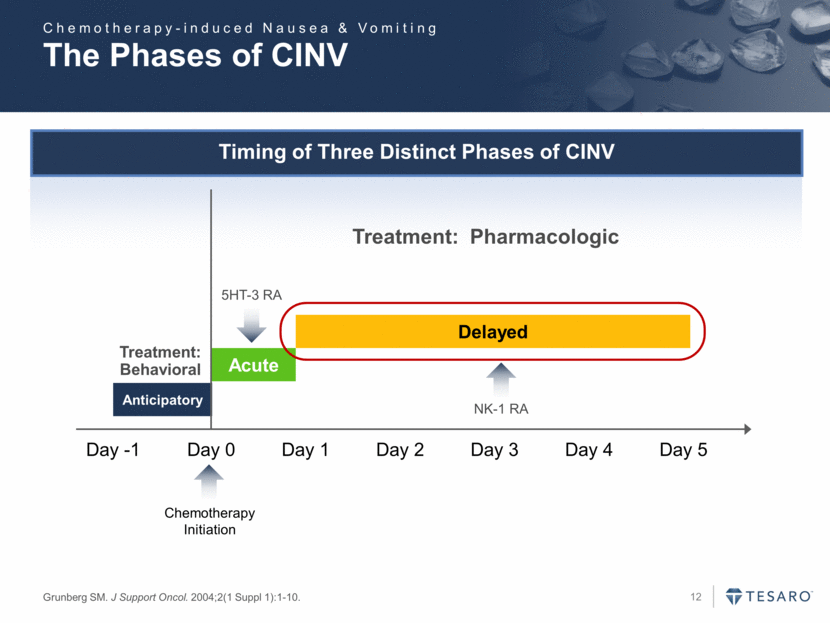
The Phases of CINV Grunberg SM. J Support Oncol. 2004;2(1 Suppl 1):1-10. Timing of Three Distinct Phases of CINV Day -1 Day 0 Day 1 Day 5 Anticipatory Acute Delayed Chemotherapy Initiation Day 2 Day 3 Day 4 Treatment: Behavioral Treatment: Pharmacologic NK-1 RA 5HT-3 RA Chemotherapy-induced Nausea & Vomiting
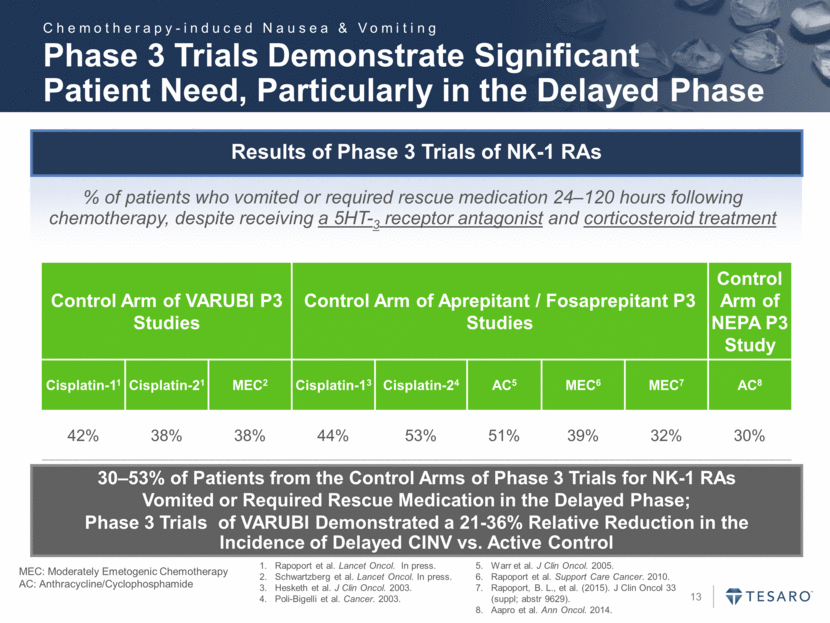
Phase 3 Trials Demonstrate Significant Patient Need, Particularly in the Delayed Phase Results of Phase 3 Trials of NK-1 RAs % of patients who vomited or required rescue medication 24–120 hours following chemotherapy, despite receiving a 5HT-3 receptor antagonist and corticosteroid treatment 30–53% of Patients from the Control Arms of Phase 3 Trials for NK-1 RAs Vomited or Required Rescue Medication in the Delayed Phase; Phase 3 Trials of VARUBI Demonstrated a 21-36% Relative Reduction in the Incidence of Delayed CINV vs. Active Control Control Arm of VARUBI P3 Studies Control Arm of Aprepitant / Fosaprepitant P3 Studies Control Arm of NEPA P3 Study Cisplatin-11 Cisplatin-21 MEC2 Cisplatin-13 Cisplatin-24 AC5 MEC6 MEC7 AC8 42% 38% 38% 44% 53% 51% 39% 32% 30% MEC: Moderately Emetogenic Chemotherapy AC: Anthracycline/Cyclophosphamide Rapoport et al. Lancet Oncol. In press. Schwartzberg et al. Lancet Oncol. In press. Hesketh et al. J Clin Oncol. 2003. Poli-Bigelli et al. Cancer. 2003. Warr et al. J Clin Oncol. 2005. Rapoport et al. Support Care Cancer. 2010. Rapoport, B. L., et al. (2015). J Clin Oncol 33 (suppl; abstr 9629). Aapro et al. Ann Oncol. 2014. Chemotherapy-induced Nausea & Vomiting
VARUBI® (rolapitant) Launch Update

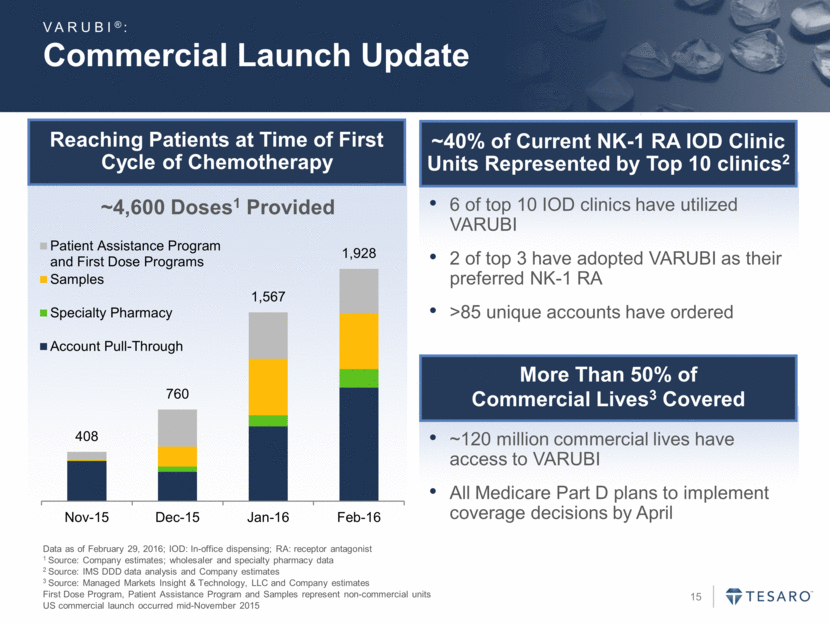
Commercial Launch Update Data as of February 29, 2016; IOD: In-office dispensing; RA: receptor antagonist 1 Source: Company estimates; wholesaler and specialty pharmacy data 2 Source: IMS DDD data analysis and Company estimates 3 Source: Managed Markets Insight & Technology, LLC and Company estimates First Dose Program, Patient Assistance Program and Samples represent non-commercial units US commercial launch occurred mid-November 2015 VARUBI®: Reaching Patients at Time of First Cycle of Chemotherapy ~40% of Current NK-1 RA IOD Clinic Units Represented by Top 10 clinics2 6 of top 10 IOD clinics have utilized VARUBI 2 of top 3 have adopted VARUBI as their preferred NK-1 RA >85 unique accounts have ordered More Than 50% of Commercial Lives3 Covered ~120 million commercial lives have access to VARUBI All Medicare Part D plans to implement coverage decisions by April ~4,600 Doses1 Provided 408 760 1,567 1,928 Nov-15 Dec-15 Jan-16 Feb-16 Patient Assistance Program and First Dose Programs Samples Specialty Pharmacy Account Pull-Through
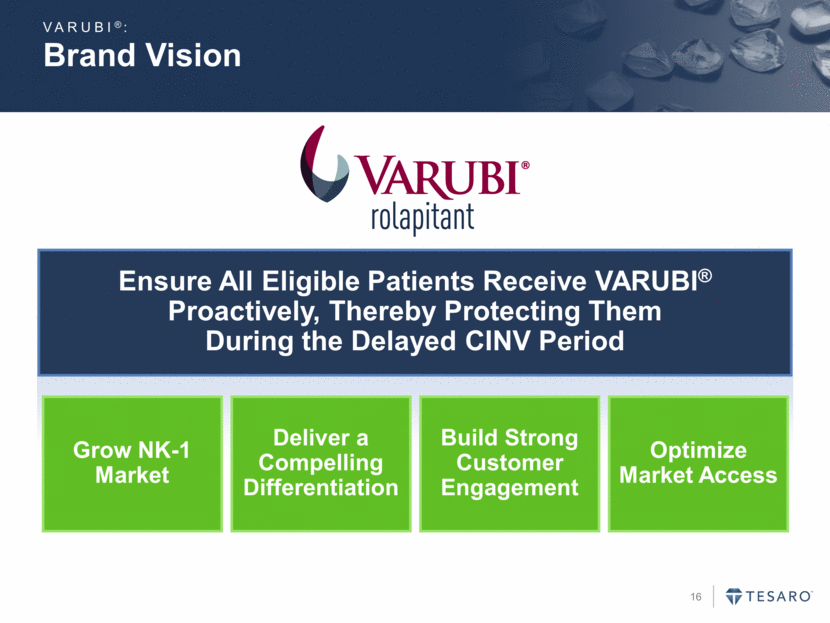
Brand Vision Ensure All Eligible Patients Receive VARUBI® Proactively, Thereby Protecting Them During the Delayed CINV Period VARUBI®: Grow NK-1 Market Deliver a Compelling Differentiation Build Strong Customer Engagement Optimize Market Access
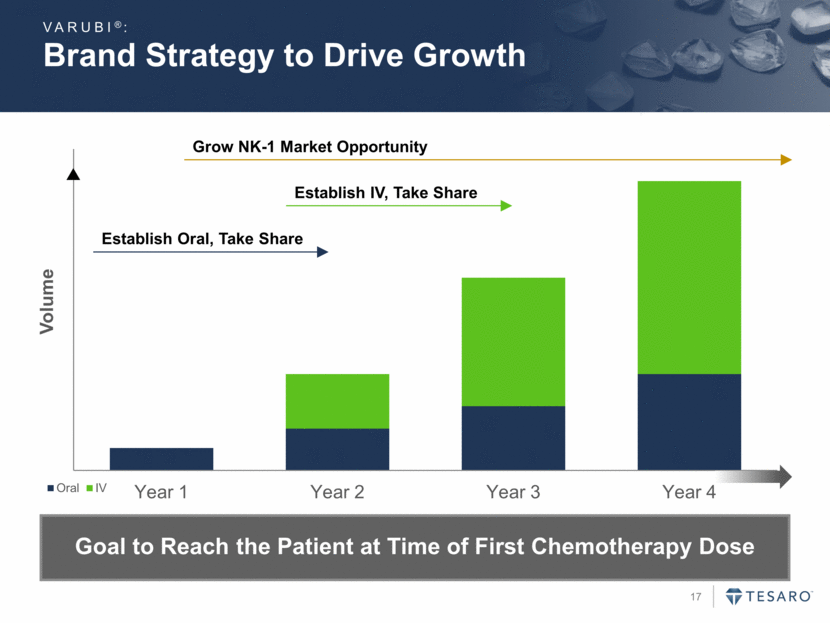
Brand Strategy to Drive Growth VARUBI®: Establish Oral, Take Share Establish IV, Take Share Grow NK-1 Market Opportunity Goal to Reach the Patient at Time of First Chemotherapy Dose Year 1 Year 2 Year 3 Year 4 Volume Oral IV
Annual Market Potential (2014) Large U.S. Revenue Opportunity in CINV Source: IMS claims data, Company estimates 5M admins of emetogenic chemotherapy 4M 5-HT3 treatments 1M NK-1 RA admins ~20% ORAL ~80% IV U.S. Market Opportunity Exceeds $1 Billion VARUBI®: - 1,000,000.00 2,000,000.00 3,000,000.00 4,000,000.00 5,000,000.00 6,000,000.00

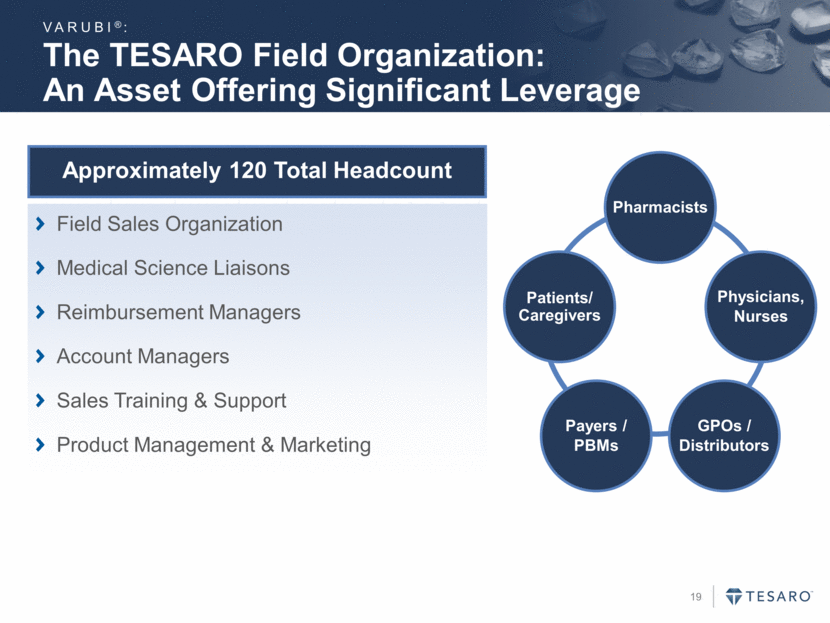
The TESARO Field Organization: An Asset Offering Significant Leverage VARUBI®: Field Sales Organization Medical Science Liaisons Reimbursement Managers Account Managers Sales Training & Support Product Management & Marketing Approximately 120 Total Headcount Pharmacists Payers / PBMs GPOs / Distributors Patients/ Caregivers Physicians, Nurses
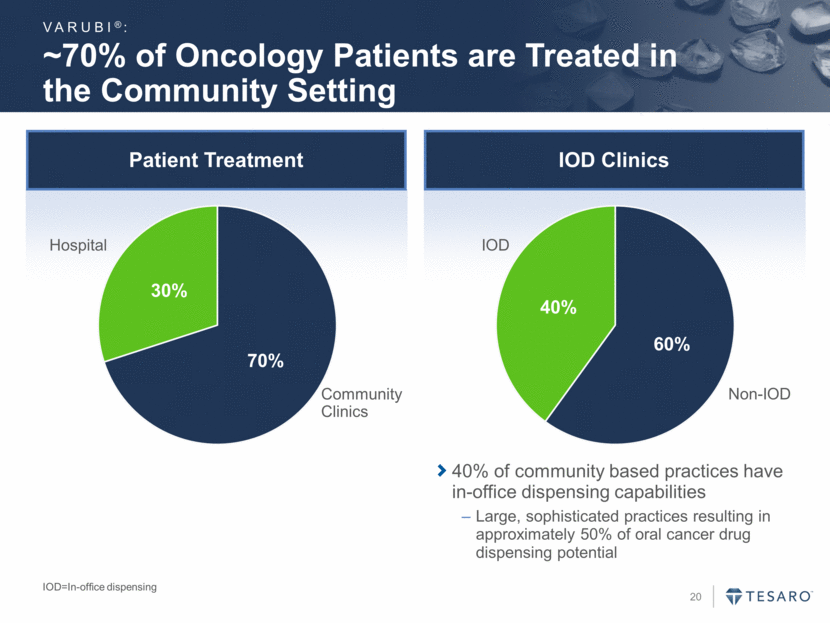
~70% of Oncology Patients are Treated in the Community Setting Patient Treatment IOD Clinics VARUBI®: Hospital Community Clinics IOD Non-IOD 40% of community based practices have in-office dispensing capabilities Large, sophisticated practices resulting in approximately 50% of oral cancer drug dispensing potential IOD=In-office dispensing
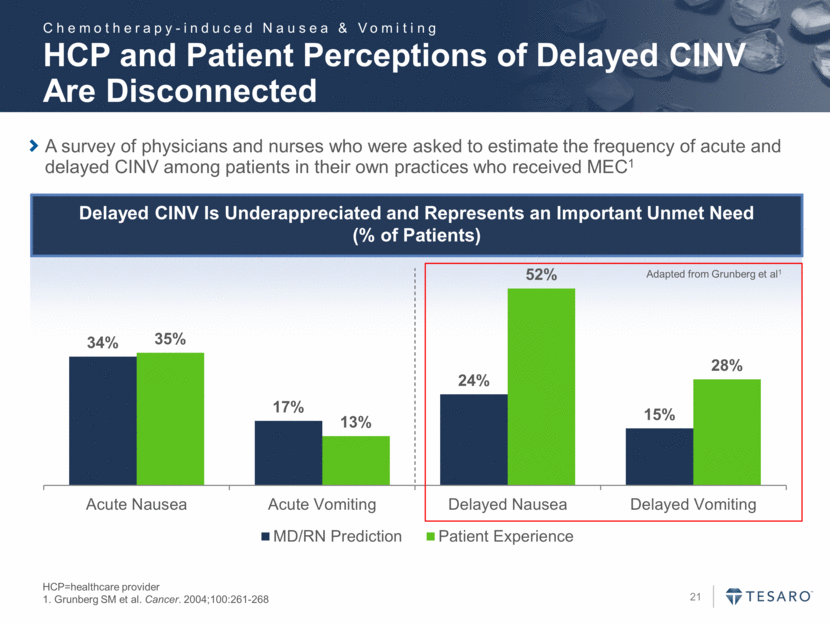
HCP and Patient Perceptions of Delayed CINV Are Disconnected HCP=healthcare provider 1. Grunberg SM et al. Cancer. 2004;100:261-268 A survey of physicians and nurses who were asked to estimate the frequency of acute and delayed CINV among patients in their own practices who received MEC1 Delayed CINV Is Underappreciated and Represents an Important Unmet Need (% of Patients) Adapted from Grunberg et al1 Chemotherapy-induced Nausea & Vomiting 34% 17% 24% 15% 35% 13% 52% 28% Acute Nausea Acute Vomiting Delayed Nausea Delayed Vomiting MD/RN Prediction Patient Experience
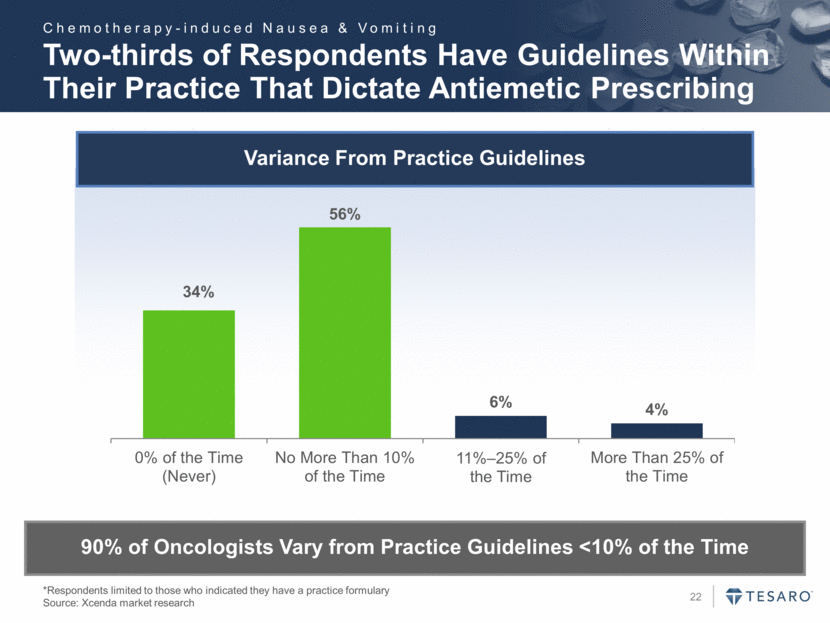
Variance From Practice Guidelines Two-thirds of Respondents Have Guidelines Within Their Practice That Dictate Antiemetic Prescribing *Respondents limited to those who indicated they have a practice formulary Source: Xcenda market research 90% of Oncologists Vary from Practice Guidelines <10% of the Time Chemotherapy-induced Nausea & Vomiting 34% 56% 6% 4% 0% of the Time (Never) No More Than 10% of the Time 11% – 25% of the Time More Than 25% of the Time
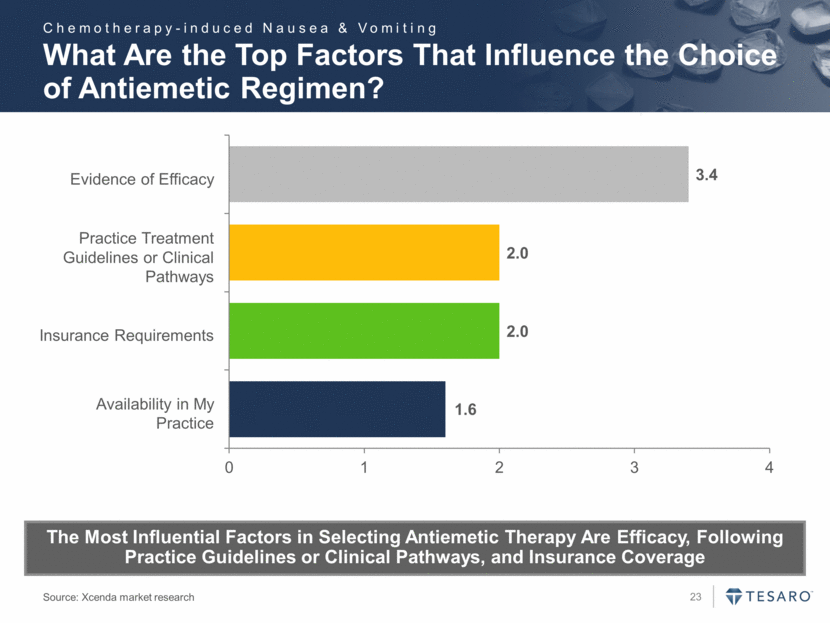
Evidence of Efficacy Practice Treatment Guidelines or Clinical Pathways Insurance Requirements Availability in My Practice What Are the Top Factors That Influence the Choice of Antiemetic Regimen? Source: Xcenda market research The Most Influential Factors in Selecting Antiemetic Therapy Are Efficacy, Following Practice Guidelines or Clinical Pathways, and Insurance Coverage Chemotherapy-induced Nausea & Vomiting 1.6 2.0 2.0 3.4 0 1 2 3 4
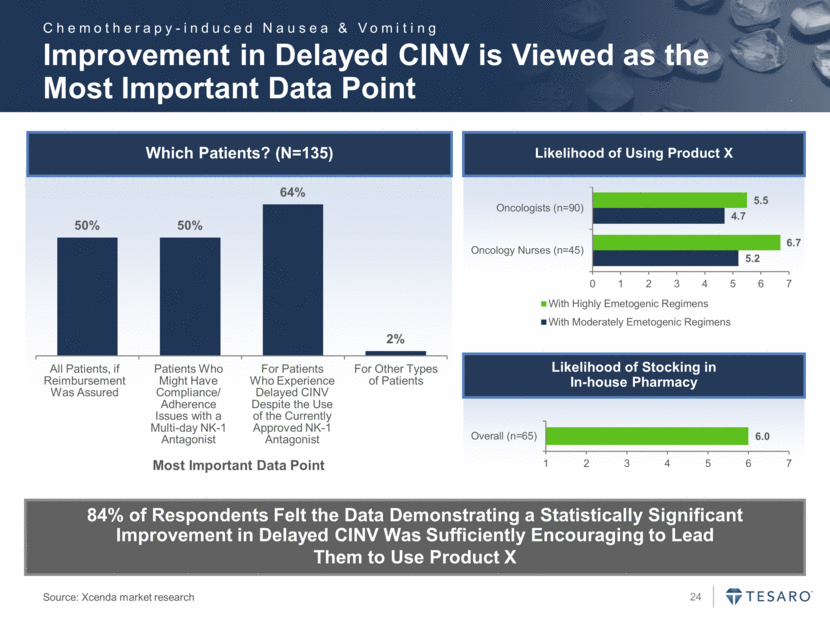
Improvement in Delayed CINV is Viewed as the Most Important Data Point 84% of Respondents Felt the Data Demonstrating a Statistically Significant Improvement in Delayed CINV Was Sufficiently Encouraging to Lead Them to Use Product X Which Patients? (N=135) All Patients, if Reimbursement Was Assured Patients Who Might Have Compliance/ Adherence Issues with a Multi-day NK-1 Antagonist For Patients Who Experience Delayed CINV Despite the Use of the Currently Approved NK-1 Antagonist For Other Types of Patients Most Important Data Point Likelihood of Using Product X Likelihood of Stocking in In-house Pharmacy Source: Xcenda market research Chemotherapy-induced Nausea & Vomiting 50% 50% 64% 2% 5.2 4.7 6.7 5.5 0 1 2 3 4 5 6 7 Oncology Nurses (n=45) Oncologists (n=90) With Highly Emetogenic Regimens With Moderately Emetogenic Regimens 6.0 1 2 3 4 5 6 7 Overall (n=65)
Rolapitant IV Program Overview & Bioequivalence Study Results
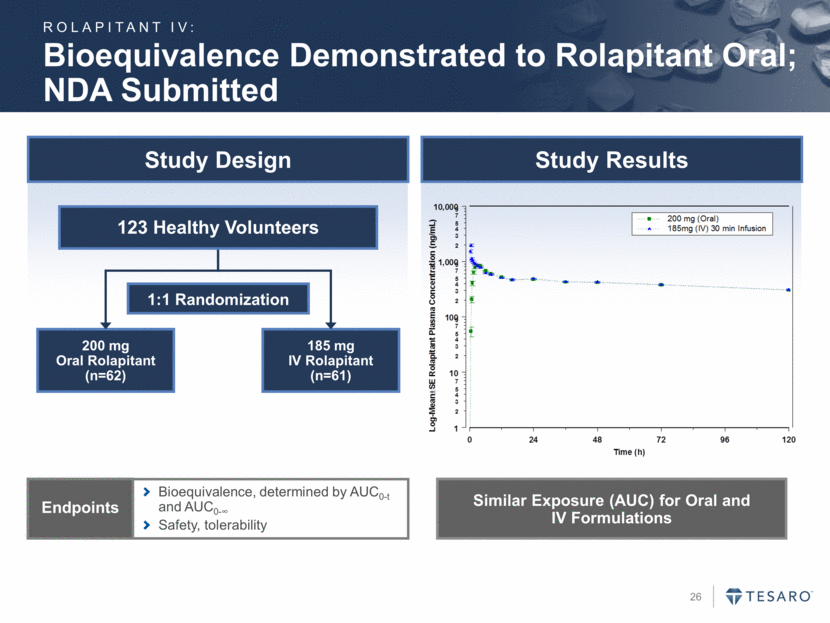
Bioequivalence Demonstrated to Rolapitant Oral; NDA Submitted Study Design Study Results Bioequivalence, determined by AUC0-t and AUC0- Safety, tolerability Endpoints 1:1 Randomization 200 mg Oral Rolapitant (n=62) 185 mg IV Rolapitant (n=61) 123 Healthy Volunteers Similar Exposure (AUC) for Oral and IV Formulations ROLAPITANT IV:
Niraparib A Potentially Best-in-Class PARP Inhibitor in Phase 3 for Ovarian and Breast Cancers
TESARO’s Most Advanced Cancer Therapeutic Candidate Orally active, potent PARP 1/2 inhibitor Convenient, once daily dosing Compelling response rates and durations of response in highly pre-treated populations demonstrated in Phase 1 (N=100) Safety profile well characterized Clinical and genetic enrichment allow for targeted development myChoice® HRD Test provides a patient selection assay based on defined HRD score Potential for multiple indications and combination approaches IP through 2030, not including potential U.S. Hatch-Waxman extension NIRAPARIB:
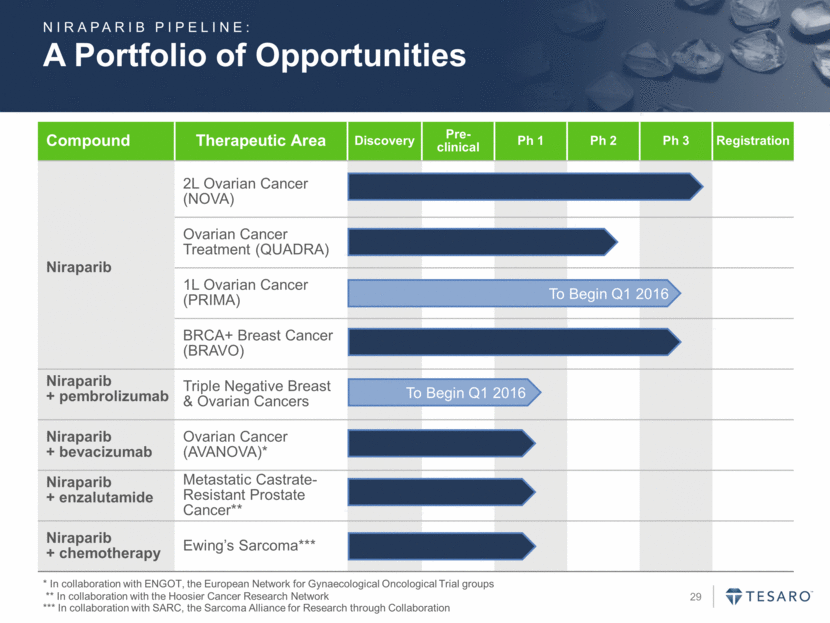
Compound Therapeutic Area Discovery Pre- clinical Ph 1 Ph 2 Ph 3 Registration Niraparib 2L Ovarian Cancer (NOVA) Ovarian Cancer Treatment (QUADRA) 1L Ovarian Cancer (PRIMA) BRCA+ Breast Cancer (BRAVO) Niraparib + pembrolizumab Triple Negative Breast & Ovarian Cancers Niraparib + bevacizumab Ovarian Cancer (AVANOVA)* Niraparib + enzalutamide Metastatic Castrate-Resistant Prostate Cancer** Niraparib + chemotherapy Ewing’s Sarcoma*** A Portfolio of Opportunities To Begin Q1 2016 To Begin Q1 2016 NIRAPARIB PIPELINE: * In collaboration with ENGOT, the European Network for Gynaecological Oncological Trial groups ** In collaboration with the Hoosier Cancer Research Network *** In collaboration with SARC, the Sarcoma Alliance for Research through Collaboration
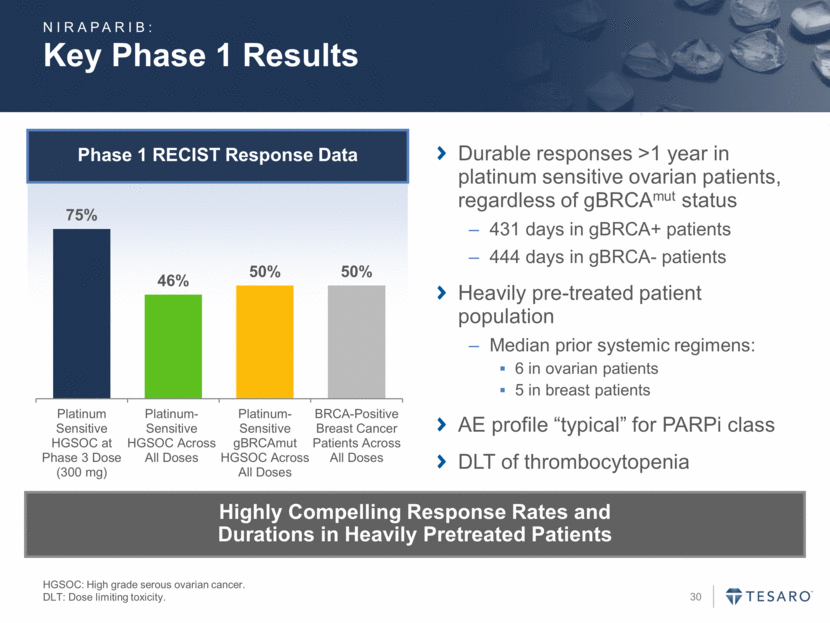
Key Phase 1 Results HGSOC: High grade serous ovarian cancer. DLT: Dose limiting toxicity. Phase 1 RECIST Response Data Durable responses >1 year in platinum sensitive ovarian patients, regardless of gBRCAmut status 431 days in gBRCA+ patients 444 days in gBRCA- patients Heavily pre-treated patient population Median prior systemic regimens: 6 in ovarian patients 5 in breast patients AE profile “typical” for PARPi class DLT of thrombocytopenia Highly Compelling Response Rates and Durations in Heavily Pretreated Patients NIRAPARIB: 75% 46% 50% 50% Platinum Sensitive HGSOC at Phase 3 Dose (300 mg) Platinum- Sensitive HGSOC Across All Doses Platinum- Sensitive gBRCAmut HGSOC Across All Doses BRCA-Positive Breast Cancer Patients Across All Doses
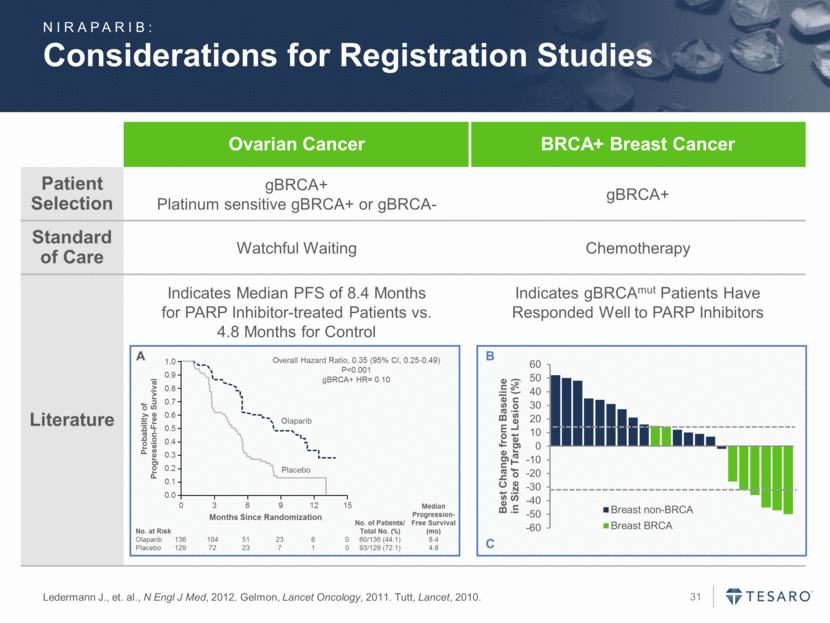
Considerations for Registration Studies Ledermann J., et. al., N Engl J Med, 2012. Gelmon, Lancet Oncology, 2011. Tutt, Lancet, 2010. Ovarian Cancer BRCA+ Breast Cancer Patient Selection gBRCA+ Platinum sensitive gBRCA+ or gBRCA- gBRCA+ Standard of Care Watchful Waiting Chemotherapy Literature Indicates Median PFS of 8.4 Months for PARP Inhibitor-treated Patients vs. 4.8 Months for Control Indicates gBRCAmut Patients Have Responded Well to PARP Inhibitors A 0.0 0.1 0.2 0.3 0.4 0.5 0.6 0.7 0.8 0.9 1.0 0 3 6 9 12 15 Months Since Randomization Probability of Progression-Free Survival Placebo Olaparib Overall Hazard Ratio, 0.35 (95% CI, 0.25-0.49) P<0.001 gBRCA+ HR= 0.10 No. at Risk No. of Patients/ Total No. (%) Median Progression-Free Survival (mo) Olaparib 136 104 51 23 6 0 60/136 (44.1) 8.4 Placebo 129 72 23 7 1 0 93/129 (72.1) 4.8 B C NIRAPARIB: -60 -50 -40 -30 -20 -10 0 10 20 30 40 50 60 Best Change from Baseline in Size of Target Lesion (%) Breast non-BRCA Breast BRCA
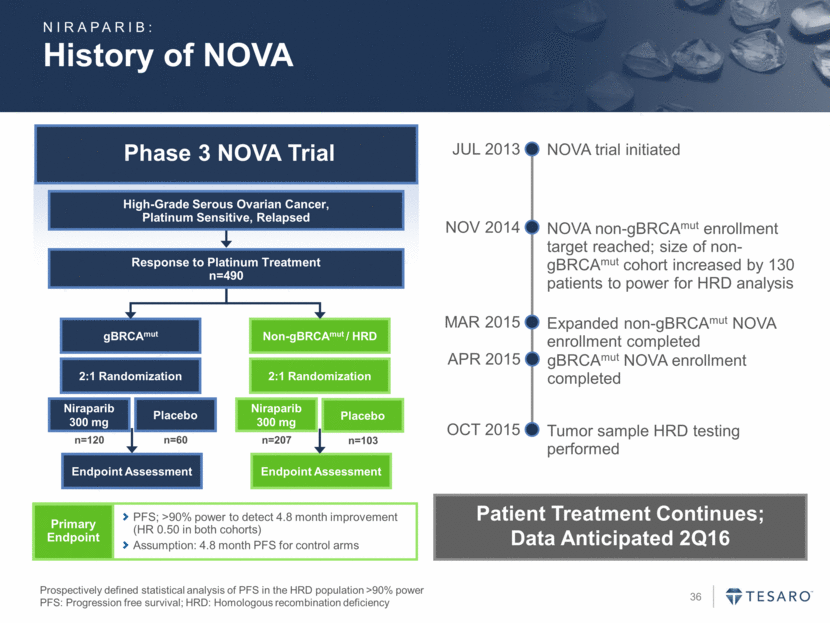
Phase 3 NOVA Trial NOVA Study Design and PFS Analysis Prospectively defined statistical analysis of PFS in the HRD population >90% power PFS: Progression free survival; HRD: Homologous recombination deficiency gBRCAmut Endpoint Assessment Niraparib 300 mg Placebo Non-gBRCAmut / HRD Endpoint Assessment Niraparib 300 mg Placebo 2:1 Randomization 2:1 Randomization n=120 n=60 n=207 n=103 Response to Platinum Treatment n=490 High-Grade Serous Ovarian Cancer, Platinum Sensitive, Relapsed Primary Endpoint PFS; >90% power to detect 4.8 month improvement (HR 0.50 in both cohorts) Assumption: 4.8 month PFS for control arms Two cohorts (gBRCAmut and non-gBRCAmut) are independently powered for 1o endpoint (PFS) analysis Assess PFS in gBRCAmut cohort (p<0.05) N=180 >90% power to detect a HR=0.50 Assess PFS in non-gBRCAmut cohort using hierarchical testing First, assess PFS in HRD+ subset n~165 >90% power to detect a HR=0.50 If HRD+ subset has p<0.05, assess PFS for the entire cohort n=330 >90% power to detect a HR=0.50 NIRAPARIB:
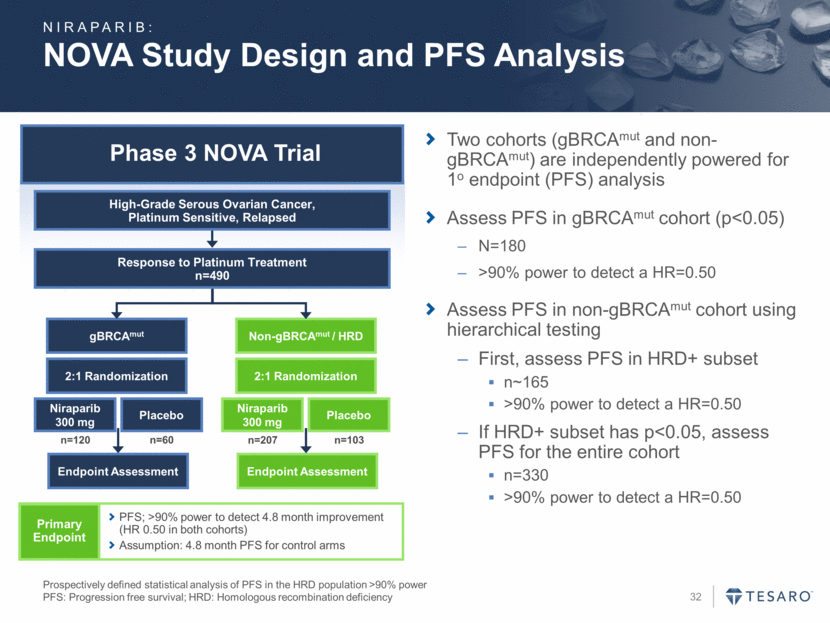
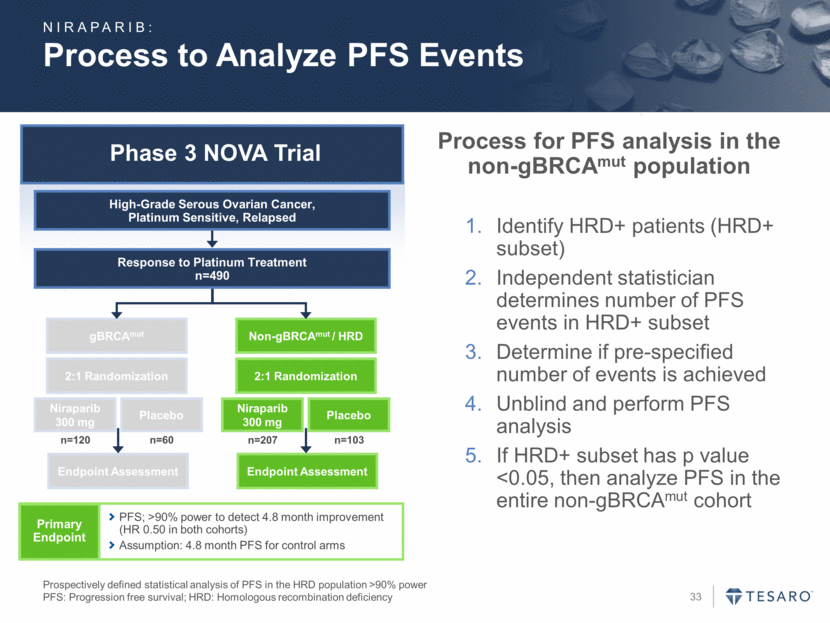
Phase 3 NOVA Trial Process to Analyze PFS Events Prospectively defined statistical analysis of PFS in the HRD population >90% power PFS: Progression free survival; HRD: Homologous recombination deficiency gBRCAmut Endpoint Assessment Niraparib 300 mg Placebo Non-gBRCAmut / HRD Endpoint Assessment Niraparib 300 mg Placebo 2:1 Randomization 2:1 Randomization n=120 n=60 n=207 n=103 Response to Platinum Treatment n=490 High-Grade Serous Ovarian Cancer, Platinum Sensitive, Relapsed Primary Endpoint PFS; >90% power to detect 4.8 month improvement (HR 0.50 in both cohorts) Assumption: 4.8 month PFS for control arms Process for PFS analysis in the non-gBRCAmut population Identify HRD+ patients (HRD+ subset) Independent statistician determines number of PFS events in HRD+ subset Determine if pre-specified number of events is achieved Unblind and perform PFS analysis If HRD+ subset has p value <0.05, then analyze PFS in the entire non-gBRCAmut cohort NIRAPARIB:
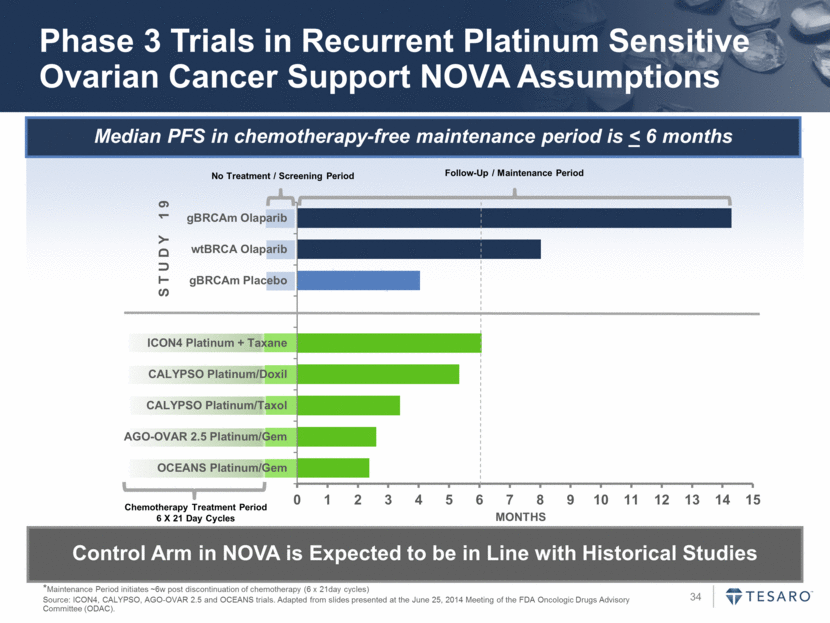
Median PFS in chemotherapy-free maintenance period is < 6 months Phase 3 Trials in Recurrent Platinum Sensitive Ovarian Cancer Support NOVA Assumptions *Maintenance Period initiates ~6w post discontinuation of chemotherapy (6 x 21day cycles) Source: ICON4, CALYPSO, AGO-OVAR 2.5 and OCEANS trials. Adapted from slides presented at the June 25, 2014 Meeting of the FDA Oncologic Drugs Advisory Committee (ODAC). Control Arm in NOVA is Expected to be in Line with Historical Studies No Treatment / Screening Period Chemotherapy Treatment Period 6 X 21 Day Cycles Follow-Up / Maintenance Period S T U D Y 1 9 MONTHS 0 1 2 3 4 5 6 7 8 9 10 11 12 13 14 15 OCEANS Platinum/Gem AGO-OVAR 2.5 Platinum/Gem CALYPSO Platinum/Taxol CALYPSO Platinum/Doxil ICON4 Platinum + Taxane gBRCAm Placebo wtBRCA Olaparib gBRCAm Olaparib
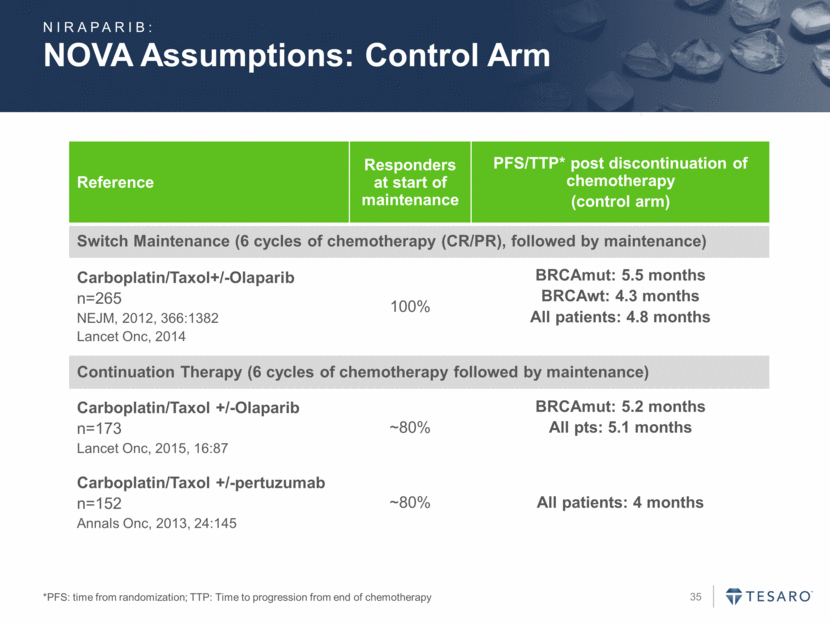
NOVA Assumptions: Control Arm *PFS: time from randomization; TTP: Time to progression from end of chemotherapy Reference Responders at start of maintenance PFS/TTP* post discontinuation of chemotherapy (control arm) Switch Maintenance (6 cycles of chemotherapy (CR/PR), followed by maintenance) Carboplatin/Taxol+/-Olaparib n=265 NEJM, 2012, 366:1382 Lancet Onc, 2014 100% BRCAmut: 5.5 months BRCAwt: 4.3 months All patients: 4.8 months Continuation Therapy (6 cycles of chemotherapy followed by maintenance) Carboplatin/Taxol +/-Olaparib n=173 Lancet Onc, 2015, 16:87 ~80% BRCAmut: 5.2 months All pts: 5.1 months Carboplatin/Taxol +/-pertuzumab n=152 Annals Onc, 2013, 24:145 ~80% All patients: 4 months NIRAPARIB:
History of NOVA Phase 3 NOVA Trial Prospectively defined statistical analysis of PFS in the HRD population >90% power PFS: Progression free survival; HRD: Homologous recombination deficiency gBRCAmut Endpoint Assessment Niraparib 300 mg Placebo Non-gBRCAmut / HRD Endpoint Assessment Niraparib 300 mg Placebo 2:1 Randomization 2:1 Randomization n=120 n=60 n=207 n=103 Response to Platinum Treatment n=490 High-Grade Serous Ovarian Cancer, Platinum Sensitive, Relapsed Primary Endpoint PFS; >90% power to detect 4.8 month improvement (HR 0.50 in both cohorts) Assumption: 4.8 month PFS for control arms NIRAPARIB: NOVA trial initiated JUL 2013 NOVA non-gBRCAmut enrollment target reached; size of non-gBRCAmut cohort increased by 130 patients to power for HRD analysis NOV 2014 Expanded non-gBRCAmut NOVA enrollment completed MAR 2015 Tumor sample HRD testing performed OCT 2015 Patient Treatment Continues; Data Anticipated 2Q16 gBRCAmut NOVA enrollment completed APR 2015
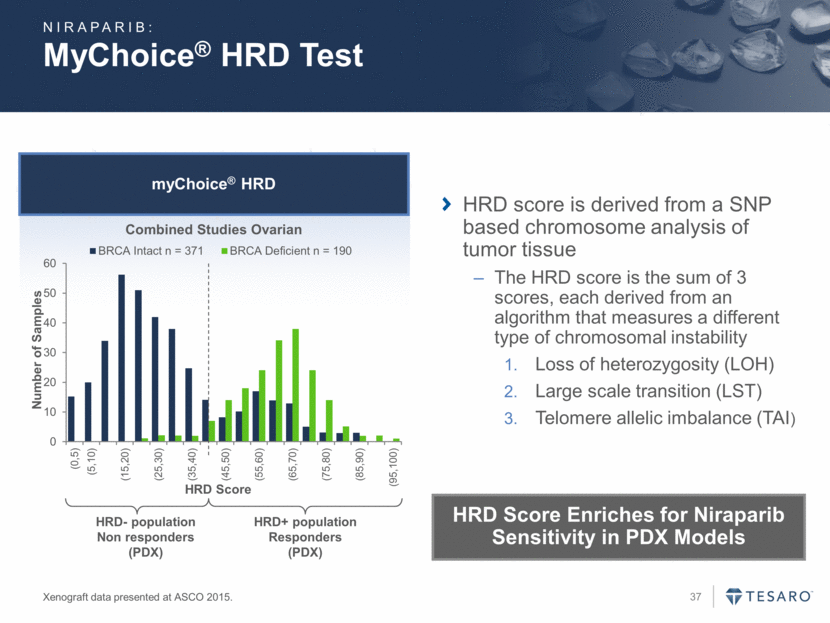
myChoice® HRD MyChoice® HRD Test Xenograft data presented at ASCO 2015. Combined Studies Ovarian HRD- population Non responders (PDX) HRD+ population Responders (PDX) HRD score is derived from a SNP based chromosome analysis of tumor tissue The HRD score is the sum of 3 scores, each derived from an algorithm that measures a different type of chromosomal instability Loss of heterozygosity (LOH) Large scale transition (LST) Telomere allelic imbalance (TAI) NIRAPARIB: HRD Score Enriches for Niraparib Sensitivity in PDX Models 0 10 20 30 40 50 60 (0,5) (5,10) (15,20) (25,30) (35,40) (45,50) (55,60) (65,70) (75,80) (85,90) (95,100) Number of Samples HRD Score BRCA Intact n = 371 BRCA Deficient n = 190
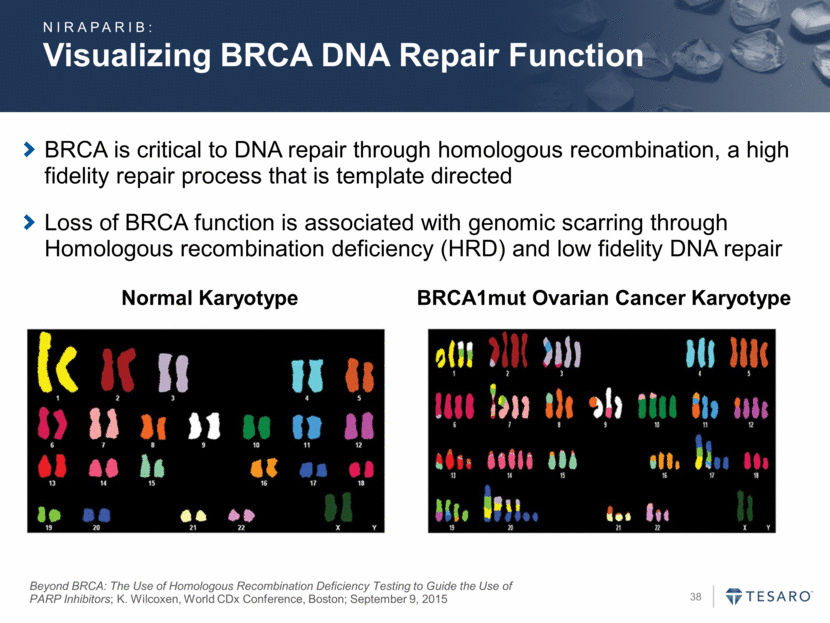
BRCA is critical to DNA repair through homologous recombination, a high fidelity repair process that is template directed Loss of BRCA function is associated with genomic scarring through Homologous recombination deficiency (HRD) and low fidelity DNA repair Beyond BRCA: The Use of Homologous Recombination Deficiency Testing to Guide the Use of PARP Inhibitors; K. Wilcoxen, World CDx Conference, Boston; September 9, 2015 BRCA1mut Ovarian Cancer Karyotype Normal Karyotype Visualizing BRCA DNA Repair Function NIRAPARIB:
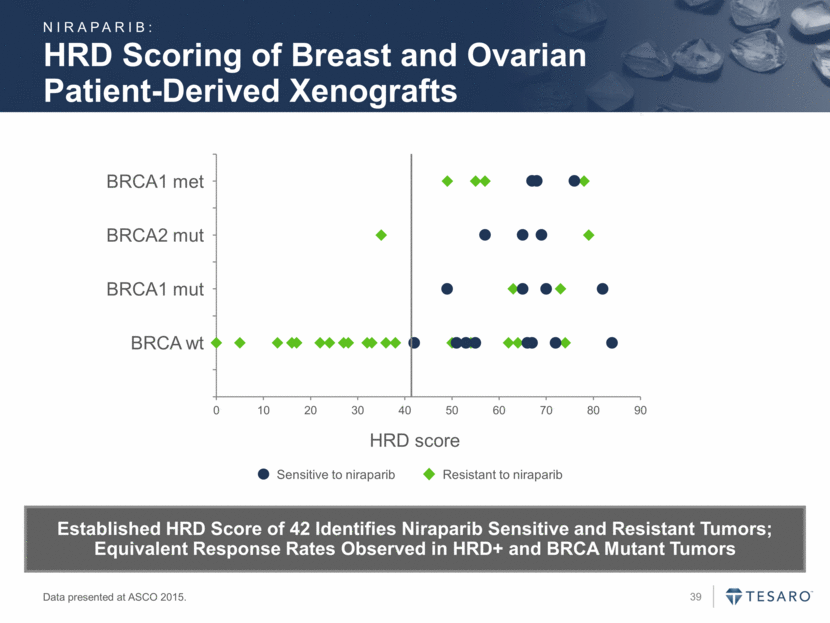
HRD Scoring of Breast and Ovarian Patient-Derived Xenografts HRD score BRCA wt BRCA1 mut BRCA2 mut BRCA1 met Resistant to niraparib Sensitive to niraparib Data presented at ASCO 2015. Established HRD Score of 42 Identifies Niraparib Sensitive and Resistant Tumors; Equivalent Response Rates Observed in HRD+ and BRCA Mutant Tumors NIRAPARIB: 0 0.5 1 1.5 2 2.5 3 3.5 4 4.5 0 10 20 30 40 50 60 70 80 90
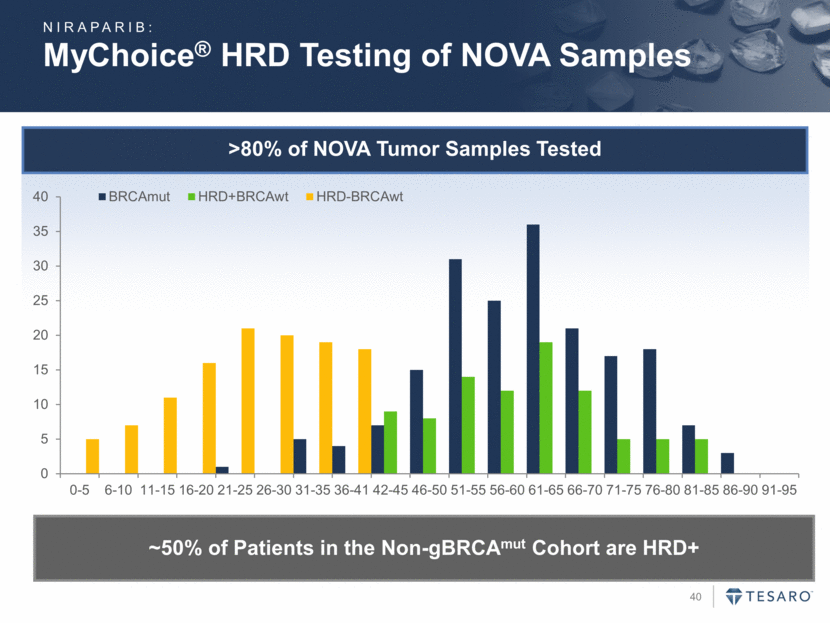
>80% of NOVA Tumor Samples Tested MyChoice® HRD Testing of NOVA Samples NIRAPARIB: ~50% of Patients in the Non-gBRCAmut Cohort are HRD+ 0 5 10 15 20 25 30 35 40 0-5 6-10 11-15 16-20 21-25 26-30 31-35 36-41 42-45 46-50 51-55 56-60 61-65 66-70 71-75 76-80 81-85 86-90 91-95 BRCAmut HRD+BRCAwt HRD-BRCAwt
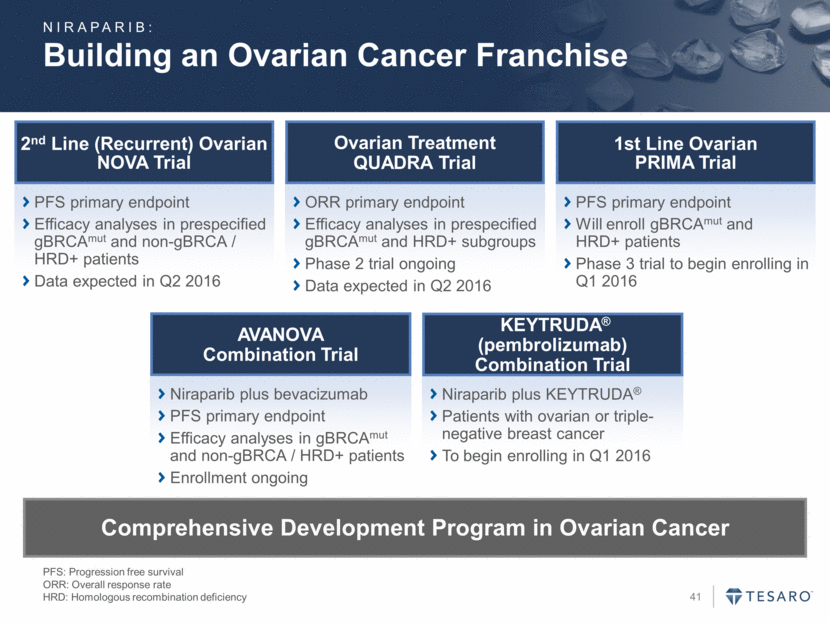
Building an Ovarian Cancer Franchise PFS: Progression free survival ORR: Overall response rate HRD: Homologous recombination deficiency PFS primary endpoint Efficacy analyses in prespecified gBRCAmut and non-gBRCA / HRD+ patients Data expected in Q2 2016 2nd Line (Recurrent) Ovarian NOVA Trial ORR primary endpoint Efficacy analyses in prespecified gBRCAmut and HRD+ subgroups Phase 2 trial ongoing Data expected in Q2 2016 Ovarian Treatment QUADRA Trial PFS primary endpoint Will enroll gBRCAmut and HRD+ patients Phase 3 trial to begin enrolling in Q1 2016 1st Line Ovarian PRIMA Trial Niraparib plus KEYTRUDA® Patients with ovarian or triple-negative breast cancer To begin enrolling in Q1 2016 KEYTRUDA® (pembrolizumab) Combination Trial Niraparib plus bevacizumab PFS primary endpoint Efficacy analyses in gBRCAmut and non-gBRCA / HRD+ patients Enrollment ongoing AVANOVA Combination Trial Comprehensive Development Program in Ovarian Cancer NIRAPARIB:
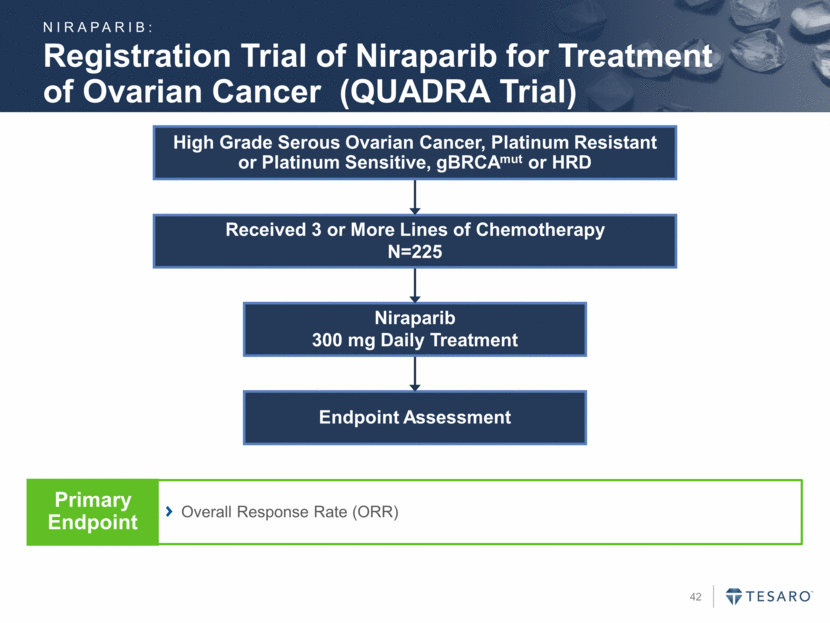
Endpoint Assessment Niraparib 300 mg Daily Treatment Received 3 or More Lines of Chemotherapy N=225 Registration Trial of Niraparib for Treatment of Ovarian Cancer (QUADRA Trial) High Grade Serous Ovarian Cancer, Platinum Resistant or Platinum Sensitive, gBRCAmut or HRD Overall Response Rate (ORR) Primary Endpoint NIRAPARIB:
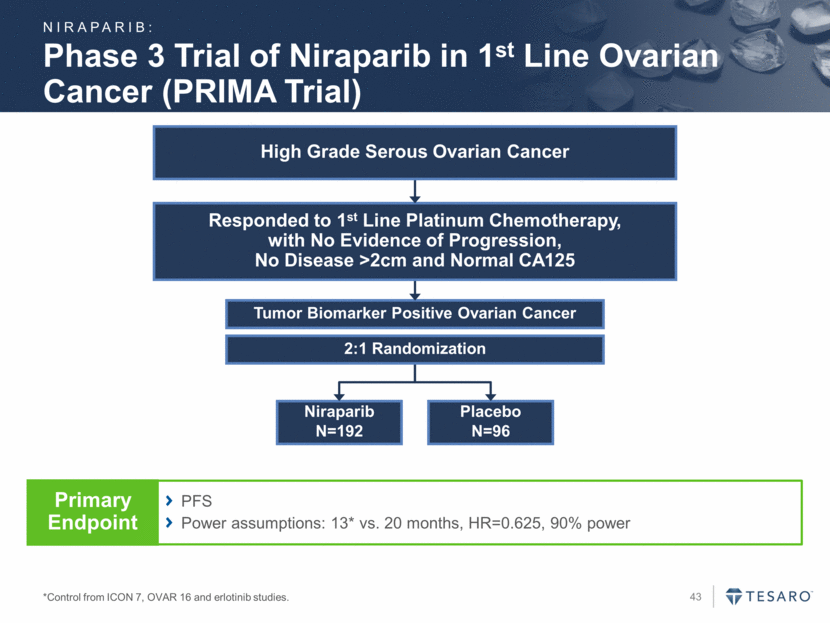
Niraparib N=192 Placebo N=96 Tumor Biomarker Positive Ovarian Cancer 2:1 Randomization Phase 3 Trial of Niraparib in 1st Line Ovarian Cancer (PRIMA Trial) *Control from ICON 7, OVAR 16 and erlotinib studies. Responded to 1st Line Platinum Chemotherapy, with No Evidence of Progression, No Disease >2cm and Normal CA125 High Grade Serous Ovarian Cancer PFS Power assumptions: 13* vs. 20 months, HR=0.625, 90% power Primary Endpoint NIRAPARIB:
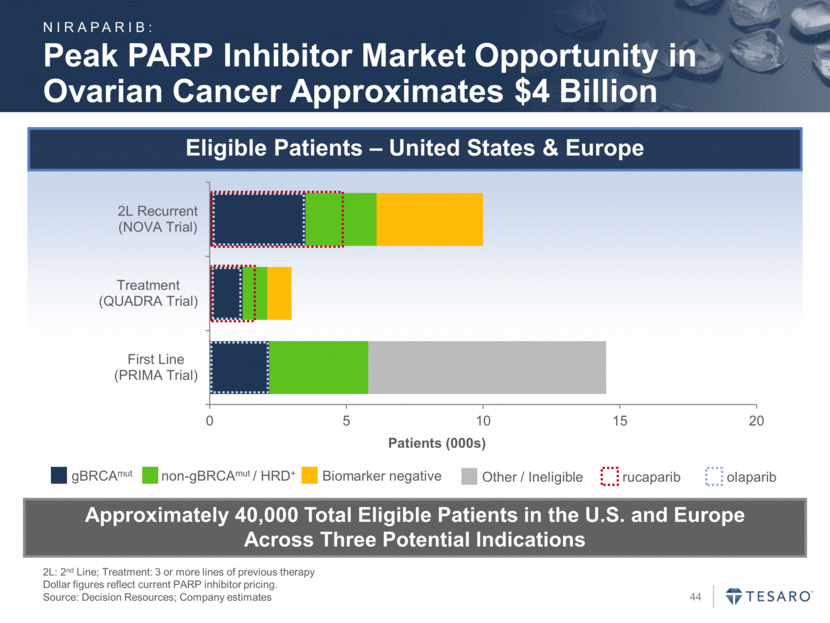
Peak PARP Inhibitor Market Opportunity in Ovarian Cancer Approximates $4 Billion 2L: 2nd Line; Treatment: 3 or more lines of previous therapy Dollar figures reflect current PARP inhibitor pricing. Source: Decision Resources; Company estimates gBRCAmut non-gBRCAmut / HRD+ Biomarker negative Eligible Patients – United States & Europe Other / Ineligible Approximately 40,000 Total Eligible Patients in the U.S. and Europe Across Three Potential Indications NIRAPARIB: rucaparib olaparib 0 5 10 15 20 2L Recurrent (NOVA Trial) Treatment (QUADRA Trial) First Line (PRIMA Trial) Patients (000s)
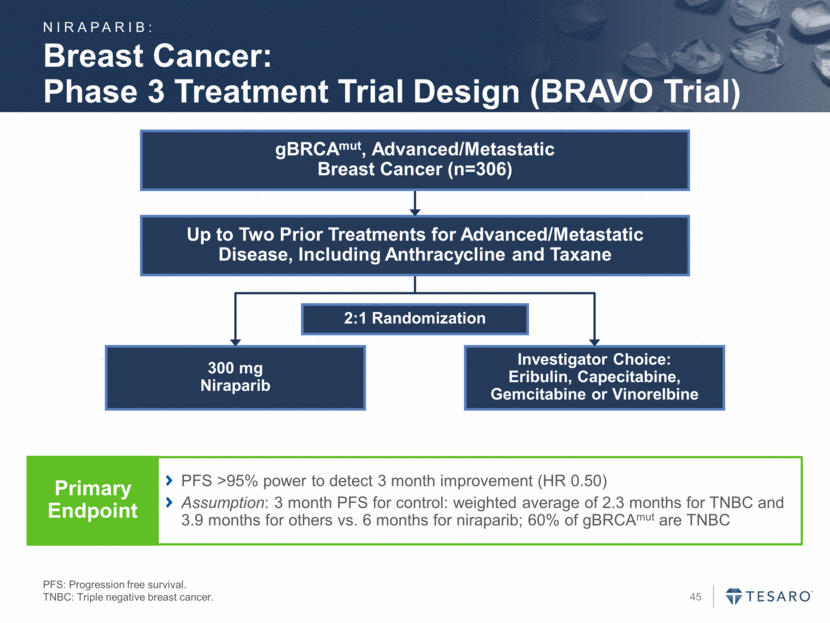
Breast Cancer: Phase 3 Treatment Trial Design (BRAVO Trial) PFS: Progression free survival. TNBC: Triple negative breast cancer. 2:1 Randomization 300 mg Niraparib Investigator Choice: Eribulin, Capecitabine, Gemcitabine or Vinorelbine PFS >95% power to detect 3 month improvement (HR 0.50) Assumption: 3 month PFS for control: weighted average of 2.3 months for TNBC and 3.9 months for others vs. 6 months for niraparib; 60% of gBRCAmut are TNBC Primary Endpoint Up to Two Prior Treatments for Advanced/Metastatic Disease, Including Anthracycline and Taxane gBRCAmut, Advanced/Metastatic Breast Cancer (n=306) NIRAPARIB:
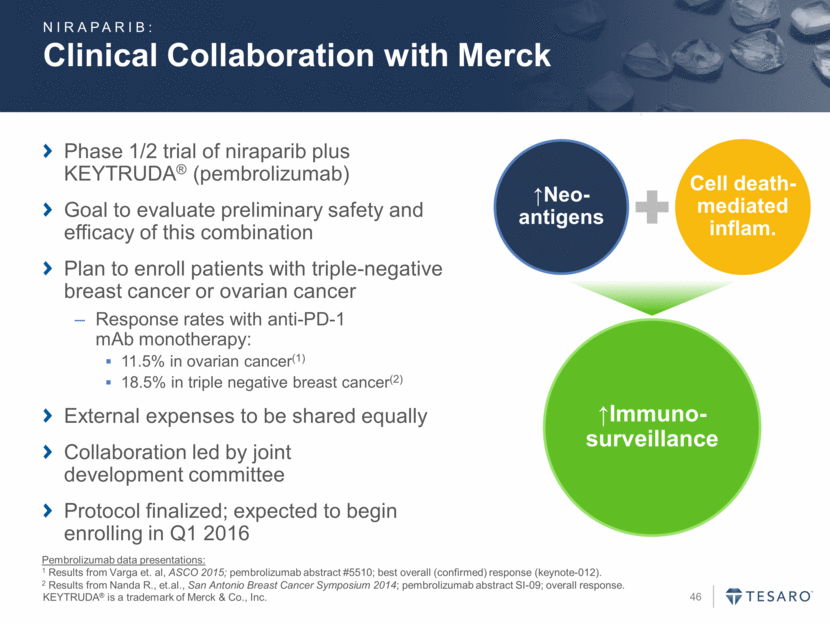
Clinical Collaboration with Merck KEYTRUDA® is a trademark of Merck & Co., Inc. Phase 1/2 trial of niraparib plus KEYTRUDA® (pembrolizumab) Goal to evaluate preliminary safety and efficacy of this combination Plan to enroll patients with triple-negative breast cancer or ovarian cancer Response rates with anti-PD-1 mAb monotherapy: 11.5% in ovarian cancer(1) 18.5% in triple negative breast cancer(2) External expenses to be shared equally Collaboration led by joint development committee Protocol finalized; expected to begin enrolling in Q1 2016 Pembrolizumab data presentations: 1 Results from Varga et. al, ASCO 2015; pembrolizumab abstract #5510; best overall (confirmed) response (keynote-012). 2 Results from Nanda R., et.al., San Antonio Breast Cancer Symposium 2014; pembrolizumab abstract SI-09; overall response. Cell death-mediated inflam. Neo-antigens Immuno-surveillance NIRAPARIB:
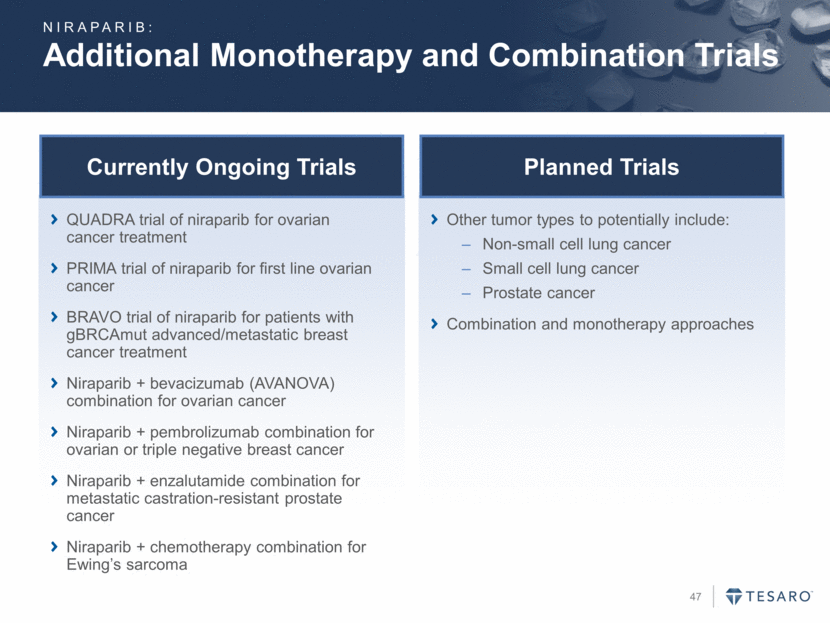
Additional Monotherapy and Combination Trials QUADRA trial of niraparib for ovarian cancer treatment PRIMA trial of niraparib for first line ovarian cancer BRAVO trial of niraparib for patients with gBRCAmut advanced/metastatic breast cancer treatment Niraparib + bevacizumab (AVANOVA) combination for ovarian cancer Niraparib + pembrolizumab combination for ovarian or triple negative breast cancer Niraparib + enzalutamide combination for metastatic castration-resistant prostate cancer Niraparib + chemotherapy combination for Ewing’s sarcoma Currently Ongoing Trials Other tumor types to potentially include: Non-small cell lung cancer Small cell lung cancer Prostate cancer Combination and monotherapy approaches Planned Trials NIRAPARIB:
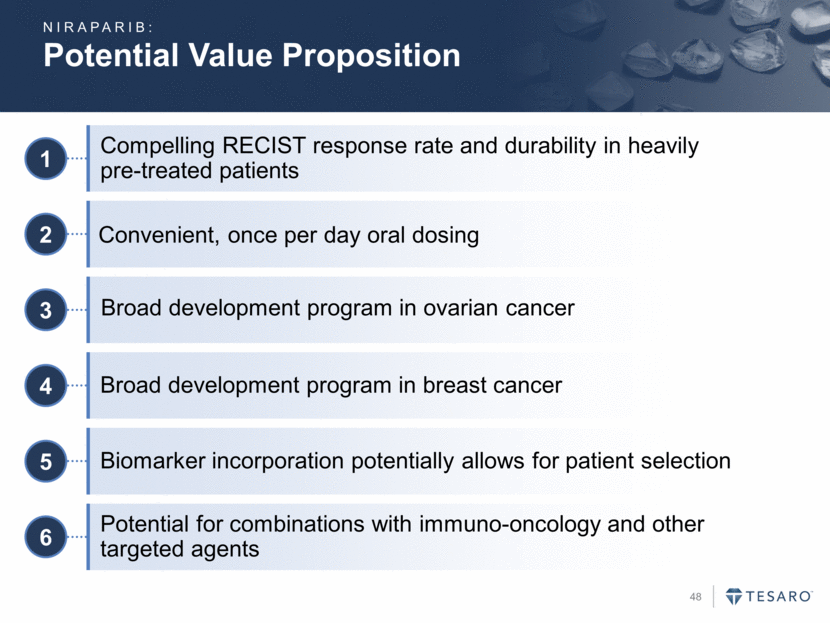
Potential Value Proposition 1 Compelling RECIST response rate and durability in heavily pre-treated patients 2 3 4 Broad development program in breast cancer 5 Biomarker incorporation potentially allows for patient selection 6 Potential for combinations with immuno-oncology and other targeted agents Convenient, once per day oral dosing Broad development program in ovarian cancer NIRAPARIB:
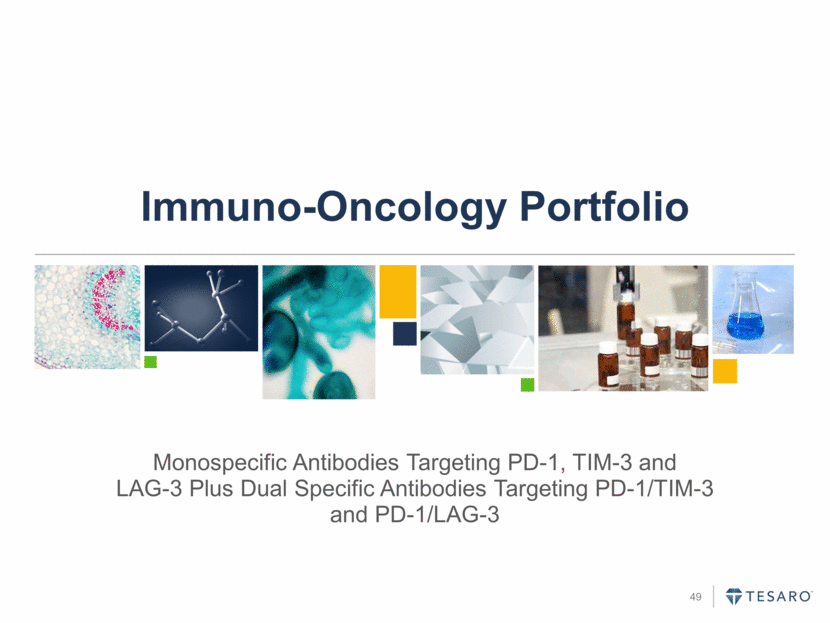
Immuno-Oncology Portfolio Monospecific Antibodies Targeting PD-1, TIM-3 and LAG-3 Plus Dual Specific Antibodies Targeting PD-1/TIM-3 and PD-1/LAG-3
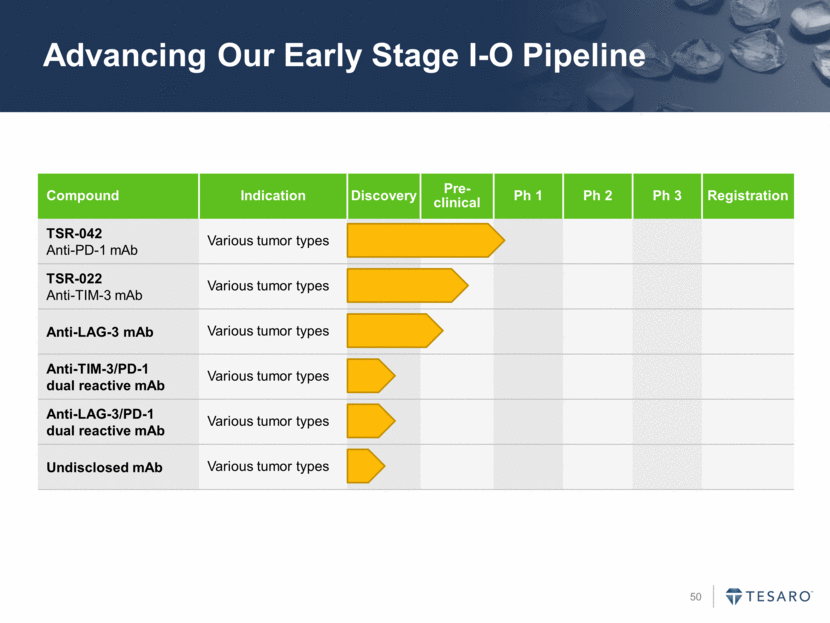
Advancing Our Early Stage I-O Pipeline Compound Indication Discovery Pre- clinical Ph 1 Ph 2 Ph 3 Registration TSR-042 Anti-PD-1 mAb Various tumor types TSR-022 Anti-TIM-3 mAb Various tumor types Anti-LAG-3 mAb Various tumor types Anti-TIM-3/PD-1 dual reactive mAb Various tumor types Anti-LAG-3/PD-1 dual reactive mAb Various tumor types Undisclosed mAb Various tumor types
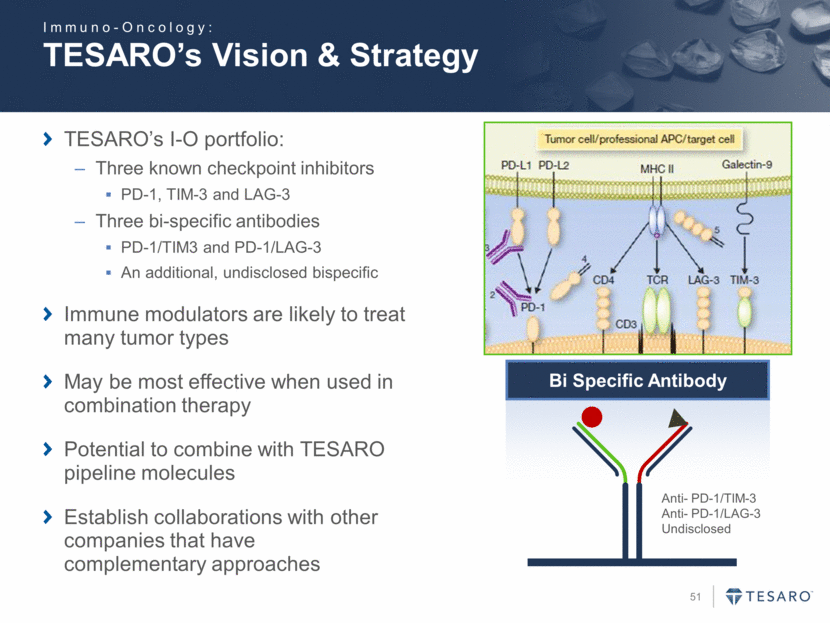
TESARO’s Vision & Strategy TESARO’s I-O portfolio: Three known checkpoint inhibitors PD-1, TIM-3 and LAG-3 Three bi-specific antibodies PD-1/TIM3 and PD-1/LAG-3 An additional, undisclosed bispecific Immune modulators are likely to treat many tumor types May be most effective when used in combination therapy Potential to combine with TESARO pipeline molecules Establish collaborations with other companies that have complementary approaches Bi Specific Antibody Anti- PD-1/TIM-3 Anti- PD-1/LAG-3 Undisclosed Immuno-Oncology:
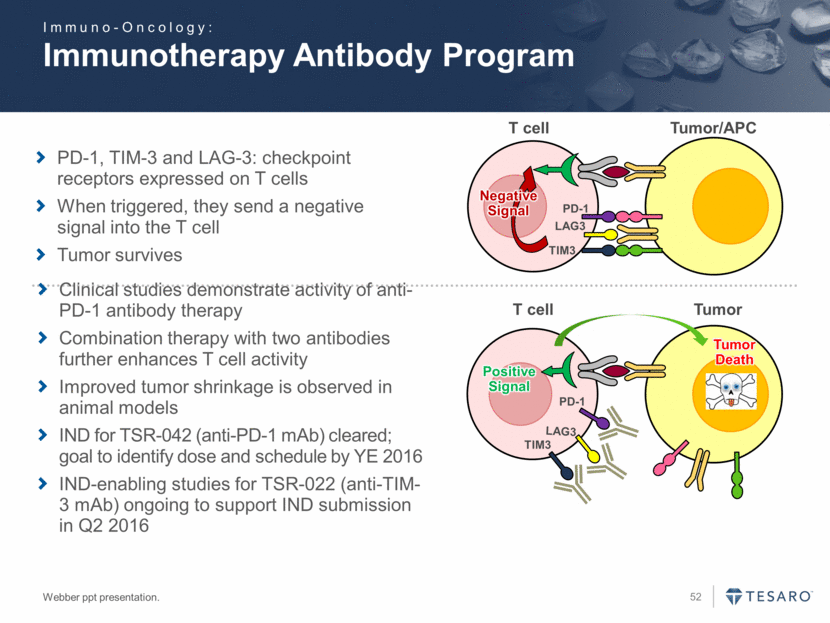
Immunotherapy Antibody Program Webber ppt presentation. T cell PD-1 Negative Signal TIM3 LAG3 PD-1 Positive Signal TIM3 LAG3 Tumor/APC Tumor Death T cell Tumor PD-1, TIM-3 and LAG-3: checkpoint receptors expressed on T cells When triggered, they send a negative signal into the T cell Tumor survives Clinical studies demonstrate activity of anti-PD-1 antibody therapy Combination therapy with two antibodies further enhances T cell activity Improved tumor shrinkage is observed in animal models IND for TSR-042 (anti-PD-1 mAb) cleared; goal to identify dose and schedule by YE 2016 IND-enabling studies for TSR-022 (anti-TIM-3 mAb) ongoing to support IND submission in Q2 2016 Immuno-Oncology:
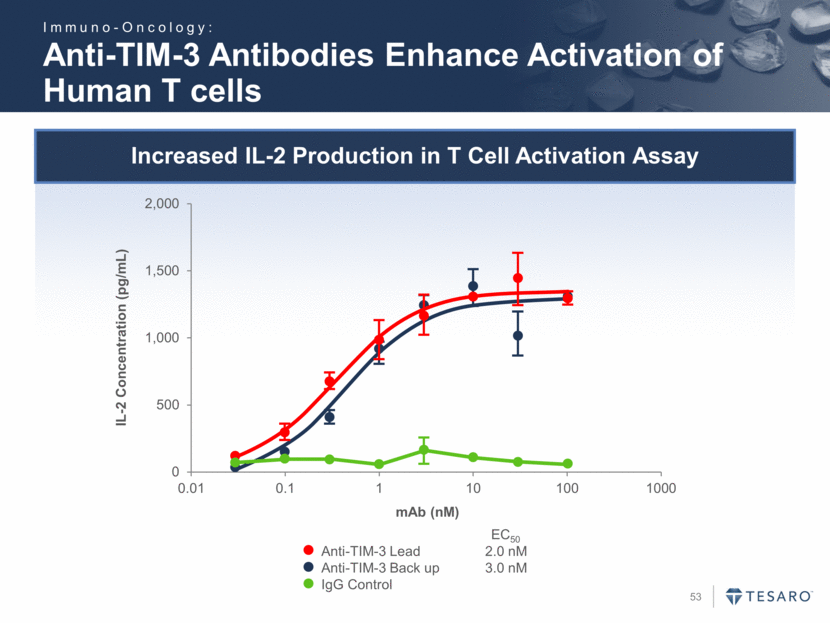
Increased IL-2 Production in T Cell Activation Assay Anti-TIM-3 Antibodies Enhance Activation of Human T cells Anti-TIM-3 Lead 2.0 nM Anti-TIM-3 Back up 3.0 nM IgG Control EC50 IL-2 Concentration (pg/mL) mAb (nM) Immuno-Oncology: 0 500 1,000 1,500 2,000 0.01 0.1 1 10 100 1000
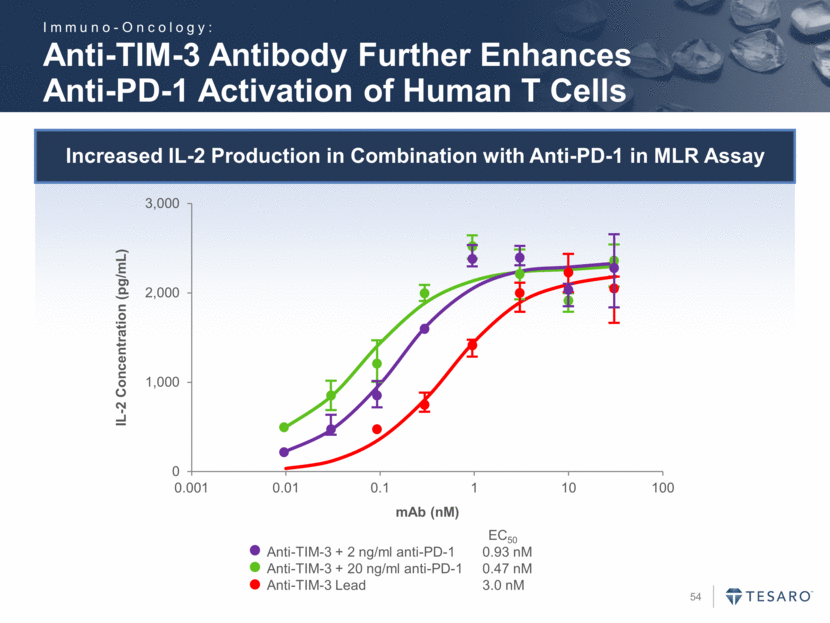
Increased IL-2 Production in Combination with Anti-PD-1 in MLR Assay Anti-TIM-3 Antibody Further Enhances Anti-PD-1 Activation of Human T Cells Anti-TIM-3 + 2 ng/ml anti-PD-1 0.93 nM Anti-TIM-3 + 20 ng/ml anti-PD-1 0.47 nM Anti-TIM-3 Lead 3.0 nM EC50 IL-2 Concentration (pg/mL) mAb (nM) Immuno-Oncology: 0 1,000 2,000 3,000 0.001 0.01 0.1 1 10 100
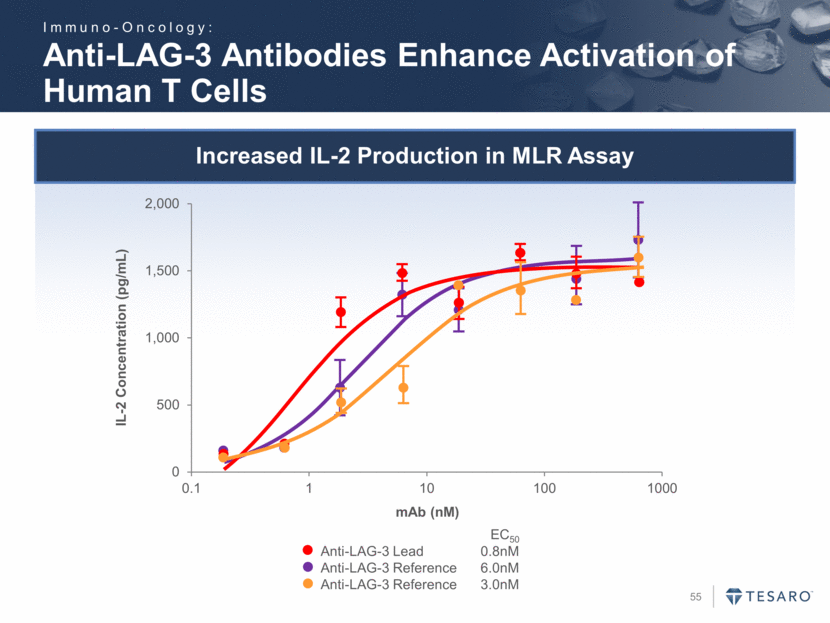
Increased IL-2 Production in MLR Assay Anti-LAG-3 Antibodies Enhance Activation of Human T Cells Anti-LAG-3 Lead 0.8nM Anti-LAG-3 Reference 6.0nM Anti-LAG-3 Reference 3.0nM EC50 IL-2 Concentration (pg/mL) mAb (nM) Immuno-Oncology: 0 500 1,000 1,500 2,000 0.1 1 10 100 1000
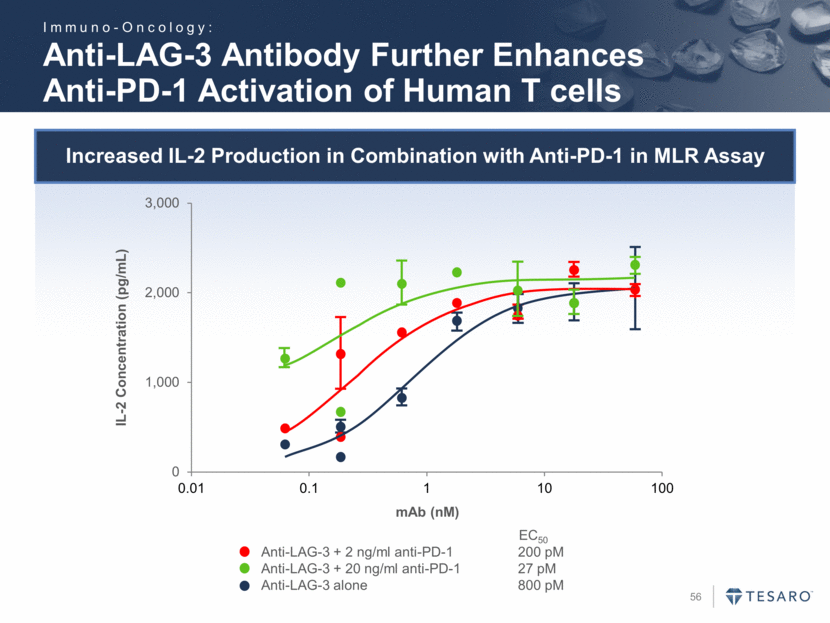
Increased IL-2 Production in Combination with Anti-PD-1 in MLR Assay Anti-LAG-3 Antibody Further Enhances Anti-PD-1 Activation of Human T cells Anti-LAG-3 + 2 ng/ml anti-PD-1 200 pM Anti-LAG-3 + 20 ng/ml anti-PD-1 27 pM Anti-LAG-3 alone 800 pM EC50 mAb (nM) IL-2 Concentration (pg/mL) Immuno-Oncology: 0 1,000 2,000 3,000 0.01 0.1 1 10 100
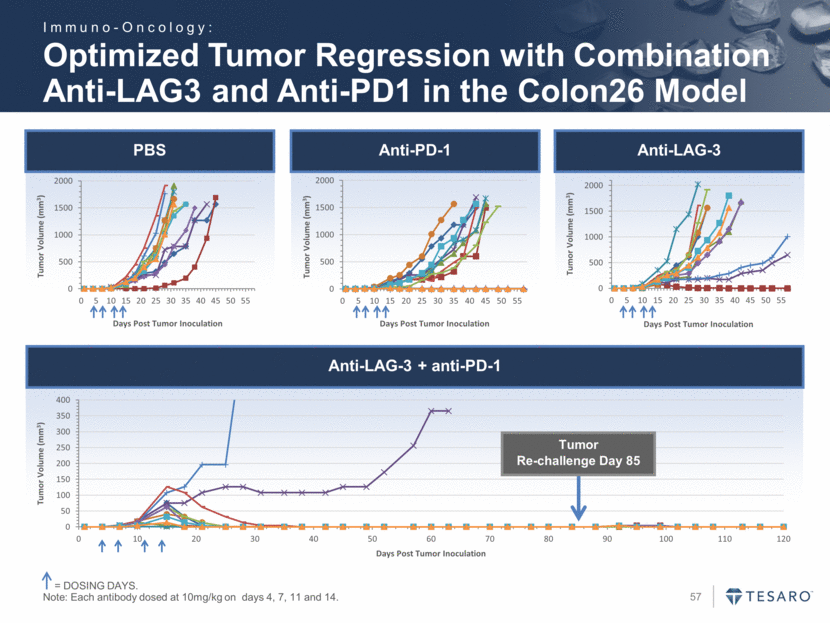
Optimized Tumor Regression with Combination Anti-LAG3 and Anti-PD1 in the Colon26 Model = DOSING DAYS. Note: Each antibody dosed at 10mg/kg on days 4, 7, 11 and 14. PBS Anti-PD-1 Anti-LAG-3 Anti-LAG-3 + anti-PD-1 Tumor Re-challenge Day 85 Immuno-Oncology: 0 500 1000 1500 2000 0 5 10 15 20 25 30 35 40 45 50 55 Tumor Volume (mm 3 ) Days Post Tumor Inoculation 0 500 1000 1500 2000 0 5 10 15 20 25 30 35 40 45 50 55 Tumor Volume (mm 3 ) Days Post Tumor Inoculation 0 500 1000 1500 2000 0 5 10 15 20 25 30 35 40 45 50 55 Tumor Volume (mm 3 ) Days Post Tumor Inoculation 0 50 100 150 200 250 300 350 400 0 10 20 30 40 50 60 70 80 90 100 110 120 Tumor Volume (mm 3 ) Days Post Tumor Inoculation
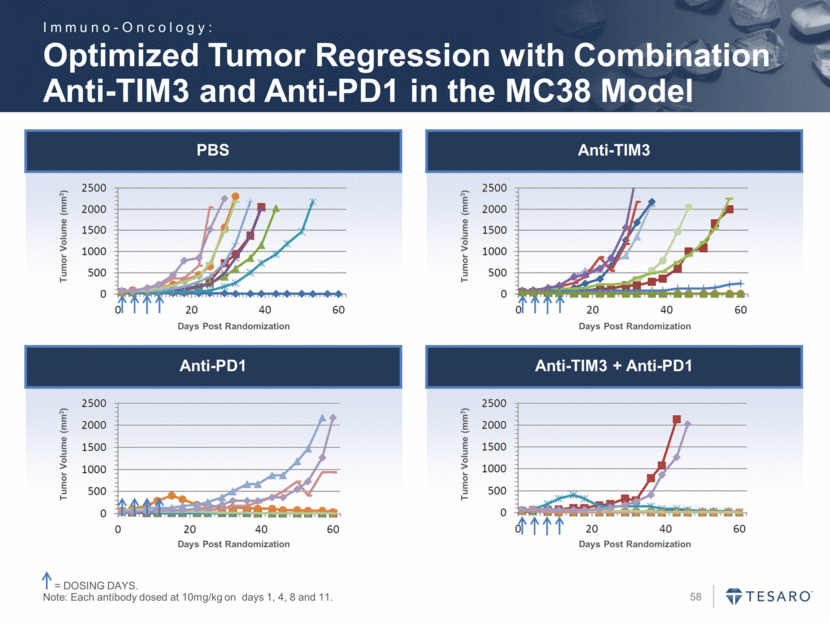
PBS Anti-TIM3 Anti-PD1 Anti-TIM3 + Anti-PD1 Optimized Tumor Regression with Combination Anti-TIM3 and Anti-PD1 in the MC38 Model = DOSING DAYS. Note: Each antibody dosed at 10mg/kg on days 1, 4, 8 and 11. Tumor Volume (mm3) Days Post Randomization Tumor Volume (mm3) Days Post Randomization Tumor Volume (mm3) Days Post Randomization Days Post Randomization Tumor Volume (mm3) Immuno-Oncology:
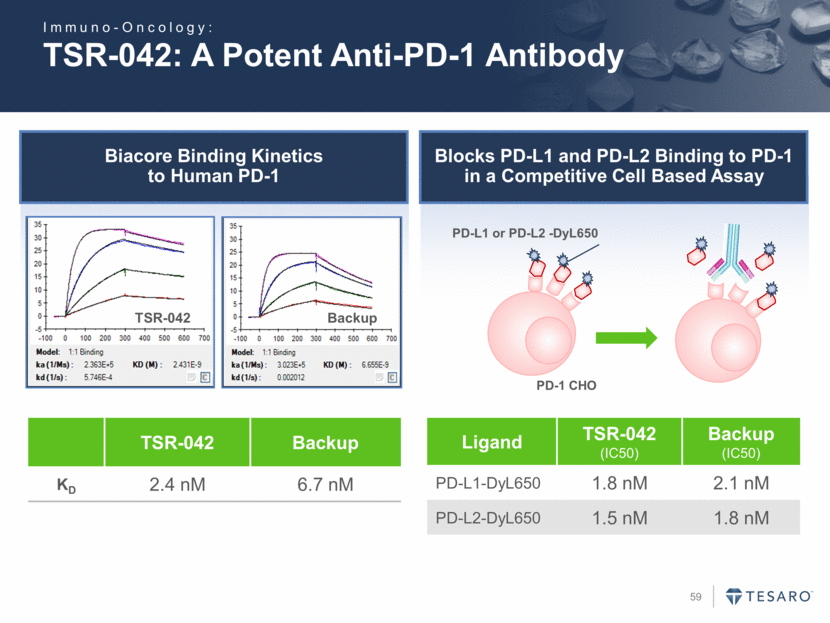
Biacore Binding Kinetics to Human PD-1 TSR-042: A Potent Anti-PD-1 Antibody TSR-042 Backup KD 2.4 nM 6.7 nM PD-L1 or PD-L2 -DyL650 PD-1 CHO Ligand TSR-042 (IC50) Backup (IC50) PD-L1-DyL650 1.8 nM 2.1 nM PD-L2-DyL650 1.5 nM 1.8 nM TSR-042 Backup Blocks PD-L1 and PD-L2 Binding to PD-1 in a Competitive Cell Based Assay Immuno-Oncology:
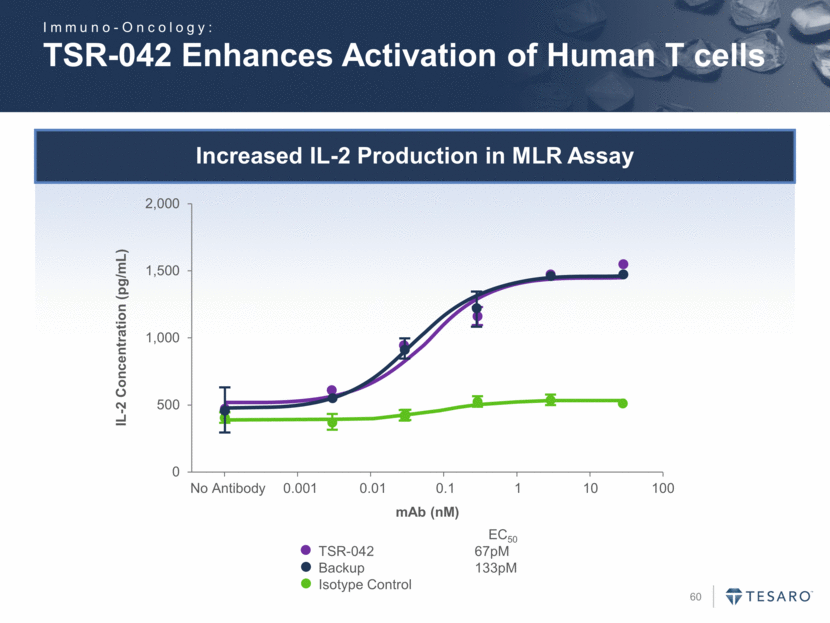
Increased IL-2 Production in MLR Assay TSR-042 Enhances Activation of Human T cells IL-2 Concentration (pg/mL) TSR-042 67pM Backup 133pM Isotype Control EC50 mAb (nM) Immuno-Oncology: 0 500 1,000 1,500 2,000 No Antibody 0.001 0.01 0.1 1 10 100
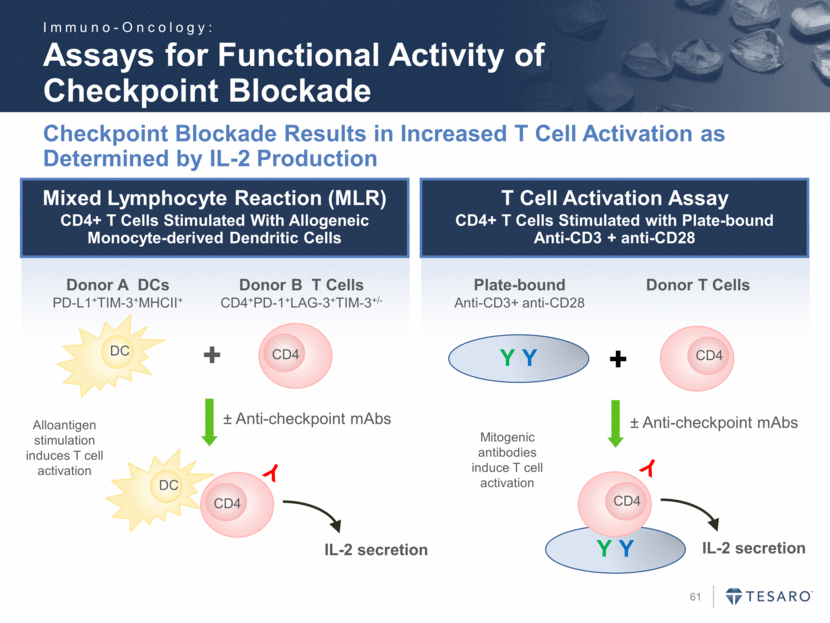
Mixed Lymphocyte Reaction (MLR) CD4+ T Cells Stimulated With Allogeneic Monocyte-derived Dendritic Cells Assays for Functional Activity of Checkpoint Blockade Checkpoint Blockade Results in Increased T Cell Activation as Determined by IL-2 Production CD4 DC DC CD4 Donor A DCs PD-L1+TIM-3+MHCII+ Donor B T Cells CD4+PD-1+LAG-3+TIM-3+/- + ± Anti-checkpoint mAbs Y IL-2 secretion Alloantigen stimulation induces T cell activation T Cell Activation Assay CD4+ T Cells Stimulated with Plate-bound Anti-CD3 + anti-CD28 Y Y CD4 Y CD4 Y Y + ± Anti-checkpoint mAbs Plate-bound Anti-CD3+ anti-CD28 Donor T Cells IL-2 secretion Mitogenic antibodies induce T cell activation Immuno-Oncology:
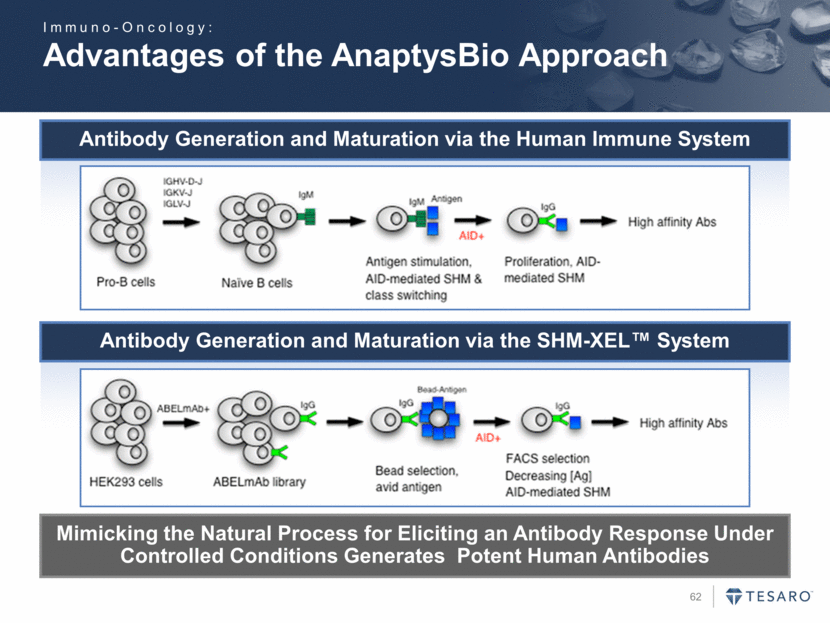
Advantages of the AnaptysBio Approach Mimicking the Natural Process for Eliciting an Antibody Response Under Controlled Conditions Generates Potent Human Antibodies Antibody Generation and Maturation via the Human Immune System Antibody Generation and Maturation via the SHM-XEL™ System Immuno-Oncology:
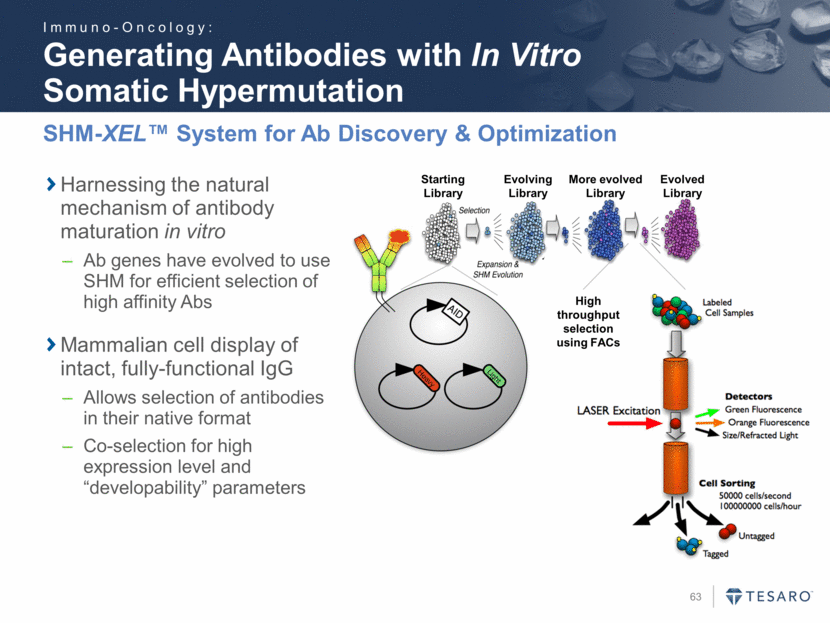
Generating Antibodies with In Vitro Somatic Hypermutation SHM-XEL™ System for Ab Discovery & Optimization High throughput selection using FACs Starting Library Evolving Library More evolved Library Evolved Library Harnessing the natural mechanism of antibody maturation in vitro Ab genes have evolved to use SHM for efficient selection of high affinity Abs Mammalian cell display of intact, fully-functional IgG Allows selection of antibodies in their native format Co-selection for high expression level and “developability” parameters Immuno-Oncology:
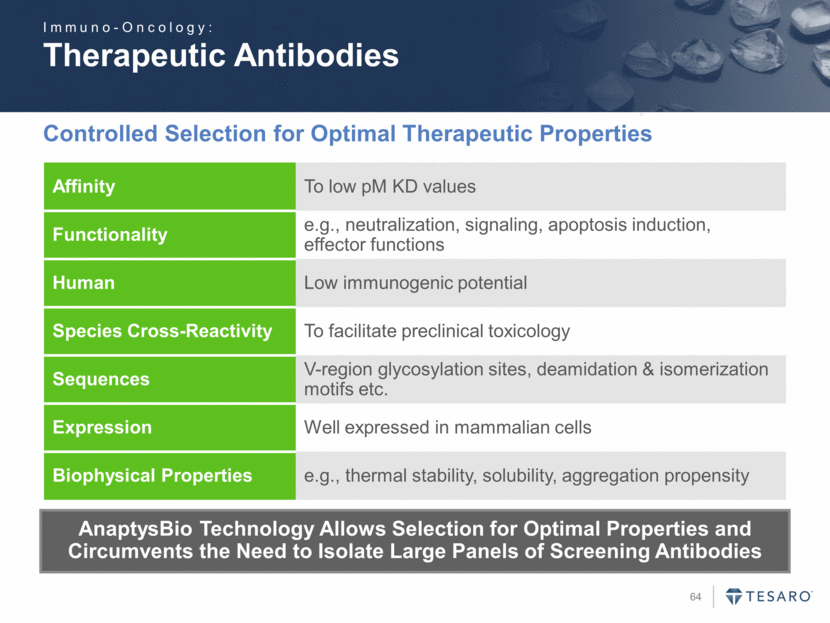
Therapeutic Antibodies Controlled Selection for Optimal Therapeutic Properties AnaptysBio Technology Allows Selection for Optimal Properties and Circumvents the Need to Isolate Large Panels of Screening Antibodies Affinity To low pM KD values Functionality e.g., neutralization, signaling, apoptosis induction, effector functions Human Low immunogenic potential Species Cross-Reactivity To facilitate preclinical toxicology Sequences V-region glycosylation sites, deamidation & isomerization motifs etc. Expression Well expressed in mammalian cells Biophysical Properties e.g., thermal stability, solubility, aggregation propensity Immuno-Oncology:
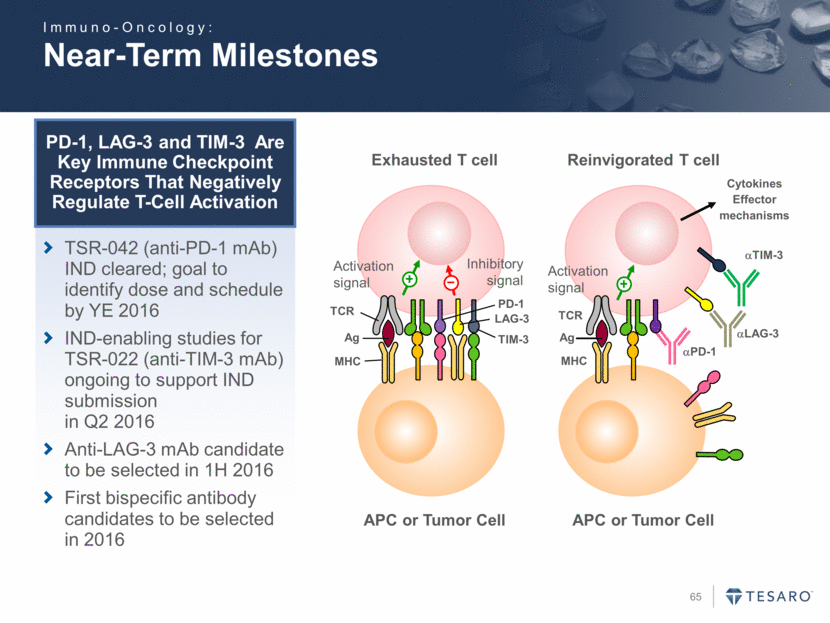
Near-Term Milestones APC or Tumor Cell Exhausted T cell TCR Ag MHC PD-1 TIM-3 LAG-3 Activation signal Inhibitory signal Ag APC or Tumor Cell Reinvigorated T cell TCR MHC Activation signal Cytokines Effector mechanisms aPD-1 aLAG-3 aTIM-3 PD-1, LAG-3 and TIM-3 Are Key Immune Checkpoint Receptors That Negatively Regulate T-Cell Activation TSR-042 (anti-PD-1 mAb) IND cleared; goal to identify dose and schedule by YE 2016 IND-enabling studies for TSR-022 (anti-TIM-3 mAb) ongoing to support IND submission in Q2 2016 Anti-LAG-3 mAb candidate to be selected in 1H 2016 First bispecific antibody candidates to be selected in 2016 Immuno-Oncology:
CORPORATE PRESENTATION March 2016