Attached files
| file | filename |
|---|---|
| 8-K - 8-K - MONITRONICS INTERNATIONAL INC | miinvestorpresentation.htm |

A S C E N T CAPITAL GROUP INC Investor Presentation March 2016 ASCENT CAPITAL GROUP INC March 2016 1 3 Exhibit 99.1
A S C E N T CAPITAL GROUP INC This presentation contains or may contain certain forward-looking statements within the meaning of the Private Securities Litigation Reform Act of 1995, including statements about our market potential in the DIY alarm space, new and expanded service and product offerings, consumer demand for home automation systems, lead generation for Monitronics' dealers, business strategies, our ability to perform well in a challenging competitive environment, future financial performance, the growth and development of our core business, growth expectations (including regarding our HomeTouch® offering), the predictability of our pool attrition curve, our acquisition opportunities and prospects and other matters that are not historical facts. These forward-looking statements involve many risks and uncertainties that could cause actual results to differ materially from those expressed or implied by such statements, including, without limitation, the operating performance and actual growth potential of the Monitronics and LiveWatch businesses, continued productivity of Monitronics’ dealer network and LiveWatch's internal sales force, competitive issues, subscriber preferences, continued access to capital on terms acceptable to Ascent and Monitronics, our ability to capitalize on acquisition opportunities, general market conditions and regulatory issues. These forward looking statements speak only as of the date hereof, and Ascent expressly disclaims any obligation or undertaking to disseminate any updates or revisions to any forward-looking statement contained herein to reflect any change in Ascent's or Monitronics' expectations with regard thereto or any change in events, conditions or circumstances on which any such statement is based. This presentation will discuss certain non-GAAP financial measures, including Adjusted EBITDA, Pre-SAC Adjusted EBITDA and Steady State Free Cash Flow. As companies often define non-GAAP financial measures differently, Adjusted EBITDA, Pre-SAC Adjusted EBITDA and Steady State Free Cash Flow as calculated by us may not be comparable to similarly titled measures reported by other companies. Please see Monitronics’ and Ascent Capital's most recent 10-K filed with the Securities and Exchange Commission (“SEC”). For applicable definitions and reconciliations, see the Appendix at the end of this presentation. March 2016 2 Forward Looking Statements
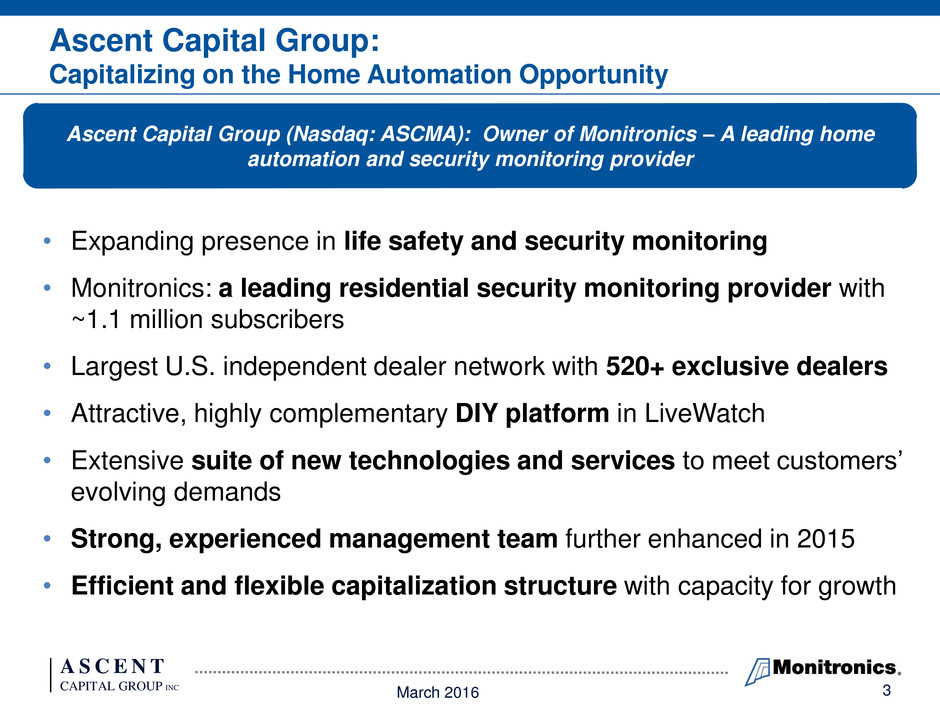
A S C E N T CAPITAL GROUP INC March 2016 3 Ascent Capital Group: Capitalizing on the Home Automation Opportunity • Expanding presence in life safety and security monitoring • Monitronics: a leading residential security monitoring provider with ~1.1 million subscribers • Largest U.S. independent dealer network with 520+ exclusive dealers • Attractive, highly complementary DIY platform in LiveWatch • Extensive suite of new technologies and services to meet customers’ evolving demands • Strong, experienced management team further enhanced in 2015 • Efficient and flexible capitalization structure with capacity for growth Ascent Capital Group (Nasdaq: ASCMA): Owner of Monitronics – A leading home automation and security monitoring provider
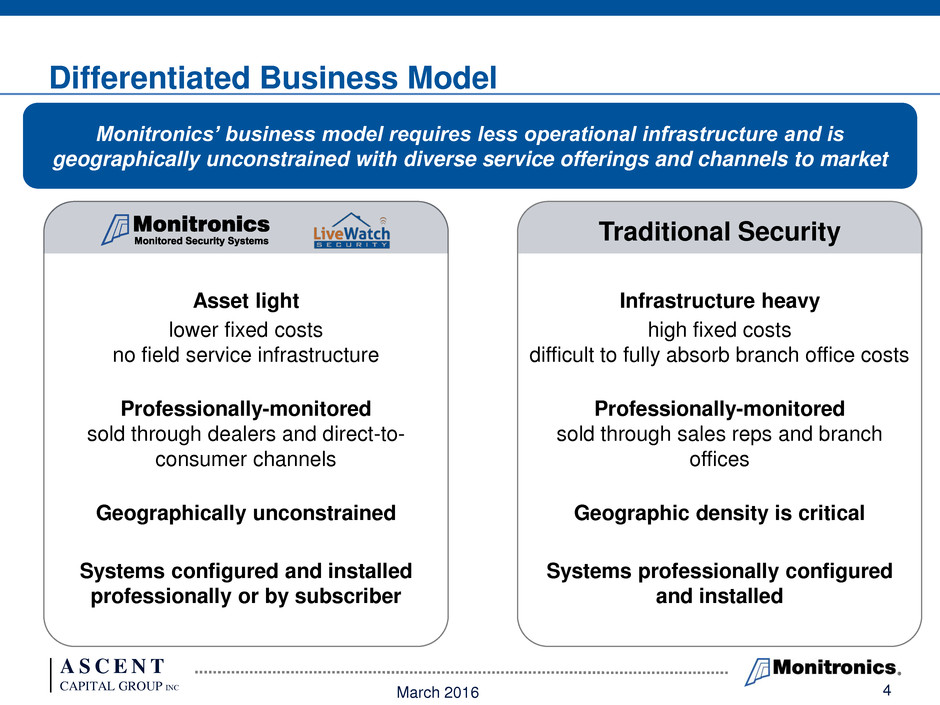
A S C E N T CAPITAL GROUP INC Traditional Security Infrastructure heavy high fixed costs difficult to fully absorb branch office costs Professionally-monitored sold through sales reps and branch offices Geographic density is critical Systems professionally configured and installed Asset light lower fixed costs no field service infrastructure Professionally-monitored sold through dealers and direct-to- consumer channels Geographically unconstrained Systems configured and installed professionally or by subscriber Differentiated Business Model March 2016 4 Monitronics’ business model requires less operational infrastructure and is geographically unconstrained with diverse service offerings and channels to market
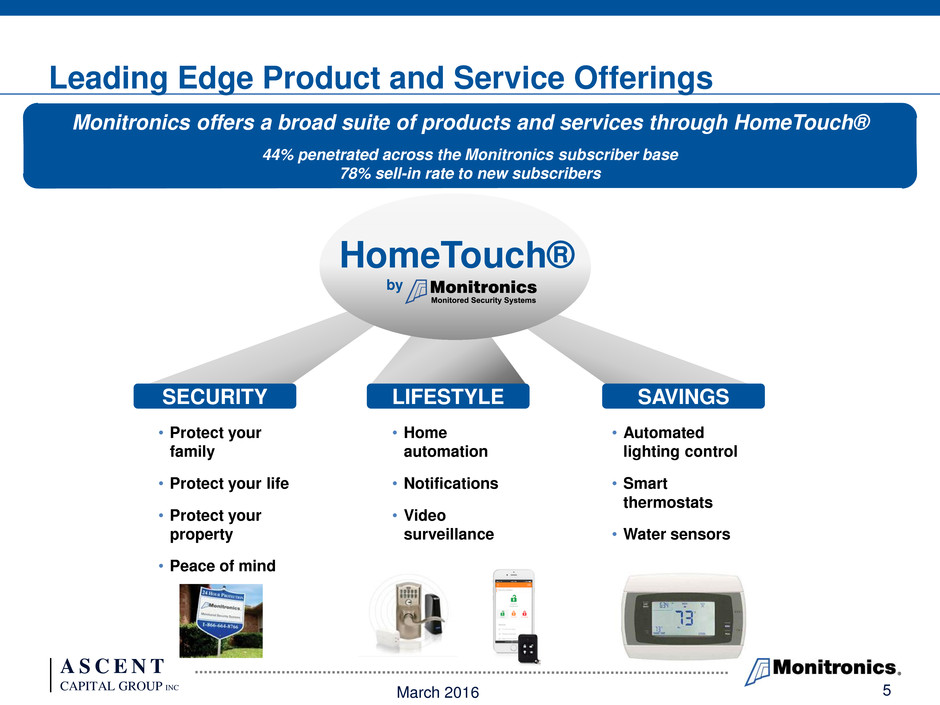
A S C E N T CAPITAL GROUP INC Leading Edge Product and Service Offerings March 2016 5 Monitronics offers a broad suite of products and services through HomeTouch® 44% penetrated across the Monitronics subscriber base 78% sell-in rate to new subscribers HomeTouch® by SECURITY LIFESTYLE SAVINGS • Protect your family • Protect your life • Protect your property • Peace of mind • Home automation • Notifications • Video surveillance • Automated lighting control • Smart thermostats • Water sensors Update rates
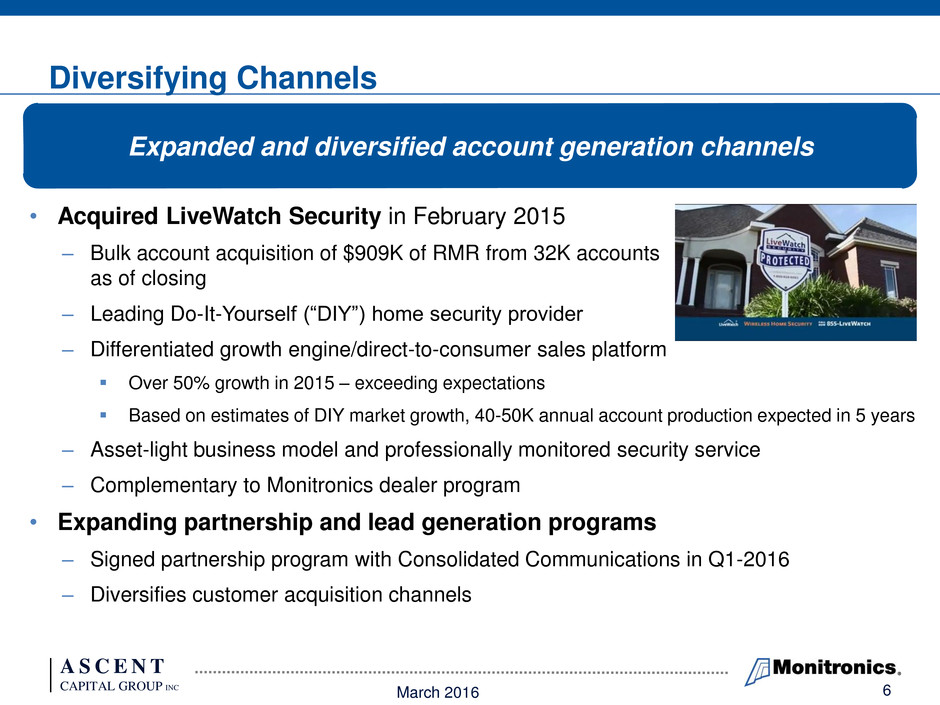
A S C E N T CAPITAL GROUP INC • Acquired LiveWatch Security in February 2015 ‒ Bulk account acquisition of $909K of RMR from 32K accounts as of closing ‒ Leading Do-It-Yourself (“DIY”) home security provider ‒ Differentiated growth engine/direct-to-consumer sales platform Over 50% growth in 2015 – exceeding expectations Based on estimates of DIY market growth, 40-50K annual account production expected in 5 years ‒ Asset-light business model and professionally monitored security service ‒ Complementary to Monitronics dealer program • Expanding partnership and lead generation programs ‒ Signed partnership program with Consolidated Communications in Q1-2016 ‒ Diversifies customer acquisition channels Diversifying Channels March 2016 6 Expanded and diversified account generation channels
A S C E N T CAPITAL GROUP INC • Core account attrition improved to 12.7% • Topline revenue increased at 4.4% • Acquired LiveWatch and grew its revenue by over 50% in 2015 • Increased subscriber accounts by 2.9% • Continued to lead the industry in interactive sales with 75% of new customers buying home automation services • Significant progress in building strength of management team 2015 Highlights March 2016 7 Solid year with changes that laid the foundation for tomorrow
A S C E N T CAPITAL GROUP INC Attrition • Core attrition ‒ Implement predictive churn model to identify high risk subscribers and proactively address dissatisfaction ‒ Focus on customer service and first call resolution • Pinnacle attrition ‒ Expected impact at or below current levels through 2017 • 2G attrition ‒ Continue conversion efforts – approximately 75,000 customers remaining as of March 2016 ‒ Expect the large majority of 2G customer base to be fully transitioned by year end 2016 Roadmap to Improved Free Cash Flow Production • Enhance services offered to existing subscriber base ‒ Increase penetration of HomeTouch® home automation services in existing subscriber base ‒ Expand HomeTouch® services to include Internet of Things • New service offerings ‒ DIY security, home automation, PERS Core Account Generation Engine Operating Costs March 2016 8 Monitronics’ leverageable operating platform provides a foundation for strong free cash flow generation, future growth and expanded service offerings Service Offerings • Invest in greater customer service automation • Enhance subscriber self-service capabilities • Streamline operations through opportunistic operating cost cuts • Focus on dealer network ‒ Attract new dealers and enhance productivity of existing dealers ‒ Reduce purchase multiples • Grow Customer Demand Generation Engine ‒ Direct-to-consumer DIY ‒ Professional security monitoring & home automation • Expand Lead Generation ‒ New corporate affiliate partnerships ‒ 3rd party lead generation ‒ SEO/SEM and website redesign
A S C E N T CAPITAL GROUP INC • Lower creation cost multiples • Diversification of account creation channels • Increased capital efficiency through streamlined operations • Attrition, long-term trend toward lifecycle metrics • Maturation of Pinnacle account portfolio, lower attrition levels • Completion of 2G transition, free up financial and human resources • Bottom Line: Drive higher cash flow generation and FCF yield Future Outlook March 2016 9 Focus on free cash flow yield
A S C E N T CAPITAL GROUP INC • Large, dynamic industry poised for penetration growth • Strong and predictable operating business with attractive long term cash flows and core growth opportunities • Highly scalable platform for future growth and service expansion • Asset-light model with highly productive, tax efficient, cash flow characteristics • Strong, stable balance sheet with sufficient liquidity and access to capital markets • Capitalization structure to drive highly attractive equity returns • Fragmented landscape with potential consolidation opportunity March 2016 10 Summary Highlights
A S C E N T CAPITAL GROUP INC Appendix March 2016 11
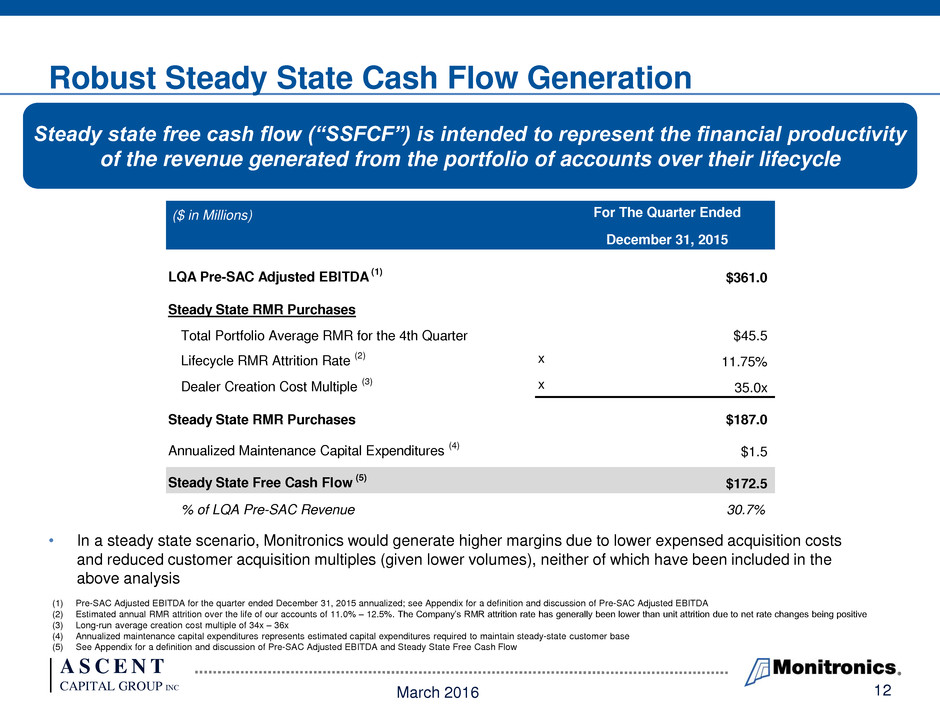
A S C E N T CAPITAL GROUP INC ($ in Millions) For The Quarter Ended December 31, 2015 LQA Pre-SAC Adjusted EBITDA (1) $361.0 Steady State RMR Purchases Total Portfolio Average RMR for the 4th Quarter $45.5 Lifecycle RMR Attrition Rate (2) x 11.75% Dealer Creation Cost Multiple (3) x 35.0x Steady State RMR Purchases $187.0 Annualized Maintenance Capital Expenditures (4) $1.5 Steady State Free Cash Flow (5) $172.5 % of LQA Pre-SAC Revenue 30.7% Robust Steady State Cash Flow Generation (1) Pre-SAC Adjusted EBITDA for the quarter ended December 31, 2015 annualized; see Appendix for a definition and discussion of Pre-SAC Adjusted EBITDA (2) Estimated annual RMR attrition over the life of our accounts of 11.0% – 12.5%. The Company’s RMR attrition rate has generally been lower than unit attrition due to net rate changes being positive (3) Long-run average creation cost multiple of 34x – 36x (4) Annualized maintenance capital expenditures represents estimated capital expenditures required to maintain steady-state customer base (5) See Appendix for a definition and discussion of Pre-SAC Adjusted EBITDA and Steady State Free Cash Flow Steady state free cash flow (“SSFCF”) is intended to represent the financial productivity of the revenue generated from the portfolio of accounts over their lifecycle March 2016 12 • In a steady state scenario, Monitronics would generate higher margins due to lower expensed acquisition costs and reduced customer acquisition multiples (given lower volumes), neither of which have been included in the above analysis
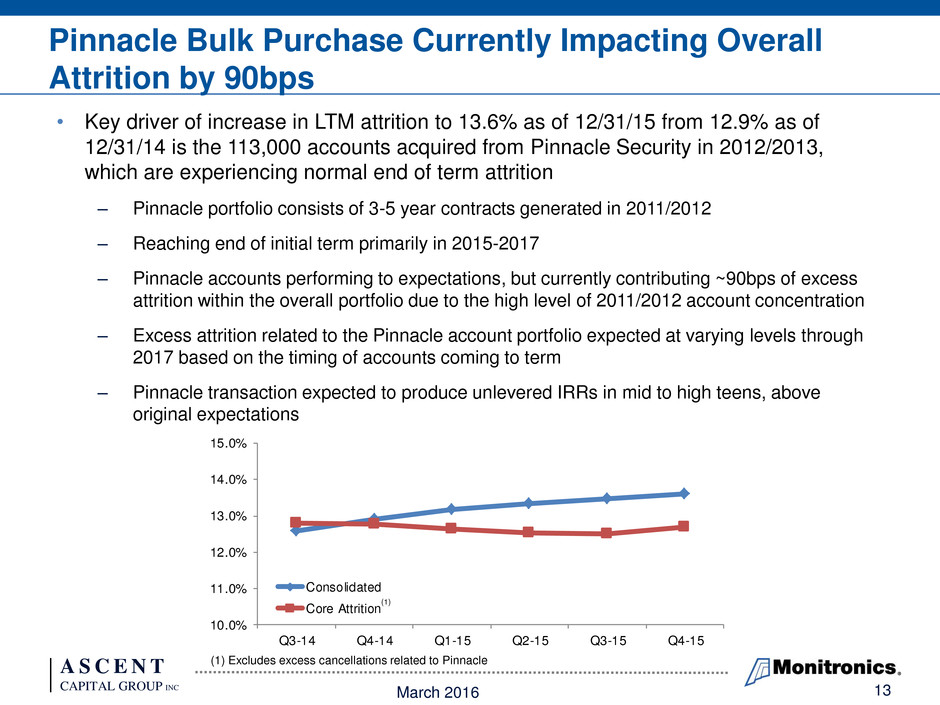
A S C E N T CAPITAL GROUP INC 10.0% 11.0% 12.0% 13.0% 14.0% 15.0% Q3-14 Q4-14 Q1-15 Q2-15 Q3-15 Q4-15 Consolidated Core Attrition • Key driver of increase in LTM attrition to 13.6% as of 12/31/15 from 12.9% as of 12/31/14 is the 113,000 accounts acquired from Pinnacle Security in 2012/2013, which are experiencing normal end of term attrition ‒ Pinnacle portfolio consists of 3-5 year contracts generated in 2011/2012 ‒ Reaching end of initial term primarily in 2015-2017 ‒ Pinnacle accounts performing to expectations, but currently contributing ~90bps of excess attrition within the overall portfolio due to the high level of 2011/2012 account concentration ‒ Excess attrition related to the Pinnacle account portfolio expected at varying levels through 2017 based on the timing of accounts coming to term ‒ Pinnacle transaction expected to produce unlevered IRRs in mid to high teens, above original expectations March 2016 13 Pinnacle Bulk Purchase Currently Impacting Overall Attrition by 90bps (1) Excludes excess cancellations related to Pinnacle (1)
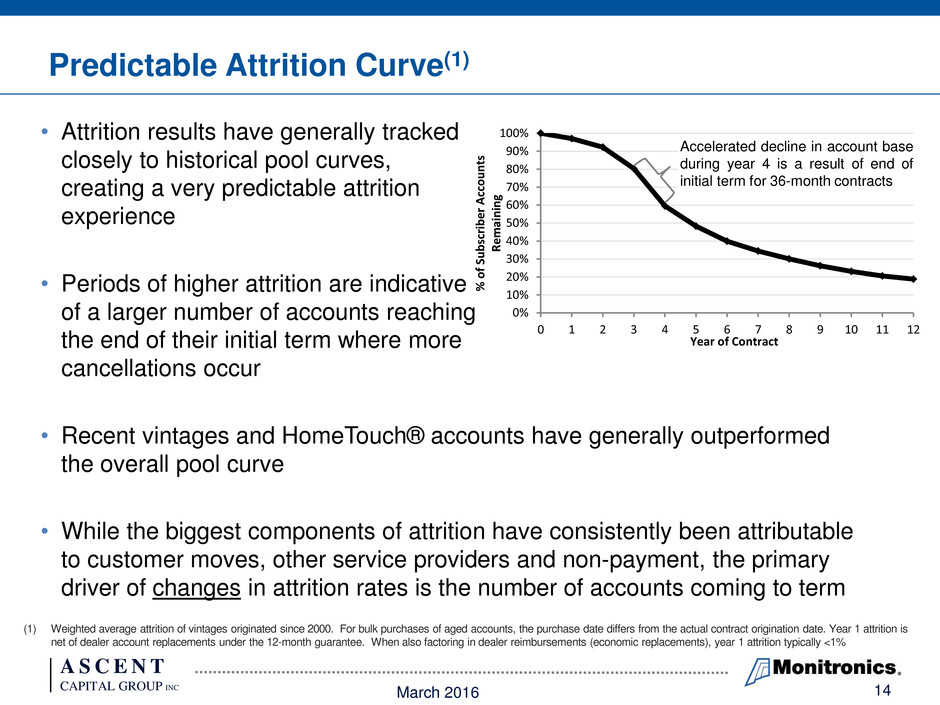
A S C E N T CAPITAL GROUP INC • Attrition results have generally tracked closely to historical pool curves, creating a very predictable attrition experience • Periods of higher attrition are indicative of a larger number of accounts reaching the end of their initial term where more cancellations occur • Recent vintages and HomeTouch® accounts have generally outperformed the overall pool curve • While the biggest components of attrition have consistently been attributable to customer moves, other service providers and non-payment, the primary driver of changes in attrition rates is the number of accounts coming to term (1) Weighted average attrition of vintages originated since 2000. For bulk purchases of aged accounts, the purchase date differs from the actual contract origination date. Year 1 attrition is net of dealer account replacements under the 12-month guarantee. When also factoring in dealer reimbursements (economic replacements), year 1 attrition typically <1% 0% 10% 20% 30% 40% 50% 60% 70% 80% 90% 100% 0 1 2 3 4 5 6 7 8 9 10 11 12 % o f Su b sc ri b e r A cc o u n ts R e m ai n in g Year of Contract Accelerated decline in account base during year 4 is a result of end of initial term for 36-month contracts Predictable Attrition Curve(1) March 2016 14
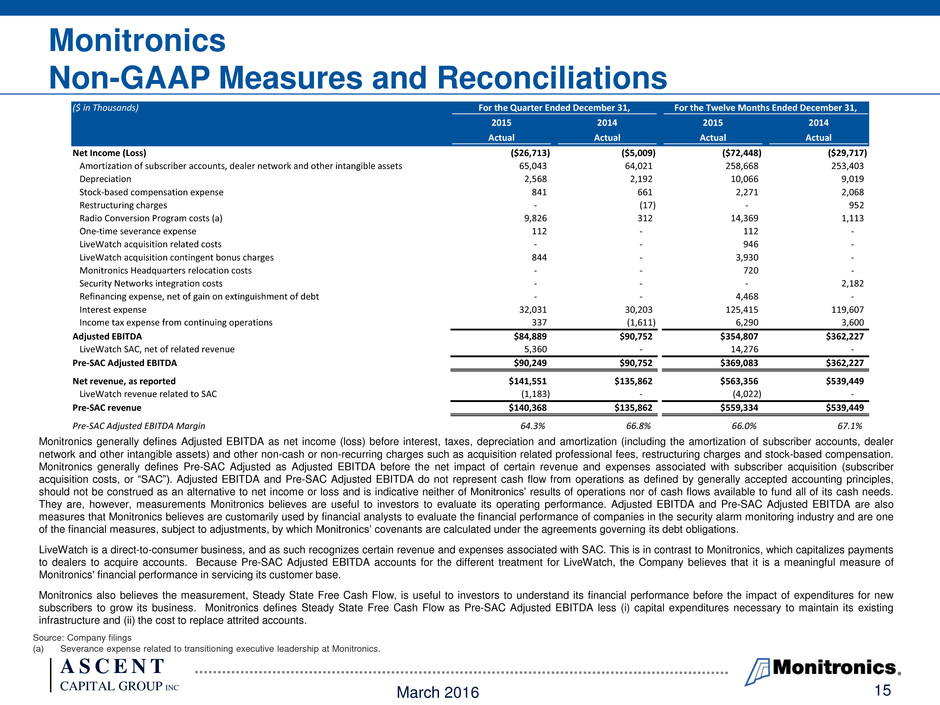
A S C E N T CAPITAL GROUP INC ($ in Thousands) For the Quarter Ended December 31, For the Twelve Months Ended December 31, 2015 2014 2015 2014 Actual Actual Actual Actual Net Income (Loss) ($26,713) ($5,009) ($72,448) ($29,717) Amortization of subscriber accounts, dealer network and other intangible assets 65,043 64,021 258,668 253,403 Depreciation 2,568 2,192 10,066 9,019 Stock-based compensation expense 841 661 2,271 2,068 Restructuring charges - (17) - 952 Radio Conversion Program costs (a) 9,826 312 14,369 1,113 One-time severance expense 112 - 112 - LiveWatch acquisition related costs - - 946 - LiveWatch acquisition contingent bonus charges 844 - 3,930 - Monitronics Headquarters relocation costs - - 720 - Security Networks integration costs - - - 2,182 Refinancing expense, net of gain on extinguishment of debt - - 4,468 - Interest expense 32,031 30,203 125,415 119,607 Income tax expense from continuing operations 337 (1,611) 6,290 3,600 Adjusted EBITDA $84,889 $90,752 $354,807 $362,227 LiveWatch SAC, net of related revenue 5,360 - 14,276 - Pre-SAC Adjusted EBITDA $90,249 $90,752 $369,083 $362,227 Net revenue, as reported $141,551 $135,862 $563,356 $539,449 LiveWatch revenue related to SAC (1,183) - (4,022) - Pre-SAC revenue $140,368 $135,862 $559,334 $539,449 Pre-SAC Adjusted EBITDA Margin 64.3% 66.8% 66.0% 67.1% Source: Company filings (a) Severance expense related to transitioning executive leadership at Monitronics. Monitronics generally defines Adjusted EBITDA as net income (loss) before interest, taxes, depreciation and amortization (including the amortization of subscriber accounts, dealer network and other intangible assets) and other non-cash or non-recurring charges such as acquisition related professional fees, restructuring charges and stock-based compensation. Monitronics generally defines Pre-SAC Adjusted as Adjusted EBITDA before the net impact of certain revenue and expenses associated with subscriber acquisition (subscriber acquisition costs, or “SAC”). Adjusted EBITDA and Pre-SAC Adjusted EBITDA do not represent cash flow from operations as defined by generally accepted accounting principles, should not be construed as an alternative to net income or loss and is indicative neither of Monitronics’ results of operations nor of cash flows available to fund all of its cash needs. They are, however, measurements Monitronics believes are useful to investors to evaluate its operating performance. Adjusted EBITDA and Pre-SAC Adjusted EBITDA are also measures that Monitronics believes are customarily used by financial analysts to evaluate the financial performance of companies in the security alarm monitoring industry and are one of the financial measures, subject to adjustments, by which Monitronics’ covenants are calculated under the agreements governing its debt obligations. LiveWatch is a direct-to-consumer business, and as such recognizes certain revenue and expenses associated with SAC. This is in contrast to Monitronics, which capitalizes payments to dealers to acquire accounts. Because Pre-SAC Adjusted EBITDA accounts for the different treatment for LiveWatch, the Company believes that it is a meaningful measure of Monitronics' financial performance in servicing its customer base. Monitronics also believes the measurement, Steady State Free Cash Flow, is useful to investors to understand its financial performance before the impact of expenditures for new subscribers to grow its business. Monitronics defines Steady State Free Cash Flow as Pre-SAC Adjusted EBITDA less (i) capital expenditures necessary to maintain its existing infrastructure and (ii) the cost to replace attrited accounts. Monitronics Non-GAAP Measures and Reconciliations March 2016 15
