Attached files
| file | filename |
|---|---|
| 8-K - FORM 8-K - Surgical Care Affiliates, Inc. | d149709d8k.htm |
Surgical Care Affiliates March 15, 2016 Exhibit 99.1
This presentation contains “forward-looking statements” within the meaning of the Private Securities Litigation Reform Act of 1995; particularly statements regarding future financial and operating results of the Company and its business. Statements contained herein that are not clearly historical in nature are forward-looking, and the words “anticipate,” “believe,” “continues,” “expect,” “estimate,” “intend,” “project” and similar expressions and future or conditional verbs such as “will,” “would,” “should,” “could,” “might,” “can,” “may,” or similar expressions are generally intended to identify forward-looking statements. These forward-looking statements speak only as of the date hereof and are based on management’s current plans and expectations and are subject to a number of known and unknown uncertainties and risks, many of which are beyond management’s control. As a consequence, current plans, anticipated actions and future financial position and results of operations may differ materially from those expressed or implied in any forward-looking statements in the presentation. You should consider the numerous risks and uncertainties described in the Company’s Annual Report on Form 10-K for the year ended December 31, 2015 (the “Form 10-K”), and in other documents we have filed with the U.S. Securities and Exchange Commission, including those described under the heading of “Risk Factors” in the Form 10-K. You are cautioned not to unduly rely on such forward- looking statements when evaluating the information presented and the Company is under no obligation to, and expressly disclaims any such obligation to, update or alter these forward-looking statements whether as a result of new information, future events or otherwise. This presentation includes unaudited “non-GAAP financial measures” as defined in Regulation G under the Securities Exchange Act of 1934, as amended, including Adjusted EBITDA-NCI, Assumed Adjusted EBITDA-NCI, Basic Adjusted Net Income per Share and Adjusted Operating Cash Flow less Distributions to NCI. We believe that the presentation of non-GAAP financial measures helps investors analyze underlying trends in our business, evaluate the performance of our business both on an absolute basis and relative to our peers and the broader market, provides useful information to both management and investors by excluding certain items that may not be indicative of the core operating results and operational strength of our business and helps investors evaluate our ability to service our debt. Non-GAAP financial measures do not have any standardized meaning and are therefore unlikely to be comparable to similar measures presented by other companies. The presentation of non-GAAP financial measures is not intended to be a substitute for, and should not be considered in isolation from, the financial measures reported in accordance with GAAP. Systemwide growth measures should not be considered substitutes for and are not comparable to GAAP financial measures. Systemwide growth measures are intended as supplemental measures of our performance. See the appendix for a reconciliation of certain non-GAAP financial measures to their comparable GAAP financial measures. This presentation also contains estimates and other information concerning our industry that are based on industry publications, surveys and forecasts. This information involves a number of assumptions and limitations, and we have not independently verified the accuracy or completeness of the information. Throughout the presentation, certain numbers will not sum to the total due to rounding. Note: Unless we indicate otherwise or the context requires, references made in this presentation to “Surgical Care Affiliates”, the “Company”, “SCA”, “we”, “us” and “our” refer to Surgical Care Affiliates, Inc. and its consolidated subsidiaries after our conversion to a Delaware corporation on October 30, 2013 and to ASC Acquisition LLC and its consolidated subsidiaries prior to our conversion to a Delaware corporation on October 30, 2013. Forward Looking Statements & Non-GAAP Metrics
Largest independent surgical provider in US Outstanding quality and physician satisfaction Diversified growth strategy – partnerships with leading health plans, large medical groups, and health systems Strong organic growth, including growth of new service lines – total joints, spine, and cardiovascular Achieved 12% Adjusted EBITDA-NCI growth in 2015 Anticipate 13-16% Adjusted EBITDA-NCI growth in 2016 Seven year (2009-2015) CAGR of 12% Adjusted EBITDA-NCI growth and 36% Adjusted Diluted Net Income per share Summary
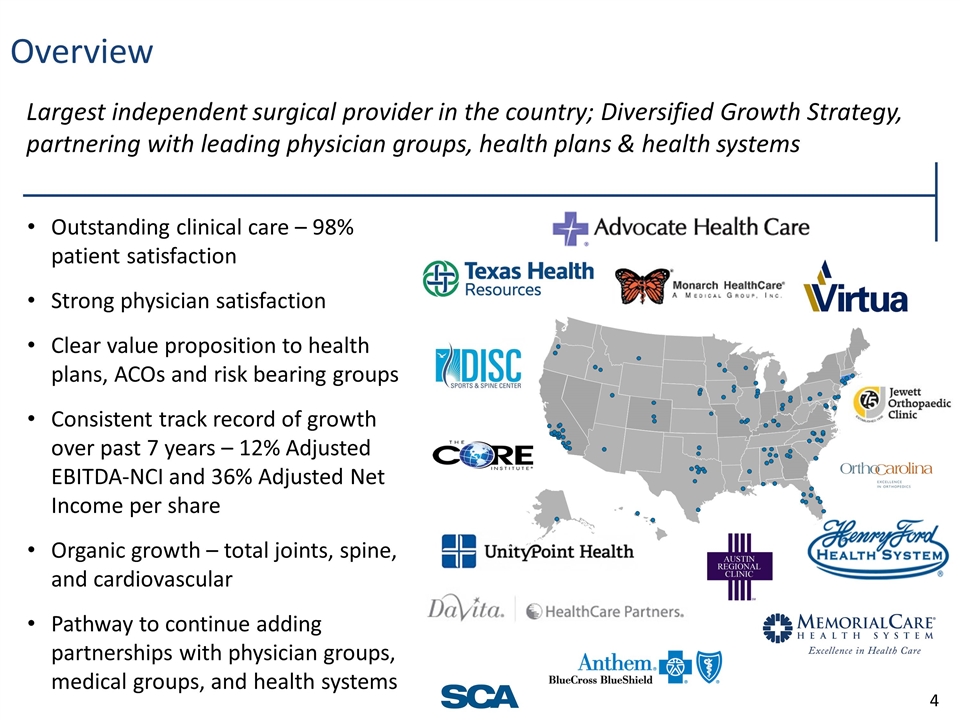
Overview Largest independent surgical provider in the country; Diversified Growth Strategy, partnering with leading physician groups, health plans & health systems Outstanding clinical care – 98% patient satisfaction Strong physician satisfaction Clear value proposition to health plans, ACOs and risk bearing groups Consistent track record of growth over past 7 years – 12% Adjusted EBITDA-NCI and 36% Adjusted Net Income per share Organic growth – total joints, spine, and cardiovascular Pathway to continue adding partnerships with physician groups, medical groups, and health systems 4
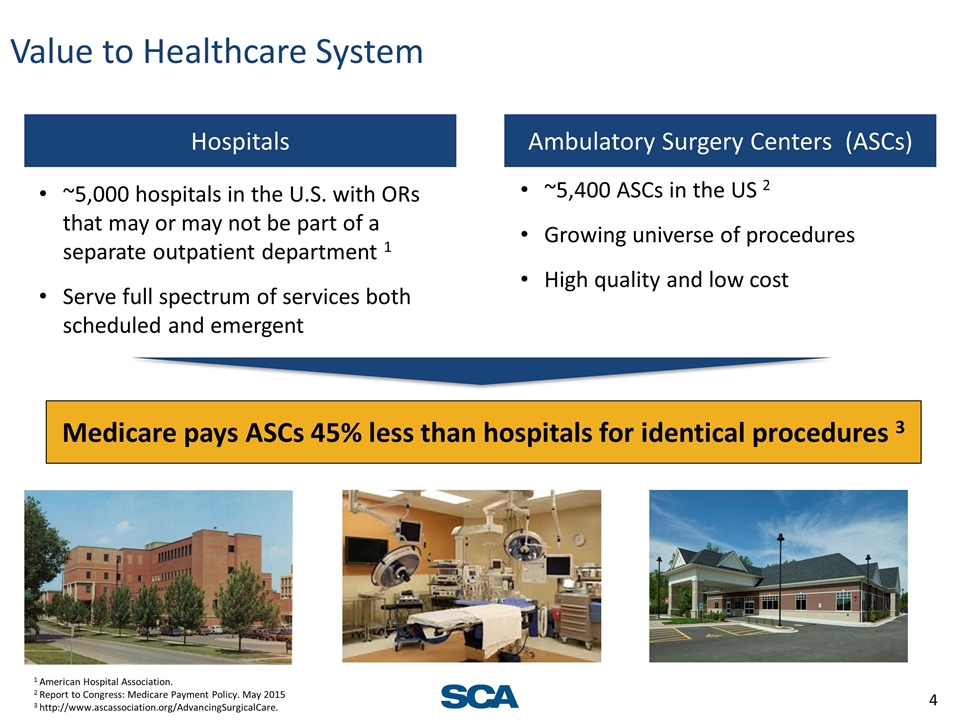
Value to Healthcare System Ambulatory Surgery Centers (ASCs) Hospitals ~5,000 hospitals in the U.S. with ORs that may or may not be part of a separate outpatient department 1 Serve full spectrum of services both scheduled and emergent ~5,400 ASCs in the US 2 Growing universe of procedures High quality and low cost Medicare pays ASCs 45% less than hospitals for identical procedures 3 1 American Hospital Association. 2 Report to Congress: Medicare Payment Policy. May 2015 3 http://www.ascassociation.org/AdvancingSurgicalCare.
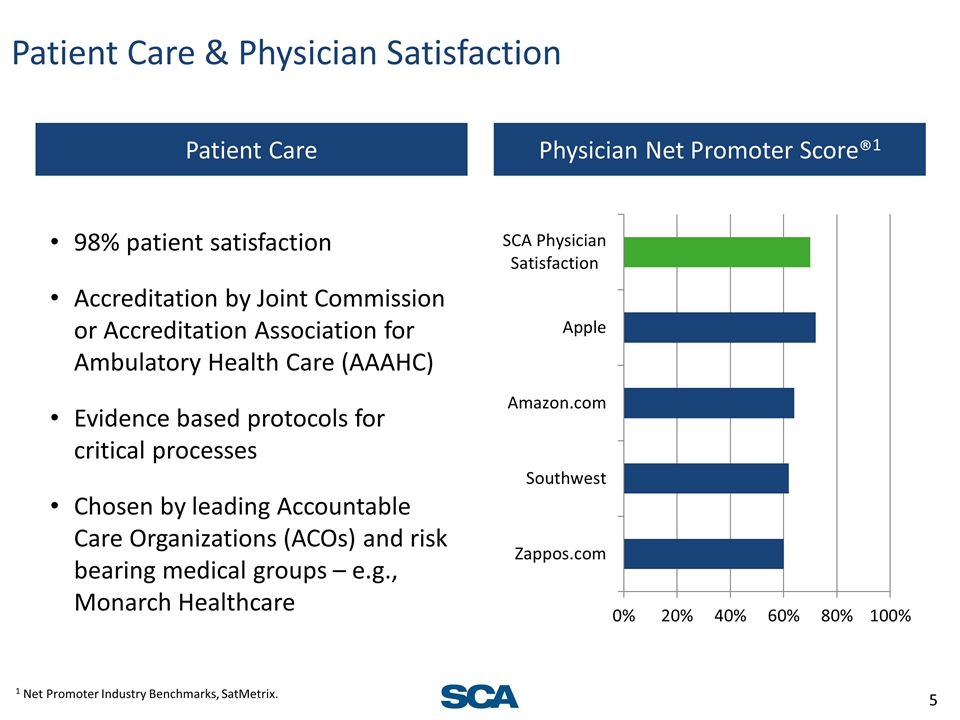
Patient Care & Physician Satisfaction 1 Net Promoter Industry Benchmarks, SatMetrix. Physician Net Promoter Score®1 98% patient satisfaction Accreditation by Joint Commission or Accreditation Association for Ambulatory Health Care (AAAHC) Evidence based protocols for critical processes Chosen by leading Accountable Care Organizations (ACOs) and risk bearing medical groups – e.g., Monarch Healthcare Patient Care
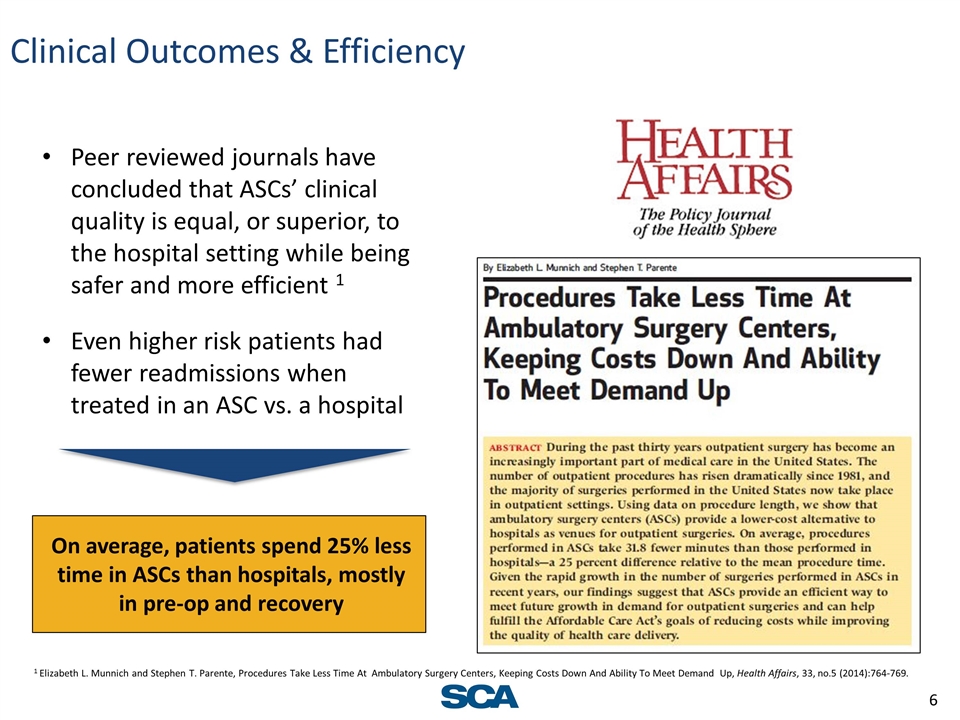
Clinical Outcomes & Efficiency Peer reviewed journals have concluded that ASCs’ clinical quality is equal, or superior, to the hospital setting while being safer and more efficient 1 Even higher risk patients had fewer readmissions when treated in an ASC vs. a hospital 1 Elizabeth L. Munnich and Stephen T. Parente, Procedures Take Less Time At Ambulatory Surgery Centers, Keeping Costs Down And Ability To Meet Demand Up, Health Affairs, 33, no.5 (2014):764-769. On average, patients spend 25% less time in ASCs than hospitals, mostly in pre-op and recovery
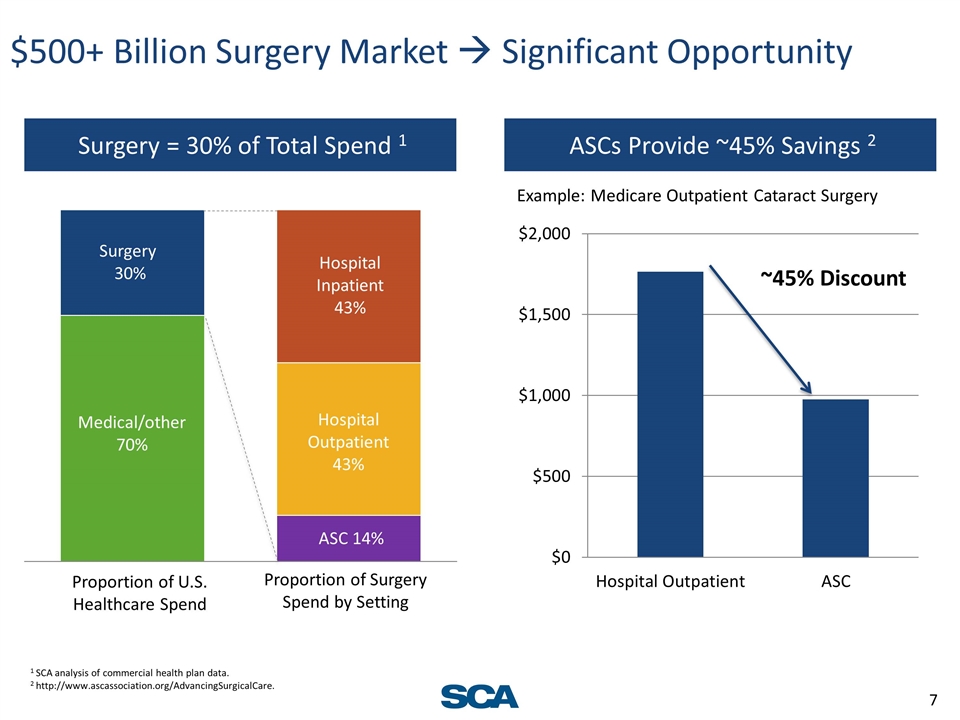
Surgery = 30% of Total Spend 1 Surgery 30% Medical/other 70% Hospital Outpatient 43% ASC 14% Hospital Inpatient 43% 1 SCA analysis of commercial health plan data. 2 http://www.ascassociation.org/AdvancingSurgicalCare. $500+ Billion Surgery Market à Significant Opportunity ~45% Discount Proportion of U.S. Healthcare Spend Proportion of Surgery Spend by Setting ASCs Provide ~45% Savings 2 Example: Medicare Outpatient Cataract Surgery
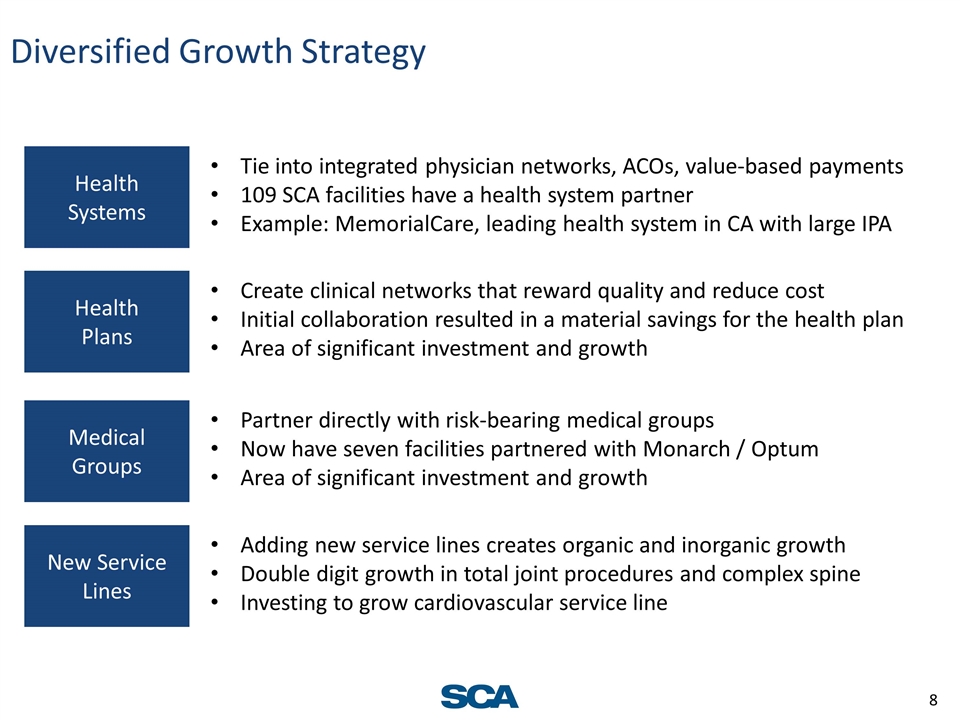
Diversified Growth Strategy Health Systems Tie into integrated physician networks, ACOs, value-based payments 109 SCA facilities have a health system partner Example: MemorialCare, leading health system in CA with large IPA Health Plans Create clinical networks that reward quality and reduce cost Initial collaboration resulted in a material savings for the health plan Area of significant investment and growth Medical Groups Partner directly with risk-bearing medical groups Now have seven facilities partnered with Monarch / Optum Area of significant investment and growth New Service Lines Adding new service lines creates organic and inorganic growth Double digit growth in total joint procedures and complex spine Investing to grow cardiovascular service line
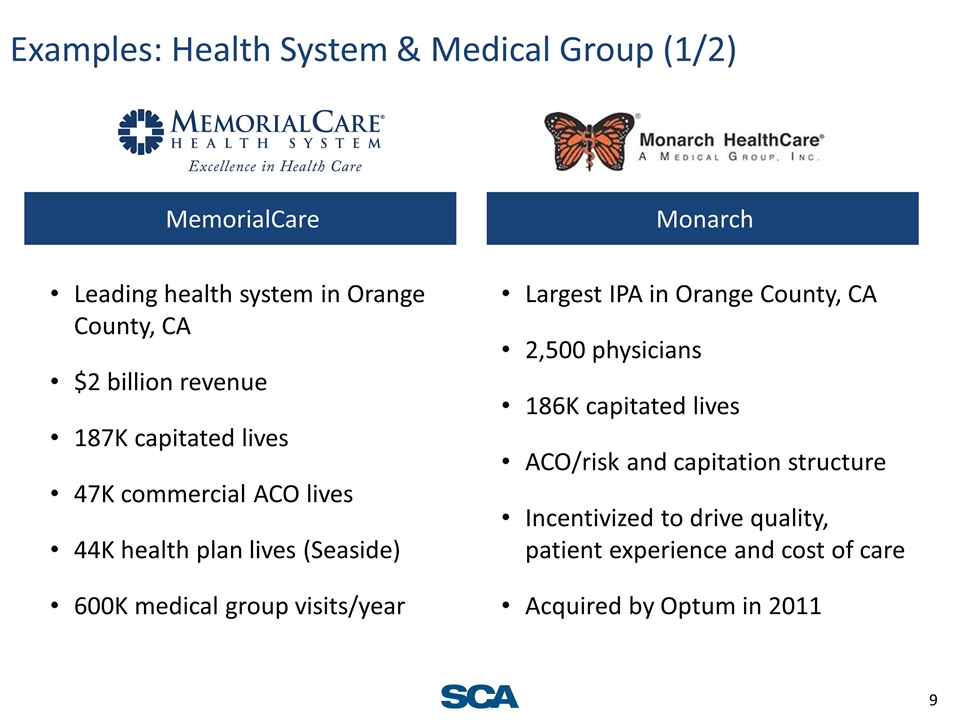
Examples: Health System & Medical Group (1/2) Partnership implications Leading health system in Orange County, CA $2 billion revenue 187K capitated lives 47K commercial ACO lives 44K health plan lives (Seaside) 600K medical group visits/year MemorialCare Monarch Largest IPA in Orange County, CA 2,500 physicians 186K capitated lives ACO/risk and capitation structure Incentivized to drive quality, patient experience and cost of care Acquired by Optum in 2011
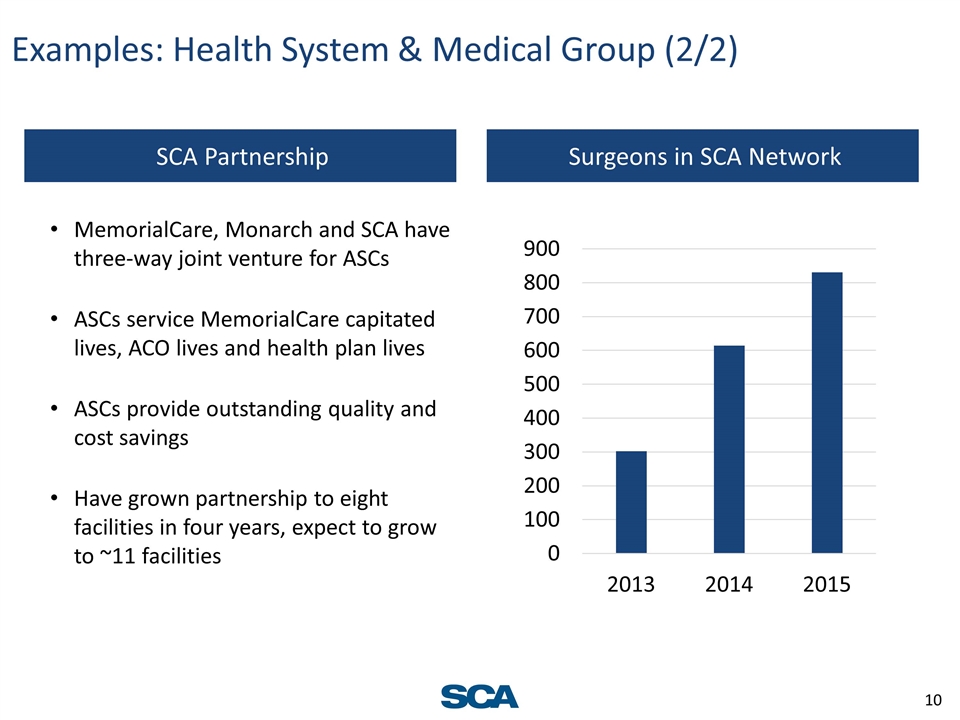
Examples: Health System & Medical Group (2/2) Partnership implications MemorialCare, Monarch and SCA have three-way joint venture for ASCs ASCs service MemorialCare capitated lives, ACO lives and health plan lives ASCs provide outstanding quality and cost savings Have grown partnership to eight facilities in four years, expect to grow to ~11 facilities SCA Partnership Surgeons in SCA Network
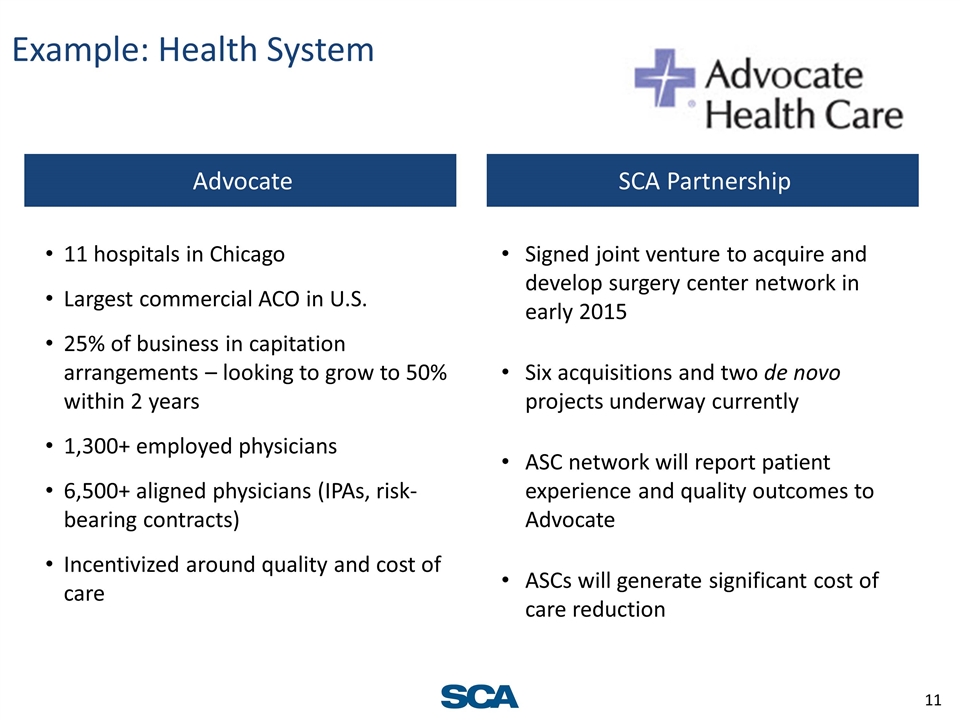
Example: Health System Partnership implications 11 hospitals in Chicago Largest commercial ACO in U.S. 25% of business in capitation arrangements – looking to grow to 50% within 2 years 1,300+ employed physicians 6,500+ aligned physicians (IPAs, risk-bearing contracts) Incentivized around quality and cost of care Advocate SCA Partnership Signed joint venture to acquire and develop surgery center network in early 2015 Six acquisitions and two de novo projects underway currently ASC network will report patient experience and quality outcomes to Advocate ASCs will generate significant cost of care reduction
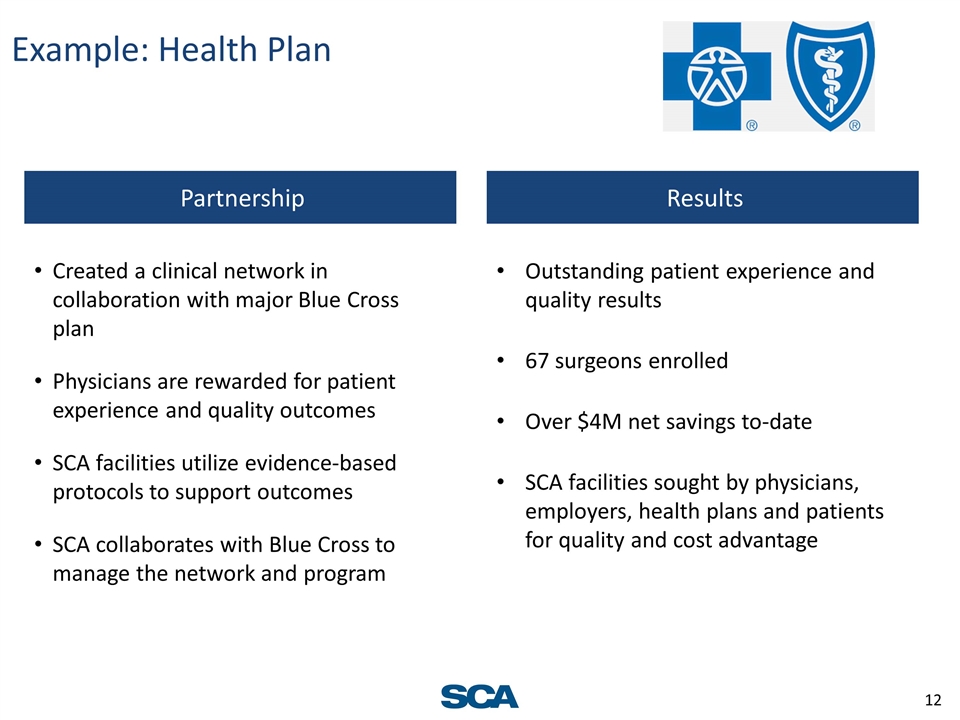
Example: Health Plan Created a clinical network in collaboration with major Blue Cross plan Physicians are rewarded for patient experience and quality outcomes SCA facilities utilize evidence-based protocols to support outcomes SCA collaborates with Blue Cross to manage the network and program Partnership Results Outstanding patient experience and quality results 67 surgeons enrolled Over $4M net savings to-date SCA facilities sought by physicians, employers, health plans and patients for quality and cost advantage
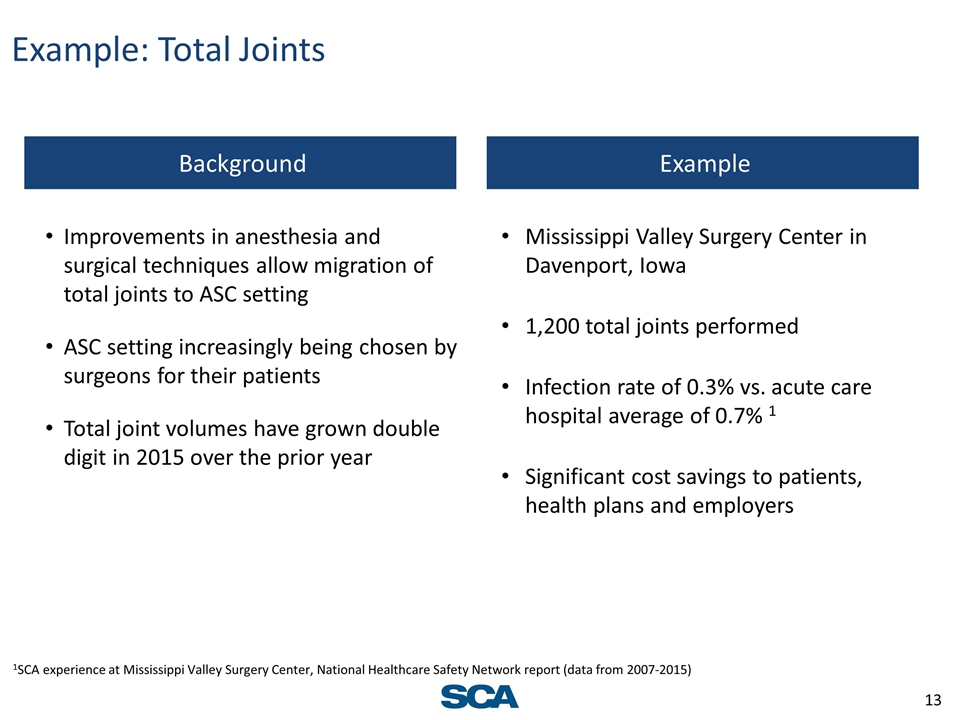
Example: Total Joints Partnership implications Improvements in anesthesia and surgical techniques allow migration of total joints to ASC setting ASC setting increasingly being chosen by surgeons for their patients Total joint volumes have grown double digit in 2015 over the prior year Background Example Mississippi Valley Surgery Center in Davenport, Iowa 1,200 total joints performed Infection rate of 0.3% vs. acute care hospital average of 0.7% 1 Significant cost savings to patients, health plans and employers 1SCA experience at Mississippi Valley Surgery Center, National Healthcare Safety Network report (data from 2007-2015)
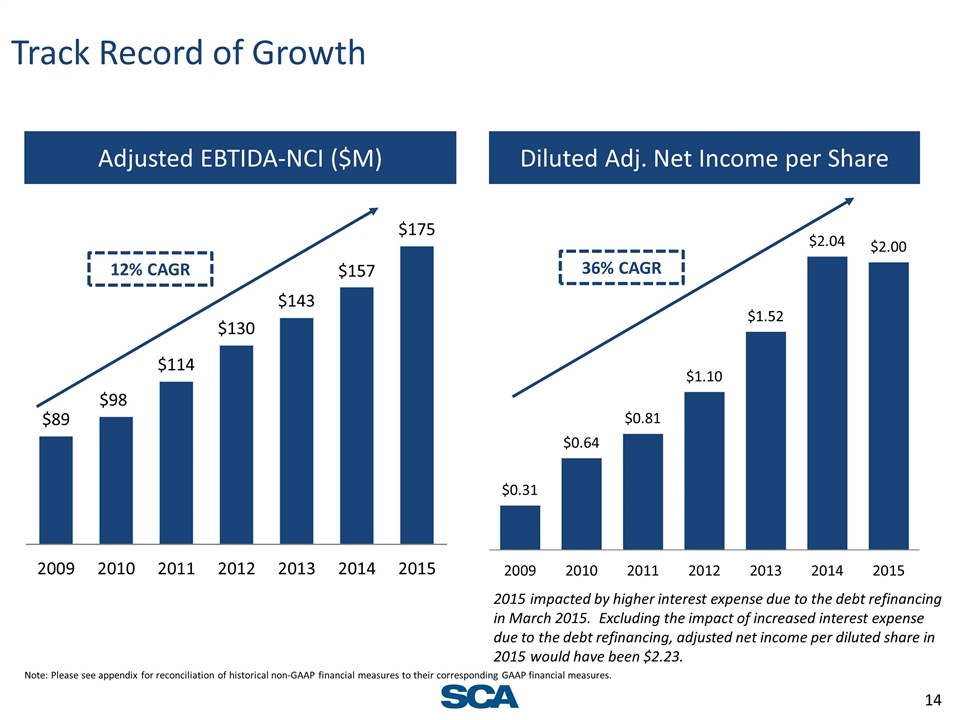
Track Record of Growth Adjusted EBTIDA-NCI ($M) 12% CAGR Diluted Adj. Net Income per Share Note: Please see appendix for reconciliation of historical non-GAAP financial measures to their corresponding GAAP financial measures. 36% CAGR 2015 impacted by higher interest expense due to the debt refinancing in March 2015. Excluding the impact of increased interest expense due to the debt refinancing, adjusted net income per diluted share in 2015 would have been $2.23.
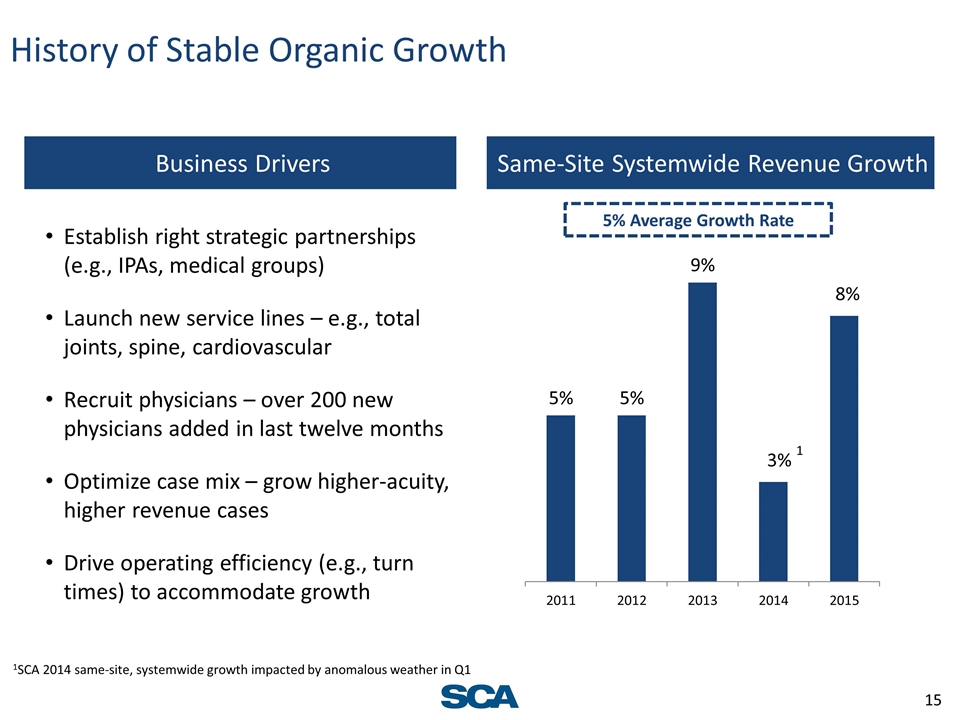
History of Stable Organic Growth Establish right strategic partnerships (e.g., IPAs, medical groups) Launch new service lines – e.g., total joints, spine, cardiovascular Recruit physicians – over 200 new physicians added in last twelve months Optimize case mix – grow higher-acuity, higher revenue cases Drive operating efficiency (e.g., turn times) to accommodate growth Business Drivers Same-Site Systemwide Revenue Growth 5% Average Growth Rate 1SCA 2014 same-site, systemwide growth impacted by anomalous weather in Q1 3% 1 8%
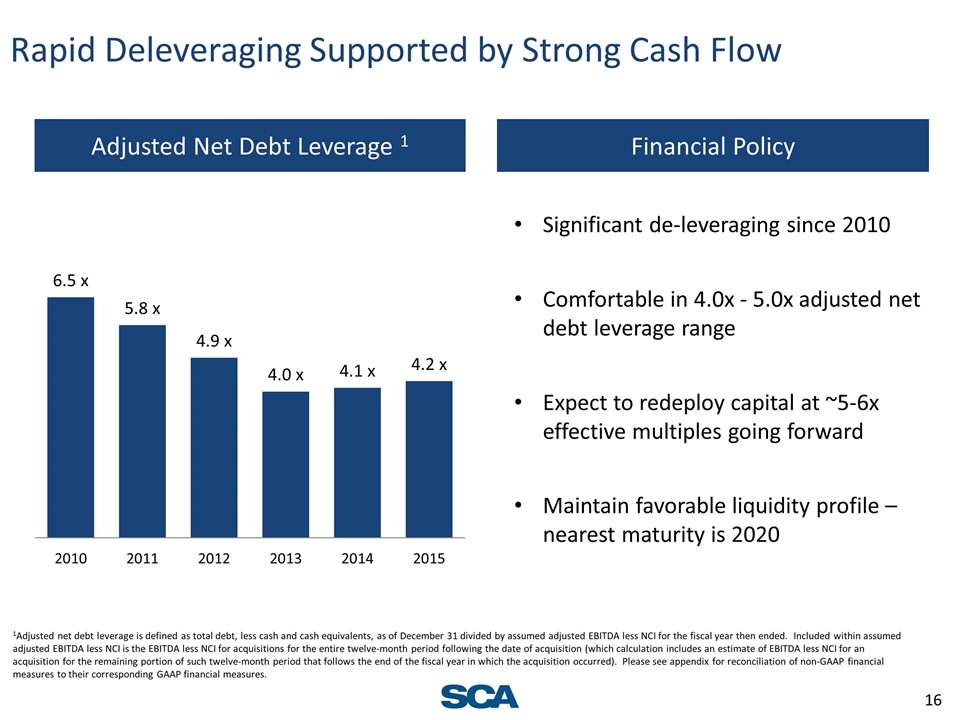
Rapid Deleveraging Supported by Strong Cash Flow Adjusted Net Debt Leverage 1 Significant de-leveraging since 2010 Comfortable in 4.0x - 5.0x adjusted net debt leverage range Expect to redeploy capital at ~5-6x effective multiples going forward Maintain favorable liquidity profile – nearest maturity is 2020 Financial Policy 1Adjusted net debt leverage is defined as total debt, less cash and cash equivalents, as of December 31 divided by assumed adjusted EBITDA less NCI for the fiscal year then ended. Included within assumed adjusted EBITDA less NCI is the EBITDA less NCI for acquisitions for the entire twelve-month period following the date of acquisition (which calculation includes an estimate of EBITDA less NCI for an acquisition for the remaining portion of such twelve-month period that follows the end of the fiscal year in which the acquisition occurred). Please see appendix for reconciliation of non-GAAP financial measures to their corresponding GAAP financial measures.
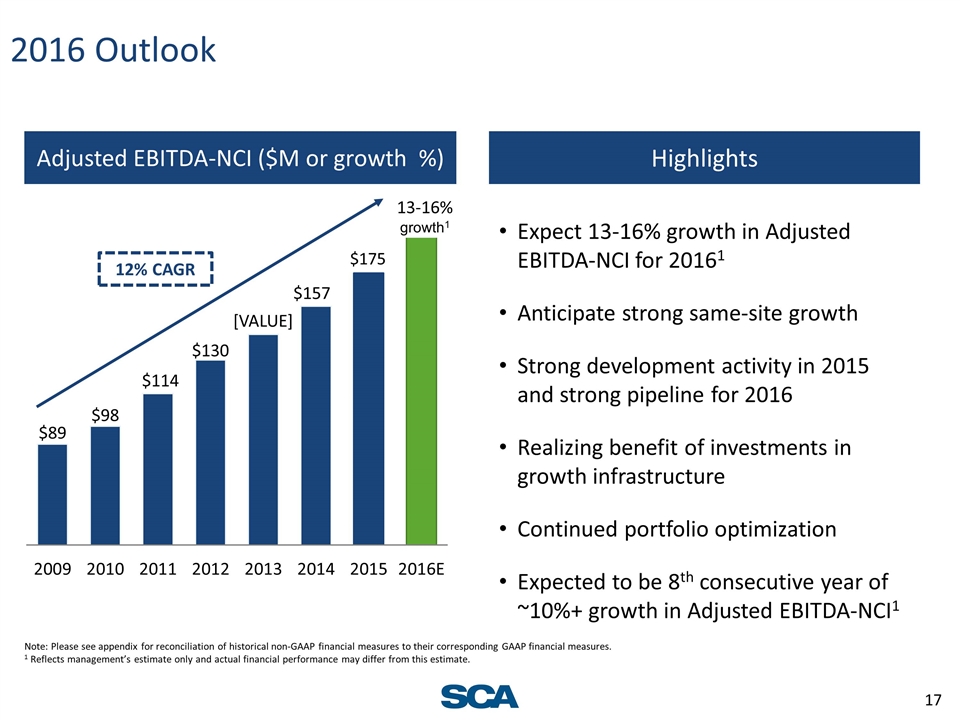
2016 Outlook Adjusted EBITDA-NCI ($M or growth %) 12% CAGR Highlights Note: Please see appendix for reconciliation of historical non-GAAP financial measures to their corresponding GAAP financial measures. 1 Reflects management’s estimate only and actual financial performance may differ from this estimate. 13-16% growth1 Expect 13-16% growth in Adjusted EBITDA-NCI for 20161 Anticipate strong same-site growth Strong development activity in 2015 and strong pipeline for 2016 Realizing benefit of investments in growth infrastructure Continued portfolio optimization Expected to be 8th consecutive year of ~10%+ growth in Adjusted EBITDA-NCI1
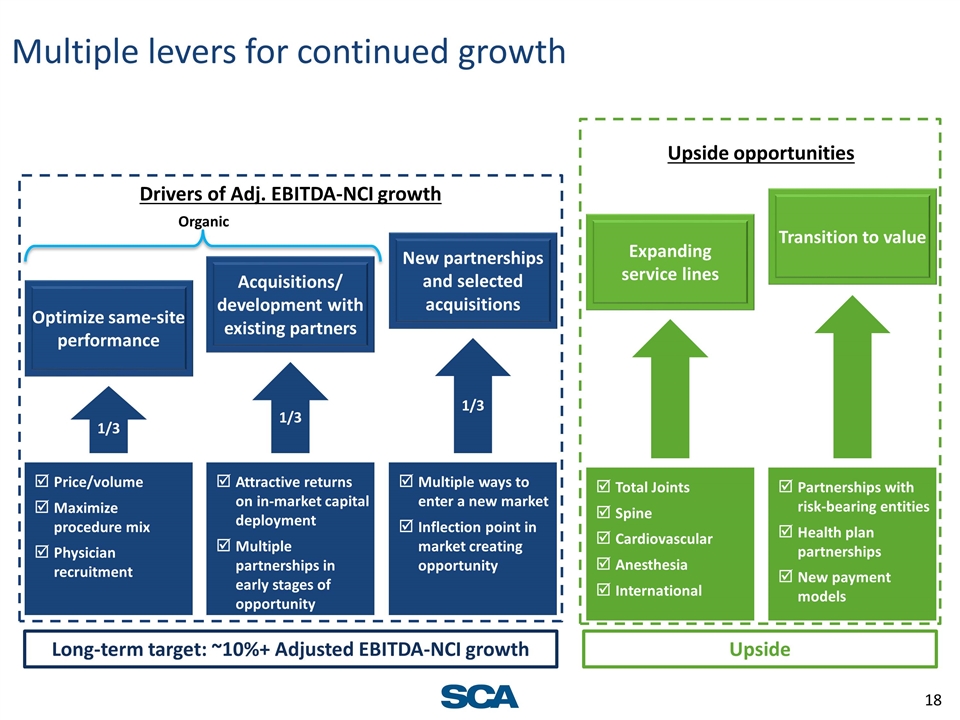
Multiple levers for continued growth 1/3 1/3 1/3 Acquisitions/ development with existing partners New partnerships and selected acquisitions Optimize same-site performance Expanding service lines Attractive returns on in-market capital deployment Multiple partnerships in early stages of opportunity Multiple ways to enter a new market Inflection point in market creating opportunity Total Joints Spine Cardiovascular Anesthesia International Price/volume Maximize procedure mix Physician recruitment Transition to value Partnerships with risk-bearing entities Health plan partnerships New payment models Organic Upside opportunities Long-term target: ~10%+ Adjusted EBITDA-NCI growth Upside Drivers of Adj. EBITDA-NCI growth
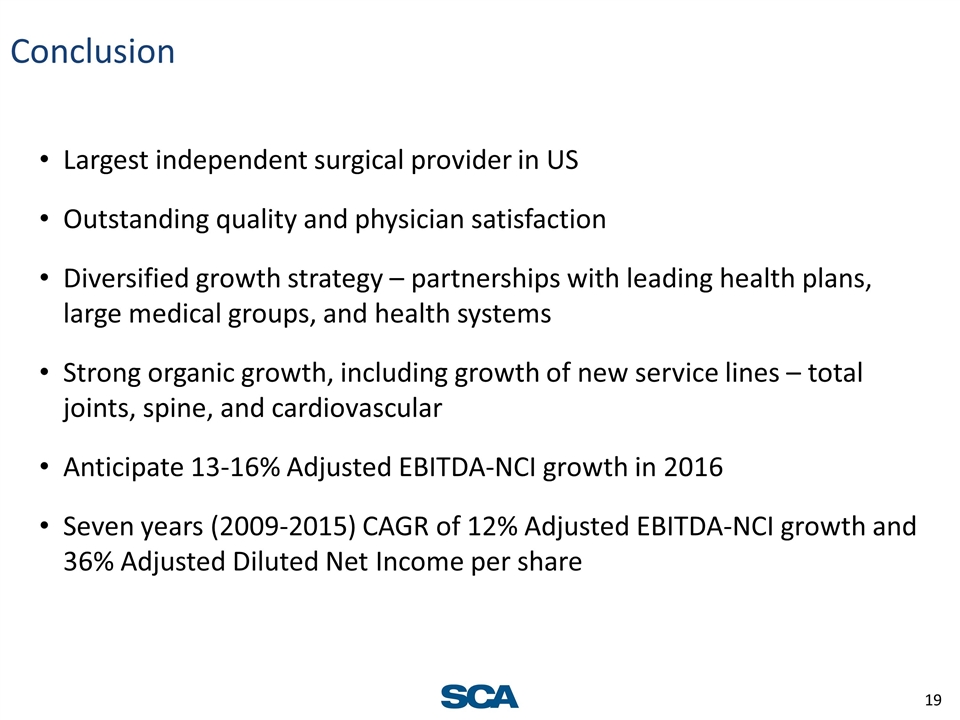
Largest independent surgical provider in US Outstanding quality and physician satisfaction Diversified growth strategy – partnerships with leading health plans, large medical groups, and health systems Strong organic growth, including growth of new service lines – total joints, spine, and cardiovascular Anticipate 13-16% Adjusted EBITDA-NCI growth in 2016 Seven years (2009-2015) CAGR of 12% Adjusted EBITDA-NCI growth and 36% Adjusted Diluted Net Income per share Conclusion
Appendix
How the P&L works Illustrative example
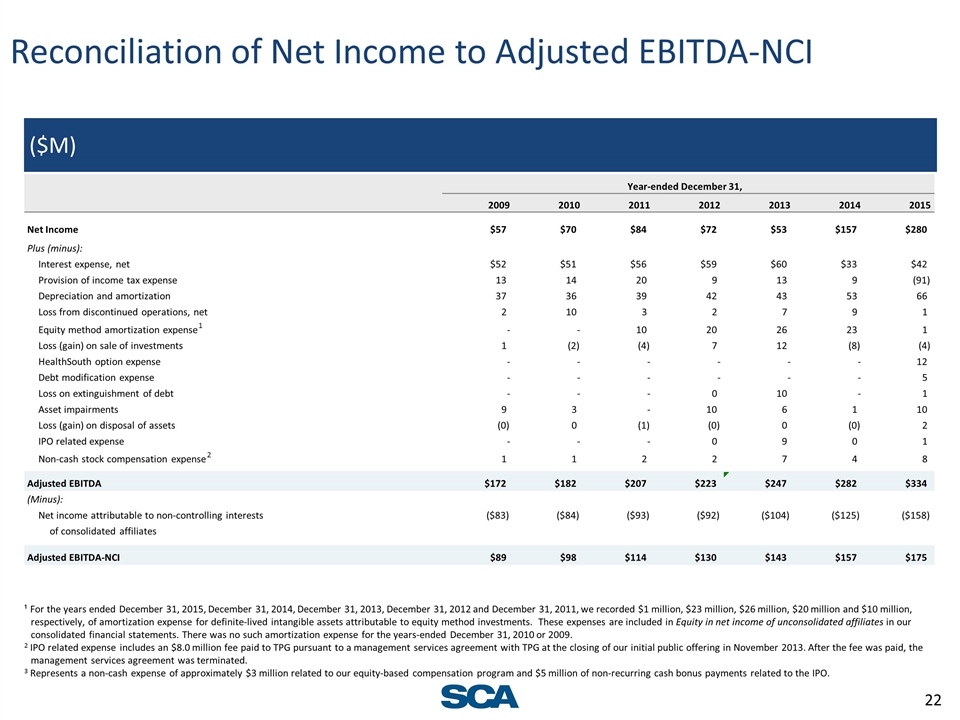
Reconciliation of Net Income to Adjusted EBITDA-NCI ($M) ¹ For the years ended December 31, 2015, December 31, 2014, December 31, 2013, December 31, 2012 and December 31, 2011, we recorded $1 million, $23 million, $26 million, $20 million and $10 million, respectively, of amortization expense for definite-lived intangible assets attributable to equity method investments. These expenses are included in Equity in net income of unconsolidated affiliates in our consolidated financial statements. There was no such amortization expense for the years-ended December 31, 2010 or 2009. 2 IPO related expense includes an $8.0 million fee paid to TPG pursuant to a management services agreement with TPG at the closing of our initial public offering in November 2013. After the fee was paid, the management services agreement was terminated. 3Represents a non-cash expense of approximately $3 million related to our equity-based compensation program and $5 million of non-recurring cash bonus payments related to the IPO. Year-ended December 31, 2009 2010 2011 2012 2013 2014 2015 Net Income $57 $70 $84 $72 $53 $157 $280 Plus (minus): Interest expense, net $52 $51 $56 $59 $60 $33 $42 Provision of income tax expense 13 14 20 9 13 9 (91) Depreciation and amortization 37 36 39 42 43 53 66 Loss from discontinued operations, net 2 10 3 2 7 9 1 Equity method amortization expense 1 - - 10 20 26 23 1 Loss (gain) on sale of investments 1 (2) (4) 7 12 (8) (4) HealthSouth option expense - - - - - - 12 Debt modification expense - - - - - - 5 Loss on extinguishment of debt - - - 0 10 - 1 Asset impairments 9 3 - 10 6 1 10 Loss (gain) on disposal of assets (0) 0 (1) (0) 0 (0) 2 IPO related expense - - - 0 9 0 1 Non-cash stock compensation expense 2 1 1 2 2 7 4 8 Adjusted EBITDA $172 $182 $207 $223 $247 $282 $334 (Minus): Net income attributable to non-controlling interests ($83) ($84) ($93) ($92) ($104) ($125) ($158) of consolidated affiliates Adjusted EBITDA-NCI $89 $98 $114 $130 $143 $157 $175
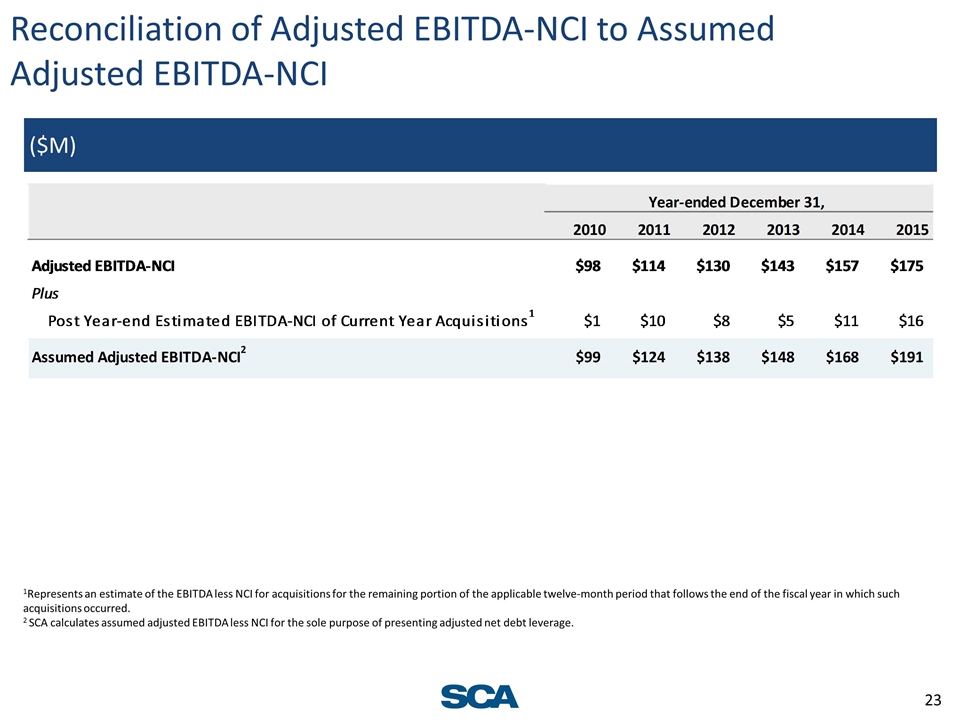
Reconciliation of Adjusted EBITDA-NCI to Assumed Adjusted EBITDA-NCI ($M) 1Represents an estimate of the EBITDA less NCI for acquisitions for the remaining portion of the applicable twelve-month period that follows the end of the fiscal year in which such acquisitions occurred. 2 SCA calculates assumed adjusted EBITDA less NCI for the sole purpose of presenting adjusted net debt leverage.
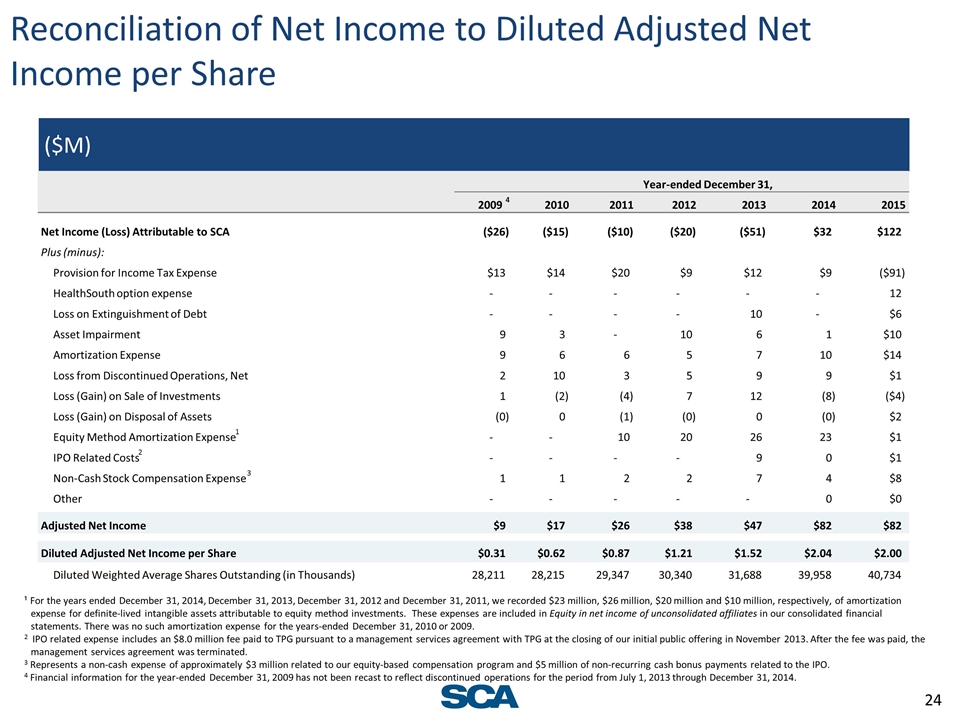
Reconciliation of Net Income to Diluted Adjusted Net Income per Share ¹ For the years ended December 31, 2014, December 31, 2013, December 31, 2012 and December 31, 2011, we recorded $23 million, $26 million, $20 million and $10 million, respectively, of amortization expense for definite-lived intangible assets attributable to equity method investments. These expenses are included in Equity in net income of unconsolidated affiliates in our consolidated financial statements. There was no such amortization expense for the years-ended December 31, 2010 or 2009. 2 IPO related expense includes an $8.0 million fee paid to TPG pursuant to a management services agreement with TPG at the closing of our initial public offering in November 2013. After the fee was paid, the management services agreement was terminated. 3Represents a non-cash expense of approximately $3 million related to our equity-based compensation program and $5 million of non-recurring cash bonus payments related to the IPO. 4 Financial information for the year-ended December 31, 2009 has not been recast to reflect discontinued operations for the period from July 1, 2013 through December 31, 2014. ($M) Year-ended December 31, 2009 4 2010 2011 2012 2013 2014 2015 Net Income (Loss) Attributable to SCA ($26) ($15) ($10) ($20) ($51) $32 $122 Plus (minus): Provision for Income Tax Expense $13 $14 $20 $9 $12 $9 ($91) HealthSouth option expense - - - - - - 12 Loss on Extinguishment of Debt - - - - 10 - $6 Asset Impairment 9 3 - 10 6 1 $10 Amortization Expense 9 6 6 5 7 10 $14 Loss from Discontinued Operations, Net 2 10 3 5 9 9 $1 Loss (Gain) on Sale of Investments 1 (2) (4) 7 12 (8) ($4) Loss (Gain) on Disposal of Assets (0) 0 (1) (0) 0 (0) $2 Equity Method Amortization Expense 1 - - 10 20 26 23 $1 IPO Related Costs 2 - - - - 9 0 $1 Non-Cash Stock Compensation Expense 3 1 1 2 2 7 4 $8 Other - - - - - 0 $0 Adjusted Net Income $9 $17 $26 $38 $47 $82 $82 Diluted Adjusted Net Income per Share $0.31 $0.62 $0.87 $1.21 $1.52 $2.04 $2.00 Diluted Weighted Average Shares Outstanding (in Thousands) 28,211 28,215 29,347 30,340 31,688 39,958 40,734
