Attached files
| file | filename |
|---|---|
| EX-23.1 - CONSENT OF BDO USA, LLP - PRGX GLOBAL, INC. | ex231201510k.htm |
| EX-21.1 - SUBSIDIARIES OF THE REGISTRANT - PRGX GLOBAL, INC. | ex211201510k.htm |
| EX-31.1 - CERTIFICATION OF THE CHIEF EXECUTIVE OFFICER PURSUANT TO SECTION 302 - PRGX GLOBAL, INC. | ex311201510k.htm |
| EX-31.2 - CERTIFICATION OF THE CHIEF FINANCIAL OFFICER PURSUANT TO SECTION 302 - PRGX GLOBAL, INC. | ex312201510k.htm |
| EX-10.38 - EMPLOYMENT AGREEMENT - PRGX GLOBAL, INC. | ex1038reeneseparationagree.htm |
| EX-32.1 - CERTIFICATION OF THE CEO AND CFO PURSUANT TO SECTION 906 - PRGX GLOBAL, INC. | ex321201510k.htm |
UNITED STATES
SECURITIES AND EXCHANGE COMMISSION
Washington, D.C. 20549
________________________________________
FORM 10-K
________________________________________
(Mark One)
ý | ANNUAL REPORT PURSUANT TO SECTION 13 OR 15(d) OF THE SECURITIES EXCHANGE ACT OF 1934 |
For the fiscal year ended December 31, 2015
OR
¨ | TRANSITION REPORT PURSUANT TO SECTION 13 OR 15(d) OF THE SECURITIES EXCHANGE ACT OF 1934 |
For the transition period from to
Commission File Number 0-28000
PRGX Global, Inc.
(Exact name of registrant as specified in its charter)
Georgia | 58-2213805 | |
(State or other jurisdiction of | (I.R.S. Employer | |
incorporation or organization) | Identification No.) | |
600 Galleria Parkway | 30339-5986 | |
Suite 100 | (Zip Code) | |
Atlanta, Georgia | ||
(Address of principal executive offices) | ||
Registrant’s telephone number, including area code: (770) 779-3900
Securities registered pursuant to Section 12(b) of the Act:
Title of each class | Name of each exchange on which registered |
Common Stock, No Par Value | The NASDAQ Stock Market LLC (The Nasdaq Global Select Market) |
Securities registered pursuant to Section 12(g) of the Act: None
Indicate by check mark if the registrant is a well-known seasoned issuer, as defined in Rule 405 of the Securities
Act. Yes ¨ No ý
Indicate by check mark if the registrant is not required to file reports pursuant to Section 13 or Section 15(d) of the Act. Yes ¨ No ý
Note – Checking the box above will not relieve any registrant required to file reports pursuant to Section 13 or 15(d) of the Exchange Act from their obligations under those Sections.
Indicate by check mark whether the registrant (1) has filed all reports required to be filed by Section 13 or 15(d) of the Securities Exchange Act of 1934 during the preceding 12 months (or for such shorter period that the registrant was required to file such reports), and (2) has been subject to such filing requirements for the past 90 days. Yes ý No ¨
Indicate by check mark if disclosure of delinquent filers pursuant to Item 405 of Regulation S-K is not contained herein and will not be contained, to the best of the registrant’s knowledge, in definitive proxy or information statements incorporated by reference in Part III of this Form 10-K or any amendment to this Form 10-K. ý
Indicate by check mark whether the registrant has submitted electronically and posted on its corporate Web site, if any, every Interactive Data File required to be submitted and posted pursuant to Rule 405 of Regulation S-T during the preceding 12 months (or for such shorter period that the registrant was required to submit and post such files). Yes ý No ¨
Indicate by check mark whether the registrant is a large accelerated filer, an accelerated filer, a non-accelerated filer, or a smaller reporting company. See definitions of “large accelerated filer,” “accelerated filer,” and “smaller reporting company” in Rule 12b-2 of the Exchange Act. (Check One):
¨ Large accelerated filer | ý | Accelerated filer | ¨ | Non-accelerated filer | ¨ | Smaller reporting company | |
Indicate by check mark whether the registrant is a shell company (as defined in Rule 12b-2 of the Act). Yes ¨ No ý
The aggregate market value, as of June 30, 2015, of common shares of the registrant held by non-affiliates of the registrant was approximately $103.3 million, based upon the last sales price reported that date on The Nasdaq Global Select Market of $4.39 per share. (Aggregate market value is estimated solely for the purposes of this report and shall not be construed as an admission for the purposes of determining affiliate status.)
Common shares of the registrant outstanding at March 6, 2016 were 22,235,310.
Documents Incorporated by Reference
Part III: Portions of Registrant’s Proxy Statement relating to the Company’s 2016 Annual Meeting of Shareholders.
PRGX GLOBAL, INC.
FORM 10-K
December 31, 2015
INDEX
Page No. | |
Part I | |
Part II | |
Part III | |
Part IV | |
Cautionary Statement Regarding Forward-Looking Statements
The following discussion includes “forward-looking” statements within the meaning of the Private Securities Litigation Reform Act of 1995. These forward-looking statements are at times identified by words such as “plans,” “intends,” “expects,” or “anticipates” and words of similar effect and include statements regarding the Company’s financial and operating plans and goals. These forward-looking statements include any statements that cannot be assessed until the occurrence of a future event or events. Except as otherwise indicated or unless the context otherwise requires, “PRGX,” “we,” “us,” “our” and the “Company” refer to PRGX Global, Inc. and its subsidiaries.
These forward-looking statements are subject to risks, uncertainties and other factors, including but not limited to those discussed herein and below under Item 1A “Risk Factors.” Many of these risks are outside of our control and could cause actual results to differ materially from the results discussed in the forward-looking statements. Factors that could lead to material changes in our performance may include, but are not limited to:
• | our ability to successfully execute our recovery audit growth strategy; |
• | our continued dependence on our largest clients for significant revenue; |
• | the use of internal recovery audit groups by our clients, reducing the amount of recoveries available to us; |
• | commoditization of our services and the effects of rate reductions; |
• | the significant control that our clients have over assertion or acceptance of recovery audit claims against their suppliers and the corresponding impact on our revenue; |
• | changes to Medicare and Medicaid recovery audit contractor (“RAC”) programs administered by the Centers for Medicare and Medicaid Services (“CMS”) and other government agencies, and our role in the national Medicare RAC program, the results of operations of which are reported in our discontinued operations; |
• | revenue that does not meet expectations or justify costs incurred; |
• | our ability to develop material sources of new revenue in addition to revenue from our core accounts payable recovery audit services; |
• | changes in the market for our services; |
• | client and vendor bankruptcies and financial difficulties; |
• | our ability to retain and attract qualified personnel and effectively manage our global workforce; |
• | our inability to protect and maintain the competitive advantage of our proprietary technology and intellectual property rights; |
• | our reliance on operations outside the U.S. for a significant portion of our revenue; |
• | our ability to effectively manage foreign currency fluctuations; |
• | the highly competitive environments in which our recovery audit services and Adjacent Services businesses operate and the resulting pricing pressure on those businesses; |
• | our ability to integrate recent and future acquisitions; |
• | our ability to realize operational cost savings and the transformation severance and related expenses we may incur to generate these savings; |
• | uncertainty in the global credit markets; |
• | our ability to maintain compliance with the financial and non-financial covenants in our financing arrangements; |
• | our tax positions and other factors that could affect our effective income tax rate or our ability to use our existing deferred tax assets; |
• | our ability to operate in compliance with changing data privacy requirements; |
• | a cyber-security incident involving the misappropriation, loss or unauthorized disclosure or use of client data or other confidential information of our clients; |
• | effects of changes in accounting policies, standards, guidelines or principles; or |
• | terrorist acts, acts of war and other factors over which we have little or no control. |
i
Any forward-looking statement speaks only as of the date on which such statement is made, and, except as required by law, we undertake no obligation to update any forward-looking statement to reflect events or circumstances after the date on which such statement is made or to reflect the occurrence of unanticipated events. New factors emerge from time to time and it is not possible for management to predict all such factors.
ii
PART I
ITEM 1. Business
PRGX Global, Inc., together with its subsidiaries, is a global leader in recovery audit and spend analytics services based in the United States of America (“U.S.”) and serves clients in more than 30 countries. PRGX Global, Inc. was incorporated in the State of Georgia in 1996. At the heart of our client services portfolio is the core capability of mining client data to deliver “actionable insights.” Actionable insights allow our clients to improve their financial performance by reducing costs, improving business processes and increasing profitability.
The vast majority of our revenue comes from “recovery audit,” a service based on the mining of a tremendous amount of our clients’ purchasing data, looking for overpayments to their third-party suppliers. PRGX is the world's leading provider of accounts payable recovery audit services principally to large businesses and government agencies with high volumes of transactions and complex pricing arrangements with vendors. We provide services to 75% of the top 20 global retailers and earn the largest portion of our revenue from our retail clients. Recovery audit in the retail industry is a mature service offering and we have been serving a number of our clients for decades. Pricing of merchandise for resale in the retail industry is extremely complex due to the high volume of promotions, allowances and rebates provided by suppliers. The second largest portion of our business is referred to within the recovery audit business as “commercial.” Commercial recovery auditing is the delivery of recovery audit services to industries other than retail, such as automotive and industrial manufacturing, oil and gas, financial services, mining and transportation. Recovery audit in the industries represented within commercial is typically less mature in terms of complexity of vendor pricing, scope of purchase transactions made available for audit and depth of audit programs within individual companies. “Contract compliance” auditing is a specific type of recovery auditing which is more heavily utilized by commercial clients and is expected to be a growing part of our business. This service offering focuses on auditing supplier billings against large and complex service, construction and licensing contracts, and is particularly relevant to oil and gas, mining, technology, media and brand dependent manufacturing companies. As the leader in the recovery audit industry we continue to innovate through technological advances innovations and expanded service offerings, including spend analytics and supplier information management services. These services target client functional and process areas where we have established expertise, enabling us to provide services to finance, merchandising and procurement executives to improve working capital, optimize purchasing leverage in vendor pricing negotiations, improve insight into product margin and true cost of goods for resale, identify and manage risks associated with vendor compliance, improve quality of vendor master data and improve visibility and diagnostics of direct and indirect spend. These service offerings are increasingly important to our business and are applicable to clients in both retail and commercial industries.
PRGX is unique in that we are a global recovery audit services provider, serving clients in over 30 countries across a multitude of industries. We conduct our operations through three reportable segments: Recovery Audit Services - Americas, Recovery Audit Services - Europe/Asia-Pacific and Adjacent Services. The Recovery Audit Services - Americas segment represents recovery audit services we provide in the U.S., Canada and Latin America and is our largest segment in terms of clients served and revenue generated. The Recovery Audit Services - Europe/Asia-Pacific segment represents recovery audit services we provide in Europe, Asia and the Pacific region and is responsible for a significant portion of our revenue. Our Adjacent Services offerings are generally provided to clients on a global basis. We report the unallocated portion of corporate selling, general and administrative expenses not specifically attributable to the three reportable segments in Corporate Support. For additional financial information relating to our reporting segments, see Note 2 - Operating Segments and Related Information of our Consolidated Financial Statements included in Item 8 of this Form 10-K.
As of December 31, 2015, the Company discontinued its Healthcare Claims Recovery Audit ("HCRA") business. PRGX entered into agreements with third parties to fulfill its Medicare RAC program subcontract obligations to audit Medicare payments and provide support for claims appeals and assigned its remaining Medicaid contract to another party. The Company will continue to incur certain expenses while the current Medicare RAC contracts are still in effect.
1
The Recovery Audit Industry and PRGX
Many businesses and government agencies generate substantial volumes of payment transactions involving multiple vendors, numerous discounts and allowances, fluctuating prices and complex pricing arrangements or rate structures. Although these entities correctly process the vast majority of payment transactions, errors occur in a small percentage of transactions. These errors include, but are not limited to, missed or inaccurate discounts, allowances and rebates, vendor pricing errors, erroneous coding and duplicate payments. Many factors contribute to the errors, including communication failures between the purchasing and accounts payable departments, complex pricing arrangements or rate structures, personnel turnover and changes in information and accounting systems. In the aggregate, these transaction errors can represent meaningful amounts of reduced cash flow and lost profits for these entities. Recovery auditing is a business service focused on finding overpayments created by these errors. These audits typically entail comprehensive and customized data acquisition from the client, frequently including purchasing, receiving, point-of-sale, pricing and deal documentation, emails, and payment data.
PRGX, like most companies in the recovery audit services industry, generates the majority of its revenue through contingent fee arrangements, sharing a pre-determined percentage of successful claims or “recoveries” generated from an audit. There are certain recovery audit services or types of audits that are billed as a fixed fee or on a time and materials basis, but the vast majority of our revenue is generated through contingent fee contracts.
Recovery audit clients generally recover claims by either (a) taking credits against outstanding payables or future purchases from the involved vendors or service providers, or (b) receiving refund checks directly from those vendors or service providers. Industry practice generally dictates the manner in which a client receives the benefit for a recovery audit claim. In many cases, we must satisfy client-specific procedural guidelines before we can submit recovery audit claims for client approval.
Contracts with recovery audit clients generally vary in length from one year to three years, with some being evergreen. Most of our recovery audit contracts provide that the client may terminate the contract without cause prior to the completion of the term of the agreement by providing relatively short prior written notice of termination.
As businesses have evolved, PRGX and the recovery audit industry have evolved with them, innovating processes, error identification tools, and claim types to maximize recoveries. The following are a number of factors impacting the recovery audit industry:
•Data Capture and Availability. Businesses increasingly are using technology to manage complex procurement and accounts payable systems and realize greater operating efficiencies. Many businesses worldwide communicate with vendors electronically - whether by Electronic Data Interchange (“EDI”) or the Internet - to exchange inventory and sales data, transmit purchase orders, submit invoices, forward shipping and receiving information and remit payments. These systems capture more detailed data and enable the cost effective review of more transactions by recovery auditors.
•Increased Role of Email Documentation in Client Transaction Data. Clients and vendors increasingly document transaction terms in email correspondence that is not integrated into their financial systems and increases opportunities for errors. To efficiently identify these errors, recovery audit firms must use sophisticated technology-based tools that are able to ingest and search through massive volumes of emails to identify potential errors that then are investigated by the auditors. A comprehensive recovery audit requires the effective use of technology-based email search tools and techniques.
•Increasing Number of Auditable Claim Categories. Traditionally, the recovery audit industry identified simple, or “disbursement,” claim types such as the duplicate payment of invoices. Enhancements to accounts payable software, particularly large enterprise software solutions used by many large companies, have reduced the extent to which these companies make simple disbursement errors. However, the introduction of creative vendor discount programs, complex pricing arrangements and activity-based incentives has led to an increase in auditable transactions and potential sources of error. These transactions are complicated to audit, as the underlying transaction data is difficult to access and recognizing mistakes is complex. Recovery audit firms such as PRGX with significant industry-specific expertise and sophisticated technology are best equipped to audit these complicated claim categories.
•Globalization. As the operations of business enterprises become increasingly multi-national, they often seek service providers with a global reach. Sophistication in systems and processes varies markedly across the global network of suppliers which further drives the need for our services. PRGX serves clients in more than 30 countries and we believe we are the recovery audit service provider best suited to deliver multi-national audits.
•Significant Promotional Activity. Trade promotion spending is substantial within the retail trade and significant sums are being spent in categories with numerous transactions and a high potential for errors, such as scan downs, or discounts at the point of sale. Because of the high volume of trade promotion within retail, there are significant opportunities for mistakes and, therefore, auditable claims.
•Technology Platform. The ability to efficiently and cost effectively ingest large volumes of structured and unstructured data is critical to providing best in class recovery audit services. We believe we have developed the most sophisticated and
2
highest performing large data processing infrastructure system in our industry. This system is based on the Hadoop open source technology standard and allows us to effectively process and manage our clients’ data. We are achieving significant acceleration in data processing speeds for both structured and unstructured data sets, which supports our efforts to accelerate audit results and transform our core audit processes.
We expect the evolution of the recovery audit industry to continue. In particular, we expect that the industry will continue to move towards the electronic capture and presentation of data, more automated, centralized processing and auditing closer to the time of the payment transaction.
Adjacent Services
Our Adjacent Services business targets client functional and process areas where we have established expertise, enabling us to provide services to finance, merchandising and procurement executives to improve working capital, optimize purchasing leverage in vendor pricing negotiations, improve insight into product margin and true cost of goods for resale, identify and manage risks associated with vendor compliance, improve quality of vendor master data and improve visibility and diagnostics of direct and indirect spend. Our Adjacent Services also include our global Supplier Information Management ("SIM") services offering, as well as the CIPS Sustainability Index ("CSI") offered in the United Kingdom through our strategic alliance with the Chartered Institute of Purchasing & Supply ("CIPS"). As our clients’ data volumes and complexity levels continue to grow, we are using our deep data management experience to develop new actionable insight solutions, compliance related tools, custom analytics and data transformation services. Taken together, our deep understanding of our clients’ procure-to-pay data and our technology-based solutions provide multiple routes to help our clients achieve greater profitability.
Clients
PRGX provides its services principally to large businesses and government agencies having a tremendous volume of payment transactions and complex procurement environments. Retailers continue to constitute the largest part of our client and revenue base. Our five largest clients contributed approximately 34.5% of our revenue in 2015, 32.2% in 2014 and 30.4% in 2013. No client has accounted for 10% or more of our total revenue in the past three years.
Some organizations (primarily large retailers) maintain internal recovery audit departments to recover certain types of payment errors and identify opportunities to reduce costs. Despite having such internal resources, many companies also retain independent recovery audit firms, such as PRGX, due to their specialized knowledge, capabilities and focused technologies. In the U.S., Canada, the United Kingdom, France, Mexico, Brazil, and Australia, large retailers routinely engage independent recovery audit firms as a standard business practice. It is typical in the retail industry for large firms to engage a primary audit firm at one contingency fee rate and a secondary firm to audit behind the primary at a higher rate. Our commercial recovery audit clients are typically Fortune 1000 companies with multi-billion dollars of purchase transactions to be audited. These clients range from large multi-national manufacturing and oil and gas companies, to large regional or national financial services institutions to global high tech software organizations. The audit specialty practice of contract compliance is applicable across most of our clients, but is particularly relevant to large "resource" companies (including oil and gas and mining) and industrial manufacturing and brand-dependent service and manufacturing companies.
3
The PRGX Strategy
PRGX is a global leader in recovery audit and spend analytics services. We provide recovery audit, procure-to-pay performance improvement, spend analytics and risk management services principally to large businesses and government agencies having a tremendous volume of payment transactions and complex procurement environments. We plan to achieve higher profitability and growth through the following strategy:
1.Deliver value, operational efficiency and innovative services to our customers;
2.Differentiate our service offerings and capabilities;
3.Expand into new high potential industry verticals; and
4.Attract and develop highly qualified and motivated professionals with deep industry knowledge and technical skills.
Deliver value, operational efficiency and innovative services to our customers
Our value delivery, operational efficiency and service innovation efforts start with a solid foundation of technology infrastructure and lean process design. We are consolidating our clients’ data into a centralized, high performance technology infrastructure, deploying global best practices and rolling out world class and proprietary audit tools to drive deeper recoveries and enable next generation audit concepts. We expect to achieve our objectives through process redesign coupled with investing in new infrastructure and aggressively rolling out new technologies across our global audits. These investments in infrastructure and processes are fundamental to optimization and efficiency. They also serve as the foundation for service innovation efforts in our core recovery audit business and in Adjacent Services.
Differentiate our service offerings and capabilities
We plan to differentiate our service offerings and capabilities through meaningful and sustainable innovation such as:
• | Audit acceleration. Our clients are constantly seeking to accelerate the audit process to deliver audit results closer to the time of the transaction to increase recovery yields, provide a greater opportunity to address process errors, and reduce supplier abrasion. We believe that our deep and broad business process experience across thousands of audits, together with new technology initiatives will put us in a unique position to achieve superior acceleration results for our clients. |
• | Global audit programs. Our global programs take advantage of our operations that span over 30 countries to provide true global audit capabilities to multi-national companies. This unique perspective gives our clients visibility to their business practice variations around the world and creates value for our clients by allowing them to see their data in new ways. |
• | Adjacent Services. Our Adjacent Services offerings, including spend analytics and SIM services, target client functional and process areas where we have established expertise, enabling us to provide services to finance, merchandising and procurement executives. These services will assist our clients in improving many aspects of their businesses, including working capital, purchasing leverage, product margin, vendor compliance and risk management, vendor master data and diagnostics of direct and indirect spend. |
Expand into new high potential industry verticals
Our plans include continuing to build our commercial recovery audit practice, which serves industries outside of retail and healthcare, in order to reduce our industry concentration. We have organized the commercial recovery audit practice into industry verticals such as oil and gas, financial services and manufacturing and are building focused practice areas with targeted service offerings for each industry.
Attract and develop highly qualified and motivated professionals with deep industry and technical skills
We are building a culture of results-oriented performance where professionals can share ideas and work together to capture, understand, and deploy the very best practices consistently across every client globally.
In line with our focus on delivering value and operating efficiently, we have identified and are executing on these near-term initiatives:
• | Continue our focus on consistent delivery excellence through standard processes, methodologies and tools across all of our geographic territories; |
• | Accelerate the implementation of our global shared service delivery model centered on our regional and global shared service centers; |
• | Leverage state of the market technologies to drive faster processing and deeper analytics with the massive amount of data we receive from our clients. Technologies enabling large data manipulation and unstructured data analysis are |
4
evolving at a very rapid rate. We plan to remain at the forefront of these technologies and maintain the most secure and trusted infrastructure environment in our industry; and
• | Further develop and sell our Adjacent Services offerings. |
5
Technology
PRGX uses advanced, proprietary information systems and processes and a large-scale technology infrastructure to conduct its audits of clients’ payment transactions. The ability to efficiently and cost effectively ingest large volumes of structured and unstructured data is critical to providing best in class recovery audit and spend analytics services. We believe we have developed the most sophisticated and highest performing large data processing infrastructure system in the recovery audit industry. This system is based on the Hadoop open source technology standard and allows us to effectively process and manage our clients’ data. We are achieving significant acceleration in data processing speeds for both structured and unstructured data sets, which supports our efforts to accelerate audit results, transform core audit processes and deliver actionable spend analytics insights.
We believe that our proprietary technology and processes serve as important competitive advantages over both our principal competitors and our clients’ in-house internal recovery audit functions. To sustain these competitive advantages, we continually invest in technology initiatives to deliver innovative solutions that improve both the effectiveness and efficiency of our services.
We focus our data acquisition, data processing and data management methodologies on maximizing efficiencies and productivity and maintaining the highest standards of transaction auditing and spend analytics accuracy. At the beginning of a typical recovery audit or spend analytics engagement, we use a dedicated staff of data acquisition specialists and proprietary tools to acquire a wide array of transaction data from the client for the time period under review. We typically receive this data by secured electronic transmissions, digital media or paper. For paper-based data, we use a custom, proprietary imaging technology to scan the paper into electronic format. Upon receipt of the data, we secure, catalog, back up and convert it into standard, readable formats using third party and proprietary tools.
Our technology professionals clean and map massive volumes of structured and unstructured client data, primarily using high performance database and storage technologies, into standardized layouts at one of our data processing facilities. We also generate statistical reports to verify the completeness and accuracy of the data.
We then process the data using proprietary algorithms (business rules) leveraging over thirty years’ experience to help uncover patterns or potential problems in clients’ various transactional streams. We deliver this data with a high probability of transaction errors to our auditors who, using our proprietary audit software, sort, filter and search the data to validate and identify actual transaction errors. We also maintain a secure database of audit information with the ability to query on multiple variables, including claim categories, industry codes, vendors and audit years, to facilitate the identification of additional recovery opportunities and provide recommendations for process improvements to clients.
Once we identify and validate transaction errors, we present the information to clients for approval and submission to vendors as “claims.” We offer a proprietary web-based claim presentation and collaboration tool to help the client view, approve and submit claims to vendors.
In providing our spend analytics services, we use proprietary algorithms and technologies to clean and classify a client’s vendor spend data down to the line item level. We then are able to present this information to the client as a multi-dimensional data cube over a web-based interface. We believe these proprietary algorithms and technologies provide us with a competitive advantage over many of our competitors.
Competition
Accounts Payable Recovery Audit Services
We believe that the principal providers of domestic and international accounts payable recovery audit services in major markets worldwide consist of PRGX, two substantial competitors, and numerous other smaller competitors. The smaller recovery audit firms generally do not possess multi-country service capabilities and do not have the centralized resources or broad client base required to support the technology investments necessary to provide comprehensive recovery audit services for large, complex accounts payable systems. These smaller firms, therefore, are less equipped to audit large, data-intensive purchasing and accounts payable systems. In addition, many of these firms have limited resources and may lack the experience and knowledge of national promotions, seasonal allowances and current recovery audit practices. As a result, we believe that compared to most other firms providing accounts payable recovery audit services, PRGX has competitive advantages based on its domestic and international presence, well-trained and experienced professionals, and advanced technology.
While we believe that PRGX has the greatest depth and breadth of audit expertise, data and technology capabilities, scale and global presence in the industry, we face competition from the following:
Client Internal Recovery Audit Departments. A number of large retailers (particularly those in the discount, grocery and drug store sectors) have developed an internal recovery audit process to review transactions prior to turning them over to external recovery audit firms. Regardless of the level of recoveries made by internal recovery audit departments, we have
6
observed that virtually all large retail clients retain at least one (primary), and frequently two (primary and secondary), external recovery audit firms to capture errors not identified by their internal recovery audit departments.
Other Accounts Payable Recovery Audit Firms. The competitive landscape in the recovery audit industry is comprised of:
• | Full-service accounts payable recovery audit firms. We believe that only two companies other than PRGX offer a full suite of U.S. and international recovery audit services; |
• | A large number of smaller accounts payable recovery firms which have a limited client base and which use less sophisticated tools to mine disbursement claim categories at low contingency rates. These firms are most common in the U.S. market. Competition in most international markets, if any, typically comes from small niche providers; |
• | Firms, including one of our two substantial competitors, that offer a hybrid of audit software tools and training for use by internal audit departments, or general accounts payable process improvement enablers; and |
• | Firms with specialized skills focused on recovery audit services for discrete sectors such as sales and use tax, telecom, freight or real estate. |
Other Providers of Recovery Audit Services. The major international accounting firms provide recovery audit services; however, we believe their practices tend to be primarily focused on tax-related services.
Adjacent Services
Our Adjacent Services business faces competition from regional and local consulting firms; privately and publicly held global and national firms; large, well-known ERP software vendors; procurement-specific software providers and smaller, very specialized analytics providers. These businesses generally compete on the basis of the breadth, quality and cost of the services and products provided to clients. We believe that we differentiate ourselves from our competitors through our in-depth knowledge of our clients’ purchasing processes, systems and data, along with our direct channel to our existing clients.
Hiring, Training and Compensation of Personnel
Many of our auditors and other professionals formerly held finance-related management positions in the industries we serve. Training primarily is provided in the field by our experienced professionals enabling newly hired personnel to develop and refine their skills and improve productivity. We also use various other training materials such as process manuals and documented policies and procedures to supplement the field training provided by our experienced professionals. We periodically upgrade our training programs based on feedback from auditors and changing industry protocols. Many of our professionals participate in one of our incentive compensation plans that link their compensation to the financial performance of their service offering(s).
Proprietary Rights
From time to time, we develop new software and methodologies that replace or enhance existing proprietary software and methodologies. We rely primarily on trade secret and copyright protection for our proprietary software and other proprietary information. We capitalize the costs incurred for the development of computer software that will be sold, leased, or otherwise marketed or that will be used in our operations beginning when technological feasibility has been established. We consider the costs associated with developing or replacing methodologies to be research and development costs and expense them as incurred. Research and development costs, including the amortization of amounts previously capitalized, were approximately $3.0 million in 2015, $3.1 million in 2014 and $6.0 million in 2013.
We own or have rights to various trademarks, trade names and copyrights, including U.S. and foreign registered trademarks and trade names and U.S. registered copyrights, that are valuable assets and important to our business. We monitor the status of our copyright and trademark registrations to maintain them in force and renew them as appropriate. The duration of our active trademark registrations varies based upon the relevant statutes in the applicable jurisdiction, but generally endure for as long as they are used. The duration of our active copyright registrations similarly varies based on the relevant statutes in the applicable jurisdiction, but generally endure for the full statutory period. Our trademarks and trade names are of significant importance and include, but are not limited to, the following: PRGX®, Discover Your Hidden Profits®, SureF!nd®, Four Way Match®, Thrive in the Data™, PRG-Schultz™, imDex™, Profit Discovery™, GET™; PRGX APTrax™, PRGX AuditTrax™, PRGX ClaimTrax™, PRGX MailTrax™, PRGX MerchTrax™, and PRGX SpendTrax™.
7
Regulation
Various aspects of our business, including, without limitation, our data flows and our data acquisition, processing and reporting protocols, are subject to extensive and frequently changing governmental regulation in both the U.S. and internationally. These regulations include extensive data protection and privacy requirements. In the U.S., we are subject to the provisions of the Health Insurance Portability and Accountability Act of 1996 (“HIPAA”) with respect to our discontinued HCRA business. Internationally, we must comply with the European Data Protection Directive that various members of the European Union have implemented, as well as with data protection laws that exist in many of the other countries where we serve clients. Failure to comply with such regulations may, depending on the nature of the noncompliance, result in the termination or loss of contracts, the imposition of contractual damages, civil sanctions, damage to our reputation or in certain circumstances, criminal penalties.
Employees
As of January 31, 2016, PRGX had approximately 1,460 employees, of whom approximately 550 were in the U.S. The majority of our employees are involved in our recovery audit business.
Website
PRGX makes available free of charge on its website, www.prgx.com, its annual report on Form 10-K, quarterly reports on Form 10-Q, current reports on Form 8-K and all amendments to those reports. PRGX makes all filings with the Securities and Exchange Commission ("SEC") available on its website no later than the close of business on the date the filing was made. In addition, investors can access our filings with the Securities and Exchange Commission at www.sec.gov.
We also post certain corporate governance materials, including our Board of Directors committee charters and our Code of Conduct and Code of Ethics For Senior Financial Officers, on our website under the heading “Corporate Governance” on the “Investors” page. From time to time, we may update the corporate governance materials on our website as necessary to comply with rules issued by the SEC or NASDAQ, or as desirable to further the continued effective and efficient governance of our company.
8
ITEM 1A. Risk Factors
Revenue from our accounts payable recovery audit business generally has declined in the past several years. We must successfully execute our growth strategy in order to increase our revenue, and must lower our cost of delivery in order to maintain profitability.
Over time, our clients tend to resolve recurring transaction processing deficiencies. In addition, many of our clients have an internal staff that audits the transactions before we do. As the skills, experience and resources of our clients’ internal recovery audit staffs improve, they will identify many overpayments themselves and reduce some of our audit recovery opportunities. Based on these and other factors, including competitive rate pressures, our dependency on client approval of identified claims, and loss of clients and reduced audit scope at existing clients from time to time, without improved audit execution, rate stabilization and acquisition of new clients, we believe that our accounts payable recovery audit business will experience revenue declines and may incur losses.
We depend on our largest clients for significant revenue, so losing a major client could adversely affect our revenue and liquidity.
We generate a significant portion of our revenue from our largest clients. Our five largest clients collectively accounted for 34.5% of our annual revenue in 2015, 32.2% in 2014 and 30.4% in 2013. No client has accounted for 10% or more of our total revenue in the past three years. If we lose any of our major clients, our results of operations and liquidity could be materially and adversely affected.
Although we continually seek to diversify our client base, we may be unable to offset the effects of an adverse change in one of our key client relationships. For example, if our existing clients elect not to renew their contracts with us at the expiration of the current terms of those contracts, or reduce the services they purchase thereunder, our recurring revenue base will be reduced, which could have a material adverse effect on our business, financial position, results of operations, and cash flows. In addition, we could lose clients if they cancel their agreements with us, if we fail to win a competitive bid at the time of contract renewal, if the financial condition of any of our clients deteriorates or if our clients are acquired by, or acquire, companies with which we do not have contracts, any of which could materially and adversely affect our business, financial position, results of operations, and cash flows.
Our strategy may not be successful.
As discussed in Item 1 “The PRGX Strategy,” our objectives are to achieve higher profitability and growth by delivering value, operational efficiency and innovative services, differentiating our service offerings and capabilities, expanding into new industry verticals and attracting and developing highly qualified professionals. These efforts are ongoing, and the results of our efforts will not be known until sometime in the future. Successful execution of our strategy requires sustained management focus, innovation, organization and coordination over time, as well as success in building relationships with third parties. If we are unable to execute our strategy successfully, our business, financial position, results of operations and cash flows could be adversely affected. In addition, execution of our strategy will require material investments and additional costs that may not yield incremental revenue and improved financial performance as planned.
Our acquisitions, investments, partnerships and strategic alliances may require significant resources and/or result in significant unanticipated losses, costs or liabilities.
Acquisitions have contributed to our revenue. Although we cannot predict our rate of growth as the result of acquisitions with complete accuracy, we believe that additional acquisitions, investments and strategic alliances will be important to our growth strategy.
We may finance future acquisitions by issuing additional equity and/or debt. The issuance of additional equity in connection with any such transaction could be substantially dilutive to existing shareholders. The issuance of additional debt could increase our leverage substantially. In addition, announcement or implementation of future transactions by us or others could have a material effect on the price of our common stock. We could face financial risks associated with incurring significant debt. Additional debt may reduce our liquidity, curtail our access to financing markets, impact our standing with credit agencies and increase the cash flow required for debt service. Any incremental debt incurred to finance an acquisition could also place significant constraints on the operation of our business.
Furthermore, any future acquisitions of businesses or facilities could entail a number of additional risks, including:
•problems with effective integration of acquired operations;
•the inability to maintain key pre-acquisition business relationships;
•increased operating costs;
•the diversion of our management team from our other operations;
•problems with regulatory agencies;
9
•exposure to unanticipated liabilities;
•difficulties in realizing projected efficiencies, synergies and cost savings; and
•changes in our credit rating and financing costs.
The terms of our credit facility place restrictions on us, which create risks of default and reduce our flexibility.
Our current credit facility contains a number of affirmative, negative, and financial covenants that may limit our ability to take certain actions and require us to comply with specified financial ratios and other performance covenants. No assurance can be provided that we will not violate the covenants of our secured credit facility in the future. If we are unable to comply with our financial covenants in the future, our lenders could pursue their contractual remedies under the credit facility, including requiring the immediate repayment in full of all amounts outstanding, if any. Additionally, we cannot be certain that, if the lenders demanded immediate repayment of any amounts outstanding, we would be able to secure adequate or timely replacement financing on acceptable terms or at all.
Our ability to make payments due on debt we may have outstanding will depend upon our future operating performance, which is subject to general economic and competitive conditions and to financial, business and other factors, many of which we cannot control. If the cash flow from our operating activities is insufficient to make these payments, we may take actions such as delaying or reducing capital expenditures, attempting to restructure or refinance our debt, selling assets or operations or seeking additional equity capital. Some or all of these actions may not be sufficient to allow us to service our debt obligations and we could be required to file for bankruptcy. Further, we may be unable to take any of these actions on satisfactory terms, in a timely manner or at all. In addition, our credit agreements may limit our ability to take several of these actions. Our failure to generate sufficient funds to pay our debts or to undertake any of these actions successfully could materially and adversely affect our business, financial position, results of operations and cash flows.
We have incurred and will continue to incur significant costs in connection with our discontinued HCRA services business.
As of December 31, 2015, we discontinued the HCRA services business, but will continue to incur significant costs as it winds down. There are complex regulations governing many healthcare payments and recoupments, including a multi-layered scheme for provider appeals of overpayment determinations under the Medicare RAC program. These regulations, the terms of the Company’s contracts and the complexity of Medicare and other healthcare data, systems and processes, generally make it more difficult and costly to exit this portion of our business. Finally, any appeals settlement(s) which require(s) us to repay a significant portion of our historical fees could materially and adversely impact our results of operations and cash flow.
We may be unable to protect and maintain the competitive advantage of our proprietary technology and intellectual property rights.
Our operations could be materially and adversely affected if we are not able to protect our proprietary software, audit techniques and methodologies, and other proprietary intellectual property rights. We rely on a combination of trade secret and copyright laws, nondisclosure and other contractual arrangements and technical measures to protect our proprietary rights. Although we presently hold U.S. registered copyrights on certain of our proprietary technology and certain U.S. and foreign registered trademarks, we may be unable to obtain similar protection on our other intellectual property. In addition, our foreign registered trademarks may not receive the same enforcement protection as our U.S. registered trademarks.
Additionally, to protect our confidential and trade secret information, we generally enter into nondisclosure agreements with our employees, consultants, clients and potential clients. We also limit access to, and distribution of, our proprietary information. Nevertheless, we may be unable to deter misappropriation or unauthorized dissemination of our proprietary information, detect unauthorized use and take appropriate steps to enforce our intellectual property rights. In spite of the level of care taken to protect our intellectual property, there is no guarantee that our sensitive proprietary information will not be improperly accessed or that our competitors will not independently develop technologies that are substantially equivalent or superior to our technology. Moreover, although we are not aware of any infringement of our services and products on the intellectual property rights of others, we also are subject to the risk that someone else will assert a claim against us in the future for violating their intellectual property rights.
Cyber-security incidents, including data security breaches or computer viruses, could harm our business by disrupting our delivery of services, damaging our reputation or exposing us to liability.
We receive, process, store and transmit, often electronically, the confidential data of our clients and others. Unauthorized access to our computer systems or stored data could result in the theft or improper disclosure of confidential information, the deletion or modification of records or could cause interruptions in our operations. These cyber-security risks increase when we transmit information from one location to another, including transmissions over the Internet or other electronic networks. Despite implemented security measures, our facilities, systems and procedures, and those of our third-party service providers, may be vulnerable to security breaches, acts of vandalism, software viruses, misplaced or lost data, programming and/or human
10
errors or other similar events which may disrupt our delivery of services or expose the confidential information of our clients and others. Any security breach involving the misappropriation, loss or other unauthorized disclosure or use of confidential information of our clients or others, whether by us or a third party, could (i) subject us to civil and criminal penalties, (ii) have a negative impact on our reputation, (iii) expose us to liability to our clients, third parties or government authorities, and (iv) cause our present and potential clients to choose another service provider. Any of these developments could have a material adverse effect on our business, results of operations, financial position, and cash flows.
Operational failures in our data processing facilities could harm our business and reputation.
An interruption of data processing services, including an interruption caused by damage or destruction of facilities or a failure of data processing equipment, could result in a loss of clients, difficulties in obtaining new clients and a reduction in revenue. In addition, we also may be liable to third parties or our clients because of such interruption. These risks would increase with longer service interruptions. Despite any disaster recovery and business continuity plans and precautions we have implemented (including insurance) to protect against the effects of service delivery interruptions, such interruptions could result in a material adverse effect on our business, results of operations, financial position, and cash flows.
Our investment of substantial capital in information technology systems, and a failure to successfully implement such systems could adversely affect our business.
We have invested and continue to invest substantial amounts in the development and implementation of information technology systems. Although investments are carefully planned, there can be no assurance that such systems will justify the related investments. If we fail to realize the benefits expected from our information technology system investments, or if we fail to do so within the envisioned time frame, it could have an adverse effect on our results of operations, financial position, and cash flows.
Client and vendor bankruptcies and financial difficulties could reduce our earnings.
Our clients generally operate in intensely competitive environments and, accordingly, bankruptcy filings by our clients are not uncommon. Bankruptcy filings by our large clients or the significant vendors who supply them or unexpectedly large vendor claim chargebacks lodged against one or more of our larger clients could have a materially adverse effect on our financial condition, results of operations, and cash flows. Similarly, our inability to collect our accounts receivable due to other financial difficulties of one or more of our large clients could adversely affect our financial position, results of operations, and cash flows.
Economic conditions which adversely impact our clients and their vendors in the retail industry in the United Kingdom and Europe may continue to have a negative impact on our revenue. Specifically, client liquidity and the liquidity of client vendors can have a significant impact on claim production, the claim approval process, and the ability of clients to offset or otherwise make recoveries from their vendors.
If a client files for bankruptcy, we could be subject to an action to recover certain payments received in the 90 days prior to the bankruptcy filing known as “preference payments.” If we are unsuccessful in defending against such claims, we would be required to make unbudgeted cash payments which could strain our financial liquidity, and our earnings would be reduced.
Our failure to retain the services of key members of our management team and highly skilled personnel could adversely impact our operations and financial performance.
Our future success depends largely on the efforts and skills of our management team, including our executive officers and other key employees. As such, we have entered into employment agreements with key members of our management team. While these employment agreements include limits on the ability of key employees to directly compete with us in the future, nothing prevents them from leaving our company. We also do not maintain “key person” life insurance policies on any of our executive officers or other key employees. Thus, we may have to incur costs to replace such employees if we were to lose their services, and our ability to execute our business strategy could be impaired if we are unable to replace such employees in a timely manner.
In addition, it is especially challenging to attract and retain highly qualified skilled auditors and other professionals in an industry where competition for skilled personnel is intense. Accordingly, our future performance also depends, in part, on the ability of our management team to work together effectively, manage our workforce, and retain highly qualified personnel.
We rely on operations outside the U.S. for a significant portion of our revenue and are increasingly dependent on operations outside the U.S. for supporting our operations globally.
Operations outside the U.S. generated 41.8% of our annual revenue in 2015, 45.0% in 2014 and 44.5% in 2013. These international operations are subject to numerous risks, including:
• | greater exposure to the possibility of economic instability, the disruption of operations from labor and political disturbances, expropriation or war in the international markets we serve; |
11
• | difficulties in staffing and managing foreign operations and in collecting accounts receivable; |
• | fluctuations in currency exchange rates, particularly weaknesses in the British pound, the euro, the Canadian dollar, the Mexican peso, the Brazilian real, the Australian dollar, the Indian rupee and other currencies of countries in which we transact business, which could result in currency translations that materially reduce our revenue and earnings; |
• | costs associated with adapting our services to our foreign clients’ needs; |
• | unexpected changes in regulatory requirements and laws; |
• | expenses and legal restrictions associated with transferring earnings from our foreign subsidiaries to us; |
• | difficulties in complying with a variety of foreign laws and regulations, such as those relating to data content retention, privacy and employment, as well as U.S. laws affecting operations outside of the United States; |
• | business interruptions due to widespread disease, actual or potential terrorist activities, or other catastrophes; |
• | reduced or limited protection of our intellectual property rights; |
• | longer accounts receivable cycles; and |
• | competition with large or state-owned enterprises or regulations that effectively limit our operations and favor local competitors. |
Because we expect a significant portion of our revenue to continue to come from operations outside the U.S., and expect to continue transitioning certain of our operations to locations outside the U.S., the occurrence of any of these events could materially and adversely affect our business, financial position, results of operations, and cash flows.
In 2015, our European operations accounted for 21.0% of our consolidated revenue. There have been continuing concerns and uncertainties regarding the stability of certain European economies. A continued decline in the economic conditions in Europe may materially and adversely affect our operations both in Europe and on a consolidated basis.
Furthermore, in 2010 we began transitioning certain of our core data processing and other functions to locations outside the U.S., including India, where approximately 20% of our employees were located on December 31, 2015. While our operations in India have been key to serving clients more efficiently and cost-effectively under our improved service delivery model, India has from time to time experienced instances of civil unrest and hostilities with neighboring countries. Geopolitical conflicts, military activity, terrorist attacks, or other political uncertainties in the future could adversely affect the Indian economy by disrupting communications and making business operations and travel more difficult, which may have a material adverse effect on our ability to deliver services from India. Disruption of our Indian operations could materially and adversely affect our profitability and our ability to execute our growth strategy.
Our business operates in highly competitive environments and is subject to pricing pressure.
The environments in which our business operates are highly competitive, with numerous other recovery audit firms and other service providers. In addition, many of our recovery audit clients have developed their own internal recovery audit capabilities. As a result of competition among the providers of these services and the availability of certain recovery audit services from clients’ internal audit departments, our business is subject to intense rate pressure. Our Adjacent Services business also has numerous competitors varying in size, market strength and specialization, many of whom have established and well-known franchises and brands. Intense price competition faced by all of our service lines could negatively impact our profit margins and have a potential adverse effect on our business, financial position, results of operations, and cash flows.
Our client contracts generally contain provisions under which the client may terminate our services prior to the completion of the agreement.
Many of our client contracts provide that the client may terminate the contract without cause prior to the end of the term of the agreement by providing us with relatively short prior written notice of the termination. As a result, the existence of contractual relationships with our clients is not an assurance that we will continue to provide services for our clients through the entire term of their respective agreements. If clients representing a significant portion of our revenue terminated their agreements unexpectedly, we may not, in the short-term, be able to replace the revenue and income from such contracts and this would have a material adverse effect on our business, financial condition, results of operations and cash flows. In addition, client contract terminations also could harm our reputation within the industry which could negatively impact our ability to obtain new clients.
Our charges to earnings resulting from acquisition, restructuring and integration costs may materially adversely affect the market value of our common stock.
We account for the completion of our acquisitions using the purchase method of accounting. We allocate the total estimated purchase prices to net tangible assets, amortizable intangible assets and indefinite-lived intangible assets, and based
12
on their fair values as of the date of completion of the acquisitions, record the excess of the purchase price over those fair values as goodwill. Our financial results, including earnings per share, could be adversely affected by a number of financial adjustments required in purchase accounting including the following:
• | we will incur additional amortization expense over the estimated useful lives of certain of the intangible assets acquired in connection with acquisitions during such estimated useful lives; |
• | we will incur additional depreciation expense as a result of recording purchased tangible assets; and |
• | to the extent the value of goodwill or intangible assets becomes impaired, we may be required to incur material charges relating to the impairment of those assets. |
Our failure to comply with applicable governmental privacy laws and regulations in the U.S. and internationally could substantially impact our business, operations, financial position, and cash flows.
We are subject to extensive and evolving federal, state and foreign privacy laws and regulations. Changes in privacy laws or regulations or new interpretations of existing laws or regulations could have a substantial effect on our operating methods and costs. Failure to comply with such regulations could result in the termination or loss of contracts, the imposition of contractual damages, civil sanctions, damage to the Company’s reputation, or in certain circumstances, criminal penalties, any of which could have a material adverse effect on our results of operations, financial position, cash flows, business and prospects. Determining compliance with such regulations is complicated by the fact that many of these laws and regulations have not been fully interpreted by governing regulatory authorities or the courts, and many of the provisions of such laws and regulations are open to a wide range of interpretations. There can be no assurance that we are or have been in compliance with all applicable existing laws and regulations or that we will be able to comply with new laws or regulations.
With respect to trans-border data flows from the European Economic Area, or EEA, we have historically relied on the U.S.-European Union and the U.S.-Swiss Safe Harbor Frameworks, as agreed to by the U.S. Department of Commerce and the European Union (“EU”) and Switzerland, respectively, as a means to legally transfer European personal information from Europe to the United States. However, on October 6, 2015, the European Court of Justice (“ECJ”) invalidated the U.S.-EU Safe Harbor framework and the Swiss data protection authorities later invalidated the U.S.-Swiss Safe Harbor framework. As a result, we have begun to undertake efforts to conform transfers of personal information from the EEA based on current regulatory obligations, the guidance of data protection authorities and evolving best practices. Despite these efforts, we may be unsuccessful in establishing conforming means of transferring such data from the EEA. The legitimacy of these alternate means are subject to differing interpretations among various European jurisdictions and, as such, we may experience hesitancy, reluctance, or refusal by European or multi-national clients to use our services due to the potential risk exposure they may face as a result of the ECJ ruling and the current data protection obligations imposed on them by certain data protection authorities. Furthermore, the ECJ’s decision may result in different European data protection regulators applying differing standards for the transfer of personal data, which could result in increased regulation, cost of compliance and limitations on data transfers for us and our clients. These developments could harm our business, financial condition and results of operations.
Recently, it was announced that negotiators from Europe and the United States reached an agreement on a successor to the Safe Harbor framework that will be referred to as the EU-U.S. Privacy Shield. However, it is likely to be months before all of the details regarding the Privacy Shield program are finalized and a procedure is introduced to allow interested companies to participate in the program. While the details regarding the Privacy Shield program continue to be finalized, we will continue to face uncertainty as to whether our efforts to comply with our obligations under European privacy laws will be sufficient. Noncompliance or alleged noncompliance with European privacy laws could result in fines and other penalties and could have a negative effect on our existing business and on our ability to attract and retain new customers.
The ownership change that occurred as a result of our 2006 exchange offer limits our ability to use our net operating losses.
We have substantial tax loss and credit carry-forwards for U.S. federal income tax purposes. On March 17, 2006, as a result of the closing of its exchange offer, the Company experienced an ownership change as defined under Section 382 of the Internal Revenue Code (“IRC”). This ownership change resulted in an annual IRC Section 382 limitation that limits the use of certain tax attribute carry-forwards. Of the $91.1 million of U.S. federal net loss carry-forwards available to the Company, $13.8 million of the loss carry-forwards are subject to an annual usage limitation of $1.4 million. The Company has reviewed subsequent potential ownership changes as defined under IRC Section 382 and has determined that on August 4, 2008, the Company experienced an additional ownership change. This subsequent ownership change did not decrease the original limitation nor did it impact the Company’s financial position, results of operations, or cash flows. However, future ownership changes may result in additional limitations and the loss of portions of these carry-forwards and may significantly increase our projected future tax liability.
Certain of our tax positions may be subject to challenge by the Internal Revenue Service and other tax authorities, and if successful, these challenges could increase our future tax liabilities and expense.
13
For U.S. federal income tax purposes, as well as local country tax purposes in the jurisdictions where we operate, from time to time we take positions under provisions of applicable tax law that are subject to varying interpretations. Certain of our tax positions may be subject to challenge by the applicable taxing authorities, including, in the U.S., the Internal Revenue Service. If our tax positions are successfully challenged, our future tax liabilities and expense could significantly increase.
While we believe that our tax positions are proper based on applicable law and we believe that it is more likely than not that we would prevail with respect to challenges to these positions, we can make no assurances that we would prevail if our positions are challenged or that business economics would justify the mounting of a legal defense against such challenges. If our tax positions are successfully challenged by the U.S. or non-U.S. taxing authorities, it could increase our future tax liabilities and expense and have a material adverse impact on our financial position, results of operations and cash flows.
We may have exposure to additional income tax liabilities or additional costs if the U.S. government changes certain U.S. tax rules or other laws applicable to U.S. corporations doing business in foreign jurisdictions.
We are a U.S. corporation that conducts business both in the U.S. and in foreign jurisdictions. From time to time, proposals for changes to tax and other laws are made that may negatively impact U.S. corporations doing business in foreign jurisdictions, including proposals for comprehensive tax reform. While the scope of future changes remains unclear, proposed changes might include limiting the ability of U.S. corporations to deduct certain expenses attributable to offshore earnings, modifying the foreign tax credit rules and taxing currently certain transfers of intangible assets offshore or imposing other economic disincentives to doing business outside of the U.S. The enactment of some or all of these proposals could increase the Company’s effective tax rate or otherwise adversely affect our profitability.
Future impairment of goodwill, other intangible assets and long-lived assets would reduce our future earnings.
As of December 31, 2015, the Company’s goodwill and other intangible assets totaled $18.5 million. We must perform periodic assessments to determine whether some portion, or all, of our goodwill, intangible assets and other long-lived assets are impaired. We recorded an impairment charge of $4.2 million in 2013 relating to certain internally developed software assets. Future impairment testing could result in a determination that our goodwill, other intangible assets or our other long-lived assets have been impaired. Future adverse changes in the business environment or in our ability to perform audits successfully and compete effectively in our markets or the discontinuation of our use of certain of our intangible or other long-lived assets could result in impairment which could materially adversely impact future earnings.
Claims under our self-insurance program may differ from our estimates, which could materially impact our results of operations.
We use a combination of insurance and self-insurance plans to provide for the potential liabilities for healthcare benefits for our employees. We estimate the liabilities associated with the risks that we retain by considering historical claims experience, demographic factors, severity factors and other actuarial assumptions. Our results could be materially impacted by claims and other expenses related to such plans if future occurrences and claims differ from these assumptions and historical trends.
Our articles of incorporation, bylaws and Georgia law may inhibit a change of control that shareholders may favor.
Our articles of incorporation, bylaws and Georgia law contain provisions that may delay, deter or inhibit a future acquisition of PRGX that is not approved by our Board of Directors. This could occur even if our shareholders receive attractive offers for their shares or if a substantial number, or even a majority, of our shareholders believe the takeover is in their best interest. These provisions are intended to encourage any person interested in acquiring us to negotiate with and obtain the approval of our Board of Directors in connection with the transaction. Provisions that could delay, deter or inhibit a future acquisition include the following:
• | a classified Board of Directors; |
• | the requirement that our shareholders may only remove directors for cause; |
• | specified requirements for calling special meetings of shareholders; |
• | the ability of the Board of Directors to consider the interests of various constituencies, including our employees, clients and creditors and the local community, in making decisions; and |
• | the ability of the Board of Directors to issue shares of preferred stock with such designations, powers, preferences and rights as it determines, without any further vote or action by our shareholders. |
14
Our stock price has been and may continue to be volatile.
Our common stock is currently traded on The Nasdaq Global Select Market. The trading price of our common stock has been and may continue to be subject to large fluctuations. For example, for the year ended December 31, 2015, our stock traded as high as $5.77 per share and as low as $3.35 per share. Our stock price may increase or decrease in response to a number of events and factors, including:
•future announcements concerning us, key clients or competitors;
•quarterly variations in operating results and liquidity;
•changes in financial estimates and recommendations by securities analysts;
•developments with respect to technology or litigation;
•changes in applicable laws and regulations;
•the operating and stock price performance of other companies that investors may deem comparable to our
company;
•acquisitions and financings; and
•sales and purchases of our stock by insiders.
Fluctuations in the stock market, generally, also impact the volatility of our stock price. Finally, general economic conditions and stock market movements may adversely affect the price of our common stock, regardless of our operating performance.
ITEM 1B. Unresolved Staff Comments
None.
ITEM 2. Properties
Our principal executive offices are located in approximately 58,000 square feet of office space in Atlanta, Georgia. We have subleased approximately 3,000 square feet of our principal executive office space to independent third parties. In January 2014, we amended the lease for our principal executive offices to extend the term through December 31, 2021, reduce the lease payment for 2014, and reduce the space under lease to approximately 58,000 square feet effective January 1, 2015. This space is used by our Recovery Audit Services - Americas and Adjacent Services segments and is the primary location of our Corporate Support personnel. Our various operating units lease numerous other parcels of operating space elsewhere in the U.S. and in the various other countries in which we currently conduct our business.
Excluding the lease for our principal executive offices, the majority of our real property leases are individually less than five years in duration. See Contractual Obligations and Other Commitments in “Management’s Discussion and Analysis of Financial Condition and Results of Operations” included in Part II, Item 7 of this Form 10-K and Note 6 of “Notes to Consolidated Financial Statements” included in Part II, Item 8 of this Form 10-K for a discussion of costs we may incur in the future to the extent we (i) reduce our office space capacity or (ii) commit to, or occupy, new properties in the locations in which we operate.
ITEM 3. Legal Proceedings
We are party to a variety of legal proceedings arising in the normal course of business. While the results of these proceedings cannot be predicted with certainty, management believes that the final outcome of these proceedings will not have a material adverse effect on our financial position, results of operations or cash flows.
ITEM 4. Mine Safety Disclosures
Not applicable.
15
PART II
ITEM 5. Market for Registrant's Common Equity, Related Stockholder Matters and Issuer Purchases of Equity Securities
Our common stock is traded under the symbol “PRGX” on The Nasdaq Global Select Market (Nasdaq). The Company has not paid cash dividends on its common stock since it became a public company in 1996 and does not intend to pay cash dividends in the foreseeable future. Moreover, restrictive covenants included in our secured credit facility specifically prohibit payment of cash dividends. As of March 4, 2016, there were 126 holders of record of our common stock and management believes there were approximately 2,700 beneficial holders. The following table sets forth, for the quarters indicated, the range of high and low sales prices for the Company’s common stock as reported by Nasdaq during 2015 and 2014.
2015 Calendar Quarter | High | Low | ||||||
1st Quarter | $ | 5.77 | $ | 3.84 | ||||
2nd Quarter | 4.99 | 3.65 | ||||||
3rd Quarter | 4.51 | 3.35 | ||||||
4th Quarter | 4.42 | 3.50 | ||||||
2014 Calendar Quarter | High | Low | ||||||
1st Quarter | $ | 7.42 | $ | 5.82 | ||||
2nd Quarter | 6.90 | 5.95 | ||||||
3rd Quarter | 6.89 | 5.50 | ||||||
4th Quarter | 6.05 | 3.97 | ||||||
Issuer Purchases of Equity Securities
A summary of our repurchases of our common stock during the fourth quarter ended December 31, 2015 is set forth below.
2015 | Total Number of Shares Purchased (a) | Average Price Paid per Share | Total Number of Shares Purchased as Part of Publicly Announced Plans or Programs (b) | Maximum Approximate Dollar Value of Shares that May Yet Be Purchased Under the Plans or Programs | ||||||||||
(millions of dollars) | ||||||||||||||
October 1 - October 31 | 12,360 | $ | 4.01 | 12,000 | $ | — | ||||||||
November 1 - November 30 | 12,400 | $ | 3.81 | 12,400 | $ | — | ||||||||
December 1 - December 31 | 181,949 | $ | 3.93 | 181,949 | $ | — | ||||||||
206,709 | $ | 3.93 | 206,349 | $ | 9.2 | |||||||||
(a) | The shares purchased during the quarter include shares surrendered by employees to satisfy tax withholding obligations upon vesting of restricted stock and shares purchased as part of the Company's stock repurchase program. |
(b) | On February 21, 2014, our Board of Directors authorized a stock repurchase program under which we could repurchase up to $10.0 million of our common stock from time to time through March 31, 2015. On March 25, 2014, our Board of Directors authorized a $10.0 million increase to the stock repurchase program, bringing the total amount of its common stock that the Company could repurchase under the program to $20.0 million. On October 24, 2014, our Board of Directors authorized a $20.0 million increase to the stock repurchase program, increasing the total share repurchase program to $40.0 million, and extended the duration of the program to December 31, 2015. During October 2015, our Board of Directors authorized an additional $10.0 million increase in the program, increasing the total repurchase program to $50.0 million, and extended the duration of the program to December 31, 2016. From the February 2014 announcement of the Company's current stock repurchase program through December 31, 2015, the Company repurchased a total of 7.8 million shares under this program for an aggregate purchase price of $40.8 million. The timing and amount of future repurchases, if any, will depend upon the Company’s stock price, the amount of the Company's available cash, regulatory requirements, and other corporate considerations. The Company may initiate, suspend or discontinue purchases under the stock repurchase program at any time. |
16
Performance Graph
Set forth below is a line graph presentation comparing the cumulative shareholder return on our common stock, on an indexed basis, against cumulative total returns of The Nasdaq Composite Index and the RDG Technology Composite Index. The graph assumes that the value of the investment in the common stock in each index was $100 on December 31, 2010 and shows total return on investment for the period beginning December 31, 2010 through December 31, 2015, assuming reinvestment of any dividends. Notwithstanding anything to the contrary set forth in any of the Company’s filings under the Securities Act of 1933 or the Securities Exchange Act of 1934 that might incorporate future filings, including this Annual Report on Form 10-K, in whole or in part, the Performance Graph presented below shall not be incorporated by reference into any such filings.
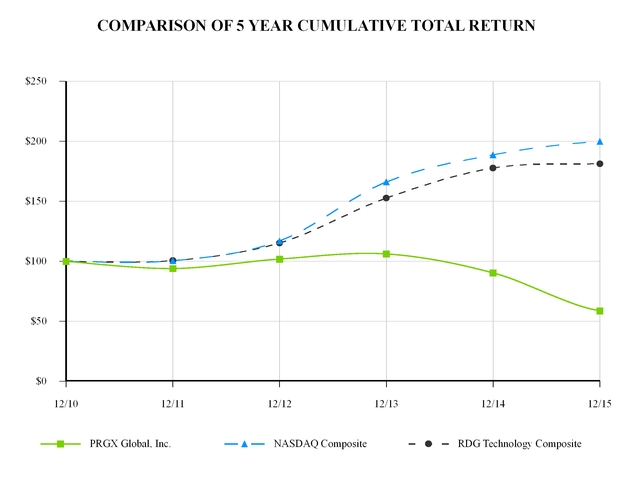
Cumulative Total Return | ||||||||||||||||||
12/10 | 12/11 | 12/12 | 12/13 | 12/14 | 12/15 | |||||||||||||
PRGX Global, Inc. | 100.00 | 94.00 | 101.90 | 106.16 | 90.36 | 58.77 | ||||||||||||
NASDAQ Composite | 100.00 | 100.53 | 116.92 | 166.19 | 188.78 | 199.95 | ||||||||||||
RDG Technology Composite | 100.00 | 100.56 | 115.30 | 152.75 | 177.73 | 181.32 | ||||||||||||
17
ITEM 6. Selected Financial Data
The following table sets forth selected financial data from continuing operations for the Company as of and for each of the five years in the period ended December 31, 2015. The following data reflects the business acquisitions that we have completed through December 31, 2015. We have included the results of operations for these acquired businesses in our results of operations since the date of their acquisitions. We have derived this historical consolidated financial data from our Consolidated Financial Statements and Notes thereto, which have been audited by our Independent Registered Public Accounting Firm. The Consolidated Balance Sheets as of December 31, 2015 and 2014, and the related Consolidated Statements of Operations, Comprehensive Income (Loss), Shareholders’ Equity and Cash Flows for each of the years in the three-year period ended December 31, 2015 and the report of the Independent Registered Public Accounting Firm thereon are included in Item 8 of this Form 10-K.
The data presented below should be read in conjunction with the Consolidated Financial Statements and Notes thereto included elsewhere in this Form 10-K and other financial information appearing elsewhere in this Form 10-K, including “Management’s Discussion and Analysis of Financial Condition and Results of Operations.” Certain reclassifications have been made to the prior periods to conform to the current period presentation.
Years Ended December 31, (1) | ||||||||||||||||||||
2015 | 2014 | 2013 | 2012 | 2011 | ||||||||||||||||
Statements of Operations Data: | (In thousands, except per share data) | |||||||||||||||||||
Revenue, net | $ | 138,302 | $ | 161,552 | $ | 178,268 | $ | 190,411 | $ | 195,077 | ||||||||||
Operating expenses: | ||||||||||||||||||||
Cost of revenue | 93,169 | 110,890 | 112,853 | 123,157 | 130,015 | |||||||||||||||
Selling, general and administrative expenses | 32,284 | 38,581 | 46,143 | 46,601 | 44,933 | |||||||||||||||
Depreciation of property and equipment | 5,317 | 6,025 | 6,783 | 5,743 | 4,546 | |||||||||||||||
Amortization of intangible assets | 2,458 | 3,531 | 4,997 | 7,224 | 4,991 | |||||||||||||||
Impairment charges | — | — | 2,773 | — | — | |||||||||||||||
Total operating expenses | 133,228 | 159,027 | 173,549 | 182,725 | 184,485 | |||||||||||||||
Operating income from continuing operations | 5,074 | 2,525 | 4,719 | 7,686 | 10,592 | |||||||||||||||
Foreign currency transaction (gains) losses on short-term intercompany balances | 2,165 | 2,003 | (13 | ) | (377 | ) | 417 | |||||||||||||
Interest expense (income), net | (190 | ) | (77 | ) | (77 | ) | 966 | 1,616 | ||||||||||||
Other loss | 1,191 | 57 | — | — | — | |||||||||||||||
Income from continuing operations before income taxes | 1,908 | 542 | 4,809 | 7,097 | 8,559 | |||||||||||||||
Income tax expense (2) | 369 | 3,241 | 2,755 | 1,297 | 1,292 | |||||||||||||||
Net income (loss) from continuing operations | $ | 1,539 | $ | (2,699 | ) | $ | 2,054 | $ | 5,800 | $ | 7,267 | |||||||||
Basic earnings (loss) from continuing operations per common share | $ | 0.06 | $ | (0.09 | ) | $ | 0.07 | $ | 0.23 | $ | 0.30 | |||||||||
Diluted earnings (loss) from continuing operations per common share | $ | 0.06 | $ | (0.09 | ) | $ | 0.07 | $ | 0.23 | $ | 0.29 | |||||||||
18
December 31, | ||||||||||||||||||||
2015 | 2014 | 2013 | 2012 | 2011 | ||||||||||||||||
Balance Sheet Data: (3) | (In thousands) | |||||||||||||||||||
Cash and cash equivalents | $ | 15,122 | $ | 25,735 | $ | 43,700 | $ | 37,806 | $ | 20,337 | ||||||||||
Working capital | 21,641 | 36,006 | 50,506 | 37,445 | 16,319 | |||||||||||||||
Total assets | 80,391 | 102,782 | 132,829 | 143,586 | 126,413 | |||||||||||||||
Long-term debt, excluding current installments | — | — | — | 3,000 | 6,000 | |||||||||||||||
Total shareholders' equity | $ | 52,415 | $ | 70,986 | $ | 93,828 | $ | 84,652 | $ | 59,090 | ||||||||||
(1) | Data for all years prior to 2015 has been restated in order to reflect only continuing operations. |
(2) | The taxes recorded for 2014 were primarily related to the recording of a valuation allowance on the future use of net losses in our UK operations. The high effective tax rate relative to the U.S. federal statutory rate in 2013 is due to taxes on income of foreign subsidiaries with no benefit recognized for losses incurred in the U.S. due to the Company having a deferred tax asset valuation allowance. The low effective tax rate in 2012 is attributable to recognition of certain previously unrecognized tax benefits. See Note 1 (i) and Note 7 of “Notes to Consolidated Financial Statements” included in Item 8 of this Form 10-K. |
(3) | Data in this table reflects the balance sheet amounts for both continuing and discontinued operations. |
19
ITEM 7. Management’s Discussion and Analysis of Financial Condition and Results of Operations
Introduction
PRGX Global, Inc. is a global leader in recovery audit and spend analytics services. We conduct our operations through three reportable segments: Recovery Audit Services – Americas, Recovery Audit Services – Europe/Asia-Pacific and Adjacent Services. The Recovery Audit Services – Americas segment represents recovery audit services we provide in the U.S., Canada and Latin America. The Recovery Audit Services – Europe/Asia-Pacific segment represents recovery audit services we provide in Europe, Asia and the Pacific region. The Adjacent Services segment includes spend analytics (data transformation and cost harmonization), SIM, and CSI. We include the unallocated portion of corporate selling, general and administrative expenses not specifically attributable to the three reportable segments in Corporate Support. Recovery auditing is a business service focused on finding overpayments created by errors in payment transactions, such as missed or inaccurate discounts, allowances and rebates, vendor pricing errors, erroneous coding and duplicate payments. Generally, we earn our recovery audit revenue by identifying overpayments made by our clients, assisting our clients in recovering the overpayments from their vendors, and collecting a specified percentage of the recoveries from our clients as our fee. The fee percentage we earn is based on specific contracts with our clients that generally also specify: (a) time periods covered by the audit; (b) the nature and extent of services we are to provide; and (c) the client’s responsibilities to assist and cooperate with us. Clients generally recover claims by either taking credits against outstanding payables or future purchases from the relevant vendors, or receiving refund checks directly from those vendors. The manner in which a claim is recovered by a client is often dictated by industry practice. In addition, many clients establish client-specific procedural guidelines that we must satisfy prior to submitting claims for client approval. Our recovery audit business also includes contract compliance services which focus on auditing supplier billings against large and complex services, construction and licensing contracts. Such services include verification of the accuracy of third party reporting, appropriateness of allocations and other charges in cost or revenue sharing types of arrangements, adherence to contract covenants and other risk mitigation requirements and numerous other reviews and procedures to assist our clients with proper monitoring and enforcement of the obligations of their contractors. For some services we provide, such as certain of our services in our Adjacent Services segment, we earn our compensation in the form of a fixed fee, a fee per hour, or a fee per other unit of service.
We earn the vast majority of our recovery audit revenue from clients in the retail industry due to many factors, including the high volume of transactions and the complicated pricing and allowance programs typical in this industry. Changes in consumer spending associated with economic fluctuations generally impact our recovery audit revenue to a lesser degree than they affect individual retailers due to several factors, including:
• | Diverse client base – our clients include a diverse mix of discounters, grocery, pharmacy, department and other stores that tend to be impacted to varying degrees by general economic fluctuations, and even in opposite directions from each other depending on their position in the market and their market segment; |
• | Motivation – when our clients experience a downturn, they frequently are more motivated to use our services to recover prior overpayments to make up for relatively weaker financial performance in their own business operations; |
• | Nature of claims – the relationship between the dollar amount of recovery audit claims identified and client purchases is non-linear. Claim volumes are generally impacted by purchase volumes, but a number of other factors may have an even more significant impact on claim volumes, including new items being purchased, changes in discount, rebate, marketing allowance and similar programs offered by vendors and changes in a client’s or a vendor’s information processing systems; and |
• | Timing – the client purchase data on which we perform our recovery audit services is historical data that typically reflects transactions between our clients and their vendors that took place 3 to 15 months prior to the data being provided to us for audit. As a result, we generally experience a delayed impact from economic changes that varies by client and the impact may be positive or negative depending on the individual clients’ circumstances. |
While the net impact of the economic environment on our recovery audit revenue is difficult to determine or predict, we believe that for the foreseeable future, our revenue will remain at a level that will not have a significant adverse impact on our liquidity, and we have taken steps to mitigate the adverse impact of an economic downturn on our revenue and overall financial health. These steps include devoting substantial efforts to develop an improved service delivery model to enable us to more cost effectively serve our clients. Further, we continue to pursue our ongoing growth strategy to expand our business beyond our core recovery audit services to retailers by growing the portion of our business that provides recovery audit services to enterprises other than retailers, such as our offerings to commercial clients; contract compliance service offerings; expansion into new industry verticals, such as oil and gas; and growth within our Adjacent Services segment.
As our clients’ data volumes and complexity levels continue to grow, we are using our deep data management experience to develop new actionable insight solutions, as well as to develop custom analytics and data transformation services. Taken
20
together, our deep understanding of our clients’ procure-to-pay data and our technology-based solutions provide multiple routes to help our clients achieve greater profitability. Our Adjacent Services business targets client functional and process areas where we have established expertise, enabling us to provide services to finance, merchandising and procurement executives to improve working capital, optimize purchasing leverage in vendor pricing negotiations, improve insight into product margin and true cost of goods for resale, identify and manage risks associated with vendor compliance, improve quality of vendor master data and improve visibility and diagnostics of direct and indirect spend. Our Adjacent Services include our global SIM services offering, as well as CSI.
Discontinued Operations
As of December 31, 2015, the Company discontinued its HCRA business. PRGX entered into agreements with third parties to fulfill its Medicare RAC program subcontract obligations to audit Medicare payments and provide support for claims appeals and assigned its remaining Medicaid contract to another party. The Company will continue to incur certain expenses while the current Medicare RAC contracts are still in effect. The discussions and financial results in Item 7 have been adjusted to reflect the discontinued business.
Non-GAAP Financial Measures
EBIT, EBITDA and Adjusted EBITDA are all “non-GAAP financial measures” presented as supplemental measures of the Company’s performance. They are not presented in accordance with accounting principles generally accepted in the United States, or GAAP. The Company believes these measures provide additional meaningful information in evaluating its performance over time, and that the rating agencies and a number of lenders use EBITDA and similar measures for similar purposes. In addition, a measure similar to Adjusted EBITDA is used in the restrictive covenants contained in the Company’s secured credit facility. However, EBIT, EBITDA and Adjusted EBITDA have limitations as analytical tools, and you should not consider them in isolation, or as substitutes for analysis of the Company’s results as reported under GAAP. In addition, in evaluating EBIT, EBITDA and Adjusted EBITDA, you should be aware that, as described above, the adjustments may vary from period to period and in the future the Company will incur expenses such as those used in calculating these measures. The Company’s presentation of these measures should not be construed as an inference that future results will be unaffected by unusual or nonrecurring items.
21
Results of Operations from Continuing Operations
The following table sets forth the percentage of revenue represented by certain items in our Consolidated Statements of Operations from continuing operations for the periods indicated:
Years Ended December 31, | |||||||||
2015 | 2014 | 2013 | |||||||
Revenue, net | 100.0 | % | 100.0 | % | 100.0 | % | |||
Operating expenses: | |||||||||
Cost of revenue | 67.4 | 68.6 | 63.3 | ||||||
Selling, general and administrative expenses | 23.3 | 23.9 | 25.9 | ||||||
Depreciation of property and equipment | 3.8 | 3.7 | 3.8 | ||||||
Amortization of intangible assets | 1.8 | 2.2 | 2.7 | ||||||
Impairment charges | — | (0.1 | ) | 1.6 | |||||
Total operating expenses | 96.3 | 98.3 | 97.3 | ||||||
Operating income from continuing operations | 3.7 | 1.7 | 2.7 | ||||||
Foreign currency transaction (gains) losses on short-term intercompany balances | 1.6 | 1.2 | — | ||||||
Interest expense, net | (0.1 | ) | — | — | |||||
Income (loss) before income taxes from continuing operations | 2.2 | 0.5 | 2.7 | ||||||
Income tax expense | 0.3 | 2.0 | 1.5 | ||||||
Net income (loss) from continuing operations | 1.9 | % | (1.5 | )% | 1.2 | % | |||
Year Ended December 31, 2015 Compared to Prior Years from Continuing Operations
Revenue. Revenue was as follows (in thousands):
Years Ended December 31, | ||||||||||||
2015 | 2014 | 2013 | ||||||||||
Recovery Audit Services – Americas | $ | 97,009 | $ | 106,533 | $ | 118,649 | ||||||
Recovery Audit Services – Europe/Asia-Pacific | 36,264 | 44,319 | 46,436 | |||||||||
Adjacent Services | 5,029 | 10,700 | 13,183 | |||||||||
Total | $ | 138,302 | $ | 161,552 | $ | 178,268 | ||||||
Total revenue decreased by $23.3 million, or 14.4%, in 2015, and decreased $16.7 million, or 9.4%, in 2014. Below is a discussion of our revenue for our three reportable segments.
Recovery Audit Services – Americas revenue decreased by 8.9% in 2015 and decreased by 10.2% in 2014. We experience changes in our reported revenue based on the strength of the U.S. dollar relative to foreign currencies. Changes in the value of the U.S. dollar relative to currencies in Canada and Latin America negatively impacted reported revenue in both 2015 and 2014. On a constant dollar basis, adjusted for changes in foreign exchange (“FX”) rates, 2015 revenue decreased by 5.4% compared to a decrease of 8.9% as reported, and 2014 revenue decreased by 8.6% compared to a decrease of 10.2% as reported.
The changes in our Recovery Audit Services – Americas revenue in 2015 and 2014 were due to a number of factors in addition to changes in FX rates. Revenue increased 5.3% in 2015 and 2.7% in 2014 due to revenue from new clients. Revenue from existing clients decreased 13.8% in 2015 and 12.9% in 2014. The revenue decreases in both 2015 and 2014 were due primarily to lower revenue from a significant retail client that has increased its internal resources and is identifying more claims itself, scope restrictions at another significant client, and lower contingency fee rates at a few clients.
Recovery Audit Services – Europe/Asia-Pacific revenue decreased by 18.2% in 2015 and decreased by 4.6% in 2014. The changes in the strength of the U.S. dollar relative to foreign currencies in Europe, Asia and the Pacific region negatively impacted reported revenue in 2015, but positively impacted reported revenue in 2014. On a constant dollar basis, adjusted for
22
changes in FX rates, 2015 revenue decreased by 7.6% compared to a decrease of 18.2% as reported, and 2014 revenue decreased by 5.3% compared to a decrease of 4.6% as reported. Revenue increased 3.5% in 2015 and 3.5% in 2014 due to new clients. Revenue from existing clients decreased 21.7% in 2015 and decreased 7.9% in 2014. The 2015 revenue decrease is due primarily to lower revenue from various retail clients in Europe as a result of UK grocery specific regulatory enforcement activities resulting in tighter restrictions on the age of transactions being audited and claim deduction policies and practices. Revenue in 2015 was also adversely impacted by scope restrictions and lower contingency fee rates at a few clients. Partially offsetting these declines was an increase in revenue in the Asia-Pacific region. The 2014 revenue decrease is due primarily to lower revenue from various retail clients in Europe as a result of scope restrictions and lower contingency fee rates at a few clients, partially offset by an increase in revenue in the Asia-Pacific region.
In our Adjacent Services segment, during 2015 we were able to dispose of or wind down service offerings which were unprofitable and did not fit our long-term strategy. Adjacent Services revenue decreased by 53.0% in 2015 and decreased by 18.8% in 2014. After eliminating revenue from the Chicago, Illinois-based consulting practice that was sold during the fourth quarter of 2014, the 2015 revenue decreased from 2014 by approximately 20%. This remaining decrease in revenue primarily resulted from a slower than planned ramp up of our spend analytics business during the second half of 2015, partially offset by an increase in our SIM revenue. The decline in revenue from 2013 to 2014 is primarily due to a weak backlog of projects at the beginning of each year as well as our strategic decision to wind-down certain service offerings and refocus on other growth opportunities in this segment that are more closely aligned with the recovery audit business.
Cost of Revenue (“COR”). COR consists principally of commissions and other forms of variable compensation we pay to our auditors based primarily on the level of overpayment recoveries and/or profit margins derived therefrom, fixed auditor salaries, compensation paid to various types of hourly support staff and salaries for operational and client service managers for our recovery audit services and our Adjacent Services businesses. COR also includes other direct and indirect costs incurred by these personnel, including office rent, travel and entertainment, telephone, utilities, maintenance and supplies and clerical assistance. A significant number of the components comprising COR are variable and will increase or decrease with increases or decreases in revenue.
COR was as follows (in thousands):
Years Ended December 31, | ||||||||||||
2015 | 2014 | 2013 | ||||||||||
Recovery Audit Services – Americas | $ | 60,214 | $ | 68,163 | $ | 65,977 | ||||||
Recovery Audit Services – Europe/Asia-Pacific | 25,424 | 31,103 | 34,945 | |||||||||
Adjacent Services | 7,531 | 11,624 | 11,931 | |||||||||
Total | $ | 93,169 | $ | 110,890 | $ | 112,853 | ||||||
COR as a percentage of revenue for Recovery Audit Services – Americas was 62.1% in 2015, 64.0% in 2014 and 55.6% in 2013. We continue to invest in our various growth and other strategic initiatives, and include portions of these costs in Recovery Audit Services – Americas COR each year. The reduction in COR expenses as a percentage of revenue for 2015 compared to 2014 is due to cost reductions implemented in late 2014 and early 2015, the continued focus on strengthening our operational processes, as well as a $0.7 million reduction in transformation expenses when compared to 2014. The increase in COR expenses as a percentage of revenue for 2014 compared to 2013 is due to costs not decreasing in proportion to decreases in revenue, and the cost of personnel we added to extend our service offerings into new areas, such as contract compliance, and to expand into new industry verticals. In addition, there was an increase of $0.8 million in transformation expenses in 2014 compared to 2013. These transformation expenses were generated mainly in the fourth quarter of 2014.
COR as a percentage of revenue for Recovery Audit Services – Europe/Asia-Pacific was 70.1% in 2015, 70.2% in 2014 and 75.3% in 2013. COR decreased 18.3% in 2015 compared to 2014 and 11.0% in 2014 compared to 2013. The 2015 and 2014 decreases are due mainly to reductions in compensation-related costs that vary with revenue. In addition, our continuing efforts to increase revenue and centralize and standardize the recovery audit processes in this segment enabled us to lower our COR as a percentage of revenue in this segment in 2015 and 2014.
The higher COR as a percentage of revenue for Recovery Audit Services – Europe/Asia-Pacific (70.1% for 2015) compared to Recovery Audit Services – Americas (62.1% for 2015) is due primarily to differences in service delivery models, scale and geographic fragmentation. The Recovery Audit Services – Europe/Asia-Pacific segment generally serves fewer clients in each geographic market and generates lower average revenue per client than those served by the Recovery Audit Services – Americas segment.
23
Adjacent Services COR relates primarily to our continued investments in service delivery, which consist mainly of fixed personnel costs. Due to the nature of these costs and the reduced Adjacent Services revenue, COR as a percentage of revenue increased to 149.8% in 2015 from 108.6% in 2014 and 90.5% in 2013.
Selling, General and Administrative Expenses (“SG&A”). SG&A expenses for all segments other than Corporate Support include the expenses of sales and marketing activities, information technology services and allocated corporate data center costs, human resources, legal, accounting, administration, foreign currency transaction gains and losses other than those relating to short-term intercompany balances and gains and losses on asset disposals. Corporate Support SG&A represents the unallocated portion of SG&A expenses which are not specifically attributable to our segment activities and include the expenses of information technology services, the corporate data center, human resources, legal, accounting, treasury, administration and stock-based compensation charges.
SG&A expenses were as follows (in thousands):
Years Ended December 31, | ||||||||||||
2015 | 2014 | 2013 | ||||||||||
Recovery Audit Services – Americas | $ | 7,685 | $ | 10,211 | $ | 14,140 | ||||||
Recovery Audit Services – Europe/Asia-Pacific | 5,487 | 6,829 | 5,884 | |||||||||
Adjacent Services | 662 | 2,124 | 3,312 | |||||||||
Subtotal for reportable segments | 13,834 | 19,164 | 23,336 | |||||||||
Corporate Support | 18,450 | 19,417 | 22,807 | |||||||||
Total | $ | 32,284 | $ | 38,581 | $ | 46,143 | ||||||
Recovery Audit Services – Americas SG&A decreased 24.7% in 2015 compared to 2014 and decreased 27.8% in 2014 compared to 2013. The decrease in 2015 is due primarily to lower personnel costs. The decrease in 2014 is due primarily to lower personnel costs and contingent consideration recorded in 2013 for the Business Strategy, Inc. acquisition that did not reoccur during 2014.
Recovery Audit Services – Europe/Asia-Pacific SG&A decreased 19.7% in 2015 compared to 2014 after increasing 16.1% in 2014 compared to 2013. The decrease in 2015 is due mainly to lower transformation and facilities costs. The 2014 increase resulted primarily from increased transformation costs in 2014, the reversal of bad debt provisions in 2013 and fair value adjustments recorded in 2013 to reduce the acquisition-related contingent consideration for a prior year business acquisition.
Adjacent Services SG&A decreased 68.8% in 2015 compared to 2014 and 35.9% in 2014 compared to 2013. The 2015 decrease resulted primarily from reduced transformation and facilities costs. The 2014 decrease resulted primarily from personnel reductions that were made in response to the decline in revenue and the strategic decision to dispose of our Chicago, Illinois-based consulting business during the fourth quarter of 2014.
Corporate Support SG&A includes stock-based compensation charges of $3.9 million in 2015, $4.5 million in 2014 and $6.3 million in 2013. Excluding stock-based compensation charges, Corporate Support SG&A decreased 2.4% in 2015 compared to 2014 and 9.9% in 2014 compared to 2013. The decrease in 2015 compared to 2014 reflects our focus on controlling our expenses. The decrease in 2014 compared to 2013 relates primarily to severance costs recorded in 2013 that were associated with the departure of the Company's former President and CEO.
Depreciation of Property and Equipment. Depreciation of property and equipment was as follows (in thousands):
Years Ended December 31, | ||||||||||||
2015 | 2014 | 2013 | ||||||||||
Recovery Audit Services – Americas | $ | 4,036 | $ | 4,711 | $ | 5,617 | ||||||
Recovery Audit Services – Europe/Asia-Pacific | 647 | 592 | 514 | |||||||||
Adjacent Services | 634 | 722 | 652 | |||||||||
Total | $ | 5,317 | $ | 6,025 | $ | 6,783 | ||||||
24
Depreciation expense declined in 2015 and 2014 primarily as a result of the impairment charges recorded in the fourth quarter of 2013, which reduced the future depreciation to be recorded.
Amortization of Intangible Assets. Amortization of intangible assets was as follows (in thousands):
Years Ended December 31, | ||||||||||||
2015 | 2014 | 2013 | ||||||||||
Recovery Audit Services – Americas | $ | 1,728 | $ | 2,002 | $ | 2,792 | ||||||
Recovery Audit Services – Europe/Asia-Pacific | 600 | 1,195 | 1,508 | |||||||||
Adjacent Services | 130 | 334 | 697 | |||||||||
Total | $ | 2,458 | $ | 3,531 | $ | 4,997 | ||||||
Generally, we amortize the customer relationship and trademark intangible assets we record in connection with an acquisition on an accelerated basis over six years or longer, and we amortize non-compete agreements and trade names on a straight-line basis over five years or less. This methodology results in higher amortization immediately following an acquisition, and declining expense in subsequent periods. Our most recent acquisitions include the SIM services business acquired from Global Edge, LLC and certain affiliated companies (collectively, "Global Edge") in December 2015, Business Strategy, Inc. and substantially all the assets of an affiliated company (collectively, "BSI") in Recovery Audit Services – Americas in December 2011, the associate migrations in Recovery Audit Services – Europe / Asia-Pacific in 2011 and 2012, and Etesius Limited and TJG Holdings LLC in Adjacent Services in 2010. Amortization expense declined in our recovery audit segments in 2015 and 2014 compared to the prior year as we did not complete a material acquisition in these segments in either year. Similarly, Adjacent Services amortization declined in both 2015 and 2014 compared to the prior year as we have not completed a significant acquisition in this segment since 2010. We anticipate that, unless we complete additional significant acquisitions in any of our reportable segments in 2016, amortization expense will continue to decrease in 2016.
Impairment Charges. Impairment charges were as follows (in thousands):
Years Ended December 31, | ||||||||||||
2015 | 2014 | 2013 | ||||||||||
Recovery Audit Services – Americas | $ | — | $ | — | $ | 2,702 | ||||||
Recovery Audit Services – Europe/Asia-Pacific | — | — | — | |||||||||
Adjacent Services | — | — | 71 | |||||||||
Total | $ | — | $ | — | $ | 2,773 | ||||||
The impairment charges in the Recovery Audit Services - Americas segment in 2013 relate to certain capitalized software development costs associated with our improved service delivery model. Much of the development efforts in this area were beneficial, but certain aspects of the development did not yield the benefits anticipated. We continue to develop this service delivery model, but have changed our focus in certain areas and no longer expect to receive future economic benefit from certain costs and recorded an impairment charge in the fourth quarter of 2013.
Foreign Currency Transaction (Gains) Losses on Short-Term Intercompany Balances. Foreign currency transaction gains and losses on short-term intercompany balances result from fluctuations in the exchange rates between foreign currencies and the U.S. dollar and the impact of these fluctuations, primarily on balances payable by our foreign subsidiaries to their U.S. parent. Substantial changes from period to period in foreign currency exchange rates may significantly impact the amount of such gains and losses. The strengthening of the U.S. dollar relative to other currencies results in recorded losses on short-term intercompany balances receivable from our foreign subsidiaries while the relative weakening of the U.S. dollar results in recorded gains.
The U.S. dollar generally strengthened relative to the local currencies of certain of our foreign subsidiaries in 2015 and 2014 resulting in our recording net foreign currency losses on short-term intercompany balances of $2.2 million and $2.0 million respectively. We recorded gains on short-term intercompany balances of less than $0.1 million in 2013.
Net Interest Expense (Income). Net interest income was $0.2 million in 2015 and $0.1 million in each of 2014 and 2013 due to reductions in interest accruals on uncertain tax positions.
25
Income Tax Expense. Our reported effective tax rates on earnings approximated 19.3% in 2015, 598.0% in 2014, and 57.3% in 2013. Reported income tax expense in each year primarily results from taxes on the income of foreign subsidiaries. We have recorded a deferred tax asset valuation allowance that effectively eliminates income tax expense or benefit relating to our U.S. operations. The tax rate for 2015 reflects the impact of recognizing benefit for certain deferred tax assets in Australia. The tax rate for 2014 reflects the impact of the recording of a valuation allowance against certain deferred tax assets in the United Kingdom. The tax rate in 2013 is due to the Company's U.S. operations incurring a loss due in part to the impairment charges noted above, while certain foreign subsidiaries generated greater taxable income in 2013. The effective tax rates noted above exclude discontinued operations in the current and prior years.
Together with the reversal of interest expense accruals described above, the total net reduction to our reserves for uncertain tax positions based on changes in accruals was $0.2 million in 2015, $0.1 million in 2014, and $1.4 million in 2013. These reserves decreased in 2013 by an additional $1.3 million due to payments we made to various taxing authorities. We initially established these reserves based on estimates we made in prior years of the potential liability we may incur should certain domestic and foreign tax jurisdictions perform audits of our books and records and determine that we owe additional taxes, for which they may also assess penalty and interest amounts. We increased the reserves for additional estimated interest in subsequent years to reflect the additional time from when the estimated potential taxes may have been due. In 2013, we adjusted our estimates based primarily on completing voluntary disclosure processes with a number of states. Under these voluntary disclosure agreements, we agreed to file required returns for specified periods, and received waivers of the requirement to file other returns as well as limitations on the taxes and other amounts required to be paid in connection with such filings.
As of the end of the past three years, management determined that based on all available evidence, deferred tax asset valuation allowances of $45.6 million in 2015, $52.0 million in 2014 and $48.5 million in 2013 were appropriate. We recorded an increase in the valuation allowance of $2.3 million in 2014 as a result of placing a valuation allowance against deferred tax assets in the United Kingdom.
As of December 31, 2015, we had approximately $91.1 million of U.S. federal loss carry-forwards available to reduce future U.S. federal taxable income. The U.S. federal loss carry-forwards expire through 2034. As of December 31, 2015, we had approximately $139.2 million of state loss carry-forwards available to reduce future state taxable income. The state loss carry-forwards expire to varying degrees between 2020 and 2034 and are subject to certain limitations. The state loss carry-forwards at December 31, 2015, reflect adjustments for prior period write-downs associated with ownership changes for state purposes.
On March 17, 2006, the Company experienced an ownership change as defined under Section 382 of the Internal Revenue Code (“IRC”). This ownership change resulted in an annual IRC Section 382 limitation that limits the use of certain tax attribute carry-forwards and also resulted in the write-off of certain deferred tax assets and the related valuation allowances that the Company recorded in 2006. Of the $91.1 million of U.S. federal loss carry-forwards available to the Company, $13.8 million of the loss carry-forwards are subject to an annual usage limitation of $1.4 million. The Company has reviewed subsequent potential ownership changes as defined under Section 382 and has determined that on August 4, 2008, the Company experienced an additional ownership change. This subsequent ownership change did not decrease the original limitation nor did it impact the Company’s financial position, results of operations, or cash flows.
Adjusted EBITDA. We evaluate the performance of our operating segments based upon revenue and measures of profit or loss we refer to as EBITDA and Adjusted EBITDA. We define Adjusted EBITDA as earnings from continuing operations before interest and taxes (“EBIT”), adjusted for depreciation and amortization (“EBITDA”), and then adjusted for unusual and other significant items that management views as distorting the operating results of the various segments from period to period. Such adjustments include restructuring charges, stock-based compensation, bargain purchase gains, acquisition-related charges and benefits (acquisition transaction costs, acquisition obligations classified as compensation, and fair value adjustments to acquisition-related contingent consideration), tangible and intangible asset impairment charges, certain litigation costs and litigation settlements, severance charges and foreign currency transaction gains and losses on short-term intercompany balances viewed by management as individually or collectively significant.
26
Reconciliations of consolidated net loss to each of EBIT, EBITDA and Adjusted EBITDA for the periods included in this report are as follows (in thousands):
Years Ended December 31, | ||||||||||||
2015 | 2014 | 2013 | ||||||||||
Net loss | $ | (3,226 | ) | $ | (7,526 | ) | $ | (186 | ) | |||
Income tax expense | 369 | 3,241 | 2,755 | |||||||||
Interest income, net | (190 | ) | (77 | ) | (77 | ) | ||||||
EBIT | (3,047 | ) | (4,362 | ) | 2,492 | |||||||
Depreciation of property and equipment | 5,352 | 6,216 | 8,231 | |||||||||
Amortization of intangible assets | 2,458 | 3,531 | 4,997 | |||||||||
EBITDA | 4,763 | 5,385 | 15,720 | |||||||||
Impairment charges | — | — | 4,207 | |||||||||
Foreign currency transaction (gains) losses on short-term intercompany balances | 2,165 | 2,003 | (13 | ) | ||||||||
Acquisition-related charges | — | 249 | 602 | |||||||||
Transformation severance and related expenses | 2,299 | 4,050 | 2,544 | |||||||||
Other loss | 1,191 | 57 | — | |||||||||
Stock-based compensation | 3,926 | 4,532 | 6,294 | |||||||||
Adjusted EBITDA | $ | 14,344 | $ | 16,276 | $ | 29,354 | ||||||
Acquisition-related charges included: acquisition obligations classified as compensation of $0.2 million in both 2014 and 2013; and a fair value adjustment to acquisition-related contingent consideration of $0.4 million in 2013. We made the final payments for the related acquisitions in the third quarter of 2014.
Transformation severance and related expenses decreased $1.8 million or 43.2% in 2015 compared to 2014 due to reduced restructuring activities in 2015. These costs increased $1.5 million, or 59.2%, in 2014 compared to 2013 due to severance and related costs associated with reductions in staff and lease expense across all segments in order to reduce our cost structure.
Stock-based compensation decreased $0.6 million, or 13.4%, in 2015 compared to 2014 and decreased by $1.8 million, or 28.0%, in 2014 compared to 2013. The reduced expenses in 2015 compared to 2014 were due primarily to the completion of the expense recognition period for prior year grants that exceeded the recognized expense for new grants in 2015. The reduced expenses in 2014 compared to 2013 were due primarily to the acceleration of vesting of outstanding awards for certain executives in connection with their separation from the Company in the prior periods as well as the relatively lower fair value of options and stock awards granted as part of the annual equity grant to employees in 2014.
We include a detailed calculation of Adjusted EBITDA by segment in Note 2 of “Notes to Consolidated Financial Statements” included in Item 8 of this Form 10-K. A summary of Adjusted EBITDA by segment for the years ended December 31, 2015, 2014, and 2013 was as follows (in thousands):
Years Ended December 31, | ||||||||||||
2015 | 2014 | 2013 | ||||||||||
Recovery Audit Services – Americas | $ | 29,431 | $ | 29,507 | $ | 39,954 | ||||||
Recovery Audit Services – Europe/Asia-Pacific | 5,942 | 7,672 | 5,842 | |||||||||
Adjacent Services | (3,134 | ) | (2,381 | ) | (1,792 | ) | ||||||
Subtotal for reportable segments | 32,239 | 34,798 | 44,004 | |||||||||
Corporate Support | (14,215 | ) | (14,296 | ) | (15,379 | ) | ||||||
Total for continuing operations | $ | 18,024 | $ | 20,502 | $ | 28,625 | ||||||
Recovery Audit Services – Americas Adjusted EBITDA decreased by $0.1 million, or 0.3%, in 2015 compared to 2014 and decreased $10.4 million, or 26.1%, in 2014 compared to 2013. The 2014 decrease resulted from reductions in revenue that exceeded the reductions in COR and SG&A expenses for the year.
27
Recovery Audit Services – Europe/Asia-Pacific Adjusted EBITDA decreased by $1.7 million, or 22.5%, in 2015 compared to 2014 and increased $1.8 million, or 31.3%, in 2014 compared to 2013. The decrease in 2015 is due to lower revenue partially offset by lower COR and SG&A expenses. The increase in 2014 is due to reductions in COR and SG&A that exceeded the revenue reductions for the year.
Adjacent Services Adjusted EBITDA declined 31.6% to a loss of $(3.1) million in 2015 compared to 2014, and declined 32.8% to a loss of $(2.4) million in 2014 compared to 2013. These declines are due to revenue in each period declining at a faster rate than COR and SG&A expenses.
Corporate Support Adjusted EBITDA improved by $0.1 million, or 0.6%, in 2015 compared to 2014 and improved by $1.1 million, or 7.0%, in 2014 compared to 2013. The improvement in 2014 is due mainly to a reduction in transformation-related expense.
Liquidity and Capital Resources
As of December 31, 2015, we had $15.1 million in cash and cash equivalents and no borrowings under the revolver portion of our credit facility. As of December 31, 2015, the revolver had $20.0 million of availability for borrowings and the Company was in compliance with the covenants in its SunTrust credit facility. We amended the SunTrust credit facility in January 2014 and again in December 2014 as further described in Secured Credit Facility below.
The $15.1 million in cash and cash equivalents includes $4.7 million held in the U.S., $2.8 million held in Canada, and $7.6 million held in other foreign jurisdictions, primarily in the United Kingdom, Australia, India, and Brazil. Certain foreign jurisdictions restrict the amount of cash that can be transferred to the U.S. or impose taxes and penalties on such transfers of cash. To the extent we have excess cash in foreign locations that could be used in, or is needed by, our operations in the U.S., we may incur significant penalties and/or taxes to repatriate these funds. Generally, we have not provided deferred taxes on the undistributed earnings of international subsidiaries as we consider these earnings to be permanently reinvested. However, we do not consider the earnings of our Canadian subsidiary to be permanently invested, and have provided deferred taxes relating to the potential repatriation of the funds held in Canada.
Operating Activities. Net cash provided by operating activities was $13.5 million in 2015, $10.0 million in 2014 and $18.4 million in 2013. These amounts consist of two components, specifically, net income (loss) adjusted for certain non-cash items (such as depreciation, amortization, stock-based compensation expense, impairment charges, and deferred income taxes) and changes in assets and liabilities, primarily working capital, as follows (in thousands):
Years Ended December 31, | ||||||||||||
2015 | 2014 | 2013 | ||||||||||
Net income (loss) | $ | (3,226 | ) | $ | (7,526 | ) | $ | (186 | ) | |||
Adjustments for certain non-cash items | 15,112 | 16,443 | 23,909 | |||||||||
11,886 | 8,917 | 23,723 | ||||||||||
Changes in operating assets and liabilities | 1,567 | 1,130 | (5,299 | ) | ||||||||
Net cash provided by operating activities | $ | 13,453 | $ | 10,047 | $ | 18,424 | ||||||
The increase in net cash provided by operating activities in 2015 compared to 2014 is primarily attributable to the improvement in working capital resulting from a decrease of $5.6 million in accounts receivable partially offset by a $3.7 million decrease in accounts payable, accrued payroll and other accrued expenses. The decrease in net cash provided by operating activities in 2014 compared to 2013 is primarily attributable to the decrease in operating income excluding non-cash expenses. Operating income excluding non-cash expenses (depreciation, amortization and impairment charges) was $10.5 million in 2014 compared to 2013 which is mainly attributable to the $31.0 million decrease in revenue partially offset by an $18.6 million decrease in COR and SG&A expenses and $2.0 million of foreign currency losses. This use of cash from operations was partially offset by a $0.4 million reduction in our working capital. Receivables and current asset balances were reduced $2.5 million in 2014 compared to 2013 primarily due to lower revenue and the collection of Medicare RAC program receivables. In addition, our accrued liabilities decreased by approximately $2.9 million in 2014 compared to 2013. The reduced receivable collections in 2014 compared to 2013 were more than offset by smaller reductions in accrued liability balances, particularly compensation related accruals.
We include an itemization of these changes in our Consolidated Statements of Cash Flows included in Part II, Item 8 of this Form 10-K.
28
No client has accounted for 10% or more of our annual revenue in any of the past three years. The loss of any one of our major clients would negatively impact our operating cash flows and would potentially have a material adverse impact on the Company’s liquidity.
Investing Activities. Net cash used for capital expenditures was $4.5 million in 2015, $4.7 million in 2014 and $7.9 million in 2013. These capital expenditures primarily related to investments we made to upgrade our information technology infrastructure, develop our proprietary audit tools and develop software relating to Adjacent Services.
Capital expenditures are discretionary and we currently expect to continue to make capital expenditures to enhance our information technology infrastructure and proprietary audit tools in 2016. Should we experience changes in our operating results, we may alter our capital expenditure plans.
Business Acquisitions and Divestitures
We made several business acquisitions over the past few years, each of which is discussed more fully in Note 12 – Business Acquisitions and Divestitures in “Notes to Consolidated Financial Statements” in Part II, Item 8 of this Form 10-K. Following is a summary of recent business acquisition and divestiture activities impacting our liquidity and capital resources in the past three years.
In July 2009, we acquired the business and certain assets of First Audit Partners LLP (“FAP”), a privately-held European provider of recovery audit services based in Cambridge, United Kingdom, for a purchase price valued at $5.8 million. The purchase price included an initial cash payment of $1.6 million that we paid in July 2009. We made the first of two deferred payments required as part of the FAP acquisition in January 2010 in the amount of £0.5 million ($0.8 million) and the second payment of £0.8 million ($1.3 million) in July 2010. Additional variable consideration potentially was due based on the operating results generated by the acquired business over a four year period from the date of acquisition. From the acquisition date to December 31, 2013, we paid £1.1 million ($1.7 million) of the earn-out and recorded accretion and other adjustments of the liability that resulted in a net decrease of $0.4 million. There were no remaining amounts payable relating to this acquisition as of December 31, 2013.
In February 2010, we acquired all of the issued and outstanding capital stock of Etesius Limited, a privately-held European provider of purchasing and payables technologies and spend analytics based in Chelmsford, United Kingdom for a purchase price valued at $3.1 million. The purchase price included an initial cash payment of $2.8 million and a $0.3 million payment for obligations on behalf of Etesius shareholders that we paid in February 2010 as well as deferred payments of $1.2 million over four years from the date of the acquisition. We also were potentially required to make additional payments of up to $3.8 million over a four-year period if the financial performance of this service line met certain targets. These payments would be to Etesius employees that we hired in connection with the acquisition. We were not obligated to make the deferred and earn-out payments to these employees if they resigned or were terminated under certain circumstances. We therefore recognized the accrual of the deferred payments as compensation expense. From the acquisition date to December 31, 2014, we paid $1.4 million of deferred payments and variable consideration. This amount included the final $0.7 million of deferred payments paid in February 2014 and the final payment of $0.2 million of variable consideration paid in August 2014.
In November 2010, we acquired the business and certain assets of TJG Holdings LLC (“TJG”), a privately-held provider of finance and procurement operations improvement services based in Chicago, Illinois for a purchase price valued at $3.7 million. The purchase price included an initial cash payment of $2.3 million that we paid in November 2010. Additional payments of up to a maximum of $1.9 million potentially were due to the sellers in four semi-annual payments if certain performance targets were met. We recorded $1.4 million as the estimated fair value of these payments at the acquisition date. From the acquisition date to December 31, 2013, we paid $1.9 million of the earn-out and recorded accretion and other adjustments of the liability of $0.5 million. There were no remaining amounts payable relating to this acquisition as of December 31, 2013.
In December 2011, we acquired BSI, based in Grand Rapids, Michigan, for a purchase price valued at $11.9 million. BSI was a provider of recovery audit and related procure-to-pay process improvement services for commercial clients, and a provider of customized software solutions and outsourcing solutions to improve back office payment processes. The purchase price included an initial cash payment of $2.8 million and 640,614 shares of our common stock having a value of $3.7 million. An additional payment of approximately $0.7 million was made in the first half of 2012 for working capital received in excess of a specified minimum level. Additional variable consideration of up to $5.5 million, payable via a combination of cash and shares of our common stock, potentially was due based on the performance of the acquired businesses over a two year period from the date of acquisition. We also could have been required to pay additional consideration of up to $8.0 million, payable in cash over a period of two years, based on certain net cash fee receipts from a particular recovery audit claim at a specific client. We recorded an additional $4.9 million payable at the acquisition date based on management’s estimate of the fair value of the variable consideration payable. From the acquisition date to December 31, 2014, we paid $6.3 million of the earn-out liability
29
consisting of cash payments of $3.6 million and 404,775 shares of our common stock having a value of $2.7 million. We also recorded accretion and other adjustments of the earn-out liability of $1.4 million. There was no remaining earn-out payable as of December 31, 2014.
We also acquired the assets of several third-party audit firms to which we had subcontracted a portion of our audit services in our Recovery Audit Services – Europe/Asia-Pacific segment. These 2012 associate migrations included CRC Management Consultants LLP (“CRC”) in January 2012 for a purchase price valued at $1.0 million; QFS Ltd (“QFS”) in June 2012 for a purchase price valued at $0.4 million; and Nordic Profit Provider AB (“NPP”) in November 2012 for a purchase price valued at $0.1 million.
In December 2015, we acquired the SIM business from Global Edge for a purchase price valued at $0.7 million. The Global Edge SIM platform includes vendor master file cleanse, regulatory and sanction checks, supplier onboarding, vendor authentication and risk management services. By leveraging the Global Edge platform, we expect to provide greater value to companies who are increasingly challenged to manage supplier information and compliance risks. The purchase price included an initial cash payment of $0.5 million and additional variable cash consideration based on the performance of the acquired businesses over a two year period from the date of acquisition valued at $0.2 million.
We did not complete a business acquisition in the years ended December 31, 2014 and 2013.
In October 2014, we divested certain assets within our Adjacent Services segment that were related to our Chicago, Illinois-based consulting business. These assets, related to the assets previously acquired in November 2010 from TJG Holdings LLC, were sold to Salo, LLC, a Minnesota limited liability company. We received an initial cash payment of $1.1 million in connection with the closing of the transaction and recognized a loss on the sale of less than $0.1 million, which we recognized in Other loss in the Consolidated Statements of Operations. We have also received payment for working capital transferred to the buyer. In addition, we received $0.7 million in earn-out payments based on certain revenue recognized by the buyer in relation to the acquired business during the year following the closing date of the divestiture.
In August 2015, we divested certain assets from a document service offering purchased as part of the BSI acquisition in 2011.We did not receive any initial cash payments at closing of the transaction and recognized a non-cash loss on the sale of $1.6 million, which we recognized in Other loss in the Consolidated Statements of Operations. We may receive certain earn-out consideration based on a percentage of 2016 revenue recognized by the buyer from the clients transferred in connection with the disposition. The revenue sharing percentage ranges from 10% to 30% based on the type of solution or service delivered.
Financing Activities. Net cash used in financing activities was $18.4 million in 2015, $22.7 million in 2014 and $4.6 million in 2013. The net cash used in financing activities in 2015 and 2014 included $18.1 million and $22.7 million, respectively, for the repurchase of common stock (see Stock Repurchase Program below). We made a mandatory payment of $3.0 million on our term loan in 2013 and an additional final payment of $3.0 million in December 2013 that was not due until January 2014. The net cash used in financing activities in 2013 included $4.1 million of net proceeds we received from the exercise of the overallotment option for an additional 685,375 shares by the underwriters of our December 2012 public offering (see Common Stock Offering below).
Secured Credit Facility
On January 19, 2010, we entered into a four-year revolving credit and term loan agreement with SunTrust Bank (“SunTrust”). The SunTrust credit facility initially consisted of a $15.0 million committed revolving credit facility and a $15.0 million term loan. The SunTrust credit facility is guaranteed by the Company and its domestic subsidiaries and is secured by substantially all of our assets. Borrowing availability under the SunTrust revolver at December 31, 2015 was $20.0 million. We had no borrowings outstanding under the SunTrust revolver as of December 31, 2015. The SunTrust term loan required quarterly principal payments of $0.8 million from March 2010 through December 2013, and a final principal payment of $3.0 million in January 2014 that we paid in December 2013.
On January 17, 2014, we entered into an amendment of the SunTrust credit facility that increased the committed credit facility from $15.0 million to $25.0 million, lowered the applicable margin to a fixed rate of 1.75%, eliminated the provision limiting availability under the credit facility based on eligible accounts receivable, increased our stock repurchase program limit, and extended the scheduled maturity of the credit facility to January 16, 2015 (subject to earlier termination as provided therein). We must pay a commitment fee of 0.5% per annum, payable quarterly, on the unused portion of the $25.0 million credit facility.
On December 23, 2014, we entered into an amendment of the SunTrust credit facility that reduced the committed revolving credit facility from $25.0 million to $20.0 million. The credit facility bears interest at a rate per annum comprised of a specified index rate based on one-month LIBOR, plus an applicable margin (1.75% per annum). The index rate is determined
30
as of the first business day of each calendar month. With the provision of a fixed applicable margin of 1.75% per the amendment of the SunTrust credit facility, the interest rate that would have applied at December 31, 2015 had any borrowings been outstanding was approximately 1.99%. The credit facility includes two financial covenants (a maximum leverage ratio and a minimum fixed charge coverage ratio) that apply only if we have borrowings under the credit facility that arise or remain outstanding during the final 30 calendar days of any fiscal quarter. These financial covenants also will be tested, on a modified pro forma basis, in connection with each new borrowing under the credit facility. This amendment also extends the scheduled maturity of the revolving credit facility to December 23, 2017 and lowered the commitment fee to 0.25% per annum, payable quarterly, on the unused portion of the revolving credit facility.
The SunTrust credit facility includes customary affirmative, negative, and financial covenants binding on the Company, including delivery of financial statements and other reports, maintenance of existence, and transactions with affiliates. The negative covenants limit the ability of the Company, among other things, to incur debt, incur liens, make investments, sell assets or declare or pay dividends on its capital stock. The financial covenants included in the SunTrust credit facility, among other things, limit the amount of capital expenditures the Company can make, set forth maximum leverage and net funded debt ratios for the Company and a minimum fixed charge coverage ratio, and also require the Company to maintain minimum consolidated earnings before interest, taxes, depreciation and amortization. In addition, the SunTrust credit facility includes customary events of default. As of December 31, 2015, we had no outstanding borrowings under the SunTrust credit facility. The Company was in compliance with the covenants in its SunTrust credit facility as of December 31, 2015.
We believe that we will have sufficient borrowing capacity and cash generated from operations to fund our capital and operational needs for at least the next twelve months.
Common Stock Offering
On December 11, 2012, we closed our public offering of 6,249,234 shares of our common stock, which consisted of 2,500,000 shares sold by us and 3,749,234 shares sold by certain selling shareholders, at a price to the public of $6.39 per share. The net proceeds to us from the public offering, after deducting underwriting discounts and commissions and offering expenses, were $14.7 million. The net proceeds from the public offering were used for working capital and general corporate purposes. We did not receive any proceeds from the sale of shares by the selling shareholders. In addition, the underwriters elected to exercise an overallotment option for an additional 687,385 shares, and we completed the sale of these additional shares on January 8, 2013. The net proceeds to us from the exercise of the overallotment option, after deducting underwriting discounts and commission and offering expenses, were $4.1 million.
Stock Repurchase Program
On February 21, 2014, our Board of Directors authorized a stock repurchase program under which we could repurchase up to $10.0 million of our common stock from time to time through March 31, 2015. On March 25, 2014, our Board of Directors authorized a $10.0 million increase to the stock repurchase program, bringing the total amount of common stock that we could repurchase under the program to $20.0 million. On October 24, 2014, our Board of Directors authorized a $20.0 million increase to the stock repurchase program, increasing the total stock repurchase program to $40.0 million, and extended the duration of the program to December 31, 2015. During October 2015, our Board of Directors authorized an additional $10.0 million increase to the stock repurchase program, increasing the total stock repurchase program to $50.0 million, and extended the duration of the program to December 31, 2016. We repurchased 4,118,386 shares of our common stock during the year ended December 31, 2015 for $18.1 million. From the February 2014 announcement of the Company’s current stock repurchase program through December 31, 2015, the Company has repurchased 7.8 million shares, or 25.8%, of its common stock outstanding on the date of the original announcement of the program, for an aggregate cost of $40.9 million. These shares were retired and accounted for as a reduction to Shareholders' equity in the Consolidated Balance Sheet. Direct costs incurred to acquire the shares are included in the total cost of the shares.
The timing and amount of future repurchases, if any, will depend upon the Company’s stock price, the amount of the Company’s available cash, regulatory requirements, and other corporate considerations. The Company may initiate, suspend or discontinue purchases under the stock repurchase program at any time.
31
Contractual Obligations and Other Commitments
As discussed in “Notes to Consolidated Financial Statements” included in Item 8 of this Form 10-K, the Company has certain contractual obligations and other commitments. A summary of those commitments as of December 31, 2015 is as follows:
Payments Due by Period (in thousands) | ||||||||||||||||||||
Contractual obligations | Total | Less Than 1 Year | 1-3 Years | 3-5 Years | More Than 5 Years | |||||||||||||||
Interest and commitment fee on Secured Credit Facility (1) | $ | 99 | $ | 50 | $ | 49 | $ | — | $ | — | ||||||||||
Operating lease obligations | 14,630 | 3,883 | 5,190 | 3,903 | 1,654 | |||||||||||||||
Payments to Messrs. Cook and Toma (2) | 701 | 62 | 130 | 138 | 371 | |||||||||||||||
Severance | 1,645 | 1,645 | — | — | — | |||||||||||||||
Total | $ | 17,075 | $ | 5,640 | $ | 5,369 | $ | 4,041 | $ | 2,025 | ||||||||||
(1) | Represents the estimated commitment fee and interest due on the Secured Credit Facility using the interest rate as of December 31, 2015 and assuming no borrowings on the revolver. See Note 5 of the Notes to Consolidated Financial Statements for additional information regarding the Secured Credit Facility. |
(2) | Represents estimated reimbursements payable for healthcare costs incurred by these former executives. |
2006 Management Incentive Plan
At the annual meeting of shareholders held on August 11, 2006, the shareholders of the Company approved a proposal granting authorization to issue up to 2.1 million shares of our common stock under the 2006 Management Incentive Plan (“2006 MIP”). At Performance Unit settlement dates, participants are issued that number of shares of Company common stock equal to 60% of the number of Performance Units being settled, and are paid in cash an amount equal to 40% of the fair market value of that number of shares of common stock equal to the number of Performance Units being settled. Prior to 2012, Performance Units were only granted in 2006 and 2007, and the last of such units were settled in May 2011.
On June 19, 2012, seven senior officers of the Company were granted 154,264 Performance Units under the 2006 MIP, comprising all remaining available awards under the plan. The awards had an aggregate grant date fair value of $1.2 million and vest ratably over three years.
All Performance Units were settled prior to December 31, 2015. We recognized compensation expense of less than $0.1 million in 2015, and $0.2 million in 2014 and $0.5 million in 2013 related to these 2006 MIP Performance Unit awards. We determined the amount of compensation expense recognized on the assumption that none of the Performance Unit awards would be forfeited and recorded actual forfeitures as incurred.
Cash payments relating to MIP awards were less than $0.1 million in 2015 and $0.1 million in 2014. There was no cash payment in 2013 for the MIP awards.
Off-Balance Sheet Arrangements
As of December 31, 2015, the Company did not have any material off-balance sheet arrangements, as defined in Item 303(a)(4)(ii) of the SEC’s Regulation S-K.
Critical Accounting Policies
We describe our significant accounting policies in Note 1 of “Notes to Consolidated Financial Statements” included in Item 8 of this Form 10-K. Certain of our accounting policies are particularly important to the portrayal of our financial position and results of operations and require the application of significant judgment by management. As a result, they are subject to an inherent degree of uncertainty. We consider accounting policies that involve the use of estimates that meet both of the following criteria to be “critical” accounting policies. First, the accounting estimate requires us to make assumptions about matters that are highly uncertain at the time that the accounting estimate is made. Second, alternative estimates in the current period, or changes in the estimate that are reasonably likely in future periods, would have a material impact on the presentation of our financial condition, changes in financial condition or results of operations.
32
In addition to estimates that meet the “critical” estimate criteria, we also make many other accounting estimates in preparing our consolidated financial statements and related disclosures. All estimates, whether or not deemed critical, affect reported amounts of assets, liabilities, revenue and expenses, as well as disclosures of contingent assets and liabilities. On an on-going basis, we evaluate our estimates and judgments, including those related to revenue recognition, refund liabilities, accounts receivable allowance for doubtful accounts, goodwill and other intangible assets and income taxes. We base our estimates and judgments on historical experience, information available prior to the issuance of the consolidated financial statements and on various other factors that we believe to be reasonable under the circumstances. This information forms the basis for making judgments about the carrying values of assets and liabilities that are not readily apparent from other sources. Materially different results can occur as circumstances change and additional information becomes known, including changes in those estimates not deemed “critical”.
We believe the following critical accounting policies, among others, involve our more significant estimates and judgments we used in the preparation of our consolidated financial statements. We have discussed the development and selection of accounting estimates, including those deemed “critical,” and the associated disclosures in this Form 10-K with the audit committee of the Board of Directors.
• | Revenue Recognition. We generally recognize revenue for a contractually specified percentage of amounts recovered when we have determined that our clients have received economic value (generally through credits taken against existing accounts payable due to the involved vendors or refund checks received from those vendors), and when we have met the following criteria: (a) persuasive evidence of an arrangement exists; (b) services have been rendered; (c) the fee billed to the client is fixed or determinable; and (d) collectability is reasonably assured. |
Additionally, for purposes of determining appropriate timing of recognition and for internal control purposes, we rely on customary business practices and processes for documenting that the criteria described in (a) through (d) above have been met. Such customary business practices and processes may vary significantly by client. On occasion, it is possible that a transaction has met all of the revenue recognition criteria described above but we do not recognize revenue, unless we can otherwise determine that criteria (a) through (d) above have been met, because our customary business practices and processes specific to that client have not been completed. The determination that we have met each of the aforementioned criteria, particularly the determination of the timing of economic benefit received by the client and the determination that collectability is reasonably assured, requires the application of significant judgment by management and a misapplication of this judgment could result in inappropriate recognition of revenue.
• | Unbilled Receivables & Refund Liabilities. Unbilled receivables relate to claims for which our clients have received economic value but for which we contractually have agreed not to invoice the clients. These unbilled receivables arise when a portion of our fee is deferred at the time of the initial invoice. At a later date (which can be up to a year after the original invoice, or a year after completion of the audit period), we invoice the unbilled receivable amount. Notwithstanding the deferred due date, our clients acknowledge that we have earned this unbilled receivable at the time of the original invoice, but have agreed to defer billing the client for the related services. |
Refund liabilities result from reductions in the economic value previously received by our clients with respect to vendor claims identified by us and for which we previously have recognized revenue. We satisfy such refund liabilities either by offsets to amounts otherwise due from clients or by cash refunds to clients. We compute the estimate of our refund liabilities at any given time based on actual historical refund data.
We record periodic changes in unbilled receivables and refund liabilities as adjustments to revenue.
• | Goodwill, Other Intangible Assets, Long-lived Assets, and Impairment Charges. Goodwill represents the excess of the purchase price over the estimated fair market value of net identifiable assets of acquired businesses. Intangible assets are assets that lack physical substance. We evaluate the recoverability of goodwill and other intangible assets in accordance with ASC 350, Intangibles—Goodwill and Other, in the fourth quarter of each year or sooner if events or changes in circumstances indicate that the carrying amount may exceed its fair value. This evaluation includes a preliminary assessment of qualitative factors to determine if it is necessary to perform a two-step impairment testing process. The first step identifies potential impairments by comparing the fair value of the reporting unit with its carrying value, including goodwill. If the calculated fair value of a reporting unit exceeds the carrying value, goodwill is not impaired, and the second step is not necessary. If the carrying value of a reporting unit exceeds the fair value, the second step calculates the possible impairment loss by comparing the implied fair value of goodwill with the carrying value. If the fair value is less than the carrying value, we would record an impairment charge. |
We are not required to calculate the fair value of our reporting units that hold goodwill unless we determine that it is more likely than not that the fair value of these reporting units is less than their carrying values. In this analysis, we consider a number of factors, including changes in our legal, business and regulatory climates, changes in competition or key personnel, macroeconomic factors impacting our company or our clients, our recent financial performance and expectations of future performance and other pertinent factors. Based on these analyses, we determined that it was not
33
necessary for us to perform the two-step process. We last used independent business valuation professionals to estimate fair value in the fourth quarter of 2010 and determined that fair value exceeded carrying value for all relevant reporting units. No impairment charges were necessary based on our internal calculations in the three years ended December 31, 2015.
We review the carrying value of long-lived assets such as property and equipment for impairment when events and circumstances indicate that the carrying value of an asset may not be recoverable from the estimated future cash flows expected to result from its use and eventual disposition. In cases where undiscounted expected future cash flows are less than the carrying value, we will recognize an impairment loss equal to the amount by which the carrying value exceeds the fair value of the asset. No impairment charges were necessary in the three years ended December 31, 2015 with the exception of impairment charges in 2013 for software development costs. In 2013, we recorded impairment charges of $4.2 million related to certain internally developed software assets. These charges primarily resulted from our decision to withdraw from the Medicare RAC program rebid process and from planned changes to the Company's recovery audit delivery processes.
• | Income Taxes. Our effective tax rate is based on historical and anticipated future taxable income, statutory tax rates and tax planning opportunities available to us in the various jurisdictions in which we operate. Significant judgment is required in determining the effective tax rate and in evaluating our tax positions. Tax regulations require items to be included in the tax returns at different times than the items are reflected in the financial statements. As a result, our effective tax rate reflected in our Consolidated Financial Statements included in Item 8 of this Form 10-K is different than that reported in our tax returns. Some of these differences are permanent, such as expenses that are not deductible on our tax returns, and some are temporary differences, such as depreciation expense. Temporary differences create deferred tax assets and liabilities. Deferred tax assets generally represent items that can be used as a tax deduction or credit in our tax returns in future years for which we have already recorded the tax benefit in our Consolidated Statements of Operations. We establish valuation allowances to reduce net deferred tax assets to the amounts that we believe are more likely than not to be realized. We adjust these valuation allowances in light of changing facts and circumstances. Deferred tax liabilities generally represent tax expense recognized in our consolidated financial statements for which payment has been deferred, or expense for which a deduction has already been taken on our tax returns but has not yet been recognized as an expense in our consolidated financial statements. |
We reduce our deferred tax assets by a valuation allowance if it is more likely than not that some portion or all of a deferred tax asset will not be realized. The ultimate realization of deferred tax assets is dependent upon the generation of future taxable income during the periods in which those temporary differences are deductible. In determining the amount of valuation allowance to record, we consider all available positive and negative evidence affecting specific deferred tax assets, including our past and anticipated future performance, the reversal of deferred tax liabilities, the length of carry-back and carry-forward periods, and the implementation of tax planning strategies. Objective positive evidence is necessary to support a conclusion that a valuation allowance is not needed for all or a portion of deferred tax assets when significant negative evidence exists. Cumulative tax losses in recent years are the most compelling form of negative evidence we considered in this determination.
We apply a “more-likely-than-not” recognition threshold and measurement attribute for the financial statement recognition and measurement of a tax position taken or expected to be taken in a tax return. We refer to U.S. generally accepted accounting principles (“GAAP”) for guidance on derecognition, classification, interest and penalties, accounting in interim periods, disclosure, and transition. Our policy for recording interest and penalties associated with tax positions is to record such items as a component of income before income taxes. A number of years may elapse before a particular tax position is audited and finally resolved or before a tax assessment is raised. The number of years subject to tax assessments varies by tax jurisdictions.
• | Stock-Based Compensation. We account for awards of equity instruments issued to employees and directors under the fair value method of accounting and recognize such amounts in our Consolidated Statements of Operations. We measure compensation cost for all stock-based awards at fair value on the date of grant and recognize compensation expense using the straight-line method over the service period over which we expect the awards to vest. We recognize compensation costs for awards with performance conditions based on the probable outcome of the performance conditions. We accrue compensation cost if we believe it is probable that the performance condition(s) will be achieved and do not accrue compensation cost if we believe it is not probable that the performance condition(s) will be achieved. In the event that it becomes probable that performance condition(s) will no longer be achieved, we reverse all of the previously recognized compensation expense in the period such a determination is made. |
We estimate the fair value of all time-vested options as of the date of grant using the Black-Scholes option valuation model, which was developed for use in estimating the fair value of traded options that have no vesting restrictions and are fully transferable. Option valuation models require the input of highly subjective assumptions, including the expected stock price volatility, which we calculate based on the historical volatility of our common stock. We use a
34
risk-free interest rate, based on the U.S. Treasury instruments in effect at the time of the grant, for the period comparable to the expected term of the option. Given our limited history with stock option grants and exercises, we use the “simplified” method in estimating the expected term, the period of time that options granted are expected to be outstanding, for our grants.
We estimate the fair value of awards of restricted shares and nonvested shares as being equal to the market value of the common stock on the date of the award. We classify our share-based payments as either liability-classified awards or as equity-classified awards. We remeasure liability-classified awards to fair value at each balance sheet date until the award is settled. We measure equity-classified awards at their grant date fair value and do not subsequently remeasure them. We have classified our share-based payments which are settled in our common stock as equity-classified awards and our share-based payments that are settled in cash as liability-classified awards. Compensation costs related to equity-classified awards generally are equal to the grant-date fair value of the award amortized over the vesting period of the award. The liability for liability-classified awards generally is equal to the fair value of the award as of the balance sheet date multiplied by the percentage vested at the time. We charge (or credit) the change in the liability amount from one balance sheet date to another to compensation expense.
New Accounting Standards
For information related to new and recently adopted accounting standards, see Note 1 – Summary of Significant Accounting Policies and Basis of Presentation, in “Notes to Consolidated Financial Statements” in Item 8 of this Form 10-K.
35
Item 7A. Quantitative and Qualitative Disclosures About Market Risk
Foreign Currency Market Risk. Our reporting currency is the U.S. dollar, although we transact business in various foreign locations and currencies. As a result, our financial results could be significantly affected by factors such as changes in foreign currency exchange rates or weak economic conditions in the foreign markets in which we provide our services. Our operating results are exposed to changes in exchange rates between the U.S. dollar and the currencies of the other countries in which we operate. When the U.S. dollar strengthens against other currencies, the value of foreign functional currency revenue decreases. When the U.S. dollar weakens, the value of the foreign functional currency revenue increases. Overall, we are a net receiver of currencies other than the U.S. dollar and, as such, benefit from a weaker dollar. We therefore are adversely affected by a stronger dollar relative to major currencies worldwide. In 2015, we recognized $8.4 million of operating income from operations located outside the U.S., virtually all of which was originally accounted for in currencies other than the U.S. dollar. Upon translation into U.S. dollars, such operating income would increase or decrease, assuming a hypothetical 10% change in weighted-average foreign currency exchange rates against the U.S. dollar, by approximately $0.8 million. We currently do not have any arrangements in place to hedge our foreign currency risk.
Interest Rate Risk. Our interest income and expense are sensitive to changes in the general level of U.S. interest rates. In this regard, changes in U.S. interest rates affect the interest earned on our cash equivalents as well as interest paid on amounts outstanding under our revolving credit facility, if any. We had $20.0 million of borrowing availability under our revolving credit facility as of December 31, 2015, but had no amounts drawn under the revolving credit facility as of that date. Interest on the amended credit facility is payable monthly and accrues at an index rate using the one-month LIBOR rate plus an applicable margin of 1.75%. Assuming full utilization of the credit facility, a hypothetical 100 basis point change in interest rates would result in an approximate $0.2 million change in annual pre-tax income.
36
ITEM 8. Financial Statements and Supplementary Data
INDEX TO CONSOLIDATED FINANCIAL STATEMENTS
Page No. | |
37
Report of Independent Registered Public Accounting Firm
Board of Directors and Shareholders
PRGX Global, Inc.
Atlanta, Georgia
We have audited the accompanying consolidated balance sheets of PRGX Global, Inc. and subsidiaries (the Company) as of December 31, 2015 and 2014 and the related consolidated statements of operations, comprehensive loss, shareholders’ equity, and cash flows for each of the three years in the period ended December 31, 2015. In connection with our audits of the financial statements, we have also audited the financial statement schedule listed in the accompanying index. These financial statements and schedule are the responsibility of the Company’s management. Our responsibility is to express an opinion on these financial statements and schedule based on our audits.
We conducted our audits in accordance with the standards of the Public Company Accounting Oversight Board (United States). Those standards require that we plan and perform the audit to obtain reasonable assurance about whether the financial statements are free of material misstatement. An audit includes examining, on a test basis, evidence supporting the amounts and disclosures in the financial statements, assessing the accounting principles used and significant estimates made by management, as well as evaluating the overall presentation of the financial statements and schedule. We believe that our audits provide a reasonable basis for our opinion.
In our opinion, the consolidated financial statements referred to above present fairly, in all material respects, the financial position of PRGX Global, Inc. and subsidiaries at December 31, 2015 and 2014, and the results of their operations and their cash flows for each of the three years in the period ended December 31, 2015, in conformity with accounting principles generally accepted in the United States of America.
Also, in our opinion, the financial statement schedule, when considered in relation to the basic consolidated financial statements taken as a whole, presents fairly, in all material respects, the information set forth therein.
We also have audited, in accordance with the standards of the Public Company Accounting Oversight Board (United States), the Company’s internal control over financial reporting as of December 31, 2015, based on criteria established in Internal Control – Integrated Framework (2013) issued by the Committee of Sponsoring Organizations of the Treadway Commission (COSO) and our report dated March 15, 2016 expressed an unqualified opinion thereon.
/s/ BDO USA, LLP
Atlanta, Georgia
March 15, 2016
38
PRGX GLOBAL, INC. AND SUBSIDIARIES
CONSOLIDATED STATEMENTS OF OPERATIONS
(In thousands, except per share data)
Years Ended December 31, | ||||||||||||
2015 | 2014 | 2013 | ||||||||||
Revenue, net | $ | 138,302 | $ | 161,552 | $ | 178,268 | ||||||
Operating expenses: | ||||||||||||
Cost of revenue | 93,169 | 110,890 | 112,853 | |||||||||
Selling, general and administrative expenses | 32,284 | 38,581 | 46,143 | |||||||||
Depreciation of property and equipment | 5,317 | 6,025 | 6,783 | |||||||||
Amortization of intangible assets | 2,458 | 3,531 | 4,997 | |||||||||
Impairment charges | — | — | 2,773 | |||||||||
Total operating expenses | 133,228 | 159,027 | 173,549 | |||||||||
Operating income from continuing operations | 5,074 | 2,525 | 4,719 | |||||||||
Foreign currency transaction (gains) losses on short-term intercompany balances | 2,165 | 2,003 | (13 | ) | ||||||||
Interest expense | (71 | ) | (351 | ) | (138 | ) | ||||||
Interest income | 261 | 428 | 215 | |||||||||
Other loss | 1,191 | 57 | — | |||||||||
Income from continuing operations before income taxes | 1,908 | 542 | 4,809 | |||||||||
Income tax expense (Note 7) | 369 | 3,241 | 2,755 | |||||||||
Net income (loss) from continuing operations | $ | 1,539 | $ | (2,699 | ) | $ | 2,054 | |||||
Discontinued operations: | ||||||||||||
Loss from discontinued operations | (4,765 | ) | (4,827 | ) | (2,240 | ) | ||||||
Income tax expense (benefit) | — | — | — | |||||||||
Net loss from discontinued operations | (4,765 | ) | (4,827 | ) | (2,240 | ) | ||||||
Net loss | $ | (3,226 | ) | $ | (7,526 | ) | $ | (186 | ) | |||
Basic earnings (loss) per common share (Note 3): | ||||||||||||
Basic earnings (loss) from continuing operations | $ | 0.06 | $ | (0.09 | ) | $ | 0.07 | |||||
Basic loss from discontinued operations | (0.18 | ) | (0.17 | ) | (0.08 | ) | ||||||
Total basic earnings (loss) per common share | $ | (0.12 | ) | $ | (0.26 | ) | $ | (0.01 | ) | |||
Diluted earnings (loss) per common share (Note 3): | ||||||||||||
Diluted earnings (loss) from continuing operations | $ | 0.06 | $ | (0.09 | ) | $ | 0.07 | |||||
Diluted loss from discontinued operations | (0.18 | ) | (0.17 | ) | (0.08 | ) | ||||||
Total diluted loss per common share | $ | (0.12 | ) | $ | (0.26 | ) | $ | (0.01 | ) | |||
Weighted-average common shares outstanding (Note 3): | ||||||||||||
Basic | 25,868 | 28,707 | 29,169 | |||||||||
Diluted | 25,904 | 28,707 | 29,628 | |||||||||
39
CONSOLIDATED STATEMENTS OF COMPREHENSIVE LOSS
(In thousands)
Years Ended December 31, | ||||||||||||
2015 | 2014 | 2011 | ||||||||||
Net loss | $ | (3,226 | ) | $ | (7,526 | ) | $ | (186 | ) | |||
Foreign currency translation adjustments | (769 | ) | (551 | ) | (1,414 | ) | ||||||
Comprehensive loss | $ | (3,995 | ) | $ | (8,077 | ) | $ | (1,600 | ) | |||
See accompanying Notes to Consolidated Financial Statements.
40
PRGX GLOBAL, INC. AND SUBSIDIARIES
CONSOLIDATED BALANCE SHEETS
(In thousands, except share and per share data)
December 31, | ||||||||
2015 | 2014 | |||||||
ASSETS | ||||||||
Current assets: | ||||||||
Cash and cash equivalents | $ | 15,122 | $ | 25,735 | ||||
Restricted cash | 48 | 53 | ||||||
Receivables: | ||||||||
Contract receivables, less allowances of $930 in 2015 and $2,243 in 2014: | ||||||||
Billed | 26,576 | 32,373 | ||||||
Unbilled | 1,967 | 2,809 | ||||||
28,543 | 35,182 | |||||||
Employee advances and miscellaneous receivables, less allowances of $681 in 2015 and $692 in 2014 | 1,740 | 1,993 | ||||||
Total receivables | 30,283 | 37,175 | ||||||
Prepaid expenses and other current assets | 2,323 | 3,416 | ||||||
Deferred income taxes (Note 7) | — | 5 | ||||||
Total current assets | 47,776 | 66,384 | ||||||
Property and equipment: | ||||||||
Computer and other equipment | 29,671 | 28,864 | ||||||
Furniture and fixtures | 2,842 | 2,926 | ||||||
Leasehold improvements | 3,446 | 3,450 | ||||||
Software | 23,788 | 20,934 | ||||||
59,747 | 56,174 | |||||||
Less accumulated depreciation and amortization | (48,167 | ) | (43,954 | ) | ||||
Property and equipment, net | 11,580 | 12,220 | ||||||
Goodwill (Note 4) | 11,810 | 13,036 | ||||||
Intangible assets, less accumulated amortization of $35,708 in 2015 and $33,973 in 2014 | 6,684 | 9,439 | ||||||
Unbilled receivables | 656 | 1,196 | ||||||
Deferred loan costs, net of accumulated amortization (Note 5) | 80 | — | ||||||
Deferred income taxes (Note 7) | 1,361 | 36 | ||||||
Other assets | 444 | 471 | ||||||
Total assets | $ | 80,391 | $ | 102,782 | ||||
LIABILITIES AND SHAREHOLDERS’ EQUITY | ||||||||
Current liabilities: | ||||||||
Accounts payable and accrued expenses | $ | 5,966 | $ | 7,397 | ||||
Accrued payroll and related expenses | 11,278 | 15,415 | ||||||
Refund liabilities | 7,887 | 5,393 | ||||||
Deferred revenue | 965 | 2,173 | ||||||
Business acquisition obligations (Note 12) | 39 | — | ||||||
Total current liabilities | 26,135 | 30,378 | ||||||
Refund liabilities | 752 | 857 | ||||||
Other long-term liabilities | 1,089 | 561 | ||||||
Total liabilities | 27,976 | 31,796 | ||||||
Commitments and contingencies (Notes 5, 6, 9 and 10) | ||||||||
Shareholders’ equity (Notes 9 and 11): | ||||||||
Common stock, no par value; $.01 stated value per share. Authorized 50,000,000 shares; 22,681,656 shares issued and outstanding at December 31, 2015 and 26,762,861 shares issued and outstanding at December 31, 2014 | 227 | 268 | ||||||
Additional paid-in capital | 575,532 | 590,067 | ||||||
Accumulated deficit | (524,138 | ) | (520,912 | ) | ||||
Accumulated other comprehensive income | 794 | 1,563 | ||||||
Total shareholders’ equity | 52,415 | 70,986 | ||||||
Total liabilities and shareholders’ equity | $ | 80,391 | $ | 102,782 | ||||
See accompanying Notes to Consolidated Financial Statements.
41
PRGX GLOBAL, INC. AND SUBSIDIARIES
CONSOLIDATED STATEMENTS OF SHAREHOLDERS' EQUITY
Years Ended December 31, 2015, 2014 and 2013
(In thousands, except share data)
Common Stock | Additional Paid-In Capital | Accumulated Deficit | Accumulated Other Comprehensive Income | Total Shareholders' Equity | |||||||||||||||||||
Shares | Amount | ||||||||||||||||||||||
Balance at December 31, 2012 | 27,893,132 | $ | 279 | $ | 594,045 | $ | (513,200 | ) | $ | 3,528 | $ | 84,652 | |||||||||||
Net loss | — | — | — | (186 | ) | — | (186 | ) | |||||||||||||||
Foreign currency translation adjustments | — | — | — | — | (1,414 | ) | (1,414 | ) | |||||||||||||||
Issuances of common stock: | |||||||||||||||||||||||
Restricted share awards | 665,629 | 7 | (7 | ) | — | — | — | ||||||||||||||||
Shares issued for acquisition | 217,155 | 2 | 1,470 | — | — | 1,472 | |||||||||||||||||
Shares issued for stock offering | 687,385 | 7 | 4,111 | — | — | 4,118 | |||||||||||||||||
Restricted shares remitted by employees for taxes | (259,116 | ) | (3 | ) | (1,754 | ) | — | — | (1,757 | ) | |||||||||||||
Stock option exercises | 202,159 | 2 | 914 | — | — | 916 | |||||||||||||||||
2006 MIP Performance Unit settlements | 52,912 | 1 | (1 | ) | — | — | — | ||||||||||||||||
Forfeited restricted share awards | (91,817 | ) | (1 | ) | 1 | — | — | — | |||||||||||||||
Stock-based compensation expense | — | — | 6,027 | — | — | 6,027 | |||||||||||||||||
Balance at December 31, 2013 | 29,367,439 | 294 | 604,806 | (513,386 | ) | 2,114 | 93,828 | ||||||||||||||||
Net loss | — | — | — | (7,526 | ) | — | (7,526 | ) | |||||||||||||||
Foreign currency translation adjustments | — | — | — | — | (551 | ) | (551 | ) | |||||||||||||||
Issuances of common stock: | |||||||||||||||||||||||
Restricted share awards | 220,442 | 2 | (2 | ) | — | — | — | ||||||||||||||||
Shares issued for acquisition | 187,620 | 2 | 1,277 | — | — | 1,279 | |||||||||||||||||
Restricted shares remitted by employees for taxes | (72,834 | ) | (1 | ) | (567 | ) | — | — | (568 | ) | |||||||||||||
Stock option exercises | 716,780 | 7 | 2,816 | — | — | 2,823 | |||||||||||||||||
2006 MIP Performance Unit settlements | 16,526 | 1 | (1 | ) | — | — | — | ||||||||||||||||
Forfeited restricted share awards | (67,970 | ) | (1 | ) | 1 | — | — | — | |||||||||||||||
Repurchases of common stock | (3,605,142 | ) | (36 | ) | (22,649 | ) | — | — | (22,685 | ) | |||||||||||||
Stock-based compensation expense | — | — | 4,386 | — | — | 4,386 | |||||||||||||||||
Balance at December 31, 2014 | 26,762,861 | 268 | 590,067 | (520,912 | ) | 1,563 | 70,986 | ||||||||||||||||
Net loss | — | — | — | (3,226 | ) | — | (3,226 | ) | |||||||||||||||
Foreign currency translation adjustments | — | — | — | — | (769 | ) | (769 | ) | |||||||||||||||
Issuances of common stock: | |||||||||||||||||||||||
Restricted share awards | 23,200 | — | — | — | — | — | |||||||||||||||||
Restricted shares remitted by employees for taxes | (17,147 | ) | — | (312 | ) | — | — | (312 | ) | ||||||||||||||
Stock option exercises | 29,128 | — | 91 | — | — | 91 | |||||||||||||||||
2006 MIP Performance Unit settlements | 9,918 | — | — | — | — | — | |||||||||||||||||
Forfeited restricted share awards | (7,918 | ) | — | — | — | — | — | ||||||||||||||||
Repurchases of common stock | (4,118,386 | ) | (41 | ) | (18,030 | ) | — | — | (18,071 | ) | |||||||||||||
Stock-based compensation expense | — | — | 3,716 | — | — | 3,716 | |||||||||||||||||
Balance at December 31, 2015 | 22,681,656 | $ | 227 | $ | 575,532 | $ | (524,138 | ) | $ | 794 | $ | 52,415 | |||||||||||
See accompanying Notes to Consolidated Financial Statements.
42
PRGX GLOBAL, INC. AND SUBSIDIARIES
CONSOLIDATED STATEMENTS OF CASH FLOWS
(In thousands)
Years Ended December 31, | ||||||||||||
2015 | 2014 | 2013 | ||||||||||
Cash flows from operating activities: | ||||||||||||
Net loss | $ | (3,226 | ) | $ | (7,526 | ) | $ | (186 | ) | |||
Adjustments to reconcile net loss to net cash provided by operating activities: | ||||||||||||
Impairment charges | — | — | 4,207 | |||||||||
Depreciation and amortization | 7,810 | 9,747 | 13,228 | |||||||||
Amortization of deferred loan costs | 20 | 104 | 193 | |||||||||
Stock-based compensation expense | 3,926 | 4,532 | 6,294 | |||||||||
Foreign currency transaction (gains) losses on short-term intercompany balances | 2,165 | 2,003 | (13 | ) | ||||||||
Deferred income taxes | (1,112 | ) | 1,566 | (23 | ) | |||||||
Other loss from sale of assets | 1,191 | 57 | — | |||||||||
Changes in operating assets and liabilities, net of business acquisitions: | ||||||||||||
Restricted cash | 5 | 4 | 8 | |||||||||
Billed receivables | 4,331 | (6,351 | ) | 4,206 | ||||||||
Unbilled receivables | 1,305 | 7,278 | 2,609 | |||||||||
Prepaid expenses and other current assets | 705 | 1,575 | (1,326 | ) | ||||||||
Other assets | — | 5 | 17 | |||||||||
Accounts payable and accrued expenses | (1,949 | ) | (3,432 | ) | (3,512 | ) | ||||||
Accrued payroll and related expenses | (3,595 | ) | 536 | (5,720 | ) | |||||||
Refund liabilities | 2,389 | (1,297 | ) | (591 | ) | |||||||
Deferred revenue | (784 | ) | 720 | (72 | ) | |||||||
Noncurrent compensation obligations | — | 414 | 329 | |||||||||
Other long-term liabilities | 272 | 112 | (1,224 | ) | ||||||||
Net cash provided by operating activities | 13,453 | 10,047 | 18,424 | |||||||||
Cash flows from investing activities: | ||||||||||||
Business acquisition, net of cash acquired | (520 | ) | — | — | ||||||||
Business divestiture | 783 | 1,100 | — | |||||||||
Purchases of property and equipment, net of disposal proceeds | (4,482 | ) | (4,709 | ) | (6,875 | ) | ||||||
Net cash used in investing activities | (4,219 | ) | (3,609 | ) | (6,875 | ) | ||||||
Cash flows from financing activities: | ||||||||||||
Repayments of long-term debt | — | — | (6,000 | ) | ||||||||
Payments for deferred loan costs | (100 | ) | (104 | ) | — | |||||||
Payments of deferred acquisition consideration | — | (2,208 | ) | (1,902 | ) | |||||||
Net proceeds from issuance of common stock | — | — | 4,118 | |||||||||
Repurchase of common stock | (18,071 | ) | (22,685 | ) | — | |||||||
Restricted stock repurchased from employees for withholding taxes | (312 | ) | (568 | ) | (1,757 | ) | ||||||
Proceeds from option exercises | 91 | 2,823 | 916 | |||||||||
Net cash used in financing activities | (18,392 | ) | (22,742 | ) | (4,625 | ) | ||||||
Effect of exchange rates on cash and cash equivalents | (1,455 | ) | (1,661 | ) | (1,030 | ) | ||||||
Net (decrease) increase in cash and cash equivalents | (10,613 | ) | (17,965 | ) | 5,894 | |||||||
Cash and cash equivalents at beginning of period | 25,735 | 43,700 | 37,806 | |||||||||
Cash and cash equivalents at end of period | $ | 15,122 | $ | 25,735 | $ | 43,700 | ||||||
Supplemental disclosure of cash flow information: | ||||||||||||
Cash paid during the period for interest | $ | 63 | $ | 132 | $ | 567 | ||||||
Cash paid during the period for income taxes, net of refunds received | $ | 1,085 | $ | 3,892 | $ | 3,245 | ||||||
43
(1) SUMMARY OF SIGNIFICANT ACCOUNTING POLICIES AND BASIS OF PRESENTATION
(a) Description of Business and Basis of Presentation
Description of Business
The principal business of PRGX Global, Inc. and subsidiaries is providing recovery audit services to large businesses and government agencies having numerous payment transactions. PRGX also provides services adjacent to recovery audit services, including data transformation, data analytics and associated advisory services, to a similar client base. These businesses include, but are not limited to:
• | retailers such as discount, department, specialty, grocery and drug stores, and wholesalers who sell to these retailers; |
• | business enterprises other than retailers such as manufacturers, financial services firms, and pharmaceutical companies; and |
• | federal and state government agencies. |
Except as otherwise indicated or unless the context otherwise requires, “PRGX,” “we,” “us,” “our” and the “Company” refer to PRGX Global, Inc. and its subsidiaries. PRGX currently provides services to clients in over 30 countries across a multitude of industries.
Basis of Presentation
During the fourth quarter of 2015 we discontinued the Healthcare Claims Recovery Audit ("HCRA") business. The results of our continuing and discontinued operations for the years ended December 31, 2015, 2014 and 2013 are presented in accordance with ASC 205-20, Presentation of Financial Statements - Discontinued Operations.
The consolidated financial statements include the financial statements of the Company and its wholly owned subsidiaries. All significant intercompany balances and transactions have been eliminated in consolidation.
Certain reclassifications have been made to the 2013 financial statements to conform to the presentations adopted in 2014.
Beginning with the second quarter of 2014, we reclassified certain information technology expenses within our Recovery Audit Services — Americas segment from Selling, General and Administrative expenses to Cost of Revenue to better reflect the nature of the work performed. We have revised the presentation of our Selling, General and Administrative expenses and Cost of Revenue for all relevant prior periods.
Beginning with the first quarter of 2014, we present the former New Services segment as two separate segments: Adjacent Services, which was formerly referred to as Profit Optimization services, and Healthcare Claims Recovery Audit Services. We have revised the presentation of our operating segments and related information in Note 2 - Operating Segments and Related Information. Also beginning with the first quarter of 2014, we reclassified certain expenses within the Recovery Audit Services — Europe/Asia-Pacific segment from Cost of Revenue to Selling, General and Administrative expenses to better reflect costs associated with new business development efforts.
Beginning with the third quarter of 2013, we present fair value adjustments to acquisition-related contingent consideration as an adjustment to our segment measure earnings before interest, taxes, depreciation and amortization ("Adjusted EBITDA") as presented in Note 2 - Operating Segments and Related Information. We now include these fair value adjustments in the Adjusted EBITDA calculation in the "Acquisition-related charges (benefits)" line, which we renamed from "Acquisition transaction costs and acquisition obligations classified as compensation." Accordingly, we have revised the presentation of our Adjusted EBITDA calculation for all relevant prior periods.
Management of the Company has made a number of estimates and assumptions relating to the reporting of assets and liabilities and the disclosure of contingent assets and liabilities to prepare these consolidated financial statements in conformity with U.S. generally accepted accounting principles (“GAAP”). Actual results could differ from those estimates.
(b) Revenue Recognition, Billed and Unbilled Receivables, and Refund Liabilities
We base our revenue on specific contracts with our clients. These contracts generally specify: (a) time periods covered by the audit; (b) nature and extent of audit services we are to provide; (c) the client’s duties in assisting and cooperating with us; and (d) fees payable to us, generally expressed as a specified percentage of the amounts recovered by the client resulting from overpayment claims identified. Clients generally recover claims either by taking credits against outstanding payables or future purchases from the involved vendors, or receiving refund checks directly from those vendors. The manner in which a claim is
44
PRGX GLOBAL, INC. AND SUBSIDIARIES
NOTES TO CONSOLIDATED FINANCIAL STATEMENTS – (Continued)
recovered by a client often is dictated by industry practice. In addition, many clients establish specific procedural guidelines that we must satisfy prior to submitting claims for client approval, and these guidelines are unique to each client. For some services we provide, we earn our compensation in the form of a fixed fee, a fee per hour, or a fee per other unit of service.
We generally recognize revenue for a contractually specified percentage of amounts recovered when we have determined that our clients have received economic value (generally through credits taken against existing accounts payable due to the involved vendors or refund checks received from those vendors) and when we have met the following criteria: (a) persuasive evidence of an arrangement exists; (b) services have been rendered; (c) the fee billed to the client is fixed or determinable; and (d) collectability is reasonably assured. In certain limited circumstances, we will invoice a client prior to meeting all four of these criteria; in such cases, we defer the revenue until we meet all of the criteria. Additionally, for purposes of determining appropriate timing of recognition and for internal control purposes, we rely on customary business practices and processes for documenting that we have met the criteria described in (a) through (d) above. Such customary business practices and processes may vary significantly by client. On occasion, it is possible that a transaction has met all of the revenue recognition criteria described above but we do not recognize revenue, unless we can otherwise determine that criteria (a) through (d) above have been met, because our customary business practices and processes specific to that client have not been completed.
Historically, there has been a certain amount of revenue with respect to which, even though we had met the requirements of our revenue recognition policy, our clients’ vendors ultimately have rejected the claims underlying the revenue. In that case, our clients may request a refund or offset of such amount even though we may have collected fees. We record any such refunds as a reduction of revenue. We provide refund liabilities for these reductions in the economic value previously received by our clients with respect to vendor claims we identified and for which we previously have recognized revenue. We compute an estimate of our refund liabilities at any given time based on actual historical refund data.
Billed receivables are stated at the amount we plan to collect and do not bear interest. We make ongoing estimates relating to the collectibility of our billed receivables and maintain a reserve for estimated losses resulting from the inability of our clients to meet their financial obligations to us. This reserve is primarily based on the level of past-due accounts based on the contractual terms of the receivables, our history of write-offs, and our relationships with, and the economic status of, our clients.
Unbilled receivables relate to claims for which clients have received economic value but for which we contractually have agreed not to submit an invoice to the clients at such time. Unbilled receivables arise when a portion of our fee is deferred at the time of the initial invoice. At a later date (which can be up to a year after original invoice, and at other times a year after completion of the audit period), we invoice the unbilled receivable amount. Notwithstanding the deferred due date, our clients acknowledge that we have earned this unbilled receivable at the time of the original invoice, but have agreed to defer billing the client for the related services.
We record periodic changes in unbilled receivables and refund liabilities as adjustments to revenue.
We derive a relatively small portion of revenue on a “fee-for-service” basis whereby billing is based upon a fixed fee, a fee per hour, or a fee per other unit of service. We recognize revenue for these types of services as we provide and invoice for them, and when criteria (a) through (d) as set forth above are met.
(c) Cash and Cash Equivalents
Cash and cash equivalents include all cash balances and highly liquid investments with an initial maturity of three months or less from date of purchase. We place our temporary cash investments with high credit quality financial institutions. At times, certain investments may be in excess of the Federal Deposit Insurance Corporation (“FDIC”) insurance limit or otherwise may not be covered by FDIC insurance. Some of our cash and cash equivalents are held at banks in jurisdictions outside the U.S. that have restrictions on transferring such assets outside of these countries on a temporary or permanent basis. Such restricted net assets are not significant in comparison to our consolidated net assets.
The $15.1 million in cash and cash equivalents as of December 31, 2015 includes $4.7 million held in the U.S., $2.8 million held in Canada, and $7.6 million held in other foreign jurisdictions, primarily in the United Kingdom, Australia, India, and Brazil. Our cash and cash equivalents included short-term investments of approximately $4.5 million as of December 31, 2015 and $12.2 million as of December 31, 2014, of which approximately $3.2 million and $2.5 million, respectively, were held at banks outside of the United States, primarily in Brazil and Canada.
45
PRGX GLOBAL, INC. AND SUBSIDIARIES
NOTES TO CONSOLIDATED FINANCIAL STATEMENTS – (Continued)
(d) Fair Value of Financial Instruments
We state cash equivalents at cost, which approximates fair market value. The carrying values for receivables from clients, unbilled receivables, accounts payable, deferred revenue and other accrued liabilities reasonably approximate fair market value due to the nature of the financial instrument and the short term maturity of these items.
We repaid the remaining balance of our bank debt in December 2013, and had no debt outstanding as of December 31, 2015 and 2014. We record bank debt, if any, as the unpaid balance as of the period end date based on the effective borrowing rate and repayment terms when originated. The bank debt that we repaid was subject to variable rate terms, and we believe that the fair value was approximately equal to the carrying value. We considered the factors used in determining the fair value of this debt to be Level 3 inputs (significant unobservable inputs).
We had no business acquisition obligations as of December 31, 2015 and 2014. Our business acquisition obligations represent the fair value of deferred consideration and earn-out payments estimated to be due as of the date for which we recorded these amounts. We determine the estimated fair values based on our projections of future revenue and profits or other factors used in the calculation of the ultimate payment to be made. The discount rate that we use to value the liability is based on specific business risk, cost of capital, and other factors. We consider these factors to be Level 3 inputs (significant unobservable inputs).
We state certain assets at fair value on a nonrecurring basis as required by accounting principles generally accepted in the United States of America. Generally, these assets are recorded at fair value on a nonrecurring basis as a result of impairment charges. We recorded an impairment charge in 2013 (see (f) Software Development Costs) whereby the fair value of the assets was derived using Level 3 inputs (significant unobservable inputs).
(e) Property and Equipment
We report property and equipment at cost or estimated fair value at acquisition date and depreciate them over their estimated useful lives using the straight-line method. Our useful lives for fixed assets are three years for computer laptops, four years for desktops, five years for IT server, storage and network equipment, five years for furniture and fixtures and three years for purchased software. We amortize leasehold improvements using the straight-line method over the shorter of the lease term or ten years. Depreciation expense from continuing operations was $5.3 million in 2015, $6.0 million in 2014 and $6.8 million in 2013.
We review the carrying value of property and equipment for impairment whenever events and circumstances indicate that the carrying value of an asset may not be recoverable from the estimated future cash flows expected to result from its use and eventual disposition. In cases where undiscounted expected future cash flows are less than the carrying value, we will recognize an impairment loss equal to the amount by which the carrying value exceeds the fair value of the asset. No impairment charges were necessary in the three years ended December 31, 2015 with the exception of charges for software development costs noted below.
(f) Software Development Costs
We capitalize a portion of the costs we incur related to our internal development of software that we use in our operations and amortize these costs using the straight-line method over the expected useful lives of three to seven years.
We also capitalize a portion of the costs we incur related to our internal development of software that we intend to market to others. We amortize these costs over the products’ estimated economic lives, which typically are three years, beginning when the underlying products are available for general release to clients. We review the carrying value of capitalized software development costs for impairment whenever events and circumstances indicate that the carrying value of the asset may not be recoverable from the estimated future cash flows expected to result from its use and eventual disposition. In cases where undiscounted expected future cash flows are less than the carrying value, we will recognize an impairment loss equal to the amount by which the carrying value exceeds the fair value of the asset.
We recorded an impairment charge of $2.8 million in 2013 relating to internally developed software assets. No impairment charges were necessary in 2015 or 2014. The impairment charges in 2013 included $2.7 million in the Recovery Audit Services - Americas segment relating to certain capitalized software development costs associated with certain proprietary audit tools. Much of the development efforts in this area were beneficial, but certain aspects of the development did not yield the benefits anticipated. We continue to develop this business model, but have changed our focus in certain areas and no longer expect to receive future economic benefit from certain costs and therefore recorded an impairment charge in the fourth quarter of 2013 representing the net book value of these capitalized costs. The remaining $0.1 million of impairment charges from 2013 were in the Adjacent Services segment and related to certain capitalized software development costs associated with certain advisory and analytics tools. Since the perceived future benefit of such tools was less than the carrying
46
PRGX GLOBAL, INC. AND SUBSIDIARIES
NOTES TO CONSOLIDATED FINANCIAL STATEMENTS – (Continued)
value of such tools, we recorded an impairment charge in the fourth quarter of 2013 representing the net book value of such tools.
We consider software development activities to be research and development costs and expense them as incurred. However, we capitalize the costs incurred for the development of computer software that will be sold, leased, or otherwise marketed or that will be used in our operations beginning when technological feasibility has been established. Research and development costs from continuing operations, including the amortization of amounts previously capitalized, were $3.0 million in 2015, $3.1 million in 2014 and $4.0 million in 2013.
(g) Goodwill and Intangible Assets
Goodwill represents the excess of the purchase price over the estimated fair market value of net identifiable assets of acquired businesses. We evaluate the recoverability of goodwill and other intangible assets in accordance with ASC 350, Intangibles—Goodwill and Other, in the fourth quarter of each year or sooner if events or changes in circumstances indicate that the carrying amount may exceed its fair value. This evaluation includes a preliminary assessment of qualitative factors to determine if it is necessary to perform a two-step impairment testing process. The first step identifies potential impairments by comparing the fair value of the reporting unit with its carrying value, including goodwill. If the calculated fair value of a reporting unit exceeds the carrying value, goodwill is not impaired, and the second step is not necessary. If the carrying value of a reporting unit exceeds the fair value, the second step calculates the possible impairment loss by comparing the implied fair value of goodwill with the carrying value. If the fair value is less than the carrying value, we would record an impairment charge.
We are not required to calculate the fair value of our reporting units that hold goodwill unless we determine that it is more likely than not that the fair value of these reporting units is less than their carrying values. In this analysis, we consider a number of factors, including changes in our legal, business and regulatory climates, changes in competition or key personnel, macroeconomic factors impacting our company or our clients, our recent financial performance and expectations of future performance and other pertinent factors. Based on these analyses, we determined that it was not necessary for us to perform the two-step process. We last used independent business valuation professionals to estimate fair value in the fourth quarter of 2010 and determined that fair value exceeded carrying value for all relevant reporting units. No impairment charges were necessary based on our internal assessments in the three years ended December 31, 2015.
(h) Direct Expenses and Deferred Costs
We typically expense direct expenses that we incur during the course of recovery audit and delivery of Adjacent Services offerings as incurred. For certain implementation and set-up costs associated with our “fee for service” revenue that we earn over an extended period of time, we defer the related direct and incremental costs and recognize them as expenses over the life of the underlying contract.
(i) Income Taxes
We account for income taxes under the asset and liability method. We recognize deferred tax assets and liabilities for the future tax consequences attributable to differences between the financial statement carrying amounts of existing assets and liabilities and their respective tax bases and operating loss and tax credit carry forwards. We measure deferred tax assets and liabilities using enacted tax rates we expect to apply to taxable income in the years in which we expect to recover or settle those temporary differences. We recognize the effect on the deferred tax assets and liabilities of a change in tax rates in income in the period that includes the enactment date.
We reduce our deferred tax assets by a valuation allowance if it is more likely than not that some portion or all of a deferred tax asset will not be realized. The ultimate realization of deferred tax assets is dependent upon the generation of future taxable income during the periods in which those temporary differences are deductible. In determining the amount of valuation allowance to record, we consider all available positive and negative evidence affecting specific deferred tax assets, including our past and anticipated future performance, the reversal of deferred tax liabilities, the length of carry-back and carry-forward periods and the implementation of tax planning strategies. Objective positive evidence is necessary to support a conclusion that a valuation allowance is not needed for all or a portion of deferred tax assets when significant negative evidence exists. Cumulative losses for tax reporting purposes in recent years are the most compelling form of negative evidence we considered in this determination.
We apply a “more-likely-than-not” recognition threshold and measurement attribute for the financial statement recognition and measurement of a tax position taken or expected to be taken in a tax return. We refer to GAAP for guidance on derecognition, classification, interest and penalties, accounting in interim periods, disclosure, and transition. In accordance with FASB ASC 740, our policy for recording interest and penalties associated with tax positions is to record such items as a
47
PRGX GLOBAL, INC. AND SUBSIDIARIES
NOTES TO CONSOLIDATED FINANCIAL STATEMENTS – (Continued)
component of income before income taxes. A number of years may elapse before a particular tax position is audited and finally resolved or when a tax assessment is raised. The number of years subject to tax assessments also varies by tax jurisdictions.
(j) Foreign Currency
We use the local currency as the functional currency in the majority of the countries in which we conduct business outside of the United States. We translate the assets and liabilities denominated in foreign currencies into U.S. dollars at the current rates of exchange at the balance sheet date. We include the translation gains and losses as a separate component of shareholders’ equity and in the determination of comprehensive income (loss). We translate revenue and expenses in foreign currencies at the weighted average exchange rates for the period. We separately state the foreign currency transaction gains and losses on short-term intercompany balances in the Consolidated Statements of Operations. We include all other realized and unrealized foreign currency transaction gains (losses) in “Selling, general and administrative expenses.”
(k) Earnings (Loss) Per Common Share
We compute basic earnings (loss) per common share by dividing net income (loss) available to common shareholders by the weighted-average number of shares of common stock outstanding during the period. We compute diluted earnings (loss) per common share by dividing net income (loss) available to common shareholders by the sum of (1) the weighted-average number of shares of common stock outstanding during the period, (2) the dilutive effect of the assumed exercise of stock options using the treasury stock method, and (3) the dilutive effect of other potentially dilutive securities. We exclude the potential dilutive effect of stock options and convertible instruments from the determination of diluted earnings (loss) per common share if the effect of including them would be antidilutive.
(l) Stock-Based Compensation
We account for awards of equity instruments issued to employees and directors under the fair value method of accounting and recognize such amounts in our Consolidated Statements of Operations. We measure compensation cost for all stock-based awards at fair value on the date of grant and recognize compensation expense in our Consolidated Statements of Operations using the straight-line method over the service period over which we expect the awards to vest. We recognize compensation costs for awards with performance conditions based on the probable outcome of the performance conditions. We accrue compensation cost if we believe it is probable that the performance condition(s) will be achieved and do not accrue compensation cost if we believe it is not probable that the performance condition(s) will be achieved. In the event that it becomes probable that performance condition(s) will no longer be achieved, we reverse all of the previously recognized compensation expense in the period such a determination is made.
We estimate the fair value of all time-vested options as of the date of grant using the Black-Scholes option valuation model, which was developed for use in estimating the fair value of traded options that have no vesting restrictions and are fully transferable. Option valuation models require the input of highly subjective assumptions, including the expected stock price volatility, which we calculate based on the historical volatility of our common stock. We use a risk-free interest rate, based on the U.S. Treasury instruments in effect at the time of the grant, for the period comparable to the expected term of the option. We use the “simplified” method in estimating the expected term, the period of time that options granted are expected to be outstanding, for our grants.
We estimate the fair value of awards of restricted shares and nonvested shares as being equal to the market value of the common stock on the date of the award. We classify our share-based payments as either liability-classified awards or as equity-classified awards. We remeasure liability-classified awards to fair value at each balance sheet date until the award is settled. We measure equity-classified awards at their grant date fair value and do not subsequently remeasure them. We have classified our share-based payments which are settled in our common stock as equity-classified awards and our share-based payments that are settled in cash as liability-classified awards. Compensation costs related to equity-classified awards generally are equal to the fair value of the award at grant-date amortized over the vesting period of the award. The liability for liability-classified awards generally is equal to the fair value of the award as of the balance sheet date multiplied by the percentage vested at the time. We record the change in the liability amount from one balance sheet date to another to compensation expense.
(m) Comprehensive Income (Loss) and Accumulated Other Comprehensive Income
Consolidated comprehensive income (loss) consists of consolidated net income (loss) and foreign currency translation adjustments. We present the calculation of consolidated comprehensive income (loss) in the accompanying Consolidated Statements of Comprehensive Income (Loss). No amounts have been reclassified out of Accumulated Other Comprehensive Income during the periods presented in our consolidated financial statements.
(n) Segment Reporting
48
PRGX GLOBAL, INC. AND SUBSIDIARIES
NOTES TO CONSOLIDATED FINANCIAL STATEMENTS – (Continued)
We report our operating segment information in three segments: Recovery Audit Services – Americas; Recovery Audit Services – Europe/Asia-Pacific and Adjacent Services. We include the unallocated portion of corporate selling, general and administrative expenses not specifically attributable to our three operating segments in Corporate Support. Our business segments reflect the internal reporting that our Chief Executive Officer, who is our chief operating decision maker, uses for the purpose of making decisions about allocating resources and assessing performance. Our management, including our Chief Executive Officer, uses what we internally refer to as “Adjusted EBITDA” as the primary measure of profit or loss for purposes of assessing the operating performance of all operating segments. We define Adjusted EBITDA as earnings from continuing operations before interest, taxes, depreciation and amortization (“EBITDA”) as adjusted for unusual and other significant items that management views as distorting the operating results of the various segments from period to period.
EBITDA and Adjusted EBITDA are not financial measures determined in accordance with GAAP. Such non-GAAP financial measures do not measure the profit or loss of the reportable segments in accordance with GAAP. Given that we use Adjusted EBITDA as our primary measure of segment performance, GAAP rules on segment reporting require that we include this non-GAAP measure in our discussion of our operating segments. We also must reconcile Adjusted EBITDA to our operating results presented on a GAAP basis. We provide this reconciliation in Note 2 to these consolidated financial statements along with other information about our reportable segments. We do not intend the reconciling items to be, nor should they be, interpreted as non-recurring or extraordinary, or in any manner be deemed as adjustments made in accordance with GAAP. Because Adjusted EBITDA is not a financial measure determined in accordance with GAAP, it may not be comparable to other similarly titled measures of other companies.
(o) New Accounting Standards
A summary of the new accounting standards issued by the Financial Accounting Standards Board (“FASB”) and included in the Accounting Standards Codification (“ASC”) that apply to us is set forth below.
FASB ASC Update No. 2016-02 - In February 2016, the FASB issued Accounting Standards Update 2016-02, Leases (Topic 842). The standard requires the recognition of lease assets and lease liabilities by lessees for those leases classified as operating leases. Leases will be classified as either finance or operating, with classification affecting the pattern of expense recognition. The standard requires lessors to classify leases as either sales-type, finance or operating. A sales-type lease occurs if the lessor transfers all of the risks and rewards, as well as control of the underlying asset, to the lessee. If risks and rewards are conveyed without the transfer of control, the lease is treated as a financing lease. If the lessor does not convey risks and rewards or control, an operating lease results. The standard will become effective for the Company beginning January 1, 2019. The Company is currently assessing the impact adoption of this standard will have on its consolidated results of operations, financial condition, cash flows, and financial statement disclosures.
FASB ASC Update No. 2015-17 - In November 2015, the FASB issued Accounting Standards Update 2015-17, Income Taxes (Topic740). The amendments in this update require an entity to classify deferred income tax liabilities and assets into noncurrent amounts in a classified statement of financial position. The impacts of these amendments is effective for fiscal periods that begin after December 15, 2016. We adopted the provisions of this update as of the end of 2015 and will apply the changes prospectively.
FASB ASC Update No. 2015-15. In August 2015, the FASB issued Accounting Standards Update No. 2015-15, Interest - Imputations of Interest (Subtopic 835-30). The amendments in this update clarify the stance by the SEC allowing an entity to defer and present debt issuance costs for a line-of-credit arrangement as an asset and subsequently amortizing the deferred debt issuance costs ratably over the term of the line-of-credit arrangement, regardless of whether there are any outstanding borrowings on the line-of-credit arrangement. We are currently evaluating the impact of ASU 2015-15 on our consolidated financial statements.
FASB ASC Update No. 2015-05. In April 2015, the FASB issued Accounting Standards Update 2015-05, Goodwill and Other - Internal-Use Software (Subtopic 350-40). The amendments in this update provide guidance about whether a cloud computing arrangement includes a software license. Specifically the amendment states that if a cloud computing arrangement includes a software license, then the customer should account for the software license element of the arrangement consistent with the acquisition of other software licenses. If a cloud computing arrangement does not include a software license, the customer should account for the arrangement as a service contract. The amendments in this update are effective for those annual periods beginning after December 15, 2015. We are currently evaluating the impact of ASU 2015-05 on our consolidated financial statements.
FASB ASC Update No. 2015-03. In April 2015, the FASB issued Accounting Standards Update No. 2015-03, Interest—Imputation of Interest (Subtopic 835-30) (“ASU 2015-03”). ASU 2015-03 simplifies presentation of debt issuance costs by requiring that debt issuance costs related to a recognized debt liability be presented in the balance sheet as a direct deduction from the carrying amount of that debt liability, consistent with debt discounts. ASU 2015-03 is effective for annual periods
49
PRGX GLOBAL, INC. AND SUBSIDIARIES
NOTES TO CONSOLIDATED FINANCIAL STATEMENTS – (Continued)
beginning after December 15, 2015 with early adoption permitted. The guidance also requires retrospective application to all prior periods presented. We are currently evaluating the impact of ASU 2015-03 on our consolidated financial statements.
FASB ASC Update No. 2015-02. In February 2015, the FASB issued Accounting Standards Update 2015-02, Consolidation (Topic 810). The amendments in this update revise the consolidation model for all entities. Specifically the amendments:
1. | Modify the evaluation of whether limited partnerships and similar legal entities are variable interest entities (VIE's) or voting interest entities; |
2. | Eliminate the presumption that a general partner should consolidate a limited partnership; |
3. | Affect the consolidation analysis of reporting entities that are involved with VIE's, particularly those that have fee arrangements and related party relationships; |
4. | Provide a scope exception from consolidation guidance for reporting entities with interests in legal entities that are required to comply with or operate in accordance with requirements that are similar to those in Rule 2a-7 of the Investment Company Act of 1940 for registered money market funds. |
The amendments in this update are effective for fiscal years beginning after December 15, 2015. We are currently evaluating the impact of ASU 2015-02 on our consolidated financial statements.
FASB ASC Update No. 2015-01. In January 2015, the FASB issued Accounting Standards Update 2015-01, Income Statement - Extraordinary and Unusual Items (Subtopic 225-20). This update eliminates the concept of extraordinary items and their use in financial statements and corresponding disclosure. The amendments in this update are effective for fiscal years beginning after December 15, 2015. We are currently evaluating the impact of ASU 2015-01 on our consolidated financial statements.
FASB ASC Update No. 2014-15. In August 2014, the FASB issued Accounting Standards Update No. 2014-15, Presentation of Financial Statements—Going Concern (Subtopic 205-40) (“ASU 2014-15”). ASU 2014-15 provides guidance on management's responsibility to evaluate whether there is substantial doubt about an entity’s ability to continue as a going concern and related disclosure requirements. ASU 2014-15 is effective for annual periods beginning after December 15, 2016 with early adoption permitted. We do not expect the adoption of ASU 2014-15 to have a material impact on our consolidated financial statements.
FASB ASC Update No. 2014-09. In May 2014, the FASB issued Accounting Standards Update No. 2014-09, Revenue from Contracts with Customers (Topic 606) (“ASU 2014-09”). ASU 2014-09 supersedes the revenue recognition requirements in Revenue Recognition (Topic 605), and requires an entity to recognize revenue when it transfers promised goods or services to customers in an amount that reflects the consideration to which the transferring entity expects to be entitled to in exchange for those goods or services. ASU 2014-09 allows for adoption using either of two methods; retrospectively to each prior reporting period presented or retrospectively with the cumulative effect of application recognized at the date of initial adoption. It is effective for annual periods beginning after December 15, 2017. Early adoption is not permitted. We are currently undergoing an evaluation of the impact of ASU 2014-09 on our consolidated financial statements.
FASB ASC Update No. 2014-08. In April 2014, the FASB issued Accounting Standards Update No. 2014-08, Presentation of Financial Statements (Topic 205) and Property, Plant, and Equipment (Topic 360)—Reporting Discontinued Operations and Disclosures of Disposals of Components of an Entity (“ASU 2014-08”). ASU 2014-08 raises the threshold for a disposal to qualify as a discontinued operation and requires new disclosures of both discontinued operations and certain other disposals that do not meet the definition of a discontinued operation. ASU 2014-08 is effective for annual periods beginning on or after December 15, 2014 with early adoption permitted for transactions that have not been disclosed in previously issued financial statements. We adopted ASU 2014-08 in the third quarter of 2014. The impact of ASU 2014-08 on the Company's financial statements with respect to any future transaction will be dependent on whether any such transaction falls within the scope of the new guidance.
(2) OPERATING SEGMENTS AND RELATED INFORMATION
We conduct our operations through three reportable segments:
Recovery Audit Services – Americas represents recovery audit services (other than HCRA services) provided in the United States of America (“U.S.”), Canada and Latin America.
Recovery Audit Services – Europe/Asia-Pacific represents recovery audit services provided in Europe, Asia and the Pacific region.
50
PRGX GLOBAL, INC. AND SUBSIDIARIES
NOTES TO CONSOLIDATED FINANCIAL STATEMENTS – (Continued)
Adjacent Services (formerly known as Profit Optimization services) represents data transformation, data analytics and associated advisory services.
We include the unallocated portion of corporate selling, general and administrative expenses not specifically attributable to the three reportable segments in Corporate Support.
During the fourth quarter of 2015, PRGX entered into agreements with third parties to fulfill its Medicare recovery audit contractor ("RAC") program subcontract obligations to audit Medicare payments and provide support for claims appeals and assigned its remaining Medicaid contract to another party. The Company will continue to incur certain expenses while the current Medicare RAC contracts are still in effect. As part of discontinuing the HCRA business, the Company increased its accrual for outstanding Medicare RAC appeals liability by approximately $2.1 million. As a result, the HCRA services business has been reported as Discontinued Operations in accordance with US GAAP.
Discontinued operations information for the years ended December 31, 2015 and 2014 and 2013 (in thousands) is as follows:
Results of Discontinued Operations | ||||||
(in thousands) | ||||||
2015 | 2014 | 2013 | ||||
Revenue, net | 1,266 | 2,640 | 16,948 | |||
Cost of sales | 4,743 | 5,069 | 13,249 | |||
Selling, general and administrative expense | 1,253 | 2,207 | 3,057 | |||
Depreciation and amortization | 35 | 191 | 1,448 | |||
Impairment charges | — | — | 1,434 | |||
Pretax loss from discontinued operations | (4,765 | ) | (4,827 | ) | (2,240 | ) |
Income tax expense | — | — | — | |||
Net loss from discontinued operations | (4,765 | ) | (4,827 | ) | (2,240 | ) |
We evaluate the performance of our reportable segments based upon revenue and measures of profit or loss we refer to as EBITDA and Adjusted EBITDA. We define Adjusted EBITDA as earnings from continuing operations before interest and taxes (“EBIT”), adjusted for depreciation and amortization (“EBITDA”), and then further adjusted for unusual and other significant items that management views as distorting the operating results of the various segments from period to period. Such adjustments include restructuring charges, stock-based compensation, bargain purchase gains, acquisition-related charges and benefits (acquisition transaction costs, acquisition obligations classified as compensation, and fair value adjustments to acquisition-related contingent consideration), tangible and intangible asset impairment charges, certain litigation costs and litigation settlements, certain severance charges and foreign currency transaction gains and losses on short-term intercompany balances viewed by management as individually or collectively significant. We do not have any inter-segment revenue.
51
PRGX GLOBAL, INC. AND SUBSIDIARIES
NOTES TO CONSOLIDATED FINANCIAL STATEMENTS – (Continued)
Segment information for the years ended December 31, 2015 and 2014 and 2013 (in thousands) is as follows:
Recovery Audit Services – Americas | Recovery Audit Services – Europe/Asia- Pacific | Adjacent Services | Corporate Support | Total | ||||||||||||||||
2015 | ||||||||||||||||||||
Revenue, net | $ | 97,009 | $ | 36,264 | $ | 5,029 | $ | — | $ | 138,302 | ||||||||||
Net income from continuing operations | $ | 1,539 | ||||||||||||||||||
Income tax expense | 369 | |||||||||||||||||||
Interest income, net | (190 | ) | ||||||||||||||||||
EBIT | $ | 22,539 | $ | 2,573 | $ | (5,131 | ) | $ | (18,263 | ) | 1,718 | |||||||||
Depreciation of property and equipment | 4,036 | 647 | 634 | — | 5,317 | |||||||||||||||
Amortization of intangible assets | 1,728 | 600 | 130 | — | 2,458 | |||||||||||||||
EBITDA | 28,303 | 3,820 | (4,367 | ) | (18,263 | ) | 9,493 | |||||||||||||
Foreign currency transaction (gains) losses on short-term intercompany balances | 807 | 1,533 | 12 | (187 | ) | 2,165 | ||||||||||||||
Acquisition-related charges | — | — | — | — | — | |||||||||||||||
Transformation severance and related expenses | 322 | 589 | 30 | 308 | 1,249 | |||||||||||||||
Other loss | — | — | 1,191 | — | 1,191 | |||||||||||||||
Stock-based compensation | — | — | — | 3,926 | 3,926 | |||||||||||||||
Adjusted EBITDA | $ | 29,432 | $ | 5,942 | $ | (3,134 | ) | $ | (14,216 | ) | $ | 18,024 | ||||||||
Capital expenditures | $ | 3,669 | $ | 543 | $ | 270 | $ | — | 4,482 | |||||||||||
Allocated assets | $ | 44,588 | $ | 13,922 | $ | 1,030 | $ | — | $ | 59,540 | ||||||||||
Unallocated assets: | ||||||||||||||||||||
Cash and cash equivalents | — | — | — | 15,122 | 15,122 | |||||||||||||||
Restricted cash | — | — | — | 48 | 48 | |||||||||||||||
Deferred loan costs | — | — | — | 80 | 80 | |||||||||||||||
Deferred income taxes | — | — | — | 1,361 | 1,361 | |||||||||||||||
Prepaid expenses and other assets | — | — | — | 2,465 | 2,465 | |||||||||||||||
Discontinued operations | — | — | — | 1,775 | 1,775 | |||||||||||||||
Total assets | $ | 44,588 | $ | 13,922 | $ | 1,030 | $ | 20,851 | $ | 80,391 | ||||||||||
52
PRGX GLOBAL, INC. AND SUBSIDIARIES
NOTES TO CONSOLIDATED FINANCIAL STATEMENTS – (Continued)
Recovery Audit Services – Americas | Recovery Audit Services – Europe/Asia- Pacific | Adjacent Services | Corporate Support | Total | ||||||||||||||||
2014 | ||||||||||||||||||||
Revenue, net | $ | 106,533 | $ | 44,319 | $ | 10,700 | $ | — | $ | 161,552 | ||||||||||
Net loss from continuing operations | $ | (2,699 | ) | |||||||||||||||||
Income tax expense | 3,241 | |||||||||||||||||||
Interest income, net | (77 | ) | ||||||||||||||||||
EBIT | $ | 21,066 | $ | 2,772 | $ | (4,161 | ) | $ | (19,212 | ) | 465 | |||||||||
Depreciation of property and equipment | 4,711 | 592 | 722 | — | 6,025 | |||||||||||||||
Amortization of intangible assets | 2,002 | 1,195 | 334 | — | 3,531 | |||||||||||||||
EBITDA | 27,779 | 4,559 | (3,105 | ) | (19,212 | ) | 10,021 | |||||||||||||
Foreign currency transaction (gains) losses on short-term intercompany balances | 380 | 1,828 | — | (205 | ) | 2,003 | ||||||||||||||
Acquisition-related charges (benefits) | — | — | 249 | — | 249 | |||||||||||||||
Transformation severance and related expenses | 1,348 | 1,285 | 418 | 589 | 3,640 | |||||||||||||||
Other loss | — | — | 57 | — | 57 | |||||||||||||||
Stock-based compensation | — | — | — | 4,532 | 4,532 | |||||||||||||||
Adjusted EBITDA | $ | 29,507 | $ | 7,672 | $ | (2,381 | ) | $ | (14,296 | ) | $ | 20,502 | ||||||||
Capital expenditures | $ | 3,930 | $ | 651 | $ | 123 | $ | — | $ | 4,704 | ||||||||||
Allocated assets | $ | 50,252 | $ | 18,556 | $ | 4,596 | $ | — | $ | 73,404 | ||||||||||
Unallocated assets: | ||||||||||||||||||||
Cash and cash equivalents | — | — | — | 25,735 | 25,735 | |||||||||||||||
Restricted cash | — | — | — | 53 | 53 | |||||||||||||||
Deferred income taxes | — | — | — | 41 | 41 | |||||||||||||||
Prepaid expenses and other assets | — | — | — | 2,729 | 2,729 | |||||||||||||||
Discontinued operations | — | — | — | 820 | 820 | |||||||||||||||
Total assets | $ | 50,252 | $ | 18,556 | $ | 4,596 | $ | 29,378 | $ | 102,782 | ||||||||||
53
PRGX GLOBAL, INC. AND SUBSIDIARIES
NOTES TO CONSOLIDATED FINANCIAL STATEMENTS – (Continued)
Recovery Audit Services – Americas | Recovery Audit Services – Europe/Asia- Pacific | Adjacent Services | Corporate Support | Total | ||||||||||||||||
2013 | ||||||||||||||||||||
Revenue, net | $ | 118,649 | $ | 46,436 | $ | 13,183 | $ | — | $ | 178,268 | ||||||||||
Net income from continuing operations | $ | 2,054 | ||||||||||||||||||
Income tax expense | 2,755 | |||||||||||||||||||
Interest expense, net | (77 | ) | ||||||||||||||||||
EBIT | $ | 27,094 | $ | 3,901 | $ | (3,480 | ) | $ | (22,783 | ) | 4,732 | |||||||||
Depreciation of property and equipment | 5,617 | 514 | 652 | — | 6,783 | |||||||||||||||
Amortization of intangible assets | 2,792 | 1,508 | 697 | — | 4,997 | |||||||||||||||
EBITDA | 35,503 | 5,923 | (2,131 | ) | (22,783 | ) | 16,512 | |||||||||||||
Impairment charges | 2,702 | — | 71 | — | 2,773 | |||||||||||||||
Foreign currency transaction (gains) losses on short-term intercompany balances | 327 | (316 | ) | — | (24 | ) | (13 | ) | ||||||||||||
Acquisition-related charges (benefits) | 1,315 | (900 | ) | 187 | — | 602 | ||||||||||||||
Transformation severance and related expenses | 107 | 1,135 | 81 | 1,134 | 2,457 | |||||||||||||||
Stock-based compensation | — | — | — | 6,294 | 6,294 | |||||||||||||||
Adjusted EBITDA | $ | 39,954 | $ | 5,842 | $ | (1,792 | ) | $ | (15,379 | ) | $ | 28,625 | ||||||||
Capital expenditures | $ | 5,292 | $ | 781 | $ | 376 | $ | — | $ | 6,449 | ||||||||||
Allocated assets | $ | 55,978 | $ | 16,706 | $ | 4,993 | $ | — | $ | 77,677 | ||||||||||
Unallocated assets: | ||||||||||||||||||||
Cash and cash equivalents | — | — | — | 43,700 | 43,700 | |||||||||||||||
Restricted cash | — | — | — | 57 | 57 | |||||||||||||||
Deferred income taxes | — | — | — | 1,708 | 1,708 | |||||||||||||||
Prepaid expenses and other assets | — | — | — | 2,254 | 2,254 | |||||||||||||||
Discontinued operations | — | — | — | 7,433 | 7,433 | |||||||||||||||
Total assets | $ | 55,978 | $ | 16,706 | $ | 4,993 | $ | 55,152 | $ | 132,829 | ||||||||||
54
PRGX GLOBAL, INC. AND SUBSIDIARIES
NOTES TO CONSOLIDATED FINANCIAL STATEMENTS – (Continued)
The following table presents revenue by country based on the location of clients served (in thousands):
Years Ended December 31, | ||||||||||||
2015 | 2014 | 2013 | ||||||||||
United States | $ | 80,484 | $ | 88,859 | $ | 98,871 | ||||||
United Kingdom | 19,540 | 23,817 | 24,639 | |||||||||
Canada | 12,388 | 15,851 | 19,584 | |||||||||
France | 6,186 | 8,508 | 10,225 | |||||||||
Australia | 6,111 | 5,762 | 4,461 | |||||||||
Mexico | 4,340 | 4,653 | 4,482 | |||||||||
Brazil | 1,223 | 3,050 | 5,090 | |||||||||
New Zealand | 596 | 1,353 | 976 | |||||||||
Spain | 1,019 | 1,275 | 844 | |||||||||
Thailand | 933 | 986 | 971 | |||||||||
Hong Kong | 864 | 903 | 851 | |||||||||
Colombia | 610 | 841 | 752 | |||||||||
Other | 4,008 | 5,694 | 6,522 | |||||||||
$ | 138,302 | $ | 161,552 | $ | 178,268 | |||||||
The following table presents long-lived assets by country based on the location of the asset (in thousands):
December 31, | |||||||||
2015 | 2014 | ||||||||
United States | $ | 26,281 | $ | 29,392 | |||||
United Kingdom | 2,939 | 4,416 | |||||||
All Other | 1,297 | 1,359 | |||||||
$ | 30,517 | $ | 35,167 | ||||||
No client accounted for 10% or more of total revenue in 2015, 2014, or 2013.
(3) EARNINGS (LOSS) PER COMMON SHARE
The following tables set forth the computations of basic and diluted earnings (loss) per common share (in thousands, except per share data):
Years Ended December 31, | ||||||||||||
Basic earnings (loss) per common share: | 2015 | 2014 | 2013 | |||||||||
Numerator: | ||||||||||||
Net income (loss) from continuing operations | $ | 1,539 | $ | (2,699 | ) | $ | 2,054 | |||||
Net loss from discontinued operations | (4,765 | ) | (4,827 | ) | (2,240 | ) | ||||||
Denominator: | ||||||||||||
Weighted-average common shares outstanding | 25,868 | 28,707 | 29,169 | |||||||||
Basic earnings (loss) per common share from continuing operations | $ | 0.06 | $ | (0.09 | ) | $ | 0.07 | |||||
Basic loss per common share from discontinued operations | $ | (0.18 | ) | $ | (0.17 | ) | $ | (0.08 | ) | |||
55
PRGX GLOBAL, INC. AND SUBSIDIARIES
NOTES TO CONSOLIDATED FINANCIAL STATEMENTS – (Continued)
Years Ended December 31, | ||||||||||||
Diluted earnings (loss) per common share: | 2015 | 2014 | 2013 | |||||||||
Numerator: | ||||||||||||
Net income (loss) from continuing operations | $ | 1,539 | $ | (2,699 | ) | $ | 2,054 | |||||
Net loss from discontinued operations | (4,765 | ) | (4,827 | ) | (2,240 | ) | ||||||
Denominator: | ||||||||||||
Weighted-average common shares outstanding | 25,868 | 28,707 | 29,169 | |||||||||
Incremental shares from stock-based compensation plans | 36 | — | 459 | |||||||||
Denominator for diluted earnings per common share | 25,904 | 28,707 | 29,628 | |||||||||
Diluted earnings (loss) per common share from continuing operations | $ | 0.06 | $ | (0.09 | ) | $ | 0.07 | |||||
Diluted loss per common share from discontinued operations | $ | (0.18 | ) | $ | (0.17 | ) | $ | (0.08 | ) | |||
Weighted-average shares outstanding excludes antidilutive shares underlying options that totaled 3.3 million, 3.3 million, and 3.0 million shares, respectively, from the computation of diluted earnings (loss) per common share for the years ended December 31, 2015, 2014, and 2013. Weighted-average shares outstanding excludes antidilutive Performance Units issuable under the Company's 2006 Management Incentive Plan that totaled less than 0.1 million shares from the computation of diluted earnings (loss) per common share for the years ended December 31, 2014 and 2013. The number of common shares we used in the basic and diluted earnings (loss) per common share computations include nonvested restricted shares of 2.7 million, 0.5 million, and 0.7 million for the years ended December 31, 2015, 2014, and 2013, respectively, and nonvested restricted share units that we consider to be participating securities of 0.1 million for the year ended December 31, 2015 and 0.1 million for the years ended December 31, 2014 and 2013.
56
PRGX GLOBAL, INC. AND SUBSIDIARIES
NOTES TO CONSOLIDATED FINANCIAL STATEMENTS – (Continued)
(4) GOODWILL AND INTANGIBLE ASSETS
(a) Goodwill
We evaluate the recoverability of goodwill in the fourth quarter of each year or sooner if events or changes in circumstances indicate that the carrying amount may exceed its fair value. These analyses did not result in an impairment charge during the periods presented. Goodwill in our Recovery Audit Services - Americas segment includes accumulated impairment losses of $359.9 million recorded in 2002 and 2005.
Goodwill by reportable segments during 2015 and 2014 was as follows (in thousands):
Recovery Audit Services – Americas | Recovery Audit Services – Europe/Asia- Pacific | Adjacent Services | Total | |||||||||||||
Balance, January 1, 2014 | $ | 12,177 | $ | 913 | $ | 596 | $ | 13,686 | ||||||||
Goodwill disposed in connection with business divestiture | — | — | (596 | ) | (596 | ) | ||||||||||
Foreign currency translation | — | (54 | ) | — | (54 | ) | ||||||||||
Balance, December 31, 2014 | 12,177 | 859 | — | 13,036 | ||||||||||||
Goodwill disposed in connection with business divestiture | (1,422 | ) | — | — | (1,422 | ) | ||||||||||
Goodwill recorded in connection with business combinations | — | — | 242 | 242 | ||||||||||||
Foreign currency translation | — | (46 | ) | — | (46 | ) | ||||||||||
Balance, December 31, 2015 | $ | 10,755 | $ | 813 | $ | 242 | $ | 11,810 | ||||||||
We initially recorded goodwill of $7.8 million in our Recovery Audit Services – Americas segment in conjunction with our December 2011 acquisition of Business Strategy, Inc. and substantially all the assets of an affiliated company (collectively, “BSI”) (see Note 12 below). We recorded purchase price adjustments in 2012 of $0.2 million that reduced the BSI goodwill to $7.6 million and recorded this change retroactively to 2011 bringing the total goodwill for this segment to $12.2 million as of December 31, 2013. We also recorded additions to goodwill of $0.7 million in our Recovery Audit Services – Europe/Asia-Pacific segment in 2012 relating to our acquisitions in 2012 of two third-party audit firms to which we had subcontracted a portion of our audit services (“associate migrations”) bringing the total goodwill for this segment to $0.9 million as of December 31, 2013. During 2015, we recorded goodwill of 0.2 million in our Adjacent Services segment relating to the acquisition of the Supplier Information Management ("SIM") business from Global Edge.
In October 2014, we divested certain previously acquired assets within our Adjacent Services segment that were related to our Chicago, Illinois-based consulting business (see Note 12 below). The goodwill from the 2010 purchase of TJG Holdings LLC was disposed of as a result of this divestiture. During August 2015, we divested certain assets from a document service offering within our Recovery Audit Services - Americas segment and disposed of (1.4) million of associated goodwill.
(b) Intangible Assets
Intangible assets consist principally of amounts we assigned to customer relationships, trademarks, non-compete agreements and trade names in conjunction with business acquisitions. Changes in gross carrying amounts for intangible assets in 2015 related primarily to the divestiture of certain assets from a document service offering ("SDS assets"). Changes in gross carrying amounts for intangible assets in 2014 related primarily to the divestiture of certain previously acquired assets within our Adjacent Services segment that were related to our Chicago, Illinois-based consulting business ("TJG assets"). There were no changes in gross carrying amounts for intangible assets in 2013, outside of foreign currency adjustments. Note 12 – Business Acquisitions and Divestitures below includes a more detailed description of the divestiture in 2014 and recent acquisitions. Certain of our intangible assets associated with acquisitions of assets or businesses by our foreign subsidiaries are denominated in the local currency of such subsidiary and therefore are subject to foreign currency ("FX") adjustments. We present the amounts for these transactions in United States dollars utilizing foreign currency exchange rates as of the respective balance sheet dates.
Amortization expense relating to intangible assets, other than acquired work in process, was $2.5 million in 2015, $3.5 million in 2014 and $4.8 million in 2013. As of December 31, 2015 and based on our current amortization methods, we project amortization expense relating to intangible assets for the next five years will be $1.5 million in 2016, $1.2 million in 2017, $1.1 million in 2018, $1.0 million in 2019 and $0.9 million in 2020. We generally use accelerated amortization methods for customer relationships and trade names, and straight-line amortization for non-compete agreements.
57
PRGX GLOBAL, INC. AND SUBSIDIARIES
NOTES TO CONSOLIDATED FINANCIAL STATEMENTS – (Continued)
58
PRGX GLOBAL, INC. AND SUBSIDIARIES
NOTES TO CONSOLIDATED FINANCIAL STATEMENTS – (Continued)
Changes in noncurrent intangible assets during 2015 and 2014 were as follows (in thousands):
Customer Relationships | Trademarks | Non- compete Agreements | Trade Names | Total | ||||||||||||||||
Gross carrying amount: | ||||||||||||||||||||
Balance, January 1, 2014 | $ | 39,815 | $ | 1,090 | $ | 2,529 | $ | 2,865 | $ | 46,299 | ||||||||||
Disposition of TJG assets | (829 | ) | — | (808 | ) | (665 | ) | (2,302 | ) | |||||||||||
FX adjustments and other | (490 | ) | (31 | ) | (64 | ) | — | (585 | ) | |||||||||||
Balance, December 31, 2014 | 38,496 | 1,059 | 1,657 | 2,200 | 43,412 | |||||||||||||||
Disposition of SDS assets | (291 | ) | (101 | ) | (126 | ) | — | (518 | ) | |||||||||||
FX adjustments and other | (421 | ) | (27 | ) | (54 | ) | — | (502 | ) | |||||||||||
Balance, December 31, 2015 | $ | 37,784 | $ | 931 | $ | 1,477 | $ | 2,200 | $ | 42,392 | ||||||||||
Accumulated amortization: | ||||||||||||||||||||
Balance, January 1, 2014 | $ | (27,168 | ) | $ | (700 | ) | $ | (2,142 | ) | $ | (2,707 | ) | $ | (32,717 | ) | |||||
Amortization expense | (3,122 | ) | (197 | ) | (137 | ) | (75 | ) | (3,531 | ) | ||||||||||
Disposition of TJG assets | 371 | — | 808 | 582 | 1,761 | |||||||||||||||
FX adjustments and other | 423 | 28 | 63 | — | 514 | |||||||||||||||
Balance, December 31, 2014 | (29,496 | ) | (869 | ) | (1,408 | ) | (2,200 | ) | (33,973 | ) | ||||||||||
Amortization expense | (2,211 | ) | (125 | ) | (122 | ) | — | (2,458 | ) | |||||||||||
Disposition of SDS assets | 64 | 87 | 95 | — | 246 | |||||||||||||||
FX adjustments and other | 397 | 26 | 54 | — | 477 | |||||||||||||||
Balance, December 31, 2015 | $ | (31,246 | ) | $ | (881 | ) | $ | (1,381 | ) | $ | (2,200 | ) | $ | (35,708 | ) | |||||
Net carrying amount: | ||||||||||||||||||||
Balance, December 31, 2014 | $ | 9,000 | $ | 190 | $ | 249 | $ | — | $ | 9,439 | ||||||||||
Balance, December 31, 2015 | $ | 6,538 | $ | 50 | $ | 96 | $ | — | $ | 6,684 | ||||||||||
Estimated useful life (years) | 6-20 years | 6 years | 1-5 years | 4-5 years | ||||||||||||||||
(5) DEBT
On January 19, 2010, we entered into a four-year revolving credit and term loan agreement with SunTrust Bank (“SunTrust”). The SunTrust credit facility initially consisted of a $15.0 million committed revolving credit facility and a $15.0 million term loan. The SunTrust term loan required quarterly principal payments of $0.8 million beginning in March 2010, and a final principal payment of $3.0 million due in January 2014 that we paid in December 2013. There have been no borrowings under the revolving credit portion of the SunTrust credit facility. The SunTrust credit facility is guaranteed by the Company and all of its material domestic subsidiaries and secured by substantially all of the assets of the Company.
Prior to the January 2014 amendment to the SunTrust credit facility described below, amounts available under the SunTrust revolver were based on eligible accounts receivable and other factors. Interest on both the revolver and term loan was payable monthly and accrued at an index rate using the one-month LIBOR rate, plus an applicable margin as determined by the loan agreement. The applicable interest rate margin varied from 2.25% per annum to 3.5% per annum, dependent on our consolidated leverage ratio, and was determined in accordance with a pricing grid under the SunTrust loan agreement. The applicable margin was 2.25% and the interest rate was approximately 2.43% at December 31, 2013. We also paid a commitment fee of 0.5% per annum, payable quarterly, on the unused portion of the $15.0 million SunTrust revolving credit facility. The weighted-average interest rate on term loan balances outstanding under the SunTrust credit facility during 2013, including fees, was 4.1%. We made mandatory principal payments on the SunTrust term loan totaling $3.0 million and the final principal payment of $3.0 million during the year ended December 31, 2013.
The SunTrust credit facility includes customary affirmative, negative, and financial covenants binding on the Company, including delivery of financial statements and other reports, maintenance of existence, and transactions with affiliates. The negative covenants limit the ability of the Company, among other things, to incur debt, incur liens, make investments, sell assets or declare or pay dividends on its capital stock. The financial covenants included in the SunTrust credit facility, among
59
PRGX GLOBAL, INC. AND SUBSIDIARIES
NOTES TO CONSOLIDATED FINANCIAL STATEMENTS – (Continued)
other things, limit the amount of capital expenditures the Company can make, set forth maximum leverage and net funded debt ratios for the Company and a minimum fixed charge coverage ratio, and also require the Company to maintain minimum consolidated earnings before interest, taxes, depreciation and amortization. In addition, the SunTrust credit facility includes customary events of default.
On January 17, 2014, we entered into an amendment of the SunTrust credit facility that increased the committed revolving credit facility from $15.0 million to $25.0 million, lowered the applicable margin to a fixed rate of 1.75%, eliminated the provision limiting availability under the revolving credit facility based on eligible accounts receivable and extended the scheduled maturity of the revolving credit facility to January 16, 2015 (subject to earlier termination as provided therein). We also paid a commitment fee of 0.5% per annum, payable quarterly, on the unused portion of the SunTrust revolving credit facility through the amendment date below.
On December 23, 2014, we entered into an amendment of the SunTrust credit facility that reduced the committed revolving credit facility from $25.0 million to $20.0 million. The credit facility bears interest at a rate per annum comprised of a specified index rate based on one-month LIBOR, plus an applicable margin (1.75% per annum). The index rate is determined as of the first business day of each calendar month. With the provision of a fixed applicable margin of 1.75% per the amendment of the SunTrust credit facility, the interest rate that would have applied at December 31, 2015, had any borrowings been outstanding, was approximately 1.99%. The credit facility includes two financial covenants (a maximum leverage ratio and a minimum fixed charge coverage ratio) that apply only if we have borrowings under the credit facility that arise or remain outstanding during the final 30 calendar days of any fiscal quarter. These financial covenants also will be tested, on a modified pro forma basis, in connection with each new borrowing under the credit facility. This amendment also extended the scheduled maturity of the revolving credit facility to December 23, 2017 and lowered the commitment fee to 0.25% per annum, payable quarterly, on the unused portion of the revolving credit facility. The weighted-average interest rate for the commitment fee due on the revolving credit facility was 0.25% in 2015 and 0.5% in 2014.
As of December 31, 2015, we had no outstanding borrowings under the SunTrust credit facility. The Company was in compliance with the covenants in its SunTrust credit facility as of December 31, 2015.
Future Minimum Payments
There were no future minimum principal payments of debt as of December 31, 2015 and 2014.
(6) LEASE COMMITMENTS
PRGX is committed under noncancelable lease arrangements for facilities and equipment. Rent expense, excluding costs associated with the termination of noncancelable lease arrangements, was $4.6 million in 2015, $6.0 million in 2014 and $6.3 million in 2013.
In January 2014, we amended the lease for our principal executive offices to extend the term through December 31, 2021, reduce the lease payment for 2014, and reduce the space under lease from approximately 132,000 square feet to approximately 58,000 square feet effective January 1, 2015. As of December 31, 2015, we had no subleased property. Starting in February 2016 we subleased approximately 3,000 square feet.
We have entered into several operating lease agreements that contain provisions for future rent increases, free rent periods or periods in which rent payments are reduced (abated). We charge the total amount of rental payments due over the lease term to rent expense on the straight-line, undiscounted method over the lease terms.
60
PRGX GLOBAL, INC. AND SUBSIDIARIES
NOTES TO CONSOLIDATED FINANCIAL STATEMENTS – (Continued)
Future minimum lease payments under noncancelable operating leases including the amended lease for our principal executive offices, are as follows (in thousands):
Year Ending December 31, | Amount | ||||
2016 | $ | 3,883 | |||
2017 | 2,990 | ||||
2018 | 2,200 | ||||
2019 | 2,058 | ||||
2020 | 1,845 | ||||
Thereafter | 1,654 | ||||
Total payments | $ | 14,630 | |||
(7) INCOME TAXES
Income (loss) before income taxes from continuing operations relate to the following jurisdictions (in thousands):
Years Ended December 31, | ||||||||||||
2015 | 2014 | 2013 | ||||||||||
United States | $ | (244 | ) | $ | (3,369 | ) | $ | (3,217 | ) | |||
Foreign | 2,152 | 3,911 | 8,026 | |||||||||
$ | 1,908 | $ | 542 | $ | 4,809 | |||||||
The provision for income taxes for continuing operations consists of the following (in thousands):
Years Ended December 31, | ||||||||||||
2015 | 2014 | 2013 | ||||||||||
Current: | ||||||||||||
Federal | $ | — | $ | — | $ | — | ||||||
State | (13 | ) | (11 | ) | (452 | ) | ||||||
Foreign | 1,494 | 1,686 | 3,230 | |||||||||
1,481 | 1,675 | 2,778 | ||||||||||
Deferred: | ||||||||||||
Federal | — | — | — | |||||||||
State | — | — | — | |||||||||
Foreign | (1,112 | ) | 1,566 | (23 | ) | |||||||
(1,112 | ) | 1,566 | (23 | ) | ||||||||
Total | $ | 369 | $ | 3,241 | $ | 2,755 | ||||||
61
PRGX GLOBAL, INC. AND SUBSIDIARIES
NOTES TO CONSOLIDATED FINANCIAL STATEMENTS – (Continued)
The significant differences between the U.S. federal statutory tax rate of 34% and the Company’s effective income tax expense for earnings (in thousands) are as follows:
Years Ended December 31, | ||||||||||||
2015 | 2014 | 2013 | ||||||||||
Statutory federal income tax rate | $ | 649 | $ | 184 | $ | 1,635 | ||||||
State income taxes, net of federal effect | (240 | ) | (189 | ) | (657 | ) | ||||||
Deferred tax true-up | 8,078 | — | — | |||||||||
Change in deferred tax asset valuation allowance | (6,729 | ) | 2,094 | (904 | ) | |||||||
Foreign taxes in excess of U.S. statutory rate | (223 | ) | 714 | 1,784 | ||||||||
Compensation deduction limitation | (1,201 | ) | 381 | 820 | ||||||||
Other, net | 35 | 57 | 77 | |||||||||
Total | $ | 369 | $ | 3,241 | $ | 2,755 | ||||||
The reconciliations shown above reflect changes to prior period schedules as a result of the reporting of discontinued operations for those periods. Additionally, it has been determined that permanent adjustments for compensation deduction limitations were inappropriately applied in 2014 and 2013. This correction is reflected as a credit in the rate reconciliation for 2015. There was an offsetting increase in the valuation allowance for the 2015 deduction recorded.
The tax effects of temporary differences and carry-forwards that give rise to deferred tax assets and liabilities consist of the following (in thousands):
Years Ended December 31, | ||||||||
2015 | 2014 | |||||||
Deferred income tax assets: | ||||||||
Accounts payable and accrued expenses | $ | 954 | $ | 1,712 | ||||
Accrued payroll and related expenses | 1,713 | 2,530 | ||||||
Stock-based compensation expense | 2,668 | 10,226 | ||||||
Depreciation of property and equipment | 3,061 | 5,480 | ||||||
Capitalized software | 94 | — | ||||||
Non-compete agreements | — | 1 | ||||||
Unbilled receivables and refund liabilities | 2,029 | 904 | ||||||
Operating loss carry-forwards of foreign subsidiary | 3,275 | 1,920 | ||||||
Federal operating loss carry-forwards | 31,884 | 30,669 | ||||||
State operating loss carry-forwards | 4,038 | 2,671 | ||||||
Other | 883 | 1,930 | ||||||
Gross deferred tax assets | 50,599 | 58,043 | ||||||
Less valuation allowance | 45,565 | 52,002 | ||||||
Gross deferred tax assets net of valuation allowance | 5,034 | 6,041 | ||||||
Deferred income tax liabilities: | ||||||||
Intangible assets | 2,775 | 3,049 | ||||||
Capitalized software | — | 1,834 | ||||||
Other | 898 | 1,117 | ||||||
Gross deferred tax liabilities | 3,673 | 6,000 | ||||||
Net deferred tax assets | $ | 1,361 | $ | 41 | ||||
During 2015, the Company undertook a detailed review of the Company's deferred taxes and it was determined that some reclassifications and adjustments were needed. All adjustments were offset by changes to the Company's valuation allowance and have been reflected in the 2015 year end balances noted above.
62
PRGX GLOBAL, INC. AND SUBSIDIARIES
NOTES TO CONSOLIDATED FINANCIAL STATEMENTS – (Continued)
Our reported effective tax rates on income approximated 19.3% in 2015, 598.0% in 2014, and 57.3% in 2013. Reported income tax expense in each year primarily results from taxes on the income of foreign subsidiaries. The effective tax rates generally differ from the expected tax rate primarily due to the Company’s deferred tax asset valuation allowance on the domestic earnings and taxes on income of foreign subsidiaries.
We reduce our deferred tax assets by a valuation allowance if it is more likely than not that some portion or all of a deferred tax asset will not be realized. The ultimate realization of deferred tax assets is dependent upon the generation of future taxable income during the periods in which those temporary differences are deductible. In making this determination, we consider all available positive and negative evidence affecting specific deferred tax assets, including our past and anticipated future performance, the reversal of deferred tax liabilities, the length of carry-back and carry-forward periods and the implementation of tax planning strategies. Since this evaluation requires consideration of future events, significant judgment is required in making the evaluation, and our conclusion could be materially different should certain of our expectations not be met.
Objective positive evidence is necessary to support a conclusion that a valuation allowance is not needed for all or a portion of deferred tax assets when significant negative evidence exists. Cumulative tax losses in recent years are the most compelling form of negative evidence considered by management in this determination. As of December 31, 2015, management determined that based on all available evidence, a valuation allowance was required for all U.S. deferred tax assets due to losses incurred for income tax reporting purposes for the past several years. We recorded a valuation allowance of $45.6 million as of December 31, 2015, representing a change of $6.4 million from the valuation allowance of $52.0 million recorded as of December 31, 2014.
In 2015, management determined that a valuation allowance was no longer required against the deferred tax assets of one of its foreign subsidiaries. As of December 31, 2015, we had gross deferred tax assets of $1.5 million relating to this subsidiary. The benefit of these deferred tax assets is reflected as a credit to tax expense during the year ended December 31, 2015.
As of December 31, 2015, we had approximately $91.1 million of U.S. federal loss carry-forwards available to reduce future U.S. federal taxable income. The U.S. federal loss carry-forwards expire through 2034. As of December 31, 2015, we had approximately $139.2 million of state loss carry-forwards available to reduce future state taxable income. The state loss carry-forwards expire to varying degrees between 2020 and 2034 and are subject to certain limitations. The state loss carry-forwards at December 31, 2015, reflect adjustments for prior period write-downs associated with ownership changes for state tax purposes.
Generally, we have not provided deferred taxes on the undistributed earnings of international subsidiaries as we consider these earnings to be permanently reinvested. As it relates to the earnings of our Canadian and Brazilian subsidiaries, we assert that we are not permanently reinvested. We provided additional deferred taxes of $0.3 million in 2015, $0.2 million in 2014, and $0.4 million in 2013 representing the estimated withholding tax liability due if such amounts are repatriated. We did not provide additional incremental U.S. income tax expense on these amounts as the Canadian subsidiary is classified as a branch for U.S. income tax purposes and our Brazilian subsidiary did not have undistributed earnings during the year.
On March 17, 2006, the Company experienced an ownership change as defined under Section 382 of the Internal Revenue Code (“IRC”). This ownership change resulted in an annual IRC Section 382 limitation that limits the use of certain tax attribute carry-forwards and also resulted in the write-off of certain deferred tax assets and the related valuation allowances that the Company recorded in 2006. Of the $91.1 million of U.S. federal loss carry-forwards available to the Company, $13.8 million of the loss carry-forwards are subject to an annual usage limitation of $1.4 million. The Company has reviewed subsequent potential ownership changes as defined under IRC Section 382 and has determined that on August 4, 2008, the Company experienced an additional ownership change. This subsequent ownership change did not decrease the original limitation nor did it impact the Company’s financial position, results of operations, or cash flows.
We apply a “more-likely-than-not” recognition threshold and measurement attribute for the financial statement recognition and measurement of a tax position taken or expected to be taken in a tax return. We refer to GAAP for guidance on derecognition, classification, interest and penalties, accounting in interim periods, disclosure, and transition. Our policy for recording potential interest and penalties associated with uncertain tax positions is to record such items as a component of income before income taxes. A number of years may elapse before a particular tax position is audited and finally resolved or when a tax assessment is raised. The number of years subject to tax assessments also varies by tax jurisdictions. As a part of an ongoing Canadian tax audit, we continue to defend our tax position related to the valuation of an intercompany transaction. While we have established accruals for this matter, an assessment by the Canadian Revenue Authority may exceed such amounts.
A reconciliation of our beginning and ending amount of unrecognized tax benefits and related accrued interest thereon is as follows:
63
PRGX GLOBAL, INC. AND SUBSIDIARIES
NOTES TO CONSOLIDATED FINANCIAL STATEMENTS – (Continued)
Unrecognized Tax Benefits | Accrued Interest and Penalties | |||||||
Balance at January 1, 2013 | $ | 2,197 | $ | 1,460 | ||||
Additions based on tax positions related to the current year | — | — | ||||||
Additions based on tax positions related to the prior years | — | 119 | ||||||
Decrease based on payments made during the year | (932 | ) | (385 | ) | ||||
Decreases based on tax positions related to the prior years | $ | (541 | ) | $ | (934 | ) | ||
Balance at December 31, 2013 | $ | 724 | $ | 260 | ||||
Additions based on tax positions related to the current year | — | — | ||||||
Additions based on tax positions related to the prior years | — | 33 | ||||||
Decreases based on payments made during the year | — | — | ||||||
Decreases based on tax positions related to the prior years | (47 | ) | (73 | ) | ||||
Balance at December 31, 2014 | $ | 677 | $ | 220 | ||||
Additions based on tax positions related to the current year | — | — | ||||||
Additions based on tax positions related to the prior years | — | 24 | ||||||
Decreases based on payments made during the year | — | — | ||||||
Decreases based on tax positions related to the prior years | (142 | ) | (42 | ) | ||||
Balance at December 31, 2015 | $ | 535 | $ | 202 | ||||
The decreases in the unrecognized tax benefits and the related accrued interest and penalties in 2015 and 2014 occurred for several reasons, including the expiration of the statute of limitations for certain of these taxes in several states and in two foreign jurisdictions, completion of an audit by a foreign jurisdiction that resulted in a lower tax assessment than we had estimated, and the imposition of limitations on our potential liability resulting from our participation in voluntary disclosure agreement processes with several states. Due to the complexity of the tax rules underlying these unrecognized tax benefits, and the unclear timing of tax audits, tax agency determinations, and other events, we cannot establish reasonably reliable estimates for the periods in which the cash settlement of these liabilities will occur.
We file U.S., state, and foreign income tax returns in jurisdictions with varying statutes of limitations. As of December 31, 2015, the 2012 through 2014 tax years generally remain subject to examination by federal and most state and foreign tax authorities. The use of net operating losses generated in tax years prior to 2012 may also subject returns for those years to examination.
(8) EMPLOYEE BENEFIT PLANS
We maintain a defined contribution retirement plan (the "Plan") in accordance with Section 401(k) of the Internal Revenue Code, which allows eligible participating employees to defer receipt of up to 50% of their annual compensation and contribute such amount to one or more investment funds. We match employee contributions in a discretionary amount to be determined by management and approved by the Board of Directors each plan year up to the lesser of 6% of an employee’s annual compensation or $3,000 per participant. We also may make additional discretionary contributions to the Plan as determined by management and approved by the Board of Directors each plan year. Company matching funds and discretionary contributions vest 100% after three years of service for participants who either had attained three or more years of service or were hired on or after January 1, 2012. For all other participants, company matching funds and discretionary contributions vest at the rate of 20% after two years of service and 100% after three years of service. We amended the Plan in 2013 to add Roth 401(k) plan features that allow participating employees to make post-tax contributions in addition to, or in lieu of, the pre-tax contributions allowed under the Plan. Company matching funds are made on a pre-tax basis for both pre-tax and post-tax employee contributions, and are subject to the above limitations based on the aggregate pre-tax and post-tax contribution by the participant. The Company contributed to the Plan approximately $0.8 million in 2015, $1.0 million in 2014 and $1.1 million in 2013.
64
PRGX GLOBAL, INC. AND SUBSIDIARIES
NOTES TO CONSOLIDATED FINANCIAL STATEMENTS – (Continued)
(9) CAPITAL STRUCTURE
Effective July 31, 2000, the Board of Directors amended the Company’s Articles of Incorporation to establish a new series of stock, which is designated as participating preferred stock. The Company’s remaining, undesignated preferred stock may be issued at any time or from time to time in one or more series with such designations, powers, preferences, rights, qualifications, limitations and restrictions (including dividend, conversion and voting rights) as may be determined by the Board of Directors, without any further votes or action by the shareholders. As of December 31, 2015 and 2014, the Company had no preferred stock outstanding.
On December 11, 2012, we closed a public offering of 6,249,234 shares of our common stock, which consisted of 2,500,000 shares sold by us and 3,749,234 shares sold by certain selling shareholders, at a price to the public of $6.39 per share. The net proceeds to us from the public offering, after deducting underwriting discounts and commissions and offering expenses, were $14.7 million. We did not receive any proceeds from the sale of shares by the selling shareholders. In addition, the underwriters elected to exercise an overallotment option for an additional 687,385 shares, and completed the additional sale on January 8, 2013. The net proceeds to us from the overallotment, after deducting underwriting discounts and commission and offering expenses, were $4.1 million.
In partial satisfaction of a business acquisition obligation, we issued 187,620 shares of our common stock having a value of $1.3 million in the year ended December 31, 2014 and 217,155 shares of our common stock having a value of $1.5 million in the year ended December 31, 2013.
On February 21, 2014, our Board of Directors authorized a stock repurchase program under which we could repurchase up to $10.0 million of our common stock from time to time through March 31, 2015. On March 25, 2014, our Board of Directors authorized a $10.0 million increase to the stock repurchase program, bringing the total amount of its common stock that the Company could repurchase under the program to $20.0 million. On October 24, 2014, our Board of Directors authorized a $20.0 million increase to the stock repurchase program, increasing the total share repurchase program to $40.0 million, and extended the duration of the program to December 31, 2015. In October 2015, our Board of Directors authorized an additional $10.0 million increase to the stock repurchase program, increasing the total share repurchase program to $50.0 million, and extended the duration of the program to December 31, 2016. We repurchased 4,118,386 shares of our common stock during the year ended December 31, 2015 for $18.1 million. We repurchased 3,605,142 shares of our common stock during the year ended December 31, 2014 for $22.7 million.
Pursuant to exercises of outstanding stock options, we issued 29,128 shares of our common stock having a value of $91,000 in the year ended December 31, 2015 and 716,780 shares of our common stock having a value of $2.8 million in the year ended December 31, 2014. Stock option exercises during the year ended December 31, 2014 primarily consisted of exercises by former executive officers of the Company.
(10) COMMITMENTS AND CONTINGENCIES
Legal Proceedings
We are party to a variety of legal proceedings arising in the normal course of business. While the results of these proceedings cannot be predicted with certainty, management believes that the final outcome of these proceedings will not have a material adverse effect on our financial position, results of operations or cash flows.
65
PRGX GLOBAL, INC. AND SUBSIDIARIES
NOTES TO CONSOLIDATED FINANCIAL STATEMENTS – (Continued)
(11) STOCK-BASED COMPENSATION
The Company currently has two stock-based compensation plans under which awards have been granted: (1) the 2006 Management Incentive Plan (“2006 MIP”); and (2) the 2008 Equity Incentive Plan (“2008 EIP”) (collectively, the “Plans”). The Company generally issues authorized but previously unissued shares to satisfy stock option exercises, grants of restricted stock awards and vesting of restricted stock units and settlements of 2006 MIP Performance Units.
2008 EIP Awards
During the first quarter of 2008, the Board of Directors of the Company adopted the 2008 EIP, which was approved by the shareholders at the annual meeting of the shareholders on May 29, 2008. The 2008 EIP authorizes the grant of incentive and non-qualified stock options, stock appreciation rights, restricted stock, restricted stock units and other incentive awards. Two million shares of the Company’s common stock initially were reserved for issuance under the 2008 EIP pursuant to award grants to key employees, directors and service providers. The options granted pursuant to the 2008 EIP generally have seven year terms.
An amendment to the 2008 EIP was adopted by the Company’s Board of Directors in April 2010 and approved at the Company’s annual meeting of shareholders held on June 15, 2010. This amendment, among other things, increased the number of shares reserved for issuance under the 2008 EIP by 3,400,000 shares to a total of 5,400,000 shares and provides that restricted stock awards and other full value awards will count as 1.41 shares against the available pool of shares under the plan.
An amendment to the 2008 EIP was adopted by the Company’s Board of Directors in April 2012 and approved at the Company’s annual meeting of shareholders held on June 19, 2012. This amendment increased the number of shares reserved for issuance under the 2008 EIP by 2,200,000 shares to a total of 7,600,000 shares.
An amendment to the 2008 EIP was adopted by the Company's Board of Directors in April 2014 and approved at the Company’s annual meeting of shareholders held on June 24, 2014. This amendment increased the number of shares reserved for issuance under the 2008 EIP by 3,000,000 shares to a total of 10,600,000 shares. Any shares issued in connection with an award against this 3,000,000 share pool will count against the available pool of shares on a one-to-one basis. As of December 31, 2015, there were approximately 1.1 million shares available for future grants under the 2008 EIP.
66
PRGX GLOBAL, INC. AND SUBSIDIARIES
NOTES TO CONSOLIDATED FINANCIAL STATEMENTS – (Continued)
Stock options granted under the 2008 EIP generally vest in equal annual increments over the vesting period, which typically is three years for employees and one year for directors. The following table summarizes stock option grants during the years ended December 31, 2015, 2014, and 2013:
Grantee Type | # of Options Granted | Vesting Period | Weighted Average Exercise Price | Weighted Average Grant Date Fair Value | |||||||||
2015 | |||||||||||||
Director group | 249,273 | 1 year or less | $ | 4.49 | $ | 2.44 | |||||||
Employee group | 17,092 | 3 | $ | 3.99 | $ | 1.33 | |||||||
Employee inducement (1) | 135,000 | 3 years | $ | 5.51 | $ | 1.42 | |||||||
2014 | |||||||||||||
Director group | 51,276 | 1 year or less | $ | 6.45 | $ | 1.89 | |||||||
Employee group (2) | 1,480,000 | 3 years | $ | 6.99 | $ | 1.81 | |||||||
Employee inducement (3) | 270,000 | 3 years | $ | 6.64 | $ | 1.71 | |||||||
2013 | |||||||||||||
Director group | 75,490 | 1 year or less | $ | 5.67 | $ | 2.00 | |||||||
Director group | 17,092 | 3 years | $ | 6.83 | $ | 3.76 | |||||||
Employee group | 549,875 | 3 years | $ | 5.75 | $ | 2.48 | |||||||
Employee inducement (4) | 20,000 | 3 years | $ | 7.14 | $ | 3.81 | |||||||
(1) | The Company granted non-qualified stock options outside its existing stock-based compensation plans in the first nine months of 2015 to three employees in connection with the employees joining the Company. |
(2) | The weighted average exercise price for these options is calculated based on an exercise price of $6.36 for the options that vest on June 27, 2015, $6.99 for the options that vest on June 27, 2016 and $7.63 for the options that vest on June 27, 2017. |
(3) | The Company granted non-qualified stock options outside its existing stock-based compensation plans in the third quarter of 2014 to two executives in connection with the executives joining the Company. |
(4) | The Company granted non-qualified performance-based stock options outside its existing stock-based compensation plans in the first quarter of 2013 to one employee in connection with the employee joining the Company. |
Nonvested stock awards, including both restricted stock and restricted stock units, generally are nontransferable until vesting and the holders are entitled to receive dividends with respect to the nonvested shares. Prior to vesting, the grantees of restricted stock are entitled to vote the shares, but the grantees of restricted stock units are not entitled to vote the shares. Generally, nonvested stock awards vest in equal annual increments over the vesting period, which typically is three years for employees and one year for directors.
67
PRGX GLOBAL, INC. AND SUBSIDIARIES
NOTES TO CONSOLIDATED FINANCIAL STATEMENTS – (Continued)
The following table summarizes nonvested stock awards granted during the years ended December 31, 2015, 2014 and 2013:
Grantee Type | # of Shares Granted | Vesting Period | Weighted Average Grant Date Fair Value | ||||||
2015 | |||||||||
Director group | 4,273 | 1 year or less | $ | 4.02 | |||||
Director group | 17,092 | 3 years | $ | 3.99 | |||||
Employee group (1) | 2,493,333 | 2 years | $ | 3.99 | |||||
Employee inducement (2) | 10,000 | 3 years | $ | 5.29 | |||||
2014 | |||||||||
Director group | 51,276 | 1 year or less | $ | 6.45 | |||||
Employee group | 120,000 | 3 years | $ | 6.36 | |||||
Employee inducement (3) | 70,000 | 3 years | $ | 6.04 | |||||
2013 | |||||||||
Director group | 75,490 | 1 year or less | $ | 5.67 | |||||
Director group | 17,092 | 3 years | $ | 6.83 | |||||
Employee group | 599,875 | 3 years | $ | 5.82 | |||||
Employee inducement (4) | 20,000 | 3 years | $ | 7.14 | |||||
(1) | The Company granted nonvested performance-based stock awards (restricted stock units) in the first quarter of 2015 to eight executive officers totaling 1,325,000 units. During the third and fourth quarter of 2015, the Company issued 1,168,333 units to key employees. |
(2) | The Company granted nonvested stock awards (restricted stock) outside its existing stock-based compensation plans in the first quarter of 2015 to two employees in connection with the employees joining the Company. |
(3) | The Company granted nonvested stock awards (restricted stock) outside its existing stock-based compensation plans in the third quarter of 2014 to two executives in connection with the executives joining the Company. |
(4) | The Company granted nonvested performance-based stock awards (restricted stock) outside its existing stock-based compensation plans in the first quarter of 2013 to one employee in connection with the employee joining the Company. |
Performance-Based Restricted Stock Units
On March 30, 2015, eight executive officers of the Company were granted 1,325,000 performance-based restricted stock units (“PBUs”) under the 2008 EIP. Upon vesting, the PBUs will be settled by the issuance of Company common stock equal to 50% of the number of PBUs being settled and the payment of cash in an amount equal to 50% of the fair market value of that number of shares of common stock equal to the number of PBUs being settled. The PBUs vest and become payable based on the cumulative adjusted EBITDA that the Company (excluding the Healthcare Claims Recovery Audit business) achieves for the two-year performance period ending December 31, 2016. At the threshold performance level, 35% of the PBUs will become vested and payable; at the target performance level, 100% of the PBUs will become vested and payable; and at the maximum performance level, 200% of the PBUs will become vested and payable. If performance falls between the stated performance levels, the percentage of PBUs that shall become vested and payable will be based on straight line interpolation between such stated performance levels (although the PBUs may not become vested and payable for more than 200% of the PBUs and no PBUs shall become vested and payable if performance does not equal or exceed the threshold performance level).
On September 28, 2015, certain employees of the Company were granted 1,123,333 PBUs under the 2008 EIP. On December 14, 2015, certain employees of the Company were granted an additional 45,000 PBUs under the 2008 EIP. Upon vesting, the PBUs will be settled by the issuance of Company common stock equal to 25% of the number of PBUs being settled and the payment of cash in an amount equal to 75% of the fair market value of that number of shares of common stock equal to the number of PBUs being settled. The PBUs vest and become payable based on the cumulative adjusted EBITDA that the Company (excluding the Healthcare Claims Recovery Audit business) achieves for the two-year performance period ending December 31, 2016. At the threshold performance level, 35% of the PBUs will become vested and payable and at the target performance level, 100% of the PBUs will become vested and payable. If performance falls between the stated performance levels, the percentage of PBUs that shall become vested and payable will be based on straight line interpolation between such stated performance levels (although the PBUs may not become vested and payable for more than 100% of the PBUs and no PBUs shall become vested and payable if performance does not equal or exceed the threshold performance level).
68
PRGX GLOBAL, INC. AND SUBSIDIARIES
NOTES TO CONSOLIDATED FINANCIAL STATEMENTS – (Continued)
During 2015, the PBUs were expensed at the target performance level based on management's estimates. During the fourth quarter of 2015, it was determined it was "not probable" that the threshold performance level would be achieved by the vesting period ending December 31, 2016 and the Company reversed approximately $0.8 million of expense incurred in the second quarter and $0.6 million of expense incurred in third quarter, a total of $1.4 million for the year ended December 31, 2015.
69
PRGX GLOBAL, INC. AND SUBSIDIARIES
NOTES TO CONSOLIDATED FINANCIAL STATEMENTS – (Continued)
A summary of option activity as of December 31, 2015, and changes during the year then ended is presented below:
Options | Shares | Weighted- Average Exercise Price (Per Share) | Weighted- Average Remaining Contractual Term | Aggregate Intrinsic Value ($ 000’s) | |||||||||
Outstanding at January 1, 2015 | 3,325,103 | $ | 6.66 | 4.67 years | $ | 711 | |||||||
Granted | 401,365 | 4.81 | |||||||||||
Exercised | (29,128 | ) | 3.13 | $ | 40 | ||||||||
Forfeited | (179,281 | ) | 6.40 | ||||||||||
Expired | (180,275 | ) | 9.63 | ||||||||||
Outstanding at December 31, 2015 | 3,337,784 | $ | 6.36 | 4.68 years | $ | 70 | |||||||
Exercisable at December 31, 2015 | 1,432,579 | $ | 8.09 | 3.49 years | $ | 70 | |||||||
The weighted-average grant date fair value of options granted was $2.32 per share in 2015, $1.80 per share in 2014 and $2.50 per share in 2013. The total intrinsic value of options exercised was $40 thousand in 2015, $1.7 million in 2014 and $0.4 million in 2013.
70
PRGX GLOBAL, INC. AND SUBSIDIARIES
NOTES TO CONSOLIDATED FINANCIAL STATEMENTS – (Continued)
For time-vested option grants that resulted in compensation expense recognition, we used the following assumptions in our Black-Scholes valuation models:
Years Ended December 31, | ||||||
2015 | 2014 | 2013 | ||||
Risk-free interest rates | 0.80% - 1.59% | 0.88% - 1.79% | 0.37% - 1.55% | |||
Dividend yields | —% | —% | —% | |||
Volatility factor of expected market price | .323 - .733 | .370 - .390 | .446 - .675 | |||
Weighted-average expected term of option | 3.1 - 5 years | 3.5 - 4.5 years | 3.7 - 5 years | |||
Forfeiture rate | —% | —% | —% | |||
A summary of nonvested stock awards (restricted stock and restricted stock units) activity as of December 31, 2015 and changes during the year then ended is presented below:
Nonvested Stock | Shares | Weighted Average Grant Date Fair Value (Per Share) | |||||
Nonvested at January 1, 2015 | 627,848 | $ | 6.40 | ||||
Granted | 2,564,698 | 4.00 | |||||
Vested | (275,053 | ) | 6.45 | ||||
Forfeited | (95,451 | ) | 4.14 | ||||
Nonvested at December 31, 2015 | 2,822,042 | $ | 4.30 | ||||
The weighted-average grant date fair value of nonvested stock awards (restricted stock and restricted stock units) granted was $4.00 per share in 2015, $6.29 per share in 2014 and $5.86 per share in 2013. The total vest date fair value of stock awards vested during the year was $1.2 million in 2015, $2.3 million in 2014 and $4.6 million in 2013.
2006 MIP Performance Units
At the annual meeting of shareholders held on August 11, 2006, the shareholders of the Company approved a proposal granting authorization to issue up to 2.1 million shares of the Company’s common stock under the 2006 MIP. At Performance Unit settlement dates, participants were issued that number of shares of Company common stock equal to 60% of the number of Performance Units being settled, and were paid in cash an amount equal to 40% of the fair market value of that number of shares of common stock equal to the number of Performance Units being settled. Prior to 2012, Performance Units were only granted in 2006 and 2007, and the last of such units were settled in May 2011.
On June 19, 2012, seven senior officers of the Company were granted 154,264 Performance Units under the 2006 MIP, comprising all remaining available awards under the 2006 MIP. The awards had an aggregate grant date fair value of $1.2 million and vest ratably over three years. Upon vesting, the Performance Units were settled by the issuance of Company common stock equal to 60% of the number of Performance Units being settled and the payment of cash in an amount equal to 40% of the fair market value of that number of shares of common stock equal to the number of Performance Units being settled.
During the year ended December 31, 2015, an aggregate of 16,530 Performance Units were settled, which resulted in the issuance of 9,918 shares of common stock and cash payments totaling less than $0.1 million. During the year ended December 31, 2014, an aggregate of 27,546 Performance Units were settled, which resulted in the issuance of 16,526 shares of common stock and cash payments totaling $0.1 million. Since the June 19, 2012 grant date to December 31, 2014, an aggregate of 137,740 Performance Units were settled by three current executive officers and three former executive officers, and 16,524 Performance Units were forfeited by one former executive officer. Such settlements resulted in the issuance of 79,356 shares of common stock and cash payments totaling $0.3 million. As of December 31, 2015, no Performance Units were outstanding. There was no settlement of Performance Units during 2012.
We recognized compensation expense of less than $0.1 million in 2015, $0.2 million in 2014 and less than $0.5 million in 2013 related to these 2006 MIP Performance Unit awards. We determined the amount of compensation expense recognized on the assumption that none of the Performance Unit awards would be forfeited and recorded actual forfeitures as incurred.
71
PRGX GLOBAL, INC. AND SUBSIDIARIES
NOTES TO CONSOLIDATED FINANCIAL STATEMENTS – (Continued)
Stock-based compensation charges aggregated $3.9 million in 2015 and $4.5 million in 2014 and $6.3 million in 2013. We include these charges in “Selling, general and administrative expenses” in the accompanying Consolidated Statements of Operations. At December 31, 2015, there was $1.9 million of unrecognized stock-based compensation expense related to stock options, restricted stock awards, restricted stock unit awards, and Performance Unit awards which we expect to recognize over a weighted-average period of 2.0 years.
(12) BUSINESS ACQUISITIONS AND DIVESTITURES
We completed several acquisitions and divestitures in recent years that we describe below. Generally, we acquire businesses that we believe will provide a strategic fit for our existing operations, cost savings and revenue synergies, or enable us to expand our capabilities in our Adjacent Services segment. We divest assets or businesses that we no longer find strategically aligned with our service offerings.
We allocate the total purchase price in a business acquisition to the fair value of identified assets acquired and liabilities assumed based on the fair values at the acquisition date, and record amounts exceeding the fair values as goodwill. If the fair value of the assets acquired exceeds the purchase price, we record this excess as a gain on bargain purchase. We determine the estimated fair values of intangible assets acquired using our estimates of future discounted cash flows to be generated by the acquired business over the estimated duration of those cash flows. We base the estimated cash flows on our projections of future revenue, cost of revenue, capital expenditures, working capital needs and tax rates. We estimate the duration of the cash flows based on the projected useful life of the assets and business acquired. We determine the discount rate based on specific business risk, cost of capital and other factors.
Etesius Limited
In February 2010, the Company’s UK subsidiary acquired all the issued and outstanding capital stock of Etesius Limited (“Etesius”), a privately-held European provider of purchasing and payables technologies and spend analytics based in Chelmsford, United Kingdom. We have included the results of operations of Etesius in our Adjacent Services segment results of operations since the acquisition date as we acquired Etesius with the intention of expanding our capabilities in this segment.
The financial terms of the Etesius share purchase agreement (“SPA”) required an initial payment to the Etesius shareholders of $2.8 million and a $0.3 million payment for obligations on behalf of Etesius shareholders which resulted in a total estimated purchase price value of approximately $3.1 million.
The SPA required deferred payments of $1.2 million over four years from the date of the SPA to certain selling shareholders who are now our employees. The SPA also provided for potential additional variable payments (“earn-out”) to these selling shareholders/employees over the same four-year period based on the financial performance of certain of the Company’s services lines, up to a maximum of $3.8 million. Because we were not obligated to make the deferred and earn-out payments upon the termination of employment of these employees under certain circumstances, we recognized these payments as compensation expense as earned. From the acquisition date to December 31, 2014, we paid $1.4 million of deferred payments and variable consideration. This amount consisted of the final $0.7 million of deferred payments paid in February 2014 and $0.2 million of variable consideration paid in August 2014. We currently estimate that we will not pay any additional variable consideration relating to these provisions resulting in no remaining amounts payable relating to this acquisition as of December 31, 2015 and 2014.
TJG Holdings LLC
In November 2010, we acquired the business and certain assets of TJG Holdings LLC (“TJG”), a privately-held provider of finance and procurement operations improvement services based in Chicago, Illinois. We have included the results of operations of TJG in our Adjacent Services segment results of operations since the acquisition date. We acquired TJG with the intention of expanding our financial advisory services business. We recorded goodwill in connection with this acquisition, representing the value of the assembled workforce, including a management team with deep industry knowledge. This goodwill was deductible for tax purposes until our divestiture of certain assets from this acquisition in October 2014 (see Divestitures below).
The financial terms of the TJG Asset Purchase Agreement required an initial payment to the TJG owners of $2.3 million. Additional variable consideration (“earn-out”) could be earned based on the operating results generated by the acquired business over the two years subsequent to the acquisition, up to a maximum of $1.9 million. We recorded an additional $1.4 million payable based on management’s estimate of the fair value of the earn-out liability. We calculated the earn-out liability based on estimated future discounted cash flows to be generated by the acquired business over a two year period. We determined the discount rate based on specific business risk, cost of capital and other factors. The total estimated purchase price was valued at approximately $3.7 million. From the acquisition date to December 31, 2013, we paid $1.9 million of the earn-
72
PRGX GLOBAL, INC. AND SUBSIDIARIES
NOTES TO CONSOLIDATED FINANCIAL STATEMENTS – (Continued)
out and recorded accretion and other adjustments of the liability of $0.5 million, resulting in no remaining earn-out payable as of December 31, 2013.
Associate Migrations
During 2012, we acquired the assets of several third-party audit firms to which we had subcontracted a portion of our audit services in our Recovery Audit Services – Europe/Asia-Pacific segment. We refer to the subcontractors as associates, and to the acquisitions as associate migrations. In an associate migration, we generally transfer all of the employees of the associate entity to PRGX, and continue to service the related clients with the same personnel as were providing services prior to the associate migration. We completed the associate migrations with the intention of providing more standardization and centralization of our audit procedures, thereby increasing client service while also decreasing costs. Generally, revenue remains unchanged as a result of an associate migration, and expenses change from a fixed percentage of revenue to a variable amount based on actual employee and related costs. The 2012 associate migrations included CRC Management Consultants LLP (“CRC”) in January 2012 for a purchase price valued at $1.0 million; QFS Ltd (“QFS”) in June 2012 for a purchase price valued at $0.4 million; and Nordic Profit Provider AB (“NPP”) in November 2012 for a purchase price valued at $0.1 million.
The allocation of the aggregate fair values of the assets acquired and purchase price for these associate migrations in 2012 is summarized as follows (in thousands):
Fair values of net assets acquired: | ||||
Equipment | $ | 10 | ||
Intangible assets, primarily non-compete agreements | 171 | |||
Working capital, including work in progress | 666 | |||
Goodwill | 695 | |||
Fair value of net assets acquired | $ | 1,542 | ||
Fair value of purchase price | $ | 1,542 | ||
Business Strategy, Inc.
In December 2011, we acquired BSI, based in Grand Rapids, Michigan, for a purchase price valued at $11.9 million. BSI was a provider of recovery audit and related procure-to-pay process improvement services for commercial clients, and a provider of customized software solutions and outsourcing solutions to improve back office payment processes. We have included the results of operations of Business Strategy, Inc. in our Recovery Audit Services – Americas segment and the results of operations of the affiliated company in our Adjacent Services segment results of operations since the acquisition date. These amounts aggregated $0.8 million of revenue and $0.1 million of net income in 2011 and $10.9 million of revenue and $1.5 million of net income in 2012. We acquired BSI with the intention of expanding our commercial recovery audit capabilities and to expand the services we offer to our clients.
The purchase price included an initial cash payment of $2.8 million and 640,614 shares of our common stock having a value of $3.7 million. An additional payment of approximately $0.7 million was due and paid in the first half of 2012 for working capital received in excess of a specified minimum level. We were subject to additional variable consideration of up to $5.5 million, payable via a combination of cash and shares of our common stock, based on the performance of the acquired businesses over a two-year period from the date of acquisition. We were also subject to additional consideration of up to $8.0 million, payable in cash over a period of two years, based on certain net cash fee receipts from a particular recovery audit claim at a specific client. We recorded an additional $4.9 million payable as of the acquisition date based on management’s estimate of the fair value of the variable consideration payable. We adjusted the $12.2 million initial estimates of the fair value of the assets and liabilities in 2012, resulting in reductions to goodwill of $0.2 million, and the fair value of the purchase price of $0.2 million, and recorded this change retroactively to 2011. The final goodwill amount of $7.6 million includes $1.5 million that is deductible for income tax purposes.
73
PRGX GLOBAL, INC. AND SUBSIDIARIES
NOTES TO CONSOLIDATED FINANCIAL STATEMENTS – (Continued)
The final allocation of the fair values of the assets acquired and purchase price is summarized as follows (in thousands):
Fair values of net assets acquired: | Final Allocation | |||
Equipment | $ | 70 | ||
Intangible assets, primarily customer relationships | 4,041 | |||
Working capital, including work in progress | 1,967 | |||
Deferred tax liabilities | (1,736 | ) | ||
Goodwill | 7,577 | |||
Fair value of net assets acquired | $ | 11,919 | ||
Fair value of purchase price | $ | 11,919 | ||
From the acquisition date to December 31, 2014, we paid $6.3 million of the earn-out liability consisting of cash payments of $3.6 million and 404,775 shares of our common stock having a value of $2.7 million. We also recorded accretion and other adjustments of the earn-out liability of $1.4 million, resulting in no remaining earn-out payable as of December 31, 2014.
The following unaudited pro forma condensed financial information presents the combined results of operations of the Company, BSI, CRC, QFS, and NPP as if the acquisitions had occurred as of January 1, 2011. The unaudited pro forma financial information is not indicative of, nor does it purport to project, the future financial position or operating results of the Company. Pro forma adjustments included in these amounts consist primarily of amortization expense associated with the intangible assets recorded in the allocation of the purchase price. The unaudited pro forma financial information excludes acquisition and integration costs and does not give effect to any estimated and potential cost savings or other operating efficiencies that could result from the acquisition. Unaudited pro forma condensed financial information, excluding divestitures, is as follows (in thousands):
Years Ended December 31, | ||||||||
2012 | 2011 | |||||||
Revenue | $ | 208,503 | $ | 210,073 | ||||
Net income (loss) | $ | 5,913 | $ | 4,341 | ||||
Global Edge
In December 2015, we acquired the Supplier Information Management business from Global Edge for a purchase price valued at $0.7 million. The Global EDGE SIM platform includes vendor master file cleanse, regulatory and sanction checks, supplier onboarding, vendor authentication and risk management services. The purchase price included an initial cash payment of $0.5 million and additional variable cash consideration based on the performance of the acquired businesses over a two year period from the date of acquisition valued at $0.2 million.
Divestitures
In October 2014, we divested certain assets within our Adjacent Services segment that were related to our Chicago, Illinois-based consulting business. These assets, previously acquired in November 2010 from TJG Holdings LLC, were sold to Salo, LLC, a Minnesota limited liability company. We received an initial cash payment of $1.1 million in connection with the closing of the transaction and recognized a loss on the sale of less than $0.1 million, which we recognized in Other loss in the Consolidated Statements of Operations. We have also received payment for working capital transferred to the buyer. In addition, we received $0.8 million in earn-out payments based on certain revenue recognized by the buyer in relation to the acquired business during the year following the closing date of the divestiture.
In August 2015, we divested certain assets from a document service offering purchased as part of the Business Strategy, Inc. acquisition in 2011.We did not receive any initial cash payments at closing of the transaction and recognized a loss on the sale of $1.6 million, which we recognized in Other loss in the Consolidated Statements of Operations. We may receive a portion of revenue recognized by the buyer for the period from January 1, 2016 to December 31, 2016 that is based on a percentage of revenue from the clients transferred in connection with the disposition. The revenue sharing percentage ranges from 10% to 30% based on the type of solution or service to be performed.
74
PRGX GLOBAL, INC. AND SUBSIDIARIES
NOTES TO CONSOLIDATED FINANCIAL STATEMENTS – (Continued)
(13) QUARTERLY RESULTS (UNAUDITED)
The following tables set forth certain unaudited condensed consolidated quarterly financial data for each of the last eight quarters during our fiscal years ended December 31, 2015 and 2014. We have derived the information from unaudited Condensed Consolidated Financial Statements that, in the opinion of management, reflect all adjustments (consisting only of normal recurring adjustments) necessary for a fair presentation of such quarterly information. The operating results for any quarter are not necessarily indicative of the results to be expected for any future period. The quarterly results are updated for continuing operations.
2015 Quarter Ended | 2014 Quarter Ended | |||||||||||||||||||||||||||||||
Mar. 31 | June 30 | Sept. 30 | Dec. 31 | Mar. 31 | June 30 | Sept. 30 | Dec. 31 | |||||||||||||||||||||||||
(In thousands, except per share data) | ||||||||||||||||||||||||||||||||
Revenue, net | $ | 32,985 | $ | 36,995 | $ | 33,365 | $ | 34,957 | $ | 36,783 | $ | 41,692 | $ | 42,844 | $ | 40,233 | ||||||||||||||||
Operating expenses: | ||||||||||||||||||||||||||||||||
Cost of revenue | 23,167 | 24,111 | 23,507 | 22,384 | 26,452 | 28,596 | 27,966 | 27,876 | ||||||||||||||||||||||||
Selling, general and administrative expenses | 7,944 | 9,185 | 8,284 | 6,871 | 9,352 | 10,484 | 9,952 | 8,793 | ||||||||||||||||||||||||
Depreciation of property and equipment | 1,279 | 1,294 | 1,255 | 1,489 | 1,562 | 1,552 | 1,406 | 1,505 | ||||||||||||||||||||||||
Amortization of intangible assets | 746 | 754 | 517 | 441 | 903 | 902 | 895 | 831 | ||||||||||||||||||||||||
Total operating expenses | 33,136 | 35,344 | 33,563 | 31,185 | 38,269 | 41,534 | 40,219 | 39,005 | ||||||||||||||||||||||||
Operating income (loss) from continuing operations | (151 | ) | 1,651 | (198 | ) | 3,772 | (1,486 | ) | 158 | 2,625 | 1,228 | |||||||||||||||||||||
Foreign currency transaction (gains) losses on short-term intercompany balances | 1,692 | (416 | ) | 654 | 235 | 15 | (163 | ) | 1,221 | 930 | ||||||||||||||||||||||
Interest expense (income), net | (42 | ) | (53 | ) | (8 | ) | (87 | ) | 54 | (43 | ) | (44 | ) | (44 | ) | |||||||||||||||||
Other (income) loss | — | — | 1,612 | (421 | ) | — | — | — | 57 | |||||||||||||||||||||||
Income (loss) from continuing operations before income taxes | (1,801 | ) | 2,120 | (2,456 | ) | 4,045 | (1,555 | ) | 364 | 1,448 | 285 | |||||||||||||||||||||
Income tax expense | 455 | 296 | 421 | (803 | ) | 113 | 186 | 554 | 2,388 | |||||||||||||||||||||||
Net income (loss) from continuing operations | (2,256 | ) | 1,824 | (2,877 | ) | 4,848 | (1,668 | ) | 178 | 894 | (2,103 | ) | ||||||||||||||||||||
Basic earnings (loss) per common share from continuing operations (1) | $ | (0.09 | ) | $ | 0.07 | $ | (0.11 | ) | $ | 0.19 | $ | (0.06 | ) | $ | 0.01 | $ | 0.03 | $ | (0.08 | ) | ||||||||||||
Diluted earnings (loss) per common share from continuing operations (1) | $ | (0.09 | ) | $ | 0.07 | $ | (0.11 | ) | $ | 0.19 | $ | (0.06 | ) | $ | 0.01 | $ | 0.03 | $ | (0.08 | ) | ||||||||||||
(1) | We calculate each quarter as a discrete period; the sum of the four quarters may not equal the calculated full-year amount. |
In the fourth quarter of 2015, we released a valuation allowance of $1.5 million against the net deferred tax assets of one of our foreign subsidiaries, which reduced our income tax expense for the period.
In the fourth quarter of 2014, we recorded a valuation allowance of $2.3 million against the net deferred tax assets of one of our foreign subsidiaries, which increased our income tax expense for the period.
(14) SUBSEQUENT EVENTS
The Company has evaluated subsequent events through the date of issuance of the Company's Audited Consolidated Financial Statements and determined that no subsequent events occurred that would require accrual or additional disclosure.
75
ITEM 9. Changes in and Disagreements with Accountants on Accounting and Financial Disclosure
None.
ITEM 9A. Controls and Procedures
Evaluation of Disclosure Controls and Procedures
The Company carried out an evaluation, under the supervision and with the participation of its management, including the Chief Executive Officer and Chief Financial Officer, of the effectiveness of the design and operation of the Company’s “disclosure controls and procedures” (as defined in the Exchange Act Rule 13a-15(e)) as of the end of the period covered by this report. Based upon that evaluation, the Chief Executive Officer and Chief Financial Officer concluded that the Company’s disclosure controls and procedures are effective as of December 31, 2015.
Changes in internal controls over financial reporting
During the fourth quarter of 2015, internal controls were designed and implemented to enhance the planning and review of tax provisions and positions by an additional member of the accounting department other than the preparer and reviewer in order to prevent and detect potential errors. These changes materially affected, or are reasonably likely to materially affect, our internal control over financial reporting. These controls have been tested and we found them to be effective as key controls had been designed and documented during the fourth quarter of 2015.
Management’s Annual Report on Internal Control Over Financial Reporting
The Company’s management is responsible for establishing and maintaining an adequate system of internal control over financial reporting, as defined in the Exchange Act Rule 13a-15(f). Our internal control system is designed to provide reasonable assurance regarding the preparation and fair presentation of financial statements for external purposes in accordance with generally accepted accounting principles. All internal control systems, no matter how well designed, have inherent limitations and can provide only reasonable assurance that the objectives of the internal control system are met. Under the supervision and with the participation of the Company’s management, including the Company’s President and Chief Executive Officer along with the Company’s Chief Financial Officer and Treasurer, the Company conducted an assessment of the effectiveness of internal control over financial reporting based on the framework (2013 Framework) in Internal Control – Integrated Framework issued by the Committee of Sponsoring Organizations of the Treadway Commission. Based on the assessment, management concluded that, as of December 31, 2015, the Company’s internal control over financial reporting is effective. The Company’s internal control over financial reporting as of December 31, 2015 has been audited by BDO USA, LLP, an independent registered public accounting firm, as stated in their report which is included herein, which expresses an unqualified opinion on the effectiveness of the Company’s internal control over financial reporting as of December 31, 2015.
Management’s report shall not be deemed filed for purposes of Section 18 of the Exchange Act.
76
Report of Independent Registered Public Accounting Firm
Board of Directors and Shareholders
PRGX Global, Inc.
Atlanta, Georgia
We have audited PRGX Global, Inc. and subsidiaries’ (the Company) internal control over financial reporting as of December 31, 2015, based on criteria established in Internal Control – Integrated Framework (2013) issued by the Committee of Sponsoring Organizations of the Treadway Commission (the COSO criteria). The Company’s management is responsible for maintaining effective internal control over financial reporting and for its assessment of the effectiveness of internal control over financial reporting, included in the accompanying Item 9A, “Management’s Annual Report on Internal Control Over Financial Reporting”. Our responsibility is to express an opinion on the Company’s internal control over financial reporting based on our audit.
We conducted our audit in accordance with the standards of the Public Company Accounting Oversight Board (United States). Those standards require that we plan and perform the audit to obtain reasonable assurance about whether effective internal control over financial reporting was maintained in all material respects. Our audit included obtaining an understanding of internal control over financial reporting, assessing the risk that a material weakness exists, and testing and evaluating the design and operating effectiveness of internal control based on the assessed risk. Our audit also included performing such other procedures as we considered necessary in the circumstances. We believe that our audit provides a reasonable basis for our opinion.
A company’s internal control over financial reporting is a process designed to provide reasonable assurance regarding the reliability of financial reporting and the preparation of financial statements for external purposes in accordance with generally accepted accounting principles. A company’s internal control over financial reporting includes those policies and procedures that (1) pertain to the maintenance of records that, in reasonable detail, accurately and fairly reflect the transactions and dispositions of the assets of the company; (2) provide reasonable assurance that transactions are recorded as necessary to permit preparation of financial statements in accordance with generally accepted accounting principles, and that receipts and expenditures of the company are being made only in accordance with authorizations of management and directors of the company; and (3) provide reasonable assurance regarding prevention or timely detection of unauthorized acquisition, use, or disposition of the company’s assets that could have a material effect on the financial statements.
Because of its inherent limitations, internal control over financial reporting may not prevent or detect misstatements. Also, projections of any evaluation of effectiveness to future periods are subject to the risk that controls may become inadequate because of changes in conditions, or that the degree of compliance with the policies or procedures may deteriorate.
In our opinion, PRGX Global, Inc. and subsidiaries maintained, in all material respects, effective internal control over financial reporting as of December 31, 2015, based on the COSO criteria.
We also have audited, in accordance with the standards of the Public Company Accounting Oversight Board (United States), the consolidated balance sheets of the Company as of December 31, 2015 and 2014, and the related consolidated statements of operations, comprehensive loss, shareholders’ equity, and cash flows for each of the three years in the period ended December 31, 2015 and our report dated March 15, 2016 expressed an unqualified opinion thereon.
/s/ BDO USA, LLP
Atlanta, Georgia
March 15, 2016
ITEM 9B. Other Information
None.
77
PART III
ITEM 10. Directors, Executive Officers and Corporate Governance
Except as set forth below, the information required by Item 10 of this Form 10-K is incorporated herein by reference to the information contained in the sections captioned “Proposal I: Election of Directors”, “Information about the Board of Directors and Committees of the Board of Directors”, “Executive Officers” and “Section 16(a) Beneficial Ownership Reporting Compliance” of our definitive proxy statement (the “Proxy Statement”) for the 2016 Annual Meeting of Stockholders to be filed with the Securities and Exchange Commission pursuant to Regulation 14A under the Securities and Exchange Act of 1934, as amended (the “Exchange Act”).
We have undertaken to provide to any person without charge, upon request, a copy of our code of ethics applicable to our chief executive officer and senior financial officers. You may obtain a copy of this code of ethics free of charge from our website, www.prgx.com.
ITEM 11. Executive Compensation
The information required by Item 11 of this Form 10-K is incorporated by reference to the information contained in the sections captioned “Executive Compensation”, “Information about the Board of Directors and Committees of the Board of Directors”, and “Report of the Compensation Committee” of the Proxy Statement.
78
ITEM 12. Security Ownership of Certain Beneficial Owners and Management and Related Stockholder Matters
Except as set forth below, the information required by Item 12 of this Form 10-K is incorporated by reference to the information contained in the section captioned “Ownership of Directors, Principal Shareholders and Certain Executive Officers” of the Proxy Statement.
Securities Authorized for Issuance Under Equity Compensation Plans
The Company currently has two shareholder approved stock-based compensation plans under which equity awards have been granted: (1) the 2006 Management Incentive Plan (“2006 MIP”), and (2) the 2008 Equity Incentive Plan (“2008 EIP”).
At the annual meeting of shareholders held on August 11, 2006, the shareholders of the Company approved a proposal granting authorization to issue up to 2.1 million shares of the Company’s common stock under the 2006 MIP. At Performance Unit settlement dates (which varied), participants were paid in common stock and in cash. Participants received a number of shares of Company common stock equal to 60% of the number of Performance Units being paid out, plus a cash payment equal to 40% of the fair market value of that number of shares of common stock equal to the number of Performance Units being paid out. There are no shares remaining available for awards under the 2006 MIP.
During the first quarter of 2008, the Board of Directors of the Company adopted the 2008 EIP, which was approved by the shareholders at the annual meeting of the shareholders on May 29, 2008. The 2008 EIP authorizes the grant of incentive and non-qualified stock options, stock appreciation rights, restricted stock, restricted stock units and other incentive awards. Pursuant to amendments to the 2008 EIP that were approved by the Company's Board of Directors and the Company's shareholders in 2010, 2012 and 2014, 10,600,000 shares are reserved for issuance under the 2008 EIP pursuant to award grants to key employees, directors and service providers.
The following table presents certain information with respect to compensation plans under which equity securities of the registrant were authorized for issuance as of December 31, 2015:
Plan category | Number of securities to be issued upon exercise of outstanding options, warrants and rights | Weighted-average exercise price of outstanding options, warrants and rights | Number of securities remaining available for future issuance under equity compensation plans (excluding securities reflected in column (a)) | |||||||
(a) | (b) | (c) | ||||||||
Equity compensation plans approved by security holders: | ||||||||||
2008 Equity Incentive Plan | 2,937,784 | 6.36 | 1,115,830 | |||||||
Equity compensation plans not approved by security holders (1), (2), (3) | 400,000 | 6.34 | — | |||||||
Total | 3,337,784 | $ | 6.36 | 1,115,830 | ||||||
(1) | Inducement Option Grant – during the first and second quarters of 2015, in connection with senior personnel joining the Company, the Company made inducement grants outside its existing stock-based compensation plans. These employees received options to purchase 110,000 shares of the common stock of the Company. |
(2) | Inducement Option Grant – during the third quarter of 2014, in connection with two executives joining the Company, the Company made inducement grants outside its existing stock-based compensation plans to the executives. The executives received options to purchase 270,000 shares of the common stock of the Company. |
(3) | Inducement Option Grant – during the first quarter of 2013, in connection with an employee joining the Company, the Company made an inducement grant outside its existing stock-based compensation plans to the employee. The employee received an option to purchase 20,000 shares of the common stock of the Company. Vesting of the grant is subject to certain performance requirements. |
79
ITEM 13. Certain Relationships and Related Transactions, and Director Independence
The information required by Item 13 of this Form 10-K is incorporated by reference to the information contained in the sections captioned “Information about the Board of Directors and Committees of the Board of Directors”, “Executive Compensation – Employment Agreements” and “Certain Transactions” of the Proxy Statement.
ITEM 14. Principal Accountant Fees and Services
The information required by Item 14 of this Form 10-K is incorporated by reference to the information contained in the sections captioned “Principal Accountant Fees and Services” of the Proxy Statement.
PART IV
ITEM 15. Exhibits, Financial Statement Schedules
(a) Documents filed as part of the report
(1) Consolidated Financial Statements:
For the following consolidated financial information included herein, see Index on Page 42. |
Page No. | |
(2) Financial Statement Schedule:
Schedule II - Valuation and Qualifying Accounts | |
(3) Exhibits
Exhibit Number | Description | |
2.1 | Share Purchase Agreement dated February 28, 2010 by and between PRGX U.K. Limited and Sajid Ghani and Others (incorporated by reference to Exhibit 2.1 to the Registrant’s Form 10-K filed on March 29, 2010). | |
2.2 | Acquisition Agreement dated December 1, 2011, among PRGX Global, Inc., PRGX Commercial LLC, Business Strategy, Inc., Strategic Document Solutions, LLC, DD&C Investments, L.L.C., Charles Fayon, Daniel Geelhoed and Dennis VanDyke. (incorporated by reference to Exhibit 2.1 to the Registrant’s Form 8-K filed on December 2, 2011). | |
3.1 | Restated Articles of Incorporation of the Registrant, as amended and corrected through August 11, 2006 (restated solely for the purpose of filing with the Commission) (incorporated by reference to Exhibit 3.1 to the Registrant’s Form 8-K filed on August 17, 2006). | |
3.1.1 | Articles of Amendment of the Registrant effective January 20, 2010 (incorporated by reference to Exhibit 3.1 to the Registrant’s Form 8-K filed on January 25, 2010). | |
3.2 | Amended and Restated Bylaws of the Registrant (incorporated by reference to Exhibit 3.1 to the Registrant’s Form 8-K filed on December 11, 2007). | |
4.1 | Specimen Common Stock Certificate (incorporated by reference to Exhibit 4.1 to the Registrant’s Form 10-K for the year ended December 31, 2001). | |
4.2 | See Restated Articles of Incorporation and Bylaws of the Registrant, filed as Exhibits 3.1 and 3.2, respectively. | |
+10.1 | Form of Indemnification Agreement between the Registrant and Directors and certain officers, including named executive officers, of the Registrant (incorporated by reference to Exhibit 10.4 to the Registrant’s Form 10-K for the year ended December 31, 2003). | |
10.2 | Noncompetition, Nonsolicitation and Confidentiality Agreement among The Profit Recovery Group International, Inc., Howard Schultz & Associates International, Inc., Howard Schultz, Andrew Schultz and certain trusts, dated January 24, 2002 (incorporated by reference to Exhibit 10.34 to the Registrant’s Form 10-K for the year ended December 31, 2001). | |
10.3 | Office Lease Agreement between Galleria 600, LLC and PRG-Schultz International, Inc. (incorporated by reference to Exhibit 10.43 to the Registrant’s Form 10-K for the year ended December 31, 2001). | |
81
10.4 | First Amendment to Office Lease Agreement between Galleria 600, LLC and PRG-Schultz International, Inc. (incorporated by reference to Exhibit 10.65 to the Registrant’s Form 10-K for the year ended December 31, 2002). | |
10.5 | Third Amendment of Lease, entered into as of January 8, 2014, by and between Galleria 600, LLC and the Company (incorporated by reference to Exhibit 10.1 to the Registrant’s Form 8-K filed on January 14, 2014). | |
+10.6 | Amended and Restated 2006 Management Incentive Plan (incorporated by reference to Exhibit 10.1 to the Registrant’s Form 10-Q for the quarter ended September 30, 2006). | |
+10.7 | Form of Performance Unit Agreement under 2006 Amended and Restated Management Incentive Plan (incorporated by reference to Exhibit 10.2 to the Registrant’s Form 8-K filed on June 22, 2012). | |
+10.8 | PRGX Global, Inc. 2008 Equity Incentive Plan, as Amended and Restated Effective April 25, 2014 (incorporated by reference to Exhibit 10.1 to the Registrant’s Form 8-K filed on June 30, 2014). | |
+10.9 | Form of Restricted Stock Agreement for Non-Employee Directors (incorporated by reference to Exhibit 10.2 to the Registrant’s Form 8-K filed on June 4, 2008). | |
+10.10 | Form of Non-Qualified Stock Option Agreement for Non-Employee Directors (incorporated by reference to Exhibit 10.3 to the Registrant’s Form 8-K filed on June 4, 2008). | |
+10.11 | Form of Nonqualified Stock Option Agreement (incorporated by reference to Exhibit 10.2 to the Registrant’s Form 8-K filed on January 14, 2009). | |
+10.12 | Form of Restricted Stock Agreement (incorporated by reference to Exhibit 10.3 to the Registrant’s Form 8-K filed on January 14, 2009). | |
+10.13 | Form of Performance-Based Restricted Stock Unit Agreement for Employees (incorporated by reference to Exhibit 10.1 to the Registrant’s Form 8-K filed on April 1, 2015). | |
10.14 | Amended & Restated Revolving Credit Agreement dated as of December 23, 2014, among PRGX Global, Inc. and PRGX USA, Inc., as borrowers, the lenders from time to time party thereto and SunTrust Bank, as administrative agent and issuing bank (incorporated by reference to Exhibit 10.1 to the Registrant’s Form 8-K filed on December 30, 2014). | |
10.15 | Subsidiary Guaranty Agreement dated as of January 19, 2010 by and among PRGX Global, Inc. (formerly PRG-Schultz International, Inc), and PRGX USA, Inc. (formerly PRG-Schultz USA, Inc.), as borrowers, each of the subsidiaries of PRGX Global, Inc. listed on Schedule I thereto, as guarantors, and SunTrust Bank, as administrative agent (incorporated by reference to Exhibit 10.2 to the Registrant’s Form 8-K filed on January 25, 2010). | |
10.16 | Security Agreement dated January 19, 2010 among PRGX Global, Inc. (formerly PRG-Schultz International, Inc), PRGX USA, Inc. (formerly PRG-Schultz USA, Inc.), and the other direct and indirect subsidiaries of PRGX Global, Inc. signatory thereto, as grantors, in favor of SunTrust Bank, as administrative agent (incorporated by reference to Exhibit 10.3 to the Registrant’s Form 8-K filed on January 25, 2010). | |
10.17 | Equity Pledge Agreement dated as of January 19, 2010, made by PRGX Global, Inc. (formerly PRG-Schultz International, Inc), PRGX USA, Inc. (formerly PRG-Schultz USA, Inc.), and the other direct and indirect subsidiaries of PRGX Global, Inc. signatory thereto, as grantors, in favor of SunTrust Bank, as administrative agent (incorporated by reference to Exhibit 10.4 to the Registrant’s Form 8-K filed on January 25, 2010). | |
10.18 | Loan Documents Modification Agreement dated June 21, 2010, by and among the Borrowers, the Guarantors and the Lender (incorporated by reference to Exhibit 10.29.4 to the Registrant’s Form 10-K filed on March 15, 2012). | |
10.19 | Second Loan Documents Modification Agreement dated September 30, 2010, by and among the Borrowers and the Lender (incorporated by reference to Exhibit 10.1 to the Registrant’s Form 8-K filed on October 1, 2010). | |
10.20 | Third Loan Documents Modification Agreement dated October 17, 2011, by and among the Borrowers and the Lender (incorporated by reference to Exhibit 10.29.6 to the Registrant’s Form 10-K filed on March 15, 2012) | |
10.21 | Fourth Loan Documents Modification Agreement, entered into as of January 17, 2014, by and among the Borrowers, the Guarantors and the Lender (incorporated by reference to Exhibit 10.1 to the Registrant’s Form 8-K filed on January 24, 2014). | |
82
10.22 | Fifth Loan Documents Modification Agreement and Waiver, entered into as of May 8, 2014, by and among the Borrowers, the Guarantors and the Lender (incorporated by reference to Exhibit 10.1 to the Registrant’s Form 10-Q filed on May 12, 2014). | |
10.23 | Sixth Loan Documents Modification Agreement and Waiver, entered into as of August 7, 2014, by and among the Borrowers, the Guarantors and the Lender (incorporated by reference to Exhibit 10.1 to the Registrant’s Form 10-Q filed on August 7, 2014). | |
10.24 | Seventh Loan Documents Modification Agreement, entered into as of October 23, 2014, by and among the Borrowers, the Guarantors and the Lender (incorporated by reference to Exhibit 10.29 to the Registrant's Form 10-K filed on March 13, 2015). | |
10.25 | Eighth Loan Documents Modification Agreement, entered into as of December 23, 2014, by and among the Borrowers, the Guarantors and the Lender (incorporated by reference to Exhibit 10.2 to the Registrant’s Form 8-K filed on December 30, 2014). | |
10.26 | PRGX Global, Inc. Deferred Compensation Plan for Non-Employee Directors (incorporated by reference to Exhibit 10.2 to the Registrant’s Form 8-K filed on June 30, 2014). | |
10.27 | Form of PRGX Global, Inc. Restricted Stock Unit Agreement for Non-Employee Directors (incorporated by reference to Exhibit 10.3 to the Registrant’s Form 8-K filed on June 30, 2014). | |
10.28 | Employment Agreement between the Registrant and Victor A. Allums dated November 28, 2008 (incorporated by reference to Exhibit 10.31 to the Registrant’s Form 10-K filed on March 29, 2010). | |
10.29 | Employment Agreement between the Registrant and Puneet Pamnani dated February 8, 2012 (incorporated by reference to Exhibit 10.35 to the Registrant’s Form 10-K filed on March 15, 2012). | |
10.30 | Employment Agreement between the Registrant and Tushar Sachdev dated June 18, 2013 (incorporated by reference to Exhibit 10.1 to the Registrant’s Form 10-Q filed on August 6, 2013). | |
+10.31 | Separation Agreement between the Registrant and Romil Bahl dated December 5, 2013 (incorporated by reference to Exhibit 10.1 to the Registrant’s Form 8-K filed on December 11, 2013). | |
+10.32 | Employment Agreement between the Registrant and Ronald E. Stewart dated December 13, 2013 (incorporated by reference to Exhibit 10.1 to the Registrant’s Form 8-K filed on December 19, 2013). | |
+10.33 | Employment Agreement between the Registrant and Michael Cochrane dated April 24, 2014 (incorporated by reference to Exhibit 10.1 to the Registrant’s Form 8-K filed on April 29, 2014). | |
+10.34 | Separation Agreement between the Registrant and James R. Shand dated August 14, 2014 (incorporated by reference to Exhibit 10.1 to the Registrant’s Form 8-K filed on August 20, 2014). | |
+10.35 | Separation Agreement between the Registrant and Robert B. Lee dated September 11, 2014 (incorporated by reference to Exhibit 10.1 to the Registrant’s Form 8-K filed on September 11, 2014). | |
+10.36 | Employment Agreement between the Registrant and Peter Limeri dated September 11, 2014 (incorporated by reference to Exhibit 10.1 to the Registrant’s Form 8-K filed on November 21, 2014). | |
+10.37 | Separation Agreement between the Registrant and Catherine Lee dated September 25, 2015 (incorporated by reference to Exhibit 10.1 to Registrant's Form 10-Q filed on November 6, 2015). | |
+10.38 | Separation Agreement between the Registrant and Michael W. Reene dated January 22, 2016. | |
14.1 | Code of Ethics for Senior Financial Officers (incorporated by reference to Exhibit 14.1 to the Registrant’s Form 10-K for the year ended December 31, 2003). | |
21.1 | Subsidiaries of the Registrant. | |
23.1 | Consent of BDO USA, LLP. | |
31.1 | Certification of the Chief Executive Officer, pursuant to Rule 13a-14(a) or 15d-14(a), for the year ended December 31, 2015. | |
31.2 | Certification of the Chief Financial Officer, pursuant to Rule 13a-14(a) or 15d-14(a), for the year ended December 31, 2015. | |
32.1 | Certification of the Chief Executive Officer and Chief Financial Officer, pursuant to 18 U.S.C. Section 1350, for the year ended December 31, 2015. | |
83
101 | The following financial information from the Registrant’s Annual Report on Form 10-K for the fiscal year ended December 31, 2015, formatted in Extensible Business Reporting Language (“XBRL”): (i) Consolidated Statements of Operations, (ii) Consolidated Statements of Comprehensive Income (Loss), (iii) Consolidated Balance Sheets, (iv) Consolidated Statements of Shareholders' Equity, (v) Consolidated Statements of Cash Flows and (vi) Notes to Consolidated Financial Statements. | |
+ | Designates management contract or compensatory plan or arrangement. | |
84
SCHEDULE II - VALUATION AND QUALIFYING ACCOUNTS | ||||||||
FOR THE YEARS ENDED DECEMBER 31, 2015, 2014 AND 2013 | ||||||||
(In thousands) | ||||||||
Additions | Deductions | |||||||||||||
Description | Balance at Beginning of Year | Charge (Credit) to Costs and Expenses | Credit to the respective receivable (1) | Balance at End of Year | ||||||||||
2015 | ||||||||||||||
Allowance for doubtful accounts receivable | $ | 2,243 | (1,311 | ) | (2 | ) | $ | 930 | ||||||
Allowance for doubtful employee advances and miscellaneous receivables | $ | 692 | 1,294 | (1,305 | ) | $ | 681 | |||||||
Deferred tax valuation allowance (2) | $ | 52,002 | (6,437 | ) | — | $ | 45,565 | |||||||
2014 | ||||||||||||||
Allowance for doubtful accounts receivable | $ | 1,996 | 253 | (6 | ) | $ | 2,243 | |||||||
Allowance for doubtful employee advances and miscellaneous receivables | $ | 402 | 1,125 | (835 | ) | $ | 692 | |||||||
Deferred tax valuation allowance | $ | 48,453 | 3,549 | — | $ | 52,002 | ||||||||
2013 | ||||||||||||||
Allowance for doubtful accounts receivable | $ | 1,693 | 303 | — | $ | 1,996 | ||||||||
Allowance for doubtful employee advances and miscellaneous receivables | $ | 538 | 1,176 | (1,312 | ) | $ | 402 | |||||||
Deferred tax valuation allowance | $ | 48,489 | (36 | ) | — | $ | 48,453 | |||||||
-----------------------------
(1) | Write-offs net of recoveries. |
(2) | The change in the current year valuation allowance is due mainly to a $1.5 million release of the valuation allowance on a foreign subsidiary and adjustments required to deferred taxes after a review of the balances was performed. |
85
SIGNATURES
Pursuant to the requirements of Section 13 or 15(d) of the Securities Exchange Act of 1934, the registrant has duly caused this report to be signed on its behalf by the undersigned, thereunto duly authorized.
PRGX GLOBAL, INC. | |||
By: | /s/ RONALD E. STEWART | ||
Ronald E. Stewart | |||
President, Chief Executive Officer, Director (Principal Executive Officer) | |||
Date: | March 15, 2016 | ||
Pursuant to the requirements of the Securities Exchange Act of 1934, this report has been signed below by the following persons on behalf of the registrant and in the capacities and on the dates indicated.
Signature | Title | Date | ||
/s/ RONALD E. STEWART | President, Chief Executive Officer and Director | March 15, 2016 | ||
Ronald E. Stewart | (Principal Executive Officer) | |||
/s/ PETER LIMERI | Chief Financial Officer and Treasurer | March 15, 2016 | ||
Peter Limeri | (Principal Financial Officer) | |||
/s/ BRADLEY T. WHITE | Controller | March 15, 2016 | ||
Bradley T. White | (Principal Accounting Officer) | |||
/s/ DAVID A. COLE | Director | March 15, 2016 | ||
David A. Cole | ||||
/s/ PATRICK G. DILLS | Director | March 15, 2016 | ||
Patrick G. Dills | ||||
/s/ WILLIAM F. KIMBLE | Director | March 15, 2016 | ||
William F. Kimble | ||||
/s/ MYLLE H. MANGUM | Director | March 15, 2016 | ||
Mylle H. Mangum | ||||
/s/ GREGORY J. OWENS | Director | March 15, 2016 | ||
Gregory J. Owens | ||||
/s/ JOSEPH E. WHITTERS | Chairman of the Board | March 15, 2016 | ||
Joseph E. Whitters | ||||
86