Attached files
| file | filename |
|---|---|
| EX-32.1 - EX-32.1 - PC TEL INC | d68635dex321.htm |
| EX-31.1 - EX-31.1 - PC TEL INC | d68635dex311.htm |
| EX-21.1 - EX-21.1 - PC TEL INC | d68635dex211.htm |
| EX-23.1 - EX-23.1 - PC TEL INC | d68635dex231.htm |
| EX-31.2 - EX-31.2 - PC TEL INC | d68635dex312.htm |
Table of Contents
UNITED STATES
SECURITIES AND EXCHANGE COMMISSION
Washington, DC 20549
Form 10-K
| x | ANNUAL REPORT PURSUANT TO SECTION 13 OR 15(d) OF THE SECURITIES EXCHANGE ACT OF 1934 |
For the fiscal year ended December 31, 2015
OR
| ¨ | TRANSITION REPORT PURSUANT TO SECTION 13 OR 15(d) OF THE SECURITIES EXCHANGE ACT OF 1934 |
For the transition period from to
Commission File Number 000-27115
PCTEL, Inc.
(Exact Name of Registrant as Specified in Its Charter)
| Delaware | 77-0364943 | |
| (State or Other Jurisdiction of Incorporation or Organization) |
(I.R.S. Employer Identification Number) |
| 471 Brighton Drive, Bloomingdale IL |
60108 | |
| (Address of Principal Executive Office) | (Zip Code) |
(630) 372-6800
(Registrant’s Telephone Number, Including Area Code)
Securities registered pursuant to Section 12(b) of the Act:
| Title of each class |
Name of each exchange on which registered | |
| Common Stock, $.001 Par Value Per Share | The NASDAQ Global Select Market |
Securities registered pursuant to Section 12(g) of the Act:
None
Indicate by check mark whether the registrant is a well-known seasoned issuer, as defined in Rule 405 of the Securities Act. Yes ¨ No x
Indicate by check mark if the registrant is not required to file reports pursuant to Section 13 or Section 15(d) of the Act. Yes ¨ No x
Indicate by check mark whether the registrant (1) has filed all reports required to be filed by Section 13 or 15(d) of the Securities Exchange Act of 1934 during the preceding 12 months (or for such shorter period that the registrant was required to file such reports), and (2) has been subject to such filing requirements for the past 90 days. Yes x No ¨
Indicate by checkmark whether the registrant has submitted electronically and posted on the Company’s website, if any, every Interactive Data File required to be submitted and posted pursuant to Rule 405 of Regulation S-T ((§ 232.405 of this chapter) during the preceding 12 months (or for such shorter period that the registrant was acquired to submit and post such files) ). Yes x No ¨
Indicate by check mark if disclosure of delinquent filers pursuant to Item 405 of Regulation S-K (§ 229.405 of this chapter) is not contained herein, and will not be contained, to the best of registrant’s knowledge, in definitive proxy or information statements incorporated by reference in Part III of this Form 10-K or any amendment to this Form 10-K. ¨
Indicate by check mark whether the registrant is a large accelerated filer, an accelerated filer, a non-accelerated filer, or a smaller reporting company. See definition of “large accelerated filer”, “accelerated filer” and “smaller reporting company” in Rule 12b-2 of the Exchange Act.:
| Large accelerated filer | ¨ | Accelerated filer | x | |||
| Non-accelerated filer | ¨ (Do not check if a smaller reporting company) | Smaller reporting company | ¨ | |||
Indicate by check mark whether the registrant is a shell company (as defined in Rule 12b-2 of the Act). Yes ¨ No x
As of June 30, 2015, the last business day of the registrant’s most recently completed second fiscal quarter, there were 18,555,527 shares of the registrant’s common stock outstanding, and the aggregate market value of such shares held by non-affiliates of the registrant (based upon the closing sale price of such shares on the NASDAQ Global Select Market on June 30, 2015) was approximately $133,228,684. Shares of the registrant’s common stock held by each executive officer and director and by each entity that owns 5% or more of the registrant’s outstanding common stock have been excluded because such persons may be deemed to be affiliates. This determination of affiliate status is not necessarily a conclusive determination for any other purposes.
17,264,986 shares of common stock were issued and outstanding as of March 10, 2016.
Documents Incorporated by Reference
Certain sections of the registrant’s definitive proxy statement relating to its 2016 Annual Stockholders’ Meeting to be held on June 14, 2016 are incorporated by reference into Part III of this Annual Report on Form 10-K. The Company intends to file its proxy statement within 120 days after the end of its fiscal year end to which this report relates.
Table of Contents
PCTEL, Inc.
Form 10-K
For the Fiscal Year Ended December 31, 2015
2
Table of Contents
PART I
| Item 1: | Business |
This Annual Report on Form 10-K contains forward-looking statements within the meaning of Section 27A of the Securities Act of 1933, as amended (the “Securities Act”) and Section 21E of the Securities Exchange Act of 1934, as amended (the “Exchange Act”). These statements include, among other things, statements concerning our future operations, financial condition and prospects, and business strategies. The words “believe”, “expect”, “anticipate” and other similar expressions generally identify forward-looking statements. Investors in our common stock are cautioned not to place undue reliance on these forward-looking statements. These forward-looking statements are subject to substantial risks and uncertainties that could cause our future business, financial condition, or results of operations to differ materially from the historical results or currently anticipated results. Investors should carefully review the information contained in Item 1A. Risk Factors and elsewhere in, or incorporated by reference into, this Annual Report on Form 10-K. Other factors not currently anticipated may also materially and adversely affect our results of operations, cash flows and financial position. There can be no assurance that future results will meet expectations. While we believe that the forward-looking statements in this Annual Report on Form 10-K are reasonable, investors should not place undue reliance on any forward-looking statements. In addition, these statements speak only as of the date made. We do not undertake, and expressly disclaim any obligation to update or alter any statements whether as a result of new information, future events or otherwise, except as may be required by applicable law.
Overview
PCTEL, Inc. (“PCTEL”, the “Company”, “we”, “ours”, and “us”) delivers Performance Critical Telecom solutions. Our RF Solutions™ segment develops and provides test equipment, software and engineering services for wireless networks. The industry relies upon PCTEL to benchmark network performance, analyze trends, and optimize wireless networks. Our Connected Solutions™ segment designs and delivers performance critical antennas and site solutions for wireless networks globally. Our antennas support evolving wireless standards for cellular, private, and broadband networks. PCTEL antennas and site solutions support networks worldwide, including Supervisory Control and Data Acquisition (“SCADA”) for oil, gas and utilities, fleet management, industrial operations, healthcare, small cell and network timing deployment, defense, public safety, education, and broadband access.
PCTEL was incorporated in California in 1994 and reincorporated in Delaware in 1998. Our principal executive offices are located at 471 Brighton Drive, Bloomingdale, Illinois 60108. Our telephone number at that address is (630) 372-6800 and our website is www.pctel.com. The information within, or that can be accessed through, our website, is not part of this report.
Segment Reporting
PCTEL operates in two segments for reporting purposes, Connected Solutions and RF Solutions. Our chief operating decision maker uses the profit and loss results through operating profit and identified assets for the Connected Solutions and RF Solutions segments to make operating decisions. Each segment has its own segment manager as well as its own engineering, sales and marketing, and operational general and administrative functions. All of our accounting and finance, human resources, IT and legal functions are provided on a centralized basis through the corporate function. We manage the balance sheet and cash flows centrally at the corporate level, with the exception of trade accounts receivable and inventory which is managed at the segment level. Each of the segment managers reports to and maintains regular contact with the chief operating decision maker to discuss operating activities, financial results, forecasts, or plans for the segment.
Connected Solutions Segment
Connected Solutions designs and delivers performance critical antennas and site solutions for wireless networks globally. Our antennas and site solutions support networks worldwide, including SCADA for oil, gas and utilities, fleet management, industrial operations, health care, small cell and network timing deployment, defense, public safety, education, and broadband access. PCTEL’s performance critical MAXRAD® and Bluewave™ antenna solutions include high rejection and high performance GPS and GNSS products, the industry leading Yagi antenna portfolio, mobile and indoor LTE, broadband, and LMR antennas and PIM-rated antennas for transit, in-building, and small cell applications. We provide design, logistics, and support capabilities to deliver performance critical site solutions into carrier, railroad, and utility applications. Revenue growth for antenna and site solutions is primarily driven by the increased use of wireless communications in these vertical markets. PCTEL’s antenna and site solution products are primarily sold through distributors, value-added resellers, and original equipment manufacturers (“OEM”).
There are many competitors for antenna products, as the market is highly fragmented. Competitors include Laird (Cushcraft, Centurion, and Antennex brands), Mobile Mark, Radiall/Larsen, Comtelco, Wilson, Commscope (Andrew products), and Kathrein, among others. We seek out product applications that command a premium for product performance and customer service, and avoid commodity markets.
3
Table of Contents
PCTEL maintains expertise in several technology areas in order to be competitive in the antenna engineered site solutions market. These include radio frequency engineering, mobile antenna design and manufacturing, mechanical engineering, product quality and testing, and wireless network engineering.
RF Solutions Segment
RF Solutions develops and provides performance critical test equipment, software, and engineering services for wireless networks. The industry relies upon PCTEL to benchmark network performance, analyze trends, and optimize wireless networks. The Company’s SeeGull® flex scanning receivers are used around the world for indoor and drive test applications, including baseline testing, acceptance testing, competitive benchmarking, spectrum clearing, troubleshooting, and network optimization. The SeeGull CW Transmitter supports the design, verification, and optimization of in-building networks. SeeHawk® Analytics is a network analytics tool that translates data from multiple sources into actions that optimize network performance. PCTEL provides wireless network testing, commissioning, optimization, design, integration and consulting services for both indoor and outdoor networks.
Revenue growth for the segment’s products and services is driven by the deployment of products based on new wireless technology and the need for wireless networks to be tuned and reconfigured on a regular basis. Our RF Solutions products are sold primarily through test and measurement value-added resellers and to a lesser extent directly to network operators. Competitors for these products are OEMs such as JDS Uniphase, Rohde and Schwarz, Anritsu, Digital Receiver Technology, and Berkley Varitronics. Our services are directly marketed to wireless carriers, network deployment companies, tower companies and industrial companies.
PCTEL maintains expertise in several technology areas in order to be competitive in the scanning receiver and related engineering services market. These include radio frequency engineering, DSP engineering, manufacturing, mechanical engineering, product quality and testing, and wireless network engineering.
Major Customers
There were no customers that accounted for 10% or greater of revenues or accounts receivable during the fiscal years ended December 31, 2015, 2014, or 2013, respectively.
International Activities
The following table shows the percentage of revenues by geographic location during the last three fiscal years:
| Years Ended December 31, | ||||||||||||
| Region |
2015 | 2014 | 2013 | |||||||||
| Europe, Middle East, & Africa |
10 | % | 11 | % | 13 | % | ||||||
| Asia Pacific |
9 | % | 11 | % | 10 | % | ||||||
| Other Americas |
6 | % | 5 | % | 6 | % | ||||||
|
|
|
|
|
|
|
|||||||
| Total Foreign sales |
25 | % | 27 | % | 29 | % | ||||||
|
|
|
|
|
|
|
|||||||
| Total Domestic sales |
75 | % | 73 | % | 71 | % | ||||||
|
|
|
|
|
|
|
|||||||
| 100 | % | 100 | % | 100 | % | |||||||
|
|
|
|
|
|
|
|||||||
See Note 12 of the consolidated financial statements for further geographical information.
Backlog
Sales of our products are generally made pursuant to standard purchase orders, which are officially acknowledged according to standard terms and conditions. The backlog, while useful for scheduling production, is not a meaningful indicator of future revenues as the order to ship cycle is extremely short.
4
Table of Contents
Research and Development
We recognize that a strong technology base is essential to our long-term success and we have made a substantial investment in engineering and research and development. We will continue to devote substantial resources to product development and patent submissions. The patent submissions are primarily for defensive purposes, rather than for potential license revenue generation. We monitor changing customer needs and work closely with our customers, consultants and market research organizations to track changes in the marketplace, including emerging industry standards.
Research and development expenses include costs for hardware and related software development, prototyping, certification and pre-production costs. We spent approximately $11.2 million, $11.7 million, and $11.1 million in the fiscal years 2015, 2014, and 2013, respectively, in research and development.
Sales, Marketing and Support
We supply our products to public and private carriers, wireless infrastructure providers, wireless equipment distributors, value added resellers (“VARs”) and OEMs. PCTEL’s direct sales force is technologically sophisticated and sales executives have strong industry domain knowledge. Our direct sales force supports the sales efforts of our distributors and OEM resellers.
Our marketing strategy is focused on building market awareness and acceptance of our new products. The marketing organization also provides a wide range of programs, materials and events to support the sales organization. We spent approximately $14.2 million, $13.0 million, and $12.1 million in fiscal years 2015, 2014, and 2013, respectively, for sales and marketing support.
Manufacturing
We do final assembly of most of our antenna products and all of our OEM receiver and interference management product lines. We also have arrangements with several contract manufacturers but are not dependent on any one. If any of our contract manufacturers are unable to provide satisfactory services for us, other contract manufacturers are available, although engaging a new contract manufacturer could cause unwanted delays and additional costs. We have no material guaranteed supply contracts or long-term agreements with any of our suppliers. We do have open purchase orders with our suppliers. See the contractual obligations and commercial commitments section of Item 7 for information on purchase commitments.
Employees
As of December 31, 2015, we had 491 full-time equivalent employees, consisting of 329 in operations, 61 in sales and marketing, 61 in research and development, and 40 in general and administrative functions. Total full-time equivalent employees were 465 and 449 at December 31, 2014 and 2013, respectively. Headcount increased by 26 at December 31, 2015 from December 31, 2014 primarily due to the employees from our acquisition of the business of Nexgen Wireless, Inc. See additional information related to the acquisition of the business from Nexgen in Note 4 to the consolidated financial statements. None of our employees are represented by a labor union. We consider employee relations to be good.
Available Information
Our annual reports on Form 10-K, quarterly reports on Form 10-Q, current reports on Form 8-K, and amendments to such reports, are available free of charge through our website as soon as reasonably practicable after we electronically file such material with, or furnish it to, the United States Securities and Exchange Commission (the “SEC”). Our website is located at the following address: www.pctel.com. The information within, or that can be accessed through, our website, is not part of this Annual Report on Form 10-K. Further, any materials we file with the SEC may be read and copied by the public at the SEC’s Public Reference Room, located at 100 F Street, N.E., Room 1580, Washington D.C. 20549. Information regarding the operation of the Public Reference Room can be obtained by calling the SEC at 1(800) SEC-0330. The SEC maintains an Internet site that contains reports, proxy and information statements and other information regarding our filings at www.sec.gov.
| Item 1A: | Risk Factors |
Factors That May Affect Our Business, Financial Condition and Future Operations
Risks Related to Our Business
Competition within the wireless product and services industry is intense and is expected to increase significantly. Failure to compete successfully could materially harm our prospects and financial results.
The market for our products and services is highly fragmented and is served by many local providers. We may not be able to displace established competitors from their customer base with our products and services.
5
Table of Contents
Many of our present and potential competitors have substantially greater financial, marketing, technical and other resources with which to pursue engineering, manufacturing, marketing, and distribution of their products and delivery of their services. These competitors may succeed in establishing technology standards or strategic alliances in the connectivity products markets, obtain more rapid market acceptance for their products, or otherwise gain a competitive advantage. We can offer no assurance that we will succeed in developing product technologies and services that are more effective than those developed by our competitors. We can offer no assurance that we will be able to compete successfully against existing and new competitors as the connectivity wireless markets evolve and the level of competition increases.
Our wireless business is dependent upon the continued growth and evolution of the wireless industry.
Our future success is dependent upon the continued growth and evolution of the wireless industry. The growth in demand for wireless products and services may not continue at its current rate or at all. Any decrease in the growth of the wireless industry could have a material adverse effect on the results of our operations.
Our future success depends on our ability to develop and successfully introduce new and enhanced products for the wireless market that meet the needs of our customers.
Our revenue depends on our ability to anticipate our existing and prospective customers’ needs and develop products and services that address those needs. Our future success will depend on our ability to introduce new products and services for the wireless market, anticipate improvements and enhancements in wireless technology and wireless standards, and to develop products and services that are competitive in the rapidly changing wireless industry. Introduction of new products, product enhancements, and services will require coordination of our efforts with those of our customers, suppliers, and manufacturers to rapidly achieve volume production. If we fail to coordinate these efforts, develop product enhancements or introduce new products that meet the needs of our customers as scheduled, our operating results will be materially and adversely affected and our business and prospects will be harmed. We cannot assure that product introductions will meet the anticipated release schedules or that our wireless products will be competitive in the market. Furthermore, given the evolving nature of the wireless market, there can be no assurance our products and technology will not be rendered obsolete by alternative or competing technologies.
We may experience integration or other problems with potential acquisitions, which could have an adverse effect on our business or results of operations. New acquisitions could dilute the interests of existing stockholders, and the announcement of new acquisitions could result in a decline in the price of our common stock.
We may in the future make acquisitions of, or large investments in, businesses that offer products, services, and technologies that we believe would complement our products or services, including wireless products and technology. We may also make acquisitions of or investments in, businesses that we believe could expand our distribution channels. Even if we were to announce an acquisition, we may not be able to complete it. Additionally, any future acquisition or substantial investment would present numerous risks, including:
| • | difficulty in integrating the technology, operations, internal accounting controls or work force of the acquired business with our existing business, |
| • | disruption of our on-going business, |
| • | difficulty in realizing the potential financial or strategic benefits of the transaction, |
| • | difficulty in maintaining uniform standards, controls, procedures and policies, |
| • | dealing with tax, employment, logistics, and other related issues unique to international organizations and assets we acquire, |
| • | possible impairment of relationships with employees and customers as a result of integration of new businesses and management personnel, and |
| • | impairment of assets related to resulting goodwill, and reductions in our future operating results from amortization of intangible assets. |
We expect that future acquisitions could provide for consideration to be paid in cash, shares of our common stock, or a combination of cash and our common stock. If consideration for a transaction is paid in common stock, this would further dilute our existing stockholders. We may also incur debt to pay for an acquisition.
6
Table of Contents
Our gross profit may vary based on the mix of sales of our products and services, and these variations may cause our net income to decline.
Depending on the mix of our products and services sold, our gross profit could vary significantly from quarter to quarter. Generally, antenna products and engineering services have a lower profit margin than scanning receiver products creating the variance in gross profits related to profit mix. A variance or decrease of our gross profit could have a negative impact on our financial results and cause our net income to decline.
Any delays in our sales cycles could result in customers canceling purchases of our products.
Sales cycles for our products with major customers can be lengthy, often lasting nine months or longer. In addition, it can take an additional nine months or more before a customer commences volume production of equipment that incorporates our products. Sales cycles with our major customers are lengthy for a number of reasons, including:
| • | our OEM customers and carriers usually complete a lengthy technical evaluation of our products, over which we have no control, before placing a purchase order, |
| • | the development and commercial introduction of products incorporating new technologies frequently are delayed. |
A significant portion of our operating expenses is relatively fixed and is largely based on our forecasts of volume and timing of orders. The lengthy sales cycles make forecasting the volume and timing of product orders difficult. In addition, the delays inherent in lengthy sales cycles raise additional risks of customer decisions to cancel or change product phases. If customer cancellations or product changes were to occur, this could result in the loss of anticipated sales without sufficient time for us to reduce our operating expenses.
We generally rely on independent companies to manufacture, assemble and test our products. If these companies do not meet their commitments to us, or if our own assembly operations are impaired, our ability to sell products to our customers would be impaired.
We have limited manufacturing capability. For some product lines we outsource the manufacturing, assembly, and testing of printed circuit board subsystems. For other product lines, we purchase completed hardware platforms and add our proprietary software. While there is no unique capability with these suppliers, any failure by these suppliers to meet delivery commitments would cause us to delay shipments and potentially be unable to accept new orders for product.
In addition, in the event that these suppliers discontinued the manufacture of materials used in our products, we would be forced to incur the time and expense of finding a new supplier or to modify our products in such a way that such materials were not necessary. Either of these alternatives could result in increased manufacturing costs and increased prices of our products.
We assemble our antenna products in our facilities located in Illinois and China and scanning receivers at our facility in Maryland. We may experience delays, disruptions, capacity constraints or quality control problems at our assembly facilities, which could result in lower yields or delays of product shipments to our customers. In addition, we are having a number of our antenna products manufactured in China via contract manufacturers. Any disruption of our own or contract manufacturers’ operations could cause us to delay product shipments, which would negatively impact our sales, competitive reputation and position. In addition, if we do not accurately forecast demand for our products, we will have excess or insufficient parts to build our products, either of which could materially affect our operating results.
In order for us to operate at a profitable level and continue to introduce and develop new products for emerging markets, we must attract and retain our executive officers and qualified engineering, technical, sales, support and other administrative personnel.
Our performance is substantially dependent on the performance of our current executive officers and certain key engineering, sales, marketing, financial, technical and customer support personnel. If we lose the services of our executives or key employees, replacements could be difficult to recruit and, as a result, we may not be able to grow our business.
7
Table of Contents
Competition for personnel, especially qualified engineering personnel, is intense. We are particularly dependent on our ability to identify, attract, motivate and retain qualified engineers with the requisite education, background and industry experience. As of December 31, 2015, we employed a total of 61 people in our research and development department. If we lose the services of one or more of our key engineering personnel, our ability to continue to develop products and technologies responsive to our markets may be impaired.
We may be subject to litigation regarding intellectual property associated with our business and this could be costly to defend and could prevent us from using or selling the challenged technology.
In recent years, there has been significant litigation in the United States involving intellectual property rights. We expect potential claims in the future, including with respect to our wireless business. Intellectual property claims against us, and any resulting lawsuits, may result in significant expenses and could subject us to significant liability for damages and invalidate what we currently believe are our proprietary rights. These claims, regardless of their merits or outcome, would likely be time-consuming and expensive to resolve and could divert management’s time and attention. This could have a material and adverse effect on our results of operations. Any intellectual property litigation disputes related to our business could also force us to do one or more of the following:
| • | cease selling, incorporating or using technology, products or services that incorporate the disputed intellectual property, |
| • | obtain from the holder of the disputed intellectual property a license to sell or use the relevant technology, which license may not be available on acceptable terms, if at all, or |
| • | redesign those products or services that incorporate the disputed intellectual property, which could result in substantial unanticipated development expenses. |
If we are subject to a successful claim of infringement related to our wireless intellectual property and we fail to develop non-infringing intellectual property or license the infringed intellectual property on acceptable terms and on a timely basis, operating results could decline, and our ability to grow and sustain our wireless business could be materially and adversely affected. As a result, our results of operations could be impaired.
We may in the future initiate claims or litigation against third parties for infringement of our intellectual property rights or to determine the scope and validity of our proprietary rights or the proprietary rights of our competitors. These claims could also result in significant expense and the diversion of technical and management personnel’s attention.
Undetected failures found in new products may result in a loss of customers or a delay in market acceptance of our products.
To date, we have not been made aware of any significant failures in our products. However, despite testing by us and by current and potential customers, errors may be found in new products after commencement of commercial shipments, which could result in loss of revenue, loss of customers or delay in market acceptance, any of which could adversely affect our business, operating results, and financial condition. We cannot assure that our efforts to monitor, develop, modify and implement appropriate test and manufacturing processes for our products will be sufficient to avoid failures in our products that result in delays in product shipment, replacement costs or potential damage to our reputation, any of which could harm our business, operating results and financial condition.
Conducting business in foreign countries involve additional risks.
A substantial portion of our manufacturing, research and development, and marketing activities is conducted outside the United States, including the United Kingdom, Hong Kong, and China. There are a number of risks inherent in doing business in foreign countries, including: unfavorable political or economic factors; unexpected legal or regulatory changes; lack of sufficient protection for intellectual property rights; difficulties in recruiting and retaining personnel and managing international operations; repatriation of earnings; and less developed infrastructure. If we are unable to manage successfully these and other risks pertaining to our international activities, our operating results, cash flows and financial position could be materially and adversely affected.
Our financial position and results of operations may be adversely affected if tax authorities challenge us and the tax challenges result in unfavorable outcomes.
We currently have international subsidiaries located in China, United Kingdom, and Israel as well as an international branch office located in Hong Kong. The complexities resulting from operating in several different tax jurisdictions increase our exposure to worldwide tax challenges. In the event a review of our tax filings results in unfavorable adjustments to our tax returns, our operating results, cash flows and financial position could be materially and adversely affected.
8
Table of Contents
Conducting business in international markets involves foreign exchange rate exposure that may lead to reduced profitability.
We currently have operations in United Kingdom, Israel, Hong Kong, and China. Fluctuations in the value of the U.S. dollar relative to other currencies may impact our revenues, cost of revenues and operating margins and may result in foreign currency translation gains and losses.
Risks Related to Our Industry
Challenging economic conditions worldwide have from time to time contributed, and may continue to contribute, to slowdowns in the wireless industry at large, resulting in:
| • | reduced demand for our products as a result of continued constraints on corporate and government spending by our customers, |
| • | increased price competition for our products, |
| • | risk of excess and obsolete inventory, |
| • | risk of supply constraints, |
| • | risk of excess facilities and manufacturing capacity, and |
| • | higher costs as a percentage of revenue and higher interest expense. |
Our industry is characterized by rapidly changing technologies and rapidly changing competitive environments. If we are not successful in responding to these changes, our products may become obsolete and we may not be able to compete effectively.
We must continue to evaluate, develop and introduce technologically advanced products that will position us for possible growth in the wireless market. If we are not successful in doing so, our products may not be accepted in the market or may become obsolete and we may not be able to compete effectively.
Consolidation and vertical integration in our industry, and particularly integration of our customers with our competitors, may significantly reduce our ability to successfully market our products to long-standing customers and may adversely affect our vertically integrated customers’ ability to choose our products even if our products are technologically superior.
Changes in laws or regulations, in particular future Federal Communications Commission (“FCC”) regulations or international regulations affecting the broadband market, internet service providers, or the communications industry, could negatively affect our ability to develop new technologies or sell new products and, therefore, reduce our profitability.
The jurisdiction of the FCC extends to the entire communications industry, including our customers and their products and services that incorporate our products. Future FCC regulations affecting the broadband access services industry, our customers or our products may harm our business. For example, future FCC regulatory policies that affect the availability of data and Internet services may impede our customers’ penetration into their markets or affect the prices that they are able to charge. In addition, FCC regulatory policies that affect the specifications of wireless data devices may impede certain of our customers’ ability to manufacture their products profitably, which could, in turn, reduce demand for our products. Furthermore, international regulatory bodies are beginning to adopt standards for the communications industry. Although our business has not been hurt by any regulations to date, in the future, delays caused by our compliance with regulatory requirements may result in order cancellations or postponements of product purchases by our customers, which would reduce our profitability.
Risks Related to our Common Stock
The trading price of our stock price may be volatile based on a number of factors, many of which are not under our control.
Our stock can experience significant changes in price on a percentage basis. The common stock price fluctuated between a high of $8.88 and a low of $4.38 in 2015. Our stock price could be subject to wide fluctuations in response to a variety of factors, many of which are out of our control, including:
| • | adverse change in domestic or global economic conditions, |
9
Table of Contents
| • | new products or services offered by us or our competitors, |
| • | actual or anticipated variations in quarterly operating results, |
| • | changes in financial estimates by securities analysts, |
| • | announcements of technological innovations, |
| • | our announcement of significant acquisitions, strategic partnerships, joint ventures or capital commitments, |
| • | conditions or trends in our industry, |
| • | additions or departures of key personnel, |
| • | mergers and acquisitions, and |
| • | sales of common stock by our stockholders or us or repurchases by us. |
In addition, the NASDAQ Global Select Market, where many publicly held telecommunications companies, including PCTEL, are traded, often experiences extreme price and volume fluctuations. These fluctuations often have been unrelated or disproportionate to the operating performance of these companies.
Provisions in our charter documents may inhibit a change of control or a change of management, which may cause the market price for our common stock to decline and may inhibit a takeover or change in our control that a stockholder may consider favorable.
Provisions in our charter documents could discourage potential acquisition proposals and could delay or prevent a change in control transaction that our stockholders may favor. Specifically, our charter documents do not permit stockholders to act by written consent, do not permit stockholders to call a stockholders meeting, and provide for a classified board of directors, which means stockholders can only elect, or remove, a limited number of our directors in any given year. These provisions could have the effect of discouraging others from making tender offers for our shares, and as a result, these provisions may prevent the market price of our common stock from reflecting the effects of actual or rumored takeover attempts and may prevent stockholders from reselling their shares at or above the price at which they purchased their shares. These provisions may also prevent changes in our management that our stockholders may favor.
Our board of directors has the authority to issue up to 5,000,000 shares of preferred stock in one or more series. The board of directors can fix the price, rights, preferences, privileges and restrictions of this preferred stock without any further vote or action by our stockholders. The rights of the holders of our common stock will be affected by, and may be adversely affected by, the rights of the holders of any preferred stock that may be issued in the future. Further, the issuance of shares of preferred stock may delay or prevent a change in control transaction without further action by our stockholders. As a result, the market price of our common stock may decline.
If we are unable to successfully maintain processes and procedures required by the Sarbanes-Oxley Act of 2002 to achieve and maintain effective internal control over our financial reporting, our ability to provide reliable and timely financial reports could be harmed and our stock price could be adversely affected.
We must comply with the rules promulgated under Section 404 of the Sarbanes-Oxley Act of 2002. Section 404 requires an annual management report assessing the effectiveness of our internal control over financial reporting and a report by our independent registered public accounting firm addressing this assessment.
While we are expending significant resources in maintaining the necessary documentation and testing procedures required by Section 404, we cannot be certain that the actions we are taking to achieve and maintain our internal control over financial reporting will be adequate. If the processes and procedures that we implement for our internal control over financial reporting are inadequate, our ability to provide reliable and timely financial reports, and consequently our business and operating results, could be harmed. This in turn could result in an adverse reaction in the financial markets due to a loss of confidence in the reliability of our financial reports, which could cause the market price of our common stock to decline.
10
Table of Contents
| Item 1B: | Unresolved Staff Comments |
None.
| Item 2: | Properties |
The following table lists our main facilities:
| Lease Term |
||||||||||||
| Location |
Square feet |
Owned/Leased |
Beginning |
Ending |
Segment | |||||||
| Bloomingdale, Illinois |
75,517 | Owned | N/A | N/A | Connected Solutions and Corporate | |||||||
| Tianjin, China |
44,289 | Leased | 2012 | 2020 | Connected Solutions | |||||||
| Germantown, Maryland |
20,704 | Leased | 2012 | 2020 | RF Solutions | |||||||
| Schaumburg, Illinois |
6,652 | Leased | 2015 | 2018 | RF Solutions | |||||||
| Lexington, North Carolina |
5,630 | Leased | 2013 | 2019 | Connected Solutions | |||||||
| Beijing, China |
5,393 | Leased | 2013 | 2016 | Connected Solutions | |||||||
| Englewood, Colorado |
4,759 | Leased | 2015 | 2021 | RF Solutions | |||||||
| Melbourne, Florida |
3,600 | Leased | 2013 | 2018 | RF Solutions | |||||||
Facility Changes
Pursuant to the Asset Purchase Agreement dated February 27, 2015 with Nexgen, we assumed the lease for office space in Schaumburg, Illinois consisting of 6,652 square feet. The total lease obligation pursuant to this lease assumption was $0.3 million. The Schaumburg lease expires on October 31, 2018, but contains a one-time option to elect an early termination of the lease on August 31, 2016. In March 2016, we exercised the early termination option and paid a fee of $57.
In April 2015, we terminated the lease related to a sales office in San Antonio, Texas effective September 27, 2015.
In May 2015, we entered into a new five-year, five-month office lease in Englewood, Colorado consisting of 4,579 square feet of leased space for our expanding engineering services business. The total lease obligation pursuant to this lease is $0.6 million. The lease expires on February 28, 2021; however, during the first quarter 2016, the Company vacated this facility and is marketing this property for sublease. The office is located in an area with low vacancy rates.
Effective October 31, 2015, our lease for our mobile tower assembly facility in Pryor, Oklahoma expired in accordance with its terms. This lease was not renewed after October 2015 because of the Company’s exit from the mobile tower product line.
Due to the recent transfer of certain manufacturing activities to our Tianjin, China facility, in October 2015 we entered into a new five-year lease for additional manufacturing space in Tianjin consisting of 22,163 square feet which expands our footprint in Tianjin to 44,289 square feet. This lease expires October 2020. The total lease obligation pursuant to this lease is $0.2 million.
All properties are in good condition and are suitable for the purposes for which they are used. We believe that we have adequate space for our current needs.
| Item 3: | Legal Proceedings |
TelWorx Parties
After discovering accounting irregularities with respect to the TelWorx Entities and conducting an internal investigation, we pursued restitution from the TelWorx Parties. See Note 8 of the consolidated financial statements for a description of the TelWorx Parties. A legal settlement with an aggregate fair value of $5.4 million was reached with the TelWorx Parties in March 2013 as further described therein.
11
Table of Contents
Other parties on the TelWorx acquisition
We also engaged in efforts to seek restitution from two other parties used by the TelWorx Parties for professional services in the sale of the business to PCTEL. On September 30, 2014, we settled in cash with one party for $0.1 million and on October 10, 2014, we settled with the other party in cash for $0.8 million.
| Item 4: | Mine Safety Disclosures |
Not applicable.
PART II
| Item 5: | Market for Registrant’s Common Equity, Related Stockholder Matters and Issuer Purchases of Equity Securities |
Price Range of Common Stock and Dividends
PCTEL’s common stock has been traded on the NASDAQ Global Select Market under the symbol PCTI since our initial public offering on October 19, 1999. The following table shows the high and low sale prices of our common stock as reported by the NASDAQ Global Select Market for the periods indicated.
| 2015 | 2014 | |||||||||||||||||||||||
| Market Price | Market Price | |||||||||||||||||||||||
| High | Low | Dividends per Share | High | Low | Dividends per Share | |||||||||||||||||||
| Fourth Quarter |
$ | 6.01 | $ | 4.38 | $ | 0.05 | $ | 8.67 | $ | 7.18 | $ | 0.04 | ||||||||||||
| Third Quarter |
$ | 7.24 | $ | 5.27 | $ | 0.05 | $ | 8.42 | $ | 7.36 | $ | 0.04 | ||||||||||||
| Second Quarter |
$ | 8.24 | $ | 7.01 | $ | 0.05 | $ | 8.83 | $ | 7.00 | $ | 0.04 | ||||||||||||
| First Quarter |
$ | 8.88 | $ | 7.97 | $ | 0.05 | $ | 9.51 | $ | 7.90 | $ | 0.04 | ||||||||||||
|
|
|
|
|
|||||||||||||||||||||
| $ | 0.20 | $ | 0.16 | |||||||||||||||||||||
|
|
|
|
|
|||||||||||||||||||||
The closing sale price of our common stock as reported on the NASDAQ Global Select Market on March 10, 2016 was $5.30 per share. As of that date there were 35 holders of record of the common stock. A substantially greater number of holders of the common stock are in “street name” or beneficial holders, whose shares are held of record by banks, brokers, and other financial institutions.
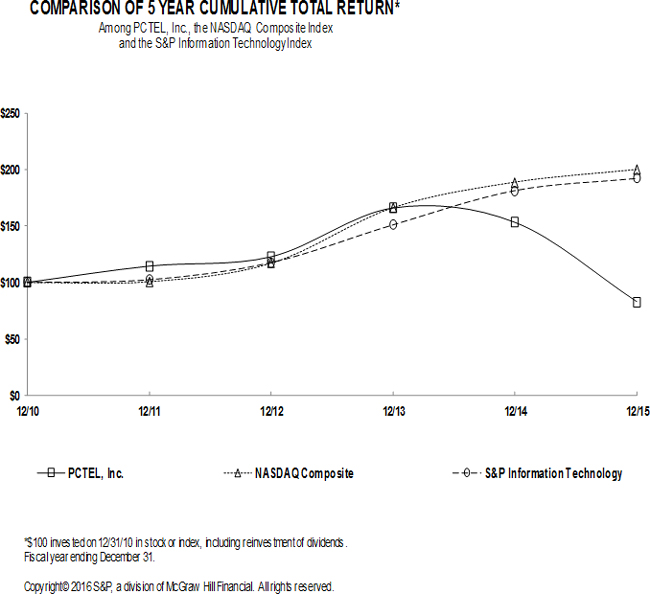
Five-Year Cumulative Total Return Comparison
The following graph compares the annual percentage change in the cumulative return to our stockholders with the cumulative return of the NASDAQ Composite Index and the S&P Information Technology Index for the period beginning December 31, 2010 and ending December 31, 2015. Returns for the indices are weighted based on market capitalization at the beginning of each measurement point. Note that historic stock price performance is not necessarily indicative of future stock price performance.
12
Table of Contents
Sales of Unregistered Equity Securities
None.
Issuer Purchases of Equity Securities
All share repurchase programs are authorized by our Board of Directors and are announced publicly. On April 20, 2015, our Board of Directors authorized an additional 500,000 shares of stock for our share repurchase program. Additionally, on August 10, 2015, our Board of Directors authorized an additional 1,300,000 shares under the existing share repurchase programs, for a total of 2,726,000 shares. We repurchased 1,942,788 shares at an average price of $6.22 during the year ended December 31, 2015. At December 31, 2015, the Company had 783,212 shares authorized for repurchase under this program.
13
Table of Contents
The following table provides the activity of our repurchase program during the three months ended December 31, 2015 (in thousands, except per share amounts):
| Period |
Total Number of Shares Purchased |
Average Price per Share |
Total Number of Shares Purchased as Part of Publicly Announced Programs |
Maximum Number (or Approximate Dollar Value) of Shares That May Yet be Purchased Under the Programs |
||||||||||||
| October 1 - October 31, 2015 |
165,600 | $ | 5.86 | 1,659,619 | 1,066,381 | |||||||||||
| November 1 - November 30, 2015 |
109,300 | $ | 5.49 | 1,768,919 | 957,081 | |||||||||||
| December 1 - December 31, 2015 |
173,869 | $ | 4.70 | 1,942,788 | 783,212 | |||||||||||
| Item 6: | Selected Consolidated Financial Data |
The following selected consolidated financial data should be read in conjunction with “Management’s Discussion and Analysis of Financial Condition and Results of Operations,” the Consolidated Financial Statements and related notes and other financial information appearing elsewhere in this Annual Report on Form 10-K. The statement of operations data for the years ended December 31, 2015, 2014, and 2013 and the balance sheet data as of December 31, 2015 and 2014 are derived from audited financial statements included elsewhere in this Annual Report on Form 10-K. The statement of operations data for the years ended December 31, 2012 and 2011 and the balance sheet data as of December 31, 2013, 2012, and 2011 are derived from audited financial statements not included in this Annual Report on Form 10-K.
14
Table of Contents
| 2015 | 2014 | 2013 | 2012 | 2011 | ||||||||||||||||
| (in thousands, except per share data) | ||||||||||||||||||||
| Consolidated Statement of Operations Data: |
||||||||||||||||||||
| Revenues |
$ | 106,615 | $ | 107,164 | $ | 104,253 | $ | 88,849 | $ | 76,844 | ||||||||||
| Cost of revenues |
69,354 | 63,577 | 62,493 | 53,029 | 40,982 | |||||||||||||||
|
|
|
|
|
|
|
|
|
|
|
|||||||||||
| Gross profit |
37,261 | 43,587 | 41,760 | 35,820 | 35,862 | |||||||||||||||
|
|
|
|
|
|
|
|
|
|
|
|||||||||||
| Operating expenses: |
||||||||||||||||||||
| Research and development |
11,205 | 11,736 | 11,064 | 9,290 | 10,286 | |||||||||||||||
| Sales and marketing |
14,196 | 12,961 | 12,121 | 11,343 | 10,359 | |||||||||||||||
| General and administrative |
12,399 | 12,819 | 15,623 | 10,982 | 10,752 | |||||||||||||||
| Amortization of intangible assets |
3,426 | 1,967 | 2,400 | 2,359 | 2,258 | |||||||||||||||
| Restructuring charges |
1,630 | 0 | 256 | 157 | 117 | |||||||||||||||
| Impairment of goodwill and intangible assets |
161 | 0 | 0 | 12,550 | 0 | |||||||||||||||
|
|
|
|
|
|
|
|
|
|
|
|||||||||||
| Total operating expenses |
43,017 | 39,483 | 41,464 | 46,681 | 33,772 | |||||||||||||||
|
|
|
|
|
|
|
|
|
|
|
|||||||||||
| Operating (loss) income from continuing operations |
(5,756 | ) | 4,104 | 296 | (10,861 | ) | 2,090 | |||||||||||||
| Other income, net |
3,287 | 1,666 | 5,378 | 100 | 195 | |||||||||||||||
|
|
|
|
|
|
|
|
|
|
|
|||||||||||
| (Loss) income before income taxes |
(2,469 | ) | 5,770 | 5,674 | (10,761 | ) | 2,285 | |||||||||||||
| (Benefit) expense for income taxes |
(901 | ) | 1,158 | 2,332 | (4,089 | ) | 604 | |||||||||||||
|
|
|
|
|
|
|
|
|
|
|
|||||||||||
| Net (loss) income from continuing operations |
(1,568 | ) | 4,612 | 3,342 | (6,672 | ) | 1,681 | |||||||||||||
| Net (loss) from discontinued operations, net of tax benefit for income taxes |
0 | 0 | (91 | ) | (2,587 | ) | (1,497 | ) | ||||||||||||
|
|
|
|
|
|
|
|
|
|
|
|||||||||||
| Net (loss) income |
($ | 1,568 | ) | $ | 4,612 | $ | 3,251 | ($ | 9,259 | ) | $ | 184 | ||||||||
|
|
|
|
|
|
|
|
|
|
|
|||||||||||
| (Loss) earnings per share from continuing operations: |
||||||||||||||||||||
| Basic |
($ | 0.09 | ) | $ | 0.25 | $ | 0.19 | ($ | 0.38 | ) | $ | 0.10 | ||||||||
| Diluted |
($ | 0.09 | ) | $ | 0.25 | $ | 0.18 | ($ | 0.38 | ) | $ | 0.09 | ||||||||
| Loss per share from discontinued operations: |
||||||||||||||||||||
| Basic |
$ | 0.00 | $ | 0.00 | ($ | 0.01 | ) | ($ | 0.15 | ) | ($ | 0.09 | ) | |||||||
| Diluted |
$ | 0.00 | $ | 0.00 | $ | 0.00 | ($ | 0.15 | ) | ($ | 0.08 | ) | ||||||||
| (Loss) earnings per share: |
||||||||||||||||||||
| Basic |
($ | 0.09 | ) | $ | 0.25 | $ | 0.18 | ($ | 0.53 | ) | $ | 0.01 | ||||||||
| Diluted |
($ | 0.09 | ) | $ | 0.25 | $ | 0.18 | ($ | 0.53 | ) | $ | 0.01 | ||||||||
| Weighted average shares: |
||||||||||||||||||||
| Basic |
17,737 | 18,159 | 17,797 | 17,402 | 17,186 | |||||||||||||||
| Diluted |
17,737 | 18,389 | 18,184 | 17,402 | 17,739 | |||||||||||||||
| Dividends per common share |
$ | 0.20 | $ | 0.16 | $ | 0.14 | $ | 0.12 | $ | 0.03 | ||||||||||
| Consolidated Balance Sheet Data: |
||||||||||||||||||||
| Cash, cash equivalents and short-term investments |
$ | 31,783 | $ | 60,009 | $ | 57,895 | $ | 51,139 | $ | 61,628 | ||||||||||
| Working capital |
$ | 59,041 | $ | 88,573 | $ | 83,585 | $ | 74,486 | $ | 80,311 | ||||||||||
| Total assets |
$ | 113,710 | $ | 131,669 | $ | 127,432 | $ | 128,570 | $ | 133,464 | ||||||||||
| Total stockholders’ equity |
$ | 100,397 | $ | 115,515 | $ | 112,052 | $ | 108,145 | $ | 116,315 | ||||||||||
15
Table of Contents
| Item 7: | Management’s Discussion and Analysis of Financial Condition and Results of Operations |
The following commentary presents a discussion and analysis of the Company’s financial condition and results of operations by its management. The review highlights the principal factors affecting earnings and the significant changes in balance sheet items for the years 2015 and 2014. Financial information for prior years is presented when appropriate. The objective of this financial review is to enhance investor understanding of the accompanying tables and charts, the consolidated financial statements, notes to financial statements, and financial statistics appearing elsewhere in this Annual Report on Form 10-K. Where applicable, this discussion also reflects management’s insights with respect to known events and trends that have or may reasonably be expected to have a material effect on the Company’s operations and financial condition.
Our 2015 revenues decreased by $0.5 million (0.5%), compared to 2014, due to lower revenues from scanning receivers and engineered site solutions, offset by revenue generated from the business acquired from Nexgen. We recorded an operating loss of $5.8 million in 2015, compared to an operating profit of $4.1 million in 2014. The loss was the result of product mix with lower gross margins, higher intangible amortization, sales and marketing expenses, and restructuring expenses.
Introduction
PCTEL delivers Performance Critical Telecom solutions. RF Solutions develops and provides test equipment, software and engineering services for wireless networks. The industry relies upon PCTEL to benchmark network performance, analyze trends, and optimize wireless networks. Connected Solutions designs and delivers performance critical antennas and site solutions for wireless networks globally. Our antennas support evolving wireless standards for cellular, private, and broadband networks. PCTEL antennas and site solutions support networks worldwide, including SCADA for oil, gas and utilities, fleet management, industrial operations, health care, small cell and network timing deployment, defense, public safety, education, and broadband access.
Revenue growth for antenna products and site solutions is driven by emerging wireless applications in the following markets: public safety, military, and government applications; SCADA, health care, energy, smart grid and agricultural applications; indoor wireless, wireless backhaul, and cellular applications. Revenue growth for scanning receiver products, interference management products, and optimization services is driven by the deployment of new wireless technology and the need for wireless networks to be tuned and reconfigured on a regular basis.
We have an intellectual property portfolio related to antennas, the mounting of antennas, and scanning receivers. These patents are being held for defensive purposes and are not part of an active licensing program.
We operate in two segments for reporting purposes. Our Connected Solutions segment includes our antenna and engineered site solutions and our RF Solutions segment includes our scanning receivers and related RF engineering services. Each segment has its own segment manager as well as its own engineering, sales and marketing, and operational general and administrative functions. All of our accounting and finance, human resources, IT and legal functions are provided on a centralized basis through the corporate function.
On February 27, 2015, PCTEL acquired substantially all of the assets of, and assumed certain specified liabilities of, Nexgen Wireless, Inc. (“Nexgen”) pursuant to an Asset Purchase Agreement dated as of February 27, 2015 (the “Nexgen APA”). The business acquired from Nexgen is based in Schaumburg, Illinois. Nexgen provided a network analysis tool portfolio now known as SeeHawk® Analytics, and engineering services. The RF engineering services acquired in 2015 were integrated into the existing RF engineering services operation and the data analytics products were integrated in the RF scanner product line. Nexgen’s software product portfolio translates real-time network performance data into engineering actions to optimize operator performance and supports crowd-based, cloud-based data analysis to enhance network performance. Nexgen provides performance engineering, specialized staffing, and trend analysis for carriers, infrastructure vendors, and neutral hosts for 2G, 3G, 4G, and LTE networks. Refer to Note 4 of the financial statements for more information on the Nexgen acquisition.
On April 30, 2013, we divested all material assets associated with PCTEL Secure’s ProsettaCore™ technology to Redwall Technologies, LLC (“Redwall”), a development organization that specializes in mobile security, military and defense projects and systems, and critical national infrastructure. Under the terms of the agreement, Redwall acquired the server and device software (the “Software”), the underlying IP, and complete development responsibility for the security products. At the closing of the divestiture, we received no upfront cash payment, but have the right to receive a royalty of 7% of the net sale price of each future sale or license of the Software and each provision of services related to the Software, if any. Under the agreement, royalties will not exceed $10.0 million in the aggregate. In accordance with accounting for discontinued operations, the consolidated financial statements separately reflect the results of PCTEL Secure as discontinued operations for the year ended December 31, 2013.
16
Table of Contents
Results of Operations for Continuing Operations
Years ended December 31, 2015, 2014, and 2013
(All amounts in tables, other than percentages, are in thousands)
REVENUES BY SEGMENT
| 2015 compared to 2014 | 2014 compared to 2013 | |||||||||||||||||||||||||||
| 2015 | $ Change | % Change | 2014 | $ Change | % Change | 2013 | ||||||||||||||||||||||
| Connected Solutions |
$ | 69,579 | ($ | 2,754 | ) | -3.8 | % | $ | 72,333 | ($ | 1,890 | ) | -2.5 | % | $ | 74,223 | ||||||||||||
| RF Solutions |
37,255 | 2,142 | 6.1 | % | 35,113 | 4,803 | 15.8 | % | 30,310 | |||||||||||||||||||
| Corporate |
(219 | ) | 63 | not meaningful | (282 | ) | (2 | ) | not meaningful | (280 | ) | |||||||||||||||||
|
|
|
|
|
|
|
|
|
|
|
|
|
|
|
|||||||||||||||
| Total |
$ | 106,615 | ($ | 549 | ) | -0.5 | % | $ | 107,164 | $ | 2,911 | 2.8 | % | $ | 104,253 | |||||||||||||
|
|
|
|
|
|
|
|
|
|
|
|
|
|
|
|||||||||||||||
Revenues were approximately $106.6 million for the year ended December 31, 2015, a decrease of 0.5% from the prior year. Revenues for the RF Solutions segment increased by $2.1 million (6.1%) due to revenue generated from the business acquired from Nexgen, offset by lower revenues for scanning receivers. Revenues for the Connected Solutions segment decreased $2.8 million (3.8%). Within Connected Solutions, revenues increased for antenna products, but decreased for cellular kitting products and mobile towers. We exited the mobile tower product line as of September 30, 2015. The decline in revenues from mobile towers contributed 2.6% of the 3.8% decrease in revenues for Connected Solutions for the year ended December 31, 2015 compared to the prior year.
Revenues were approximately $107.2 million for the year ended December 31, 2014, an increase of 2.8% from the prior year. RF Solutions segment revenue increased $4.8 million (15.8%) due to the rapid growth of in-building wireless network expansion. Connected Solutions segment revenue decreased $1.9 million, or 2.5%. Within the Connected Solutions segment, revenue declined for antenna products, but increased for cellular kitting products.
GROSS PROFIT BY SEGMENT
| 2015 | % of Revenues | 2014 | % of Revenues | 2013 | % of Revenues | |||||||||||||||||||
| Connected Solutions |
$ | 20,426 | 29.4 | % | $ | 22,818 | 31.5 | % | $ | 22,720 | 30.6 | % | ||||||||||||
| RF Solutions |
16,803 | 45.1 | % | 20,743 | 59.1 | % | 19,018 | 62.7 | % | |||||||||||||||
| Corporate |
32 | not meaningful | 26 | not meaningful | 22 | not meaningful | ||||||||||||||||||
|
|
|
|
|
|
|
|
|
|
|
|
|
|||||||||||||
| Total |
$ | 37,261 | 34.9 | % | $ | 43,587 | 40.7 | % | $ | 41,760 | 40.1 | % | ||||||||||||
|
|
|
|
|
|
|
|
|
|
|
|
|
|||||||||||||
Gross profit was 34.9% for the year ended December 31, 2015, lower by 5.8% compared to 2014. RF Solutions segment gross profit was 45.1%, a decrease of (14.0%). The decrease was due to less favorable product mix of lower revenues from scanning receivers and higher revenues from engineering services. Connected Solutions gross profit was 29.4%, lower by 2.1% compared to 2014. The margin decline was primarily due to the fixed cost capacity variance created by the decline in mobile tower revenue and charges for excess inventories.
Gross profit was 40.7% for the year ended December 31, 2014, higher by 0.6% compared to 2013. RF Solutions segment gross profit was 59.1%, a decrease of (3.6%). The increasing revenue generated by network engineering services contributed (4.9%) of the decrease in percent of revenue. Connected Solutions gross profit was 31.5%, higher by 0.9% compared to 2013. While the segment experienced margin pressure from fixed costs spread over lower revenue, it was more than offset by improvements made through our elimination of unprofitable site solutions products and customers, consolidating the site solutions factory into our Bloomingdale facility, and other supply chain improvements.
17
Table of Contents
CONSOLIDATED OPERATING EXPENSES
| % of Revenues | ||||||||||||||||||||||||||||||||
| 2015 | Change | 2014 | Change | 2013 | 2015 | 2014 | 2013 | |||||||||||||||||||||||||
| Research and development |
$ | 11,205 | ($ | 531 | ) | $ | 11,736 | $ | 672 | $ | 11,064 | 10.5 | % | 11.0 | % | 10.6 | % | |||||||||||||||
| Sales and marketing |
14,196 | 1,235 | 12,961 | 840 | 12,121 | 13.3 | % | 12.1 | % | 11.6 | % | |||||||||||||||||||||
| General and administrative |
12,399 | (420 | ) | 12,819 | (2,804 | ) | 15,623 | 11.6 | % | 12.0 | % | 15.0 | % | |||||||||||||||||||
| Amortization of intangible assets |
3,426 | 1,459 | 1,967 | (433 | ) | 2,400 | 3.2 | % | 1.8 | % | 2.3 | % | ||||||||||||||||||||
| Restructuring charges |
1,630 | 1,630 | 0 | (256 | ) | 256 | 1.5 | % | 0.0 | % | 0.2 | % | ||||||||||||||||||||
| Impairment of goodwill and intangible assets |
161 | 161 | 0 | 0 | 0 | 0.2 | % | 0.0 | % | 0.0 | % | |||||||||||||||||||||
|
|
|
|
|
|
|
|
|
|
|
|
|
|
|
|
|
|||||||||||||||||
| $ | 43,017 | $ | 3,534 | $ | 39,483 | ($ | 1,981 | ) | $ | 41,464 | 40.3 | % | 36.8 | % | 39.8 | % | ||||||||||||||||
|
|
|
|
|
|
|
|
|
|
|
|
|
|
|
|
|
|||||||||||||||||
RESEARCH AND DEVELOPMENT
Research and development expenses decreased $0.5 million from 2014 to 2015. Development expenses for scanning receivers declined $1.7 million and stock compensation expenses declined $0.2 million, offsetting $1.4 million of development expenses related to SeeHawk Analytics. Development expenses declined for scanning receivers because the IBflex® scanning receiver was launched in 2014.
Research and development expenses increased $0.7 million from 2013 to 2014. The increase was primarily due to investments in new scanning receiver technology within the RF Solutions segment.
We had 61, 57, and 63 full-time equivalent employees in research and development at December 31, 2015, 2014, and 2013, respectively.
SALES AND MARKETING
Sales and marketing expenses include costs associated with the sales and marketing employees, sales representatives, product line management, and trade show expenses.
Sales and marketing expenses increased $1.2 million from 2014 to 2015. The increase consisted of $1.0 million related to the business acquired from Nexgen and $0.6 million related to sales headcount and marketing expenses, offset by a $0.4 million reduction in stock compensation expenses.
Sales and marketing expenses increased $0.8 million from 2013 to 2014. The increase consisted of $0.5 million for engineering services and $0.3 million for scanning receivers.
We had 61, 65, 58 full-time equivalent employees in sales and marketing at December 31, 2015, 2014, and 2013, respectively.
GENERAL AND ADMINISTRATIVE
General and administrative expenses include costs associated with the general management, finance, human resources, information technology, legal, public company costs, and other operating expenses to the extent not otherwise allocated to other functions.
General and administrative expenses decreased $0.4 million from 2014 to 2015 due to declines of $1.2 million for legal and professional fees associated with the TelWorx SEC investigation, $0.7 million for stock compensation expenses, and $0.2 million related to expenses for the short-term incentive plan, offsetting $1.7 million of expenses related to the Nexgen acquisition.
General and administrative expenses decreased $2.8 million from 2013 to 2014 due to lower legal and professional services, lower short-term incentive plan expenses, and lower IT expenses for the Enterprise Resource Planning (“ERP”) system. During 2014, we incurred $1.3 million related to legal expenses and other professional fees associated with the litigation with the TelWorx Parties and for the SEC investigation. During 2013, we incurred $2.6 million for legal expenses and other professional fees associated with the litigation with the TelWorx Parties. See the section below entitled “Other Income, Net” for the insurance proceeds received by us as reimbursement for its expenses related to the SEC investigation. Expenses for the short-term incentive plan declined by $1.1 million in 2014 compared to the prior year.
18
Table of Contents
We had 40, 43, and 38 full-time equivalent employees in general and administrative functions at December 31, 2015, 2014, and 2013, respectively.
AMORTIZATION OF INTANGIBLE ASSETS
Amortization expense was approximately $3.4 million in 2015 compared to $2.0 million in 2014. The increase of $1.4 million is due to amortization expense related to intangible assets acquired from Nexgen.
Amortization expense was approximately $2.0 million in 2014 compared to $2.4 million in 2013. Expense decreased by $0.4 million due to assets being fully amortized as of the year ended 2013.
RESTRUCTURING CHARGES
In June 2015, we committed to a restructuring program for reductions in U.S. headcount and the exit from the mobile towers product line. To lower operating and production costs, the company reduced engineering headcount related to scanning receivers, U.S. operations headcount for Connected Solutions, and all headcount related to the mobile tower product line. We terminated 51 employees between June and December 2015 and recorded severance and other employee benefits of $1.2 million.
We acquired the mobile tower product line in the 2012 acquisition of TelWorx (defined below). Our mobile towers were primarily sold into the oil and gas exploration market in North America. The mobile towers were used to primarily provide a communications link to an oil drilling site or lighting for a site under construction. The decline in oil prices caused a decline in related mobile tower sales. We made the decision to exit the mobile tower product line due to the anticipated long term effect on revenue from depressed oil prices, and one of our two tower suppliers filing for Chapter 7 bankruptcy in June 2015 as a result of the decline in sales. Mobile towers were not a key element of our kitting operation or antenna business within Connected Solutions. Our exit from the mobile tower product line does not meet the accounting guidance for discontinued operations. The exit from mobile towers did not constitute a strategic shift in our operations. We recorded a charge of $0.4 million related to write-off of intangible assets related to the mobile product line.
During the second and third quarters of 2013, we integrated our TelWorx business with our Connected Solutions segment. The kitting and order fulfillment operations in North Carolina were consolidated into our Bloomingdale, Illinois facility. As part of the integration, we separated 18 employees resulting in restructuring expense of $0.3 million consisting of employee related costs and asset disposals.
IMPAIRMENT OF GOODWILL AND OTHER INTANGIBLE ASSETS
As part of the our annual impairment test for goodwill as of October 31, 2015, we recorded a goodwill impairment charge of $0.2 million related to our RF Services reporting unit because its fair value was below its carrying value.
We recorded no goodwill impairments in 2014 or 2013. See the discussion of this goodwill impairment within the critical accounting estimates section of this Item 7 and see Note 1 of the consolidated financial statements for information related to our evaluation of goodwill in the fourth quarter 2015.
OPERATING (LOSS) PROFIT BY SEGMENT
| 2015 | % of Revenues | 2014 | % of Revenues | 2013 | % of Revenues | |||||||||||||||||||
| Connected Solutions |
$ | 5,040 | 7.2 | % | $ | 7,357 | 10.2 | % | $ | 6,012 | 8.1 | % | ||||||||||||
| RF Solutions |
(298 | ) | -0.8 | % | 7,333 | 20.9 | % | 7,248 | 23.9 | % | ||||||||||||||
| Corporate |
(10,498 | ) | not meaningful | (10,586 | ) | not meaningful | (12,964 | ) | not meaningful | |||||||||||||||
|
|
|
|
|
|
|
|
|
|
|
|
|
|||||||||||||
| Total |
($ | 5,756 | ) | -5.4 | % | $ | 4,104 | 3.8 | % | $ | 296 | 0.3 | % | |||||||||||
|
|
|
|
|
|
|
|
|
|
|
|
|
|||||||||||||
Total operating profit declined $9.9 million for the year ended December 31, 2015 compared to 2014. The decline is largely attributed to $6.3 million lower gross profit previously discussed, $1.6 million of restructuring costs, and a $1.5 million increase in amortization of intangible assets from the Nexgen acquisition.
19
Table of Contents
Total operating profit improved by $3.8 million during the year ended December 31, 2014 compared to the prior year due to lower corporate expenses and due to higher operating profit for Connected Solutions. Connected Solutions operating profit improved by $1.3 million due to lower incentive plan expenses and lower intangible amortization expense.
Corporate expenses for TelWorx related issues declined by $1.3 million for the year ended December 31, 2014, compared to the prior year. During 2014, we incurred $1.3 million related to legal expenses and other professional fees associated with the litigation with the TelWorx Parties and for the related SEC investigation. During 2013, we incurred $2.6 million for legal expenses and other professional fees associated with the litigation with the TelWorx Parties. Within the corporate functions, expenses for our short-term incentive plan (“STIP”) were lower by approximately $0.8 million for the year ended December 31, 2014 compared to the prior year. While our revenues and earnings improved during 2014, our STIP was based on plan goals for revenue and non-GAAP earnings, weighted 40% for revenues and 60% for non-GAAP earnings. Since we missed the plan goals significantly for revenues and non-GAAP earnings, the payout for the STIP was significantly less than target for 2014.
OTHER INCOME, NET
| 2015 | 2014 | 2013 | ||||||||||
| Settlement income |
$ | 3,160 | $ | 1,005 | $ | 4,330 | ||||||
| Insurance proceeds |
102 | 639 | 1,024 | |||||||||
| Interest income |
55 | 85 | 73 | |||||||||
| Foreign exchange losses |
(33 | ) | (49 | ) | (26 | ) | ||||||
| Other, net |
3 | (14 | ) | (23 | ) | |||||||
|
|
|
|
|
|
|
|||||||
| $ | 3,287 | $ | 1,666 | $ | 5,378 | |||||||
|
|
|
|
|
|
|
|||||||
| Percentage of revenues |
3.1 | % | 1.6 | % | 5.2 | % | ||||||
Other income, net consists of interest income, foreign exchange gains and losses, insurance proceeds, and income from legal settlements.
For the year ended December 31, 2015, an Amendment to the Nexgen APA resulted in settlement income of $3.2 million consisting of $2.3 million from the release of the Nexgen escrow fund, $0.8 million from the collection of previously excluded accounts receivables, and $0.1 million related to the reversal of the contingent liability for the earnout. We also received $0.1 million in insurance proceeds related to claims for legal and professional expenses for the SEC investigation of the TelWorx Parties. The legal expenses and professional fees related to the insurance claim were recorded in general and administrative expenses. We recorded interest income of $55 and foreign exchange losses of $33 during the year ended December 31, 2015.
For the year ended December 31, 2014, settlement income includes $0.9 million related to legal settlements with professional service firms that assisted the TelWorx parties with the sale of the business to PCTEL. We received $0.6 million in insurance proceeds related to claims for legal and professional expenses for the SEC investigation of the TelWorx Parties. The legal expenses and professional fees related to the insurance claim were recorded in general and administrative expenses. We recorded interest income of $85 and foreign exchange losses of $49 during the year ended December 31, 2014.
For the year ended December 31, 2013, other income includes $4.3 million related to the TelWorx settlement we received in the first quarter of 2013 and $1.0 million related to insurance proceeds for claims related to legal and professional expenses for the SEC investigation of the TelWorx Parties. The legal expenses and professional fees related to the insurance claim were recorded in general and administrative expenses. We recorded interest income of $73 and foreign exchange losses of $26 during the year ended December 31, 2013.
(BENEFIT) EXPENSE FOR INCOME TAXES
| 2015 | 2014 | 2013 | ||||||||||
| (Benefit) Expense for income taxes |
($ | 901 | ) | $ | 1,158 | $ | 2,332 | |||||
| Effective tax rate |
36.5 | % | 20.1 | % | 41.1 | % | ||||||
20
Table of Contents
The effective tax rate differed from the statutory Federal rate of 34.0% by approximately 2.5% during 2015 primarily due to research and development credits and incremental tax on repatriation of Israel funds. The effective tax rate differed from the statutory Federal rate of 34.0% by approximately 14.0% during 2014 primarily due to reversals of reserves for uncertain tax positions related to research credits and foreign withholding taxes. The effective tax rate differed from the statutory Federal rate of 34% by approximately 7.0% during 2013 due to state income taxes and a state rate change for deferred tax assets.
At December 31, 2015, we had net deferred tax assets of $13.2 million and a valuation allowance of $0.7 million against the deferred tax assets. We maintain a valuation allowance due to uncertainties regarding realizability. The valuation allowance at December 31, 2015 relates to deferred tax assets in tax jurisdictions in which we no longer have significant operations. Significant management judgment is required to assess the likelihood that our deferred tax assets will be recovered from future taxable income, and the carryback available to offset against prior year gains. On a regular basis, management evaluates the recoverability of deferred tax assets and the need for a valuation allowance.
DISCONTINUED OPERATIONS
| 2015 | 2014 | 2013 | ||||||||||
| Net loss from discontinued operations, net of tax benefit |
$ | 0 | $ | 0 | ($ | 91 | ) | |||||
The net loss from discontinued operations for the year ended December 31, 2013 includes operating expenses of PCTEL Secure net of income taxes. There has been no activity with PCTEL Secure since the sale of the business in April 2013.
Liquidity and Capital Resources
| Years Ended December 31, | ||||||||||||
| 2015 | 2014 | 2013 | ||||||||||
| Net (loss) income |
($ | 1,568 | ) | $ | 4,612 | $ | 3,251 | |||||
| Charges for depreciation, amortization, stock-based compensation, and other non-cash items |
8,085 | 8,720 | 9,727 | |||||||||
| Changes in operating assets and liabilities |
2,557 | (5,356 | ) | (1,575 | ) | |||||||
|
|
|
|
|
|
|
|||||||
| Net cash provided by operating activities |
9,074 | 7,976 | 11,403 | |||||||||
| Net cash used in investing activities |
(7,689 | ) | (6,014 | ) | (5,465 | ) | ||||||
| Net cash used in financing activities |
(14,712 | ) | (3,314 | ) | (1,748 | ) | ||||||
| Cash and cash equivalents at the end of the year |
$ | 7,055 | $ | 20,432 | $ | 21,790 | ||||||
| Short-term investments at the end of the year |
24,728 | 39,577 | 36,105 | |||||||||
| Working capital at the end of the year |
$ | 59,041 | $ | 88,573 | $ | 83,585 | ||||||
Liquidity and Capital Resources Overview
At December 31, 2015, our cash, cash equivalents, and investments were approximately $31.8 million and we had working capital of approximately $59.0 million. Our primary source of liquidity is cash provided by operations, with short term swings in liquidity supported by a significant balance of cash and short-term investments. The balance has fluctuated with cash from operations, acquisitions and divestitures, payment of dividends and the repurchase of our common shares.
Within operating activities, we are historically a net generator of operating funds from our income statement activities and a net user of operating funds for balance sheet expansion. We expect this historical trend to continue in the future.
Within investing activities, capital spending historically ranges between 2.0% and 5.0% of our revenues and the primary use of capital is for manufacturing and engineering development requirements. Our capital expenditures during the year ended December 31, 2015 was approximately 2.0% of revenues. We historically have significant transfers between investments and cash as we rotate our large cash balances and short-term investment balances between money market funds, which are accounted for as cash equivalents, and other investment vehicles. We have a history of supplementing our organic revenue growth with acquisitions of product lines or companies, resulting in significant uses of our cash and short-term investment balances from time to time. We expect the historical trend for capital spending and the variability caused by moving money between cash and investments and periodic merger and acquisition activity to continue in the future.
21
Table of Contents
Within financing activities, we have historically generated funds from the exercise of stock options and proceeds from the issuance of common stock through the Employee Stock Purchase Plan (“ESPP”) and have historically used funds to repurchase shares of our common stock through our share repurchase programs. We pay quarterly dividends and have reinstated a stock repurchase program. Whether this activity results in our being a net user of funds versus a net generator of funds is largely dependent on our stock price during any given year.
Operating Activities:
We generated $9.1 million of funds from operating activities during the year ended December 31, 2015. Adjustments related to non-cash items within net income were $8.1 million for the year ended December 31, 2015 as amortization and depreciation was $7.1 million and stock-based compensation was $1.9 million. Within the balance sheet, we generated cash of $8.3 million from accounts receivable, of which $5.4 million related to the collection of opening balance sheet accounts receivable for Nexgen. We also generated cash from accounts receivable because revenues for the quarter ended December 31, 2015 were $3.3 million lower than the quarter ended December 31, 2014. We used $1.9 million for the payout of the executive deferred compensation plan, and we used $1.5 million to pay annual 2014 accruals, including short-term incentive plan bonuses and sales commissions. Inventories increased $1.4 million due to higher inventories for Connected Solutions. Inventories increased because of the transition of additional production to China from the U.S. and because of increased safety stock. We used $0.4 million for payroll taxes related to stock-based compensation. The tax payments related to our stock issued for restricted stock awards.
We generated $8.0 million of funds from operating activities during the year ended December 31, 2014. Cash from operations consisted of approximately $13.3 million of cash generated from our income statement, offset by approximately $5.3 million of cash used within our balance sheet. Within our income statement activities, we used $1.0 million for payroll taxes related to stock-based compensation. The tax payments related to our stock issued for restricted stock awards. On the balance sheet, we used cash of $5.3 million due to higher accounts receivable. Accounts receivable increased due to higher revenues during the quarter ended compared to quarter ended December 31, 2013 and due to the timing of revenues with the quarters. Revenues were $3.4 million higher for the three months ended December 31, 2014 versus the comparable period in 2013. We used cash of $1.9 million from the increase of inventories. Our inventories were higher for RF Solutions due to the introduction of new products, and our inventories were higher for Connected Solutions to meet the demand for shipments in the first quarter 2015. We generated cash of $1.1 million within the balance sheet due to higher accounts payable. Accounts payable increased due to increases in inventories and due to the timing of vendor purchases during the year ended December 31, 2014 compared to the year ended December 31, 2013.
We generated $11.4 million of funds from operating activities during the year ended December 31, 2013. We generated approximately $12.9 million of cash from our income statement but used $1.5 million of cash from our balance sheet. Within our income statement activities, we used $1.1 million for payroll taxes related to stock-based compensation. The tax payments related to our stock issued for restricted stock awards and performance shares. On the balance sheet, we used cash of $6.1 million for the contraction of accounts payable. Accounts payable declined due to reductions in inventories and due to the timing of vendor purchases during the year ended December 31, 2013 compared to the year ended December 31, 2012. We generated cash of $3.1 million from the reduction of inventories. We managed our RF Solutions inventory down from higher than normal inventory levels at year end 2012. We also lowered our site solutions inventory as a result of the integration of the Lexington business with the operations in Bloomingdale.
Investing Activities:
Our investing activities used $7.7 million of cash during the year ended December 31, 2015. We used $20.5 million for the purchase of the Nexgen business in February 2015. We funded the acquisition from the Company’s cash and from investments that matured during January and February 2015. During the year ended December 31, 2015, redemptions and maturities of our short-term investments provided $45.0 million in cash and we rotated $30.1 million of cash into new short-term investments. We used $2.1 million for capital expenditures during the year ended December 31, 2015.
Our investing activities used $6.0 million of cash during the year ended December 31, 2014 as we used $3.5 million of cash for investments and used $2.5 million for capital expenditures. Redemptions and maturities of our investments in short-term bonds during the year ended December 31, 2014 provided $55.1 million in funds. We rotated $58.6 million of cash into new short-term bonds during the year ended December 31, 2014.
Our investing activities used $5.5 million of cash during the year ended December 31, 2013 as we used $2.5 million of cash for investments and used $3.0 million for capital expenditures. Redemptions and maturities of our investments in short-term bonds during the year ended December 31, 2013 provided $69.5 million in funds. We rotated $72.0 million of cash into new short-term bonds during the year ended December 31, 2013.
22
Table of Contents
Financing Activities:
We used $14.7 million in cash for financing activities during the year ended December 31, 2015. We used $12.1 million to repurchase shares in the stock repurchase program and $3.6 million for cash dividends paid quarterly during 2015. We received $1.0 million in proceeds from the purchase of shares through our ESPP and the exercise of stock options.
We used $3.3 million in cash for financing activities during the year ended December 31, 2014. We paid $3.0 million for quarterly cash dividends and used $1.6 million to repurchase shares in the stock repurchase program. We received $1.3 million in proceeds from the purchase of shares through our ESPP and the exercise of stock options.
We used $1.7 million in cash for financing activities during the year ended December 31, 2013. We paid $2.6 million for quarterly cash dividends and used $0.4 million to repurchase shares in the stock repurchase program. We received $1.3 million in proceeds from the purchase of shares through our ESPP and the exercise of stock options.
Contractual Obligations and Commercial Commitments
The following summarizes our contractual obligations at December 31, 2015 for office and product assembly facility leases, office equipment leases and purchase obligations, and the effect such obligations are expected to have on the liquidity and cash flows in future periods (in thousands):
| Payments Due by Period | ||||||||||||||||||||||||
| Less than | After | |||||||||||||||||||||||
| Total | 1 year | 1-3 years | 4-5 years | 5 years | ||||||||||||||||||||
| Operating leases: |
||||||||||||||||||||||||
| Facility |
(a | ) | $ | 3,713 | $ | 996 | $ | 2,458 | $ | 237 | $ | 22 | ||||||||||||
| Equipment |
(b | ) | $ | 294 | $ | 136 | $ | 154 | $ | 4 | $ | 0 | ||||||||||||
| Purchase obligations |
(c | ) | $ | 5,063 | $ | 5,063 | $ | 0 | $ | 0 | $ | 0 | ||||||||||||
|
|
|
|
|
|
|
|
|
|
|
|||||||||||||||
| Total |
$ | 9,070 | $ | 6,195 | $ | 2,612 | $ | 241 | $ | 22 | ||||||||||||||
|
|
|
|
|
|
|
|
|
|
|
|||||||||||||||
| (a) | Future payments for the lease of office and production facilities. |
| (b) | Future payments for the lease of office equipment. |
| (c) | Includes purchase orders or contracts for the purchase of inventory, as well as for other goods and services, in the ordinary course of business, and excludes the balances for purchases currently recognized as liabilities on the balance sheet. |
As of December 31, 2015, we had obligations through 2020 for capital leases of $154 related to office and manufacturing equipment. See Note 8 of the consolidated financial statements for more information on capital leases.
We have a liability related to uncertain positions for income taxes of $0.8 million at December 31, 2015. We do not know when this obligation will be paid.
Off-Balance Sheet Arrangements
None.
Critical Accounting Policies and Estimates
The preparation of our consolidated financial statements in accordance with generally accepted accounting principles requires us to make estimates and judgments that affect the reported amounts of assets and liabilities and the disclosure of contingent assets and liabilities at the date of the financial statements, and the reported amounts of revenue and expenses during the period reported. By their nature, these estimates and judgments are subject to an inherent degree of uncertainty. Management bases its estimates and judgments on historical experience, market trends, and other factors that are believed to be reasonable under the circumstances. Actual results may differ from these estimates under different assumptions or conditions.
Revenue Recognition - We recognize revenue when the following criteria are met: persuasive evidence of an arrangement exists, delivery has occurred or services have been rendered, price is fixed and determinable, and collectability is reasonably assured. We
23
Table of Contents
recognize revenue for sales of products when title transfers, which is predominantly upon shipment from the factory. For products shipped on consignment, we recognize revenue upon delivery from the consignment location. Revenue recognition is also based on estimates of product returns, allowances, discounts, and other factors. These estimates are based on historical data. We believe that the estimates used are appropriate, but differences in actual experience or changes in estimates may affect future results. We recognize revenue for our network engineering services under the completed performance method. Most services occur in one week or less, and revenue is generally recognized when the engineering reports are completed and issued to the customer.
Accounts Receivable and Allowance for Doubtful Accounts - Accounts receivable are recorded at invoiced amount. We extend credit to our customers based on an evaluation of a company’s financial condition and collateral is generally not required. We maintain an allowance for doubtful accounts for estimated uncollectible accounts receivable. The allowance is based on our assessment of known delinquent accounts, historical experience, and other currently available evidence of the collectability and the aging of accounts receivable. Although management believes the current allowance is sufficient to cover existing exposures, there can be no assurance against the deterioration of a major customer’s creditworthiness, or against defaults that are higher than what has been experienced historically.
Excess and Obsolete Inventory - We maintain reserves to reduce the value of inventory to the lower of cost or market and reserves for excess and obsolete inventory. Reserves for excess inventory are calculated based on our estimate of inventory in excess of normal and planned usage. Obsolete reserves are based on our identification of inventory where carrying value is above net realizable value. We believe the accounting estimate related to excess and obsolete inventory is a critical accounting estimate because it requires us to make assumptions about future sales volumes and product mix, both of which are highly uncertain. Changes in these estimates can have a material impact on our financial statements.
Warranty Costs - We offer repair and replacement warranties of primarily five years for antenna products and scanning receiver products. Our warranty reserve is based on historical sales and costs of repair and replacement trends. We believe that the accounting estimate related to warranty costs is a critical accounting estimate because it requires us to make assumptions about matters that are highly uncertain, including future rates of product failure and repair costs. Changes in warranty reserves could be material to our financial statements.
Stock-based Compensation - We recognize stock-based compensation expense for all share based payment awards in accordance with fair value recognition provisions. Under the fair value provisions, we recognize stock-based compensation expense net of an estimated forfeiture rate, recognizing compensation cost only for those awards expected to vest over requisite service periods of the awards. Stock-based compensation expense and disclosures are dependent on assumptions used in calculating such amounts. These assumptions include risk-free interest rates, expected term of the stock-based compensation instrument granted, volatility of stock and option prices, expected time between grant date and date of exercise, attrition, performance, and other factors. These factors require us to use judgment. Our estimates of these assumptions typically are based on historical experience and currently available market place data. While management believes that the estimates used are appropriate, differences in actual experience or changes in assumptions may affect our future stock-based compensation expense and disclosures.
Income Taxes - Income taxes are accounted for under the asset and liability method. Deferred tax assets and liabilities are recognized for the future tax consequences attributable to differences between the financial statement carrying amounts of existing assets and liabilities and their respective tax bases and operating loss and tax credit carryforwards. Deferred tax assets and liabilities are measured using enacted tax rates expected to apply to taxable income in the years in which those temporary differences are expected to be recovered or settled. The effect on deferred tax assets and liabilities of a change in tax rates is recognized in income in the period that includes the enactment date.
Our operations have international subsidiaries located in China, United Kingdom and Israel, as well as an international branch office located in Hong Kong. The complexities brought on by operating in several different tax jurisdictions inevitably lead to an increased exposure to worldwide taxes. Should review of the tax filings result in unfavorable adjustments to our tax returns, the operating results, cash flows, and financial position could be materially and adversely affected.
We are subject to the continuous examination of our income tax returns by the Internal Revenue Service and other tax authorities. A change in the assessment of the outcomes of such matters could materially impact our consolidated financial statements. The calculation of tax liabilities involves dealing with uncertainties in the application of complex tax regulations. We recognize liabilities for anticipated tax audit issues based on our estimate of whether, and the extent to which, additional taxes may be required. If we ultimately determine that payment of these amounts is unnecessary, then we reverse the liability and recognize a tax benefit during the period in which we determine that the liability is no longer necessary. We also recognize tax benefits to the extent that it is more likely than not that our positions will be sustained if challenged by the taxing authorities. To the extent we prevail in matters for which liabilities have been established, or are required to pay amounts in excess of our liabilities, our effective tax rate in a given
24
Table of Contents
period may be materially affected. An unfavorable tax settlement would require cash payments and may result in an increase in our effective tax rate in the year of resolution. A favorable tax settlement would be recognized as a reduction in our effective tax rate in the year of resolution.
Valuation Allowances for Deferred Tax Assets - We establish an income tax valuation allowance when available evidence indicates that it is more likely than not that all or a portion of a deferred tax asset will not be realized. In assessing the need for a valuation allowance, we consider the amounts and timing of expected future deductions or carryforwards and sources of taxable income that may enable utilization. We maintain an existing valuation allowance until sufficient positive evidence exists to support its reversal. Changes in the amount or timing of expected future deductions or taxable income may have a material impact on the level of income tax valuation allowances. Our assessment of the realizability of the deferred tax assets requires judgment about our future results. Inherent in this estimation is the requirement for us to estimate future book and taxable income and possible tax planning strategies. These estimates require us to exercise judgment about our future results, the prudence and feasibility of possible tax planning strategies, and the economic environment in which we do business. It is possible that the actual results will differ from the assumptions and require adjustments to the allowance. Adjustments to the allowance would affect future net income.
Impairment Reviews of Goodwill – We perform an annual impairment test of goodwill as of the end of the first month of the fiscal fourth quarter (October 31st), or at an interim date if an event occurs or if circumstances change that would indicate that an impairment loss may have been incurred. In performing our annual impairment test, we first perform a qualitative assessment to determine whether it is more likely that not that the fair value of a reporting unit is less than its carrying value, including goodwill. If our qualitative assessment is indicative of possible impairment, then a two-step quantitative fair value assessment is performed at the reporting unit level. In the first step, the fair value of each reporting unit is compared with its carrying value. If the fair value exceeds the carrying value, then goodwill is not impaired and no further testing is performed. The second step is performed if the carrying value exceeds the fair value. The implied fair value of goodwill is then compared against the carrying value of goodwill to determine the amount of impairment.
The process of evaluating the potential impairment of goodwill is subjective because it requires the use of estimates and assumptions in determining a reporting unit’s fair value. We calculate the fair value of each reporting unit by using the income approach based on the present value of future discounted cash flows. The discounted cash flow method requires us to use estimates and judgments about the future cash flows of the reporting units. Although we base cash flow forecasts on assumptions that are consistent with plans and estimates we use to manage the underlying reporting units, there is significant judgment in determining the cash flows attributable to these reporting units, including markets and market share, sales volumes and mix, research and development expenses, tax rates, capital spending, discount rate and working capital changes. Cash flow forecasts are based on reporting unit operating plans for the early years and business projections in later years. We believe the accounting estimate related to the valuation of goodwill is a critical accounting estimate because it requires us to make assumptions that are highly uncertain about the future cash flows of our reporting units.
While the use of historical results and future projections can result in different valuations for a business, it is a generally accepted valuation practice to apply more than one valuation technique to establish a range of values for a business. Since each technique relies on different inputs and assumptions, it is unlikely that each technique would yield the same results. However, it is expected that the different techniques would establish a reasonable range. In determining the fair value, we weigh the two methods equally because we believe both methods have an equal probability of providing an appropriate fair value.
Impairment Reviews of Finite-Lived Intangible Assets - We evaluate the carrying value of finite-lived intangible assets and other long-lived assets for impairment whenever indicators of impairment exist. We test finite-lived intangible assets for recoverability using undiscounted cash flows. Although we base cash flow forecasts on assumptions that are consistent with plans and estimates we use to manage the underlying reporting units, there is significant judgment in determining the cash flows attributable to these reporting units, including markets and market share, sales volumes and mix, research and development expenses, capital spending and working capital changes. Cash flow forecasts are based on operating plans and business projections. We compare the tax-affected undiscounted cash flows to the carrying value of the asset group. If the carrying value exceeds the sum of the undiscounted cash flows of the asset group, the Company would assess the fair value of the intangible assets in the group to determine if an impairment charge should be recognized in the financial statements.
We believe the accounting estimate related to the valuation of intangible assets is a critical accounting estimate because it requires us to make assumptions about future sales prices and volumes for products that involve new technologies and applications where customer acceptance of new products or timely introduction of new technologies into their networks are uncertain. The recognition of impairment could be material to our financial statements.
25
Table of Contents
Recent Accounting Pronouncements
In February 2016, the Financial Accounting Standards Board (“FASB”) issued Accounting Standards Update (“ASU”) No. 2016-02, “Leases (Topic 842),” which requires lessees to recognize assets and liabilities for the rights and obligations created by most leases on their balance sheet. The guidance is effective for fiscal years beginning after December 15, 2018, including interim periods within those fiscal years. Early application is permitted. ASU 2016-02 requires modified retrospective adoption for all leases existing at, or entered into after, the date of initial application, with an option to use certain transition relief. We are currently evaluating the impact the standard may have on our consolidated financial statements and related disclosures.
In November 2015, the FASB issued ASU 2015-17, Balance Sheet Classification of Deferred Taxes, to simplify the presentation of deferred income taxes. The amendments in this update require that deferred tax assets and liabilities be entirely classified as noncurrent within the statement of financial position. Effective December 31, 2015, we early adopted the balance sheet classification of deferred taxes on a prospective basis. The guidance requires deferred tax assets and liabilities to be classified as noncurrent rather than split between current and noncurrent. Approximately $1.8 million in current deferred tax assets were reclassified to long-term deferred tax assets at December 31, 2015. See Note 7 to the consolidated financial statements for additional details related to income taxes.
In July 2015, the FASB issued ASU 2015-11, “Simplifying the Measurement of Inventory (Topic 330).” The new guidance requires most inventory to be measured at the lower of cost and net realizable value, thereby simplifying the previous guidance under which an entity must measure inventory at the lower of cost or market. Market is defined as replacement cost, net realizable value (“NRV”), or NRV less a normal profit margin. The ASU will not apply to inventory that is measured using either the last-in, first-out method or the retail inventory method. The standard will be effective prospectively for the first interim period within annual reporting periods beginning after December 15, 2016. Early adoption is permitted. The Company is currently assessing the provisions of the guidance and has not determined the impact of the adoption of this guidance on its consolidated financial statements.
In June 2014, the FASB issued ASU No. 2014-12, Accounting for Share-Based Payments When the Terms of an Award Provide That a Performance Target Could Be Achieved after the Requisite Service Period. ASU 2014-12 was issued to clarify that a performance target in a share-based payment that affects vesting and that could be achieved after the requisite service period should be accounted for as a performance condition under Accounting Standards Codification (ASC) 718, Compensation - Stock Compensation. As a result, the target is not reflected in the estimation of the award’s grant date fair value. Compensation cost would be recognized over the required service period, if it is probable that the performance condition will be achieved. The adoption of ASU No. 2014-12 is not expected to have a material impact on our consolidated financial statements.
In May 2014, the FASB issued ASU 2014-09 “Revenue from Contracts with Customers” which introduces a new revenue recognition model in which an entity should recognize revenue to depict the transfer of promised goods or services to customers in an amount that reflects the consideration to which the entity expects to be entitled in exchange for those goods or services. ASU 2014-09 defines a five step process to achieve this core principle and, in doing so, more judgment and estimates may be required within the revenue recognition process than are required under existing U.S. GAAP. This ASU also requires disclosures sufficient to enable users to understand the nature, amount, timing, and uncertainty of revenue and cash flows arising from contracts with customers, including qualitative and quantitative disclosures about contracts with customers, significant judgments and changes in judgments, and assets recognized from the costs to obtain or fulfill a contract. The FASB has voted to approve a one-year deferral of the effective date from January 1, 2017 to January 1, 2018, while allowing for early adoption as of January 1, 2017. The new accounting standard is expected to have an impact on our consolidated financial statements. We are currently evaluating the adoption method options and the impact of the new guidance on our consolidated financial statements.
In April 2014, the FASB issued ASU 2014-08, “Presentation of Financial Statements” which includes amendments that change the requirements for reporting discontinued operations and require additional disclosures about discontinued operations. Under the new guidance, only disposals representing a strategic shift in operations - that is, a major effect on the organization’s operations and financial results should be presented as discontinued operations. Examples include a disposal of a major geographic area, a major line of business, or a major equity method investment. Additionally, the ASU requires expanded disclosures about discontinued operations that will provide financial statement users with more information about the assets, liabilities, income, and expenses of discontinued operations. This update is effective in the first quarter of 2015. We do not expect the new guidance to have a material impact on our consolidated financial statements.
26
Table of Contents
| Item 7A: | Quantitative and Qualitative Disclosures about Market Risk |
We are exposed to market risk from changes in interest rates, foreign exchange rates, credit risk, and investment risk as follows:
Interest Rate Risk
We manage the sensitivity of our results of operations to interest rate risk on cash equivalents by maintaining a conservative investment portfolio. The primary objective of our investment activities is to preserve principal without significantly increasing risk. To achieve this objective, we maintain our portfolio of cash equivalents, short-term investments, and long-term investments in, pre-refunded municipal bonds, U.S. government agency bonds or money market funds invested exclusively in government agency bonds and AA or higher rated corporate bonds.
Due to changes in interest rates, our future investment income may fall short of expectations. A hypothetical increase or decrease of 10% in market interest rates would not result in a material decrease in interest income earned through maturity on investments held at December 31, 2015. We do not hold or issue derivatives, derivative commodity instruments or other financial instruments for trading purposes.
Foreign Currency Risk
We are exposed to currency fluctuations due to our foreign operations and because we sell our products internationally. We manage the sensitivity of our international sales by denominating the majority of transactions in U.S. dollars. If the United States dollar uniformly increased or decreased in strength by 10% relative to the currencies in which our sales were denominated, our net income would not have changed by a material amount for the year ended December 31, 2015. For purposes of this calculation, we have assumed that the exchange rates would change in the same direction relative to the United States dollar. Our exposure to foreign exchange rate fluctuations, however, arises in part from translation of the financial statements of foreign subsidiaries into U.S. dollars in consolidation. As exchange rates vary, these results, when translated, may vary from expectations and adversely impact overall expected profitability.
We had $1.3 million of cash in foreign bank accounts at December 31, 2015. We plan to repatriate the cash from our subsidiary in Israel during 2016 because we expect to cease operations of this entity. We do not expect the foreign currency exchange related to the repatriation of these funds to have a material impact on the financial statements. As of December 31, 2015, we had no intention of repatriating the cash in our foreign bank accounts in China or the U.K. If we decide to repatriate the cash in these foreign bank accounts, we may experience difficulty in repatriating the cash in a timely manner. We may also be exposed to foreign currency fluctuations and taxes if we repatriate these funds.
Credit Risk
The financial instruments that potentially subject us to credit risk consist primarily of trade receivables. For trade receivables, credit risk is the potential for a loss due to a customer not meeting its payment obligations. Our customers are concentrated in the wireless communications industry. Estimates are used in determining an allowance for amounts which we may not be able to collect, based on current trends, the length of time receivables are past due and historical collection experience. Provisions for and recovery of bad debts are recorded as sales and marketing expense in the consolidated statements of operations. We perform ongoing evaluations of customers’ credit limits and financial condition. Generally, we do not require collateral from customers. No customer’s accounts receivable balance represented 10% or greater of gross accounts receivable at December 31, 2015 or December 31, 2014. Our allowances for potential credit losses have historically been adequate compared to actual losses. No customers represented 10% of our revenues for the years ended December 31, 2015, 2014, 2013.
27
Table of Contents
| Item 8: | Financial Statements and Supplementary Data |
PCTEL, INC.
INDEX TO THE CONSOLIDATED FINANCIAL STATEMENTS
28
Table of Contents
REPORT OF INDEPENDENT REGISTERED PUBLIC ACCOUNTING FIRM
Board of Directors and Stockholders
PCTEL, Inc.
We have audited the accompanying consolidated balance sheets of PCTEL, Inc. (a Delaware corporation) and subsidiaries (the Company) as of December 31, 2015 and 2014, and the related consolidated statements of operations, comprehensive (loss) income, stockholders’ equity, and cash flows for each of the three years in the period ended December 31, 2015. Our audits of the basic consolidated financial statements included the financial statement schedule listed in the index appearing under Item 15(a)(2). These financial statements and financial statement schedule are the responsibility of the Company’s management. Our responsibility is to express an opinion on these financial statements and financial statement schedule based on our audits.
We conducted our audits in accordance with the standards of the Public Company Accounting Oversight Board (United States). Those standards require that we plan and perform the audit to obtain reasonable assurance about whether the financial statements are free of material misstatement. An audit includes examining, on a test basis, evidence supporting the amounts and disclosures in the financial statements. An audit also includes assessing the accounting principles used and significant estimates made by management, as well as evaluating the overall financial statement presentation. We believe that our audits provide a reasonable basis for our opinion.
In our opinion, the consolidated financial statements referred to above present fairly, in all material respects, the financial position of PCTEL Inc. and subsidiaries as of December 31, 2015 and 2014, and the results of their operations and their cash flows for each of the three years in the period ended December 31, 2015 in conformity with accounting principles generally accepted in the United States of America. Also in our opinion, the related financial statement schedule, when considered in relation to the basic consolidated financial statements taken as a whole, present fairly, in all material respects, the information set forth therein.
As discussed in note 1 to the consolidated financial statements, the Company adopted new accounting guidance in 2015 related to the presentation of deferred income taxes.
We also have audited, in accordance with the standards of the Public Company Accounting Oversight Board (United States), the Company’s internal control over financial reporting as of December 31, 2015, based on criteria established in the 2013 Internal Control—Integrated Framework issued by the Committee of Sponsoring Organizations of the Treadway Commission (COSO), and our report dated March 15, 2016 expressed an unqualified opinion thereon.
/s/ Grant Thornton LLP
Chicago, Illinois
March 15, 2016
29
Table of Contents
REPORT OF INDEPENDENT REGISTERED PUBLIC ACCOUNTING FIRM
Board of Directors and Stockholders
PCTEL, Inc.
We have audited the internal control over financial reporting of PCTEL, Inc. (a Delaware corporation) and subsidiaries (the Company) as of December 31, 2015, based on criteria established in the 2013 Internal Control—Integrated Framework issued by the Committee of Sponsoring Organizations of the Treadway Commission (COSO). The Company’s management is responsible for maintaining effective internal control over financial reporting and for its assessment of the effectiveness of internal control over financial reporting, included in the accompanying “Management’s Report on Internal Control Over Financial Reporting”. Our responsibility is to express an opinion on the Company’s internal control over financial reporting based on our audit.
We conducted our audit in accordance with the standards of the Public Company Accounting Oversight Board (United States). Those standards require that we plan and perform the audit to obtain reasonable assurance about whether effective internal control over financial reporting was maintained in all material respects. Our audit included obtaining an understanding of internal control over financial reporting, assessing the risk that a material weakness exists, testing and evaluating the design and operating effectiveness of internal control based on the assessed risk, and performing such other procedures as we considered necessary in the circumstances. We believe that our audit provides a reasonable basis for our opinion.
A company’s internal control over financial reporting is a process designed to provide reasonable assurance regarding the reliability of financial reporting and the preparation of financial statements for external purposes in accordance with generally accepted accounting principles. A company’s internal control over financial reporting includes those policies and procedures that (1) pertain to the maintenance of records that, in reasonable detail, accurately and fairly reflect the transactions and dispositions of the assets of the company; (2) provide reasonable assurance that transactions are recorded as necessary to permit preparation of financial statements in accordance with generally accepted accounting principles, and that receipts and expenditures of the company are being made only in accordance with authorizations of management and directors of the company; and (3) provide reasonable assurance regarding prevention or timely detection of unauthorized acquisition, use, or disposition of the company’s assets that could have a material effect on the financial statements.
Because of its inherent limitations, internal control over financial reporting may not prevent or detect misstatements. Also, projections of any evaluation of effectiveness to future periods are subject to the risk that controls may become inadequate because of changes in conditions, or that the degree of compliance with the policies or procedures may deteriorate.
In our opinion, the Company maintained, in all material respects, effective internal control over financial reporting as of December 31, 2015, based on criteria established in the 2013 Internal Control—Integrated Framework issued by COSO.
We also have audited, in accordance with the standards of the Public Company Accounting Oversight Board (United States), the consolidated financial statements of the Company as of and for the year ended December 31, 2015, and our report dated March 15, 2016 expressed an unqualified opinion on those financial statements.
/s/ Grant Thornton LLP
Chicago, Illinois
March 15, 2016
30
Table of Contents
PCTEL, INC.
(in thousands, except share data)
| December 31, 2015 |
December 31, 2014 |
|||||||
| ASSETS | ||||||||
| Cash and cash equivalents |
$ | 7,055 | $ | 20,432 | ||||
| Short-term investment securities |
24,728 | 39,577 | ||||||
| Accounts receivable, net of allowance for doubtful accounts of $314 and $121 at December 31, 2015 and December 31, 2014, respectively |
21,001 | 23,874 | ||||||
| Inventories, net |
17,596 | 16,358 | ||||||
| Deferred tax assets, net |
0 | 2,281 | ||||||
| Prepaid expenses and other assets |
1,586 | 1,757 | ||||||
|
|
|
|
|
|||||
| Total current assets |
71,966 | 104,279 | ||||||
| Property and equipment, net |
13,839 | 14,842 | ||||||
| Goodwill |
3,332 | 161 | ||||||
| Intangible assets, net |
11,378 | 2,637 | ||||||
| Deferred tax assets, net |
13,155 | 9,710 | ||||||
| Other noncurrent assets |
40 | 40 | ||||||
|
|
|
|
|
|||||
| TOTAL ASSETS |
$ | 113,710 | $ | 131,669 | ||||
|
|
|
|
|
|||||
| LIABILITIES AND STOCKHOLDERS’ EQUITY | ||||||||
| Accounts payable |
$ | 6,735 | $ | 5,495 | ||||
| Accrued liabilities |
6,190 | 10,211 | ||||||
|
|
|
|
|
|||||
| Total current liabilities |
12,925 | 15,706 | ||||||
| Other long-term liabilities |
388 | 448 | ||||||
|
|
|
|
|
|||||
| Total liabilities |
13,313 | 16,154 | ||||||
|
|
|
|
|
|||||
| Stockholders’ equity: |
||||||||
| Common stock, $0.001 par value, 100,000,000 shares authorized, 17,654,236 and 18,571,419 shares issued and outstanding at December 31, 2015 and December 31, 2014, respectively |
18 | 19 | ||||||
| Additional paid-in capital |
135,714 | 145,462 | ||||||
| Accumulated deficit |
(35,320 | ) | (30,101 | ) | ||||
| Accumulated other comprehensive income (loss) |
(15 | ) | 135 | |||||
|
|
|
|
|
|||||
| Total stockholders’ equity |
100,397 | 115,515 | ||||||
|
|
|
|
|
|||||
| TOTAL LIABILITIES AND STOCKHOLDERS’ EQUITY |
$ | 113,710 | $ | 131,669 | ||||
|
|
|
|
|
|||||
The accompanying notes are an integral part of these consolidated financial statements.
31
Table of Contents
PCTEL, INC.
CONSOLIDATED STATEMENTS OF OPERATIONS
(in thousands, except per share data)
| Years Ended December 31, | ||||||||||||
| 2015 | 2014 | 2013 | ||||||||||
| REVENUES |
$ | 106,615 | $ | 107,164 | $ | 104,253 | ||||||
| COST OF REVENUES |
69,354 | 63,577 | 62,493 | |||||||||
|
|
|
|
|
|
|
|||||||
| GROSS PROFIT |
37,261 | 43,587 | 41,760 | |||||||||
|
|
|
|
|
|
|
|||||||
| OPERATING EXPENSES: |
||||||||||||
| Research and development |
11,205 | 11,736 | 11,064 | |||||||||
| Sales and marketing |
14,196 | 12,961 | 12,121 | |||||||||
| General and administrative |
12,399 | 12,819 | 15,623 | |||||||||
| Amortization of intangible assets |
3,426 | 1,967 | 2,400 | |||||||||
| Impairment of goodwill |
161 | 0 | 0 | |||||||||
| Restructuring charges |
1,630 | 0 | 256 | |||||||||
|
|
|
|
|
|
|
|||||||
| Total operating expenses |
43,017 | 39,483 | 41,464 | |||||||||
|
|
|
|
|
|
|
|||||||
| OPERATING (LOSS) INCOME |
(5,756 | ) | 4,104 | 296 | ||||||||
| Other income, net |
3,287 | 1,666 | 5,378 | |||||||||
|
|
|
|
|
|
|
|||||||
| (LOSS) INCOME BEFORE INCOME TAXES |
(2,469 | ) | 5,770 | 5,674 | ||||||||
| (Benefit) Expense for income taxes |
(901 | ) | 1,158 | 2,332 | ||||||||
|
|
|
|
|
|
|
|||||||
| NET (LOSS) INCOME FROM CONTINUING OPERATIONS |
(1,568 | ) | 4,612 | 3,342 | ||||||||
| NET LOSS FROM DISCONTINUED OPERATIONS, NET OF TAX BENEFIT |
0 | 0 | (91 | ) | ||||||||
|
|
|
|
|
|
|
|||||||
| NET (LOSS) INCOME |
($ | 1,568 | ) | $ | 4,612 | $ | 3,251 | |||||
|
|
|
|
|
|
|
|||||||
| (Loss) Earnings per Share from Continuing Operations: |
||||||||||||
| Basic |
($ | 0.09 | ) | $ | 0.25 | $ | 0.19 | |||||
| Diluted |
($ | 0.09 | ) | $ | 0.25 | $ | 0.18 | |||||
| Loss per Share from Discontinued Operations: |
||||||||||||
| Basic |
$ | 0.00 | $ | 0.00 | ($ | 0.01 | ) | |||||
| Dilute |
$ | 0.00 | $ | 0.00 | $ | 0.00 | ||||||
| (Loss) Earnings per Share: |
||||||||||||
| Basic |
($ | 0.09 | ) | $ | 0.25 | $ | 0.18 | |||||
| Diluted |
($ | 0.09 | ) | $ | 0.25 | $ | 0.18 | |||||
| Weighted Average Shares: |
||||||||||||
| Basic |
17,737 | 18,159 | 17,797 | |||||||||
| Diluted |
17,737 | 18,389 | 18,184 | |||||||||
| Cash dividend per share |
$ | 0.20 | $ | 0.16 | $ | 0.14 | ||||||
The accompanying notes are an integral part of these consolidated financial statements.
32
Table of Contents
PCTEL, INC.
CONSOLIDATED STATEMENTS OF COMPREHENSIVE (LOSS) INCOME
(in thousands, except per share data)
| Years Ended December 31, | ||||||||||||
| 2015 | 2014 | 2013 | ||||||||||
| NET (LOSS) INCOME |
($ | 1,568 | ) | $ | 4,612 | $ | 3,251 | |||||
| OTHER COMPREHENSIVE (LOSS) INCOME: |
||||||||||||
| Foreign currency translation adjustments |
(150 | ) | (74 | ) | 61 | |||||||
|
|
|
|
|
|
|
|||||||
| COMPREHENSIVE (LOSS) INCOME |
($ | 1,718 | ) | $ | 4,538 | $ | 3,312 | |||||
|
|
|
|
|
|
|
|||||||
The accompanying notes are an integral part of these consolidated financial statements.
33
Table of Contents
PCTEL, INC.
CONSOLIDATED STATEMENTS OF STOCKHOLDERS’ EQUITY
(in thousands)
| Common Stock |
Additional Paid-In Capital |
Retained Deficit |
Accumulated Other Comprehensive Income (Loss) |
Total Stockholders’ Equity of PCTEL, Inc. |
||||||||||||||||
| BALANCE at JANUARY 1, 2012 |
$ | 19 | $ | 140,388 | ($ | 32,410 | ) | $ | 148 | $ | 108,145 | |||||||||
| Stock-based compensation expense |
0 | 3,441 | 0 | 0 | 3,441 | |||||||||||||||
| Issuance of shares for stock purchase and option plans |
1 | 1,265 | 0 | 0 | 1,266 | |||||||||||||||
| Cancellation of shares for payment of withholding tax |
(1 | ) | (1,097 | ) | 0 | 0 | (1,098 | ) | ||||||||||||
| Repurchase of common stock |
0 | (435 | ) | 0 | 0 | (435 | ) | |||||||||||||
| Dividends paid |
0 | 10 | (2,589 | ) | 0 | (2,579 | ) | |||||||||||||
| Net income |
0 | 0 | 3,251 | 0 | 3,251 | |||||||||||||||
| Change in cumulative translation adjustment, net |
0 | 0 | 0 | 61 | 61 | |||||||||||||||
|
|
|
|
|
|
|
|
|
|
|
|||||||||||
| BALANCE at DECEMBER 31, 2013 |
$ | 19 | $ | 143,572 | ($ | 31,748 | ) | $ | 209 | $ | 112,052 | |||||||||
|
|
|
|
|
|
|
|
|
|
|
|||||||||||
| Stock-based compensation expense |
0 | 3,276 | 0 | 0 | 3,276 | |||||||||||||||
| Issuance of shares for stock purchase and option plans |
1 | 1,091 | 0 | 0 | 1,092 | |||||||||||||||
| Cancellation of shares for payment of withholding tax |
0 | (1,037 | ) | 0 | 0 | (1,037 | ) | |||||||||||||
| Tax effect from stock based compensation |
0 | 203 | 0 | 0 | 203 | |||||||||||||||
| Repurchase of common stock |
(1 | ) | (1,651 | ) | 0 | 0 | (1,652 | ) | ||||||||||||
| Dividends paid |
0 | 8 | (2,965 | ) | 0 | (2,957 | ) | |||||||||||||
| Net income |
0 | 0 | 4,612 | 0 | 4,612 | |||||||||||||||
| Change in cumulative translation adjustment, net |
0 | 0 | 0 | (74 | ) | (74 | ) | |||||||||||||
|
|
|
|
|
|
|
|
|
|
|
|||||||||||
| BALANCE at DECEMBER 31, 2014 |
$ | 19 | $ | 145,462 | ($ | 30,101 | ) | $ | 135 | $ | 115,515 | |||||||||
|
|
|
|
|
|
|
|
|
|
|
|||||||||||
| Stock-based compensation expense |
0 | 1,865 | 0 | 0 | 1,865 | |||||||||||||||
| Issuance of shares for stock purchase and option plans |
0 | 1,018 | 0 | 0 | 1,018 | |||||||||||||||
| Cancellation of shares for payment of withholding tax |
0 | (438 | ) | 0 | 0 | (438 | ) | |||||||||||||
| Tax effect from stock based compensation |
0 | (115 | ) | 0 | 0 | (115 | ) | |||||||||||||
| Repurchase of common stock |
(1 | ) | (12,078 | ) | 0 | 0 | (12,079 | ) | ||||||||||||
| Dividends paid |
0 | 0 | (3,651 | ) | 0 | (3,651 | ) | |||||||||||||
| Net loss |
0 | 0 | (1,568 | ) | 0 | (1,568 | ) | |||||||||||||
| Change in cumulative translation adjustment, net |
0 | 0 | 0 | (150 | ) | (150 | ) | |||||||||||||
|
|
|
|
|
|
|
|
|
|
|
|||||||||||
| BALANCE at DECEMBER 31, 2015 |
$ | 18 | $ | 135,714 | ($ | 35,320 | ) | ($ | 15 | ) | $ | 100,397 | ||||||||
|
|
|
|
|
|
|
|
|
|
|
|||||||||||
The accompanying notes are an integral part of these consolidated financial statements
34
Table of Contents
PCTEL, INC.
CONSOLIDATED STATEMENT OF CASH FLOWS
(in thousands)
| Years Ended December 31, | ||||||||||||
| 2015 | 2014 | 2013 | ||||||||||
| Operating Activities: |
||||||||||||
| Net (loss) income |
($ | 1,568 | ) | $ | 4,612 | $ | 3,251 | |||||
| Adjustments to reconcile net (loss) income to net cash provided by operating activities: |
||||||||||||
| Loss from discontinued operations |
0 | 0 | 91 | |||||||||
| Depreciation and amortization |
7,105 | 4,806 | 5,070 | |||||||||
| Impairment charges |
161 | 0 | 0 | |||||||||
| Stock based compensation |
1,865 | 3,276 | 3,440 | |||||||||
| (Gain) loss on disposal/sale of property and equipment |
(12 | ) | 9 | (27 | ) | |||||||
| Restructuring costs |
688 | 0 | 86 | |||||||||
| Payment of withholding tax on stock based compensation |
(438 | ) | (1,037 | ) | (1,098 | ) | ||||||
| Deferred tax expense |
(1,284 | ) | 1,666 | 2,165 | ||||||||
| Changes in operating assets and liabilities, net of acquisitions: |
||||||||||||
| Accounts receivable |
8,260 | (5,301 | ) | 1 | ||||||||
| Inventories |
(1,385 | ) | (1,870 | ) | 3,092 | |||||||
| Prepaid expenses and other assets |
227 | 1,406 | 596 | |||||||||
| Accounts payable |
1,114 | 1,050 | (6,149 | ) | ||||||||
| Income taxes payable |
4 | (79 | ) | (61 | ) | |||||||
| Other accrued liabilities |
(4,465 | ) | (1,625 | ) | 807 | |||||||
| Deferred revenue |
(1,198 | ) | 1,063 | 139 | ||||||||
|
|
|
|
|
|
|
|||||||
| Net cash provided by operating activities |
9,074 | 7,976 | 11,403 | |||||||||
|
|
|
|
|
|
|
|||||||
| Investing Activities: |
||||||||||||
| Capital expenditures |
(2,102 | ) | (2,542 | ) | (2,959 | ) | ||||||
| Proceeds from disposal of property and equipment |
64 | 0 | 3 | |||||||||
| Purchase of investments |
(30,146 | ) | (58,629 | ) | (72,010 | ) | ||||||
| Redemptions/maturities of short-term investments |
44,995 | 55,157 | 69,501 | |||||||||
| Purchase of assets/businesses, net of cash acquired |
(20,500 | ) | 0 | 0 | ||||||||
|
|
|
|
|
|
|
|||||||
| Net cash used in investing activities |
(7,689 | ) | (6,014 | ) | (5,465 | ) | ||||||
|
|
|
|
|
|
|
|||||||
| Financing Activities: |
||||||||||||
| Proceeds from issuance of common stock |
1,018 | 1,092 | 1,266 | |||||||||
| Payments for repurchase of common stock |
(12,079 | ) | (1,652 | ) | (435 | ) | ||||||
| Tax effect from stock based compensation |
0 | 203 | 0 | |||||||||
| Cash dividends |
(3,651 | ) | (2,957 | ) | (2,579 | ) | ||||||
|
|
|
|
|
|
|
|||||||
| Net cash used in financing activities |
(14,712 | ) | (3,314 | ) | (1,748 | ) | ||||||
|
|
|
|
|
|
|
|||||||
| Cash flows from discontinued operations: |
||||||||||||
| Net cash used in operating activities |
0 | 0 | (17 | ) | ||||||||
| Net cash provided by investing activities |
0 | 0 | 1 | |||||||||
| Net cash provided by financing activities |
0 | 0 | 0 | |||||||||
| Net (decrease) increase in cash and cash equivalents |
(13,327 | ) | (1,352 | ) | 4,174 | |||||||
| Effect of exchange rate changes on cash |
(50 | ) | (6 | ) | 57 | |||||||
| Cash and cash equivalents, beginning of year |
20,432 | 21,790 | 17,559 | |||||||||
|
|
|
|
|
|
|
|||||||
| Cash and Cash Equivalents, End of Year |
$ | 7,055 | $ | 20,432 | $ | 21,790 | ||||||
|
|
|
|
|
|
|
|||||||
| Other information: |
||||||||||||
| Cash paid (refunds received) for income taxes |
$ | 413 | $ | 199 | $ | 232 | ||||||
| Cash paid for interest |
$ | 7 | $ | 14 | $ | 16 | ||||||
| Non-cash investing and financing information: |
||||||||||||
| Increases (decreases) to deferred stock compensation, net |
$ | 3,566 | $ | 12 | ($ | 1,968 | ) | |||||
| Issuance of restricted common stock, net of cancellations |
$ | 4,941 | $ | 431 | ($ | 703 | ) | |||||
| Purchase of assets under capital leases |
$ | 30 | $ | 189 | $ | 0 | ||||||
The accompanying notes are an integral part of these consolidated financial statements.
35
Table of Contents
PCTEL, INC.
NOTES TO THE CONSOLIDATED FINANCIAL STATEMENTS
For the Year Ended: December 31, 2015
(in thousands)
1. Organization and Summary of Significant Accounting Policies
Nature of Operations
PCTEL, Inc. (“PCTEL”, the “Company”, “we”, “ours”, and “us”) delivers Performance Critical Telecom solutions. RF Solutions develops and provides test equipment, software and engineering services for wireless networks. The industry relies upon PCTEL to benchmark network performance, analyze trends, and optimize wireless networks. Connected Solutions designs and delivers performance critical antennas and site solutions for wireless networks globally. Our antennas support evolving wireless standards for cellular, private, and broadband networks. PCTEL antennas and site solutions support networks worldwide, including Supervisory Control and Data Acquisition (“SCADA”) for oil, gas and utilities, fleet management, industrial operations, healthcare, small cell and network timing deployment, defense, public safety, education, and broadband access.
Segment Reporting
PCTEL operates in two segments for reporting purposes, Connected Solutions and RF Solutions. The Company’s chief operating decision maker uses the profit and loss results through operating profit and identified assets for the Connected Solutions and RF Solutions segments to make operating decisions. Each segment has its own segment manager as well as its own engineering, sales and marketing, and operational general and administrative functions. All of the Company’s accounting and finance, human resources, IT and legal functions are provided on a centralized basis through the corporate function. The Company manages its balance sheet and cash flows centrally at the corporate level, with the exception of trade accounts receivable and inventory which is managed at the segment level. Each of the segment managers reports to and maintains regular contact with the chief operating decision maker to discuss operating activities, financial results, forecasts, or plans for the segment.
Connected Solutions Segment
Connected Solutions designs and delivers performance critical antennas and site solutions for wireless networks globally. The Company’s antennas and site solutions support networks worldwide, including SCADA for oil, gas and utilities, fleet management, industrial operations, healthcare, small cell and network timing deployment, defense, public safety, education, and broadband access. PCTEL’s performance critical MAXRAD® and Bluewave™ antenna solutions include high rejection and high performance GPS and GNSS products, the industry leading Yagi portfolio, mobile and indoor LTE, broadband, and LMR antennas and PIM-rated antennas for transit, in-building, and small cell applications. We leverage our design, logistics, and support capabilities to deliver performance critical site solutions into carrier, railroad, and utility applications. Revenue growth for antenna and site solutions is primarily driven by the increased use of wireless communications in these vertical markets. PCTEL’s antenna and site solution products are primarily sold through distributors, value-added resellers, and original equipment manufacturer (“OEM”) providers.
There are many competitors for antenna products, as the market is highly fragmented. Competitors include Laird (Cushcraft, Centurion, and Antennex brands), Mobile Mark, Radiall/Larsen, Comtelco, Wilson, Commscope (Andrew products), Kathrein, among others. The Company seeks out product applications that command a premium for product performance and customer service, and avoid commodity markets.
PCTEL maintains expertise in several technology areas in order to be competitive in the antenna engineered site solutions market. These include radio frequency engineering, mobile antenna design and manufacturing, mechanical engineering, product quality and testing, and wireless network engineering.
RF Solutions Segment
RF Solutions develops and provides performance critical test equipment, software, and engineering services for wireless networks. The industry relies upon PCTEL to benchmark network performance, analyze trends, and optimize wireless networks. SeeGull® scanning receivers are used around the world for indoor and drive test applications, including baseline testing, acceptance testing, competitive benchmarking, spectrum clearing, troubleshooting, and network optimization. SeeGull scanning receivers provide high quality real-world RF measurements needed to build, tune, troubleshoot, and expand commercial wireless networks. The Company’s highly-trained engineering services team uses state-of-the-art test, measurement, and design tools to provide engineering services for
36
Table of Contents
in-building and outdoor networks. Our engineering services team (“NES”) provides wireless network testing, optimization, design, integration, and consulting services, with an emphasis on in-building distributed antenna systems (“DAS”). Revenue growth for the segment’s products and services is driven by the deployment of products based on new wireless technology and the need for wireless networks to be tuned and reconfigured on a regular basis. Scanning receiver products are sold primarily through test and measurement value-added resellers and to a lesser extent directly to network operators. Competitors for these products are OEMs such as JDS Uniphase, Rohde and Schwarz, Anritsu, Digital Receiver Technology, and Berkley Varitronics.
On February 27, 2015, PCTEL, Inc. acquired substantially all of the assets of, and assumed certain specified liabilities of, Nexgen Wireless, Inc. (“Nexgen”), pursuant to an Asset Purchase Agreement dated as of February 27, 2015. The business acquired from Nexgen is based in Schaumburg, Illinois. Nexgen provides a network analysis tool portfolio now known as SeeHawk® Analytics, and engineering services. Nexgen’s software product portfolio translates real-time network performance data into engineering actions to optimize operator performance and supports crowd-based, cloud-based data analysis to enhance network performance. Nexgen provides performance engineering, specialized staffing, and trend analysis for carriers, infrastructure vendors, and neutral hosts for 2G, 3G, 4G, and LTE networks. Refer to Note 4 for additional information on the Nexgen acquisition.
PCTEL maintains expertise in several technology areas in order to be competitive in the scanning receiver and related engineering services market. These include radio frequency engineering, DSP engineering, manufacturing, mechanical engineering, product quality and testing, and wireless network engineering.
Basis of Consolidation
These consolidated financial statements include the accounts of the Company and its subsidiaries. All intercompany accounts and transactions have been eliminated.
On April 30, 2013, the Company divested all material assets associated with its PCTEL Secure, LLC subsidiary’s ProsettaCore™ technology to Redwall Technologies, LLC (“Redwall”), a development organization that specializes in mobile security, military and defense projects and systems, and critical national infrastructure. Under the terms of the agreement, Redwall acquired the server and device software (the “Software”), the underlying intellectual property, and complete development responsibility for the security products. At the closing of the divestiture, the Company received no upfront cash payment, but has the right to receive a royalty of 7% of the net sale price of each future sale or license of the Software and each provision of services related to the Software, if any. Under the agreement, royalties will not exceed $10.0 million in the aggregate. In accordance with accounting for discontinued operations, the consolidated financial statements separately reflect the results of PCTEL Secure as discontinued operations for all periods presented. The prior period results have been restated to reflect this accounting treatment.
Use of Estimates
The preparation of financial statements in conformity with generally accepted accounting principles in the U.S. requires management to make estimates and assumptions that affect the reported amounts of assets and liabilities and disclosure of contingent assets and liabilities at the date of the financial statements and the reported amounts of revenues and expenses during the periods reported. Actual results could differ from those estimates.
Foreign Operations
The Company is exposed to foreign currency fluctuations due to its foreign operations and because products are sold internationally. The functional currency for the Company’s foreign operations is predominantly the applicable local currency. Accounts of foreign operations are translated into U.S. dollars using the year-end exchange rate for assets and liabilities and average monthly rates for revenue and expense accounts. Adjustments resulting from translation are included in accumulated other comprehensive income (loss), a separate component of stockholders’ equity. Gains and losses resulting from other transactions originally in foreign currencies and then translated into U.S. dollars are included in the consolidated statements of operations. Net foreign exchange losses resulting from foreign currency transactions included in other income, net were $33, $49, and $26 in the years ended December 31, 2015, 2014, and 2013, respectively.
Fair Value of Financial Instruments
The Company follows accounting pronouncements for Fair Value Measurements and Disclosures, which establishes a fair value hierarchy that requires the Company to maximize the use of observable inputs and minimize the use of unobservable inputs when measuring fair value. Fair value is a market-based measurement that should be determined based on assumptions that market participants would use in pricing an asset or liability. As a basis for considering such assumptions, a three-tier fair value hierarchy has been established, which prioritizes the inputs used in measuring fair value as follows:
Level 1: inputs are unadjusted quoted prices in active markets for identical assets or liabilities.
37
Table of Contents
Level 2: inputs other than Level 1 that are observable, either directly or indirectly, such as quoted prices in active markets for similar assets and liabilities, quoted prices for identical or similar assets or liabilities in markets that are not active, or other inputs that are observable or can be corroborated by observable market data for substantially the full term of assets or liabilities.
Level 3: unobservable inputs that are supported by little or no market activity and that are significant to the fair value of the assets or liabilities.
Cash equivalents are measured at fair value and investments are recognized at amortized cost in the Company’s financial statements. Accounts receivable and other investments are financial assets with carrying values that approximate fair value due to the short-term nature of these assets. Accounts payable is a financial liability with a carrying value that approximates fair value due to the short-term nature of these liabilities.
Cash and Cash Equivalents and Investments
The Company’s cash and investments consist of the following:
| December 31, | December 31, | |||||||
| 2015 | 2014 | |||||||
| Cash |
$ | 6,077 | $ | 19,731 | ||||
| Cash equivalents |
978 | 701 | ||||||
| Short-term investments |
24,728 | 39,577 | ||||||
|
|
|
|
|
|||||
| $ | 31,783 | $ | 60,009 | |||||
|
|
|
|
|
|||||
Cash and Cash equivalents
At December 31, 2015, cash and cash equivalents included bank balances and investments with original maturities less than 90 days. At December 31, 2015 and 2014, the Company’s cash equivalents were invested in highly liquid AAA rated money market funds that are required to comply with Rule 2a-7 under the Investment Company Act of 1940. Such funds utilize the amortized cost method of accounting, seek to maintain a constant $1.00 per share price, and are redeemable upon demand. The Company restricts its investments in AAA money market funds to those invested 100% in either short-term U.S. Government Agency securities or bank repurchase agreements collateralized by these same securities. The fair values of these money market funds are established through quoted prices in active markets for identical assets (Level 1 inputs). The cash in the Company’s U.S. banks is insured by the Federal Deposit Insurance Corporation up to the insurable limit of $250.
At December 31, 2015, the Company had $6.1 million in cash and $1.0 million in cash equivalents and at December 31, 2014, the Company had $19.7 million in cash and $0.7 million in cash equivalents. The Company had $1.3 million and $0.5 million of cash and cash equivalents in foreign bank accounts at December 31, 2015 and at December 31, 2014, respectively. The Company plans to repatriate its cash from its subsidiary in Israel during 2016 because we expect to cease operations of this subsidiary during 2016. The Company expects to incur incremental income tax of $0.1 million related to the repatriation of the funds from Israel. The Company does not expect the foreign currency exchange related to the repatriation of these funds to have a material impact on the financial statements. As of December 31, 2015, the Company had no intentions of repatriating the cash in its foreign bank accounts in the U.K. or China. If the Company decides to repatriate the cash in the foreign bank accounts, it may experience difficulty in doing so in a timely manner. The Company may also be exposed to foreign currency fluctuations and taxes if it repatriates these funds. The Company’s cash in its foreign bank accounts is not insured.
Investments
At December 31, 2015 and 2014, the Company’s short-term investments consisted of pre-refunded municipal bonds, U.S. government agency bonds, AA or higher rated corporate bonds and certificates of deposit, all classified as held-to-maturity. At December 31, 2014, the Company’s short-term investments also included mutual funds classified as available-for-sale and recorded at fair value.
38
Table of Contents
At December 31, 2015, the Company had invested $7.6 million in AA rated or higher corporate bond funds, $7.5 million in pre-refunded municipal bonds and taxable bond funds, $7.0 million in U.S. government agency bonds, $2.7 million in certificates of deposit. The income and principal from the pre-refunded municipal bonds is secured by an irrevocable trust of U.S. Treasury securities. The bonds have original maturities greater than 90 days and mature in 2015. The Company’s bonds are recorded at the purchase price and carried at amortized cost. The net unrealized gains (losses) were approximately $1 and $(5) at December 31, 2015 and December 31, 2014, respectively. Approximately 11% and 5% of the Company’s bonds were protected by bond default insurance at December 31, 2015 and 2014, respectively.
At December 31, 2014, the Company had invested $13.5 million in U.S. government agency bonds, $11.8 million in certificates of deposit, $7.2 million in AA rated or higher corporate bond funds, $5.2 million in pre-refunded municipal bonds and taxable bond funds, and $2.0 million in mutual funds.
The Company categorizes its financial instruments within a fair value hierarchy according to accounting guidance for fair value. The fair value hierarchy is described under the Fair Value of Financial Instruments in Note 1. For the Level 2 investments, the Company uses quoted prices of similar assets in active markets.
Cash equivalents and Level 1 and Level 2 investments measured at fair value were as follows:
| December 31, 2015 | December 31, 2014 | |||||||||||||||||||||||||||||||
| Level 1 | Level 2 | Level 3 | Total | Level 1 | Level 2 | Level 3 | Total | |||||||||||||||||||||||||
| Cash equivalents: |
||||||||||||||||||||||||||||||||
| Money market funds and other cash equivalents |
$ | 978 | $ | 0 | $ | 0 | $ | 978 | $ | 701 | $ | 0 | $ | 0 | $ | 701 | ||||||||||||||||
| Investments: |
||||||||||||||||||||||||||||||||
| Corporate bonds |
0 | 7,558 | 0 | 7,558 | 0 | 7,155 | 0 | 7,155 | ||||||||||||||||||||||||
| Pre-refunded municipal bonds |
0 | 7,497 | 0 | 7,497 | 0 | 5,162 | 0 | 5,162 | ||||||||||||||||||||||||
| US government agency bonds |
0 | 7,008 | 0 | 7,008 | 0 | 13,502 | 0 | 13,502 | ||||||||||||||||||||||||
| Certificates of deposit |
2,666 | 0 | 0 | 2,666 | 11,782 | 0 | 0 | 11,782 | ||||||||||||||||||||||||
| Mutual funds |
0 | 0 | 0 | 0 | 1,971 | 0 | 0 | 1,971 | ||||||||||||||||||||||||
|
|
|
|
|
|
|
|
|
|
|
|
|
|
|
|
|
|||||||||||||||||
| Total |
$ | 3,644 | $ | 22,063 | $ | 0 | $ | 25,707 | $ | 14,454 | $ | 25,819 | $ | 0 | $ | 40,273 | ||||||||||||||||
|
|
|
|
|
|
|
|
|
|
|
|
|
|
|
|
|
|||||||||||||||||
Accounts Receivable and Allowance for Doubtful Accounts
Accounts receivable are recorded at invoiced amount with standard net terms for most customers that range between 30 and 60 days. The Company extends credit to its customers based on an evaluation of a company’s financial condition and collateral is generally not required. The Company maintains an allowance for doubtful accounts for estimated uncollectible accounts receivable. The allowance is based on the Company’s assessment of known delinquent accounts, historical experience, and other currently available evidence of the collectability and the aging of accounts receivable. The Company’s allowance for doubtful accounts was $0.3 million and $0.1 million at December 31, 2015 and 2014, respectively. The provision for doubtful accounts is included in sales and marketing expense in the consolidated statements of operations.
Inventories
Inventories are stated at the lower of cost or market and include material, labor and overhead costs using the first-in, first-out (“FIFO”) method of costing. Inventories as of December 31, 2015 and 2014 were composed of raw materials, sub-assemblies, finished goods and work-in-process. The Company had consigned inventory of $0.7 million and $0.8 million at December 31, 2015 and 2014, respectively. The Company records allowances to reduce the value of inventory to the lower of cost or market, including allowances for excess and obsolete inventory. Reserves for excess inventory are calculated based on our estimate of inventory in excess of normal and planned usage. Obsolete reserves are based on our identification of inventory where carrying value is above net realizable value. The allowance for inventory losses was $2.2 million and $1.8 million as of December 31, 2015 and 2014, respectively.
39
Table of Contents
Inventories consisted of the following:
| December 31, | December 31, | |||||||
| 2015 | 2014 | |||||||
| Raw materials |
$ | 11,012 | $ | 10,160 | ||||
| Work in process |
917 | 915 | ||||||
| Finished goods |
5,667 | 5,283 | ||||||
|
|
|
|
|
|||||
| Inventories, net |
$ | 17,596 | $ | 16,358 | ||||
|
|
|
|
|
|||||
Prepaid and other current assets
Prepaid assets are stated at cost and are amortized over the useful lives (up to one year) of the assets.
Property and Equipment
Property and equipment are stated at cost and are depreciated using the straight-line method over the estimated useful lives of the assets. The Company depreciates computers over three to five years, office equipment, manufacturing and test equipment and motor vehicles over five years, furniture and fixtures over seven years, and buildings over 30 years. Leasehold improvements are amortized over the shorter of the corresponding lease term or useful life. Depreciation expense and gains and losses on the disposal of property and equipment are included in cost of sales and operating expenses in the consolidated statements of operations. Maintenance and repairs are expensed as incurred.
Property and equipment consisted of the following:
| December 31, | December 31, | |||||||
| 2015 | 2014 | |||||||
| Building |
$ | 6,227 | $ | 6,229 | ||||
| Computers and office equipment |
10,931 | 10,435 | ||||||
| Manufacturing and test equipment |
12,826 | 11,880 | ||||||
| Furniture and fixtures |
1,273 | 1,214 | ||||||
| Leasehold improvements |
1,001 | 909 | ||||||
| Motor vehicles |
42 | 117 | ||||||
|
|
|
|
|
|||||
| Total property and equipment |
32,300 | 30,784 | ||||||
| Less: Accumulated depreciation and amortization |
(20,231 | ) | (17,712 | ) | ||||
| Land |
1,770 | 1,770 | ||||||
|
|
|
|
|
|||||
| Property and equipment, net |
$ | 13,839 | $ | 14,842 | ||||
|
|
|
|
|
|||||
Depreciation and amortization expense was approximately $3.1 million, $2.8 million, and $2.7 million for the years ended December 31, 2015, 2014, and 2013, respectively. Amortization for capital leases is included in depreciation and amortization expense. See Note 8 for information related to capital leases.
40
Table of Contents
Liabilities
Accrued liabilities consisted of the following:
| December 31, | December 31, | |||||||
| 2015 | 2014 | |||||||
| Inventory receipts |
$ | 1,628 | $ | 2,471 | ||||
| Paid time off |
1,271 | 1,247 | ||||||
| Payroll, bonuses, and other employee benefits |
1,179 | 1,539 | ||||||
| Warranties |
348 | 304 | ||||||
| Income and sales taxes |
381 | 266 | ||||||
| Professional fees and contractors |
305 | 223 | ||||||
| Employee stock purchase plan |
280 | 314 | ||||||
| Restructuring |
237 | 0 | ||||||
| Real estate taxes |
161 | 181 | ||||||
| Deferred revenues |
65 | 1,262 | ||||||
| Executive deferred compensation |
0 | 2,043 | ||||||
| Other |
335 | 361 | ||||||
|
|
|
|
|
|||||
| Total |
$ | 6,190 | $ | 10,211 | ||||
|
|
|
|
|
|||||
Long-term liabilities consisted of the following:
| December 31, | December 31, | |||||||
| 2015 | 2014 | |||||||
| Deferred rent |
$ | 250 | $ | 258 | ||||
| Long-term obligations under capital leases |
107 | 135 | ||||||
| Deferred revenues |
31 | 55 | ||||||
|
|
|
|
|
|||||
| $ | 388 | $ | 448 | |||||
|
|
|
|
|
|||||
Revenue Recognition
The Company sells antennas, site solutions, and scanning receiver products, and provides network engineering and staffing services. The Company recognizes revenue when the following criteria are met: persuasive evidence of an arrangement exists, delivery has occurred or services have been rendered, price is fixed and determinable, and collectability is reasonably assured.
The Company recognizes revenue for sales of its products when title transfers, which is predominantly upon shipment from its factory. For products shipped on consignment, the Company recognizes revenue upon delivery from the consignment location. The Company allows its major antenna product distributors to return product under specified terms and conditions and accrues for product returns. The Company recognizes revenue for its engineering services under the completed performance method. Most services occur in one week or less, and revenue is generally recognized when engineering reports are completed and issued to the customer. For specialized staffing, the Company recognizes revenue as services are provided to the customer.
Research and Development Costs
The Company expenses research and development costs as incurred. To date, the Company has expensed all software development costs related to research and development because the costs incurred subsequent to the products reaching technological feasibility were not significant.
Advertising Costs
Advertising costs are expensed in the period in which they are incurred. Advertising expense was $212, $175, and $166 in each of the fiscal years ended December 31, 2015, 2014, and 2013, respectively.
Income Taxes
Income taxes are accounted for under the asset and liability method. Deferred tax assets and liabilities are recognized for the future tax consequences attributable to differences between the financial statement carrying amounts of existing assets and liabilities and
41
Table of Contents
their respective tax bases and operating loss and tax credit carryforwards. Deferred tax assets and liabilities are measured using enacted tax rates expected to apply to taxable income in the years in which those temporary differences are expected to be recovered or settled. The effect on deferred tax assets and liabilities of a change in tax rates is recognized in income in the period that includes the enactment date. Valuation allowances are provided against deferred tax assets, which are not likely to be realized. On a regular basis, management evaluates the recoverability of deferred tax assets and the need for a valuation allowance.
Deferred tax assets arise when the Company recognizes charges or expenses in the financial statements that will not be allowed as income tax deductions until future periods. The deferred tax assets also include unused tax net operating losses and tax credits that the Company is allowed to carry forward to future years. Accounting rules permit the Company to carry the deferred tax assets on the balance sheet at full value as long as it is more likely than not the deductions, losses, or credits will be used in the future. A valuation allowance must be recorded against a deferred tax asset if this test cannot be met.
The Company recognizes the effect of income tax positions only if those positions are more likely than not of being sustained. Recognized income tax positions are measured at the largest amount that is greater than 50% likely of being realized. Changes in recognition or measurement are reflected in the period in which the change in judgment occurs.
Sales and Value Added Taxes
Taxes collected from customers and remitted to governmental authorities are presented on a net basis in cost of sales in the accompanying consolidated statements of operations.
Shipping and handling costs
Shipping and handling costs are included on a gross basis in cost of sales in the accompanying consolidated statements of operations.
Goodwill
The Company performs an annual impairment test of goodwill as of the end of the first month of the fiscal fourth quarter (October 31st), or at an interim date if an event occurs or if circumstances change that would indicate that an impairment loss may have been incurred. In performing the annual impairment test, the Company first performs a qualitative assessment to determine whether it is more likely than not that the fair value of a reporting unit is less than its carrying value, including goodwill. If the qualitative assessment is indicative of possible impairment, then a two-step quantitative fair value assessment is performed at the reporting unit level. In the first step, the fair value of each reporting unit is compared with its carrying value. If the fair value exceeds the carrying value, then goodwill is not impaired and no further testing is performed. The second step is performed if the carrying value exceeds the fair value. The implied fair value of goodwill is then compared against the carrying value of goodwill to determine the amount of impairment.
The process of evaluating the potential impairment of goodwill is subjective because it requires the use of estimates and assumptions in determining a reporting unit’s fair value. The Company calculates the fair value of each reporting unit by using the income approach based on the present value of future discounted cash flows. The discounted cash flow method requires the Company to use estimates and judgments about the future cash flows of the reporting units. Although the Company bases cash flow forecasts on assumptions that are consistent with plans and estimates the Company uses to manage the underlying reporting units, there is significant judgment in determining the cash flows attributable to these reporting units, including markets and market share, sales volumes and mix, research and development expenses, tax rates, capital spending, discount rate and working capital changes. Cash flow forecasts are based on reporting unit operating plans for the early years and business projections in later years. The Company believes the accounting estimate related to the valuation of goodwill is a critical accounting estimate because it requires us to make assumptions that are highly uncertain about the future cash flows of the reporting units. Changes in these estimates can have a material impact on the Company’s financial statements.
While the use of historical results and future projections can result in different valuations for a business, it is a generally accepted valuation practice to apply more than one valuation technique to establish a range of values for a business. Since each technique relies on different inputs and assumptions, it is unlikely that each technique would yield the same results. However, it is expected that the different techniques would establish a reasonable range. In determining the fair value, the Company weighs the two methods equally because it believes both methods have an equal probability of providing an appropriate fair value.
42
Table of Contents
The Company recorded $0.2 million of goodwill related to the business acquired from Envision Wireless, Inc. in 2011 and recorded goodwill of $3.3 million of related to the business acquired from Nexgen Wireless, Inc. in February 2015. There are two reporting units for goodwill testing purposes within the RF Solutions segment, Products and Services. The $3.3 million of goodwill from the Nexgen acquisition was recorded in Products and the $0.2 million of goodwill from the Envision acquisition was recorded in Services.
The RF Solutions segment had experienced declining profitability for the three quarters ended September 30, 2015 (See Note 12 for the segment information). The Company considered the decline to be an interim change in circumstances that would indicate that an impairment loss may have been incurred at September 30, 2015. The Company performed a qualitative assessment on both reporting units at September 30, 2015 and determined it was more likely than not that the fair value of each reporting unit was greater than its carrying value, including goodwill. The primary positive evidence considered was a restructuring of costs that is expected to lower the cost structure by several million dollars annually. In addition the Company performed a Step 1 quantitative goodwill test at September 30, 2015 at the lower forecasted cost structure, which confirmed the qualitative assessment.
The Company performed its annual goodwill test on both the RF Solutions Products and Services reporting units at October 31, 2015. At that date the carrying value of the Company’s assets was $102.5 million as compared to a $100.0 million market capitalization and a $9.3 million control premium determined by the Company as the net present value of its public company costs that would become cost savings synergies to an acquirer. During the fourth quarter the Products reporting unit was operating consistently with the projections made at September 30, 2015. The Services reporting unit was operating at a lower level than the projections at September 30, 2015. The Company performed a qualitative assessment and concluded it is more likely than not that the fair value of the Products reporting unit is more than its carrying value, including goodwill, and the Services reporting unit is less likely than not. In addition the Company performed a Step 1 quantitative goodwill test for both reporting units at October 31, 2015 which confirmed the qualitative assessments. The Company performed a Step 2 quantitative goodwill test at October 31, 2015 on the Services reporting unit and concluded that all $0.2 million of the goodwill was impaired.
The Company’s carrying value at December 31, 2015 was $100.5 million as compared to a market capitalization of $80.3 million and a control premium of $9.3 million. The market cap deficit has existed since mid-November 2015. A stock performance comparison was performed with twelve of the peer companies we use for compensation comparable data that are still publicly traded at December 31, 2015. The company list can be found in the Company’s Proxy Statement dated April 30, 2015. When comparing the period October 31, 2015 to December 31, 2015 eight of the companies experienced stock price declines, two of which were comparable to PCTEL’s decline. Trading volume for all the companies including PCTEL during that period was consistent with historical levels. Management concluded that the market was distressed but liquid. The Company considered the decline in market capitalization and resulting deficit to carrying value to be an indication that an impairment loss may have occurred at December 31, 2015. The Company performed another Step 1 quantitative goodwill test at December 31, 2015. The higher discount rates used for the reporting units reconciled the total fair value of the Company to its December 31, 2015 market capitalization. The test indicated the remaining goodwill was not impaired.
For the annual goodwill test as of October 31, 2014, the Company performed a qualitative analysis of goodwill and concluded that there was no triggering event that would necessitate a two-step goodwill impairment test.
Long-lived and Definite-Lived Intangible assets
The Company reviews definite-lived intangible assets, investments and other long-lived assets for impairment when events or changes in circumstances indicate that their carrying values may not be fully recoverable. This analysis differs from the Company’s goodwill analysis in that definite-lived intangible asset impairment is only deemed to have occurred if the sum of the forecasted undiscounted future cash flows related to the assets being evaluated is less than the carrying value of the assets. The estimate of long-term undiscounted cash flows includes long-term forecasts of revenue growth, gross margins, and operating expenses. All of these items require significant judgment and assumptions. An impairment loss may exist when the estimated undiscounted cash flows attributable to the assets are less than the carrying amount.
As discussed in the goodwill section above, the Company recorded the impairment of all $0.2 million of the goodwill carried by the RF Services reporting unit at the annual impairment test date. Additionally at December 31, 2015 the Services reporting unit forecast had deteriorated from that used in the October 31, 2015 goodwill impairment analysis. Management concluded that these were triggering events indicating that a potential impairment of long lived intangible assets in that reporting unit may have occurred. The Company performed a long lived asset impairment test by comparing the undiscounted future cash flows for the reporting unit to the reporting unit’s asset carrying value. The customer relationships were determined to be the primary asset of the asset group. Since this asset was not separable from the other assets in the reporting group, the asset group consisted of all of the assets in the reporting group. No impairment was indicated.
43
Table of Contents
Recent Accounting Pronouncements
In February 2016, the Financial Accounting Standards Board (“FASB”) issued Accounting Standards Update (“ASU”) No. 2016-02, “Leases (Topic 842),” which requires lessees to recognize assets and liabilities for the rights and obligations created by most leases on their balance sheet. The guidance is effective for fiscal years beginning after December 15, 2018, including interim periods within those fiscal years. Early application is permitted. ASU 2016-02 requires modified retrospective adoption for all leases existing at, or entered into after, the date of initial application, with an option to use certain transition relief. The Company is currently evaluating the impact the standard may have on its consolidated financial statements and related disclosures.
In November 2015, the FASB issued ASU 2015-17, Balance Sheet Classification of Deferred Taxes, to simplify the presentation of deferred income taxes. The amendments in this update require that deferred tax assets and liabilities be entirely classified as noncurrent within the statement of financial position. Effective December 31, 2015, the Company early adopted the balance sheet classification of deferred taxes on a prospective basis. The guidance requires deferred tax assets and liabilities to be classified as noncurrent rather than split between current and noncurrent. Approximately $1.8 million in current deferred tax assets were reclassified to long-term deferred tax assets at December 31, 2015. See Note 7 for additional details related to income taxes.
In July 2015, the FASB issued ASU 2015-11, “Simplifying the Measurement of Inventory (Topic 330).” The new guidance requires most inventory to be measured at the lower of cost and net realizable value, thereby simplifying the previous guidance under which an entity must measure inventory at the lower of cost or market. Market is defined as replacement cost, net realizable value (“NRV”), or NRV less a normal profit margin. The ASU will not apply to inventory that is measured using either the last-in, first-out method or the retail inventory method. The standard will be effective prospectively for the first interim period within annual reporting periods beginning after December 15, 2016. Early adoption is permitted. The Company is currently assessing the provisions of the guidance and has not determined the impact of the adoption of this guidance on its consolidated financial statements.
In June 2014, the FASB issued ASU No. 2014-12, Accounting for Share-Based Payments When the Terms of an Award Provide That a Performance Target Could Be Achieved after the Requisite Service Period. ASU 2014-12 was issued to clarify that a performance target in a share-based payment that affects vesting and that could be achieved after the requisite service period should be accounted for as a performance condition under Accounting Standards Codification (ASC) 718, Compensation - Stock Compensation. As a result, the target is not reflected in the estimation of the award’s grant date fair value. Compensation cost would be recognized over the required service period, if it is probable that the performance condition will be achieved. The adoption of ASU No. 2014-12 is not expected to have a material impact on the Company’s consolidated financial statements.
In May 2014, the FASB issued ASU 2014-09 “Revenue from Contracts with Customers” which introduces a new revenue recognition model in which an entity should recognize revenue to depict the transfer of promised goods or services to customers in an amount that reflects the consideration to which the entity expects to be entitled in exchange for those goods or services. ASU 2014-09 defines a five step process to achieve this core principle and, in doing so, more judgment and estimates may be required within the revenue recognition process than are required under existing U.S. GAAP. This ASU also requires disclosures sufficient to enable users to understand the nature, amount, timing, and uncertainty of revenue and cash flows arising from contracts with customers, including qualitative and quantitative disclosures about contracts with customers, significant judgments and changes in judgments, and assets recognized from the costs to obtain or fulfill a contract. The FASB has voted to approve a one-year deferral of the effective date from January 1, 2017 to January 1, 2018, while allowing for early adoption as of January 1, 2017. The new accounting standard is expected to have an impact to the Company’s consolidated financial statements. The Company is currently evaluating the adoption method options and the impact of the new guidance on our consolidated financial statements.
In April 2014, the FASB issued ASU 2014-08, “Presentation of Financial Statements” which includes amendments that change the requirements for reporting discontinued operations and require additional disclosures about discontinued operations. Under the new guidance, only disposals representing a strategic shift in operations - that is, a major effect on the organization’s operations and financial results should be presented as discontinued operations. Examples include a disposal of a major geographic area, a major line of business, or a major equity method investment. Additionally, the ASU requires expanded disclosures about discontinued operations that will provide financial statement users with more information about the assets, liabilities, income, and expenses of discontinued operations. This update took effect in the first quarter of 2015. The new guidance did not have a material impact on the Company’s consolidated financial statements.
2. Earnings (Loss) per Share
The Company computes earnings per share data under two different disclosures, basic and diluted, for all periods in which statements of operations are presented. Basic earnings (loss) per share is computed by dividing net income (loss) by the weighted average number of shares of common stock outstanding, less shares subject to repurchase. Diluted earnings (loss) per share are computed by dividing net income by the weighted average number of common stock and common stock equivalents outstanding. Common stock equivalents consist of stock options using the treasury stock method. Common stock options are excluded from the computation of diluted earnings per share if their effect is anti-dilutive.
44
Table of Contents
The following table provides a reconciliation of the numerators and denominators used in calculating basic and diluted earnings per share:
| Years Ended December 31, | ||||||||||||
| 2015 | 2014 | 2013 | ||||||||||
| Basic (Loss) Earnings Per Share computation: |
||||||||||||
| Numerator: |
||||||||||||
| Net (loss) income from continuing operations |
($ | 1,568 | ) | $ | 4,612 | $ | 3,342 | |||||
| Net loss from discontinued operations |
$ | 0 | $ | 0 | ($ | 91 | ) | |||||
| Net (loss) income |
($ | 1,568 | ) | $ | 4,612 | $ | 3,251 | |||||
| Denominator: |
||||||||||||
| Common shares outstanding |
17,737 | 18,159 | 17,797 | |||||||||
| (Loss) Earnings per common share - basic |
||||||||||||
| (Loss) net income from continuing operations |
($ | 0.09 | ) | $ | 0.25 | $ | 0.19 | |||||
| Net loss from discontinued operations |
$ | 0.00 | $ | 0.00 | ($ | 0.01 | ) | |||||
| (Loss) net income |
($ | 0.09 | ) | $ | 0.25 | $ | 0.18 | |||||
| Diluted (Loss) Earnings Per Share computation: |
||||||||||||
| Denominator: |
||||||||||||
| Common shares outstanding |
17,737 | 18,159 | 17,797 | |||||||||
| Restricted shares subject to vesting |
* | 139 | 232 | |||||||||
| Performance shares subject to vesting |
* | 80 | 97 | |||||||||
| Common stock option grants |
* | 11 | 58 | |||||||||
|
|
|
|
|
|
|
|||||||
| Total shares |
17,737 | 18,389 | 18,184 | |||||||||
| (Loss) Earnings per common share - diluted |
||||||||||||
| (Loss) net income from continuing operations |
($ | 0.09 | ) | $ | 0.25 | $ | 0.18 | |||||
| Net loss from discontinued operations |
$ | 0.00 | $ | 0.00 | $ | 0.00 | ||||||
| (Loss) net income |
($ | 0.09 | ) | $ | 0.25 | $ | 0.18 | |||||
| * | As denoted by “*” in the table above, weighted average common stock option grants and restricted shares of 520,000 were excluded from the calculations of diluted net loss per share for the year ended December 31, 2015, since their effects are anti-dilutive. |
3. PCTEL Secure – discontinued operations
PCTEL Secure designed Android-based, secure communication products. The Company learned through its marketing efforts for PCTEL Secure’s baseline product that its distribution channels had limited access to the target software markets, primarily U.S. government agencies. In January 2013 the Company engaged Wunderlich Securities, Inc. to evaluate strategic alternatives for PCTEL Secure, including a further search for a distribution entity that could take its baseline product to market.
On April 30, 2013, the Company divested all material assets associated with PCTEL Secure’s ProsettaCore™ technology to Redwall Technologies, LLC (“Redwall”), a development organization that specializes in mobile security, military and defense projects and systems, and critical national infrastructure. Under the terms of the agreement, Redwall acquired the server and device software (the “Software”), the underlying intellectual property, and complete development responsibility for the related products. At the closing of the divestiture, the Company received no upfront cash payment, but the Company has the right to receive a royalty of 7% of the net sale price of each future sale or license of the Software and each provision of services related to the Software, if any. Under the agreement, royalties are capped at $10 million in the aggregate. Through December 31, 2015, the Company has received aggregate royalties of $14.
45
Table of Contents
The consolidated financial statements separately reflect the PCTEL Secure operations as discontinued operations for all periods presented. Summary results of operations for the discontinued operations included in the condensed consolidated statements of operations are as follows:
| Year Ended December 31, |
||||
| 2013 | ||||
| Operating loss |
($ | 191 | ) | |
|
|
|
|||
| Loss from discontinued operations, before income taxes |
(191 | ) | ||
| Benefit for income tax |
(100 | ) | ||
|
|
|
|||
| Loss from discontinued operations, net of tax |
($ | 91 | ) | |
|
|
|
|||
| Loss from discontinued operations per common share: |
||||
| Basic |
($ | 0.01 | ) | |
| Diluted |
$ | 0.00 | ||
| Weighted average shares: |
||||
| Basic |
17,797 | |||
| Diluted |
18,184 | |||
4. Acquisitions
Business combinations are accounted for using the acquisition method of accounting. In general the acquisition method requires acquisition-date fair value measurement of identifiable assets acquired, liabilities assumed, and non-controlling interests in the acquiree. The measurement requirements result in the recognition of the full amount of acquisition-date goodwill, which includes amounts attributable to non-controlling interests. Neither the direct costs incurred to effect a business combination nor the costs the acquirer expects to incur under a plan to restructure an acquired business may be included as part of the business combination accounting. As a result, those costs are charged to expense when incurred, except for debt or equity issuance costs, which are accounted for in accordance with other generally accepted accounting principles.
Acquisition of Nexgen Wireless, Inc.
On February 27, 2015, the Company acquired substantially all of the assets of, and assumed certain specified liabilities of, Nexgen Wireless, Inc., an Illinois corporation (“Nexgen”), pursuant to an Asset Purchase Agreement dated as of February 27, 2015 (the “Nexgen APA”) among PCTEL, Inc., Nexgen, Bhumika Thakkar 2012 Irrevocable Trust Number One, Bhumika Thakkar 2012 Irrevocable Trust Number Two, and Jigar Thakkar (collectively, such trusts and Mr. Thakkar are the “Nexgen Shareholders”), and Bhumika Thakkar (collectively with Nexgen and the Nexgen Shareholders, the “Nexgen Parties”).
The business acquired from Nexgen is based in Schaumburg, Illinois. Nexgen provides a network analysis tool portfolio, and engineering services. Nexgen’s software product portfolio translates real-time network performance data into engineering actions to optimize operator performance and supports crowd-based, cloud-based data analysis to enhance network performance. The business provides performance engineering, specialized staffing, and trend analysis for carriers, infrastructure vendors, and neutral hosts for 2G, 3G, 4G, and LTE networks.
The purchase consideration for the Nexgen business was $21.4 million, consisting of $18.25 million in cash paid at closing, $2.25 million held in escrow, an estimated $0.8 million excess working capital true-up to be paid in cash, and a contingency payment that was provisionally calculated with a fair value of $0.1 million. The contingent payment was dependent on the achievement of revenue-based goals pertaining to the acquired business for the period commencing on March 1, 2015 and ending on April 30, 2016. The purchase consideration paid in cash was provided from the Company’s existing cash. The Company incurred transaction costs of $0.8 million for the acquisition of Nexgen primarily related to investment banking, legal, and due diligence consulting services.
The assets acquired from Nexgen consisted primarily of customer relationships, intellectual property (including trade names), working capital (accounts receivable, work in process, accounts payable and accrued liabilities), and fixed assets. The Nexgen Parties are bound by non-competition covenants under the Nexgen APA, which generally expire on February 27, 2019. The Company calculated the fair value of the customer relationships, trade names, and non-compete agreement assets acquired by using the present value of future discounted cash flows. For the new technology, the Company used the replacement cost method for its valuation. The intangible assets recorded have a weighted average amortization period of 5.0 years.
46
Table of Contents
As previously reported in the Company’s Current Report on Form 8-K filed with the SEC on April 14, 2015, on April 7, 2015, Samsung Electronics America, Inc., as successor in interest to Samsung Telecommunications America, LLC (“Samsung”), provided Nexgen and the Company with a final notice of Samsung’s election to terminate, effective April 30, 2015, the Contractor Services Agreement, dated May 2, 2012 (the “CSA”), by and between Samsung and Nexgen. On May 5, 2015, the Company and the Nexgen Parties entered into an Amendment to the Asset Purchase Agreement (the “Nexgen APA Amendment”) with the following principal terms: (a) Nexgen agreed to transfer to the Company previously excluded accounts receivable with an aggregate value of $0.8 million; (b) the aggregate amount potentially payable to the Nexgen Parties as contingent earnout consideration was reduced from $2.0 million to $1.0 million; (c) the Company waived its right to seek additional indemnification from the Nexgen Parties for matters specified therein; (d) the parties directed that $2.25 million in escrowed funds potentially payable to the Nexgen Parties pursuant to the Nexgen APA be released to the Company; (e) Mr. Thakkar relinquished a portion of the equity awards previously granted to him; (f) the Company released various potential claims against Nexgen and the Nexgen Parties with respect to the termination of the CSA and related matters; The measurement period for the revised earnout commenced on January 1, 2016 and ends on December 31, 2016 and is dependent on software revenue-based goals pertaining to the acquired business. The Company estimated that the contingent liability would be 0 at December 31, 2015.
The amendment terms were accounted for consistent with accounting for legal settlements, as there is not a clear and direct link between the settlement and the acquisition price. During June 2015, the Company received the cash from the escrow fund and the previously excluded accounts receivable. These amounts are recorded in Other Income, net in the condensed consolidated statements of operations. At December 31, 2015, the Company assumed no liability for the contingent earnout consideration. Approximately 78% of Nexgen’s revenue was related to the U.S. Sprint cellular network, contracted either with Samsung or Sprint directly. During due diligence, the Company modeled a likely range of future revenue and cash flow based on the high degree of customer concentration risk. While the terminated CSA represented a material portion of that revenue, the resulting total future revenue and cash flow remained within the lower range of the forecast model. The Company utilized the lower end of the forecast range in evaluating the fair value of the acquired assets. At December 31, 2015, the valuation yielded goodwill of $3.3 million, of which $1.5 million was related to the assembled workforce. The goodwill is deductible for income tax purposes. The purchase accounting related to the valuation of certain tangible and intangible assets was complete as of December 31, 2015. The following is the allocation of the purchase price for the assets from Nexgen at the date of the acquisition as of December 31, 2015:
| Tangible assets: |
||||
| Accounts receivable |
$ | 5,358 | ||
| Prepaid and other assets |
49 | |||
| Deferred cost of sales |
24 | |||
| Fixed assets |
43 | |||
|
|
|
|||
| Total tangible assets |
5,474 | |||
|
|
|
|||
| Intangible assets: |
||||
| Customer relationships |
8,117 | |||
| Trade names |
972 | |||
| Technology |
3,332 | |||
| Backlog |
162 | |||
| Non-compete |
583 | |||
| Goodwill |
3,332 | |||
|
|
|
|||
| Total intangible assets |
16,498 | |||
|
|
|
|||
| Total assets |
21,972 | |||
|
|
|
|||
| Accounts payable |
200 | |||
| Accrued liabilities |
341 | |||
|
|
|
|||
| Total liabilities |
541 | |||
|
|
|
|||
|
|
|
|||
| Net assets acquired |
$ | 21,431 | ||
|
|
|
|||
47
Table of Contents
A reconciliation of the assets acquired with the cash paid at closing is as follows:
| Net assets acquired |
$ | 21,431 | ||
| Due Nexgen - contingent liability |
(91 | ) | ||
| Due Nexgen - working capital adjustment |
(840 | ) | ||
|
|
|
|||
| Cash paid at closing |
$ | 20,500 | ||
|
|
|
The Company does not have any material relationship with Mr. Thakkar and the other Nexgen Parties other than in respect of the Nexgen APA, the Nexgen APA Amendment and the transactions provided for therein. Effective November 2015, Mr. Thakkar resigned from his role as the Company’s Vice President and Chief Technology Officer, Network Analytics.
The Company assumed Nexgen’s existing lease for Nexgen’s offices in Schaumburg, Illinois and is currently operating the acquired business from that location. The Nexgen services acquired in 2015 were integrated into the existing RF engineering services operation and the data analytics products were integrated in the RF scanner product line. The Company recognizes revenue for the engineering services under the completed performance method. For specialized staffing, the Company recognizes revenue as services are provided to the customer.
Revenues for Nexgen were $23.8 million for the year ended December 31, 2014. The Company’s results for the year ended December 31, 2015 include the operating results for March through December 2015 for the business acquired from Nexgen. The following unaudited pro forma financial information gives effect to the acquisition of the Nexgen business as if the acquisition had taken place on January 1, 2013. The pro forma financial information for Nexgen was derived from the historical accounting records of Nexgen.
| (unaudited) Year Ended December 31, 2015 |
(unaudited) Year Ended December 31, 2014 |
(unaudited) Year Ended December 31, 2013 |
||||||||||
| REVENUES |
$ | 109,573 | $ | 130,991 | $ | 119,796 | ||||||
| NET (LOSS) INCOME |
($ | 1,435 | ) | $ | 8,954 | $ | 3,242 | |||||
| NET (LOSS) INCOME PER SHARE |
($ | 0.08 | ) | $ | 0.49 | $ | 0.18 | |||||
The pro forma results include adjustments for intangible amortization of $0.3 million, $2.6 million, and $2.8 million for the years ended December 31, 2015, 2014, and 2013, respectively. The pro forma information is presented for illustrative purposes only and may not be indicative of the results that would have been obtained had the acquisition actually occurred on January 1, 2013, nor is it necessarily indicative of the Company’s future consolidated results of operations or financial position.
| 5. | Goodwill and Other Intangible Assets |
Goodwill
The activity related to goodwill for the year ended December 31, 2015 was as follows:
| Amount | ||||
| Balance at January 1, 2014 |
$ | 161 | ||
| No changes |
0 | |||
|
|
|
|||
| Balance at December 31, 2014 |
$ | 161 | ||
| Acquisition of business from Nexgen Wireless |
3,332 | |||
| Impairment of goodwill - RF Services |
(161 | ) | ||
|
|
|
|||
| Balance at December 31, 2015 |
$ | 3,332 | ||
|
|
|
|||
The Company recorded $0.2 million of goodwill related to the business acquired from Envision Wireless, Inc. in 2011 and recorded goodwill of $3.3 million of related to the business acquired from Nexgen in February 2015. There are two reporting units for goodwill testing purposes within the RF Solutions segment, Products and Services. The $3.3 million of goodwill from the Nexgen acquisition was recorded in Products and the $0.2 million of goodwill from the Envision acquisition was recorded in Services. The Company recorded an impairment charge of $0.2 million in the fourth quarter 2015 because the fair value of the RF Services reporting unit was below its carrying value. See the goodwill section of Note 1 for more information on the evaluation of goodwill.
48
Table of Contents
Intangible Assets
The Company amortizes intangible assets with finite lives on a straight-line basis over the estimated useful lives, which range from one to eight years. Amortization expense was approximately $4.0 million, $2.0 million, and $2.4 million for the years ended December 31, 2015, 2014, and 2013, respectively. For the year ended December 31, 2015, $3.4 million of the intangible amortization was included in operating expenses and $0.6 million was included in cost of goods sold. For the years ended December 31, 2014 and 2013, all of the intangible amortization was recorded within operating expenses.
The summary of other intangible assets, net is as follows:
| December 31, 2015 | December 31, 2014 | |||||||||||||||||||||||
| Cost | Accumulated Amortization |
Net Book Value |
Cost | Accumulated Amortization |
Net Book Value |
|||||||||||||||||||
| Customer contracts and relationships |
$ | 25,497 | $ | 18,616 | $ | 6,881 | $ | 17,381 | $ | 15,933 | $ | 1,448 | ||||||||||||
| Patents and technology |
10,114 | 7,337 | 2,777 | 6,781 | 6,507 | 274 | ||||||||||||||||||
| Trademarks and trade names |
4,960 | 3,738 | 1,222 | 3,988 | 3,152 | 836 | ||||||||||||||||||
| Other |
2,743 | 2,245 | 498 | 1,998 | 1,919 | 79 | ||||||||||||||||||
|
|
|
|
|
|
|
|
|
|
|
|
|
|||||||||||||
| $ | 43,314 | $ | 31,936 | $ | 11,378 | $ | 30,148 | $ | 27,511 | $ | 2,637 | |||||||||||||
|
|
|
|
|
|
|
|
|
|
|
|
|
|||||||||||||
The $8.7 million increase in the net book value of intangible assets at December 31, 2015 compared to December 31, 2014 reflects $13.1 million of intangible assets recorded for the purchase of the business from Nexgen, offset by amortization expense of $4.0 million recorded for the year ended December 31, 2015, and a restructuring charge of $0.4 million recorded in June 2015. The amortization expense for new technology of $0.6 million was recorded in cost of revenues, and the $3.4 million was recorded in operating expenses. The restructuring charge relates to the Company’s exit from the mobile towers product line. The Company wrote off the remaining technology and a portion of the trade names and customer relationships from the acquisition of the TelWorx business in 2012. The amortization related to the assets recorded for the acquisition of the business from Nexgen was $2.4 million for the year ended December 31, 2015.
The assigned lives and weighted average amortization periods by intangible asset category is summarized below:
| Intangible Assets |
Assigned Life | Weighted Average Amortization Period |
||||
| Customer contracts and relationships |
4 to 6 years | 5.0 | ||||
| Patents and technology |
3 to 6 years | 4.5 | ||||
| Trademarks and trade names |
3 to 8 years | 4.7 | ||||
| Other |
1 to 6 years | 4.4 | ||||
The Company’s scheduled amortization expense over the next four years is as follows:
| Fiscal Year |
Amount | |||
| 2016 | $ | 2,962 | ||
| 2017 | $ | 2,785 | ||
| 2018 | $ | 2,708 | ||
| 2019 | $ | 2,509 | ||
| 2020 | $ | 414 | ||
| 6. | Restructuring |
The Company incurred restructuring expense of $1.6 million for the year ended December 31, 2015 and $0.3 million during the year ended 2013. No restructuring expenses were recorded for the year ended December 31, 2014.
2015 Restructuring
In June 2015, the Company committed to a restructuring program for reductions in U.S. headcount and the exit from the mobile towers product line. To lower operating and production costs, the Company reduced headcount in engineering related to scanning receivers, in U.S. operations for Connected Solutions, and related to the mobile tower product line. The Company terminated 51 employees between June and December 2015 and recorded severance and other employee benefits of $1.2 million.
49
Table of Contents
The Company acquired the mobile tower product line in the 2012 acquisition of TelWorx. The Company’s mobile towers were primarily sold into the oil and gas exploration market in North America. The mobile towers were used to primarily provide a communications link to an oil drilling site or lighting for a site under construction. The decline in oil prices caused a decline in related mobile tower sales. The Company made the decision to exit the mobile tower product line due to the anticipated long term effect on revenue from depressed oil prices, and the fact that one of our two tower suppliers filing for Chapter 7 bankruptcy in June 2015 as a result of the decline in sales. Mobile towers were not a key element of the company’s kitting operation or antenna business within Connected Solutions. The Company’s exit from the mobile tower product line does not meet the accounting guidance for discontinued operations. The exit from mobile towers did not constitute a strategic shift in our operations. The Company recorded a charge of $0.4 million related to write-off of intangible assets related to the mobile product line.
The following table summarizes the Company’s restructuring accrual activity for 2015:
| Severance | Intangible Assets |
Asset Disposals |
Total | |||||||||||||
| Balance at December 31, 2014 |
$ | 0 | $ | 0 | $ | 0 | $ | 0 | ||||||||
| Restructuring charges |
1,199 | 406 | 25 | 1,630 | ||||||||||||
| Payments/Charges |
(962 | ) | (406 | ) | (25 | ) | (1,393 | ) | ||||||||
|
|
|
|
|
|
|
|
|
|||||||||
| Balance at December 31, 2015 |
$ | 237 | $ | 0 | $ | 0 | $ | 237 | ||||||||
|
|
|
|
|
|
|
|
|
|||||||||
2013 Restructuring
During the second and third quarters of 2013, the Company integrated the Company’s TelWorx business with its Bloomingdale, IL operations. The Company moved kitting operations and order fulfillment to its Bloomingdale facility from the Lexington, North Carolina facility. As part of the integration, the Company separated 18 employees between March and September 2013. The Company recorded $0.3 million as restructuring expense during the year ended December 31, 2013, consisting of employee-related costs and asset disposals. In October 2013, the Company moved to a smaller Lexington office facility for its sales and procurement functions.
| 7. | Income Taxes |
The Company recorded an income tax benefit of $0.9 million for the year ended December 31, 2015 and income tax expense of $1.2 million and $2.3 million for the years ended December 31, 2014 and December 31, 2013 respectively.
The 2015 effective tax rate differed from the statutory Federal rate of 34% primarily due to research and development credits and incremental tax on repatriation of funds from Israel. The 2014 effective tax rate differed from the statutory Federal rate of 34% primarily because of reversals of liabilities for uncertain tax positions related to research credits and foreign withholding taxes. The 2013 effective tax rate differed from the statutory Federal rate of 34% primarily because of state taxes and a change in the effective state rate for deferred tax assets. During 2015 the Company wrote off $0.1 million of deferred tax assets to additional paid in capital related to vested stock options that were forfeited. During 2014, the Company recorded $0.2 million to additional paid in capital related to excess tax benefits for stock-based compensation.
In 2013, the Company recorded a tax gain of $0.7 million related to the sale of PCTEL Secure. The income tax gain was based on the fair market value of the intangible assets sold minus the tax basis of the intangible assets.
50
Table of Contents
A reconciliation of the expense (benefit) for income taxes at the federal statutory rate compared to the expense (benefit) at the effective tax rate is as follows:
| Years Ended December 31 | ||||||||||||
| 2015 | 2014 | 2013 | ||||||||||
| Statutory federal income tax rate |
34 | % | 34 | % | 34 | % | ||||||
| State income tax, net of federal benefit |
2 | % | 4 | % | 5 | % | ||||||
| Tax effect of permanent differences |
-2 | % | 1 | % | 1 | % | ||||||
| Tax on repatriation |
-5 | % | 0 | % | 0 | % | ||||||
| Effective state rate change to deferred tax assets |
0 | % | 0 | % | 4 | % | ||||||
| Foreign income taxed at different rates |
3 | % | -1 | % | 0 | % | ||||||
| Research and development credits |
5 | % | -3 | % | -4 | % | ||||||
| Return to provision adjustments |
0 | % | 0 | % | 1 | % | ||||||
| Release of FIN 48 liability |
0 | % | -15 | % | 0 | % | ||||||
|
|
|
|
|
|
|
|||||||
| 37 | % | 20 | % | 41 | % | |||||||
|
|
|
|
|
|
|
|||||||
The domestic and foreign components of the continuing income (loss) before expense (benefit) for income taxes were as follows:
| Years Ended December 31, | ||||||||||||
| 2015 | 2014 | 2013 | ||||||||||
| Domestic |
($ | 3,705 | ) | $ | 4,882 | $ | 5,413 | |||||
| Foreign |
1,236 | 888 | 261 | |||||||||
|
|
|
|
|
|
|
|||||||
| ($ | 2,469 | ) | $ | 5,770 | $ | 5,674 | ||||||
|
|
|
|
|
|
|
|||||||
The expense (benefit) for income taxes of continuing operations consisted of the following:
| Years Ended December 31, | ||||||||||||
| 2015 | 2014 | 2013 | ||||||||||
| Current: |
||||||||||||
| Federal |
$ | 30 | ($ | 716 | ) | $ | 23 | |||||
| State |
91 | 60 | 56 | |||||||||
| Foreign |
262 | 148 | 88 | |||||||||
|
|
|
|
|
|
|
|||||||
| 383 | (508 | ) | 167 | |||||||||
| Deferred: |
||||||||||||
| Federal |
(1,214 | ) | 1,521 | 1,696 | ||||||||
| State |
(113 | ) | 164 | 481 | ||||||||
| Foreign |
43 | (19 | ) | (12 | ) | |||||||
|
|
|
|
|
|
|
|||||||
| (1,284 | ) | 1,666 | 2,165 | |||||||||
|
|
|
|
|
|
|
|||||||
| Total |
($ | 901 | ) | $ | 1,158 | $ | 2,332 | |||||
|
|
|
|
|
|
|
|||||||
51
Table of Contents
Deferred income taxes reflect the net tax effects of temporary differences between the carrying amounts of assets and liabilities for financial reporting purposes and the amounts used for income tax purposes.
The net deferred tax accounts consist of the following:
| December 31, | ||||||||
| 2015 | 2014 | |||||||
| Deferred Tax Assets: |
||||||||
| Amortization |
7,799 | 8,692 | ||||||
| Stock compensation |
1,571 | 1,798 | ||||||
| Federal, foreign, and state credits |
1,247 | 1,117 | ||||||
| Inventory reserves |
1,191 | 971 | ||||||
| Deferred compensation |
0 | 755 | ||||||
| Accrued vacation |
465 | 446 | ||||||
| Net operating loss carryforwards |
2,514 | 213 | ||||||
| Other |
330 | 261 | ||||||
|
|
|
|
|
|||||
| Gross deferred tax assets |
15,117 | 14,253 | ||||||
| Valuation allowance |
(659 | ) | (633 | ) | ||||
|
|
|
|
|
|||||
| Net deferred tax asset |
14,458 | 13,620 | ||||||
| Deferred Tax liabilities: |
||||||||
| Depreciation |
(1,303 | ) | (1,629 | ) | ||||
|
|
|
|
|
|||||
| Net Deferred Tax Assets |
$ | 13,155 | $ | 11,991 | ||||
|
|
|
|
|
|||||
The classification of deferred tax amounts on the balance sheet is as follows:
| December 31, | ||||||||
| 2015 | 2014 | |||||||
| Current: |
||||||||
| Deferred tax assets |
$ | 0 | $ | 2,281 | ||||
| Deferred tax liabilities |
0 | 0 | ||||||
|
|
|
|
|
|||||
| Current deferred tax assets |
0 | 2,281 | ||||||
| Non-current: |
||||||||
| Deferred tax assets |
14,458 | 11,339 | ||||||
| Deferred tax liabilities |
(1,303 | ) | (1,629 | ) | ||||
|
|
|
|
|
|||||
| Non-current deferred tax assets, net |
13,155 | 9,710 | ||||||
|
|
|
|
|
|||||
| Net Deferred Tax Assets |
$ | 13,155 | $ | 11,991 | ||||
|
|
|
|
|
|||||
Effective December 31, 2015, the Company early adopted the balance sheet classification of deferred taxes on a prospective basis. The guidance requires deferred tax assets and liabilities to be classified as noncurrent rather than split between current and noncurrent. Approximately $1.8 million in current deferred tax assets were reclassified to long-term deferred tax assets at December 31, 2015. The Company did not change the prior period balance sheet amounts.
Deferred Tax Valuation Allowance
At December 31, 2015, the Company had $13.2 million of net deferred tax assets, including domestic net deferred tax assets of $13.1 million and foreign net deferred tax assets of $0.1 million. The Company had a valuation allowance of $0.7 million at December 31, 2015. At December 31, 2014, the Company had $12.0 million of net deferred tax assets, including domestic net deferred tax assets of $11.8 million and foreign net deferred tax assets of $0.2 million. The Company had a valuation allowance of $0.6 million at December 31, 2014. The net deferred tax assets at December 31, 2015 and 2014, respectively, are primarily related to intangible assets acquired under purchase accounting which are amortized for tax purposes over 15 years, but for shorter periods under generally accepted accounting principles. The valuation allowance at December 31, 2015 and 2014, respectively, relates to credits and state operating losses that the Company does not expect to realize because they correspond to tax jurisdictions where the Company no longer has significant operations.
52
Table of Contents
On a regular basis, the Company evaluates the recoverability of deferred tax assets and the need for a valuation allowance. Such evaluations involve the application of significant judgment. The Company considers multiple factors in its evaluation of the need for a valuation allowance. The Company has incurred a cumulative U.S. profit exclusive of reversing temporary differences over the three years ended December 31, 2015 of $7.1 million. The Company’s domestic deferred tax assets have a ratable reversal pattern over 15 years. The carry forward rules allow for up to a 20 year carryforward of net operating losses (“NOL”) to future income that is available to realize the deferred tax assets. The combination of the deferred tax asset reversal pattern and carry forward period yields a 27.5 year average period over which future income can be utilized to realize the deferred tax assets. The future domestic income required to realize the $13.1 million of net deferred U.S. tax assets over that period is $35.0 million. The result is that $1.3 million a year on average ($35.0 million/27.5 years) of income is required over the next 27.5 years to realize the net deferred tax assets.
In the Company’s judgment, an average of $1.3 million per year of income over an extended 27.5 year period represents a threshold that is unlikely to require extraordinary or unusual one-time events or actions on the Company’s part to meet. The Company’s estimate of future income over the recovery period is sufficient to realize the deferred tax assets.
Based on the evaluation of these factors taken as a whole, the Company believes that the positive evidence in the form of (i) a 27.5 year future recovery period, (ii) a modest average future annual income requirement of $1.3 million is unlikely to require extraordinary or unusual one-time events or actions on the Company’s part to meet, and (iii) its estimate of future income, outweigh the negative evidence of a cumulative taxable loss from operations exclusive of reversing temporary differences over the last three years. Therefore, the Company believes that the net deferred tax asset exclusive of the credits and state net operating losses is more likely than not to be realized.
Accounting for Uncertainty for Income Taxes
A reconciliation of the beginning and ending amount of unrecognized tax benefits is as follows:
| December 31, | ||||||||
| 2015 | 2014 | |||||||
| Beginning of period |
$ | 807 | $ | 1,539 | ||||
| Addition related to tax positions in current year |
43 | 47 | ||||||
| Reversals |
0 | (779 | ) | |||||
|
|
|
|
|
|||||
| End of period |
$ | 850 | $ | 807 | ||||
|
|
|
|
|
|||||
Included in the balance of total unrecognized tax benefits at December 31, 2015 are potential benefits of $0.8 million that, if recognized, would affect the effective rate on income before taxes. During 2014, the Company recognized tax benefits of $0.8 million related to the reversal of liabilities related to tax positions for research credits and foreign withholding taxes. The Company is unaware of any positions for which it is reasonably possible that the unrecognized tax benefits will significantly increase or decrease within the next twelve months.
The Company recognizes all interest and penalties, including those relating to unrecognized tax benefits as income tax expense. The Company’s income tax expense related to interest and penalties includes $0, $0, and $22 for the years ended December 31, 2015, 2014, and 2013, respectively for unrecognized tax benefits.
Audits
The Company and its subsidiaries file income tax returns in the U.S. and various foreign jurisdictions. The Company’s U.S. federal tax returns remain subject to examination for 2012 and subsequent periods. The Company’s state tax returns remain subject to examination for 2012 and subsequent periods. The Company’s foreign tax returns remain subject to examination for 2009 and subsequent periods.
Summary of Carryforwards
At December 31, 2015, the Company has a federal net operating loss carryforward of $7.9 million that expires between 2032 and 2034, state net operating loss carryforwards of $8.1 million that expire between 2024 and 2034. Of the $7.9 million net operating loss,
53
Table of Contents
$1.7 million is related to stock-based compensation tax deductions in excess of book compensation expense (APIC NOLs) that will be credited to additional paid in capital when such deductions reduce taxes payable as determined on a “with-and-without” basis. The Company’s state net operating losses consist of tax deductible expenses in addition to excess tax benefits for stock-based compensation. Additionally, the Company has $1.5 million of state research credits with no expiration.
Investment in Foreign Operations
The Company provided additional U.S. income taxes of $0.1 million related to the expected repatriation of earnings from its subsidiary in Israel. The Company expects to cease operations of this subsidiary in 2016. The Company has not provided deferred U.S. income taxes and foreign withholding taxes on approximately $2.8 million of undistributed cumulative earnings of other foreign subsidiaries because the Company considers such earnings to be permanently reinvested in those operations. Upon repatriation of these earnings, the Company would be subject to U.S. income tax, net of available foreign tax credits. The Company does not believe that the net tax effect of repatriation of foreign earnings is significant.
Tangible Property Regulations
On September 13, 2013, the U. S. Treasury Department and the IRS issued final regulations providing comprehensive guidance on the tax treatment of costs incurred to acquire, repair or improve tangible property. The final regulations are generally effective for taxable years beginning on or after January 1, 2014. On January 24, 2014, the IRS issued procedural guidance pursuant to which taxpayers will be granted automatic consent to change their tax accounting methods to comply with the final regulations. These regulations did not have a material impact on the Company’s financial condition, results of operations or cash flows.
| 8. | Commitments and Contingencies |
Operating Leases
The Company has operating leases for facilities through 2020 and office equipment through 2019. The future minimum rental payments under these leases at December 31, 2015, are as follows:
| Year |
Amount | |||
| 2016 |
1,132 | |||
| 2017 |
974 | |||
| 2018 |
927 | |||
| 2019 |
711 | |||
| 2020 |
242 | |||
| Thereafter |
21 | |||
|
|
|
|||
| Future minimum lease payments |
$ | 4,007 | ||
|
|
|
|||
The rent expense under leases was approximately $1.1 million, $0.9 million, and $1.0 million for the years ended December 31, 2015, 2014, and 2013, respectively.
Capital Leases
The Company has capital leases for office and manufacturing equipment. As of December 31, 2015 and 2014, the equipment had cost, accumulated depreciation, and a net book value as follows:
| December 31, 2015 |
December 31, 2014 |
|||||||
| Cost |
$ | 190 | $ | 189 | ||||
| Accumulated Depreciation |
(48 | ) | (16 | ) | ||||
|
|
|
|
|
|||||
| Net Book Value |
$ | 142 | $ | 173 | ||||
|
|
|
|
|
|||||
54
Table of Contents
The following table presents future minimum lease payments under capital leases together with the present value of the net minimum lease payments due in each year:
| Year |
Amount | |||
| 2016 |
41 | |||
| 2017 |
40 | |||
| 2018 |
40 | |||
| 2019 |
29 | |||
| 2020 |
4 | |||
|
|
|
|||
| Total minimum payments required: |
154 | |||
| Less amount representing interest: |
12 | |||
|
|
|
|||
| Present value of net minimum lease payments: |
$ | 142 | ||
|
|
|
|||
Warranty Reserve and Sales Returns
The Company allows its major distributors and certain other customers to return unused product under specified terms and conditions. The Company accrues for product returns based on historical sales and return trends. The Company’s allowance for sales returns was $0.2 million at December 31, 2015, and $0.1 million at December 31, 2014, respectively, and is included within accounts receivable on the consolidated balance sheet.
The Company offers repair and replacement warranties of primarily five years for antenna products and for scanning receivers. The Company’s warranty reserve is based on historical sales and costs of repair and replacement trends. The warranty reserve was $0.3 million at December 31, 2015 and 2014, respectively, and is included in other accrued liabilities in the accompanying consolidated balance sheets.
| Year Ended December 31, | ||||||||
| 2015 | 2014 | |||||||
| Beginning balance |
$ | 304 | $ | 305 | ||||
| Provisions for warranties |
60 | 124 | ||||||
| Consumption of reserves |
(16 | ) | (125 | ) | ||||
|
|
|
|
|
|||||
| Ending balance |
$ | 348 | $ | 304 | ||||
|
|
|
|
|
|||||
Contingent Consideration
As part of the acquisition of the business from Nexgen, the purchase consideration included a contingent payment that was dependent on the achievement of revenue-based goals pertaining to the acquired business for the period commencing on March 1, 2015 and ending on April 30, 2016. As part of the Nexgen APA Amendment, the parties revised the terms of the contingent consideration. The measurement period for the revised earnout commenced on January 1, 2016 and ends on December 31, 2016 and is dependent on software revenue-based goals pertaining to the acquired business. The Company estimated that the contingent liability would be 0 at December 31, 2015. See Note 4 for information related to the Nexgen APA Amendment.
Legal Proceedings
Settlement with TelWorx Parties
On March 27, 2013, the Company, its wholly owned subsidiary PCTelWorx, Inc. (“PCTelWorx”), and the TelWorx Parties (as defined below) entered into an Amendment (the “Amendment”) to the Asset Purchase Agreement dated July 9, 2012 (the “Original Agreement), among the Company, PCTelWorx, Ciao Enterprises, LLC f/k/a TelWorx Communications, LLC and certain of its affiliated entities (collectively, the “TelWorx Entities”) and Tim and Brenda Scronce (“Sellers” and collectively with the TelWorx Entities, the “TelWorx Parties”), as part of a settlement arrangement relative to PCTelWorx’s acquisition of substantially all of the assets and the assumption of certain specified liabilities of the TelWorx Entities on July 9, 2012 (the “Acquisition”).
As disclosed in the Company’s Form 8-K/A filed with the Securities and Exchange Commission (the “Commission”) on March 13, 2013, after completion of the Acquisition, the Company became aware of certain accounting irregularities with respect to the TelWorx Entities and the Company’s Board of Directors directed management to conduct an internal investigation. Based on the results of the Company’s investigation, the Company’s Board of Directors directed management to seek restitution from the TelWorx Parties, and after protracted negotiations and concurrent litigation, the parties entered into the Amendment and related settlement agreements to resolve their dispute.
55
Table of Contents
The following is a summary of the material terms of the Amendment:
| • | the TelWorx Parties paid the Company a cash payment of $4.3 million, which included $1.0 million pursuant to the working capital adjustment provisions of the Original Agreement; |
| • | the TelWorx Parties forfeited all $1.5 million of the potential contingent consideration earnable under the Original Agreement, which had a fair value of $0.6 million, and which, if earned, would have been payable in the form of common stock of the Company; |
| • | the TelWorx Parties forfeited the $0.5 million holdback escrow under the Original Agreement; |
| • | the parties agreed to the elimination of all indemnification obligations provided for under the Original Agreement; |
| • | the Company, PCTelWorx and the Sellers each agreed to execute mutual releases of all claims arising in connection with the dispute; and |
| • | The Company acquired an option to terminate the facility lease in Lexington, North Carolina with Scronce Real Estate, LLC (which is controlled by the Sellers) upon 180 days written notice. |
The settlement had an aggregate fair value of $5.4 million, consisting of $4.3 million cash received, $0.6 million for the contingent consideration forfeited, and $0.5 million for the holdback escrow balance released. Approximately $1.0 million of the cash received was pursuant to the working capital adjustment provisions of the Original Agreement. The remaining $4.3 million settlement amount, consisting of $3.2 million cash and the release of the $0.6 million contingent consideration fair value and the $0.5 million release of the holdback escrow, was recorded as income in the quarter ended March 31, 2013, consistent with accounting for legal settlements.
As part of the Acquisition, the Company executed a five-year lease with Scronce Real Estate, LLC for the continued use of an operating facility and offices in Lexington, which provided for annual rental payments of approximately $0.2 million. In May 2013, the Company gave notice of its election to exercise its option to terminate the Lexington facility lease, with termination effective October 31, 2013.
Settlement with Other Parties on the TelWorx Acquisition
The Company also engaged in efforts to seek further restitution from two other parties used by the TelWorx Parties for professional services in their sale of the business to the Company. On September 30, 2014, the Company settled in cash with one party for $0.1 million and on October 10, 2014, the Company settled with the other party in cash for $0.8 million. The Company recorded the settlements as income in the quarters ended September 30, 2014 and December 31, 2014, respectively.
| 9. | Shareholders’ Equity |
Common Stock
The activity related to common shares outstanding for the years ended December 31st is as follows:
| 2015 | 2014 | 2013 | ||||||||||
| Beginning of year |
18,571 | 18,566 | 18,515 | |||||||||
| Issuance of common stock on exercise of stock options net of stock swaps |
35 | 58 | 91 | |||||||||
| Issuance of restricted common stock and performance shares, net of cancellations |
916 | 183 | 49 | |||||||||
| Issuance of common stock from purchase of Employee Stock Purchase Plan shares |
134 | 101 | 113 | |||||||||
| Cancellation of stock for withholding tax for vested shares |
(59 | ) | (121 | ) | (142 | ) | ||||||
| Common stock buyback |
(1,943 | ) | (216 | ) | (60 | ) | ||||||
|
|
|
|
|
|
|
|||||||
| End of Year |
17,654 | 18,571 | 18,566 | |||||||||
|
|
|
|
|
|
|
|||||||
Preferred Stock
The Company is authorized to issue up to 5,000,000 shares of preferred stock in one or more series, each with a par value of $0.001 per share. As of December 31, 2015 and 2014, no shares of preferred stock were issued or outstanding.
56
Table of Contents
| 10. | Stock-Based Compensation |
Stock Plans
Common Stock Reserved for Future Issuance
At December 31, 2015, the Company had 5,400,264 shares of common stock that could potentially be issued under various stock-based compensation plans described in this footnote. A summary of the reserved shares of common stock for future issuance are as follows:
| December 31, | ||||||||
| 2015 | 2014 | |||||||
| 1997 Stock Plan |
4,712,576 | 2,835,151 | ||||||
| 2001 Stock Plan |
50,530 | 68,810 | ||||||
| Employee Stock Purchase Plan |
637,158 | 770,765 | ||||||
|
|
|
|
|
|||||
| Total shares reserved |
5,400,264 | 3,674,726 | ||||||
|
|
|
|
|
|||||
These amounts include the shares available for grant and the options outstanding.
1997 Stock Plan
The Board of Directors may grant to employees, directors and consultants restricted stock, options to purchase common stock, or stock purchase rights at terms and prices determined by the Board under the 1997 Stock Plan which expires in 2016. Under the 1997 Stock Plan, each restricted share award consumes 1.78 of shares available and each stock option award consumes 1.0 share available. As of December 31, 2015, options to acquire 1,169,912 shares were outstanding and a total of 3,542,664 shares remain available for future grants.
2001 Non-Statutory Stock Option Plan
Options granted under the 2001 Plan are exercisable at any time within ten years from the date of grant or within ninety days of termination of employment. In June 2010 the stockholders approved certain changes to the 1997 Stock Plan that included the following: (i) there would be no additional grants from the 2001 Stock Plan; and (ii) any shares returned (or that would have otherwise returned) to the 2001 Plan would be added to the shares of common stock authorized for issuance under the 1997 Stock Plan. The 2001 Plan terminated in August 2011, and options to acquire 50,530 shares were outstanding at December 31, 2015.
Employee Stock Purchase Plan
Under the Company’s Employee Stock Purchase Plan (“ESPP”), eligible employees can purchase common stock at the lower of 85% of the fair market value of the common stock on the first or last day of each offering period. In June 2014, the Company’s shareholders approved an amended and restated ESPP. Under the restated ESPP, the number of shares authorized for issuance was increased by 750,000 and the expiration date of the ESPP was modified from March 2017 to the date that all shares authorized have been granted. As of December 31, 2015, the Company had 637,158 shares remaining that can be issued under the Purchase Plan.
Stock-Based Compensation Expense
The consolidated statements of operations include $1.9 million, $3.3 million, and $3.4 million of stock compensation expense for the years ended December 31, 2015, 2014, and 2013, respectively. Stock compensation expense for the year ended December 31, 2015, consisted of $1.8 million for service-based restricted stock and restricted stock unit awards and $0.6 million for stock option and stock purchase plan expenses, offset by a $0.5 million benefit related to expense reversals for performance-based stock awards. Stock compensation expense for the year ended December 31, 2014, consisted of $1.5 million for service-based restricted stock and restricted stock unit awards, $1.2 million for stock option and stock purchase plan expenses, and $0.6 million for performance-based stock awards. Stock compensation expense for the year ended December 31, 2013, consisted of $2.3 million for service-based restricted stock and restricted stock unit awards, $0.9 million for stock option and stock purchase plan expenses, and $0.2 million for performance-based stock awards. The Company did not capitalize any stock compensation expense during the years ended December 31, 2015, 2014, and 2013.
57
Table of Contents
The stock-based compensation expense by type is as follows:
| Years Ended December 31, | ||||||||||||
| 2015 | 2014 | 2013 | ||||||||||
| Service-based awards |
$ | 1,813 | $ | 1,468 | $ | 2,332 | ||||||
| Stock option and employee purchase plans |
562 | 1,192 | 883 | |||||||||
| Performance-based shares and stock options |
(510 | ) | 616 | 226 | ||||||||
|
|
|
|
|
|
|
|||||||
| $ | 1,865 | $ | 3,276 | $ | 3,441 | |||||||
|
|
|
|
|
|
|
|||||||
The stock-based compensation is reflected in the consolidated statements of operations as follows:
| Years Ended December 31, | ||||||||||||
| 2015 | 2014 | 2013 | ||||||||||
| Cost of revenues |
$ | 370 | $ | 426 | $ | 390 | ||||||
| Research and development |
419 | 659 | 689 | |||||||||
| Sales and marketing |
238 | 661 | 575 | |||||||||
| General and administrative |
838 | 1,530 | 1,786 | |||||||||
|
|
|
|
|
|
|
|||||||
| Total continuing operations |
1,865 | 3,276 | 3,440 | |||||||||
| Discontinued operations |
0 | 0 | 1 | |||||||||
|
|
|
|
|
|
|
|||||||
| Total |
$ | 1,865 | $ | 3,276 | $ | 3,441 | ||||||
|
|
|
|
|
|
|
|||||||
Restricted Stock - Serviced Based
The Company grants restricted shares as employee incentives. When service-based restricted stock is granted to employees, the Company records deferred stock compensation within additional paid in capital, representing the fair value of the common stock on the date the restricted shares are granted. The Company records stock compensation expense on a straight-line basis over the vesting period of the applicable service-based restricted shares. These grants vest over various periods, but typically vest over four years. During the years ended December 31, 2015 and 2014, the Company awarded annual service-based restricted stock to eligible employees.
The following table summarizes service-based restricted stock activity for the years ended December 31st:
| 2015 | 2014 | 2013 | ||||||||||||||||||||||
| Unvested Restricted Stock Awards |
Shares | Weighted Average Fair Value |
Shares | Weighted Average Fair Value |
Shares | Weighted Average Fair Value |
||||||||||||||||||
| Beginning of year |
343,836 | $ | 7.41 | 543,021 | $ | 6.59 | 940,685 | $ | 6.24 | |||||||||||||||
| Shares awarded |
1,033,776 | 6.12 | 182,407 | 8.19 | 23,982 | 8.26 | ||||||||||||||||||
| Shares vested |
(193,751 | ) | 7.20 | (378,417 | ) | 6.60 | (401,713 | ) | 5.87 | |||||||||||||||
| Shares cancelled |
(133,689 | ) | 7.90 | (3,175 | ) | 8.28 | (19,933 | ) | 6.68 | |||||||||||||||
|
|
|
|
|
|
|
|
|
|
|
|
|
|||||||||||||
| End of year |
1,050,172 | $ | 6.11 | 343,836 | $ | 7.41 | 543,021 | $ | 6.59 | |||||||||||||||
|
|
|
|
|
|
|
|
|
|
|
|
|
|||||||||||||
The intrinsic values of service-based restricted shares that vested were $1.5 million, $3.2 million, and $3.0 million during the years ended December 31, 2015, 2014, and 2013, respectively.
As of December 31, 2015, the unrecognized compensation expense related to the unvested portion of the Company’s restricted stock was approximately $4.3 million, net of estimated forfeitures to be recognized through 2019 over a weighted average period of 1.8 years.
58
Table of Contents
Restricted Stock Units – Service Based
The Company grants restricted stock units as employee incentives. Restricted stock units are primarily granted to foreign employees for long-term incentive purposes. Employee restricted stock units are service-based awards and are amortized over the vesting period. At the vesting date, these units are converted to shares of common stock. The Company records expense on a straight-line basis for restricted stock units.
The following summarizes the service-based restricted stock unit activity during the year ended December 31st:
| 2015 | 2014 | 2013 | ||||||||||||||||||||||
| Unvested Restricted Stock Units |
Shares | Weighted Average Fair Value |
Shares | Weighted Average Fair Value |
Shares | Weighted Average Fair Value |
||||||||||||||||||
| Beginning of year |
4,600 | $ | 7.47 | 6,325 | $ | 6.70 | 11,925 | $ | 6.61 | |||||||||||||||
| Units awarded |
22,350 | 5.62 | 1,500 | 8.77 | 0 | 0.00 | ||||||||||||||||||
| Units vested/Shares awarded |
(2,475 | ) | 7.00 | (3,225 | ) | 6.56 | (4,475 | ) | 6.46 | |||||||||||||||
| Units cancelled |
(1,750 | ) | 7.91 | 0 | 0.00 | (1,125 | ) | 6.77 | ||||||||||||||||
|
|
|
|
|
|
|
|
|
|
|
|
|
|||||||||||||
| End of year |
22,725 | $ | 5.65 | 4,600 | $ | 7.47 | 6,325 | $ | 6.70 | |||||||||||||||
|
|
|
|
|
|
|
|
|
|
|
|
|
|||||||||||||
The intrinsic values of service-based restricted stock units that vested were $20, $27, and $34 during the years ended December 31, 2015, 2014, and 2013, respectively.
The Company recorded stock compensation expense of $22, $21, and $25 for restricted stock units in the years ended December 31, 2015, 2014, and 2013, respectively. As of December 31, 2015, the unrecognized compensation expense related to the unvested portion of the Company’s restricted stock units was $92, net of estimated forfeitures to be recognized through 2019 over a weighted average period of 1.5 years
Stock Options
The Company grants stock options to purchase common stock as long-term incentives. The Company issues stock options with exercise prices no less than the fair value of the Company’s stock on the grant date. Employee options are subject to installment vesting typically over a period of four years. Stock options may be exercised at any time prior to their expiration date or within ninety days of termination of employment, or such shorter time as may be provided in the related stock option agreement. Prior to July 2010, the Company primarily granted stock options with a ten-year life. Beginning with options granted in July 2010, the Company grants stock options with a seven-year life. During 2013, the Company issued its annual long-term incentive awards in the form of stock options, and during the years ended December 31, 2015, 2014, and 2013, the Company awarded stock options to eligible new employees for incentive purposes.
59
Table of Contents
A summary of the Company’s stock option activity for the years ended December 31st is as follows:
| 2015 | 2014 | 2013 | ||||||||||||||||||||||
| Options Outstanding |
Weighted Average Exercise Price |
Options Outstanding |
Weighted Average Exercise Price |
Options Outstanding |
Weighted Average Exercise Price |
|||||||||||||||||||
| Beginning of Year |
1,357,928 | $ | 7.81 | 1,461,559 | $ | 8.40 | 1,099,106 | $ | 9.06 | |||||||||||||||
| Options granted |
185,000 | 7.61 | 25,800 | 8.19 | 698,050 | 7.23 | ||||||||||||||||||
| Options granted from stock option rights |
0 | 0.00 | 207,236 | 7.16 | 0 | 0.00 | ||||||||||||||||||
| Options exercised |
(35,134 | ) | 7.25 | (74,463 | ) | 7.46 | (164,079 | ) | 7.84 | |||||||||||||||
| Options forfeited |
(141,722 | ) | 7.46 | (10,144 | ) | 7.98 | (40,783 | ) | 6.86 | |||||||||||||||
| Options cancelled/expired |
(145,630 | ) | 8.75 | (252,060 | ) | 10.86 | (130,735 | ) | 8.85 | |||||||||||||||
|
|
|
|
|
|
|
|
|
|
|
|
|
|||||||||||||
| End of Year |
1,220,442 | $ | 7.72 | 1,357,928 | $ | 7.81 | 1,461,559 | $ | 8.40 | |||||||||||||||
|
|
|
|
|
|
|
|
|
|
|
|
|
|||||||||||||
| Exercisable |
764,546 | $ | 7.97 | 643,810 | $ | 8.46 | 759,284 | $ | 9.51 | |||||||||||||||
|
|
|
|
|
|
|
|
|
|
|
|
|
|||||||||||||
During the year ended December 31, 2015, the Company received proceeds of $0.3 million from the exercise of 35,134 options. The intrinsic value of these options exercised was $34. During the year ended December 31, 2014, the Company received proceeds of $0.6 million from the exercise of 74,463 options. The intrinsic value of these options exercised was $72. During the year ended December 31, 2013, the Company received proceeds of $1.3 million from the exercise of 164,079 options. The intrinsic value of these options exercised was $252.
The range of exercise prices for options outstanding and exercisable at December 31, 2015, was $5.50 to $11.00. The following table summarizes information about stock options outstanding under all stock option plans:
| Options Outstanding | Options Exercisable | |||||||||||||||||||||||||||||
| Range of Exercise Prices |
Number Outstanding |
Weighted Average Contractual Life (Years) |
Weighted- Average Exercise Price |
Number Exercisable |
Weighted Average Exercise Price |
|||||||||||||||||||||||||
| $ | 5.50 | — | $ | 6.00 | 32,379 | 6.46 | $ | 5.90 | 3,180 | $ | 5.64 | |||||||||||||||||||
| 6.01 | — | 6.50 | 16,267 | 3.29 | 6.23 | 13,786 | 6.23 | |||||||||||||||||||||||
| 6.51 | — | 7.00 | 37,522 | 2.40 | 6.85 | 34,908 | 6.86 | |||||||||||||||||||||||
| 7.01 | — | 7.50 | 715,546 | 4.01 | 7.18 | 406,293 | 7.17 | |||||||||||||||||||||||
| 7.51 | — | 8.00 | 24,250 | 4.66 | 7.78 | 11,009 | 7.81 | |||||||||||||||||||||||
| 8.01 | — | 8.50 | 123,244 | 4.91 | 8.17 | 28,574 | 8.44 | |||||||||||||||||||||||
| 8.51 | — | 9.00 | 31,750 | 0.92 | 8.76 | 28,523 | 7.76 | |||||||||||||||||||||||
| 9.01 | — | 9.50 | 182,584 | 0.74 | 9.19 | 182,323 | 9.19 | |||||||||||||||||||||||
| 9.51 | — | 10.00 | 16,000 | 2.79 | 9.63 | 15,050 | 9.63 | |||||||||||||||||||||||
| 10.01 | — | 11.00 | 40,900 | 0.47 | 10.64 | 40,900 | 10.64 | |||||||||||||||||||||||
|
|
|
|
|
|
|
|
|
|
|
|
|
|
|
|||||||||||||||||
| $ | 5.50 | — | $ | 11.00 | 1,220,442 | 3.41 | $ | 7.72 | 764,546 | $ | 7.97 | |||||||||||||||||||
60
Table of Contents
The weighted average contractual life and intrinsic value at December 31, 2015, was the following:
| Weighted Average Contractual Life (years) |
Intrinsic Value |
|||||||
| Options Outstanding |
3.41 | $ | 0 | |||||
| Options Exercisable |
2.54 | $ | 0 | |||||
The intrinsic value is based on the share price of $4.55 at December 31, 2015.
The Company calculated the fair value of each option grant on the date of grant using the Black-Scholes option-pricing model using the following assumptions at December 31st:
| 2015 | 2014 | 2013 | ||||||||||
| Dividend yield |
4.4 | % | 2.3 | % | 1.7 | % | ||||||
| Risk-free interest rate |
0.7 | % | 0.8 | % | 0.5 | % | ||||||
| Expected volatility |
34 | % | 33 | % | 45 | % | ||||||
| Expected life (in years) |
5.2 | 5.3 | 5.8 | |||||||||
The fair value of each unvested option was estimated on the date of grant using the Black-Scholes option valuation model. The Black-Scholes option valuation model was developed for use in estimating the fair value of traded options, which have no vesting restrictions and are fully transferable. In addition, option valuation models require the input of highly subjective assumptions including the expected stock price volatility and expected option life. Because the Company’s employee stock options have characteristics significantly different from those of traded options, and because changes in the subjective input assumptions can materially affect the fair value estimate, the existing models may not necessarily provide a reliable single measure of the fair value of the employee stock options.
The dividend yield rate was calculated by dividing the Company’s annual dividend by the closing price on the grant date. The risk-free interest rate was based on the U.S. Treasury yields with remaining term that approximates the expected life of the options granted. The Company calculates the volatility based on a five-year historical period of the Company’s stock price. The Company incorporates a forfeiture rate based on historical data in the expense calculation. The expected life used for options granted is based on historical data of employee exercise performance. The Company records expense based on the grading vesting method.
As of December 31, 2015, the unrecognized compensation expense related to the unvested portion of the Company’s stock options was approximately $0.3 million, net of estimated forfeitures to be recognized through 2019 over a weighted average period of 1.3 years.
Performance-based Equity Awards
Performance units
The Company issued performance share units to executives in 2014 and 2015. The fair value of these performance share units was calculated based on the stock price on the date of grant.
In March 2015, the Company’s Board of Directors approved the 2015 Long-Term Incentive Plan (“2015 LTIP”). Under the 2015 LTIP, shares can be earned by certain executive employees based upon achievement of revenue goals over a four-year period with a penalty if certain earnings levels are not maintained. The four-year period is divided into two interim periods (each an “Interim Period”), the first of which will end on December 31, 2016, and the second of which will end on December 31, 2018. At the award date, the number of shares that could be earned collectively by all participants at threshold and target were 212,000 and 424,000, respectively. Stock compensation expense is amortized over the performance period for these awards based on estimated achievement of the goals. No expense was recorded during the year ended December 31, 2015 for the 2015 LTIP because the Company does not believe it will meet the revenue threshold for the year ended December 31, 2016.
In March 2014, the Company’s Board of Directors approved the 2014 Long-Term Incentive Plan (“2014 LTIP”). Under the 2014 LTIP, shares can be earned by certain executive employees based upon achievement of revenue goals over a four-year period with a penalty if certain profit levels are not maintained. The four-year period is divided into two interim periods (each an “Interim Period”), the first of which will end on December 31, 2015, and the second of which will end on December 31, 2017. The number of shares that
61
Table of Contents
could be earned collectively by all participants at threshold and target were 190,000 and 380,000, respectively. Stock compensation expense is amortized over the performance period for these awards based on estimated achievement of the goals. No expense was recorded for the 2014 LTIP because the Company did not meet the revenue threshold for the year ended 2015. Unvested awards of 162,000 related to the Interim Period ended December 31, 2015 were cancelled in December.
The following summarizes the performance unit activity during the years ended December 31st:
| 2015 | 2014 | 2013 | ||||||||||||||||||||||
| Unvested Performance Units |
Awards | Weighted Average Fair Value |
Awards | Weighted Average Fair Value |
Awards | Weighted Average Fair Value |
||||||||||||||||||
| Beginning of Year |
380,000 | $ | 8.47 | 0 | $ | 0.00 | 147,250 | $ | 7.04 | |||||||||||||||
| Units awarded |
431,000 | 7.49 | 380,000 | 8.47 | 0 | 0.00 | ||||||||||||||||||
| Units vested |
(13,202 | ) | 7.98 | 0 | 0.00 | 0 | 0.00 | |||||||||||||||||
| Units cancelled |
(242,798 | ) | 8.34 | 0 | 0.00 | (147,250 | ) | 7.04 | ||||||||||||||||
|
|
|
|
|
|
|
|
|
|
|
|
|
|||||||||||||
| End of Year |
555,000 | $ | 7.78 | 380,000 | $ | 8.47 | 0 | $ | 0.00 | |||||||||||||||
|
|
|
|
|
|
|
|
|
|
|
|
|
|||||||||||||
The number of awards presented in the table above is based on achievement at target. The intrinsic value of performance units that vested during the year ended December 31, 2015 was $82.
Performance stock option rights
For the Company’s 2013 Long-Term Incentive Plan, the Company awarded 182,500 performance-based retention stock option rights to executive officers with a weighted average grant date fair value of $2.83 in April 2013. The number of options granted was based on the target for the Company’s 2013 revenue goal. In March 2014, the Company awarded 207,236 stock options because the Company exceeded the target revenue goal for 2013. These options will vest between two and four years beginning in April 2014. The Company records expense for these retention stock options on the grading vested method based on achievement of the performance goals. The assumptions used for the valuation of these stock options were consistent with the employee stock options awarded to employees in April 2013.
The following table summarizes the retention stock option activity for the year ended December 31, 2014:
| 2014 | ||||||||
| Retention Stock Option Rights |
Stock Options Rights |
Weighted Average Exercise Price |
||||||
| Beginning of Year |
182,500 | $ | 7.16 | |||||
| Stock option rights granted |
24,736 | 7.16 | ||||||
| Stock options granted |
(207,236 | ) | 7.16 | |||||
|
|
|
|
|
|||||
| End of Year |
0 | $ | 0.00 | |||||
|
|
|
|
|
|||||
| Exercisable |
0 | $ | 0.00 | |||||
62
Table of Contents
Employee Stock Purchase Plan
The following summarizes the Purchase Plan activity during the years ended December 31st:
| 2015 | 2014 | 2013 | ||||||||||||||||||||||
| Shares | Weighted Average Fair Value at Grant Date |
Shares | Weighted Average Fair Value at Grant Date |
Shares | Weighted Average Fair Value at Grant Date |
|||||||||||||||||||
| Outstanding, beginning of year |
0 | $ | 0.00 | 0 | $ | 0.00 | 0 | $ | 0.00 | |||||||||||||||
| Granted |
133,607 | 1.35 | 100,608 | 1.88 | 112,965 | 2.24 | ||||||||||||||||||
| Vested |
(133,607 | ) | 1.35 | (100,608 | ) | 1.88 | (112,965 | ) | 2.24 | |||||||||||||||
|
|
|
|
|
|
|
|
|
|
|
|
|
|||||||||||||
| Outstanding, end of year |
0 | $ | 0.00 | 0 | $ | 0.00 | 0 | $ | 0.00 | |||||||||||||||
|
|
|
|
|
|
|
|
|
|
|
|
|
|||||||||||||
Based on the 15% discount and the fair value of the option feature of this plan, the ESPP is considered compensatory. Compensation expense is calculated using the fair value of the employees’ purchase rights under the Black-Scholes model. The Company recognized compensation expense of $0.2 million for the years ended December 31, 2015 and 2014, respectively and $0.3 million for the year ended December 31, 2013.
The Company calculated the fair value of each employee stock purchase grant on the date of grant using the Black-Scholes option-pricing model using the following assumptions:
| Employee Stock Purchase Plan |
||||||||||||
| 2015 | 2014 | 2013 | ||||||||||
| Dividend yield |
3.4 | % | 2.2 | % | 1.7 | % | ||||||
| Risk-free interest rate |
0.6 | % | 0.3 | % | 0.3 | % | ||||||
| Expected volatility |
34 | % | 38 | % | 51 | % | ||||||
| Expected life (in years) |
0.5 | 0.5 | 0.5 | |||||||||
The dividend yield rate was calculated by dividing the Company’s annual dividend by the closing price on the grant date. The risk-free interest rate was based on the U.S. Treasury yields with remaining term that approximates the expected life of the options granted. The dividend yield rate is calculated by dividing the Company’s annual dividend by the closing price on the grant date. The Company calculates the volatility based on a five-year historical period of the Company’s stock price. The expected life used is based on the offering period.
Board of Director Equity Awards
The Company grants equity awards to member of its Board of Directors for an annual retainer and for committee services in either shares of the Company’s stock or restricted stock units. These awards vest immediately. New directors receive time-based restricted shares which vest over three years. During the year ended December 31, 2015, the Company issued 37,379 shares of the Company’s stock with a fair value of $277 which vested immediately to the directors. During the year ended December 31, 2014, the Company issued 35,555 shares of the Company’s stock with a fair value of $277 which vested immediately to the directors. During the year ended December 31, 2013, the Company issued 38,812 shares of the Company’s stock with a fair value of $307 which vested immediately to the Directors.
Employee Withholding Taxes on Stock Awards
For ease in administering the issuance of stock awards, the Company holds back shares of vested restricted stock awards and short-term incentive plan stock awards for the value of the statutory withholding taxes. For each individual receiving a share award, the Company redeems the shares it computes as the value for the withholding tax and remits this amount to the appropriate tax authority. For withholding taxes related to stock awards, the Company paid $0.4 million during the year ended December 31, 2015, and $1.0 million during the years ended December 31, 2014 and 2013.
11. Stock Repurchases
All share repurchase programs are authorized by the Company’s Board of Directors and are announced publicly. On March 18, 2013, the Board of Directors approved a share repurchase program of $5.0 million. On May 6, 2014, the Board of Directors extended this stock buyback program through September 2014. On November 13, 2014, the Board of Directors approved a share repurchase program of up to 926,000 of the Company’s outstanding shares that will expire on the earlier of the date that the total shares are
63
Table of Contents
repurchased or November 13, 2016. On April 20, 2015, the Board of Directors authorized an increase to the share repurchase program to purchase another 500,000 shares of stock. Additionally, on August 10, 2015, the Board of Directors authorized another increase to the share repurchase program to purchase an additional 1,300,000 shares, for a total of 2,726,000 shares. The Company repurchased 1,942,788 shares at an average price of $6.22 during the year ended December 31, 2015. At December 31, 2015, the Company had 783,212 shares that could still be repurchased under these programs.
The following table is a summary of the share repurchases for the years ended December 31st:
| Year |
Shares | Amount | Avg price per Share |
|||||||||
| 2013 |
59,510 | $ | 435 | $ | 7.31 | |||||||
| 2014 |
215,650 | $ | 1,651 | $ | 7.66 | |||||||
| 2015 |
1,942,788 | $ | 12,079 | $ | 6.22 | |||||||
| 12. | Segment, Customer and Geographic Information |
PCTEL operates in two segments for reporting purposes. The Company’s Connected Solutions segment includes its antenna and engineered site solutions. Its RF Solutions segment includes its scanning receivers and RF engineering services. Each of the segments has its own segment manager as well as its own engineering, sales and marketing, and operational general and administrative functions. All of the Company’s accounting and finance, human resources, IT and legal functions are provided on a centralized basis through the corporate function. The Company manages its balance sheet and cash flows centrally at the corporate level, with the exception of trade accounts receivable and inventory which is managed at the segment level. Each of the segment managers reports to and maintains regular contact with the chief operating decision maker to discuss operating activities, financial results, forecasts, or plans for the segment. The Company’s chief operating decision maker uses the profit and loss results through operating profit and identified assets for Connected Solutions and RF Solutions segments to make operating decisions.
The following tables are the segment operating profits and cash flow information for the year ended December 31, 2015 and December 31, 2014, respectively, and the segment balance sheet information as of December 31, 2015 and December 31, 2014:
| Year Ended December 31, 2015 | ||||||||||||||||
| Connected Solutions |
RF Solutions | Corporate | Total | |||||||||||||
| REVENUES |
$ | 69,579 | $ | 37,255 | ($ | 219 | ) | $ | 106,615 | |||||||
|
|
|
|
|
|
|
|
|
|||||||||
| GROSS PROFIT |
20,426 | 16,803 | 32 | 37,261 | ||||||||||||
|
|
|
|
|
|
|
|
|
|||||||||
| OPERATING INCOME (LOSS) |
$ | 5,040 | ($ | 298 | ) | ($ | 10,498 | ) | ($ | 5,756 | ) | |||||
|
|
|
|
|
|
|
|
|
|||||||||
| Depreciation |
$ | 1,706 | $ | 1,108 | $ | 271 | $ | 3,085 | ||||||||
| Intangible amortization |
$ | 811 | $ | 2,615 | $ | 0 | $ | 3,426 | ||||||||
| Capital expenditures |
$ | 954 | $ | 997 | $ | 151 | $ | 2,102 | ||||||||
| As of December 31, 2015 | ||||||||||||||||
| Connected Solutions |
RF Solutions | Corporate | Total | |||||||||||||
| Accounts receivable |
$ | 12,875 | $ | 8,126 | $ | 0 | $ | 21,001 | ||||||||
| Inventories |
$ | 15,507 | $ | 2,089 | $ | 0 | $ | 17,596 | ||||||||
| Long-lived assets: |
||||||||||||||||
| Property and equipment, net |
$ | 10,250 | $ | 2,985 | $ | 604 | $ | 13,839 | ||||||||
| Goodwill |
$ | 0 | $ | 3,332 | $ | 0 | $ | 3,332 | ||||||||
| Intangible assets, net |
$ | 425 | $ | 10,953 | $ | 0 | $ | 11,378 | ||||||||
| Deferred tax assets, net |
$ | 0 | $ | 0 | $ | 13,155 | $ | 13,155 | ||||||||
| Other noncurrent assets |
$ | 0 | $ | 0 | $ | 40 | $ | 40 | ||||||||
64
Table of Contents
| Year Ended December 31, 2014 | ||||||||||||||||
| Connected Solutions |
RF Solutions | Corporate | Total | |||||||||||||
| REVENUES |
$ | 72,333 | $ | 35,113 | ($ | 282 | ) | $ | 107,164 | |||||||
|
|
|
|
|
|
|
|
|
|||||||||
| GROSS PROFIT |
22,818 | 20,743 | 26 | 43,587 | ||||||||||||
|
|
|
|
|
|
|
|
|
|||||||||
| OPERATING INCOME (LOSS) |
$ | 7,357 | $ | 7,333 | ($ | 10,586 | ) | $ | 4,104 | |||||||
|
|
|
|
|
|
|
|
|
|||||||||
| Depreciation |
$ | 1,700 | $ | 795 | $ | 344 | $ | 2,839 | ||||||||
| Intangible amortization |
$ | 1,151 | $ | 816 | $ | 0 | $ | 1,967 | ||||||||
| Capital expenditures |
$ | 1,173 | $ | 1,328 | $ | 41 | $ | 2,542 | ||||||||
| As of December 31, 2014 | ||||||||||||||||
| Connected Solutions |
RF Solutions | Corporate | Total | |||||||||||||
| Accounts receivable |
$ | 15,947 | $ | 7,927 | $ | 0 | $ | 23,874 | ||||||||
| Inventories |
$ | 14,172 | $ | 2,186 | $ | 0 | $ | 16,358 | ||||||||
| Long-lived assets: |
||||||||||||||||
| Property and equipment, net |
$ | 11,124 | $ | 2,987 | $ | 731 | $ | 14,842 | ||||||||
| Goodwill |
$ | 0 | $ | 161 | $ | 0 | $ | 161 | ||||||||
| Intangible assets, net |
$ | 1,681 | $ | 956 | $ | 0 | $ | 2,637 | ||||||||
| Deferred tax assets, net |
$ | 0 | $ | 0 | $ | 9,710 | $ | 9,710 | ||||||||
| Other noncurrent assets |
$ | 0 | $ | 0 | $ | 40 | $ | 40 | ||||||||
| Year Ended December 31, 2013 | ||||||||||||||||
| Connected Solutions |
RF Solutions | Corporate | Total | |||||||||||||
| REVENUES |
$ | 74,223 | $ | 30,310 | ($ | 280 | ) | $ | 104,253 | |||||||
|
|
|
|
|
|
|
|
|
|||||||||
| GROSS PROFIT |
22,720 | 19,018 | 22 | 41,760 | ||||||||||||
|
|
|
|
|
|
|
|
|
|||||||||
| OPERATING INCOME (LOSS) |
$ | 6,012 | $ | 7,248 | ($ | 12,964 | ) | $ | 296 | |||||||
|
|
|
|
|
|
|
|
|
|||||||||
| Depreciation |
$ | 1,785 | $ | 570 | $ | 315 | $ | 2,670 | ||||||||
| Intangible amortization |
$ | 1,573 | $ | 827 | $ | 0 | $ | 2,400 | ||||||||
| Capital expenditures |
$ | 1,505 | $ | 1,251 | $ | 203 | $ | 2,959 | ||||||||
The Company’s revenues attributable to products and services are as follows:
| Years Ended December 31, | ||||||||||||
| 2015 | 2014 | 2013 | ||||||||||
| Revenues: |
||||||||||||
| Products |
$ | 90,337 | $ | 96,346 | $ | 97,722 | ||||||
| Services |
16,278 | 10,818 | 6,531 | |||||||||
|
|
|
|
|
|
|
|||||||
| Total revenues |
$ | 106,615 | $ | 107,164 | $ | 104,253 | ||||||
|
|
|
|
|
|
|
|||||||
| Years Ended December 31, | ||||||||||||
| 2015 | 2014 | 2013 | ||||||||||
| Cost of revenues: |
||||||||||||
| Products |
$ | 54,561 | $ | 55,813 | $ | 57,387 | ||||||
| Services |
14,793 | 7,764 | 5,106 | |||||||||
|
|
|
|
|
|
|
|||||||
| Total cost of revenues |
$ | 69,354 | $ | 63,577 | $ | 62,493 | ||||||
|
|
|
|
|
|
|
|||||||
The Company’s revenue to customers by geographic location, as a percent of total revenues, is as follows:
| Years Ended December 31, | ||||||||||||
| Region |
2015 | 2014 | 2013 | |||||||||
| Europe, Middle East, & Africa |
10 | % | 11 | % | 13 | % | ||||||
| Asia Pacific |
9 | % | 11 | % | 10 | % | ||||||
| Other Americas |
6 | % | 5 | % | 6 | % | ||||||
|
|
|
|
|
|
|
|||||||
| Total Foreign sales |
25 | % | 27 | % | 29 | % | ||||||
|
|
|
|
|
|
|
|||||||
| Total Domestic sales |
75 | % | 73 | % | 71 | % | ||||||
|
|
|
|
|
|
|
|||||||
| 100 | % | 100 | % | 100 | % | |||||||
|
|
|
|
|
|
|
|||||||
65
Table of Contents
There were no customers that accounted for 10% or greater of revenues during the years ended December 31, 2015 and December 31, 2014. At December 31, 2015 and 2014, no customer accounts receivable balance represented 10% or greater of gross receivable.
The long-lived assets by geographic region are as follows:
| December 31, | ||||||||||||
| 2015 | 2014 | 2013 | ||||||||||
| United States |
$ | 23,741 | $ | 26,436 | $ | 30,682 | ||||||
| All Other |
994 | 954 | 922 | |||||||||
|
|
|
|
|
|
|
|||||||
| $ | 24,735 | $ | 27,390 | $ | 31,604 | |||||||
|
|
|
|
|
|
|
|||||||
| 13. | Benefit Plans |
The Company’s 401(k) plan covers all of the U.S. employees beginning the first of the month following the first month of their employment. Under this plan, employees may elect to contribute up to 15% of their current compensation to the 401(k) plan up to the statutorily prescribed annual limit. The Company may make discretionary contributions to the 401(k) plan. For the year ended December 31, 2015, contributions of $55 was related to employees from the acquisition of the business from Nexgen. The Company also contributes to various defined contribution retirement plans for foreign employees.
The Company’s contributions to retirement plans were as follows:
| Year Ended December 31, | ||||||||||||
| 2015 | 2014 | 2013 | ||||||||||
| PCTEL, Inc. 401(k) Profit sharing Plan - US employees |
$ | 757 | $ | 666 | $ | 584 | ||||||
| Defined contribution plans - foreign employees |
345 | 332 | 259 | |||||||||
|
|
|
|
|
|
|
|||||||
| Total |
$ | 1,102 | $ | 998 | $ | 843 | ||||||
|
|
|
|
|
|
|
|||||||
Executive Deferred Compensation Plan
Through December 2013, the Company provided an Executive Deferred Compensation Plan (“EDCP”) for executive officers, senior managers and directors. Under the EDCP, the executives could select to defer up to 50% of salary and up to 100% of cash bonuses. In addition, the Company provided a 4% matching cash contribution which vests depending upon the number of completed years of participation in the EDCP. The Company funded the obligation related to the EDCP with corporate-owned life insurance policies. The executive had a choice of investment alternatives from a menu of mutual funds offered by the insurance company. In November 2012, the Company’s Board of Directors authorized the termination of the EDCP and on December 27, 2013, the plan was terminated. The funds at the life insurance company were remitted to the Company and subsequently invested by the Company to fund the obligation.
At December 31, 2014, the value of the Company’s investment account to fund EDCP obligations was $2.1 million, included in cash equivalents and short-term investments in the consolidated balance sheets. The funds from the insurance company were received by the Company in January 2014 following the termination of the plan in December 2013. As such, $1.9 million was included in prepaid assets and other receivables on the balance sheet at December 31, 2013. At December 31, 2014 the deferred compensation obligation was $2.0 million, included in accrued liabilities in the consolidated balance sheets. Each participant received the value of his or her account in January 2015.
66
Table of Contents
14. Quarterly Data (Unaudited)
| Quarters Ended, | ||||||||||||||||
| March 31, 2015 |
June 30, 2015 |
September 30, 2015 |
December 31, 2015 |
|||||||||||||
| Revenues |
$ | 26,326 | $ | 27,625 | $ | 26,526 | $ | 26,138 | ||||||||
| Gross profit |
10,169 | 9,350 | 8,463 | 9,279 | ||||||||||||
| Operating loss |
(96 | ) | (1,665 | ) | (2,221 | ) | (1,774 | ) | ||||||||
| (Loss) Income before income taxes |
(52 | ) | 540 | (1,687 | ) | (1,270 | ) | |||||||||
|
|
|
|
|
|
|
|
|
|||||||||
| Net (loss) income |
($ | 33 | ) | $ | 347 | ($ | 1,062 | ) | ($ | 820 | ) | |||||
|
|
|
|
|
|
|
|
|
|||||||||
| (Loss) Earnings per Share: |
||||||||||||||||
| Basic |
$ | 0.00 | $ | 0.02 | ($ | 0.06 | ) | ($ | 0.05 | ) | ||||||
| Diluted |
$ | 0.00 | $ | 0.02 | ($ | 0.06 | ) | ($ | 0.05 | ) | ||||||
| Weighted Average Shares: |
||||||||||||||||
| Basic |
18,312 | 18,257 | 17,626 | 16,820 | ||||||||||||
| Diluted |
18,312 | 18,408 | 17,626 | 16,820 | ||||||||||||
| Quarters Ended, | ||||||||||||||||
| March 31, 2014 |
June 30, 2014 |
September 30, 2014 |
December 31, 2014 |
|||||||||||||
| Revenues |
$ | 23,656 | $ | 26,181 | $ | 27,932 | $ | 29,395 | ||||||||
| Gross profit |
9,582 | 10,850 | 11,394 | 11,761 | ||||||||||||
| Operating (loss) income |
(422 | ) | 545 | 2,096 | 1,885 | |||||||||||
| (Loss) Income before income taxes |
(225 | ) | 879 | 2,304 | 2,812 | |||||||||||
|
|
|
|
|
|
|
|
|
|||||||||
| Net (loss) income |
($ | 146 | ) | $ | 545 | $ | 2,218 | $ | 1,995 | |||||||
|
|
|
|
|
|
|
|
|
|||||||||
| (Loss) Earnings per Share: |
||||||||||||||||
| Basic |
($ | 0.01 | ) | $ | 0.03 | $ | 0.12 | $ | 0.11 | |||||||
| Diluted |
($ | 0.01 | ) | $ | 0.03 | $ | 0.12 | $ | 0.11 | |||||||
| Weighted Average Shares: |
||||||||||||||||
| Basic |
18,176 | 18,165 | 18,112 | 18,154 | ||||||||||||
| Diluted |
18,176 | 18,291 | 18,271 | 18,412 | ||||||||||||
The quarterly information for 2015 includes reclassifications between cost of revenues and operating expenses for intangible amortization. The Company reclassified $20 from operating expense to cost of revenues for the quarter ended March 31, 2015, reclassified $0.2 million from operating expenses to cost of revenues for the quarters ended June 30, 2015 and September 30, 2015, respectively, and reclassified $0.4 million from cost of revenues to operating expenses for the quarter ended December 31, 2015.
15. Related Parties
Commencing July 9, 2012 through October 2013, the Company’s lease for its Lexington, North Carolina facility was with Scronce Real Estate LLC. Scronce Real Estate, LLC is owned by Tim and Brenda Scronce, the wife of Tim Scronce. Tim and/or Brenda Scronce were the majority owners of the TelWorx entities as defined in Note 8 – Commitments and Contingencies above. The Company, through its wholly owned subsidiary PCTelWorx, Inc. (“PCTelWorx”), purchased certain of the assets of TelWorx in July 2012. Tim Scronce worked for the Company until his resignation in December 2012 and Brenda Scronce never worked for the Company. In May 2013, the Company gave notice of early termination of the lease which became effective October 31, 2013. The Company signed a new lease for an office facility in Lexington effective August 1, 2013. The new lease is not with a related party.
Through October 2013, the Company’s lease for its Melbourne, Florida office was with 3dB, LLC, a real estate entity co-owned by Robert Joslin, Scott Clay, and Greg Akin. As co-owners of Envision Wireless, Joslin, Clay and Akin sold the assets of Envision Wireless to the Company in October 2011. Joslin, Clay, and Akin continue to work for the Company. This lease expired October 31, 2013. In September 2013, the Company signed a five-year lease for new office space in Melbourne, Florida. The new lease is not with a related party.
67
Table of Contents
The Company leased its Pryor, Oklahoma facility from American Tradition Custom Steel LLC, of which Aaron Jarvis is a member. Mr. Jarvis was the operations manager for the Company’s mobile tower business. Mr. Jarvis was separated from employment with the Company in September 2015, and the lease terminated on October 31, 2015. Effective October, 2015, Mr. Jarvis provides warranty support as a contractor for the mobile towers product line.
16. Accumulated Other Comprehensive Income
Accumulated other comprehensive income (loss) of ($15) and $135 at December 31, 2015 and December 31, 2014, respectively, consists of foreign currency translation adjustments.
17. Subsequent Events
The Company evaluates subsequent events occurring between the most recent balance sheet date and the date that the financial statements are available to be issued in order to determine whether the subsequent events are to be recorded and/or disclosed in the Company’s financial statements and footnotes. The financial statements are considered to be available to be issued at the time that they are filed with the SEC. Except as described below, there were no other subsequent events or transactions that required recognition or disclosure in the consolidated financial statements.
Restructuring
Through March 10, 2015, the Company eliminated the positions of 16 employees to reduce costs in RF Solutions. The Company also exercised its option to terminate its Schaumburg lease as of August 31, 2016. The Company paid a termination fee of $57. With the termination, lease obligations will decline by $0.3 million. The employees in the Company’s Schaumburg office will be relocated to the Bloomingdale office.
Stock Repurchases
The Company repurchased 783,212 shares at an average price of $5.23 during the three months ended March 31, 2016. As of March 10, 2015, there were no additional shares yet to be purchased under publicly announced share repurchase programs.
Item 9: Changes in and Disagreements with Accountants on Accounting and Financial Disclosure.
None.
| Item 9A: | Controls and Procedures |
(a) Evaluation of Disclosure Controls and Procedures
Our management evaluated, with the participation of our Chief Executive Officer and our Chief Financial Officer, the effectiveness of our disclosure controls and procedures as defined by Rule 13a-15(e) of the Securities Exchange Act of 1934, as of the end of the period covered by this Annual Report on Form 10-K. Based on this evaluation, our Chief Executive Officer and our Chief Financial Officer have concluded that our disclosure controls and procedures are effective to ensure that information we are required to disclose in our reports that we file or submit under Securities Exchange Act of 1934 (i) is recorded, processed, summarized, and reported within the time periods specified in SEC rules and forms, and (ii) is accumulated and communicated to our management, including our Chief Executive Officer and our Chief Financial Officer, as appropriate to allow timely decisions regarding required disclosure.
(b) Management’s Report on Internal Control Over Financial Reporting
Our management is responsible for establishing and maintaining adequate internal control over financial reporting as defined in Rules 13a-15(f) and 15d-15(f) under the Securities Exchange Act of 1934. Our internal control over financial reporting is a process designed by, or under the supervision of, our principal executive and principal financial officers, or persons performing similar functions, and effected by our board of directors, management, and other personnel, to provide reasonable assurance regarding the reliability of financial reporting and the preparation of financial statements for external purposes in accordance with generally accepted accounting principles (GAAP) and includes those policies and procedures that:
| • | pertain to the maintenance of records that in reasonable detail accurately and fairly reflect the transactions and dispositions of the assets of PCTEL; |
68
Table of Contents
| • | provide reasonable assurance that transactions are recorded as necessary to permit preparation of financial statements in accordance with GAAP, and that receipts and expenditures of PCTEL are being made only in accordance with authorizations of management and directors of PCTEL; and |
| • | provide reasonable assurance regarding prevention or timely detection of unauthorized acquisition, use, or disposition of PCTEL’s assets that could have a material effect on the financial statements. |
Our management has assessed the effectiveness of our internal control over financial reporting as of December 31, 2015. In making its assessment of internal control over financial reporting, management used the criteria described in “2013 Internal Control – Integrated Framework” issued by the Committee of Sponsoring Organizations of the Treadway Commission (COSO).
Based on our management’s assessment of internal control over financial reporting, management has concluded that, as of December 31, 2015, our internal control over financial reporting was effective to provide assurance regarding the reliability of financial reporting and the preparation of financial statements for external purposes in accordance with generally accepted accounting principles.
Grant Thornton LLP, our independent registered public accounting firm, has audited and issued their report on our internal control over reporting, which is included herein.
(c) Changes in Internal Control Over Financial Reporting
There have been no changes in our internal control over financial reporting during the most recently completed fiscal quarter that have materially affected, or are likely to materially affect, our internal control over financial reporting.
| Item 9B: | Other Information |
None.
PART III
| Item 10: | Directors, Executive Officers and Corporate Governance |
The information with respect to the directors and the board committees of the Company required to be included pursuant to this Item 10 is included in PCTEL’s proxy statement for the 2016 Annual Meeting of Stockholders which will be filed with the SEC pursuant to Rule 14a-6 under the Exchange Act in accordance with applicable SEC deadlines, and is incorporated in this Item 10 by reference.
The information regarding executive and director compensation in response to this item will be included in PCTEL’s proxy statement for the 2016 Annual Meeting of Stockholders and incorporated by reference herein. Information included under the caption “Compensation Committee Report” in PCTEL’s proxy statement for the 2016 Annual Meeting of Stockholders is incorporated by reference herein; however, this information shall not be deemed to be “soliciting material” or to be filed with the Securities and Exchange Commission or subject to Regulation 14A or 14C, or the liabilities of Section 18 of the Securities Exchange Act of 1934.
| Item 11: | Executive Compensation |
The information required by Item 402, 407(e)(4) and Item 407(e)(5) of Regulation S-K will be included under the captions “Compensation Discussion and Analysis,” “Executive Compensation and Other Matters,” “Compensation Committee Interlocks and Insider Participation,” and “Compensation Committee Report,” respectively, in PCTEL’s proxy statement for the 2016 Annual Meeting of Stockholders and is incorporated by reference herein.
| Item 12: | Security Ownership of Certain Beneficial Owners and Management and Related Stockholder Matters |
The information regarding security ownership will be included under the caption “Security Ownership of Certain Beneficial Owners and Management” in PCTEL’s proxy statement for the 2016 Annual Meeting of Stockholders and is incorporated by reference herein.
The information regarding securities authorized for issuance under equity compensation plans is included under the caption “Equity Compensation Plan Information” in PCTEL’s proxy statement for the 2016 Annual Meeting of Stockholders and is incorporated by reference herein.
69
Table of Contents
| Item 13: | Certain Relationships and Related Transactions, and Director Independence |
The information required by this item is incorporated by reference to the sections entitled “Certain Relationships and Related Transactions” and “Corporate Governance” which will be contained in PCTEL’s proxy statement for the 2016 Annual Meeting of Stockholders and is incorporated by reference herein.
| Item 14: | Principal Accountant Fees and Services |
Information regarding principal accounting fees and services is under the caption “Summary of Fees” in PCTEL’s proxy statement for the 2016 Annual Meeting of Stockholders and is incorporated by reference herein.
PART IV
| Item 15: | Exhibits and Financial Statement Schedules |
(a) (1) Financial Statements
The Consolidated Financial Statements are included in Part II, Item 8 of this Annual Report on Form 10-K on pages 28 to 68.
(a) (2) Financial Statement Schedules
The following financial statement schedule is filed as a part of this Report under “Schedule II” immediately preceding the signature page: Schedule II — Valuation and Qualifying Accounts for the three fiscal years ended December 31, 2015.
All other information called for this Item are omitted because they are inapplicable or the required information is shown in the financial statements, or notes thereto, included herein.
PCTEL, INC.
SCHEDULE II — VALUATION AND QUALIFYING ACCOUNTS
(in thousands)
| Balance at Beginning of Year |
Charged to Costs and Expenses |
Addition (Deductions) |
Balance at End of Year |
|||||||||||||
| Year Ended December 31, 2013: |
||||||||||||||||
| Allowance for doubtful accounts |
$ | 222 | 130 | (222 | ) | $ | 130 | |||||||||
| Warranty reserves |
$ | 270 | 192 | (157 | ) | $ | 305 | |||||||||
| Deferred tax asset valuation allowance |
$ | 662 | (22 | ) | 0 | $ | 640 | |||||||||
| Year Ended December 31, 2014: |
||||||||||||||||
| Allowance for doubtful accounts |
$ | 130 | 48 | (57 | ) | $ | 121 | |||||||||
| Warranty reserves |
$ | 305 | 124 | (125 | ) | $ | 304 | |||||||||
| Deferred tax asset valuation allowance |
$ | 640 | (7 | ) | 0 | $ | 633 | |||||||||
| Year Ended December 31, 2015: |
||||||||||||||||
| Allowance for doubtful accounts |
$ | 121 | 205 | (12 | ) | $ | 314 | |||||||||
| Warranty reserves |
$ | 304 | 60 | (16 | ) | $ | 348 | |||||||||
| Deferred tax asset valuation allowance |
$ | 633 | 26 | 0 | $ | 659 | ||||||||||
All other schedules called for by Form 10-K are omitted because they are inapplicable or the required information is shown in the financial statements, or notes thereto, included herein.
70
Table of Contents
a) (3) Exhibits (numbered in accordance with Item 601 of Regulation S-K)
The exhibits listed in the accompanying index to exhibits are filed or incorporated by reference as part of this Annual Report on Form 10-K. We will furnish at no cost a copy of any exhibit filed with or incorporated by reference into this Annual Report on Form 10-K. Oral or written requests for copies of any exhibits should be directed to us, Attn: Corporate Secretary.
71
Table of Contents
| Description |
Reference | |||||
| 2.5 | Acquisition Agreement (Asset Purchase Agreement) dated July 9, 2012, by and among PCTEL, TelWorx Communications, LLC, and other parties. | Incorporated by reference to exhibit number 2.1 filed with the Registrant’s Current Report on Form 8-K filed July 13, 2012. | ||||
| 2.6 | Amendment to Asset Purchase Agreement, dated March 27, 2013, by and among the PCTEL, PCTelWorx, Enterprises, LLC f/k/a TelWorx Communications, LLC and the other parties thereto. | Incorporated by reference to exhibit number 10.1 filed with the Registrant’s Current Report on Form 8-K dated March 27, 2013. | ||||
| 2.7 | Asset Purchase Agreement dated April 30, 2013, by and among the Company, PCTEL Secure LLC and Redwall Technologies, LLC 1 | Incorporated by reference to exhibit number 2.1 filed with the Registrant’s Current Report on Form 8-K/A filed May 24, 2013. | ||||
| 2.8 | Asset Purchase Agreement dated February 27, 2015, by and among the Company, Nexgen Wireless, Inc. and other parties thereto. | Incorporated by reference to exhibit number 2.1 filed with the Registrant’s Current Report on Form 8-K filed March 4, 2015. | ||||
| 2.9 | Amendment to Asset Purchase Agreement entered into as of May 5, 2015 by among, PCTEL, Inc., Nexgen Wireless, Inc., and the principals of Nexgen. | Incorporated by reference to exhibit number 2.1 filed with the Registrant’s Quarterly Report on Form 10-Q filed May 11, 2015. | ||||
| 3.1 | Amended and Restated Certificate of Incorporation of PCTEL, Inc. | Incorporated by reference to exhibit number 3.2 filed with the Registrant’s Registration Statement on Form S-1 (File No. 333-84707). | ||||
| 3.2 | Amended and Restated Bylaws of the Registrant | Incorporated by reference to exhibit number 3.3 filed with the Registrant’s Annual Report on Form 10-K for fiscal year ended December 31, 2001. | ||||
| 4.1 | Specimen common stock certificate | Incorporated by reference to the exhibit bearing the same number filed with the Registrant’s Registration Statement on Form S-1 (File No. 333-84707). | ||||
| 10.1 | * | Form of Indemnification Agreement between PCTEL, Inc. and each of its directors and officers | Incorporated by reference to the exhibit bearing the same number filed with the Registrant’s Registration Statement on Form S-1 (File No. 333-84707). | |||
| 10.23 | * | 2001 Nonstatutory Stock Option Plan and form of agreements hereunder | Incorporated by reference herein to the Registrant’s Registration Statement of Form S-8 filed on October 3, 2001 (File No. 333-70886). | |||
| 10.25 | * | Employment Agreement between Jeffrey A. Miller and PCTEL, Inc., dated November 7, 2001 | Incorporated by reference to the exhibit bearing the same number filed with the Registrant’s Annual Report on Form 10-K for fiscal year ended December 31, 2001. | |||
| 10.25.1 | * | Letter agreement dated August 22, 2006 amending the Employment Agreement, by and between PCTEL, Inc. and Jeffrey A. Miller | Incorporated by reference to the exhibit bearing the same number filed with the Registrant’s Quarterly Report on Form 10-Q for the quarter ended September 30, 2006. | |||
| 10.26 | * | Employment Agreement between John Schoen and the Registrant, dated November 12, 2001 | Incorporated by reference to the exhibit bearing the same number filed with the Registrant’s Annual Report on Form 10-K for fiscal year ended December 31, 2001. | |||
| 10.26.1 | * | Letter agreement dated August 22, 2006 amending the Employment Agreement, by, and between PCTEL, Inc. and John Schoen | Incorporated by reference to the exhibit bearing the same number filed with the Registrant’s Quarterly Report on Form 10-Q for the quarter ended September 30, 2006. | |||
| 10.32 | * | Stock Option Agreement of Jeffrey A. Miller, dated November 15, 2001 | Incorporated by reference herein to the Registrant’s Registration Statement of Form S-8 filed on December 14, 2001 (File No. 333-75204). | |||
| 10.33 | * | Stock Option Agreement of John Schoen, dated November 15, 2001 | Incorporated by reference herein to the Registrant’s Registration Statement of Form S-8 filed on December 14, 2001 (File No. 333-75204). | |||
| 10.37 | * | Executive Deferred Compensation Plan | Incorporated by reference to the exhibit bearing the same number filed with the Registrant’s Annual Report on Form 10-K for the fiscal year ended December 31, 2002. | |||
| 10.38 | * | Executive Deferred Stock Plan | Incorporated by reference to the exhibit bearing the same number filed with the Registrant’s Annual Report on Form 10-K for the fiscal year ended December 31, 2002. | |||
| 10.39 | * | Board of Directors Deferred Compensation Plan | Incorporated by reference to the exhibit bearing the same number filed with the Registrant’s Quarterly Report on Form 10-Q for the quarter ended June 30, 2003. | |||
| 10.40 | * | Board of Directors Deferred Stock Plan | Incorporated by reference to the exhibit bearing the same number filed with the Registrant’s Quarterly Report on Form 10-Q for the quarter ended June 30, 2003. | |||
| 10.50 | Lease Agreement dated September 16, 2005 between PCTEL Maryland, Inc. and First Campus Limited Partnership for an office building located at 20410 Observation Drive, Germantown, MD 20876 | Incorporated by reference to the exhibit bearing the same number filed with the Registrant’s Current Report on Form 10-Q for the quarter ended September 30, 2005 | ||||
| 10.59 | * | 1998 Employee Stock Purchase Plan and related standard form of agreement | Incorporated by reference to the exhibit bearing the same number filed with the Registrant’s Current Report on Form 8-K filed on June 21, 2007. | |||
| 10.60 | * | Executive Compensation Plan | Incorporated by reference to the exhibit bearing the same number filed with the Registrant’s Current Report on Form 8-K filed on June 21, 2007. | |||
| 10.61 | * | Employment Agreement dated September 5, 2007 between PCTEL, Inc., and Martin H. Singer | Incorporated by reference to the exhibit bearing the same number filed with the Registrant’s Current Report on Form 8-K filed on September 10, 2007. | |||
| 10.62 | * | Management Retention Agreement dated September 5, 2007 between PCTEL, Inc., and Martin H. Singer | Incorporated by reference to the exhibit bearing the same number filed with the Registrant’s Current Report on Form 8-K filed on September 10, 2007. | |||
| 10.63 | * | Form of Performance Share Agreement | Incorporated by reference to the exhibit bearing the same number filed with the Registrant’s Current Report on Form 8-K filed on September 10, 2007. | |||
| 10.64 | * | Form of Amended and Restated Management Retention Agreement | Incorporated by reference to the exhibit bearing the same number filed with the Registrant’s Current Report on Form 8-K filed on October 12, 2007. | |||
| 10.66 | * | Form of 1997 Stock Plan Performance Share Agreement | Incorporated by reference to the exhibit bearing the same number filed with the Registrant’s Quarterly Report on Form 10-Q for the quarter ended March 31, 2008. | |||
| 10.68 | * | PCTEL, Inc., Stock Plan, as amended and restated July 20, 2015 | Incorporated by reference to the Exhibit 10.1 of the Registrants Registration Statement on Form S-8 filed on July 20, 2015 | |||
| 10.69 | * | PCTEL, Inc., 1997 Stock Plan Form of Stock Option Award Agreement, as amended September 18, 2008 | Incorporated by reference to the exhibit bearing the same number filed with the Registrant’s Current Report on Form 8-K filed on September 22, 2008. | |||
| 10.70 | * | PCTEL, Inc., 2001 Nonstatutory Stock Option Plan, as amended November 7, 2008 | Incorporated by reference to the exhibit bearing the same number filed with the Registrant’s Current Report on Form 8-K filed on November 13, 2008. | |||
| 10.71 | * | PCTEL, Inc, 2001 Nonstatutory Stock Option Plan Form of Stock Option Agreement, as amended November 7, 2008 | Incorporated by reference to the exhibit bearing the same number filed with the Registrant’s Current Report on Form 8-K filed on November 13, 2008. | |||
| 10.72 | * | PCTEL, Inc, 1997 Stock Plan, as amended and restated June 15, 2010 | Incorporated by reference to the exhibit bearing the same number filed with the Registrant’s Current Report on Form 8-K filed on June 21, 2010. | |||
| 10.73 | Limited Liability Company Agreement, dated January 5, 2011, by and between PCTEL, Inc. and Eclipse Design Technologies, Inc. | Incorporated by reference to the exhibit bearing the same number filed with the Registrant’s Current Report on Form 8-K filed on January 11, 2011. | ||||
| 10.74 | * | Letter agreement dated April 12, 2011 between PCTEL, Inc. and Anthony Kobrinetz covering severance benefits | Incorporated by reference to the exhibit bearing the same number filed with the Registrant’s Current Report on Form 8-K filed on April 14, 2011. | |||
| 10.75 | Amended and restated Limited Liability Company Agreement, dated January 5, 2011, by and between PCTEL, Inc. and Eclipse Design Technologies, Inc. | Incorporated by reference to the exhibit bearing the same number filed with the Registrant’s Current Report on Form 8-K filed on May 24, 2011. | ||||
| 10.76 | * | Letter Agreement dated September 24, 2013 between PCTEL, Inc. and David Neumann granting severance benefits and Letter Agreement dated September 30, 2013 between PCTEL, Inc. and Varda A. Goldman amending severance benefits granted in a letter agreement dated December 11, 2008. | Incorporated by reference to the exhibit bearing the same number filed with the Registrant’s Current Report on Form 8-K filed on September 30, 2013. | |||
| 11 | ** | Statement re Computation of Per Share Earnings | ||||
| 21.1 | List of significant subsidiaries | Filed herewith | ||||
| 23.1 | Consent of Grant Thornton LLP | Filed herewith | ||||
| 31.1 | Certification of Principal Executive Officer pursuant to Exchange Act Rules 13a-14(a) and 15(d)-14(a), as adopted pursuant to Section 302 of Sarbanes-Oxley Act of 2002 | Filed herewith | ||||
| 31.2 | Certification of Principal Financial Officer pursuant to Exchange Act Rules 13a-14(a) and 15(d)-14(a), as adopted pursuant to Section 302 of Sarbanes-Oxley Act of 2002 | Filed herewith | ||||
| 32.1*** | Certifications of Principal Executive Officer and Principal Financial Officer pursuant to 18 U.S.C. Section 1350 as adopted pursuant to Section 906 of Sarbanes-Oxley Act of 2002. | |||||
| 101.INS | XBRL Instance Document | Filed herewith | ||||
| 101.SCH | XBRL Taxonomy Extension Schema | Filed herewith | ||||
| 101.CAL | XBRL Taxonomy Extension Calculation Linkbase | Filed herewith | ||||
| 101.DEF | XBRL Taxonomy Extension Definition Linkbase | Filed herewith | ||||
| 101.LAB | XBRL Taxonomy Extension Label Linkbase | Filed herewith | ||||
| 101.PRE | XBRL Taxonomy Extension Presentation Linkbase | Filed herewith | ||||
| * | Management contract or compensatory plan or arrangement required to be filed as an exhibit hereto. |
| ** | Information required to be presented in exhibit 11 is provided in Note 2 of the notes to consolidated financial statements in this Annual Report on Form 10-K in accordance with accounting rules related to accounting for earnings per share. |
| *** | Furnished herewith |
72
Table of Contents
Pursuant to the requirements of Section 13 or 15(d) of the Securities Exchange Act of 1934, as amended, the Registrant has duly caused this report to be signed on its behalf by the undersigned, thereunto duly authorized:
| PCTEL, Inc. |
| A Delaware corporation |
| (Registrant) |
| /s/ MARTIN H. SINGER |
| Martin H. Singer |
| Chairman of the Board and Chief Executive Officer |
| Dated: March 15, 2016 |
73
Table of Contents
KNOW ALL PERSONS BY THESE PRESENTS, that each person whose signature appears below constitutes and appoints Martin H. Singer and John Schoen, and each of them, his true and lawful attorneys-in-fact and agents, each with full power of substitution and re-substitution, to sign any and all amendments (including post-effective amendments) to this Annual Report on Form 10-K and to file the same, with all exhibits thereto and other documents in connection therewith, with the Securities and Exchange Commission, granting unto said attorneys-in-fact and agents, and each of them, full power and authority to do and perform each and every act and thing requisite and necessary to be done in connection therewith, as fully to all intents and purposes as he or she might or could do in person, hereby ratifying and confirming all that said attorneys-in-fact and agents, or their substitute or substitutes, or any of them, shall do or cause to be done by virtue hereof.
Pursuant to the requirements of the Securities Exchange Act of 1934, this report has been signed below by the following persons on behalf of the Registrant and in the capacities and on the dates indicated.
| Signature |
Title |
Date | ||
| /s/ MARTIN H. SINGER |
Chairman of the Board, Chief Executive Officer | March 15, 2016 | ||
| (Martin H. Singer) | (Principal Executive Officer) and Director | |||
| /s/ JOHN SCHOEN |
Chief Financial Officer | March 15, 2016 | ||
| (John Schoen) | (Principal Financial and Accounting Officer) | |||
| /s/ CINDY ANDREOTTI |
Director | March 15, 2016 | ||
| (Cindy Andreotti) | ||||
| /s/ GINA HASPILAIRE |
Director | March 15, 2016 | ||
| (Gina Haspilaire) | ||||
| /s/ BRIAN J. JACKMAN |
Director | March 15, 2016 | ||
| (Brian J. Jackman) | ||||
| /s/ STEVEN D. LEVY |
Director | March 15, 2016 | ||
| (Steven D. Levy) | ||||
| /s/ GIACOMO MARINI |
Director | March 15, 2016 | ||
| (Giacomo Marini) | ||||
| /s/ JAY SINDER |
Director | March 15, 2016 | ||
| (Jay Sinder) | ||||
| /s/ CARL THOMSEN |
Director | March 15, 2016 | ||
| (Carl Thomsen) | ||||
74