Attached files
| file | filename |
|---|---|
| EX-32 - EXHIBIT 32 - INNOVATE Corp. | a201410-kexhibit32.htm |
| EX-23.1 - EXHIBIT 23.1 - INNOVATE Corp. | a201410-kexhibit231.htm |
| EX-31.1 - EXHIBIT 31.1 - INNOVATE Corp. | a201410-kexhibit311.htm |
| EX-31.2 - EXHIBIT 31.2 - INNOVATE Corp. | a201410-kexhibit312.htm |
UNITED STATES
SECURITIES AND EXCHANGE COMMISSION
WASHINGTON, D.C. 20549
____________________________________________________
FORM 10-K/A
Amendment No. 1
____________________________________________________
x | ANNUAL REPORT PURSUANT TO SECTION 13 OR 15(d) OF THE SECURITIES EXCHANGE ACT OF 1934. |
For the fiscal year ended December 31, 2014
OR
¨ | TRANSITION REPORT PURSUANT TO SECTION 13 OR 15(d) OF THE SECURITIES EXCHANGE ACT OF 1934. |
Commission File No. 001-35210
____________________________________________________
HC2 HOLDINGS, INC.
(Exact name of registrant as specified in its charter)
____________________________________________________
Delaware | 54-1708481 | |
(State or other jurisdiction of incorporation or organization) | (I.R.S. Employer Identification No.) | |
505 Huntmar Park Drive, Suite 325, Herndon, VA | 20170 | |
(Address of principal executive offices) | (Zip Code) | |
(703) 456-4100
(Registrant’s telephone number, including area code)
____________________________________________________
Securities registered pursuant to Section 12(b) of the Act:
Title of each class | Name of each exchange on which registered | |
Common Stock, par value $0.001 per share | NYSE MKT LLC | |
Securities registered pursuant to Section 12(g) of the Act:
N/A
____________________________________________________
Indicate by check mark if the registrant is a well-known seasoned issuer, as defined in Rule 405 of the Securities Act. Yes ¨ No x
Indicate by check mark if the registrant is not required to file reports pursuant to Section 13 or Section 15(d) of the Act. Yes ¨ No x
Indicate by check mark whether the registrant (1) has filed all reports required to be filed by Section 13 or 15(d) of the Securities Exchange Act of 1934 during the preceding 12 months (or for such shorter period that the registrant was required to file such reports), and (2) has been subject to such filing requirements for the past 90 days. Yes x No ¨
Indicate by check mark whether the registrant has submitted electronically and posted on its corporate Web site, if any, every Interactive Data File required to be submitted and posted pursuant to Rule 405 of Regulation S-T (§232.405 of this chapter) during the preceding 12 months (or for such shorter period that the registrant was required to submit and post such files). Yes x No ¨
Indicate by check mark if disclosure of delinquent filers pursuant to Item 405 of Regulation S-K is not contained herein, and will not be contained, to the best of the registrants’ knowledge, in definitive proxy or information statements incorporated by reference in Part III of this Form 10-K or any amendment to this Form 10-K. x
Indicate by check mark whether the registrant is a large accelerated filer, an accelerated filer, a non-accelerated filer, or a smaller reporting company. See the definitions of “large accelerated filer,” “accelerated filer” and “smaller reporting company” in Rule 12b-2 of the Exchange Act. (Check one):
Large accelerated filer | ¨ | Accelerated filer | x |
Non-accelerated filer | ¨ | Smaller reporting company | ¨ |
Indicate by check mark whether the registrant is a shell company (as defined in Rule 12b-2 of the Act). Yes ¨ No x
The aggregate fair market value of the Common Stock held by non-affiliates of the registrant as of June 30, 2014 was approximately $87,890,040, based on the closing sale price of the Common Stock on such date. All executive officers and directors of the registrant and all persons filing a Schedule 13D with the Securities and Exchange Commission in respect of the registrant’s common stock as of such date have been deemed, solely for the purpose of the foregoing calculation, to be “affiliates” of the registrant.
As of February 28, 2015, 23,815,216 shares of Common Stock, par value $0.001, were outstanding.
Documents Incorporated by Reference:
Portions of the definitive Proxy Statement to be delivered to Stockholders in connection with the Annual Meeting of Stockholders are incorporated by reference into Part III.
EXPLANATORY NOTE
This Amendment No. 1 on Form 10-K/A ("Amendment No. 1") amends the Annual Report on Form 10-K of HC2 Holdings, Inc. (the “Company”) for the fiscal year ended December 31, 2014, as originally filed with the Securities and Exchange Commission (the “SEC”) on March 16, 2015 (the “Original Filing”).
As previously disclosed in Form 8-K filed on February 22, 2016 and described in more detail in Note 1 of the Notes to Consolidated Financial Statements, on February 21, 2016, we determined that we had improperly accounted for certain items. As a result of the aggregate effect of these errors and other individually immaterial errors that had been waived in prior periods, the Audit Committee of our Board of Directors determined that our financial statements for the fiscal year ended December 31, 2014 and the fiscal quarters ended June 30, 2014, September 30, 2014, March 31, 2015, June 30, 2015 and September 30, 2015 could no longer be relied upon and should be restated. To correct the errors described above and in Note 1 of the Notes to Consolidated Financial Statements, we are amending the Original Filing to provide restated consolidated financial statements as of and for the fiscal year ended December 31, 2014 and to amend related disclosures.
As previously disclosed, we identified an error in accounting for income taxes, including the income tax provision and related tax assets and liabilities in the consolidated statement of operations for the year ended December 31, 2014. The Company subsequently recorded an out-of-period adjustment to tax benefit of $2.3 million in its quarterly period ended September 30, 2015 and is correcting that error and other known out-of-period errors that had been waived in prior periods in its restated consolidated financial statements for the fiscal year ended December 31, 2014.
Subsequently, management identified a material weakness in the Company’s internal controls over the valuation of a business acquisition and the application of U.S. GAAP to complex and/or non-routine transactions. In particular, the Company determined that it incorrectly accounted for the acquisition of American Natural Gas, completed on August 1, 2014 as required by FASB Accounting Standards Codification 805. Further, the Company determined that it incorrectly classified funds released from escrow totaling $29.2 million as cash flows from operating activities rather than cash flows from investing activities in its Consolidated Statements of Cash Flows for the fiscal year ended December 31, 2014. The funds related to the 2013 sales of the North American Telecom and BLACKIRON Data business units.
As a result of material weaknesses leading to the errors described above, management has concluded that the Company’s internal control over financial reporting and its disclosure controls and procedures were not effective as of the ends of each of the applicable restatement periods. The effects of the material weaknesses are discussed in more detail in Item 9A, Controls and Procedures.
For ease of reference, this Amendment No. 1 amends and restates the Original Filing in its entirety. Revisions to the Original Filing have been made to the following sections:
• | Part I - Item 1 - Business |
• | Part I - Item 1A - Risk Factors |
• | Part I - Item 2 - Properties |
• | Part I - Item 6 - Selected Financial Data |
• | Part II - Item 7 - Management’s Discussion and Analysis of Financial Condition and Results of Operations |
• | Part II - Item 8 - Financial Statements and Supplementary Data |
• | Part II - Item 9A - Controls and Procedures |
• | Part IV - Exhibits |
In addition, the Company’s principal executive officer and principal financial officer have provided new certifications in connection with this Amendment No.1 (Exhibits 31.1, 31.2, and 32), as well as various exhibits related to XBRL.
Except as described above, no other amendments have been made to the Original Filing. This Amendment continues to speak as of the date of the Original Filing, and the Company has not updated the disclosure contained herein to reflect events that have occurred since the date of the Original Filing, other than with respect to the items listed above. Accordingly, this Amendment should be read in conjunction with the Company’s other filings made with the SEC subsequent to the filing of the Original Filing, including any amendments to those filings.
TABLE OF CONTENTS
Item | Description | Page |
1 | ||
1A. | ||
1B. | ||
2 | ||
3 | ||
4 | ||
5 | ||
6 | ||
7 | ||
7A. | ||
8 | ||
9 | ||
9A. | ||
9B. | ||
10 | ||
11 | ||
12 | ||
13 | ||
14 | ||
15 | ||
PART I
ITEM 1. BUSINESS
Unless the context otherwise requires, in this Annual Report on Form 10-K, “HC2,” means HC2 Holdings, Inc. and the “Company,” “we” and “our” mean HC2 together with its consolidated subsidiaries.
General
We are a diversified holding company with six reportable operating segments based on management’s organization of the enterprise—Manufacturing, Marine Services, Utilities, Telecommunications, Life Sciences and Other, which includes operations that do not meet the separately reportable segment thresholds. We expect to continue to focus on acquiring and investing in businesses with attractive assets that we consider to be undervalued or fairly valued and growing our acquired businesses.
On May 29, 2014, we completed the acquisition of 2.5 million shares of common stock of Schuff International, Inc. (“Schuff”), a steel fabrication and erection company and negotiated an agreement to purchase an additional 198,411 shares, representing an approximately 65% interest in Schuff. Schuff repurchased a portion of its outstanding common stock in June 2014, which had the effect of increasing the Company’s ownership interest to 70%. During the fourth quarter, the final results of a tender offer for all outstanding shares of Schuff were announced and various open-market purchases were made, which resulted in the acquisition of 809,043 shares and an increase in our ownership interest to 91%. We intend to execute a short-form merger, which will increase our ownership of Schuff shares to 100%. Schuff and its wholly-owned subsidiaries primarily operate as integrated fabricators and erectors of structural steel and heavy steel plates with headquarters in Phoenix, Arizona and operations in Arizona, Georgia, Texas, Kansas and California. Schuff’s construction projects are primarily in the aforementioned states. In addition, Schuff has construction projects in select international markets, primarily Panama.
On August 1, 2014, the Company paid $15.5 million to acquire 15,500 shares of Series A Convertible Preferred Stock of American Natural Gas (“ANG”), representing an approximately 51% interest in ANG. ANG is a premier distributor of natural gas motor fuel headquartered in the Northeast that designs, builds, owns, acquires, operates and maintains compressed natural gas fueling stations for transportation.
On September 22, 2014, the Company completed the acquisition of Bridgehouse Marine Limited, the parent holding company of Global Marine Systems Limited (“GMSL”). The purchase price reflects an enterprise value of approximately $260 million, including assumed indebtedness. GMSL is a leading provider of engineering and underwater services on submarine cables. In conjunction with the acquisition, approximately 3% of the Company’s interest in GMSL was purchased by a group of individuals, leaving the Company’s controlling interest as of December 31, 2014 at approximately 97%.
On September 3, 2014, the Company invested $14.2 million for a combination of common stock, warrants and convertible preferred stock of Novatel Wireless, Inc. (“Novatel”). The Company received (i) 7,363,334 shares of common stock at a stock price of $1.75 per share, (ii) 5-year warrants to purchase an additional 4,117,647 shares of common stock at an exercise price of $2.26 per share and (iii) 87,196 shares of Series C Convertible Preferred Stock at a price of $17.50 per share. In October 2014, the 87,196 shares of Series C Convertible Preferred Stock were converted into 871,960 shares of common stock. The Company’s ownership of common stock and warrants represents beneficial ownership of approximately 25% of Novatel’s common stock.
The Company has made other investments in start-up companies that operate in the life sciences, technology and interactive gaming industries.
We have also historically operated a telecommunications business including a network of direct routes and provided premium voice communication services for national telecom operators, mobile operators, wholesale
carriers, prepaid operators, Voice over Internet Protocol (“VoIP”) service operators and Internet service providers (“ISPs”). The Company has provided telecommunications services from its North America Telecom and International Carrier Services (“ICS”) business units. In the second quarter of 2013, the Company entered into a definitive purchase agreement to sell its North America Telecom business and sought shareholder approval of such transaction. On July 31, 2013, the Company completed the initial closing of the sale of substantially all of its North America Telecom business. The sale of Primus Telecommunications, Inc. (“PTI”) was also contemplated as part of this transaction, subject to regulatory approval. On July 31, 2014, having received the necessary regulatory approvals for the sale of PTI, we completed the divestiture of the remainder of our North America Telecom business.
1
During 2013, we also provided data center services in Canada through our BLACKIRON Data business unit. On April 17, 2013, we consummated the divestiture of BLACKIRON Data.
Overall Business Strategy
We are evaluating several strategic and business alternatives, which may include the following: acquiring assets or businesses unrelated to our current or historical operations, operating, growing or acquiring additional assets or businesses related to our current or historical operations, or winding down or selling our existing operations. As part of any acquisition strategy, we may raise capital in the form of debt or equity securities (including preferred stock) or a combination thereof. We have broad discretion in selecting a business strategy for the Company. If we elect to pursue an acquisition, we have broad discretion in identifying and selecting both the industries and the possible acquisition or business combination opportunities. We have not identified a specific industry to focus on and there can be no assurance that we will, or we will be able to, identify or successfully complete any such transactions. In connection with evaluating these strategic and business alternatives, we may at any time be engaged in ongoing discussions with respect to possible acquisitions, business combinations and debt or equity securities offerings of widely varying sizes. There can be no assurance that any of these discussions will result in a definitive agreement and if they do, what the terms or timing of any agreement would be. While we search for additional acquisition opportunities, we manage a portion of our available cash and acquire interests in possible acquisition targets through our wholly-owned subsidiary, HC2 Investment Securities, Inc., a Delaware corporation.
Our Operating Subsidiaries
Schuff
Schuff is a fully integrated fabricator and erector of structural steel and heavy steel plate. Schuff fabricates and erects structural steel for commercial and industrial construction projects such as high- and low-rise buildings and office complexes, hotels and casinos, convention centers, sports arenas, shopping malls, hospitals, dams, bridges, mines and power plants. Schuff also fabricates trusses and girders and specializes in the fabrication and erection of large-diameter water pipe, water storage tanks, pollution control scrubbers, tunnel liners, pressure vessels, strainers, filters, separators and a variety of customized products. Schuff’s operations make up our Manufacturing segment.
Schuff’s results of operations are affected primarily by (i) the level of commercial and industrial construction in its principal markets; (ii) its ability to win project contracts; (iii) the number and complexity of project changes requested by customers or general contractors; (iv) its success in utilizing its resources at or near full capacity; and (v) its ability to complete contracts on a timely and cost-effective basis. The level of commercial and industrial construction activity is related to several factors, including local, regional and national economic conditions, interest rates, availability of financing, and the supply of existing facilities relative to demand.
Strategy
Schuff’s objective is to achieve and maintain a leading position in the geographic regions and project segments that it serves by providing timely, high-quality services to its customers. Schuff is pursuing this objective with a strategy comprised of the following components:
• | Pursue Large, Value-Added Design-Build Projects. Schuff’s unique ability to offer design-build services, a full range of steel construction services and project management capabilities makes it a preferred partner for complex, design-build fabrication projects in the geographic regions it serves. This capability often enables Schuff to bid against fewer competitors in a less traditional, more negotiated selection process on these projects, thereby offering the potential for higher margins while providing overall cost savings and project flexibility and efficiencies to its customers; |
• | Expand and Diversify Revenue Base. Schuff is seeking to expand and diversify its revenue base by leveraging its long-term relationships with national and multi-national construction and engineering firms, national and regional accounts and other customers. Schuff also intends to continue to grow its operations by targeting smaller projects that carry higher margins and less risk of large margin fluctuations. Schuff believes that continuing to diversify its revenue base by completing smaller projects—such as low-rise office buildings, healthcare facilities and other commercial and industrial structures—could reduce the impact of periodic adverse market or economic conditions as well as potential margin slippage that may accompany larger projects; |
• | Emphasize Innovative Services. Schuff focuses its design-build, engineering, detailing, fabrication and erection expertise on larger, more complex projects, where it typically experiences less competition and more advantageous negotiated contract opportunities. Schuff has extensive experience in providing services requiring complex fabrication and erection techniques and other unusual project needs, such as specialized transportation, steel treatment or specialty coating applications. These service capabilities have enabled Schuff to address such design-sensitive projects as stadiums and uniquely designed hotels and casinos; and |
2
• | Diversify Customer and Product Base. Although Schuff seeks to garner a leading share of the geographic and product markets in which it competes, it also seeks to diversify its construction projects across a wide range of commercial, industrial, and specialty projects, including projects related to the oil & gas and alternative energy industries. |
Services and/or Products and Customers
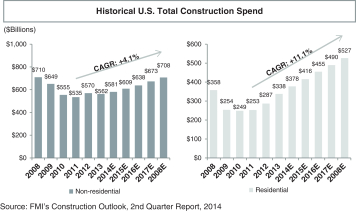
Schuff operates primarily within the over $550 billion non-residential construction industry, which serves a diverse set of end markets. As shown on the chart below, while non-residential construction has shown only a small rebound since 2011, industry experts expect that it will follow the already significant rebound in residential construction spending. Despite only a modest increase in non-residential construction spending, Schuff’s backlog has already rebounded to pre-economic crisis levels.
Schuff consists of three business units spread across diverse steel markets: Schuff Steel Company (steel fabrication and erection), Schuff Steel Management Company (management of smaller projects, leveraging subcontractors) and Aitken, Inc. (manufacturing of equipment for the oil & gas industry). For the fiscal year ended December 28, 2014, Schuff Steel’s revenues of $485 million account for 92% of Schuff’s total revenue. Schuff Steel Management Company’s revenues of $29 million account for 5% of Schuff’s total revenue. Aitken, Inc.’s revenues of $5 million account for 1% of Schuff’s total revenue. Schuff also provides fabricated steel to Canada and other select countries, including Panama, where Schuff owns 49% of Panama-based Schuff Hopsa Engineering, Inc., an engineering design, steel fabrication and erection company, Empresas Hopsa, S.A. Schuff Hopsa Engineering, Inc.’s revenues of $13 million account for 3% of Schuff’s total revenue. During 2014, Schuff had revenues from a customer that totaled approximately 12% of its revenues. The revenue amounts above include activity prior to HC2’s acquisition. Please refer to the “Results of Operations” discussion within Item 7. for further discussion surrounding pro forma revenue.
Schuff’s size gives it production capacity to complete large-scale, demanding projects, with typical utilization per facility ranging from 50%-88% and a sales pipeline that includes over $800 million in potential revenue generation. Schuff has benefitted from being one of the largest players in a market that is highly fragmented across many small firms. Schuff outperformed many of its competitors in the recent downturn. Due to its strong financial position and continued access to bonding facilities, whereas many competitors were forced to close their doors.
Schuff ensures a highly efficient and cost-effective construction process by focusing on partnering with all project participants and utilizing its extensive design-build and design-assist capabilities with its clients. Additionally, Schuff enjoys in-house fabrication and erection combined with access to a network of subcontractors for smaller projects in order to provide high quality solutions for its customers. Schuff offers a range of services across a broad geography through its 10 fabrication shops and 10 sales and management facilities located in the United States and Panama.
Schuff operates with minimal bonding requirements, with the current balance less than 13% of backlog, and bonding is reduced as projects are billed, rather than upon completion. Schuff has limited raw material cost exposure by securing fixed prices from mills at contract bid, and utilizing its purchasing power as the largest domestic buyer of wide flange beam in the United States.
3
Products
Schuff Steel offers a variety of services to its customers which it believes enhances our ability to obtain and successfully complete projects. These services fall into six distinct groups: design-assist/design-build, preconstruction design & budgeting, steel management, fabrication, erection, and Building Information Modeling (“BIM”). Schuff primarily operates in the southwestern and southeastern United States geographic markets.
• | Design-Assist/Design-Build: Using the latest technology and BIM, Schuff works to provide clients with cost-effective steel designs. The end result is turnkey structural steel solutions for its diverse client base. |
• | Preconstruction Design & Budgeting: Clients who contact Schuff in the early stages of planning can receive a Schuff-performed analysis of the structure and cost breakdown. Both of these tools allow clients to accurately plan and budget for any upcoming project. |
• | Steel Management: Using Schuff’s proprietary Schuff Steel Integrated Management System (“SSIMS”), Schuff can track any piece of steel and instantly know its location. Additionally, Schuff can help clients manage steel subcontracts, providing clients with savings on raw steel purchases and giving them access to variety of Schuff-approved subcontractors. |
• | Fabrication: Through its nine fabrication shops in California, Arizona, Texas, Kansas and Georgia, Schuff has one of the highest fabrication capacities in America. Schuff has over 1.3 million square feet of steel under roof and a maximum annual fabrication capacity of approximately 300,000 tons. |
• | Erection: Named the nation’s top steel erector in 2007, 2008, 2011, 2013 and 2014 by Engineering News-Record, Schuff knows how to add value to its project through safe and efficient erection of steel structures. |
• | BIM: Schuff is experienced in using BIM on every project to manage its role efficiently. Additionally Schuff’s use of SSIMS in conjunction with BIM allows for real-time reporting of a project’s progress and information-rich model review. |
Schuff Steel Management Company provides turn-key steel fabrication and erection services with an expertise in project management. Using these skills, Schuff Steel Management Company uses its relationships with reliable subcontractors and erectors, along with state-of-the-art management systems, to deliver excellence to clients.
Schuff’s third product line, Aitken, is a manufacturer of equipment used in the oil, gas, petrochemical and pipeline industries. Aitken supplies the following products both nationwide and internationally.
• | Strainers: Temporary Cone and Basket Strainers, Tee Type Srainers, Vertical and Horizontal Permanent Line Strainers, Fabricated Duplex Strainers |
• | Measurement Equipment: Orifice Meter Tubes, Orifice Plates, Orifice Flanges, Seal Pots, Flow Nozzles, Venturi Tubes, Low Loss Tubes, Straightening Vanes |
• | Major Products: Spectacle Blinds, Paddle Blinds, Drip Rings, Bleed Rings, and Test Inserts, ASME Vessels, Launchers, Pipe Spools |
Customers
Schuff offers its integrated steel construction services primarily to general contractors and engineering firms that specialize in a wide variety of projects, including the following: hotels and casinos, office complexes, hospitals, manufacturing plants, shopping malls and centers, sports stadiums, power plants, restaurants, convention facilities, entertainment complexes, airports, schools, churches and warehouses. During 2014, Schuff had revenues from a customer that totaled approximately 12% of its revenues. During 2013, Schuff did not have revenues from any one customer in excess of 10% of its revenues.
Suppliers
Schuff currently purchases a majority of its steel from various foreign and domestic steel producers but is not dependent on any one producer.
Sales and Distributions
Schuff offers its services primarily to general contractors and engineering firms that focus on a wide array of projects such as airports, malls, power plants, stadiums, shopping malls and centers. Schuff obtains these contracts through competitive bidding or negotiation, which generally are fixed-price, cost-plus, or unit cost arrangements. Bidding and negotiations require Schuff to estimate the costs of the project up front with most projects typically lasting from one to 12 months.
4
Marketing
Sales managers lead Schuff’s domestic sales and marketing efforts. Each sales manager is responsible primarily for estimating, sales, and marketing efforts in defined geographic areas. In addition, Schuff employs full-time project estimators and chief estimators. Schuff’s sales representatives maintain relationships with general contractors, architects, engineers, and other potential sources of business to determine potential new projects under consideration. Schuff generates future project reports to track the weekly progress of new opportunities. Schuff’s sales efforts are further supported by most of its executive officers and engineering personnel, who have substantial experience in the design, fabrication, and erection of structural steel and heavy steel plate.
Schuff competes for new project opportunities through its relationships and interaction with its active and prospective customer base, which provides valuable current market information and sales opportunities. In addition, Schuff is contacted by governmental agencies in connection with public construction projects, and by large private-sector project owners, general contractors and engineering firms in connection with new building projects such as plants, warehouse and distribution centers, and other industrial and commercial facilities.
Upon selection of projects to bid or price, Schuff’s estimating division reviews and prepares projected costs of shop, field, detail drawing preparation and crane hours, steel and other raw materials, and other costs. On bid projects, a formal bid is prepared detailing the specific services and materials Schuff plans to provide, payment terms and project completion timelines. Upon acceptance, Schuff’s bid proposal is finalized in a definitive contract.
Backlog
Schuff’s backlog was $357.0 million ($305.3 million under contracts or purchase orders and $51.7 million under letters of intent) at December 31, 2014. Schuff’s backlog increases as contract commitments, letters of intent, notices to proceed and purchase orders are obtained, decreases as revenues are recognized and increases or decreases to reflect modifications in the work to be performed under the contracts, notices to proceed, letters of intent or purchase orders. Schuff’s backlog can be significantly affected by the receipt, or loss, of individual contracts. Approximately $203.1 million, representing 56.9% of Schuff’s backlog at December 31, 2014, was attributable to five contracts, letters of intent, notices to proceed or purchase orders. If one or more of these large contracts or other commitments are terminated or their scope reduced, Schuff’s backlog could decrease substantially. At December 29, 2013, its backlog was $426.9 million ($370.1 million under contracts or purchase orders and $56.8 million under letters of intent). Backlog at December 30, 2012 was $186.2 million ($167.3 million under contracts or purchase orders and $18.9 million under letters of intent).
Competition
The principal geographic and product markets Schuff serves are highly competitive, and this intense competition is expected to continue. Schuff competes with other contractors for commercial, industrial and specialty projects on a local, regional, or national basis. Continued service within these markets requires substantial resources and capital investment in equipment, technology and skilled personnel, and certain of Schuff’s competitors have financial and operating resources greater than Schuff. Competition also places downward pressure on Schuff’s contract prices and margins. Among the principal competitive factors within the industry are price, timeliness of completion of projects, quality, reputation, and the desire of customers to utilize specific contractors with whom they have favorable relationships and prior experience. While Schuff believes that it maintains a competitive advantage with respect to these factors, failure to continue to do so or to meet other competitive challenges could have a material adverse effect on Schuff’s results of operations, cash flows or financial condition.
Employees
As of December 28, 2014, Schuff employed approximately 1,470 people across the country. The number of persons Schuff employs on an hourly basis fluctuates directly in relation to the amount of business Schuff performs. Certain of the fabrication and erection personnel Schuff employs are represented by the United Steelworkers of America, the International Association of Bridge, Structural, Ornamental and Reinforcing Iron Workers Union, the International Union of Operating Engineers, and the International Brotherhood of Boilermakers, Iron Shipbuilders, Blacksmiths, Forgers and Helpers Union. Schuff is a party to several separate collective bargaining agreements with these unions in certain of its current operating regions, which expire (if not renewed) at various times in the future. Approximately 25% of Schuff’s employees are covered under various collective bargaining agreements. Most of Schuff’s collective bargaining agreements are subject to automatic annual or other renewal unless either party elects to terminate the agreement on the scheduled expiration date. Approximately 11% of Schuff’s employees are covered under a collective bargaining agreement that expires within the next year. Schuff considers its relationship with its employees to be good and, other than sporadic and unauthorized work stoppages of an
5
immaterial nature, none of which have been related to its own labor relations, Schuff has not experienced a work stoppage or other labor disturbance.
Schuff strategically utilizes third-party fabrication and erection subcontractors on many of its projects and also subcontracts detailing services from time to time when economically beneficial and/or Schuff requires additional capacity for such services. Schuff’s inability to engage fabrication, erection and detailing subcontractors on terms favorable to it could limit its ability to complete projects in a timely manner or compete for new projects and could have a material adverse effect on its operations.
Legal, Environmental and Insurance
In December 2012, British Petroleum (“BP”) brought suit against Carboline Company (“Carboline”), Trinity Steel Fabricators, Inc. (“Trinity”), the Schuff’s subsidiary, Schuff Steel Company (“SSC”), Tecon Services, Inc. (“Tecon”) and Alfred Miller Contracting Company (“AMC”) in regards to fabrication work on a BP refinery in Indiana. BP alleged that the Schuff subsidiary and others defectively fireproofed certain pieces of steel used in a modernization project at the refinery. AMC and Tecon filed a Petition for Damages and Declaratory Judgment against Caroline, BP Corporation North America Inc., BP Products North America, Trinity, SSC, Schuff Steel-Gulf Coast, Inc., and others. In April 2014, the lawsuits were successfully mediated and a confidential settlement agreement was executed on June 16, 2014. Both cases were dismissed in July 2014.
Schuff is subject to other claims and legal proceedings that arise in the ordinary course of business. Such matters are inherently uncertain, and there can be no guarantee that the outcome of any such matter will be decided favorably to Schuff or that the resolution of any such matter will not have a material adverse effect upon Schuff or the Company’s business, consolidated financial position, results of operations or cash flows. Neither Schuff nor the Company believes that any of such pending claims and legal proceedings will have a material adverse effect on its business, consolidated financial position, results of operations or cash flows.
Schuff’s operations and properties are affected by numerous federal, state and local environmental protection laws and regulations, such as those governing discharges to air and water and the handling and disposal of solid and hazardous wastes. Compliance with these laws and regulations has become increasingly stringent, complex and costly. There can be no assurance that such laws and regulations or their interpretation will not change in a manner that could materially and adversely affect Schuff’s operations. Certain environmental laws, such as the CERCLA and its state law counterparts, provide for strict and joint and several liability for investigation and remediation of spills and other releases of toxic and hazardous substances. These laws may apply to conditions at properties currently or formerly owned or operated by an entity or its predecessors, as well as to conditions at properties at which wastes or other contamination attributable to an entity or its predecessors come to be located. Although Schuff has not incurred any material environmental related liability in the past and believes that it is in material compliance with environmental laws, there can be no assurance that Schuff, or entities for which it may be responsible, will not incur such liability in connection with the investigation and remediation of facilities it currently operates (or formerly owned or operated) or other locations in a manner that could materially and adversely affect its operations.
Schuff maintains commercial general liability insurance in the amount of $1.0 million per occurrence and $2.0 million in the aggregate. In addition, Schuff maintains umbrella coverage limits of $25.0 million. Schuff also maintains insurance against property damage caused by fire, flood, explosion and similar catastrophic events that may result in physical damage or destruction of its facilities and property. All policies are subject to various deductibles and coverage limitations. Although Schuff’s management believes that its insurance is adequate for its present needs, there can be no assurance that it will be able to maintain adequate insurance at premium rates that management considers commercially reasonable, nor can there be any assurance that such coverage will be adequate to cover all claims that may arise.
GMSL
GMSL is a global offshore engineering company focused on specialist subsea services across three market sectors, namely telecommunications, oil & gas and offshore power. GMSL’s operations make up our Marine Services segment.
Strategy Overview
GMSL is a leading independent operator in the subsea cable installation and maintenance markets. GMSL aims to maintain its leading market position in the telecommunications maintenance segment and will look for opportunities to grow the installation activities in the three main segments of the market and installation in the telecommunications sector while capitalizing on high market growth in the oil & gas sector through expansion of its installation and maintenance services in that sector. In order to accomplish these goals GMSL has crafted a comprehensive strategy which includes:
6
• | Re-entering the offshore power market in November 2015 after expiration of the Prysmian non-compete; |
• | Diversify the business by pursuing growth within GMSL’s three market segments (telecommunications, oil & gas, and offshore power) which will strengthen GMSL’s quality of earnings and reduce exposure to one particular market segment; |
• | Retain and build its leading position in telecommunications maintenance and installation; |
• | Exploit high market growth in oil & gas, first in installation, then in maintenance; |
• | Work to develop convergence of GMSL’s maintenance services across all three market segments; and |
• | Encourage overall consolidation in the wider subsea cables market by pursuing targeted mergers & acquisitions, joint ventures or partnerships, allowing a larger operating platform and benefitting from increased operating efficiencies. |
GMSL has a highly experienced management team with a proven track record and has demonstrated the ability to enter new markets and generate returns for investors. The senior management team has a combined 70 years of experience within the telecommunications, oil & gas, and offshore power segments.
GMSL’s three sectors of focus for providing subsea cable services are telecommunications installation and maintenance, oil & gas installation and offshore power installation.
Telecommunications: GMSL provides maintenance and installation to its global telecommunications customers. GMSL has a long, well-established reputation in the telecommunications sector and is considered a leading provider of subsea services in the industry. It operates in a mature market and is the largest independent provider in the maintenance segment. GMSL provides vessels on standby to repair fiber optic telecommunications cables in defined geographic zones, and its maintenance business is provided through contracts with consortia of up to 60 global telecommunications providers. Typically, GMSL enters into five to seven year contracts to provide maintenance to cable systems that are located in specific geographical areas. These contracts provide highly stable, predictable and recurring revenue and earnings. Additionally, GMSL provides installation of cable systems including route planning, mapping, route engineering, cable-laying, trenching and burial. GMSL’s installation business is project-based with contracts typically lasting one to five months.
Oil & Gas: GMSL provides installation, maintenance and repair of fiber optic communication and power infrastructure to offshore platforms, through which it realizes higher margins due to implementation complexity. Its primary activities include providing power from shore, enabling fiber-based communication between platforms and shore-based systems and installing permanent reservoir monitoring systems which allow customers to monitor subsea seismic data. The majority of GMSL’s oil & gas business is contracted on a project-by-project basis with major energy producers or Tier I engineering, procurement and construction (EPC) contractors.
Offshore Power: GMSL’s former subsidiary Global Marine Energy (“GME”) was established in 2011 as the vehicle for GMSL’s significant offshore power activities, which include installing inter-array power cables for use in offshore wind farms and in the offshore wind market. GME was sold to Prysmian UK Group Limited (“Prysmian”) in November 2012 in anticipation of a temporary downturn in the offshore power market and the onerous contracting regime present at the time. As part of this sale, GMSL entered into a non-compete agreement regarding offshore power operations with Prysmian lasting until November 2015 but retained certain key personnel and assets to ensure that GMSL maintained its core capabilities and experience in the offshore power sector. Following entry into this non-compete agreement, GMSL continued to install offshore power cables on behalf of Prysmian with chartered vessels through June 2014. GMSL expects to re-enter the high growth, high margin offshore power market upon the expiration of the non-compete agreement. Given that renewable energy production is predicted to grow over the next decade, with a substantial proportion of that energy to be harvested offshore, GMSL is well positioned to capitalize on this anticipated growth of the offshore alternative energy market, with a strong presence in Northern Europe and Asia, especially China.
Services and/or Products and Customers
GMSL is a pioneer in the subsea cable industry having laid the first subsea cable in the 1850s and installed the first transatlantic fiber optic cable (TAT-8) in 1988. Over the last 30 years, GMSL estimates that it has installed approximately 300,000 kilometers of cable, which management believes represents almost a quarter of all the fiber optic cable on the global seabed today. GMSL is positioned as a global independent market leader in subsea cable installation and maintenance services and derives approximately 50% of its total revenue from long term, recurring maintenance contracts. GMSL has a strong financial position with a modest level of debt (consisting only of vessel financing), has delivered substantial growth during recent years, generates a substantial amount of cash and serves a diverse mix of global, blue-chip clients with excellent credit profiles. It has started a new phase of growth through applying its capabilities to the rapidly expanding oil & gas and offshore
7
power sectors (the latter of which GMSL anticipates re-entering in November 2015, as discussed below) while retaining a leading position in the telecommunications sector. As a result of this growth, GMSL has major offices in the United Kingdom and Singapore, and has additional presence in Bermuda, Canada, China, Indonesia and the Philippines. See Item IA—“Risk Factors—Risks Related to GMSL—GMSL derives a significant amount of its revenues from sales to customers in non-U.S. countries, which pose additional risks including economic, political and other uncertainties” for a description of risks attendant to such foreign operations. GMSL operates one of the largest specialist cable laying fleets in the world, consisting of seven vessels (five owned and two operated through long-term leases).
Growth Opportunities
Today, GMSL is positioned as a leading global independent market leader in subsea cable installation and maintenance services. GMSL has a strong financial position, has delivered substantial profit growth during recent years, and generates a substantial amount of cash. It has started a new phase of growth through transferring its capabilities to the rapidly expanding demand in the oil & gas and offshore power sectors (the latter of which GMSL anticipates re-entering in November 2015, as discussed above) while retaining its leading position in the telecommunications sector. GMSL believes it has installed more offshore wind inter-array cables than any other provider and, following the sale of GME in November 2012, remains well positioned as one of the leading installers of cables in the offshore power sector.
Following the sale of GME, GMSL has remained one of the leading installers of cables in relation to supporting the growth in the offshore power market and GMSL’s track record in these types of projects includes the following:
• | Experimental UK farm, Blythe, for Shell |
• | London Array Ltd: inter-array cables for London Array project |
• | RWE: 4 export cables for Gwynt y Mor project |
• | C-Power: inter-array cables for Thornton Bank project (Belgium) |
• | Dong Energy: Inter-array cables for Horns Rev project, Denmark (three phases) |
• | Vattenfall: 3 export cables for Kentish Flats project |
• | EON/Shell: power and fiber optic cables for Blythe project |
• | GT1: largest German wind farm to date |
Fleet Overview
GMSL operates one of the largest, specialist cable laying fleets consisting of 7 vessels (5 owned, 2 operated through long-term leases). The average age of GMSL’s owned and operated fleet is 22 years, which is less than the industry average. Each vessel is equipped with specialist inspection, burial, and survey equipment. By providing oil & gas, offshore power, and telecommunications installation as well as telecommunications maintenance, GMSL can retain vessels throughout their asset lives by cascading them through different uses as they age. This provides a significant competitive advantage as GMSL can retain vessels for longer and reduce the frequency of capital expenditure requirements with a longer amortization period. GMSL’s fleet has an estimated fair value of approximately $140 million (with approximately $75.7 million of associated vessel financing as of December 31, 2014) and are all manned by GMSL employees or long-term contractors.
Fleet Details
8
Vessels | Ownership | Lease Expiry | Joined Fleet | Age | Flag | Base Port | Market Value ($m) | |||||||||
Maintenance - GMSL | ||||||||||||||||
Wave Venture | GMSL | N/A | Purchased -1999 | 31 | UK | Victoria, Canada | $ | 5 | ||||||||
Pacific Guardian | GMSL | N/A | New Build -1984 | 30 | UK | Curacao | 9 | |||||||||
Wave Sentinel | GMSL | N/A | Purchased - 1999 | 18 | UK | Portland, UK | 16 | |||||||||
Cable Retriever | ICPL | Jan-23 | New Build - 1997 | 15 | Singapore | Batangas, Philippines | N/A | |||||||||
Installation – GMSL | ||||||||||||||||
Sovereign | GMSL | N/A | New Build - 1991 | 22 | UK | Portland, UK | 32 | |||||||||
Innovator (2) | DYVI Cableship AS | Mar-18 | New Build - 1995 | 18 | UK | Portland, UK | N/A | |||||||||
Networker | GMSL | N/A | New Build - 1999 | 14 | Panama | Batam, Indonesia | 7 | |||||||||
Total Value | $ | 69 | ||||||||||||||
SBSS Joint Venture Vessels (49% share) | ||||||||||||||||
Installation | ||||||||||||||||
CS Fu Hai | SBSS | N/A | Purchased - 2003 | 14 | Panama | Shanghai, China | $ | 38 | ||||||||
Bold Maverick | SBSS | N/A | Purchased - 2012 | 13 | Panama | Shanghai, China | 38 | |||||||||
CS Fu An | SBSS | N/A | Purchased - 2000 | 32 | Panama | Shanghai, China | 9 | |||||||||
Total Value | $ | 85 | ||||||||||||||
Owned Vessel Market Value | ||||||||||||||||
GMSL Vessels | $ | 69 | ||||||||||||||
SBSS Joint Venture Vessels | 42 | |||||||||||||||
Total Value | $ | 111 | ||||||||||||||
Product Research & Development
Drawing on its long experience in the subsea cable market, over the years GMSL has provided many important innovations to the subsea cable market. One such innovation was GEOCABLE, GMSL’s proprietary Geographical Information System (GIS), which GMSL believes to be the largest cable database in the market and was developed specifically to meet the needs of the cable industry. GEOCABLE is an important tool to any vendor planning subsea cable installation and GMSL sells data from GEOCABLE to third-party customers.
In addition to GEOCABLE, GMSL also developed and owns intellectual property associated with the Universal Joint in a consortium with other industry participants, a product which easily and effectively links together cables from different manufacturers. The Universal Joint has gained such prevalence in the industry that new fiber optic cables may be certified to the Universal Joint, which is a service provided by GMSL among others, so that the subsea cable manufacturer can ensure compatibility of their subsea cable with other existing subsea cables and the standardized equipment on board cable repair vessels. GMSL benefits from its sales of the Universal Joint, and proceeds from GMSL sponsored training of jointing skills, but GMSL also enjoys the industry leadership and brand enhancement that come with creation of an industry leading product.
Intellectual Property
GMSL is looking to protect its interests in intellectual property and closely monitors industry changes, including GEOCABLE and Universal Joint.
9
Customers
GMSL’s customer base is made up primarily of blue-chip companies. Within the two kinds of services provided by GMSL, maintenance and repair and installation, contract length varies. Maintenance and repair contracts tend to be long-term upon inception (5-7 years), with a relatively high level of expected renewal rates and the customer is typically a consortium of different cable owners such as national, regional and international telecommunication companies and others who have an owner in the subsea cables covered by the maintenance contract. GMSL charges a standing fee for cost of vessels in port plus margin, paid in advance proportionally by each member, and an additional daily call out fee for repairs paid by the specific cable owner(s). All four maintenance vessels are engaged on GMSL’s three current long term telecommunications maintenance contracts with ACMA, SEAIOCMA, and NAZ. Installation contracts tend to be much shorter term (30-150 days) and the counter party tends to be a single client. Contracts are typically bid for on a fixed-sum basis with an initial upfront payment plus subsequent installments providing working capital support. Due to the added complexity of cable installation as opposed to maintenance, GMSL generally realizes higher margins on its installation contracts, especially in the oil & gas and offshore power sectors.
Sales and Distributions
In the telecommunications cable market, cable maintenance is most often accomplished by zone maintenance contracts in which a consortium of telecommunications operators or cable owners contract with a maintenance provider like GMSL, over a long-term period of around five to six years. GMSL has three cable maintenance agreements and these are a steady, high-quality source of income for GMSL. These maintenance contracts are usually re-awarded to incumbent providers unless there are significant performance issues which ultimately may mean that GMSL likely need not expend extra capital on retaining these contracts. GMSL constantly has a focused sales plan to build relationships with current and potential customers at regional and corporate offices and readily leverages Huawei Technologies’ large sales organization.
Marketing
In the oil & gas sector, GMSL has a focused sales and marketing plan to create relationships with major players in the oil & gas industries. In particular and depending on the prevailing market conditions, GMSL hopes to use its expertise in installing PRM systems to forge new contacts with both the end users of PRM services, such as oil majors, and the PRM suppliers themselves. Additionally GMSL hopes to pursue a strategy of specialization in installing the small power and fiber optic cables that its competitors in the oil & gas and offshore power sectors find unprofitable and lack installation experience in.
In order to aid these plans for expansion, GMSL plans on increasing its fleet of maintenance and installation vessels anywhere from two to four vessels over the next several years. In particular, GMSL intends to acquire an installation vessel in 2015, to replace one of its older maintenance vessels in 2016, and purchase both a new remotely operated vehicle (“ROV”) in 2017 as well as a new build vessel in 2018, as funded 75/25 through vessel-financing.
Competition
GMSL is one of the few companies that provide subsea cable installation and maintenance services on a worldwide basis. GMSL competes for contracts with companies that have worldwide operations, as well as numerous others operating locally in various areas. There are a number of players, mainly Asian based, who focus primarily on their countries of origin. Competition for GMSL’s services historically has been based on vessel availability, location of or ability to deploy these vessels and associated subsea equipment, quality of service and price. The relative importance of these factors can vary depending on the customer or specific project and also over time based on the prevailing market conditions. The ability to develop, train and retain skilled engineering personnel is also an important competitive factor in GMSL’s markets.
GMSL believes that its ability to provide a wide range of subsea cable installation and maintenance services in the telecommunications, oil & gas and offshore power sectors on a worldwide basis enables it to compete effectively in the industry in which it operates. However, in some cases involving projects that require less sophisticated vessel and subsea equipment, smaller companies may be able to bid for contracts at prices uneconomical to GMSL. In addition, GMSL’s competitors generally have the capability to move their vessels to where GMSL operates from other locations with relative ease, which may impact competition in the markets it serves.
Management and Employees
As of December 31, 2014, GMSL employed 365 people. GMSL’s employees are not formally represented by any labor union or other trade organization although the majority of the seafarers are members of an established trade union. GMSL
10
considers relations with its employees to be satisfactory and it has never experienced a work stoppage or strike. GMSL regularly uses independent consultants and contractors to perform various professional services in different areas of the business, including in its installation and fleet operations and in certain administrative functions. Dick Fagerstal is a 3% interest holder, chairman and chief executive officer of Global Marine Holdings LLC, the parent holding company of Bridgehouse Marine Limited, and he is executive chairman of Global Marine Systems Limited. Mr. Fagerstal has served in an executive capacity for companies operating in various industries including energy, marine services, and their related infrastructure.
Legal, Environmental and Insurance
GMSL is from time to time subject to claims and legal proceedings that arise in the ordinary course of business. Such matters are inherently uncertain, and there can be no guarantee that the outcome of any such matter will be decided favorably to GMSL or that the resolution of any such matter will not have a material adverse effect upon GMSL’s business, consolidated financial position, results of operations or cash flows. GMSL does not believe that any of such pending claims and legal proceedings will have a material adverse effect on its business, consolidated financial position, results of operations or cash flows.
GMSL has various kinds of insurance coverage including protection and indemnity, hull and machinery, war risk, and property insurances, directors and officers liability insurance, contract warranty insurance for the maintenance contracts, and all other necessary corporate insurances. GMSL’s liability is capped and insured under each of its installation contracts.
Other Businesses and Investments
Outside of Schuff and GMSL, which collectively represented $383.6 million, or 70.1% of our net revenue for 2014, we currently have controlling equity positions in several other businesses.
• | In our Telecommunications segment, International Carrier Services, Inc. (“ICS”) is our 100% owned telecommunications business, through which we operate direct routes and provide premium voice communication services for national telecom operators, mobile operators, wholesale carriers, prepaid operators, VoIP service operators and Internet service providers. |
• | In our Life Sciences segment, we operate Pansend, LLC, which has an 80% interest in Genovel Orthopedics, Inc., which seeks to develop products to treat early osteoarthritis of the knee, and a 61% interest in GemDerm Aesthetics, Inc., which develops skin lightening technology. |
• | In our Utilities segment, we invested $15.5 million for a 51% stake in American Natural Gas (“ANG”), a compressed natural gas fueling company. |
In the interactive gaming sector, we acquired a 100% ownership interest in DMi, Inc., which owns licenses to create and distribute NASCAR® video games, for $6.0 million. We also have made several recent noncontrolling investments, including $14.2 million for an approximate 25% ownership interest in Novatel, a publicly listed company that designs and develops wireless communications technologies, and $5.6 million for a 40% interest in NerVve Technologies, Inc. (“NerVve Technologies”), an information technology company.
See Note 17—“Operating Segment and Related Information,” for additional detail regarding our operating segments.
Recent Divestitures
Historically, we operated a network of direct routes and provided premium voice communication services for national telecommunications, operators, mobile operators, wholesale carriers, prepaid operators, Voice over Internet Protocol (“VoIP”) service operators and Internet service providers (“ISPs”). We classified these services into two categories: Traditional Services and International Carrier Services (“ICS”). We provided these services from our two business units: North America Telecom (“NAT”) and ICS.
In the second quarter of 2013, we entered into a definitive purchase agreement to sell our NAT business for approximately $129 million. On July 31, 2013, we completed the initial closing of the sale of substantially all of our NAT business. The closing of the sale of the remainder of our NAT business, consisting of our subsidiary Primus Telecommunications, Inc. (“PTI”), was deferred pending the receipt of regulatory approvals. On July 31, 2014, having received the necessary regulatory approvals for PTI, we completed the divestiture of the remainder of our NAT business. We recorded a $13.8 million gain from the sale of the NAT business for the year ended December 31, 2013.
11
During 2013, we also provided certain growth services through our BLACKIRON Data business unit, which operated our pure data center operations in Canada. On April 17, 2013, we completed the sale of our BLACKIRON Data business for approximately $195.6 million (CAD$200.0 million). We recorded a $135.0 million gain from the sale of BLACKIRON Data during the second quarter of 2013.
Employees
As of December 31, 2014, we had approximately 1,886 employees, 1,870 of which were full-time employees. We consider our relations with our employees to be satisfactory.
Environmental Regulation
Our operations and properties, including those of Schuff and GMSL, are subject to a wide variety of increasingly complex and stringent foreign, federal, state and local environmental laws and regulations, including those concerning emissions into the air, discharge into waterways, generation, storage, handling, treatment and disposal of waste materials and health and safety of employees. Sanctions for noncompliance may include revocation of permits, corrective action orders, administrative or civil penalties and criminal prosecution. Some environmental laws provide for strict, joint and several liability for remediation of spills and other releases of hazardous substances, as well as damage to natural resources. In addition, companies may be subject to claims alleging personal injury or property damage as a result of alleged exposure to hazardous substances. These laws and regulations may also expose us to liability for the conduct of or conditions caused by others, or for our acts that were in compliance with all applicable laws at the time such acts were performed.
Compliance with federal, state and local provisions regulating the discharge of materials into the environment or relating to the protection of the environment has not had a material impact on our capital expenditures, earnings or competitive position. Based on our experience to date, we do not currently anticipate any material adverse effect on our business or consolidated financial position, results of operations or cash flows as a result of future compliance with existing environmental laws and regulations. However, future events, such as changes in existing laws and regulations or their interpretation, more vigorous enforcement policies of regulatory agencies, or stricter or different interpretations of existing laws and regulations, may require additional expenditures by us, which may be material. Accordingly, there can be no assurance that we will not incur significant environmental compliance costs in the future.
Corporate Information
The Company’s executive offices are located at 460 Herndon Parkway, Suite 150, Herndon, VA 20170. The Company’s telephone number is (703) 456-4100. Our Internet address is www.hc2.com. We make available free of charge through our Internet website our Annual Reports on Form 10-K, Quarterly Reports on Form 10-Q, Current Reports on Form 8-K and amendments to those reports filed or furnished pursuant to the Securities Exchange Act of 1934, as amended, as soon as reasonably practicable after we electronically file such material with, or furnish it to, the United States Securities and Exchange Commission (the “SEC”). The information on our website is not a part of this Annual Report on Form 10-K.
ITEM 1A. RISK FACTORS
A wide range of factors could materially affect our overall performance, the performance of particular businesses and our results of operations, and therefore, an investment in us is subject to risks and uncertainties. In addition to factors affecting specific business operations and the financial results of those operations identified elsewhere in this Annual Report on Form 10-K, the following factors, among others, could adversely affect our operations. While each risk is described separately below, some of these risks are interrelated and it is possible that certain risks could trigger the applicability of other risks described below. Also, the risks and uncertainties described below are not the only ones that we face. Additional risks and uncertainties not presently known to us, or that are currently deemed immaterial, could also potentially impair our overall performance, the performance of particular businesses and our results of operations.
Risks Related to Our Businesses
We have experienced significant historical, and may experience significant future, operating losses and net losses, which may hinder our ability to meet working capital requirements or service our indebtedness, and we cannot assure you that we will generate sufficient cash flow from operations to meet such requirements or service our indebtedness.
We cannot assure you that we will recognize net income in future periods. If we cannot generate net income or sufficient operating profitability, we may not be able to meet our working capital requirements or service our indebtedness. Our ability to
12
generate sufficient cash for our operations will depend upon, among other things, our future financial and operating performance, which will be affected by prevailing economic conditions and financial, business, regulatory and other factors, many of which are beyond our control. We recognized a net loss of $14.4 million in 2014, net income of $111.6 million in 2013 (after taking into account $148.8 million of gain from the sale of discontinued operations, net of tax) and net income of $27.9 million in 2012 (after taking into account $94.3 million of gain from the sale of discontinued operations, net of tax), and have incurred net losses in prior periods.
We cannot assure you that our business will generate cash flow from operations in an amount sufficient to fund our liquidity needs. If our cash flows and capital resources are insufficient, we may be forced to reduce or delay capital expenditures, sell assets and/or seek additional capital or financings. Our ability to obtain financings will depend on the condition of the capital markets and our financial condition at such time. Any financings could be at high interest rates and may require us to comply with covenants, which could further restrict our business operations. In the absence of such operating results and resources, we could face substantial liquidity problems and might be required to dispose of material assets or operations to meet our obligations. We may not be able to consummate those dispositions for fair market value or at all. Furthermore, any proceeds that we could realize from any such disposition may not be adequate to meet our obligations. We recognized cash flows from operating activities of $32.8 million in 2014, $(20.3) million in 2013 and $23.6 million in 2012.
We may not be able to fully utilize our net operating loss and other tax carryforwards.
Our ability to utilize our net operating loss (“NOL”) and other tax carryforward amounts to reduce taxable income in future years may be limited for various reasons, including if future taxable income is insufficient to recognize the full benefit of such NOL carryforward amounts prior to their expiration. Additionally, our ability to fully utilize these U.S. tax assets can also be adversely affected by “ownership changes” within the meaning of Sections 382 and 383 of the Internal Revenue Code of 1986, as amended (the “Code”). An ownership change is generally defined as a greater than 50% increase in equity ownership by “5% shareholders” (as that term is defined for purposes of Sections 382 and 383 of the Code) in any three year period.
In 2014, substantial acquisitions of our common stock were reported by new beneficial owners on Schedule 13D filings made with the SEC and we issued shares of our Preferred Stock, which are convertible into a substantial number of shares of our common stock. During the second quarter of 2014, we completed a Section 382 review. The conclusions of this review indicated that an ownership change had occurred as of May 29, 2014. Our annual Section 382 base limit following the ownership change is estimated to be $2.3 million per year. As of December 31, 2014, we had an estimated U.S. NOL carryforward in the amount of $62.7 million.
We are dependent on certain key personnel, the loss of which may adversely affect our financial condition or results of operations.
HC2 and its operating subsidiaries depend, and will continue to depend in the foreseeable future, on the services of HC2’s and each such subsidiary’s executive management team and other key personnel, which may consist of a relatively small number of individuals that possess sales, marketing, engineering, financial and other
skills that are critical to the operation of our businesses. The ability to retain officers and key senior employees is important to our success and future growth. Competition for these professionals can be intense, and we may not be able to retain and motivate our existing management and key personnel, and continue to compensate such individuals competitively. The unexpected loss of the services of one or more of these individuals could have a detrimental effect on the financial condition or results of operations of our businesses, and could hinder the ability of such businesses to effectively compete in the various industries in which we operate.
We may not be able to attract additional skilled personnel.
We may not be able to attract new personnel, including management and technical and sales personnel, necessary for future growth or to replace lost personnel. Competition for the best personnel in our businesses can be intense. Our financial condition and results of operations could be materially adversely affected if we are unable to attract qualified personnel.
Because we face significant competition for acquisition and business opportunities, including from numerous companies with a business plan similar to ours, it may be difficult for us to fully execute our business strategy. Additionally, our subsidiaries also operate in highly competitive industries, limiting their ability to gain or maintain their positions in their respective industries.
We expect to encounter intense competition for acquisition and business opportunities from both strategic investors and other entities having a business objective similar to ours, such as private investors (which may be individuals or investment
13
partnerships), blank check companies, and other entities, domestic and international, competing for the type of businesses that we may intend to acquire. Many of these competitors possess greater technical, human and other resources, or more local industry knowledge, or greater access to capital, than we do and our financial resources will be relatively limited when contrasted with those of many of these competitors. These factors may place us at a competitive disadvantage in successfully completing future acquisitions and investments.
In addition, while we believe that there are numerous target businesses that we could potentially acquire or invest in, our ability to compete with respect to the acquisition of certain target businesses that are sizable will be limited by our available financial resources. We may need to obtain additional financing in order to consummate future acquisitions and investment opportunities and cannot assure you that any additional financing will be available to us on acceptable terms, or at all. This inherent competitive limitation gives others an advantage in pursuing acquisition and investment opportunities.
Furthermore, our subsidiaries also face competition from both traditional and new market entrants that may adversely affect them as well, as discussed below in the risk factors related to Schuff, GMSL and our ICS operations.
Future acquisitions or business opportunities could involve unknown risks that could harm our business and adversely affect our financial condition and results of operations.
We are a diversified holding company that owns interests in a number of different businesses. We have in the past, and may in the future, acquire businesses or make investments, directly or indirectly through our subsidiaries, that involve unknown risks, some of which will be particular to the industry in which the investment or acquisition targets operate, including risks in industries with which we are not familiar or experienced. Although we intend to conduct appropriate business, financial and legal due diligence in connection with the evaluation of future investment or acquisition opportunities, there can be no assurance our due diligence investigations will identify every matter that could have a material adverse effect on us. We may be unable to adequately address the financial, legal and operational risks raised by such investments or acquisitions, especially if we are unfamiliar with the relevant industry. The realization of any unknown risks could expose us to unanticipated costs and liabilities and prevent or limit us from realizing the projected benefits of the investments or acquisitions, which could adversely affect our financial condition and liquidity. In addition, our financial condition, results of operations and the ability to service our debt may be adversely impacted depending on the specific risks applicable to any business we invest in or acquire and our ability to address those risks.
We will increase our size in the future, and may experience difficulties in managing growth.
We have adopted a business strategy that contemplates that we will expand our operations, including in connection with or in anticipation of any future acquisitions or other business opportunities, and as a result we are required to increase our level of corporate functions, which may include hiring additional personnel to perform such functions and enhancing our information technology systems. Any future growth may increase our corporate operating costs and expenses and impose significant added responsibilities on members of our management, including the need to identify, recruit, maintain and integrate additional employees and implement enhanced informational technology systems. Our future financial performance and our ability to compete effectively will depend, in part, on our ability to manage any future growth effectively.
Our officers, directors, stockholders and their respective affiliates may have a pecuniary interest in certain transactions in which we are involved, and may also compete with us.
While we have adopted a code of ethics applicable to our officers and directors reasonably designed to promote the ethical handling of actual or apparent conflicts of interest between personal and professional relationships, we have not adopted a policy that expressly prohibits our directors, officers, stockholders or affiliates from having a direct or indirect pecuniary interest in any transaction to which we are a party or have an interest. Nor do we have a policy that expressly prohibits any such persons from engaging for their own account in business activities of the types conducted by us. We have in the past engaged in transactions in which such persons have an interest and, subject to the terms of any applicable covenants in financing arrangements or other agreements we may enter into from time to time, may in the future enter into additional transactions in which such persons have an interest. In addition, such parties may have an interest in certain transactions such as strategic partnerships or joint ventures in which we are involved, and may also compete with us.
In the course of their other business activities, certain of our current and future directors and officers may become aware of business and acquisition opportunities that may be appropriate for presentation to our Company as well as the other entities with which they are affiliated. Such directors and officers may therefore not present otherwise attractive business or acquisition opportunities to us.
14
Certain of our current and future directors and officers may become aware of business and acquisition opportunities which may be appropriate for presentation to us as well as the other entities with which they are or may be affiliated. Due to those directors’ and officers’ affiliations with other entities, they may have obligations to present potential business and acquisition opportunities to those entities, which could cause conflicts of interest. Moreover, in accordance with Delaware law, our certificate of incorporation contains a provision that renounces our expectation to certain corporate opportunities that are presented to our current and future directors that serve in capacities with other entities. Accordingly, our directors and officers may not present otherwise attractive business or acquisition opportunities to us.
We may suffer adverse consequences if we are deemed an investment company and we may incur significant costs to avoid investment company status.
We have not held, and do not hold, ourselves out as an investment company and do not believe we are an investment company under the Investment Company Act of 1940. If the SEC or a court were to disagree with us, we could be required to register as an investment company. This would subject us to disclosure and accounting rules geared toward investment, rather than operating, companies; limiting our ability to borrow money, issue options, issue multiple classes of stock and debt, and engage in transactions with affiliates; and requiring us to undertake significant costs and expenses to meet the disclosure and regulatory requirements to which we would be subject as a registered investment company.
From time to time we may be subject to litigation for which we may be unable to accurately assess our level of exposure and which, if adversely determined, may have a material adverse effect on our financial condition and results of operations.
We are or may become party to legal proceedings that are considered to be either ordinary or routine litigation incidental to our current or prior businesses or not material to our financial position or results of operations. We also are or may become party to legal proceedings with the potential to be material to our financial position or results of operations. There can be no assurance that we will prevail in any litigation in which we may become involved, or that our insurance coverage will be adequate to cover any potential losses. To the extent that we sustain losses from any pending litigation which are not reserved or otherwise provided for or insured against, our business, results of operations, cash flows and/or financial condition could be materially adversely affected. See Item 3, “Legal Proceedings.”
Further deterioration of global economic conditions could adversely affect our business.
The global economy and capital and credit markets have experienced exceptional turmoil and upheaval over the past several years. Many major economies worldwide entered significant economic recessions beginning in 2007 and continue to experience economic weakness, with the potential for another economic downturn to occur. Ongoing concerns about the systemic impact of potential long-term and widespread recession and potentially prolonged economic recovery, volatile energy costs, geopolitical issues, the availability, cost and terms of credit, consumer and business confidence and demand, and substantially increased unemployment rates have all contributed to increased market volatility and diminished expectations for many established and emerging economies, including those in which we operate. These general economic conditions could have a material adverse effect on our cash flow from operations, results of operations and overall financial condition.
The availability, cost and terms of credit also have been and may continue to be adversely affected by illiquid markets and wider credit spreads. Concern about the stability of the markets generally and the strength of counterparties specifically has led many lenders and institutional investors to reduce credit to businesses and consumers. These factors have led to a decrease in spending by businesses and consumers over the past several years, and a corresponding slowdown in global infrastructure spending. Continued uncertainty in the U.S. and international markets and economies and prolonged stagnation in business and consumer spending may adversely affect our liquidity and financial condition, and the liquidity and financial condition of our customers, including our ability to access capital markets and obtain capital lease financing to meet liquidity needs.
Fluctuations in the exchange rate of the U.S. dollar and in foreign currencies may adversely impact our results of operations and financial condition.
We conduct various operations outside the United States, primarily in the United Kingdom. As a result, we face exposure to movements in currency exchange rates. These exposures include but are not limited to:
• | re-measurement gains and losses from changes in the value of foreign denominated assets and liabilities; |
• | translation gains and losses on foreign subsidiary financial results that are translated into U.S. dollars, our functional currency, upon consolidation; and |
15
• | planning risk related to changes in exchange rates between the time we prepare our annual and quarterly forecasts and when actual results occur. |
Depending on the size of the exposures and the relative movements of exchange rates, if we choose to hedge or fail to hedge effectively our exposure, we could experience a material adverse effect on results of operations and financial condition. As we have seen in some recent periods, in the event of volatility in exchange rates, these exposures can increase, and the impact on our results of operations and financial condition can be more pronounced. In addition, the current environment and the increasingly global nature of our business have made hedging these exposures more complex and costly.
We are subject to risks associated with our international operations.
We operate in international markets, and may in the future consummate additional investments in or acquisitions of foreign businesses. Our international operations are subject to a number of risks, including:
• | political conditions and events, including embargoes; |
• | restrictive actions by U.S. and foreign governments; |
• | the imposition of withholding or other taxes on foreign income, tariffs or restrictions on foreign trade and investment; |
• | adverse tax consequences; |
• | limitations on repatriation of earnings; |
• | currency exchange controls and import/export quotas; |
• | nationalization, expropriation, asset seizure, blockades and blacklisting; |
• | limitations in the availability, amount or terms of insurance coverage; |
• | loss of contract rights and inability to adequately enforce contracts; |
• | political instability, war and civil disturbances or other risks that may limit or disrupt markets, such as terrorist attacks, piracy and kidnapping; |
• | outbreaks of pandemic diseases or fear of such outbreaks; |
• | fluctuations in currency exchange rates, hard currency shortages and controls on currency exchange that affect demand for our services and our profitability; |
• | potential noncompliance with a wide variety of laws and regulations, such as the U.S. Foreign Corrupt Practices Act of 1977 (the “FCPA”), and similar non-U.S. laws and regulations, including the U.K. Bribery Act 2010; |
• | labor strikes; |
• | changes in general economic and political conditions; |
• | adverse changes in foreign laws or regulatory requirements; and |
• | different liability standards and legal systems that may be less developed and less predictable than those in the United States. |
If we are unable to adequately address these risks, we could lose our ability to operate in certain international markets and our business, financial condition or results of operations could be materially adversely affected.
The U.S. Departments of Justice, Commerce, Treasury and other agencies and authorities have a broad range of civil and criminal penalties they may seek to impose against companies for violations of export controls, the FCPA, and other federal statutes, sanctions and regulations, including those established by the Office of Foreign Assets Control (“OFAC”) and, increasingly, similar or more restrictive foreign laws, rules and regulations. By virtue of these laws and regulations, and under laws and regulations in other jurisdictions, we may be obliged to limit our business activities, we may incur costs for compliance programs and we may be subject to enforcement actions or penalties for noncompliance. In recent years, U.S. and foreign governments have increased their oversight and enforcement activities with respect to these laws and we expect the relevant agencies to continue to increase these activities. A violation of these laws, sanctions or regulations could materially adversely affect our business, financial condition or results of operations.
We have compliance policies in place for our employees with respect to FCPA, OFAC and similar laws, but there can be no assurance that our employees, consultants or agents will not engage in conduct for which we may be held responsible. Violations of the FCPA, OFAC and other laws, sanctions or regulations may result in severe criminal or civil penalties, and we may be subject to other liabilities, which could materially adversely affect our business, financial condition or results of operations.
16
We have identified material weaknesses in our internal control over financial reporting related to the preparation and review of our income tax provisions and related accounts, the valuation of a business acquisition, and the application of US GAAP to complex and/or non-routine transactions, which could, if not remediated, adversely affect our ability to report our financial condition and results of operations in a timely and accurate manner.
Management, through documentation, testing and assessment of our internal control over financial reporting pursuant to the rules promulgated by the SEC under Section 404 of the Sarbanes-Oxley Act of 2002 and Item 308 of Regulation S-K, has concluded that our internal control over financial reporting had a material weakness related to the accounting for income taxes, including the income tax provision and related tax assets and liabilities. Additionally, management identified a material weakness in our internal controls over the valuation of a business acquisition and the application of U.S. GAAP to complex and/or non-routine transactions. In particular, the Company determined that it incorrectly accounted for the acquisition of American Natural Gas, completed on August 1, 2014 in its financial statements for the quarter ended September 30, 2014 as required by FASB Accounting Standards Codification 805. In addition, we determined that the valuation of the net assets acquired was incorrect, resulting in goodwill of $1.4 million.
A material weakness is a deficiency, or a combination of deficiencies, in internal control over financial reporting, such that there is a reasonable possibility that a material misstatement of our annual or interim financial statements will not be prevented or detected on a timely basis.
As a result of this material weakness, our management has concluded that our internal control over financial reporting was not effective as of December 31, 2014. We are actively engaged in developing a remediation plan designed to address these material weaknesses, which may cause us to incur additional expense and devote management resources in remediating the material weaknesses in 2015. The effects of the material weaknesses are discussed in more detail in Item 9A, Controls and Procedures.
In future periods, if the process required by Section 404 of the Sarbanes-Oxley Act reveals further material weaknesses or significant deficiencies, the correction of any such material weakness or significant deficiency could require additional remedial measures including additional personnel which could be costly and time-consuming. If a material weakness exists as of a future period year-end (including a material weakness identified prior to year-end for which there is an insufficient period of time to evaluate and confirm the effectiveness of the corrections or related new procedures), our management will be unable to report favorably as of such future period year-end to the effectiveness of our control over financial reporting. If we are unable to assert that our internal control over financial reporting is effective in any future period, or if we continue to experience material weaknesses in our internal control over financial reporting for accounting for income taxes, we could lose investor confidence in the accuracy and completeness of our financial reports, which could have an adverse effect on our share price and potentially subject us to additional and potentially costly litigation and governmental inquiries/investigations.
We may be required to expend substantial sums in order to bring Schuff, GMSL and ANG, as well as other companies we have acquired or may acquire in the future, into compliance with the various reporting requirements applicable to public companies and/or to prepare required financial statements, and such efforts may harm our operating results or be unsuccessful altogether.
Prior to our acquisition of Schuff, GMSL and ANG, such companies were not subject to many of the requirements applicable to public companies, including Section 404 of the Sarbanes-Oxley Act of 2002, (the “Sarbanes-Oxley Act”), which requires publicly traded companies to establish, evaluate and report on their internal control over financial reporting. We will need to evaluate and integrate the system of internal control over financial reporting for Schuff, GMSL and ANG. We did not conduct a formal evaluation of Schuff’s, GMSL’s or ANG’s internal control over financial reporting prior to our acquisition of those companies. Moreover, as disclosed under Item 9A, “Management’s Report on Internal Control Over Financial Reporting,” in accordance with SEC rules, we have excluded from management’s assessment of the effectiveness of our internal control over financial reporting as of December 31, 2014 the internal control over financial reporting of businesses that we acquired in 2014, including Schuff, GMSL and ANG. If we discover any material weaknesses in internal control over financial reporting in companies we acquire, including Schuff, GMSL or ANG, as we continue to assess such controls we may be required to hire additional staff and incur substantial legal and accounting costs to address such inadequacies. Moreover, we cannot be certain that our remedial measures will be effective. Any failure to implement required or improved controls, or difficulties encountered in their implementation, could harm our operating results or increase the risk of a material weakness in internal controls, in addition to the risks described under “We have identified material weaknesses in our internal control over financial reporting related to the preparation and review of our income tax provisions and related accounts and the application of US GAAP to complex and/or non-routine transactions, which could, if not remediated, adversely affect our ability to report our financial condition and results of operations in a timely and accurate manner.”
17
We face certain risks associated with the acquisition or disposition of businesses and lack of control over investments in associates.
In pursuing our corporate strategy, we may acquire or dispose of or exit businesses or reorganize existing investments. The success of this strategy is dependent upon our ability to identify appropriate opportunities, negotiate transactions on favorable terms and ultimately complete such transactions. Once we complete acquisitions or reorganizations there can be no assurance that we will realize the anticipated benefits of any transaction, including revenue growth, operational efficiencies or expected synergies. For example, if we fail to recognize some or all of the strategic benefits and synergies expected from a transaction, goodwill and intangible assets may be impaired in future periods. The negotiations associated with the acquisition and disposition of businesses could also disrupt our ongoing business, distract management and employees or increase our expenses.
In addition, we may not be able to integrate acquisitions successfully, including Schuff and GMSL, and we could incur or assume unknown or unanticipated liabilities or contingencies, which may impact our results of operations. If we dispose of or otherwise exit certain businesses, there can be no assurance that we will not incur certain disposition related charges, or that we will be able to reduce overhead related to the divested assets.
In addition to the risks described above, acquisitions are accompanied by a number of inherent risks, including, without limitation, the following:
• | the difficulty of integrating acquired products, services or operations; |
• | difficulties in maintaining uniform standards, controls, procedures and policies; |
• | the potential impairment of relationships with employees and customers as a result of any integration of new management personnel; |
• | difficulties in disposing of the excess or idle facilities of an acquired company or business and expenses in maintaining such facilities; and |
• | the effect of and potential expenses under the labor, environmental and other laws and regulations of various jurisdictions to which the business acquired is subject. |
We also own an interest in a number of entities, such as Novatel, over which we do not exercise or have only little management control and we are therefore unable to direct or manage the business to realize the anticipated benefits that we can achieve through full integration.
We have incurred substantial costs in connection with our prior acquisitions and expect to incur substantial costs in connection with any other transaction we complete in the future, which may increase our indebtedness or reduce the amount of our available cash and could adversely affect our financial condition, results of operations and liquidity.
We have incurred substantial costs in connection with our prior acquisitions and expect to incur substantial costs in connection with any other transactions we complete in the future. These costs may increase our
indebtedness or reduce the amount of cash otherwise available to us for acquisitions, business opportunities and other corporate purposes. There is no assurance that the actual costs will not exceed our estimates. We may continue to incur additional material charges reflecting additional costs associated with our investments and the integration of our acquisitions, including our acquisition of Schuff and GMSL, in fiscal quarters subsequent to the quarter in which such investments and acquisitions were consummated.
We could consume resources in researching acquisitions, business opportunities or financings and capital market transactions that are not consummated, which could materially adversely affect subsequent attempts to locate and acquire or invest in another business.
We anticipate that the investigation of each specific acquisition or business opportunity and the negotiation, drafting and execution of relevant agreements, disclosure documents and other instruments with respect to such transaction will require substantial management time and attention and substantial costs for financial advisors, accountants, attorneys and other advisors. If a decision is made not to consummate a specific acquisition, business opportunity or financing and capital market transaction, the costs incurred up to that point for the proposed transaction likely would not be recoverable. Furthermore, even if an agreement is reached relating to a specific acquisition, investment target or financing, we may fail to consummate the investment or acquisition for any number of reasons, including those beyond our control. Any such event could consume significant management time and result in a loss to us of the related costs incurred, which could adversely affect our financial position and our ability to consummate other acquisitions and investments.
18
Our participation in current or any future joint investment could be adversely affected by our lack of sole decision-making authority, our reliance on a partner’s financial condition and disputes between us and the relevant partners.
We have, indirectly through our subsidiaries, formed joint ventures, and may in the future engage in similar joint ventures with third parties. For example, Schuff has formed the Schuff Hopsa Engineering, Inc. joint venture located in Panama, and GMSL operates various joint ventures outside of the United States. In such circumstances, we may not be in a position to exercise significant decision-making authority if we do not own a substantial majority of the equity interests of such joint venture or otherwise have contractual rights entitling us to exercise such authority. These ventures may involve risks not present were a third party not involved, including the possibility that partners might become insolvent or fail to fund their share of required capital contributions. In addition, partners may have economic or other business interests or goals that are inconsistent with our business interests or goals, and may be in a position to take actions contrary to our policies or objectives. Disputes between us and partners may result in litigation or arbitration that would increase our costs and expenses and divert a substantial amount of management’s time and effort away from our businesses. We may also, in certain circumstances, be liable for the actions of our third-party partners.
There may be tax consequences associated with our acquisition, investment, holding and disposition of target companies and assets.
We may incur significant taxes in connection with effecting acquisitions of or investments in, holding, receiving payments from, operating or disposing of target companies and assets. Our decision to make a particular acquisition, sell a particular asset or increase or decrease a particular investment may be based on considerations other than the timing and amount of taxes owed as a result thereof.
We rely on information systems to conduct our businesses, and failure to protect these systems against security breaches and otherwise maintain such systems in working order could have a material adverse effect on our results of operations, cash flows or financial condition.
The efficient operation of our businesses is dependent on computer hardware and software systems. Information systems are vulnerable to security breaches, and we rely on industry-accepted security measures and technology to securely maintain confidential and proprietary information maintained on our information systems. However, these measures and technology may not adequately prevent security breaches. In addition, the unavailability of the information systems or the failure of these systems to perform as anticipated for any other reason could disrupt our businesses and result in decreased performance and increased costs, causing our results of operations, cash flows or financial condition to suffer.
Risks Related to Schuff
Schuff’s business is dependent upon major construction contracts, the unpredictable timing of which may result in significant fluctuations in its cash flow due to the timing of receipt of payment under such contracts.
Schuff’s cash flow is dependent upon obtaining major construction contracts primarily from general contractors and engineering firms responsible for commercial and industrial construction projects, such as high- and low-rise buildings and office complexes, hotels and casinos, convention centers, sports arenas, shopping malls, hospitals, dams, bridges, mines and power plants. The timing of or failure to obtain contracts, delays in awards of contracts, cancellations of contracts, delays in completion of contracts, or failure to obtain timely payment from Schuff’s customers, could result in significant periodic fluctuations in cash flows from Schuff’s operations. In addition, many of Schuff’s contracts require it to satisfy specific progress or performance milestones in order to receive payment from the customer. As a result, Schuff may incur significant costs for engineering, materials, components, equipment, labor or subcontractors prior to receipt of payment from a customer. Such expenditures could have a material adverse effect on Schuff’s results of operations, cash flows or financial condition.
The nature of Schuff’s primary contracting terms for its contracts, including fixed-price and cost-plus pricing, could have a material adverse effect on Schuff’s results of operations, cash flows or financial condition.
Schuff’s projects are awarded through a competitive bid process or are obtained through negotiation, in either case generally using one of two types of contract pricing approaches: fixed-price or cost-plus pricing. Under fixed-price contracts, Schuff performs its services and executes its projects at an established price, subject to adjustment only for change orders approved by the customer, and, as a result, it may benefit from cost savings but be unable to recover any cost overruns. If Schuff does not execute such a contract within cost estimates, it may incur losses or the project may be less profitable than expected. Historically, the majority of Schuff’s contracts have been fixed-price arrangements. The revenue, cost and gross
19
profit realized on such contracts can vary, sometimes substantially, from the original projections due to a variety of factors, including, but not limited to:
• | failure to properly estimate costs of materials, including steel and steel components, engineering services, equipment, labor or subcontractors; |
• | costs incurred in connection with modifications to a contract that may be unapproved by the customer as to scope, schedule, and/or price; |
• | unanticipated technical problems with the structures, equipment or systems we supply; |
• | unanticipated costs or claims, including costs for project modifications, customer-caused delays, errors or changes in specifications or designs, or contract termination; |
• | changes in the costs of materials, engineering services, equipment, labor or subcontractors; |
• | changes in labor conditions, including the availability and productivity of labor; |
• | productivity and other delays caused by weather conditions; |
• | failure to engage necessary suppliers or subcontractors, or failure of such suppliers or subcontractors to perform; |
• | difficulties in obtaining required governmental permits or approvals; |
• | changes in laws and regulations; and |
• | changes in general economic conditions. |
Under cost-plus contracts, Schuff receives reimbursement for its direct labor and material cost, plus a specified fee in excess thereof, which is typically a fixed rate per hour, an overall fixed fee, or a percentage of total reimbursable costs, up to a maximum amount, which is an arrangement that may protect Schuff against cost overruns. If Schuff is unable to obtain proper reimbursement for all costs incurred due to improper estimates, performance issues, customer disputes, or any of the additional factors noted above for fixed-price contracts, the project may be less profitable than expected.
Generally, Schuff’s contracts and projects vary in length from 1 to 12 months, depending on the size and complexity of the project, project owner demands and other factors. The foregoing risks are exacerbated for projects with longer-term durations because there is an increased risk that the circumstances upon which Schuff based its original estimates will change in a manner that increases costs. In addition, Schuff sometimes bears the risk of delays caused by unexpected conditions or events. To the extent there are future cost increases that Schuff cannot recover from its customers, suppliers or subcontractors, the outcome could have a material adverse effect on Schuff’s results of operations, cash flows or financial condition.
Furthermore, revenue and gross profit from Schuff’s contracts can be affected by contract incentives or penalties that may not be known or finalized until the later stages of the contract term. Some of Schuff’s contracts provide for the customer’s review of its accounting and cost control systems to verify the completeness and accuracy of the reimbursable costs invoiced. These reviews could result in reductions in reimbursable costs and labor rates previously billed to the customer.
The cumulative impact of revisions in total cost estimates during the progress of work is reflected in the period in which these changes become known, including, to the extent required, the reversal of profit recognized in prior periods and the recognition of losses expected to be incurred on contracts in progress. Due to the various estimates inherent in Schuff’s contract accounting, actual results could differ from those estimates.
Schuff’s billed and unbilled revenue may be exposed to potential risk if a project is terminated or canceled or if Schuff’s customers encounter financial difficulties.
Schuff’s contracts often require it to satisfy or achieve certain milestones in order to receive payment for the work performed. As a result, under these types of arrangements, Schuff may incur significant costs or perform significant amounts of services prior to receipt of payment. If the ultimate customer does not proceed with the completion of the project or if the customer or contractor under which Schuff is a subcontractor defaults on its payment obligations, Schuff may face difficulties in collecting payment of amounts due to it for the costs previously incurred. If Schuff is unable to collect amounts owed to it, this could have a material adverse effect on Schuff’s results of operations, cash flows or financial condition.
Schuff may be exposed to additional risks as it obtains new significant awards and executes its backlog, including greater backlog concentration in fewer projects, potential cost overruns and increasing requirements for letters of credit, each of which could have a material adverse effect on Schuff’s results of operations, cash flows or financial condition.
20
As Schuff obtains new significant project awards, these projects may use larger sums of working capital than other projects and Schuff’s backlog may become concentrated among a smaller number of customers. Approximately $203.1 million, representing 56.9%, of Schuff’s backlog at December 31, 2014 was attributable to five contracts, letters of intent, notices to proceed or purchase orders. If any significant projects such as these currently included in Schuff’s backlog or awarded in the future were to have material cost overruns, or be significantly delayed, modified or canceled, Schuff’s results of operations, cash flows or financial position could be adversely impacted.
Additionally, as Schuff converts its significant projects from backlog into active construction, it may face significantly greater requirements for the provision of letters of credit or other forms of credit enhancements. We can provide no assurance that Schuff would be able to access such capital and credit as needed or that it would be able to do so on economically attractive terms. Moreover, Schuff may be unable to replace the projects that it executes in its backlog.
Schuff may not be able to fully realize the revenue value reported in its backlog, a substantial portion of which is attributable to a relatively small number of large contracts or other commitments.
As of December 31, 2014, Schuff had a backlog of work to be completed of approximately $357.0 million ($305.3 million under contracts or purchase orders and $51.7 million under letters of intent). Backlog develops as a result of new awards, which represent the revenue value of new project commitments received by Schuff during a given period, including legally binding commitments without a defined scope. Commitments may be in the form of written contracts, letters of intent, notices to proceed and purchase orders. New awards may also include estimated amounts of work to be performed based on customer communication and historic experience and knowledge of our customers’ intentions. Backlog consists of projects which have either not yet been started or are in progress but are not yet complete. In the latter case, the revenue value reported in backlog is the remaining value associated with work that has not yet been completed, which increases or decreases to reflect modifications in the work to be performed under a given commitment. The revenue projected in Schuff’s backlog may not be realized or, if realized, may not be profitable as a result of poor contract terms or performance.
Due to project terminations, suspensions or changes in project scope and schedule, we cannot predict with certainty when or if Schuff’s backlog will be performed. From time to time, projects are canceled that appeared to have a high certainty of going forward at the time they were recorded as new awards. In the event of a project cancellation, Schuff typically has no contractual right to the total revenue reflected in its backlog. Some of the contracts in Schuff’s backlog provide for cancellation fees or certain reimbursements in the event customers cancel projects. These cancellation fees usually provide for reimbursement of Schuff’s out-of-pocket costs, costs associated with work performed prior to cancellation, and, to varying degrees, a percentage of the profit Schuff would have realized had the contract been completed. Although Schuff may be reimbursed for certain costs, it may be unable to recover all direct costs incurred and may incur additional unrecoverable costs due to the resulting under-utilization of Schuff’s assets. Approximately $203.1 million, representing 56.9%, of Schuff’s backlog at December 31, 2014 was attributable to five contracts, letters of intent, notices to proceed or purchase orders. If one or more of these large contracts or other commitments are terminated or their scope reduced, Schuff’s backlog could decrease substantially.
Schuff’s failure to meet contractual schedule or performance requirements could have a material adverse effect on Schuff’s results of operations, cash flows or financial condition.
In certain circumstances, Schuff guarantees project completion by a scheduled date or certain performance levels. Failure to meet these schedule or performance requirements could result in a reduction of revenue and additional costs, and these adjustments could exceed projected profit. Project revenue or profit could also be reduced by liquidated damages withheld by customers under contractual penalty provisions, which can be substantial and can accrue on a daily basis. Schedule delays can result in costs exceeding our projections for a particular project. Performance problems for existing and future contracts could cause actual results of operations to differ materially from those previously anticipated and could cause us to suffer damage to our reputation within our industry and our customer base.
Schuff’s government contracts may be subject to modification or termination, which could have a material adverse effect on Schuff’s results of operations, cash flows or financial condition.
Schuff is a provider of services to U.S. government agencies and is therefore exposed to risks associated with government contracting. Government agencies typically can terminate or modify contracts to which Schuff
is a party at their convenience, due to budget constraints or various other reasons. As a result, Schuff’s backlog may be reduced or it may incur a loss if a government agency decides to terminate or modify a contract to which Schuff is a party. Schuff is also subject to audits, including audits of internal control systems, cost reviews and investigations by government contracting oversight agencies. As a result of an audit, the oversight agency may disallow certain costs or withhold a percentage of interim
21
payments. Cost disallowances may result in adjustments to previously reported revenue and may require Schuff to refund a portion of previously collected amounts. In addition, failure to comply with the terms of one or more of our government contracts or government regulations and statutes could result in Schuff being suspended or debarred from future government projects for a significant period of time, possible civil or criminal fines and penalties, the risk of public scrutiny of our performance, and potential harm to Schuff’s reputation, each of which could have a material adverse effect on Schuff’s results of operations, cash flows or financial condition. Other remedies that government agencies may seek for improper activities or performance issues include sanctions such as forfeiture of profit and suspension of payments.
In addition to the risks noted above, legislatures typically appropriate funds on a year-by-year basis, while contract performance may take more than one year. As a result, contracts with government agencies may be only partially funded or may be terminated, and Schuff may not realize all of the potential revenue and profit from those contracts. Appropriations and the timing of payment may be influenced by, among other things, the state of the economy, competing political priorities, curtailments in the use of government contracting firms, budget constraints, the timing and amount of tax receipts and the overall level of government expenditures.
Schuff is exposed to potential risks and uncertainties associated with its reliance on subcontractors and third-party vendors to execute certain projects.
Schuff relies on third-party suppliers, especially suppliers of steel and steel components, and subcontractors to assist in the completion of projects. To the extent these parties cannot execute their portion of the work and are unable to deliver their services, equipment or materials according to the agreed-upon contractual terms, or Schuff cannot engage subcontractors or acquire equipment or materials, Schuff’s ability to complete a project in a timely manner may be impacted. Furthermore, when bidding or negotiating for contracts, Schuff must make estimates of the amounts these third parties will charge for their services, equipment and materials. If the amount Schuff is required to pay for third-party goods and services in an effort to meet its contractual obligations exceeds the amount it has estimated, Schuff could experience project losses or a reduction in estimated profit.
Any increase in the price of, or change in supply and demand for, the steel and steel components that Schuff utilizes to complete projects could have a material adverse effect on Schuff’s results of operations, cash flows or financial condition.
The prices of the steel and steel components that Schuff utilizes in the course of completing projects are susceptible to price fluctuations due to supply and demand trends, energy costs, transportation costs, government regulations, duties and tariffs, changes in currency exchange rates, price controls, general economic conditions and other unforeseen circumstances. Although Schuff may attempt to pass on certain of these increased costs to its customers, it may not be able to pass all of these cost increases on to its customers. As a result, Schuff’s margins may be adversely impacted by such cost increases.
Schuff’s dependence on suppliers of steel and steel components makes it vulnerable to a disruption in the supply of its products.
Schuff purchases a majority of the steel and steel components utilized in the course of completing projects from several domestic and foreign steel producers and suppliers. Although Schuff has long-standing relationships with many of its suppliers, it generally does not have long-term contracts with them. An adverse change in any of the following could have a material adverse effect on Schuff’s results of operations or financial condition:
• | its ability to identify and develop relationships with qualified suppliers; |
• | the terms and conditions upon which it purchases products from its suppliers, including applicable exchange rates, transport costs and other costs, its suppliers’ willingness to extend credit to it to finance its inventory purchases and other factors beyond its control; |
• | financial condition of its suppliers; |
• | political instability in the countries in which its suppliers are located; |
• | its ability to import products; |
• | its suppliers’ noncompliance with applicable laws, trade restrictions and tariffs; |
• | its inability to find replacement suppliers in the event of a deterioration of the relationship with current suppliers; or |
• | its suppliers’ ability to manufacture and deliver products according to its standards of quality on a timely and efficient basis. |
Intense competition in the markets Schuff serves could reduce Schuff’s market share and earnings.
22
The principal geographic and product markets Schuff serves are highly competitive, and this intense competition is expected to continue. Schuff competes with other contractors for commercial, industrial and specialty projects on a local, regional, or national basis. Continued service within these markets requires substantial resources and capital investment in equipment, technology and skilled personnel, and certain of Schuff’s competitors have financial and operating resources greater than Schuff. Competition also places downward pressure on Schuff’s contract prices and margins. Among the principal competitive factors within the industry are price, timeliness of completion of projects, quality, reputation, and the desire of customers to utilize specific contractors with whom they have favorable relationships and prior experience. While Schuff believes that it maintains a competitive advantage with respect to these factors, failure to continue to do so or to meet other competitive challenges could have a material adverse effect on Schuff’s results of operations, cash flows or financial condition.
Schuff’s customers’ ability to receive the applicable regulatory and environmental approvals for projects and the timeliness of those approvals could adversely affect Schuff’s business.
The regulatory permitting process for Schuff’s projects requires significant investments of time and money by Schuff’s customers and sometimes by Schuff. There are no assurances that Schuff’s customers or Schuff will obtain the necessary permits for these projects. Applications for permits may be opposed by governmental entities, individuals or special interest groups, resulting in delays and possible non-issuance of the permits.
Schuff’s failure to obtain or maintain required licenses may adversely affect its business.
Schuff is subject to licensure and hold licenses in each of the states in the United States in which it operates and in certain local jurisdictions within such states. While we believe that Schuff is in material compliance with all contractor licensing requirements in the various jurisdictions in which it operates, the failure to obtain, loss of or revocation of any license or the limitation on any of Schuff’s primary services thereunder in any jurisdiction in which it conducts substantial operations could prevent Schuff from conducting further operations in such jurisdiction and have a material adverse effect on Schuff’s results of operations, cash flows or financial condition.
Volatility in equity and credit markets could adversely impact Schuff due to its impact on the availability of funding for Schuff’s customers, suppliers and subcontractors.
Some of Schuff’s ultimate customers, suppliers and subcontractors have traditionally accessed commercial financing and capital markets to fund their operations, and the availability of funding from those sources could be
adversely impacted by volatile equity or credit markets. The unavailability of financing could lead to the delay or cancellation of projects or the inability of such parties to pay Schuff or provide needed products or services and thereby have a material adverse effect on Schuff’s results of operations, cash flows or financial condition.
Schuff’s business may be adversely affected by bonding and letter of credit capacity.
Certain of Schuff’s projects require the support of bid and performance surety bonds or letters of credit. A restriction, reduction, or termination of Schuff’s surety bond agreements or letter of credit facilities could limit its ability to bid on new project opportunities, thereby limiting new awards, or perform under existing awards.
Schuff is vulnerable to significant fluctuations in its liquidity that may vary substantially over time.
Schuff’s operations could require the utilization of large sums of working capital, sometimes on short notice and sometimes without assurance of recovery of the expenditures. Circumstances or events that could create large cash outflows include losses resulting from fixed-price contracts, environmental liabilities, litigation risks, contract initiation or completion delays, customer payment problems, professional and product liability claims and other unexpected costs. Although Schuff’s facilities provide it with a source of liquidity, there is no guarantee that such facilities will be sufficient to meet Schuff’s liquidity needs or that Schuff will be able to maintain such facilities or obtain any other sources of liquidity on attractive terms, or at all.
Schuff’s projects expose it to potential professional liability, product liability, warranty and other claims.
Schuff’s operations are subject to the usual hazards inherent in providing engineering and construction services for the construction of often large commercial industrial facilities, such as the risk of accidents, fires and explosions. These hazards can cause personal injury and loss of life, business interruptions, property damage and pollution and environmental damage. Schuff may be subject to claims as a result of these hazards. In addition, the failure of any of Schuff’s products to conform to
23
customer specifications could result in warranty claims against it for significant replacement or rework costs, which could have a material adverse effect on Schuff’s results of operations, cash flows or financial condition.
Although Schuff generally does not accept liability for consequential damages in its contracts, should it be determined liable, it may not be covered by insurance or, if covered, the dollar amount of these liabilities may exceed applicable policy limits. Any catastrophic occurrence in excess of insurance limits at project sites involving Schuff’s products and services could result in significant professional liability, product liability, warranty or other claims against Schuff. Any damages not covered by insurance, in excess of insurance limits or, if covered by insurance, subject to a high deductible, could result in a significant loss for Schuff, which may reduce its profits and cash available for operations. These claims could also make it difficult for Schuff to obtain adequate insurance coverage in the future at a reasonable cost.
Additionally, customers or subcontractors that have agreed to indemnify Schuff against such losses may refuse or be unable to pay Schuff.
Schuff may experience increased costs and decreased cash flow due to compliance with environmental laws and regulations, liability for contamination of the environment or related personal injuries.
Schuff is subject to environmental laws and regulations, including those concerning emissions into the air, discharge into waterways, generation, storage, handling, treatment and disposal of waste materials and health and safety.
Schuff’s fabrication business often involves working around and with volatile, toxic and hazardous substances and other highly regulated pollutants, substances or wastes, for which the improper characterization, handling or disposal could constitute violations of U.S. federal, state or local laws and regulations and laws of
other countries, and result in criminal and civil liabilities. Environmental laws and regulations generally impose limitations and standards for certain pollutants or waste materials and require Schuff to obtain permits and comply with various other requirements. Governmental authorities may seek to impose fines and penalties on Schuff, or revoke or deny issuance or renewal of operating permits for failure to comply with applicable laws and regulations. Schuff is also exposed to potential liability for personal injury or property damage caused by any release, spill, exposure or other accident involving such pollutants, substances or wastes. In connection with the historical operation of our facilities, substances which currently are or might be considered hazardous may have been used or disposed of at some sites in a manner that may require us to make expenditures for remediation.
The environmental, health and safety laws and regulations to which Schuff is subject are constantly changing, and it is impossible to predict the impact of such laws and regulations on Schuff in the future. We cannot ensure that Schuff’s operations will continue to comply with future laws and regulations or that these laws and regulations will not cause Schuff to incur significant costs or adopt more costly methods of operation. Additionally, the adoption and implementation of any new regulations imposing reporting obligations on, or limiting emissions of greenhouse gases from, Schuff’s customers’ equipment and operations could significantly impact demand for Schuff’s services, particularly among its customers for industrial facilities.
Any expenditures in connection with compliance or remediation efforts or significant reductions in demand for Schuff’s services as a result of the adoption of environmental proposals could have a material adverse effect on Schuff’s results of operations, cash flows or financial condition.
Schuff is and will likely continue to be involved in litigation that could have a material adverse effect on Schuff’s results of operations, cash flows or financial condition.
Schuff has been and may be, from time to time, named as a defendant in legal actions claiming damages in connection with fabrication and other products and services Schuff provides and other matters. These are typically claims that arise in the normal course of business, including employment-related claims and contractual disputes or claims for personal injury or property damage which occur in connection with services performed relating to project or construction sites. Contractual disputes normally involve claims relating to the timely completion of projects or other issues concerning fabrication and other products and services Schuff provides. While we do not believe that any of Schuff’s pending contractual, employment-related personal injury or property damage claims and disputes will have a material effect on Schuff’s future results of operations, cash flows or financial condition, there can be no assurance that this will be the case.
Work stoppages, union negotiations and other labor problems could adversely affect Schuff’s business.
24
A portion of Schuff’s employees are represented by labor unions. A lengthy strike or other work stoppage at any of its facilities could have a material adverse effect on Schuff’s business. There is inherent risk that ongoing or future negotiations relating to collective bargaining agreements or union representation may not be favorable to Schuff. From time to time, Schuff also has experienced attempts to unionize its non-union facilities. Such efforts can often disrupt or delay work and present risk of labor unrest.
Schuff’s employees work on projects that are inherently dangerous, and a failure to maintain a safe work site could result in significant losses.
Safety is a primary focus of Schuff’s business and is critical to all of its employees and customers, as well as its reputation. However, Schuff often works on large-scale and complex projects, frequently in geographically remote locations. Such involvement often places Schuff’s employees and others near large equipment, dangerous processes or highly regulated materials. If Schuff or other parties fail to implement appropriate safety procedures for which they are responsible or if such procedures fail, Schuff’s employees or others may suffer injuries. In addition to being subject to state and federal regulations concerning health and safety, many of Schuff’s customers require that it meet certain safety criteria to be eligible to bid on contracts, and some of Schuff’s contract fees or profits are subject to satisfying safety criteria. Unsafe work conditions also have the potential of increasing employee turnover, project costs and operating costs. Although Schuff has adopted important safety policies that are administered and enforced by functional groups whose primary purpose is to implement effective health, safety and environmental procedures, the failure to comply with such policies, customer contracts or applicable regulations could subject Schuff to losses and liability.
Risks Related to GMSL
GMSL may be unable to maintain or replace its vessels as they age.
As of December 31, 2014, the average age of the vessels operated by GMSL was approximately 22 years. The expense of maintaining, repairing and upgrading GMSL’s vessels typically increases with age, and after a period of time the cost necessary to satisfy required marine certification standards may not be economically justifiable. There can be no assurance that GMSL will be able to maintain its fleet by extending the economic life of its existing vessels, or that its financial resources will be sufficient to enable it to make the expenditures necessary for these purposes. In addition, the supply of second-hand replacement vessels is relatively limited and the costs associated with acquiring a newly constructed vessel are high. In the event that GMSL was to lose the use of any of its vessels for a sustained period of time, its financial performance would be adversely affected.
The operation and leasing of seagoing vessels entails the possibility of marine disasters including damage or destruction of vessels due to accident, the loss of vessels due to piracy or terrorism, damage or destruction of cargo and similar events that may cause a loss of revenue from affected vessels and damage GMSL’s business reputation, which may in turn lead to loss of business.
The operation of seagoing vessels entails certain inherent risks that may adversely affect GMSL’s business and reputation, including:
• | damage or destruction of a vessel due to marine disaster such as a collision or grounding; |
• | the loss of a vessel due to piracy and terrorism; |
• | cargo and property losses or damage as a result of the foregoing or less drastic causes such as human error, mechanical failure and bad weather; |
• | environmental accidents as a result of the foregoing; and |
• | business interruptions and delivery delays caused by mechanical failure, human error, war, terrorism, political action in various countries, labor strikes or adverse weather conditions. |
Any of these circumstances or events could substantially increase GMSL’s operating costs, as for example, the cost of substituting or replacing a vessel, or lower its revenues by taking vessels out of operation permanently or for periods of time. The involvement of GMSL’s vessels in a disaster or delays in delivery or damages or loss of cargo may harm its reputation as a safe and reliable vessel operator and cause it to lose business.
GMSL’s operations are subject to complex laws and regulations, including environmental laws and regulations that result in substantial costs and other risks.
25
GMSL does significant business with clients in the oil and natural gas industry, which is extensively regulated by U.S. federal, state, tribal, and local authorities, and corresponding foreign governmental authorities. Legislation and regulations affecting the oil and natural gas industry are under constant review for amendment or expansion, raising the possibility of changes that may become more stringent and, as a result, may affect, among other things, the pricing or marketing of crude oil and natural gas production. Noncompliance with statutes and regulations and more vigorous enforcement of such statutes and regulations by regulatory agencies may lead to substantial administrative, civil, and criminal penalties, including the assessment of natural resource damages, the imposition of significant investigatory and remedial obligations, and may also result in the suspension or termination of our operations.
Litigation, enforcement actions, fines or penalties could adversely impact GMSL’s financial condition or results of operations and damage its reputation.
GMSL’s business is subject to various international laws and regulations that could lead to enforcement actions, fines, civil or criminal penalties or the assertion of litigation claims and damages. In addition, improper conduct by GMSL’s employees or agents could damage its reputation and lead to litigation or legal proceedings that could result in significant awards or settlements to plaintiffs and civil or criminal penalties, including substantial monetary fines. Such events could lead to an adverse impact on GMSL’s financial condition or results of operations, if not mitigated by its insurance coverage.
As a result of any ship or other incidents, litigation claims, enforcement actions and regulatory actions and investigations, including, but not limited to, those arising from personal injury, loss of life, loss of or damage to personal property, business interruption losses or environmental damage to any affected coastal waters and the surrounding area, may be asserted or brought against various parties including GMSL. The time and attention of GMSL’s management may also be diverted in defending such claims, actions and investigations. GMSL may also incur costs both in defending against any claims, actions and investigations and for any judgments, fines or civil or criminal penalties if such claims, actions or investigations are adversely determined and not covered by its insurance policies.
Currency exchange rate fluctuations may negatively affect GMSL’s operating results.
The exchange rates between the US dollar, the Singapore dollar and the GBP have fluctuated in recent periods and may fluctuate substantially in the future. Accordingly, any material fluctuation of the exchange rate of the GBP against the US dollar and Singapore dollar could have a negative impact on GMSL’s results of operations and financial condition.
There are risks inherent in foreign joint ventures and investments, such as adverse changes in currency values and foreign regulations.
The joint ventures in which GMSL has operating activities or interests that are located outside the United States are subject to certain risks related to the indirect ownership and development of, or investment in, foreign subsidiaries, including government expropriation and nationalization, adverse changes in currency values and foreign exchange controls, foreign taxes, U.S. taxes on the repatriation of funds to the United States, and other laws and regulations, any of which may have a material adverse effect on GMSL’s investments, financial condition, results of operations, or cash flows.
GMSL derives a significant amount of its revenues from sales to customers in non-U.S. countries, which pose additional risks including economic, political and other uncertainties.
GMSL’s non-U.S. sales are significant in relation to consolidated sales. GMSL believes that non-U.S. sales will remain a significant percentage of its revenue. In addition, sales of its products to customers operating in foreign countries that experience political/economic instability or armed conflict could result in difficulties in delivering and installing complete seismic energy source systems within those geographic areas and receiving payment from these customers. Furthermore, restrictions under the FCPA or similar legislation in other countries, or trade embargoes or similar restrictions imposed by the United States or other countries, could limit GMSL’s ability to do business in certain foreign countries. These factors could materially adversely affect GMSL’s results of operations and financial condition.
Further deterioration of economic opportunities in the Oil and Gas sector could adversely affect the financial growth of GMSL.
The O&G market has experienced an exceptional upheaval over the past several months with the price of oil falling dramatically and this economic weakness could continue into the foreseeable future. Oil prices can be
very volatile and are subject to international supply and demand, political developments, increased supply from new sources and the influence of OPEC in particular. The major operators are reviewing their overall capital spending and this trend is likely
26
to reduce the size and number of projects carried out in the medium term as the project viability comes under greater scrutiny. Ongoing concerns about the systemic impact of lower oil prices and the continued uncertainty of possible reductions in long term capital expenditure could have a material adverse effect on the planned growth of GMSL and eventually curtail the anticipated cash flow and results from operations.
Risks Related to our ICS Operations
Our ICS business is substantially smaller than some of our major competitors, whose marketing and pricing decisions, and relative size advantage could adversely affect our ability to attract and to retain customers and are likely to continue to cause significant pricing pressures that could adversely affect ICS’s net revenues, results of operations and financial condition.
The carrier services telecommunications industry is significantly influenced by the marketing and pricing decisions of the larger business participants. ICS faces competition for its voice trading services from telecommunication services providers’ traditional processes and new companies. Once telecommunication services providers have established business relationships with competitors to ICS, it could be extremely difficult to convince them to utilize our services. These competitors may be able to develop services or processes that are superior to ICS’s services or processes, or that achieve greater industry acceptance.
Many of our competitors are significantly larger than us and have substantially greater financial, technical and marketing resources, larger networks, a broader portfolio of service offerings, greater control over network and transmission lines, stronger name recognition and customer loyalty and long-standing relationships with our target customers. As a result, our ability to attract and retain customers may be adversely affected. Many of our competitors enjoy economies of scale that result in low cost structures for transmission and related costs that could cause significant pricing pressures within the industry. While growth through acquisitions is a possible strategy for ICS, there are no guarantees that any acquisitions will occur, nor are there any assurances that any acquisitions by ICS would improve the financial results of its business.
Any failure of ICS’s physical infrastructure, including undetected defects in technology, could lead to significant costs and disruptions that could reduce its revenue and harm its business reputation and financial results.
ICS depends on providing customers with highly reliable service. ICS must protect its infrastructure and any collocated equipment from numerous factors, including:
• | human error; |
• | physical or electronic security breaches; |
• | fire, earthquake, flood and other natural disasters; |
• | water damage; |
• | power loss; and |
• | terrorism, sabotage and vandalism. |
Problems at one or more of ICS’s exchange delivery points, whether or not within ICS’s control, could result in service interruptions or significant equipment damage. Any loss of services, equipment damage or inability to terminate voice calls or supply Internet capacity could reduce the confidence of the members and customers and could consequently impair ICS’s ability to obtain and retain customers, which would adversely affect both ICS’s ability to generate revenues and its operating results.
ICS’s positioning in the marketplace and intense domestic and international competition in these services places a significant strain on our resources, which if not managed effectively could result in operational inefficiencies and other difficulties.
To manage ICS’s market positioning effectively, we must continue to implement and improve its operational and financial systems and controls, invest in critical network infrastructure to expand its coverage and capacity, maintain or improve its service quality levels, purchase and utilize other transmission facilities, evolve its support and billing systems and train and manage its employee base. If we inaccurately forecast the movement of traffic onto ICS’s network, we could have insufficient or excessive transmission facilities and disproportionate fixed expenses. As we proceed with the development of our ICS business, operational difficulties could arise from additional demand placed on customer provisioning and support, billing and management information systems, product delivery and fulfillment, support, sales and marketing, administrative resources, network infrastructure, maintenance and upgrading. For instance, we may encounter delays or cost-overruns or suffer other adverse consequences in implementing new systems when required.
27
If ICS is not able to operate a cost-effective network, we may not be able to grow our ICS business successfully.
Our ICS business’ long-term success depends on our ability to design, implement, operate, manage, maintain and upgrade a reliable and cost-effective network infrastructure. In addition, we rely on third-party equipment and service vendors to expand and manage ICS’s global network through which it provides its services. If we fail to generate additional traffic on ICS’s network, if we experience technical or logistical impediments to the development of necessary aspects of ICS’s network or the migration of traffic and customers onto ICS’s network, or if we experience difficulties with third-party providers, we may not achieve desired economies of scale or otherwise be successful in growing our ICS business.
If we are not able to use and protect intellectual property associated with the ICS business domestically and internationally, it could have a material adverse effect on our ICS business.
ICS’s ability to compete depends, in part, on our ability to use intellectual property associated with the business in the United States and internationally. We are subject to the risks of claims and litigation alleging infringement of the intellectual property rights of others and may need to litigate against others to protect our intellectual property rights. The telecommunications industry is subject to frequent litigation regarding patent and other intellectual property rights. Any such litigation could result in substantial costs and diversion of resources that could have a material effect on ICS’s business, financial condition and/or operations. Furthermore, there can be no assurance that we would be successful in any such litigation.
We rely upon certain technology, including hardware and software, licensed from third parties to operate our ICS business. There can be no assurance that the technology licensed by us will continue to provide competitive features and functionality or that licenses for technology currently used by us or other technology that we may seek to license in the future will be available to us on commercially reasonable terms or at all. The loss of, or our inability to maintain, existing licenses could result in shipment delays or reductions until equivalent technology or suitable alternative products could be developed, identified, licensed and integrated and could cause service disruption to ICS’s customers. Such delays or reductions in the aggregate could harm our ICS business, and there can be no assurance that suitable alternative products would be available.
We also rely on indemnification provisions from third parties to protect against claims of infringement regarding such licensed technology, which indemnification could be affected by, among other things, the financial strength of the licensor. Furthermore, effective intellectual property protection may not be available in every country where ICS does business. Any significant impairment of our intellectual property or other licensed rights could harm our ICS’s business and/or its ability to compete effectively.
Risks Related to Our Liquidity Needs and Securities
We are a holding company and our only material assets are our equity interests in our operating subsidiaries and our other investments. As a result, our principal source of revenue and cash flow is distributions from our subsidiaries and our subsidiaries may be limited by law and by contract in making distributions to us.
As a holding company, our only material assets are our cash on hand, the equity interests in our subsidiaries and other investments. As of December 31, 2014, we had approximately $23.5 million in cash, cash equivalents and short-term investments at the corporate level at HC2. Our principal source of revenue and cash flow is distributions from our subsidiaries. Thus, our ability to service our debt and to finance future acquisitions is dependent on the ability of our subsidiaries to generate sufficient net income and cash flows to make upstream cash distributions to us. Our subsidiaries are and will be separate legal entities, and although they may be wholly-owned or controlled by us, they have no obligation to make any funds available to us, whether in the form of loans, dividends, distributions or otherwise. The ability of our subsidiaries to distribute cash to us will also be subject to, among other things, restrictions that are contained in our subsidiaries’ financing agreements, availability of sufficient funds and applicable state laws and regulatory restrictions. Claims of creditors of our subsidiaries generally will have priority as to the assets of such subsidiaries over our claims and claims of our creditors and stockholders. To the extent the ability of our subsidiaries to distribute dividends or other payments to us could be limited in any way, our ability to grow, pursue business opportunities or make acquisitions that could be beneficial to our businesses, or otherwise fund and conduct our business, could be materially limited.
In order to satisfy the requirements of Section 226 of the Pensions Act of 2004 (UK), GMSL is a party to the Global Marine Pension Plan Recovery Plan, dated as of March 28, 2014 (the “Recovery Plan”). The Recovery Plan addresses GMSL’s pension funding shortfall of approximately GBP 32 million by requiring GMSL to make certain scheduled fixed monthly contributions, certain variable annual profit-related contributions and certain variable dividend-related contributions to the pension plan. The variable dividend-related contributions require GMSL to pay cash contributions to the underfunded pension
28
plan equal to 50% of any dividend payments made to its shareholder, which reduces the amount of cash available for GMSL to make upstream payments to us.
The Recovery Plan provides for the funding shortfall to be eliminated on or before June 30, 2021. However the UK plan must be valued on a triennial basis and all valuations are dependent upon the prevailing market conditions and the actuarial methods and assumptions used as well as the expected pension liabilities at the valuation date. There are various risks which could adversely affect the next valuation of the UK pension plan and consequently the obligations of GMSL to fund the plan, such as a significant adverse change in the market value of the pension plan assets, an increase in pension liabilities, longer life expectancy of plan members, a change in the discount rate or inflation rate used by the actuary or if the trustees of the plan recommend a material change to the investment strategy. Any increase in the deficit may result in a need for GMSL to increase its pension contributions which would reduce the amount of cash available for GMSL to make upstream dividend payments to us. While we expect the trustees of the pension plan to renegotiate the Recovery Plan on at least a triennial basis from March 31, 2014 or dispense with the Recovery Plan if and when the funding shortfall has been eliminated, we can make no assurances in relation to this.
Under the UK Pensions Act 2004, the Pensions Regulator may issue a contribution notice to us or any employer in the UK pension plan or any person who is connected with or is an associate of any such employer where the Pensions Regulator is of the opinion that the relevant person has been a party to an act, or a deliberate failure to act, which had as its main purpose (or one of its main purposes) the avoidance of pension liabilities. Under the UK Pensions Act 2008, the Pension Regulator has the power to issue a contribution notice to any such person where the Pensions Regulator is of the opinion that the relevant person has been a party to an act, or a deliberate failure to act, which has a materially detrimental effect on pension plans without sufficient mitigation having been provided. If the Pensions Regulator considers that any of the employers participating in the UK pension plan are “insufficiently resourced” or a “service company,” it may impose a financial support direction requiring us or any person associated or connected with that employer to put in place financial support.
The Pensions Regulator can only issue a contribution notice or financial support direction where it believes it is reasonable to do so. The terms “associate” and “connected person,” which are taken from the UK Insolvency Act 1986, are widely defined and cover among others GMSL, its subsidiaries and others deemed to be shadow directors. Liabilities imposed under a contribution notice or financial support direction may be up to the difference between the value of the assets of the plan and the cost of buying out the benefits of members and other beneficiaries. If GMSL or its connected or associated parties are the recipient of a contribution notice or financial support direction this could have an effect on our cash flow.
In practice, the risk of a contribution notice being imposed may restrict our ability to restructure or undertake certain corporate activities relating to GMSL without first seeking agreement of the trustees of the UK pension plan and, possibly, the approval of the Pensions Regulator. Additional security may also need to be provided to the trustees before certain corporate activities can be undertaken (such as the payment of an unusual dividend from GMSL) and any additional funding required by the UK pension plan may have an adverse effect on our financial condition and the results of our operations.
In addition, GMSL and Schuff are each party to credit agreements that include certain financial covenants that can reduce or otherwise limit the amount of cash available to make upstream dividend payments to us. GMSL’s term loan with DVB Bank (the “GMSL Facility”) requires GMSL to maintain minimum liquidity of GBP 7.5 million through January 23, 2015, and GBP 6.0 million until maturity on July 23, 2018. If GMSL does not meet these minimum liquidity requirements, it will not be able to make upstream dividend payments to us until such minimum liquidity requirements are met. Schuff’s Credit and Security Agreement (the “Schuff Facility”) with Wells Fargo Credit, Inc. (“Wells Fargo”) allows dividends to be paid to Schuff shareholders up to four times a year, subject to the following conditions: (a) the consent of Wells Fargo Credit, Inc., which is the Schuff Facility lender (which consent shall not be unreasonably withheld); (b) maintenance of a fixed charge coverage ratio of 1.20 to 1; (c) a minimum excess availability under the Schuff Facility of $10 million before and after the payment of a dividend and (d) Schuff not being in default under the Schuff Facility at the time of the dividend payment. For more information, see “Management’s Discussion and Analysis of Financial Condition and Results of Operations—Liquidity and Capital Resources.”
To service our indebtedness and other obligations, we will require a significant amount of cash.
Our ability to generate cash depends on many factors beyond our control, and any failure to meet our debt service obligations, including those under (a) the indenture (the “11% Notes Indenture”) governing our 11% senior secured notes due 2019 (the “11% Notes”), (b) the Schuff Facility and (c) the GMSL Facility, as well as the obligations with respect to HC2’s (i) 30,000 shares of Series A Convertible Participating Preferred Stock (the “Series A Preferred Stock”) issued on May 29, 2014, (ii) 11,000 shares of Series A-1 Convertible Participating Preferred Stock (the “Series A-1 Preferred Stock”) issued on September 22, 2014, and (iii) 14,000 shares of Series A-2 Convertible Participating Preferred Stock (the “Series A-2 Preferred
29
Stock” and, together with the Series A Preferred Stock and Series A-1 Preferred Stock, the “Preferred Stock”) issued on January 5, 2015, each of which is governed by a certificate of designation forming a part of HC2’s Certificate of Incorporation (collectively, the “Certificates of Designation”), could harm our business, financial condition and results of operations. Our ability to make payments on and to refinance our indebtedness and Preferred Stock and to fund working capital needs and planned capital expenditures will depend on our ability to generate cash in the future. This, to a certain extent, is subject to general economic, financial, competitive, business, legislative, regulatory and other factors that are beyond our control.
If our business does not generate sufficient cash flow from operations or if future borrowings are not available to us in an amount sufficient to enable us to pay our indebtedness or make mandatory redemption payments with respect to the Preferred Stock, or to fund our other liquidity needs, we may need to refinance all or a portion of our indebtedness or redeem the Preferred Stock, on or before the maturity thereof, sell assets, reduce or delay capital investments or seek to raise additional capital, any of which could have a material adverse effect on our operations.
In addition, we may not be able to affect any of these actions, if necessary, on commercially reasonable terms or at all. Our ability to restructure or refinance our indebtedness or redeem the Preferred Stock will depend on the condition of the capital markets and our financial condition at such time. Any refinancing of our debt or financings related to the redemption of our Preferred Stock could be at higher interest rates and may require us to comply with more onerous covenants, which could further restrict our business operations. The terms of existing or future debt instruments or preferred stock may limit or prevent us from taking any of these actions. In addition, any failure to make scheduled payments of interest and principal on our outstanding indebtedness or dividend payments on our Preferred Stock would likely result in a reduction of our credit rating, which could harm our ability to incur additional indebtedness or otherwise raise capital on commercially reasonable terms or at all. Our inability to generate sufficient cash flow to satisfy our debt service and other obligations, or to refinance or restructure our obligations on commercially reasonable terms or at all, would have an adverse effect, which could be material, on our business, financial condition and results of operations.
The agreements governing our indebtedness and Preferred Stock, including the 11% Notes Indenture, the Schuff Facility and the GMSL Facility, as well as the Certificates of Designation with respect to our Preferred Stock, contain various covenants that may limit our discretion in the operation of our business and/or require us to meet financial maintenance tests and other covenants. The failure to comply with such tests and covenants could have a material adverse effect on us.
The agreements governing our indebtedness and Preferred Stock, including the 11% Notes Indenture, the Schuff Facility and the GMSL Facility, as well as the Certificates of Designation with respect to the Preferred Stock, contain, and any of our other future financing agreements may contain, covenants imposing operating and financial restrictions on our businesses.
The 11% Notes Indenture contains various covenants, including those that restrict our ability to, among other things:
• | incur liens on our property, assets and revenue; |
• | borrow money, and guarantee or provide other support for the indebtedness of third parties; |
• | redeem or repurchase, our capital stock; |
• | prepay, redeem or repurchase, certain of our indebtedness, including our Preferred Stock; |
• | enter into certain change of control transactions; |
• | make investments in entities that we do not control, including joint ventures; |
• | enter into certain asset sale transactions, including divestiture of certain company assets and divestiture of capital stock of wholly-owned subsidiaries; |
• | enter into certain transactions with affiliates; |
• | enter into secured financing arrangements; and |
• | enter into sale and leaseback transactions. |
The Schuff Facility and the GMSL Facility contain similar covenants applicable to Schuff and GMSL, respectively. These covenants may limit our ability to effectively operate our businesses. In addition, the 11% Notes Indenture requires that we meet certain financial tests, including a collateral coverage ratio and minimum liquidity test. Our ability to satisfy these tests may be affected by factors and events beyond our control, and we may be unable to meet such tests in the future.
Any failure to comply with the restrictions in the 11% Notes Indenture, or any agreement governing other indebtedness we could incur, may result in an event of default under those agreements. Such default may allow the creditors to accelerate the related debt, which acceleration may trigger cross-acceleration or cross-default provisions in other debt. If any of these risks were to occur, our business and operations could be materially and adversely affected.
30
The Certificates of Designation provide the holders of our Preferred Stock with consent and voting rights with respect to certain of the matters referred to above, in addition to certain corporate governance rights. These restrictions may interfere with our ability to obtain financings or to engage in other business activities, which could have a material adverse effect on our business and operations.
We have significant indebtedness and other financing arrangements and could incur additional indebtedness and other obligations, which could adversely affect our business and financial condition.
We have a significant amount of indebtedness and Preferred Stock. As of December 31, 2014, our total outstanding indebtedness was $343.4 million and the accrued value of our Series A Preferred Stock and Series A-1 Preferred Stock was $39.9 million, and on January 5, 2015 we issued $14.0 million of our Series A-2 Preferred Stock. We may not generate enough cash flow to satisfy our obligations under such indebtedness and other arrangements.
Additional risks relating to our indebtedness and other financing arrangements include:
• | increased vulnerability to general adverse economic and industry conditions; |
• | higher interest expense if interest rates increase on our floating rate borrowings and our hedging strategies are not effective to mitigate the effects of these increases; |
• | our having to divert a significant portion of our cash flow from operations to payments on our indebtedness and other arrangements, thereby reducing the availability of cash to fund working capital, capital expenditures, acquisitions, investments and other general corporate purposes; |
• | limiting our ability to obtain additional financing, on terms we find acceptable, if needed, for working capital, capital expenditures, expansion plans and other investments, which may limit our ability to implement our business strategy; |
• | limiting our flexibility in planning for, or reacting to, changes in our businesses and the markets in which we operate or to take advantage of market opportunities; and · |
• | placing us at a competitive disadvantage compared to our competitors that have less debt and other outstanding obligations. |
In addition, it is possible that we may need to incur additional indebtedness or enter into additional financing arrangements in the future in the ordinary course of business. The terms of the 11% Notes Indenture and our other financing arrangements allow us to incur additional debt and issue additional shares of preferred stock, subject to certain limitations. If additional indebtedness is incurred or equity is issued, the risks described above could intensify. In addition, our inability to maintain certain leverage ratios could result in acceleration of a portion of our debt obligations and could cause us to be in default if we are unable to repay the accelerated obligations.
HC2 may issue additional shares of common stock or preferred stock, which could dilute the interests of its stockholders and present other risks.
HC2’s certificate of incorporation, as amended (the “Certificate of Incorporation”), authorizes the issuance of up to 80,000,000 shares of common stock and 20,000,000 shares of preferred stock. As of February 28, 2015, HC2 has 23,815,216 shares of its common stock issued and outstanding, and 55,000 shares of Preferred Stock issued and outstanding. However, the Certificate of Incorporation authorizes HC2’s Board of Directors to from time to time, subject to limitations prescribed by law and any consent rights granted to holders of outstanding shares of Preferred Stock, to issue additional shares of preferred stock having rights that are senior to those afforded to the holders of HC2’s common stock. HC2 also has reserved shares of common stock for issuance pursuant to its broad-based equity incentive plans, upon exercise of stock options and other equity-based awards granted thereunder, and pursuant to other equity compensation arrangements.
HC2 may issue shares of common stock or additional shares of preferred stock to raise additional capital, to complete a business combination or other acquisition, to capitalize new businesses or new or existing businesses of our operating subsidiaries or pursuant to other employee incentive plans, any of which could dilute the interests of HC2’s stockholders and present other risks.
The issuance of additional shares of common stock or preferred stock may, among other things:
• | significantly dilute the equity interest and voting power of all other stockholders; |
• | subordinate the rights of holders of HC2’s outstanding common stock and/or Preferred Stock if preferred stock is issued with rights senior to those afforded to holders of HC2’s common stock and/or Preferred Stock; |
• | call for us to make dividend or other payments not available to the holders of HC2’s common stock; and |
31
• | cause a change in control of our company if a substantial number of shares of HC2’s common stock is issued and/or if additional shares of preferred stock having substantial voting rights are issued. |
The issuance of additional shares of common stock or preferred stock, or perceptions in the market that such issuances could occur, may also adversely affect the prevailing market price of HC2’s outstanding common stock and impair our ability to raise capital through the sale of additional equity securities.
Future sales of substantial amounts of HC2 common stock by holders of our Preferred Stock or other significant stockholders may adversely affect the market price of HC2 common stock.
As of December 31, 2014, the holders of our outstanding Preferred Stock had certain rights to convert their Preferred Stock into an aggregate amount of approximately 10,192,757 shares of our common stock. Pursuant to a second amended and restated registration rights agreement (the “Registration Rights Agreement”) entered into in connection with the issuance of the Preferred Stock, we have granted registration rights to the purchasers of our Preferred Stock and certain of their transferees with respect to HC2 common stock held by them and common stock underlying the Preferred Stock. This Registration Rights Agreement allows these holders, subject to certain conditions, to require us to register the sale of their shares under the federal securities laws. Furthermore, the shares of HC2 common stock held by these holders, as well as other significant stockholders, may be sold into the public market under Rule 144 of the Securities Act of 1933, as amended.
Future sales of substantial amounts of HC2 common stock into the public market, or perceptions in the market that such sales could occur, may adversely affect the prevailing market price of HC2 common stock and impair our ability to raise capital through the sale of additional equity securities.
Changes in credit ratings issued by nationally recognized statistical ratings organizations could adversely affect our cost of financing and the market price of our securities.
Credit rating agencies rate our debt securities and other instruments on factors that include our operating results, actions that we take, their view of the general outlook for our industry and their view of the general outlook for the economy. Actions taken by the rating agencies can include maintaining, upgrading, or downgrading the current rating or placing us on a watch list for possible future downgrading. Downgrading the credit rating of our debt securities or other instruments or placing us on a watch list for possible future downgrading would likely increase our cost of financing, limit our access to the capital markets and have an adverse effect on the market price of our securities.
Price fluctuations in HC2’s common stock could result from general market and economic conditions and a variety of other factors.
The trading price of HC2’s common stock may be highly volatile and could be subject to fluctuations in response to a number of factors beyond our control, including:
• | actual or anticipated fluctuations in our results of operations and the performance of our competitors; |
• | reaction of the market to our announcement of any future acquisitions or investments; |
• | the public’s reaction to our press releases, our other public announcements and our filings with the SEC; |
• | changes in general economic conditions; and |
• | actions of HC2’s equity investors, including sales of HC2’s common stock by significant shareholders. |
ITEM 1B. UNRESOLVED STAFF COMMENTS
None.
ITEM 2. PROPERTIES
We currently lease our corporate headquarters facility, which is located in Herndon, Virginia. Additionally, we lease administrative, technical and sales office space in various locations in the countries in which we operate. GMSL is headquartered in Chelmsford, UK, Schuff is headquartered in Phoenix, Arizona, and our European ICS operations are headquartered in London. We also lease space for switches operated by our Telecommunications segment. As of December 31, 2014, total leased space in the United States and the United Kingdom, as well as other countries in which we operate, approximates 508,000 square feet and the total annual lease costs are approximately $4.2 million. The operating leases expire at various times, with the longest commitment expiring in 2027. We believe that our present administrative, technical and sales
32
office facilities are adequate for our anticipated operations and that similar space can be obtained readily as needed. In addition, Schuff owns operations, administrative, and sales offices located throughout the United States approximating 1,562,000 square feet.
We own substantially all of our equipment required for our businesses which include cable–ships and submersibles, steel machinery and equipment, and communications equipment. Our net property and equipment was $233.0 million and $3.0 million at December 31, 2014 and 2013, respectively. As of December 31, 2014, total equipment under capital leases consisted of $75.5 million of cable-ships and submersibles. See Note 7—“Property and Equipment,” for additional detail regarding our property and equipment. HC2’s 11% Notes issued on November 20, 2014 are secured by substantially all of the Company’s assets. In addition, the Schuff Facility and GMSL Facility are secured by certain of the assets of Schuff and GMSL, respectively. See Note 9—“Long-Term Obligations,” for additional detail regarding encumbrances affecting our property and equipment.
ITEM 3. LEGAL PROCEEDINGS
On November 6, 2014, a putative stockholder class action complaint challenging the buyout by HC2 Holdings, Inc. of the noncontrolling interest in Schuff International, Inc. (“Schuff International”) was filed in the Court of Chancery of the State of Delaware, captioned Mark Jacobs v. Philip A. Falcone, Keith M. Hladek, Paul Voigt, Michael R. Hill, Rustin Roach, D. Ronald Yagoda, Phillip O. Elbert, HC2 Holdings, Inc., and Schuff International, Inc., Civil Action No. 10323 (the “Complaint”). On November 17, 2014, a second lawsuit was filed in the Court of Chancery of the State of Delaware, captioned Arlen Diercks v. Schuff International, Inc. Philip A. Falcone, Keith M. Hladek, Paul Voigt, Michael R. Hill, Rustin Roach, D. Ronald Yagoda, Phillip O. Elbert, HC2 Holdings, Inc., Civil Action No. 10359. The Complaints allege, among other things, that in connection with the buyout, the individual members of the Schuff International board of directors and HC2 Holdings, the controlling stockholder of Schuff, breached their fiduciary duties to members of the plaintiff class. The Complaints seek a rescission of the buyout and/or compensatory damages, as well as attorney’s fees and other relief. On February 19, 2015, the court consolidated the actions (now designated as Schuff International, Inc. Stockholders Litigation) and appointed lead plaintiff and counsel. No responsive pleading has been filed yet by the defendants. We believe that the allegations and claims set forth in the Complaint are without merit and intend to defend them vigorously.
On January 16, 2014, Xplornet Communications Inc. and Xplornet Broadband Inc. (“Xplornet”) instituted an action in the Ontario Superior Court of Justice styled Xplornet Communications Inc. and Xplornet Broadband Inc. vs. Inukshuk Wireless Inc., et al. Other defendants include Globility Communications Corporation (“Globility”), MIPPS Inc. (“MIPPS”), Primus Telecommunications Canada Inc. and the Company (sued under its previous name). In such action, Xplornet alleges that it entered into an agreement to acquire certain licenses for radio spectrum in Canada from Globility, a former subsidiary of the Company. Xplornet alleges that Globility agreed to sell Xplornet certain spectrum licenses in a Letter of Intent dated July 12, 2011 but then breached the Letter of Intent by selling the licenses to Inukshuk Wireless Inc. (“Inukshuk”) and that Globility further failed to negotiate with Xplornet in good faith. Xplornet also alleges that it reached an agreement with Inukshuk to purchase the licenses on June 26, 2012, but that Inukshuk breached that agreement by not completing the sale. Xplornet claims that, as a result of the foregoing, it has been damaged in the amount of $50 million. Xplornet also seeks injunctive relief against Inukshuk, pre and post-judgment interest, and costs. We intend to assert that we have meritorious defenses in the foregoing matter and we intend to defend ourselves vigorously.
The Company is indemnifying Primus Telecommunications Canada, Inc., Globility, and MIPPS subject to a full reservation of rights pursuant to the Equity Purchase Agreement among PTUS, Inc., PTCAN, Inc. Primus Telecommunications Group, Incorporated, Primus Telecommunications Holding, Inc., Lingo Holdings, Inc. and Primus Telecommunications International, Inc. dated as of May 10, 2013 in connection with this case.
On March 13, 2015, Inukshuk Wireless Partnership filed a cross claim against Globility, MIPPS, Primus Telecommunications Canada Inc., and the Company. Inukshuk asserts that if Inukshuk is found liable to Xplornet, then Inukshuk is entitled to contribution and indemnity, compensatory damages, interest, and costs from the Company. Inukshuk alleges that Globility represented and warranted that it owned the licenses at issue, that Globility held the licenses free and clear, and that no third party had any rights to acquire them. Inukshuk claims breach of contract and misrepresentation if the Court finds that any of these representations are untrue. We intend to assert that we have meritorious defenses to the cross claim and we intend to defend ourselves vigorously.
In December 2012, British Petroleum (“BP”) brought suit against Carboline Company (“Carboline”), Trinity Steel Fabricators, Inc. (“Trinity”), the Schuff’s subsidiary, Schuff Steel Company (“SSC”), Tecon Services, Inc. (“Tecon”) and Alfred Miller Contracting Company (“AMC”) in regards to fabrication work on a BP refinery in Indiana. BP alleged that the Schuff
33
subsidiary and others defectively fireproofed certain pieces of steel used in a modernization project at the refinery. AMC and Tecon filed a Petition for Damages and Declaratory Judgment against Caroline, BP Corporation North America Inc., BP Products North America, Trinity, SSC, Schuff Steel-Gulf Coast, Inc., and others. In April 2014, the lawsuits were successfully mediated and a confidential settlement agreement was executed on June 16, 2014. Both cases were dismissed in July 2014.
The Company is subject to other claims and legal proceedings that arise in the ordinary course of its business. Such matters are inherently uncertain, and there can be no guarantee that the outcome of any such matter will be decided favorably to the Company or that the resolution of any such matter will not have a material adverse effect upon the Company’s business, consolidated financial position, results of operations or cash flows. The Company does not believe that any of such pending claims and legal proceedings will have a material adverse effect on its business, consolidated financial position, results of operations or cash flows.
ITEM 4. MINE SAFETY DISCLOSURES
Not applicable.
PART II
ITEM 5. MARKET FOR REGISTRANT’S COMMON EQUITY, RELATED STOCKHOLDER MATTERS AND ISSUER PURCHASES OF EQUITY SECURITIES
Common Stock
HC2 common stock began trading on the New York Stock Exchange (“NYSE”) under the ticker symbol “PTGI” on June 23, 2011. On November 18, 2013, the Company voluntarily withdrew the trading of HC2 common stock on the NYSE, at which point HC2 common stock began to trade on the OTCQB Market (“OTCQB”) under the same ticker symbol, “PTGI.” On April 9, 2014 in connection with our name change, we changed the ticker symbol of our common stock from “PTGI” to “HCHC”. On December 29, 2014, HC2 common stock began to trade on the NYSE MKT LLC (“NYSE MKT”) under the same ticker symbol “HCHC”.
The following table provides the high and low sale prices for HC2’s common stock as reported by the NYSE, OTCQB or NYSE MKT, as applicable, for each quarterly period for the last two fiscal years. The quotations from the OTCQB reflect inter-dealer prices, without retail markup, markdown or commissions, and may not represent actual transactions.
Common Stock | |||||||
Period | High | Low | |||||
2014 | |||||||
1st Quarter | $ | 4.04 | $ | 2.80 | |||
2nd Quarter | $ | 4.10 | $ | 3.50 | |||
3rd Quarter | $ | 4.60 | $ | 3.86 | |||
4th Quarter | $ | 8.50 | $ | 4.41 | |||
2013 | |||||||
1st Quarter | $ | 12.34 | $ | 10.00 | |||
2nd Quarter | $ | 14.77 | $ | 9.85 | |||
3rd Quarter | $ | 12.71 | $ | 3.30 | |||
4th Quarter | $ | 3.69 | $ | 2.25 | |||
Holders of Common Stock
As of February 28, 2015, HC2 had 32 holders of record of its common stock. This number does not include stockholders for whom shares were held in “nominee” or “street” name.
Dividends
During 2013 and 2014, HC2’s Board of Directors declared one special cash dividend with respect to HC2’s issued and outstanding common stock, as presented in the following table (Total Dividend amount presented in thousands):
34
Cash Dividend Per Share | |||
$8.50 | |||
Declaration Date | August 7, 2013 | ||
Holders of Record Date | August 20, 2013 | ||
Payment Date | August 27, 2013 | ||
Total Dividend | $ | 119,788 | |
HC2 paid no dividends on its common stock in 2014, and the HC2 Board of Directors has no current intention of paying any dividends on HC2 common stock in the near future. The payment of dividends, if any, in the future is within the discretion of the HC2 Board of Directors and will depend on our earnings, our capital requirements and financial condition. The 11% Notes Indenture contains covenants that, among other things, limit or restrict our ability to make certain restricted payments, including the payment of cash dividends with respect to HC2’s common stock. The Schuff Facility and the GMSL Facility contain similar covenants applicable to Schuff and GMSL, respectively. See Item 7—“Management’s Discussion and Analysis of Financial Condition and Results of Operations—Liquidity and Capital Resources” and Note 9—“Long-Term Obligations” to our consolidated financial statements for more detail concerning our 11% Notes and other financing arrangements. Moreover, dividends may be restricted by other arrangements entered into in the future by us.
Class A and B Warrants
In July 2009, HC2 issued Class A Warrants, which were divided into three separate series (Class A-1, Class A-2 and Class A-3 Warrants), and Class B Warrants to purchase shares of HC2 common stock.
There were 878,940 Class A-1 Warrants exercised during the year ended December 31, 2014, resulting in the issuance of 3,855,289 shares of HC2’s common stock. There were 780,753 Class A-2 Warrants exercised during the year ended December 31, 2014, resulting in the issuance of 3,424,641 shares of HC2’s common stock. There were 5,709 Class A-3 Warrants exercised during the year ended December 31, 2014, resulting in the issuance of 25,041 shares of HC2’s common stock. The warrants expired on July 1, 2014.
Issuance of Common Stock
On May 29, 2014, HC2 issued 1,500,000 shares of common stock to certain of the purchasers of our Series A Convertible Participating Preferred Stock (discussed below), the proceeds of which were used to pay for a portion of the purchase price for the acquisition of Schuff.
Issuances of Preferred Stock
On May 29, 2014, HC2 issued 30,000 shares of Series A Convertible Participating Preferred Stock of HC2 (the “Series A Preferred Stock”) and 1,500,000 shares of common stock, the proceeds of which were used to pay for a portion of the purchase price for the acquisition of Schuff. On September 22, 2014, HC2 issued 11,000 shares of Series A-1 Convertible Participating Preferred Stock (the “Series A-1 Preferred Stock”). Each share of Series A-1 Preferred Stock is convertible at a conversion price of $4.25. In connection with the issuance of the Series A-1 Preferred Stock, HC2 amended the certificate of designation governing the Series A Preferred Stock on September 22, 2014, which changed the applicable conversion price from $4.25 to $4.00, reflected the issuance of the Series A-1 Preferred Stock as a class of preferred stock which ranks at parity with the Series A Preferred Stock and made certain other changes to conform the terms of the Series A Preferred Stock to those of the Series A-1 Preferred Stock. On January 5, 2015, HC2 issued 14,000 shares of Series A-2 Convertible Participating Preferred Stock of HC2 (the “Series A-2 Preferred Stock” and together with the Series A Preferred Stock and Series A-1 Preferred Stock, the “Preferred Stock”). Each share of Series A-2 Preferred Stock is convertible at a conversion price of $8.25. The conversion prices for the Preferred Stock are subject to adjustments for dividends, certain distributions, stock splits, combinations, reclassifications, reorganizations, mergers, recapitalizations and similar events. See Note 14—“Equity” for additional terms of the Preferred Stock.
Recent Sales of Unregistered Securities
There were no unregistered sales of our equity securities in the year ended December 31, 2014, except as otherwise reported.
Issuer Purchases of Equity Securities
35
Period | Total Number of Shares Purchased | Average Price Paid Per Share | Total Number of Shares Purchased as Part of Announced Plans or Programs | Approximate Dollar Value of Shares that May Yet be Purchased Under the Plans or Programs (in millions) | |||||||||
Shares purchased in satisfaction of tax withholding obligations (1) | |||||||||||||
October 1, 2014 to October 31, 2014 | 1,516 | $ | 4.06 | — | $ | — | |||||||
November 1, 2014 to November 30, 2014 | — | $ | — | — | $ | — | |||||||
December 1, 2014 to December 31, 2014 | — | $ | — | — | $ | — | |||||||
Total | 1,516 | $ | 4.06 | — | $ | — | |||||||
(1) | Upon vesting of restricted stock units awarded by HC2 to employees, HC2 withholds shares to cover employees’ tax withholding obligations, other than for employees who have chosen to satisfy their tax withholding requirements in the form of a cash payment. The table above reflects shares of common stock withheld to satisfy tax withholding obligations during the fourth quarter of 2014. |
Stock Performance Graph
The following graph compares the cumulative total returns during the period from December 31, 2009 to December 31, 2014 of our common stock to the Standard & Poor’s Midcap 400 Index and the iShares S&P Global Telecommunications Sector Index. The comparison assumes $100 was invested on December 31, 2009 in the common stock of HC2 and the indices and assumes that all dividends were reinvested. HC2’s common stock began trading on the OTC Bulletin Board on July 1, 2009, on the NYSE on June 23, 2011, on the OTCQB on November 18, 2013, and on the NYSE MKT on December 29, 2014.
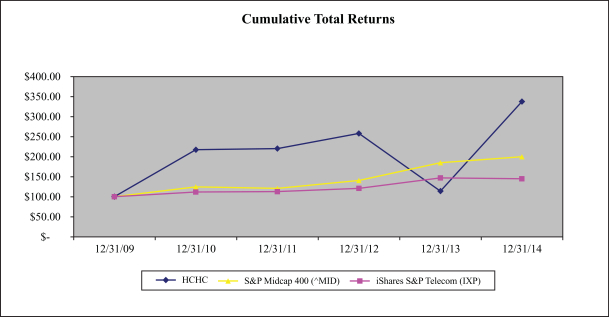
36
December 31, 2009 | December 31, 2010 | December 31, 2011 | December 31, 2012 | December 31, 2013 | December 31, 2014 | ||||||||||||||||||
HC2 Holdings, Inc. (HCHC) | $ | 100.00 | $ | 217.39 | $ | 220.17 | $ | 257.96 | $ | 114.03 | $ | 337.29 | |||||||||||
Standard & Poor’s Midcap 400 Index (^MID) | $ | 100.00 | $ | 124.85 | $ | 120.98 | $ | 140.43 | $ | 184.75 | $ | 199.88 | |||||||||||
iShares S&P Global Telecommunications Sector Index Fund (IXP) | $ | 100.00 | $ | 111.60 | $ | 112.65 | $ | 121.04 | $ | 146.79 | $ | 145.00 | |||||||||||
The performance graph will not be deemed to be incorporated by reference by means of any general statement incorporating by reference this Form 10-K into any filing under the Securities Act of 1933, as amended, or the Securities Exchange Act of 1934, as amended, except to the extent that HC2 specifically incorporates such information by reference, and shall not otherwise be deemed filed under such Acts.
ITEM 6. SELECTED FINANCIAL DATA
The selected consolidated financial data set forth below should be read in conjunction with (i) Item 7 entitled “Management’s Discussion and Analysis of Financial Condition and Results of Operations,” (ii) our consolidated audited annual financial statements and the notes thereto, each of which are contained in Item 8 entitled “Financial Statements and Supplementary Data” and (iii) the information described below under “—Discontinued Operations.”
Discontinued Operations
We have reclassified several segments as discontinued operations. Accordingly, revenue, costs, and expenses of the discontinued operations have been excluded from the respective captions in the consolidated statements of operations. Conversely, as it pertains to ICS, we reclassified such operations as a continuing operation effective as of the fourth quarter of 2013; accordingly, the revenue, costs and expenses are now included in the respective captions in the consolidated statements of operations. The net operating results of the discontinued operations have been reported, net of applicable income taxes as income, or loss, as applicable, from discontinued operations. There have been no reclassifications of any of our subsidiaries as discontinued operations in 2014.
• | ICS. During the second quarter of 2012, the Board of Directors of HC2 committed to dispose of ICS and as a result classified ICS as a discontinued operation. In December 2013, based on management’s assessment of the requirements under ASC No. 360, “Property, Plant and Equipment” (“ASC 360”), it was determined that ICS no longer met the criteria of a held for sale asset. On February 11, 2014, the Board of Directors officially ratified management’s December 2013 assessment, and reclassified ICS from held for sale to held and used, effective December 31, 2013. As a result, the Company has applied retrospective adjustments for 2012, 2011, and 2010 to reflect the effects of the Company’s decision to cease its sale process of ICS that occurred as of December 31, 2013. |
• | BLACKIRON Data. In the second quarter of 2013, the Company sold its BLACKIRON Data segment. As a result, the Company has applied retrospective adjustments for 2012, 2011 and 2010 to reflect the effects of the discontinued operations that occurred subsequent to December 31, 2012. |
• | North America Telecom. In the third quarter of 2013, the Company completed the initial closing of the sale of its North America Telecom segment. In conjunction with the initial closing, the Company redeemed its outstanding debt. Because the debt was required to be repaid as a result of the sale of North America Telecom, the interest expense and loss on early extinguishment or restructuring of debt of HC2 Holdings, Inc. has been allocated to discontinued operations. The closing of the sale of PTI (the remaining portion of the North America Telecom segment subject to the applicable purchase agreement) was completed on July 31, 2014. Prior to the closing, PTI had been included in discontinued operations as a result of being held for sale. As a result, the Company has applied retrospective adjustments for 2012, 2011 and 2010 to reflect the effects of the discontinued operations that occurred subsequent to December 31, 2012. |
• | Australia. During the second quarter of 2012, the Company sold its Australian segment. As a result, the Company has applied retrospective adjustments for 2011 and 2010 to reflect the effects of the discontinued operations that occurred subsequent to December 31, 2011. |
• | Brazil. During the fourth quarter of 2011, the Company sold its Brazilian segment. As a result, the Company has applied retrospective adjustments for 2010 to reflect the effects of the discontinued operations that occurred subsequent to December 31, 2010. |
37
• | Europe. During the third quarter of 2010, the Company discontinued its European segment, which was also known as European retail operations and has presented the results of the European segment as discontinued operations and held for sale as of September 30, 2010. |
HC2 HOLDINGS, INC.
CONSOLIDATED STATEMENTS OF OPERATIONS
(in thousands, except per share amounts)
Years Ended December 31, | |||||||||||||||||||
2014 (As Restated) | 2013 | 2012 | 2011 | 2010 | |||||||||||||||
Services revenue | $ | 197,280 | $ | 230,686 | $ | 302,959 | $ | 411,983 | $ | 178,739 | |||||||||
Sales revenue | 350,158 | — | — | — | — | ||||||||||||||
Net revenue | 547,438 | 230,686 | 302,959 | 411,983 | 178,739 | ||||||||||||||
Operating expenses: | |||||||||||||||||||
Cost of revenue—services | 177,812 | 220,315 | 285,631 | 389,412 | 168,698 | ||||||||||||||
Cost of revenue—sales | 296,530 | — | — | — | — | ||||||||||||||
Selling, general and administrative | 80,239 | 34,692 | 45,202 | 42,299 | 25,557 | ||||||||||||||
Depreciation and amortization | 6,334 | 12,032 | 3,204 | 6,636 | 380 | ||||||||||||||
(Gain) loss on sale or disposal of assets | (162 | ) | (8 | ) | 520 | 124 | — | ||||||||||||
Asset impairment expense | 291 | 2,791 | 20,298 | 14,679 | — | ||||||||||||||
Total operating expenses | 561,044 | 269,822 | 354,855 | 453,150 | 194,635 | ||||||||||||||
Loss from operations | (13,606 | ) | (39,136 | ) | (51,896 | ) | (41,167 | ) | (15,896 | ) | |||||||||
Interest expense | (10,754 | ) | (8 | ) | (27 | ) | (94 | ) | (36 | ) | |||||||||
Amortization of debt discount | (1,593 | ) | — | — | — | — | |||||||||||||
Loss on early extinguishment or restructuring of debt | (11,969 | ) | — | — | — | — | |||||||||||||
Gain (loss) from contingent value rights valuation | — | 14,904 | 1,292 | 2,902 | (13,737 | ) | |||||||||||||
Interest income and other expense, net | 768 | (226 | ) | 90 | 169 | (232 | ) | ||||||||||||
Foreign currency transaction gain (loss) | (66 | ) | (588 | ) | 2,538 | (4,301 | ) | 3,654 | |||||||||||
Income (loss) from continuing operations before reorganization items, income taxes and income (loss) from equity investees | (37,220 | ) | (25,054 | ) | (48,003 | ) | (42,491 | ) | (26,247 | ) | |||||||||
Reorganization items, net | — | — | — | — | 1 | ||||||||||||||
Income (loss) from continuing operations before income taxes and income (loss) from equity investees | (37,220 | ) | (25,054 | ) | (48,003 | ) | (42,491 | ) | (26,246 | ) | |||||||||
Income (loss) from equity investees | 2,665 | — | — | — | — | ||||||||||||||
Income tax (expense) benefit | 22,869 | 7,442 | 3,132 | (1,066 | ) | (1,044 | ) | ||||||||||||
Income (loss) from continuing operations | (11,686 | ) | (17,612 | ) | (44,871 | ) | (43,557 | ) | (27,290 | ) | |||||||||
Income (loss) from discontinued operations | (25 | ) | (19,621 | ) | (21,525 | ) | 15,069 | 5,172 | |||||||||||
Gain (loss) from sale of discontinued operations | (121 | ) | 148,839 | 94,265 | (4,781 | ) | 2,926 | ||||||||||||
Net income (loss) | (11,832 | ) | 111,606 | 27,869 | (33,269 | ) | (19,192 | ) | |||||||||||
Less: Net (income) loss attributable to noncontrolling interest | (2,559 | ) | — | 18 | (5,461 | ) | 105 | ||||||||||||
Net income (loss) attributable to HC2 Holdings, Inc. | (14,391 | ) | 111,606 | 27,887 | (38,730 | ) | (19,087 | ) | |||||||||||
Less: Preferred stock dividends and accretion | 2,049 | — | — | — | — | ||||||||||||||
Net income (loss) attributable to common stock and participating preferred stockholders | $ | (16,440 | ) | $ | 111,606 | $ | 27,887 | $ | (38,730 | ) | $ | (19,087 | ) | ||||||
Basic income (loss) per common share: | |||||||||||||||||||
Loss from continuing operations attributable to HC2 Holdings, Inc. | $ | (0.82 | ) | $ | (1.25 | ) | $ | (3.24 | ) | $ | (3.77 | ) | $ | (2.79 | ) | ||||
Income (loss) from discontinued operations | — | (1.40 | ) | (1.55 | ) | 1.16 | 0.53 | ||||||||||||
Gain (loss) from sale of discontinued operations | (0.01 | ) | 10.60 | 6.81 | (0.37 | ) | 0.30 | ||||||||||||
Net income (loss) attributable to HC2 Holdings, Inc. | $ | (0.83 | ) | $ | 7.95 | $ | 2.02 | $ | (2.98 | ) | $ | (1.96 | ) | ||||||
38
Years Ended December 31, | |||||||||||||||||||
2014 (As Restated) | 2013 | 2012 | 2011 | 2010 | |||||||||||||||
Diluted income (loss) per common share: | |||||||||||||||||||
Loss from continuing operations attributable to HC2 Holdings, Inc. | $ | (0.82 | ) | $ | (1.25 | ) | $ | (3.24 | ) | $ | (3.77 | ) | $ | (2.79 | ) | ||||
Income (loss) from discontinued operations | — | (1.40 | ) | (1.55 | ) | 1.16 | 0.53 | ||||||||||||
Gain (loss) from sale of discontinued operations | (0.01 | ) | 10.60 | 6.81 | (0.37 | ) | 0.30 | ||||||||||||
Net income (loss) attributable to HC2 Holdings, Inc. | $ | (0.83 | ) | $ | 7.95 | $ | 2.02 | $ | (2.98 | ) | $ | (1.96 | ) | ||||||
Weighted average common shares outstanding: | |||||||||||||||||||
Basic | 19,729 | 14,047 | 13,844 | 12,994 | 9,721 | ||||||||||||||
Diluted | 19,729 | 14,047 | 13,844 | 12,994 | 9,721 | ||||||||||||||
Dividends declared per basic weighted average common shares outstanding | — | $ | 8.58 | $ | 4.09 | — | — | ||||||||||||
Amounts attributable to common shareholders of HC2 Holdings, Inc. | |||||||||||||||||||
Loss from continuing operations attributable to HC2 Holdings, Inc. | $ | (16,294 | ) | $ | (17,612 | ) | $ | (44,853 | ) | $ | (49,018 | ) | $ | (27,185 | ) | ||||
Income (loss) from discontinued operations | (25 | ) | (19,621 | ) | (21,525 | ) | 15,069 | 5,172 | |||||||||||
Gain (loss) from sale of discontinued operations | (121 | ) | 148,839 | 94,265 | (4,781 | ) | 2,926 | ||||||||||||
Net income (loss) attributable to HC2 Holdings, Inc. | $ | (16,440 | ) | $ | 111,615 | $ | 27,891 | $ | (38,730 | ) | $ | (19,087 | ) | ||||||
Balance Sheet Data:
As of December 31, | |||||||||||||||||||
(in thousands) | 2014 (As Restated) | 2013 | 2012 | 2011 | 2010 | ||||||||||||||
Total assets | $ | 720,003 | $ | 87,680 | $ | 301,190 | $ | 543,824 | $ | 514,459 | |||||||||
Total long-term obligations (including current portion) | $ | 343,371 | $ | — | $ | 127,112 | $ | 247,762 | $ | 243,891 | |||||||||
Total liabilities | $ | 571,759 | $ | 33,271 | $ | 232,687 | $ | 442,118 | $ | 431,425 | |||||||||
Total HC2 Holdings, Inc. stockholders’ equity (deficit), before noncontrolling interest | $ | 79,187 | $ | 54,409 | $ | 68,503 | $ | 101,706 | $ | 83,034 | |||||||||
Discontinued Operations Data:
Years Ended December 31, | |||||||||||||||||||
2014 | 2013 | 2012 | 2011 | 2010 | |||||||||||||||
Net revenue | $ | 7,530 | $ | 132,515 | $ | 375,264 | $ | 602,647 | $ | 623,715 | |||||||||
Operating expenses | 7,610 | 119,392 | 343,263 | 549,217 | 608,265 | ||||||||||||||
Income (loss) from operations | (80 | ) | 13,123 | 32,001 | 53,430 | 15,450 | |||||||||||||
Interest expense | (17 | ) | (11,362 | ) | (24,621 | ) | (32,702 | ) | (35,647 | ) | |||||||||
Gain (loss) on early extinguishment or restructuring of debt | — | (21,124 | ) | (21,682 | ) | (7,346 | ) | 165 | |||||||||||
Interest income and other income (expense) | (60 | ) | (51 | ) | 283 | 189 | 580 | ||||||||||||
Foreign currency transaction gain (loss) | — | (378 | ) | (2,550 | ) | 1,539 | 12,624 | ||||||||||||
Income (loss) before income tax | (157 | ) | (19,792 | ) | (16,569 | ) | 15,110 | (6,828 | ) | ||||||||||
Income tax (expense) benefit | 132 | 171 | (4,956 | ) | (41 | ) | 12,000 | ||||||||||||
Income (loss) from discontinued operations | $ | (25 | ) | $ | (19,621 | ) | $ | (21,525 | ) | $ | 15,069 | $ | 5,172 | ||||||
39
ITEM 7. MANAGEMENT’S DISCUSSION AND ANALYSIS OF FINANCIAL CONDITION AND RESULTS OF OPERATIONS
You should read the following discussion and analysis of our financial condition and results of operations together with the information in our consolidated annual audited financial statements and the notes thereto, each of which are contained in Item 8 entitled “Financial Statements and Supplementary Data,” and other financial information incorporated by reference herein. Some of the information contained in this discussion and analysis includes forward-looking statements that involve risks and uncertainties. You should review the “Risk Factors” section as well as the section below entitled “—Special Note Regarding Forward-Looking Statements” for a discussion of important factors that could cause actual results to differ materially from the results described in or implied by the forward-looking statements contained in the following discussion and analysis.
Unless the context otherwise requires, in this Annual Report on Form 10-K, “HC2” means HC2 Holdings, Inc. and the “Company,” “we” and “our” mean HC2 together with its subsidiaries. “US GAAP” means accounting principles accepted in the United States of America.
General
The accompanying Management's Discussion and Analysis of Financial Condition and Results of Operations gives effect to the restatement adjustments made to the previously reported Consolidated Financial Statements for the year ended December 31, 2014. For additional information and a detailed discussion of the restatement, see Note 1 to our Consolidated Financial Statements included in this Report under the caption Item 1, "Consolidated Financial Statements."
General
The accompanying Management's Discussion and Analysis of Financial Condition and Results of Operations gives effect to the restatement adjustments made to the previously reported consolidated financial statements for fiscal year ended December 31, 2014. For additional information and a detailed discussion of the restatement, see Note 1 to our consolidated financial statements included in this Report under the caption Item 1, “Consolidated Financial Statements."
Introduction and Overview of Operations
We are a diversified holding company with six reportable operating segments based on management’s organization of the enterprise—Manufacturing, Marine Services, Utilities, Telecommunications, Life Sciences and Other, which includes operations that do not meet the separately reportable segment thresholds. We expect to continue to focus on acquiring and investing in businesses with attractive assets that we consider to be undervalued or fairly valued and growing our acquired businesses.
On May 29, 2014, we completed the acquisition of 2.5 million shares of common stock of Schuff International, Inc. (“Schuff”), a steel fabrication and erection company and negotiated an agreement to purchase an additional 198,411 shares, representing an approximately 65% interest in Schuff. Schuff repurchased a portion of its outstanding common stock in June 2014, which had the effect of increasing the Company’s ownership interest to 70%. During the fourth quarter, the final results of a tender offer for all outstanding shares of Schuff were announced and various open-market purchases were made, which resulted in the acquisition of 809,043 shares and an increase in our ownership interest to 91%. We intend to execute a short-form merger, which will increase our ownership of Schuff shares to 100%. Schuff and its wholly-owned subsidiaries primarily operate as integrated fabricators and erectors of structural steel and heavy steel plates with headquarters in Phoenix, Arizona and operations in Arizona, Florida, Georgia, Texas, Kansas and California. Schuff’s construction projects are primarily in the aforementioned states. In addition, Schuff has construction projects in select international markets, primarily Panama.
On August 1, 2014, the Company paid $15.5 million to acquire 15,500 shares of Series A Convertible Preferred Stock of American Natural Gas (“ANG”), representing an approximately 51% interest in ANG. ANG is a premier distributor of natural
40
gas motor fuel headquartered in the Northeast that designs, builds, owns, acquires, operates and maintains compressed natural gas fueling stations for transportation.
On September 22, 2014, the Company completed the acquisition of Bridgehouse Marine Limited, the parent holding company of Global Marine Systems Limited (“GMSL”). The purchase price reflects an enterprise value of approximately $260 million, including assumed indebtedness, and was funded using the net proceeds from (i) the issuance of $11 million of Series A-1 Convertible Participating Preferred Stock of HC2 (the “Series A-1 Preferred Stock”) and (ii) a senior secured credit facility providing for a twelve month term loan of $214 million and a delayed draw term loan of $36 million (the “September Credit Facility”), each of which was also completed on September 22, 2014. The September Credit Facility was subsequently repaid using the proceeds from HC2’s issuance of its 11% Notes discussed below under—“Liquidity and Capital Resources”. With a portion of the proceeds from the September Credit Facility, the Company paid off its senior secured credit facility entered into on May 29, 2014 providing for an eighteen month term loan of $80 million and its senior
unsecured credit facility entered into on September 8, 2014 consisting of a term loan of $17 million. GMSL is a leading provider of engineering and underwater services on submarine cables. In conjunction with the acquisition, approximately 3% of the Company’s interest in GMSL was purchased by a group of individuals, leaving the Company’s controlling interest as of December 31, 2014 at approximately 97%.
We have also historically operated a telecommunications business including a network of direct routes and provided premium voice communication services for national telecom operators, mobile operators, wholesale carriers, prepaid operators, Voice over Internet Protocol (“VoIP”) service operators and Internet service providers (“ISPs”). The Company has provided telecommunications services from its North America Telecom and International Carrier Services (“ICS”) business units. In the second quarter of 2013, the Company entered into a definitive purchase agreement to sell its North America Telecom business and sought shareholder approval of such transaction. On July 31, 2013, the Company completed the initial closing of the sale of substantially all of its North America Telecom business. The sale of Primus Telecommunications, Inc. (“PTI”) was also contemplated as part of this transaction, subject to regulatory approval. On July 31, 2014, having received the necessary regulatory approvals for the sale of PTI, we completed the divestiture of the remainder of our North America Telecom business.
In our Life Sciences segment, we operate Pansend, LLC (“Pansend”), which has an 80% interest in Genovel Orthopedics, Inc., which seeks to develop products to treat early osteoarthritis of the knee, and a 61% interest in GemDerm Aesthetics, Inc., which develops skin lightening technology.
During 2013, we also provided data center services in Canada through our BLACKIRON Data business unit. On April 17, 2013, we consummated the divestiture of BLACKIRON Data.
We are evaluating several strategic and business alternatives, which may include the following: acquiring assets or businesses unrelated to our current or historical operations, operating, growing or acquiring additional assets or businesses related to our current or historical operations or winding down or selling our existing operations. As part of any acquisition strategy, we may raise capital in the form of debt or equity securities (including preferred stock) or a combination thereof. We have broad discretion in selecting a business strategy for the Company. If we elect to pursue an acquisition, we have broad discretion in identifying and selecting both the industries and the possible acquisition or business combination opportunities. We have not identified a specific industry to focus on and there can be no assurance that we will, or we will be able to, identify or successfully complete any such transactions. In connection with evaluating these strategic and business alternatives, we may at any time be engaged in ongoing discussions with respect to possible acquisitions, business combinations and debt or equity securities offerings of widely varying sizes. There can be no assurance that any of these discussions will result in a definitive agreement and if they do, what the terms or timing of any agreement would be. While we search for additional acquisition opportunities, we manage a portion of our available cash and acquire interests in possible acquisition targets through our wholly-owned subsidiary, HC2 Investment Securities, Inc., a Delaware corporation.
Recent Developments
Offering of Senior Notes
On November 20, 2014, the Company issued $250.0 million in aggregate principal amount of its 11% Notes discussed below under—“Liquidity and Capital Resources”. See Note 9—“Long-Term Obligations” for additional terms of the 11% Notes.
Preferred Stock and Common Stock Issuances
41
On May 29, 2014, HC2 issued 30,000 shares of Series A Convertible Participating Preferred Stock of HC2 (“the Series A Preferred Stock”) and 1,500,000 shares of common stock, the proceeds of which were used to pay for a portion of the purchase price for the acquisition of Schuff. On September 22, 2014, HC2 issued 11,000 shares of Series A-1 Preferred Stock. Each share of Series A-1 Preferred Stock is convertible at a conversion price of $4.25. In connection with the issuance of the Series A-1 Preferred Stock, HC2 amended the certificate of designation governing the Series A Preferred Stock on September 22, 2014, which changed the applicable conversion price from $4.25 to $4.00, reflected the issuance of the Series A-1 Preferred Stock as a class of preferred stock which ranks at parity with the Series A Preferred Stock and made certain other changes to conform the terms of the Series A Preferred Stock to those of the Series A-1 Preferred Stock. On January 5, 2015, HC2 issued 14,000 shares of Series A-2 Convertible Participating Preferred Stock of HC2 (the “Series A-2 Preferred Stock” and together with the Series A Preferred Stock and Series A-1 Preferred Stock, the “Preferred Stock”. Each share of Series A-2 Preferred Stock is convertible at a conversion price of $8.25. The conversion prices for the Preferred Stock are subject to adjustments for dividends, certain distributions, stock splits, combinations, reclassifications, reorganizations, mergers, recapitalizations and similar events. See Note 14—“Equity” for additional terms of the Preferred Stock.
Foreign Currency
Foreign currency can impact our financial results. During the year ended December 31, 2014, approximately 19.2% of our net revenue from continuing operations was derived from sales and operations outside the U.S. The reporting currency for our consolidated financial statements is the United States dollar (the “USD”). The local currency of each country is the functional currency for each of our respective entities operating in that country. In the future, we expect to continue to derive a portion of our net revenue and incur a portion of our operating costs from outside the U.S., and therefore changes in exchange rates may continue to have a significant, and potentially adverse, effect on our results of operations. Our risk of loss regarding foreign currency exchange rate risk is caused primarily by fluctuations in the USD/British pound sterling (“GBP”) exchange rate. Due to a percentage of our revenue derived outside of the U.S., changes in the USD relative to the GBP could have an adverse impact on our future results of operations. In addition, prior to the sale of the Company’s Australia operations during the second quarter of 2012 and the sale of BLACKIRON Data and North America Telecom during the second and third quarters of 2013, respectively, we also experienced risk of loss regarding foreign currency exchange rates due to fluctuations in the USD/Australian dollar (“AUD”) and USD/Canadian dollar (“CAD”) exchange rates. We have agreements with certain subsidiaries for repayment of a portion of the investments and advances made to these subsidiaries. As we anticipate repayment in the foreseeable future, we recognize the unrealized gains and losses in foreign currency transaction gain (loss) on the consolidated statements of operations. The exposure of our income from operations to fluctuations in foreign currency exchange rates is reduced in part because a majority of the costs that we incur in connection with our foreign operations are also denominated in local currencies.
We are exposed to financial statement gains and losses as a result of translating the operating results and financial position of our international subsidiaries. We translate the local currency statements of operations of our foreign subsidiaries into USD using the average exchange rate during the reporting period. Changes in foreign exchange rates affect the reported profits and losses and cash flows of our international subsidiaries and may distort comparisons from year to year. By way of example, when the USD strengthens compared to the GBP, there could be a negative or positive effect on the reported results for our Telecommunications and Marine Services segments, depending upon whether such businesses are operating profitably or at a loss. It takes more profits in GBP to generate the same amount of profits in USD and a greater loss in GBP to generate the same amount of loss in USD. The opposite is also true. For instance, when the USD weakens against the GBP, there is a positive effect on reported profits and a negative effect on reported losses.
For the year ended December 31, 2014 as compared to the year ended December 31, 2013, the USD was weaker on average as compared to the GBP. For the year ended December 31, 2013 as compared to the year
ended December 31, 2012, the USD was stronger on average as compared to the CAD and GBP. The following tables demonstrate the impact of currency fluctuations on our net revenue for the years ended December 31, 2014, 2013 and 2012:
Net Revenue by Location, including Discontinued Operations—in USD (in thousands)
Years Ended December 31, | |||||||||||||||||||||||||
2014 | vs 2013 | 2013 | vs 2012 | ||||||||||||||||||||||
2014 | 2013 | 2012 | Variance $ | Variance % | Variance $ | Variance % | |||||||||||||||||||
Canada (1) | $ | — | $ | 109,167 | $ | 223,301 | $ | (109,167 | ) | (100.0 | )% | $ | (114,134 | ) | (51.1 | )% | |||||||||
Australia (1) | — | — | 114,860 | N/A | N/A | (114,860 | ) | (100.0 | )% | ||||||||||||||||
United Kingdom (1) | 97,653 | 122,123 | 202,196 | (24,470 | ) | (20.0 | )% | (80,073 | ) | (39.6 | )% | ||||||||||||||
42
Net Revenue by Location, including Discontinued Operations—in Local Currencies (in thousands)
Years Ended December 31, | |||||||||||||||||||||||||
2014 | vs 2013 | 2013 | vs 2012 | ||||||||||||||||||||||
2014 | 2013 | 2012 | Variance $ | Variance % | Variance $ | Variance % | |||||||||||||||||||
Canada (1) (in CAD) | $ | — | $ | 111,090 | $ | 223,190 | $ | (111,090 | ) | (100.0 | )% | $ | (112,100 | ) | (50.2 | )% | |||||||||
Australia (1) (in AUD) | — | — | 110,408 | N/A | N/A | (110,408 | ) | (100.0 | )% | ||||||||||||||||
United Kingdom (1) (in GBP) | 59,989 | 78,371 | 127,726 | (18,382 | ) | (23.5 | )% | (49,355 | ) | (38.6 | )% | ||||||||||||||
(1) Table includes revenues from discontinued operations which are subject to currency risk.
Critical Accounting Policies
To aid in the understanding of our financial reporting, our most critical accounting policies are described below. These policies have the potential to have a more significant impact on our financial statements, either because of the significance of the financial statement item to which they relate, or because they require judgment and estimation due to the uncertainty involved in measuring, at a specific point in time, events which are continuous in nature.
Revenue and Cost Recognition
GMSL—GMSL generates revenue by providing maintenance services for subsea telecommunications cabling. GMSL also generates revenues from the design and installation of subsea cables under contracts. GMSL also provides installation, maintenance and repair of fiber optic communication and power infrastructure to offshore oil and gas platforms and installs inter-array power cables for use in offshore wind farms and in the offshore wind market. Over the next decade, energy production from renewables is expected to grow substantially and in particular from the Asia Pacific region. Within the offshore power market, the North Sea, as a pioneering region, and East Asia (particularly China), GMSL is well positioned to participate in the growth of these two geographical markets with their existing assets best suited for the installation of inter array cables.
Telecommunication/Maintenance—GMSL provides vessels on standby to repair fiber optic telecommunications cables in defined geographic zones, and its maintenance business is provided through contracts with consortia of up to 60 global telecommunications providers. Typically, GMSL enters into five to seven year contracts to provide maintenance to cable systems that are located in specific geographical areas. Revenue from these maintenance agreements is recognized on a straight line basis unless the pattern of costs associated with repairs indicates otherwise.
Telecommunications/Installation—GMSL provides installation of cable systems including route planning, mapping, route engineering, cable laying, and trenching and burial. GMSL’s installation business is project-based with fixed price contracts typically lasting one to five months. Revenue is recognized as time and costs are incurred.
Charter hire—rentals from short term operating leases in respect of vessels are recognized as revenue on a straight line basis over the term of the lease.
Oil & Gas—GMSL provides installation, maintenance and repair of fiber optic communication and power infrastructure to offshore platforms. Its primary activities include providing power from shore, enabling fiber-based communication between platforms and shore-based systems and installing permanent reservoir monitoring systems which allow customers to monitor subsea seismic data. The majority of GMSL’s oil & gas business is contracted on a project-by-project basis with major energy producers or tier I engineering, procurement and construction (EPC) contractors. Revenue is recognized as time and costs are incurred.
A loss is recognized immediately if the expected costs during any contract exceed expected revenues. Amounts billed in advance of revenue recognition are recorded as deferred revenue.
Schuff—Schuff performs its services primarily under fixed-price contracts and recognizes revenues and costs from construction projects using the percentage of completion method. Under this method, revenue is recognized based upon either the ratio of the costs incurred to date to the total estimated costs to complete the project or the ratio of tons fabricated to date to total estimated tons. Revenue recognition begins when work has commenced. Costs include all direct material and labor costs related to contract performance, subcontractor costs, indirect labor, and fabrication plant overhead costs, which are charged to contract costs as incurred. Revenues relating to changes in the scope of a contract are recognized when the work has commenced, Schuff has made an estimate of the amount that is probable of being paid for the change and there is a high degree of probability that the charges will be approved by the customer or general contractor. At December 31, 2014, Schuff had $53.9 million of unapproved change orders on open projects, for which it has recognized revenues on a percentage of completion basis. While Schuff has been
43
successful in having the majority of its change orders approved in prior years, there is no guarantee that the majority of unapproved change orders at December 31, 2014 will be approved. Revisions in estimates during the course of contract work are reflected in the accounting period in which the facts requiring the revision become known. Provisions for estimated losses on uncompleted contracts are made in the period a loss on a contract becomes determinable.
Construction contracts with customers generally provide that billings are to be made monthly in amounts which are commensurate with the extent of performance under the contracts. Contract receivables arise principally from the balance of amounts due on progress billings on jobs under construction. Retentions on contract receivables are amounts due on progress billings, which are withheld until the completed project has been accepted by the customer.
Costs and recognized earnings in excess of billings on uncompleted contracts primarily represent revenue earned under the percentage of completion method which has not been billed. Billings in excess of related costs and recognized earnings on uncompleted contracts represent amounts billed on contracts in excess of the revenue allowed to be recognized under the percentage of completion method on those contracts.
ICS—Net revenue is derived from carrying a mix of business, residential and carrier long-distance traffic, data and Internet traffic. For certain voice services, net revenue is earned based on the number of minutes during a call, and is recorded upon completion of a call. Revenue for a period is calculated from information received through the Company’s network switches. Customized software has been designed to track the information from the switch and analyze the call detail records against stored detailed information about revenue rates. This software provides the Company the ability to do a timely and accurate analysis of revenue earned in a period. Separate prepaid services software is used to track additional information related to prepaid service usage such as activation date, monthly usage amounts and expiration date. Revenue on these prepaid services is recognized as service is provided until expiration, when all unused minutes, which are no longer available to the customers, are recognized as revenue. Net revenue is also earned on a fixed monthly fee basis for unlimited local and long-distance voice plans and for the provision of data/Internet services (including retail VoIP), hosting, and colocation. In the United States, we charge customers Federal Universal Service Fund (“USF”) fees. We recognize revenue on a gross basis for USF and related fees. We record these fees as revenue when billed. Net revenue represents gross revenue, net of allowance for doubtful accounts receivable, service credits and service adjustments. Cost of revenue includes network costs that consist of access, transport and termination costs. The majority of the Company’s cost of revenue is variable, primarily based upon minutes of use, with transmission and termination costs being the most significant expense. Cost of revenue also includes fees such as Federal USF fees. Such costs are recognized when incurred in connection with the provision of telecommunications services.
Goodwill and Other Intangible Assets—Under ASC No. 350, “Intangibles—Goodwill and Other” (“ASC 350”), goodwill and indefinite lived intangible assets are not amortized but are reviewed annually for impairment, or more frequently, if impairment indicators arise. Intangible assets that have finite lives are amortized over their estimated useful lives and are subject to the provisions of ASC 360.
Goodwill impairment is tested at least annually (October 1st) or when factors indicate potential impairment using a two-step process that begins with an estimation of the fair value of each reporting unit. Step 1 is a screen for potential impairment pursuant to which the estimated fair value of each reporting unit is compared to its carrying value. The Company estimates the fair values of each reporting unit by an estimation of the discounted cash flows of each of the reporting units based on projected earnings in the future (the income approach). If there is a deficiency (the estimated fair value of a reporting unit is less than its carrying value), a Step 2 test is required.
Step 2 measures the amount of impairment loss, if any, by comparing the implied fair value of the reporting unit’s goodwill with its carrying amount. The implied fair value of goodwill is determined in the same manner as the amount of goodwill recognized in a business combination is determined; i.e., through an allocation of the fair value of a reporting unit to all of the assets and liabilities of that unit as if the reporting unit had been acquired in a business combination. If the carrying amount of the reporting unit goodwill exceeds the implied fair value of that goodwill, an impairment loss shall be recognized in an amount equal to that excess.
The Company also may utilize the provisions of Accounting Standards Update (“ASU”) No. 2011-08, “Testing Goodwill for Impairment” (“ASU 2011-08”), which allows the Company to use qualitative factors to determine whether the existence of events or circumstances leads to a determination that it is more likely than not that the fair value of a reporting unit is less than its carrying amount.
Subsequent to classifying ICS as a discontinued operation in the second quarter of 2012 and its goodwill being classified as a held for sale asset, the reporting units were Canada and US. Subsequent to the sale of North America Telecom (which included the Canada reporting unit) in the third quarter of 2013, the Company had no goodwill attributable to the remaining US reporting
44
unit. The US reporting unit goodwill was attributable to PTI, the unsold portion of North America Telecom, and was included in assets held for sale. As a result of the decision to cease the sale process of ICS as of December 31, 2013, ICS became a reporting unit and its goodwill was reclassified as a held and used asset. With the acquisition of Schuff it became its own reporting unit in May 2014 and was subject to annual testing for impairment on October 1st of each year.
Estimating the fair value of a reporting unit requires various assumptions including projections of future cash flows, perpetual growth rates and discount rates. The assumptions about future cash flows and growth rates are based on the Company’s assessment of a number of factors, including the reporting unit’s recent performance against budget, performance in the market that the reporting unit serves, and industry and general economic data from third party sources. Discount rate assumptions are based on an assessment of the risk inherent in those future cash flows. Changes to the underlying businesses could affect the future cash flows, which in turn could affect the fair value of the reporting unit.
Intangible assets subject to amortization consists of certain trade names, customer contracts and developed technology. These finite lived intangible assets are amortized based on their estimated useful lives. Such assets are subject to the impairment provisions of ASC 360, wherein impairment is recognized and measured only if there are events and circumstances that indicate that the carrying amount may not be recoverable. The carrying amount is not recoverable if it exceeds the sum of the undiscounted cash flows expected to result from the use of the asset group. An impairment loss is recorded if after determining that it is not recoverable, the carrying amount exceeds the fair value of the asset.
In addition to the foregoing, the Company reviews its goodwill and intangible assets for possible impairment whenever events or circumstances indicate that the carrying amounts of assets may not be recoverable. The factors that the Company considers important, and which could trigger an impairment review, include, but are not limited to: a more likely than not expectation of selling or disposing all, or a portion, of a reporting unit; a significant decline in the market value of our common stock or debt securities for a sustained period; a material adverse change in economic, financial market, industry or sector trends; a material failure to achieve operating results relative to historical levels or projected future levels; and significant changes in operations or business strategy.
Valuation of Long-lived Assets—The Company reviews long-lived assets whenever events or changes indicate that the carrying amount of an asset may not be recoverable. In making such evaluations, the Company compares the expected undiscounted future cash flows to the carrying amount of the assets. If the total of the expected undiscounted future cash flows is less than the carrying amount of the assets, the Company is required to make estimates of the fair value of the long-lived assets in order to calculate the impairment loss equal to the difference between the fair value and carrying value of the assets.
The Company makes significant assumptions and estimates in this process regarding matters that are inherently uncertain, such as determining asset groups and estimating future cash flows, remaining useful lives, discount rates and growth rates. The resulting undiscounted cash flows are projected over an extended period of time, which subjects those assumptions and estimates to an even larger degree of uncertainty. While the Company believes that its estimates are reasonable, different assumptions could materially affect the valuation of the long-lived assets. The Company derives future cash flow estimates from its historical experience and its internal business plans, which include consideration of industry trends, competitive actions, technology changes, regulatory actions, available financial resources for marketing and capital expenditures and changes in its underlying cost structure.
The Company makes assumptions about the remaining useful life of its long-lived assets. The assumptions are based on the average life of its historical capital asset additions and its historical asset purchase trend. In some cases, due to the nature of a particular industry in which the company operates, the Company may assume that technology changes in such industry render all associated assets, including equipment, obsolete with no salvage value after their useful lives. In certain circumstances in which the underlying assets could be leased for an additional period of time or salvaged, the Company includes such estimated cash flows in its estimate.
The estimate of the appropriate discount rate to be used to apply the present value technique in determining fair value was the Company’s weighted average cost of capital which is based on the effective rate of its long-term debt obligations at the current market values (for periods during which the Company had long-term debt obligations) as well as the current volatility and trading value of the Company’s common stock.
Accounting for Income Taxes—We recognize deferred tax assets and liabilities for the expected future tax consequences of transactions and events. Under this method, deferred tax assets and liabilities are determined based on the difference between the financial statement bases and the tax bases of assets and liabilities using enacted tax rates in effect for the year in which the differences are expected to reverse. If necessary, deferred tax assets are reduced by a valuation allowance to an amount that is determined to be more likely than not recoverable. We must make significant estimates and assumptions about future taxable income and future tax consequences when
45
determining the amount of the valuation allowance. The additional guidance provided by ASC No. 740, “Income Taxes” (“ASC 740”), clarifies the accounting for uncertainty in income taxes recognized in the financial statements. Expected outcomes of current or anticipated tax examinations, refund claims and tax-related litigation and estimates regarding additional tax liability (including interest and penalties thereon) or refunds resulting therefrom will be recorded based on the guidance provided by ASC 740 to the extent applicable.
At present, our U.S. and foreign companies have significant deferred tax assets resulting from tax loss carryforwards. The foreign deferred tax assets with minor exceptions are fully offset with valuation allowances. The appropriateness and amount of these valuation allowances are based on our assumptions about the future taxable income of each affiliate. If our assumptions have significantly underestimated future taxable income with respect to a particular affiliate, all or part of the valuation allowance for the affiliate would be reversed and additional income could result. The valuation allowances for the U.S. NOL deferred tax assets were released in 2014.
Financial Presentation Background
In the following presentations and narratives within this Management’s Discussion and Analysis of Financial Condition and Results of Operations, we compare, pursuant to accounting principles generally accepted in the United States of America (“US GAAP”) and SEC disclosure rules, the Company’s results of operations for the year ended December 31, 2014 as compared to the year ended December 31, 2013 and the year ended December 31, 2013 as compared to the year ended December 31, 2012.
Discontinued Operations
2014 and 2013 Developments—In the second quarter of 2013, the Company sold its BLACKIRON Data segment. In addition, in the second quarter of 2013, the Company entered into a definitive purchase agreement to sell its North America Telecom segment and sought shareholder approval of such transaction. On July 31, 2013, the Company completed the initial closing of the sale of its North America Telecom segment (see Note 20—“Discontinued Operations”). In conjunction with the initial closing of the sale of the North America Telecom segment, the Company redeemed its outstanding debt issued by PTGi International Holding, Inc. (f/k/a Primus Telecommunications Holding, Inc., “PTHI”) on August 30, 2013. Because the debt was required to be repaid as a result of the sale of North America Telecom, the interest expense and loss on early extinguishment or restructuring of debt of PTHI has been allocated to discontinued operations. The closing of the sale of Primus Telecommunications, Inc. (“PTI”) (the remaining portion of the North America Telecom segment subject to the applicable purchase agreement) was completed on July 31, 2014. Prior to the closing, PTI had been included in discontinued operations as a result of being held for sale. In December 2013, based on management’s assessment of the requirements under ASC 360, it was determined that ICS no longer met the criteria of a held for sale asset. On February 11, 2014, the Board of Directors officially ratified management’s December 2013 assessment, and reclassified ICS from held for sale to held and used, effective December 31, 2013. As a result, ICS became classified as a continuing operation. ICS had been classified as a discontinued operation since the second quarter of 2012 as a result of being held for sale.
2012 Developments—During the second quarter of 2012, the Company sold its Australian segment.
As a result of these events, the Company’s consolidated financial statements reflect the BLACKIRON Data, North America Telecom and Australian segments, as well as PTHI’s interest expense and loss on early extinguishment or restructuring of debt as discontinued operations for the years ended December 31, 2014, 2013 and 2012. Accordingly, revenue, costs and expenses of the discontinued operations have been excluded from the respective captions in the consolidated statements of operations. The net operating results of the discontinued operations have been reported, net of applicable income taxes as income or loss (where applicable) from discontinued operations.
Summarized operating results of the discontinued operations are as follows (in thousands):
46
Years Ended December 31, | |||||||||||
2014 | 2013 | 2012 | |||||||||
Net revenue | $ | 7,530 | $ | 132,515 | $ | 375,264 | |||||
Operating expenses | 7,610 | 119,392 | 343,263 | ||||||||
Income (loss) from operations | (80 | ) | 13,123 | 32,001 | |||||||
Interest expense | (17 | ) | (11,362 | ) | (24,621 | ) | |||||
Gain (loss) on early extinguishment or restructuring of debt | — | (21,124 | ) | (21,682 | ) | ||||||
Interest income and other income (expense) | (60 | ) | (51 | ) | 283 | ||||||
Foreign currency transaction gain (loss) | — | (378 | ) | (2,550 | ) | ||||||
Income (loss) before income tax | (157 | ) | (19,792 | ) | (16,569 | ) | |||||
Income tax (expense) benefit | 132 | 171 | (4,956 | ) | |||||||
Income (loss) from discontinued operations | $ | (25 | ) | $ | (19,621 | ) | $ | (21,525 | ) | ||
Results of Operations
Results of operations for the year ended December 31, 2014 as compared to the year ended December 31, 2013
For the year ended December 31, 2014, the results of operations include Schuff and GMSL from their respective dates of acquisition.
The pro forma results of operations for the years ended December 31, 2014 and 2013 include pro forma financial information for the Manufacturing and Marine Services operating segments. These pro forma results give effect to the acquisitions of Schuff and GMSL as if they had occurred on January 1, 2013, but do not include any purchase price accounting adjustments (if applicable). The pro forma results of operations are limited to the discussion of net revenue, cost of revenue and selling, general and administrative expenses, as presented below.
Revenue
Years Ended | Year-over-Year | |||||||||||||||||||
2014 | 2013 | |||||||||||||||||||
(in thousands) | Net Revenue (As Restated) | % of Total (As Restated) | Net Revenue | % of Total | Variance (As Restated) | Variance % (As Restated) | ||||||||||||||
Telecommunications | $ | 161,953 | 29.6 | % | $ | 230,686 | 100.0 | % | $ | (68,733 | ) | (29.8 | )% | |||||||
Manufacturing | 348,318 | 63.6 | % | — | — | % | 348,318 | 100.0 | % | |||||||||||
Marine Services | 35,328 | 6.5 | % | — | — | % | 35,328 | 100.0 | % | |||||||||||
Utilities | 1,839 | 0.3 | % | — | — | % | 1,839 | 100.0 | % | |||||||||||
Total Net Revenue | $ | 547,438 | 100.0 | % | $ | 230,686 | 100.0 | % | $ | 316,752 | 137.3 | % | ||||||||
Pro forma Revenue
Years Ended | Year-over-Year | |||||||||||||||||||
2014 | 2013 | |||||||||||||||||||
(in thousands) | Net Revenue | % of Total | Net Revenue | % of Total | Variance | Variance % | ||||||||||||||
Telecommunications | $ | 161,953 | 19.0 | % | $ | 230,686 | 28.8 | % | $ | (68,733 | ) | (29.8 | )% | |||||||
Manufacturing | 526,141 | 61.6 | % | 416,142 | 51.9 | % | 109,999 | 26.4 | % | |||||||||||
Marine Services | 163,595 | 19.2 | % | 154,862 | 19.3 | % | 8,733 | 5.6 | % | |||||||||||
Utilities | 1,839 | 0.2 | % | — | — | % | 1,839 | 100.0 | % | |||||||||||
Total Net Revenue | $ | 853,528 | 100.0 | % | $ | 801,690 | 100.0 | % | $ | 51,838 | 6.5 | % | ||||||||
47
Net revenue: Net revenue increased $316.8 million, or 137.3%, to $547.4 million for the year ended December 31, 2014 from $230.7 million for the year ended December 31, 2013.
Telecommunications: The decrease in Telecommunications is primarily due to a significant decline in both domestic and international terminations year over year.
Manufacturing: On a pro forma basis, manufacturing revenue increased by $110.0 million or 26.4%. The increase in Manufacturing is primarily due to the ramp-up of major projects located in the Pacific, Midwest and Gulf Coast regions of the United States. The increase in Midwest and Gulf Coast regions was mostly due to increased work in the industrial market, including oil and gas projects. The increase in the Pacific region was due to several large commercial projects beginning in 2014.
Marine Services: On a pro forma basis, marine services revenue increased by $8.7 million or 5.6%. The increase is primarily due to the impact of currency fluctuations.
Cost of Revenue
Years Ended | Year-over-Year | |||||||||||||||||||
2014 | 2013 | |||||||||||||||||||
(in thousands) | Cost of Revenue (As Restated) | % of Net Revenue (As Restated) | Cost of Revenue | % of Net Revenue | Variance (As Restated) | Variance % (As Restated) | ||||||||||||||
Telecommunications | $ | 154,346 | 95.3 | % | $ | 220,315 | 95.5 | % | $ | (65,969 | ) | (29.9 | )% | |||||||
Manufacturing | 295,706 | 84.9 | % | — | — | % | 295,706 | 100.0 | % | |||||||||||
Marine Services | 23,466 | 66.4 | % | — | — | % | 23,466 | 100.0 | % | |||||||||||
Utilities | 824 | 44.8 | % | — | — | % | 824 | 100.0 | % | |||||||||||
Total Cost of Revenue | $ | 474,342 | 86.6 | % | $ | 220,315 | 95.5 | % | $ | 254,027 | 115.3 | % | ||||||||
Pro forma Cost of Revenue
Years Ended | Year-over-Year | |||||||||||||||||||
2014 | 2013 | |||||||||||||||||||
(in thousands) | Cost of Revenue | % of Net Revenue | Cost of Revenue | % of Net Revenue | Variance | Variance % | ||||||||||||||
Telecommunications | $ | 154,346 | 95.3 | % | $ | 220,315 | 95.5 | % | $ | (65,969 | ) | (29.9 | )% | |||||||
Manufacturing | 444,932 | 84.6 | % | 355,951 | 85.5 | % | 88,981 | 25.0 | % | |||||||||||
Marine Services | 109,914 | 67.2 | % | 112,486 | 72.6 | % | (2,572 | ) | (2.3 | )% | ||||||||||
Utilities | 824 | 44.8 | % | — | — | % | 824 | 100.0 | % | |||||||||||
Total Cost of Revenue | $ | 710,016 | 83.2 | % | $ | 688,752 | 85.9 | % | $ | 21,264 | 3.1 | % | ||||||||
Cost of revenue: Cost of revenue increased $254.0 million to $474.3 million, or 86.6% of net revenue, for the year ended December 31, 2014 from $220.3 million, or 95.5% of net revenue, for the year ended December 31, 2013.
Telecommunications: The decrease in Telecommunications is primarily due to the decrease in net revenue in such segment. While there have been significant declines in both net revenue and cost of revenue in Telecommunications, cost of revenue as a percentage of net revenue for such segment decreased 20 basis points year over year.
Manufacturing: On a pro forma basis, manufacturing cost of sales increased by $89.0 million or 25.0%. The increase in Manufacturing is primarily due to the increase in revenues. Cost of revenue increased less than revenues due to several favorable settlements on projects in the Southwest and Gulf Coast regions.
Marine Services: On a pro forma basis, marine services cost of sales decreased by $2.6 million or 2.3%. The decrease is primarily due to a decrease in payroll costs due to a reduction in seafarer headcount.
48
Selling, General and Administrative Expenses
Years Ended | Year-over-Year | |||||||||||||||||||
2014 | 2013 | |||||||||||||||||||
(in thousands) | SG&A (As Restated) | % of Net Revenue (As Restated) | SG&A | % of Net Revenue | Variance (As Restated) | Variance % (As Restated) | ||||||||||||||
Telecommunications | $ | 8,788 | 5.4 | % | $ | 16,272 | 7.1 | % | $ | (7,484 | ) | (46.0 | )% | |||||||
Life Sciences | 4,761 | — | % | — | — | % | 4,761 | 100.0 | % | |||||||||||
Manufacturing | 25,203 | 7.2 | % | — | — | % | 25,203 | 100.0 | % | |||||||||||
Marine Services | 2,709 | 7.7 | % | — | — | % | 2,709 | 100.0 | % | |||||||||||
Utilities | 1,178 | 64.1 | % | — | — | % | 1,178 | 100.0 | % | |||||||||||
Other | 8,123 | — | % | — | — | % | 8,123 | 100.0 | % | |||||||||||
Corporate | 29,477 | — | % | 18,420 | — | % | 11,057 | 60.0 | % | |||||||||||
Total SG&A | $ | 80,239 | 14.7 | % | $ | 34,692 | 15.0 | % | $ | 45,547 | 131.3 | % | ||||||||
Pro forma Selling, General and Administrative Expenses
Years Ended | Year-over-Year | |||||||||||||||||||
2014 | 2013 | |||||||||||||||||||
(in thousands) | SG&A (As Restated) | % of Net Revenue (As Restated) | SG&A | % of Net Revenue | Variance (As Restated) | Variance % (As Restated) | ||||||||||||||
Telecommunications | $ | 8,788 | 5.4 | % | $ | 16,272 | 7.1 | % | $ | (7,484 | ) | (46.0 | )% | |||||||
Life Sciences | 4,761 | — | % | — | — | % | 4,761 | 100.0 | % | |||||||||||
Manufacturing | 39,588 | 7.5 | % | 32,275 | 7.8 | % | 7,313 | 22.7 | % | |||||||||||
Marine Services | 11,934 | 7.3 | % | 9,825 | 6.3 | % | 2,109 | 21.5 | % | |||||||||||
Utilities | 1,178 | 64.1 | % | — | — | % | 1,178 | 100.0 | % | |||||||||||
Other | 8,123 | — | % | — | — | % | 8,123 | 100.0 | % | |||||||||||
Corporate | 29,477 | — | % | 18,420 | — | % | 11,057 | 60.0 | % | |||||||||||
Total SG&A | $ | 103,849 | 12.2 | % | $ | 76,792 | 9.6 | % | $ | 27,057 | 35.2 | % | ||||||||
Selling, general and administrative expenses: Selling, general and administrative expenses increased $45.5 million to $80.2 million, or 14.7% of net revenue, for the year ended December 31, 2014 from $34.7 million, or 15.0% of net revenue, for the year ended December 31, 2013.
Telecommunications: The decrease in Telecommunications was primarily due to a $3.9 million decrease in salaries and benefits resulting from headcount reductions, $1.4 million in lower occupancy costs, a $1.2 million decrease in general and administrative expenses and a $0.9 million decrease in professional fees.
Manufacturing: On a pro forma basis, manufacturing selling, general and administrative expenses increased by $7.3 million or 22.7%. The increase in Manufacturing is primarily due to additional employee-related costs to support the increased revenues and higher bonus expense due to our improved financial performance. We continue to make a concerted effort to control costs while continuing to invest in business development and information technology to increase profitability.
Marine Services: On a pro forma basis, marine services selling, general and administrative expenses increased by $2.1 million or 21.5%. The increase is primarily due to additional relocation and severance costs, training and development costs and marketing costs.
Corporate: The increase in Corporate included $4.5 million higher salaries and benefits resulting from higher bonus amounts, $3.1 million higher occupancy related to a lease buyout, and $3.0 million higher professional fees related to our acquisitions.
49
Pro forma Revenue less Cost of Revenue less Selling, General and Administrative Expenses
Pro forma revenue less cost of revenue less selling, general and administrative expense for our Manufacturing segment was $41.6 million for the year ended December 31, 2014 compared to $27.9 million for the year ended December 31, 2013. This represented an increase of $13.7 million or 49.1%.
Pro forma revenue less cost of revenue less selling, general and administrative expense for our Marine Services segment was $41.8 million for the year ended December 31, 2014 compared to $32.6 million for the year ended December 31, 2013. This represented an increase of $9.2 million or 28.3%.
Depreciation and amortization expense: Depreciation and amortization expense for the year ended December 31, 2014 was $10.7 million, a portion of which was included in cost of revenue. Depreciation and amortization expense for the year ended December 31, 2013 was $12.0 million of which a majority included depreciation and amortization for the period July 1, 2012 – December 31, 2013, when the property and equipment of ICS was included in assets held for sale. In accordance with US GAAP, held for sale assets are not depreciated. When ICS was no longer considered to be held for sale, we were required to record all unrecorded depreciation in the fourth quarter of 2013.
Gain on sale or disposal of assets: Gain on sale or disposal of assets was $0.2 million and $0 for the years ended December 31, 2014 and 2013, respectively.
Asset impairment expense: Asset impairment expense decreased $2.5 million to $0.3 million for the year ended December 31, 2014 from $2.8 million for the year ended December 31, 2013. For the year ended December 31, 2013, asset impairment expense primarily included $2.0 million related to the impairment of property and equipment as a result of reclassifying ICS from held for sale to held and used.
Interest expense: Interest expense was $10.8 million for the year ended December 31, 2014. Interest expense was immaterial for the year ended December 31, 2013. The increase in interest expense in 2014 was due to our entry into credit facilities and issuance of HC2’s 11% Notes during the year.
Amortization of debt discount: Amortization of debt discount was $1.6 million and $0 for the years ended December 31, 2014 and 2013, respectively. The increase in amortization of debt discount was due to our entry into credit facilities during 2014.
Loss on early extinguishment of debt: Loss on early extinguishment of debt was $12.0 million and $0 for the years ended December 31, 2014 and 2013, respectively. The loss in 2014 was due to the early payoff of our credit facilities entered into during the year and subsequently refinanced.
Gain from contingent rights valuation: The gain from the change in fair value of HC2’s contingent value rights (the “CVRs”) for the year ended December 31, 2013 was $14.9 million. Estimates of fair value represent the Company’s best estimates based on a pricing model and have historically been correlated to and reflective of our common stock trends. Generally, as the fair value of our common stock increased/decreased, the fair value of the CVRs increased/decreased and a loss/gain from CVR valuation was recorded. The sale of substantially all of North America Telecom constituted a change of control under the CVR Agreement and resulted in the expiration of the CVRs and termination of the CVR Agreement in 2013. Accordingly, there was no gain from the change in fair value of the CVRs for the year ended December 31, 2014.
Interest income and other expense, net: Interest income and other expense, net was expense of $0.8 million and expense of $0.2 million for the years ended December 31, 2014 and 2013, respectively.
Foreign currency transaction gain (loss): Foreign currency transactions resulted in a loss of $0.1 million and a loss of $0.6 million for the years ended December 31, 2014 and 2013, respectively. The gains and losses are attributable to receivables and payables denominated in a currency other than the subsidiaries’ functional currency.
Income from equity investees: Income from equity investees was $2.7 million and $0 for the years ended December 31, 2014 and 2013, respectively. The primary reason for the increase was the result of the performance of GMSL’s equity investments.
Income tax benefit: Income tax benefit was $22.9 million and $7.4 million for the years ended December 31, 2014 and 2013, respectively. The increase in tax benefit was due primarily to the reversal of certain valuation allowances on our U.S. deferred tax assets.
Results of operations for the year ended December 31, 2013 as compared to the year ended December 31, 2012
50
Years Ended | Year-over-Year | |||||||||||||||||||
2013 | 2012 | |||||||||||||||||||
(in thousands) | Net Revenue | % of Total | Net Revenue | % of Total | Variance | Variance % | ||||||||||||||
Telecommunications | $ | 230,686 | 100.0 | % | $ | 302,959 | 100.0 | % | $ | (72,273 | ) | (23.9 | )% | |||||||
Total Net Revenue | $ | 230,686 | 100.0 | % | $ | 302,959 | 100.0 | % | $ | (72,273 | ) | (23.9 | )% | |||||||
Net revenue: Net revenue decreased $72.3 million to $230.7 million for the year ended December 31, 2013 from $303.0 million for the year ended December 31, 2012. The decrease was primarily due to a significant decline in both domestic and international terminations year over year.
Years Ended | Year-over-Year | |||||||||||||||||||
2013 | 2012 | |||||||||||||||||||
(in thousands) | Cost of Revenue | % of Net Revenue | Cost of Revenue | % of Net Revenue | Variance | Variance % | ||||||||||||||
Telecommunications | $ | 220,315 | 95.5 | % | $ | 285,631 | 94.3 | % | $ | (65,316 | ) | (22.9 | )% | |||||||
Total Cost of Revenue | $ | 220,315 | 95.5 | % | $ | 285,631 | 94.3 | % | $ | (65,316 | ) | (22.9 | )% | |||||||
Cost of revenue: Cost of revenue decreased $65.3 million to $220.3 million for the year ended December 31, 2013 from $285.6 million for the year ended December 31, 2012. The decrease was primarily due to the decrease in net revenue. Cost of revenue as a percentage of net revenue increased 120 basis points.
Years Ended | Year-over-Year | |||||||||||||||||||
2013 | 2012 | |||||||||||||||||||
(in thousands) | SG&A | % of Net Revenue | SG&A | % of Net Revenue | Variance | Variance % | ||||||||||||||
Telecommunications | $ | 16,272 | 7.1 | % | $ | 20,536 | 6.8 | % | $ | (4,264 | ) | (20.8 | )% | |||||||
Corporate | 18,420 | — | % | 24,666 | — | % | (6,246 | ) | (25.3 | )% | ||||||||||
Total SG&A | $ | 34,692 | 15.0 | % | $ | 45,202 | 14.9 | % | $ | (10,510 | ) | (23.3 | )% | |||||||
Selling, general and administrative expenses: Selling, general and administrative expenses decreased $10.5 million to $34.7 million, or 15.0% of net revenue, for the year ended December 31, 2013 from $45.2 million, or 14.9% of net revenue, for the year ended December 31, 2012. The decrease was primarily due to a $3.8 million decrease in salaries and benefits, a $3.2 million decrease in general and administrative expenses, a $2.5 million decrease in professional fees, a $0.6 million decrease in occupancy costs and a $0.4 million decrease in travel and entertainment expenses.
Depreciation and amortization expense: Depreciation and amortization expense increased $8.8 million to $12.0 million for the year ended December 31, 2013 from $3.2 million for the year ended December 31, 2012. Depreciation and amortization expense in 2013 includes depreciation and amortization for the period July 1, 2012 – December 31, 2013, when the property and equipment of ICS was included in assets held for sale. In accordance with US GAAP, held for sale assets are not depreciated. When ICS was no longer considered to be held for sale, we were required to record all unrecorded depreciation in the fourth quarter of 2013.
Asset impairment expense: Asset impairment expense decreased $17.5 million to $2.8 million for the year ended December 31, 2013 from $20.3 million for the year ended December 31, 2012. For the year ended December 31, 2013, asset impairment expense primarily included $2.0 million related to the impairment of property and equipment as a result of reclassifying ICS from held for sale to held and used. For the year ended December 31, 2012, asset impairment expense included $10.3 million related to the write down of carrying value of ICS when it was classified as a held for sale asset in the second quarter of 2012 and $10.0 million related to the impairment of our U.S. trade name, “Primus Telecommunications.”
Gain from contingent rights valuation: The gain from the change in fair value of the CVRs increased $13.6 million to $14.9 million for the year ended December 31, 2013 from $1.3 million for the year ended December 31, 2012. Estimates of fair value represent the Company’s best estimates based on a pricing model and have historically been correlated to and reflective of our common stock trends. Generally, as the fair value of our common stock increased/decreased, the fair value of the CVRs
51
increased/decreased and a loss/gain from CVR valuation was recorded. As a result of the pending sale of North America Telecom during the second quarter of 2013, which would constitute a change of control under the CVR Agreement and likely result in the expiration of the CVRs and termination of the CVR Agreement absent any required distribution of shares of our common stock with respect to the CVRs, the fair value of the CVRs was marked at zero as of June 30, 2013.
Interest income and other expense, net: Interest income and other expense, net decreased $0.3 million to expense of $0.2 million for the year ended December 31, 2013 from income of $0.1 million for the year ended December 31, 2012.
Foreign currency transaction gain (loss): Foreign currency transaction gain decreased $3.1 million to a $0.6 million loss for the year ended December 31, 2013 from a gain of $2.5 million for the year ended December 31, 2012. The gains and losses are attributable to the impact of foreign currency exchange rate changes on intercompany debt balances and on receivables and payables denominated in a currency other than the subsidiaries’ functional currency. We incurred a foreign currency translation loss on the intercompany payable balances that our Canadian subsidiaries had with our U.S. subsidiaries due to a decrease in the exchange rate in the first quarter of 2013. We incurred a foreign currency translation gain on the intercompany payable balances that our Canadian subsidiaries had with our U.S. subsidiaries due to an increase in the exchange rate in the first and third quarters of 2012.
Income tax benefit (expense): Income tax benefit increased $4.3 million to $7.4 million for the year ended December 31, 2013 from $3.1 million for the year ended December 31, 2012. Included in the benefit for the year ended December 31, 2013 is a benefit from reversing foreign withholding tax, expiration of the statute of limitations and state tax refunds. Included in the benefit for the year ended December 31, 2012 is a benefit from the release of a liability on our U.S. trade name, “Primus Telecommunications,” and certain ASC 740 liabilities as a result of the expiration of the statute of limitations, partially offset by expenses consisting of a provision for foreign income taxes and foreign withholding tax on intercompany interest.
Pro forma Adjusted EBITDA
Management believes that Adjusted EBITDA is significant to gaining an understanding of the Company’s results as it is frequently used by the financial community to provide insight into an organization’s operating trends and facilitates comparisons between peer companies, since interest, taxes, depreciation and amortization can differ greatly between organizations as a result of differing capital structures and tax strategies. Adjusted EBITDA can also be a useful measure of a company’s ability to service debt. While management believes that non-US GAAP measurements are useful supplemental information, such adjusted results
52
are not intended to replace the Company’s US GAAP financial results.
As Reported | Pro Forma | ||||||||||||||||||||||
HC2 Holdings, Inc. Year Ended December 31, 2014 (As Restated) | Schuff Year Ended December 31, 2014 (1) | GMSL Year Ended December 31, 2014 (2) | ICS Year Ended December 31, 2014 (3) | Other Year Ended December 31, 2014 (4) (As Restated) | HC2 Holdings, Inc. Year Ended December 31, 2014 (As Restated) | ||||||||||||||||||
Net income (loss) attributable to HC2 Holdings, Inc. | $ | (14,391 | ) | $ | 19,278 | $ | 26,079 | $ | (1,068 | ) | $ | (34,075 | ) | $ | 10,214 | ||||||||
Adjustments to reconcile net income (loss) to Adjusted EBIT: | |||||||||||||||||||||||
Asset impairment expense | 291 | — | — | 291 | — | 291 | |||||||||||||||||
(Gain) loss on sale or disposal of assets | (162 | ) | (2 | ) | 104 | (160 | ) | — | (58 | ) | |||||||||||||
Interest expense | 10,754 | 1,627 | 4,708 | 1 | 9,127 | 15,463 | |||||||||||||||||
Amortization of debt discount | 1,593 | — | — | — | 1,593 | 1,593 | |||||||||||||||||
Loss on early extinguishment of debt | 11,969 | — | — | — | 11,969 | 11,969 | |||||||||||||||||
Interest income and other expense, net | (768 | ) | (476 | ) | (3,174 | ) | (417 | ) | 174 | (3,893 | ) | ||||||||||||
Foreign currency (gain) loss | 66 | — | 764 | (414 | ) | 222 | 572 | ||||||||||||||||
(Gain) loss from sale of discontinued operations | 121 | — | — | — | 121 | 121 | |||||||||||||||||
Gain (loss) from discontinued operations | 25 | 35 | 3,007 | — | 36 | 3,078 | |||||||||||||||||
Income tax (benefit) expense | (22,869 | ) | 13,318 | 1,069 | 58 | (32,688 | ) | (18,243 | ) | ||||||||||||||
(Income) from equity investees | (2,665 | ) | — | (7,201 | ) | — | 886 | (6,315 | ) | ||||||||||||||
Acquisition and related charges | 13,044 | — | — | — | 13,044 | 13,044 | |||||||||||||||||
Noncontrolling interest | 2,559 | 3,569 | 2,821 | — | (570 | ) | 5,820 | ||||||||||||||||
Share-based payment expense | 11,028 | — | — | — | 11,028 | 11,028 | |||||||||||||||||
Adjusted EBIT | 10,595 | 37,349 | 28,177 | (1,709 | ) | (19,133 | ) | 44,684 | |||||||||||||||
Depreciation and amortization | 6,334 | 4,139 | 14,776 | 528 | 485 | 19,928 | |||||||||||||||||
Depreciation and amortization (included in cost of revenue) | 4,350 | 4,350 | — | — | — | 4,350 | |||||||||||||||||
Adjusted EBITDA | $ | 21,279 | $ | 45,838 | $ | 42,953 | $ | (1,181 | ) | $ | (18,648 | ) | $ | 68,962 | |||||||||
(1) Schuff includes activity for the 5 months ended May 26, 2014, prior to our acquisition of a controlling interest.
(2) GMSL includes activity for the period ended September 22, 2014, prior to our acquisition of a controlling interest
(3) ICS activity does not include any pro forma adjustments
(4) Other includes activity for the 7 months ended July 31, 2014 for ANG, prior to our acquisition of a controlling interest.
The calculation of Adjusted EBITDA, as defined by us on a pro forma basis, consists of Net income (loss) as adjusted for asset impairment expense; gain (loss) on sale or disposal of assets; amortization of debt discount; loss on early extinguishment or restructuring of debt; gain on bargain purchase; interest income and other income (expense), net; foreign currency transaction gain (loss); (gain) loss on sale of discontinued operations; gain (loss) from discontinued operations; income tax (benefit) expense;
53
income (loss) from equity investees; acquisition and related charges; non-controlling interests; share-based compensation expense; and depreciation and amortization expense.
Liquidity and Capital Resources
Important Long-Term Liquidity and Capital Structure Developments:
Issuance of 11% Senior Secured Notes
On November 20, 2014, the Company issued $250.0 million in aggregate principal amount of 11% Senior Secured Notes due 2019 (the “11% Notes”). The Company used the proceeds to pay off its term loan of $214 million and delayed draw term loan of $36 million entered into on September 22, 2014. See Note 9—“Long-Term Obligations” for additional terms of the 11% Notes.
Escrow Deposits
The Company has maintained interests in certain escrow deposits associated with the sales of BLACKIRON Data and North America Telecom during 2013 which have various conditions for their release. In connection with the sale of BLACKIRON Data, CAD$20.0 million (or approximately USD$19.5 million giving effect to the currency exchange rate on the day of sale) was retained from the purchase price and placed into escrow until July 17, 2014 for purposes of satisfying potential indemnification claims pursuant to the purchase agreement. In July 2014, we received escrow proceeds of $19.5 million, a majority of which was used to pay down then-existing credit facilities. In connection with the sale of North America Telecom, several different escrow deposits were established, all with varying release conditions and dates which in total amounted to $18.25 million. Pursuant to the terms of the purchase agreement, $6.45 million of the purchase price was placed in escrow to be released 14 months after the closing date, subject to any deductions required to satisfy indemnification obligations of HC2 under the purchase agreement. The $6.45 million escrow deposit was released to the Company in October 2014. In addition, $4.0 million of the purchase price was placed in escrow to cover any payments required in connection with the post-closing working capital and cash adjustments, of which $3.2 million was disbursed to the Company and $0.8 million was disbursed to the purchaser upon completion of such adjustments in February 2014. Furthermore, $4.8 million of the purchase price was placed in escrow to cover certain tax liabilities, which will be released after a positive ruling with respect to the underlying matter is received or 30 days after expiration of the applicable statute of limitations relating to the underlying matter. Lastly, an additional $3.0 million was placed in escrow to be paid upon closing of the sale of PTI. On July 31, 2014, having received the necessary regulatory approvals for the sale of PTI, we completed the divestiture of the remainder of our North America Telecom business. On July 31, 2014, the escrow proceeds of $3.0 million were released and a portion of such proceeds was used to pay down then-existing credit facilities. The $4.8 million escrow deposit is recorded in other assets in the consolidated balance sheets, of which $0.4 million is reserved.
Pro Forma Capital Expenditures
Pro forma capital expenditures for the years ended December 31, 2014 and 2013 include pro forma financial information for the Manufacturing and Marine Services operating segments. These pro forma capital expenditures give effect to the acquisitions of Schuff and GMSL as if they had occurred on January 1, 2013. Pro forma capital expenditures consist of the following (in thousands):
HC2 Holdings, Inc. Year Ended December 31, 2014 | Schuff International, Inc. Five Months Ended May 26, 2014 | Bridgehouse Marine Limited Nine Months Ended September 30, 2014 | Pro Forma Year Ended December 31, 2014 | ||||||||||||
Telecommunications | $ | 42 | $ | — | $ | — | $ | 42 | |||||||
Manufacturing | 5,039 | 5,819 | — | 10,858 | |||||||||||
Utilities | 803 | — | — | 803 | |||||||||||
Marine Services | (863 | ) | — | 4,208 | 3,345 | ||||||||||
Other (1) | 798 | — | — | 798 | |||||||||||
Total | $ | 5,819 | $ | 5,819 | $ | 4,208 | $ | 15,846 | |||||||
54
HC2 Holdings, Inc. Year Ended December 31, 2013 | Schuff International, Inc. Year Ended December 31, 2013 | Bridgehouse Marine Limited Year Ended December 31, 2013 | Pro Forma Year Ended December 31, 2013 | ||||||||||||
Telecommunications | $ | 1,390 | $ | — | $ | — | $ | 1,390 | |||||||
Manufacturing | — | 9,989 | — | 9,989 | |||||||||||
Utilities | — | — | — | — | |||||||||||
Marine Services | — | — | 16,135 | 16,135 | |||||||||||
Other (1) | 11,137 | — | — | 11,137 | |||||||||||
Corporate | — | — | — | — | |||||||||||
Total | $ | 12,527 | $ | 9,989 | $ | 16,135 | $ | 38,651 | |||||||
(1) | Other also includes capital expenditures related to discontinued operations. |
The above capital expenditures exclude assets acquired under terms of capital lease and vendor financing obligations.
Changes in Cash Flows
Our principal liquidity requirements arise from cash used in operating activities, purchases of equipment used in our operations, including switches and related transmission equipment and capacity, steel manufacturing equipment and undersea cable installation and maintenance equipment, acquisitions, development of back-office systems and income taxes. We have financed our growth and operations to date through public offerings and private placements of debt and equity securities, entry into credit facilities, vendor financing, capital lease financing and other financing arrangements.
Net cash provided by operating activities was $3.7 million for the year ended December 31, 2014 as compared to net cash used in operating activities of $20.3 million for the year ended December 31, 2013. For the year ended December 31, 2014, net loss, net of non-cash operating activity, used $7.9 million of cash. Other major drivers included a increase in prepaid expenses and other current assets of $1.1 million, an increase in accounts payable of $24.6 million, a decrease in accounts receivable of $18.3 million, an increase in accrued payroll and employee benefits of $9.7 million and a decrease in inventories of $6.6 million, partially offset by a decrease in billings in excess of costs and recognized earnings on uncompleted contracts of $23.8 million, a decrease in accrued expenses and other current liabilities of $14.5 million and a decrease in pension liability of $7.6 million. For the year ended December 31, 2013, net income, net of non-cash operating activity, used $1.3 million of cash. Other major drivers included a decrease in accrued income taxes of $7.4 million, an increase in prepaid expenses and other current assets of $5.3 million, a decrease in accrued payroll and employee benefits of $5.3 million, an increase in accounts receivable of $2.9 million, a decrease in accounts payable of $2.0 million, a decrease in other liabilities of $1.7 million and a decrease in accrued interest of $1.7 million, partially offset by an increase in accrued interconnection costs of $4.4 million and a decrease in other assets of $3.2 million.
Net cash used in operating activities was $20.3 million for the year ended December 31, 2013 as compared to net cash provided by operating activities of $23.6 million for the year ended December 31, 2012. For the year ended December 31, 2012, net income, net of non-cash operating activity, provided $28.6 million of cash. Other major drivers included a decrease in accounts payable of $8.4 million, a decrease in accrued expenses and other current liabilities of $8.2 million, a decrease in accrued interest of $3.9 million, a decrease in accrued interconnection costs of $3.4 million and an increase in prepaid expenses and other current assets of $2.1 million partially offset by a decrease in accounts receivable of $16.4 million and a decrease in other assets of $5.9 million.
Net cash used in investing activities was $187.3 million for the year ended December 31, 2014 as compared to net cash provided by investing activities of $258.1 million for the year ended December 31, 2013. Net cash used in investing activities for the year ended December 31, 2014 included $85.0 million for the Schuff acquisition, $32.2 million for additional purchases of Schuff stock, $130.4 million for the GMSL acquisition, $15.5 million for the ANG acquisition, $14.2 million for the Novatel investment, $5.6 million for the NerVve Technologies investment, purchase of $9.9 million in marketable securities and $5.8 million of capital expenditures, partially offset by $62.6 million cash acquired in the GMSL acquisition and $15.5 million contribution by the noncontrolling interest. Net cash provided by investing activities during the year ended December 31, 2013 included $270.6 million of net proceeds from the sale of our BLACKIRON Data and North America Telecom segments and a decrease in restricted cash of $0.5 million, partially offset by $12.6 million of capital expenditures and $0.4 million used in the acquisition of businesses.
Net cash provided by investing activities was $258.1 million for the year ended December 31, 2013 as compared to $149.7 million for the year ended December 31, 2012. Net cash provided by investing activities during the year ended
55
December 31, 2012 included $183.1 million of net proceeds from the sale of our Australia segment, partially offset by $31.7 million of capital expenditures and $1.7 million used in the acquisition of businesses.
Net cash provided by financing activities was $284.6 million for the year ended December 31, 2014 as compared to net cash used in financing activities of $250.1 million for the year ended December 31, 2013. Net cash provided by financing activities for the year ended December 31, 2014 included $915.9 million of proceeds from credit facilities, $46.0 million of proceeds from the issuance of Series A Preferred Stock, Series A-1 Preferred Stock and common stock and $24.3 million of proceeds from the exercise of warrants and stock options, partially offset by $689.7 million used to make principal payments on then-existing credit facilities and payment of deferred financing fees of $12.3 million. Net cash used in financing activities during the year ended December 31, 2013 included $127.7 million used in the redemption of the 13% Senior Secured Notes, 10% Senior Secured Notes and 10% Senior Secured Exchange Notes, $119.8 million used to pay a special cash dividend to our shareholders, $1.2 million used to pay fees on the redemption of the 13% Senior Secured Notes, 10% Senior Secured Notes and 10% Senior Secured Exchange Notes, $1.2 million used to pay dividend equivalents to our shareholders, $1.0 million used to satisfy the tax obligations for shares issued under share-based compensation arrangements and $0.3 million used to reduce the principal amounts outstanding on capital leases, partially offset by $1.1 million in proceeds from the sale of common stock.
Net cash used in financing activities was $250.1 million for the year ended December 31, 2013 as compared to $191.1 million for the year ended December 31, 2012. Net cash used in financing activities during the year ended December 31, 2012 included $119.0 million used to repurchase a portion of the 10% Senior Secured Notes, $55.3 million used to pay special cash dividends to our shareholders, $13.5 million used to pay fees related to the repurchase of a portion of the 10% Senior Secured Notes, the subsequent November and December note exchanges for a portion of the 10% Senior Secured Notes and the exchange offers and consent solicitation that was consummated in July 2011, $1.7 million used to reduce the principal amounts outstanding on capital leases and $1.7 million used to satisfy the tax obligations for shares issued under share-based compensation arrangements, partially offset by $0.1 million in proceeds from the sale of common stock.
Short- and Long-Term Liquidity Considerations and Risks; Contractual Obligations
As of December 31, 2014, we had $108.0 million of cash and cash equivalents, net of restricted cash. We believe that our existing cash and cash equivalents will be sufficient to fund our fixed obligations (such as operating leases), and other cash needs for our operations for at least the next twelve months. As of December 31, 2014, we had $343.4 million of indebtedness.
HC2 is a holding company and its liquidity needs are primarily for dividend payments on its Preferred Stock, interest payments on any long-term debt, professional fees (including advisory services, legal and accounting fees), salaries and benefits, office rent, insurance costs and certain support services. HC2’s current source of liquidity is its cash, cash equivalents and investments, and distributions from its subsidiaries.
The ability of HC2’s subsidiaries to generate sufficient net income and cash flows to make upstream cash distributions is subject to numerous factors, including restrictions contained in such subsidiary’s financing agreements, availability of sufficient funds in such subsidiary and the approval of such payment by such subsidiary’s board of directors, which must consider various factors, including general economic and business conditions, tax considerations, strategic plans, financial results and condition, expansion plans, any contractual, legal or regulatory restrictions on the payment of dividends, and such other factors such subsidiary’s board of directors considers relevant. See Note 9—“Long-Term Obligations” to our consolidated financial statements for more detail concerning financing arrangements of our subsidiaries. In addition, one or more subsidiaries may issue, repurchase, retire or refinance, as applicable, their debt or equity securities for a variety of purposes, including in order to grow their business, pursue acquisition activities or to manage their liquidity needs. Any such issuance may limit such subsidiary’s ability to make upstream cash distributions. HC2’s liquidity may also be impacted by the capital needs of its current and future subsidiaries. Such entities may require additional capital to maintain or grow their businesses, or make payments on their indebtedness.
We expect our cash, cash equivalents and investments to continue to be a source of liquidity except to the extent they may be used to fund investments in operating businesses or assets. Depending on a variety of factors, including the general state of capital markets, operating needs or acquisition size and terms, HC2 and its subsidiaries may raise additional capital through the issuance of equity, debt, or both. There is no assurance, however, that such capital will be available at that time, in the amounts necessary or on terms satisfactory to HC2.
As of December 31, 2014, we have $26.0 million in future operating lease payments.
The obligations set forth in the table below reflect the contractual payments of principal and interest that existed as of December 31, 2014:
56
Payments Due By Period | |||||||||||||||||||
Contractual Obligations | Total | Less than 1 year | 1-3 years | 3-5 years | More than 5 years | ||||||||||||||
Operating leases | $ | 25,995 | $ | 4,209 | $ | 7,163 | $ | 4,360 | $ | 10,263 | |||||||||
Capital leases | 81,195 | 6,946 | 13,899 | 21,431 | 38,919 | ||||||||||||||
Notes payable(1) | 421,099 | 35,576 | 70,339 | 315,184 | — | ||||||||||||||
Total contractual obligations | $ | 528,289 | $ | 46,731 | $ | 91,401 | $ | 340,975 | $ | 49,182 | |||||||||
(1) | Interest is calculated using stated interest rates as shown in Note 9—“Long Term Obligations” to our consolidated financial statements. |
We have contractual obligations to utilize network facilities from certain carriers with terms greater than one year. We generally do not purchase or commit to purchase quantities in excess of normal usage or amounts that cannot be used within the contract term.
Off-Balance Sheet Arrangements
Schuff
Schuff’s off-balance sheet arrangements at December 31, 2014 included letters of credit of $3.9 million under the Schuff Facility and performance bonds of $8.2 million.
Schuff’s letters of credit are issued for the benefit of its workers’ compensation insurance carrier. Schuff’s workers’ compensation insurance carrier requires standby letters of credit to be issued as collateral on all of its outstanding indemnity cases. The amount of collateral required is determined each year and is provided to the carrier for outstanding indemnity claims not greater than 54 months old. The prior years’ levels of required collateral can be adjusted each year based upon the costs incurred and settlements reached on the outstanding indemnity cases.
Schuff’s contract arrangements with customers sometimes require Schuff to provide performance bonds to partially secure its obligations under its contracts. Bonding requirements typically arise in connection with public works projects and sometimes with respect to certain private contracts. Schuff’s performance bonds are obtained through surety companies and typically cover the entire project price.
New Accounting Pronouncements
For a discussion of our “New Accounting Pronouncements,” refer to Note 2—“Summary of Significant Accounting Policies” to our consolidated financial statements included elsewhere in this Annual Report on Form 10-K.
Related Party Transactions
For a discussion of our “Related Party Transactions,” refer to Note 16—“Related Parties” to our consolidated financial statements included elsewhere in this Annual Report on Form 10-K.
Special Note Regarding Forward-Looking Statements
This Annual Report on Form 10-K contains or incorporates a number of “forward-looking statements” within the meaning of Section 27A of the Securities Act of 1933, as amended, and Section 21E of the Securities Exchange Act of 1934, as amended. Such statements are based on current expectations, and are not strictly historical statements. In some cases, you can identify forward-looking statements by terminology such as “if,” “may,” “should,” “believe,” “anticipate,” “future,” “forward,” “potential,” “estimate,” “opportunity,” “goal,” “objective,” “growth,” “outcome,” “could,” “expect,” “intend,” “plan,” “strategy,” “provide,” “commitment,” “result,” “seek,” “pursue,” “ongoing,” “include” or in the negative of such terms or comparable terminology. These forward-looking statements inherently involve certain risks and uncertainties and are not guarantees of performance, results,
57
or the creation of shareholder value, although they are based on our current plans or assessments which we believe to be reasonable as of the date hereof.
HC2
Factors or risks that could cause HC2’s actual results to differ materially from the results we anticipate include, but are not limited to:
• | any claims, investigations or proceedings arising as a result of the restatement of our previously issued financial results; |
• | our ability to remediate the material weaknesses in our internal controls over financial reporting described in ITEM 9A of this restated annual report in this Form 10-K/A; |
• | the possibility of indemnification claims arising out of divestitures of businesses; |
• | uncertain global economic conditions in the markets in which our operating segments conduct their businesses; |
• | the ability of our operating segments to attract and retain customers; |
• | increased competition in the markets in which our operating segments conduct their businesses; |
• | our possible inability to generate sufficient liquidity, margins, earnings per share, cash flow and working capital from our operating segments; |
• | our expectations regarding the timing, extent and effectiveness of our cost reduction initiatives and management’s ability to moderate or control discretionary spending; |
• | management’s plans, goals, forecasts, expectations, guidance, objectives, strategies and timing for future operations, acquisitions, synergies, asset dispositions, fixed asset and goodwill impairment charges, tax and withholding expense, selling, general and administrative expenses, product plans, performance and results; |
• | management’s assessment of market factors and competitive developments, including pricing actions and regulatory rulings; |
• | limitations on our ability to successfully identify any strategic acquisitions or business opportunities and to compete for these opportunities with others who have greater resources; |
• | the impact of additional material charges associated with our oversight of acquired or target businesses and the integration of our financial reporting; |
• | the impact of expending significant resources in considering acquisition targets or business opportunities that are not consummated; |
• | tax consequences associated with our acquisition, holding and disposition of target companies and assets; |
• | our dependence on distributions from our subsidiaries to fund our operations and payments on our obligations; |
• | the impact of covenants in the Certificates of Designation governing HC2’s Preferred Stock, the 11% Notes Indenture, the credit agreements governing the Schuff Facility and the GMSL Facility and future financing or refinancing agreements, on our ability to operate our business and finance our pursuit of acquisition opportunities; |
• | the impact on the holders of HC2’s common stock if we issue additional shares of HC2 common stock or preferred stock; |
• | the impact of decisions by HC2’s significant stockholders, whose interest may differ from those of HC2’s other stockholders, or their ceasing to remain significant stockholders; |
• | the effect any interests our officers, directors, stockholders and their respective affiliates may have in certain transactions in which we are involved; |
• | our dependence on certain key personnel; |
• | our ability to effectively increase the size of our organization, if needed, and manage our growth; |
• | the impact of a determination that we are an investment company or personal holding company; |
• | the impact of delays or difficulty in satisfying the requirements of Section 404 of the Sarbanes-Oxley Act of 2002 or negative reports concerning our internal controls; |
• | the impact on our business and financial condition of our substantial indebtedness and the significant additional indebtedness and other financing obligations we may incur; |
• | our possible inability to raise additional capital when needed or refinance our existing debt, on attractive terms, or at all; and |
• | our possible inability to hire and retain qualified executive management, sales, technical and other personnel. |
58
Marine Services / GMSL
Factors or risks that could cause GMSL’s, and thus our Marine Services segment’s, actual results to differ materially from the results we anticipate include, but are not limited to:
• | the possibility of global recession or market downturn with a reduction in capital spending within the targeted market segments the business operates in; |
• | project implementation issues and possible subsequent overruns; |
• | risks associated with operating outside of core competencies when moving into different market segments; |
• | possible loss or severe damage to marine assets; |
• | vessel equipment aging or reduced reliability; |
• | risks associated with operating two joint ventures in China (China Telecom, Huawei); |
• | risks related to foreign corrupt practices; |
• | changes to the local laws and regulatory environment in different geographical regions; |
• | loss of key senior employees; |
• | difficulties attracting enough skilled technical personnel; |
• | foreign exchange rate risk; |
• | liquidity risk; and |
• | potential for financial loss arising from the failure by customers to fulfil their obligations as and when these obligations fall due. |
Manufacturing / Schuff
Factors or risks that could cause Schuff’s, and thus our Manufacturing segment’s, actual results to differ materially from the results we anticipate include, but are not limited to:
• | its ability to realize cost savings from expected performance of contracts, whether as a result of improper estimates, performance, or otherwise; |
• | uncertain timing and funding of new contract awards, as well as project cancellations; |
• | cost overruns on fixed-price or similar contracts or failure to receive timely or proper payments on cost-reimbursable contracts, whether as a result of improper estimates, performance, disputes, or otherwise; |
• | risks associated with labor productivity, including performance of subcontractors that Schuff hires to complete projects; |
• | its ability to settle or negotiate unapproved change orders and claims; |
• | changes in the costs or availability of, or delivery schedule for, equipment, components, materials, labor or subcontractors; |
• | adverse impacts from weather affecting Schuff’s performance and timeliness of completion of projects, which could lead to increased costs and affect the quality, costs or availability of, or delivery schedule for, equipment, components, materials, labor or subcontractors; |
• | fluctuating revenue resulting from a number of factors, including the cyclical nature of the individual markets in which our customers operate; |
• | adverse outcomes of pending claims or litigation or the possibility of new claims or litigation, and the potential effect of such claims or litigation on Schuff’s business, financial condition, results of operations or cash flow; and |
• | lack of necessary liquidity to provide bid, performance, advance payment and retention bonds, guarantees, or letters of credit securing Schuff’s obligations under bids and contracts or to finance expenditures prior to the receipt of payment for the performance of contracts. |
Telecommunications / ICS
Factors or risks that could cause ICS’s, and thus our Telecommunications segment’s, actual results to differ materially from the results we anticipate include, but are not limited to:
• | our expectations regarding increased competition, pricing pressures and usage patterns with respect to ICS’s product offerings; |
59
• | significant changes in ICS’s competitive environment, including as a result of industry consolidation, and the effect of competition in its markets, including pricing policies; |
• | its compliance with complex laws and regulations in the U.S. and internationally; and |
• | further changes in the telecommunications industry, including rapid technological, regulatory and pricing changes in its principal markets. |
Other unknown or unpredictable factors could also affect our business, financial condition and results. Although we believe that the expectations reflected in the forward-looking statements are reasonable, there can be no assurance that any of the estimated or projected results will be realized. You should not place undue reliance on these forward-looking statements, which apply only as of the date hereof. Subsequent events and developments may cause our views to change. While we may elect to update these forward-looking statements at some point in the future, we specifically disclaim any obligation to do so.
ITEM 7A. QUANTITATIVE AND QUALITATIVE DISCLOSURES ABOUT MARKET RISK
Our primary market risk exposures relate to changes in foreign currency exchange rates.
Foreign currency exchange rates—Foreign currency can impact our financial results. During the year ended December 31, 2014, approximately 19.2% of our net revenue from continuing operations was derived from sales and operations outside the U.S. The reporting currency for our consolidated financial statements is the United States dollar (the “USD”). The local currency of each country is the functional currency for each of our respective entities operating in that country. In the future, we expect to continue to derive a portion of our net revenue and incur a portion of our operating costs from outside the U.S., and therefore changes in exchange rates may continue to have a significant, and potentially adverse, effect on our results of operations. Our risk of loss regarding foreign currency exchange rate risk is caused primarily by fluctuations in the USD/British pound sterling (“GBP”) exchange rate. Due to a percentage of our revenue derived outside of the U.S., changes in the USD relative to the GBP could have an adverse impact on our future results of operations. In addition, prior to the sale of the Company’s Australia operations during the second quarter of 2012 and the sale of BLACKIRON Data and North America Telecom during the second and third quarters of 2013, respectively, we also experienced risk of loss regarding foreign currency exchange rates due to fluctuations in the USD/Australian dollar (“AUD”) and USD/Canadian dollar (“CAD”) exchange rates. We have agreements with certain subsidiaries for repayment of a portion of the investments and advances made to these subsidiaries. As we anticipate repayment in the foreseeable future, we recognize the unrealized gains and losses in foreign currency transaction gain (loss) on the consolidated statements of operations. The exposure of our income from operations to fluctuations in foreign currency exchange rates is reduced in part because a majority of the costs that we incur in connection with our foreign operations are also denominated in local currencies.
We are exposed to financial statement gains and losses as a result of translating the operating results and financial position of our international subsidiaries. We translate the local currency statements of operations of our foreign subsidiaries into USD using the average exchange rate during the reporting period. Changes in foreign exchange rates affect the reported profits and losses and cash flows of our international subsidiaries and may distort comparisons from year to year. By way of example, when the USD strengthens compared to the GBP, there could be a negative or positive effect on the reported results for ICS, depending upon whether the business in ICS is operating profitably or at a loss. It takes more profits in GBP to generate the same amount of profits in USD and a greater loss in GBP to generate the same amount of loss in USD. The opposite is also true. For instance, when the USD weakens against the GBP, there is a positive effect on reported profits and a negative effect on the reported losses.
60
ITEM 8. FINANCIAL STATEMENTS AND SUPPLEMENTARY DATA
Page | |
Reports of Independent Registered Public Accounting Firms | F-2 |
Consolidated Financial Statements: | |
Consolidated Statements of Operations for the years ended December 31, 2014 (as restated), 2013 and 2012 | F-5 |
Consolidated Statements of Comprehensive Income (Loss) for the years ended December 31, 2014 (as restated), 2013 and 2012 | F-6 |
Consolidated Balance Sheets as of December 31, 2014 (as restated) and 2013 | F-7 |
Consolidated Statements of Stockholders’ Equity for the years ended December 31, 2014 (as restated), 2013 and 2012 | F-8 |
Consolidated Statements of Cash Flows for the years ended December 31, 2014 (as restated), 2013 and 2012 | F-9 |
Notes to Consolidated Financial Statements | F-11 |
Schedule II—Valuation and Qualifying Accounts | S-1 |
ITEM 9. CHANGES IN AND DISAGREEMENTS WITH ACCOUNTANTS ON ACCOUNTING AND FINANCIAL DISCLOSURE
None.
ITEM 9A. CONTROLS AND PROCEDURES
Evaluation of Disclosure Controls and Procedures
Under the supervision of and with the participation of the Chief Executive Officer and Chief Financial Officer, the Company's management evaluated the effectiveness of the design and operation of our disclosure controls and procedures, as such term is defined in Rules 13a-15(e) and 15d-15(e) under the Securities Exchange Act of 1934, as amended (“Exchange Act”) as of December 31, 2014. Based upon this evaluation, our Chief Executive Officer and Chief Financial Officer concluded that our disclosure controls and procedures were not effective as of December 31, 2014 as a result of the identification of material weaknesses in our internal control over financial reporting, as discussed below.
Management’s Report on Internal Control Over Financial Reporting
Management is responsible for establishing and maintaining adequate internal control over financial reporting Rules 13a-15(f) and 15d-15(f) under the Exchange Act. The Company's internal control over financial reporting is designed to provide reasonable assurance as to the reliability of its financial reporting and the preparation of financial statements for external purposes in accordance with U.S. GAAP.
Our management assessed the effectiveness of our internal control over financial reporting as of December 31, 2014. This assessment was based on criteria for effective internal control over financial reporting set forth by the Committee of Sponsoring Organizations of the Treadway Commission Internal Control-Integrated Framework (2013) (“COSO 2013”). In connection with the preparation of the Company’s Annual Report on Form 10-K for the fiscal year ended December 31, 2014, management identified a material weakness in our internal controls related to the accounting for income taxes, including the income tax provision, the related tax assets and liabilities and related footnote disclosures. A material weakness is a deficiency, or a combination of deficiencies, in internal control over financial reporting, such that there is a reasonable possibility that a material misstatement of the Company’s annual or interim financial statements will not be prevented or detected on a timely basis. Specifically, management determined that the Company did not have the technical knowledge or perform sufficient review and approval of the completeness and accuracy of the data used in the computation of income tax expense, taxes payable or receivable, deferred tax assets and liabilities, and related footnote disclosures. COSO 2013 Point of Focus 2013 12.5 specifies that competent personnel with sufficient authority perform control activities with diligence and continuing focus. Additionally, COSO 2013 Point of Focus 12.1 specifies
61
that management establishes control activities that are built into business processes and employees’ day-to-day activities through policies establishing what is expected and relevant procedures specifying actions.
Management subsequently identified a material weakness in our internal controls over the valuation of a business acquisition and the accounting for complex and/or non-routine transactions. In particular, the Company determined that it incorrectly valued its acquisition of American Natural Gas, completed on August 1, 2014 in its financial statements for the quarter ended September 30, 2014 as required by FASB Accounting Standards Codification 805. In addition, we determined that the valuation of the net assets acquired was incorrect, resulting in goodwill of $1.4 million. Further, the Company determined that it incorrectly classified funds released from escrow totaling $29.2 million as cash flows from operating activities rather than cash flows from investing activities in its Consolidated Statements of Cash Flows for the fiscal year ended December 31, 2014. The funds related to the 2013 sales of the North American Telecom and BLACKIRON Data business units. COSO 2013 Point of Focus 12.1 specifies that management establishes control activities that are built into business processes and employees’ day-to-day activities through policies establishing what is expected and relevant procedures specifying actions.
As a result of these material weaknesses, our management has concluded that our internal control over financial reporting was not effective as of December 31, 2014. In particular, our management concluded that our processes, procedures and controls related to financial reporting were not effective to ensure the accuracy of the amounts reported relating to the income tax provision, the related tax assets and liabilities, and the related footnote disclosures, the valuation of a business combination, and the accounting for complex and/or non-routine transactions. In particular, our processes and procedures did not provide for adequate and timely identification and review of various income tax calculations, reconciliations and related supporting documentation required to apply our accounting policies for income taxes in accordance with U.S. GAAP, adequate and timely review of the valuation of a business acquisition and the recognition of the goodwill arising from the business acquisition in accordance with U.S. GAAP, and adequate review of the Consolidated Statements of Cash Flows and the classification of cash flows in accordance with U.S. GAAP. These material weaknesses resulted in errors that, when aggregated with other errors that had been waived due to immateriality in prior periods, formed the basis for the determination by the Audit Committee that our financial statements for the year ended December 31, 2014 and our condensed consolidated financial statements for the quarters ended June 30, 2014, September 30, 2014, March 31, 2015, June 30, 2015 and September 30, 2015 should be restated.
As permitted by applicable SEC guidance, management’s evaluation of our internal control over financial reporting did not include an assessment of the effectiveness of internal control at Schuff International, Inc., Global Marine Systems Limited and American Natural Gas (collectively, the “Acquired Entities”), each of which was acquired during 2014 (see Note 5 to the consolidated financial statements). The Acquired Entities reflect total assets and net revenues of 82% and 70%, respectively of the consolidated financial statements for the year ended December 31, 2014. Pursuant to SEC guidance regarding the treatment of business combinations, the Company is not required to include an assessment of the internal control over financial reporting of an entity acquired during the reporting period in its evaluation of internal control over financial reporting for the Company. In accordance with the Company’s integration efforts, the Company is in the process of incorporating each acquired entity’s operations into its “internal control over financial reporting” and intends to complete this process within the one-year of acquisition date time frame for each entity.
Management performed analyses, substantive procedures, and other post-closing activities with the assistance of consultants and other professional advisors in order to ensure the validity, completeness and accuracy of our income tax provision and accounting for complex and/or non-routine transactions and the related disclosures. Accordingly, management believes that the financial statements included in this Form 10-K/A as of December 31, 2014, and for the year ended December 31, 2014, are fairly presented, in all material respects, in conformity with U.S. GAAP.
Remediation Plan
The Company believes that the material weaknesses relating to its application of U.S. GAAP to complex and/or non-routine transactions and accounting for income tax are a result of the Company’s new strategy to acquire and grow businesses that can generate long-term sustainable free cash flow, and which has added additional complexity surrounding the accounting, reporting and internal control environment during 2014, with significant volume occurring in the third quarter of 2014. The material weaknesses included deficiencies in the period-end financial reporting process, an insufficient complement of personnel with a level of U.S. GAAP accounting knowledge commensurate with the Company’s financial reporting requirements, and inadequate monitoring and review activities.
In an effort to remediate these material weaknesses, during the nine months ended December 31, 2015, the Company has undertaken the following steps:
• | the appointment of a new Chief Financial Officer; |
62
• | hiring of additional certified public accountants, including a Controller; |
• | engagement of external advisors to supplement the staff charged with compiling and filing our U.S. GAAP results; |
• | implementation of organizational structure changes that better integrate the tax accounting and finance functions; |
• | enhancement of our processes and procedures for determining, documenting and calculating our income tax provision; |
• | increasing the level of certain tax review activities throughout the year and during the financial statement close process; and |
• | enhancing the procedures and documentation requirements, including related training, surrounding the evaluation and recording of complex and/or non-routine transactions, such as business combinations. |
Changes in Internal Control over Financial Reporting
There were no changes in our internal controls over financial reporting that occurred during our fiscal quarter ended December 31, 2014 that have materially affected, or are reasonably likely to affect, our internal control over financial reporting.
ITEM 9B. OTHER INFORMATION
None.
PART III
Certain of the information required by Part III will be provided in our definitive proxy statement for our 2015 annual meeting of stockholders, which definitive proxy statement will be filed pursuant to Regulation 14A not later than April 30, 2015 (“2015 Proxy Statement”), and is incorporated herein by this reference.
ITEM 10. DIRECTORS, EXECUTIVE OFFICERS AND CORPORATE GOVERNANCE
Information relating to our directors and our code of conduct is set forth under the caption entitled “Board of Directors” in our 2015 Proxy Statement and is incorporated herein by reference. Information relating to our executive officers is set forth in our 2015 Proxy Statement under the caption “Executive Officers” and is incorporated herein by reference. Information relating to beneficial ownership reporting compliance is set forth in our 2015 Proxy Statement under the caption “Section 16(a) Beneficial Ownership Reporting Compliance” and is incorporated herein by reference. Information relating to our Audit Committee and Audit Committee Financial Expert is set forth in our 2015 Proxy Statement under the Caption “Board Committees” and is incorporated herein by reference.
ITEM 11. EXECUTIVE COMPENSATION
The information regarding this item is set forth under the captions entitled “Compensation Discussion and Analysis,” “Compensation Committee Report,” “Compensation Committee Interlocks and Insider Participation,” “Compensation Tables,” and “Employment Arrangements and Potential Payments upon Termination or Change of Control” in our 2015 Proxy Statement and is incorporated herein by reference.
ITEM 12. SECURITY OWNERSHIP OF CERTAIN BENEFICIAL OWNERS AND MANAGEMENT AND RELATED STOCKHOLDER MATTERS
Information regarding this item is set forth under the captions entitled “Security Ownership of Certain Beneficial Owners and Management” and “Equity Compensation Plan Information” in our 2015 Proxy Statement and is incorporated herein by reference.
ITEM 13. CERTAIN RELATIONSHIPS AND RELATED TRANSACTIONS, AND DIRECTOR INDEPENDENCE
Information regarding this item is set forth under the captions entitled “Board of Directors” and “Transactions with Related Persons” in our 2015 Proxy Statement and is incorporated herein by reference.
ITEM 14. PRINCIPAL ACCOUNTANT FEES AND SERVICES
Information regarding principal accountant fees and services is set forth under the caption entitled “Independent Registered Public Accounting Firm Fees” in our 2015 Proxy Statement and is incorporated herein by reference.
PART IV
63
ITEM 15. EXHIBITS AND FINANCIAL STATEMENT SCHEDULE
a) Financial Statements and Schedules
The financial statements as set forth under Item 8 of this Annual Report on Form 10-K are incorporated herein.
Financial Statement Schedules: | Page |
(II) Valuation and Qualifying Accounts | S-1 |
All other financial statement schedules have been omitted since they are either not required, not applicable, or the information is otherwise included.
b) Exhibit listing
The following is a list of exhibits filed as part of this Annual Report on Form 10-K.
Exhibit Number | Description | |
2.1 | Sale and Purchase Agreement, dated September 22, 2014, by and between Global Marine Holdings, LLC and the Sellers party thereto (incorporated by reference to Exhibit 2.1 to HC2 Holdings, Inc.’s (“HC2”) Current Report on Form 8-K, filed on September 26, 2014) (File No. 001-35210). | |
3.1 | Second Amended and Restated Certificate of Incorporation of HC2 (incorporated by reference to Exhibit 3.1 to HC2’s Form 8-A, filed on June 20, 2011) (File No. 001-35210). | |
3.2 | Certificate of Ownership of HC2 (incorporated by reference to Exhibit 3.1 to HC2’s Current Report on Form 8-K, filed on October 18, 2013) (File No. 001-35210). | |
3.3 | Certificate of Ownership and Merger (incorporated by reference to Exhibit 3.1 to HC2’s Current Report on Form 8-K, filed on April 11, 2014) (File No. 001-35210). | |
3.4 | Certificate of Amendment (incorporated by reference to Exhibit 3.1 to HC2’s Current Report on Form 8-K, filed on June 18, 2014) (File No. 001-35210). | |
3.5 | Second Amended and Restated By-laws of HC2 (incorporated by reference to Exhibit 3.2 to HC2’s Current Report on Form 8-K, filed on April 27, 2012) (File No. 001-35210). | |
4.1 | Certificate of Amendment to the Certificate of Designation of Series A Convertible Participating Preferred Stock of HC2 (incorporated by reference to Exhibit 4.2 to HC2’s Current Report on Form 8-K, filed on January 9, 2015) (File No. 001-35210). | |
4.2 | Certificate of Amendment to the Certificate of Designation of Series A-1 Convertible Participating Preferred Stock of HC2 (incorporated by reference to Exhibit 4.3 to HC2’s Current Report on Form 8-K, filed on January 9, 2015) (File No. 001-35210). | |
4.3 | Certificate of Designation of Series A-2 Convertible Participating Preferred Stock of HC2 (incorporated by reference to Exhibit 4.1 to HC2’s Current Report on Form 8-K, filed on January 9, 2015) (File No. 001-35210). | |
4.4 | Indenture, dated as of November 20, 2014, by and among HC2, the guarantors party thereto and U.S. Bank National Association (incorporated by reference to Exhibit 4.1 to HC2’s Current Report on Form 8-K, filed on November 21, 2014) (File No. 001-35210). | |
10.1^ | Offer Letter, dated May 8, 2013, by and between HC2 and Craig Denson (incorporated by reference to Exhibit 10.9^ on HC2’s Quarterly Report on Form 10-Q, filed on May 9, 2014) (File No. 001-35210). | |
64
Exhibit Number | Description | |
10.2 | Stock Purchase Agreement, dated May 12, 2014, by and between HC2 and SAS Venture LLC (incorporated by reference to Exhibit 10.1 to HC2’s Current Report on Form 8-K, filed on May 13, 2014) (File No. 001-35210). | |
10.3^ | Employment Agreement, dated May 21, 2014, by and between HC2 and Philip Falcone (incorporated by reference to Exhibit 10.2^ on HC2’s Quarterly Report on Form 10-Q, filed on August 11, 2014) (File No. 001-35210). | |
10.4^ | Employment Agreement, dated May 21, 2014, by and between HC2 and Robert Pons (incorporated by reference to Exhibit 10.4^ on HC2’s Quarterly Report on Form 10-Q, filed on August 11, 2014) (File No. 001-35210). | |
10.5^ | Employment Agreement, dated May 21, 2014, by and between HC2 and Keith Hladek (incorporated by reference to Exhibit 10.5^ on HC2’s Quarterly Report on Form 10-Q, filed on August 11, 2014) (File No. 001-35210). | |
10.6 | Securities Purchase Agreement, dated as of May 29, 2014, by and among HC2 and affiliates of Hudson Bay Capital Management LP, Benefit Street Partners L.L.C. and DG Capital Management, LLC (the “Purchasers”) (incorporated by reference to Exhibit 10.1 to HC2’s Current Report on Form 8-K, filed on June 4, 2014) (File No. 001-35210). | |
10.7^ | HC2 2014 Omnibus Equity Award Plan (incorporated by reference to Exhibit A to HC2’s Definitive Proxy Statement, filed on April 30, 2014) (File No. 001-35210). | |
10.8^ | 2014 HC2 Executive Bonus Plan (incorporated by reference to Exhibit 10.1 to HC2’s Current Report on Form 8-K, filed on June 18, 2014) (File No. 001-35210). | |
10.9.1 | Second Amended and Restated Credit and Security Agreement, dated as of August 14, 2013, by and among Schuff, as Borrower, and Wells Fargo Credit, Inc. (incorporated by reference to Exhibit 10.12 on HC2’s Quarterly Report on Form 10-Q, filed on August 11, 2014) (File No. 001-35210). | |
10.9.2 | Amendment to Second Amended and Restated Credit and Security Agreement, dated as of September 24, 2013, by and among Schuff, as Borrower, and Wells Fargo Credit, Inc. (incorporated by reference to Exhibit 10.13 on HC2’s Quarterly Report on Form 10-Q, filed on August 11, 2014) (File No. 001-35210). | |
10.9.3 | Second Amendment to Second Amended and Restated Credit and Security Agreement, dated as of February 3, 2014, by and among Schuff, as Borrower, and Wells Fargo Credit, Inc. (incorporated by reference to Exhibit 10.14 on HC2’s Quarterly Report on Form 10-Q, filed on August 11, 2014) (File No. 001-35210). | |
10.9.4 | Third Amendment to Second Amended and Restated Credit and Security Agreement, dated as of May 5, 2014, by and among Schuff, as Borrower, and Wells Fargo Credit, Inc. (incorporated by reference to Exhibit 10.15 on HC2’s Quarterly Report on Form 10-Q, filed on August 11, 2014) (File No. 001-35210). | |
10.9.5 | Fourth Amendment to Second Amended and Restated Credit and Security Agreement, dated as of September 26, 2014, by and among Schuff, as Borrower, and Wells Fargo Credit, Inc. (incorporated by reference to Exhibit 10.7 on HC2’s Quarterly Report on Form 10-Q, filed on November 10, 2014) (File No. 001-35210). | |
10.9.6 | Fifth Amendment to Second Amended and Restated Credit and Security Agreement, dated as of October 21, 2014, by and among Schuff, as Borrower, and Wells Fargo Credit, Inc. (incorporated by reference to Exhibit 10.9.6 to the Original Filing.) | |
10.10^ | Employment Agreement, dated September 9, 2014, by and between HC2 and Andrea Mancuso (incorporated by reference to Exhibit 10.1^ on HC2’s Quarterly Report on Form 10-Q, filed on November 10, 2014) (File No. 001-35210). | |
10.11^ | Employment Agreement, dated September 11, 2014, by and between HC2 and Mesfin Demise (incorporated by reference to Exhibit 10.2^ on HC2’s Quarterly Report on Form 10-Q, filed on November 10, 2014) (File No. 001-35210). | |
65
Exhibit Number | Description | |
10.12 | Securities Purchase Agreement, dated as of September 22, 2014, by and among HC2 and affiliates of DG Capital Management, LLC and Luxor Capital Partners, LP (incorporated by reference to Exhibit 10.3 to HC2’s Current Report on Form 8-K, filed on September 26, 2014) (File No. 001-35210). | |
10.13 | Secured Loan Agreement, dated as of January 20, 2014, by and among Global Marine Systems (Vessels) Limited, as Borrower, Global Marine Systems Limited, as Guarantor, and DVB Bank SE Nordic Branch, as Lender (incorporated by reference to Exhibit 10.8 on HC2’s Quarterly Report on Form 10-Q, filed on November 10, 2014) (File No. 001-35210). | |
10.14.1 | Supplemental Charter Agreement, dated as of March 21, 2012, by and among Global Marine Systems Limited, as Charterer, and International Cableship PTE LTD, as Owner (incorporated by reference to Exhibit 10.9.1 on HC2’s Quarterly Report on Form 10-Q, filed on November 10, 2014) (File No. 001-35210). | |
10.14.2 | Bareboat Charter, dated as of September 24, 1992, between International Cableship Pte Ltd and Global Marine Systems Limited (as successor-in-interest to Cable & Wireless (Marine) Ltd) (incorporated by reference to Exhibit 10.9.2 on HC2’s Quarterly Report on Form 10-Q, filed on November 10, 2014) (File No. 001-35210). | |
10.15.1 | Deed of Covenant, dated as of March 14, 2006, by and among Global Marine Systems Limited, as Mortgagee, and DYVI Cable Ship, as Mortgagor (incorporated by reference to Exhibit 10.10.1 on HC2’s Quarterly Report on Form 10-Q, filed on November 10, 2014) (File No. 001-35210). | |
10.15.2 | Bareboat Charter, dated as of March 14, 2006, between DYVI Cable Ship AS and Global Marine Systems Limited (incorporated by reference to Exhibit 10.10.2 on HC2’s Quarterly Report on Form 10-Q, filed on November 10, 2014) (File No. 001-35210). | |
10.15.3 | Mortgage, dated as of March 14, 2006, of DYVI Cable Ship AS, as mortgagor, in favor of Global Marine Systems Limited, as mortgagee (incorporated by reference to Exhibit 10.10.3 on HC2’s Quarterly Report on Form 10-Q, filed on November 10, 2014) (File No. 001-35210). | |
10.16 | Consent and Waiver, dated as of October 9, 2014 to Securities Purchase Agreement, dated as of May 29, 2014, by and among HC2 and affiliates of Hudson Bay Capital Management LP, Benefit Street Partners L.L.C. and DG Capital Management, LLC (incorporated by reference to Exhibit 10.14 on HC2’s Quarterly Report on Form 10-Q, filed on November 10, 2014) (File No. 001-35210). | |
10.17 | Consent, Waiver and Amendment, dated as of September 22, 2014 to Securities Purchase Agreement, dated as of May 29, 2014, by and among HC2 and affiliates of Hudson Bay Capital Management LP, Benefit Street Partners L.L.C. and DG Capital Management, LLC (incorporated by reference to Exhibit 10.15 on HC2’s Quarterly Report on Form 10-Q, filed on November 10, 2014) (File No. 001-35210). | |
10.18.1 | Reformed and Clarified Option Agreement, dated October 26, 2014, by and between HC2 and Philip Falcone (incorporated by reference to Exhibit 10.18.1 to the Original Filing). | |
10.18.2 | Form of Option Agreement (Additional Time Contingent Option) by and between HC2 and Philip Falcone (incorporated by reference to Exhibit 10.18.2 to the Original Filing). | |
10.18.3 | Form of Option Agreement (Contingent Option) by and between HC2 and Philip Falcone (incorporated by reference to Exhibit 10.18.3 to the Original Filing). | |
10.19 | Form of Non-Qualified Stock Option Award Agreement (incorporated by reference to Exhibit 10.1 on HC2’s Current Report on Form 8-K, filed on September 22, 2014). | |
10.20 | Form of Restricted Stock Award Agreement (incorporated by reference to Exhibit 10.2 on HC2’s Current Report on Form 8-K, filed on September 22, 2014). | |
66
Exhibit Number | Description | |
21.1 | Subsidiaries of HC2 (incorporated by reference to Exhibit 21.1 to the Original Filing). | |
23.1 | Consent of BDO LLP, an independent registered public accounting firm (filed herewith). | |
24.1 | Powers of Attorney of directors and officers of HC2 (included on signature page). | |
31.1 | Certification (filed herewith). | |
31.2 | Certification (filed herewith). | |
32* | Certifications (filed herewith). | |
101 | The following materials from the registrant’s Annual Report on Form 10-K for the fiscal year ended December 31, 2014, formatted in extensible business reporting language (XBRL); (i) Consolidated Statements of Operations for the years ended December 31, 2014, 2013 and 2012, (ii) Consolidated Statements of Comprehensive Income (Loss) for the years ended December 31, 2014, 2013 and 2012, (iii) Consolidated Balance Sheets at December 31, 2014 and 2013, (iv) Consolidated Statements of Stockholders’ Equity for the years ended December 31, 2014, 2013 and 2012, (v) Consolidated Statements of Cash Flows for the years ended December 31, 2014, 2013 and 2012, and (vi) Notes to Consolidated Financial Statements (filed herewith). | |
* | These certifications are being “furnished” and will not be deemed “filed” for purposes of Section 18 of the Securities Exchange Act of 1934, as amended, or otherwise subject to the liability of that section. Such certifications will not be deemed to be incorporated by reference into any filing under the Securities Act of 1933 or the Securities Exchange Act of 1934, as amended, except to the extent that the registrant specifically incorporates it by reference. |
^ | Indicates management contract or compensatory plan or arrangement. |
67
SIGNATURES
Pursuant to the requirements of Section 13 or 15(d) of the Securities Exchange Act of 1934, as amended, the Registrant has duly caused this report to be signed on its behalf by the undersigned, thereunto duly authorized.
HC2 HOLDINGS, INC.
By: | /S/ PHILIP A. FALCONE | |
Philip A. Falcone Chairman, President and Chief Executive Officer (Principal Executive Officer) | ||
Date: March 15, 2016
Pursuant to the requirements of the Securities Exchange Act of 1934, this report has been signed below by the following persons on behalf of the Registrant and in the capacities and on the date indicated.
Signature | Title | Date | ||
/S/ PHILIP A. FALCONE Philip A. Falcone | Director and Chairman, President and Chief Executive Officer (Principal Executive Officer) | March 15, 2016 | ||
/S/ MICHAEL SENA Michael Sena | Chief Financial Officer, (Principal Financial and Accounting Officer) | March 15, 2016 | ||
/S/ WAYNE BARR, JR. Wayne Barr, Jr. | Director | March 15, 2016 | ||
/S/ ROBERT M. PONS Robert M. Pons | Director | March 15, 2016 | ||
/S/ ROBERT LEFFLER Robert Leffler | Director | March 15, 2016 | ||
/S/ DANIEL TSEUNG Daniel Tseung | Director | March 15, 2016 | ||
68
INDEX TO FINANCIAL STATEMENTS AND SCHEDULE
Page | |
Consolidated Financial Statements: | |
F-1
REPORT OF INDEPENDENT REGISTERED PUBLIC ACCOUNTING FIRM
To the Board of Directors and Stockholders of
HC2 Holdings, Inc.
Herndon, Virginia
We have audited the accompanying consolidated balance sheets of HC2 Holdings, Inc. as of December 31, 2014 and 2013 and the consolidated statements of operations, comprehensive income (loss), stockholders’ equity, and cash flows for each of the three years in the period ended December 31, 2014. In connection with our audits of the financial statements, we have also audited the financial statement schedule listed in the accompanying index. These financial statements and schedule are the responsibility of the Company’s management. Our responsibility is to express an opinion on these financial statements and schedules based on our audits.
We conducted our audits in accordance with the standards of the Public Company Accounting Oversight Board (United States). Those standards require that we plan and perform the audit to obtain reasonable assurance about whether the financial statements are free of material misstatement. An audit includes examining, on a test basis, evidence supporting the amounts and disclosures in the financial statements, assessing the accounting principles used and significant estimates made by management, as well as evaluating the overall presentation of the financial statements and schedules. We believe that our audits provide a reasonable basis for our opinion.
In our opinion, the consolidated financial statements referred to above present fairly, in all material respects, the financial position of HC2 Holdings, Inc. at December 31, 2014 and 2013, and the results of its operations and its cash flows for each of the three years in the period ended December 31, 2014, in conformity with accounting principles generally accepted in the United States of America.
Also, in our opinion, the financial statement schedule, when considered in relation to the basic consolidated financial statements taken as a whole, present fairly, in all material respects, the information set forth therein.
As discussed in Note 1 to the consolidated financial statements, the 2014 financial statements have been restated due to the correction of errors. Our opinion is not modified with respect to this matter.
We also have audited, in accordance with the standards of the Public Company Accounting Oversight Board (United States), HC2 Holdings, Inc.'s internal control over financial reporting as of December 31, 2014, based on criteria established in Internal Control - Integrated Framework (1992) issued by the Committee of Sponsoring Organizations of the Treadway Commission (COSO) and our report dated March 16, 2015, except as to the effect of the additional material weaknesses which is dated March 15, 2016, expressed an adverse opinion thereon.
/s/ BDO USA, LLP
McLean, VA
March 16, 2015, except for the effects of the restatement discussed in Note 1 which is as of March 15, 2016.
F-2
REPORT OF INDEPENDENT REGISTERED PUBLIC ACCOUNTING FIRM
To the Board of Directors and Stockholders of
HC2 Holdings, Inc.
Herndon, Virginia
We have audited HC2 Holdings, Inc.’s internal control over financial reporting as of December 31, 2014, based on criteria established in Internal Control - Integrated Framework (1992) issued by the Committee of Sponsoring Organizations of the Treadway Commission (the COSO criteria). HC2 Holdings, Inc.’s management is responsible for maintaining effective internal control over financial reporting and for its assessment of the effectiveness of internal control over financial reporting, included in the accompanying “Item 9A, Management’s Report on Internal Control Over Financial Reporting”. Our responsibility is to express an opinion on the company’s internal control over financial reporting based on our audit.
We conducted our audit in accordance with the standards of the Public Company Accounting Oversight Board (United States). Those standards require that we plan and perform the audit to obtain reasonable assurance about whether effective internal control over financial reporting was maintained in all material respects. Our audit included obtaining an understanding of internal control over financial reporting, assessing the risk that a material weakness exists, and testing and evaluating the design and operating effectiveness of internal control based on the assessed risk. Our audit also included performing such other procedures as we considered necessary in the circumstances. We believe that our audit provides a reasonable basis for our opinion.
A company’s internal control over financial reporting is a process designed to provide reasonable assurance regarding the reliability of financial reporting and the preparation of financial statements for external purposes in accordance with generally accepted accounting principles. A company’s internal control over financial reporting includes those policies and procedures that (1) pertain to the maintenance of records that, in reasonable detail, accurately and fairly reflect the transactions and dispositions of the assets of the company; (2) provide reasonable assurance that transactions are recorded as necessary to permit preparation of financial statements in accordance with generally accepted accounting principles, and that receipts and expenditures of the company are being made only in accordance with authorizations of management and directors of the company; and (3) provide reasonable assurance regarding prevention or timely detection of unauthorized acquisition, use, or disposition of the company’s assets that could have a material effect on the financial statements.
Because of its inherent limitations, internal control over financial reporting may not prevent or detect misstatements. Also, projections of any evaluation of effectiveness to future periods are subject to the risk that controls may become inadequate because of changes in conditions, or that the degree of compliance with the policies or procedures may deteriorate.
As indicated in the accompanying “Item 9A, Management’s Report on Internal Control over Financial Reporting”, management’s assessment of and conclusion on the effectiveness of internal control over financial reporting did not include the internal controls of Schuff International, Inc., which was acquired on May 29, 2014, Bridgehouse Marine Limited, which was acquired on September 22, 2014 and American Natural Gas, which was acquired on August 1, 2014, and which are included in the consolidated balance sheets of HC2 Holdings, Inc. as of December 31, 2014, and the related consolidated statements of operations, comprehensive income (loss), stockholders’ equity, and cash flows for the year then ended. Schuff International, Inc., Bridgehouse Marine Limited and American Natural Gas constituted 82% of total assets as of December 31, 2014, and 70% of net revenues for the year then ended. Management did not assess the effectiveness of internal control over financial reporting of the acquired entities because of the timing of the acquisitions. Our audit of internal control over financial reporting of HC2 Holdings, Inc. also did not include an evaluation of the internal control over financial reporting of Schuff International, Inc., Bridgehouse Marine Limited and American Natural Gas.
A material weakness is a deficiency, or a combination of deficiencies, in internal control over financial reporting, such that there is a reasonable possibility that a material misstatement of the company’s annual or interim financial statements will not be prevented or detected on a timely basis. A material weakness regarding management’s failure to design and maintain controls over the completeness and accuracy of the accounting for income taxes, including the income tax provision and related tax assets and liabilities has been described in management’s assessment. Subsequent to March 16, 2015, HC2 Holdings, Inc. identified a material misstatement which impacts the fiscal year ended December 31, 2014, the fiscal quarters ended June 30, 2014 and September 30, 2014, March 31, 2015, June 30, 2015 and September 30, 2015, requiring restatement of such financial statements. Management revised its assessment of internal control over financial reporting due to the identification of additional material weaknesses, described in the following paragraph, in connection with the financial statement restatement.
A material weakness regarding management’s failure to design and maintain controls over valuation of a business acquisition and accounting for complex and/or non-routine transactions have been described in management’s assessment. These material weaknesses were considered in determining the nature, timing, and extent of audit tests applied in our audit of the 2014
F-3
financial statements (as restated).
In our opinion, HC2 Holdings, Inc. did not maintain, in all material respects, effective internal control over financial reporting as of December 31, 2014, based on the COSO criteria.
We do not express an opinion or any other form of assurance on management’s statements referring to any corrective actions taken by the company after the date of management’s assessment.
We also have audited, in accordance with the standards of the Public Company Accounting Oversight Board (United States), the consolidated balance sheets of HC2 Holdings, Inc. as of December 31, 2014 and 2013, and the related consolidated statements of operations, comprehensive income (loss), stockholders’ equity, and cash flows for each of the three years in the period ended December 31, 2014 and our report dated March 16, 2015, except as to Note 1, which is dated March 15, 2016, expressed an unqualified opinion thereon.
/s/ BDO USA, LLP
McLean, VA
March 16, 2015, except as to the effect of the additional material weakness, which is dated as of March 15, 2016.
F-4
HC2 HOLDING, INC.
CONSOLIDATED STATEMENTS OF OPERATIONS
(in thousands, except per share amounts)
Years Ended December 31, | |||||||||||
2014 (As Restated) | 2013 | 2012 | |||||||||
Services revenue | $ | 197,280 | $ | 230,686 | $ | 302,959 | |||||
Sales revenue | 350,158 | — | — | ||||||||
Net revenue | 547,438 | 230,686 | 302,959 | ||||||||
Operating expenses: | |||||||||||
Cost of revenue—services | 177,812 | 220,315 | 285,631 | ||||||||
Cost of revenue—sales | 296,530 | — | — | ||||||||
Selling, general and administrative | 80,239 | 34,692 | 45,202 | ||||||||
Depreciation and amortization | 6,334 | 12,032 | 3,204 | ||||||||
(Gain) loss on sale or disposal of assets | (162 | ) | (8 | ) | 520 | ||||||
Asset impairment expense | 291 | 2,791 | 20,298 | ||||||||
Total operating expenses | 561,044 | 269,822 | 354,855 | ||||||||
Loss from operations | (13,606 | ) | (39,136 | ) | (51,896 | ) | |||||
Interest expense | (10,754 | ) | (8 | ) | (27 | ) | |||||
Amortization of debt discount | (1,593 | ) | — | — | |||||||
Loss on early extinguishment or restructuring of debt | (11,969 | ) | — | — | |||||||
Gain from contingent value rights valuation | — | 14,904 | 1,292 | ||||||||
Interest income and other expense, net | 768 | (226 | ) | 90 | |||||||
Foreign currency transaction gain (loss) | (66 | ) | (588 | ) | 2,538 | ||||||
Loss from continuing operations before income taxes and income (loss) from equity investees | (37,220 | ) | (25,054 | ) | (48,003 | ) | |||||
Income from equity investees | 2,665 | — | — | ||||||||
Income tax (expense) benefit | 22,869 | 7,442 | 3,132 | ||||||||
Loss from continuing operations | (11,686 | ) | (17,612 | ) | (44,871 | ) | |||||
Loss from discontinued operations | (25 | ) | (19,621 | ) | (21,525 | ) | |||||
Gain (loss) from sale of discontinued operations | (121 | ) | 148,839 | 94,265 | |||||||
Net income (loss) | (11,832 | ) | 111,606 | 27,869 | |||||||
Less: Net (income) loss attributable to noncontrolling interest | (2,559 | ) | — | 18 | |||||||
Net income (loss) attributable to HC2 Holdings, Inc. | (14,391 | ) | 111,606 | 27,887 | |||||||
Less: Preferred stock dividends and accretion | 2,049 | — | — | ||||||||
Net income (loss) attributable to common stock and participating preferred stockholders | $ | (16,440 | ) | $ | 111,606 | $ | 27,887 | ||||
Basic income (loss) per common share: | |||||||||||
Loss from continuing operations attributable to HC2 Holdings, Inc. | $ | (0.82 | ) | $ | (1.25 | ) | $ | (3.24 | ) | ||
Loss from discontinued operations | — | (1.40 | ) | (1.55 | ) | ||||||
Gain (loss) from sale of discontinued operations | (0.01 | ) | 10.60 | 6.81 | |||||||
Net income (loss) attributable to HC2 Holdings, Inc. | $ | (0.83 | ) | $ | 7.95 | $ | 2.02 | ||||
Diluted income (loss) per common share: | |||||||||||
Loss from continuing operations attributable to HC2 Holdings, Inc. | $ | (0.82 | ) | $ | (1.25 | ) | $ | (3.24 | ) | ||
Loss from discontinued operations | — | (1.40 | ) | (1.55 | ) | ||||||
Gain (loss) from sale of discontinued operations | (0.01 | ) | 10.60 | 6.81 | |||||||
Net income (loss) attributable to HC2 Holdings, Inc. | $ | (0.83 | ) | $ | 7.95 | $ | 2.02 | ||||
Weighted average common shares outstanding: | |||||||||||
Basic | 19,729 | 14,047 | 13,844 | ||||||||
Diluted | 19,729 | 14,047 | 13,844 | ||||||||
Dividends declared per basic weighted average common shares outstanding | $ | — | $ | 8.58 | $ | 4.09 | |||||
Amounts attributable to common shareholders of HC2 Holdings, Inc. | |||||||||||
Loss from continuing operations attributable to HC2 Holdings, Inc. | $ | (16,294 | ) | $ | (17,612 | ) | $ | (44,853 | ) | ||
Loss from discontinued operations | (25 | ) | (19,621 | ) | (21,525 | ) | |||||
Gain (loss) from sale of discontinued operations | (121 | ) | 148,839 | 94,265 | |||||||
Net income (loss) attributable to HC2 Holdings, Inc. | $ | (16,440 | ) | $ | 111,606 | $ | 27,887 | ||||
See notes to consolidated financial statements.
F-5
HC2 HOLDINGS, INC.
CONSOLIDATED STATEMENTS OF COMPREHENSIVE INCOME (LOSS)
(in thousands)
Years Ended December 31, | |||||||||||
2014 (As Restated) | 2013 | 2012 | |||||||||
Net income (loss) | $ | (11,832 | ) | $ | 111,606 | $ | 27,869 | ||||
Other comprehensive income (loss) | |||||||||||
Foreign currency translation adjustment | (6,168 | ) | (7,583 | ) | (8,156 | ) | |||||
Unrealized gain on available-for-sale securities | 1,551 | — | — | ||||||||
Actuarial benefit on pension plan | 426 | — | — | ||||||||
Less: Comprehensive (income) attributable to the noncontrolling interest | (2,559 | ) | — | (711 | ) | ||||||
Comprehensive income (loss) attributable to HC2 Holdings, Inc. | $ | (18,582 | ) | $ | 104,023 | $ | 19,002 | ||||
See notes to consolidated financial statements.
F-6
HC2 HOLDING, INC.
CONSOLIDATED BALANCE SHEETS
(in thousands, except share and per share amounts)
December 31, | |||||||
2014 (As Restated) | 2013 | ||||||
Assets | |||||||
Current assets: | |||||||
Cash and cash equivalents | $ | 107,978 | $ | 8,997 | |||
Short-term investments | 4,867 | — | |||||
Accounts receivable (net of allowance for doubtful accounts receivable of $2,760 and $2,476 at December 31, 2014 and 2013, respectively) | 152,279 | 18,980 | |||||
Costs and recognized earnings in excess of billings on uncompleted contracts | 28,098 | — | |||||
Deferred tax asset—current | 1,701 | — | |||||
Inventories | 14,975 | — | |||||
Prepaid expenses and other current assets | 18,590 | 40,594 | |||||
Assets held for sale | 3,865 | 6,329 | |||||
Total current assets | 332,353 | 74,900 | |||||
Restricted cash | 6,467 | — | |||||
Long-term investments | 50,816 | — | |||||
Property, plant and equipment, net | 233,022 | 2,962 | |||||
Goodwill | 30,540 | 3,378 | |||||
Other intangible assets, net | 31,158 | — | |||||
Deferred tax asset—long-term | 14,019 | — | |||||
Other assets | 21,628 | 6,440 | |||||
Total assets | $ | 720,003 | $ | 87,680 | |||
Liabilities, temporary equity and stockholders’ equity | |||||||
Current liabilities: | |||||||
Accounts payable | $ | 80,183 | $ | 6,964 | |||
Accrued interconnection costs | 9,717 | 12,456 | |||||
Accrued payroll and employee benefits | 20,023 | 1,854 | |||||
Accrued expenses and other current liabilities | 34,042 | 5,550 | |||||
Billings in excess of costs and recognized earnings on uncompleted contracts | 41,959 | — | |||||
Accrued income taxes | 512 | 53 | |||||
Accrued interest | 3,125 | — | |||||
Current portion of long-term debt | 10,444 | — | |||||
Liabilities held for sale | — | 4,823 | |||||
Total current liabilities | 200,005 | 31,700 | |||||
Long-term debt | 332,927 | — | |||||
Pension liability | 37,210 | — | |||||
Other liabilities | 1,617 | 1,571 | |||||
Total liabilities | 571,759 | 33,271 | |||||
Commitments and contingencies (See Note 11) | |||||||
Temporary equity (See Note 14) | |||||||
Preferred stock, $0.001 par value – 20,000,000 shares authorized; Series A—30,000 and 0 shares issued and outstanding at December 31, 2014 and 2013, respectively; Series A-1—11,000 and 0 shares issued and outstanding at December 31, 2014 and 2013, respectively | 39,845 | — | |||||
Redeemable noncontrolling interest | 4,004 | — | |||||
Total temporary equity | 43,849 | — | |||||
Stockholders’ equity: | |||||||
Common stock, $0.001 par value – 80,000,000 shares authorized; 23,844,711 and 14,257,545 shares issued and 23,813,085 and 14,225,919 shares outstanding at December 31, 2014 and 2013, respectively | 24 | 14 | |||||
Additional paid-in capital | 141,948 | 98,598 | |||||
Accumulated deficit | (44,164 | ) | (29,773 | ) | |||
Treasury stock, at cost – 31,626 shares at December 31, 2014 and 2013, respectively | (378 | ) | (378 | ) | |||
Accumulated other comprehensive loss | (18,243 | ) | (14,052 | ) | |||
Total HC2 Holdings, Inc. stockholders’ equity before noncontrolling interest | 79,187 | 54,409 | |||||
Noncontrolling interest | 25,208 | — | |||||
Total stockholders’ equity | 104,395 | 54,409 | |||||
Total liabilities, temporary equity and stockholders’ equity | $ | 720,003 | $ | 87,680 | |||
See notes to consolidated financial statements.
F-7
HC2 HOLDINGS, INC.
CONSOLIDATED STATEMENT OF STOCKHOLDERS’ EQUITY
(in thousands)
Total | Common Stock | Additional Paid-In Capital | Treasury Stock | Retained Earnings (Accumulated Deficit) | Accumulated Other Comprehensive Income (Loss) | Non- controlling Interest | ||||||||||||||||||||||||
Shares | Amount | |||||||||||||||||||||||||||||
Balance as of December 31, 2011 | $ | 101,706 | 13,741 | $ | 14 | $ | 142,796 | $ | (378 | ) | $ | (51,085 | ) | $ | 2,416 | $ | 7,943 | |||||||||||||
Share-based compensation expense | 5,194 | — | — | 5,194 | — | — | — | — | ||||||||||||||||||||||
Proceeds from sale of common stock, net | 124 | 193 | — | 124 | — | — | — | — | ||||||||||||||||||||||
Taxes paid in lieu of shares issued for share-based compensation | (1,653 | ) | — | — | (1,653 | ) | — | — | — | — | ||||||||||||||||||||
Dividends declared | (56,581 | ) | — | — | (56,581 | ) | — | — | — | — | ||||||||||||||||||||
Acquisition of noncontrolling interest | — | — | — | 8,654 | — | — | — | (8,654 | ) | |||||||||||||||||||||
Net income (loss) | 27,869 | — | — | — | — | 27,887 | — | (18 | ) | |||||||||||||||||||||
Foreign currency translation adjustment | (8,156 | ) | — | — | — | — | — | (8,885 | ) | 729 | ||||||||||||||||||||
Balance as of December 31, 2012 | $ | 68,503 | 13,934 | $ | 14 | $ | 98,534 | $ | (378 | ) | $ | (23,198 | ) | $ | (6,469 | ) | $ | — | ||||||||||||
Share-based compensation expense | 2,286 | — | — | 2,286 | — | — | — | — | ||||||||||||||||||||||
Proceeds from sale of common stock, net | 1,158 | 328 | — | 1,158 | — | — | — | — | ||||||||||||||||||||||
Taxes paid in lieu of shares issued for share-based compensation | (1,000 | ) | (36 | ) | — | (1,000 | ) | — | — | — | — | |||||||||||||||||||
Dividends declared | (120,561 | ) | — | — | (2,380 | ) | — | (118,181 | ) | — | — | |||||||||||||||||||
Net income (loss) | 111,606 | — | — | — | — | 111,606 | — | — | ||||||||||||||||||||||
Foreign currency translation adjustment | (7,583 | ) | — | — | — | — | — | (7,583 | ) | — | ||||||||||||||||||||
Balance as of December 31, 2013 | $ | 54,409 | 14,226 | $ | 14 | $ | 98,598 | $ | (378 | ) | $ | (29,773 | ) | $ | (14,052 | ) | $ | — | ||||||||||||
Share-based compensation expense | 11,028 | — | — | 11,028 | — | — | — | — | ||||||||||||||||||||||
Proceeds from the exercise of warrants and stock options | 24,348 | 7,589 | 8 | 24,340 | — | — | — | — | ||||||||||||||||||||||
Taxes paid in lieu of shares issued for share-based compensation | (47 | ) | — | — | (47 | ) | — | — | — | — | ||||||||||||||||||||
Preferred stock dividend and accretion | (2,049 | ) | — | — | (2,049 | ) | — | — | — | — | ||||||||||||||||||||
Preferred stock beneficial conversion feature | 659 | — | — | 659 | — | — | — | — | ||||||||||||||||||||||
Issuance of common stock | 6,000 | 1,500 | 2 | 5,998 | — | — | — | — | ||||||||||||||||||||||
Issuance of restricted stock | — | 498 | — | — | — | — | — | — | ||||||||||||||||||||||
Acquisition of noncontrolling interest (As Restated) | 67,106 | — | — | — | — | — | — | 67,106 | ||||||||||||||||||||||
Additional acquisition of noncontrolling interest | (41,036 | ) | — | — | — | — | — | — | (41,036 | ) | ||||||||||||||||||||
Excess book value over fair value of purchased noncontrolling interest | — | — | — | 3,421 | — | — | — | (3,421 | ) | |||||||||||||||||||||
Actuarial benefit on pension plan | 426 | — | — | — | — | — | 426 | — | ||||||||||||||||||||||
Net income (loss) (As Restated) | (11,832 | ) | — | — | — | — | (14,391 | ) | — | 2,559 | ||||||||||||||||||||
Foreign currency translation adjustment | (6,168 | ) | — | — | — | — | — | (6,168 | ) | — | ||||||||||||||||||||
Unrealized gain on available-for-sale securities | 1,551 | — | — | — | — | — | 1,551 | — | ||||||||||||||||||||||
Balance as of December 31, 2014 (As Restated) | $ | 104,395 | 23,813 | $ | 24 | $ | 141,948 | $ | (378 | ) | $ | (44,164 | ) | $ | (18,243 | ) | $ | 25,208 | ||||||||||||
See notes to Consolidated Financial Statements.
F-8
HC2 HOLDINGS, INC.
CONSOLIDATED STATEMENTS OF CASH FLOWS
(in thousands)
Years Ended December 31, | |||||||||||
2014 (As Restated) | 2013 | 2012 | |||||||||
Cash flows from operating activities: | |||||||||||
Net income (loss) | $ | (11,832 | ) | $ | 111,606 | $ | 27,869 | ||||
Adjustments to reconcile net income (loss) to net cash provided by (used in) operating activities: | |||||||||||
Provision for doubtful accounts receivable | 403 | 1,507 | 4,819 | ||||||||
Share-based compensation expense | 11,028 | 2,286 | 5,194 | ||||||||
Depreciation and amortization | 10,684 | 23,964 | 43,239 | ||||||||
Amortization of deferred financing costs | 240 | — | — | ||||||||
(Gain) loss on sale or disposal of assets | 816 | (148,848 | ) | (93,175 | ) | ||||||
(Gain) loss on sale of investments | (434 | ) | — | — | |||||||
Equity investment (income)/loss | (2,665 | ) | — | — | |||||||
Impairment of goodwill and long-lived assets | 291 | 3,123 | 20,298 | ||||||||
Amortization of debt discount | 1,593 | 86 | 201 | ||||||||
Loss on early extinguishment or restructuring of debt | 11,969 | 21,124 | 21,682 | ||||||||
(Gain) on bargain purchase | (1,417 | ) | — | — | |||||||
Realized loss on marketable securities | 1,608 | — | — | ||||||||
Change in fair value of Contingent Value Rights | — | (14,904 | ) | (1,292 | ) | ||||||
Deferred income taxes | (30,223 | ) | (522 | ) | 119 | ||||||
Unrealized foreign currency transaction (gain) loss on intercompany and foreign debt | 1,352 | (764 | ) | (324 | ) | ||||||
Changes in assets and liabilities, net of acquisitions: | |||||||||||
(Increase) decrease in accounts receivable | 18,349 | (2,892 | ) | 16,372 | |||||||
(Increase) decrease in costs and recognized earnings in excess of billings on uncompleted contracts | (1,139 | ) | — | — | |||||||
(Increase) decrease in inventories | 6,616 | 644 | 662 | ||||||||
(Increase) decrease in prepaid expenses and other current assets | (1,106 | ) | (5,346 | ) | (2,059 | ) | |||||
(Increase) decrease in other assets | 1,870 | 3,221 | 5,933 | ||||||||
Increase (decrease) in accounts payable | 24,570 | (2,014 | ) | (8,393 | ) | ||||||
Increase (decrease) in accrued interconnection costs | (2,790 | ) | 4,418 | (3,397 | ) | ||||||
Increase (decrease) in accrued payroll and employee benefits | 9,681 | (5,287 | ) | — | |||||||
Increase (decrease) in accrued expenses and other current liabilities | (14,451 | ) | (829 | ) | (8,203 | ) | |||||
Increase (decrease) in billings in excess of costs and recognized earnings on uncompleted contracts | (23,793 | ) | — | — | |||||||
Increase (decrease) in accrued income taxes | (1,091 | ) | (7,432 | ) | (942 | ) | |||||
Increase (decrease) in accrued interest | 3,049 | (1,715 | ) | (3,870 | ) | ||||||
Increase (decrease) in other liabilities | (1,951 | ) | (1,741 | ) | (1,164 | ) | |||||
Increase (decrease) in pension liability | (7,564 | ) | — | — | |||||||
Net cash provided by (used in) operating activities | 3,663 | (20,315 | ) | 23,569 | |||||||
Cash flows from investing activities: | |||||||||||
Purchases of property, plant and equipment | (5,819 | ) | (12,577 | ) | (31,747 | ) | |||||
Sale of property and equipment and other assets | 3,706 | 9 | 25 | ||||||||
Purchases of equity investments | (22,909 | ) | — | — | |||||||
Purchases of available-for-sale securities | (9,875 | ) | — | — | |||||||
Investment in debt securities | (250 | ) | — | — | |||||||
Sale of available-for-sale securities | 2,411 | — | — | ||||||||
Cash from disposition of business, net of cash disposed | 31,645 | 270,634 | 183,101 | ||||||||
Cash paid for business acquisitions, net of cash acquired | (146,026 | ) | (397 | ) | (1,707 | ) | |||||
Purchase of noncontrolling interest | (38,403 | ) | — | — | |||||||
(Increase) decrease in restricted cash | (1,785 | ) | 475 | 66 | |||||||
Net cash (used in) provided by investing activities | (187,305 | ) | 258,144 | 149,738 | |||||||
Cash flows from financing activities: | |||||||||||
Proceeds from long-term obligations | 915,896 | — | — | ||||||||
Principal payments on long-term obligations | (689,745 | ) | (128,036 | ) | (120,763 | ) | |||||
Payment of fees on restructuring of debt | (12,333 | ) | (1,201 | ) | (13,455 | ) | |||||
Proceeds from sale of common stock, net | 6,000 | 1,158 | 124 | ||||||||
Proceeds from sale of preferred stock, net | 40,050 | — | — | ||||||||
Proceeds from the exercise of warrants and stock options | 24,348 | — | — | ||||||||
Payment of dividend equivalents | — | (1,235 | ) | (125 | ) | ||||||
Payment of dividends | (1,626 | ) | (119,788 | ) | (55,265 | ) | |||||
Receipt of dividends | 2,081 | — | — | ||||||||
Taxes paid in lieu of shares issued for share-based compensation | (47 | ) | (1,000 | ) | (1,653 | ) | |||||
Net cash provided by (used) in financing activities | 284,624 | (250,102 | ) | (191,137 | ) | ||||||
Effects of exchange rate changes on cash and cash equivalents | (2,001 | ) | (1,927 | ) | (25 | ) | |||||
Net change in cash and cash equivalents | 98,981 | (14,200 | ) | (17,855 | ) | ||||||
Cash and cash equivalents, beginning of period | 8,997 | 23,197 | 41,052 | ||||||||
Cash and cash equivalents, end of period | $ | 107,978 | $ | 8,997 | $ | 23,197 | |||||
F-9
Supplemental cash flow information: | |||||||||||
Cash paid for interest | $ | 7,527 | $ | 10,372 | $ | 24,908 | |||||
Cash paid for taxes | $ | 8,792 | $ | 616 | $ | 2,349 | |||||
Preferred stock dividends and accretion | $ | 2,049 | $ | — | $ | — | |||||
Non-cash investing and financing activities: | |||||||||||
Capital lease additions | $ | — | $ | 148 | $ | — | |||||
Prepayment premium associated with debt restructuring converted into new debt | $ | — | $ | — | $ | 9,084 | |||||
Acquisition of noncontrolling interest | $ | — | $ | — | $ | 8,654 | |||||
Purchases of property, plant and equipment under financing arrangements | $ | 4,400 | $ | — | $ | — | |||||
Property, plant and equipment included in accounts payable | $ | 2,544 | $ | — | $ | — | |||||
Non-cash investing activity on the reacquisition of shares from a noncontrolling interest | $ | 1,700 | $ | — | $ | — | |||||
See notes to consolidated financial statements.
F-10
1. ORGANIZATION AND BUSINESS
On April 9, 2014, we changed our name from PTGi Holding, Inc. to HC2 Holdings, Inc. (“HC2” and, together with its subsidiaries, the “Company”, “we” and “our”). The name change was effected pursuant to Section 253 of the General Corporation Law of the State of Delaware by the merger of our wholly owned subsidiary, HC2 Name Change, Inc., into us. In connection with the name change, we changed the ticker symbol of our common stock from “PTGI” to “HCHC”.
On May 29, 2014, the Company completed the acquisition of 2.5 million shares of common stock of Schuff International, Inc. (“Schuff”), a steel fabrication and erection company, and negotiated an agreement to purchase an additional 198,411 shares, representing an approximately 65% interest in Schuff. The aggregate consideration for the shares of Schuff acquired was approximately $85 million, which was funded using the net proceeds from (i) the issuance of $30 million of Series A Convertible Participating Preferred Stock of HC2 (the “Series A Preferred Stock”) and $6 million of common stock of HC2, and (ii) the entry into a senior secured credit facility providing for an eighteen month, floating interest rate term loan of $80 million(the “May Credit Facility”), each of which was also completed on May 29, 2014. Schuff repurchased a portion of its outstanding common stock in June 2014, which had the effect of increasing the Company’s ownership interest to 70%. During the fourth quarter, the final results of a tender offer for all outstanding shares of Schuff were announced and various open-market purchases were made, which resulted in the acquisition of 809,043 shares and an increase in our ownership interest to 91%. We intend to execute a short-form merger, which will increase our ownership of Schuff shares to 100%.
Schuff and its wholly-owned subsidiaries primarily operate as integrated fabricators and erectors of structural steel and heavy steel plates with headquarters in Phoenix, Arizona and operations in Arizona, Georgia, Texas, Kansas and California. Schuff’s construction projects are primarily in the aforementioned states. In addition, Schuff has construction projects in select international markets, primarily Panama. Schuff has a 49% interest in Schuff Hopsa Engineering, Inc. (“SHE”), a Panamanian joint venture with Empresas Hopsa, S.A., that provides steel fabrication services. Schuff controls the operations of SHE, as provided in the operating agreement. Therefore, the assets, liabilities, revenues and expenses of SHE are included in the consolidated financial statements of Schuff. Empresas Hopsa, S.A.’s 51% interest in SHE is presented as a noncontrolling interest component of total equity.
On August 1, 2014, the Company paid $15.5 million to acquire 15,500 shares of Series A Convertible Preferred Stock of American Natural Gas (“ANG”), representing an approximately 51% interest in ANG. ANG is a premier distributor of natural gas motor fuel headquartered in the Northeast that designs, builds, owns, acquires, operates and maintains compressed natural gas fueling stations for transportation.
On September 22, 2014, the Company completed the acquisition of Bridgehouse Marine Limited (“Bridgehouse”), the parent holding company of Global Marine Systems Limited (“GMSL”). The purchase price reflects an enterprise value of approximately $260 million, including assumed indebtedness, and was funded using a portion of the net proceeds from (i) the issuance of $11 million of Series A-1 Convertible Participating Preferred Stock of HC2 (the “Series A-1 Preferred Stock”) and (ii) a senior secured credit facility providing for a twelve month, floating interest rate term loan of $214 million and a delayed draw term loan of $36 million (the “September Credit Facility”), each of which was also completed on September 22, 2014. The September Credit Facility was subsequently repaid using the proceeds from HC2’s issuance of its 11% Notes discussed below under Note 9—“Long-Term Obligations”. With a portion of the proceeds from the September Credit Facility, the Company paid off its May Credit Facility and its senior unsecured credit facility consisting of a term loan of $17 million entered into on September 8, 2014 (the “Novatel Acquisition Term Loan”) for the purpose of acquiring an ownership interest in Novatel Wireless, Inc. GMSL is a leading provider of engineering and underwater services on submarine cables. In conjunction with the acquisition, approximately 3% of the Company’s interest in GMSL was purchased by a group of individuals, leaving the Company’s controlling interest as of December 31, 2014 at approximately 97%.
We have historically operated a telecommunications business including a network of direct routes and provided premium voice communication services for national telecom operators, mobile operators, wholesale carriers, prepaid operators, Voice over Internet Protocol (“VoIP”) service operators and Internet service providers (“ISPs”). The Company has provided telecommunications service from its North America Telecom and International Carrier Services (“ICS”) business units. In the second quarter of 2013, the Company entered into a definitive purchase agreement to sell its North America Telecom business and sought shareholder approval of such transaction. On July 31, 2013, the Company completed the initial closing of the sale of substantially all of its North America Telecom business. The sale of Primus Telecommunications, Inc. (“PTI”) was also
F-11
contemplated as part of this transaction, and subject to regulatory approval. On July 31, 2014, having received the necessary regulatory approvals for the sale of PTI, we completed the divestiture of the remainder of our North America Telecom business.
In our Life Sciences segment, we operate Pansend, LLC (“Pansend”), which has an 80% interest in Genovel Orthopedics, Inc., which seeks to develop products to treat early osteoarthritis of the knee, and a 61% interest in GemDerm Aesthetics, Inc., which develops skin lightening technology.
Additionally, we acquired a 100% ownership interest in DMi, Inc. (“DMi”) which owns licenses to create and distribute NASCAR® video games.
During 2013, we also provided data center services in Canada through our BLACKIRON Data business unit. On April 17, 2013, we consummated the divestiture of BLACKIRON Data. During 2012, we sold our Australian segment.
The Company currently has six reportable operating segments based on management’s organization of the enterprise—Manufacturing (Schuff), Marine Services (GMSL), Utilities (ANG), Telecommunications (ICS), Life Sciences and Other, which includes operations that do not meet the separately reportable segment thresholds.
HC2 was formed as a corporation under the laws of Delaware in 1994 and operates as a holding company of operating subsidiaries primarily in the United States and the United Kingdom.
Restatement of Consolidated Financial Statements
In connection with the preparation of the Company’s Annual Report on Form 10-K for the fiscal year ended December 31, 2014, management identified a material weakness in our internal controls over the accounting for income taxes, including the income tax provision and related tax assets and liabilities. Specifically, management determined that the Company did not have the technical knowledge nor management review controls to ensure the completeness and accuracy of the data used in the computation of income tax expense, taxes payable or receivable and deferred tax assets and liabilities.
Subsequently, management identified a material weakness in the Company’s internal controls over the valuation of a business acquisition and the application of U.S. GAAP to complex and/or non-routine transactions. In particular, the Company determined that it incorrectly accounted for the acquisition of American Natural Gas, completed on August 1, 2014 in its financial statements for the quarter ended September 30, 2014 as required by FASB Accounting Standards Codification 805.
These material weaknesses resulted in errors that, when aggregated with other errors that had been waived due to immateriality in prior periods, formed the basis for the determination by the Audit Committee of our Board of Directors that our financial statements for the year ended December 31, 2014 and our Condensed Consolidated Financial Statements for the quarters ended June 30, 2014, September 30, 2014, March 31, 2015, June 30, 2015 and September 30, 2015 should be restated.
In addition to the items referenced above, the restated financial statements also account for the following items:
• | The Company completed the acquisition of GMSL on September 22, 2014, but treated the acquisition as having closed on September 30, 2014. As a result, eight days of activity were excluded from the results of operations. In addition, the Company subsequently identified items related to the opening balance sheet as well as conforming balance sheet reclassifications related to the purchase accounting for GMSL. |
• | The Company incorrectly valued the share-based compensation expense. Options were entitled to be received between May and September of 2014, but which were actually issued on October 28, 2014. The Company incorrectly recorded the fair value of the options using the October 28th issuance date rather than the earlier measurement date under US GAAP. |
• | The Company amended the valuation of the ANG business acquisition which resulted in goodwill. |
• | The Company reclassified redeemable non-controlling interest from permanent equity to temporary equity. |
• | The Company corrected the Consolidated Statement of Cash Flows to reclassify funds released from escrow which related to the sale of business units from operating activities to investing activities. |
The principal effect of the aggregate adjustments required to correct these errors results in an approximate increase of the net loss as previously reported from $10 million to $12 million for the year ended December 31, 2014.
F-12
The following tables provide a reconciliation of the amounts previously reported to the restated amounts for the year ended December 31, 2014:
Fiscal Year 2014 Quarter Ended, | Fiscal Year Ended | ||||||||||||||||||
(in thousands) | Mar. 31, 2014 | June 30, 2014 | Sept. 30, 2014 | Dec. 31, 2014 | Dec. 31, 2014 | ||||||||||||||
Net income (loss), as previously reported | $ | (4,947 | ) | $ | (2,502 | ) | $ | (14,948 | ) | $ | 12,849 | $ | (9,548 | ) | |||||
Adjustments | — | (348 | ) | (1,517 | ) | (419 | ) | (2,284 | ) | ||||||||||
Net income (loss), as restated | $ | (4,947 | ) | $ | (2,850 | ) | $ | (16,465 | ) | $ | 12,430 | $ | (11,832 | ) | |||||
The following tables provide a reconciliation of the amounts previously reported to the restated amounts for the year ended December 31, 2014:
HC2 HOLDINGS, INC.
CONSOLIDATED STATEMENTS OF OPERATIONS
F-13
(in thousands, except per share amounts)
Year Ended December 31, 2014 | |||||||||||
As Reported | Adjustments | As Restated | |||||||||
Services revenue | $ | 193,044 | $ | 4,236 | $ | 197,280 | |||||
Sales revenue | 350,158 | — | 350,158 | ||||||||
Net revenue | 543,202 | 4,236 | 547,438 | ||||||||
Operating expenses: | |||||||||||
Cost of revenue—services | 174,956 | 2,856 | 177,812 | ||||||||
Cost of revenue—sales | 296,530 | — | 296,530 | ||||||||
Selling, general and administrative | 81,396 | (1,157 | ) | 80,239 | |||||||
Depreciation and amortization | 4,617 | 1,717 | 6,334 | ||||||||
(Gain) loss on sale or disposal of assets | (162 | ) | — | (162 | ) | ||||||
Asset impairment expense | 291 | — | 291 | ||||||||
Total operating expenses | 557,628 | 3,416 | 561,044 | ||||||||
Loss from operations | (14,426 | ) | 820 | (13,606 | ) | ||||||
Interest expense | (10,754 | ) | — | (10,754 | ) | ||||||
Amortization of debt discount | (1,593 | ) | — | (1,593 | ) | ||||||
Loss on early extinguishment or restructuring of debt | (11,969 | ) | — | (11,969 | ) | ||||||
Gain from contingent value rights valuation | — | — | — | ||||||||
Interest income and other expense, net | 436 | 332 | 768 | ||||||||
Foreign currency transaction gain (loss) | 1,061 | (1,127 | ) | (66 | ) | ||||||
Loss from continuing operations before income taxes and income (loss) from equity investees | (37,245 | ) | 25 | (37,220 | ) | ||||||
Income from equity investees | 3,359 | (694 | ) | 2,665 | |||||||
Income tax (expense) benefit | 24,484 | (1,615 | ) | 22,869 | |||||||
Loss from continuing operations | (9,402 | ) | (2,284 | ) | (11,686 | ) | |||||
Loss from discontinued operations | (25 | ) | — | (25 | ) | ||||||
Gain (loss) from sale of discontinued operations | (121 | ) | — | (121 | ) | ||||||
Net income (loss) | (9,548 | ) | (2,284 | ) | (11,832 | ) | |||||
Less: Net (income) loss attributable to noncontrolling interest | (2,559 | ) | — | (2,559 | ) | ||||||
Net income (loss) attributable to HC2 Holdings, Inc. | (12,107 | ) | (2,284 | ) | (14,391 | ) | |||||
Less: Preferred stock dividends and accretion | 2,049 | — | 2,049 | ||||||||
Net income (loss) attributable to common stock and participating preferred stockholders | $ | (14,156 | ) | $ | (2,284 | ) | $ | (16,440 | ) | ||
Basic income (loss) per common share: | |||||||||||
Loss from continuing operations attributable to HC2 Holdings, Inc. | $ | (0.71 | ) | $ | (0.11 | ) | $ | (0.82 | ) | ||
Loss from discontinued operations | — | — | — | ||||||||
Gain (loss) from sale of discontinued operations | (0.01 | ) | — | (0.01 | ) | ||||||
Net income (loss) attributable to HC2 Holdings, Inc. | $ | (0.72 | ) | $ | (0.11 | ) | $ | (0.83 | ) | ||
Diluted income (loss) per common share: | |||||||||||
Loss from continuing operations attributable to HC2 Holdings, Inc. | $ | (0.71 | ) | $ | (0.11 | ) | $ | (0.82 | ) | ||
Loss from discontinued operations | — | — | — | ||||||||
Gain (loss) from sale of discontinued operations | (0.01 | ) | — | (0.01 | ) | ||||||
Net income (loss) attributable to HC2 Holdings, Inc. | $ | (0.72 | ) | $ | (0.11 | ) | $ | (0.83 | ) | ||
Weighted average common shares outstanding: | |||||||||||
Basic | 19,729 | 19,729 | 19,729 | ||||||||
Diluted | 19,729 | 19,729 | 19,729 | ||||||||
Dividends declared per basic weighted average common shares outstanding | — | — | — | ||||||||
Amounts attributable to common shareholders of HC2 Holdings, Inc. | |||||||||||
Loss from continuing operations attributable to HC2 Holdings, Inc. | $ | (14,010 | ) | $ | (2,284 | ) | $ | (16,294 | ) | ||
Loss from discontinued operations | (25 | ) | — | (25 | ) | ||||||
Gain (loss) from sale of discontinued operations | (121 | ) | — | (121 | ) | ||||||
Net income (loss) attributable to HC2 Holdings, Inc. | $ | (14,156 | ) | $ | (2,284 | ) | $ | (16,440 | ) | ||
F-14
HC2 HOLDINGS, INC.
CONSOLIDATED STATEMENTS OF COMPREHENSIVE INCOME (LOSS)
(in thousands)
Year Ended December 31, 2014 | |||||||||||
As Reported | Adjustments | As Restated | |||||||||
Net income (loss) | $ | (9,548 | ) | $ | (2,284 | ) | $ | (11,832 | ) | ||
Other comprehensive income (loss) | |||||||||||
Foreign currency translation adjustment | (4,717 | ) | (1,451 | ) | (6,168 | ) | |||||
Unrealized gain on available-for-sale securities | 2,462 | (911 | ) | 1,551 | |||||||
Actuarial benefit on pension plan | 1,129 | (703 | ) | 426 | |||||||
Less: Comprehensive (income) attributable to the noncontrolling interest | (2,559 | ) | — | (2,559 | ) | ||||||
Comprehensive income (loss) attributable to HC2 Holdings, Inc. | $ | (13,233 | ) | $ | (5,349 | ) | $ | (18,582 | ) | ||
HC2 HOLDING, INC.
CONSOLIDATED BALANCE SHEETS
F-15
(in thousands, except share and per share amounts)
As of December 31, 2014 | |||||||||||
As Reported | Adjustments | As Restated | |||||||||
Assets | |||||||||||
Current assets: | |||||||||||
Cash and cash equivalents | $ | 107,978 | $ | — | $ | 107,978 | |||||
Short-term investments | 4,867 | — | 4,867 | ||||||||
Accounts receivable (net of allowance for doubtful accounts receivable of $2,760 and $2,476 at December 31, 2014 and 2013, respectively) | 151,558 | 721 | 152,279 | ||||||||
Costs and recognized earnings in excess of billings on uncompleted contracts | 28,098 | — | 28,098 | ||||||||
Deferred tax asset—current | 1,701 | — | 1,701 | ||||||||
Inventories | 14,975 | — | 14,975 | ||||||||
Prepaid expenses and other current assets | 18,590 | — | 18,590 | ||||||||
Assets held for sale | 3,865 | — | 3,865 | ||||||||
Total current assets | 331,632 | 721 | 332,353 | ||||||||
Restricted cash | 6,467 | — | 6,467 | ||||||||
Long-term investments | 48,674 | 2,142 | 50,816 | ||||||||
Property, plant and equipment, net | 239,851 | (6,829 | ) | 233,022 | |||||||
Goodwill | 27,990 | 2,550 | 30,540 | ||||||||
Other intangible assets, net | 31,144 | 14 | 31,158 | ||||||||
Deferred tax asset—long-term | 15,811 | (1,792 | ) | 14,019 | |||||||
Other assets | 22,479 | (851 | ) | 21,628 | |||||||
Total assets | $ | 724,048 | $ | (4,045 | ) | $ | 720,003 | ||||
Liabilities, temporary equity and stockholders’ equity | |||||||||||
Current liabilities: | |||||||||||
Accounts payable | $ | 79,794 | $ | 389 | $ | 80,183 | |||||
Accrued interconnection costs | 9,717 | — | 9,717 | ||||||||
Accrued payroll and employee benefits | 20,023 | — | 20,023 | ||||||||
Accrued expenses and other current liabilities | 34,042 | — | 34,042 | ||||||||
Billings in excess of costs and recognized earnings on uncompleted contracts | 41,959 | — | 41,959 | ||||||||
Accrued income taxes | 512 | — | 512 | ||||||||
Accrued interest | 3,125 | — | 3,125 | ||||||||
Current portion of long-term debt | 10,444 | — | 10,444 | ||||||||
Current portion of pension liability | 5,966 | (5,966 | ) | — | |||||||
Liabilities held for sale | — | — | — | ||||||||
Total current liabilities | 205,582 | (5,577 | ) | 200,005 | |||||||
Long-term debt | 332,927 | — | 332,927 | ||||||||
Pension liability | 31,244 | 5,966 | 37,210 | ||||||||
Other liabilities | 1,617 | — | 1,617 | ||||||||
Total liabilities | 571,370 | 389 | 571,759 | ||||||||
Commitments and contingencies (See Note 11) | |||||||||||
Temporary equity (See Note 14) | |||||||||||
Preferred stock, $0.001 par value – 20,000,000 shares authorized; Series A—30,000 and 0 shares issued and outstanding at December 31, 2014 and 2013, respectively; Series A-1—11,000 and 0 shares issued and outstanding at December 31, 2014 and 2013, respectively | 39,845 | — | 39,845 | ||||||||
Redeemable noncontrolling interest | — | 4,004 | 4,004 | ||||||||
Total temporary equity | 39,845 | 4,004 | 43,849 | ||||||||
Stockholders’ equity: | |||||||||||
Common stock, $0.001 par value – 80,000,000 shares authorized; 23,844,711 and 14,257,545 shares issued and 23,813,085 and 14,225,919 shares outstanding at December 31, 2014 and 2013, respectively | 24 | — | 24 | ||||||||
Additional paid-in capital | 147,081 | (5,133 | ) | 141,948 | |||||||
Accumulated deficit | (41,880 | ) | (2,284 | ) | (44,164 | ) | |||||
Treasury stock, at cost – 31,626 shares at December 31, 2014 and 2013, respectively | (378 | ) | — | (378 | ) | ||||||
Accumulated other comprehensive loss | (15,178 | ) | (3,065 | ) | (18,243 | ) | |||||
Total HC2 Holdings, Inc. stockholders’ equity before noncontrolling interest | 89,669 | (10,482 | ) | 79,187 | |||||||
Noncontrolling interest | 23,164 | 2,044 | 25,208 | ||||||||
Total stockholders’ equity | 112,833 | (8,438 | ) | 104,395 | |||||||
Total liabilities, temporary equity and stockholders’ equity | $ | 724,048 | $ | (4,045 | ) | $ | 720,003 | ||||
F-16
HC2 HOLDINGS, INC.
CONSOLIDATED STATEMENT OF STOCKHOLDERS’ EQUITY
(in thousands)
Year Ended December 31, 2014 | |||||||||||
As Reported | Adjustments | As Restated | |||||||||
Common stock | $ | 24 | $ | — | $ | 24 | |||||
Additional paid-in capital | 147,081 | (5,133 | ) | 141,948 | |||||||
Treasury stock | (378 | ) | — | (378 | ) | ||||||
Retained earnings (accumulated deficit) | (41,880 | ) | (2,284 | ) | (44,164 | ) | |||||
Other comprehensive income (loss) | (15,178 | ) | (3,065 | ) | (18,243 | ) | |||||
Noncontrolling interest | 23,164 | 2,044 | 25,208 | ||||||||
Total stockholders' equity | $ | 112,833 | $ | (8,438 | ) | $ | 104,395 | ||||
F-17
HC2 HOLDINGS, INC.
CONSOLIDATED STATEMENTS OF CASH FLOWS
(in thousands)
Year Ended December 31, 2014 | |||||||||||
As Reported | Adjustments | As Restated | |||||||||
Cash flows from operating activities: | |||||||||||
Net income (loss) | $ | (9,548 | ) | $ | (2,284 | ) | $ | (11,832 | ) | ||
Adjustments to reconcile net income (loss) to net cash provided by (used in) operating activities: | |||||||||||
Provision for doubtful accounts receivable | 403 | — | 403 | ||||||||
Share-based compensation expense | 11,487 | (459 | ) | 11,028 | |||||||
Depreciation and amortization | 8,967 | 1,717 | 10,684 | ||||||||
Amortization of deferred financing costs | 240 | — | 240 | ||||||||
(Gain) loss on sale or disposal of assets | 816 | — | 816 | ||||||||
(Gain) loss on sale of investments | (434 | ) | — | (434 | ) | ||||||
Equity investment (income)/loss | (3,359 | ) | 694 | (2,665 | ) | ||||||
Impairment of goodwill and long-lived assets | 291 | — | 291 | ||||||||
Amortization of debt discount | 1,593 | — | 1,593 | ||||||||
Loss on early extinguishment or restructuring of debt | 11,969 | — | 11,969 | ||||||||
(Gain) on bargain purchase | (1,417 | ) | — | (1,417 | ) | ||||||
Realized loss on marketable securities | 1,608 | — | 1,608 | ||||||||
Change in fair value of Contingent Value Rights | — | — | — | ||||||||
Deferred income taxes | (31,838 | ) | 1,615 | (30,223 | ) | ||||||
Unrealized foreign currency transaction (gain) loss on intercompany and foreign debt | 225 | 1,127 | 1,352 | ||||||||
Changes in assets and liabilities, net of acquisitions: | |||||||||||
(Increase) decrease in accounts receivable | 23,306 | (4,957 | ) | 18,349 | |||||||
(Increase) decrease in costs and recognized earnings in excess of billings on uncompleted contracts | (1,139 | ) | — | (1,139 | ) | ||||||
(Increase) decrease in inventories | 6,616 | — | 6,616 | ||||||||
(Increase) decrease in prepaid expenses and other current assets | 28,044 | (29,150 | ) | (1,106 | ) | ||||||
(Increase) decrease in other assets | 1,870 | — | 1,870 | ||||||||
Increase (decrease) in accounts payable | 23,956 | 614 | 24,570 | ||||||||
Increase (decrease) in accrued interconnection costs | (2,790 | ) | — | (2,790 | ) | ||||||
Increase (decrease) in accrued payroll and employee benefits | 6,825 | 2,856 | 9,681 | ||||||||
Increase (decrease) in accrued expenses and other current liabilities | (14,451 | ) | — | (14,451 | ) | ||||||
Increase (decrease) in billings in excess of costs and recognized earnings on uncompleted contracts | (23,793 | ) | — | (23,793 | ) | ||||||
Increase (decrease) in accrued income taxes | (1,091 | ) | — | (1,091 | ) | ||||||
Increase (decrease) in accrued interest | 3,049 | — | 3,049 | ||||||||
Increase (decrease) in other liabilities | (1,951 | ) | — | (1,951 | ) | ||||||
Increase (decrease) in pension liability | (6,641 | ) | (923 | ) | (7,564 | ) | |||||
Net cash provided by (used in) operating activities | 32,813 | (29,150 | ) | 3,663 | |||||||
Cash flows from investing activities: | |||||||||||
Purchases of property, plant and equipment | (5,819 | ) | — | (5,819 | ) | ||||||
Sale of property and equipment and other assets | 3,706 | — | 3,706 | ||||||||
Purchases of equity investments | (22,909 | ) | — | (22,909 | ) | ||||||
Purchases of available-for-sale securities | (9,875 | ) | — | (9,875 | ) | ||||||
Investment in debt securities | (250 | ) | — | (250 | ) | ||||||
Sale of available-for-sale securities | 2,411 | — | 2,411 | ||||||||
Cash from disposition of business, net of cash disposed | 2,495 | 29,150 | 31,645 | ||||||||
Cash paid for business acquisitions, net of cash acquired | (146,026 | ) | — | (146,026 | ) | ||||||
Purchase of noncontrolling interest | (38,403 | ) | — | (38,403 | ) | ||||||
(Increase) decrease in restricted cash | (1,785 | ) | — | (1,785 | ) | ||||||
Net cash (used in) provided by investing activities | (216,455 | ) | 29,150 | (187,305 | ) | ||||||
Cash flows from financing activities: | |||||||||||
Proceeds from long-term obligations | 915,896 | — | 915,896 | ||||||||
Principal payments on long-term obligations | (689,745 | ) | — | (689,745 | ) | ||||||
Payment of fees on restructuring of debt | (12,333 | ) | — | (12,333 | ) | ||||||
Proceeds from sale of common stock, net | 6,000 | — | 6,000 | ||||||||
Proceeds from sale of preferred stock, net | 40,050 | — | 40,050 | ||||||||
Proceeds from the exercise of warrants and stock options | 24,348 | — | 24,348 | ||||||||
F-18
Payment of dividend equivalents | — | — | — | ||||||||
Payment of dividends | (1,626 | ) | — | (1,626 | ) | ||||||
Receipt of dividends | 2,081 | — | 2,081 | ||||||||
Taxes paid in lieu of shares issued for share-based compensation | (47 | ) | — | (47 | ) | ||||||
Net cash provided by (used) in financing activities | 284,624 | — | 284,624 | ||||||||
Effects of exchange rate changes on cash and cash equivalents | (2,001 | ) | — | (2,001 | ) | ||||||
Net change in cash and cash equivalents | 98,981 | — | 98,981 | ||||||||
Cash and cash equivalents, beginning of period | 8,997 | — | 8,997 | ||||||||
Cash and cash equivalents, end of period | $ | 107,978 | — | $ | 107,978 | ||||||
Supplemental cash flow information: | |||||||||||
Cash paid for interest | $ | 7,527 | — | $ | 7,527 | ||||||
Cash paid for taxes | $ | 8,792 | — | $ | 8,792 | ||||||
Preferred stock dividends and accretion | $ | 2,049 | — | $ | 2,049 | ||||||
Non-cash investing and financing activities: | |||||||||||
Capital lease additions | — | — | — | ||||||||
Prepayment premium associated with debt restructuring converted into new debt | — | — | — | ||||||||
Acquisition of noncontrolling interest | — | — | — | ||||||||
Purchases of property, plant and equipment under financing arrangements | $ | 4,400 | — | $ | 4,400 | ||||||
Property, plant and equipment included in accounts payable | $ | 2,544 | — | $ | 2,544 | ||||||
Non-cash investing activity on the reacquisition of shares from a noncontrolling interest | $ | 1,700 | — | $ | 1,700 | ||||||
Quarter Ended December 31, 2014 | |||||||||||
(in thousands, except per share amounts) | |||||||||||
As Reported | Adjustments | As Restated | |||||||||
Services revenue | $ | 66,191 | $ | 380 | $ | 66,571 | |||||
Sales revenue | 157,638 | — | 157,638 | ||||||||
Net revenue | 223,829 | 380 | 224,209 | ||||||||
Cost of revenue—services | 54,855 | — | 54,855 | ||||||||
Cost of revenue—sales | 134,025 | — | 134,025 | ||||||||
Total cost of revenue | 188,880 | — | 188,880 | ||||||||
Income (loss) from operations | (9,317 | ) | 2,494 | (6,823 | ) | ||||||
Income (loss) from continuing operations attributable to HC2 Holdings, Inc.—common holders | 7,982 | (419 | ) | 7,563 | |||||||
Income (loss) from continuing operations attributable to HC2 Holdings, Inc.—preferred holders | 3,416 | — | 3,416 | ||||||||
Income (loss) from discontinued operations | 37 | — | 37 | ||||||||
Gain (loss) from sale of discontinued operations | — | — | — | ||||||||
Net income (loss)—basic | $ | 11,435 | $ | (419 | ) | $ | 11,016 | ||||
Net income (loss)—diluted | $ | 11,435 | $ | (419 | ) | $ | 11,016 | ||||
Weighted average common shares outstanding-basic | 23,813 | 23,813 | 23,813 | ||||||||
Weighted average common shares outstanding-diluted | 28,962 | 28,962 | 28,962 | ||||||||
Basic income (loss) per common share: | |||||||||||
Income (loss) from continuing operations attributable to HC2 Holdings, Inc.—common holders | $ | 0.34 | $ | (0.02 | ) | $ | 0.32 | ||||
Income (loss) from continuing operations attributable to HC2 Holdings, Inc.—preferred holders | 0.34 | — | 0.34 | ||||||||
Income (loss) from discontinued operations | — | — | — | ||||||||
Gain (loss) from sale of discontinued operations | — | — | — | ||||||||
Net income (loss) attributable to HC2 Holdings, Inc. | $ | 0.68 | $ | (0.02 | ) | $ | 0.66 | ||||
Diluted income (loss) per common share: | |||||||||||
Income (loss) from continuing operations attributable to HC2 Holdings, Inc.—common holders | $ | 0.28 | $ | (0.02 | ) | $ | 0.26 | ||||
Income (loss) from continuing operations attributable to HC2 Holdings, Inc.—preferred holders | 0.34 | — | $ | 0.34 | |||||||
Income (loss) from discontinued operations | — | — | — | ||||||||
Gain (loss) from sale of discontinued operations | — | — | — | ||||||||
Net income (loss) attributable to HC2 Holdings, Inc. | $ | 0.62 | $ | (0.02 | ) | $ | 0.60 | ||||
F-19
2. SUMMARY OF SIGNIFICANT ACCOUNTING POLICIES
Principles of Consolidation—The consolidated financial statements include the accounts of the Company, its wholly owned subsidiaries and all other subsidiaries over which the Company exerts control. All intercompany profits, transactions and balances have been eliminated in consolidation. As of December 31, 2014, the Company has a 97% interest in GMSL, a 91% interest in Schuff, a 51% interest in ANG and a 100% interest in DMi. Through its subsidiary, Pansend, the Company has an 80% interest in Genovel Orthopedics, Inc. and a 61% interest in GemDerm Aesthetics, Inc. The results of each of these entities are consolidated with the Company’s results from and after their respective acquisition dates based on guidance from the Financial Accounting Standards Board (“FASB”) Accounting Standards Codification (“ASC”) No. 810, “Consolidation” (“ASC 810”). The remaining interests not owned by the Company are presented as a noncontrolling interest component of total equity. Schuff uses a 4-4-5 week quarterly cycle, which for the fiscal year of 2014 ended on December 28, 2014.
Redeemable Noncontrolling Interest—The GMSL noncontrolling interest includes a put right which allows the holder to require the Company to purchase their interests in cash on a determinable date outside the control of the Company. The redeemable noncontrolling interests was initially recorded at fair value and will be subsequently remeasured each reporting period to reflect the redemption value (fair market value) with changes recorded against retained earnings.
Discontinued Operations—In the second quarter of 2013, the Company sold its BLACKIRON Data segment and reiterated its June 2012 commitment to dispose of ICS. In addition, in the second quarter of 2013,the Company entered into a definitive purchase agreement to sell its North America Telecom business and sought shareholder approval of such transaction. The Company completed the initial closing of the sale of its North America Telecom business on July 31, 2013 and completed the divestiture of the remainder of its North America Telecom business on July 31, 2014 (see Note 20—“Discontinued Operations”). In conjunction with the initial closing of the sale of the North America Telecom business, the Company redeemed its outstanding debt issued by PTGi International Holding, Inc. (f/k/a Primus Telecommunications Holding, Inc., “PTHI”) on August 30, 2013. Because the debt was required to be repaid as a result of the sale of North America Telecom, the interest expense and loss on early extinguishment or restructuring of debt of PTHI. has been allocated to discontinued operations. In December 2013, based on management’s assessment of the requirements under ASC No. 360, “Property, Plant and Equipment” (“ASC 360”), it was determined that ICS no longer met the criteria of a held for sale asset. On February 11, 2014, the Board of Directors officially ratified management’s December 31 assessment, and reclassified ICS from held for sale to held and used, effective December 31, 2013.
Presentation of Taxes Collected—The Company reports any tax assessed by a governmental authority that is directly imposed on a revenue-producing transaction between the Company and a customer (including sales, use, value-added and some excise taxes) on a net basis (excluded from revenues).
Foreign Currency Transactions—Foreign currency transactions are transactions denominated in a currency other than a subsidiary’s functional currency. A change in the exchange rates between a subsidiary’s functional currency and the currency in which a transaction is denominated increases or decreases the expected amount of functional currency cash flows upon settlement of the transaction. That increase or decrease in expected functional currency cash flows is reported by the Company as a foreign currency transaction gain (loss). The primary component of the Company’s foreign currency transaction gain (loss) is due to agreements in place with certain subsidiaries in foreign countries regarding intercompany transactions. The Company anticipates repayment of these transactions in the foreseeable future, and recognizes the realized and unrealized gains or losses on these transactions that result from foreign currency changes in the period in which they occur as foreign currency transaction gain (loss).
Foreign Currency Translation—The assets and liabilities of the Company’s foreign subsidiaries are translated at the exchange rates in effect on the reporting date. Income and expenses are translated at the average exchange rate during the period. The net effect of such translation gains and losses are reflected within accumulated other comprehensive income (loss) in the stockholders’ equity section of the consolidated balance sheets.
Cash and Cash Equivalents—Cash and cash equivalents are comprised principally of amounts in money market accounts, operating accounts, certificates of deposit, and overnight repurchase agreements with original maturities of three months or less.
Accounts Receivable—Accounts receivable is stated at amounts due from customers net of an allowance for doubtful accounts. Our allowance for doubtful accounts considers historical experience, the age of certain receivable balances, credit history, current economic conditions and other factors that may affect the counterparty’s ability to pay.
F-20
Inventories
Schuff—Inventories, primarily steel components, are stated at the lower of cost or market under the first-in, first-out method.
GMSL—Inventory is valued at the lower of cost or market value under the first-in first-out method. Provision for obsolescence is made where appropriate and is charged to cost of revenue in the consolidated statements of operations. Short-term work in progress on contracts is stated at cost less foreseeable losses. These costs include only direct labor and expenses incurred to date and exclude any allocation of overhead. The policy for long-term work in progress contracts is disclosed within the Revenue and Cost Recognition accounting policy for GMSL.
Short-term Investments—The current investments are classified as available-for-sale securities and the change in value is recognized within accumulated other comprehensive income (loss).
Long-term Investments—Investments in non-wholly-owned companies are generally consolidated if the Company's interest exceeds 50% or if the Company has the power to direct the economic activities of the entity and the obligation to absorb losses, or accounted for under the equity method of accounting when the Company exercises significant influence over the venture.
Under the equity method of accounting, the Company records its proportionate interest in the underlying income or loss of the equity method investee. Additional investments made or distributions received are recorded as increases and decreases, respectively, to the carrying value of the equity method investment. Equity method investments are evaluated for potential impairment as circumstances warrant and an impairment charge is recorded when an impairment is deemed to be other-than-temporary.
When the Company’s investment in an equity method investee is greater than its proportionate share of the underlying net assets of that investee, a basis difference is created under ASC No. 323, “Investments—Equity Method and Joint Ventures” (“ASC 323”). When this situation occurs, the Company is required to determine the acquisition date fair value of the identifiable assets and assumed liabilities in the same manner as for a business combination under ASC No. 805, “Business Combinations” (“ASC 805”). If the basis difference is assigned to amortizable assets, it is amortized (net of tax) against the Company’s investment in the equity method investee.
Accounting for Income Taxes—We recognize deferred tax assets and liabilities for the expected future tax consequences of transactions and events. Under this method, deferred tax assets and liabilities are determined based on the difference between the financial statement bases and the tax bases of assets and liabilities using enacted tax rates in effect for the year in which the differences are expected to reverse. If necessary, deferred tax assets are reduced by a valuation allowance to an amount that is determined to be more likely than not recoverable. We must make significant estimates and assumptions about future taxable income and future tax consequences when determining the amount of the valuation allowance. The additional guidance provided by ASC No. 740, “Income Taxes” (“ASC 740”), clarifies the accounting for uncertainty in income taxes recognized in the financial statements. Expected outcomes of current or anticipated tax examinations, refund claims and tax-related litigation and estimates regarding additional tax liability (including interest and penalties thereon) or refunds resulting therefrom will be recorded based on the guidance provided by ASC 740 to the extent applicable.
At present, our U.S. and foreign companies have significant deferred tax assets resulting from tax loss carryforwards. The foreign deferred tax assets with minor exceptions are fully offset with valuation allowances. The appropriateness and amount of these valuation allowances are based on our assumptions about the future taxable income of each affiliate. If our assumptions have significantly underestimated future taxable income with respect to a particular affiliate, all or part of the valuation allowance for the affiliate would be reversed and additional income could result. The valuation allowances for the U.S. NOL deferred tax assets were released in 2014.
Deferred Financing Costs—The Company capitalizes certain expenses incurred in connection with its long-term debt and line of credit obligations and amortizes them over the term of the respective debt agreement. The amortization expense of the deferred financing costs is included in interest expense on the consolidated statements of operations. If the Company extinguishes portions of its long-term debt prior to the maturity date, deferred financing costs are charged to expense on a pro rata basis and are included in loss on early extinguishment or restructuring of debt on the consolidated statements of operations. Deferred financing costs are included in other assets on the consolidated balance sheets.
Property, Plant and Equipment—Property, plant and equipment are stated at cost less accumulated depreciation, which is provided on the straight-line method over the estimated useful lives of the assets. Cost includes major expenditures for
F-21
improvements and replacements which extend useful lives or increase capacity of the assets as well as expenditures necessary to place assets into readiness for use. Cost includes the original purchase price of the asset and the costs attributable to bringing the asset to its working condition for its intended use. Cost includes finance costs incurred prior to the asset being available for use. Expenditures for maintenance and repairs are expensed as incurred. Depreciation is determined on a straight-line basis over the estimated useful lives of the assets, which range from 15 to 40 years for buildings and improvements, up to 35 years for cable-ships and submersibles, 3 to 15 years for machinery and equipment, and 3 to 20 years for plant and motor vehicles. Plant includes equipment on the cable-ships that is portable and can be moved around the fleet and computer equipment. Leasehold improvements are amortized over the lives of the leases or estimated useful lives of the assets, whichever is shorter. Assets under construction are not depreciated until they are complete and available for use. Costs for internal use software that are incurred in the preliminary project stage and in the post-implementation stage are expensed as incurred. Costs incurred during the application development stage are capitalized and amortized over the estimated useful life of the software. When assets are sold or otherwise retired, the costs and accumulated depreciation are removed from the books and the resulting gain or loss is included in operating results. Property, plant and equipment that have been included as part of the assets held for sale are no longer depreciated from the time that they are classified as such. The Company periodically evaluates the carrying value of its property, plant and equipment based upon the estimated cash flows to be generated by the related assets. If impairment is indicated, a loss is recognized.
Goodwill and Other Intangible Assets—Under ASC No. 350, “Intangibles—Goodwill and Other” (“ASC 350”), goodwill and indefinite lived intangible assets are not amortized but are reviewed annually for impairment, or more frequently, if impairment indicators arise. Intangible assets that have finite lives are amortized over their estimated useful lives and are subject to the provisions of ASC 360.
Goodwill impairment is tested at least annually (October 1st) or when factors indicate potential impairment using a two-step process that begins with an estimation of the fair value of each reporting unit. Step 1 is a screen for potential impairment pursuant to which the estimated fair value of each reporting unit is compared to its carrying value. The Company estimates the fair values of each reporting unit by an estimation of the discounted cash flows of each of the reporting units based on projected earnings in the future (the income approach). If there is a deficiency (the estimated fair value of a reporting unit is less than its carrying value), a Step 2 test is required.
Step 2 measures the amount of impairment loss, if any, by comparing the implied fair value of the reporting unit’s goodwill with its carrying amount. The implied fair value of goodwill is determined in the same manner as the amount of goodwill recognized in a business combination is determined; i.e., through an allocation of the fair value of a reporting unit to all of the assets and liabilities of that unit as if the reporting unit had been acquired in a business combination. If the carrying amount of the reporting unit goodwill exceeds the implied fair value of that goodwill, an impairment loss shall be recognized in an amount equal to that excess.
The Company also may utilize the provisions of Accounting Standards Update (“ASU”) No. 2011-8, “Testing Goodwill for Impairment” (“ASU 2011-8”), which allows the Company to use qualitative factors to determine whether the existence of events or circumstances leads to a determination that it is more likely than not that the fair value of a reporting unit is less than its carrying amount.
Subsequent to classifying ICS as a discontinued operation in the second quarter of 2012 and its goodwill being classified as a held for sale asset, the reporting units were Canada and US. Subsequent to the sale of North America Telecom (which included the Canada reporting unit) in the third quarter of 2013, the Company had no goodwill attributable to the remaining US reporting unit. The US reporting unit goodwill was attributable to PTI, the unsold portion of North America Telecom, and was included in assets held for sale. As a result of the decision to cease the sale process of ICS as of December 31, 2013, ICS became a reporting unit and its goodwill was reclassified as a held and used asset. With the acquisition of Schuff it became its own reporting unit in May 2014 and was subject to annual testing for impairment on October 1st.
Estimating the fair value of a reporting unit requires various assumptions including projections of future cash flows, perpetual growth rates and discount rates. The assumptions about future cash flows and growth rates are based on the Company’s assessment of a number of factors, including the reporting unit’s recent performance against budget, performance in the market that the reporting unit serves, and industry and general economic data from third party sources. Discount rate assumptions are based on an assessment of the risk inherent in those future cash flows. Changes to the underlying businesses could affect the future cash flows, which in turn could affect the fair value of the reporting unit.
F-22
Intangible assets subject to amortization consists of certain trade names, customer contracts and developed technology. These finite lived intangible assets are amortized based on their estimated useful lives. Such assets are subject to the impairment provisions of ASC 360, wherein impairment is recognized and measured only if there are events and circumstances that indicate that the carrying amount may not be recoverable. The carrying amount is not recoverable if it exceeds the sum of the undiscounted cash flows expected to result from the use of the asset group. An impairment loss is recorded if after determining that it is not recoverable, the carrying amount exceeds the fair value of the asset.
In addition to the foregoing, the Company reviews its goodwill and intangible assets for possible impairment whenever events or circumstances indicate that the carrying amounts of assets may not be recoverable. The factors that the Company considers important, and which could trigger an impairment review, include, but are not limited to: a more likely than not expectation of selling or disposing all, or a portion, of a reporting unit; a significant decline in the market value of our common stock or debt securities for a sustained period; a material adverse change in economic, financial market, industry or sector trends; a material failure to achieve operating results relative to historical levels or projected future levels; and significant changes in operations or business strategy.
Valuation of Long-lived Assets—The Company reviews long-lived assets whenever events or changes indicate that the carrying amount of an asset may not be recoverable. In making such evaluations, the Company compares the expected undiscounted future cash flows to the carrying amount of the assets. If the total of the expected undiscounted future cash flows is less than the carrying amount of the assets, the Company is required to make estimates of the fair value of the long-lived assets in order to calculate the impairment loss equal to the difference between the fair value and carrying value of the assets.
The Company makes significant assumptions and estimates in this process regarding matters that are inherently uncertain, such as determining asset groups and estimating future cash flows, remaining useful lives, discount rates and growth rates. The resulting undiscounted cash flows are projected over an extended period of time, which subjects those assumptions and estimates to an even larger degree of uncertainty. While the Company believes that its estimates are reasonable, different assumptions could materially affect the valuation of the long-lived assets. The Company derives future cash flow estimates from its historical experience and its internal business plans, which include consideration of industry trends, competitive actions, technology changes, regulatory actions, available financial resources for marketing and capital expenditures and changes in its underlying cost structure.
The Company makes assumptions about the remaining useful life of its long-lived assets. The assumptions are based on the average life of its historical capital asset additions and its historical asset purchase trend. In some cases, due to the nature of a particular industry in which the company operates, the Company may assume that technology changes in such industry render all associated assets, including equipment, obsolete with no salvage value after their useful lives. In certain circumstances in which the underlying assets could be leased for an additional period of time or salvaged, the Company includes such estimated cash flows in its estimate.
The estimate of the appropriate discount rate to be used to apply the present value technique in determining fair value was the Company’s weighted average cost of capital which is based on the effective rate of its long-term debt obligations at the current market values (for periods during which the Company had long-term debt obligations) as well as the current volatility and trading value of the Company’s common stock.
Use of Estimates—The preparation of consolidated financial statements in conformity with U.S. GAAP requires management to make estimates and assumptions. These estimates and assumptions affect the reported amounts of assets and liabilities and disclosures of contingent assets and liabilities at the date of the consolidated financial statements and the reported amounts of net revenue and expenses during the reporting period. Actual results may differ from these estimates. Significant estimates include allowance for doubtful accounts receivable, the extent of progress towards completion on contracts, contract revenue and costs on long-term contracts, market assumptions used in estimating the fair values of certain assets and liabilities, the calculation used in determining the fair value of HC2’s stock options required by ASC No. 718, “Compensation—Stock Compensation” (“ASC 718”), income taxes and various other contingencies.
Estimates of fair value represent the Company’s best estimates developed with the assistance of independent appraisals or various valuation techniques and, where the foregoing have not yet been completed or are not available, industry data and trends and by reference to relevant market rates and transactions. The estimates and assumptions are inherently subject to significant uncertainties and contingencies beyond the control of the Company. Accordingly, the Company cannot provide assurance that the estimates, assumptions, and values reflected in the valuations will be realized, and actual results could vary materially.
F-23
Revenue and Cost Recognition
GMSL—GMSL generates revenue by providing maintenance services for subsea telecommunications cabling. GMSL also generates revenues from the design and installation of subsea cables under contracts. GMSL also provides installation, maintenance and repair of fiber optic communication and power infrastructure to offshore oil and gas platforms and installs inter-array power cables for use in offshore wind farms and in the offshore wind market.
Telecommunication/Maintenance—GMSL provides vessels on standby to repair fiber optic telecommunications cables in defined geographic zones, and its maintenance business is provided through contracts with consortia of up to 60 global telecommunications providers. Typically, GMSL enters into five to seven years contracts to provide maintenance to cable systems that are located in specific geographical areas. Revenue from these maintenance agreements is recognized on a straight line basis unless the pattern of costs associated with repairs indicates otherwise.
Telecommunications/Installation—GMSL provides installation of cable systems including route planning, mapping, route engineering, cable laying, and trenching and burial. GMSL’s installation business is project-based with fixed price contracts typically lasting one to five months. Revenue is recognized as time and costs are incurred.
Charter hire—rentals from short term operating leases in respect of vessels are recognized as revenue on a straight line basis over the term of the lease.
Oil & Gas—GMSL provides installation, maintenance and repair of fiber optic communication and power infrastructure to offshore platforms. Its primary activities include providing power from shore, enabling fiber-based communication between platforms and shore-based systems and installing permanent reservoir monitoring systems which allow customers to monitor subsea seismic data. The majority of GMSL’s oil & gas business is contracted on a project-by-project basis with major energy producers or tier I engineering, procurement and construction (EPC) contractors. Revenue is recognized as time and costs are incurred.
A loss is recognized immediately if the expected costs during any contract exceed expected revenues. Amounts billed in advance of revenue recognition are recorded as deferred revenue.
Schuff—Schuff performs its services primarily under fixed-price contracts and recognizes revenues and costs from construction projects using the percentage of completion method. Under this method, revenue is recognized based upon either the ratio of the costs incurred to date to the total estimated costs to complete the project or the ratio of tons fabricated to date to total estimated tons. Revenue recognition begins when work has commenced. Costs include all direct material and labor costs related to contract performance, subcontractor costs, indirect labor, and fabrication plant overhead costs, which are charged to contract costs as incurred. Revenues relating to changes in the scope of a contract are recognized when the work has commenced, Schuff has made an estimate of the amount that is probable of being paid for the change and there is a high degree of probability that the charges will be approved by the customer or general contractor. At December 31, 2014, Schuff had $53.9 million of unapproved change orders on open projects, for which it has recognized revenues on a percentage of completion basis. While Schuff has been successful in having the majority of its change orders approved in prior years, there is no guarantee that the unapproved change orders at December 31, 2014 will be approved. Revisions in estimates during the course of contract work are reflected in the accounting period in which the facts requiring the revision become known. Provisions for estimated losses on uncompleted contracts are made in the period a loss on a contract becomes determinable.
Construction contracts with customers generally provide that billings are to be made monthly in amounts which are commensurate with the extent of performance under the contracts. Contract receivables arise principally from the balance of amounts due on progress billings on jobs under construction. Retentions on contract receivables are amounts due on progress billings, which are withheld until the completed project has been accepted by the customer.
Costs and recognized earnings in excess of billings on uncompleted contracts primarily represent revenue earned under the percentage of completion method which has not been billed. Billings in excess of related costs and recognized earnings on uncompleted contracts represent amounts billed on contracts in excess of the revenue allowed to be recognized under the percentage of completion method on those contracts.
ICS—Net revenue is derived from carrying a mix of business, residential and carrier long-distance traffic, data and Internet traffic. For certain voice services, net revenue is earned based on the number of minutes during a call, and is recorded upon completion of a call. Revenue for a period is calculated from information received through the Company’s network switches.
F-24
Customized software has been designed to track the information from the switch and analyze the call detail records against stored detailed information about revenue rates. This software provides the Company the ability to do a timely and accurate analysis of revenue earned in a period. Separate prepaid services software is used to track additional information related to prepaid service usage such as activation date, monthly usage amounts and expiration date. Revenue on these prepaid services is recognized as service is provided until expiration, when all unused minutes, which are no longer available to the customers, are recognized as revenue. Net revenue is also earned on a fixed monthly fee basis for unlimited local and long-distance voice plans and for the provision of data/Internet services (including retail VoIP), hosting, and colocation. In the United States, we charge customers Federal Universal Service Fund (“USF”) fees. We recognize revenue on a gross basis for USF and related fees. We record these fees as revenue when billed. Net revenue represents gross revenue, net of allowance for doubtful accounts receivable, service credits and service adjustments. Cost of revenue includes network costs that consist of access, transport and termination costs. The majority of the Company’s cost of revenue is variable, primarily based upon minutes of use, with transmission and termination costs being the most significant expense. Cost of revenue also includes fees such as Federal USF fees. Such costs are recognized when incurred in connection with the provision of telecommunications services.
Pensions—GMSL operates various pension schemes comprising both defined benefit plans and defined contribution plans. GMSL also makes contributions on behalf of employees who are members of the Merchant Navy Officers Pension Fund (“MNOPF”).
For the defined benefit plans and the MNOPF plan, the amounts charged to income (loss) from operations are the current service costs and the gains and losses on settlements and curtailments. These are included as part of staff costs. Past service costs are recognized immediately if the benefits have vested. If the benefits have not vested immediately, the costs are recognized over the period vesting occurs. The interest costs and expected return of assets are shown as a net amount and included in interest income and other income (expense). Actuarial gains and losses are recognized immediately in the consolidated statements of operations.
Defined benefit plans are funded with the assets of the plan held separately from those of GMSL, in separate trustee administered funds. Pension plan assets are measured at fair value and liabilities are measured on an actuarial basis using the projected unit method discounted at a rate of equivalent currency and term to the plan liabilities. The actuarial valuations are obtained annually.
For the defined contribution plans, the amount charged to income (loss) from operations in respect of pension costs is the contributions payable in the period. Differences between contributions payable in the period and contributions actually paid are shown as either accruals or prepayments in the consolidated balance sheets.
Share-Based Compensation—The Company accounts for share-based compensation under ASC No. 718, “Compensation—Stock Compensation” (“ASC 718”), which addresses the accounting for share-based payment transactions whereby an entity receives employee services in exchange for equity instruments, including stock options and restricted stock units. ASC 718 generally requires that share-based compensation be accounted for using a fair-value based method. The Company records share-based compensation expense for all new and unvested stock options that are ultimately expected to vest as the requisite service is rendered. The Company issues new shares of common stock upon the exercise of stock options.
The Company elected to adopt the alternative transition method for calculating the tax effects of share-based compensation. The alternative transition method includes simplified methods to determine the beginning balance of the APIC pool related to the tax effects of share-based compensation and to determine the subsequent impact on the APIC pool and the statement of cash flows of the tax effects of share-based awards that were fully vested and outstanding upon the adoption of ASC 718.
The Company uses a Black-Scholes option valuation model to determine the fair value of share-based compensation under ASC 718. The Black-Scholes model incorporates various assumptions including the expected term of awards, volatility of stock price, risk-free rates of return and dividend yield. The expected term of an award is no less than the option vesting period and is based on the Company’s historical experience. Expected volatility is based upon the historical volatility of the Company’s stock price. The risk-free interest rate is approximated using rates available on U.S. Treasury securities with a remaining term similar to the option’s expected life. The Company uses a dividend yield of zero in the Black-Scholes option valuation model as it does not anticipate paying cash dividends in the foreseeable future that do not contain antidilution provisions requiring the adjustment of exercise prices and option shares. Share-based compensation is recorded net of expected forfeitures.
F-25
Concentration of Credit Risk—Financial instruments that potentially subject the Company to concentration of credit risk principally consist of trade accounts receivable. The Company performs ongoing credit evaluations of its customers but generally does not require collateral to support customer receivables. The Company maintains its cash with high quality credit institutions, and its cash equivalents are in high quality securities.
Income (Loss) Per Common Share—Basic income (loss) per common share is computed using the weighted average number of shares of common stock outstanding during the period. Diluted income (loss) per common share is computed using the weighted average number of shares of common stock, adjusted for the dilutive effect of potential common stock and related income from continuing operations, net of tax. Potential common stock, computed using the treasury stock method or the if-converted method, includes options, restricted stock, restricted stock units and convertible preferred stock.
In periods when the Company generates income, the Company calculates basic earnings per share using the two-class method, pursuant to ASC No. 260, “Earnings Per Share.” The two-class method is required as the shares of the Company’s Preferred Stock qualify as participating securities, having the right to receive dividends should dividends be declared on common stock. Under this method, earnings for the period are allocated on a pro-rata basis to the common stockholders and to the holders of preferred stock based on the weighted average number of common shares outstanding and the number of shares that could be converted. The Company does not use the two-class method in periods when it generates a loss as the holders of the Preferred Stock do not participate in losses.
Reclassification —Certain previous year amounts have been reclassified to conform with current year presentations, as related to the reporting of new balance sheet line items.
Newly Adopted Accounting Principles
In July 2013, an update was issued to the Income Taxes Topic No. 740, ASU 2013-11, “Presentation of an Unrecognized Tax Benefit When a Net Operating Loss Carryforward, a Similar Tax Loss, or a Tax Credit Carryforward Exists,” which indicates that an unrecognized tax benefit, or a portion of an unrecognized tax benefit, should be presented in the financial statements as a reduction to a deferred tax asset for a net operating loss carryforward, a similar tax loss, or a tax credit carryforward, except as follows. To the extent a net operating loss carryforward, a similar tax loss, or a tax credit carryforward is not available at the reporting date under the tax law of the applicable jurisdiction to settle any additional income taxes that would result from the disallowance of a tax position or the tax law of the applicable jurisdiction does not require the entity to use, and the entity does not intend to use, the deferred tax asset for such purpose, the unrecognized tax benefit should be presented in the financial statements as a liability and should not be combined with deferred tax assets. The assessment of whether a deferred tax asset is available is based on the unrecognized tax benefit and deferred tax asset that exist at the reporting date and should be made presuming disallowance of the tax position at the reporting date. Early adoption is permitted and this accounting update should be applied prospectively from the beginning of the fiscal year of adoption. On January 1, 2014, the Company adopted this update, which did not have a material impact on the consolidated financial statements.
In March 2013, an update was issued to the Foreign Currency Matters Topic No. 830, ASU 2013-5, “Parent’s Accounting for the Cumulative Translation Adjustment upon Derecognition of Certain Subsidiaries or Groups of Assets within a Foreign Entity or of an Investment in a Foreign Entity,” which indicates that the entire amount of a cumulative translation adjustment related to an entity’s investment in a foreign entity should be released when there has been a (1) sale of a subsidiary or group of net assets within a foreign entity and the sale represents the substantially complete liquidation of the investment in the foreign entity; (2) loss of a controlling financial interest in an investment in a foreign entity; or (3) step acquisition for a foreign entity. Early adoption is permitted and this accounting update should be applied prospectively from the beginning of the fiscal year of adoption. On January 1, 2014, the Company adopted this update, which did not have a material impact on the consolidated financial statements.
In February 2013, an update was issued to the Liabilities Topic No. 405, ASU 2013-4, “Obligations Resulting from Joint and Several Liability Arrangements for Which the Total Amount of the Obligation is Fixed at the Reporting Date,” which indicates reporting entities are required to measure obligations resulting from certain joint and several liability arrangements where the total amount of the obligation is fixed as of the reporting date, as the sum of the amount the reporting entity agreed to pay on the basis of its arrangement among co-obligors and any additional amounts the reporting entity expects to pay on behalf of its co-obligors. On January 1, 2014, the Company adopted this update, which did not have a material impact on the consolidated financial statements.
New Accounting Pronouncements
F-26
In August 2014, the FASB issued ASU 2014-15, Presentation of Financial Statements—Going Concern (Subtopic 205-40). This ASU is applicable to all companies, public and private, unless they have adopted the liquidation basis of accounting under Subtopic 205-30. It defines when and how companies are required to disclose going concern uncertainties, which must be evaluated each interim and annual period. Specifically, it requires management to determine whether substantial doubt exists regarding the entity’s going concern presumption. Substantial doubt about an entity’s ability to continue as a going concern exists when relevant conditions and events, considered in the aggregate, indicate that it is probable that the entity will be unable to meet its obligations as they become due within one year after the date that the financial statements are issued (or available to be issued). If substantial doubt exists, certain disclosures are required; the extent of those disclosures depends on an evaluation of management’s plans (if any) to mitigate the going concern uncertainty. The Company’s effective date for adoption is January 1, 2017. The Company does not expect this accounting update to have a material effect on its consolidated financial statements in future periods, although that could change.
In June 2014, the FASB issued ASU 2014–12, “Compensation—Stock Compensation (Topic 718): Accounting for Share-Based Payments When the Terms of an Award Provide That a Performance Target Could Be Achieved after the Requisite Service Period (a consensus of the FASB Emerging Issues Task Force),” in response to the EITF consensus on Issue 13-D. The ASU clarifies that entities should treat performance targets that can be met after the requisite service period of a share-based payment award as performance conditions that affect vesting. Therefore, an entity would not record compensation expense (measured as of the grant date without taking into account the effect of the performance target) related to an award for which transfer to the employee is contingent on the entity’s satisfaction of a performance target until it becomes probable that the performance target will be met. The ASU does not contain any new disclosure requirements. Early adoption is permitted. The Company’s effective date for adoption is January 1, 2016. The Company does not expect this accounting update to have a material effect on its consolidated financial statements in future periods, although that could change.
In June 2014, an update was issued to the Development Stage Entities Topic No. 915, ASU 2014-10, “Elimination of Certain Financial Reporting Requirements, Including an Amendment to Variable Interest Entities Guidance in Topic 810, Consolidation. The amendments in ASU 2014-10 eliminate an exception provided to development stage entities in Topic 810, Consolidation, for determining whether an entity is a variable interest entity on the basis of the amount of investment equity that is at risk. The amendments to eliminate that exception simplify U.S. GAAP by reducing avoidable complexity in existing accounting literature and improve the relevance of information provided to financial statement users by requiring the application of the same consolidation guidance by all reporting entities. The elimination of the exception may change the consolidation analysis, consolidation decision, and disclosure requirements for a reporting entity that has an interest in an entity in the development stage. For public business entities, the amendment eliminating the exception to the sufficiency-of-equity-at-risk criterion for development stage entities in paragraph 4 810-10-15-16 should be applied retrospectively for annual reporting periods beginning after December 15, 2015, and interim periods therein. For all other entities, the amendments to Topic 810 should be applied retrospectively for annual reporting periods beginning after December 15, 2016, and interim reporting periods beginning after December 15, 2017. The Company does not expect this accounting update to have a material effect on its consolidated financial statements in future period, although that could change.
In May 2014, the FASB and IASB issued their final standard on revenue from contracts with customers. The standard, issued as ASU 2014-9, “Revenue from Contracts with Customers (Topic 606),” by the FASB and as IFRS 15by the IASB, outlines a single comprehensive model for entities to use in accounting for revenue arising from contracts with customers and supersedes most current revenue recognition guidance, including industry-specific guidance. The core principle of the revenue model is that “an entity recognizes revenue to depict the transfer of promised goods or services to customers in an amount that reflects the consideration to which the entity expects to be entitled in exchange for those goods or services.” In applying the revenue model to contracts within its scope, an entity:
Identifies the contract(s) with a customer (step 1).
• | Identifies the performance obligations in the contract (step 2). |
• | Determines the transaction price (step 3). |
• | Allocates the transaction price to the performance obligations in the contract (step 4). |
• | Recognizes revenue when (or as) the entity satisfies a performance obligation (step 5). |
The ASU applies to all contracts with customers except those that are within the scope of other topics in the FASB Accounting Standards Codification. Certain of the ASU’s provisions also apply to transfers of nonfinancial assets, including in-substance nonfinancial assets that are not an output of an entity’s ordinary activities (e.g., sales of (1) property, plant, and equipment; (2) real estate; or (3) intangible assets). Existing accounting guidance applicable to these transfers (e.g., ASC 360-20) has been amended or superseded. Compared with current U.S. GAAP, the ASU also requires significantly expanded disclosures about revenue
F-27
recognition. The standard is effective for annual periods beginning after December 15, 2016, and interim periods therein, using either of the following transition methods: (i) a full retrospective approach reflecting the application of the standard in each prior reporting period with the option to elect certain practical expedients, or (ii) a retrospective approach with the cumulative effect of initially adopting ASU 2014-9 recognized disclosures. We are currently evaluating the impact of our pending adoption of ASU 2014-9 on our consolidated financial statements and have not yet determined the method by which we will adopt the standard in 2017.
In April 2014, an update was issued to the Presentation of Financial Statements Topic No. 205 and Property, Plant and Equipment Topic No. 360, ASU 2014-8, “Reporting Discontinued Operations and Disclosures of Disposals of Components of an Entity”, which changes the criteria for reporting discontinued operations. The ASU revises the definition of a discontinued operation and expands the disclosure requirements. Entities should not apply the amendments to a component of an entity that is classified as held for sale before the effective date even if it is disposed of after the effective date. That is, the ASU must be adopted prospectively. Early adoption is permitted, but only for disposals (or classifications as held for sale) that have not been previously reported in the financial statements. The Company’s effective date for adoption is January 1, 2015. The Company does not expect this accounting update to have a material effect on its consolidated financial statements in future periods, although that could change.
3. ACCOUNTS RECEIVABLE AND CONTRACTS IN PROGRESS
Accounts receivable consist of the following (in thousands):
December 31, | |||||||
2014 (As Restated) | 2013 | ||||||
Contract receivables: | |||||||
Contracts in progress | $ | 112,929 | $ | — | |||
Unbilled retentions | 32,850 | — | |||||
Trade receivables | 9,065 | 21,456 | |||||
Other receivables | 195 | — | |||||
Allowance for doubtful accounts | (2,760 | ) | (2,476 | ) | |||
$ | 152,279 | $ | 18,980 | ||||
Costs and recognized earnings in excess of billings on uncompleted contracts and billings in excess of costs and recognized earnings on uncompleted contracts consist of the following:
December 31, | |||||||
2014 | 2013 | ||||||
Costs incurred on contracts in progress | $ | 531,129 | $ | — | |||
Estimated earnings | 73,540 | — | |||||
604,669 | — | ||||||
Less: progress billings | 618,530 | — | |||||
$ | (13,861 | ) | $ | — | |||
The above is included in the accompanying consolidated balance sheet under the following captions: | |||||||
Costs and recognized earnings in excess of billings on uncompleted contracts | 28,098 | — | |||||
Billings in excess of costs and recognized earnings on uncompleted contracts | (41,959 | ) | — | ||||
$ | (13,861 | ) | $ | — | |||
4. INVENTORIES
Inventories consist of the following (in thousands):
F-28
December 31, | |||||||
2014 | 2013 | ||||||
Raw materials | $ | 12,956 | $ | — | |||
Work in process | 1,779 | — | |||||
Finished goods | 240 | — | |||||
$ | 14,975 | $ | — | ||||
5. BUSINESS COMBINATIONS
The Company’s acquisitions were accounted for using the acquisition method of accounting which requires, among other things, that assets acquired and liabilities assumed be recognized at their estimated fair values as of the acquisition date. Estimates of fair value included in the consolidated financial statements, in conformity with ASC No. 820, “Fair Value Measurements and Disclosures” (“ASC 820”), represent the Company’s best estimates and valuations developed with the assistance of independent appraisers and, where such valuations have not yet been completed or are not available, industry data and trends and by reference to relevant market rates and transactions. The following estimates and assumptions are inherently subject to significant uncertainties and contingencies beyond the control of the Company. Accordingly, the Company cannot provide assurance that the estimates, assumptions, and values reflected in the valuations will be realized, and actual results could vary materially.
Any changes to the initial estimates of the fair value of the assets and liabilities will be recorded as adjustments to those assets and liabilities and residual amounts will be allocated to goodwill. In accordance with ASC 805, if additional information is obtained about these assets and liabilities within the measurement period (not to exceed one year from the date of acquisition), including finalization of asset appraisals, the Company will refine its estimates of fair value to allocate the purchase price more accurately.
Schuff
On May 29, 2014, the Company completed the acquisition of 2.5 million shares of common stock of Schuff, a steel fabrication and erection company and negotiated an agreement to purchase an additional 198,411 shares, representing an approximately 65% interest in Schuff. Schuff repurchased a portion of its outstanding common stock in June 2014, which had the effect of increasing the Company’s ownership interest to 70%. During the fourth quarter, the final results of a tender offer for all outstanding shares of Schuff were announced and various open-market purchases were made, which resulted in the acquisition of 809,043 shares and an increase in our ownership interest to 91%. We intend to execute a short-form merger, which will increase our ownership of Schuff shares to 100%. Schuff and its wholly-owned subsidiaries primarily operate as integrated fabricators and erectors of structural steel and heavy steel plates with headquarters in Phoenix, Arizona and operations in Arizona, Georgia, Texas, Kansas and California. Schuff’s construction projects are primarily in the aforementioned states. In addition, Schuff has construction projects in select international markets, primarily Panama. The Company acquired Schuff to diversify its portfolio of holdings and saw Schuff as an opportunity to enter the steel fabrication and erection market.
The table below summarizes the estimates of fair value of the Schuff assets acquired and liabilities assumed as of the acquisition date. The Company purchased 2.5 million shares of common stock of Schuff for $78.75 million. The purchase price of Schuff was valued at $31.50 per share which represented both the cash paid by the Company for its 60% interest, and the fair value of the noncontrolling interest of 40%.
F-29
The preliminary purchase price allocation is as follows (in thousands):
Cash and cash equivalents | $ | (627 | ) |
Investments | 1,714 | ||
Accounts receivable | 130,622 | ||
Costs and recognized earnings in excess of billings on uncompleted contracts | 27,126 | ||
Prepaid expenses and other current assets | 3,079 | ||
Inventories | 14,487 | ||
Assets held for sale | — | ||
Property and equipment, net | 85,662 | ||
Goodwill | 24,612 | ||
Trade names | 4,478 | ||
Other assets | 2,947 | ||
Total assets acquired | 294,100 | ||
Accounts payable | 37,621 | ||
Accrued payroll and employee benefits | 11,668 | ||
Accrued expenses and other current liabilities | 12,532 | ||
Billings in excess of costs and recognized earnings on uncompleted contracts | 65,985 | ||
Accrued income taxes | 1,202 | ||
Accrued interest | 76 | ||
Current portion of long-term debt | 15,460 | ||
Liabilities held for sale | — | ||
Long-term debt | 4,375 | ||
Deferred tax liability | 7,815 | ||
Other liabilities | 604 | ||
Noncontrolling interest | 4,365 | ||
Total liabilities assumed | 161,703 | ||
Enterprise value | 132,397 | ||
Less fair value of noncontrolling interest | 53,647 | ||
Purchase price attributable to controlling interest | $ | 78,750 | |
The acquisition of Schuff resulted in goodwill of approximately $24.6 million. Goodwill was the excess of the consideration transferred over the net assets recognized and represents the future economic benefits arising from other assets acquired that could not be individually identified and separately recognized. Goodwill was recognized as a new stand-alone reporting unit. Goodwill is not amortized and is not deductible for tax purposes.
The acquired amortizable intangible assets and the related estimated useful lives consist of the following (in thousands):
Useful Lives | Value May 29, 2014 | |||
Trade names | 15 years | $ | 4,478 | |
Total intangible assets | $ | 4,478 | ||
ASC 810 requires that transactions that result in an increase in ownership of a subsidiary be accounted for as equity transactions. The carrying amount of the noncontrolling interest is adjusted to reflect the controlling interest’s decreased ownership interest in the subsidiary’s net assets and any difference between the consideration paid by the parent to a noncontrolling interest holder (or contributed by the parent to the net assets of the subsidiary) and the adjustment to the carrying amount of the noncontrolling interest in the subsidiary is recognized directly in equity attributable to the controlling interest. Due to the increase of the Company’s ownership to 91% from the acquisition date through December 31, 2014, the Company has recorded an adjustment of Schuff’s noncontrolling interest by $3.4 million and recorded as excess book value over fair value of purchased noncontrolling interest in the Company’s consolidated statement of equity.
F-30
ANG
On August 1, 2014, the Company paid $15.5 million to acquire 15,500 shares of Series A Convertible Preferred Stock of ANG (the “ANG Preferred Stock”), representing an approximately 51% interest in ANG. The ANG Preferred Stock is convertible into 1,033,333 shares of common stock and also has voting rights. The noncontrolling interest represents 1,000,000 shares of common stock; thereby giving the Company a controlling interest. ANG is a premier distributor of natural gas motor fuel headquartered in the Northeast that designs, builds, owns, operates and maintains compressed natural gas fueling stations for transportation. The Company acquired ANG for its strong growth potential which is in line with the Company’s strategy to find investments that can generate high returns and significant cash flow.
The table below summarizes the preliminary estimate of fair value of the ANG assets acquired and liabilities assumed as of the acquisition date. The purchase price of ANG was valued at $23.7 million which represented both the cash paid by the Company for its 51% interest $15.5 million, and the fair value of the noncontrolling interest of 49%, which was determined by an outside appraisal to be $8.2 million.
The purchase price allocation as restated is as follows (in thousands):
Cash and cash equivalents | $ | 15,704 | |
Accounts receivable | 306 | ||
Prepaid expenses and other current assets | 31 | ||
Inventories | 27 | ||
Property and equipment, net | 1,921 | ||
Customer contracts | 2,700 | ||
Trade names | 6,300 | ||
Other assets | 2 | ||
Goodwill | 1,374 | ||
Total assets acquired | 28,365 | ||
Accounts payable | 49 | ||
Accrued payroll and employee benefits | 5 | ||
Accrued expenses and other current liabilities | 26 | ||
Billings in excess of costs and recognized earnings on uncompleted contracts | 114 | ||
Current portion of long-term debt | 34 | ||
Long-term debt | 870 | ||
Deferred tax liability | 3,530 | ||
Total liabilities assumed | 4,628 | ||
Enterprise value | 23,737 | ||
Less fair value of non-controlling interest | 8,237 | ||
Purchase price attributable to controlling interest | $ | 15,500 | |
The acquisition of ANG resulted in goodwill of approximately $1.4 million. Goodwill was the excess of the consideration transferred over the net assets recognized and represents the future economic benefits arising from other assets acquired that could not be individually identified and separately recognized. Goodwill was recognized as a new stand-alone reporting unit. Goodwill is not amortized and is not deductible for tax purposes.
The acquired amortizable intangible assets and the related estimated useful lives consist of the following (in thousands):
Useful Lives | Value August 1, 2014 | |||
Customer contracts | 4 years | $ | 2,700 | |
Trade names | 15 years | 6,300 | ||
Total intangible assets | $ | 9,000 | ||
F-31
GMSL
On September 22, 2014, the Company completed the acquisition of Bridgehouse and its subsidiary, GMSL. The purchase price reflects an enterprise value of approximately $260 million, including assumed indebtedness of approximately $130 million leaving a net enterprise value of approximately $130 million. GMSL is a leading provider of engineering and underwater services on submarine cables. The Company acquired GMSL for its attractive valuation and strong cash position.
The table below summarizes the fair value of the GMSL assets acquired and liabilities assumed as of the acquisition date. The net enterprise value of GMSL was valued at $130.4 million which represented both the cash paid by the Company for its 97% interest, and the fair value of the noncontrolling interest of 3%.
The purchase price allocation as restated is as follows (in thousands):
Cash and cash equivalents | $ | 62,555 | |
Accounts receivable | 22,381 | ||
Prepaid expenses and other current assets | 23,108 | ||
Inventories | 7,395 | ||
Restricted cash | 4,682 | ||
Property and equipment, net | 152,022 | ||
Customer contracts | 8,121 | ||
Trade name | 1,137 | ||
Developed technology | 1,299 | ||
Goodwill | 1,366 | ||
Investments | 26,767 | ||
Other assets | 7,482 | ||
Total assets acquired | 318,315 | ||
Accounts payable | 8,740 | ||
Accrued expenses and other current liabilities | 44,136 | ||
Accrued income taxes | 1,251 | ||
Current portion of long-term debt | 8,140 | ||
Long-term debt | 78,356 | ||
Pension liability | 46,110 | ||
Deferred tax liability | 709 | ||
Other liabilities | 485 | ||
Total liabilities assumed | 187,927 | ||
Enterprise value | 130,388 | ||
Less fair value of noncontrolling interest | 3,803 | ||
Purchase price attributable to controlling interest | $ | 126,585 | |
The acquisition of GMSL resulted in goodwill of approximately $1.4 million. Goodwill was the excess of the consideration transferred over the net assets recognized and represents the future economic benefits arising from other assets acquired that could not be individually identified and separately recognized. Goodwill was recognized as a new stand-alone reporting unit. Goodwill is not amortized and is not deductible for tax purposes. The values for goodwill, customer contracts, trade name, developed technology and investments are estimates and may change.
F-32
The acquired amortizable intangible assets and the related estimated useful lives consist of the following (in thousands):
Useful Lives | Value September 22, 2014 (As Restated) | |||
Customer contracts | 15 years | $ | 8,121 | |
Trade name | 3 years | 1,137 | ||
Developed technology | 4 years | 1,299 | ||
Total intangible assets | $ | 10,557 | ||
Pro Forma Adjusted Summary
The results of operations for Schuff, ANG, and GMSL have been included in the consolidated financial statements subsequent to their acquisition dates.
The following schedule presents unaudited consolidated pro forma results of operations data as if the acquisitions had occurred on January 1, 2013. This information does not purport to be indicative of the actual results that would have occurred if the acquisitions had actually been completed on the date indicated, nor is it necessarily indicative of the future operating results or the financial position of the combined company (in thousands):
Years Ended December 31, | |||||||
2014 (As Restated) | 2013 (As Restated) | ||||||
Net revenue | $ | 854,152 | $ | 800,153 | |||
Net income (loss) from continuing operations | $ | 20,499 | $ | (3,103 | ) | ||
Net income (loss) from discontinued operations | $ | (2,984 | ) | $ | (32,722 | ) | |
Gain (loss) from sale of discontinued operations | $ | (121 | ) | $ | 148,839 | ||
Net income (loss) attributable to HC2 Holdings, Inc. | $ | 17,394 | $ | 111,623 | |||
All expenditures incurred in connection with the acquisitions were expensed and are included in selling, general and administrative expenses. Transaction costs incurred in connection with the Schuff acquisition were $0.3 million during the year ended December 31, 2014. Transaction costs incurred in connection with the GMSL acquisition were $8 million during the year ended December 31, 2014. The results of operations for Schuff, ANG, and GMSL have been included in the consolidated results of operations from the respective acquisition dates through December 31, 2014. The Company recorded revenue of $348.3 million and net income of $13.7 million from Schuff for the year ended December 31, 2014. The Company recorded revenue of $1.8 million and net income of $0.4 million from ANG for the year ended December 31, 2014. The Company recorded revenue of $35.3 million and net income of $6.9 million from GMSL for the year ended December 31, 2014.
6. INVESTMENTS
As of December 31, 2014, the Company had both current and long-term investments. The current investments are classified as available-for-sale securities and the change in value is recognized within accumulated other comprehensive income (loss). The fair market value is determined using quoted market prices (a Level 1 approach). The long-term investments are comprised of two types of investments; those accounted for under the equity method of accounting and investments in debt securities.
The long-term investments accounted for under the equity method of accounting include the following:
Joint ventures by GMSL (ownership interest reflects the Company’s 97% ownership in GMSL)
• | $0.1 million for investment in Global Cable Technology Ltd. representing a 63% ownership interest |
• | $13.0 million for investment in SB Submarine Systems Co., Ltd. representing a 48% ownership interest |
• | $3.0 million for investment in International Cableship Pte., Ltd. representing a 29% ownership interest |
F-33
• | $1.0 million for investment in Sembawang Cable Depot Ptd., Ltd. representing a 39% ownership interest |
• | $11.0 million for investment in Huawei Marine Systems Co., Ltd. representing a 48% ownership interest |
• | $0.4 million for investment in Visser Smit Global Marine Partnership representing a 48% ownership interest |
Novatel Wireless, Inc. (“Novatel”)
• | An initial investment of $14.2 million for a combination of common stock, warrants and convertible preferred stock. The Company received (i) 7,363,334 shares of common stock at a stock price of $1.75 per share, (ii) 5-year warrants to purchase an additional 4,117,647 shares of common stock at an exercise price of $2.26 per share and (iii) 87,196 shares of Series C Convertible Preferred Stock at a price of $17.50 per share. |
• | In October 2014, the 87,196 shares of Series C Convertible Preferred Stock was converted into 871,960 shares of common stock. |
• | The Company’s ownership of common stock and warrants represents beneficial ownership of approximately 25% of Novatel’s common stock. |
• | A basis difference, net of tax of $9.1 million consists of a trade name of $1.2 million (being amortized over 15 years), a technology and customer intangible of $1.8 million (being amortized over 7 years) and goodwill of $6.1 million. |
• | Current investment balance is $13.4 million. |
Kaneland, LLC (“Kaneland”)
• | An initial investment of $1.2 million for stock under a subscription agreement representing a 35% ownership interest. |
• | A basis difference, net of tax of $0.7 million consisting of developed technology (to be amortized over 3 years once underlying technology is completed). |
• | Current investment balance is $1.2 million. |
NerVve Technologies, Inc. (“NerVve”)
• | An initial investment of $5.0 million for 791,071 shares of Series A-1 Preferred Stock representing a 36% ownership interest. |
• | In the fourth quarter, the Company purchased an additional 94,215 shares of Series A-1 Preferred Stock from its former holders for $0.6 million, which had the effect of increasing the ownership to approximately 40%. |
• | A basis difference, net of tax of $3.1 million consisting of developed technology (to be amortized over 3 years once underlying technology is completed). |
• | Current investment balance is $5.5 million. |
Benevir Biopharm, Inc. (“Benevir”)
• | An initial investment of $1.95 million for 2,000 shares of Series A-1 Preferred Stock representing a 49% ownership interest. |
• | A basis difference, net of tax of $1.2 million consisting of developed technology (to be amortized over 15 years once underlying technology is completed). |
• | Current investment balance is $1.9 million. |
During the year ended December 31, 2014, the Company recorded $2.7 million of equity in net income from these investments. As of December 31, 2014, the net book value of the equity method investments was $50.8 million. The long-term investments in debt securities include $0.3 million of convertible debt of mParticle.
Summarized information for the entities in which we have equity method investments is as follows (in thousands):
Income Statement Data | Year ended December 31, 2014 | ||
Net Revenue | $ | 151,594 | |
Gross Profit | $ | 35,783 | |
Income from continuing operations | $ | 5,142 | |
Net income | $ | 5,142 | |
F-34
Balance Sheet Summary | December 31, 2014 | ||
Current assets | $ | 269,864 | |
Noncurrent assets | $ | 149,995 | |
Current liabilities | $ | 179,552 | |
Noncurrent liabilities | $ | 18,063 | |
7. PROPERTY AND EQUIPMENT
Property, plant and equipment consist of the following (in thousands):
December 31, | |||||||
2014 (As Restated) | 2013 | ||||||
Land | $ | 19,179 | $ | — | |||
Building and leasehold improvements | 29,520 | 386 | |||||
Plant and transportation equipment | 7,090 | — | |||||
Cable-ships and submersibles | 136,252 | — | |||||
Equipment, furniture and fixtures | 35,229 | 5,683 | |||||
Construction in progress | 12,150 | — | |||||
239,420 | 6,069 | ||||||
Less: accumulated depreciation and amortization | 6,398 | 3,107 | |||||
$ | 233,022 | $ | 2,962 | ||||
Depreciation expense was $9.8 million, $12 million and $3.2 million for the years ended December 31, 2014, 2013 and 2012, respectively. Depreciation and amortization expense in 2013 includes depreciation and amortization for the period July 1, 2012—December 31, 2013, when the property and equipment of ICS was included in assets held for sale. In accordance with US GAAP, held for sale assets are not depreciated. When ICS was no longer considered to be held for sale, we were required to record all unrecorded depreciation in the fourth quarter of 2013.
As of December 31, 2014, total net book value of equipment under capital leases consisted of $75.5 million of cable-ships and submersibles.
8. GOODWILL AND OTHER INTANGIBLE ASSETS
Goodwill
The Company performed its annual goodwill impairment test for the ICS reporting unit on October 1, 2014. Based on the results of the step one test, the Company determined that the fair value was in excess of the carrying value and a step two test was not required. The Company used an income-based approach looking at the most current financial projections available to determine the outlook for future income generation. Estimates of future income were projected for a five year forecast period after which assumptions were made relative to a terminal period. A discounted cash flow analysis using a 13.0% weighted average cost of capital was used to facilitate the calculation of fair value. A key assumption in the fair value calculations was the Company’s future operating performance and resulting cash flow, which are inherently subject to significant uncertainties and contingencies and are based on management’s best estimates at the date of measurement. Potential events which could have a negative effect on this and other key assumptions include competitive actions, technological developments, regulatory actions and currency movements.
The Company performed its annual goodwill impairment test for the Schuff reporting unit on October 1, 2014. The Company utilized the provisions of ASU 2011-8, which allows the Company to use qualitative factors to determine whether the existence of events or circumstances leads to a determination that it is more likely than not that the fair value of the reporting unit is less than its carrying amount. The Company analyzed current projections for future performance compared to prior projections which had been used recently for the valuation of assets acquired and liabilities assumed. The Company did not identify any material economic conditions, industry or market considerations or cost factors that would significantly alter the carrying value or fair value of the Schuff reporting unit. In addition, the executive management team of each reporting unit has remained static
F-35
since their acquisition. All of these factors led to the conclusion that it is not more likely than not that the fair value of the Schuff reporting unit is less than its carrying amount.
The Company sold its BLACKIRON Data segment during the second quarter of 2013. BLACKIRON Data was part of the Canada reporting unit, and therefore an allocation of the goodwill of the Canada reporting unit was made to the disposed entity. Prior to its disposal, the Company allocated, based on relative fair value to the Canada reporting unit in total, $20.2 million of goodwill to BLACKIRON Data.
The sale of BLACKIRON Data and the announcement of the sale of North America Telecom during the second quarter of 2013 were considered triggering events under ASC 350 and the Company tested the goodwill of the Canada and US reporting units for impairment. The proceeds from each of the transactions were used as a measurement of fair value. Based on the carrying values of the Canada and US reporting units, the Company determined that goodwill was not impaired as of June 30, 2013.
The Company completed the initial closing of the sale of the North America Telecom segment during the third quarter of 2013. A portion of North America Telecom included in the initial closing represented the remaining portion of goodwill, or $13.2 million, of the Canada reporting unit. In addition, regarding the US reporting unit, prior to its disposal, the Company allocated, based on relative fair value to the US reporting unit in total, $22.6 million of goodwill to the disposed entities of North America Telecom. The remaining goodwill of the US reporting unit of $4.0 million was applicable to PTI, and included in held for sale assets prior to its divestiture on July 31, 2014.
In conjunction with the decision to cease the sale process of ICS, ICS was valued at the lower of the (1) carrying value prior to its held for sale classification, adjusted for any depreciation and amortization that would have been recognized and (2)the fair value as of the date of the decision not to sell. It was then reclassified to held and used as of December 31, 2013. Subsequent to such reclassification, the Company tested goodwill under ASC 350 using a Step 1 and Step 2 approach. Because the fair value of ICS exceeded its adjusted carrying value under Step 1, no further analysis was required. The Company used an income-based approach looking at the most current financial projections available to determine the outlook for future income generation. Estimates of future income were projected for a five year forecast period after which assumptions were made relative to a terminal period. A discounted cash flow analysis using a 11.1% weighted average cost of capital was used to facilitate the calculation of fair value.
The changes in the carrying amount of goodwill by reporting unit for the years ended December 31, 2014 and 2013 are as follows (in thousands):
Disposed Reporting Units | |||||||||||||||||||||||||||
Schuff | GMSL | ICS | ANG | United States | Canada | Total | |||||||||||||||||||||
Balance as of January 1, 2013 | $ | — | $ | — | $ | — | $ | — | $ | 26,582 | $ | 34,162 | $ | 60,744 | |||||||||||||
Effect of change in foreign currency exchange rates | — | — | — | — | — | (776 | ) | (776 | ) | ||||||||||||||||||
Disposition of business | — | — | — | — | (22,568 | ) | (33,386 | ) | (55,954 | ) | |||||||||||||||||
Allocation (to) from disposal group | — | — | 3,378 | — | (4,014 | ) | — | (636 | ) | ||||||||||||||||||
Balance as of December 31, 2013 | $ | — | $ | — | $ | 3,378 | $ | — | $ | — | $ | — | $ | 3,378 | |||||||||||||
Effect of change in foreign currency exchange rates | — | (190 | ) | — | — | — | — | (190 | ) | ||||||||||||||||||
Acquisition of business | 24,612 | 1,366 | — | 1,374 | — | — | 27,352 | ||||||||||||||||||||
Balance as of December 31, 2014 (As Restated) | $ | 24,612 | $ | 1,176 | $ | 3,378 | $ | 1,374 | $ | — | $ | — | $ | 30,540 | |||||||||||||
Indefinite-lived Trade Names
In conjunction with the initial closing of the sale of the North America Telecom segment, the Company also assigned the trade names used by the North America Telecom segment to affiliates of York Capital Management. The value of the assigned trade names was $27.0 million, less a deferred tax liability of $10.5 million.
Amortizable Intangible Assets
Intangible assets subject to amortization consisted of the following (in thousands):
F-36
Schuff | GMSL | ANG | Pansend | Other | Corporate | Total | |||||||||||||||||||||
Trade names | |||||||||||||||||||||||||||
Balance as of December 31, 2013 | $ | — | $ | — | $ | — | $ | — | $ | — | $ | — | $ | — | |||||||||||||
Effect of change in foreign currency exchange rates | — | (49 | ) | — | — | — | — | (49 | ) | ||||||||||||||||||
Amortization | (174 | ) | (91 | ) | (263 | ) | — | — | — | (528 | ) | ||||||||||||||||
Acquisition of business | 4,478 | 1,137 | 6,300 | — | — | — | 11,915 | ||||||||||||||||||||
Balance as of December 31, 2014 | $ | 4,304 | $ | 997 | $ | 6,037 | $ | — | $ | — | $ | — | $ | 11,338 | |||||||||||||
Customer relationships | |||||||||||||||||||||||||||
Balance as of December 31, 2013 | $ | — | $ | — | $ | — | $ | — | $ | — | $ | — | $ | — | |||||||||||||
Effect of change in foreign currency exchange rates | — | (353 | ) | — | — | — | — | (353 | ) | ||||||||||||||||||
Amortization | — | (129 | ) | (151 | ) | — | — | — | (280 | ) | |||||||||||||||||
Acquisition of business | — | 8,121 | 5,032 | — | — | — | 13,153 | ||||||||||||||||||||
Balance as of December 31, 2014 (As Restated) | $ | — | $ | 7,639 | $ | 4,881 | $ | — | $ | — | $ | — | $ | 12,520 | |||||||||||||
Developed technology | |||||||||||||||||||||||||||
Balance as of December 31, 2013 | $ | — | $ | — | $ | — | $ | — | $ | — | $ | — | $ | — | |||||||||||||
Effect of change in foreign currency exchange rates | — | (57 | ) | — | — | — | — | (57 | ) | ||||||||||||||||||
Amortization | — | (78 | ) | — | — | — | — | (78 | ) | ||||||||||||||||||
Acquisition of business | — | 1,299 | — | — | — | — | 1,299 | ||||||||||||||||||||
Balance as of December 31, 2014 (As Restated) | $ | — | $ | 1,164 | $ | — | $ | — | $ | — | $ | — | $ | 1,164 | |||||||||||||
Other | |||||||||||||||||||||||||||
Balance as of December 31, 2013 | $ | — | $ | — | $ | — | $ | — | $ | — | $ | — | $ | — | |||||||||||||
Amortization | — | — | — | (1 | ) | — | — | (1 | ) | ||||||||||||||||||
Acquisition of business/development | — | — | — | 115 | 6,000 | 22 | 6,137 | ||||||||||||||||||||
Balance as of December 31, 2014 | $ | — | $ | — | $ | — | $ | 114 | $ | 6,000 | $ | 22 | $ | 6,136 | |||||||||||||
Total amortizable intangible assets | |||||||||||||||||||||||||||
Balance as of December 31, 2013 | $ | — | $ | — | $ | — | $ | — | $ | — | $ | — | $ | — | |||||||||||||
Effect of change in foreign currency exchange rates | — | (459 | ) | — | — | — | — | (459 | ) | ||||||||||||||||||
Amortization | (174 | ) | (298 | ) | (414 | ) | (1 | ) | — | — | (887 | ) | |||||||||||||||
Acquisition of business | 4,478 | 10,557 | 11,332 | 115 | 6,000 | 22 | 32,504 | ||||||||||||||||||||
Balance as of December 31, 2014 (As Restated) | $ | 4,304 | $ | 9,800 | $ | 10,918 | $ | 114 | $ | 6,000 | $ | 22 | $ | 31,158 | |||||||||||||
F-37
Amortization expense for amortizable intangible assets for the years ended December 31, 2014, 2013 and 2012 was $0.9 million as restated, $0 and $0.2 million, respectively. The Company expects amortization expense for its amortizable intangible assets for the years ending December 31, 2015, 2016, 2017, 2018, 2019 and thereafter to be approximately $3.4 million, $3.4 million, $3.3 million, $2.9 million, $2.7 million and $15.4 million, respectively.
9. LONG-TERM OBLIGATIONS
Long-term debt consists of the following (in thousands):
December 31, | |||||||
2014 | 2013 | ||||||
Senior Secured Notes collaterized by the Company’s assets, with interest payable semi-yearly based on a fixed annual interest rate of 11% with principal due in 2019 | $ | 250,000 | $ | — | |||
Note payable collaterized by GMSL’s assets, with interest payable monthly at LIBOR plus 3.65% and principal payable quarterly, maturing in 2018 | 16,732 | — | |||||
Note payable collaterized by Schuff’s real estate, with interest payable monthly at LIBOR plus 4% and principal payable monthly with one final balloon payment of $1.9 million, maturing in 2019 | 4,635 | — | |||||
Note payable collaterized by Schuff’s equipment, with interest payable monthly at LIBOR plus 4% and principal payable monthly with one final balloon payment of $1.9 million, maturing in 2019 | 8,333 | — | |||||
Note payable collaterized by ANG’s assets, with interest payable monthly at 5.5% and principal payable monthly, maturing in 2018 | 810 | — | |||||
Obligations under capital leases | 65,176 | — | |||||
Other | 30 | — | |||||
Subtotal | 345,716 | — | |||||
Original issue discount on Senior Secured Notes | (2,345 | ) | — | ||||
Subtotal | 343,371 | — | |||||
Less: Current portion of long-term obligations | (10,444 | ) | — | ||||
Total long-term obligations | $ | 332,927 | $ | — | |||
Aggregate debt maturities are as follows (in thousands):
2015 | $ | 10,595 | |
2016 | 10,864 | ||
2017 | 11,138 | ||
2018 | 14,339 | ||
2019 | 262,474 | ||
Thereafter | 36,306 | ||
$ | 345,716 | ||
Aggregate maturities for the capital leases are as follows (in thousands):
2015 | $ | 6,946 | |
2016 | 6,954 | ||
2017 | 6,945 | ||
2018 | 10,716 | ||
2019 | 10,715 | ||
Thereafter | 38,919 | ||
Total minimum principal & interest payments | 81,195 | ||
Less: Amount representing interest | (16,019 | ) | |
Total capital lease obligations | $ | 65,176 | |
F-38
The interest rates on the capital leases range from approximately 4% to 10.4%
11% Senior Secured Notes due 2019
On November 20, 2014, the Company issued $250.0 million in aggregate principal amount of 11% Senior Secured Notes due 2019 (“the 11% Notes). The 11% Notes were issued at 99.05% which resulted in a discount of $2.4 million. The net proceeds from the issuance of the 11% Notes were used to pay off the September Credit Facility entered into in connection with the GMSL acquisition. The 11% Notes were issued under an indenture dated November 20, 2014, by and among HC2, the guarantors party thereto and U.S. Bank National Association, a national banking association (“U.S. Bank”), as trustee (the “11% Notes Indenture”).
Maturity and Interest. The 11% Notes mature on December 1, 2019. The 11% Notes accrue interest at a rate of 11% per year. Interest on the 11% Notes is paid semi-annually on December 1 and June 1 of each year.
Ranking. The 11% Notes and the guarantees thereof will be HC2’s and certain of its direct and indirect domestic subsidiaries’ (the “Subsidiary Guarantors”) general senior secured obligations. The 11% Notes and the guarantees thereof will rank: (i) senior in right of payment to all of HC2’s and the Subsidiary Guarantors’ future subordinated debt; (ii) equal in right of payment with all of HC2’s and the Subsidiary Guarantors’ existing and future senior debt and effectively senior to all of its unsecured debt to the extent of the value of the collateral; and (iii) effectively subordinated to all liabilities of its non-guarantor subsidiaries.
Collateral. The 11% Notes and the guarantees thereof will be collaterized on a first-priority basis by substantially all of HC2’s assets and the assets of the Subsidiary Guarantors (except for certain “Excluded Assets,” and subject to certain “Permitted Liens,” each as defined in the 11% Notes Indenture). The 11% Notes Indenture permits the Company, under specified circumstances, to incur additional debt in the future that could equally and ratably share in the collateral. The amount of such debt is limited by the covenants contained in the 11% Notes Indenture.
Certain Covenants. The 11% Notes Indenture contains covenants limiting, among other things, the ability of HC2, and, in certain cases, HC2’s subsidiaries, to incur additional indebtedness; create liens; engage in sale-leaseback transactions; pay dividends or make distributions in respect of capital stock; make certain restricted payments; sell assets; engage in transactions with affiliates; or consolidate or merge with, or sell substantially all of its assets to, another person. These covenants are subject to a number of important exceptions and qualifications. HC2 is also required to maintain compliance with certain financial tests, including minimum liquidity and collateral coverage ratios. As of December 1, 2016, HC2 was in compliance with these covenants.
Redemption Premiums. The Company may redeem the 11% Notes at a redemption price equal to 100% of the principal amount of the 11% Notes plus a make-whole premium before December 1, 2016. The make-whole premium is the greater of (i) 1% of principal amount or (ii) the excess of the present value of redemption price at December 1, 2016 plus all required interest payments through December 1, 2016 over the principal amount. After December 1, 2016, the Company may redeem the 11% Notes at a redemption price equal to 100% of the principal amount plus accrued interest. The Company is required to make an offer to purchase the 11% Notes upon a change of control. The purchase price will equal 101% of the principal amount of the 11% Notes on the date of purchase plus accrued interest.
Terminated HC2 Credit Facilities
In 2014, HC2 entered into (i) the May Credit Facility to finance a portion of the acquisition of Schuff, (ii) the Novatel Acquisition Term Loan to finance the acquisition of Novatel and (iii) the September Credit Facility to finance a portion of the acquisition of GMSL. HC2 used a portion of the proceeds from the September Credit Facility to repay the May Credit Facility and the Novatel Acquisition Term Loan. HC2 used the net proceeds from the issuance of the 11% Notes to repay the September Credit Facility.
Prior to the payoff of the May Credit Facility, the Company made partial principal payments according to covenants within the agreement that required that portions of escrows received and proceeds from the exercise of warrants be used to pay down the May Credit Facility. In connection with those partial prepayments, the Company wrote off $0.1 million of deferred financing costs and $0.2 million of original issue discount in the second quarter to amortization of debt discount. In connection with those partial prepayments, the Company wrote off $0.1 million of deferred financing costs and $1.9 million of original
F-39
issue discount in the third quarter of 2014 to loss on early extinguishment or restructuring of debt. In connection with the payoff of the remaining balance of the May Credit Facility, the Company incurred $0.9 million of prepayment premiums and wrote off $0.3 million of deferred financing costs and $2.5 million of original issue discount in the third quarter of 2014 to loss on early extinguishment or restructuring of debt. In connection with the payoff of the Novatel Acquisition Term Loan, the Company wrote off $0.4 million of deferred financing costs and $0.8 million of original issue discount in the third quarter of 2014 to loss on early extinguishment or restructuring of debt. In connection with the payoff of the September Credit Facility, the Company wrote off $0.5 million of deferred financing costs and $4.5 million of original issue discount, which is net of a credit for previous paid funding fees of $2.3 million during the fourth quarter of 2014 to loss on early extinguishment or restructuring of debt.
Schuff Credit Facilities
Schuff has a Credit and Security Agreement (“Schuff Facility”) with Wells Fargo Credit, Inc. (“Wells Fargo”), pursuant to which Wells Fargo agreed to advance up to a maximum amount of $50.0 million to Schuff. On October 21, 2014, Schuff amended the Schuff Facility, pursuant to which Wells Fargo allowed for the issuance of a note payable up to $10.0 million, collateralized by its machinery and equipment (“Real Estate (2) Term Advance (M&E)”) and the issuance of a note payable up to $5.0 million, collateralized by its real estate (“Real Estate (2) Term Advance (Working Capital)”). At December 31, 2014, Schuff had borrowed $8.4 million under the Real Estate (2) Term Advance (M&E). The Real Estate (2) Term Advance (M&E) has a 5 year amortization period requiring monthly principal payments and a final balloon payment at maturity. The Real Estate (2) Term Advance (M&E) has a floating interest rate of LIBOR plus 4.0% and requires monthly interest payments. At December 31, 2014, the Company had no borrowings under the Real Estate (2) Term Advance (Working Capital).
On May 6, 2014, Schuff amended the Schuff Facility, pursuant to which Wells Fargo extended the maturity date of the Schuff Facility to April 30, 2019, lowered the interest rate charged in connection with borrowings under the line of credit and allowed for the issuance of a note payable totaling $5.0 million, collateralized by its real estate (“Real Estate Term Advance”). The Real Estate (2)Term Advance (M&E) has a 5-year amortization period requiring monthly principal payments and a final balloon payment at maturity. The Real Estate Term Advance has a floating interest rate of LIBOR plus 4.0% and requires monthly interest payments. The proceeds of the Real Estate Term Advance, in conjunction with cash generated from operations and borrowings under the Schuff Facility, were used to pay the remaining balance of the previous real estate term loan issued under the Schuff Facility.
The Schuff Facility has a floating interest rate of LIBOR plus 3.00% (3.25% at December 28, 2014) and requires monthly interest payments. The Schuff Facility is secured by a first priority, perfected security interest in all of Schuff’s assets, excluding the real estate, and its present and future subsidiaries and a second priority, perfected security interest in all of Schuff’s real estate. The security agreements pursuant to which Schuff’s assets are pledged prohibit any further pledge of such assets without the written consent of the bank. The Schuff Facility contains various restrictive covenants. At December 31, 2014, the Company was in compliance with these covenants.
SHE has a Line of Credit Agreement (“International LOC”) with Banco General, S.A. (“Banco General”) in Panama pursuant to which Banco General agreed to advance up to a maximum amount of $2.5 million. The line of credit is secured by a first priority, perfected security interest in the SHE’s property and plant. The interest rate is 5.25% plus 1% of the special interest compensation fund (“FECI”). The line of credit contains covenants that, among other things, limit the SHE’s ability to incur additional indebtedness, change its business, merge, consolidate or dissolve and sell, lease, exchange or otherwise dispose of its assets, without prior written notice.
There was $46.1 million available and $3.9 million of outstanding letters of credit issued under the Schuff Facility at December 31, 2014. At December 31, 2014, Schuff had no borrowings and no outstanding letters of credit issued under its International LOC. There was $2.5 million available under Schuff’s International LOC at December 31, 2014.
GMSL Credit Facility
GMSL established a term loan with DVB Bank in January 2014 (the “GMSL Facility”). This GMSL facility has a 4.5 year term and bears interest at the rate of 3.65% plus the USD LIBOR rate. As of December 31, 2014, $16.7 million remained outstanding under the GMSL Facility. The GMSL Facility contains various restrictive covenants. At December 31, 2014, GMSL was in compliance with these covenants.
F-40
ANG Term Loan
ANG established a term loan with Signature Financial in October 2013. This term loan has a 5 year term and bears interest at the rate of 5.5%. As of December 31, 2014, $0.8 million remained outstanding under this term loan.
GMSL Capital Leases
GMSL is a party to two leases to finance the use of two vessels: the Innovator (such applicable lease, the “Innovator Lease”) and the Cable Retriever (such applicable lease, the “Cable Lease,” and together with the Innovator Lease, the “GMSL Leases”). The Innovator Lease expires in 2018, subject to the Company’s ability to extend the Innovator Lease for four one-year periods through 2022. The principal amount thereunder bears interest at the rate of approximately 10.4%. The Cable Lease expires in 2023. The principal amount thereunder bears interest at the rate of approximately 4.0%.
As of December 31, 2014, $65.2 million in aggregate principal amount remained outstanding under the GMSL Leases.
Redemption of 10% Notes, 10% Exchange Notes and 13% Notes and Satisfaction and Discharge of Related Indentures
On August 30, 2013, PTHI consummated the redemption of approximately $125.3 million of its 10% Senior Secured Notes due 2017 (the “10% Notes”) and 10% Senior Secured Exchange Notes due 2017 (the “10% Exchange Notes”). The $125.3 million consisted of approximately $12.7 million in aggregate principal amount of its 10% Notes at a redemption price equal to 106.50% of the principal amount thereof and $112.6 million in aggregate principal amount of its 10% Exchange Notes at a redemption price equal to 100.00% of the principal amount thereof, plus accrued but unpaid interest to the date of redemption. PTHI thereby satisfied and discharged the indenture governing the 10% Notes and 10% Exchange Notes (the “10% Notes Indenture”), as a result of which all of the obligations of PTHI, as the issuer of the 10% Notes and 10% Exchange Notes, and the guarantors of the 10% Notes and 10% Exchange Notes (including HC2) under the 10% Notes Indenture ceased to be of further effect (subject to certain exceptions) and the liens on collateral of PTHI and the guarantors of the 10% Notes and 10% Exchange Notes securing such notes were released. In connection with the August 2013 10% Notes and 10% Exchange Notes redemption, the Company incurred $0.8 million of premiums and other costs and wrote off $0.8 million and $14.8 million of deferred financing costs, respectively, and $0.1 million and $0.5 million of original issue discount, respectively, in the third quarter of 2013. Aside from the applicable redemption price, no other redemption premium was paid for the 10% Exchange Notes.
On August 30, 2013, PTHI and Primus Telecommunications Canada Inc. (“PTCI”) consummated the redemption of approximately $2.4 million in aggregate principal amount of its 13% Senior Secured Notes due 2016 (the “13% Notes”) at a redemption price equal to 106.50% of the principal amount thereof, plus accrued but unpaid interest to the date of redemption. PTHI and PTCI thereby satisfied and discharged the indenture governing the 13% Notes (the “13% Notes Indenture”), as a result of which all of the obligations of PTHI and PTCI, as the issuers of the 13% Notes, and the guarantors of the 13% Notes (including HC2) under the 13% Notes Indenture ceased to be of further effect (subject to certain exceptions). Liens on collateral securing the 13% Notes had previously been released in connection with the amendment of the 13% Notes Indenture that became effective on July 7, 2011. In connection with the August 2013 13% Notes redemption, the Company incurred $0.2 million of premiums and other costs and wrote off $3.7 million of deferred financing costs and $0.02 million of original issue discount in the third quarter of 2013.
F-41
10. INCOME TAXES
The provisions (benefits) for income taxes for the years ended December 31, 2014, 2013 and 2012 are as follows (in thousands):
Years Ended December 31, | |||||||||||
2014 (As Restated) | 2013 | 2012 | |||||||||
Current: Federal | $ | 5,527 | $ | (256 | ) | $ | — | ||||
State | 1,600 | 147 | 33 | ||||||||
Foreign | 227 | (7,333 | ) | (3,165 | ) | ||||||
Subtotal Current | 7,354 | (7,442 | ) | (3,132 | ) | ||||||
Deferred: Federal | (28,092 | ) | — | — | |||||||
State | (2,131 | ) | — | — | |||||||
Foreign | — | — | — | ||||||||
Subtotal Deferred | (30,223 | ) | — | — | |||||||
Income tax (benefit) expense | $ | (22,869 | ) | $ | (7,442 | ) | $ | (3,132 | ) | ||
The US and foreign components of income (loss) from continuing operations before income taxes for the years ended December 31, 2014, 2013 and 2012 are as follows (in thousands):
Years Ended December 31, | |||||||||||
2014(As Restated) | 2013 | 2012 | |||||||||
US | $ | (41,351 | ) | $ | (24,833 | ) | $ | (43,821 | ) | ||
Foreign | 6,796 | (221 | ) | (4,182 | ) | ||||||
Income (loss) from continuing operations before income taxes | $ | (34,555 | ) | $ | (25,054 | ) | $ | (48,003 | ) | ||
The provision for (benefit from) income taxes differed from the amount computed by applying the federal statutory income tax rate to income (loss) before income taxes due to the following items for the years ended December 31, 2014, 2013 and 2012 (in thousands).
Years Ended December 31, | |||||||||||
2014(As Restated) | 2013 | 2012 | |||||||||
Tax provision (benefit) at federal statutory rate | $ | (13,027 | ) | $ | (8,769 | ) | $ | (16,801 | ) | ||
Permanent differences | 335 | (536 | ) | 7,660 | |||||||
State tax (net of federal benefit) | 1,170 | 95 | 44 | ||||||||
Effect of foreign tax rate change | (838 | ) | (235 | ) | (2,828 | ) | |||||
Section 162m limit | 2,701 | — | — | ||||||||
Foreign withholding taxes (net of federal) | 231 | (3,759 | ) | 725 | |||||||
Reverse book loss on notes | — | — | 19,767 | ||||||||
Reverse AU book loss on notes | — | — | 24,034 | ||||||||
Uncertain tax positions | — | (3,575 | ) | — | |||||||
Increase (decrease) in valuation allowance | (17,520 | ) | 6,642 | (41,692 | ) | ||||||
Contingent Value Rights | — | (5,216 | ) | (452 | ) | ||||||
Reversing deferred taxes | — | (365 | ) | 3,890 | |||||||
Debt exchange costs | — | 7,393 | — | ||||||||
Transaction costs | 2,106 | (1,338 | ) | — | |||||||
UK Sterwardship costs | — | 1,455 | 2,509 | ||||||||
199 Manufacturing Deduction | (594 | ) | — | — | |||||||
Bargain Purchase Gain | (496 | ) | — | — | |||||||
Officer Life Insurance Proceeds | (392 | ) | — | — | |||||||
Foreign E&P | 3,395 | — | — | ||||||||
Other | 60 | 766 | 12 | ||||||||
Income tax (benefit) expense | $ | (22,869 | ) | $ | (7,442 | ) | $ | (3,132 | ) | ||
F-42
For the year ended December 31, 2014, the Company’s effective tax rate was favorably impacted by the release of valuation allowances totaling $17.5 million attributed to management’s conclusion that more-likely-than-not the deferred tax assets of our U.S. consolidated group would be realized. As discussed below, this conclusion is based on the consistent earnings history of Schuff and Global Marine and the impact of those earnings on the group’s future US taxable income.
Deferred income taxes reflect the net income tax effect of temporary differences between the basis of assets and liabilities for financial reporting purposes and for income tax purposes. Net deferred tax balances are comprised of the following as of December 31, 2014 and 2013 (in thousands).
December 31, | |||||||
2014 (As Restated) | 2013 | ||||||
Deferred tax assets | $ | 114,023 | $ | 138,334 | |||
Valuation allowance | (68,982 | ) | (118,323 | ) | |||
Deferred tax liabilities | (29,321 | ) | (20,011 | ) | |||
Net deferred taxes | $ | 15,720 | $ | — | |||
Certain fixed and intangible assets were marked to their fair market values as a result of our emergence from bankruptcy in 2009, and the associated fresh-start accounting resulted in a substantial decrease to our deferred tax asset, net operating loss carryforwards, a discharge of certain tax liabilities, and tax attribute reduction, as prescribed by Internal Revenue Code Section 108. The significant components of the Company’s deferred tax assets and liabilities are as follows as of December 31, 2014 and 2013 (in thousands):
December 31, | |||||||
2014 (As Restated) | 2013 | ||||||
Current | |||||||
Allowance for bad debt | $ | 351 | $ | 905 | |||
Other | 1,494 | 1,675 | |||||
Valuation allowance | (144 | ) | (2,580 | ) | |||
Total Current | 1,701 | — | |||||
Non-current | |||||||
Basis difference in intangibles | (7,527 | ) | 2,105 | ||||
Capital loss carryforwards | — | 1,726 | |||||
Net operating loss carryforwards | 27,416 | 96,230 | |||||
Basis difference in fixed assets | 4,646 | 15,560 | |||||
Deferred compensation | 4,101 | — | |||||
UK Trading loss carryforward | 52,895 | — | |||||
Start-up costs | 1,285 | — | |||||
Other | 41 | 122 | |||||
Valuation allowance | (68,838 | ) | (115,743 | ) | |||
Total Non-current | $ | 14,019 | $ | — | |||
In accordance with ASC Topic 740, the Company establishes valuation allowances for deferred tax assets that, in its judgment are not more-likely-than-not realizable. These judgments are based on projections of future income by individual tax jurisdiction. Changes in industry and economic conditions and the competitive environment may impact these projections. In accordance with ASC Topic 740, during each reporting period the Company assesses the likelihood that its deferred tax assets will be realized and determines if adjustments to its valuation allowances are appropriate. As a result of this assessment for the year ended December 31, 2014, the Company had a net release of valuation allowance to earnings of $17.5 million.
Management evaluated the continued need for a valuation allowance against deferred taxes of the Company for each of the reporting periods. Included in the assessment was HC2’s historical operating results over the prior three-year period. Also considered was the positive and negative evidence over the prior 3 years and other evidence of the newly acquired Schuff International Inc. and Global Marine Systems, Limited groups. Based on the evidence Management concluded that it is more
F-43
likely than not that HC2’s deferred tax assets will be realized. On this basis, as of December 31, 2014, most US valuation allowances have been released. Valuation allowances have been maintained, however, against deferred taxes related to US capital loss carryforwards and deferred tax assets of the European entities, including GMSL’s UK non-tonnage tax trading losses.
As of December 31, 2014, the Company had foreign operating loss carryforwards of approximately $248.7 million, none of which are subject to expiration based on the passage of time. Of the foreign NOLs $230.1 million were generated by Global Marine’s historical non-tonnage tax operations.
At December 31, 2014, the Company projects United States operating loss carryforwards available to reduce future taxable income in the amount of $62.7 million, of which $46.1 million is subject to limitation under Section 382, and of which $16.6 million is not subject to the Section 382 limit. Net operating losses will expire periodically through 2034. Of the carryforward NOL, $7.9 million resulted from stock compensation plan deductions in excess of accrued compensation cost for financial reporting purposes. Per the requirements of paragraph ASC 740-20-45-11(d), when the excess deduction is realized by reducing taxes payable, the tax effected amount of the excess is to be recognized in shareholders’ equity.
Pursuant to the rules under Section 382 of the Internal Revenue Code, the Company believes that it underwent an ownership change on May 29, 2014. This conclusion is based on an analysis of Schedule 13D and Schedule 13G filings over the prior three years made with the SEC and the impact resulting from the May 29 preferred stock issuance. Due to the Section 382 limit resulting from the ownership change, approximately $146.2 million of the Company’s net operating losses will expire unused. The $146.2 million in expiring NOLs have been derecognized in the financial statements. The remaining pre-change NOL’s of $46.1 million recorded in the financial statements are subject to an annual limitation under IRC Sec. 382 of approximately $2.3 million.
The Company follows the provision of ASC No. 740-10, “Income Taxes” which prescribes a comprehensive model for how a company should recognize, measure, present, and disclose in its financial statements uncertain tax positions that the Company has taken or expects to take on a tax return. The Company is subject to challenge from various taxing authorities relative to certain tax planning strategies, including certain intercompany transactions as well as regulatory taxes.
Reconciliations of the period January 1, 2012 to December 31, 2012, and January 1, 2013 to December 31, 2013 and January 1, 2014 to December 31, 2014 balances of unrecognized tax benefits are as follows (in thousands):
Years Ended December 31, | |||||||||||
2014 | 2013 | 2012 | |||||||||
Balance at January 1, | $ | 35,196 | $ | 66,161 | $ | 86,206 | |||||
Foreign currency adjustments | — | — | — | ||||||||
Statute expiration | — | (3,295 | ) | (1,172 | ) | ||||||
Gross increases (decreases) of tax positions in prior period | (35,196 | ) | (28,178 | ) | (21,496 | ) | |||||
Audit resolution | — | — | — | ||||||||
Gross increases of tax positions in current period | — | 508 | 2,623 | ||||||||
Balance at December 31, | $ | — | $ | 35,196 | $ | 66,161 | |||||
The decrease in 2014 to unrecognized tax benefits is due to the permanent impairment and de-recognition of NOLs under the May 2014, Section 382 limitation that were created by the uncertain positions. The total unrecognized tax benefits as of December 31, 2014, was $0.
The Company conducts business globally, and as a result, HC2 or one or more of its subsidiaries files income tax returns in the United States federal jurisdiction and various state and foreign jurisdictions. In the normal course of business the Company is subject to examination by taxing authorities throughout the world. Tax years 2002-2014 remain open for examination.
The company is currently under examination in various domestic and foreign tax jurisdictions. The open tax years contain matters that could be subject to differing interpretations of applicable tax laws and regulations as they relate to the amount, character, timing or inclusion of revenue and expenses or the applicability of income tax credits for the relevant tax period. Given the nature of tax audits there is a risk that disputes may arise.
F-44
11. COMMITMENTS AND CONTINGENCIES
Future minimum lease payments under non-cancellable operating leases as of December 31, 2014 are as follows (in thousands):
Year Ending December 31, | Operating Leases | ||
2015 | $ | 4,209 | |
2016 | 3,914 | ||
2017 | 3,249 | ||
2018 | 2,433 | ||
2019 | 1,927 | ||
Thereafter | 10,263 | ||
Total long-term obligations | $ | 25,995 | |
The Company has contractual obligations to utilize an external vendor for certain customer support functions and to utilize network facilities from certain carriers with terms greater than one year.
The Company’s rent expense under operating leases was $5.7 million, $2.1 million and $2.5 million for the years ended December 31, 2014, 2013 and 2012, respectively. The rent expense for the year ended December 31, 2014 includes costs associated with the terminations of facilities leases.
Litigation
On November 6, 2014, a putative stockholder class action complaint challenging the buyout by HC2 Holdings, Inc. of the noncontrolling interest in Schuff International, Inc. (“Schuff International”) was filed in the Court of Chancery of the State of Delaware, captioned Mark Jacobs v. Philip A. Falcone, Keith M. Hladek, Paul Voigt, Michael R. Hill, Rustin Roach, D. Ronald Yagoda, Phillip O. Elbert, HC2 Holdings, Inc., and Schuff International, Inc., Civil Action No. 10323 (the “Complaint”). On November 17, 2014, a second lawsuit was filed in the Court of Chancery of the State of Delaware, captioned Arlen Diercks v. Schuff International, Inc. Philip A. Falcone, Keith M. Hladek, Paul Voigt, Michael R. Hill, Rustin Roach, D. Ronald Yagoda, Phillip O. Elbert, HC2 Holdings, Inc., Civil Action No. 10359. The Complaints allege, among other things, that in connection with the buyout, the individual members of the Schuff International board of directors and HC2 Holdings, the controlling stockholder of Schuff, breached their fiduciary duties to members of the plaintiff class. The Complaints seek a rescission of the buyout and/or compensatory damages, as well as attorney’s fees and other relief. On February 19, 2015, the court consolidated the actions (now designated as Schuff International, Inc. Stockholders Litigation) and appointed lead plaintiff and counsel. No responsive pleading has been filed yet by the defendants. We believe that the allegations and claims set forth in the Complaint are without merit and intend to defend them vigorously.
On January 16, 2014, Xplornet Communications Inc. and Xplornet Broadband Inc. (“Xplornet”) instituted an action in the Ontario Superior Court of Justice styled Xplornet Communications Inc. and Xplornet Broadband Inc. vs. Inukshuk Wireless Inc., et al. Other defendants include Globility Communications Corporation (“Globility”), MIPPS Inc. (“MIPPS”), Primus Telecommunications Canada Inc. and the Company (sued under its previous name). In such action, Xplornet alleges that it entered into an agreement to acquire certain licenses for radio spectrum in Canada from Globility, a former subsidiary of the Company. Xplornet alleges that Globility agreed to sell Xplornet certain spectrum licenses in a Letter of Intent dated July 12, 2011 but then breached the Letter of Intent by selling the licenses to Inukshuk Wireless Inc. (“Inukshuk”) and that Globility further failed to negotiate with Xplornet in good faith. Xplornet also alleges that it reached an agreement with Inukshuk to purchase the licenses on June 26, 2012, but that Inukshuk breached that agreement by not completing the sale. Xplornet claims that, as a result of the foregoing, it has been damaged in the amount of $50 million. Xplornet also seeks injunctive relief against Inukshuk, pre and post-judgment interest, and costs. We intend to assert that we have meritorious defenses in the foregoing matter and we intend to defend ourselves vigorously.
The Company is indemnifying Primus Telecommunications Canada, Inc., Globility, and MIPPS subject to a full reservation of rights pursuant to the Equity Purchase Agreement among PTUS, Inc., PTCAN, Inc. Primus Telecommunications Group, Incorporated, Primus Telecommunications Holding, Inc., Lingo Holdings, Inc. and Primus Telecommunications International, Inc. dated as of May 10, 2013 in connection with this case.
F-45
On March 13, 2015, Inukshuk Wireless Partnership filed a cross claim against Globility, MIPPS, Primus Telecommunications Canada Inc., and the Company. Inukshuk asserts that if Inukshuk is found liable to Xplornet, then Inukshuk is entitled to contribution and indemnity, compensatory damages, interest, and costs from the Company. Inukshuk alleges that Globility represented and warranted that it owned the licenses at issue, that Globility held the licenses free and clear, and that no third party had any rights to acquire them. Inukshuk claims breach of contract and misrepresentation if the Court finds that any of these representations are untrue. We intend to assert that we have meritorious defenses to the cross claim and we intend to defend ourselves vigorously.
In December 2012, British Petroleum (“BP”) brought suit against Carboline Company (“Carboline”), Trinity Steel Fabricators, Inc. (“Trinity”), the Schuff’s subsidiary, Schuff Steel Company (“SSC”), Tecon Services, Inc. (“Tecon”) and Alfred Miller Contracting Company (“AMC”) in regards to fabrication work on a BP refinery in Indiana. BP alleged that the Schuff subsidiary and others defectively fireproofed certain pieces of steel used in a modernization project at the refinery. AMC and Tecon filed a Petition for Damages and Declaratory Judgment against Caroline, BP Corporation North America Inc., BP Products North America, Trinity, SSC, Schuff Steel-Gulf Coast, Inc., and others. In April 2014, the lawsuits were successfully mediated and a confidential settlement agreement was executed on June 16, 2014. Both cases were dismissed in July 2014.
The Company is subject to claims and legal proceedings that arise in the ordinary course of business. Such matters are inherently uncertain, and there can be no guarantee that the outcome of any such matter will be decided favorably to the Company or that the resolution of any such matter will not have a material adverse effect upon the Company’s business, consolidated financial position, results of operations or cash flow. The Company does not believe that any of such pending claims and legal proceedings will have a material adverse effect on its business, consolidated financial position, results of operations or cash flow.
12. EMPLOYEE RETIREMENT PLANS
HC2
The Company sponsors a 401(k) employee benefit plan (the “401(k) Plan”) that covers substantially all United States based employees. Employees may contribute amounts to the 401(k) Plan not to exceed statutory limitations. The 401(k) Plan provides an employer matching contribution in cash of 50% of the first 6% of employee annual salary contributions capped at $6,000.
The matching contribution made during the years ended December 31, 2014, 2013 and 2012 was $88 thousand, $215 thousand and $368 thousand.
Schuff
Certain of Schuff’s fabrication and erection workforce are subject to collective bargaining agreements. Schuff contributes to union-sponsored, multi-employer pension plans. Contributions are made in accordance with negotiated labor contracts. The passage of the Multi-Employer Pension Plan Amendments Act of 1980 (the “Act”) may, under certain circumstances, cause Schuff to become subject to liabilities in excess of contributions made under collective bargaining agreements. Generally, liabilities are contingent upon the termination, withdrawal, or partial withdrawal from the plans. Under the Act, liabilities would be based upon Schuff’s proportionate share of each plan’s unfunded vested benefits.
Effective March 31, 2012, Schuff withdrew from the Steelworkers Pension Trust and incurred an initial withdrawal liability of approximately $2.6 million. During 2013, Schuff negotiated with the Steelworkers Pension Trust and reduced the liability to approximately $2.4 million. Schuff is required to make quarterly payments of approximately $0.2 million through September 1, 2015. The remaining balance of the withdrawal liability at December 31, 2014 was approximately $0.6 million, and is included in other liabilities in the consolidated balance sheets.
Schuff made contributions to the California Ironworkers Field Pension Trust (“Field Pension”) of $2.5 million during the year ended December 31, 2014. Schuff’s funding policy is to make monthly contributions to the plan. Schuff’s employees represent less than 5% of the participants in the Field Pension. As of December 31, 2014, Schuff has not undertaken to terminate, withdraw, or partially withdraw from the Field Pension.
To replace the benefits associated with the Steelworkers Pension Trust upon Schuff’s withdrawal from that plan, Schuff agreed to make profit share contributions to a 401(k) defined contribution retirement savings plan (the “Union 401k”) for union
F-46
steelworkers. Contributions made to the Union 401k by union steelworkers are 100% vested immediately. Union steelworkers are eligible for the profit share contributions after completing a probationary period (640 of work) and are 100% vested in the profit share contributions three years from the date of hire. Union steelworkers are not required to make contributions to the Union 401(k) to receive the profit share contributions. Profit share contributions are made for each hour worked by each eligible union steelworker at a rate of $0.55 per hour. Profit share contributions amounted to approximately $89,000 for the year ended December 31, 2014.
Schuff maintains a 401(k) retirement savings plan which covers eligible employees and permits participants to contribute to the plan, subject to Internal Revenue Code restrictions and which features matching contributions. The matching contributions for the year ended December 31, 2014 was $373 thousand.
GMSL
GMSL has established a number of pension schemes and contribute to other pension schemes around the world covering many of its employees. The principal funds are those in the UK comprising The Global Marine Systems Pension Plan, The Global Marine Personal Pension Plan (established in 2008), and Global Marine Systems (Guernsey) Pension Plan. A small number of employees are members of the Merchant Navy Officers Pension Fund, a centralized defined benefit scheme to which the GMSL contributes.
The Global Marine Systems Pension Plan, the Global Marine Systems (Guernsey) Pension Plan and the Merchant Navy Officers Pension Fund are defined benefit plans with assets held in separate trustee administered funds. However as the Global Marine Systems (Guernsey) Pension Plan, which operates both a Career Average Re-valued Earnings (“CARE”) defined benefit section and a defined contribution section is small with few members, the scheme is accounted for as defined contribution type plan. The Global Marine Personal Pension Plan is predominantly of the money purchase type.
The Global Marine Systems Pension Plan was a hybrid, exempt approved, occupational pension scheme for the majority of staff, which provides pension and death in service benefits. The defined benefit section of the Plan provided final salary benefits up to December 31, 2003 and CARE benefits from January 1, 2004. In 2008 the defined contribution section was closed to new contributions and all the accumulated funds attributable to the defined contribution members were transferred to a Contracted in Money Purchase Scheme (“CIMP”) set up by GMSL. These funds were held on behalf of the defined contribution members and were all transferred to the Global Marine Personal Pension plan of each member on or before June 30, 2009. From August 31, 2006 the defined benefit section of the Scheme closed to future accrual and active members were offered membership of the existing defined contribution section (with some enhanced benefits).
Global Marine Systems Pension Plan—Defined Benefit Section
The defined benefit section of the Global Marine Systems Plan (prior to its closure on August 31, 2006) was contributory, with employees contributing between 5% and 8% (depending on their age) and the employer contributing at a rate of 9.2% of pensionable salary plus deficit contributions of $1.5 million per year.
The defined benefit section of the Global Marine Systems Pension Plan is funded by the payment of contributions determined with the advice of qualified independent actuaries on the basis of triennial valuations using the projected unit method. The most recent full actuarial valuation was conducted as of December 31, 2013 for the purpose of determining the funding requirements of the plan. An actuarial valuation was conducted as of December 31, 2014 for the purpose of meeting US GAAP requirements. The main assumptions used were that Retail Price Inflation would be 3.7% per year, Consumer Price Inflation would be 2.7% per year, the rate of return on investments (pre-retirement) would be would be 5.5% per year, the rate of return on investments (post-retirement) would be 4.5% per year, with pensions increasing by 3% per year. At the actuarial valuation date the market value of the defined benefit section’s assets amounted to $146.7 million. On a statutory funding objective basis the value of these assets covered the value of technical provisions by 74%.
Following the 2013 actuarial valuation contributions are payable by GMSL as follows:
• | $0.5 million payable every month during calendar year 2014; |
• | $0.5 million payable every month during calendar years 2015 to 2018; |
• | $0.6 million payable every month during calendar years 2019 to May 2021; |
• | $0.2 million payable in June 2021; |
F-47
• | GMSL will pay 10% of profits after tax before dividends. This will be paid up to two years following the year end to enable budgeting and cash flow control; and |
• | GMSL will pay a cash sum equal to 50% of any future dividend payments. |
Global Marine Personal Pension Plan
This is a defined contribution pension scheme and is contributory from the employee; the rate of contributions is split as follows:
• | ex CARE employees contributing between 2.5% and 7.5% and the employer contributing at a matching rate plus an additional 5% fixed contributions and |
• | defined contribution employees contributing between 2% and 7.5% and the employer contributing at a matching rate. |
For the period September 22 to December 31, 2014, GMSL made matching contributions of $0.4 million.
Merchant Navy Officers Pension Fund
The Merchant Navy Officers Pension Fund is funded by the payment of contributions determined with the advice of qualified independent actuaries on the basis of triennial valuations using the projected unit method. The most recent available full actuarial valuation was conducted as at March 31, 2012 for the purpose of determining the funding requirements of the plan. An actuarial valuation was conducted as of December 31, 2014 for the purpose of meeting US GAAP requirements. The main assumptions used were that Retail Price Inflation would be 3.2% per year, Consumer Price Inflation would be 2.2% per year, the rate of return on investments (pre-retirement) would be 5.7% per year, the rate of return on investments (post-retirement) would be 4.0% per year and the rate of salary increases 4.2% per year with pensions increasing by 3.0% per year.
At the actuarial valuation date the market value of the total assets in the scheme amounted to $3.5 billion of which 0.05594% ($1.9 million) relates to the Global Marine Systems Group. On an on-going basis the value of these assets, together with the deficit contributions receivable of $528 million, covered the value of pensioner liabilities, preserved pension liabilities for former employees and the value of benefits for active members based on accrued service and projected salaries, to the extent of 94%.
Following the 2012 actuarial valuation, contributions are payable by the Group as follows:
• | Increase Employer contributions to 20% of pensionable salaries from October 1, 2013. |
Global Marine Systems (Guernsey) Pension Plan
The defined benefit section of the Guernsey Scheme is contributory, with employees contributing between 5% and 8% (depending on their age), the employer ceased contributing after July 2004. The defined contribution section is also contributory, with employees contributing between 2% and 7.5% (depending on their age and individual choice) and the employer contributing at a matching rate. The defined benefit section of the Guernsey Scheme is funded by the payment of contributions determined with the advice of qualified independent actuaries on the basis of triennial valuations using the projected unit method.
The most recent full actuarial valuation was conducted as of December 31, 2010 for the purpose of determining the funding requirements of the plan. An actuarial valuation was conducted as of December 31, 2014 for the purpose of meeting US GAAP requirements. The principal actuarial assumptions used by the actuary were investment returns of 5.7% per year pre-retirement, 4.8% per year post-retirement, inflation of 3.7% per year and pension increases of 3.4% per year.
At the valuation date the market value of the assets amounted to $2.0 million. The results show a past service shortfall of $0.6 million corresponding to a funding ratio of 76%.
Following the actuarial valuation as at December 31, 2010, contributions are as follows:
• | 19.5% of Pensionable Salaries from January 1, 2012 for future final salary benefits and management expenses. |
• | Seven annual contributions of $0.1 million from December 31, 2014 to 2020. |
F-48
Collectively hereafter, the defined benefit plans will be referred to as the “Plans”.
Obligations and Funded Status
For all company sponsored defined benefit plans and our portion of the Merchant Navy Officers Pension Fund, the benefit obligation is the “projected benefit obligation,” the actuarial present value, as of our December 31 measurement date, of all benefits attributed by the pension benefit formula to employee service rendered to that date. The amount of benefit to be paid depends on a number of future events incorporated into the pension benefit formula, including estimates of the average life of employees/survivors and average years of service rendered. It is measured based on assumptions concerning future interest rates and future employee compensation levels.
The following table presents this reconciliation and shows the change in the projected benefit obligation for the Plans for the period from September 22 through December 31, 2014:
(in thousands) | |||
Projected benefit obligation at September 22, 2014 | $ | 206,735 | |
Service cost - benefits earning during the period | 14 | ||
Interest cost on projected benefit obligation | 2,017 | ||
Contributions | 8 | ||
Actuarial loss | 12,480 | ||
Benefits paid | (2,167 | ) | |
Projected benefit obligation at December 31, 2014 | $ | 219,087 | |
The following table presents the change in the value of the assets of the Plans for the period from September 22 through December 31, 2014 and the plans’ funded status at December 31, 2014:
(in thousands) | |||
Fair value of plan assets at September 22, 2014 | $ | 160,812 | |
Actual return on plan assets | 14,873 | ||
Benefits paid | (2,167 | ) | |
Contributions | 6,641 | ||
Foreign currency gain (loss) | 1,718 | ||
Fair value of plan assets at December 31, 2014 | 181,877 | ||
Unfunded status at end of year | $ | 37,210 | |
Amounts recognized in the consolidated balance sheets at December 31, 2014 are listed below:
(in thousands) | |||
Pension Liability | $ | 37,210 | |
Net amount recognized | $ | 37,210 | |
The accumulated benefit obligation for the Plans represents the actuarial present value of benefits based on employee service and compensation as of a certain date and does not include an assumption about future compensation levels.
As of December 31, 2014 contributions of $0.1 million were due to be payable to the Plans.
Net Periodic Benefit Cost and Other Amounts Recognized in Other Comprehensive Income
Periodic Benefit Costs
The aggregate net pension cost recognized in the consolidated statements of operations was $69,000, included in cost of revenue for the period from September 22, 2014 through December 31, 2014.
F-49
The following table presents the components of net periodic benefit cost:
(in thousands) | |||
Components of Net Periodic Benefit Costs: | |||
Service cost—benefits earning during the period | $ | 14 | |
Interest cost on projected benefit obligation | 1,978 | ||
Expected return on assets | (1,923 | ) | |
Net pension benefit | 69 | ||
Other changes in plan assets and benefit obligations recognized in other comprehensive income: | |||
Net actuarial (gain) | (426 | ) | |
Total recognized in Other Comprehensive Income | (426 | ) | |
Total recognized in net pension benefit cost and other comprehensive income | $ | (357 | ) |
In determining the net periodic pension cost for the Plans, GMSL used the following weighted average assumptions: the pension increase assumption is that for benefits increasing with RPI limited to 5% per year, to which the majority of the Plan’s liabilities relate. The Group employs a building block approach in determining the long-term rate of return of pension plan assets. Historical markets are studied and assets with higher volatility are assumed to generate higher returns consistent with widely accepted capital market principles. The overall expected rate of return on assets is then derived by aggregating the expected return for each asset class over the actual asset allocation for the Plans as of December 31, 2014.
Year Ended December 31, 2014 | ||
Discount rate | 3.60 | % |
Rate of compensation increases (Merchant Navy Officers Pension Fund only) | 4.50 | % |
Rate of future RPI inflation | 3.00 | % |
Rate of future CPI inflation | 2.00 | % |
Pension increases in payment | 2.85 | % |
Long-term rate of return on assets | 4.43 | % |
Estimated Future Benefit Payments
Expected benefit payments are estimated using the same assumptions used in determining the Plan’s benefit obligation at December 31, 2014. Because benefit payments will depend on future employment and compensation levels, average years employed, average life spans, and payment elections, among other factors, changes in any of these factors could significantly affect these expected amounts. The following table provides expected benefit payments under our pension and postretirement plans:
(in thousands) | |||
2015 | $ | 5,736 | |
2016 | 5,885 | ||
2017 | 6,037 | ||
2018 | 6,194 | ||
2019 | 6,355 | ||
Thereafter | 34,336 | ||
$ | 64,543 | ||
Aggregate expected contributions in the coming fiscal year are expected to be $6.3 million.
Plan Assets—Description of plan assets and investment objectives
F-50
The assets of the Plans consist primarily of private and public equity, government and corporate bonds, among others. The asset allocations of the Plans are maintained to meet regulatory requirements where applicable. Any contributions to the Plans are made to a pension trust for the benefit of plan participants.
The principal investment objectives are to ensure the availability of funds to pay pension benefits as they become due under a broad range of future economic scenarios, to maximize long-term investment return with an acceptable level of risk based on our pension and postretirement obligations, and to be broadly diversified across and within the capital markets to insulate asset values against adverse experience in any one market. Each asset class has broadly diversified characteristics. Substantial biases toward any particular investing style or type of security are sought to be avoided by managing the aggregation of all accounts with portfolio benchmarks. Asset and benefit obligation forecasting studies are conducted periodically, generally every two to three years, or when significant changes have occurred in market conditions, benefits, participant demographics or funded status. Decisions regarding investment policy are made with an understanding of the effect of asset allocation on funded status, future contributions and projected expenses.
The plans’ weighted-average asset targets and actual allocations as a percentage of plan assets, including the notional exposure of future contracts by asset categories at December 31, are as follows:
Target | December 31, 2014 | ||||
Liability hedging | 25.0 | % | 21.5 | % | |
Equities | 24.2 | % | 24.6 | % | |
Hedge funds | 24.7 | % | 25.5 | % | |
Corporate bonds | 13.8 | % | 14.9 | % | |
Emerging markets | 5.6 | % | 5.0 | % | |
Property | 3.7 | % | 4.0 | % | |
Other | 3.0 | % | 4.5 | % | |
100.0 | % | ||||
Investment Valuation
GMSL’s plan investments related to the Global Marine Systems Pension Plan consist of the following at December 31, 2014:
(in thousands) | |||
Equities | $ | 45,198 | |
Liability Hedging Assets | 39,626 | ||
Hedge Funds | 40,853 | ||
Corporate Bonds | 20,238 | ||
Property | 8,847 | ||
Other | 14,777 | ||
Total market value of assets | 169,539 | ||
Present value of liabilities | (206,853 | ) | |
Net pension liability | $ | (37,314 | ) |
GMSL’s plan investments related to the Merchant Navy Officers Pension Fund consist of the following at December 31, 2014:
F-51
(in thousands) | |||
Equities | $ | 699 | |
Hedge Funds | 435 | ||
Corporate Bonds | 715 | ||
LDI Strategy | 1,255 | ||
Total market value of assets | 3,104 | ||
Present value of liabilities | (3,000 | ) | |
Net pension asset (liability) | $ | 104 | |
Investments are stated at fair value. Fair value is the price that would be received to sell an asset or paid to transfer a liability in an orderly transaction between market participants at the measurement date. Generally, investments are valued based on information provided by fund managers to our trustee as reviewed by management and its investment advisers.
Investments in securities traded on a national securities exchange are valued at the last reported sales price on the last business day of the year. If no sale was reported on that date, they are valued at the last reported bid price. Investments in securities not traded on a national securities exchange are valued using pricing models, quoted prices of securities with similar characteristics or discounted cash flows. Over-the-counter (OTC) securities and government obligations are valued at the bid price or the average of the bid and asked price on the last business day of the year from published sources where available and, if not available, from other sources considered reliable. Depending on the types and contractual terms of OTC derivatives, fair value is measured using a series of techniques, such as Black-Scholes option pricing model, simulation models or a combination of various models.
Alternative investments, including investments in private equities, private bonds, limited partnerships, hedge funds, real assets and natural resources, do not have readily available market values. These estimated fair values may differ significantly from the values that would have been used had a ready market for these investments existed, and such differences could be material. Private equity, private bonds, limited partnership interests, hedge funds and other investments not having an established market are valued at net asset values as determined by the investment managers, which management has determined approximates fair value. Private equity investments are often valued initially based upon cost; however, valuations are reviewed utilizing available market data to determine if the carrying value of these investments should be adjusted. Such market data primarily includes observations of the trading multiples of public companies considered comparable to the private companies being valued. Investments in real assets funds are stated at the aggregate net asset value of the units of these funds, which management has determined approximates fair value. Real assets and natural resource investments are valued either at amounts based upon appraisal reports prepared by appraisers or at amounts as determined by an internal appraisal performed by the investment manager, which management has determined approximates fair value.
Purchases and sales of securities are recorded as of the trade date. Realized gains and losses on sales of securities are determined on the basis of average cost. Interest income is recognized on the accrual basis. Dividend income is recognized on the ex-dividend date.
The following table sets forth by level, within the fair value hierarchy, the pension assets and liabilities at fair value as of December 31, 2014 for the Global Marine Systems Pension Plan:
(in thousands) | Level 1 | Level 2 | Total | ||||||||
Equities | $ | — | $ | 45,198 | $ | 45,198 | |||||
Liability Hedging Assets | — | 39,626 | 39,626 | ||||||||
Hedge Funds | — | 40,853 | 40,853 | ||||||||
Corporate Bonds | — | 20,238 | 20,238 | ||||||||
Property | — | 8,847 | 8,847 | ||||||||
Other | 14,777 | — | 14,777 | ||||||||
Total Plan Net Assets | $ | 14,777 | $ | 154,762 | $ | 169,539 | |||||
The following table sets forth by level, within the fair value hierarchy, the pension assets and liabilities at fair value as of December 31, 2014 for the Merchant Navy Officers Pension Fund:
F-52
(in thousands) | Level 3 | Total | |||||
Equities | $ | 699 | $ | 699 | |||
Hedge Funds | 435 | 435 | |||||
Corporate Bonds | 715 | 715 | |||||
LDI Strategy | 1,255 | 1,255 | |||||
Total Plan Net Assets | $ | 3,104 | $ | 3,104 | |||
The table below set forth a summary of changes in the fair value of the Level 3 pension assets for the period ended December 31, 2014 for the Merchant Navy Officers Pension Fund:
(in thousands) | |||
Balance at December 31, 2014 | $ | 2,908 | |
Actual return on plan assets | 165 | ||
Contributions | 59 | ||
Benefits paid | (28 | ) | |
Balance at December 31, 2014 | $ | 3,104 | |
13. SHARE-BASED COMPENSATION
On April 11, 2014, HC2’s Board of Directors adopted the HC2 Holdings, Inc. 2014 Omnibus Equity Award Plan (the “Omnibus Plan”), which was approved by our stockholders at the annual meeting of stockholders held on June 12, 2014. The Omnibus Plan provides that no further awards will be granted pursuant to HC2’s Management Compensation Plan, as amended (the “Prior Plan”). However, awards that had been previously granted pursuant to the Prior Plan will continue to be subject to and governed by the terms of the Prior Plan. As of December 31, 2014, there were 472,002 shares of HC2 common stock underlying outstanding awards under the Prior Plan.
The Compensation Committee (the “Committee”) of the Board of Directors of HC2 administers HC2’s Omnibus Plan and the Prior Plan and has broad authority to administer, construe and interpret the plans.
The Omnibus Plan provides for the grant of awards of non-qualified stock options, incentive (qualified) stock options, stock appreciation rights, restricted stock awards, restricted stock units, other stock based awards, performance compensation awards (including cash bonus awards) or any combination of the foregoing. HC2 typically issues new shares of common stock upon the exercise of stock options, as opposed to using treasury shares. The Omnibus Plan authorizes the issuance of up to 5,000,000 shares of HC2 common stock, subject to adjustment as provided in the Omnibus Plan.
The Company follows guidance which addresses the accounting for share-based payment transactions whereby an entity receives employee services in exchange for either equity instruments of the enterprise or liabilities that are based on the fair value of the enterprise’s equity instruments or that may be settled by the issuance of such equity instruments. The guidance generally requires that such transactions be accounted for using a fair-value based method and share-based compensation expense be recorded, based on the grant date fair value, estimated in accordance with the guidance, for all new and unvested stock awards that are ultimately expected to vest as the requisite service is rendered.
There were 5,234,849 and 690,948 options granted during the years ended December 31, 2014 and 2013, respectively. Of the 5,234,849 options granted during the year ended December 31, 2014, 5,133,028 of such options were granted to Philip Falcone, pursuant to a standalone option agreement entered in connection with Mr. Falcone’s appointment as Chairman, President and Chief Executive Officer of HC2, and not pursuant to the Omnibus Plan. The weighted average fair value at date of grant for options granted during the year ended December 31, 2014, 2013 and 2012 was $1.00, $0.26 and $1.63, respectively, per option. The fair value of each option grant was estimated on the date of grant using the Black-Scholes option-pricing model with the following assumptions shown as a weighted average for the year:
F-53
Years Ended December 31, | |||||
2014 | 2013 | 2012 | |||
Expected option life | 5.5 - 6 years | 4 - 5.75 years | 4 - 5.75 years | ||
Risk-free interest rate | 1.61 - 2.73% | 1.17 - 1.73% | 0.57 - 0.89% | ||
Expected volatility | 36.74 - 40.50% | 35.55 - 37.23% | 35.83 - 36.64% | ||
Dividend yield | —% | —% | —% | ||
Total share-based compensation expense recognized by the Company was $11.0 million (as restated), $2.3 million and $5.2 million for the years ended December 31, 2014, 2013 and 2012, respectively. Most of HC2’s stock awards vest ratably during the vesting period. The Company recognizes compensation expense for equity awards, reduced by estimated forfeitures, using the straight-line basis.
Restricted Stock
A summary of HC2’s restricted stock activity during the years ended December 31, 2014 and 2013 is as follows:
Shares | Weighted Average Grant Date Fair Value | |||||
Unvested—January 1, 2013 | 286,208 | $ | 12.91 | |||
Granted | 20,000 | $ | 11.89 | |||
Vested | (283,626 | ) | $ | 12.79 | ||
Forfeitures | (82 | ) | $ | 15.60 | ||
Unvested—December 31, 2013 | 22,500 | $ | 13.59 | |||
Granted | 502,172 | $ | 4.21 | |||
Vested | (185,970 | ) | $ | 5.25 | ||
Forfeitures | — | $ | — | |||
Unvested—December 31, 2014 | 338,702 | $ | 4.26 | |||
As of December 31, 2014, the unvested restricted stock represented $1.2 million of compensation expense that is expected to be recognized over the weighted average remaining vesting period of 1.5 years. The number of shares of unvested restricted stock expected to vest is 338,702.
In January 2014, the Board of Directors of HC2 accelerated the vesting of 15,000 RSUs, awarded to certain non-employee directors in conjunction with their departure from the Board of Directors. During the year ended December 31, 2013, the Board of Directors of HC2 accelerated the vesting of 98,280 RSUs awarded to certain employees as part of severance agreements. In addition, on December 31, 2013, the Board of Directors of HC2 accelerated the vesting of 28,833 RSUs, awarded to certain non-employee directors in conjunction with their departure from the Board of Directors. Share-based compensation expense recognized during the year ended December 31, 2013 from the accelerated vesting was $1.5 million.
Stock Options
A summary of HC2’s stock option activity during the years ended December 31, 2014 and 2013 is as follows:
F-54
Shares | Weighted Average Exercise Price | |||||
Outstanding—January 1, 2013 | 212,244 | $ | 9.24 | |||
Granted | 690,948 | $ | 3.64 | |||
Exercised | (75,564 | ) | $ | 5.93 | ||
Forfeitures | (237,769 | ) | $ | 9.07 | ||
Outstanding—December 31, 2013 | 589,859 | $ | 3.17 | |||
Granted | 5,234,849 | $ | 4.22 | |||
Exercised | (230,300 | ) | $ | 2.43 | ||
Forfeitures | (2,021,267 | ) | $ | 4.11 | ||
Outstanding—December 31, 2014 (As Restated) | 3,573,141 | $ | 4.27 | |||
Eligible for exercise (As Restated) | 1,260,644 | $ | 4.22 | |||
As a result of certain special cash dividends on HC2’s issued and outstanding common stock paid in 2012 and 2013, the Company reduced the exercise price and increased the number of shares of common stock issuable upon exercise of such options. The Company has evaluated the accounting impact of modification accounting under ASC 718 and concluded that the modification of the terms of such instruments did not result in a significant change in fair value before and after the modification date. For the year ended December 31, 2013, there were 650,948 options granted (with a weighted average exercise price of $3.13) and 203,654 options forfeited (with a weighted average exercise price of $10.02) included in the chart above related to these adjustments.
The following table summarizes the intrinsic values and remaining contractual terms of HC2’s stock options (in thousands):
Intrinsic Value | Weighted Average Remaining Life in Years (As Restated) | ||||
Options outstanding—December 31, 2014 | $ | 14,828 | 9.6 | ||
Options exercisable—December 31, 2014 | $ | 5,292 | 9.4 | ||
During the year ended December 31, 2014, the intrinsic value of the exercised options was $0.3 million. As of December 31, 2014, the Company had 2,312,497 unvested stock options outstanding of which $2.6 million of compensation expense is expected to be recognized over the weighted average remaining vesting period of 1.5 years. The number of unvested stock options expected to vest is 2,312,497 shares, with a weighted average remaining life of 9.6, a weighted average exercise price of $4.27, and an intrinsic value of $9.5 million.
14. EQUITY
As of December 31, 2014 and 2013, there were 23,813,085 and 14,225,919 shares of common stock outstanding, respectively. As of December 31, 2014 and 2013, there were 41,000 and 0 shares of preferred stock outstanding, respectively.
Class A and B Warrants
In July 2009, HC2 issued (A) Class A warrants (the “Class A Warrants”) to purchase shares of HC2’s common stock, which were divided into three separate series (Class A-1, Class A-2 and Class A-3 Warrants), each of which series consisted of 1,000,000 warrants to purchase an original aggregate amount of up to 1,000,000 shares of HC2 common stock; and (B) Class B warrants (the “Class B Warrants” and, together with the Class A Warrants, the “Warrants”) to purchase an original aggregate amount of up to 1,500,000 shares of HC2 common stock. In connection with the issuance of the Warrants, HC2 entered into a Warrant Agreement for each of the Class A Warrants and the Class B Warrants, in each case with Broadridge Financial Solutions, Inc. (successor-in-interest to StockTrans, Inc.), as warrant agent. The Warrants had a 5-year term which expired on July 1, 2014. As a result of special cash dividends paid in 2012 and 2013, antidilution adjustment provisions were triggered and the original exercise price and the number of shares of HC2 common stock issuable upon exercise were adjusted.
F-55
There were 878,940 Class A-1 Warrants exercised during the year ended December 31, 2014, resulting in the issuance of 3,855,289 shares of HC2’s common stock. There were 780,753 Class A-2 Warrants exercised during the year ended December 31, 2014, resulting in the issuance of 3,424,641 shares of HC2’s common stock. There were 5,709 Class A-3 Warrants exercised during the year ended December 31, 2014, resulting in the issuance of 25,041 shares of HC2’s common stock. The warrants expired on July 1, 2014.
Preferred and Common Stock
On May 29, 2014, HC2 issued 30,000 shares of Series A Preferred Stock and 1,500,000 shares of common stock, the proceeds of which were used to pay for a portion of the purchase price for the acquisition of Schuff. On September 22, 2014, HC2 issued 11,000 shares of Series A-1 Preferred Stock. Each share of Series A-1 Preferred Stock is convertible at a conversion price of $4.25. In connection with the issuance of the Series A-1 Preferred Stock, HC2 amended the certificate of designation governing the Series A Preferred Stock on September 22, 2014, which changed the applicable conversion price from $4.25 to $4.00, reflected the issuance of the Series A-1 Preferred Stock as a class of preferred stock which ranks at parity with the Series A Preferred Stock and made certain other changes to conform the terms of the Series A Preferred Stock to those of the Series A-1 Preferred Stock. As disclosed in Note 22—“Subsequent Events,” on January 5, 2015, HC2 issued 14,000 shares of Series A-2 Convertible Participating Preferred Stock (the “Series A-2 Preferred Stock” and, together with the Series A Preferred Stock and Series A-1 Preferred Stock, the “Preferred Stock”). Each share of Series A-2 Preferred Stock is convertible at a conversion price of $8.25. In connection with the issuance of the Series A-2 Preferred Stock, HC2 amended the certificates of designation governing the Series A Preferred Stock and Series A-1 Preferred Stock on January 5, 2015, which reflected the issuance of the Series A-2 Preferred Stock as a class of preferred stock which ranks at parity with the Series A Preferred Stock and Series A-1 Preferred Stock and made certain other changes to conform the terms of the Series A Preferred Stock and Series A-1 Preferred Stock to those of the Series A-2 Preferred Stock. The conversion prices for the Preferred Stock are subject to adjustments for dividends, certain distributions, stock splits, combinations, reclassifications, reorganizations, mergers, recapitalizations and similar events. The Preferred Stock will accrue a cumulative quarterly cash dividend at an annualized rate of 7.5%. The accrued value of the Preferred Stock will accrete quarterly at an annualized rate of 4% that will be reduced to 2% or 0% if the Company achieves specified rates of growth measured by increases in its net asset value. The preferred stock is classified as temporary equity outside of stockholder’s equity due to its redemption provisions.
The Company recorded a beneficial conversion feature on both of its Series A and Series A-1 Preferred Stock as a result of the fair market value of the Company’s common stock exceeding the conversion price. The Company recorded a $0.3 million beneficial conversion feature on its Series A-1 Preferred Stock which was calculated using the intrinsic value ($4.36—$4.25) multiplied by the number of convertible common shares ($11,000,000 / $4.25). The Company recorded a $0.4 million beneficial conversion feature on its Series A Preferred Stock as a result of the adjustment to the conversion price from $4.25 to $4.00. The beneficial conversion feature was calculated using the intrinsic value ($4.05—$4.00) multiplied by the number of convertible common shares ($30,000,000/ $4.00). The beneficial conversion features are being accreted over seven years so that the preferred stock is at its face value at the end of its redemption period.
Each share of Preferred Stock may be converted by the holder into common stock at any time based on the then-applicable conversion price. On the seventh anniversary of the issue date of the Series A Preferred Stock, holders of the Preferred Stock shall be entitled to cause the Company to redeem the Preferred Stock at the accrued value per share plus accrued but unpaid dividends. Each share of Preferred Stock that is not so redeemed will be automatically converted into shares of common stock at the conversion price then in effect. Upon a change of control, holders of the Preferred Stock shall be entitled to cause HC2 to redeem their Preferred Stock at a price per share equal to the greater of (i) the accrued value of the Preferred Stock, which amount would be multiplied by 150% in the event of a change in control occurring on or prior to the third anniversary of the issue date of the Series A Preferred Stock plus and accrued but unpaid dividends and (ii) the value that would be received if the share of Preferred Stock were converted into common stock immediately prior to the change of control.
At any time after the third anniversary of the issue date of the Series A Preferred Stock, HC2 may redeem the Preferred Stock, in whole but not in part, at a price per share generally equal to 150% of the accrued value per share plus accrued but unpaid dividends. After the third anniversary of the issue date of the Series A Preferred Stock, HC2 may force conversion of the Preferred Stock into common stock if the common stock’s thirty-day volume-weighted average price (“VWAP”) exceeds 150% of the then-applicable conversion price and the common stock’s daily VWAP exceeds 150% of the then-applicable conversion price for at least twenty trading days out of the thirty trading day period used to calculate the thirty-day VWAP.
F-56
Dividends
During 2014, HC2’s Board of Directors declared cash and PIK dividends with respect to HC2’s issued and outstanding preferred stock, as presented in the following table (Total Dividend amount presented in thousands):
Declaration Date | June 30, 2014 | September 30, 2014 | December 31, 2014 | ||||||||
Holders of Record Date | June 30, 2014 | September 30, 2014 | December 31, 2014 | ||||||||
Payment/Accrual Date | July 15, 2014 | October 15, 2014 | January 15, 2015 | ||||||||
Total Dividend | $ | 307 | $ | 897 | $ | 777 | |||||
During 2013, HC2’s Board of Directors declared a special cash dividend with respect to HC2’s issued and outstanding common stock, as presented in the following table (Total Dividend amount presented in thousands):
Cash Dividend Per Share | |||
$8.50 | |||
Declaration Date | August 7, 2013 | ||
Holders of Record Date | August 20, 2013 | ||
Payment Date | August 27, 2013 | ||
Total Dividend | $ | 119,788 | |
15. FAIR VALUE OF FINANCIAL INSTRUMENTS AND DERIVATIVES
The carrying amounts reported in the consolidated balance sheets for cash and cash equivalents, accounts receivable, inventory, costs and recognized earnings in excess of billings, accounts payable, accrued expenses, billings in excess of costs and recognized earnings, and other current assets and liabilities approximate fair value due to relatively short periods to maturity. The Company’s investments in available-for-sale securities, recorded at fair value using quoted market prices (a Level 1 approach), as of December 31, 2014 was $4.9 million. The estimated aggregate fair value of the Company’s debt, based on significant other observable inputs (a Level 2 approach) approximated $338.1 million at December 31, 2014.
16. RELATED PARTIES
Schuff
During the year ended December 31, 2014, Schuff had the following related party transactions:
• | Purchased a home on behalf of an executive for $1.70 million which is recorded as an asset held for sale |
• | Sold 25% investment in United Steel to a former executive in return for 253,039 restricted shares of Schuff and $5.0 million in cash |
• | Purchased 74,625 shares from the Chairman of the Board and former executives for $2.0 million. |
GMSL
As part of the closing GMSL transaction, Dick Fagerstal was awarded a finder's fee in the amount of $1.3 million in equity interests of parent company of GMSL, Global Marine Holdings, LLC ("GMH"). Contemporaneously, Mr. Fagerstal, a director of GMSL, and CEO of GMH, invested $2.0 million in equity interests of GMH through his investment vehicle Zencor Holdings LLC.
On December 3, 2014, GMSL and GMH entered into a management agreement with Zencor Holdings LLC. During the year ended December 31, 2014, GMH paid management fees to Zencor Holdings LLC in the amount $0.1 million.
GMSL has investments in various entities for which it exercises significant influence. Summary of transactions during the year and balances outstanding at year-end is as follows (in thousands):
F-57
Year ended December 31, 2014 | |||
Revenue | $ | 6,625 | |
Operating costs | 900 | ||
Capital lease interest | 436 | ||
Dividends received | 3,714 | ||
December 31, 2014 | |||
Accounts receivable | $ | 2,585 | |
Obligations under capital leases | 42,296 | ||
Trade creditors | 436 | ||
17. OPERATING SEGMENT AND RELATED INFORMATION
The Company currently has two primary reportable geographic segments—United States and United Kingdom; and Other. The Company has 6 reportable operating segments based on management’s organization of the enterprise—Telecommunications, Life Sciences, Manufacturing, Marine Services, Utilities, and Other. The Company also has non-operating Corporate segment. Net revenue and long-lived assets by geographic segment is reported on the basis of where the entity is domiciled. All inter-segment revenues are eliminated. The Company has no single customer representing greater than 10% of its revenues.
Summary information with respect to the Company’s geographic and operating segments is as follows (in thousands):
Years Ended December 31, | |||||||||||
2014 (As Restated) | 2013 | 2012 | |||||||||
Net Revenue by Geographic Region | |||||||||||
United States | $ | 442,472 | $ | 108,563 | $ | 100,753 | |||||
United Kingdom | 97,653 | 122,123 | 202,206 | ||||||||
Other | 7,313 | — | — | ||||||||
Total | $ | 547,438 | $ | 230,686 | $ | 302,959 | |||||
Net Revenue by Segment | |||||||||||
Telecommunications | $ | 161,953 | $ | 230,686 | $ | 302,959 | |||||
Manufacturing | 348,318 | — | — | ||||||||
Utilities | 1,839 | — | — | ||||||||
Marine Services | 35,328 | — | — | ||||||||
Total | $ | 547,438 | $ | 230,686 | $ | 302,959 | |||||
Income (Loss) from Operations | |||||||||||
Telecommunications | $ | (1,840 | ) | $ | (19,705 | ) | $ | (17,187 | ) | ||
Life Sciences | (4,762 | ) | — | — | |||||||
Manufacturing | 26,359 | — | — | ||||||||
Utilities | (491 | ) | — | — | |||||||
Marine Services | 4,729 | — | — | ||||||||
Other | (8,002 | ) | — | — | |||||||
Corporate | (29,599 | ) | (19,431 | ) | (34,709 | ) | |||||
Total | $ | (13,606 | ) | $ | (39,136 | ) | $ | (51,896 | ) | ||
Capital Expenditures | |||||||||||
Telecommunications | $ | 42 | $ | 1,390 | $ | 1,452 | |||||
Manufacturing | 5,039 | — | — | ||||||||
Utilities | 803 | — | — | ||||||||
Marine Services | (863 | ) | — | — | |||||||
Other (1) | 798 | 11,187 | 29,999 | ||||||||
Corporate | — | — | 296 | ||||||||
Total | $ | 5,819 | $ | 12,577 | $ | 31,747 | |||||
(1) Other also includes capital expenditures related to discontinued operations.
The above capital expenditures exclude assets acquired under terms of capital lease and vendor financing obligations.
F-58
December 31, | |||||||||||
2014 (As Restated) | 2013 | 2012 | |||||||||
Long-term investments | |||||||||||
Life Sciences | $ | 1,916 | $ | — | $ | — | |||||
Marine Services | 28,543 | — | — | ||||||||
Corporate | 20,357 | — | — | ||||||||
Total | $ | 50,816 | $ | — | $ | — | |||||
December 31, | |||||||||||
2014 (As Restated) | 2013 | 2012 | |||||||||
Property, Plant and Equipment—Net | |||||||||||
United States | $ | 87,091 | $ | 2,303 | $ | 2,335 | |||||
United Kingdom | 140,494 | 659 | — | ||||||||
Other (1) | 5,437 | — | 62,980 | ||||||||
Total | $ | 233,022 | $ | 2,962 | $ | 65,315 | |||||
December 31, | |||||||||||
2014 (As Restated) | 2013 | 2012 | |||||||||
Total Assets | |||||||||||
Telecommunications | $ | 25,164 | $ | 33,397 | $ | 44,710 | |||||
Life Sciences | 11,007 | — | — | ||||||||
Manufacturing | 281,067 | — | — | ||||||||
Utilities | 26,765 | — | — | ||||||||
Marine Services | 280,334 | — | — | ||||||||
Other (1) | 6,369 | 7,423 | 223,899 | ||||||||
Corporate | 89,297 | 46,860 | 32,581 | ||||||||
Total | $ | 720,003 | $ | 87,680 | $ | 301,190 | |||||
(1) | Other also includes property, plant and equipment—net and total assets related to discontinued operations. |
18. QUARTERLY RESULTS OF OPERATIONS (UNAUDITED)
The following is a tabulation of the unaudited quarterly results of operations for the years ended December 31, 2014, 2013.
F-59
Quarters Ended | |||||||||||||||
(in thousands, except per share amounts) | |||||||||||||||
March 31, 2014 | June 30, 2014 (As Restated) | September 30, 2014 (As Restated) | December 31, 2014 (As Restated) | ||||||||||||
Services revenue | $ | 43,354 | $ | 42,178 | $ | 45,123 | $ | 66,571 | |||||||
Sales revenue | — | 54,408 | 138,166 | 157,638 | |||||||||||
Net revenue | 43,354 | 96,586 | 183,289 | 224,209 | |||||||||||
Cost of revenue—services | 41,107 | 39,530 | 42,320 | 54,855 | |||||||||||
Cost of revenue—sales | — | 43,330 | 119,175 | 134,025 | |||||||||||
Total cost of revenue | 41,107 | 82,860 | 161,495 | 188,880 | |||||||||||
Income (loss) from operations | (4,087 | ) | (116 | ) | (2,580 | ) | (6,823 | ) | |||||||
Income (loss) from continuing operations attributable to HC2 Holdings, Inc.—common holders | (4,180 | ) | (4,136 | ) | (18,957 | ) | 7,563 | ||||||||
Income (loss) from continuing operations attributable to HC2 Holdings, Inc.—preferred holders | — | — | — | 3,416 | |||||||||||
Income (loss) from discontinued operations | 17 | 27 | (106 | ) | 37 | ||||||||||
Gain (loss) from sale of discontinued operations | (784 | ) | — | 663 | — | ||||||||||
Net income (loss)—basic | $ | (4,947 | ) | $ | (4,109 | ) | $ | (18,400 | ) | $ | 11,016 | ||||
Net income (loss)—diluted | $ | (4,947 | ) | $ | (4,109 | ) | $ | (18,400 | ) | $ | 11,016 | ||||
Weighted average common shares outstanding-basic | 14,631 | 16,905 | 23,372 | 23,813 | |||||||||||
Weighted average common shares outstanding-diluted | 14,631 | 16,905 | 23,372 | 28,962 | |||||||||||
Basic income (loss) per common share: | |||||||||||||||
Income (loss) from continuing operations attributable to HC2 Holdings, Inc.—common holders | $ | (0.29 | ) | $ | (0.24 | ) | $ | (0.82 | ) | $ | 0.32 | ||||
Income (loss) from continuing operations attributable to HC2 Holdings, Inc.—preferred holders | — | — | — | 0.34 | |||||||||||
Income (loss) from discontinued operations | — | — | — | — | |||||||||||
Gain (loss) from sale of discontinued operations | (0.05 | ) | — | 0.03 | — | ||||||||||
Net income (loss) attributable to HC2 Holdings, Inc. | $ | (0.34 | ) | $ | (0.24 | ) | $ | (0.79 | ) | $ | 0.66 | ||||
Diluted income (loss) per common share: | |||||||||||||||
Income (loss) from continuing operations attributable to HC2 Holdings, Inc.—common holders | $ | (0.29 | ) | $ | (0.24 | ) | $ | (0.82 | ) | $ | 0.26 | ||||
Income (loss) from continuing operations attributable to HC2 Holdings, Inc.—preferred holders | — | — | — | 0.34 | |||||||||||
Income (loss) from discontinued operations | — | — | — | — | |||||||||||
Gain (loss) from sale of discontinued operations | (0.05 | ) | — | 0.03 | — | ||||||||||
Net income (loss) attributable to HC2 Holdings, Inc. | $ | (0.34 | ) | $ | (0.24 | ) | $ | (0.79 | ) | $ | 0.60 | ||||
F-60
Quarters Ended | |||||||||||||||
(in thousands, except per share amounts) | |||||||||||||||
March 31, 2013 | June 30, 2013 | September 30, 2013 | December 31, 2013 | ||||||||||||
Net services revenue | $ | 58,789 | $ | 58,621 | $ | 61,077 | $ | 52,199 | |||||||
Cost of revenue—services | 55,516 | 55,436 | 58,752 | 50,611 | |||||||||||
Income (loss) from operations | (5,502 | ) | (11,491 | ) | (4,113 | ) | (18,030 | ) | |||||||
Income (loss) from continuing operations attributable to HC2 Holdings, Inc. | (5,592 | ) | 2,921 | (867 | ) | (14,074 | ) | ||||||||
Income (loss) from discontinued operations | 2,379 | (604 | ) | (21,493 | ) | 97 | |||||||||
Gain (loss) from sale of discontinued operations | — | 135,045 | 15,650 | (1,856 | ) | ||||||||||
Net income (loss)—basic | $ | (3,213 | ) | $ | 137,362 | $ | (6,710 | ) | $ | (15,833 | ) | ||||
Net income (loss)—diluted | $ | (3,213 | ) | $ | 137,362 | $ | (6,710 | ) | $ | (15,833 | ) | ||||
Weighted average common shares outstanding-basic | 13,909 | 13,972 | 14,077 | 14,222 | |||||||||||
Weighted average common shares outstanding-diluted | 13,909 | 14,436 | 14,077 | 14,222 | |||||||||||
Basic income (loss) per common share: | |||||||||||||||
Income (loss) from continuing operations attributable to HC2 Holdings, Inc. | $ | (0.40 | ) | $ | 0.21 | $ | (0.06 | ) | $ | (0.99 | ) | ||||
Income (loss) from discontinued operations | 0.17 | (0.04 | ) | (1.53 | ) | 0.01 | |||||||||
Gain (loss) from sale of discontinued operations | — | 9.67 | 1.11 | (0.13 | ) | ||||||||||
Net income (loss) attributable to HC2 Holdings, Inc. | $ | (0.23 | ) | $ | 9.84 | $ | (0.48 | ) | $ | (1.11 | ) | ||||
Diluted income (loss) per common share: | |||||||||||||||
Income (loss) from continuing operations attributable to HC2 Holdings, Inc. | $ | (0.40 | ) | $ | 0.20 | $ | (0.06 | ) | $ | (0.99 | ) | ||||
Income (loss) from discontinued operations | 0.17 | (0.04 | ) | (1.53 | ) | 0.01 | |||||||||
Gain (loss) from sale of discontinued operations | — | 9.35 | 1.11 | (0.13 | ) | ||||||||||
Net income (loss) attributable to HC2 Holdings, Inc. | $ | (0.23 | ) | $ | 9.51 | $ | (0.48 | ) | $ | (1.11 | ) | ||||
(1) | Income (loss) from operations includes depreciation expense of $12.0 million for the period July 1, 2012—December 31, 2013, when the property and equipment of ICS was included in assets held for sale. In accordance with U.S. GAAP, held for sale assets are not depreciated. When ICS was no longer considered to be held for sale, we were required to record all unrecorded depreciation in the fourth quarter of 2013. |
Quarterly and year-to-date computations of per share amounts are made independently; therefore, the sum of per share amounts for the quarters may not agree with per share amounts for the year.
19. BACKLOG
Schuff’s backlog was $357.0 million ($305.3 million under contracts or purchase orders and $51.7 million under letters of intent) at December 31, 2014. Schuff’s backlog increases as contract commitments, letters of intent, notices to proceed and purchase orders are obtained, decreases as revenues are recognized and increases or decreases to reflect modifications in the work to be performed under the contracts, notices to proceed, letters of intent or purchase orders. Schuff’s backlog can be significantly affected by the receipt, or loss, of individual contracts. Approximately $203.1 million, representing 56.9% of Schuff’s backlog at December 31, 2014, was attributable to five contracts, letters of intent, notices to proceed or purchase orders. If one or more of these large contracts or other commitments are terminated or their scope reduced, Schuff’s backlog could decrease substantially.
20. DISCONTINUED OPERATIONS
Discontinued Operations—year ended December 31, 2014, 2013 and 2012
On April 17, 2013, the Company completed the sale of its BLACKIRON Data segment to Rogers Communications Inc., a Canadian telecommunications company, and its affiliates for CAD $200.0 million (or approximately USD $195.6 million
F-61
giving effect to the currency exchange rate on the day of sale). The Company recorded a $135.0 million gain from the sale of this segment during the second quarter of 2013. In addition, the purchase agreement contains customary indemnification obligations, representations, warranties and covenants for a transaction of this nature. In connection with the closing of the transaction, CAD $20.0 million (or approximately USD $19.5 million giving effect to the currency exchange rate on the day of sale) was retained from the purchase price and placed into escrow until July 17, 2014 for purposes of satisfying potential indemnification claims pursuant to the purchase agreement. The escrow was recorded as part of prepaid expenses and other current assets in the consolidated balance sheet as of December 31, 2013 and was released pursuant to its terms on July 17, 2014.
On July 31, 2013, the Company completed the sale of Lingo, Inc., iPrimus, USA, Inc., 3620212 Canada Inc., PTCI, Telesonic Communications Inc., and Globility Communications Corporation to affiliates of York Capital Management, an investment firm (together “York”), for $129 million. The sale of PTI was also contemplated as part of this transaction but was deferred pending receipt of regulatory approval of such sale. The closing of the sale of PTI, which constituted the remainder of our North America Telecom segment, was completed on July 31, 2014 upon receipt of the necessary regulatory approval. The Company recorded a $13.8 million gain from the sale of this segment during the year ended December 31, 2013. In addition, the purchase agreement contains customary indemnification obligations, representations, warranties and covenants for a transaction of this nature. The Company received $126.0 million, net of $15.25 million held in escrow as part of the initial closing, with an additional $3.0 million held in escrow to be paid upon closing of the sale of PTI. The escrow was recorded as part of prepaid expenses and other current assets in the consolidated balance sheet as of December 31, 2013.
Pursuant to the terms of the purchase agreement, $6.45 million of the purchase price was placed in escrow to be released 14 months after the closing date, subject to any deductions required to satisfy indemnification obligations of HC2 under the purchase agreement, which amount was released to the Company in October 2014. In addition, $4.0 million of the purchase price was placed in escrow to cover any payments required in connection with the post-closing working capital and cash adjustments, of which $3.2 million was disbursed to the Company and $0.8 million was disbursed to York upon completion of such adjustments in February 2014. Furthermore, $4.8 million of the purchase price was placed in escrow to cover certain tax liabilities, which escrow amount will be released after a positive ruling with respect to the underlying matter is received or 30 days after expiration of the applicable statute of limitations relating to the underlying matter. The $4.8 million escrow deposit is recorded in other assets in the consolidated balance sheets, however it is fully reserved as it appears that the escrow in its entirety may be at risk.
The Company evaluated the remaining carrying value of North America Telecom, i.e. PTI, in the third quarter of 2013 which resulted in it being higher than its fair value less costs to sell by $0.3 million and have attributed such adjustment to the long-lived assets of PTI. As the adjustment is related to North America Telecom, it has been classified within income (loss) from discontinued operations, net of tax on the consolidated statements of operations for the year ended December 31, 2013.
Discontinued Operations—year ended December 31, 2012
On May 31, 2012, the Company completed the sale of its Australian segment to M2Telecommunications Group Ltd. (“M2”), an Australian telecommunications company, for approximately AUD $192.4 million (or approximately USD $195.7 million giving effect to a currency hedge that the Company put in place in connection with the transaction). The Company recorded a $98.6 million gain from the sale of this segment during the second quarter of 2012. In connection with the closing of the transaction, $9.8 million was retained from the purchase price and placed into escrow until May 31, 2013 for purposes of satisfying potential indemnification claims pursuant to the purchase agreement. The purchase price was also subject to a customary post-closing working capital adjustment. In the fourth quarter of 2012, the Company and M2 settled on a working capital adjustment and the escrow was released. The Company received $5.4 million and M2 received $4.4 million. The $4.4 million was recorded as an adjustment to the gain that was recorded in the second quarter of 2012, which resulted in a net gain for the year ended December 31, 2012 of $94.3 million.
On June 28, 2012, the Board of Directors of HC2 committed to dispose of ICS and as a result classified ICS as a discontinued operation. In the fourth quarter of 2012, the Company began discussions with potential buyers for BLACKIRON Data and North America Telecom. The special committee of the Board of Directors believed that the Company’s focus was best served on these potential deals as they would provide a greater return to our shareholders. These events, although unanticipated at the time, took precedence over the ICS sale process, and therefore resulted in the need to extend the allowable period to complete the sale of ICS under ASC 360 to beyond one year. In conjunction with the commitment to dispose of ICS and classification of ICS as a discontinued operation, the Company evaluated the carrying value of ICS in the second quarter of
F-62
2012 which resulted in it being higher than its fair value less costs to sell by $10.3 million and have attributed such adjustment to the long-lived assets of ICS. The Company performed the same analysis as of December 31, 2012 and determined that the fair value less costs to sell exceeded the carrying value and therefore no additional adjustment was required. In December 2013, based on management’s assessment of the requirements under ASC 360, it was determined that ICS no longer met the criteria of a held for sale asset. On February 11, 2014, the Board of Directors officially ratified management’s December 2013 assessment, and reclassified ICS from held for sale to held and used, effective December 31, 2013. As a result, ICS became classified as a continuing operation.
Summarized operating results of the discontinued operations are as follows (in thousands):
Years Ended December 31, | |||||||||||
2014 | 2013 | 2012 | |||||||||
Net revenue | $ | 7,530 | $ | 132,515 | $ | 375,264 | |||||
Operating expenses | 7,610 | 119,392 | 343,263 | ||||||||
Income from operations | (80 | ) | 13,123 | 32,001 | |||||||
Interest expense | (17 | ) | (11,362 | ) | (24,621 | ) | |||||
Gain (loss) on early extinguishment or restructuring of debt | — | (21,124 | ) | (21,682 | ) | ||||||
Interest income and other income (expense) | (60 | ) | (51 | ) | 283 | ||||||
Foreign currency transaction loss | — | (378 | ) | (2,550 | ) | ||||||
Loss before income tax | (157 | ) | (19,792 | ) | (16,569 | ) | |||||
Income tax benefit (expense) | 132 | 171 | (4,956 | ) | |||||||
Income from discontinued operations | $ | (25 | ) | $ | (19,621 | ) | $ | (21,525 | ) | ||
Summarized assets and liabilities of the remaining portion of North America Telecom, PTI, classified as held for sale as of December 31, 2013 are as follows (in thousands):
North America Telecom (1) | |||
December 31, 2013 | |||
Accounts receivable | $ | 670 | |
Prepaid expenses and other current assets | 839 | ||
Long-lived assets and other non-current assets | 4,820 | ||
Assets held for sale | $ | 6,329 | |
Accounts payable | $ | 869 | |
Accrued interconnection costs | 420 | ||
Accrued expenses and other liabilities | 3,534 | ||
Liabilities held for sale | $ | 4,823 | |
(1) | Included in the table above is the remaining goodwill of the US reporting unit of $3.7 million and customer relationships of $0.4 million, applicable to PTI. |
21. BASIC AND DILUTED INCOME (LOSS) PER COMMON SHARE
Basic income (loss) per common share is calculated by dividing income (loss) attributable to common shareholders by the weighted average common shares outstanding during the period. Diluted income per common share adjusts basic income per common share for the effects of potentially dilutive common share equivalents.
The Company had no dilutive common share equivalents during the years ended December 31, 2014, 2013 and 2012 due to the results of operations being a loss from continuing operations, net of tax. For the years ended December 31, 2014, 2013 and 2012, the following were potentially dilutive but were excluded from the calculation of diluted loss per common share due to their antidilutive effect:
F-63
Year Ended December 31, 2014
• | 0.2 million shares issuable upon exercise of stock options and RSUs under the Prior Plan and Omnibus Plan. |
Year Ended December 31, 2013
• | 0.6 million shares issuable upon exercise of stock options and RSUs under the Prior Plan; and |
• | 19.5 million shares issuable upon exercise of Warrants. |
Year Ended December 31, 2012
• | 0.5 million shares issuable upon exercise of stock options and RSUs under the Prior Plan; |
• | 6.2 million shares issuable upon exercise of Warrants; and |
• | 3.7 million shares issuable upon exercise of contingent value rights. |
A calculation of basic income (loss) per common share to diluted income (loss) per common share is set forth below (in thousands, except per share amounts):
Years Ended December 31, | |||||||||||
2014 (As Restated) | 2013 | 2012 | |||||||||
Income (loss) from continuing operations attributable to HC2 Holdings, Inc. | (16,294 | ) | (17,612 | ) | (44,853 | ) | |||||
Income (loss) from discontinued operations | (25 | ) | (19,621 | ) | (21,525 | ) | |||||
Gain (loss) from sale of discontinued operations | (121 | ) | 148,839 | 94,265 | |||||||
Net income (loss)—basic | $ | (16,440 | ) | $ | 111,606 | $ | 27,887 | ||||
Net income (loss)—diluted | $ | (16,440 | ) | $ | 111,606 | $ | 27,887 | ||||
Weighted average common shares outstanding-basic | 19,729 | 14,047 | 13,844 | ||||||||
Weighted average common shares outstanding-diluted | 19,729 | 14,047 | 13,844 | ||||||||
Basic income (loss) per common share: | |||||||||||
Income (loss) from continuing operations attributable to HC2 Holdings, Inc. | $ | (0.82 | ) | $ | (1.25 | ) | $ | (3.24 | ) | ||
Income (loss) from discontinued operations | — | (1.40 | ) | (1.55 | ) | ||||||
Gain (loss) from sale of discontinued operations | (0.01 | ) | 10.60 | 6.81 | |||||||
Net income (loss) attributable to HC2 Holdings, Inc. | $ | (0.83 | ) | $ | 7.95 | $ | 2.02 | ||||
Diluted income (loss) per common share: | |||||||||||
Income (loss) from continuing operations attributable to HC2 Holdings, Inc. | $ | (0.82 | ) | $ | (1.25 | ) | $ | (3.24 | ) | ||
Income (loss) from discontinued operations | — | (1.40 | ) | (1.55 | ) | ||||||
Gain (loss) from sale of discontinued operations | (0.01 | ) | 10.60 | 6.81 | |||||||
Net income (loss) attributable to HC2 Holdings, Inc. | $ | (0.83 | ) | $ | 7.95 | $ | 2.02 | ||||
22. SUBSEQUENT EVENTS
Series A-2 Preferred Stock Issuance
As discussed in Note 14—“Equity,” on January 5, 2015, HC2 issued 14,000 shares of Series A-2 Preferred Stock. Each share of Series A-2 Preferred Stock is convertible at a conversion price of $8.25. In connection with the issuance of the Series A-2 Preferred Stock, HC2 amended the certificates of designation governing the Series A Preferred Stock and Series A-1 Preferred Stock on January 5, 2015, which reflected the issuance of the Series A-2 Preferred Stock as a class of preferred stock which ranks at parity with the Series A Preferred Stock and Series A-1 Preferred Stock and made certain other changes to conform the terms of the Series A Preferred Stock and Series A-1 Preferred Stock to those of the Series A-2 Preferred Stock.
F-64
SCHEDULE II
HC2 HOLDINGS, INC.
VALUATION AND QUALIFYING ACCOUNTS
Activity in the Company’s allowance accounts for the years ended December 31, 2014, 2013 and 2012 was as follows (in thousands):
Doubtful Accounts Receivable | |||||||||||||||||||||
Period | Balance at Beginning of Period | Charged to Costs and Expenses | Deductions | Other | Balance at End of Period | ||||||||||||||||
2012 | $ | 7,552 | $ | 4,819 | $ | 7,411 | $ | (3,189 | ) | (1) | $ | 1,771 | |||||||||
2013 | $ | 1,771 | $ | 1,507 | $ | 2,816 | $ | 2,014 | (2) | $ | 2,476 | ||||||||||
2014 | $ | 2,476 | $ | 403 | $ | (119 | ) | $ | — | $ | 2,760 | ||||||||||
Deferred Tax Asset Valuation | |||||||||||||||||||||
Period | Balance at Beginning of Period | Charged to Costs and Expenses | Deductions | Other | Balance at End of Period | ||||||||||||||||
2012 | $ | 144,611 | $ | 4,883 | $ | — | $ | — | $ | 149,494 | |||||||||||
2013 | $ | 149,494 | $ | (31,171 | ) | $ | — | $ | — | $ | 118,323 | ||||||||||
2014 | $ | 118,323 | $ | (49,341 | ) | $ | — | $ | — | $ | 68,982 | ||||||||||
(1) | Other contains the subtraction of the allowance for doubtful accounts receivable that was sold in conjunction with the sale of the Company’s Australian segment ($1,859), and the Company’s allowance for doubtful accounts receivable of ICS ($1,330) in assets held for sale. |
(2) | Other contains the addition of the Company’s allowance for doubtful accounts receivable of ICS ($2,111) that was reclassified out of assets held for sale as of December 31, 2013 and the subtraction of the Company’s allowance for doubtful accounts of PTI ($97) in assets held for sale. |
S-1