Attached files
| file | filename |
|---|---|
| EX-32 - EXHIBIT 32 - American Capital Senior Floating, Ltd. | acsf-20151231xexhibit32.htm |
| EX-31.2 - EXHIBIT 31.2 - American Capital Senior Floating, Ltd. | acsf-20151231xexhibit312.htm |
| EX-31.1 - EXHIBIT 31.1 - American Capital Senior Floating, Ltd. | acsf-20151231xexhibit311.htm |
| EX-24 - EXHIBIT 24 - American Capital Senior Floating, Ltd. | acsf-20151231xexhibit24.htm |
UNITED STATES
SECURITIES AND EXCHANGE COMMISSION
Washington, D.C. 20549
FORM 10-K
x | Annual Report Pursuant to Section 13 or 15(d) of the Securities Exchange Act of 1934 |
For the fiscal year ended December 31, 2015
¨ | Transition Report Pursuant to Section 13 or 15(d) of the Securities Exchange Act of 1934 |
Commission File Number: 814-01025

AMERICAN CAPITAL SENIOR FLOATING, LTD.
(Exact name of registrant as specified in its charter)
Maryland | 46-1996220 | |
(State of Incorporation) | (I.R.S. Employer Identification No.) | |
2 Bethesda Metro Center 14th Floor Bethesda, MD 20814 | ||
(Address of principal executive offices) | ||
301-968-9310 | ||
(Registrant’s telephone number, including area code) | ||
Securities registered pursuant to Section 12(b) of the Act: | ||
Title of each class | Name of each exchange on which registered | |
Common Stock, $0.01 par value per share | The NASDAQ Stock Market LLC (NASDAQ Global Select Market) | |
Securities registered pursuant to Section 12(g) of the Act: NONE | ||
Indicate by check mark if the registrant is a well-known seasoned issuer, as defined in Rule 405 of the Securities Act. Yes ¨ No x
Indicate by check mark if the registrant is not required to file reports pursuant to Section 13 of 15(d) of the Act. Yes ¨ No x
Indicate by check mark whether the registrant (1) has filed all reports required to be filed by Section 13 or 15(d) of the Securities Exchange Act of 1934 during the preceding 12 months (or for such shorter period that the registrant was required to file such reports) and (2) has been subject to such filing requirements for the past 90 days. Yes x No ¨
Indicate by check mark whether the registrant has submitted electronically and posted on its corporate Web site, if any, every Interactive Data File required to be submitted and posted pursuant to Rule 405 of Regulation S-T during the preceding 12 months (or for such shorter period that the registrant was required to submit and post such files). Yes ¨ No ¨
Indicate by check mark if disclosure of delinquent filers pursuant to Item 405 of Regulation S-K is not contained herein and will not be contained, to the best of the registrant's knowledge, in definitive proxy or information statements incorporated by reference in part III of this Form 10-K or any amendment to this Form 10-K. ¨
Indicate by check mark whether the registrant is a large accelerated filer, an accelerated filer, a non-accelerated filer, or a smaller reporting company. See definition of “large accelerated filer,” “accelerated filer” and “smaller reporting company” in Rule 12b-2 of the Exchange Act.
Large accelerated filer | ¨ | Accelerated filer | x | Non-accelerated filer | ¨ | Smaller reporting company | ¨ | |
(Do not check if a smaller reporting company) | ||||||||
Indicate by check mark whether the registrant is a shell company (as defined in Rule 12b-2 of the Exchange Act). Yes ¨ No x
The aggregate market value of the registrant’s common stock held by non-affiliates of the registrant as of June 30, 2015 was $121,507,019 based upon a closing price of the registrant's common stock of $12.65 per share as reported on the NASDAQ Global Select Market on that date. For this computation, the registrant has excluded the market value of all shares of its common stock reported as beneficially owned by executive officers and directors of the registrant and certain other stockholders; such an exclusion shall not be deemed to constitute an admission that any such person is an “affiliate” of the registrant. The registrant had 10,000,100 shares of common stock outstanding as of March 9, 2016.
Documents Incorporated by Reference: Portions of the Registrant’s Proxy Statement relating to the Registrant’s 2016 Annual Meeting of Stockholders to be filed not later than 120 days after the end of the fiscal year covered by this Annual Report on Form 10-K are incorporated by reference into Part III of this report. Certain exhibits previously filed with the Securities and Exchange Commission are incorporated by reference into Part IV of this report.
AMERICAN CAPITAL SENIOR FLOATING, LTD.
TABLE OF CONTENTS
PAGE | ||
2
PART I.
Item 1. Business
General
American Capital Senior Floating, Ltd. (which is referred to as “ACSF”, “we”, “us” and “our”) was organized in February 2013 as a Maryland corporation and commenced operations on October 15, 2013. We are structured as an externally managed, non-diversified closed-end investment management company that has elected to be regulated as a business development company (“BDC”) under the Investment Company Act of 1940, as amended (the “1940 Act”). For tax purposes, we have elected to be taxed as a regulated investment company (“RIC”), as defined in Subchapter M of the Internal Revenue Code of 1986, as amended (the “Code”). On November 14, 2013, we formed a wholly-owned consolidated special purpose financing vehicle, ACSF Funding I, LLC (“ACSF Funding”), a Delaware limited liability company.
In January 2014, we completed an initial public offering (“IPO”) of 10.0 million shares of common stock at the public offering price of $15.00 per share for gross proceeds of $150.0 million. We are externally managed by American Capital ACSF Management, LLC (our “Manager”), an indirect subsidiary of American Capital Asset Management, LLC (“ACAM”), which is a wholly-owned portfolio company of American Capital, Ltd. (“American Capital”). Our common stock is listed on the NASDAQ Global Select Market, where it trades under the symbol “ACSF”.
Our investment objective is to provide attractive, risk-adjusted returns over the long term primarily through current income while seeking to preserve our capital. We actively manage a leveraged portfolio composed primarily of diversified investments in first lien and second lien floating rate loans principally to large-market U.S.-based companies (collectively, “Senior Floating Rate Loans” or “SFRLs”), which are commonly referred to as leveraged loans. Standard and Poor's (“S&P”), an independent international financial data and investment services company and provider of global equity indexes, defines large-market loans as loans to issuers with earnings before interest, taxes, depreciation and amortization (“EBITDA”) of greater than $50 million. We also invest in equity tranches of collateralized loan obligations (“CLOs”), which are securitized vehicles collateralized primarily by SFRLs, and we may invest in debt tranches of CLOs. In addition, we may selectively invest in loans issued by middle market companies, mezzanine and unitranche loans and high yield bonds. Additionally, we may from time to time hold or invest in other equity investments and other debt or equity securities generally arising from a restructuring of Senior Floating Rate Loan positions previously held by us. We utilize leverage to enhance our returns and we are limited under the 1940 Act as a BDC on the amount of leverage we can utilize.
As of December 31, 2015, our investment portfolio totaled $229.1 million at fair value and our net asset value (“NAV”) was $117.9 million. Our portfolio was comprised of 128 loan obligors totaling $192.2 million and 20 CLO equity investments totaling $36.9 million. During our fiscal year ended December 31, 2015, we invested $107.0 million and investments sold or repaid totaled $134.3 million.
Our Manager
Our Manager is an indirect subsidiary of ACAM, which is a wholly-owned portfolio company of American Capital. Founded in 1986, American Capital is a publicly-traded global asset manager and private equity firm, which directly and through its global asset management business, originates, underwrites and manages investments in middle market private equity, leveraged finance, real estate, energy and structured products. From its seven offices in the United States and Europe, American Capital has $73 billion in total assets under management (including levered assets) across its target asset classes.
Our Manager is responsible for administering our business activities and day-to-day operations, subject to the supervision and oversight of our Board of Directors. All of our officers and the members of our Manager’s senior investment team and other support personnel are employees of American Capital or the parent company of our Manager. Because neither we nor our Manager have any employees, our Manager has entered into an administrative services agreement with American Capital and the parent company of our Manager, pursuant to which our Manager will have access to their employees, including senior management and operations, finance, compliance, legal, capital markets, accounting, treasury, investor relations and information technology, and their infrastructure, operations, business relationships and management expertise, to enable our Manager to fulfill all of its responsibilities under the management agreement as well as provide certain additional services. Refer to “Risk Factors - Risks related to our relationship with our Manager and American Capital” for additional information.
Investment Focus
Our investment focus is primarily on Senior Floating Rate Loans and CLOs and, under normal market conditions, we will have at least 80% of our assets in Senior Floating Rate Loans. As a BDC, we are restricted from holding more than 30% of our assets in nonqualified investments, as defined by Section 55(a) of the 1940 Act. Investments in debt and equity tranches of CLOs are deemed nonqualified assets for BDC compliance purposes and therefore we are limited as to the amount of CLO investments we hold at any given time in our portfolio.
3
Senior Floating Rate Loans
Senior Floating Rate Loans are loans generally issued by U.S.-based middle market and large market private and public companies. Issuers typically use Senior Floating Rate Loans to refinance existing debt, finance acquisitions or leveraged buyouts, to pay dividends and for other general corporate purposes.
Investors typically classify the loan market by issuer size. S&P defines large-market loans as loans to companies with EBITDA of greater than $50 million and middle-market loans as loans to companies with EBITDA of less than $50 million.
Senior Floating Rate Loans pay interest based on a floating rate typically calculated as a spread over the London Interbank Offered Rate (“LIBOR”) or another market index. Interest rates are periodically reset to reflect changes in market index rates. As a result of the recent low interest rate environment, many Senior Floating Rate Loans include provisions defining a minimum market index rate, also referred to as an interest rate floor. Spreads are typically expressed in basis points and are defined at origination and may be adjusted over the life of a loan to account for changes in a borrower’s credit profile according to predefined credit covenants. Market spreads vary according to market dynamics. Senior Floating Rate Loans are generally structured as minimally-amortizing loans with monthly interest payments and are typically collateralized by a company’s assets.
Senior Floating Rate Loans may be structured with various lien priorities, such as first lien and second lien, on underlying collateral. Principal payments are generally applied based on lien position with second lien loans generally paid after payments to first lien loans or other loans with seniority in priority of payments. As a result, second lien loans are generally riskier and therefore have a higher spread compared to first lien loans. The market for second lien loans is significantly smaller and less liquid than the market for first lien loans.
Senior Floating Rate Loans are generally rated “Ba1” or lower by Moody’s Investor Services, “BB+” or lower by S&P or “BB+” or lower by Fitch Ratings, Inc. (collectively, “below investment grade”).
Senior Floating Rate Loans are typically arranged by a syndicate of investment or commercial banks, who syndicate loans to third-party investors (“the primary market”). After being placed into the primary market, investors may seek to buy and sell Senior Floating Rate Loan positions to other investors in over-the-counter transactions (the “secondary market”). We invest in Senior Floating Rate Loans through both the primary and secondary markets.
We concentrate our investment activities in Senior Floating Rate Loans to those issued by companies with free cash flow generation, defensible market positions and attractive market dynamics. Our Manager and its affiliates have significant experience underwriting and managing investments across a number of industries and seek to create a diversified portfolio of investments across various industries in which they have direct expertise.
Listed below are the top ten industries in which our Senior Floating Rate Loans were invested as of December 31, 2015 and 2014, represented as a percentage of our consolidated investment portfolio at fair value, excluding CLO equity investments:
Industry | 2015 | Industry | 2014 | |
Software | 11.6% | Health Care Providers & Services | 9.9% | |
Health Care Providers & Services | 9.2% | Media | 7.7% | |
Media | 7.7% | Software | 7.4% | |
Aerospace & Defense | 6.6% | Aerospace & Defense | 7.4% | |
Insurance | 5.2% | Hotels, Restaurants & Leisure | 6.7% | |
Commercial Services & Supplies | 4.6% | Commercial Services & Supplies | 5.0% | |
Hotels, Restaurants & Leisure | 3.7% | Insurance | 4.1% | |
Professional Services | 2.7% | Health Care Equipment & Supplies | 3.3% | |
IT Services | 2.7% | Containers & Packaging | 2.9% | |
Capital Markets | 2.6% | Oil, Gas & Consumable Fuels | 2.8% | |
Collateralized Loan Obligations
A CLO is a special purpose vehicle that is formed to finance a pool of loans that meet predefined investment criteria. It is typically a managed vehicle that may trade and reinvest the loans and generally raises capital by issuing both debt and equity securities. Typically, a CLO will issue various classes, or “tranches,” of debt broadly categorized as senior and subordinate debt tranches as well as an equity tranche.
CLO securities receive cash flows generated by underlying collateral according to a defined payment waterfall. Principal and interest payments to CLO debt tranches are typically paid sequentially, with senior debt tranches receiving cash flows prior to subordinate debt tranches. The risk and return to CLO debt tranches vary depending upon each tranche’s right to collect cash
4
flows generated by the underlying collateral. CLO debt tranches are generally rated, with ratings ranging from the highest investment grade to below investment grade, with coupons commensurate with the risk of each tranche. CLO debt tranches are also generally structured with covenants which, if violated, divert cash flows to the senior tranches prior to making any interest or principal payments to subordinate debt tranches or equity tranches.
Unlike debt securities issued by CLOs, CLO equity securities are not rated and do not have contractually stated payment schedules. At origination, the weighted average interest rate of all CLO debt tranches is generally lower than the weighted average interest earned by a CLO’s underlying collateral, resulting in an interest rate spread. CLO equity securities receive residual cash flows, or the interest spread, generated by the underlying collateral after obligated payments for CLO debt securities and other expenses of the CLO have been made. CLO equity tranches typically comprise approximately 10% of total capital raised by a CLO.
CLOs are generally structured as managed entities, with a collateral manager assigned to manage the underlying CLO collateral within predefined investment criteria. CLOs are typically structured with a reinvestment period, during which prepayments and the sale of underlying collateral may be reinvested. Collateral managers are responsible for reinvesting proceeds for a CLO during the reinvestment period. By continuously reinvesting proceeds during the reinvestment period, the effective leverage on CLO equity securities is generally maintained during the reinvestment period.
A result of the typical CLO structure is that CLO equity tranches can generate front-end loaded cash flows. CLO equity cash flows are also highly dependent on the credit performance of their underlying collateral pool. If loans within the collateral pool default, the reduced amount of performing collateral leads to lower cash flows available for distribution through CLO waterfalls, resulting in lower residual cash flows available for equity tranches. Residual cash flows are also impacted by changes in portfolio spreads for CLO collateral. Declines in spreads on newly issued collateral during the reinvestment period result in lower residual cash flows available for equity tranches.
We focus predominantly on CLOs collateralized primarily by Senior Floating Rate Loans. Under normal market conditions, we expect to limit these investments to no more than 20% of the fair value of our portfolio.
Current Market Conditions
Economic and market conditions can impact our business and our investments in multiple ways, including the financial condition of the portfolio companies in which we invest, our investment returns, our funding costs, our access to the capital markets and our access to credit. The loan market has grown substantially in recent years with the amount of total Loans outstanding exceeding $800 billion as of the end of 2015. Growth has largely been a function of the resilient performance of the asset class across multiple credit cycles coupled with the changing regulatory and investor landscape and the attractive floating rate nature of the assets. Despite the size and liquidity of the loan market, there continues to be volatility in the loan market as a result of (i) the dynamic correlation between retail fund flows, and (ii) the financial performance of the underlying issuers that comprise the asset class. Despite uncertainties regarding economic and market conditions, the new issue loan pipeline in the leveraged loan market remains active, with first lien and second lien transactions that support leveraged buyouts, strategic acquisitions, plant expansions, recapitalizations and refinancings for large to mid-sized borrowers.
During the year ended December 31, 2015, technical factors in the leveraged loan market began to erode as retail outflows continued and CLO issuance slowed from the pace at the beginning of year. Coupled with these technical elements, the leverage loan market continued to experience certain fundamental challenges, primarily in commodity related sectors. The combined technical and fundamental factors contributed to an overall reduction to loan prices during the year ended December 31, 2015 as evidenced by a decline in the average bid of the S&P/LSTA Leveraged Loan Index to 91.26 on December 31, 2015, down from both the September 30, 2015 average bid price of 94.21 and the December 31, 2014 average bid price of 95.92.
Portfolio Valuation
We value our investments on a quarterly basis, or more frequently if required, in accordance with accounting principles generally accepted in the United States of America (“GAAP”) and the 1940 Act.
Employees
We do not have any employees. We are managed by our Manager pursuant to the management agreement between our Manager and us.
Investment Committee
Our Manager has established an Investment Committee, consisting of Malon Wilkus, John Erickson, Samuel Flax, Mark Pelletier and Thomas McHale, each of whom is an officer of our Manager. The role of the Investment Committee is to monitor the performance of our Manager with respect to our investment strategy, to monitor our investment portfolio and to monitor our regulatory compliance. The Investment Committee meets as frequently as it believes is required to maintain prudent oversight of
5
our investment activities. The Investment Committee has established operating policies and monitoring guidelines for ACSF and receives notification in the event we operate outside of such policies or guidelines.
Senior Investment Team
Our Manager’s senior investment team currently consists of Mark Pelletier, Michael Cerullo, Dana Dratch, Juan Miguel Estela, Christian Toro, and William Weiss. One or more members of our Manager’s senior investment team must approve each new investment that we make. We consider our senior investment team, led by Mark Pelletier, to be our portfolio managers.
Underwriting Process
We take a qualitative and quantitative approach to sourcing, valuing and selecting investment opportunities. Our approach is grounded in fundamental analysis coupled with an active portfolio management strategy. Our underwriting approach culminates in the development of an investment thesis for each investment, giving consideration to various factors.
We begin by developing a macroeconomic understanding of current and expected economic conditions that provides the context for investment decisions. We also develop a view on each industry that we invest in or contemplate entering. When forming our view of an industry, several factors are considered. These factors include but are not limited to: (i) cyclicality, including demand elasticity of an industry’s products, (ii) defensibility of an industry’s position within the value chain, including consideration of the regulatory environment, (iii) pace of technological change and (iv) direction of industry-wide trends.
In addition, when assessing potential investments, we perform a fundamental analysis on each issuer. This analysis includes consideration of several investment specific factors. These factors include but are not limited to: (i) defensibility of market position, (ii) maturity of the business model, (iii) sustainability of a cash flow and strength of coverage ratios, (iv) consistency and level of historical performance relative to peers, (v) depth of management teams and alignment of incentives and (vi) the level and quality of leverage ratios.
We make investments with the context of our overall portfolio in mind. This is done to ensure that material or significant concentration risks do not develop within industry and issuer subclasses. Generally, we seek to diversify our portfolio across industries and issuers. The level of diversification can vary as the risk-reward profile of the portfolio changes. We actively manage our portfolio’s composition to ensure that the portfolio is optimally structured. Each security is also analyzed on a relative value basis.
We also evaluate market conditions before making investment decisions. Our view of market conditions is influenced by several factors including but not limited to: (i) current and expected liquidity in the market, (ii) relative value of issuances, (iii) level of spreads relative to other opportunities, (iv) covenant levels and (v) volume of new issuances. We actively manage our investment portfolio by investing in both the new issue and secondary loan markets as better relative value investment opportunities become available.
Portfolio Management
In order to maximize our returns for our stockholders, we employ robust portfolio and risk management processes. Our processes include monitoring market conditions and the performance of our investments. As a result of our portfolio and risk management processes, we may change the portfolio composition as we deem appropriate. On a quarterly basis, we perform a comprehensive review and reevaluation of our investments. As part of this process, we review the investment thesis for each position, as well as financial performance, covenant compliance, other credit issues and the relative value of our positions to similar securities in the market. Our analysis provides the basis for, and updates to, our recommendations for each portfolio position. Positions that have deviated significantly from their investment thesis will be placed on a list (our “Watch List”) and monitored more frequently. Members of our Manager’s senior investment team are actively involved in the quarterly review process and monitor changes to our recommendations and holdings of our portfolio.
In addition, on a monthly basis, we update the analysis for Watch List portfolio companies with current operating performance and the senior investment team discusses an overview of the risk exposure, mitigation strategies, secondary trading levels relative to the perceived recovery and justification for continued Watch List inclusion.
Our portfolio management process extends beyond the monthly and quarterly review processes. Through routine formal and informal meetings, our Manager’s senior investment team monitors Watch List constituents, performing positions and market conditions. The senior investment team receives real-time updates on portfolio company earnings, significant announcements and secondary trading price levels from the team of credit analysts and traders who support our business.
Management Agreement
Our management agreement with our Manager, has a current renewal term expiring January 15, 2017. Under the management agreement, our Manager has agreed to provide investment advisory services to us, in addition to providing personnel, facilities and additional services necessary for our operations. Unless terminated earlier, the management agreement will
6
automatically renew following the expiration of its current term for successive one year periods if approved annually by our Board of Directors or by the affirmative vote of the holders of a majority of our outstanding voting securities, and, in either case if also approved by a majority of our directors who are not “Interested Persons” as defined under the 1940 Act. Our Board of Directors and a majority of our directors who are not “Interested Persons”, as defined under the 1940 Act, have approved a renewal of the management agreement until January 15, 2017 and, subject to stockholder approval, an amendment and restatement of the management agreement, as described below.
Pursuant to the management agreement, our Manager has agreed to be responsible for certain of our operating expenses in excess of 0.75% of our consolidated net assets, less net unrealized appreciation or depreciation, each as defined under GAAP at the end of the most recently completed fiscal quarter for the first 24 months following the date of our IPO (the “Expense Cap”). Operating expenses subject to this reimbursement include both (i) our operating expenses reimbursed to our Manager and its affiliates for the expenses related to our operations incurred on our behalf and (ii) our operating expenses directly incurred by us excluding the management fee, interest costs, taxes and accrued costs and fees related to actual, pending or threatened litigation, each as determined under GAAP for the most recently completed fiscal quarter. As a result of this Expense Cap, any reimbursements to our Manager and its affiliates could be reduced or eliminated, and in certain instances, our Manager could be required to reimburse us so that our other expenses do not exceed the Expense Cap. Our Manager has agreed to extend the Expense Cap until the date of our 2016 Annual Meeting of Stockholders, at which time we expect to submit to a vote of stockholders an amendment and restatement of the management agreement which would (i) extend the Expense Cap through December 31, 2020, (ii) subject to the Expense Cap, provide for reimbursement by us to our Manager for certain compensation expenses related to legal, compliance and internal audit personnel of our Manager and its affiliates who provide services to us necessary for our operations that are not required to be provided by our Manager under the management agreement and (iii) make certain other immaterial changes. Following the expiration of the Expense Cap, there are no limits on the reimbursement to our Manager or its affiliates of such expenses related to our operations. For the years ended December 31, 2015, 2014 and the period ended December 31, 2013, our Manager was responsible for $899, $1,001, and $0, respectively, of operating expenses as a result of the Expense Cap.
Our Manager receives a management fee from us that is payable quarterly in arrears. The management fee is calculated at an annual rate of 0.80% of our total consolidated assets, excluding cash and cash equivalents and net unrealized appreciation or depreciation, each as determined under GAAP at the end of the most recently completed fiscal quarter. There is no incentive compensation paid to our Manager under the management agreement. For the years ended December 31, 2015, 2014 and the period ended December 31, 2013, we recognized management fees of $2,236, $2,186 and $0, respectively.
Since our Manager has no employees, it has entered into an administrative services agreement with both its parent and American Capital pursuant to which our Manager will be provided with personnel, services and resources necessary for our Manager to perform its obligations under the management agreement as well as provide certain additional services.
ACSF Funding has entered into an investment advisory agreement with our Manager to manage its assets. No additional compensation is payable to our Manager under such agreement.
Expenses
We do not have any employees and do not pay our officers any cash or non-cash equity compensation. We pay, or reimburse our Manager and its affiliates, for expenses related to our operations incurred on our behalf, but excluding employment-related expenses of our and our Manager’s officers and any employees of American Capital or the parent company of our Manager who provide services to us pursuant to the management agreement or to our Manager pursuant to the administrative services agreement. However, in accordance with the terms of our Management Agreement, our Manager agreed to limit the amount of operating expenses subject to reimbursement by us to the amount of the Expense Cap (See “Management Agreement” in this Annual Report on Form 10-K for further discussion). The costs and expenses required to be paid by us include, but are not limited to:
• | certain costs incurred in connection with capital raising activities; |
• | transaction costs incident to the acquisition, disposition, financing, hedging and ownership of our investments; |
• | diligence costs incurred for prospective investments; |
• | expenses incurred in contracting with third-parties; |
• | external legal, auditing, accounting, consulting, investor relations, portfolio valuation, brokerage and administrative fees and expenses; |
• | the compensation and expenses of our independent directors and the cost of liability insurance to indemnify our directors and officers and the officers and employees of our Manager and its affiliates who provide services to us; |
• | the costs associated with our establishment and maintenance of any indebtedness (including interest expense, commitment fees, accounting fees, legal fees, closing costs, rating agency fees and similar expenses); |
7
• | expenses relating to the payment of distributions to stockholders; |
• | costs incurred by our Board of Directors and personnel of our Manager or its affiliates for travel on our behalf; |
• | expenses relating to communications to holders of our securities and in complying with the continuous reporting and other requirements of the U.S. Securities and Exchange Commission (“SEC”) and other governmental bodies; |
• | tax and license fees applicable to us and our subsidiaries, including external fees for tax and regulatory compliance; |
• | insurance costs incurred by us and our subsidiaries; |
• | transfer agent, custodial, trustee, third-party loan administration and exchange listing fees; |
• | the costs of printing and mailing proxies and reports to our stockholders; |
• | the costs of establishing and maintaining our website; |
• | all costs of organizing, modifying or dissolving our company or any subsidiary and costs in preparation of entering into or exiting any business activity; |
• | our pro rata portion of costs associated with any computer software, hardware or information technology services that are used by us or our Manager on our behalf; |
• | our pro rata portion of the costs and expenses incurred with respect to market information systems and publications, research publications and materials used by us or our Manager on our behalf; |
• | settlement, clearing, trustee, prime brokerage and custodial fees and expenses relating to us; |
• | the costs of maintaining compliance with all federal, state and local rules and regulations or any other regulatory agency (as such costs relate to us), all taxes and license fees and all insurance costs incurred on behalf of us; |
• | the costs of administering our equity incentive plans, if any; and |
• | our pro rata portion of rent (including disaster recovery facility costs and expenses), telephone, utilities, office furniture, equipment, machinery and other office, internal and overhead expenses of our Manager and its affiliates required for our operations. |
Competitive Advantages
We believe we have competitive advantages over other operators in the leveraged loan market and other BDCs that allow us to deliver attractive risk-adjusted returns to our stockholders. Our advantages include the following characteristics:
Established Platform
The senior investment team has extensive experience investing across the loan market, in multiple credit cycles with, on average, over 20 years of investment experience. As of December 31, 2015, the senior investment team managed approximately $4 billion of investments across multiple CLOs, ACSF and other managed accounts of American Capital or its affiliates. In total, there are 19 investment professionals employed by American Capital or its affiliates who are dedicated to underwriting Senior Floating Rate Loan and CLO investments and a 7-person transaction management team who are dedicated to overseeing the transaction processing and operations for Senior Floating Rate Loans. Through our management agreement and the administrative services agreement, we have access to American Capital and its affiliates' employees, including senior management, investment professionals, operations, finance, compliance, legal, capital markets, accounting, treasury, investor relations, internal audit and information technologies staffs, and their infrastructure, operations, business relationships and management expertise.
Portfolio Management
We manage our portfolio through a well-defined underwriting and portfolio management process as described above that leverages the established platform of American Capital and its affiliates. We believe this reduces the downside risk to our stockholders and provides a scalable framework for investing in the future.
Actively Managed Granular Portfolio
Our portfolio is granular with the maximum loan obligor exposure as of December 31, 2015 of 1.5% and an average position size of 0.7% of the portfolio. Due to the size and liquidity available in the loan market, our Manager is able to actively manage the portfolio and respond to changes in credit quality or market tones to ensure the portfolio is optimized for the benefit of our stockholders. During the year ended December 31, 2015, our portfolio turnover ratio was 40.7%.
8
Expense Structure
Our expenses are limited to our financing costs, taxes, audit fees, costs incurred by our Manager and its affiliates for expenses related to our operations incurred on our behalf, excluding employment-related expenses, a 0.80% management fee and no incentive fee. Additionally, for the 24 months following the IPO, our other operating expenses, as defined in our management agreement, were limited by the Expense Cap.
Our Manager has agreed to extend the Expense Cap until the date of our 2016 Annual Meeting of Stockholders, at which time we expect to submit to a vote of stockholders an amendment and restatement of the management agreement. See “Management Agreement” in this Annual Report on Form 10-K for further discussion of the Expense Cap.
Competition
Our primary competitors include other BDCs, CLO investors, other credit focused investment funds, commercial and investment banks, commercial financing companies, insurance companies and, to the extent they provide an alternative form of financing, hedge funds. Many of our competitors are substantially larger and may have greater financial, technical and marketing resources than we do. For example, we believe some competitors may have access to funding sources that are not available to us. In addition, some of our competitors may have higher risk tolerances or different risk assessments, which could allow them to consider a wider variety of investments and establish more relationships than we can. Furthermore, many of our competitors are not subject to the regulatory restrictions that the 1940 Act imposes on us as a BDC or the requirements we must satisfy to maintain our qualification as a RIC. For additional information concerning the competitive risks we face, see “Risk Factors - Risks Related to Our Business and Structure - We operate in a highly competitive market for investment opportunities” in the Annual Report on Form 10-K.
REGULATION
Business Development Company Requirements
We are an externally managed, non-diversified closed-end management investment company that has elected to be treated as a RIC under the Code. We have elected to be regulated as a BDC under the 1940 Act. The 1940 Act contains prohibitions and restrictions relating to transactions between BDCs and their affiliates (including any investment advisors), principal underwriters and affiliates of those affiliates or underwriters and requires that a majority of the directors of a BDC be persons other than “Interested Persons,” as that term is defined in the 1940 Act. In addition, the 1940 Act provides that we may not change the nature of our business so as to cease to be, or to withdraw our election as, a BDC unless approved by a majority of our outstanding voting securities. We may invest up to 100% of our assets in securities acquired directly from issuers in privately negotiated transactions. With respect to such securities, we may, for the purpose of public resale, be deemed an “underwriter” as that term is defined in the Securities Act of 1933. Our intention is to not write (sell) or buy put or call options to manage risks associated with the publicly traded securities of our portfolio companies, except that we may enter into hedging transactions to manage the risks associated with interest rate currency or foreign exchange rate fluctuations.
However, we may purchase or otherwise receive warrants to purchase the common stock of our portfolio companies in connection with acquisition financing or other investments. Similarly, in connection with an acquisition, we may acquire rights to require the issuers of acquired securities or their affiliates to repurchase them under certain circumstances. We also do not intend to acquire securities issued by any investment company that exceed the limits imposed by the 1940 Act. Under these limits, we generally cannot acquire more than 3% of the total outstanding voting stock of any registered investment company, invest more than 5% of the value of our total assets in the securities of one investment company or invest, in the aggregate, more than 10% of the value of our total assets in the securities of more than one investment company. With regard to that portion of our portfolio invested in securities issued by investment companies, it should be noted that such investments might subject our stockholders to additional expenses. None of these policies is fundamental and may be changed without stockholder approval.
We are also required to provide and maintain a bond issued by a reputable fidelity insurance company to protect us against larceny and embezzlement. Furthermore, as a BDC, we are prohibited from protecting any director or officer against any liability to us or our stockholders arising from willful misfeasance, bad faith, gross negligence or reckless disregard of the duties involved in the conduct of such person’s office.
Qualifying Assets
As a BDC, we may not acquire any asset other than certain qualifying assets described in the 1940 Act, unless, at the time the acquisition is made, the value of such qualifying assets represent at least 70% of the value of our total assets. The principal categories of qualifying assets relevant to our business include the following:
• | securities purchased in transactions not involving any public offering from: |
9
(a) | an issuer that (i) is organized and has its principal place of business in the United States, (ii) is neither an investment company other than a wholly-owned small business investment company nor an entity that would be an investment company but for certain statutory exemptions, and (iii) does not have any class of securities listed on a national securities exchange with a market capitalization in excess of $250 million; or |
(b) | an issuer that satisfies the criteria set forth in clauses (a) (i) and (ii) above but not clause (a)(iii), so long as, at the time of purchase, we own at least 50% of (i) the greatest amount of equity securities of the issuer, including securities convertible into such securities and (ii) the greatest amount of certain debt securities of such issuer, held by us at any point in time during the period when such issuer was an eligible portfolio company, except that options, warrants, and similar securities which have by their terms expired and debt securities which have been converted, or repaid or prepaid in the ordinary course of business or incident to a public offering of securities of such issuer, shall not be considered to have been held by us, and we are one of the 20 largest holders of record of such issuer’s outstanding voting securities; |
• | securities of an issuer described in clauses (a)(i) and (ii) above with respect to which we control (alone or together as a part of a group), we in fact exercise a controlling influence over such issuer’s management or policies and a person affiliated with us is on the issuer’s Board of Directors; |
• | securities received in exchange for or distributed with respect to securities described above, or pursuant to the exercise of options, warrants or rights relating to such securities; and |
• | cash, cash items, U.S. government securities, or high quality debt securities maturing in one year or less from the time of investment. |
Managerial Assistance to Portfolio Companies
In order to count portfolio securities as qualifying assets for the purpose of the 70% test, we must either control the issuer of the securities or must offer to make available to the issuer of the securities significant managerial assistance; except that, where we purchase such securities in conjunction with one or more other persons acting together, one of the other persons in the group may make available such managerial assistance. This assistance could involve monitoring the operations of our portfolio companies, participating in board and management meetings, consulting and advising officers of portfolio companies and providing other organizational and financial guidance. We may receive fees for these services and will reimburse our Manager for its allocated costs in providing such assistance, subject to the review and approval by our Board of Directors, including our independent directors.
Temporary Investments
Pending investment in other types of qualifying assets described in the 1940 Act, we may invest our funds in cash items, government securities, agency paper or high quality debt securities maturing in one year or less from the time of investment in such high quality debt investments. We refer to such assets and cash herein as temporary investments.
Leverage
We have, and intend to utilize, leverage on our investment portfolio. Our leverage may vary periodically depending on market conditions, our portfolio composition and our Manager’s assessment of risks and returns. We may finance our assets, subject to market conditions, through a combination of financing arrangements, including, but not limited to, warehouse facilities, securitizations and term financing facilities. The 1940 Act permits us, as a BDC, to issue senior securities in amounts such that our asset coverage is at least 200% after each issuance of senior securities. Asset coverage is defined in the 1940 Act as the ratio which the value of the total assets, less all liabilities and indebtedness not represented by senior securities, bears to the aggregate amount of senior securities representing indebtedness. Such indebtedness may also be incurred for the purpose of effecting share repurchases. As a result, we are exposed to the risks of leverage. As permitted by the 1940 Act, we may, in addition, borrow amounts up to 5% of our total assets for temporary purposes.
Under the 1940 Act, if a BDC has any senior debt securities outstanding that were publicly issued, the BDC must make provision to prohibit the declaration of any dividend (except a dividend payable in the stock of the BDC) if its asset coverage is below 200% at the time of the distribution after deducting the amount of such dividend.
Issuance of Stock
As a BDC, we are generally not able to issue and sell our common stock at a price below our NAV per share, exclusive of any distributing commission or discount, except (i) with the prior approval of a majority of our stockholders, (ii) in connection with a rights offering to our existing stockholders or (iii) under such other circumstances as the SEC may permit.
Code of Ethics
We and our Manager have each adopted the Code of Ethics that applies to our officers and directors and the officers and employees of our Manager, American Capital and its affiliates who provide services to us. Among other matters, our Code of
10
Ethics is designed to deter wrongdoing and to promote honest and ethical conduct, including the ethical handling of actual or apparent conflicts of interest between personal and professional relationships; full, fair, accurate, timely and understandable disclosure in our SEC reports and other public communications; compliance with applicable governmental laws, rules and regulations; prompt internal reporting of violations of the code to appropriate persons identified in the code; and accountability for adherence to the code. Our Code of Ethics also establishes procedures for personal investments and restricts certain personal securities transactions pursuant to Rule 17j-1 under the 1940 Act. Personnel subject to the Code of Ethics may invest in securities for their personal investment accounts, including securities that may be purchased or held by us, so long as such investments are made in accordance with the Code of Ethics' requirements. The Code of Ethics is available, free of charge, on our website at www.ACSF.com or www.AmericanCapitalSeniorFloating.com. In addition, the Code of Ethics is available on the SEC’s website at www.sec.gov. The public may read and copy the Code of Ethics at the SEC’s Public Reference Room in Washington, DC. You may obtain information on the operation of the Public Reference Room by calling the SEC at 1-800-SEC-0330. A copy of our Code of Ethics can also be obtained, after paying a duplicating fee, by electronic request at the following email address: publicinfo@sec.gov, or by writing the SEC’s Public Reference Section at 100 F Street, N.E., Washington, D.C 20549.
Proxy Voting Policies and Procedures
Our investments do not generally entitle us to voting rights in our portfolio companies. We have delegated our proxy voting responsibility to our Manager for portfolio companies in which we may have voting rights. Our Manager has adopted proxy voting policies and procedures, which will be reviewed periodically by our Manager and our disinterested directors, and accordingly, are subject to change.
As an investment adviser registered under the Advisers Act, our Manager has a fiduciary duty to act solely in the best interests of its clients. As part of this duty, our Manager recognizes that it must vote client securities in a timely manner free of conflicts of interest and in the best interests of its clients. Our Manager’s policies and procedures for voting proxies are intended to comply with Section 206 of, and Rule 206(4)-6 under, the Advisers Act.
Our Manager’s Policy
Under our Manager’s proxy voting policies and procedures, officers of our Manager will consult with each other and our senior investment team in determining how to vote, taking into account our and our stockholders’ interests, any potential conflicts of interest and any voting guidelines of our Manager. Our Manager will consult with legal counsel to identify potential conflicts of interest. Where a potential conflict of interest exists, our Manager may, if it so elects, resolve it by following the recommendation of a disinterested third-party, by seeking the direction of our disinterested directors or, in extreme cases, by abstaining from voting. While our Manager may retain an outside service to provide voting recommendations and to assist in analyzing votes, our Manager will not delegate its voting authority to any third-party.
An officer of our Manager will keep a written record of how all such proxies are voted. Our Manager will retain records of (i) proxy voting policies and procedures, (ii) all proxy statements received (or it may rely on proxy statements filed on the SEC’s EDGAR system in lieu thereof), (iii) all votes cast, (iv) investor requests for voting information and (v) any specific documents prepared or received in connection with a decision on a proxy vote. If it uses an outside service, our Manager may rely on such service to maintain copies of proxy statements and records, so long as such service will provide a copy of such documents promptly upon request. You may obtain information regarding how we voted proxies, free of charge, by making a written request for proxy voting information to: American Capital Senior Floating, Ltd., 2 Bethesda Metro Center, 14th Floor, Bethesda, MD 20814 or by calling us collect at (301) 968-9310.
Sarbanes-Oxley Act of 2002
The Sarbanes-Oxley Act imposes a wide variety of regulatory requirements on publicly held companies and their insiders. Many of these requirements affect us. For example:
• | pursuant to Rule 13a-14 of the Securities Exchange Act of 1934, or the Exchange Act, our Chief Executive Officer and Chief Financial Officer must certify the accuracy of the financial statements contained in our periodic reports; |
• | pursuant to Item 307 of Regulation S-K, our periodic reports must disclose our conclusions about the effectiveness of our disclosure controls and procedures; |
• | pursuant to Rule 13a-15 of the Exchange Act, beginning with our fiscal year ending December 31, 2015, our management must prepare an annual report regarding its assessment of our internal control over financial reporting, which must be audited by our independent registered public accounting firm beginning with the first fiscal year in which we do not qualify as an emerging growth company; and |
• | pursuant to Item 308 of Regulation S-K and Rule 13a-15 of the Exchange Act, our periodic reports must disclose whether there were significant changes in our internal controls over financial reporting or in other factors that could significantly |
11
affect these controls subsequent to the date of their evaluation, including any corrective actions with regard to significant deficiencies and material weaknesses.
The Sarbanes-Oxley Act requires us to review our current policies and procedures to determine whether we comply with the Sarbanes-Oxley Act and the regulations promulgated thereunder. We will continue to monitor our compliance with all regulations that are adopted under the Sarbanes-Oxley Act and will take actions necessary to ensure that we are in compliance with that act.
JOBS Act
We are an “emerging growth company,” as defined in the Jumpstart our Business Startups Act of 2012 (the “JOBS Act”) until the earliest of:
• | the last day of our fiscal year ending December 31, 2019; |
• | the last day of the fiscal year in which our total annual gross revenues first exceed $1 billion; |
• | the date on which we have, during the prior three-year period, issued more than $1 billion in non-convertible debt; or |
• | the last day of a fiscal year in which we (1) have an aggregate worldwide market value of our common stock held by non-affiliates of $700 million or more, computed at the end of each fiscal year as of the last business day of our most recently completed second fiscal quarter and (2) have been an Exchange Act reporting company for at least one year (and filed at least one annual report under the Exchange Act). |
Under the JOBS Act, we are exempt from the provisions of Section 404(b) of the Sarbanes-Oxley Act, which would require that our independent registered public accounting firm provide an attestation report on the effectiveness of our internal control over financial reporting. This may increase the risk that material weaknesses or other deficiencies in our internal control over financial reporting go undetected.
Under the JOBS Act, emerging growth companies are permitted to cover only two years of financial information in the Management’s Discussion and Analysis of Financial Condition and Results of Operations disclosures. In addition, for the presentation of “selected financial data,” which ordinarily covers five years, an emerging growth company may omit selected financial data for any period prior to the earliest audited period presented in its initial registration statement. Because we are not taking advantage of this relief under the JOBS Act, such relief has not impacted the disclosures we make in this Annual Report on Form 10-K.
Under the JOBS Act, emerging growth companies can delay adopting new or revised accounting standards until such time as those standards apply to private companies. We have made an irrevocable election not to take advantage of this exemption from new or revised accounting standards. We will therefore be subject to the same new or revised accounting standards as other public companies that are not emerging growth companies.
Taxation as a RIC
We have elected to be treated as a RIC under Subchapter M of the Code. As a RIC, we generally will not have to pay corporate-level U.S. federal income taxes on any ordinary income or capital gains that we timely distribute to our stockholders as dividends. To qualify as a RIC, we must, among other things, meet certain source-of-income and asset diversification requirements, as described below. In addition, to be relieved of U.S. federal income taxes on income and gains distributed to our stockholders, we must distribute to our stockholders, for each taxable year, at least 90% of our “investment company taxable income,” which is generally our net ordinary income plus the excess of realized net short-term capital gains over realized net long-term capital losses (the “Annual Distribution Requirement”).
If we qualify as a RIC and meet the Annual Distribution Requirement, then we will not be subject to U.S. federal income tax on the portion of our investment company taxable income and net capital gains, defined as net long-term capital gains in excess of net short-term capital losses, we distribute to stockholders. We will be subject to U.S. federal income tax at regular corporate rates on any investment company taxable income or net capital gain not distributed (or deemed distributed) to our stockholders.
We will be subject to a nondeductible U.S. federal excise tax of 4% on our undistributed “ordinary income” and “capital gain net income” (each as defined below) unless for each calendar year we distribute (including through “deemed distributions” as described below) an amount equal to or greater than the sum of (a) 98% of our “ordinary income” (generally, our taxable income excluding net short-term and net long-term capital gains or losses for the calendar year), (b) 98.2% of our “capital gain net income” (including both net short-term and net long-term capital gains or losses) realized, subject to certain modifications, for the 12-month period ending October 31 of such calendar year, and (c) any income recognized, but not distributed, in the preceding years. For this purpose, however, any ordinary income or capital gain net income retained by us that is subject to corporate income tax for the tax year ending in the calendar year will be considered to have been distributed by year end.
12
In order to qualify as a RIC for U.S. federal income tax purposes, we must, among other things: (a) elect to be treated as a RIC, (b) meet the Annual Distribution Requirement, (c) qualify to be treated as a BDC under the 1940 Act at all times during each taxable year, (d) derive in each taxable year at least 90% of our gross income from dividends, interest, payments with respect to securities loans, gains from the sale of stock or other securities, other income derived with respect to our business of investing in such stock or securities, and net income derived from interests in “qualified publicly traded partnerships” (partnerships that are traded on an established securities market or tradable on a secondary market, other than partnerships that derive 90% of their income from interest, dividends and other permitted RIC income) (the “90% Income Test”), and (e) diversify our holdings so that at the end of each quarter of the taxable year (i) at least 50% of the value of our assets consists of cash, cash equivalents, U.S. government securities, securities of other RICs, and other securities if such other securities of any one issuer do not represent more than 5% of the value of our assets or more than 10% of the outstanding voting securities of the issuer (which for these purposes includes the equity securities of a “qualified publicly traded partnership”), and (ii) no more than 25% of the value of our assets are invested in securities, other than U.S. government securities or securities of other RICs, of one issuer or two or more issuers that are controlled (as determined under applicable tax rules) by us and that are engaged in the same or similar or related trades or businesses (the “Diversification Tests”).
Our income for tax purposes, which determines the Annual Distribution Requirement, generally differs from our income as measured by GAAP due to temporary and permanent differences in the recognition of income and expenses, returns of capital, and net unrealized appreciation or depreciation of investments.
We may be required to recognize taxable income in circumstances in which we do not receive a corresponding payment in cash. For example, if we hold debt obligations that are treated under applicable tax rules as having original issue discount (“OID”) (such as debt instruments with payment-in-kind (“PIK”) interest or, in certain cases, increasing interest rates, or debt instruments issued with warrants), we must include in income each year a portion of the OID that accrues over the life of the obligation, regardless of whether cash representing such income is received by us in the same taxable year. We may also have to include in our income other amounts that we have not yet received in cash, such as deferred loan origination fees that are paid after origination of the loan or are paid in non-cash compensation such as warrants or stock. We anticipate that a portion of our income may constitute OID or other income required to be included in taxable income prior to receipt of cash. In addition, we may be required to accrue for U.S. federal income tax purposes amounts attributable to our investment in CLOs that may differ from the distributions received in respect of such investments.
Because any OID or other amounts accrued will be included in our investment company taxable income for the year of the accrual, we may be required to make a distribution to our stockholders in order to satisfy the Annual Distribution Requirement, even though we will not have received any corresponding cash amount. As a result, we may have difficulty meeting the Annual Distribution Requirement. We may have to sell some of our investments at times and/or at prices we do not consider advantageous, raise additional debt or equity capital or forgo new investment opportunities for this purpose. If we are not able to obtain cash from other sources, we may not qualify as a RIC for tax purposes and thus may become subject to corporate-level U.S. federal income tax.
Gain or loss realized by us from warrants acquired by us as well as any loss attributable to the lapse of such warrants generally will be treated as capital gain or loss. Such gain or loss generally will be long-term or short term, depending on how long we held a particular warrant.
We may purchase a residual or subordinated interest in a CLO that is treated for U.S. federal income tax purposes as an equity investment in a passive foreign investment company (“PFIC”), a foreign corporation that receives at least 75% of its annual gross income from passive sources (such as interest, dividends, rents, royalties or capital gain) or holds at least 50% of its total assets in investments producing such passive income. In addition, we may purchase or acquire through other means an equity interest in a company that is considered a PFIC. If we purchase shares in a foreign corporation that is treated as a PFIC, we may be subject to U.S. federal income tax on our allocable share of a portion of any “excess distribution” received on, or any gain from the disposition of, such shares even if (in certain circumstances) our allocable share of such income is distributed as a taxable dividend to the PFIC’s stockholders. Additional charges in the nature of interest generally will be imposed on us in respect of deferred taxes arising from any such excess distribution or gain. If we elect to treat a PFIC as a qualified electing fund (“QEF”) under the Code, in lieu of the foregoing requirements, we will be required to include in income each year our proportionate share of the ordinary earnings and net capital gain of the QEF, even if such income is not distributed to us by the QEF. Alternatively, we can elect mark-to-market treatment for a PFIC; in that case, we will recognize as ordinary income our allocable share of any increase in the value of such PFIC, and as ordinary loss our allocable share of any decrease in such value to the extent that any such decrease does not exceed prior increases included in our income. Under either election, we may be required to recognize in a year income in excess of our distributions from PFICs and proceeds from dispositions of PFIC shares during that year, and such income will be taken into account for purposes of the Annual Distribution Requirement and the 4% U.S. federal excise tax.
We may purchase a residual or subordinated interest in a CLO that is treated for U.S. federal income tax purposes as an equity investment in a controlled foreign corporation (“CFC”). In addition, we may purchase or acquire through other means an
13
equity interest in a company that is considered a CFC. If we hold more than 10% of the shares in a foreign corporation that is treated as a CFC, we may be treated as receiving a deemed distribution (taxable as ordinary income) each year from such foreign corporation in an amount equal to our pro rata share of the corporation’s income for the tax year (including both ordinary earnings and capital gains), whether or not the corporation makes an actual distribution during such year. This deemed distribution of the CFC’s income for its tax year is referred to as subpart F income. In general, a foreign corporation will be classified as a CFC if more than 50% of the shares of the corporation, measured by reference to combined voting power or value, is owned (directly, indirectly or by attribution) by U.S. stockholders. A “U.S. stockholder,” for this purpose, is any U.S. person that possesses (actually or constructively) 10% or more of the combined voting power of all classes of shares of a corporation. If we are treated as receiving a deemed distribution from a CFC, we will be required to include such distribution in our investment company taxable income regardless of whether we receive any actual distributions from such CFC, and such income will be taken into account for purposes of the Annual Distribution Requirement and the 4% U.S. federal excise tax. If we acquire a 10% or lesser interest in a CFC, we are required to treat it as a PFIC for federal income tax purposes.
Although the Code generally provides that income inclusions from a QEF and subpart F income will be “good income” for purposes of the 90% Income Test to the extent it is distributed to a RIC in the year it is included in the RIC’s income, the Code does not specifically provide whether income inclusions from a QEF and subpart F income for which no distribution is received during the RIC’s taxable year would be “good income” for the 90% Income Test. The IRS has issued a series of private rulings in which it has concluded that all income inclusions from a QEF and subpart F income included in a RIC’s income would constitute “good income” for purposes of the 90% Income Test. Such rulings are not binding on the IRS except with respect to the taxpayers to whom such rulings were issued. Accordingly, although we believe that the income inclusions from a QEF and subpart F income of a CLO that we are required to include in our taxable income would be “good income” for purposes of the 90% Income Test, no guaranty can be made that the IRS would not assert that such income would not be “good income” for purposes of the 90% Income Test. If such income were not considered “good income” for purposes of the 90% Income Test, we may not qualify as a RIC.
Our investments in non-U.S. securities may be subject to non-U.S. income, withholding and other taxes. In that case, our yield on those securities would be decreased. Stockholders will generally not be entitled to claim a credit or deduction with respect to non-U.S. taxes paid by us. Any gain or loss attributable to fluctuations in exchange rates between the time we accrue income, expenses, or other liabilities denominated in a foreign currency and the time we actually collect such income or pay such expenses or liabilities is generally treated as ordinary income or loss. Similarly, gain or loss on foreign currency forward contracts and the disposition of debt denominated in a foreign currency, to the extent attributable to fluctuations in exchange rates between the acquisition and disposition dates, are also generally treated as ordinary income or loss.
If we do not satisfy the Annual Distribution Requirement or otherwise do not qualify as a RIC in any taxable year, and certain relief provisions are not available, we will be subject to tax in such year on all of our taxable income, regardless of whether we make any distributions to our stockholders. In that case, all of such income will be subject to corporate-level U.S. federal income tax, reducing the amount available to be distributed to our stockholders.
As a RIC, we will not be allowed to carry forward or carry back a net operating loss for purposes of computing our investment company taxable income in other taxable years. We generally are permitted to carry forward for an indefinite period any capital losses not used to offset capital gains. However, future transactions that we engage in may limit our ability to use any capital loss carryforwards, and unrealized losses once realized, under Section 382 of the Code.
Some of the income and fees that we may recognize may not satisfy the 90% Income Test to qualify as a RIC. In order to ensure that such income and fees do not disqualify us as a RIC for a failure to satisfy such income test, we may be required to recognize such income and fees directly or indirectly through one or more entities treated as corporations for U.S. federal income tax purposes. Such corporations will be required to pay U.S. corporate income tax on their earnings, which ultimately will reduce our return on such income and fees.
Under the 1940 Act, if a BDC has any senior debt securities outstanding that were publicly issued, the BDC must make provision to prohibit the declaration of any dividend (except a dividend payable in the stock of the BDC) if its asset coverage is below 200% at the time of the distribution after deducting the amount of such dividend. If we are unable to make sufficient distributions to satisfy the Annual Distribution Requirement, we may not qualify as RIC.
Certain of our investment practices may be subject to special and complex U.S. federal income tax provisions that may, among other things, (i) disallow, suspend or otherwise limit the allowance of certain losses or deductions, (ii) convert lower taxed long-term capital gain and qualified dividend income into higher taxed short-term capital gain or ordinary income, (iii) convert an ordinary loss or a deduction into a capital loss (the deductibility of which is more limited), (iv) cause us to recognize income or gain without a corresponding receipt of cash, (v) adversely affect the time as to when a purchase or sale of stock or securities is deemed to occur, (vi) adversely alter the characterization of certain complex financial transactions, and (vii) produce income that will not be qualifying income for purposes of the 90% Income Test. We will monitor our transactions and may make certain tax elections in order to mitigate the effect of these provisions.
14
Failure to Qualify as a RIC
If we do not satisfy the 90% Income Test for any taxable year or the Diversification Tests at the end of any quarter of such taxable year, we may nevertheless continue to qualify as a RIC for such year if certain relief provisions of the Code apply (which, among other things, may require us to pay certain corporate-level U.S. federal taxes or to dispose of certain assets).
If we were unable to qualify for treatment as a RIC, we would be subject to tax on all of our taxable income at regular corporate rates. We would not be able to deduct distributions to stockholders, nor would they be required to be made. Distributions, including distributions of net long-term capital gain, would generally be taxable to our stockholders as dividend income to the extent of our current and accumulated earnings and profits. Such dividend income would be taxable as a qualified dividend eligible for preferential U.S. federal tax rates in the case of U.S. stockholders, as discussed below, provided that the shares have been held for more than 60 days during the 121-day period beginning 60 days before the ex-dividend date. Subject to certain limitations under the Code, corporate distributees would be eligible for the dividends received deduction. Distributions in excess of our current and accumulated earnings and profits would be treated first as a return of capital to the extent of a stockholder’s tax basis, and any remaining distributions would be treated as capital gain.
If we do not qualify as a RIC for two or more taxable years, in order to qualify as a RIC in a subsequent year we may be subject to regular corporate tax on any Net Built-in Gains with respect to certain of our assets (i.e., the excess of the aggregate gains, including items of income, over aggregate losses that would have been realized with respect to such assets if we had been liquidated) that we elect to recognize on requalification or when recognized over the next ten years.
Information Available
Our address is 2 Bethesda Metro Center, 14th Floor, Bethesda, MD 20814. Our phone number is (301) 968-9310, and our internet address is www.ACSF.com. We make available, free of charge on our website, our proxy statement, Annual Report on Form 10-K, quarterly reports on Form 10-Q, current reports on Form 8-K and amendments to those reports as soon as reasonably practicable after we electronically file such material with, or furnish it to the SEC. Information contained on our website is not incorporated by reference into this Annual Report on Form 10-K and you should not consider information contained on our website to be part of this Annual Report on Form 10-K or any other report we file with the SEC.
The SEC also maintains a website that contains reports, proxy and information statements and other information we file with the SEC at www.sec.gov. The public may read and copy these reports, proxy and information statements at the SEC's Public Reference Room in Washington, D.C. Copies of these reports, proxy and information statements and other information may also be obtained, after paying a duplicating fee, by electronic request at the following email address: publicinfo@sec.gov, or by writing the SEC’s Public Reference Section, 100 F Street, N.E., Washington, D.C. 20549. Information on the operation of the Public Reference Room may be obtained by calling the SEC at 1-800-SEC-0330.
15
Item 1A. Risk Factors
You should carefully consider the risks described below and all other information contained in this Annual Report on Form 10-K, including our consolidated financial statements and the related notes thereto and the other reports and documents filed by us with the SEC, before you decide whether to invest in ACSF. The risks and uncertainties described below are not the only ones we face. Additional risks and uncertainties not presently known to us, or not presently deemed material by us, may also impair our operations and performance. If any of the following risks actually occur, our business, financial condition or results of operations could be materially adversely affected. If that happens, the trading price of our common stock could decline, and you may lose all or part of your investment. The risks discussed below also include forward-looking statements and our actual results may differ substantially from those discussed in these forward-looking statements. See “Forward-Looking Statements” in this Annual Report on Form 10-K.
Risks Relating to Economic Conditions
Economic recessions or downturns may have a material adverse effect on our business, financial condition and results of operations, and could impair the ability of our portfolio companies to repay loans
Economic recessions or downturns may result in a prolonged period of market illiquidity, which could have a material adverse effect on our business, financial condition and results of operations. Unfavorable economic conditions also could increase our funding costs, limit our access to the capital markets or result in a decision by lenders not to extend credit to us. These events could limit our investment originations, limit our ability to grow and negatively impact our operating results. In addition, if a recession were to occur, the financial condition of the portfolio companies in which we invest may deteriorate, which could ultimately lead to difficulty in meeting their debt service obligations to us and an increase in defaults. Additionally, the end markets for certain of our portfolio companies’ products and services would likely experience negative economic trends. The performance of certain of our portfolio companies may be negatively impacted by these economic or other conditions, which may ultimately result in our receipt of a reduced level of interest income from our portfolio companies and/or losses or charge offs related to our investments, and, in turn, may adversely affect distributable income. Further, adverse economic conditions may decrease the value of collateral securing some of our debt and CLO investments. As a result, the payment terms of our investments and/or cash interest rates may be modified. These factors may result in our receipt of a reduced level of interest income from our portfolio companies and/or losses or charge offs related to our investments, and, in turn, may adversely affect distributable income and have a material adverse effect on our results of operations.
Global economic, political and market conditions may materially and adversely affect our business, results of operations and financial condition, including our revenue growth and profitability
Past recessions have had a significant negative impact on the operating performance and fair value of Senior Floating Rate Loans, which comprise the majority of our investment portfolio. Many of our portfolio companies could be adversely impacted again by any future economic downturn or recession and may be unable to repay our investments, may be unable to be sold at a price that would allow us to recover our investment, or may be unable to operate during such downturn or recession. Worldwide financial market crises, as well as various social and political tensions (including wars, terrorist acts and security operations) in the United States and around the world, may cause increased market volatility, may have long-term effects on the United States and worldwide financial markets, and may cause economic uncertainties or deterioration in the United States and worldwide. Since 2010, several European Union (“EU”) countries, including Greece, Ireland, Italy, Spain, and Portugal, have faced budget issues, some of which may have negative long-term effects for the economies of those countries and other EU countries. There is continued concern about national-level support for the Euro and the accompanying coordination of fiscal and wage policy among European Economic and Monetary Union member countries. In addition, the fiscal and monetary policies of foreign nations, such as China, may have a severe impact on the worldwide and United States financial markets; and worldwide oil prices may continue to decrease and stay low for a prolonged period of time. We do not know how the financial markets will be affected by these events and cannot predict the effects of these or similar events in the future on the United States economy and securities markets or on our investments. We monitor developments and seek to manage our investments in a manner consistent with achieving our investment objective, but there can be no assurance that we will be successful in doing so. Such investment performance could have a material adverse effect on our business, financial condition and results of operations.
A disruption in capital markets could negatively affect our business
As a BDC, we may need access to the capital markets to maintain our ability to either refinance existing indebtedness or raise additional capital for investment and growth purposes. Without sufficient access to the capital markets, we may be forced to curtail our business operations or we may not be able to pursue new business opportunities. Disruptive conditions in the financial industry and the impact of new legislation in response to those conditions could restrict our business operations and could adversely impact our results of operations and financial condition. If the fair value of our assets declines substantially, we may not maintain the asset coverage ratios required by the 1940 Act, which would affect our ability to issue senior securities, including borrowings, and pay dividends, and could materially impair our business operations. Our liquidity could be impaired further by an inability
16
to access the capital markets. Equity capital may be difficult to raise because, subject to some limited exceptions, as a BDC, we will generally not be able to issue additional shares of our common stock at a price less than NAV. In addition, our ability to incur indebtedness or issue preferred stock will be limited by applicable regulations such that our asset coverage, as defined in the 1940 Act, must equal at least 200% immediately after each time we incur indebtedness or issue preferred stock. The debt capital that will be available, if at all, may be at a higher cost and on less favorable terms and conditions in the future. Any inability to raise capital could have a negative effect on our business, financial condition and results of operations. These situations may arise due to circumstances that we may be unable to control, such as inaccessibility to the credit markets, a severe decline in the value of the U.S. dollar, an economic downturn or an operational problem that affects third-parties or us, and could materially damage our business. Moreover, we are unable to predict when economic and market conditions may become more favorable or worsen. Even if such conditions improve broadly and significantly over the long term, adverse conditions in particular sectors of the financial markets could adversely impact our business.
Risks Related to Our Business and Structure
We have limited operating history
We were formed in February 2013, acquired our initial portfolio in the period from October through December 2013 and completed our IPO in January 2014. As a result of our short operating history, we are subject to many of the business risks and uncertainties associated with recently formed businesses, including the risk that we will not achieve our investment objective and that the value of your investment could decline substantially.
We are dependent upon American Capital’s key management personnel for our future success
We depend on the diligence and skill of senior management and other members of management of American Capital and certain of its affiliates for raising capital and the selection, structuring, closing and monitoring of our investments. Our future success depends to a significant extent on the continued service of such senior management and other members of management. We cannot assure you that any such individual will not terminate his or her relationship with us. The departure of certain of our executive officers or key employees of American Capital and certain of its affiliates could materially adversely affect our ability to implement our business strategy. In addition, we can offer no assurance that American Capital ACSF Management, LLC will remain our Manager. Our Manager’s senior investment team is and may in the future become affiliated with entities engaged in business activities similar to those conducted by us, and may have conflicts of interest in allocating their time. Our Manager’s senior investment team dedicates a significant portion of their time to our activities; however, they may be engaged in other business activities that could divert their time and attention in the future.
American Capital has announced that it is soliciting offers to purchase American Capital or its various business lines
On January 7, 2016, American Capital announced that its Board of Directors had authorized American Capital to solicit offers to purchase American Capital or its various business lines, in whole or in part. American Capital has issued no information on the status of the solicitation or the nature of any possible transaction that may result from it. Thus, while it is possible that a transaction could have an impact on us or our Manager, it is impractical to provide information on the nature of any impacts. Moreover, there is no assurance that the solicitation will result in a transaction that will have an impact on us or our Manager.
We operate in a highly competitive market for investment opportunities
Many entities compete with us for investments in our target portfolio companies. Our primary competitors include other BDCs and CLO investors, other credit focused investment funds, commercial and investment banks, commercial financing companies, insurance companies and, to the extent they provide an alternative form of financing, hedge funds. Many of our potential competitors are substantially larger and have considerably greater financial, technical and marketing resources than we do. For example, some competitors may have a lower cost of funds and access to funding sources that may not be available to us. In addition, some of our competitors may have higher risk tolerances or different risk assessments than we do, which could allow them to consider a wider variety of investments and establish more relationships than we can. Furthermore, many of our competitors are not subject to the regulatory restrictions that the 1940 Act imposes on us. We cannot assure you that the competitive pressures we face will not have a material adverse effect on our business, financial condition and results of operations. Also, as a result of this competition, we may not be able to take advantage of attractive investment opportunities from time to time, and we can offer no assurance that we will be able to identify and make investments that are consistent with our investment goals.
We may experience material fluctuations in our quarterly results
We may experience material fluctuations in our quarterly operating results due to many factors, such as changes in the credit quality of our portfolio, changes in the fair value of our portfolio, including as a result of an overall decline in the market prices or an increase in industry sector risk, changes in the amount of loans on non-accrual status, changes in interest rates and changes in our expenses. Therefore, results for any historical period are not indicative of performance in future periods.
17
We incur significant costs as a result of being a publicly traded company
As a publicly-traded company, we incur legal, accounting and other expenses, including costs associated with the periodic reporting requirements applicable to a company whose securities are registered under the Exchange Act, as well as additional corporate governance requirements, including requirements under the Sarbanes-Oxley Act, and other rules implemented by the SEC and the listing standards of the NASDAQ Stock Market. Upon ceasing to qualify as an emerging growth company under the JOBS Act, our independent registered public accounting firm will be required to attest to the effectiveness of our internal control over financial reporting pursuant to Section 404(b) of the Sarbanes-Oxley Act, which will increase costs associated with our periodic reporting requirements.
If we fail to maintain an effective system of internal control over financial reporting, we may not be able to accurately report our financial results or prevent fraud, which could cause stockholders to lose confidence in our financial and other public reporting and harm our business and the trading price of our common stock
Effective internal controls over financial reporting are necessary for us to provide reliable financial reports and, together with adequate disclosure controls and procedures, are designed to prevent fraud. Any failure to implement required new or improved controls, or difficulties encountered in their implementation could cause us to fail to meet our reporting obligations. In addition, any testing by us conducted in connection with Section 404 of the Sarbanes-Oxley Act, or the subsequent testing by our independent registered public accounting firm (when undertaken, as noted in the next paragraph), may reveal deficiencies in our internal control over financial reporting that are deemed to be material weaknesses or that may require prospective or retroactive changes to our financial statements or identify other areas for further attention or improvement. Ineffective internal controls over financial reporting could also cause investors to lose confidence in our reported financial information, which could have a negative effect on the trading price of our common stock.
We are required to disclose changes made in our internal control on financial reporting on a quarterly basis and our management is required to assess the effectiveness of these controls annually. However, for as long as we are an “emerging growth company” under the recently enacted JOBS Act, our independent registered public accounting firm will not be required to attest to the effectiveness of our internal control over financial reporting pursuant to Section 404(b) of the Sarbanes-Oxley Act. We could be an emerging growth company for up to five years from the date of our IPO. An independent assessment of the effectiveness of our internal controls could detect problems that our management’s assessment might not detect. Undetected material weaknesses in our internal controls could lead to financial statement restatements and require us to incur the expense of remediation.
The Investment Committee and/or our Board of Directors may change our operating policies, guidelines and strategies without prior notice or stockholder approval, which may adversely affect your investment in us
The Investment Committee and/or our Board of Directors has the authority to modify or waive our operating policies, guidelines and strategies without prior notice and without stockholder approval. We cannot predict the effect any changes to our operating policies, guidelines and strategies would have on our business, NAV, operating results and the value of our stock. However, the effects could negatively impact our ability to pay you distributions and cause you to lose part or all of your investment.
Changes in laws or regulations governing our operations or our non-compliance with those laws or regulations may adversely affect our business or cause us to alter our business strategy
We and our portfolio companies are subject to regulation by laws at the local, state, federal and foreign levels, including with respect to securities laws, tax and accounting standards. These laws and regulations, as well as their interpretation, may be changed from time to time. Accordingly, any change in these laws or regulations or our non-compliance with these laws or regulations could have a material adverse impact on our business. Certain of these laws and regulations pertain specifically to BDCs. Additionally, any changes to the laws and regulations governing our operations relating to permitted investments may cause us to alter our investment strategy in order to avail ourselves of new or different opportunities. Such changes could result in material differences to the strategies and plans set forth in this prospectus and may result in our investment focus shifting from the areas of expertise of our Manager and its affiliates to other types of investments in which our Manager and its affiliates may have less expertise or little or no experience. Thus, any such changes, if they occur, could have a material adverse effect on our results of operations and the value of your investment. On October 22, 2014, six federal agencies approved a final rule requiring sponsors of securitization transactions to retain risk in those transactions. The final rule implemented the risk retention requirements in the Dodd-Frank Wall Street Reform and Consumer Protection Act. The final rule largely retained the risk retention framework contained in the proposal issued by the agencies in August 2013 and generally required sponsors of asset-backed securities (“ABS”) to retain not less than five percent of the credit risk of the assets collateralizing the ABS issuance. The rule also set forth prohibitions on transferring or hedging the credit risk that the sponsor was required to retain. In spite of calls from CLO and leveraged loan market participants for certain exemptions from the risk retention requirements in the final rule for CLOs, the agencies declined to create an exemption for open market CLOs or to create a third-party risk retention alternative for open market CLOs, citing ongoing concerns about the leveraged loan market, including systemic risk resulting from the origination and pooling of leveraged loans with poor underwriting standards. Certain limited exemptions granted by the final rule were generally considered to be inconsistent
18
with the current market practice in the leveraged loan market and were not expected to be widely utilized. The implementation of such risk retention rules by CLOs or any shift in the market practice in the leveraged loan market could have a material impact on our future investments in CLOs.
It is unclear how increased regulatory oversight and changes in the method for determining LIBOR may affect the value of the financial obligations to be held or issued by us that are linked to LIBOR, or how such changes could affect our results of operations or financial condition
Senior Floating Rate Loans pay interest based on a floating rate calculated as a spread over a market index. The London-Interbank Offered Rate (“LIBOR”) is generally used as the market index for Senior Floating Rate Loans. Beginning in 2012, a number of British Bankers’ Association (“BBA”) member banks entered into settlements with certain regulators and law enforcement agencies with respect to the alleged manipulation of LIBOR, and there remain ongoing investigations into the matter by regulators and governmental authorities in various jurisdictions. Following a review of LIBOR conducted at the request of the U.K. government, on September 28, 2012, recommendations for reforming the setting and governing of LIBOR were released, which are referred to as the Wheatley Review. The Wheatley Review made a number of recommendations for changes with respect to LIBOR, including the introduction of S-5 statutory regulation of LIBOR, the transfer of responsibility for LIBOR from the BBA to an independent administrator, changes to the method of the compilation of lending rates and new regulatory oversight and enforcement mechanisms for rate setting and a reduction in the number of currencies and tenors for which LIBOR is published. Based on the Wheatley Review and on a subsequent public and governmental consultation process, on March 25, 2013, the U.K. Financial Services Authority published final rules for the U.K. Financial Conduct Authority’s regulation and supervision of LIBOR, which are referred to as the FCA Rules. In particular, the FCA Rules include requirements that (1) an independent LIBOR administrator monitor and survey LIBOR submissions to identify breaches of practice standards and/or potentially manipulative behavior, and (2) firms submitting data to LIBOR establish and maintain a clear conflicts of interest policy and appropriate systems and controls. The FCA Rules took effect on April 2, 2013. It is uncertain what additional regulatory changes or what changes, if any, in the method of determining LIBOR may be required or made by the U.K. government or other governmental or regulatory authorities. Accordingly, uncertainty as to the nature of such changes may adversely affect the market for or value of any LIBOR-linked securities, loans, derivatives and other financial obligations or extensions of credit held by or due to us or on our overall financial condition or results of operations. In addition, any further changes or reforms to the determination or supervision of LIBOR may result in a sudden or prolonged increase or decrease in reported LIBOR, which could have an adverse impact on the market for or value of any LIBOR linked securities, loans, derivatives and other financial obligations or extensions of credit held by or due to us or on our overall financial condition or results of operations.
We are an “emerging growth company,” and we do not know if such status makes our common stock less attractive to investors
We currently are an “emerging growth company,” as defined in the JOBS Act, until the earliest of:
• | the last day of our fiscal year ending December 31, 2019; |
• | the year in which our total annual gross revenues first exceed $1 billion; |
• | the date on which we have, during the prior three-year period, issued more than $1 billion in non-convertible debt; or |
• | the last day of a fiscal year in which we (1) have an aggregate worldwide market value of our common stock held by non-affiliates of $700 million or more, computed at the end of each fiscal year as of the last business day of our most recently completed second fiscal quarter, and (2) have been an Exchange Act reporting company for at least one year (and filed at least one annual report under the Exchange Act). |
We intend to take advantage of some of the reduced regulatory and disclosure requirements permitted by the JOBS Act and, as a result, some investors may consider our common stock less attractive, which could reduce the market value of our common stock. For example, while we are an emerging growth company, we intend to take advantage of the exemption from the provisions of Section 404(b) of the Sarbanes-Oxley Act requiring that our independent registered public accounting firm provide an attestation report on the effectiveness of our internal control over financial reporting. This may increase the risk that any material weaknesses or other deficiencies in our internal control over financial reporting may go undetected.
Any failure on our part to maintain our status as a BDC would reduce our operating flexibility
Our Board of Directors may determine that it is in our best interests to withdraw our BDC election, subject to the consent of the holders of a majority of our outstanding voting securities, as required under the 1940 Act. If we do not remain a BDC, we would likely be regulated as a closed-end investment company under the 1940 Act. Such regulation would subject us to substantially more regulatory restrictions under the 1940 Act and correspondingly decrease our operating flexibility, which could have a material adverse effect on our business, financial condition and results of operations.
19
We may have difficulty satisfying the annual distribution requirement in order to qualify and maintain RIC status if we recognize income before or without receiving cash representing such income
For federal income tax purposes, we will include in income certain amounts that we have not yet received in cash, such as OID. In addition, we may have to continue to recognize interest income for federal income tax purposes on a defaulted loan investment that has not paid the interest contractually owed to us. We also may be required to include in income certain other amounts that we will not receive in cash. For example, for certain investments, we may accrue income at some point after the trade date and before settlement, but we will not receive such income until settlement, which, in certain situations, can be as long as 90 days. Because in certain cases we may recognize income before or without receiving cash representing such income, we may have difficulty satisfying the annual distribution requirement applicable to RICs. Accordingly, we may have to sell some of our investments at times we would not consider advantageous, raise additional debt or equity capital or reduce new investments to meet these distribution requirements. If we are not able to obtain cash from other sources, we may not qualify for RIC tax treatment and thus be subject to corporate-level income tax. Additionally, we may never collect the cash representing such income.
We will become subject to corporate-level income tax if we are unable to qualify and maintain our qualification as a RIC under Subchapter M of the Code
Although we have elected to be treated as a RIC under Subchapter M of the Code for 2014 and intend to maintain our qualification for succeeding tax years, no assurance can be given that we will be able to qualify for and maintain RIC status. To obtain and maintain RIC tax treatment under the Code, we must meet numerous annual distribution, income source and asset diversification requirements. We provide no assurances we will meet those requirements.
In addition, our Board of Directors may determine, without stockholder approval, that it is in our best interests to withdraw our RIC tax status election.
Loss of RIC tax status could substantially reduce net assets and income available for debt service and distributions
If we operate as a RIC, we generally will not be subject to corporate-level income taxation on income we timely distribute, or deem to distribute, to our stockholders as distributions. We would cease to qualify for such tax treatment if we were unable to comply with these requirements. In addition, we may have difficulty meeting the requirement to make distributions to our stockholders because in certain cases we may recognize income before or without ever receiving cash representing such income. If we fail to qualify as a RIC, we will have to pay corporate-level taxes on all of our income whether or not we distribute it, which would substantially reduce the amount of income available for debt service as well as reduce and/or affect the character and amount of our distributions to our stockholders.
Risks Related to Our Relationship with Our Manager and American Capital
Our management agreement was not negotiated on an arm’s-length basis and the terms, including fees payable, may not be as favorable to us as if they were negotiated with an unaffiliated third-party
Our management agreement with our Manager was negotiated between related parties, and we did not have the benefit of arm’s-length negotiations of the type normally conducted with an unaffiliated third-party. The terms of the management agreement, including fees payable, may not reflect the terms that we may have received if it were negotiated with an unrelated third-party. In addition, we may choose not to enforce, or to enforce less vigorously, our rights under the management agreement because of our desire to maintain our ongoing relationship with our Manager.
Our results are dependent upon the efforts of our Manager
Our Manager’s success, which is largely determinative of our own success, depends on many factors, including (i) the availability of attractive risk-adjusted investment opportunities that satisfy our targeted investment strategies, (ii) our Manager’s ability to identify and cause us to consummate those investment opportunities on favorable terms, and (iii) the existence of appropriate levels and stability of interest rates and suitable conditions in the financial markets and the economy. There can be no assurance regarding the occurrence or existence of these factors. In addition, our Manager may face substantial competition for attractive investment opportunities. Our Manager may not be able to successfully cause us to make investments with attractive risk-adjusted returns.
We are completely dependent upon our Manager and certain personnel of American Capital who provide services to us through the management agreement and the administrative services agreement and we may not find suitable replacements for our Manager and these personnel if the management agreement and the administrative services agreement are terminated or such personnel are no longer available to us
Because we have no employees, we are completely dependent on our Manager and its affiliates to conduct our operations pursuant to the management agreement. Our Manager does not have any employees and relies upon certain employees of American
20
Capital and the parent company of our Manager to conduct our day-to-day operations pursuant to an administrative services agreement. Under the administrative services agreement, our Manager is provided with those services and resources necessary for our Manager to perform its obligations and responsibilities under the management agreement in exchange for certain fees payable by our Manager. Neither the administrative services agreement nor the management agreement requires our Manager or American Capital to dedicate specific personnel to our operations. They also do not require any specific personnel of our Manager or American Capital to dedicate a specific amount of time to our business. Additionally, because our Manager is relying upon American Capital, we may be negatively impacted by events or factors that negatively impact American Capital’s business, financial condition or results of operations.
If we terminate the management agreement without cause, we may not, without the consent of our Manager, employ any employee of our Manager or any of its affiliates, including American Capital, or any person who has been employed by our Manager or any of its affiliates at any time within the two-year period immediately preceding the date on which the person commences employment with us for two years after such termination of the management agreement. We believe that the successful implementation of our investment, financing and hedging strategies depends upon the experience of certain of American Capital’s and our Manager’s officers. However, none of these individuals’ continued service is guaranteed. Furthermore, if the management agreement is terminated or these individuals leave American Capital, we may be unable to execute our business plan.
There are conflicts of interest in our relationship with our Manager and American Capital
Because we have no employees, our Manager is responsible for making all of our investment decisions. All of our and our Manager’s officers are employees of American Capital or the parent company of our Manager and these persons do not devote their time exclusively to us. Our Manager’s Investment Committee consists of Malon Wilkus, John Erickson, Samuel Flax, Mark Pelletier and Thomas McHale, each of whom is an officer of our Manager and has significant responsibilities to American Capital and certain of its portfolio companies, affiliated entities or managed funds. Mr. Pelletier is the President of our Manager and also serves as our President and Chief Investment Officer, with primary oversight for all of our investments. Mr. Pelletier is also the President of American Capital CLO Management, LLC, the external manager of ACAS CLO 2007-1, Ltd., ACAS CLO 2012-1, Ltd., ACAS CLO 2013-1, Ltd., ACAS CLO 2013-2, Ltd., ACAS CLO 2014-1, Ltd., ACAS CLO 2014-2, Ltd., ACAS CLO 2015-1, Ltd. and ACAS CLO 2015-2, Ltd., which also invest in Senior Floating Rate Loans. In addition, Mr. Pelletier is President of American Capital Leveraged Finance Management, LLC, the ultimate general partner of American Capital CLO Fund I, LP, which invests in CLO equity. As a result, such funds may compete with us for investments. American Capital CLO Management, LLC and American Capital Leveraged Finance Management, LLC are wholly-owned by ACAM, a wholly-owned portfolio company of American Capital. Thus, Mr. Pelletier has, and may in the future have, significant responsibilities for American Capital or other funds that are managed by affiliates thereof. In addition, because certain of our and our Manager’s officers are also responsible for providing services to American Capital and/or certain of its portfolio companies, affiliated entities or managed funds, they may not devote sufficient time to the management of our business operations. In addition, there are no restrictions on American Capital that would prevent American Capital from sponsoring another investment vehicle that competes with us. Accordingly, American Capital or one or more of its affiliates may also compete with us for investments.
Although our Manager and its affiliates have policies in place to seek to mitigate the effects of conflicts of interest, these policies will not eliminate the conflicts of interest that our and our Manager’s officers and the employees of American Capital and certain of its affiliates will face in making investment decisions on behalf of American Capital, any other American Capital-sponsored investment vehicles and us. Further, we do not have any agreement or understanding with American Capital that would give us any priority over American Capital, any of its affiliates, or any such American Capital-sponsored investment vehicle in opportunities to invest in Senior Floating Rate Loans, CLOs or any other investments we may make. Accordingly, we may compete for access to the benefits that we expect from our relationship with our Manager and American Capital.
We have no recourse to American Capital if it does not fulfill its obligations under the administrative services agreement
Neither we nor our Manager have any employees. Our day-to-day operations are conducted by employees of American Capital or the parent company of our Manager pursuant to an administrative services agreement among our Manager, American Capital and the parent company of our Manager. Under the administrative services agreement, our Manager is also provided with the services and other resources necessary for our Manager to perform its obligations and responsibilities under the management agreement in exchange for certain fees payable by our Manager. Although the administrative services agreement may not be terminated unless the management agreement has been terminated pursuant to its terms, American Capital may assign its rights and obligations thereunder to any of its affiliates, including ACAM, the sole member of the parent company of our Manager. In addition, because we were not a party to the administrative services agreement, we do not have any recourse to American Capital or the parent company of our Manager if they do not fulfill their obligations under the administrative services agreement or if they elect to assign the agreement to one of their affiliates. Also, our Manager only has nominal assets and we have limited recourse against our Manager under the management agreement to remedy any liability to us from a breach of contract or fiduciary duties.
21
Our Manager can resign upon not more than 60 days’ notice, and we may not be able to find a suitable replacement within that time, resulting in a disruption in our operations that could adversely affect our financial condition, business and results of operations
Our Manager has the right, under the management agreement, to resign at any time upon not more than 60 days’ written notice, whether we have found a replacement or not. If our Manager resigns, we may not be able to find a new manager or hire internal management with similar expertise and ability to provide the same or equivalent services on acceptable terms within 60 days, or at all. If we are unable to do so quickly, our operations are likely to experience a disruption, our financial condition, business and results of operations as well as our ability to pay distributions are likely to be adversely affected and the market price of our shares may decline. In addition, the coordination of our internal management and investment activities is likely to suffer if we are unable to identify and reach an agreement with a single institution or group of executives having the expertise possessed by our Manager and its affiliates. Even if we are able to retain comparable management, whether internal or external, the integration of such management and their lack of familiarity with our investment objective may result in additional costs and time delays that may adversely affect our financial condition, business and results of operations.
Our Manager’s management fee is based on the amount of our total consolidated assets and is payable regardless of our performance
Our Manager is entitled to receive a quarterly management fee from us that is based on the amount of our total consolidated assets, excluding our cash and cash equivalents and net unrealized appreciation or depreciation. The amount of the quarterly management fee is equal to one-fourth of 0.80% of our total consolidated assets, excluding our cash and cash equivalents and net unrealized appreciation or depreciation. Accordingly, if we experience a net loss during a quarter as a result of net unrealized depreciation of our investments, the decline in our total consolidated assets from such net unrealized depreciation will not reduce our management fee payable to our Manager. Also, any new investments funded with the cash proceeds received from the issuances of equity or debt will result in an increase in our total consolidated assets and therefore an increase in the management fee payable to our Manager, which could result in a conflict of interest between our Manager and our stockholders with respect to the timing and terms of our equity and debt issuances. While our stockholders will bear the risk of our future equity issuances reducing the price of our common stock and diluting the value of their stock holdings in us and will bear the risk of additional leverage from future debt issuances, the compensation payable to our Manager will increase as a result of future issuances of our equity and debt securities. Our Manager’s entitlement to substantial nonperformance-based compensation may reduce its incentive to devote sufficient time and effort to seeking investments that provide attractive risk-adjusted returns for our investment portfolio. This in turn could harm both our ability to make distributions to our stockholders and the market price of our common stock.
Our Manager’s liability is limited under the management agreement, and we have agreed to indemnify our Manager against certain liabilities
The management agreement provides that our Manager and its affiliates and their respective directors, officers, employees, members, managers, partners and stockholders shall not be liable to us or our subsidiaries or our and our subsidiaries’ respective directors, officers, employees, members, managers, partners or stockholders for any action taken or omitted to be taken by our Manager in connection with the performance of any of its duties or obligations under the management agreement or otherwise as a manager or investment adviser, except to the extent specified in Section 36(b) of the 1940 Act concerning loss resulting from a breach of fiduciary duty (as the same is finally determined by judicial proceedings) with respect to the receipt of compensation for services. The management agreement also provides that our Manager and its affiliates and their respective directors, officers, employees, members, managers, partners and stockholders are entitled to indemnification from us from and against any claims or liabilities (including reasonable legal fees and other expenses reasonably incurred, arising out of or in connection with our business and operations or any action taken or omitted on our behalf pursuant to authority granted by the management agreement) to the fullest extent such indemnification is then permitted under our charter, the 1940 Act, the Investment Advisers Act of 1940, the laws of the State of Maryland and any other applicable law.
We may not replicate the historical results achieved by other entities managed by members of the Investment Committee, or by American Capital or its affiliates
Our investments may differ from those of other entities managed by American Capital, its affiliates or members of the Investment Committee. Investors in our securities are not acquiring an interest in any such entities. We may consider co-investing in portfolio investments with other investment vehicles sponsored or managed by members of the Investment Committee, American Capital or its affiliates as permitted under applicable regulations and our policies and procedures. We can offer no assurance, however, that we will develop such permitted opportunities. We also cannot assure you that we will replicate the historical results achieved by members of the Investment Committee or other entities managed by American Capital or its affiliates, and we caution you that our investment returns could be substantially lower than the returns achieved by them in prior periods. Additionally, all or a portion of the prior results may have been achieved in particular market conditions that may never be repeated. Moreover, current or future market volatility and regulatory uncertainty may have an adverse impact on our future performance.
22
Our ability to enter into transactions with our affiliates is restricted
We are prohibited under the 1940 Act from participating in certain transactions with certain of our affiliates without the prior approval of the members of our independent directors and, in some cases, the SEC. An affiliate under the 1940 Act includes, among others, any person that owns, directly or indirectly, 5% or more of our outstanding voting securities. We generally are prohibited from buying or selling any securities (other than our securities) or other investments from or to such affiliate, absent the prior approval of our independent directors. The 1940 Act also prohibits certain “joint” transactions with certain of our affiliates, which could include investments in the same portfolio company (whether at the same or different times), without prior approval of our independent directors and, in some cases, the SEC. These restrictions limit our ability to transact business with our officers or directors or their affiliates. As a result of these restrictions, we may be prohibited from buying or selling any security (other than any security of which we are the issuer) or other investments from or to any portfolio company of a fund managed by an affiliate of American Capital without the prior approval of the SEC, which may limit the scope of investment opportunities that would otherwise be available to us. We can offer no assurance that we will seek or be able to obtain such SEC approval.
ACAM owns approximately 3% of our common stock, which could result in its influence over the outcome of matters submitted to the vote of our stockholders
As of December 31, 2015, ACAM owned approximately 3% of our outstanding common stock. As a result, ACAM and American Capital may have influence over the outcome of matters submitted to a vote of our stockholders, including the election of our directors or transactions involving a change in control. Their interests may conflict with, or differ from, the interests of our other stockholders, including you. So long as ACAM continues to own shares of our common stock, it and American Capital could influence our corporate decisions submitted to our stockholders for approval, regardless of whether we terminate the management agreement with our Manager.
Risks Related to Liquidity and Capital Resources
We may need to raise additional capital to grow because we must distribute most of our income
We may need additional capital to fund growth in the future. A reduction in the availability of new capital could limit our ability to grow. We must distribute at least 90% of our investment company taxable income to our stockholders to maintain our RIC status. As a result, any such cash earnings may not be available to fund our investments. We may borrow from financial institutions and issue additional debt and equity securities. If we do not obtain funds from such sources or from other sources to fund our investments, it could limit our ability to grow, which may have an adverse effect on our stock price. In addition, as a BDC, our ability to borrow or issue preferred stock may be restricted if our total assets are less than 200% of our total borrowings and preferred stock.
The 1940 Act limits our ability to issue senior securities in certain circumstances
As a BDC, the 1940 Act generally limits our ability to issue senior securities if our asset coverage ratio does not exceed 200% immediately after each issuance of senior securities or is improved immediately upon the issuance. Asset coverage ratio is defined in the 1940 Act as the ratio that the value of the total assets, less all liabilities and indebtedness not represented by senior securities, bears to the aggregate amount of senior securities representing indebtedness. There are no assurances that we will always operate above this ratio. The resulting restrictions on issuing senior securities could have a material adverse impact on our business operations to the extent we do not maintain such asset coverage ratio.
The 1940 Act limits our ability to issue equity below our NAV per share
As a BDC, the 1940 Act generally limits our ability to issue and sell our common stock at a price below our NAV per share, exclusive of any distributing commission or discount, without stockholder approval. As of the date of this filing, we do not have such approval; however, we may seek such approval in the future or we may elect to conduct a rights offering, which would not require stockholder approval under the 1940 Act. If our common stock trades at a price below our NAV per share, there are no assurances that we can issue or sell shares of our common stock if needed to fund our business. In addition, in certain instances where we could issue or sell shares of our common stock at a price below our NAV per share, including through our dividend reinvestment and stock purchase plan or through a rights offering, such issuance could result in dilution in our NAV per share, which could result in a decline of our stock price.
We may fund a portion of our investments with debt securities, which would magnify the potential for loss and the risks of investing in us
As a result of any issuance of debt securities, we would be exposed to typical risks associated with leverage, including an increased risk of loss and an increase in expenses, which are ultimately borne by our common stockholders. Payment of interest on such debt securities must take preference over any other dividends or other payments in respect of our common stock (or any preferred stock that we may issue in the future). If we issue debt securities, it is likely that such securities will be governed by an
23
indenture or other instrument containing covenants restricting our operating flexibility. In addition, such securities may be rated by rating agencies, and in obtaining a rating for such securities, we may be required to abide by operating and investment guidelines that could further restrict our operating flexibility. Furthermore, any amounts that we use to service our indebtedness would not be available for distributions in respect of our common stock (or any preferred stock that we may issue in the future).
We may in the future determine to fund a portion of our investments with preferred stock, which would magnify the potential for loss and the risks of investing in us in the same way as our borrowings
Preferred stock, which is another form of leverage, has similar risks to our common stockholders as borrowings because the dividends on any preferred stock we issue must be cumulative and they would rank “senior” to common stock in our capital structure. Payment of dividends on, and repayment of the liquidation preference of, such preferred stock would typically take preference over any dividends or other payments to our common stockholders. Also, preferred stockholders are not typically subject to any of our expenses or losses and are not entitled to participate in any income or appreciation in excess of their stated preference. Furthermore, preferred stockholders would have separate voting rights and may have rights, preferences or privileges more favorable than those of our common stockholders. Also, the issuance of preferred securities could have the effect of delaying, deferring or preventing a transaction or a change of control that might involve a premium price for our common stockholders or otherwise be in our common stockholders’ best interest.
The agreements governing our current and any future credit facilities may contain various covenants which, if not complied with, could accelerate repayment under the relevant facility, thereby materially and adversely affecting our liquidity, financial condition, results of operations and our ability to pay distributions to our stockholders
We finance our assets with secured debt. Our current credit facility does, and any future such credit facilities are likely to, contain default provisions such as the failure to make principal and interest payments when due; the failure to maintain a certain borrowing base; the insolvency or bankruptcy of us or the relevant financing subsidiary; and the decline of our or the relevant financing subsidiary’s NAV, as applicable, below a specified threshold.
An event of default under the relevant facility may result, among other things, in the termination of the availability of further funds under the relevant facility and an accelerated maturity date for all amounts outstanding thereunder. This could disrupt our business, reduce our revenues, cause us to take losses, delay any dividends allowed to us under the facility until the lender has been paid in full, reduce our liquidity and cash flow and impair our ability to grow our business, make distribution payments to our stockholders and maintain our status as a RIC. In addition, each borrowing under our current (and any future) credit facility will be subject to the satisfaction of certain conditions. We cannot assure you that we will be able to borrow funds under the relevant facility at any particular time or at all.
Risks Related to Our Investing and Financing Strategy
There is uncertainty regarding the value of our portfolio investments
A substantial portion of our portfolio investments are not publicly traded. We determine the fair value of these investments in accordance with the 1940 Act and Financial Accounting Standards Board Accounting Standards Codification (“ASC”) Topic 820, Fair Value Measurements and Disclosures (“ASC 820”) based on a determination made in good faith by our Board of Directors. For our investments that are not publicly traded, our determinations of fair value will be based upon certain inputs and our own assumptions about how market participants would price the asset or liability. Due to the uncertainty inherent in valuing investments that are not publicly traded, our determination of fair value may differ materially from the values that would exist if a ready market for these investments existed. Our determination of the fair value of our investments will have a material impact on our net earnings and NAV.
Changes in interest rates may increase our cost of capital, reduce the ability of our portfolio companies to service their debt obligations and adversely affect our profitability
General interest rate fluctuations and changes in credit spreads on floating rate loans may have a substantial negative impact on our investments and investment opportunities and, accordingly, may have a material adverse effect on our rate of return on invested capital, our net investment income, our NAV and the market price of our common stock. A substantial portion of our debt investments have variable interest rates that reset periodically based on benchmarks such as LIBOR and the prime rate. Thus, an increase in interest rates from their historically low present levels may make it more difficult for our portfolio companies to service their obligations under the debt investments that we hold.
Given the low absolute level of interest rates, many of our debt investments have floors or benchmark minimums which are currently in excess of the actual benchmark rate in the market. Currently our financing facility is based on a similar benchmark but does not have any floors associated with it. Therefore any such increase to interest rates would make it more expensive to use debt to finance our investments. As such, our earnings will be affected by the spread between the interest rate on our investments
24
and the interest rate at which we borrow funds. As a result, we can offer no assurance that a significant change in market interest rates will not have a material adverse effect on our net investment income in the event we use floating rate debt to finance our investments. Additionally, in periods of rising interest rates, our cost of funds could reset at rates faster than those of our assets, which could reduce our net investment income. These risks are also prevalent in our CLO investments where the floating rate collateral assets may have benchmark floors while its debt may have a floating component without a floor or minimum base rate. As such, the spread compression risk explained above could be magnified in our CLO investments due to the higher leverage deployed resulting in a negative impact to our earnings and NAV.
A change in currency exchange rates may adversely affect our profitability
We may make investments in debt instruments that are denominated in currencies other than the U.S. dollar. Our domestic portfolio companies may also transact a significant amount of business in foreign countries and therefore their profitability may be impacted by changes in foreign currency exchange rates. As a result, an adverse change in currency exchange rates may have a material adverse impact on our business, financial condition and results of operations.
We may be unable to invest proceeds from investment sales/repayments or follow-on offerings of shares of our common stock on acceptable terms within an attractive time frame
Delays in investing the proceeds from investment sales or repayments along with any net proceeds raised in follow-on offerings of shares of our common stock may cause our performance to be worse than that of other fully invested BDCs or other lenders or investors pursuing comparable investment strategies. We cannot assure you that we will be able to identify any new investments that meet our investment objective or that any additional investment that we make will produce a positive return. We may be unable to invest the proceeds from investments or net proceeds of any follow-on offering on acceptable terms within the time period that we anticipate or at all, which could harm our financial condition and operating results.
We have restrictions on the type of assets we can invest in as a BDC
As a BDC, we may not acquire any assets other than certain qualifying assets described in the 1940 Act, unless, at the time of and after giving effect to the acquisition, at least 70% of our total assets consist of such qualifying assets. Thus, in certain instances, we may be precluded from investing in potentially attractive investments that are not qualifying assets for purposes of the 1940 Act. In addition, there is a risk that this restriction could prevent us from making additional investments in any non-qualifying investments we may acquire, which could cause our position to be diluted or limit our access to capital of non-qualifying investments.
Our portfolio may be concentrated in a limited number industries, which will subject us to a risk of significant loss if there is a downturn in a particular industry.
Our portfolio may be concentrated in a limited number industries. Beyond the asset diversification requirements associated with our qualification as a RIC under Subchapter M of the Code, we do not have fixed guidelines for diversification, and while we are not targeting any specific industries, our investments may be concentrated in relatively few industries. As a result, a downturn in any particular industry in which we are invested could also significantly impact the aggregate returns we realize.
The investments in which we invest are generally traded over-the-counter, if at all, and may experience limited liquidity
Our investments may experience periods with limited or no liquidity. The absence of liquidity may make it difficult for us to ascertain a market value for our investments, may limit or preclude our ability to exit underperforming investments, and may negatively impact the ability for issuers of Senior Floating Rate Loans to refinance. As a result, periods of heightened illiquidity may adversely impact the performance of our portfolio and could persist for prolonged periods.
Because we generally do not hold controlling interests in the Senior Floating Rate Loans or the issuers of Senior Floating Rate Loans in which we invest, we may not be in a position to exercise control over issuers or to prevent decisions by management teams at issuers that could decrease the value of our investments
We generally do not hold equity positions or controlling interests in the issuers of Senior Floating Rate Loans in which we invest. As a result, we are subject to the risk that an issuer of Senior Floating Rate Loans may make business decisions with which we disagree, and that the management and/or stockholders of an issuer may take risks or otherwise act in ways that will be adverse to our interests.
An investment strategy focused primarily on privately held companies presents certain challenges, including the lack of available information about these companies, a dependence on the talents and efforts of only a few key portfolio company personnel and a greater vulnerability to economic downturns
We invest primarily in privately held companies. Generally, little public information exists about these companies, and we are required to rely on the ability of our Manager to obtain adequate information to evaluate the potential returns from investing in these companies. If we are unable to uncover all material information about these companies, we may not make a fully informed
25
investment decision, and we may lose money on our investments. Also, privately held companies frequently have less diverse product or service lines and smaller market presence than larger competitors. These factors could adversely affect our investment returns as compared to companies investing primarily in the securities of public companies.
We intend to continue to finance our investments with borrowed money, and may securitize our investments in the future, which magnifies the potential for gain or loss on amounts invested and may increase the risk of investing in us
The use of leverage, including through the issuance of senior securities, magnifies the potential for gain or loss on amounts invested. The use of leverage is generally considered a speculative investment technique and increases the risks associated with investing in our securities. Our lenders will have fixed dollar claims on our assets that are superior to the claims of our common stockholders, and we would expect such holders to seek recovery against our assets in the event of a default. We may pledge up to 100% of our assets and may grant a security interest in all of our assets under the terms of any debt instruments into which we may enter. In addition, under the terms of any credit facility or other debt instrument we enter into, we may be required by its terms to use the net proceeds of investments that we sell to repay a portion of the amount borrowed under such facility or instrument before applying such net proceeds to any other uses.
If the value of our assets decreases, leverage would cause NAV to decline more sharply than it otherwise would have had we not leveraged, thereby magnifying losses. Similarly, any decrease in our revenue or income will cause our net income to decline more sharply than it would have had we not borrowed. Such a decline would also negatively affect our ability to make distributions on our common stock. Our ability to service our debt will depend largely on our financial performance and will be subject to prevailing economic conditions and competitive pressures. In addition, our common stockholders will bear the burden of any increase in our expenses as a result of our use of leverage, including interest expense and any increase in the management fee.
The following table illustrates the effect on returns to a holder of our common stock from the leverage created by our use of borrowing, using our cost of funding of 2.39% as of December 31, 2015 together with (a) our total value of net assets as of December 31, 2015; (b) approximately $124 million in aggregate principal amount of indebtedness outstanding as of December 31, 2015; and (c) hypothetical annual returns on our portfolio of minus 10% to plus 10%. As illustrated below, leverage generally increases the return to shareholders when the portfolio return is positive and decreases the return when the portfolio return is negative. Actual returns may be greater or less than those appearing in the table.
Assumed Return on Portfolio (Net of Expenses) (1) | (10)% | (5)% | —% | 5% | 10% |
Corresponding Return to Stockholders (2) | (22)% | (12)% | (2)% | 8% | 18% |
(1) | The assumed portfolio return is required by SEC regulations and is not a prediction of, and does not represent, our projected or actual performance. Actual returns may be greater or less than those appearing in the table. |
(2) | In order to compute the “Corresponding Return to Shareholders,” the “Assumed Return on Portfolio” is multiplied by the total value of our assets at December 31, 2015 to obtain an assumed return to us. From this amount, estimated annual interest expense, based on the amount of debt outstanding at December 31, 2015, is subtracted to determine the return available to shareholders. The return available to shareholders is then divided by the total value of our net assets as of December 31, 2015 to determine the “Corresponding Return to Shareholders”. |
In order for us to cover our annual interest payments on our outstanding indebtedness as of December 31, 2015, we must achieve annual returns on our December 31, 2015 total investments of at least 1.1%.
As a BDC, we generally are required to meet a coverage ratio of total assets to total borrowings and other senior securities, which include all of our borrowings and any preferred stock that we may issue in the future, of at least 200%. If this ratio declines below 200%, we cannot incur additional debt and could be required to sell a portion of our investments to repay some debt when it is disadvantageous to do so. This could have a material adverse effect on our operations, and we may not be able to make distributions. The amount of leverage that we employ will depend on our Manager’s and our Board of Directors’ assessment of market and other factors at the time of any proposed borrowing. We cannot assure you that we will be able to obtain credit at all or on terms acceptable to us.
Our portfolio companies may be highly leveraged with debt
The debt levels of our portfolio companies may have significant adverse consequences to such companies and to us as an investor. Portfolio companies that are indebted may be subject to restrictive financial and operating covenants. The leverage may impair these companies’ ability to finance their future operations and capital needs. As a result, their flexibility to respond to changing business and economic conditions and to business opportunities may be limited. A company’s income and net worth will tend to increase or decrease at a greater rate than if the company did not capitalize itself in part with debt.
Our portfolio companies may incur debt that ranks equally with, or senior to, some of our investments in such companies
Our portfolio companies typically may be permitted to incur other debt that ranks equally with, or senior to, some of such debt instruments, including unitranche, second lien, middle market loans and unsecured debt instruments. By their terms, such debt instruments may provide that the holders are entitled to receive payment of interest or principal on or before the dates on
26
which we will be entitled to receive payments in respect of the debt securities in which we will invest. Also, in the event of insolvency, liquidation, dissolution, reorganization or bankruptcy of a portfolio company, holders of debt instruments ranking senior to our investment in that portfolio company would typically be entitled to receive payment in full before we receive any distribution in respect of our investment. In such cases, after repaying such senior creditors, such portfolio company may not have any remaining assets to use for repaying its obligation to us. In the case of debt ranking equally with debt securities in which we will invest, we would have to share on an equal basis any distributions with other creditors holding such debt in the event of an insolvency, liquidation, dissolution, reorganization or bankruptcy of the relevant portfolio company.
Our borrowers may default on their payments, which may have a materially negative effect on our financial performance
Our primary business exposes us to credit risk, and the quality of our portfolio has a significant impact on our earnings. Credit risk is a component of our fair valuation of our portfolio companies. Negative credit events will lead to a decrease in the fair value of our portfolio companies and may potentially disrupt or impact the ability to pay amounts due to us thereby resulting in a decline in our earnings and NAV.
In addition, market conditions can affect consumer confidence levels, which may harm the business of our portfolio companies and result in adverse changes in payment patterns. Additionally, if interest rates rise, some of our portfolio companies may not be able to pay the escalating interest on our loans and may default. Deterioration in the credit quality of our portfolio could have a material adverse effect on our business, financial condition and results of operations. Increased delinquencies and default rates would negatively impact our results of operations.
A general economic downturn or severe tightening in the credit markets could materially impact the ability of our borrowers to repay their loans, which could have a significant negative affect on us. Numerous other factors may affect a borrower’s ability to repay its loan, including the failure to meet its business plan or a downturn in its industry. A portfolio company’s failure to satisfy financial or operating covenants imposed by us or other lenders could lead to defaults and, potentially, termination of its loans or foreclosure on the secured assets. This could trigger cross-defaults under other agreements and jeopardize a portfolio company’s ability to meet its obligations under the loans or debt securities that we hold. In addition, our portfolio companies may have, or may be permitted to incur, other debt that ranks senior to or equally with our securities. This means that payments on such senior-ranking securities may have to be made before we receive any payments on our subordinated loans or debt securities. Deterioration in a borrower’s financial condition and prospects may be accompanied by deterioration in any related collateral and may have a material adverse effect on our financial condition and results of operations.
Certain of the issuers of Senior Floating Rate Loans in which we invest may enter into bankruptcy proceedings
Senior Floating Rate Loan issuers may experience bankruptcy or similar financial distress. The bankruptcy process has a number of significant inherent risks. Many events in a bankruptcy proceeding are the product of contested matters and adversary proceedings and are beyond the control of the creditors. A bankruptcy filing by an issuer may adversely and permanently affect the issuer. If the proceeding is converted to a liquidation, the value of the issuer may be significantly less than the liquidation value that was believed to exist at the time of the investment. The duration of a bankruptcy proceeding is also difficult to predict, and a creditor’s return on investment can be adversely affected by delays until the plan of reorganization or liquidation ultimately becomes effective. The administrative costs of a bankruptcy proceeding are frequently high and would be paid out of the debtor’s estate prior to any return to creditors. Because the standards for classification of claims under bankruptcy law are vague, our influence with respect to the class of securities or other obligations we own may be lost by increases in the number and amount of claims in the same class or by different classification and treatment. In the early stages of the bankruptcy process, it is often difficult to estimate the extent of, or even to identify, any contingent claims that might be made. In addition, certain claims that have priority by law (for example, claims for taxes) may be substantial.
Our investments in Senior Floating Rate Loans involve risk and we could lose all or part of our investment
Investing in Senior Floating Rate Loans involves a number of significant risks. Senior Floating Rate Loans in which we invest may be issued by companies with limited financial resources and limited access to alternative financing. Issuers of Senior Floating Rate Loans may be unable to meet their obligations under their debt securities that we hold. Such developments may be accompanied by deterioration in the value of collateral backing our investments. This could lead to a decline in value of our portfolio, which could result in a decline in our net earnings and NAV.
Second priority liens on collateral securing loans in which we invest may be subject to control by senior creditors with first priority liens. If there is a default, the value of the collateral may not be sufficient to repay in full both the first priority creditors and us
Some loans in which we invest may be secured on a second priority basis by the same collateral securing first priority debt of our portfolio companies. The first priority liens on the collateral will secure the portfolio company’s obligations under any outstanding senior debt and may secure certain other future debt that may be permitted to be incurred by the company under the agreements governing the loans. The holders of obligations secured by the first priority liens on the collateral will generally control
27
the liquidation of and be entitled to receive proceeds from any realization of the collateral to repay their obligations in full before us. In addition, the value of the collateral in the event of liquidation will depend on market and economic conditions, the availability of buyers and other factors. There can be no assurance that the proceeds, if any, from the sale or sales of all of the collateral would be sufficient to satisfy the loan obligations secured by the second priority liens after payment in full of all obligations secured by the first priority liens on the collateral. If such proceeds are not sufficient to repay amounts outstanding under the loan obligations secured by the second priority liens, then we, to the extent not repaid from the proceeds of the sale of the collateral, will only have an unsecured claim against the company’s remaining assets, if any. The rights we may have with respect to the collateral securing the loans we may make to portfolio companies with senior debt outstanding may also be limited pursuant to the terms of one or more intercreditor agreements that we enter into with the holders of senior debt. Under such an intercreditor agreement, at any time that obligations that have the benefit of the first priority liens are outstanding, any of the following actions that may be taken with respect to the collateral will be at the direction of the holders of the obligations secured by the first priority liens: the ability to cause the commencement of enforcement proceedings against the collateral; the ability to control the conduct of such proceedings; the approval of amendments to collateral documents; releases of liens on the collateral; and waivers of past defaults under collateral documents. We may not have the ability to control or direct such actions, even if our rights are adversely affected.
Investments in non-investment grade CLO securities may be illiquid, may have a higher risk of default, and may not produce current returns
Our investments in CLO securities are generally non-investment grade. Non-investment grade CLO securities tend to be illiquid, have a higher risk of default and may be more difficult to value than investment grade bonds. Recessions or poor economic or pricing conditions in the markets associated with CLO securities may cause higher defaults or losses than expected. Non-investment grade securities are considered speculative, and their capacity to pay principal and interest in accordance with the terms of their issue is not certain.
We invest in equity securities of CLOs, and may invest in debt securities of CLOs, collateralized primarily by Loans. Accordingly, such securities involve the same risks associated with investing in Senior Floating Rate Loans on a levered basis, including credit risk and market risk. Changes in a variety of factors, including interest rates, defaults, interest rate spreads, interest rate curves, investor perception of macroeconomic risks and market outlook, and demand for debt securities issued by CLOs may cause the cash flows provided by and the market prices for CLO securities to fluctuate significantly. CLOs are typically privately offered and sold and CLO securities may be thinly traded or have a limited trading market.
Some of our investments in CLOs may be in newly issued CLOs. Generally, new-issue CLOs make their initial distribution to underlying debt and equity tranches six to nine months after closing, and subsequent payments are generally made on a quarterly basis. Additionally, equity securities of CLOs do not have a stated coupon and only have claims to residual cash flows after payments to securities ranked senior to equity securities have been made. Changes in a variety of factors, including interest rates, defaults, interest rate spreads, interest rate curves and performance of collateral underlying CLO securities may cause the cash flows generated by our investments in the debt and equity tranches of CLOs to fluctuate significantly, and in certain instances may be shut off all together either temporarily or permanently. Therefore, the cash flows and earnings we receive from our CLO investments may fluctuate significantly.
We invest in CLO securities that are subordinate in right of payment to more senior securities
CLO equity securities are the first to bear losses resulting from defaults and losses from underlying collateral. As a result, investments in CLO equity securities carry significant risks, including, but not limited to the possibility that distributions from CLO equity securities may decline or cease altogether should the quality of the collateral deteriorate, decline in value or default. Therefore, we may fail to achieve our expected investment returns from CLO equity securities.
Our investments in CLO securities may be riskier and less transparent to us and our stockholders than direct investments in the underlying companies
We invest in equity tranches and may invest in debt tranches of CLOs. Generally, there will be less information available to us regarding the underlying investments held by such CLO vehicles than if we had invested directly in the underlying companies. As a result, our stockholders will not know the details of the underlying securities of the CLO vehicles in which we invest. Our CLO investments are subject to the risk of leverage associated with the debt issued by such CLOs and the repayment priority of senior debt holders in such CLO vehicles. The accounting and tax implications of such investments are complicated. In particular, reported revenue from the equity tranche investments of these CLO vehicles are recorded each quarter in accordance with GAAP under the effective interest rate method based on the future projected cash flows. Our current taxable earnings on these investments, however, will depend upon the ownership of the CLO equity tranche as well as for certain CLOs any election we make to mark-to-market our taxable income. Our current taxable income will generally not be determinable until after the end of the fiscal year of each individual CLO vehicle that ends within our fiscal year and may be materially different from both the cash distributions we receive and revenue we record in accordance with GAAP. We may be required to record current taxable income based on our proportionate share of the ordinary earnings and net capital gain of the CLO vehicle or based on changes to fair value if we elect
28
mark-to-market treatment for certain eligible CLO investments, even if such income is not distributed to us by the CLO vehicle. As a result, the reported revenue to our stockholders under GAAP from investments in these CLO vehicles may not be reflective of the taxable income we record for such investments, and the current cash flow we receive from these CLO investments may be less than the current taxable income we record from these investments that we are required to distribute to our stockholders.
CLOs typically will have no significant assets other than their underlying Senior Floating Rate Loans
CLOs typically will have no significant assets other than their underlying Senior Floating Rate Loans. Accordingly, payments on CLO investments are and will be payable solely from the cash flows from such Loans, net of all management fees and other expenses. Payments to us as a holder of CLO junior securities are and will be made only after payments due on the senior securities. It may adversely impact our returns if the cash flows from the Loans are insufficient to repay our CLO investments.
There is the potential for interruption and deferral of cash flow from CLO investments
If certain minimum collateral coverage ratios and/or interest coverage ratios are not met by a CLO, then cash flows that otherwise would have been available to pay distributions to us on our CLO investments may instead be used to redeem any senior notes or to purchase additional Loans, until the ratios again exceed the minimum required levels or any senior notes are repaid in full. This could result in a reduction in the distribution and/or principal paid to the holders of the CLO investments, which would adversely impact our returns.
Senior Floating Rate Loans that are collateral of our CLO investments are subject to prepayments and calls, increasing re-investment risk, and the inability of a CLO collateral manager to reinvest the proceeds of the prepayment of its loan collateral may adversely affect us
The underlying Loans of our CLO investments may be prepaid more quickly than expected, which could have an adverse impact on the value of our CLO investment. Prepayment rates are influenced by changes in interest rates and a variety of economic, geographic and other factors beyond our control, and consequently cannot be predicted with certainty. There can be no assurance that for any CLO investment, in the event that any of the Loans of a CLO underlying such investment are prepaid, the CLO collateral manager will be able to reinvest such proceeds in new Loans with equivalent investment returns. If the CLO collateral manager cannot reinvest in new Loans with equivalent investment returns, the proceeds available to pay interest, principal or other distributions to the CLO securities may be adversely affected.
We may not have the ability to control the timing of a call position on our CLO investments
Our CLO investments generally contain optional call provisions, exercisable at the discretion of the holders of the equity tranches, after the expiration of an initial period in the deal (referred to as the “non-call period”) which provide for the senior notes and the junior secured notes to be paid in full. The exercise of the call option is by the relevant percentage (usually a majority) of the holders of the equity tranche. Therefore, where we do not hold the relevant percentage, we will not be able to control the timing of the exercise of the call option. The equity tranche also generally has a call at any time based on certain tax event triggers. In any event, the call can only be exercised by the holders of the equity tranche if they can demonstrate (in accordance with the detailed provisions in the transaction) that the senior notes and junior secured notes will be paid in full if the call is exercised.
We have limited control of the administration and amendment of Loans owned by the CLOs in which we invest
We will not be able to directly enforce any rights and remedies in the event of a default of a Loan held by a CLO vehicle. In addition, the terms and conditions of the Loans underlying our CLO investments may be amended, modified or waived only by the agreement of the underlying lenders. Generally, any such agreement must include a majority or a super majority (measured by outstanding loans or commitments) or, in certain circumstances, a unanimous vote of the lenders. Consequently, the terms and conditions of the payment obligations arising from Loans could be modified, amended or waived in a manner contrary to our preferences.
We have limited control of the administration and amendment of any CLO in which we invest
The terms and conditions of CLOs may be amended, modified or waived only by the agreement of the underlying security holders. Generally, any such agreement must include a majority or a super majority (measured by outstanding amounts) or, in certain circumstances, a unanimous vote of the security holders. Consequently, the terms and conditions of the payment obligation arising from the CLOs in which we invest may be modified, amended or waived in a manner contrary to our preferences.
We will have no influence on management of underlying investments managed by non-affiliated third-party CLO collateral managers
We are not responsible for and have no influence over the asset management of the portfolios underlying the CLO investments we hold as those portfolios are managed by non-affiliated third-party CLO collateral managers. Similarly, we are not responsible for and have no influence over the day-to-day management, administration or any other aspect of the issuers of the
29
individual securities. As a result, the performance and values of the portfolios underlying our CLO investments could decrease as a result of decisions made by third-party CLO collateral managers.
Engaging in hedging transactions may expose us to additional risks
We may enter into interest rate or currency hedges. Hedging against interest rate and currency fluctuations may expose us to additional risks and could harm our financial performance. Our use of hedging would not eliminate the risk that the value of our investments could decline or that our investment performance would be better off if we did not hedge. The effectiveness of our hedging is dependent on the price we pay for the hedge and the correlation of the hedge to the risk it is designed to mitigate. It may arise that the cost of a hedging instrument exceeds its expected benefits or that an instrument may not hedge all of the risk for which it was designed to mitigate. Additionally, the use of hedging instruments exposes us to counterparty risk including the failure to perform under the contract such as nonpayment.
Risks Related to Our Common Stock
Investing in our common stock may involve an above average degree of risk
The investments we make in accordance with our investment objective may result in a higher amount of risk than alternative investment options and a higher risk of volatility or loss of principal. Our investments in portfolio companies involve higher levels of risk, and therefore, an investment in our common stock may not be suitable for someone with lower risk tolerance.
There is a risk that our stockholders may not receive distributions or that our distributions may not grow over time, and a portion of our distributions may be a return of capital
We intend to make distributions on a monthly basis to our stockholders out of assets legally available for distribution. We cannot assure you that we will achieve investment results that will allow us to make a specified level of cash distributions or year-to-year increases in cash distributions. In addition, due to the asset coverage test applicable to us as a BDC, we may be limited in our ability to make distributions.
The market price of our common stock may fluctuate significantly
The market price and marketability of shares of our common stock may from time to time be significantly affected by numerous factors, including many over which we have no control and that may not be directly related to us. These factors include the following:
• | price and volume fluctuations in the stock market from time to time, which are often unrelated to the operating performance of particular companies; |
• | significant volatility in the market price and trading volume of securities of BDCs, financial service companies, asset managers or other companies in our sector, which is not necessarily related to the operating performance of particular companies; |
• | changes in laws, regulatory policies, tax guidelines or financial accounting standards, particularly with respect to BDCs or RICs; |
• | not qualifying as a RIC, or the loss of RIC status; |
• | changes in our earnings or variations in operating results; |
• | any shortfall in revenue or net income or any increase in losses from levels expected by securities analysts and the market in general; |
• | decreases in our NAV per share; |
• | general economic trends and other external factors; and |
• | loss of a major funding source. |
Fluctuations in the trading price of our common stock may adversely affect the liquidity of the trading market for our common stock and, in the event that we seek to raise capital through future equity financings, our ability to raise such equity capital.
Our shares of common stock may trade at a substantial discount from NAV and may continue to do so over the long term
Our shares of common stock may trade at a market price that is less than the NAV that is attributable to those shares. The possibility that our shares of common stock will trade at a substantial discount from NAV over the long term is separate and distinct from the risk that our NAV will decrease. We cannot predict whether shares of our common stock will trade above, at or below
30
our NAV. If our common stock trades below its NAV, we will generally not be able to issue additional shares or sell our common stock at its market price without first obtaining the approval for such issuance from our stockholders and our independent directors. If additional funds are not available to us, we could be forced to curtail or cease our new lending and investment activities, and our NAV could decrease and our level of distributions could be impacted.
Our common stock may be difficult to resell
Investors may not be able to resell shares of our common stock at or above their purchase prices due to a number of factors, including:
• | actual or anticipated fluctuation in our operating results; |
• | volatility in our common stock price; |
• | changes in expectations as to our future financial performance or changes in financial estimates of securities analysts; and |
• | departures of key personnel, or changes in our relationship with our Manager or American Capital. |
Certain provisions in our charter and bylaws could discourage a change of control that our stockholders may favor, which could also adversely affect the market price of our common stock
Provisions in our charter and bylaws may make it more difficult and expensive for a third-party to acquire control of us, even if a change of control would be beneficial to our stockholders. For example, our charter authorizes our Board of Directors to issue up to 50,000,000 shares of preferred stock in one or more classes or series and to fix the rights, preferences, privileges and restrictions of unissued classes or series of preferred stock, each without any vote or action by our stockholders. We could issue a class or series of preferred stock to impede the completion of a merger, tender offer or other takeover attempt. These and other provisions in our charter and bylaws may impede takeover attempts, or other transactions, that may be in the best interests of our stockholders and, in particular, our common stockholders. In addition, the market price of our common stock could be adversely affected to the extent that provisions of our charter and bylaws discourage potential takeover attempts, or other transactions, that our stockholders may favor.
Certain provisions of Maryland law may limit the ability of a third-party to acquire control of our company
Certain provisions of the Maryland General Corporation Law (the “MGCL”) may have the effect of delaying, deferring or preventing a transaction or a change of control of our company that might involve a premium price for holders of our common stock or otherwise be in their best interests.
Subject to certain limitations, provisions of the MGCL prohibit certain business combinations between us and an “interested stockholder” (defined generally as any person who beneficially owns 10% or more of the voting power of our outstanding voting stock or an affiliate or associate of ours who beneficially owned 10% or more of the voting power of our then outstanding stock during the two-year period immediately prior to the date in question) or an affiliate of the interested stockholder for five years after the most recent date on which the stockholder became an interested stockholder. After the five-year period, business combinations between us and an interested stockholder or an affiliate of the interested stockholder must generally either provide a minimum price to our stockholders (as defined in the MGCL) in the form of cash or other consideration in the same form as previously paid by the interested stockholder or be recommended by our Board of Directors and approved by the affirmative vote of at least 80% of the votes entitled to be cast by holders of our outstanding shares of voting stock and at least two-thirds of the votes entitled to be cast by stockholders other than the interested stockholder and its affiliates and associates. These provisions of the MGCL relating to business combinations do not apply, however, to business combinations that are approved or exempted by our Board of Directors prior to the time that the interested stockholder becomes an interested stockholder. Pursuant to the statute, our Board of Directors has, by resolution, exempted business combinations between us and American Capital and its affiliates, and between us and any other person, provided that in the latter case the business combination is first approved by our Board of Directors (including a majority of our directors who are not affiliates or associates of such person). However, our Board of Directors may repeal or modify this resolution at any time in the future, in which case the applicable provisions of this statute will become applicable to business combinations between us and interested stockholders.
The “control share” provisions of the MGCL provide that holders of “control shares” of a Maryland corporation (defined as shares which, when aggregated with other shares controlled by the stockholder (except solely by virtue of a revocable proxy), entitle the stockholder to exercise one of three increasing ranges of voting power in electing directors) acquired in a “control share acquisition” (defined as the direct or indirect acquisition of ownership or control of “control shares”) have no voting rights with respect to such shares except to the extent approved by our stockholders by the affirmative vote of at least two-thirds of all the votes entitled to be cast on the matter, excluding votes entitled to be cast by the acquiror of control shares, our officers and our employees who are also our directors. Our bylaws contain a provision exempting from the control share acquisition statute any and all acquisitions by any person of shares of our stock. There can be no assurance that this provision will not be amended or
31
eliminated at any time in the future. However, so long as we are a BDC, we will amend our bylaws to be subject to the control share acquisition statute only if our Board of Directors determines that it would be in our best interests based on our determination that our being subject to the control share acquisition statute does not conflict with the 1940 Act.
Additionally, Title 3, Subtitle 8 of the MGCL permits our Board of Directors, without stockholder approval and regardless of what is currently provided in our charter or bylaws, to elect to be subject to certain provisions relating to corporate governance that may have the effect of delaying, deferring or preventing a transaction or a change of control of our company that might involve a premium to the market price of our common stock or otherwise be in our stockholders’ best interests. Upon the consummation of this offering, we will already be subject to some of these provisions, either by provisions of our charter and bylaws unrelated to Subtitle 8 or by reason of an election in our charter to be subject to certain provisions of Subtitle 8.
Our Board of Directors has the power to cause us to issue additional shares of our stock without stockholder approval
Our charter authorizes us to issue additional authorized but unissued shares of common or preferred stock. In addition, our Board of Directors may, without stockholder approval, amend our charter to increase the aggregate number of our shares of stock or the number of shares of stock of any class or series that we have authority to issue and classify or reclassify any unissued shares of common or preferred stock and set the preferences, rights and other terms of the classified or reclassified shares. As a result, our Board of Directors may establish a series of shares of common or preferred stock that could delay or prevent a transaction or a change in control that might involve a premium price for our shares of common stock or otherwise be in the best interest of our stockholders.
Our common stockholders will bear the expenses associated with our borrowings, and the holders of our debt securities, if any, will have certain rights senior to our common stockholders
All of the costs of offering and servicing our debt, including interest thereon, will be borne by our common stockholders. The interests of the holders of any debt we may issue will not necessarily be aligned with the interests of our common stockholders. In particular, the rights of holders of our debt to receive interest or principal repayment will be senior to those of our common stockholders. In addition, we may grant a lender a security interest in a significant portion or all of our assets, even if the total amount we may borrow from such lender is less than the amount of such lender's security interest in our assets.
Our shares of common stock have a limited trading history and we cannot assure you that the market price of shares of our common stock will not decline
Our shares of common stock have a limited trading history and we cannot assure you that a public trading market will be sustained for such shares. We cannot predict the prices at which our common stock will trade. We cannot assure you that the market price of shares of our common stock will not decline at any time. In addition, if our common stock trades below our NAV per share, we will generally not be able to sell additional shares of our common stock to the public at the market price without first obtaining the approval of our stockholders (including our unaffiliated stockholders) and our independent directors for such issuance.
Our stockholders could experience dilution in their ownership percentage if they do not participate in our dividend reinvestment plan
All distributions declared in cash and payable to stockholders that are participants in our dividend reinvestment plan are reinvested in shares of our common stock. As a result, our stockholders that do not participate in our dividend reinvestment plan could experience dilution in their ownership percentage of our common stock over time if we issue additional shares of our common stock as part of the dividend reinvestment plan.
You may have current tax liabilities on distributions that are reinvested in our common stock
Under the dividend reinvestment plan, if you own shares of our common stock, you will have all cash distributions automatically reinvested in additional shares of our common stock unless you, or your nominee on your behalf, specifically “opt out” of the dividend reinvestment plan by delivering a written notice to the plan administrator prior to the record date of the next distribution. If you have not “opted out” of the dividend reinvestment plan, you will be deemed to have received, and for federal income tax purposes will be taxed on, the amount reinvested in our common stock to the extent the amount reinvested was not a tax-free return of capital. As a result, you may have to use funds from other sources to pay your federal income tax liability on the value of the common stock received. See “Management’s Discussion and Analysis of Financial Condition and Results of Operations—Financial Condition, Liquidity and Capital Resources” for more information.
We may in the future choose to pay distributions partly in our own stock, in which case you may be required to pay tax in excess of the cash you receive
We may make taxable distributions that are payable in part in our stock. The Internal Revenue Service (the “IRS”) has issued private letter rulings to other RIC taxpayers in the past that allowed the RIC taxpayer to treat a distribution of its own stock as fulfilling its RIC annual distribution requirement under certain circumstances. In addition, the IRS has issued revenue procedures
32
in the past that temporarily allowed a RIC to treat a distribution of its own stock as fulfilling its RIC annual distribution requirements under certain circumstances (although those periods to which those revenue procedures applied have expired). We may seek to obtain a similar private letter ruling from the IRS, or the IRS may issue revenue procedures in the future allowing RICs to treat a distribution of its own stock as fulfilling its RIC annual distribution requirements. As a result, a stockholder may be required to pay tax with respect to such distributions in excess of any cash received.
Item 1B. Unresolved Staff Comments
None.
Item 2. Properties
We do not own any real estate or other physical properties materially important to our operation. Our and our Manager’s executive offices are located at 2 Bethesda Metro Center, 14th Floor, Bethesda, MD 20814, and members of our Manager’s senior investment team are located at 505 Fifth Avenue, 26th Floor, New York, NY 10017; such offices are provided by American Capital in accordance with the terms of the administrative services agreement.
Item 3. Legal Proceedings
From time to time, we may be a party to certain ordinary routine litigation incidental to our business, including the enforcement of our rights under contracts with our portfolio companies. We are not currently subject to any material litigation nor, to our knowledge, is any material litigation threatened against us.
Item 4. Mine Safety Disclosures
Not applicable.
33
PART II.
Item 5. Market for Registrant's Common Equity, Related Stockholder Matters and Issuer Purchases of Equity Securities
Price Range of Common Stock
Our common stock is traded on the NASDAQ Global Select Market under the symbol “ACSF.” The following table lists the high and low closing sale prices for our common stock, the closing sale prices as a premium or (discount) to our NAV per share and distributions per share since January 16, 2014, the date on which our common stock began trading on the NASDAQ Global Select Market.
Closing Sales Price | Premium (Discount) of High Sales Price to NAV (2) per Share | Premium (Discount) of Low Sales Price to NAV (2) per Share | Distributions Declared | |||
Period | NAV (1) | High | Low | |||
Fiscal year ended December 31, 2015 | ||||||
Fourth quarter | $11.79 | $11.72 | $9.56 | (0.6)% | (18.9)% | $0.291 |
Third quarter | $13.53 | $13.20 | $10.91 | (2.4)% | (19.4)% | $0.291 |
Second quarter | $14.54 | $13.45 | $12.65 | (7.5)% | (13.0)% | $0.291 |
First quarter | $14.51 | $13.49 | $12.11 | (7.0)% | (16.5)% | $0.29 |
Fiscal year ended December 31, 2014 | ||||||
Fourth quarter | $14.42 | $13.44 | $12.11 | (6.8)% | (16.0)% | $0.29 |
Third quarter | $14.85 | $14.12 | $13.01 | (4.9)% | (12.4)% | $0.28 |
Second quarter | $15.12 | $14.25 | $13.25 | (5.8)% | (12.4)% | $0.28 |
First quarter (3) | $15.11 | $14.70 | $13.38 | (2.7)% | (11.4)% | $0.18 |
(1) | NAV per share is determined as of the last day in the relevant quarter and therefore may not reflect the NAV per share on the date of the high and low sales prices. The NAVs shown are based on outstanding common shares at the end of the each period. |
(2) | Calculated as of the respective high or low closing sales price divided by the quarter-end NAV. |
(3) | The high and low price, as reported, reflects the time period from January 16, 2014 through March 31, 2014 and does not consider the initial public offering price of $15.00 per share. |
The last reported price for our common stock on March 9, 2016 was $9.51 per share. As of March 9, 2016, we had three stockholders of record. Most of the shares of our common stock are held by brokers and other institutions on behalf of stockholders.
Shares of BDCs may trade at a market price both above and below the NAV that is attributable to those shares. Our shares have historically traded below our NAV per share. For example, our shares closed on the NASDAQ Global Select Market at $9.83 on December 31, 2015. Our NAV per share was $11.79 as of the same date as shown in the table above. The possibility that our shares of common stock will trade at a discount from NAV per share or at a premium that is unsustainable over the long term is separate and distinct from the risk that our NAV per share will decrease. It is not possible to predict whether our shares will trade at, above or below our NAV per share in the future.
Distributions to Stockholders
We intend to continue making regular distributions to our stockholders. The timing and amount of our distributions, if any, will be determined by our Board of Directors. All distributions to our stockholders are declared out of assets legally available for distribution. We expect that our distributions to stockholders will generally be from accumulated net investment income and from net realized capital gains, if any, as applicable. To the extent our taxable earnings fall below the total amount of our distributions for any given fiscal year, a portion of those distributions may be deemed to be a tax return of capital to our stockholders. Thus, the source of a distribution to our stockholders may be the original capital invested by the stockholder rather than our taxable ordinary income or capital gains. Stockholders should read any written disclosure accompanying a distribution payment carefully and should not assume that the source of any distribution is our taxable ordinary income or capital gain.
We have elected to be taxed as a RIC under Subchapter M of the Code. To maintain our RIC status, we must distribute at least 90% of our ordinary income and the excess of net short term gains over the net long term losses, if any, out of the assets legally available for distribution. During the years ended December 31, 2015 and 2014, 100% of our our distributions were made from net investment income. A written statement identifying the nature of these distributions for tax reporting purposes for the year was posted on our website. We may not be able to achieve operating results that will allow us to make distributions at a specific level or to increase the amounts of these distributions from time to time. In addition, we may be limited in our ability to make distributions due to the asset coverage requirements applicable to us as a BDC under the 1940 Act. If we do not distribute a certain percentage of our income annually, we will suffer adverse tax consequences, including possible loss of favorable RIC tax treatment. We cannot assure stockholders that they will receive any distributions.
34
All distributions declared in cash and payable to stockholders that are participants in our dividend reinvestment and stock purchase plan are generally automatically reinvested in shares of our common stock. As a result, stockholders that opt out of our dividend reinvestment and stock purchase plan may experience dilution over time.
The following table reflects the cash distributions that we have declared on our common stock since our IPO:
($ in thousands, except per share data) | |||||
Quarterly Declaration Date | Ex-Dividend Date | Record Date | Payment Date | Per Share Amount | Total Amount |
March 17, 2014 | March 27, 2014 | March 31, 2014 | April 10, 2014 | $0.18 | $1,800 |
June 18, 2014 | June 26, 2014 | June 30, 2014 | July 10, 2014 | $0.28 | $2,800 |
September 17, 2014 | September 26, 2014 | September 30, 2014 | October 10, 2014 | $0.28 | $2,800 |
December 18, 2014 | December 29, 2014 | December 31, 2014 | January 9, 2015 | $0.29 | $2,900 |
March 19, 2015 | March 27, 2015 | March 31, 2015 | April 6, 2015 | $0.29 | $2,900 |
Monthly Declaration Date | Ex-Dividend Date | Record Date | Payment Date | Per Share Amount | Total Amount |
March 19, 2015 | April 17, 2015 | April 21, 2015 | May 4, 2015 | $0.097 | $970 |
May 4, 2015 | May 20, 2015 | May 22, 2015 | June 2, 2015 | $0.097 | $970 |
May 4, 2015 | June 17, 2015 | June 19, 2015 | July 2, 2015 | $0.097 | $970 |
May 4, 2015 | July 22, 2015 | July 24, 2015 | August 4, 2015 | $0.097 | $970 |
August 3, 2015 | August 19, 2015 | August 21, 2015 | September 2, 2015 | $0.097 | $970 |
August 3, 2015 | September 18, 2015 | September 22, 2015 | October 2, 2015 | $0.097 | $970 |
August 3, 2015 | October 21, 2015 | October 23, 2015 | November 3, 2015 | $0.097 | $970 |
November 2, 2015 | November 18, 2015 | November 20, 2015 | December 2, 2015 | $0.097 | $970 |
November 2, 2015 | December 22, 2015 | December 24, 2015 | January 5, 2016 | $0.097 | $970 |
November 2, 2015 | January 20, 2016 | January 22, 2016 | February 2, 2016 | $0.097 | $970 |
February 8, 2016 | February 17, 2016 | February 19, 2016 | March 2, 2016 | $0.097 | $970 |
February 8, 2016 | March 21, 2016 | March 23, 2016 | April 4, 2016 | $0.097 | $970 |
February 8, 2016 | April 19, 2016 | April 21, 2016 | May 3, 2016 | $0.097 | $970 |
Inception to Date Total | $2.581 | $25,810 | |||
Sale of Unregistered Securities
We did not engage in any sales of unregistered securities during the fiscal years ended December 31, 2015 and 2014.
35
Stock Performance Graph
This graph compares the return on our common stock with that of the S&P/LSTA U.S. All Loans Index and the Russell 2000 Index, for the period from January 16, 2014 (initial public offering) through December 31, 2015. The graph assumes that, on January 16, 2014, a person invested $100 in each of our common stock, the S&P/LSTA U.S. All Loans Index and the Russell 2000 Index at their closing prices. The graph measures total stockholder return, which takes into account both changes in stock price and dividends. It assumes that dividends paid are reinvested in like securities.
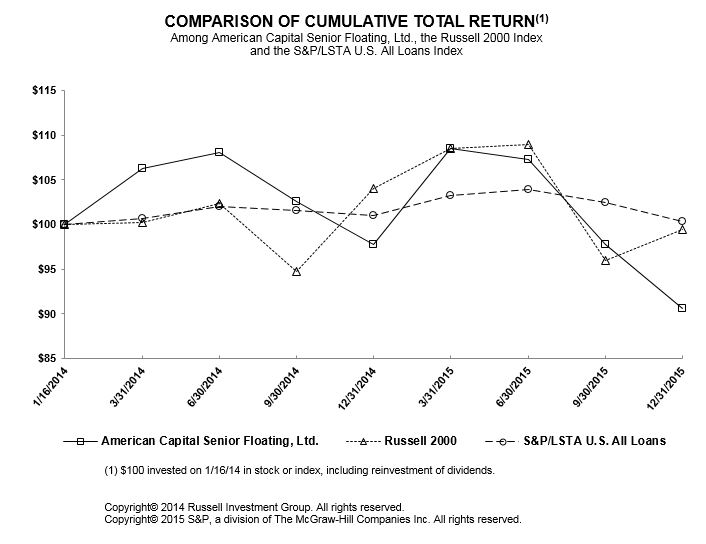
This graph and the other information furnished under this Part II Item 5 of this report shall not be deemed to be “soliciting material” or to be “filed” with the SEC or subject to Regulation 14A or 14C, or to the liabilities of Section 18 of the Exchange Act. The stock price performance included in this graph is not necessarily indicative of future stock price performance.
Dividend Reinvestment and Stock Purchase Plan
Our Board of Directors has adopted a dividend reinvestment and stock purchase plan. If your shares of common stock are registered in your own name, your distributions will automatically be reinvested under the plan in additional whole and fractional shares of common stock, unless you “opt out” of the plan so as to receive cash distributions by notifying our plan administrator by telephone, internet or in writing. If your shares are held in the name of a broker or other nominee, you should contact the broker or nominee for details regarding opting out of the plan. Under the optional cash purchase component of the plan, participants in the plan may also make optional cash purchases of shares of our common stock of between $50 and $10,000 per month and, with our prior approval, in excess of $10,000 per month. Stockholders who receive distributions in the form of stock will be subject to the same federal, state and local tax consequences as stockholders who elect to receive their distributions in cash; however, since their cash distributions will be reinvested, such stockholders will not receive cash with which to pay any applicable taxes on reinvested distributions.
Our stock transfer agent, registrar and dividend reinvestment plan administrator is Computershare Investor Services. Requests for information from Computershare can be sent to Computershare Investor Services, P.O. Box 30170, College Station, TX 77842-3170, or calling (800) 733-5001 (U.S. and Canada) (781) 575-3400 (outside U.S. and Canada) or through the Internet, at www.computershare.com.
36
Item 6. Selected Financial Data
AMERICAN CAPITAL SENIOR FLOATING, LTD.
CONSOLIDATED SELECTED FINANCIAL DATA
($ in thousands, except per share data)
The selected financial and other data below should be read in conjunction with our “Management’s Discussion and Analysis of Financial Condition and Results of Operations” and the consolidated financial statements and notes thereto. Financial information is presented for the fiscal years ended December 31, 2015, 2014 and the period ended December 31, 2013. Financial information has been derived from our consolidated financial statements that were audited by Ernst & Young LLP, an independent registered public accounting firm.
As of and for the year ended December 31, | Period from October 15, 2013* to | ||||||||||
2015 | 2014 | December 31, 2013 | |||||||||
Consolidated Statement of Operations data: | |||||||||||
Total investment income | $ | 19,245 | $ | 17,773 | $ | 1,572 | |||||
Total expenses (net) (1) | $ | 6,555 | $ | 6,914 | $ | 1,326 | |||||
Net investment income | $ | 12,690 | $ | 10,859 | $ | 246 | |||||
Net (loss) gain on investments | $ | (27,355 | ) | $ | (7,070 | ) | $ | 769 | |||
Net (decrease) increase in net assets resulting from operations | $ | (14,665 | ) | $ | 3,789 | $ | 1,015 | ||||
Per Share data: | |||||||||||
Net asset value | $ | 11.79 | $ | 14.42 | n/a | ||||||
Net investment income | $ | 1.27 | $ | 1.09 | n/a | ||||||
Net loss on investments | $ | (2.74 | ) | $ | (0.71 | ) | n/a | ||||
Net (decrease) increase in net assets resulting from operations | $ | (1.47 | ) | $ | 0.38 | n/a | |||||
Distributions to stockholders declared | $ | 1.16 | $ | 1.03 | n/a | ||||||
Consolidated Balance Sheet data: | |||||||||||
Investments, fair value | $ | 229,056 | $ | 276,370 | $ | 199,565 | |||||
Cash and cash equivalents | $ | 2,474 | $ | 1,757 | $ | 12,493 | |||||
Total assets | $ | 235,805 | $ | 282,477 | $ | 218,696 | |||||
Secured revolving credit facility payable | $ | 110,200 | $ | 130,000 | $ | 194,748 | |||||
Total net assets | $ | 117,929 | $ | 144,235 | $ | 1,016 | |||||
Other data: | |||||||||||
Total return based on market value (2) | (10.75 | )% | (12.90 | )% | n/a | ||||||
Total return based on net asset value (2) | (10.10 | )% | 3.73 | % | n/a | ||||||
Investment purchases during the period | $ | 106,982 | $ | 226,628 | $ | 207,548 | |||||
Investment sales and repayments during the period | $ | 134,342 | $ | 148,461 | $ | 9,790 | |||||
Number of loan obligors at period end | 128 | 117 | 69 | ||||||||
Number of CLO issuers at period end | 20 | 16 | 8 | ||||||||
Yield on SFRLs as of period end | 5.38 | % | 5.36 | % | 5.17 | % | |||||
Yield on CLOs as of period end | 10.04 | % | 13.64 | % | 14.64 | % | |||||
Yield on investment portfolio as of period end | 6.37 | % | 6.92 | % | 6.61 | % | |||||
* | Commencement of operations |
(1) | Net expenses include income tax provision included in net investment income. |
(2) | Total return is based on the change in market price or NAV per share during the period and takes into account dividends reinvested in accordance with the dividend reinvestment and stock purchase plan. |
37
Item 7. Management’s Discussion and Analysis of Financial Condition and Results of Operations
The information contained in this section should be read in conjunction with our financial statements and notes thereto appearing elsewhere in this report.
Forward-Looking Statements
Some of the statements in this report constitute forward-looking statements, which relate to future events or our future performance or financial condition. We generally use words such as “anticipates,” “believes,” “expects,” “intends” and similar expressions to identify forward-looking statements. Our actual results could differ materially from those projected in the forward-looking statements for any reason, including any factors set forth in “Risk Factors” and elsewhere in this report. The forward-looking statements contained herein involve risks and uncertainties, including statements as to: (i) our future operating results; (ii) our business prospects and the prospects of our portfolio companies; (iii) the impact of investments that we expect to make; (iv) our contractual arrangements and relationships with third-parties; (v) the dependence of our future success on the general economy and its impact on the industries in which we invest; (vi) the ability of our portfolio companies to achieve their objectives; (vii) our expected financings and investments; (viii) the adequacy of our cash resources and working capital; and (ix) the timing of cash flows, if any, from the operations of our portfolio companies.
We have based the forward-looking statements included in this report on information available to us on the date of this report, and we assume no obligation to update any such forward-looking statements. Although we undertake no obligation to revise or update any forward-looking statements, whether as a result of new information, future events or otherwise, you are advised to consult any additional disclosures that we may make directly to you or through reports that we may file with the SEC in the future, including any annual reports on Form 10-K, quarterly reports on Form 10-Q and current reports on Form 8-K.
Overview
American Capital Senior Floating, Ltd. (“ACSF”, “we”, “our” and “us”), a Maryland corporation organized in February 2013 that commenced operations on October 15, 2013, is an externally managed, non-diversified closed-end investment management company. We have elected to be treated as a business development company (“BDC”) under the Investment Company Act of 1940 (the “1940 Act”). In addition, for tax purposes we have elected to be treated as a regulated investment company (“RIC”) under Subchapter M of the Internal Revenue Code of 1986, as amended (the “Code”).
On January 15, 2014, we priced our initial public offering (“IPO”), selling 10.0 million shares of common stock, at a price of $15.00 per share for net proceeds of $149.2 million. Our common stock is listed on the NASDAQ Global Select Market, where it trades under the symbol “ACSF”. We are an “emerging growth company,” as defined in the Jumpstart Our Business Startups Act of 2012 (“JOBS Act”), and intend to take advantage of the exemption for emerging growth companies allowing us to temporarily forgo the auditor attestation requirements of Section 404(b) of the Sarbanes-Oxley Act of 2002. We do not intend to take advantage of other disclosure or reporting exemptions for emerging growth companies under the JOBS Act.
Our investment activities are managed by American Capital ACSF Management, LLC (our “Manager”) for an annual base management fee of 0.80% of our total consolidated assets, excluding cash and cash equivalents and net unrealized appreciation or depreciation, at the end of the most recently completed fiscal quarter. There is no incentive compensation paid to our Manager. However, in connection with our IPO, our Manager has agreed to be responsible for certain of our operating expenses in excess of 0.75% of our consolidated net assets, less net unrealized appreciation or depreciation, each as defined under GAAP at the end of the most recently completed fiscal quarter for the first 24 months following the date of our IPO (the “Expense Cap”). Our Manager has agreed to extend the Expense Cap until the date of our 2016 Annual Meeting of Stockholders, at which time we expect to submit to a vote of stockholders an amendment and restatement of the management agreement which would (i) extend the Expense Cap through December 31, 2020, (ii) subject to the Expense Cap, provide for reimbursement by us to our Manager for certain compensation expenses related to legal, compliance and internal audit personnel of our Manager and its affiliates who provide services to us necessary for our operations that are not required to be provided by our Manager under the management agreement and (iii) make certain other immaterial changes. Following the expiration of the Expense Cap, there are no limits on the reimbursement to our Manager or its affiliates of such expenses related to our operations.
On October 29, 2015, our wholly-owned consolidated financing subsidiary, ACSF Funding I, LLC (“ACSF Funding”) amended and restated its secured revolving credit facility with Bank of America, N.A. (as amended and restated, the “Credit Facility”) to extend the maturity date from December 18, 2015 to December 18, 2018, decrease the commitment amount from $140,000 to $135,000 and eliminate the commitment fee when the facility is at least 90% utilized. The Credit Facility generally bears interest at the London Interbank Offered Rate (“LIBOR”) plus 1.80%. There is a commitment fee equal to 0.75% on the unused amount of the commitments to the extent the outstanding amount of committed loans is less than 90% of the aggregate commitments. The Credit Facility is secured by ACSF Funding's assets pursuant to a security agreement and contains customary financial and negative covenants and events of default. Advance rates vary on the type of collateral owned and can range up to 80%.
38
Investments
Our investment objective is to provide attractive, risk-adjusted returns over the long term primarily through current income while seeking to preserve our capital. We actively manage a leveraged portfolio composed primarily of diversified investments in first lien and second lien floating rate loans principally to large-market U.S.-based companies (collectively, “Senior Floating Rate Loans” or “SFRLs”), which are commonly referred to as leveraged loans. Standard and Poor's (“S&P”) defines large-market loans as loans to issuers with earnings before interest, taxes, depreciation and amortization (“EBITDA”) of greater than $50 million. Senior Floating Rate Loans are typically collateralized by a company's assets and structured with first lien or second lien priority on collateral, providing for greater security and potential recovery in the event of default compared to other subordinated fixed-income products. We also invest in equity tranches of collateralized loan obligations (“CLOs”) which are securitized vehicles collateralized primarily by SFRLs and we may invest in debt tranches of CLOs. In addition, we may selectively invest in loans issued by middle market companies, mezzanine and unitranche loans and high yield bonds. Additionally, we may from time to time hold or invest in other equity investments and other debt or equity securities generally arising from a restructuring of Senior Floating Rate Loan positions previously held by us. Under normal market conditions, we will invest at least 80% of our assets in Senior Floating Rate Loans.
Our level of investment activity can vary substantially from period to period depending on many factors, including the amount of debt and equity capital available to U.S. based large-market private companies, the level of merger and acquisition activity for such companies, the general economic environment and the competitive environment for the types of investments we make. As a BDC, we must not acquire any assets other than “qualifying assets” as defined by Section 55(a) of the 1940 Act unless, at the time the acquisition is made, at least 70% of our total assets are qualifying assets (with certain limited exceptions). Qualifying assets include investments in “eligible portfolio companies”. The definition of “eligible portfolio company” includes private operating companies and certain public companies whose securities are listed on a national securities exchange but whose market capitalization is less than $250 million, in each case organized under the laws of and with their principal place of business located in the United States. Investments in debt and equity tranches of CLOs are deemed nonqualified assets for BDC compliance purposes; therefore, under normal market conditions, we intend to limit our CLO investments to 20% of our portfolio.
Investment Income
We generate investment income primarily in the form of interest income from the investment securities we hold and capital gains, if any, on investment securities that we may sell. Our debt investments generally have a stated term of three to seven years and typically bear interest at a floating rate usually determined on the basis of a benchmark LIBOR, commercial paper rate, or the prime rate. Interest on our debt investments is generally payable quarterly but may be paid monthly or semi-annually.
Expenses
We do not have any employees and do not pay our officers any cash or non-cash equity compensation. We pay, or reimburse our Manager and its affiliates, for expenses related to our operations incurred on our behalf, excluding employment-related expenses of our and our Manager's officers and any employees of American Capital or the parent company of our Manager who provide services to us pursuant to the management agreement or to our Manager pursuant to the administrative services agreement. However, in accordance with the terms of our Management Agreement, our Manager agreed to limit the amount of operating expenses subject to reimbursement by us to the amount of the Expense Cap (See “Management Agreement” in this Annual Report on Form 10-K for further discussion).
During periods of asset growth, we generally expect our general and administrative operating expenses to decline as a percentage of our total assets and increase during periods of asset declines. Interest expense and costs relating to future offerings of securities, among others, may also increase or reduce overall operating expenses based on portfolio performance, interest rate benchmarks, and offerings of our securities relative to comparative periods, among other factors.
39
Portfolio and Investment Activity
As of December 31, 2015, our portfolio had a fair market value of $229.1 million, a cost basis of $261.9 million and was comprised of 74% first lien Loans, 10% second lien Loans and 16% CLO equity, measured at fair value. The loan portfolio consisted of 128 portfolio companies and the CLO portfolio included 20 CLOs managed by 15 collateral managers with vintages ranging from 2012 to 2015. Our loan portfolio consisted of all floating rate investments with 100% having LIBOR floors ranging between 0.75% and 1.75%. The weighted average LIBOR floor in our loan portfolio was 1.01% as of December 31, 2015. The following table depicts a summary of our portfolio as of December 31, 2015:
($ in thousands) | Cost | Fair Market Value | Cumulative Net Unrealized Appreciation (Depreciation) | Yield at Cost | ||||||||||
Investment Portfolio: | ||||||||||||||
First lien floating rate loans | $ | 181,367 | $ | 169,580 | $ | (11,787 | ) | 5.03 | % | |||||
Second lien floating rate loans | 24,909 | 22,575 | (2,334 | ) | 7.90 | % | ||||||||
Total Senior Floating Rate Loans | 206,276 | 192,155 | (14,121 | ) | 5.38 | % | ||||||||
CLO equity | 55,599 | 36,854 | (18,745 | ) | 10.04 | % | ||||||||
Equity | — | 47 | 47 | — | % | |||||||||
Total Investment Portfolio | $ | 261,875 | $ | 229,056 | $ | (32,819 | ) | 6.37 | % | |||||
As of December 31, 2014, our portfolio had a fair market value of $276.4 million, a cost basis of $282.1 million and was comprised of 70% first lien loans, 11% second lien loans and 19% CLO equity, measured at fair value. The loan portfolio consisted of 117 portfolio companies and the CLO portfolio included 16 CLOs managed by 14 collateral managers with vintages ranging from 2012 to 2014. Our loan portfolio consisted of all floating rate investments with 100% having LIBOR floors ranging between 1.00% and 1.75%. The weighted average LIBOR floor in our loan portfolio was 1.03% as of December 31, 2014. The following table depicts a summary of the portfolio as of December 31, 2014:
($ in thousands) | Cost | Fair Market Value | Cumulative Net Unrealized Depreciation | Yield at Cost | ||||||||||
Investment Portfolio: | ||||||||||||||
First lien floating rate loans | $ | 198,028 | $ | 194,952 | $ | (3,076 | ) | 4.98 | % | |||||
Second lien floating rate loans | 30,842 | 29,841 | (1,001 | ) | 7.81 | % | ||||||||
Total Senior Floating Rate Loans | 228,870 | 224,793 | (4,077 | ) | 5.36 | % | ||||||||
CLO equity | 53,263 | 51,577 | (1,686 | ) | 13.64 | % | ||||||||
Total Investment Portfolio | $ | 282,133 | $ | 276,370 | $ | (5,763 | ) | 6.92 | % | |||||
Our portfolio is actively managed, with an annualized turnover ratio of 40.7% for the year ended December 31, 2015. During the year ended December 31, 2015, the loan portfolio rotation was reflective of the active management style, which seeks to optimize the portfolio based on current market conditions by rotating into positions that have better relative values. The yield at cost as of December 31, 2015 on the loan portfolio, CLO equity and total portfolio was 5.38%, 10.04% and 6.37%, respectively. The yield at cost on the investment portfolio decreased 55 basis points from 6.92% as of December 31, 2014, primarily due to a 360 basis point decrease in the yield on the CLO Portfolio due to a decrease in projected future cash flows.
As a result of the decrease in projected future cash flows on the CLO Portfolio, ACSF recognized a $4.0 million write down related to credit losses included in the fair value of the investments on five CLO investments as of December 31, 2015. This write down does not affect the GAAP cost basis of these investments, but does impact the amount of interest income that is recognized over the remaining life of the investment. As a result of the $4.0 million credit loss write down recorded as of December 31, 2015, ACSF continues to accrete income on these five CLO investments but will recognize $4.0 million more of total interest income over the life of these investments and will record a $4.0 million realized loss upon the sale or redemption of these investments.
40
The following tables depict the portfolio activity for years ended December 31, 2015 and 2014:
2015 | |||||||||||||||||||||||||||||
First Lien | Second Lien | CLO Equity | Equity | Total | |||||||||||||||||||||||||
$ in thousands | Amount | Yield (at cost) | Amount | Yield (at cost) | Amount | Yield (at cost) | Amount | Yield (at cost) | Amount | Yield (at cost) | |||||||||||||||||||
December 31, 2014, at Fair Value | $ | 194,952 | 4.98 | % | $ | 29,841 | 7.81 | % | $ | 51,577 | 13.64 | % | $ | — | — | % | $ | 276,370 | 6.92 | % | |||||||||
Purchases | 91,404 | 5.07 | % | 4,942 | 8.42 | % | 10,636 | 17.32 | % | — | — | % | 106,982 | 6.03 | % | ||||||||||||||
Sales | (66,976 | ) | (4.85 | )% | (6,723 | ) | (8.10 | )% | (2,282 | ) | (18.93 | )% | — | — | % | (75,981 | ) | (5.53 | )% | ||||||||||
Repayments (1) | (40,565 | ) | (5.20 | )% | (4,170 | ) | (7.69 | )% | (13,626 | ) | (13.90 | )% | — | — | % | (58,361 | ) | (7.09 | )% | ||||||||||
Amortization / accretion of discount / premium (2) | 68 | n/a | 14 | n/a | 7,330 | n/a | — | n/a | 7,412 | n/a | |||||||||||||||||||
Realized gains / (losses) | (593 | ) | n/a | 5 | n/a | 278 | n/a | — | n/a | (310 | ) | n/a | |||||||||||||||||
Net unrealized appreciation / (depreciation) | (8,710 | ) | n/a | (1,334 | ) | n/a | (17,059 | ) | n/a | 47 | n/a | (27,056 | ) | n/a | |||||||||||||||
December 31, 2015, at Fair Value | $ | 169,580 | 5.03 | % | $ | 22,575 | 7.90 | % | $ | 36,854 | 10.04 | % | $ | 47 | n/a | $ | 229,056 | 6.37 | % | ||||||||||
(1) | Repayments for CLO equity reflect the amount of cash distributions received during the years ended December 31, 2015 and 2014 and the period ended December 31, 2013. |
(2) | Amount reflected in amortization/accretion of discount/premium for CLO equity represents the income recognized during the year ended December 31, 2015 and 2014 and the period ended December 31, 2013 using the effective interest method. |
For the Year Ended December 31, 2015 | ||||||
Loan | CLO | Total Portfolio | ||||
Portfolio Companies - December 31, 2014 | 117 | 16 | 133 | |||
Purchases (new) | 70 | 5 | 75 | |||
Purchases (add-on to existing) | 10 | — | 10 | |||
Complete Exit | (59) | (1) | (60) | |||
Portfolio Companies - December 31, 2015 | 128 | 20 | 148 | |||
As of December 31, 2015, the fair value of the portfolio was $229.1 million versus a cost basis of $261.9 million resulting in $(32.8) million of cumulative net unrealized depreciation. During the year ended December 31, 2015, we recognized net unrealized depreciation on the investment portfolio of $(27.1) million. The depreciation was due to fair value decline in both the CLO portfolio and the loan portfolio. The decline in fair value of the CLO portfolio was a result of a number of factors, including an increase in defaulted loan assets held by the CLOs, a decline in the NAV of the CLOs and a risk-off sentiment in the market which drove prices down significantly. The primary drivers for the decline in fair value of the loan portfolio were an overall decline in market prices, reinvestment uncertainty and a further decline in the commodities sector, specifically those portfolio companies in the oil & gas and metals & mining industries.
41
2014 | ||||||||||||||||||||||||
First Lien | Second Lien | CLO Equity | Total | |||||||||||||||||||||
($ in thousands) | Amount | Yield (at cost) | Amount | Yield (at cost) | Amount | Yield (at cost) | Amount | Yield (at cost) | ||||||||||||||||
December 31, 2013, at Fair Value | $ | 154,207 | 4.90 | % | $ | 15,186 | 7.97 | % | $ | 30,172 | 14.64 | % | $199,565 | 6.61 | % | |||||||||
Purchases | 169,360 | 5.06 | % | 30,571 | 8.01 | % | 26,697 | 12.51 | % | 226,628 | 6.19 | % | ||||||||||||
Sales | (93,690 | ) | (4.82 | )% | (12,724 | ) | (8.39 | )% | — | — | % | (106,414) | (5.24 | )% | ||||||||||
Repayments (1) | (30,904 | ) | (5.23 | )% | (2,030 | ) | (7.65 | )% | (9,113 | ) | (13.27 | )% | (42,047) | (7.09 | )% | |||||||||
Amortization / accretion of discount / premium (2) | (7 | ) | n/a | 14 | n/a | 5,501 | n/a | 5,508 | n/a | |||||||||||||||
Realized gains / (losses) | 128 | n/a | 62 | n/a | — | n/a | 190 | n/a | ||||||||||||||||
Unrealized appreciation / (depreciation) | (4,142 | ) | n/a | (1,238 | ) | n/a | (1,680 | ) | n/a | (7,060) | n/a | |||||||||||||
December 31, 2014, at Fair Value | $ | 194,952 | 4.98 | % | $ | 29,841 | 7.81 | % | $ | 51,577 | 13.64 | % | $ | 276,370 | 6.92 | % | ||||||||
(1) | Repayments for CLO equity reflect the amount of cash distributions received during the years ended December 31, 2015 and 2014 and the period ended December 31, 2013. |
(2) | Amount reflected in amortization/accretion of discount/premium for CLO equity represents the income recognized during the yeasr ended December 31, 2015 and 2014 and the period ended December 31, 2013 using the effective interest method. |
For the Year Ended December 31, 2014 | ||||||
Loan | CLO | Total Portfolio | ||||
Portfolio Companies - December 31, 2013 | 69 | 8 | 77 | |||
Purchases (new) | 84 | 7 | 91 | |||
Purchases (add-on to existing) | 18 | 1 | 19 | |||
Complete Exit | (54) | — | (54) | |||
Portfolio Companies - December 31, 2014 | 117 | 16 | 133 | |||
As of December 31, 2014, the fair value of the portfolio was $276.4 million versus a cost basis of $282.1 million resulting in $(5.8) million of cumulative net unrealized depreciation. During the year ended December 31, 2014, we recognized net unrealized depreciation on the investment portfolio of $(7.1) million. The depreciation, especially in the fourth quarter, was largely a function of exposure to the oil and gas industry, which was impacted by declines in oil prices during the second half of the year. The remaining net unrealized depreciation was a result of overall price changes observed in the broader market, which generally reflected an increase to the required rate of return for positions with otherwise stable credit profiles.
42
As of December 31, 2015, approximately 75% of our loan portfolio, at fair value, was comprised of loans with a facility rating by S&P of at least “B” or higher. The following chart shows the S&P facility credit rating of our loan portfolio at fair value as of December 31, 2015:
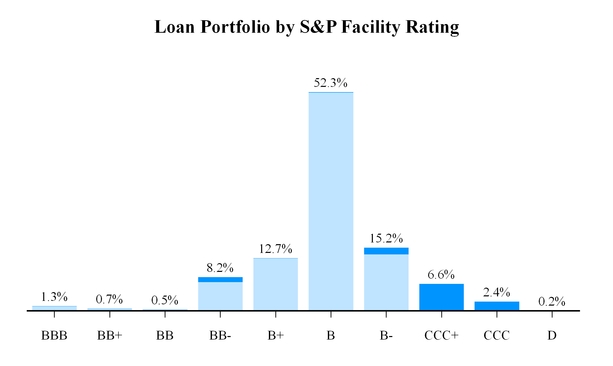
First Lien | Second Lien | ||
As of December 31, 2014, approximately 77% of our loan portfolio, at fair value, was comprised of loans with a facility rating by S&P of at least “B” or higher. The following chart shows the S&P facility credit rating of our loan portfolio at fair value as of December 31, 2014:

First Lien | Second Lien | ||
43
Results of Operations
The following analysis of our financial condition and results of operations should be read in conjunction with our audited consolidated financial statements included in this Annual Report on Form 10-K and the notes thereto.
Year ended December 31, | Period from October 15, 2013* to | ||||||||||
($ in thousands, except per share data) | 2015 | 2014 | December 31, 2013 | ||||||||
Investment income: | |||||||||||
First lien floating rate loans | $ | 9,633 | $ | 9,884 | $ | 973 | |||||
Second lien floating rate loans | 2,282 | 2,389 | 82 | ||||||||
CLO equity | 7,330 | 5,500 | 517 | ||||||||
Total investment income | 19,245 | 17,773 | 1,572 | ||||||||
Expenses: | |||||||||||
Interest and other debt related costs | 2,970 | 3,448 | 951 | ||||||||
Management fee | 2,236 | 2,186 | — | ||||||||
Other expenses (net) | 1,123 | 1,121 | 93 | ||||||||
Net expenses | 6,329 | 6,755 | 1,044 | ||||||||
Net investment income before taxes | 12,916 | 11,018 | 528 | ||||||||
Income tax provision | (227 | ) | (159 | ) | (282 | ) | |||||
Net investment income | 12,689 | 10,859 | 246 | ||||||||
Net (loss) gain on investments: | |||||||||||
Net realized (loss) gain on investments | (310 | ) | 190 | (7 | ) | ||||||
Net unrealized (depreciation) appreciation on investments | (27,056 | ) | (7,060 | ) | 1,297 | ||||||
Income tax benefit (provision) | 11 | (200 | ) | (521 | ) | ||||||
Net (loss) gain on investments | (27,355 | ) | (7,070 | ) | 769 | ||||||
Net (decrease) increase in net assets resulting from operations | $ | (14,666 | ) | $ | 3,789 | $ | 1,015 | ||||
* | Commencement of Operations |
Investment Income
Investment income increased $1.5 million to $19.2 million for the year ended December 31, 2015 compared to 2014. The increase was driven by additional income generated by a larger average CLO portfolio in 2015. Interest generated from the loan portfolio totaled $11.9 million and income from the CLO investments totaled $7.3 million for the year ended December 31, 2015. The yield at cost on our loan portfolio as of December 31, 2015 was 5.03% and the yield at cost on our CLO investments as of December 31, 2015 was 10.04% for a weighted average total yield on the portfolio as of December 31, 2015 of 6.37%.
Investment income for the year ended December 31, 2014 was $17.8 million. Interest generated from the loan portfolio totaled $12.3 million and income from the CLO investments totaled $5.5 million for the year ended December 31, 2014. The average yield on our loan portfolio during the year ended December 31, 2014 was 5.3% and the average yield on our CLO investments during the year ended December 31, 2014 was 13.0% for a weighted average total yield on the portfolio during 2014 of 6.5%.
In accordance with FASB ASC Topic 325-40, Investments-Other, Beneficial Interests in Securitized Financial Assets (“ASC 325-40”), in the event that the fair value of an investment is less than its amortized cost basis and there is an adverse change in the expected future cash flows of the investment, we may be required to write down the current amortized cost used to determine effective yield (“Reference Amount”) by credit losses included in the fair value of the investment or to fair value. We are precluded from reversing the write down for any subsequent increase in the expected cash flows of an investment with the effect of increasing total interest income over the life of the investment and increasing the realized loss recorded at the exit of the investment by the amount of the write down. During the year ended December 31, 2015, we wrote down the Reference Amount of our CLO investment portfolio by $4.0 million for credit losses included in the fair value of the investments.
44
Net Expenses
Net expenses declined $(0.4) million for the year ended December 31, 2015 compared to 2014. The decline was driven by a reduction of interest expense due to a lower average cost of funding and average debt outstanding during 2015.
Interest and other debt related costs incurred in 2013 and from January 1, 2014 until January 22, 2014 (the closing date of the IPO) primarily related to interest expense on the revolving credit facility (the “ACAM Facility”) provided by American Capital Asset Management, LLC, the indirect parent of our Manager. There was $194.7 million outstanding on the ACAM Facility at the time of the closing of the IPO, at which point the ACAM Facility was repaid in full and terminated. The weighted average interest rate on the ACAM Facility was 5.0%.
Interest and other debt related costs incurred following the closing date of the IPO through December 31, 2014 and in 2015 are related to borrowings under our Credit Facility. The Credit Facility generally bears interest at a spread of 1.80% over a chosen index (which is typically one-month LIBOR). Included in other debt related costs are additional fees and expenses associated with the Credit Facility, including an unused commitment fee of 75 basis points on undrawn commitments and the amortization of debt financing costs. On October 29, 2015 the Credit Facility was amended and restated, extending the maturity date from December 18, 2015 to December 18, 2018, decreasing the commitment amount from $140,000 to $135,000 and eliminating the commitment fee when the facility is at least 90% utilized.
The following table outlines the costs associated with our debt financing:
For the period from January 1, 2014 to January 22, 2014 | For the period from January 22, 2014 to December 31, 2014 | For the Year Ended December 31, | For the Period from October 15, 2013* to December 31, | ||||||||||||||||
($ in thousands) | 2015 | 2014 | 2013 | ||||||||||||||||
Interest expense | $ | 568 | $ | 2,433 | $ | 2,518 | $ | 3,001 | $ | 943 | |||||||||
Commitment fees | — | 54 | 111 | 54 | — | ||||||||||||||
Amortization of debt financing costs | 22 | 371 | 341 | 393 | 8 | ||||||||||||||
Total Financing Costs | $ | 590 | $ | 2,858 | $ | 2,970 | $ | 3,448 | $ | 951 | |||||||||
Average debt outstanding | $194,748 | $127,092 | $124,434 | $130,984 | $89,524 | ||||||||||||||
Average cost of funding (1) | 5.00% | 2.39% | 2.39% | 2.63% | 5.00% | ||||||||||||||
Average interest rate | 5.00% | 2.00% | 2.00% | 2.26% | 5.00% | ||||||||||||||
(1) | Includes amortization of debt financing costs |
Other operating expenses totaled $2.0 million for the year ended December 31, 2015 and are comprised primarily of insurance premiums, Board of Director fees, professional fees and rent. However, as a result of the Expense Cap, our Manager was responsible for $0.9 million of our expenses which resulted in our other operating expenses (net) totaling $1.1 million for the year ended December 31, 2015. Other operating expenses totaled $2.1 million for the year ended December 31, 2014 and are comprised primarily of insurance premiums, Board of Director fees, professional fees and rent. However, as a result of the Expense Cap, our Manager was responsible for $1.0 million of our expenses which resulted in our other operating expenses (net) totaling $1.1 million for the year ended December 31, 2014.
Net Realized (Loss) Gain on Investments
Sales and repayments of investments during the year ended December 31, 2015 totaled $76.0 million and $58.4 million, respectively, resulting in net realized losses of $(0.3) million, or $(0.03) per weighted average share outstanding. Sales and repayments of investments during the year ended December 31, 2014 totaled $106.4 million and $42.0 million, respectively, resulting in net realized gains of $0.2 million, or $0.02 per weighted average share outstanding. Sales and repayments of investments during the period ended December 31, 2013 totaled $5.9 million and $3.9 million, respectively, resulting in net realized losses of less than $(0.1) million.
Net Unrealized (Depreciation) Appreciation on Investments
During the year ended December 31, 2015, we recognized net unrealized depreciation on investments of $(27.1) million. The CLO portfolio produced $(17.1) million in net unrealized depreciation, the majority of which was incurred in the third and fourth quarters of 2015. The decline in fair value of the CLO portfolio was a result of a number of factors, including an increase in defaulted loan assets held by the CLOs, a decline in the NAV of the CLOs and a risk-off sentiment which drove prices down significantly. The loan portfolio contributed $(10.0) million of net unrealized depreciation during the year ended December 31, 2015, which was reflective of the downward trend in loan prices during 2015. The primary drivers for the decline in fair value of
45
the loan portfolio were an overall decline in market prices, which was driven primarily by weakness in the commodities sectors, a general risk-off sentiment across various asset classes and related outflows from retail loan funds.
During the year ended December 31, 2014, we recognized net unrealized depreciation on investments of $(7.1) million. The depreciation, especially in the fourth quarter, was largely a function of exposure to the oil & gas industry, which was impacted by declines in oil prices during the second half of the year. The remaining net depreciation was a result of overall price changes observed in the broader market, which reflected an increase to the required rate of return for positions with otherwise stable credit profiles. During the period ended December 31, 2013, ACSF recognized net unrealized appreciation on the investment portfolio of $1.3 million, primarily from the loan portfolio, the fair value of which moved in-line with the broader market.
Income Taxes
From our inception through the date of our IPO, we were a taxable corporation under Subchapter C of the Code (“C corporation”), subject to federal and state income taxes on our taxable ordinary income and capital gains. Prior to our IPO, we were a wholly-owned subsidiary of ACAM, which is wholly-owned by American Capital. As such, we were required to be consolidated in American Capital’s federal consolidated tax group, which has a September 30 tax year end. We had a tax sharing agreement with American Capital and other members of the consolidated tax group, under which such members bore their full share of their individual tax obligation and members were compensated for their losses and other tax benefits that were able to be used by other members of the consolidated tax group based on their pro forma stand-alone federal income tax return. We recognized $1.1 million of federal and state tax expense related to our operations prior to the IPO.
We have elected to be taxed as a RIC under Subchapter M of the Code beginning with the date of our IPO through our tax fiscal year end of December 31 and for subsequent years. As part of our election to be taxed as a RIC, we intend to make a “deemed sale election” whereby we will treat our net unrealized gains (“Net Built-in Gain”) on the date of our IPO as recognized for tax purposes in our final pre-IPO C corporation federal tax return. The federal tax sharing payment that we owed to American Capital attributed to our Net Built-in Gain was waived by American Capital which was then treated as a deemed capital contribution to us.
Excluding the deemed sale election, there were no significant tax consequences arising from the conversion to a RIC from a C corporation in connection with our IPO.
As of December 31, 2015, we had approximately $6.4 million, or $0.64 per share, of estimated undistributed taxable income. We intend to distribute sufficient dividends, including dividends distributed in the following tax year that we elect to be treated as distributed in the current year, to eliminate our current year taxable income. For the year ended December 31, 2015, we accrued federal excise tax of $0.2 million.
Financial Condition, Liquidity and Capital Resources
Our primary resources of liquidity and capital resources arise primarily from our investment portfolio and the available capacity under our Credit Facility. In addition, we expect to use proceeds from any follow-on equity offerings of common stock and other supplementary financing mechanisms as additional sources of capital and liquidity.
In order to qualify as a RIC, we must annually distribute in a timely manner to our stockholders at least 90% of our taxable ordinary income. Accordingly, our ability to retain earnings is limited.
Equity Capital
As a BDC, we are generally not able to issue or sell our common stock at a price below our net asset value per share, exclusive of any underwriting discount, except (i) with the prior approval of a majority of our stockholders, (ii) in connection with a rights offering to our existing stockholders, or (iii) under such other circumstances as the SEC may permit. As of December 31, 2015, our net asset value was $11.79 per share and our closing market price was $9.83 per share.
Debt Capital
On January 22, 2014, we closed our IPO of 10.0 million shares of common stock at $15.00 per share, raising approximately $149.2 million in net proceeds. Using the proceeds from the IPO, plus borrowings from our Credit Facility, we repaid the ACAM Facility in the amount of $194.7 million. Following repayment, the ACAM Facility was terminated.
As of December 31, 2015, we had $110.2 million in borrowings outstanding on our Credit Facility. The fair value of assets owned by ACSF Funding as of December 31, 2015 was $187.9 million and the borrowing base was $141.6 million. On a consolidated basis, as of December 31, 2015, we were leveraged at 0.93x debt to equity. As of December 31, 2015, we had approximately $27.3 million of available liquidity consisting of $2.5 million of cash and cash equivalents and $24.8 million of available capacity on our Credit Facility. As of December 31, 2014, we had $130.0 million in borrowings outstanding on our Credit Facility. The fair value of assets owned by ACSF Funding as of December 31, 2014 was $220.4 million and the borrowing base was $153.4 million. On a consolidated basis, as of December 31, 2014, we were leveraged at 0.90x debt to equity. As of
46
December 31, 2014, we had approximately $11.8 million of available liquidity consisting of $1.8 million of cash and cash equivalents and $10.0 million of available capacity on our Credit Facility.
As a BDC, we are permitted to issue “senior securities”, as defined in the 1940 Act, in any amounts as long as immediately after such issuance our asset coverage is at least 200%, or equal to or greater than our asset coverage prior to such issuance, after taking into account the payment of debt with proceeds from such issuance. Asset coverage is defined in the 1940 Act as the ratio of the value of the total assets, less all liabilities and indebtedness not represented by senior securities, to the aggregate amount of senior securities representing indebtedness. However, if our asset coverage is below 200%, we may also borrow amounts up to 5% of our total assets for temporary purposes even if that would cause our asset coverage ratio to further decline. As of December 31, 2015, our asset coverage was 207%.
Operating and Financing Cash Flows
For the year ended December 31, 2015, net cash provided by operating activities was $34.3 million. For the year and period ended December 31, 2014 and 2013, net cash used in operating activities was $87.5 million and $181.8 million, respectively. Cash provided by operating activities for the year ended December 31, 2015 was primarily due to net proceeds from the sale of investments of $134.3 million, offset by $107.0 million of investment purchases. For the year ended December 31, 2015, net cash used in financing activities was $33.6 million. For the year and period ended December 31, 2014 and 2013, net cash provided by financing activities was $76.7 million and $194.3 million, respectively. Our cash flows from financing activities during the year ended December 31, 2015 was primarily used to reduce debt outstanding by $19.8 million and pay $13.6 million of distributions to shareholders. Our cash flow from financing activities during the year ended December 31, 2014 was primarily attributable to net proceeds from our IPO of $149.2 million offset by a net decrease in the amount of debt outstanding of $64.7 million. Our cash flow from financing activities during the period ended December 31, 2013 was primarily attributable to draws on our ACAM Facility of $194.7 million.
Contractual Obligations
A summary of our contractual payment obligations as of December 31, 2015 are as follows:
Payments Due by Period (in thousands) | ||||||||||||||||||||
Total | Less than 1 Year | 1 - 3 Years | 3 - 5 Years | More than 5 Years | ||||||||||||||||
Credit Facility | $ | 110,200 | $ | — | $ | 110,200 | $ | — | $ | — | ||||||||||
Total contractual obligations | $ | 110,200 | $ | — | $ | 110,200 | $ | — | $ | — | ||||||||||
Off-Balance Sheet Arrangements
We currently engage in no off-balance sheet arrangements.
Distributions to Stockholders
When determining distributions to stockholders, our Board of Directors considers, among other things, our estimated taxable income, which may differ from GAAP income due to temporary and permanent differences in income and expense recognition, and changes in unrealized appreciation and depreciation on investments. The specific tax characteristics will be reported to stockholders on Form 1099 after the end of the calendar year. From a tax perspective, 100% of the distributions paid to stockholders during the year ended December 31, 2015 were distributions of ordinary income.
For the year ended December 31, 2015, our Board of Directors declared $1.16 per share of distributions to stockholders totaling $11.6 million in distributions. We maintain an “opt out” dividend reinvestment and stock purchase plan for our common stockholders. As a result, if we declare a distribution, then stockholders' cash distributions will be automatically reinvested in additional shares of our common stock, unless they, or their nominees on their behalf, specifically “opt out” of the dividend reinvestment and stock purchase plan so as to receive cash distributions.
47
The table below details the distributions to stockholders declared on our shares of common stock since the completion of our IPO (dollars in thousands, except per share data):
Quarterly Declaration Date | Ex-Dividend Date | Record Date | Payment Date | Per Share Amount | Total Amount |
March 17, 2014 | March 27, 2014 | March 31, 2014 | April 10, 2014 | $0.18 | $1,800 |
June 18, 2014 | June 26, 2014 | June 30, 2014 | July 10, 2014 | $0.28 | $2,800 |
September 17, 2014 | September 26, 2014 | September 30, 2014 | October 10, 2014 | $0.28 | $2,800 |
December 18, 2014 | December 29, 2014 | December 31, 2014 | January 9, 2015 | $0.29 | $2,900 |
March 19, 2015 | March 27, 2015 | March 31, 2015 | April 6, 2015 | $0.29 | $2,900 |
Monthly Declaration Date | Ex-Dividend Date | Record Date | Payment Date | Per Share Amount | Total Amount |
March 19, 2015 | April 17, 2015 | April 21, 2015 | May 4, 2015 | $0.097 | $970 |
May 4, 2015 | May 20, 2015 | May 22, 2015 | June 2, 2015 | $0.097 | $970 |
May 4, 2015 | June 17, 2015 | June 19, 2015 | July 2, 2015 | $0.097 | $970 |
May 4, 2015 | July 22, 2015 | July 24, 2015 | August 4, 2015 | $0.097 | $970 |
August 3, 2015 | August 19, 2015 | August 21, 2015 | September 2, 2015 | $0.097 | $970 |
August 3, 2015 | September 18, 2015 | September 22, 2015 | October 2, 2015 | $0.097 | $970 |
August 3, 2015 | October 21, 2015 | October 23, 2015 | November 3, 2015 | $0.097 | $970 |
November 2, 2015 | November 18, 2015 | November 20, 2015 | December 2, 2015 | $0.097 | $970 |
November 2, 2015 | December 22, 2015 | December 24, 2015 | January 5, 2016 | $0.097 | $970 |
November 2, 2015 | January 20, 2016 | January 22, 2016 | February 2, 2016 | $0.097 | $970 |
February 8, 2016 | February 17, 2016 | February 19, 2016 | March 2, 2016 | $0.097 | $970 |
February 8, 2016 | March 21, 2016 | March 23, 2016 | April 4, 2016 | $0.097 | $970 |
February 8, 2016 | April 19, 2016 | April 21, 2016 | May 3, 2016 | $0.097 | $970 |
Inception to Date Total | $2.581 | $25,810 | |||
Critical Accounting Policies
The preparation of consolidated financial statements and related disclosures in conformity with GAAP requires management to make estimates and assumptions that affect the reported amounts of assets and liabilities, disclosure of contingent assets and liabilities at the date of the consolidated financial statements, and revenues and expenses during the periods reported. Actual results could materially differ from those estimates. The following is a summary of our accounting policies that are most affected by judgments, estimates and assumptions, which relate to the estimation of fair value of portfolio investments and revenue recognition.
Valuation of Portfolio Investments
We value our investments in accordance with the 1940 Act and ASC 820, as determined in good faith by our Board of Directors.
We undertake a multi-step valuation process to determine the fair value of our investments in accordance with ASC 820. The valuation process begins with the development of a preliminary valuation recommendation for each investment as determined in accordance with our valuation policy by a group of our Manager’s valuation, accounting and finance professionals, which is independent of our Manager's investment team. To prepare the proposed valuation, the group reviews information provided by a nationally recognized independent pricing service and broker-dealers, and may consult with the investment team and other internal resources of our Manager and its affiliates. The preliminary valuation recommendations are then presented to the Investment Committee and reviewed and approved by our Audit and Compliance Committee. The valuation recommendations are then reviewed by our Board of Directors for final approval. There were no changes to our valuation techniques or to the types of unobservable inputs used in the valuation process during the year ended December 31, 2015.
ASC 820 provides a framework for measuring the fair value of assets and liabilities and provides guidance regarding a fair value hierarchy, which prioritizes information used to measure fair value and the effect of fair value measurements on earnings. When available, we determine the fair value of our investments using unadjusted quoted prices from active markets. Where inputs for an asset or liability fall into more than one level in the fair value hierarchy, the investment is classified in its entirety based on the lowest level input that is significant to that investment's fair value measurement. We use judgment and consider factors specific
48
to the investment when determining the significance of an input to a fair value measurement. Our policy is to recognize transfers in and out of levels as of the beginning of each reporting period. The three levels of the fair value hierarchy and investments that fall into each of the levels are described below:
Level 1: Inputs are unadjusted quoted prices in active markets that are accessible at the measurement date for identical, unrestricted assets or liabilities.
Level 2: Inputs other than quoted prices included within Level 1 that are observable for the asset or liability, either directly or indirectly. This may include valuations based on executed trades, broker quotations that constitute an executable price, and alternative pricing sources supported by observable inputs which, in each case, are either directly or indirectly observable for the asset in connection with market data at the measurement date.
Level 3: Inputs are unobservable and cannot be corroborated by observable market data. In certain cases, investments classified within Level 3 may include securities for which we have obtained indicative quotes from broker-dealers that do not necessarily represent prices the broker may be willing to trade on.
The valuation techniques used maximize the use of observable inputs and minimize the use of unobservable inputs. Our SFRLs are predominately valued based on evaluated prices from a nationally recognized independent pricing service or from third-party brokers who make markets in such debt investments. When possible, we make inquiries of third-party pricing sources to understand their use of significant inputs and assumptions. We review the third-party fair value estimates and perform procedures to validate their reasonableness, including an analysis of the range and dispersion of third-party estimates, frequency of pricing updates, comparison of recent trade activity for similar securities, and review for consistency with market conditions observed as of the measurement date.
There may be instances when independent or third-party pricing sources are not available, or cases where we believe that the third-party pricing sources do not provide sufficient evidence to support a market participant's view of the fair value of the debt investment being valued. These instances may result from an investment in a less liquid loan such as a middle market loan, a mezzanine loan or unitranche loan, or a loan to a company that has become financially distressed. In these instances, we may estimate the fair value based on a combination of a market yield valuation methodology and evaluated pricing discussed above, or solely based on a market yield valuation methodology. Under the market yield valuation methodology, we estimate the fair value based on a discounted cash flow technique. For these debt investments, the unobservable inputs used in the market yield valuation methodology to measure fair value reflect management's best estimate of assumptions that would be used by market participants when pricing the investment in a hypothetical transaction, including estimated remaining life, current market yield and interest rate spreads of similar loans and securities as of the measurement date. We will estimate the remaining life based on market data for the average life of similar loans. However, if we have information that the loan is expected to be repaid in the near term, we would use an estimated remaining life based on the expected repayment date. The average life to be used to estimate the fair value of our loans may be shorter than the legal maturity of the loans since many loans are prepaid prior to the maturity date. The interest rate spreads used to estimate the fair value of our loans is based on current interest rate spreads of similar loans. If there is a significant deterioration of the credit quality of a loan, we may consider other factors that a hypothetical market participant would use to estimate fair value, including the proceeds that would be received in a liquidation analysis.
We estimate the fair value of our CLO equity investments using a combination of third-party broker quotes, purchases or sales of the same or similar securities, and cash flow forecasts subject to assumptions that a market participant would use regarding the investments' underlying collateral including, but not limited to, assumptions for default and recovery rates, reinvestment spreads and prepayment rates. Cash flow forecasts are discounted using market participant's market yield assumptions that are derived from multiple sources including, but not limited to, third-party broker quotes, industry research reports and transactions of securities and indices with similar structures and risk characteristics. We weight the use of third-party broker quotes, if any, when determining fair value based on our understanding of the level of actual transactions used by the broker to develop the quote and whether the quote was an indicative price or binding offer, the depth and consistency of broker quotes and the correlation of changes in broker quotes with underlying performance and other market indices.
Investment Income
For debt investments, we record interest income on the accrual basis to the extent that such amounts are expected to be collected. OID and purchased discounts and premiums are accreted/amortized into interest income using the effective interest method, where applicable. Loan origination fees are deferred and accreted into interest income using the effective interest method. We record prepayment premiums on loans and other investments as interest income when such amounts are received. We stop accruing interest on investments when it is determined that interest is no longer collectible. As of December 31, 2015, we had one loan on non-accrual status and, as of December 31, 2014 and 2013, we had no loans on non-accrual status.
Interest income on CLO equity investments is recognized using the effective interest method as required by FASB ASC Subtopic 325-40, Investments-Other, Beneficial Interests in Securitized Financial Assets (“ASC 325-40”). Under ASC 325-40, at the time of purchase, we estimate the future expected cash flows and determine the effective yield of an investment based on these
49
estimated cash flows and our cost basis. Subsequent to the purchase, these estimated cash flows are updated quarterly and a revised yield is calculated prospectively in accordance with ASC 320-10-35, Investment-Debt and Equity Securities. In the event that the fair value of an investment decreases below its current amortized cost basis, we may be required to write down the current amortized cost basis for a credit loss or to fair value depending on our hold expectations for the investment. Current amortized cost basis less the amount of any write down (“Reference Amount”) is used to calculate the effective yield used for interest income recognition purposes over the remaining life of the investment. We are precluded from reversing write downs for any subsequent increase in the expected cash flows of an investment with the effect of increasing total interest income over the life of the investment and increasing the realized loss recorded on the sale or redemption of the investment by the amount of the credit loss write down. In estimating these cash flows, there are a number of assumptions that are subject to uncertainties and contingencies. These include the amount and timing of principal payments (including prepayments, repurchases, defaults and liquidations), the pass through or coupon rate, and interest rate fluctuations. In addition, interest payment shortfalls due to delinquencies on the underlying loans and the timing and magnitude of projected credit losses on the loans underlying the securities have to be estimated. These uncertainties and contingencies are difficult to predict and are subject to future events that may impact our estimates and interest income. As a result, actual results may differ significantly from these estimates. During the year ended December 31, 2015, we recorded $4.0 million in credit loss write downs to current amortized cost basis on five CLO equity investments. As of December 31, 2015, in aggregate, the amortized cost basis of our Structured Products investment portfolio exceeded the Reference Amount by approximately $16.6 million.
Item 7A. Quantitative and Qualitative Disclosures about Market Risk
We are subject to financial market risks, including changes in interest rates. As of December 31, 2015, all of our debt investments bore interest at floating rates, and we expect that our investment portfolio will, in the future, primarily include floating rate debt investments. The interest rates on our debt investments are usually based on a floating LIBOR and typically contain interest rate reset provisions that adjust applicable interest rates to current rates on a periodic basis. As of December 31, 2015, the debt investments in our portfolio had interest rate floors between 0.75% and 1.75%, which, in the current interest rate environment where LIBOR is below 1.0%, has effectively converted those floating rate debt investments to fixed rate debt investments. In contrast, our Credit Facility has a floating interest rate provision with no LIBOR floor and therefore our cost of funds will fluctuate with changes in short-term interest rates.
Assuming no changes to our consolidated statement of assets and liabilities as of December 31, 2015, the following table shows the approximate annualized impact to the components of our results of operations from hypothetical base rate changes in interest rates to our loan portfolio and Credit Facility.
($ in thousands, except per share data) Basis point increase (1) | Interest Income | Interest Expense | Net Increase | Net Increase per share | ||||||||||||
300 | $ | 5,218 | $ | 3,306 | $ | 1,912 | $ | 0.19 | ||||||||
200 | $ | 3,164 | $ | 2,204 | $ | 960 | $ | 0.09 | ||||||||
100 | $ | 1,113 | $ | 1,102 | $ | 11 | $ | — | ||||||||
(1) | A decline in interest rates would not have a material impact on our consolidated financial statements. |
Although management believes that this measure is indicative of our sensitivity to interest rates, it does not reflect any potential impact to the fair value of our investments as a result of changes to interest rates, nor does it adjust for potential changes in the credit market, credit quality, size and composition of assets in our consolidated statements of assets and liabilities and other business developments that could affect the net increase (decrease) in net assets resulting from operations or net investment income. Accordingly, no assurances can be given that actual results would not differ materially from those shown above.
The above sensitivity analysis does not include our CLO equity investments. CLO equity investments are levered structures that are collateralized primarily with first lien floating rate loans that may have LIBOR floors and are levered primarily with floating rate debt that does not have a LIBOR floor. The residual cash flows available to the equity holders of the CLOs will decline as interest rates increase until interest rates surpass the LIBOR floors on the floating rate loans. However, the revenue recognized on our CLO equity investments is calculated using the effective interest method which incorporates a forward LIBOR curve in the projected cash flows. Any change to interest rates that is not in-line with the forward LIBOR curve used in the projections, in either the timing or magnitude of the change, will cause actual distributions to differ from the current projections and will impact the related revenue recognized from these investments.
50
Item 8. Financial Statements and Supplementary Data
Our management is responsible for the preparation, integrity and objectivity of the accompanying consolidated financial statements and the related financial information. The financial statements have been prepared in conformity with accounting principles generally accepted in the United States and necessarily include certain amounts that are based on estimates and informed judgments. Our management also prepared the related financial information included in this Annual Report on Form 10-K and is responsible for its accuracy and consistency with the consolidated financial statements.
The consolidated financial statements have been audited by Ernst & Young LLP, an independent registered public accounting firm, who conducted their audit in accordance with the standards of the Public Company Accounting Oversight Board (United States) as of December 31, 2015, 2014 and 2013, and for the years ended December 31, 2015, and 2014 and the period from October 15, 2013 (commencement of operations) through December 31, 2013. The independent registered public accounting firm’s responsibility is to express an opinion as to the fairness with which such consolidated financial statements present our financial position, results of operations, changes in net assets and cash flows in accordance with accounting principles generally accepted in the United States.
51
Management's Report on Internal Control over Financial Reporting
Our management is responsible for establishing and maintaining adequate internal control over financial reporting as defined in Rule 13a-15(f) under the Securities Exchange Act of 1934. American Capital Senior Floating, Ltd.'s internal control over financial reporting is designed to provide reasonable assurance regarding the reliability of financial reporting and the preparation of consolidated financial statements for external purposes in accordance with accounting principles generally accepted in the United States (“U.S. GAAP”). American Capital Senior Floating, Ltd.’s internal control over financial reporting includes those policies and procedures that (i) pertain to the maintenance of records that, in reasonable detail, accurately and fairly reflect the transactions and dispositions of our assets; (ii) provide reasonable assurance that transactions are recorded as necessary to permit preparation of financial statements in accordance with U.S. GAAP, and that receipts and expenditures are being made only in accordance with authorizations of our management and Board of Directors; and (iii) provide reasonable assurance regarding prevention or timely detection of unauthorized acquisition, use, or disposition of our assets that could have a material effect on the consolidated financial statements.
Because of its inherent limitations, internal control over financial reporting may not prevent or detect misstatements. Also, projections of any evaluation of effectiveness to future periods are subject to the risk that controls may become inadequate because of changes in conditions, or that the degree of compliance with the policies or procedures may deteriorate.
Management assessed the effectiveness of American Capital Senior Floating, Ltd.’s internal control over financial reporting as of December 31, 2015, utilizing the criteria set forth by the Committee of Sponsoring Organizations of the Treadway Commission in the Internal Control-Integrated Framework (2013 Framework). Based on this assessment and those criteria, management determined that American Capital Senior Floating, Ltd.’s internal control over financial reporting was effective as of December 31, 2015. This Annual Report on Form 10-K does not include an attestation report of a registered public accounting firm regarding internal control over financial reporting due to an exemption established by the JOBS Act for “emerging growth companies”.
52
Report of Independent Registered Public Accounting Firm
The Board of Directors and Stockholders of American Capital Senior Floating, Ltd.
We have audited the accompanying consolidated statements of assets and liabilities of American Capital Senior Floating, Ltd. (the “Company”), including the consolidated schedules of investments, as of December 31, 2015 and 2014, and the related consolidated statements of operations, changes in net assets, and cash flows for the year ended December 31, 2015 and December 31, 2014 and for the period from October 15, 2013 (commencement of operations) through December 31, 2013. These financial statements are the responsibility of the Company's management. Our responsibility is to express an opinion on these financial statements based on our audits.
We conducted our audits in accordance with the standards of the Public Company Accounting Oversight Board (United States). Those standards require that we plan and perform the audit to obtain reasonable assurance about whether the financial statements are free of material misstatement. We were not engaged to perform an audit of the Company’s internal control over financial reporting. Our audits included consideration of internal control over financial reporting as a basis for designing audit procedures that are appropriate in the circumstances, but not for the purpose of expressing an opinion on the effectiveness of the Company’s internal control over financial reporting. Accordingly, we express no such opinion. An audit also includes examining, on a test basis, evidence supporting the amounts and disclosures in the financial statements, assessing the accounting principles used and significant estimates made by management, and evaluating the overall financial presentation. Our procedures included confirmation of securities owned as of December 31, 2015 and December 31, 2014, by correspondence with the custodian and others, or by other appropriate auditing procedures where replies from others were not received. We believe that our audits provide a reasonable basis for our opinion.
In our opinion, the financial statements referred to above present fairly, in all material respects, the consolidated financial position of American Capital Senior Floating, Ltd. at December 31, 2015 and 2014, and the consolidated results of its operations, changes in its net assets, and its cash flows for the year ended December 31, 2015 and December 31, 2014 and for the period from October 15, 2013 (commencement of operations) through December 31, 2013, in conformity with U.S. generally accepted accounting principles.
/s/ Ernst & Young, LLP
McLean Virginia
March 15, 2016
53
AMERICAN CAPITAL SENIOR FLOATING, LTD.
CONSOLIDATED STATEMENTS OF ASSETS AND LIABILITIES
(in thousands, except share and per share data)
December 31, | |||||||
2015 | 2014 | ||||||
Assets: | |||||||
Investments, fair value (cost of $261,875 and $282,133, respectively) | $ | 229,056 | $ | 276,370 | |||
Cash and cash equivalents | 2,474 | 1,757 | |||||
Receivable for investments sold | 3,096 | 2,983 | |||||
Deferred financing costs | 273 | 378 | |||||
Interest receivable | 583 | 704 | |||||
Prepaid expenses and other assets | 89 | 121 | |||||
Receivable from affiliate (see note 3 and 4) | 234 | 164 | |||||
Total assets | $ | 235,805 | $ | 282,477 | |||
Liabilities: | |||||||
Secured revolving credit facility payable (see note 7) | $ | 110,200 | $ | 130,000 | |||
Payable for investments purchased | 5,437 | 4,226 | |||||
Distributions to stockholders payable (see note 10) | 970 | 2,900 | |||||
Management fee payable (see note 3) | 536 | 577 | |||||
Interest payable (see note 7) | 52 | 80 | |||||
Taxes payable (see note 8) | 278 | 80 | |||||
Payable to affiliate (see note 4) | 217 | 212 | |||||
Other liabilities and accrued expenses | 186 | 167 | |||||
Total liabilities | 117,876 | 138,242 | |||||
Commitments and contingencies (see note 11) | |||||||
Net Assets: | |||||||
Common stock, par value $0.01 per share; 10,000,100 issued and outstanding on December 31, 2015 and 2014; 300,000,000 authorized on December 31, 2015 and 2014 | 100 | 100 | |||||
Paid-in capital in excess of par | 150,903 | 151,131 | |||||
Undistributed net investment income | 1,560 | 133 | |||||
Accumulated net realized loss from investments | (1,815 | ) | (1,366 | ) | |||
Net unrealized depreciation on investments | (32,819 | ) | (5,763 | ) | |||
Total net assets | 117,929 | 144,235 | |||||
Total liabilities and net assets | $ | 235,805 | $ | 282,477 | |||
Net asset value per share outstanding | $ | 11.79 | $ | 14.42 | |||
See notes to the consolidated financial statements.
54
AMERICAN CAPITAL SENIOR FLOATING, LTD.
CONSOLIDATED STATEMENTS OF OPERATIONS
(in thousands, except per share data)
Year Ended December 31, | Period from October 15, 2013* to | ||||||||||
2015 | 2014 | December 31, 2013 | |||||||||
Investment income: | |||||||||||
Interest | $ | 19,245 | $ | 17,773 | $ | 1,572 | |||||
Total investment income | 19,245 | 17,773 | 1,572 | ||||||||
Expenses: | |||||||||||
Interest and commitment fee (see note 7) | 2,629 | 3,055 | 943 | ||||||||
Management fee (see note 3) | 2,236 | 2,186 | — | ||||||||
Insurance | 467 | 521 | — | ||||||||
Amortization of deferred financing costs | 341 | 393 | 9 | ||||||||
Organizational costs | — | — | 47 | ||||||||
Other general and administrative expenses | 1,554 | 1,601 | 45 | ||||||||
Total expenses | 7,227 | 7,756 | 1,044 | ||||||||
Expense reimbursement (see note 3) | (899 | ) | (1,001 | ) | — | ||||||
Net expenses | 6,328 | 6,755 | 1,044 | ||||||||
Net investment income before tax | 12,917 | 11,018 | 528 | ||||||||
Income tax provision | (227 | ) | (159 | ) | (282 | ) | |||||
Net investment income | 12,690 | 10,859 | 246 | ||||||||
Net (loss) gain on investments: | |||||||||||
Net realized (loss) gain on investments | (310 | ) | 190 | (7 | ) | ||||||
Net unrealized (depreciation) appreciation on investments | (27,056 | ) | (7,060 | ) | 1,297 | ||||||
Income tax benefit (provision) | 11 | (200 | ) | (521 | ) | ||||||
Net (loss) gain on investments | (27,355 | ) | (7,070 | ) | 769 | ||||||
Net (decrease) increase in net assets resulting from operations (“Net (Loss) Earnings”) | $ | (14,665 | ) | $ | 3,789 | $ | 1,015 | ||||
Net investment income per share | $ | 1.27 | $ | 1.09 | n/a | ||||||
Net (Loss) Earnings per share (see note 5) | $ | (1.47 | ) | $ | 0.38 | n/a | |||||
Distributions to stockholders declared per share | $ | 1.16 | $ | 1.03 | n/a | ||||||
Weighted average shares outstanding (1) | 10,000 | 10,000 | n/a | ||||||||
* Commencement of operations
(1) | Assumes the issuance of 10,000 shares of common stock on January 1, 2014 that were issued in connection with the IPO, which closed on January 22, 2014. |
See notes to consolidated financial statements.
55
AMERICAN CAPITAL SENIOR FLOATING, LTD.
CONSOLIDATED STATEMENTS OF CHANGES IN NET ASSETS
(in thousands)
Year Ended December 31, | Period from October 15, 2013* to | ||||||||||
2015 | 2014 | December 31, 2013 | |||||||||
Operations: | |||||||||||
Net investment income | $ | 12,690 | $ | 10,859 | $ | 246 | |||||
Net realized (loss) gain | (310 | ) | 190 | (7 | ) | ||||||
Net unrealized (depreciation) appreciation on investments | (27,045 | ) | (7,260 | ) | 776 | ||||||
Net (loss) earnings | (14,665 | ) | 3,789 | 1,015 | |||||||
Distributions to stockholders: | |||||||||||
From net investment income | (11,630 | ) | (10,300 | ) | — | ||||||
Capital transactions: | |||||||||||
Proceeds from public offering | — | 150,000 | — | ||||||||
Offering costs | — | (844 | ) | — | |||||||
Contribution for taxes waived (see note 8) | (11 | ) | 574 | — | |||||||
Net (decrease) increase in net assets from capital transactions | (11 | ) | 149,730 | — | |||||||
Net (decrease) increase in net assets | (26,306 | ) | 143,219 | 1,015 | |||||||
Net assets beginning of period | 144,235 | 1,016 | 1 | ||||||||
Net assets end of period | $ | 117,929 | $ | 144,235 | $ | 1,016 | |||||
Undistributed net investment income included in net assets | $ | 1,193 | $ | 805 | $ | — | |||||
Common shares outstanding | 10,000 | 10,000 | n/a | ||||||||
* Commencement of operations
See notes to consolidated financial statements.
56
AMERICAN CAPITAL SENIOR FLOATING, LTD.
CONSOLIDATED STATEMENTS OF CASH FLOWS
(in thousands)
Year Ended December 31, | Period from October 15, 2013* to | ||||||||||
2015 | 2014 | December 31, 2013 | |||||||||
Cash Flows from Operating Activities: | |||||||||||
Net Loss (Earnings) from operations | $ | (14,665 | ) | $ | 3,789 | $ | 1,015 | ||||
Adjustments to reconcile net increase in net assets resulting from operations: | |||||||||||
Net realized loss (gain) on investments | 310 | (190 | ) | 7 | |||||||
Net change in unrealized depreciation (appreciation) on investments | 27,056 | 7,060 | (1,297 | ) | |||||||
Accretion of CLO interest income | (7,330 | ) | (5,501 | ) | (516 | ) | |||||
Net amortization of premium/discount on loans | (82 | ) | (7 | ) | (1 | ) | |||||
Amortization of deferred financing costs | 341 | 393 | 9 | ||||||||
Purchase of investments | (106,982 | ) | (226,628 | ) | (207,548 | ) | |||||
Proceeds from dispositions of investments | 134,342 | 148,461 | 9,790 | ||||||||
(Increase) decrease in receivable for investments sold | (113 | ) | 2,411 | (5,394 | ) | ||||||
Increase (decrease) in payable for investments purchased | 1,211 | (16,268 | ) | 20,494 | |||||||
Increase in receivable from affiliate | (70 | ) | (164 | ) | — | ||||||
Decrease (increase) in interest receivable | 121 | (401 | ) | (303 | ) | ||||||
Decrease (increase) in prepaid expenses and other assets | 32 | 346 | (467 | ) | |||||||
(Decrease) increase in interest payable | (28 | ) | (863 | ) | 943 | ||||||
Increase (decrease) in other liabilities and accrued expenses | 19 | (230 | ) | 397 | |||||||
Increase (decrease) in payable to affiliate | 5 | (83 | ) | 295 | |||||||
(Decrease) increase in management fee payable | (41 | ) | 577 | — | |||||||
Increase (decrease) in taxes payable | 187 | (149 | ) | 803 | |||||||
Net cash provided by (used in) operating activities | 34,313 | (87,447 | ) | (181,773 | ) | ||||||
Cash Flows from Financing Activities: | |||||||||||
Proceeds from the issuance of common stock | — | 150,000 | — | ||||||||
Offering costs from the issuance of common stock | — | (844 | ) | — | |||||||
Distributions to stockholders paid | (13,560 | ) | (7,400 | ) | — | ||||||
Proceeds from debt | 81,400 | 199,500 | 194,748 | ||||||||
Payments on debt | (101,200 | ) | (264,248 | ) | — | ||||||
Deferred financing costs paid | (235 | ) | (297 | ) | (483 | ) | |||||
Net cash (used in) provided by financing activities | (33,595 | ) | 76,711 | 194,265 | |||||||
Net increase (decrease) in cash and cash equivalents | 718 | (10,736 | ) | 12,492 | |||||||
Cash and cash equivalents at beginning of period | 1,757 | 12,493 | 1 | ||||||||
Cash and cash equivalents at end of period | $ | 2,475 | $ | 1,757 | $ | 12,493 | |||||
Supplemental disclosure of cash flow information: | |||||||||||
Cash paid for interest and commitment fees | $ | 2,431 | $ | 3,918 | $ | — | |||||
Cash paid for income taxes | $ | 30 | $ | 517 | $ | — | |||||
Distributions to stockholders declared and payable during the period | $ | 11,630 | $ | 10,300 | $ | — | |||||
Supplemental disclosure of non-cash financing activity: | |||||||||||
Contribution for taxes waived | $ | (11 | ) | $ | 574 | $ | — | ||||
* Commencement of operations
See notes to consolidated financial statements.
57
AMERICAN CAPITAL SENIOR FLOATING, LTD.
CONSOLIDATED SCHEDULE OF INVESTMENTS
DECEMBER 31, 2015
(in thousands)
Description | Maturity | Interest Rate (1) | Basis Point Spread Above Index (2) | LIBOR Interest Rate Floor | Industry | Par Amount | Cost | Fair Value | |||||||||||||||
Non-Control/Non-Affiliate Investments | |||||||||||||||||||||||
First Lien Floating Rate Loans —143.8% of Net Assets | |||||||||||||||||||||||
24 Hour Fitness Worldwide, Inc. (5) | 5/28/2021 | 4.75 | % | L+ 3.75 | 1.00% | Hotels, Restaurants & Leisure | $ | 1,972 | $ | 1,966 | $ | 1,846 | |||||||||||
Acosta, Inc. (5) | 9/26/2021 | 4.25 | % | L+ 3.25 | 1.00% | Media | 2,475 | 2,438 | 2,361 | ||||||||||||||
ADMI Corp. (5) | 4/29/2022 | 5.50 | % | L+ 4.50 | 1.00% | Health Care Providers & Services | 547 | 546 | 548 | ||||||||||||||
Aegis Toxicology Sciences Corporation (5) | 2/24/2021 | 5.50 | % | L+ 4.50 | 1.00% | Health Care Providers & Services | 1,642 | 1,633 | 1,384 | ||||||||||||||
Agrofresh Inc. (3), (5) | 7/31/2021 | 5.75 | % | L+ 4.75 | 1.00% | Chemicals | 647 | 646 | 638 | ||||||||||||||
Air Medical Group Holdings, Inc. (5) | 4/28/2022 | 4.50 | % | L+ 3.50 | 1.00% | Health Care Providers & Services | 1,990 | 1,995 | 1,932 | ||||||||||||||
Albertson's LLC (5) | 3/21/2019 | 5.50 | % | L+ 4.50 | 1.00% | Food & Staples Retailing | 993 | 989 | 991 | ||||||||||||||
AlixPartners, LLP (5) | 7/28/2022 | 4.50 | % | L+ 3.50 | 1.00% | Diversified Financial Services | 1,995 | 1,990 | 1,984 | ||||||||||||||
Alliant Holdings Intermediate, LLC (5) | 8/12/2022 | 4.50 | % | L+ 3.50 | 1.00% | Insurance | 1,045 | 1,042 | 1,022 | ||||||||||||||
American Tire Distributors, Inc. (5) | 9/1/2021 | 5.25 | % | L+ 4.25 | 1.00% | Distributors | 1,478 | 1,472 | 1,459 | ||||||||||||||
Amneal Pharmaceuticals LLC (5) | 11/1/2019 | 4.50 | % | L+ 3.50 | 1.00% | Pharmaceuticals | 992 | 992 | 976 | ||||||||||||||
AmWINS Group, LLC (5) | 9/6/2019 | 5.25 | % | L+ 4.25 | 1.00% | Insurance | 2,934 | 2,946 | 2,932 | ||||||||||||||
Anchor Glass Container Corporation (5) | 7/1/2022 | 4.54 | % | L+ 3.50 | 1.00% | Containers & Packaging | 963 | 959 | 962 | ||||||||||||||
AqGen Ascensus, Inc. (5), (7) | 12/5/2022 | 5.50 | % | L+ 4.50 | 1.00% | Capital Markets | 941 | 885 | 885 | ||||||||||||||
Aquilex LLC (5) | 12/31/2020 | 5.00 | % | L+ 4.00 | 1.00% | Commercial Services & Supplies | 968 | 966 | 929 | ||||||||||||||
Ardent Legacy Acquisitions, Inc. (5) | 8/4/2021 | 6.50 | % | L+ 5.50 | 1.00% | Health Care Providers & Services | 332 | 329 | 331 | ||||||||||||||
Arnhold and S. Bleichroeder Holdings, Inc. (5) | 12/1/2022 | 4.75 | % | L+ 4.00 | 0.75% | Capital Markets | 714 | 700 | 698 | ||||||||||||||
Ascend Learning, LLC (5) | 7/31/2019 | 5.50 | % | L+ 4.50 | 1.00% | Diversified Consumer Services | 588 | 586 | 586 | ||||||||||||||
Asurion, LLC (5) | 5/24/2019 | 5.00 | % | L+ 3.75 | 1.25% | Commercial Services & Supplies | 943 | 943 | 886 | ||||||||||||||
Asurion, LLC (5) | 8/4/2022 | 5.00 | % | L+ 4.00 | 1.00% | Commercial Services & Supplies | 1,244 | 1,238 | 1,141 | ||||||||||||||
Avaya Inc. (5) | 5/29/2020 | 6.25 | % | L+ 5.25 | 1.00% | Software | 997 | 806 | 700 | ||||||||||||||
BJ's Wholesale Club, Inc. (5) | 9/26/2019 | 4.50 | % | L+ 3.50 | 1.00% | Food & Staples Retailing | 1,471 | 1,472 | 1,414 | ||||||||||||||
Blackboard Inc. (5) | 10/4/2018 | 4.75 | % | L+ 3.75 | 1.00% | Software | 2,435 | 2,436 | 2,345 | ||||||||||||||
Blue Coat Holdings, Inc. (5) | 5/20/2022 | 4.50 | % | L+ 3.50 | 1.00% | Communications Equipment | 2,000 | 2,001 | 1,938 | ||||||||||||||
BWay Intermediate Company, Inc. (5) | 8/14/2020 | 5.50 | % | L+ 4.50 | 1.00% | Containers & Packaging | 2,456 | 2,437 | 2,369 | ||||||||||||||
C.H.I. Overhead Doors, Inc. (5) | 7/29/2022 | 4.75 | % | L+ 3.75 | 1.00% | Building Products | 332 | 332 | 327 | ||||||||||||||
Calceus Acquisition, Inc. (5) | 1/31/2020 | 5.00 | % | L+ 4.00 | 1.00% | Textiles, Apparel & Luxury Goods | 2,337 | 2,345 | 2,092 | ||||||||||||||
CAMP International Holding Company (5) | 5/31/2019 | 4.75 | % | L+ 3.75 | 1.00% | Transportation Infrastructure | 1,960 | 1,980 | 1,908 | ||||||||||||||
Carecore National, LLC (5) | 3/5/2021 | 5.50 | % | L+ 4.50 | 1.00% | Health Care Providers & Services | 2,047 | 2,047 | 1,781 | ||||||||||||||
CCM Merger, Inc. (5) | 8/6/2021 | 4.50 | % | L+ 3.50 | 1.00% | Hotels, Restaurants & Leisure | 883 | 877 | 880 | ||||||||||||||
Checkout Holding Corp. (5) | 4/9/2021 | 4.50 | % | L+ 3.50 | 1.00% | Media | 2,463 | 2,461 | 1,982 | ||||||||||||||
CityCenter Holdings, LLC (5) | 10/16/2020 | 4.25 | % | L+ 3.25 | 1.00% | Hotels, Restaurants & Leisure | 1,774 | 1,783 | 1,764 | ||||||||||||||
Compuware Corporation (5) | 12/15/2021 | 6.25 | % | L+ 5.25 | 1.00% | Software | 2,972 | 2,906 | 2,780 | ||||||||||||||
See notes to consolidated financial statements.
58
AMERICAN CAPITAL SENIOR FLOATING, LTD.
CONSOLIDATED SCHEDULE OF INVESTMENTS (continued)
DECEMBER 31, 2015
(in thousands)
Description | Maturity | Interest Rate (1) | Basis Point Spread Above Index (2) | LIBOR Interest Rate Floor | Industry | Par Amount | Cost | Fair Value | |||||||||||||||
First Lien Floating Rate Loans (continued) —143.8% of Net Assets | |||||||||||||||||||||||
Cotiviti Corporation (5) | 5/14/2021 | 4.50 | % | L+ 3.50 | 1.00% | Professional Services | $ | 1,111 | $ | 1,102 | $ | 1,078 | |||||||||||
CPG International Inc. (5) | 9/30/2020 | 4.75 | % | L+ 3.75 | 1.00% | Building Products | 1,938 | 1,938 | 1,831 | ||||||||||||||
CPI Buyer, LLC (5) | 8/16/2021 | 5.50 | % | L+ 4.50 | 1.00% | Trading Companies & Distributors | 988 | 976 | 949 | ||||||||||||||
CT Technologies Intermediate Holdings, Inc. (5) | 12/1/2021 | 5.25 | % | L+ 4.25 | 1.00% | Health Care Technology | 498 | 495 | 482 | ||||||||||||||
Dell International LLC (5) | 4/29/2020 | 4.00 | % | L+ 3.25 | 0.75% | Technology Hardware, Storage & Peripherals | 2,488 | 2,495 | 2,472 | ||||||||||||||
Deltek, Inc. (5) | 6/25/2022 | 5.00 | % | L+ 4.00 | 1.00% | Software | 2,872 | 2,866 | 2,845 | ||||||||||||||
Dole Food Company, Inc. (5) | 11/1/2018 | 4.50 | % | L+ 3.50 | 1.00% | Food Products | 2,513 | 2,509 | 2,502 | ||||||||||||||
Duff & Phelps Corporation (5) | 4/23/2020 | 4.75 | % | L+ 3.75 | 1.00% | Capital Markets | 3,421 | 3,423 | 3,356 | ||||||||||||||
DynCorp International Inc. (5) | 7/7/2016 | 6.25 | % | L+ 4.50 | 1.75% | Aerospace & Defense | 2,189 | 2,191 | 2,097 | ||||||||||||||
Electrical Components International, Inc. (5) | 5/28/2021 | 5.75 | % | L+ 4.75 | 1.00% | Electrical Equipment | 1,970 | 1,974 | 1,964 | ||||||||||||||
Emerald Expositions Holding, Inc. (5) | 6/17/2020 | 4.75 | % | L+ 3.75 | 1.00% | Media | 2,622 | 2,640 | 2,587 | ||||||||||||||
Epicor Software Corporation (5) | 6/1/2022 | 4.75 | % | L+ 3.75 | 1.00% | Software | 995 | 993 | 974 | ||||||||||||||
eResearchTechnology, Inc. (5) | 5/8/2022 | 5.50 | % | L+ 4.50 | 1.00% | Life Sciences Tools & Services | 995 | 991 | 978 | ||||||||||||||
Evergreen Acqco 1 LP (5) | 7/9/2019 | 5.00 | % | L+ 3.75 | 1.25% | Multiline Retail | 621 | 623 | 509 | ||||||||||||||
EWT Holdings III Corp. (5) | 1/15/2021 | 4.75 | % | L+ 3.75 | 1.00% | Machinery | 980 | 976 | 965 | ||||||||||||||
Expro Finservices S.à r.l. (3), (5) | 9/2/2021 | 5.75 | % | L+ 4.75 | 1.00% | Energy Equipment & Services | 1,975 | 1,950 | 1,334 | ||||||||||||||
Fairmount Minerals, Ltd. (5) | 9/5/2019 | 4.50 | % | L+ 3.50 | 1.00% | Metals & Mining | 2,933 | 2,945 | 1,463 | ||||||||||||||
Filtration Group Corporation (5) | 11/23/2020 | 4.25 | % | L+ 3.25 | 1.00% | Industrial Conglomerates | 998 | 998 | 973 | ||||||||||||||
Fitness International, LLC (5) | 7/1/2020 | 5.50 | % | L+ 4.50 | 1.00% | Hotels, Restaurants & Leisure | 1,288 | 1,279 | 1,194 | ||||||||||||||
Gates Global LLC (5) | 7/6/2021 | 4.25 | % | L+ 3.25 | 1.00% | Machinery | 1,489 | 1,487 | 1,400 | ||||||||||||||
Global Tel*Link Corporation (5) | 5/23/2020 | 5.00 | % | L+ 3.75 | 1.25% | Diversified Telecommunications Services | 1,685 | 1,662 | 1,239 | ||||||||||||||
Gruden Acquisition, Inc. (5) | 8/18/2022 | 5.75 | % | L+ 4.75 | 1.00% | Road & Rail | 333 | 330 | 320 | ||||||||||||||
HGIM Corp. (5) | 6/18/2020 | 5.50 | % | L+ 4.50 | 1.00% | Marine | 1,466 | 1,470 | 872 | ||||||||||||||
Hyland Software, Inc. (5) | 7/1/2022 | 4.75 | % | L+ 3.75 | 1.00% | Software | 2,482 | 2,461 | 2,451 | ||||||||||||||
Immucor, Inc. (5) | 8/19/2018 | 5.00 | % | L+ 3.75 | 1.25% | Health Care Equipment & Supplies | 985 | 990 | 940 | ||||||||||||||
Indra Holdings Corp. (5) | 5/1/2021 | 5.25 | % | L+ 4.25 | 1.00% | Textiles, Apparel & Luxury Goods | 1,190 | 1,181 | 1,113 | ||||||||||||||
Informatica Corporation (5) | 8/5/2022 | 4.50 | % | L+ 3.50 | 1.00% | Software | 1,995 | 1,990 | 1,926 | ||||||||||||||
Information Resources, Inc. (5) | 9/30/2020 | 4.75 | % | L+ 3.75 | 1.00% | Professional Services | 1,955 | 1,965 | 1,945 | ||||||||||||||
Inmar, Inc. (5) | 1/27/2021 | 4.25 | % | L+ 3.25 | 1.00% | Commercial Services & Supplies | 1,970 | 1,956 | 1,927 | ||||||||||||||
Ion Media Networks, Inc. (5) | 12/18/2020 | 4.75 | % | L+ 3.75 | 1.00% | Media | 1,965 | 1,975 | 1,941 | ||||||||||||||
IPC Corp. (5) | 8/6/2021 | 5.50 | % | L+ 4.50 | 1.00% | Software | 1,489 | 1,482 | 1,404 | ||||||||||||||
Jaguar Holding Company I (5) | 8/18/2022 | 4.25 | % | L+ 3.25 | 1.00% | Life Sciences Tools & Services | 1,493 | 1,485 | 1,454 | ||||||||||||||
Jazz Acquisition, Inc. (5) | 6/19/2021 | 4.50 | % | L+ 3.50 | 1.00% | Aerospace & Defense | 1,971 | 1,975 | 1,791 | ||||||||||||||
Key Safety Systems, Inc. (5) | 8/29/2021 | 4.75 | % | L+ 3.75 | 1.00% | Auto Components | 1,481 | 1,475 | 1,444 | ||||||||||||||
Kronos Acquisition Intermediate Inc. (3), (5) | 8/26/2022 | 6.00 | % | L+ 5.00 | 1.00% | Household Products | 998 | 974 | 971 | ||||||||||||||
La Frontera Generation, LLC (5) | 9/30/2020 | 4.50 | % | L+ 3.50 | 1.00% | Independent Power and Renewable Electricity Producers | 1,783 | 1,792 | 1,693 | ||||||||||||||
See notes to consolidated financial statements.
59
AMERICAN CAPITAL SENIOR FLOATING, LTD.
CONSOLIDATED SCHEDULE OF INVESTMENTS (continued)
DECEMBER 31, 2015
(in thousands)
Description | Maturity | Interest Rate (1) | Basis Point Spread Above Index (2) | LIBOR Interest Rate Floor | Industry | Par Amount | Cost | Fair Value | |||||||||||||||
First Lien Floating Rate Loans (continued) —143.8% of Net Assets | |||||||||||||||||||||||
Landmark Aviation FBO Canada, Inc. (3), (5) | 10/25/2019 | 4.75 | % | L+ 3.75 | 1.00% | Aerospace & Defense | $ | 75 | $ | 75 | $ | 75 | |||||||||||
Landslide Holdings, Inc. (5) | 2/25/2020 | 5.00 | % | L+ 4.00 | 1.00% | Software | 983 | 979 | 963 | ||||||||||||||
Language Line, LLC (5) | 7/7/2021 | 6.50 | % | L+ 5.50 | 1.00% | Commercial Services & Supplies | 956 | 947 | 953 | ||||||||||||||
Learning Care Group (US) No. 2 Inc. (5) | 5/5/2021 | 5.00 | % | L+ 4.00 | 1.00% | Diversified Consumer Services | 1,016 | 1,016 | 1,012 | ||||||||||||||
Leonardo Acquisition Corp. (5) | 1/29/2021 | 4.25 | % | L+ 3.25 | 1.00% | Internet & Catalog Retail | 2,940 | 2,950 | 2,930 | ||||||||||||||
Life Time Fitness, Inc. (5) | 6/10/2022 | 4.25 | % | L+ 3.25 | 1.00% | Hotels, Restaurants & Leisure | 498 | 495 | 486 | ||||||||||||||
LM U.S. Member LLC (5) | 10/25/2019 | 4.75 | % | L+ 3.75 | 1.00% | Aerospace & Defense | 1,895 | 1,902 | 1,889 | ||||||||||||||
Mallinckrodt International Finance S.A. (3), (5), (7) | 3/19/2021 | 3.25 | % | L+ 2.50 | 0.75% | Pharmaceuticals | 570 | 532 | 555 | ||||||||||||||
Mitchell International, Inc. (5), (7) | 10/13/2020 | 4.50 | % | L+ 3.50 | 1.00% | Software | 2,401 | 2,411 | 2,283 | ||||||||||||||
Moneygram International, Inc. (3), (5) | 3/27/2020 | 4.25 | % | L+ 3.25 | 1.00% | IT Services | 602 | 571 | 552 | ||||||||||||||
National Financial Partners Corp. (5) | 7/1/2020 | 4.50 | % | L+ 3.50 | 1.00% | Insurance | 2,466 | 2,480 | 2,376 | ||||||||||||||
New Millennium Holdco, Inc. (5) | 12/21/2020 | 7.50 | % | L+ 6.50 | 1.00% | Health Care Providers & Services | 323 | 323 | 299 | ||||||||||||||
Onex Carestream Finance LP (5) | 6/7/2019 | 5.00 | % | L+ 4.00 | 1.00% | Health Care Equipment & Supplies | 1,708 | 1,713 | 1,547 | ||||||||||||||
Opal Acquisition, Inc. (5) | 11/27/2020 | 5.00 | % | L+ 4.00 | 1.00% | Health Care Providers & Services | 2,934 | 2,917 | 2,453 | ||||||||||||||
Ortho-Clinical Diagnostics Holdings Luxembourg S.À R.L. (3), (5) | 6/30/2021 | 4.75 | % | L+ 3.75 | 1.00% | Health Care Providers & Services | 1,970 | 1,968 | 1,682 | ||||||||||||||
P2 Lower Acquisition, LLC (5) | 10/22/2020 | 5.50 | % | L+ 4.50 | 1.00% | Health Care Providers & Services | 1,895 | 1,890 | 1,876 | ||||||||||||||
Peabody Energy Corporation (3), (5) | 9/24/2020 | 4.25 | % | L+ 3.25 | 1.00% | Oil, Gas & Consumable Fuels | 990 | 903 | 475 | ||||||||||||||
PetSmart, Inc. (5) | 3/11/2022 | 4.25 | % | L+ 3.25 | 1.00% | Specialty Retail | 995 | 991 | 971 | ||||||||||||||
Phillips-Medisize Corporation (5) | 6/16/2021 | 4.75 | % | L+ 3.75 | 1.00% | Health Care Equipment & Supplies | 1,208 | 1,207 | 1,181 | ||||||||||||||
Plaskolite, LLC (5) | 11/3/2022 | 5.75 | % | L+ 4.75 | 1.00% | Chemicals | 550 | 545 | 547 | ||||||||||||||
Plaze, Inc. (5) | 7/31/2022 | 5.25 | % | L+ 4.25 | 1.00% | Chemicals | 832 | 831 | 828 | ||||||||||||||
Presidio, Inc. (5) | 2/2/2022 | 5.25 | % | L+ 4.25 | 1.00% | IT Services | 1,340 | 1,340 | 1,311 | ||||||||||||||
PrimeLine Utility Services LLC (5) | 11/14/2022 | 6.50 | % | L+ 5.50 | 1.00% | Construction & Engineering | 1,000 | 990 | 993 | ||||||||||||||
Quikrete Holdings, Inc. (5) | 9/28/2020 | 4.00 | % | L+ 3.00 | 1.00% | Constructions Materials | 2,086 | 2,093 | 2,066 | ||||||||||||||
RCHP, Inc. (5) | 4/23/2019 | 6.00 | % | L+ 5.00 | 1.00% | Health Care Providers & Services | 1,970 | 1,957 | 1,947 | ||||||||||||||
Renaissance Learning, Inc. (5) | 4/9/2021 | 4.50 | % | L+ 3.50 | 1.00% | Software | 1,965 | 1,964 | 1,887 | ||||||||||||||
RGIS Services, LLC (5) | 10/18/2017 | 5.50 | % | L+ 4.25 | 1.25% | Commercial Services & Supplies | 2,931 | 2,923 | 2,089 | ||||||||||||||
Riverbed Technology, Inc. (5) | 4/25/2022 | 6.00 | % | L+ 5.00 | 1.00% | Communications Equipment | 993 | 988 | 990 | ||||||||||||||
Scientific Games International, Inc. (3), (5) | 10/1/2021 | 6.00 | % | L+ 5.00 | 1.00% | Hotels, Restaurants & Leisure | 988 | 979 | 903 | ||||||||||||||
Sears Roebuck Acceptance Corp. (3), (5) | 6/30/2018 | 5.50 | % | L+ 4.50 | 1.00% | Multiline Retail | 987 | 976 | 931 | ||||||||||||||
Securus Technologies Holdings, Inc (5) | 4/30/2020 | 4.75 | % | L+ 3.50 | 1.25% | Diversified Telecommunications Services | 1,885 | 1,864 | 1,371 | ||||||||||||||
Shearer's Foods, LLC (5), (7) | 6/30/2021 | 5.25 | % | L+ 4.25 | 1.00% | Food Products | 500 | 495 | 494 | ||||||||||||||
See notes to consolidated financial statements.
60
AMERICAN CAPITAL SENIOR FLOATING, LTD.
CONSOLIDATED SCHEDULE OF INVESTMENTS (continued)
DECEMBER 31, 2015
(in thousands)
Description | Maturity | Interest Rate (1) | Basis Point Spread Above Index (2) | LIBOR Interest Rate Floor | Industry | Par Amount | Cost | Fair Value | |||||||||||||||
First Lien Floating Rate Loans (continued) —143.8% of Net Assets | |||||||||||||||||||||||
Spin Holdco Inc. (5) | 11/14/2019 | 4.25 | % | L+ 3.25 | 1.00% | Diversified Consumer Services | $ | 2,442 | $ | 2,442 | $ | 2,352 | |||||||||||
Sterigenics-Nordion Holdings, LLC (5) | 5/16/2022 | 4.25 | % | L+ 3.25 | 1.00% | Life Sciences Tools & Services | 905 | 896 | 882 | ||||||||||||||
STS Operating, Inc. (5) | 2/12/2021 | 4.75 | % | L+ 3.75 | 1.00% | Trading Companies & Distributors | 1,965 | 1,975 | 1,886 | ||||||||||||||
Surgery Center Holdings, Inc. (5) | 11/3/2020 | 5.25 | % | L+ 4.25 | 1.00% | Health Care Providers & Services | 1,980 | 1,972 | 1,962 | ||||||||||||||
Syniverse Holdings, Inc. (5) | 4/23/2019 | 4.00 | % | L+ 3.00 | 1.00% | Wireless Telecommunication Services | 1,500 | 1,468 | 1,107 | ||||||||||||||
Thermasys Corp. (5) | 5/3/2019 | 5.25 | % | L+ 4.00 | 1.25% | Machinery | 453 | 454 | 400 | ||||||||||||||
TPF II Power, LLC (5) | 10/2/2021 | 5.50 | % | L+ 4.50 | 1.00% | Independent Power and Renewable Electricity Producers | 984 | 978 | 966 | ||||||||||||||
Travelport Finance (Luxembourg) S.à r.l. (3), (5) | 9/2/2021 | 5.75 | % | L+ 4.75 | 1.00% | Internet Software & Services | 1,980 | 1,960 | 1,943 | ||||||||||||||
Turbocombustor Technology, Inc. (5) | 12/2/2020 | 5.50 | % | L+ 4.50 | 1.00% | Aerospace & Defense | 3,430 | 3,406 | 3,018 | ||||||||||||||
Tyche Holdings, LLC (5) | 11/12/2021 | 4.75 | % | L+ 3.75 | 1.00% | IT Services | 1,832 | 1,827 | 1,820 | ||||||||||||||
U.S. Renal Care, Inc. (5), (7) | 12/30/2022 | 5.25 | % | L+ 4.25 | 1.00% | Health Care Providers & Services | 500 | 495 | 497 | ||||||||||||||
Univision Communications Inc. (5) | 3/1/2020 | 4.00 | % | L+ 3.00 | 1.00% | Media | 1,488 | 1,489 | 1,459 | ||||||||||||||
USI, Inc. (5) | 12/27/2019 | 4.25 | % | L+ 3.25 | 1.00% | Insurance | 1,955 | 1,968 | 1,899 | ||||||||||||||
USIC Holdings, Inc. (5) | 7/10/2020 | 4.00 | % | L+ 3.00 | 1.00% | Construction & Engineering | 1,455 | 1,460 | 1,370 | ||||||||||||||
Weight Watchers International, Inc. (3), (5) | 4/2/2020 | 4.00 | % | L+ 3.25 | 0.75% | Diversified Consumer Services | 997 | 810 | 741 | ||||||||||||||
William Morris Endeavor Entertainment , LLC (5) | 5/6/2021 | 5.25 | % | L+ 4.25 | 1.00% | Media | 1,965 | 1,963 | 1,936 | ||||||||||||||
WP CPP Holdings, LLC (5) | 12/28/2019 | 4.50 | % | L+ 3.50 | 1.00% | Aerospace & Defense | 2,435 | 2,431 | 2,272 | ||||||||||||||
Total First Lien Floating Rate Loans | $ | 182,373 | $ | 181,367 | $ | 169,580 | |||||||||||||||||
Second Lien Floating Rate Loans —19.1% of Net Assets | |||||||||||||||||||||||
Advantage Sales & Marketing Inc. (5) | 7/25/2022 | 7.50 | % | L+ 6.50 | 1.00% | Professional Services | $ | 1,000 | $ | 994 | $ | 902 | |||||||||||
Ameriforge Group Inc. (8) | 12/21/2020 | 8.75 | % | L+ 7.50 | 1.25% | Energy Equipment & Services | 500 | 489 | 42 | ||||||||||||||
Applied Systems, Inc. | 1/24/2022 | 7.50 | % | L+ 6.50 | 1.00% | Software | 980 | 975 | 912 | ||||||||||||||
Asurion, LLC (5) | 3/3/2021 | 8.50 | % | L+ 7.50 | 1.00% | Commercial Services & Supplies | 1,000 | 989 | 860 | ||||||||||||||
CAMP International Holding Company | 11/29/2019 | 8.25 | % | L+ 7.25 | 1.00% | Transportation Infrastructure | 1,000 | 1,000 | 974 | ||||||||||||||
Checkout Holding Corp. (5) | 4/11/2022 | 7.75 | % | L+ 6.75 | 1.00% | Media | 1,000 | 1,002 | 573 | ||||||||||||||
Cotiviti Corporation (5) | 5/13/2022 | 8.00 | % | L+ 7.00 | 1.00% | Professional Services | 1,250 | 1,240 | 1,236 | ||||||||||||||
Del Monte Foods, Inc. (3), (5) | 8/18/2021 | 8.25 | % | L+ 7.25 | 1.00% | Food Products | 1,500 | 1,499 | 1,235 | ||||||||||||||
EWT Holdings III Corp. | 1/15/2022 | 8.50 | % | L+ 7.50 | 1.00% | Machinery | 1,000 | 996 | 965 | ||||||||||||||
Filtration Group Corporation (5) | 11/22/2021 | 8.25 | % | L+ 7.25 | 1.00% | Industrial Conglomerates | 126 | 125 | 123 | ||||||||||||||
Jazz Acquisition, Inc. (5) | 6/19/2022 | 7.75 | % | L+ 6.75 | 1.00% | Aerospace & Defense | 1,250 | 1,255 | 1,125 | ||||||||||||||
Jonah Energy LLC (5) | 5/12/2021 | 7.50 | % | L+ 6.50 | 1.00% | Oil, Gas & Consumable Fuels | 500 | 494 | 318 | ||||||||||||||
Landslide Holdings, Inc. | 2/25/2021 | 8.25 | % | L+ 7.25 | 1.00% | Software | 1,000 | 994 | 920 | ||||||||||||||
P2 Lower Acquisition, LLC | 10/22/2021 | 9.50 | % | L+ 8.50 | 1.00% | Health Care Providers & Services | 500 | 498 | 495 | ||||||||||||||
See notes to consolidated financial statements.
61
AMERICAN CAPITAL SENIOR FLOATING, LTD.
CONSOLIDATED SCHEDULE OF INVESTMENTS (continued)
DECEMBER 31, 2015
(in thousands)
Description | Maturity | Interest Rate (1) | Basis Point Spread Above Index (2) | LIBOR Interest Rate Floor | Industry | Par Amount | Cost | Fair Value | |||||||||||||||
Second Lien Floating Rate Loans (continued) —19.1% of Net Assets | |||||||||||||||||||||||
Performance Food Group, Inc. (5) | 11/14/2019 | 6.25 | % | L+ 5.25 | 1.00% | Food & Staples Retailing | $ | 2,038 | $ | 2,030 | $ | 2,038 | |||||||||||
Ranpak Corp. (5) | 10/3/2022 | 8.25 | % | L+ 7.25 | 1.00% | Containers & Packaging | 1,375 | 1,374 | 1,363 | ||||||||||||||
Road Infrastructure Investment, LLC (5) | 9/30/2021 | 7.75 | % | L+ 6.75 | 1.00% | Chemicals | 2,000 | 2,008 | 1,860 | ||||||||||||||
Sedgwick Claims Management Services, Inc. (5) | 2/28/2022 | 6.75 | % | L+ 5.75 | 1.00% | Insurance | 2,000 | 1,963 | 1,820 | ||||||||||||||
Solenis International, L.P. (5) | 7/31/2022 | 7.75 | % | L+ 6.75 | 1.00% | Chemicals | 500 | 498 | 402 | ||||||||||||||
TWCC Holding Corp. (5) | 6/26/2020 | 7.00 | % | L+ 6.00 | 1.00% | Media | 2,000 | 1,993 | 1,997 | ||||||||||||||
Tyche Holdings, LLC (5) | 11/11/2022 | 9.00 | % | L+ 8.00 | 1.00% | IT Services | 1,500 | 1,501 | 1,474 | ||||||||||||||
U.S. Renal Care, Inc. (5), (7) | 12/29/2023 | 9.00 | % | L+ 8.00 | 1.00% | Health Care Providers & Services | 500 | 490 | 493 | ||||||||||||||
WP CPP Holdings, LLC (5) | 4/30/2021 | 8.75 | % | L+ 7.75 | 1.00% | Aerospace & Defense | 493 | 502 | 448 | ||||||||||||||
Total Second Lien Floating Rate Loans | $ | 25,012 | $ | 24,909 | $ | 22,575 | |||||||||||||||||
CLO Equity —31.3% of Net Assets | |||||||||||||||||||||||
Apidos CLO XIV, Income Notes (3), (4), (6) | 4/15/2025 | 14.32 | % | $ | 5,900 | $ | 4,616 | $ | 3,524 | ||||||||||||||
Apidos CLO XVIII, Income Notes (3), (4), (6) | 7/22/2026 | 12.39 | % | 2,500 | 1,936 | 1,351 | |||||||||||||||||
Ares XXIX CLO Ltd., Subordinated Notes (3), (4), (6) | 4/17/2026 | 11.04 | % | 4,750 | 3,947 | 2,612 | |||||||||||||||||
Avery Point II CLO, Limited, Income Notes (3), (4), (6) | 7/17/2025 | 14.09 | % | 3,200 | 2,351 | 1,286 | |||||||||||||||||
Babson 2015-1, Income Notes (3), (4), (6) | 4/20/2027 | 16.32 | % | 2,500 | 2,161 | 1,716 | |||||||||||||||||
Blue Hill CLO, Ltd., Subordinated Notes (3), (4), (6) | 1/15/2026 | 11.86 | % | 5,400 | 4,315 | 1,520 | |||||||||||||||||
Blue Hill CLO, Ltd., Subordinated Fee Notes (3), (4), (6) | 1/15/2026 | 27.45 | % | 100 | 74 | 62 | |||||||||||||||||
Betony CLO, Ltd., Subordinated Notes (3), (4), (6) | 4/15/2027 | 11.90 | % | 2,500 | 2,096 | 1,289 | |||||||||||||||||
Carlyle Global Market Strategies CLO 2015-3, Ltd., Subordinated Notes (3), (4), (6) | 7/28/2028 | 21.83 | % | 3,000 | 2,491 | 2,436 | |||||||||||||||||
Cent CLO 18 Limited, Subordinated Notes (3), (4), (6) | 7/23/2025 | 12.26 | % | 4,675 | 3,595 | 2,296 | |||||||||||||||||
Cent CLO 19 Limited, Subordinated Notes (3), (4), (6) | 10/29/2025 | 10.67 | % | 2,750 | 2,184 | 1,431 | |||||||||||||||||
Dryden 30 Senior Loan Fund, Subordinated Notes (3), (4), (6) | 11/15/2025 | 17.79 | % | 2,500 | 1,676 | 1,205 | |||||||||||||||||
Dryden 31 Senior Loan Fund, Subordinated Notes (3), (4), (6) | 4/18/2026 | 11.21 | % | 5,250 | 4,008 | 2,373 | |||||||||||||||||
Galaxy XVI CLO, Ltd., Subordinated Notes (3), (4), (6) | 11/17/2025 | 11.31 | % | 2,750 | 2,123 | 1,344 | |||||||||||||||||
Halcyon Loan Advisors Funding 2014-1 Ltd., Subordinated Notes (3), (4), (6) | 4/18/2026 | 20.65 | % | 3,750 | 3,045 | 1,474 | |||||||||||||||||
Highbridge Loan Management 2013-2, Ltd., Subordinated Notes (3), (4), (6) | 10/20/2024 | 22.16 | % | 1,000 | 728 | 665 | |||||||||||||||||
Magnetite VIII, Limited, Subordinated Notes (3), (4), (6) | 4/15/2026 | 13.42 | % | 3,000 | 2,557 | 2,133 | |||||||||||||||||
Neuberger Berman CLO XV, Ltd., Subordinated Notes (3), (4), (6) | 10/15/2025 | 9.14 | % | 3,410 | 2,414 | 1,495 | |||||||||||||||||
See notes to consolidated financial statements.
62
AMERICAN CAPITAL SENIOR FLOATING, LTD.
CONSOLIDATED SCHEDULE OF INVESTMENTS (continued)
DECEMBER 31, 2015
(in thousands)
Description | Maturity | Interest Rate (1) | Basis Point Spread Above Index (2) | LIBOR Interest Rate Floor | Industry | Par Amount | Cost | Fair Value | |||||||||||||||
CLO Equity (continued) —31.3% of Net Assets | |||||||||||||||||||||||
Octagon Investment Partners XIV, Ltd., Income Notes (3), (4), (6) | 1/15/2024 | 9.49 | % | $ | 5,500 | $ | 3,924 | $ | 2,790 | ||||||||||||||
Octagon Investment Partners XX, Ltd., Subordinated Notes (3), (4), (6) | 8/12/2026 | 10.46 | % | 2,500 | 2,121 | 1,548 | |||||||||||||||||
THL Credit Wind River 2014-1 CLO Ltd., Subordinated Notes (3), (4), (6) | 4/18/2026 | 13.54 | % | 4,000 | 3,237 | 2,304 | |||||||||||||||||
Total CLO Equity | $ | 70,935 | $ | 55,599 | $ | 36,854 | |||||||||||||||||
Common Equity —0% of Net Assets | |||||||||||||||||||||||
New Millennium Holdco, Inc. (9,446 shares) (5), (6) | $ | — | $ | — | $ | 47 | |||||||||||||||||
Total Common Equity | $ | — | $ | — | $ | 47 | |||||||||||||||||
Total Non-Control/Non-Affiliate Investments — 194.2% of net assets | $ | 278,320 | $ | 261,875 | $ | 229,056 | |||||||||||||||||
Liabilities in Excess of Other Assets — (94.2%) | (111,127 | ) | |||||||||||||||||||||
Net Assets — 100.0% | $ | 117,929 | |||||||||||||||||||||
(1) | For each debt investment we have provided the weighted-average interest rate in effect as of December 31, 2015. For each CLO investment we have provided the accounting yield as of December 31, 2015 determined using the effective interest method that will be applied to the current amortized cost of the investment as adjusted for credit impairments, if any, in the following quarter. |
(2) | Floating rate debt investments typically accrue interest at a predetermined spread relative to an index, typically LIBOR or PRIME, and reset monthly, quarterly or semi-annually. These instruments may be subject to a LIBOR or PRIME rate floor. |
(3) | Investments that are not “qualifying assets” under Section 55(a) of the 1940 Act. Under the 1940 Act, we may not acquire any non-qualifying assets unless, at the time such acquisition is made, qualifying assets represent at least 70% of our total assets. As of December 31, 2015, qualifying assets represented 79% of total assets. |
(4) | These securities are exempt from registration under Rule 144A of the Securities Act of 1933, as amended. These securities may be resold in transactions that are exempt from registration, normally to qualified institutional buyers. |
(5) | Assets are held at ACSF Funding and are pledged as collateral for the Credit Facility. |
(6) | Fair value was determined using significant unobservable inputs and are classified as Level 3 in the fair value hierarchy. |
(7) | All or a portion of this position has not settled as of December 31, 2015. |
(8) | Investment has been placed on non-accrual as of December 31, 2015. All subsequent cash received from investment will be used to reduce its cost basis until the investment is placed back on accrual status or the cost basis has been collected. |
See notes to consolidated financial statements.
63
AMERICAN CAPITAL SENIOR FLOATING, LTD.
CONSOLIDATED SCHEDULE OF INVESTMENTS
DECEMBER 31, 2014
(in thousands)
Description | Maturity | Interest Rate (1) | Basis Point Spread Above Index (2) | LIBOR Interest Rate Floor | Industry | Par Amount | Cost | Fair Value | |||||||||||||||
Non-Control/Non-Affiliate Investments | |||||||||||||||||||||||
First Lien Floating Rate Loans — 135.2% of Net Assets | |||||||||||||||||||||||
24 Hour Fitness Worldwide, Inc. (6) | 05/28/21 | 4.75 | % | L+3.75 | 1.00% | Hotels, Restaurants & Leisure | $ | 2,178 | $ | 2,171 | $ | 2,095 | |||||||||||
Accellent Inc. (6) | 03/12/21 | 4.50 | % | L+3.50 | 1.00% | Health Care Equipment & Supplies | 1,985 | 1,985 | 1,947 | ||||||||||||||
Acosta Holdco, Inc. (6) | 09/24/21 | 5.00 | % | L+4.00 | 1.00% | Media | 2,500 | 2,482 | 2,504 | ||||||||||||||
Aegis Toxicology Sciences Corporation (6) | 02/24/21 | 5.50 | % | L+4.50 | 1.00% | Health Care Providers & Services | 1,658 | 1,648 | 1,662 | ||||||||||||||
Albertson's LLC (6) | 08/25/21 | 4.50 | % | L+4.50 | 1.00% | Food & Staples Retailing | 1,000 | 986 | 1,002 | ||||||||||||||
American Tire Distributors, Inc. (6) | 06/01/18 | 5.75 | % | L+4.75 | 1.00% | Distributors | 1,489 | 1,489 | 1,493 | ||||||||||||||
AmWINS Group, LLC (6) | 09/06/19 | 5.25 | % | L+4.25 | 1.00% | Insurance | 2,964 | 2,980 | 2,948 | ||||||||||||||
Aquilex LLC (6) | 12/31/20 | 5.00 | % | L+4.00 | 1.00% | Commercial Services & Supplies | 1,980 | 1,976 | 1,943 | ||||||||||||||
ARG IH Corporation (6) | 11/16/20 | 4.75 | % | L+3.75 | 1.00% | Hotels, Restaurants & Leisure | 2,475 | 2,485 | 2,472 | ||||||||||||||
Aristocrat Leisure Limited (3), (6) | 10/20/21 | 4.75 | % | L+3.75 | 1.00% | Hotels, Restaurants & Leisure | 1,500 | 1,485 | 1,478 | ||||||||||||||
Ascend Learning, LLC (6) | 07/31/19 | 6.00 | % | L+5.00 | 1.00% | Diversified Consumer Services | 596 | 593 | 593 | ||||||||||||||
Ascensus, Inc. (6) | 12/02/19 | 5.00 | % | L+4.00 | 1.00% | Commercial Services & Supplies | 990 | 986 | 986 | ||||||||||||||
Aspen Dental Management, Inc. (6) | 10/06/16 | 7.00 | % | L+5.50 | 1.50% | Health Care Providers & Services | 987 | 981 | 990 | ||||||||||||||
Asurion, LLC (6) | 05/24/19 | 5.00 | % | L+3.75 | 1.25% | Commercial Services & Supplies | 1,970 | 1,972 | 1,948 | ||||||||||||||
Atlantic Power Limited Partnership (3), (6) | 02/24/21 | 4.75 | % | L+3.75 | 1.00% | Independent Power & Renewable Electricity Producers | 821 | 818 | 810 | ||||||||||||||
BJ's Wholesale Club, Inc. (6) | 09/26/19 | 4.50 | % | L+3.50 | 1.00% | Food & Staples Retailing | 1,485 | 1,486 | 1,461 | ||||||||||||||
Blackboard Inc. (6) | 10/04/18 | 4.75 | % | L+3.75 | 1.00% | Software | 2,460 | 2,461 | 2,442 | ||||||||||||||
BWay Intermediate Company, Inc. (6) | 08/14/20 | 5.55 | % | L+4.50 | 1.00% | Containers & Packaging | 2,985 | 2,957 | 2,981 | ||||||||||||||
Calceus Acquisition, Inc. (6) | 01/31/20 | 5.00 | % | L+4.00 | 1.00% | Textiles, Apparel & Luxury Goods | 2,963 | 2,975 | 2,875 | ||||||||||||||
Camp International Holding Company (6) | 05/31/19 | 4.75 | % | L+3.75 | 1.00% | Transportation Infrastructure | 1,980 | 2,007 | 1,985 | ||||||||||||||
Caraustar Industries, Inc. (6) | 05/01/19 | 7.50 | % | L+6.25 | 1.25% | Containers & Packaging | 742 | 736 | 738 | ||||||||||||||
Carecore National, LLC (6) | 03/05/21 | 5.50 | % | L+4.50 | 1.00% | Health Care Providers & Services | 2,068 | 2,067 | 2,050 | ||||||||||||||
CCM Merger Inc. (6) | 08/06/21 | 4.50 | % | L+3.50 | 1.00% | Hotels, Restaurants & Leisure | 977 | 970 | 967 | ||||||||||||||
CDRH Parent, Inc. (6) | 07/01/21 | 5.25 | % | L+4.25 | 1.00% | Health Care Providers & Services | 1,496 | 1,500 | 1,478 | ||||||||||||||
Checkout Holding Corp. (6) | 04/09/21 | 4.50 | % | L+3.50 | 1.00% | Media | 2,488 | 2,486 | 2,379 | ||||||||||||||
Citadel Plastics Holdings, Inc. (6), (7) | 11/05/20 | 5.25 | % | L+4.25 | 1.00% | Chemicals | 750 | 743 | 744 | ||||||||||||||
CityCenter Holdings, LLC (6) | 10/16/20 | 4.25 | % | L+3.25 | 1.00% | Hotels, Restaurants & Leisure | 1,819 | 1,830 | 1,807 | ||||||||||||||
Connolly, LLC (6) | 05/14/21 | 5.00 | % | L+4.00 | 1.00% | Professional Services | 1,493 | 1,479 | 1,482 | ||||||||||||||
CPG International Inc. (6) | 09/30/20 | 4.75 | % | L+3.75 | 1.00% | Building Products | 2,958 | 2,959 | 2,921 | ||||||||||||||
CPI Buyer, LLC (6) | 08/16/21 | 5.50 | % | L+4.50 | 1.00% | Trading Companies & Distributors | 998 | 983 | 983 | ||||||||||||||
DAE Aviation Holdings, Inc. (6) | 11/02/18 | 5.00 | % | L+4.00 | 1.00% | Aerospace & Defense | 1,362 | 1,376 | 1,362 | ||||||||||||||
See notes to consolidated financial statements.
64
AMERICAN CAPITAL SENIOR FLOATING, LTD.
CONSOLIDATED SCHEDULE OF INVESTMENTS (continued)
DECEMBER 31, 2014
(in thousands)
Description | Maturity | Interest Rate (1) | Basis Point Spread Above Index (2) | LIBOR Interest Rate Floor | Industry | Par Amount | Cost | Fair Value | |||||||||||||||
First Lien Floating Rate Loans (continued) — 135.2% of Net Assets | |||||||||||||||||||||||
Deltek, Inc. (6) | 10/10/18 | 4.50 | % | L+3.50 | 1.00% | Software | $ | 2,962 | $ | 2,971 | $ | 2,934 | |||||||||||
Dole Food Company, Inc. (6) | 11/01/18 | 4.50 | % | L+3.50 | 1.00% | Food Products | 3,637 | 3,630 | 3,603 | ||||||||||||||
DPX Holdings B.V. (3), (6) | 03/11/21 | 4.25 | % | L+3.25 | 1.00% | Life Sciences Tools & Services | 1,990 | 1,986 | 1,937 | ||||||||||||||
DTZ U.S. Borrower, LLC (3), (5), (6) | 11/04/21 | 5.50 | % | L+4.50 | 1.00% | Real Estate Management & Development | 1,250 | 1,231 | 1,250 | ||||||||||||||
Duff & Phelps Corporation (6) | 04/23/20 | 4.50 | % | L+3.50 | 1.00% | Capital Markets | 3,456 | 3,458 | 3,424 | ||||||||||||||
DynCorp International Inc. (6) | 07/07/16 | 6.25 | % | L+4.50 | 1.75% | Aerospace & Defense | 2,189 | 2,196 | 2,186 | ||||||||||||||
Electrical Components International, Inc. (6) | 05/28/21 | 5.75 | % | L+4.75 | 1.00% | Electrical Equipment | 1,990 | 1,995 | 1,994 | ||||||||||||||
Emerald Expositions Holding, Inc. (6) | 06/17/20 | 4.75 | % | L+3.75 | 1.00% | Media | 2,748 | 2,771 | 2,702 | ||||||||||||||
Evergreen Acqco 1 LP (6) | 07/09/19 | 5.00 | % | L+3.75 | 1.25% | Multiline Retail | 1,995 | 2,002 | 1,935 | ||||||||||||||
EWT Holdings III Corp. (6) | 01/15/21 | 4.75 | % | L+3.75 | 1.00% | Machinery | 990 | 986 | 974 | ||||||||||||||
Exgen Renewables I, LLC (6) | 02/06/21 | 5.25 | % | L+4.25 | 1.00% | Independent Power & Renewable Electricity Producers | 1,408 | 1,413 | 1,415 | ||||||||||||||
Expro Finservices S.à r.l. (3), (6) | 09/02/21 | 5.75 | % | L+4.75 | 1.00% | Energy Equipment & Services | 1,995 | 1,966 | 1,646 | ||||||||||||||
Fairmount Minerals, Ltd. (6) | 09/05/19 | 4.50 | % | L+3.50 | 1.00% | Metals & Mining | 2,963 | 2,978 | 2,701 | ||||||||||||||
Fitness International, LLC (6) | 07/01/20 | 5.50 | % | L+4.50 | 1.00% | Hotels, Restaurants & Leisure | 1,301 | 1,289 | 1,249 | ||||||||||||||
Global Tel*Link Corporation (6) | 05/22/20 | 5.00 | % | L+3.75 | 1.25% | Diversified Telecommunication Services | 1,704 | 1,675 | 1,691 | ||||||||||||||
Great Wolf Resorts, Inc. (6) | 08/06/20 | 5.75 | % | L+4.75 | 1.00% | Hotels, Restaurants & Leisure | 2,962 | 2,969 | 2,946 | ||||||||||||||
Greeneden U.S. Holdings II, LLC (6) | 11/13/20 | 4.50 | % | L+3.50 | 1.00% | Software | 1,980 | 1,971 | 1,965 | ||||||||||||||
HGIM Corp. (6) | 06/18/20 | 5.50 | % | L+4.50 | 1.00% | Marine | 1,481 | 1,486 | 1,204 | ||||||||||||||
Hyland Software, Inc. (6) | 02/19/21 | 4.75 | % | L+3.75 | 1.00% | Software | 1,355 | 1,349 | 1,346 | ||||||||||||||
Ikaria, Inc. (6) | 02/12/21 | 5.00 | % | L+4.00 | 1.00% | Health Care Providers & Services | 2,504 | 2,509 | 2,498 | ||||||||||||||
Immucor, Inc. (6) | 08/17/18 | 5.00 | % | L+3.75 | 1.25% | Health Care Equipment & Supplies | 995 | 1,003 | 985 | ||||||||||||||
Indra Holdings Corp. (6) | 04/30/21 | 5.25 | % | L+4.25 | 1.00% | Textiles, Apparel & Luxury Goods | 1,244 | 1,232 | 1,231 | ||||||||||||||
Information Resources, Inc. (6) | 09/30/20 | 4.75 | % | L+3.75 | 1.00% | Professional Services | 1,975 | 1,988 | 1,970 | ||||||||||||||
Inmar, Inc. (6) | 01/27/21 | 4.25 | % | L+3.25 | 1.00% | Commercial Services & Supplies | 1,990 | 1,973 | 1,938 | ||||||||||||||
Interactive Data Corporation (6) | 04/30/21 | 4.75 | % | L+3.75 | 1.00% | Media | 1,990 | 2,011 | 1,981 | ||||||||||||||
Ion Media Networks, Inc. (6) | 12/18/20 | 4.75 | % | L+3.75 | 1.00% | Media | 1,985 | 1,997 | 1,965 | ||||||||||||||
J.C. Penney Corporation, Inc. (3), (6) | 06/20/19 | 5.00 | % | L+4.00 | 1.00% | Multiline Retail | 1,496 | 1,493 | 1,442 | ||||||||||||||
Jazz Acquisition, Inc. (6) | 06/18/21 | 4.50 | % | L+3.50 | 1.00% | Aerospace & Defense | 1,990 | 1,995 | 1,975 | ||||||||||||||
Key Safety Systems, Inc. (6) | 08/27/21 | 4.75 | % | L+3.75 | 1.00% | Auto Components | 1,496 | 1,489 | 1,489 | ||||||||||||||
La Frontera Generation, LLC (6) | 09/30/20 | 4.50 | % | L+3.50 | 1.00% | Independent Power & Renewable Electricity Producers | 1,839 | 1,850 | 1,817 | ||||||||||||||
Landmark Aviation FBO Canada, Inc.(3), (5), (6) | 10/25/19 | 4.75 | % | L+3.75 | 1.00% | Aerospace & Defense | 76 | 76 | 75 | ||||||||||||||
Landslide Holdings, Inc. (6) | 02/25/20 | 5.00 | % | L+4.00 | 1.00% | Software | 993 | 988 | 978 | ||||||||||||||
Learning Care Group (US) No. 2 Inc. (6) | 05/05/21 | 5.50 | % | L+4.50 | 1.00% | Diversified Consumer Services | 1,026 | 1,022 | 1,018 | ||||||||||||||
Leonardo Acquisition Corp. (6) | 01/29/21 | 4.25 | % | L+3.25 | 1.00% | Internet & Catalog Retail | 2,978 | 2,989 | 2,901 | ||||||||||||||
LM U.S. Member LLC (5), (6) | 10/25/19 | 4.75 | % | L+3.75 | 1.00% | Aerospace & Defense | 1,914 | 1,923 | 1,900 | ||||||||||||||
See notes to consolidated financial statements.
65
AMERICAN CAPITAL SENIOR FLOATING, LTD.
CONSOLIDATED SCHEDULE OF INVESTMENTS (continued)
DECEMBER 31, 2014
(in thousands)
Description | Maturity | Interest Rate (1) | Basis Point Spread Above Index (2) | LIBOR Interest Rate Floor | Industry | Par Amount | Cost | Fair Value | |||||||||||||||
First Lien Floating Rate Loans (continued) — 135.2% of net assets | |||||||||||||||||||||||
Millennium Health, LLC (6) | 04/16/21 | 5.25 | % | L+4.25 | 1.00% | Health Care Providers & Services | $ | 1,197 | $ | 1,186 | $ | 1,194 | |||||||||||
Mitchell International, Inc. (6) | 10/13/20 | 4.50 | % | L+3.50 | 1.00% | Software | 2,977 | 2,992 | 2,943 | ||||||||||||||
Murray Energy Corporation (6) | 12/05/19 | 5.25 | % | L+4.25 | 1.00% | Oil, Gas & Consumable Fuels | 2,977 | 2,965 | 2,875 | ||||||||||||||
National Financial Partners Corp. (6) | 07/01/20 | 4.50 | % | L+3.50 | 1.00% | Insurance | 2,491 | 2,508 | 2,473 | ||||||||||||||
Onex Carestream Finance LP (6) | 06/07/19 | 5.00 | % | L+4.00 | 1.00% | Health Care Equipment & Supplies | 1,858 | 1,865 | 1,854 | ||||||||||||||
Opal Acquisition, Inc. (6) | 11/27/20 | 5.00 | % | L+4.00 | 1.00% | Health Care Providers & Services | 2,970 | 2,949 | 2,948 | ||||||||||||||
Ortho-Clinical Diagnostics S.A. (3), (6) | 06/30/21 | 4.75 | % | L+3.75 | 1.00% | Health Care Providers & Services | 1,990 | 1,987 | 1,962 | ||||||||||||||
OSG Bulk Ships, Inc. (3), (6) | 08/05/19 | 5.25 | % | L+4.25 | 1.00% | Oil, Gas & Consumable Fuels | 1,492 | 1,479 | 1,459 | ||||||||||||||
OSG International, Inc. (3), (6) | 08/05/19 | 5.75 | % | L+4.75 | 1.00% | Oil, Gas & Consumable Fuels | 1,492 | 1,479 | 1,455 | ||||||||||||||
P2 Lower Acquisition, LLC (6) | 10/22/20 | 5.50 | % | L+4.50 | 1.00% | Health Care Providers & Services | 2,112 | 2,106 | 2,091 | ||||||||||||||
Pharmedium Healthcare Corporation (6) | 01/28/21 | 4.25 | % | L+3.25 | 1.00% | Pharmaceuticals | 2,370 | 2,383 | 2,307 | ||||||||||||||
Phillips-Medisize Corporation (6) | 06/16/21 | 4.75 | % | L+3.75 | 1.00% | Health Care Equipment & Supplies | 1,221 | 1,219 | 1,205 | ||||||||||||||
PRA Holdings, Inc. (6) | 09/23/20 | 4.50 | % | L+3.50 | 1.00% | Life Sciences Tools & Services | 1,638 | 1,638 | 1,620 | ||||||||||||||
Quikrete Holdings, Inc. (6) | 09/28/20 | 4.00 | % | L+3.00 | 1.00% | Construction Materials | 2,836 | 2,848 | 2,803 | ||||||||||||||
RCHP, Inc. (6) | 04/23/19 | 6.00 | % | L+5.00 | 1.00% | Health Care Providers & Services | 1,990 | 1,973 | 1,980 | ||||||||||||||
Renaissance Learning, Inc. (6) | 04/09/21 | 4.50 | % | L+3.50 | 1.00% | Software | 1,985 | 1,983 | 1,947 | ||||||||||||||
RGIS Services, LLC (6), (7) | 10/18/17 | 5.50 | % | L+4.25 | 1.25% | Commercial Services & Supplies | 2,962 | 2,948 | 2,718 | ||||||||||||||
Scientific Games International, Inc. (3), (6) | 10/01/21 | 6.00 | % | L+5.00 | 1.00% | Hotels, Restaurants & Leisure | 2,000 | 1,981 | 1,976 | ||||||||||||||
Sears Roebuck Acceptance Corp. (3), (6) | 06/29/18 | 5.50 | % | L+4.50 | 1.00% | Multiline Retail | 997 | 981 | 962 | ||||||||||||||
Securus Technologies Holdings, Inc. (6) | 04/30/20 | 4.75 | % | L+3.50 | 1.25% | Diversified Telecommunication Services | 1,904 | 1,878 | 1,885 | ||||||||||||||
Spin Holdco Inc. (6) | 11/14/19 | 4.25 | % | L+3.25 | 1.00% | Diversified Consumer Services | 2,970 | 2,971 | 2,929 | ||||||||||||||
Standard Aero Limited (3), (6) | 11/02/18 | 5.00 | % | L+4.00 | 1.00% | Aerospace & Defense | 618 | 624 | 618 | ||||||||||||||
STHI Holding Corp. (6) | 08/06/21 | 4.50 | % | L+3.50 | 1.00% | Life Sciences Tools & Services | 1,995 | 1,986 | 1,984 | ||||||||||||||
STS Operating, Inc. (6) | 02/12/21 | 4.75 | % | L+3.75 | 1.00% | Trading Companies & Distributors | 1,985 | 1,997 | 1,955 | ||||||||||||||
Surgery Center Holdings, Inc. (6) | 11/03/20 | 5.25 | % | L+4.25 | 1.00% | Health Care Providers & Services | 2,000 | 1,990 | 1,953 | ||||||||||||||
Thermasys Corp. (6) | 05/03/19 | 5.25 | % | L+4.00 | 1.25% | Machinery | 1,839 | 1,843 | 1,811 | ||||||||||||||
TMS International Corp. (6) | 10/16/20 | 4.50 | % | L+3.50 | 1.00% | Metals & Mining | 2,970 | 2,976 | 2,977 | ||||||||||||||
TPF II LC, LLC (6) | 09/29/21 | 5.50 | % | L+4.50 | 1.00% | Independent Power & Renewable Electricity Producers | 1,000 | 993 | 1,002 | ||||||||||||||
Travelport Finance (Luxembourg) S.à r.l. (3), (6) | 09/02/21 | 6.00 | % | L+5.00 | 1.00% | Internet Software & Services | 2,000 | 1,976 | 2,000 | ||||||||||||||
Turbocombustor Technology, Inc. (6) | 12/02/20 | 5.50 | % | L+4.50 | 1.00% | Aerospace & Defense | 3,465 | 3,435 | 3,433 | ||||||||||||||
Tyche Holdings, LLC (6) | 11/12/21 | 5.50 | % | L+4.50 | 1.00% | IT Services | 1,850 | 1,844 | 1,843 | ||||||||||||||
USI, Inc. (6) | 12/27/19 | 4.25 | % | L+3.25 | 1.00% | Insurance | 1,975 | 1,992 | 1,947 | ||||||||||||||
See notes to consolidated financial statements.
66
AMERICAN CAPITAL SENIOR FLOATING, LTD.
CONSOLIDATED SCHEDULE OF INVESTMENTS (continued)
DECEMBER 31, 2014
(in thousands)
Description | Maturity | Interest Rate (1) | Basis Point Spread Above Index (2) | LIBOR Interest Rate Floor | Industry | Par Amount | Cost | Fair Value | |||||||||||||||
First Lien Floating Rate Loans (continued) — 135.2% of net assets | |||||||||||||||||||||||
USIC Holdings, Inc. (6) | 07/10/20 | 4.00 | % | L+3.00 | 1.00% | Construction & Engineering | $ | 1,470 | $ | 1,476 | $ | 1,433 | |||||||||||
Veyance Technologies, Inc. (6) | 09/08/17 | 5.25 | % | L+4.00 | 1.25% | Machinery | 1,496 | 1,496 | 1,494 | ||||||||||||||
Vitera Healthcare Solutions, LLC (6), (7) | 11/04/20 | 6.00 | % | L+5.00 | 1.00% | Health Care Technology | 2,228 | 2,212 | 2,216 | ||||||||||||||
WideOpenWest Finance, LLC (6) | 04/01/19 | 4.75 | % | L+3.75 | 1.00% | Media | 2,975 | 3,001 | 2,962 | ||||||||||||||
WP CPP Holdings, LLC (6) | 12/27/19 | 4.75 | % | L+3.75 | 1.00% | Aerospace & Defense | 2,962 | 2,956 | 2,947 | ||||||||||||||
Total First Lien Floating Rate Loans | $ | 198,221 | $ | 198,028 | $ | 194,952 | |||||||||||||||||
Second Lien Floating Rate Loans — 20.7% of Net Assets | |||||||||||||||||||||||
Accellent Inc. (6) | 03/11/22 | 7.50 | % | L+6.50 | 1.00% | Health Care Equipment & Supplies | $ | 1,500 | $ | 1,497 | $ | 1,421 | |||||||||||
Advantage Sales & Marketing Inc. (6) | 07/25/22 | 7.50 | % | L+6.50 | 1.00% | Professional Services | 1,000 | 993 | 992 | ||||||||||||||
Ameriforge Group Inc. | 12/21/20 | 8.75 | % | L+7.50 | 1.25% | Energy Equipment & Services | 500 | 500 | 493 | ||||||||||||||
Applied Systems, Inc. | 01/24/22 | 7.50 | % | L+6.50 | 1.00% | Software | 1,000 | 993 | 981 | ||||||||||||||
Asurion, LLC (6) | 03/03/21 | 8.50 | % | L+7.50 | 1.00% | Commercial Services & Supplies | 1,000 | 987 | 997 | ||||||||||||||
Camp International Holding Company | 11/29/19 | 8.25 | % | L+7.25 | 1.00% | Transportation Infrastructure | 1,000 | 1,000 | 1,005 | ||||||||||||||
Checkout Holding Corp. (6) | 04/11/22 | 7.75 | % | L+6.75 | 1.00% | Media | 1,000 | 1,003 | 933 | ||||||||||||||
Connolly, LLC (6) | 05/13/22 | 8.00 | % | L+7.00 | 1.00% | Professional Services | 1,250 | 1,238 | 1,241 | ||||||||||||||
Del Monte Foods, Inc. (3), (6) | 08/18/21 | 8.25 | % | L+7.25 | 1.00% | Food Products | 1,500 | 1,499 | 1,290 | ||||||||||||||
Drew Marine Group Inc. (7) | 05/19/21 | 8.00 | % | L+7.00 | 1.00% | Chemicals | 1,000 | 998 | 995 | ||||||||||||||
EWT Holdings III Corp. | 01/15/22 | 8.50 | % | L+7.50 | 1.00% | Machinery | 1,000 | 995 | 975 | ||||||||||||||
Filtration Group Corporation (6) | 11/22/21 | 8.25 | % | L+7.25 | 1.00% | Industrial Conglomerates | 500 | 496 | 501 | ||||||||||||||
Ikaria, Inc. (6) | 02/14/22 | 8.75 | % | L+7.75 | 1.00% | Health Care Providers & Services | 1,000 | 1,012 | 987 | ||||||||||||||
Inmar, Inc. (6) | 01/27/22 | 8.00 | % | L+7.00 | 1.00% | Commercial Services & Supplies | 750 | 743 | 734 | ||||||||||||||
Jazz Acquisition, Inc. (6) | 06/19/22 | 7.75 | % | L+6.75 | 1.00% | Aerospace & Defense | 1,250 | 1,256 | 1,223 | ||||||||||||||
Jonah Energy LLC (6), (7) | 05/12/21 | 7.50 | % | L+6.50 | 1.00% | Oil, Gas & Consumable Fuels | 500 | 493 | 432 | ||||||||||||||
Landslide Holdings, Inc. | 02/25/21 | 8.25 | % | L+7.25 | 1.00% | Software | 1,000 | 993 | 975 | ||||||||||||||
P2 Lower Acquisition, LLC | 10/22/21 | 9.50 | % | L+8.50 | 1.00% | Health Care Providers & Services | 500 | 498 | 485 | ||||||||||||||
Performance Food Group, Inc. (6) | 11/14/19 | 6.25 | % | L+5.25 | 1.00% | Food & Staples Retailing | 2,963 | 2,947 | 2,914 | ||||||||||||||
Prescrix, Inc. (3), (6) | 05/02/22 | 8.00 | % | L+7.00 | 1.00% | Containers & Packaging | 1,333 | 1,321 | 1,325 | ||||||||||||||
Ranpak Corp. (6) | 10/03/22 | 8.25 | % | L+7.25 | 1.00% | Containers & Packaging | 1,375 | 1,374 | 1,374 | ||||||||||||||
Road Infrastructure Investment, LLC (6), (7) | 09/30/21 | 7.75 | % | L+6.75 | 1.00% | Chemicals | 2,000 | 2,009 | 1,813 | ||||||||||||||
Sedgwick Claims Management Services, Inc. (6) | 02/28/22 | 6.75 | % | L+5.75 | 1.00% | Insurance | 2,000 | 1,991 | 1,895 | ||||||||||||||
Solenis International, L.P. (6) | 07/31/22 | 7.75 | % | L+6.75 | 1.00% | Chemicals | 500 | 498 | 487 | ||||||||||||||
TWCC Holding Corp. (6) | 06/26/20 | 7.00 | % | L+6.00 | 1.00% | Media | 2,000 | 1,991 | 1,923 | ||||||||||||||
Tyche Holdings, LLC (6) | 11/11/22 | 9.00 | % | L+8.00 | 1.00% | IT Services | 500 | 495 | 495 | ||||||||||||||
WP CPP Holdings, LLC (6) | 04/30/21 | 8.75 | % | L+7.75 | 1.00% | Aerospace & Defense | 1,000 | 1,022 | 955 | ||||||||||||||
Total Second Lien Floating Rate Loans | $ | 30,921 | $ | 30,842 | $ | 29,841 | |||||||||||||||||
See notes to consolidated financial statements.
67
AMERICAN CAPITAL SENIOR FLOATING, LTD.
CONSOLIDATED SCHEDULE OF INVESTMENTS (continued)
DECEMBER 31, 2014
(in thousands)
Description | Maturity | Interest Rate (1) | Basis Point Spread Above Index (2) | LIBOR Interest Rate Floor | Industry | Par Amount | Cost | Fair Value | |||||||||||||||
CLO Equity — 35.7% of Net Assets | |||||||||||||||||||||||
Apidos CLO XIV, Income Notes (3), (4), (7) | 04/15/25 | 14.54 | % | $ | 5,900 | $ | 5,299 | $ | 5,337 | ||||||||||||||
Ares XXIX CLO Ltd., Subordinated Notes (3), (4), (7) | 04/17/26 | 13.95 | % | 4,750 | 4,339 | 4,239 | |||||||||||||||||
Avery Point II CLO, Limited, Income Notes (3), (4), (7) | 07/17/25 | 14.34 | % | 3,200 | 2,764 | 2,697 | |||||||||||||||||
Blue Hill CLO, Ltd., Subordinated Notes (3), (4), (7) | 01/15/26 | 14.39 | % | 5,400 | 4,709 | 4,588 | |||||||||||||||||
Blue Hill CLO, Ltd., Subordinated Fee Notes (3), (4), (7) | 01/15/26 | 6.38 | % | 100 | 94 | 91 | |||||||||||||||||
Carlyle Global Market Strategies CLO 2013-3, Ltd., Subordinated Notes (3), (4), (7) | 07/15/25 | 18.93 | % | 2,750 | 2,096 | 2,311 | |||||||||||||||||
Cent CLO 18 Limited, Subordinated Notes (3), (4), (7) | 07/23/25 | 14.13 | % | 4,675 | 4,007 | 3,940 | |||||||||||||||||
Cent CLO 19 Limited, Subordinated Notes (3), (4), (7) | 10/29/25 | 12.27 | % | 2,750 | 2,402 | 2,299 | |||||||||||||||||
Dryden 31 Senior Loan Fund, Subordinated Notes (3), (4), (7) | 04/18/26 | 9.53 | % | 5,250 | 4,686 | 4,187 | |||||||||||||||||
Galaxy XVI CLO, Ltd., Subordinated Notes (3), (4), (7) | 11/17/25 | 11.21 | % | 2,750 | 2,362 | 2,259 | |||||||||||||||||
Halcyon Loan Advisors Funding 2014-1 Ltd., Subordinated Notes (3), (4), (7) | 04/18/26 | 18.01 | % | 3,750 | 3,315 | 3,376 | |||||||||||||||||
Highbridge Loan Management 2013-2, Ltd., Subordinated Notes (3), (4), (7) | 10/20/24 | 14.71 | % | 1,000 | 849 | 838 | |||||||||||||||||
Magnetite VIII, Limited, Subordinated Notes (3), (4), (7) | 04/15/26 | 11.38 | % | 3,000 | 2,911 | 2,680 | |||||||||||||||||
Neuberger Berman CLO XV, Ltd., Subordinated Notes (3), (4), (7) | 10/15/25 | 13.92 | % | 3,410 | 2,786 | 2,773 | |||||||||||||||||
Octagon Investment Partners XIV, Ltd., Income Notes (3), (4), (7) | 01/15/24 | 14.33 | % | 5,500 | 4,571 | 4,210 | |||||||||||||||||
Octagon Investment Partners XX, Ltd., Subordinated Notes (3), (4), (7) | 08/12/26 | 11.53 | % | 2,500 | 2,482 | 2,327 | |||||||||||||||||
THL Credit Wind River 2014-1 CLO Ltd., Subordinated Notes (3), (4), (7) | 04/18/26 | 12.77 | % | 4,000 | 3,591 | 3,425 | |||||||||||||||||
Total CLO Equity | $ | 60,685 | $ | 53,263 | $ | 51,577 | |||||||||||||||||
Total Non-Control/Non-Affiliate Investments — 191.6% of Net Assets | $ | 289,827 | $ | 282,133 | $ | 276,370 | |||||||||||||||||
Liabilities in Excess of Other Assets — (91.6%) of Net Assets | (132,135 | ) | |||||||||||||||||||||
Net Assets — 100.0% | $ | 144,235 | |||||||||||||||||||||
(1) | For each debt investment we have provided the weighted-average interest rate in effect as of December 31, 2014. For each CLO investment we have provided the accounting yield as of December 31, 2014 determined using the effective interest method that will be applied to the current amortized cost of the investment as adjusted for credit impairments, if any, in the following quarter. |
(2) | Floating rate debt investments typically accrue interest at a predetermined spread relative to an index, typically LIBOR or PRIME, and reset monthly, quarterly or semi-annually. These instruments may be subject to a LIBOR or PRIME rate floor. |
(3) | Investments that are not “qualifying assets” under Section 55(a) of the 1940 Act. Under the 1940 Act, we may not acquire any non-qualifying assets unless, at the time such acquisition is made, qualifying assets represent at least 70% of our total assets. As of December 31, 2014, qualifying assets represented 74% of total assets. |
(4) | These securities are exempt from registration under Rule 144A of the Securities Act of 1933, as amended. These securities may be resold in transactions that are exempt from registration, normally to qualified institutional buyers. |
(5) | All or a portion of this position had not settled as of December 31, 2014. |
(6) | Assets are held at ACSF Funding and are pledged as collateral for the Credit Facility. |
(7) | Fair value was determined using significant unobservable inputs and are classified as Level 3 in the fair value hierarchy. |
See notes to consolidated financial statements.
68
AMERICAN CAPITAL SENIOR FLOATING, LTD.
NOTES TO CONSOLIDATED FINANCIAL STATEMENTS
(in thousands, except share and per share amounts)
Note 1. Organization
American Capital Senior Floating, Ltd. (which is referred to as “ACSF”, “we”, “us” and “our”) was organized in February 2013 as a Maryland corporation and commenced operations on October 15, 2013. We are structured as an externally managed, non-diversified closed-end investment management company that has elected to be regulated as a business development company (“BDC”) under the Investment Company Act of 1940, as amended (the “1940 Act”). On November 14, 2013, we formed a wholly-owned special purpose financing vehicle, ACSF Funding I, LLC, a Delaware limited liability company (“ACSF Funding”).
In January 2014, we completed an initial public offering (“IPO”) of 10,000,000 shares of common stock at the public offering price of $15.00 per share for gross proceeds of $150,000. Upon completion of the IPO, we became externally managed by American Capital ACSF Management, LLC (our “Manager”), an indirect subsidiary of American Capital Asset Management, LLC (“ACAM”), which is a wholly-owned portfolio company of American Capital, Ltd. (“American Capital”). Prior to the completion of our IPO, we were wholly-owned by ACAM. Following completion of the IPO, ACAM owned approximately 3% of our outstanding common stock, the maximum amount permissible under the 1940 Act. In conjunction with the IPO, our Manager paid the underwriting commissions of $7,952. Our common stock is listed on the NASDAQ Global Select Market, where it trades under the symbol “ACSF”. We have elected to be treated as a BDC under the 1940 Act and to be taxed as a regulated investment company (“RIC”), as defined in Subchapter M of the Internal Revenue Code of 1986, as amended (the “Code”).
Investment Objective
Our investment objective is to provide attractive, risk-adjusted returns over the long term primarily through current income while seeking to preserve our capital. We actively manage a leveraged portfolio composed primarily of diversified investments in first lien and second lien floating rate loans principally to large-market U.S.-based companies (collectively, “Senior Floating Rate Loans” or “SFRLs”), which are commonly referred to as leveraged loans. We also invest in equity tranches of collateralized loan obligations (“CLOs”), which are securitized vehicles collateralized primarily by SFRLs, and we may invest in debt tranches of CLOs. In addition, we may selectively invest in loans issued by middle market companies, mezzanine and unitranche loans and high yield bonds. Additionally, we may from time to time hold or invest in other equity investments and other debt or equity securities generally arising from a restructuring of Senior Floating Rate Loan positions previously held by us.
Note 2. Significant Accounting Policies
Basis of Presentation
The accompanying consolidated financial statements have been prepared in accordance with generally accepted accounting principles in the United States of America (“GAAP”).
The consolidated financial statements include our accounts and those of our wholly-owned subsidiary, ACSF Funding. Intercompany accounts and transactions have been eliminated in consolidation. The accounts of ACSF Funding are prepared for the same reporting period as ours using consistent accounting policies.
Use of Estimates
The preparation of our financial statements in conformity with GAAP requires management to make estimates and assumptions that affect the reported amounts of assets and liabilities at the date of the financial statements and the reported amount of income and expenses during the reported period. Changes in economic environment, financial markets, and any other parameters used in determining such estimates could cause actual results to differ.
Investment Classification
As required by the 1940 Act, investments are classified by level of control. “Control Investments” are defined as investments in portfolio companies that we are deemed to control, as defined in the 1940 Act. “Affiliate Investments” are investments in those companies that are affiliated companies, as defined in the 1940 Act, other than Control Investments. “Non-Control/Non-Affiliate Investments” are those that are neither Control Investments nor Affiliate Investments.
69
AMERICAN CAPITAL SENIOR FLOATING, LTD.
NOTES TO CONSOLIDATED FINANCIAL STATEMENTS (continued)
(in thousands, except share and per share amounts)
Generally, under the 1940 Act, we are deemed to control a company in which we have invested if we own more than 25% of the voting securities of such company. We are deemed to be an affiliate of a company if we own 5% or more of the voting securities of such company.
As of December 31, 2015 and 2014, all of our investments were Non-Control/Non-Affiliate investments.
Securities Transactions
Securities transactions are recorded on the trade date. The trade date for loans purchased in the “primary market” is considered the date on which the loan allocations are determined. The trade date for loans and other investments purchased in the “secondary market” is the date on which the transaction is entered into. The trade date for primary CLO equity transactions and any other security transaction entered outside conventional channels is the date we have determined all material terms have been defined for the transaction and have obtained a right to demand the securities purchased or collect the proceeds of a sale and incur an obligation to pay the price of the securities purchased or to deliver the securities sold, respectively. Cost is determined based on consideration given, adjusted for amortization of original issuance discounts (“OID”), market discounts and premiums.
Realized Gain or Loss and Unrealized Appreciation or Depreciation
Realized gain or loss from an investment is recorded at the time of disposition and calculated using the weighted average cost method. Unrealized appreciation or depreciation reflects the changes in fair value of investments as determined in compliance with the valuation policy as discussed in Note 6 to our audited consolidated financial statements included in this Annual Report on Form 10-K.
Income Taxes
As a RIC under Subchapter M of the Code, we are not subject to U.S. federal income tax on the portion of our taxable income distributed to our stockholders as a dividend. We intend to distribute 100% of our taxable income, within the Subchapter M rules, and therefore do not anticipate incurring corporate-level U.S. federal or state income tax. As a RIC, we are also subject to a nondeductible federal excise tax if we do not distribute at least 98% of net ordinary income, 98.2% of any capital gain net income, and any recognized and undistributed taxable income from prior years.
ASC Topic 740 Accounting for Uncertainty in Income Taxes (“ASC 740”), provides guidance for how uncertain tax positions should be recognized, measured, presented and disclosed. ASC 740 requires the evaluation of tax positions taken or expected to be taken in the course of preparing the tax returns to determine whether the tax positions are “more-likely-than-not” of being sustained by the applicable tax authority. Tax positions not deemed to meet the “more-likely-than-not” threshold are recorded as a tax benefit or provision in the current year. Determinations regarding ASC 740 may be subject to review and adjustment at a later date based upon factors including, but not limited to, an ongoing analysis of tax laws, regulations and interpretations thereof. We are not aware of any tax positions for which it is reasonably possible that the total amount of unrecognized tax benefits will change materially in the 12 months from December 31, 2015.
To the extent we incur interest and/or penalties in connection with our tax obligations, such amounts shall be classified as income tax expense on our consolidated statements of operations.
Investment Income
For debt investments, we record interest income on the accrual basis to the extent that such amounts are expected to be collected. OID and purchased discounts and premiums are accreted into interest income using the effective interest method, where applicable. Loan origination fees are deferred and accreted into interest income using the effective interest method. We record prepayment premiums on loans and other investments as interest income when such amounts are received. We stop accruing interest on investments when it is determined that interest is no longer collectible. As of December 31, 2015 we had one loan on non-accrual status and, as of December 31, 2014, we had no loans on non-accrual status.
Interest income on CLO equity investments is recognized using the effective interest method as required by FASB ASC Subtopic 325-40, Investments-Other, Beneficial Interests in Securitized Financial Assets (“ASC 325-40”). Under ASC 325-40, at the time of purchase, we estimate the future expected cash flows and determine the effective yield of an investment based on these estimated cash flows and our cost basis. Subsequent to the purchase, these estimated cash flows are updated quarterly and a revised yield is calculated prospectively in accordance with ASC 320-10-35, Investment-Debt and Equity Securities. In the event that the fair value of an investment decreases below its current amortized cost basis, we may be required to write down the current amortized cost basis for a credit loss or to fair value depending on our hold expectations for the investment. Current amortized cost basis less the amount of any write down (“Reference Amount”) is used to calculate the effective yield used for interest income recognition purposes over the remaining life of the investment. We are precluded from reversing write downs for any subsequent increase in the expected cash flows of an investment with the effect of increasing total interest income over the life of the investment and
70
AMERICAN CAPITAL SENIOR FLOATING, LTD.
NOTES TO CONSOLIDATED FINANCIAL STATEMENTS (continued)
(in thousands, except share and per share amounts)
increasing the realized loss recorded on the sale or redemption of the investment by the amount of the credit loss write down. In estimating these cash flows, there are a number of assumptions that are subject to uncertainties and contingencies. These include the amount and timing of principal payments (including prepayments, repurchases, defaults and liquidations), the pass through or coupon rate, and interest rate fluctuations. In addition, interest payment shortfalls due to delinquencies on the underlying loans and the timing and magnitude of projected credit losses on the loans underlying the securities have to be estimated. These uncertainties and contingencies are difficult to predict and are subject to future events that may impact our estimates and interest income. As a result, actual results may differ significantly from these estimates. During the year ended December 31, 2015, we recorded $4.0 million in credit loss write downs to current amortized cost basis on five CLO equity investments.
Cash and Cash Equivalents
Cash and cash equivalents consist of demand deposits and highly liquid financial instruments with original maturities of 90 days or less including those held in overnight sweep bank deposit accounts. Cash and cash equivalents are carried at cost, which approximates fair value. We place our cash and cash equivalents with financial institutions and, at times, cash held in bank accounts may exceed the Federal Deposit Insurance Corporation insured limit.
Consolidation
As permitted under Article 6 of Regulation S-X and as explained by ASC 946-810-45, Financial Services - Investment Companies - Consolidation, we will generally not consolidate an investment in a company other than an investment company subsidiary or a controlled operating company whose business consists primarily of providing services to us. Accordingly, we have consolidated the results of ACSF Funding in our consolidated financial statements.
Deferred Financing Costs
Deferred financing costs represent fees and other direct expenses incurred in connection with the issuance of debt. These costs are capitalized and amortized into interest expense over the estimated average life of the borrowings.
Offering Costs
Offering costs consist of fees and expenses incurred in connection with the issuance of common stock including legal, accounting, printing and other related expenses, as well as costs incurred in connection with the filing of a shelf registration statement. These costs are capitalized when incurred and recognized as a reduction to offering proceeds when the offering becomes effective. There were $0, $844 and $0 of offering costs charged to capital during the years ended December 31, 2015, 2014 and the period ended December 31, 2013, respectively. The underwriting commissions associated with our IPO in January 2014 were paid for by our Manager and were not reflected as a reduction to capital at the time of the IPO.
Distributions to Stockholders
Distributions to stockholders are recorded on the ex-dividend date.
Other General and Administrative Expenses
Other general and administrative expenses include audit and tax, professional fees, board of directors' fees, rent, IT system
costs, custody, transfer agent and other operating expenses. Expenses are recognized on an accrual basis.
New Accounting Pronouncements
In April 2015, the Financial Accounting Standards Board (“FASB”) issued Accounting Standards Update (“ASU”) No. 2015-03, Interest-Imputation of Interest (Subtopic 835-30) Simplifying the Presentation of Debt Issuance Costs (“ASU 2015-03”), which requires debt issuance costs related to a recognized debt liability to be presented in the balance sheet as a direct deduction from the carrying amount of that debt liability, consistent with debt discounts. In August 2015, the FASB issued ASU No. 2015-15, Interest-Imputation of Interest (Subtopic 835-30): Presentation and Subsequent Measurement of Debt Issuance Costs Associated with Line-of-Credit Arrangements-Amendments to U.S. Securities and Exchange Commission (“SEC”) Paragraphs Pursuant to Staff Announcement at June 18, 2015 EITF Meeting (SEC Update) (“ASU 2015-15”), which codifies existing practice and the SEC staff position on the presentation and subsequent measurement of debt issuance costs related to line-of-credit (“LOC”) arrangements and provides that such costs may be deferred and presented as an asset and subsequently amortized ratably over the term of the LOC arrangement, regardless of whether there are any outstanding borrowings on the LOC arrangement. An entity is required to apply the guidance in ASU 2015-03 on a retrospective basis such that the balance sheet of each individual period presented is adjusted to reflect the period-specific effects of applying the new guidance. Upon transition, an entity is required to comply with the applicable disclosures for a change in an accounting principle including the nature of and reason for the change in accounting principle, the transition method, a description of the prior-period information that has been retrospectively adjusted, and the effect of the change on the financial statement line items (that is, debt issuance cost asset and the debt liability). ASU
71
AMERICAN CAPITAL SENIOR FLOATING, LTD.
NOTES TO CONSOLIDATED FINANCIAL STATEMENTS (continued)
(in thousands, except share and per share amounts)
2015-03 is effective for public business entities for fiscal years beginning after December 15, 2015, and interim periods within those fiscal years. Early adoption is permitted for financial statements that have not been previously issued. We do not believe the adoption of ASU 2015-03 and ASU 2015-15 will have a material impact on our consolidated financial statements.
In May 2015, the FASB issued ASU No. 2015-07, Fair Value Measurement (Topic 820) - Disclosures for Investments in Certain Entities That Calculate Net Asset Value per Share (or Its Equivalent) (“ASU 2015-07”), which removes the requirement to include, as well as provide certain disclosure for, investments in the fair value hierarchy for which the fair value is measured at net asset value using the practical expedient. Disclosures are limited to investments for which the entity has elected to measure the fair value using that practical expedient. ASU 2015-07 is effective for annual reporting periods beginning after December 15, 2015, including interim periods within that reporting period. Early adoption is permitted. We do not believe the adoption of ASU 2015-07 will have a material impact on our consolidated financial statements.
Note 3. Management Agreement
Our management agreement with our Manager, has a current renewal term expiring January 15, 2017. Under the management agreement, our Manager has agreed to provide investment advisory services to us, in addition to providing personnel, facilities and additional services necessary for our operations. Unless terminated earlier, the management agreement will automatically renew following the expiration of its current term for successive one year periods if approved annually by our Board of Directors or by the affirmative vote of the holders of a majority of our outstanding voting securities, and, in either case if also approved by a majority of our directors who are not “Interested Persons” as defined under the 1940 Act. Our Board of Directors and a majority of our directors who are not “Interested Persons”, as defined under the 1940 Act, have approved a renewal of the management agreement until January 15, 2017 and, subject to stockholder approval, an amendment and restatement of the management agreement, as described below.
Pursuant to the management agreement, our Manager has agreed to be responsible for certain of our operating expenses in excess of 0.75% of our consolidated net assets, less net unrealized appreciation or depreciation, each as determined under GAAP at the end of the most recently completed fiscal quarter for the first 24 months following the date of our IPO (the “Expense Cap”). Operating expenses subject to this reimbursement include both (i) our operating expenses reimbursed to our Manager and its affiliates for the expenses related to our operations incurred on our behalf and (ii) our operating expenses directly incurred by us excluding the management fee, interest costs, taxes and accrued costs and fees related to actual, pending or threatened litigation, each as determined under GAAP for the most recently completed fiscal quarter. As a result of this Expense Cap, any reimbursements to our Manager and its affiliates could be reduced or eliminated, and in certain instances, our Manager could be required to reimburse us so that our other expenses do not exceed the Expense Cap. Our Manager has agreed to extend the Expense Cap until the date of our 2016 Annual Meeting of Stockholders, at which time we expect to submit to a vote of stockholders an amendment and restatement of the management agreement which would (i) extend the Expense Cap through December 31, 2020, (ii) subject to the Expense Cap, provide for reimbursement by us to our Manager for certain compensation expenses related to legal, compliance and internal audit personnel of our Manager and its affiliates who provide services to us necessary for our operations that are not required to be provided by our Manager under the management agreement and (iii) make certain other immaterial changes. Following the expiration of the Expense Cap, there are no limits on the reimbursement to our Manager or its affiliates of such expenses related to our operations. For the years ended December 31, 2015, 2014 and period ended December 31, 2013, our Manager was responsible for $899, $1,001 and $0, respectively, of operating expenses as a result of the Expense Cap.
Our Manager receives a management fee from us that is payable quarterly in arrears. The management fee is calculated at an annual rate of 0.80% of our total consolidated assets, excluding cash and cash equivalents and net unrealized appreciation or depreciation, each as determined under GAAP at the end of the most recently completed fiscal quarter. There is no incentive compensation paid to our Manager under the management agreement. The management fee is prorated for any partial period and totaled $2,236, $2,186 and $0 for the years ended December 31, 2015, 2014 and the period ended December 31, 2013, respectively.
Since our Manager has no employees, it has entered into an administrative agreement with both its parent and American Capital pursuant to which our Manager will be provided with personnel, services and resources necessary for our Manager to perform its obligations under the management agreement as well as provide certain additional services.
Note 4. Related Party Transactions
Administrative Services Agreement and Management Agreement
Our Manager has entered into an administrative services agreement whereby our Manager has agreed to reimburse American Capital and its affiliates for certain expenses incurred on our behalf. Pursuant to our management agreement, we are responsible for reimbursing our Manager, American Capital and its affiliates for expenses incurred on our behalf, excluding employment-related expenses of our and our Manager’s officers and any employees of American Capital or its affiliates who
72
AMERICAN CAPITAL SENIOR FLOATING, LTD.
NOTES TO CONSOLIDATED FINANCIAL STATEMENTS (continued)
(in thousands, except share and per share amounts)
provide services to us pursuant to the management agreement or to our Manager pursuant to the administrative services agreement. In addition, our Manager or one of its affiliates may pay for or incur certain expenses and then allocate these expenses to us. For the years ended December 31, 2015, 2014 and the period ended December 31, 2013 we recognized $937, $970 and $48, respectively, of expenses that are reimbursable to our Manager and its affiliates. Refer to Note 3 to our audited consolidated financial statements included in this Annual Report on Form 10-K for additional information on the management agreement.
Securities Transactions
We may, from time to time, purchase securities from, or sell securities to affiliates of our Manager at fair market value on the trade date. During the years ended December 31, 2015, 2014 and the period ended December 31, 2013, total proceeds from sales to affiliates were $0, $20,521 and $0, respectively.
Note 5. Net (Loss) Earnings Per Share
The following table sets forth the computation of basic and diluted (loss) earnings per share for the years ended December 31, 2015 and 2014:
2015 | 2014 | ||||||
Numerator—Net (Loss) Earnings | $ | (14,665 | ) | $ | 3,789 | ||
Denominator—weighted average shares (1) | 10,000,100 | 10,000,100 | |||||
Net (Loss) Earnings per share | $ | (1.47 | ) | $ | 0.38 | ||
(1) | Assumes the 10,000,000 common shares issued in our IPO on January 22, 2014 were issued on January 1, 2014. |
Net earnings per share for the period ended December 31, 2013 is considered not meaningful.
Note 6. Investments
We value our investments at fair value in accordance with the 1940 Act and Financial Accounting Standards Board Accounting Standards Codification (“ASC”) Topic 820, Fair Value Measurements and Disclosures (“ASC 820”), which defines fair value as the price that would be received upon the sale of an asset or paid to transfer a liability in an orderly transaction between market participants at the measurement date under current market conditions. Due to the uncertainty inherent in the valuation process, estimates of fair value may differ significantly from the values that would have been used had a ready market for our investments existed, and the differences could be material. Additionally, changes in the market environment and other events that may occur over the life of the investments may cause the gains or losses ultimately realized on the investments to be different than the valuations currently assigned.
ASC 820 provides a framework for measuring the fair value of assets and liabilities and provides guidance regarding a fair value hierarchy, which prioritizes information used to measure fair value and the effect of fair value measurements on earnings. When available, we determine the fair value of our investments using unadjusted quoted prices from active markets. Where inputs for an asset or liability fall into more than one level in the fair value hierarchy, the investment is classified in its entirety based on the lowest level input that is significant to that investment's fair value measurement. We use judgment and consider factors specific to the investment when determining the significance of an input to a fair value measurement. Our policy is to recognize transfers in and out of levels as of the beginning of each reporting period. The three levels of the fair value hierarchy and investments that fall into each of the levels are described below:
Level 1: Inputs are unadjusted quoted prices in active markets that are accessible at the measurement date for identical, unrestricted assets or liabilities.
Level 2: Inputs other than quoted prices included within Level 1 that are observable for the asset or liability, either directly or indirectly. This may include valuations based on executed trades, broker quotations that constitute an executable price, and alternative pricing sources supported by observable inputs which, in each case, are either directly or indirectly observable for the asset in connection with market data at the measurement date.
Level 3: Inputs are unobservable and cannot be corroborated by observable market data. In certain cases, investments classified within Level 3 may include securities for which we have obtained indicative quotes from broker-dealers that do not necessarily represent prices the broker may be willing to trade on.
The valuation techniques used maximize the use of observable inputs and minimize the use of unobservable inputs. Our SFRLs are predominately valued based on evaluated prices from a nationally recognized independent pricing service or from third-party brokers who make markets in such debt investments. When possible, we make inquiries of third-party pricing sources to
73
AMERICAN CAPITAL SENIOR FLOATING, LTD.
NOTES TO CONSOLIDATED FINANCIAL STATEMENTS (continued)
(in thousands, except share and per share amounts)
understand their use of significant inputs and assumptions. We review the third-party fair value estimates and perform procedures to validate their reasonableness, including an analysis of the range and dispersion of third-party estimates, frequency of pricing updates, comparison of recent trade activity for similar securities, and review for consistency with market conditions observed as of the measurement date.
There may be instances when independent or third-party pricing sources are not available, or cases where we believe that the third-party pricing sources do not provide sufficient evidence to support a market participant's view of the fair value of the debt investment being valued. These instances may result from an investment in a less liquid loan such as a middle market loan, a mezzanine loan or unitranche loan, or a loan to a company that has become financially distressed. In these instances, we may estimate the fair value based on a combination of a market yield valuation methodology and evaluated pricing discussed above, or solely based on a market yield valuation methodology. Under the market yield valuation methodology, we estimate the fair value based on a discounted cash flow technique. For these debt investments, the unobservable inputs used in the market yield valuation methodology to measure fair value reflect management's best estimate of assumptions that would be used by market participants when pricing the investment in a hypothetical transaction, including estimated remaining life, current market yield and interest rate spreads of similar loans and securities as of the measurement date. We will estimate the remaining life based on market data for the average life of similar loans. However, if we have information that the loan is expected to be repaid in the near term, we would use an estimated remaining life based on the expected repayment date. The average life to be used to estimate the fair value of our loans may be shorter than the legal maturity of the loans since many loans are prepaid prior to the maturity date. The interest rate spreads used to estimate the fair value of our loans is based on current interest rate spreads of similar loans. If there is a significant deterioration of the credit quality of a loan, we may consider other factors that a hypothetical market participant would use to estimate fair value, including the proceeds that would be received in a liquidation analysis.
We estimate the fair value of our CLO equity investments using a combination of third-party broker quotes, purchases or sales of the same or similar securities, and cash flow forecasts subject to assumptions that a market participant would use regarding the investments' underlying collateral including, but not limited to, assumptions for default and recovery rates, reinvestment spreads and prepayment rates. Cash flow forecasts are discounted using market participant's market yield assumptions that are derived from multiple sources including, but not limited to, third-party broker quotes, industry research reports and transactions of securities and indices with similar structures and risk characteristics. We weight the use of third-party broker quotes, if any, when determining fair value based on our understanding of the level of actual transactions used by the broker to develop the quote and whether the quote was an indicative price or binding offer, the depth and consistency of broker quotes and the correlation of changes in broker quotes with underlying performance and other market indices.
The following fair value hierarchy tables set forth our investments measured at fair value on a recurring basis by level:
December 31, 2015 | |||||||||||||||
Total | Level 1 | Level 2 | Level 3 | ||||||||||||
First lien floating rate loans | $ | 169,580 | $ | — | $ | 169,580 | $ | — | |||||||
Second lien floating rate loans | 22,575 | — | 22,216 | 359 | |||||||||||
CLO equity | 36,854 | — | — | 36,854 | |||||||||||
Equity | 47 | — | — | 47 | |||||||||||
Total Investments | $ | 229,056 | $ | — | $ | 191,796 | $ | 37,260 | |||||||
December 31, 2014 | |||||||||||||||
Total | Level 1 | Level 2 | Level 3 | ||||||||||||
First lien floating rate loans | $ | 194,952 | $ | — | $ | 189,274 | $ | 5,678 | |||||||
Second lien floating rate loans | 29,841 | — | 26,601 | 3,240 | |||||||||||
CLO equity | 51,577 | — | — | 51,577 | |||||||||||
Total Investments | $ | 276,370 | $ | — | $ | 215,875 | $ | 60,495 | |||||||
74
AMERICAN CAPITAL SENIOR FLOATING, LTD.
NOTES TO CONSOLIDATED FINANCIAL STATEMENTS (continued)
(in thousands, except share and per share amounts)
The following table provides a summary of the changes in fair value of Level 3 assets for the year ended December 31, 2015 as well as the portion of net unrealized appreciation (depreciation) for the year ended December 31, 2015 related to those assets still held as of December 31, 2015:
First Lien Floating Rate Loans | Second Lien Floating Rate Loans | CLO Equity | Common Equity | Total | ||||||||||||||||
Beginning Balance – December 31, 2014 | $ | 5,678 | $ | 3,240 | $ | 51,577 | $ | — | $ | 60,495 | ||||||||||
Purchases | — | — | 10,636 | — | 10,636 | |||||||||||||||
Sales | — | — | (2,282 | ) | — | (2,282 | ) | |||||||||||||
Repayments (1) | (11 | ) | (11 | ) | (13,626 | ) | — | (13,648 | ) | |||||||||||
Amortization of discount/premium (2) | 2 | — | 7,330 | — | 7,332 | |||||||||||||||
Transfers out (3) | (6,892 | ) | (3,240 | ) | — | — | (10,132 | ) | ||||||||||||
Transfers in (3) | 1,249 | 898 | — | — | 2,147 | |||||||||||||||
Realized gains, net | — | — | 278 | — | 278 | |||||||||||||||
Net unrealized appreciation (depreciation) | (26 | ) | (528 | ) | (17,059 | ) | 47 | (17,566 | ) | |||||||||||
Ending Balance – December 31, 2015 | $ | — | $ | 359 | $ | 36,854 | $ | 47 | $ | 37,260 | ||||||||||
Net change in unrealized depreciation reported within the net change in unrealized depreciation on investments in our consolidated statement of operations attributable to our Level 3 assets still held as of December 31, 2015 | $ | — | $ | (557 | ) | $ | (16,844 | ) | $ | 47 | $ | (17,354 | ) | |||||||
(1) | Includes total cash distributions from CLO equity investments. |
(2) | Includes income accrual from CLO equity investments. |
(3) | Investments were transferred into and out of Level 3 and Level 2 due to changes in the quantity and quality of inputs obtained to support the fair value of each investment. Transfers into and out of the levels are recognized at the beginning of the period. |
The following table provides a summary of the changes in fair value of Level 3 assets for the year ended December 31, 2014 as well as the portion of net unrealized depreciation for the year ended December 31, 2014 related to those assets still held as of December 31, 2014:
First Lien Floating Rate Loans | Second Lien Floating Rate Loans | CLO Equity | Total | |||||||||||||
Beginning Balance – December 31, 2013 | $ | 36,257 | $ | 3,536 | $ | 30,172 | $ | 69,965 | ||||||||
Purchases | 10,247 | 7,924 | 26,697 | 44,868 | ||||||||||||
Sales | (12,538 | ) | (3,507 | ) | — | (16,045 | ) | |||||||||
Repayments (1) | (4,351 | ) | — | (9,113 | ) | (13,464 | ) | |||||||||
Amortization of discount/premium (2) | 7 | 3 | 5,501 | 5,511 | ||||||||||||
Transfers out (3) | (34,776 | ) | (6,531 | ) | — | (41,307 | ) | |||||||||
Transfers in (3) | 10,951 | 1,944 | — | 12,895 | ||||||||||||
Realized gains, net | 133 | 36 | — | 169 | ||||||||||||
Net unrealized depreciation | (252 | ) | (165 | ) | (1,680 | ) | (2,097 | ) | ||||||||
Ending Balance – December 31, 2014 | $ | 5,678 | $ | 3,240 | $ | 51,577 | $ | 60,495 | ||||||||
Net change in unrealized depreciation reported within the net change in unrealized depreciation on investments in our consolidated statement of operations attributable to our Level 3 assets still held as of December 31, 2014 | $ | (229 | ) | $ | (280 | ) | $ | (1,680 | ) | $ | (2,189 | ) | ||||
(1) | Includes total cash distributions from CLO equity investments. |
(2) | Includes income accrual from CLO equity investments. |
(3) | Investments were transferred into and out of Level 3 and Level 2 due to changes in the quantity and quality of inputs obtained to support the fair value of each investment. Transfers into and out of the levels are recognized at the beginning of the period. |
75
AMERICAN CAPITAL SENIOR FLOATING, LTD.
NOTES TO CONSOLIDATED FINANCIAL STATEMENTS (continued)
(in thousands, except share and per share amounts)
The following table summarizes the significant unobservable inputs used in the determination of fair value for our Level 3 investments by category of investment and valuation technique as of December 31, 2015:
Range | |||||||||||
Fair Value as of December 31, 2015 | Valuation Techniques/ Methodology | Unobservable Inputs | Minimum | Maximum | Weighted Average | ||||||
Second lien floating rate loans | $ | 359 | Third-party vendor pricing service | Bid/Ask | 8 | 64 | 57 | ||||
CLO equity | 36,854 | Discounted Cash Flow | Discount rate Prepayment rate Default rate | 16.5% 30.0% 1.5% | 29.0% 33.3% 1.7% | 21.3% 30.2% 1.6% | |||||
Equity | 47 | Third-party vendor pricing service | Bid/Ask | 5 | 5 | 5 | |||||
Total | $ | 37,260 | |||||||||
The following table summarizes the significant unobservable inputs used in the determination of fair value for our Level 3 investments by category of investment and valuation technique as of December 31, 2014:
Range | |||||||||||
Fair Value as of December 31, 2014 | Valuation Techniques/ Methodology | Unobservable Inputs | Minimum | Maximum | Weighted Average | ||||||
First lien floating rate loans | $ | 5,678 | Third-party vendor pricing service | Bid/Ask | 91 | 100 | 96 | ||||
Second lien floating rate loans | 3,240 | Third-party vendor pricing service | Bid/Ask | 85 | 100 | 93 | |||||
CLO equity | 51,577 | Discounted Cash Flow | Discount rate Prepayment rate Default rate | 13.1% 30.0% 0.25% | 15.6% 35.0% 2.0% | 13.9% 30.3% 1.5% | |||||
Total | $ | 60,495 | |||||||||
The significant unobservable inputs used in the fair value measurement of CLO equity include the default and prepayment rates used to establish projected cash flows and the discount rate applied in the valuation models to those projected cash flows. An increase in any one of these individual inputs in isolation would likely result in a decrease to fair value. However, given the interrelationship between these inputs, overall market conditions would likely have a more significant impact on our Level 3 fair values than changes in any one unobservable input. Our maximum exposure to loss due to credit risk is their fair value.
76
AMERICAN CAPITAL SENIOR FLOATING, LTD.
NOTES TO CONSOLIDATED FINANCIAL STATEMENTS (continued)
(in thousands, except share and per share amounts)
We use the Global Industry Classification Standard (“GICS®”) for classifying the industry groupings of our SFRL investments. The GICS® was developed by MSCI, an independent provider of global indexes and benchmark-related products and services, and Standard & Poor’s, an independent international financial data and investment services company and provider of global equity indexes. The following table shows the SFRL portfolio composition by industry grouping at fair value as a percentage of total Senior Floating Rate Loans as of December 31, 2015 and 2014 . The investments in CLOs are excluded from the table below.
December 31, 2015 | December 31, 2014 | ||
Software | 11.6% | 7.3% | |
Health Care Providers & Services | 9.2% | 9.9% | |
Media | 7.7% | 7.7% | |
Aerospace & Defense | 6.6% | 7.4% | |
Insurance | 5.2% | 4.1% | |
Commercial Services & Supplies | 4.6% | 5.0% | |
Hotels, Restaurants & Leisure | 3.7% | 6.7% | |
Professional Services | 2.7% | 2.5% | |
IT Services | 2.7% | 1.0% | |
Capital Markets | 2.6% | 1.5% | |
Containers & Packaging | 2.4% | 2.9% | |
Diversified Consumer Services | 2.4% | 2.0% | |
Food & Staples Retailing | 2.3% | 2.4% | |
Chemicals | 2.2% | 1.8% | |
Food Products | 2.2% | 2.2% | |
Machinery | 1.9% | 2.3% | |
Health Care Equipment & Supplies | 1.9% | 3.3% | |
Life Sciences Tools & Services | 1.7% | 2.5% | |
Textiles, Apparel & Luxury Goods | 1.7% | 1.8% | |
Internet & Catalog Retail | 1.5% | 1.3% | |
Communications Equipment | 1.5% | —% | |
Transportation Infrastructure | 1.5% | 1.3% | |
Trading Companies & Distributors | 1.5% | 1.3% | |
Independent Power and Renewable Electricity Producers | 1.4% | 2.2% | |
Diversified Telecommunications Services | 1.4% | 1.6% | |
Technology Hardware, Storage & Peripherals | 1.3% | —% | |
Construction & Engineering | 1.2% | 0.6% | |
Building Products | 1.1% | 1.3% | |
Constructions Materials | 1.1% | 1.2% | |
Diversified Financial Services | 1.0% | —% | |
Electrical Equipment | 1.0% | 0.9% | |
Internet Software & Services | 1.0% | 0.9% | |
Pharmaceuticals | 0.8% | 1.0% | |
Metals & Mining | 0.8% | 2.5% | |
Other | 6.6% | 9.6% | |
Total | 100.0% | 100.0% | |
77
AMERICAN CAPITAL SENIOR FLOATING, LTD.
NOTES TO CONSOLIDATED FINANCIAL STATEMENTS (continued)
(in thousands, except share and per share amounts)
Note 7. Debt
Revolving Credit Facility
On October 15, 2013, we entered into a revolving credit facility with ACAM (the “ACAM Facility”) which provided up to $200,000 to finance eligible investments, working capital expenses and general corporate requirements (comprised of Loan A and Loan B). Under the ACAM Facility, we were able to draw up to $180,000 under Loan A and up to $20,000 under Loan B at any one time. Any amounts drawn on Loan A had a fixed interest rate of 4.75% per annum and any amounts drawn on Loan B had a fixed interest rate of 7.25% per annum, with all interest paid upon maturity of the ACAM Facility. The ACAM Facility matured on the closing date of our IPO. On January 22, 2014, we repaid the ACAM Facility in full plus accrued interest and terminated it. For the years ended December 31, 2015, 2014 and the period ended December 31, 2013, we incurred interest expense of $0, $568 and $943 on the ACAM Facility, respectively.
Secured Revolving Credit Facility
On October 29, 2015, ACSF Funding amended and restated its secured revolving credit facility with Bank of America, N.A. (as amended and restated, the “Credit Facility”) to extend the maturity date from December 18, 2015 to December 18, 2018, to decrease the commitment amount from $140,000 to $135,000 and eliminate the commitment fee rate when the facility is at least 90% utilized. ACSF Funding may make draws under the Credit Facility from time to time to purchase or acquire certain eligible assets. The Credit Facility is secured by ACSF Funding’s assets pursuant to a security agreement and contains customary financial and negative covenants and events of default. As of December 31, 2015 and 2014 , the fair value of the assets pledged as collateral in ACSF Funding were $187,895 and $220,421, respectively. The Credit Facility is non-recourse to ACSF. Amounts drawn under the Credit Facility bear interest at a rate per annum equal to either (a) LIBOR plus 1.80%, or (b) 0.80% plus the highest of (i) the Federal funds rate plus 0.50%, (ii) Bank of America, N.A.’s prime rate or (iii) one-month LIBOR plus 1%. ACSF Funding may borrow, prepay and reborrow loans under the Credit Facility at any time prior to November 18, 2018, the commitment termination date, subject to certain terms and conditions, including maintaining a borrowing base. Any outstanding balance on the Credit Facility as of the commitment termination date must be repaid by the maturity date unless otherwise extended. Following the amendment to the Credit Facility on October 29, 2015, if ACSF Funding terminates the commitment amount in whole or in part prior to December 18, 2017, ACSF Funding will be required to pay a make-whole fee equal to the sum of the present values of all future spread amounts that would have been payable in respect of the total commitments (or terminated portion thereof) during the period from the termination date through December 18, 2017.
ACSF Funding is required to pay a commitment fee in an amount equal to 0.75% on the actual daily unused amount of the current lender commitments under the Credit Facility to the extent the outstanding amount of committed loans is less than an amount equal to 90% of the aggregate commitments from October 29, 2015 to the commitment termination date, payable quarterly in arrears. Prior to the amendment to the Credit Facility, ACSF Funding was required to pay a commitment fee in an amount equal to 0.75% on the actual daily unused amount of the $140,000 of lender commitments from February 14, 2014 to October 29, 2015.
As of December 31, 2015, there was $110,200 outstanding under the Credit Facility which had a fair value of $110,200 and an interest rate of 2.02%. As of December 31, 2014, there was $130,000 outstanding under the Credit Facility which had a fair value of $130,000 and an interest rate of 1.96%. The fair value of the Credit Facility is determined in accordance with ASC 820, which defines fair value in terms of the price that would be paid to transfer a liability in an orderly transaction between market participants at the measurement date under current market conditions and is measured with Level 3 inputs. As of December 31, 2015, ACSF Funding was in compliance with all covenants of the Credit Facility, including compliance with a borrowing base that applies various advance rates of up to 80% on the assets pledged as collateral by ACSF Funding.
For the year ended December 31, 2015, we incurred interest expense and commitment fees of $2,517 and $112, respectively, on the Credit Facility. For the year ended December 31, 2014, we incurred interest expense and commitment fees of $2,433 and $54, respectively, on the Credit Facility.
Note 8. Taxes
Tax Sharing Agreement
For the period prior to our IPO, during which we were treated as a taxable corporation under Subchapter C of the Code (“C corporation”) for tax purposes, we had a tax sharing agreement with American Capital and other members of its consolidated tax group, under which such members bore their full share of their individual tax obligation and members were compensated for their losses and other tax benefits that were able to be used by other members of the consolidated tax group based on their pro-forma stand-alone federal income tax return. For the years ended December 31, 2015, 2014 and the period ended December 31, 2013, we recognized $(24), $279 and $803, respectively, of federal and state tax expense related to our operations prior to our IPO.
78
AMERICAN CAPITAL SENIOR FLOATING, LTD.
NOTES TO CONSOLIDATED FINANCIAL STATEMENTS (continued)
(in thousands, except share and per share amounts)
We have applied for retroactive relief under IRC Section 9100 to make a “deemed sale election” whereby we will treat our net unrealized gains (“Net Built-in Gain”) on the date of our IPO as recognized for tax purposes in our final pre-IPO C corporation federal tax return. We anticipate the IRS will grant this relief, and we have therefore treated the Net Built-in Gain on the date of our IPO as recognized for tax purposes in our final pre-IPO C corporation federal tax return. The federal estimated tax sharing payment that we owed to American Capital attributed to our Net Built-in Gain was $563. The entire amount was treated as a deemed capital contribution to us.
Income Taxes
We have elected to be treated as a RIC for income tax purposes beginning with the date of our IPO. In order to qualify as a RIC, among other things, we are required to distribute annually at least 90% of our ordinary income, including net short term gains in excess of net long term losses. So long as we qualify as a RIC, we are not subject to the entity level taxes on earnings timely distributed to our stockholders. We intend to make sufficient annual distributions to substantially eliminate our corporate level income taxes.
In order to qualify as a RIC for U.S. federal income tax purposes, we must meet certain annual distribution requirements, source of income tests and asset diversification rules. We were in compliance with the RIC requirements as of December 31, 2015.
As of December 31, 2015, we had approximately $6,358, or $0.64 per share, of estimated undistributed taxable income. We intend to distribute sufficient dividends, including dividends declared prior to the timely filing of our 2015 tax return and distributed by December 31, 2016, to eliminate our current year taxable income. As a result, no income tax provision has been provided in the financial statements other than the excise tax discussed below.
As a RIC, we are subject to a nondeductible U.S. federal excise tax of 4% on our undistributed “ordinary income” and “capital gain net income” (each as defined below) unless for each calendar year we distribute an amount equal to or greater than the sum of (a) 98% of our “ordinary income” (generally, our taxable income excluding net short-term and net long-term capital gains or losses for the calendar year), (b) 98.2% of our “capital gain net income” (including both net short-term and net long-term capital gains or losses) realized, subject to certain modifications, for the 12-month period ending October 31 of such calendar year, and (c) any income recognized, but not distributed, in the preceding years. For the year ended December 31, 2015 and 2014, we accrued federal excise tax of $240 and $80, respectively.
Income determined under GAAP differs from income determined under tax because of both temporary and permanent differences in income and expense recognition, including (i) unrealized gains and losses associated with debt investments marked to fair value for GAAP but excluded from taxable income until realized or settled, (ii) differences arising due to the taxation of CLO equity investments, (iii) premium amortization and gain adjustments attributed to built-in gain recognized prior to the date of IPO for tax purposes and (iv) capital losses in excess of capital gains earned in a tax year do not reduce current year taxable income, and generally will be carried forward to offset future capital gains.
GAAP/tax difference items that are permanent in nature are reclassified into paid-in capital. The following table provides the amount of reclassifications related to the permanent items for the tax year ended December 31, 2015 and 2014:
2015 | 2014 | ||||||
Increase in undistributed net investment income | $ | 356 | $ | 49 | |||
Decrease in accumulated net realized loss | (140 | ) | (1,549 | ) | |||
(Decrease) increase in paid-in capital | $ | (216 | ) | $ | 1,500 | ||
Under current law, net capital losses incurred by us during the current year and any future years can be carried forward indefinitely until they are utilized subject to certain loss limitation rules. As of December 31, 2015, we have estimated net short term and long term capital loss carry forwards of $370 and $473, respectively.
79
AMERICAN CAPITAL SENIOR FLOATING, LTD.
NOTES TO CONSOLIDATED FINANCIAL STATEMENTS (continued)
(in thousands, except share and per share amounts)
As of December 31, 2015 and 2014, the components of tax basis undistributed earnings were as follows:
2015 | 2014 | ||||||
Undistributed ordinary income | $ | 6,358 | $ | 1,997 | |||
Undistributed long-term capital gains | — | — | |||||
Capital loss carry forwards | (843 | ) | (689 | ) | |||
Net unrealized depreciation | (38,561 | ) | (8,273 | ) | |||
Other temporary differences | (29 | ) | (32 | ) | |||
Accumulated tax basis deficit | $ | (33,075 | ) | $ | (6,997 | ) | |
The unrealized appreciation (depreciation) on our investments in securities for federal income tax purposes as of December 31, 2015 and 2014 was as follows:
2015 | 2014 | ||||||
Gross unrealized appreciation | $ | 110 | $ | 182 | |||
Gross unrealized depreciation | (38,671 | ) | (8,455 | ) | |||
Tax basis net unrealized depreciation | $ | (38,561 | ) | $ | (8,273 | ) | |
Tax basis of investments | $ | 267,617 | $ | 284,643 | |||
The tax character of distributions paid during the year ended December 31, 2015 and 2014 was as follows:
2015 | 2014 | ||||||
Ordinary income | $ | 11,630 | $ | 10,300 | |||
Long-term capital gains | $ | — | $ | — | |||
Return of capital | $ | — | $ | — | |||
We identify our major tax jurisdictions as federal and Maryland. During the period in which we were taxable as a C corporation, we were part of American Capital’s federal consolidated tax group, including its federal tax fiscal year ending September 30, 2015, which remains subject to examination by the Internal Revenue Service (“IRS”).
ACSF Funding is a wholly-owned limited liability company and is treated as a disregarded entity for federal income tax purposes.
We recognize tax benefits of uncertain tax positions only when the position is more likely than not to be sustained assuming examination by tax authorities. We have analyzed our tax positions and have concluded that no liability for unrecognized tax benefits should be recorded related to uncertain tax positions taken on returns filed for open tax years or expected to be taken in our current year tax returns. We are not aware of any tax positions for which it is reasonably possible that the total amounts of unrecognized tax benefits will change materially in the next twelve months.
80
AMERICAN CAPITAL SENIOR FLOATING, LTD.
NOTES TO CONSOLIDATED FINANCIAL STATEMENTS (continued)
(in thousands, except share and per share amounts)
Note 9. Consolidated Financial Highlights
Year Ended December 31, | |||||||
2015 | 2014 | ||||||
Per Share Data (1): | |||||||
Net asset value, beginning of period (2) | $ | 14.42 | $ | 15.00 | |||
Net investment income | 1.27 | 1.09 | |||||
Net loss on investments | (2.74 | ) | (0.71 | ) | |||
Net (Loss) Earnings | (1.47 | ) | 0.38 | ||||
Capital contribution (3) | — | 0.06 | |||||
Accretion (4) | — | 0.09 | |||||
Offering costs related to public offering | — | (0.08 | ) | ||||
Distributions to stockholders | (1.16 | ) | (1.03 | ) | |||
Net asset value, end of period | $ | 11.79 | $ | 14.42 | |||
Per share market value, end of period | $ | 9.83 | $ | 12.11 | |||
Total return based on market value (5) | (10.75 | )% | (12.90 | )% | |||
Total return based on net asset value (5) | (10.10 | )% | 3.73 | % | |||
Ratios to Average Net Assets: | |||||||
Net investment income | 9.05 | % | 7.54 | % | |||
Operating expenses (6) | 2.40 | % | 2.30 | % | |||
Interest and related expenses | 2.12 | % | 2.39 | % | |||
Total expenses (6) | 4.52 | % | 4.69 | % | |||
Supplemental Data: | |||||||
Net assets, end of period | $ | 117,929 | $ | 144,235 | |||
Shares outstanding, end of period | 10,000,100 | 10,000,100 | |||||
Average debt outstanding | $ | 124,434 | $ | 130,984 | |||
Asset coverage per unit, end of period (7) | $ | 2,071 | $ | 2,109 | |||
Portfolio turnover ratio | 40.67 | % | 53.80 | % | |||
(1) | Per share data for the year ended December 31, 2014 presumes the issuance of 10 million shares of common stock on January 1, 2014 that were issued in the IPO which closed on January 22, 2014. There was no established public trading market for the stock prior to the pricing of the IPO. |
(2) | The IPO price of $15.00 per share was used as the net asset value, beginning of period for the year ended December 31, 2014. |
(3) | Capital contribution from our Manager for $574 of federal taxes due on the Net Built-in Gain on investments as a result of tax conversion to a RIC at the time of the IPO was treated as a deemed contribution for the year ended December 31, 2014 and $(11), which rounds to zero, was treated as a deemed distribution for the year ended December 31, 2015. |
(4) | The IPO issuance price of $15.00 per share was below the net asset value per share as of January 22, 2014. The amount reflects the immediate benefit to common stockholders at the time of the IPO for results of operations in 2013. |
(5) | Total return is based on the change in market price or net asset value per share and takes into account distributions reinvested in accordance with the dividend reinvestment and stock purchase plan. The IPO price of $15.00 per share was used as the starting value for the total return for the year ended December 31, 2014. |
(6) | The ratio of operating expenses to average net assets and the ratio of total expenses to average net assets are shown net of the reimbursement for the Expense Cap. The ratio of operating expenses to average net assets and the ratio of total expenses to average net assets would be 3.04% and 5.16%, respectively, prior to the Expense Cap for the year ended December 31, 2015. The ratio of operating expenses to average net assets and the ratio of total expenses to average net assets would be 2.99% and 5.38%, respectively, prior to the Expense Cap for the year ended December 31, 2014. |
(7) | The asset coverage ratio for a class of senior securities representing indebtedness is calculated on our consolidated total assets, less all liabilities and indebtedness not represented by senior securities, divided by the senior securities representing indebtedness. This asset coverage ratio is multiplied by $1,000 to determine the asset coverage per unit. |
The following is a schedule of financial highlights for the period from October 15, 2013 (commencement of operations) to December 31, 2013:
Total return (1) | 101,530 | % |
Net investment income to average net assets (2) | 209 | % |
Expenses to average net assets (2) | 745 | % |
(1) | Total return is not annualized. |
(2) | Recurring income and expense items are annualized, one-time expenses such as organizational costs are not annualized. |
81
AMERICAN CAPITAL SENIOR FLOATING, LTD.
NOTES TO CONSOLIDATED FINANCIAL STATEMENTS (continued)
(in thousands, except share and per share amounts)
Note 10. Capital Transactions
The following table details the common share transactions that occurred during the years ended December 31, 2015 and 2014:
2015 | 2014 | ||||||||||||
Shares | Amount (1) | Shares | Amount | ||||||||||
Common shares outstanding - beginning of period | 10,000,100 | $ | 151,231 | 100 | $ | 1 | |||||||
Common shares issued in connection with initial public offering | — | — | 10,000,000 | 150,000 | |||||||||
Offering costs | — | — | — | (844 | ) | ||||||||
(Distribution) Contribution for taxes waived | — | (11 | ) | — | 574 | ||||||||
Permanent differences reclassified (see Note 8) | — | 11 | — | 1,500 | |||||||||
Common shares outstanding - end of period | 10,000,100 | $ | 151,231 | 10,000,100 | $ | 151,231 | |||||||
(1) | Includes amount reflected in common stock, par value and paid-in capital in excess of par. |
Offering costs associated with the IPO totaled $844 and were recorded as a reduction of the proceeds from the sale of common shares. In connection with the IPO, the underwriters received an underwriting discount and commission (sales load) of $7,952 that was paid by our Manager.
The table below details the distributions to stockholders declared on our shares of common stock since the completion of our IPO:
Quarterly Declaration Date | Ex-Dividend Date | Record Date | Payment Date | Per Share Amount | Total Amount | |
March 17, 2014 | March 27, 2014 | March 31, 2014 | April 10, 2014 | $0.18 | $1,800 | |
June 18, 2014 | June 26, 2014 | June 30, 2014 | July 10, 2014 | $0.28 | $2,800 | |
September 17, 2014 | September 26, 2014 | September 30, 2014 | October 10, 2014 | $0.28 | $2,800 | |
December 18, 2014 | December 29, 2014 | December 31, 2014 | January 9, 2015 | $0.29 | $2,900 | |
March 19, 2015 | March 27, 2015 | March 31, 2015 | April 6, 2015 | $0.29 | $2,900 | |
Monthly Declaration Date | Ex-Dividend Date | Record Date | Payment Date | Per Share Amount | Total Amount | |
March 19, 2015 | April 17, 2015 | April 21, 2015 | May 4, 2015 | $0.097 | $970 | |
May 4, 2015 | May 20, 2015 | May 22, 2015 | June 2, 2015 | $0.097 | $970 | |
May 4, 2015 | June 17, 2015 | June 19, 2015 | July 2, 2015 | $0.097 | $970 | |
May 4, 2015 | July 22, 2015 | July 24, 2015 | August 4, 2015 | $0.097 | $970 | |
August 3, 2015 | August 19, 2015 | August 21, 2015 | September 2, 2015 | $0.097 | $970 | |
August 3, 2015 | September 18, 2015 | September 22, 2015 | October 2, 2015 | $0.097 | $970 | |
August 3, 2015 | October 21, 2015 | October 23, 2015 | November 3, 2015 | $0.097 | $970 | |
November 2, 2015 | November 18, 2015 | November 20, 2015 | December 2, 2015 | $0.097 | $970 | |
November 2, 2015 | December 22, 2015 | December 24, 2015 | January 5, 2016 | $0.097 | $970 | |
November 2, 2015 | January 20, 2016 | January 22, 2016 | February 2, 2016 | $0.097 | $970 | |
February 8, 2016 | February 17, 2016 | February 19, 2016 | March 2, 2016 | $0.097 | $970 | |
February 8, 2016 | March 21, 2016 | March 23, 2016 | April 4, 2016 | $0.097 | $970 | |
February 8, 2016 | April 19, 2016 | April 21, 2016 | May 3, 2016 | $0.097 | $970 | |
Inception to Date Total | $2.581 | $25,810 | ||||
Note 11. Commitments and Contingencies
In the ordinary course of business, we may be a party to certain legal proceedings, including actions brought against us and others with respect to investment transactions. The outcomes of any such legal proceedings are uncertain and, as a result of
82
AMERICAN CAPITAL SENIOR FLOATING, LTD.
NOTES TO CONSOLIDATED FINANCIAL STATEMENTS (continued)
(in thousands, except share and per share amounts)
these proceedings, the values of the investments to which they relate could decrease. We were not subject to any material litigation against us as of December 31, 2015and 2014.
We did not engage in any off-balance sheet activities as of December 31, 2015 and 2014.
Note 12. Selected Quarterly Data (unaudited)
Quarter Ended | Investment Income | Net Investment Income | Net Gain (Loss) on Investments | Earnings (Loss) | ||||||||||||||||||||||||||||
Total | Per Share | Total | Per Share | Total | Per Share | Total | Per Share | |||||||||||||||||||||||||
December 31, 2015 | $ | 4,637 | $ | 0.46 | $ | 3,066 | $ | 0.31 | $ | (17,483 | ) | $ | (1.75 | ) | $ | (14,417 | ) | $ | (1.44 | ) | ||||||||||||
September 30, 2015 | $ | 4,987 | $ | 0.50 | $ | 3,344 | $ | 0.33 | $ | (10,542 | ) | $ | (1.05 | ) | $ | (7,198 | ) | $ | (0.72 | ) | ||||||||||||
June 30, 2015 | $ | 4,880 | $ | 0.49 | $ | 3,220 | $ | 0.32 | $ | (61 | ) | $ | (0.01 | ) | $ | 3,159 | $ | 0.31 | ||||||||||||||
March 31, 2015 | $ | 4,741 | $ | 0.47 | $ | 3,060 | $ | 0.31 | $ | 731 | $ | 0.07 | $ | 3,791 | $ | 0.38 | ||||||||||||||||
December 31, 2014 | $ | 4,832 | $ | 0.48 | $ | 3,112 | $ | 0.31 | $ | (4,538 | ) | $ | (0.45 | ) | $ | (1,426 | ) | $ | (0.14 | ) | ||||||||||||
September 30, 2014 | $ | 4,554 | $ | 0.46 | $ | 2,893 | $ | 0.29 | $ | (2,647 | ) | $ | (0.26 | ) | $ | 246 | $ | 0.02 | ||||||||||||||
June 30, 2014 | $ | 4,590 | $ | 0.46 | $ | 2,927 | $ | 0.29 | $ | (78 | ) | $ | (0.01 | ) | $ | 2,849 | $ | 0.28 | ||||||||||||||
March 31, 2014 | $ | 3,797 | $ | 0.38 | $ | 1,927 | $ | 0.19 | $ | 193 | $ | 0.02 | $ | 2,120 | $ | 0.21 | ||||||||||||||||
December 31, 2013* | $ | 1,572 | n/a | $ | 246 | n/a | $ | 769 | n/a | $ | 1,016 | n/a | ||||||||||||||||||||
* | For the period October 15, 2013 (commencement of operations) to December 31, 2013 |
Note 13. Subsequent Event
On February 8, 2016, we declared a monthly cash distribution to stockholders of $0.097 per share for each of February, March and April 2016, respectively. The monthly cash distributions will be paid to common stockholders of record as set forth in the table below:
Distribution per Share | Record Date | Ex-Dividend Date | Payment Date | |||||
February 2016 | $0.097 | February 19, 2016 | February 17, 2016 | March 2, 2016 | ||||
March 2016 | $0.097 | March 23, 2016 | March 21, 2016 | April 4, 2016 | ||||
April 2016 | $0.097 | April 21, 2016 | April 19, 2016 | May 3, 2016 | ||||
83
Item 9. Changes in and Disagreements With Accountants on Accounting and Financial Disclosure
None.
Item 9A. Controls and Procedures
Evaluation of Disclosure Controls and Procedures
As of December 31, 2015, we, including our Chief Executive Officer and Chief Financial Officer, evaluated the effectiveness of the design and operation of our disclosure controls and procedures (as defined in Rule 13a-15(e) of the Securities Exchange Act of 1934, as amended (the “Exchange Act”). Based on that evaluation, our management, including the Chief Executive Officer and Chief Financial Officer, concluded that our disclosure controls and procedures were effective and provided reasonable assurance that information required to be disclosed in our periodic SEC filings is recorded, processed, summarized and reported within the time periods specified in the SEC’s rules and forms, and that such information is accumulated and communicated to our management, including our Chief Executive Officer and Chief Financial Officer, as appropriate, to allow timely decisions regarding required disclosure. However, in evaluating the disclosure controls and procedures, management recognized that any controls and procedures, no matter how well designed and operated can provide only reasonable assurance of achieving the desired control objectives, and management necessarily was required to apply its judgment in evaluating the cost-benefit relationship of such possible controls and procedures.
Management's Report on Internal Control over Financial Reporting
Management's Report on Internal Control over Financial Reporting is included in “Item 8.—Financial Statements and Supplementary Data.”
Attestation Report of Registered Public Accounting Firm
This Annual Report on Form 10-K does not include an attestation report of a registered public accounting firm regarding internal control over financial reporting due to an exemption established by the JOBS Act for “emerging growth companies”.
Changes in Internal Control over Financial Reporting
There have been no changes in our “internal control over financial reporting” (as defined in Rule 13a-15(f) of the Exchange Act) that occurred during our fiscal year ended December 31, 2015 that have materially affected, or are reasonably likely to materially affect, our internal control over financial reporting.
Item 9B. Other Information
None.
PART III.
Item 10. Directors, Executive Officers and Corporate Governance
The information required by Item 10 is hereby incorporated by reference to the information provided in our Proxy Statement for our 2016 Annual Meeting of Stockholders (the “2016 Proxy Statement”), to be filed with the Securities and Exchange Commission within 120 days following the end of our fiscal year, under the headings “PROPOSAL 1: ELECTION OF DIRECTORS”, “BOARD AND GOVERNANCE MATTERS”, “EXECUTIVE OFFICERS”, “SECTION 16(a) BENEFICIAL OWNERSHIP REPORTING COMPLIANCE” and “CERTAIN TRANSACTIONS WITH RELATED PERSONS.”
Item 11. Executive Compensation
The information required by Item 11 is hereby incorporated by reference to the information provided in the 2016 Proxy Statement, to be filed with the Securities and Exchange Commission within 120 days following the end of our fiscal year, under the headings “PROPOSAL 1: ELECTION OF DIRECTORS”, “EXECUTIVE COMPENSATION”, “COMPENSATION DISCUSSION AND ANALYSIS”, “REPORT OF THE COMPENSATION AND GOVERNANCE COMMITTEE” AND “COMPENSATION, CORPORATE GOVERNANCE AND NOMINATING COMMITTEE INTERLOCKS AND INSIDER PARTICIPATION.”
84
Item 12. Security Ownership of Certain Beneficial Owners and Management and Related Stockholder Matters
The information required by Item 12 is hereby incorporated by reference to the information provided in the 2016 Proxy Statement, to be filed with the Securities and Exchange Commission within 120 days following the end of our fiscal year, under the heading “SECURITY OWNERSHIP OF MANAGEMENT AND CERTAIN BENEFICIAL OWNERS.”
Item 13. Certain Relationships and Related Transactions, and Director Independence
The information required by Item 13 is hereby incorporated by reference to the information provided in the 2016 Proxy Statement, to be filed with the Securities and Exchange Commission within 120 days following the end of our fiscal year, under the headings “CERTAIN TRANSACTIONS WITH RELATED PERSONS” and “PROPOSAL 1: ELECTION OF DIRECTORS.”
Item 14. Principal Accounting Fees and Services
The information required by Item 14 is hereby incorporated by reference to the information provided in the 2016 Proxy Statement, to be filed with the Securities and Exchange Commission within 120 days following the end of our fiscal year, under the heading “PROPOSAL 3: RATIFICATION OF APPOINTMENT OF INDEPENDENT PUBLIC ACCOUNTANT.”
85
PART IV.
Item 15. Exhibits, Financial Statement Schedules
(a) The following documents are filed as part of this report:
(1) The following reports and consolidated financial statements are set forth in Item 8:
(2) Financial Statement Schedules
None
(3) Exhibits
The following exhibits are filed as part of this report or hereby incorporated by reference to exhibits previously filed with the SEC:
Exhibit Number | Description | |
*3.1 | American Capital Senior Floating, Ltd. Articles of Amendment and Restatement, incorporated herein by reference to Exhibit 3.1 of Form 10-Q for the quarter ended March 31, 2014 (File No. 814-01025), filed May 15, 2014. | |
*3.2 | American Capital Senior Floating, Ltd. Amended and Restated Bylaws, incorporated herein by reference to Exhibit 3.2 of Form 10-Q for the quarter ended March 31, 2014 (File No. 814-01025), filed May 15, 2014. | |
*4.1 | Instruments defining the rights of holders of securities: See Article VI of our Articles of Amendment and Restatement, incorporated herein by reference to Exhibit 3.1 of Form 10-Q for the quarter ended March 31, 2014 (File No. 814-01025), filed May 15, 2014. | |
*4.2 | Instruments defining the rights of holders of securities: See Article VII of our Amended and Restated Bylaws, incorporated herein by reference to Exhibit 3.2 of Form 10-Q for the quarter ended March 31, 2014 (File No. 814-01025), filed May 15, 2014. | |
*4.3 | Form of Certificate of Common Stock, incorporated herein by reference to Exhibit 2.d.3 of Amendment No. 1 to Form N-2 (Registration Statement No. 333-190357), filed December 20, 2013. | |
*10.1 | Management Agreement, dated as of January 15, 2014, between American Capital Senior Floating, Ltd. and American Capital ACSF Management, LLC, incorporated herein by reference to Exhibit 10.1 of Form 10-Q for the quarter ended March 30, 2014 (File No. 814-01025), filed May 15, 2014. | |
*10.2 | Investment Advisory Agreement, dated as of December 18, 2013, between ACSF Funding I, LLC and American Capital ACSF Management, LLC, incorporated herein by reference to Exhibit 2.g.2 of Amendment No. 1 to Form N-2 (Registration Statement No. 333-190357), filed December 20, 2013. | |
*10.3 | Amended and Restated Credit Agreement, dated as of October 29, 2015, among ACSF Funding I, LLC, the lenders party thereto and Bank of America, N.A., as administrative agent, incorporated herein by reference to Exhibit 2.k.2 of Amendment No. 2 to Form N-2 (Registration Statement No. 333-205463), filed November 3, 2015. | |
86
*10.4 | Security Agreement, dated as of December 18, 2013, between ACSF Funding I, LLC and Bank of America, N.A., as administrative agent, incorporated herein by reference to Exhibit 2.k.4 of Amendment No. 1 to Form N-2 (Registration Statement No. 333-190357), filed December 20, 2013 | |
*10.5 | Custodian Agreement, dated as of November 13, 2013, between American Capital Senior Floating, Ltd. and Deutsche Bank Trust Company Americas, incorporated herein by reference to Exhibit 2.j to Amendment No. 1 to Form N-2 (Registration Statement No. 333-190357), filed December 20, 2013. | |
12 | Computation of Earnings to Fixed Charges, filed herewith | |
*14 | American Capital Senior Floating, Ltd. Code of Ethics and Conduct, adopted January 14, 2014, incorporated herein by reference to Exhibit 2.r of Amendment No. 1 to Form N-2 (Registration Statement No. 333-190357), filed December 20, 2013. | |
21 | Subsidiaries of the Company and jurisdiction of incorporation: 1) ACSF Funding I, LLC, a Delaware limited liability company | |
24 | Powers of Attorney of directors and officers. | |
31.1 | Certification of CEO Pursuant to Section 302 of the Sarbanes-Oxley Act of 2002. | |
31.2 | Certification of CFO Pursuant to Section 302 of the Sarbanes-Oxley Act of 2002. | |
32 | Certification of CEO and CFO Pursuant to 18 U.S.C. Section 1350, as adopted pursuant to Section 906 of the Sarbanes-Oxley Act of 2002. | |
* Previously filed | ||
(b) Exhibits
See the exhibits filed herewith.
(c) Additional financial statement schedules
None
87
SIGNATURES
Pursuant to the requirements of the Securities Exchange Act of 1934, the registrant has duly caused this report to be signed on its behalf by the undersigned thereunto duly authorized.
AMERICAN CAPITAL SENIOR FLOATING, LTD. | ||||
Date: | March 15, 2016 | By: | /s/ John R. Erickson | |
John R. Erickson Executive Vice President and Chief Financial Officer | ||||
Pursuant to the requirements of the Securities Exchange Act of 1934, this report has been signed below by the following persons on behalf of the registrant and in the capacities and on the dates indicated.
Signature | Title | Date | ||
/s/ Malon Wilkus | Director, Chair of the Board and Chief Executive Officer (Principal Executive Officer) | March 15, 2016 | ||
Malon Wilkus | ||||
/s/ John R. Erickson | Executive Vice President and Chief Financial Officer (Principal Financial and Accounting Officer) | March 15, 2016 | ||
John R. Erickson | ||||
* | Director | March 15, 2016 | ||
Phyllis R. Caldwell | ||||
* | Director | March 15, 2016 | ||
Gil Crawford | ||||
* | Director | March 15, 2016 | ||
Larry K. Harvey | ||||
* | Director | March 15, 2016 | ||
Stan Lundine | ||||
* By: /s/ John R. Erickson | ||||
John R. Erickson | ||||
Attorney-in-fact | ||||
88