Attached files
| file | filename |
|---|---|
| EX-32 - EX-32 - PACIFIC CONTINENTAL CORP | d88087dex32.htm |
| EX-23.1 - EX-23.1 - PACIFIC CONTINENTAL CORP | d88087dex231.htm |
| EX-31.1 - EX-31.1 - PACIFIC CONTINENTAL CORP | d88087dex311.htm |
| EX-31.2 - EX-31.2 - PACIFIC CONTINENTAL CORP | d88087dex312.htm |
Table of Contents
UNITED STATES
SECURITIES AND EXCHANGE COMMISSION
Washington, D.C. 20549
FORM 10-K
(Mark one)
| x | ANNUAL REPORT PURSUANT TO SECTION 13 OR 15(d) OF THE SECURITIES EXCHANGE ACT OF 1934 |
FOR THE FISCAL YEAR ENDED DECEMBER 31, 2015
| ¨ | TRANSITION REPORT PURSUANT TO SECTION 13 OR 15(d) OF THE SECURITIES EXCHANGE ACT OF 1934 |
FOR THE TRANSITION PERIOD FROM TO
COMMISSION FILE NUMBER 0-30106
PACIFIC CONTINENTAL CORPORATION
(Exact name of registrant as specified in its charter)
| OREGON | 93-1269184 | |
| (State or Other Jurisdiction of Incorporation or Organization) |
(IRS Employer Identification No) | |
| 111 West 7th Avenue Eugene, Oregon |
97401 | |
| (Address of principal executive offices) | (zip code) | |
(541) 686-8685
(Registrant’s telephone number, including area code)
Securities registered pursuant to section 12(b) of the Act:
| Title of Each Class |
Name of Each Exchange on Which Registered | |
| Common Stock, No par value per share | NASDAQ Global Select Market |
Securities registered pursuant to section 12(g) of the Act:
None
Indicate by check mark if the registrant is a well-known seasoned issuer, as defined in Rule 405 of the Securities
Act. Yes ¨ No x
Indicate by check mark if the registrant is not required to file reports pursuant to Section 13 or Section 15(d) of the Act. Yes ¨ No x
Indicate by check mark whether the registrant (1) has filed all reports required to be filed by Section 13 or 15(d) of the Securities Exchange Act of 1934 during the preceding 12 months (or for such shorter period that the registrant was required to file such reports), and (2) has been subject to such filing requirements for the past 90 days. Yes x No ¨
Indicate by check mark whether the registrant has submitted electronically and posted on its corporate website, if any, every Interactive Data File required to be submitted and posted pursuant to Rule 405 of Regulation S-T (§232.405 of this chapter) during the preceding 12 months (or for such shorter period that the registrant was required to submit and post such files).
Yes x No ¨
Indicate by check mark if disclosure of delinquent filers pursuant to Item 405 of Regulation S-K is not contained herein, and will not be contained, to the best of the registrant’s knowledge, in definitive proxy or information statements incorporated by reference in Part III of this Form 10-K or any amendment to this Form 10-K. x
Indicate by check mark whether the registrant is a large accelerated filer, an accelerated filer, a non-accelerated filer, or a smaller reporting company. See the definitions of “large accelerated filer,” “accelerated filer,” and “smaller reporting company” in Rule 12b-2 of the Exchange Act. (check one)
| Large accelerated filer | ¨ | Accelerated filer | x | |||
| Non-accelerated filer | ¨ | Smaller Reporting Company | ¨ | |||
Indicate by check mark whether the registrant is a shell company (as defined in Rule 12b-2 of the Exchange Act). Yes ¨ No x
The aggregate market value of the voting and non-voting common equity held by non-affiliates of the registrant at June 30, 2015 (the last business day of the most recently completed second quarter) was $253,177,730 based on the closing price as quoted on the NASDAQ Global Select Market on that date.
The number of shares outstanding of the registrant’s common stock, no par value, as of February 29, 2016, was 19,604,780.
DOCUMENTS INCORPORATED BY REFERENCE
All or a portion of Items 10 through 14 in Part III of this Form 10-K are incorporated by reference to the Registrant’s definitive proxy statement on Schedule 14A, which will be filed within 120 days after the close of the fiscal year covered by this report on Form 10-K, or if the Registrant’s Schedule 14A is not filed within such period, will be included in an amendment to this Report on Form 10-K which will be filed within such 120-day period.
Table of Contents
PACIFIC CONTINENTAL CORPORATION
FORM 10-K
ANNUAL REPORT
2
Table of Contents
| ITEM 1 | Business |
In addition to historical information, this report contains forward-looking statements within the meaning of the Private Securities Litigation Reform Act of 1995. These forward-looking statements include, but are not limited to, statements regarding projected results for 2016, factors that could impact the Company’s financial results, the expected interest rate environment, 2016 provision for loan losses and the adequacy of the allowance, the possibility of valuation write-downs on OREO, portfolio structuring, loan origination standards, liquidity and funding, large depositor relationships, management’s plans, objectives, expectations and intentions that are not historical facts, and other statements identified by words such as “expects,” “anticipates,” “intends,” “plans,” “believes,” “should,” “projects,” “seeks,” “estimates” or words of similar meaning. These forward-looking statements are based on current beliefs and expectations of management and are inherently subject to significant business, economic and competitive uncertainties and contingencies, many of which are beyond the Company’s control. In addition, these forward-looking statements are subject to assumptions with respect to future business strategies and decisions that are subject to change. The following factors, among others, could cause actual results to differ materially from the anticipated results or other expectations in the forward-looking statements, including those set forth in this report, or the documents incorporated by reference:
| • | Local and national economic conditions could be less favorable than expected or could have a more direct and pronounced effect on us than expected and adversely affect our ability to continue internal growth at historical rates and maintain the quality of our earning assets. |
| • | The local housing or real estate market could decline. |
| • | The risks presented by an economic recession, which could adversely affect credit quality, collateral values, including real estate collateral, investment values, liquidity and loan originations, and loan portfolio delinquency rates. |
| • | Our concentration in loans to dental professionals exposes us to the risks affecting dental practices in general. |
| • | Interest rate changes could significantly reduce net interest income and negatively affect funding sources. |
| • | Projected business increases following any future strategic expansion or opening of new branches could be lower than expected. |
| • | Competition among financial institutions could increase significantly. |
| • | The goodwill we have recorded in connection with acquisitions could become impaired, which may have an adverse impact on our earnings. |
| • | The reputation of the financial services industry could deteriorate, which could adversely affect our ability to access markets for funding and to acquire and retain customers. |
| • | The efficiencies we may expect to receive from any investments in personnel, acquisitions, and infrastructure may not be realized. |
| • | The level of nonperforming assets and charge-offs or changes in the estimates of future reserve requirements based upon the periodic review thereof under relevant regulatory and accounting requirements may increase. |
| • | Changes in laws and regulations (including laws and regulations concerning taxes, banking, securities, executive compensation, and insurance) could have a material adverse effect on our business, financial condition and results of operations. |
| • | Acts of war or terrorism, or natural disasters, may adversely impact our business. |
| • | The timely development and acceptance of new banking products and services and perceived overall value of these products and services by users may adversely impact our ability to increase market share and control expenses. |
| • | Changes in accounting policies and practices, as may be adopted by the regulatory agencies, as well as the Public Company Accounting Oversight Board, the Financial Accounting Standards Board and other accounting standard setters, may impact the results of our operations. |
| • | The costs and effects of legal, regulatory and compliance developments, including the resolution of legal proceedings or regulatory or other governmental inquiries and the results of regulatory examinations or reviews, may adversely impact our ability to increase market share and control expense and my adversely affect our results of operations and future prospects. |
| • | Our success at managing the risks involved in the foregoing items will have a significant impact on our results of operations and future prospects. |
3
Table of Contents
Additional factors that could cause actual results to differ materially from those expressed in any forward-looking statements are discussed in Risk Factors in this Form 10-K. Please take into account that forward-looking statements speak only as of the date of this report or documents incorporated by reference. The Company does not undertake any obligation to publicly correct or update any forward-looking statement whether as a result of new information, future events or otherwise.
General
Pacific Continental Corporation (the “Company” or the “Registrant”) is an Oregon corporation and registered bank holding company headquartered in Eugene, Oregon. The Company was organized on June 7, 1999, pursuant to a holding company reorganization of Pacific Continental Bank, its wholly owned subsidiary (the “Bank”).
The Company’s principal business activities are conducted through the Bank, an Oregon state-chartered bank with deposits insured by the Federal Deposit Insurance Corporation (the “FDIC”). The Bank has no active subsidiaries.
Results and Financial Data
All dollar amounts in the following sections are in thousands except per share amounts or where otherwise indicated.
For the year ended December 31, 2015, the consolidated net income of the Company was $18,751 or $0.97 per diluted share. At December 31, 2015, the consolidated shareholders’ equity of the Company was $218,491 with 19,604,182 shares outstanding and a book value of $11.15 per share. Total assets were $1,909,478 at December 31, 2015. Loans net of allowance for loan losses and unearned fees were $1,387,181 at December 31, 2015, and represented 73.55% of total assets. Deposits totaled $1,597,093 at year-end 2015, with Company-defined core deposits representing $1,533,942, or 96.05% of total deposits. Core deposits are defined as all demand, interest checking, money market, savings and local non-public time deposits, including local non-public time deposits in excess of $100. At December 31, 2015, the Company had a Tier 1 leverage capital ratio, Common Equity Tier 1 risk-based capital ratio, Tier 1 risk-based capital ratio, and total risk-based capital ratio, of 9.93%, 10.97%, 11.47%, and 12.58%, respectively, all of which exceeded the minimum “well-capitalized” level for all capital ratios under FDIC guidelines of 5.00%, 6.50%, 8.00% and 10.00%, respectively.
On March 6, 2015, the Company completed the acquisition of Capital Pacific Bancorp. Capital Pacific shareholders received either $16.00 per share in cash or 1.132 shares of Pacific Continental common stock for each share of Capital Pacific common stock, or a combination of 40% in the form of cash and 60% in the form of Pacific Continental common stock. Pursuant to the merger agreement, total consideration included cash consideration of $16,413, and stock consideration of 1,778,102 shares of Pacific Continental common stock. Based on the closing price of Pacific Continental common stock on March 6, 2015, the aggregate consideration payable for Capital Pacific Bancorp was valued at $39,990.
For more information regarding the Company’s financial condition and results of operations, see Management’s Discussion and Analysis of Financial Condition and Results of Operations and Financial Statements and Supplementary Data in Items 7 and 8 of Part II of this Form 10-K.
THE BANK
General
The Bank commenced operations on August 15, 1972. The Bank operates in three primary markets: Eugene, Oregon, Portland, Oregon / Southwest Washington and Seattle, Washington. At December 31, 2015, the Bank operated fifteen full-service offices in Oregon and Washington and three loan production offices in Washington, Colorado, and California. The primary business strategy of the Bank is to operate in large commercial markets and to provide comprehensive banking and related services tailored to community-based businesses, nonprofit organizations, professional service providers, and banking services for business owners. The Bank emphasizes the diversity of its product lines, high levels of personal service and convenient access through technology typically associated with larger financial institutions, while maintaining local decision-making authority and market knowledge, typical of a community bank. The Bank has developed expertise in lending to dental professionals, and during 2015 continued to expand its national dental lending program. More information on the Bank and its banking services can be found on its website (therightbank.com). Information contained on the Bank’s website is not part of this Form 10-K. The Company’s Annual Reports on Form 10-K, Quarterly Reports on Form 10-Q, Current Reports on Form 8-K and any amendments to these reports filed or furnished pursuant to Section 13(a) or 15(d) of the Securities Exchange Act of 1934 are available free of charge upon request on the Bank’s website. The reports are also available on the SEC’s website at www.sec.gov. The Bank operates under the banking laws of the State of Oregon, and the rules and regulations of the FDIC. In addition, operations at its branches and other offices in the State of Washington, Colorado, and California are subject to various consumer protection and other laws of that state.
4
Table of Contents
THE COMPANY
Primary Market Area
The Company’s primary markets consist of metropolitan Eugene, metropolitan Portland, in the State of Oregon and metropolitan Seattle in the State of Washington. During 2015, the Company expanded its lending to dental professionals, and at year-end had loans to dental professionals in 39 states, up from 35 states in 2014. The Company has six full-service banking offices in the metropolitan Portland and Southwest Washington area, seven full-service banking offices in the metropolitan Eugene area, and two full-service offices in the metropolitan Seattle area. It also operates loan production offices in Tacoma, Washington, Denver, Colorado and San Francisco Bay Area, California. The Company has its headquarters and administrative office in Eugene, Oregon.
Overall, national economic conditions improved during 2015 as evidenced by the increased loan demand in all three of the Company’s primary markets. In particular, larger metropolitan areas, such as Portland and Seattle, experienced higher improvement in general economic conditions and job growth than rural areas of Oregon and Washington. As is typical, the economic conditions in the Eugene market improved, but not at the levels realized in Portland and Seattle.
On a monthly basis, the University of Oregon, located in Eugene, Oregon, produces the Oregon Index of Economic Indicators using the year 1997 as its beginning base of 100. This index attempts to measure various components of the State of Oregon economy, including labor markets, capital goods orders, and consumer confidence, in order to determine if economic conditions in the state are improving or deteriorating, and provides the probability of a recession. This index indicated that economic activity for the State of Oregon fell to its lowest level during the first quarter 2009 when the index reached 85.0 and then generally trended upward. During 2015, the index continued upward on a quarterly basis, and for December 2015 was at 100%, an improvement of 1.50% over the prior year-end.
The unemployment rate for the State of Oregon at December 31, 2015, was 5.40%, as compared to 5.00% nationally, and has been improving since early 2009. Portland area unemployment stood at 4.90%, for this same time period, below the state average and national average. For Lane County, Oregon, which includes Eugene, Oregon, the unemployment rate was 5.60%, above both the state and national average at December 31, 2015. The unemployment rate for the State of Washington at December 31, 2015, was 5.50%, above the national average, and has trended downward on a quarterly basis since early 2009. In King County, Washington, which includes the metropolitan Seattle area, the unemployment rate at year-end 2015 was 4.50%, below the state and national averages. The Seattle market in particular has demonstrated more economic diversity than the other primary markets in which the Company operates. All unemployment rates were provided by the U.S. Bureau of Labor Statistics.
At December 31, 2015, approximately 64% of the Company’s loan portfolio was secured by real estate, thus the condition and valuation trends of commercial and residential real estate markets in the Pacific Northwest have had a significant impact on the overall credit quality of the Company’s primary assets in that, in the event of default, the value of real estate collateral and its salability is typically the primary source of repayment. Approximately $108,368, or 8% of the Company’s loan portfolio, was categorized as residential and commercial construction loans, which also included land development and acquisition loans at December 31, 2015. During 2015, the Company experienced an increase in construction lending, centered in commercial real estate construction and acquisition and development construction.
Real estate markets in the Pacific Northwest were weak during the economic recession, but beginning in 2013, nearly every segment in the commercial real estate market began showing steady improvements that continued year over year. For the 2015 year, all three of the Company’s primary markets, Eugene, Portland, and Seattle, saw commercial real estate vacancy rates fall in almost every class while their rental rates continued to show increases, particularly in close-in urban neighborhoods and commercial business districts. Sales volumes in 2015 continued to be robust, with a notable presence of institutional investors making larger acquisitions of multi-family and other Class A properties. Residential development began to pick up as well, with single-family and multi-family building permit issuance remaining strong in all of our markets, dominated primarily by the national home builders in the Portland and Seattle markets. Commercial land sales in 2015 occurred at a moderate rate after years of near dormancy. Strong in-migration into the Northwest underpins this market improvement, as United Van Lines’ 2014 and 2015 moving studies ranked Oregon as the number one state for the percent of inbound moves and Washington was also strong, ranking tenth in this measurement.
5
Table of Contents
Residential housing prices in all three of the Company’s primary markets showed marked improvement in 2015, to the point where values have generally recovered to their pre-recession levels in each market, with some values exceeding pre-recession levels in areas of Portland and Seattle. A moderate level of new residential construction continued in each market as well due to the improving market conditions, continued low interest rates, and the slow return of bank financing to a wider range of residential developers.
Competition
Commercial banking in the States of Oregon and Washington is highly competitive. The Company competes with other banks, as well as with savings and loan associations, savings banks, credit unions, mortgage companies, investment banks, insurance companies, and other financial institutions. Banking in Oregon and Washington is dominated by several large banking institutions including U.S. Bank, Wells Fargo Bank, Bank of America, Key Bank and Chase. Together these banks account for a majority of the total commercial and savings bank deposits in Oregon and Washington. These competitors have significantly greater financial resources and offer a much greater number of branch locations. The Company offsets the advantage of the larger competitors by focusing on certain market segments, providing high levels of customization and personal service, and tailoring its technology, products and services to the specific market segments that the Company serves.
In addition to larger institutions, numerous “community” banks and credit unions operated, expanded or moved into the Company’s three primary markets and have developed a similar focus to that of the Company. These institutions have further increased competition in all three of the Company’s primary markets. This number of similar financial institutions and an increased focus by larger institutions in the Company’s primary markets has led to intensified competition in all aspects of the Company’s business. During 2015, the Company saw increased competition, specifically regarding loan pricing. The Bank saw competitors willing to accept yields or terms not desirable to the Company and some deals were lost due to the Company’s unwillingness to compromise on deal pricing. The Company remained diligent in its underwriting standards during the year and did not loosen credit standards to achieve growth.
The adoption of the Gramm-Leach-Bliley Act of 1999 (the “GLB Act”) led to further intensification of competition in the financial services industry. The GLB Act eliminated many of the barriers to affiliation among providers of various types of financial services and has permitted business combinations among financial service providers such as banks, insurance companies, securities or brokerage firms and other financial service providers. Additionally, the rapid adoption of financial services through the Internet has reduced or even eliminated many barriers to entry by financial service providers physically located outside our market areas. For example, remote deposit services allow depository companies physically located in other geographical markets to service local businesses with minimal cost of entry. Although the Company has been able to compete effectively in the financial services business in its markets to date, it may not be able to continue to do so in the future.
The financial services industry has experienced widespread consolidation over the last decade. Following consolidation due to FDIC failures between 2008 and 2011, the banking industry began to see acquisition consolidation in 2012. Beginning in 2012, consolidation continued in the form of bank acquisitions throughout the Northwest. The Company anticipates consolidation among financial institutions in its market areas will continue. In addition, with the passage of the Dodd-Frank Wall Street Reform and Consumer Protection Act (the “Dodd-Frank Act”), smaller financial institutions may find it difficult to continue to operate due to higher anticipated regulatory costs. This may create pressure on these institutions to seek partnerships or mergers with larger companies. The Company seeks acquisition opportunities from time-to-time, including FDIC-assisted transactions, in its existing markets and in new markets of strategic importance. However, other financial institutions aggressively compete against the Company in the acquisition market. Some of these institutions may have greater access to capital markets, larger cash reserves, and stock that is more liquid and more highly valued by the market for use in acquisitions. The Dodd-Frank Act also authorized nationwide de novo branching by national and state banks and certain foreign banks operating in the U.S., which could also result in new entrants to the markets served by the Bank.
As of June 30, 2015, the most recent FDIC Summary of Deposit survey indicated, the Company had 17.53% of the Lane County deposit market share, which currently is serviced by eight branches in the Eugene community. This was the highest deposit market share of any bank in Lane County. In Multnomah County, which is serviced by three of the Company’s offices in the Portland Market, the Company had 1.33% of the deposit market share, ranking tenth in the Multnomah County, Oregon Market. In King County, Washington, the Company had 0.23% of the deposit market share, serviced by the Seattle and Bellevue offices, ranking 23rd in the King County Market as of June 30, 2015.
6
Table of Contents
In addition, the Company anticipates more competitive pressure for new loans in its markets. While the Bank’s loan demand improved throughout 2015, healthy banks with ample capital and liquidity are expected to aggressively seek new loan customers. This may cause pressure on loan pricing and make it more difficult to retain existing loan customers or attract new ones and may create compression in the Company’s net interest margin.
Services Provided
The Company offers a wide array of financial service products to meet the banking needs of its targeted segments in the market areas served. The Company regularly reviews the profitability and desirability of various product offerings, particularly new product offerings, to assure ongoing viability.
Deposit Services
The Company offers a wide range of deposit services that are typically available in most banks and other financial institutions including checking, savings, money market accounts and time deposits. The transaction accounts and time deposits are tailored to the Company’s primary markets and market segments at rates competitive with those offered in the area. Additional deposits are generated through national networks for institutional deposits. All deposit accounts are insured by the FDIC to the maximum amount permitted by law, currently $250 per depositor. The Company provides online cash management, remote deposit capture and banking services to businesses and consumers. The Company also allows 24-hour customer access to deposit and loan information via telephone and online cash management products.
Lending Activities
The Company emphasizes specific areas of lending within its primary markets. Commercial loans are made primarily to professionals, community-based businesses and nonprofit organizations. These loans are available for general operating purposes, acquisition of fixed assets, purchases of equipment and machinery, financing of inventory and accounts receivable and other business purposes. The Company also originates U.S. Small Business Administration (“SBA”) loans and is a national SBA preferred lender.
Within its primary markets, the Company also originates construction and permanent loans financing commercial facilities, including investor and owner-occupied projects. The Company also originates pre-sold, custom and, on a limited basis, speculative home construction. The major thrust of residential construction lending is smaller in-fill construction projects in inner-city urban neighborhoods, and consisting of single-family residences. During 2015, as commercial real estate prices continued to stabilize and improve, the Company expanded construction financing activity in commercial real estate and multifamily residential construction financing. During 2015, the housing markets in Portland and Seattle experienced very low inventory and high rates of appreciation, thus the Company was selective in financing single-family housing projects in both of these markets.
Due to the Company’s concentration in real estate secured loans, the Company strategically focuses on increasing its commercial and industrial (“C & I”) loan lending. In particular, the Company has developed a specialty in C & I lending to dental professionals. Loans to dental professionals include loans for such purposes as starting up a practice, acquisition of a practice, equipment financing, owner-occupied facilities, and working capital. Loans for dental office startups are typically SBA loans as these loans represent additional risk. During 2015, the Company continued to expand its national dental lending program. At year-end 2015 the Company had active dental loans in 37 states, outside of the Company’s primary markets in Oregon and Washington, which totaled $340,162 at December 31, 2015. Since inception of the national dental lending program, lending was limited to loans to dental professionals for acquisition of practices by experienced dental professionals, owner-occupied commercial real estate or seasoned practice refinance loans.
The Company makes secured and unsecured loans to individuals for various purposes, including purchases of automobiles, mobile homes, boats, and other recreational vehicles, home improvements, education, and personal investment.
Inter-agency guidelines adopted by federal bank regulators mandate that financial institutions establish real estate lending policies with maximum allowable real estate loan-to-value limits, subject to an allowable amount of non-conforming loans as a percentage of capital. The Board of Directors has approved specific lending policies and procedures for the Company, and management is responsible for implementation of these policies. The lending policies and procedures include guidelines for loan term, loan-to-value ratios that are within established federal banking guidelines, collateral appraisals, and cash flow coverage. The loan policies also vest varying levels of loan authority in management, the Company’s Loan Committee and the Board of Directors. Company management monitors lending activities through management meetings, loan committee meetings, monthly reporting, and periodic review of loans by third-party contractors.
7
Table of Contents
Merchant and Card Services
In December 2013, the Company entered into an agreement with Vantiv, a third-party provider of merchant services, to outsource all merchant processing for the Bank’s clients. The agreement provides for a portion of the revenue generated from existing and new clients to be shared with the Company. Through the agreement, the Company’s existing merchant portfolio was converted onto the Vantiv platform.
Wealth Management
During 2015, the Company began offering wealth management services through a strategic partnership with Transamerica Financial Advisors (“TFA”) and World Financial Group (“WFG”). This partnership provides for employees of the Bank to also be Investment Advisors, Registered Representatives, and/or Agents with TFA and WFG. The products available include: individual investment advisory services, Company retirement plans, employee benefits programs, mutual funds, unit investment trusts, fixed and variable annuities, fixed and variable life insurance, long term care, and disability. The product and services are provided by TFA/WFG and the over 100 other financial institutions with which TFA/WFG has selling agreements. Through referral relationships, WFG is also able to provide estate planning documents, and business & personal property solutions.
Other Services
The Company provides other traditional commercial and consumer banking services, including cash management products for businesses, online banking, safe deposit services, debit and automated teller machine (“ATM”) cards, automated clearing house (“ACH”) transactions, cashier’s checks, notary services and others. The Company is a member of numerous ATM networks and utilizes an outside processor for the processing of these automated transactions. The Company has an agreement with MoneyPass, an ATM provider, which permits Company customers to use MoneyPass ATMs located throughout the country at no charge to the customer.
Employees
At December 31, 2015, the Company employed 322 FTE employees with 27 FTE employees in the Seattle market, 72 FTE employees in the Portland market, and 77 FTE employees in the Eugene market as well as 146 FTE employees in administrative functions primarily located in Eugene, Oregon. None of these employees are represented by labor unions, and management believes that the Company’s relationship with its employees is good. The Company emphasizes a positive work environment for its employees, which is validated by recognition from independent third-parties.
During 2015, the Company was recognized for the sixteenth consecutive year by Oregon Business magazine as one of the 100 Best Companies to Work For in Oregon. Also, the Company was recognized by Seattle Business magazine as one of Washington’s “100 Best Companies to Work For.” The Portland Business Journal named the Company as one of Oregon’s most admired companies. This was the seventh time the Company was recognized as a top-ten company in the “Financial Services” classification. Additionally, Seattle Business magazine named the Company “Business of the Year,” in the small business category.
Management continually strives to retain and attract top talent as well as provide career development opportunities to enhance skill levels. A number of benefit programs are available to eligible employees, including group medical plans, paid sick leave, paid vacation, group life insurance, 401(k) plans, deferred compensation plans, and equity compensation plans.
8
Table of Contents
Supervision and Regulation
General
The following discussion provides an overview of certain elements of the extensive bank regulatory framework applicable to the Company and the Bank. This regulatory framework is primarily designed for the protection of depositors and other customers of banks, the federal deposit insurance fund and the banking system as a whole, rather than specifically for the protection of shareholders or other investors in the securities of banking organizations in the United States. Due to the breadth and growth of this regulatory framework, our costs of compliance continue to increase in order to monitor and satisfy these requirements.
To the extent that this section describes statutory and regulatory provisions, it is qualified by reference to those provisions. These statutes and regulations, as well as related policies, are subject to change by Congress, state legislatures and federal and state regulators. Changes in statutes, regulations or regulatory policies applicable to us, including the interpretation or implementation thereof, could have a material adverse effect on our business and operations. In light of the financial crisis, which began in 2008 and 2009, numerous changes to the statutes, regulations or regulatory policies applicable to the Company and other banks generally have been made or proposed. The full extent to which these changes will impact our business is not yet known. However, our continued efforts to monitor and comply with new regulatory requirements add to the complexity and cost of our business.
Federal and State Bank Holding Company Regulation
General. The Company is a bank holding company as defined in the Bank Holding Company Act of 1956, as amended (“BHCA”), and is therefore subject to regulation, supervision and examination by the Federal Reserve. In general, the BHCA limits the business of bank holding companies to owning or controlling banks and engaging in other activities closely related to banking. The Company must file reports with and provide to the Federal Reserve such additional information as it may require. Under the GLB Act, a bank holding company may apply to the Federal Reserve to become a financial holding company, and thereby engage (directly or through a subsidiary) in certain expanded activities deemed financial in nature, such as securities and insurance underwriting. The Company has not applied to the Federal Reserve to become a financial holding company and has no plans to do so.
Holding Company Bank Ownership. The BHCA requires every bank holding company to obtain the prior approval of the Federal Reserve before (i) acquiring, directly or indirectly, ownership or control of any voting shares of another bank or bank holding company if, after such acquisition, it would own or control more than 5 percent of such shares; (ii) acquiring all or substantially all of the assets of another bank or bank holding company; or (iii) merging or consolidating with another bank holding company.
Holding Company Control of Non-Banks. With some exceptions, the BHCA also prohibits a bank holding company from acquiring or retaining direct or indirect ownership or control of more than 5 percent of the voting shares of any company which is not a bank or bank holding company, or from engaging directly or indirectly in activities other than those of banking, managing or controlling banks, or providing services for its subsidiaries. The principal exceptions to these prohibitions involve certain non-bank activities that, by statute or by Federal Reserve regulation or order, have been identified as activities closely related to the business of banking or of managing or controlling banks.
Transactions with Affiliates. Subsidiary banks of a bank holding company are subject to restrictions imposed by the Federal Reserve Act on extensions of credit to the holding company or its subsidiaries, on investments in their securities, and on the use of their securities as collateral for loans to any borrower. These restrictions prevent the Company from borrowing from the Bank unless the loans are secured by marketable obligations of designated amounts. Further, such secured loans and investments by the Bank to or in the Company are limited individually to 10 percent of the Bank’s capital stock and surplus and in the aggregate to 20 percent of the Bank’s capital stock and surplus. The Federal Reserve Act also provides that extensions of credit and other transactions between the Bank and the Company must be on terms and conditions, including credit standards, that are substantially the same or at least as favorable to the Bank as those prevailing at the time for comparable transactions involving other non-affiliated companies, or, in the absence of comparable transactions, on terms and conditions, including credit standards, that in good faith would be offered to, or would apply to, non-affiliated companies. These regulations and restrictions may limit the Company’s ability to obtain funds from the Bank for its cash needs, including funds for payment of dividends, interest, and operational expenses.
9
Table of Contents
Tying Arrangements. The Company is prohibited from engaging in certain tie-in arrangements in connection with any extension of credit, sale or lease of property or furnishing of services. For example, with certain exceptions, neither the Company nor its subsidiaries may condition an extension of credit to a customer on either (i) a requirement that the customer obtain additional services provided by us; or (ii) an agreement by the customer to refrain from obtaining other services from a competitor.
Support of Subsidiary Banks. Under Federal Reserve policy and the Dodd-Frank Act, the Company is required to act as a source of financial and managerial strength to the Bank. This means that the Company is required to commit, as necessary, resources to support the Bank. However, the contribution of additional capital to an under-capitalized subsidiary bank may be required at times when a bank holding company may not have the resources to provide such support. Any capital loans a bank holding company makes to its subsidiary banks are subordinate to deposits and to certain other indebtedness of those subsidiary banks.
State Law Restrictions. As an Oregon corporation, the Company is subject to certain limitations and restrictions under applicable Oregon corporate law. For example, state law restrictions and limitations in Oregon include indemnification of directors, distributions to shareholders, transactions involving directors, officers or interested shareholders, maintenance of books, records and minutes, and observance of certain corporate formalities.
Federal and State Regulation of Pacific Continental Bank
General. The Bank is an Oregon commercial bank operating in Oregon and Washington with deposits insured by the FDIC. As an Oregon state bank that is not a member of the Federal Reserve System, the Bank is subject to supervision and regulation by the Oregon Department of Consumer and Business Services (the “Oregon Department”) and the FDIC. These agencies have the authority to prohibit banks from engaging in what they believe constitute unsafe or unsound banking practices. Additionally, the Bank’s branches in Washington are subject to supervision and regulation by the Washington Department of Financial Institutions and must comply with applicable Washington laws regarding community reinvestment, consumer protection, fair lending, and intrastate branching.
Consumer Protection. The Bank is subject to a variety of federal and state consumer protection laws and regulations that govern its relationship with consumers, including laws and regulations that mandate certain disclosure requirements and regulate the manner in which we take deposits, make and collect loans, and provide other services. Failure to comply with these laws and regulations can subject the Bank to various penalties, including but not limited to, enforcement actions, injunctions, fines, civil liability, criminal penalties, punitive damages, and the loss of certain contractual rights.
Community Reinvestment. The Community Reinvestment Act of 1977 (“CRA”) requires that, in connection with examinations of financial institutions within their jurisdiction, the FDIC evaluate the record of the financial institution in meeting the credit needs of its local communities, including low- and moderate-income neighborhoods, consistent with the safe and sound operation of the institution. In addition to substantial penalties and corrective measures that may be required for a violation of certain fair lending laws, the federal banking agencies may take compliance with such laws and the CRA into account when regulating and supervising other activities, and in evaluating whether to approve applications for permission to engage in new activities or for acquisitions of other banks or companies or de novo branching. An unsatisfactory CRA rating may be the basis for denying the application. In the most current CRA examination report dated February 24, 2014, the Bank’s compliance with CRA was rated “Satisfactory”.
Insider Credit Transactions. Banks are also subject to certain restrictions imposed by the Federal Reserve Act and the regulations of the Federal Reserve on extensions of credit to executive officers, directors, principal shareholders or any related interests of such persons. Extensions of credit (i) must be made on substantially the same terms, including interest rates and collateral, and follow credit underwriting procedures that are at least as stringent as those prevailing at the time for comparable transactions with persons not covered above and who are not employees; and (ii) must not involve more than the normal risk of repayment or present other unfavorable features. Banks are also subject to certain lending limits and restrictions on overdrafts to insiders. A violation of these restrictions may result in the assessment of substantial civil monetary penalties, regulatory enforcement actions, and other regulatory sanctions.
Regulation of Management. Federal law (i) sets forth circumstances under which officers or directors of a bank may be removed by the institution’s federal supervisory agency; (ii) places restraints on lending by a bank to its executive officers, directors, principal shareholders and their related interests; and (iii) generally prohibits management personnel of a bank from serving as a director or in other management positions of another financial institution which assets exceed a specified amount or which has an office within a specified geographic area.
10
Table of Contents
Safety and Soundness Standards. Certain non-capital safety and soundness standards are also imposed upon banks. These standards cover internal controls, information systems and internal audit systems, loan documentation, credit underwriting, interest rate exposure, asset growth, compensation, fees and benefits, such other operational and managerial standards as the agency determines to be appropriate, and standards for asset quality, earnings and stock valuation. An institution that fails to meet these standards may be subject to regulatory sanctions.
Customer Information Security. The federal bank regulatory agencies have adopted guidelines for safeguarding confidential, personal customer information. The guidelines require each financial institution to create, implement and maintain a comprehensive written information security program designed to ensure the security and confidentiality of customer information, protect against any anticipated threats or hazards to the security or integrity of such information and protect against unauthorized access to or use of such information that could result in substantial harm or inconvenience to any customer. The Bank has adopted a customer information security program.
Privacy. The GLB Act requires financial institutions to implement policies and procedures regarding the disclosure of nonpublic personal information about consumers to non-affiliated third parties. In general, the statute requires explanations to consumers on policies and procedures regarding the disclosure of such nonpublic personal information, and, except as otherwise required by law, prohibits disclosing such information except as provided in the banks’ policies and procedures. The Bank implemented a privacy policy, which provides that all of its existing and new customers will be notified of the Bank’s privacy policies. State laws and regulations designed to protect the privacy and security of customer information also apply to us.
Interstate Banking and Branching
The Riegle-Neal Interstate Banking and Branching Efficiency Act of 1994 (“Interstate Act”), together with the Dodd-Frank Act, relaxed prior interstate branching restrictions under federal law by permitting, subject to regulatory approval, state and federally chartered commercial banks to establish branches in states where the laws permit banks chartered in such states to establish branches. The Interstate Act requires regulators to consult with community organizations before permitting an interstate institution to close a branch in a low-income area. Federal banking agency regulations prohibit banks from using their interstate branches primarily for deposit production, and the federal banking agencies have implemented a loan-to-deposit ratio screen to ensure compliance with this prohibition. The Dodd-Frank Act also authorized nationwide de novo branching by national and state banks and certain foreign banks operating in the U.S., which could also result in new entrants to the markets served by the Bank.
Dividends
The principal source of the Company’s cash is from dividends received from the Bank, which are subject to government regulation and limitations. In addition, capital raises may provide another source of cash. Regulatory authorities may prohibit banks and bank holding companies from paying dividends in a manner that would constitute an unsafe or unsound banking practice or would reduce the amount of its capital below that necessary to meet minimum applicable regulatory capital requirements. The Oregon Bank Act and the Federal Deposit Insurance Corporation Improvement Act of 1991 also limit a bank’s ability to pay cash dividends to its parent company. A bank may not pay cash dividends if that payment would reduce the amount of its capital below that necessary to meet minimum applicable regulatory capital requirements. In addition, under the Oregon Bank Act, the amount of the dividend paid by the Bank may not be greater than net unreserved retained earnings, after first deducting, to the extent not already charged against earnings or reflected in a reserve, all bad debts, which are debts on which interest is unpaid and past due at least six months unless the debt is fully secured and in the process of collection; all other assets charged-off as required by Oregon bank regulators or a state or federal examiner; and all accrued expenses, interest and taxes of the Bank. The Federal Reserve has issued a policy statement on the payment of cash dividends by bank holding companies, which expresses the Federal Reserve’s view that a bank holding company should pay cash dividends only to the extent that its net income for the past year is sufficient to cover both the cash dividends and a rate of earnings retention that is consistent with the holding company’s capital needs, asset quality and overall financial condition. Payment of cash dividends by the Company and the Bank will depend on sufficient earnings to support them and adherence to bank regulatory requirements.
11
Table of Contents
Capital Adequacy
Regulatory Capital Rules. Federal bank regulatory agencies use capital adequacy guidelines in the examination and regulation of bank holding companies and banks. The guidelines are “risk-based,” meaning that they are designed to make capital requirements more sensitive to differences in risk profiles among banks and bank holding companies. The Federal Reserve Board and the other U.S. federal banking agencies have adopted final rules making significant changes to the U.S. regulatory capital framework for U.S. banking organizations and to conform this framework to the current international regulatory capital accord (“Basel III”) of the Basel committee on Banking Supervision (the “Basel Committee). The Basel Committee is a committee of banking supervisory authorities from major countries in the global financial system which formulates broad supervisory standards and guidelines relating to financial institutions for implementation on a country-by-country basis. These rules replace the U.S. federal banking agencies’ general risk-based capital rules, advanced approaches rule, market-risk rule, and leverage rules, in accordance with certain transition provisions. Banks, such as Pacific Continental Bank, became subject to the new rules on January 1, 2015. The new rules establish more restrictive capital definitions, create additional categories and higher risk-weightings for certain asset classes and off-balance sheet exposures, higher leverage ratios and capital conservation buffers that will be added to the minimum capital requirements and must be met for banking organizations to avoid being subject to certain limitations on dividends and discretionary bonus payments to executive officers. The new rules also implement higher minimum capital requirements, include a new common equity Tier 1 capital requirement, and establish criteria that instruments must meet in order to be considered common equity Tier 1 capital, additional Tier 1 capital, or Tier 2 capital. When fully phased in, the final rules will provide for increased minimum capital ratios as follows: (a) a common equity Tier 1 capital ratio of 4.50%; (b) a Tier 1 capital ratio of 6.00% (which is an increase from 4.00%); (c) a total capital ratio of 8.00%; and (d) a Tier 1 leverage ratio to average consolidated assets of 4.00%. While earlier proposals would have required that trust preferred securities be phased out of Tier 1 capital, the new rules exempt depository institution holding companies with less than $15 billion in total consolidated assets as of December 31, 2009, such as the Company, from this requirement. These capital instruments, if issued prior to May 19, 2010, and currently in Tier 1 capital, are grandfathered in Tier 1 capital, subject to certain limits. Under the new rules, in order to avoid limitations on capital distributions, including dividend payments and certain discretionary bonus payments to executive officers, a banking organization must hold a capital conservation buffer composed of common equity Tier 1 capital above its minimum risk-based capital requirements (equal to 2.50% of total risk-weighted assets). The phase-in of the capital conservation buffer began on January 1, 2016, and will be completed by January 1, 2019. The new rules also provide for various adjustments and deductions to the definitions of regulatory capital that phase in from January 1, 2014 to December 31, 2017. In January 2014, the Basel Committee issued its nearly final version of its leverage ratio and disclosure guidance (the “Basel III Leverage Ratio”). The Basel III Leverage Ratio will be subject to further calibration until 2017, with final implementation expected by January 2018. The Basel III Leverage Ratio makes a number of significant changes to the Basel Committee’s June 2013 consultative paper by easing the approach to measuring the exposures of off-balance sheet items. These changes address the financial services industry’s concern that the consultative paper’s definition of exposure was too expansive, i.e., that the leverage ratio’s denominator was too large. The implementation of these new rules could have an adverse impact on our financial position and future earnings due to the inclusion of Tier 1 capital as a core capital component and because of the heightened minimum capital requirements. The newly adopted capital rules could restrict our ability to grow during favorable market conditions, or require us to raise additional capital and liquidity, generally increase our cost of doing business, and impose other restrictions on our operations. The application of more stringent capital requirements would, among other things, result in lower returns on invested capital and result in regulatory sanctions if we were unable to comply with these requirements. As a result, our business, results of operations, financial condition or prospects could be adversely affected. We expect that we will be able to satisfy the minimum capital requirements adopted by the Federal Reserve and the other U.S. banking agencies within the prescribed implementation timelines. For additional information, see “Management’s Discussion and Analysis of Financial Condition and Results of Operations – Capital Resources” in this Form 10-K.
Prompt Corrective Action. Under the guidelines, an institution is assigned to one of five capital categories ranging from “well-capitalized” to “critically under-capitalized.” Institutions that are “under-capitalized” or lower are subject to certain mandatory supervisory corrective actions. At each successively lower capital category, an insured bank is subject to increased restrictions on its operations. Failure to meet regulatory capital guidelines can result in a bank being required to raise additional capital. An “under-capitalized” bank must develop a capital restoration plan and its parent holding company must guarantee compliance with the plan subject to certain limits. During challenging economic times, the federal banking regulators have actively enforced these provisions.
12
Table of Contents
At December 31, 2015, the Company and the Bank each exceeded the required risk-based capital ratios for classification as “well capitalized” as well as the required minimum leverage ratios for the Bank. See “Management’s Discussion and Analysis of Financial Condition and Results of Operations – Capital Resources” in this Form 10-K.
Regulatory Oversight and Examination
The Federal Reserve conducts periodic inspections of bank holding companies, which are performed both onsite and offsite. The supervisory objectives of the inspection program are to ascertain whether the financial strength of the bank holding company is being maintained on an ongoing basis and to determine the effects or consequences of transactions between a holding company or its non-banking subsidiaries and its subsidiary banks. For holding companies under $10 billion in assets, such as the Company, the inspection type and frequency varies depending on asset size, complexity of the organization and the holding company’s rating at its last inspection.
The Federal Reserve Board also has extensive enforcement authority over all bank holding companies, such as the Company. Such enforcement powers include the power to assess civil money penalties against any bank holding company violating any provision of the BHCA or any regulation or order of the Federal Reserve Board under the BHCA and the power to order termination of activities or ownership of nonbank subsidiaries of the holding company if it determines that there is reasonable cause to believe that the activities or ownership of the non-bank subsidiaries constitutes a serious risk to the financial safety, soundness or stability of banks owned by the bank holding company. Knowing violations of the BHCA or regulations or orders of the Federal Reserve Board can also result in criminal penalties for the Company and any individuals participating in such conduct.
Banks are subject to periodic examinations by their primary regulators. Bank examinations have evolved from reliance on transaction testing in assessing a bank’s condition to a risk-focused approach. These examinations are extensive and cover the entire breadth of operations of the Bank. Generally, safety and soundness examinations occur on an 18-month cycle for banks under $500 million in total assets that are well-capitalized and without regulatory issues, and on a 12-month cycle otherwise. Examinations alternate between the federal and state bank regulatory agency and may occur on a combined schedule. The frequency of consumer compliance and CRA examinations is linked to the size of the institution and its compliance and CRA ratings at its most recent examinations. However, the examination authority of the FDIC allows it to examine supervised banks as frequently as deemed necessary based on the condition of the Bank or as a result of certain triggering events. Neither the Company nor the Bank is party to a formal or informal agreement with the FDIC, the Federal Reserve or the Oregon Department.
Corporate Governance and Accounting
Sarbanes-Oxley Act of 2002. The Sarbanes-Oxley Act of 2002 (the “Act”) addresses, among other things, corporate governance, auditing and accounting, enhanced and timely disclosure of corporate information, and penalties for non-compliance. Generally, the Act (i) requires chief executive officers and chief financial officers to certify to the accuracy of periodic reports filed with the Securities and Exchange Commission (the “SEC”), (ii) imposes specific and enhanced corporate disclosure requirements, (iii) accelerates the time frame for reporting of insider transactions and periodic disclosures by public companies, (iv) requires companies to adopt and disclose information about corporate governance practices, including whether or not they have adopted a code of ethics for senior financial officers and whether the audit committee includes at least one “audit committee financial expert,” and (v) requires the SEC, based on certain enumerated factors, to regularly and systematically review corporate filings.
As a publicly reporting company, we are subject to the requirements of the Act and related rules and regulations issued by the SEC and NASDAQ. After enactment, we updated our policies and procedures to comply with the Act’s requirements and have found that such compliance, including compliance with Section 404 of the Act relating to internal control over financial reporting, has resulted in significant additional expense for the Company. We anticipate that we will continue to incur such additional expense in our ongoing compliance.
Anti-terrorism and Anti-Money Laundering
USA Patriot Act of 2001. The Uniting and Strengthening America by Providing Appropriate Tools Required to Intercept and Obstruct Terrorism Act of 2001, intended to combat terrorism, was renewed with certain amendments in 2006 (the “Patriot Act”). Certain provisions of the Patriot Act were made permanent and other sections were made subject to extended “sunset” provisions. The Patriot Act, in relevant part, (i) prohibits banks from providing correspondent accounts directly to foreign shell banks; (ii) imposes due diligence requirements on banks opening or holding accounts for foreign financial institutions or wealthy foreign individuals; (iii) requires financial institutions to establish an anti-money laundering compliance program; and (iv) eliminates civil liability for persons who file suspicious activity reports.
13
Table of Contents
In recent years, the federal bank regulators have announced regulatory enforcement actions against a number of large bank holding companies and banks arising from deficiencies in processes, procedures and controls involving anti-money laundering measures and compliance with the economic sanctions that affect transactions with designated foreign countries, nationals and others as provided for in the regulations of the Office of Foreign Assets Control of the U.S. Treasury Department. These actions evidence an intensification of the U.S. government’s expectations for compliance with these regulatory regimes on the part of banks operating in the U.S., including the Bank, and may result in increased compliance costs and increased risks of regulatory sanctions.
Financial Services Modernization
The GLB Act, which became law in 1999, brought about significant changes to the laws affecting banks and bank holding companies. Generally, the GLB Act (i) repeals historical restrictions on preventing banks from affiliating with securities firms; (ii) provides a uniform framework for the activities of banks, savings institutions and their holding companies; (iii) broadens the activities that may be conducted by national banks and banking subsidiaries of bank holding companies; (iv) provides an enhanced framework for protecting the privacy of consumer information and requires notification to consumers of bank privacy policies; and (v) addresses a variety of other legal and regulatory issues affecting both day-to-day operations and long-term activities of financial institutions. Bank holding companies that qualify and elect to become financial holding companies can engage in a wider variety of financial activities than permitted under previous law, particularly with respect to insurance and securities underwriting activities.
Deposit Insurance
The Bank’s deposits are insured under the Federal Deposit Insurance Act, up to the maximum applicable limits, and are subject to deposit insurance assessments designed to tie what banks pay for deposit insurance more closely to the risks they pose. The Dodd-Frank Act required the FDIC to amend its regulations to redefine the assessment base used for calculating deposit insurance assessments. As a result, assessments are now based on a financial institution’s average consolidated total assets less average tangible equity. The rules revised the assessment rate schedule and adopted additional rate schedules that will go into effect when the Deposit Insurance Fund reserve ratio reaches various milestones. The Dodd-Frank Act required the FDIC to increase the reserve ratio of the Deposit Insurance Fund from 1.15 percent to 1.35 percent of insured deposits by 2020 and eliminated the requirement that the FDIC pay dividends to insured depository institutions when the reserve ratio exceeds certain thresholds. In October 2010, the FDIC adopted a comprehensive, long-range “restoration” plan for the Deposit Insurance Fund to ensure that the ratio of the fund’s reserves to insured deposits reaches 1.35 percent by 2020, as required by the Dodd-Frank Act. The fund’s designated reserve ratio for 2016 was set at 2.0 percent. The final rule adopts progressively lower assessment rate schedules as the fund reaches specified reserve levels. There can be no assurance that the FDIC will not impose special assessments or increase annual assessments in the future.
The FDIC may terminate the deposit insurance of any insured depository institution if it determines that the institution has engaged in or is engaging in unsafe and unsound banking practices, is in an unsafe or unsound condition or has violated any applicable law, regulation or order or any condition imposed in writing by, or pursuant to, any written agreement with the FDIC. The termination of deposit insurance for the Bank could have a material adverse effect on our financial condition and results of operations due to the fact that the Bank’s liquidity position would likely be adversely affected by deposit withdrawal activity.
The Federal Deposit Insurance Act provides that, in the event of the liquidation or other resolution of an insured depository institution, the claims of its depositors (including claims by the FDIC as subrogee of insured depositors) and certain claims for administrative expenses of the FDIC as receiver would be afforded a priority over other general unsecured claims against such an institution. If an insured depository institution fails, insured and uninsured depositors along with the FDIC will be placed ahead of unsecured, non-deposit creditors, in order of priority of payment.
If any insured depository institution becomes insolvent and the FDIC is appointed its conservator or receiver, the FDIC may, in most cases, disaffirm or repudiate any contract to which such institution is a party, if the FDIC determines that performance of the contract would be burdensome, and that disaffirmance or repudiation of the contract would promote the orderly administration of the institution’s affairs. In addition, the FDIC as conservator or receiver may enforce most contracts entered into by the institution notwithstanding any provision providing for termination, default, acceleration or exercise of rights upon or solely by reason of insolvency of the institution, appointment of a conservator or receiver for the institution, or exercise of rights or powers by a conservator or receiver for the institution.
14
Table of Contents
Other Legislation
Dodd-Frank Wall Street Reform and Consumer Protection Act. As a result of the financial crises beginning in 2008-2009, on July 21, 2010, the Dodd-Frank Act was signed into law. The Dodd-Frank Act has had, and is expected to continue to have, a broad impact on the financial services industry, including significant regulatory and compliance changes and changes to corporate governance matters affecting public companies. Among other provisions, the Dodd-Frank Act (1) created the Consumer Financial Protection Bureau with broad powers to regulate consumer financial products such as credit cards and mortgages, (2) created the Financial Stability Oversight Council (comprised of the Secretary of the Treasury, heads of the federal bank regulatory agencies and the SEC, and certain other officials) to provide oversight of all risks created within the U.S. economy from the activities of financial services companies, (3) has led to new capital requirements from federal banking agencies, (4) placed new limits on electronic debit card interchange fees, and (5) required the SEC and national stock exchanges to adopt significant new corporate governance and executive compensation reforms. As discussed below, many of the law’s provisions have been implemented by rules and regulations of the federal banking agencies, but certain provisions of the law are yet to be implemented. As a result, the full scope and impact of the law on banking institutions generally and on our business and operations cannot be fully determined at this time. However, the Dodd-Frank Act is expected to have a significant impact on our business operations, including increasing the cost of doing business, as its provisions continue to take effect. Some of the provisions of the Dodd-Frank Act that may impact our business are summarized below.
Corporate Governance. The Dodd-Frank Act requires publicly traded companies to provide their shareholders with (1) a non-binding shareholder vote on executive compensation, (2) a non-binding shareholder vote on the frequency of such vote, (3) disclosure of “golden parachute” arrangements in connection with specified change in control transactions, and (4) a non-binding shareholder vote on golden parachute arrangements in connection with these change in control transactions. Except with respect to “smaller reporting companies” and participants in the Troubled Asset Relief Program (“TARP”), the new rules applied to proxy statements relating to annual meetings of shareholders held after January 20, 2011.
Prohibition Against Charter Conversions of Troubled Institutions. The Dodd-Frank Act generally prohibits a depository institution from converting from a state to federal charter, or vice versa, while subject to an enforcement action, unless the bank seeks prior approval from its regulator and complies with specified procedures to ensure compliance with the enforcement action.
Overdraft and Interchange Fees. In November 2009, the Federal Reserve adopted amendments under its Regulation E that imposed new restrictions on banks’ abilities to charge overdraft services and fees. The rule prohibits financial institutions from charging fees for paying overdrafts on ATM and one-time debit card transactions, unless a consumer consents, or opts in, to the overdraft service for those types of transactions. The opt-in provision established requirements for clear disclosure of fees and terms of overdraft services for ATM and one-time debit card transactions. Since a percentage of the Bank’s service charges on deposits are in the form of overdraft fees on point-of-sale transactions, this has had an adverse impact on our noninterest income.
The Dodd-Frank Act, through a provision known as the Durbin Amendment, required the Federal Reserve to establish standards for interchange fees that are “reasonable and proportional” to the cost of processing the debit card transaction and imposes other requirements on card networks. Under the final rule, effective in October 2011, the maximum permissible interchange fee that a bank may receive is the sum of $0.21 per transaction and five basis points multiplied by the value of the transaction, with an additional upward adjustment of no more than $0.01 per transaction if a bank develops and implements policies and procedures reasonably designed to achieve fraud-prevention standards set by regulation. The Federal Reserve’s regulation on charges for overdraft services and interchange fees on debit card transactions reduces the fee revenues that banks receive from the business of processing debit card transactions. While the restrictions on interchange fees do not apply to banks that, together with their affiliates, have assets of less than $10 billion, the rule could affect the competitiveness of debit cards issued by smaller banks.
Consumer Financial Protection Bureau. The Dodd-Frank Act created a new, independent federal agency called the Consumer Financial Protection Bureau (“CFPB”). The CFPB has broad rulemaking, supervision and enforcement authority for a wide range of consumer protection laws for banks and thrifts with greater than $10 billion in assets. Among the CFPB’s responsibilities are implementing and enforcing federal consumer financial protection laws, reviewing the business practices
15
Table of Contents
of financial services providers for legal compliance, monitoring the marketplace for transparency on behalf of consumers and receiving complaints and questions from consumers about consumer financial products and services. The Dodd-Frank Act added prohibitions on unfair, deceptive or abusive acts and practices to the scope of consumer protection regulations overseen and enforced by the CFPB. Institutions with less than $10 billion in assets, such as the Company, are subject to rules promulgated by the CFPB but will continue to be examined and supervised by their federal banking regulators for compliance purposes.
Repeal of Demand Deposit Interest Prohibition. The Dodd-Frank Act repealed the federal prohibitions on the payment of interest on demand deposits, thereby permitting depository institutions to pay interest on business transaction and other accounts.
Proposed Legislation
Proposed legislation that may affect the Company and the Bank is introduced in almost every legislative session, both federal and state. Certain of such legislation could dramatically affect the regulation of the banking industry and significantly change the competitive and operating environment in which we operate. We cannot predict if any such legislation will be adopted or, if it is adopted, how it would affect the business of the Bank or the Company. Past history has demonstrated that new legislation or changes to existing laws or regulations usually results in a greater compliance burden and therefore generally increases our cost of doing business.
Effects of Government Monetary Policy
Our earnings and growth are affected not only by general economic conditions, but also by the fiscal and monetary policies of the federal government, particularly the Federal Reserve. The Federal Reserve implements national monetary policy for such purposes as curbing inflation and combating recession. Its open market operations in U.S. government securities, control of the discount rate applicable to borrowings from the Federal Reserve, and establishment of reserve requirements against certain deposits, influence the growth of bank loans, investments and deposits, and also affect interest rates charged on loans or paid on deposits. For the past several years since the financial crisis of 2008, the banking industry has opreated in an extremely low interest rate environment relative to historical averages, and the Federal Reserve has pursued highly accommodative monetary measures, including a very low federal funds rate and substantial purchases of long-term U.S. Treasury and agency securities, in an effort to facilitate growth in the U.S. economy and a reduction in levels of unemployment. In December 2015, the Federal Reserve raised the target range for the federal funds rate to 1/4 to 1/2 percent. The Federal Reserve further indicated future policy actions to normalize interest rates will depend upon progress towards its objectives of maximum employment and two percent inflation, although the stance of monetary policy remains accommodative, and, even after employment and inflation are near its objectives, economic conditions may warrant for some time keeping the target federal funds rate below longer-term normal levels. The Federal Reserve also indicated that it intended to continue its policy of holding longer-term agency and Treasury securities at sizeable levels to help maintain accommodative financial conditions.
16
Table of Contents
Statistical Information
All dollar amounts in the following sections, except per common share data, are in thousands of dollars, except where otherwise indicated.
Selected Quarterly Information
The following chart contains data for the prior eight quarters.
| YEAR |
2015 | 2014 | ||||||||||||||||||||||||||||||
| QUARTER |
Fourth | Third | Second | First | Fourth | Third | Second | First | ||||||||||||||||||||||||
| (in thousands, except per share data) | ||||||||||||||||||||||||||||||||
| Interest income |
$ | 19,877 | $ | 19,450 | $ | 18,840 | $ | 16,069 | $ | 15,466 | $ | 15,753 | $ | 15,618 | $ | 15,191 | ||||||||||||||||
| Interest expense |
1,055 | 1,142 | 1,144 | 1,095 | 1,092 | 1,181 | 1,161 | 1,147 | ||||||||||||||||||||||||
| Net interest income |
18,822 | 18,308 | 17,696 | 14,972 | 14,374 | 14,572 | 14,458 | 14,045 | ||||||||||||||||||||||||
| Provision for loan loss |
520 | 625 | 550 | — | — | — | — | — | ||||||||||||||||||||||||
| Noninterest income |
2,008 | 1,714 | 1,627 | 1,276 | 1,318 | 1,197 | 1,156 | 1,323 | ||||||||||||||||||||||||
| Noninterest expense |
11,706 | 11,182 | 11,030 | 11,972 | 9,798 | 9,149 | 9,269 | 9,512 | ||||||||||||||||||||||||
| Net income |
5,528 | 5,325 | 5,095 | 2,802 | 3,631 | 4,431 | 4,148 | 3,832 | ||||||||||||||||||||||||
| PER COMMON |
||||||||||||||||||||||||||||||||
| SHARE DATA |
||||||||||||||||||||||||||||||||
| Earnings per share- (basic) |
$ | 0.28 | $ | 0.27 | $ | 0.26 | $ | 0.16 | $ | 0.20 | $ | 0.25 | $ | 0.23 | $ | 0.22 | ||||||||||||||||
| Earnings per share- (diluted) |
$ | 0.28 | $ | 0.27 | $ | 0.26 | $ | 0.16 | $ | 0.20 | $ | 0.25 | $ | 0.23 | $ | 0.21 | ||||||||||||||||
| Regular cash dividends |
$ | 0.11 | $ | 0.11 | $ | 0.10 | $ | 0.10 | $ | 0.10 | $ | 0.10 | $ | 0.10 | $ | 0.10 | ||||||||||||||||
| Special cash dividends |
NA | NA | NA | NA | $ | 0.05 | $ | 0.03 | $ | 0.11 | $ | 0.10 | ||||||||||||||||||||
| WEIGHTED AVERAGE SHARES OUTSTANDING |
||||||||||||||||||||||||||||||||
| Basic |
19,598,484 | 19,591,666 | 19,562,363 | 18,232,076 | 17,717,270 | 17,749,217 | 17,889,562 | 17,897,593 | ||||||||||||||||||||||||
| Diluted |
19,765,852 | 19,816,770 | 19,788,885 | 18,444,971 | 17,939,752 | 17,970,458 | 18,119,412 | 18,126,188 | ||||||||||||||||||||||||
17
Table of Contents
Investment Portfolio
The following chart contains information regarding the Company’s investment portfolio. All of the Company’s investment securities are accounted for as available-for-sale and are reported at estimated fair value. Temporary differences between estimated fair value and amortized cost, net of deferred taxes, are recorded as a separate component of shareholders’ equity. Credit-related other-than-temporary impairment is recognized against earnings as a realized loss in the period in which it is identified.
INVESTMENT PORTFOLIO
ESTIMATED FAIR VALUE
| December 31, | ||||||||||||
| 2015 | 2014 | 2013 | ||||||||||
| (dollars in thousands) | ||||||||||||
| Obligations of U.S. government agencies |
$ | 44,623 | $ | 39,185 | $ | 30,847 | ||||||
| Obligations of states and political subdivisions |
97,151 | 83,981 | 78,795 | |||||||||
| Private label mortgage-backed securities |
2,789 | 3,816 | 5,314 | |||||||||
| Mortgage-backed securities |
185,370 | 205,390 | 223,720 | |||||||||
| SBA pools |
35,772 | 19,574 | 8,710 | |||||||||
| Corporate securities |
893 | — | — | |||||||||
|
|
|
|
|
|
|
|||||||
| Total |
$ | 366,598 | $ | 351,946 | $ | 347,386 | ||||||
|
|
|
|
|
|
|
|||||||
The following chart presents the fair value of each investment category by maturity date and includes a weighted average yield for each period. Mortgage-backed and private label mortgage-backed securities have been classified based on their December 31, 2015, projected average lives.
SECURITIES AVAILABLE-FOR-SALE
| December 31, 2015 | ||||||||||||||||||||||||||||||||
| One Year or Less |
After One Year Through Five Years |
After Five Years Through Ten Years |
After Ten Years |
|||||||||||||||||||||||||||||
| Amount | Yield | Amount | Yield | Amount | Yield | Amount | Yield | |||||||||||||||||||||||||
| (dollars in thousands) | ||||||||||||||||||||||||||||||||
| Obligations of U.S. government agencies |
$ | 1,997 | 1.61 | % | $ | 12,626 | 1.78 | % | $ | 30,000 | 2.45 | % | $ | — | — | |||||||||||||||||
| Obligations of states and political subdivisions |
1,491 | 3.07 | % | 47,824 | 3.07 | % | 46,192 | 2.64 | % | 1,644 | 2.45 | % | ||||||||||||||||||||
| Private label mortgage-backed securities |
— | — | 2,352 | 5.54 | % | 437 | 4.64 | % | — | — | ||||||||||||||||||||||
| Mortgage-backed securities |
10,131 | 1.76 | % | 148,859 | 2.59 | % | 25,114 | 2.60 | % | 1,266 | 3.82 | % | ||||||||||||||||||||
| SBA variable rate pools |
— | — | 26,976 | 1.17 | % | 8,796 | 1.91 | % | — | — | ||||||||||||||||||||||
| Corporate securities |
893 | 1.87 | % | — | — | — | — | — | — | |||||||||||||||||||||||
|
|
|
|
|
|
|
|
|
|||||||||||||||||||||||||
| Total |
$ | 14,512 | 1.88 | % | $ | 238,637 | 2.51 | % | $ | 110,539 | 2.53 | % | $ | 2,910 | 3.04 | % | ||||||||||||||||
|
|
|
|
|
|
|
|
|
|||||||||||||||||||||||||
18
Table of Contents
Loan Portfolio
The following table contains period-end information related to the Company’s loan portfolio for each of the five years ended December 31, 2015.
LOAN PORTFOLIO
| December 31, | ||||||||||||||||||||
| 2015 | 2014 | 2013 | 2012 | 2011 | ||||||||||||||||
| Commercial and other loans |
$ | 508,556 | $ | 408,011 | $ | 391,229 | $ | 326,716 | $ | 274,156 | ||||||||||
| Real estate loans |
785,737 | 560,171 | 500,752 | 461,240 | 478,466 | |||||||||||||||
| Construction loans |
108,368 | 73,967 | 98,910 | 79,720 | 63,638 | |||||||||||||||
| Consumer loans |
3,351 | 3,862 | 3,878 | 3,581 | 4,569 | |||||||||||||||
|
|
|
|
|
|
|
|
|
|
|
|||||||||||
| 1,406,012 | 1,046,011 | 994,769 | 871,257 | 820,829 | ||||||||||||||||
| Deferred loan origination fees, net |
(1,530 | ) | (990 | ) | (924 | ) | (841 | ) | (677 | ) | ||||||||||
|
|
|
|
|
|
|
|
|
|
|
|||||||||||
| 1,404,482 | 1,045,021 | 993,845 | 870,416 | 820,152 | ||||||||||||||||
| Allowance for loan losses |
(17,301 | ) | (15,637 | ) | (15,917 | ) | (16,345 | ) | (14,941 | ) | ||||||||||
|
|
|
|
|
|
|
|
|
|
|
|||||||||||
| $ | 1,387,181 | $ | 1,029,384 | $ | 977,928 | $ | 854,071 | $ | 805,211 | |||||||||||
|
|
|
|
|
|
|
|
|
|
|
|||||||||||
The following table presents loan portfolio information by loan category related to maturity and repricing sensitivity. Variable rate loans are fully floating and can adjust at any time. Adjustable rate loans are fixed for a certain time period, but will adjust at a point in the future, prior to maturity. Variable and adjustable rate loans are included in the time frame in which the interest rate on the loan could be first adjusted. At December 31, 2015, the Company had approximately $59,830 of variable rate loans at their floors and $420,889 of adjustable rate loans at their floors that are included in the analysis below. These loans are included in the category of their next available repricing date.
MATURITY AND REPRICING DATA FOR LOANS
| December 31, 2015 | ||||||||||||||||||||
| Commercial | ||||||||||||||||||||
| and Other | Real Estate | Construction | Consumer | Total | ||||||||||||||||
| (dollars in thousands) | ||||||||||||||||||||
| Three months or less |
$ | 95,662 | $ | 63,237 | $ | 62,633 | $ | 2,579 | $ | 224,111 | ||||||||||
| Over three months through 12 months |
7,559 | 35,886 | 25,334 | 9 | 68,788 | |||||||||||||||
| Over 1 year through 3 years |
45,797 | 249,577 | 18,115 | 127 | 313,616 | |||||||||||||||
| Over 3 years through 5 years |
60,656 | 282,299 | 2,044 | 180 | 345,179 | |||||||||||||||
| Over 5 years through 15 years |
298,882 | 151,460 | 242 | 456 | 451,040 | |||||||||||||||
| Thereafter |
— | 3,278 | — | — | 3,278 | |||||||||||||||
|
|
|
|
|
|
|
|
|
|
|
|||||||||||
| Total loans |
$ | 508,556 | $ | 785,737 | $ | 108,368 | $ | 3,351 | $ | 1,406,012 | ||||||||||
|
|
|
|
|
|
|
|
|
|
|
|||||||||||
19
Table of Contents
Loan Concentrations
At December 31, 2015, loans to dental professionals totaled $340,162 and represented approximately 24.19% of outstanding loans. Approximately 63.59% of the Company’s loans were secured by real estate at December 31, 2015.
Nonperforming Assets
The following table presents period-end nonperforming loans and assets for the years ended December 31, 2015, 2014, 2013, 2012 and 2011:
NONPERFORMING ASSETS
| December 31, | ||||||||||||||||||||
| 2015 | 2014 | 2013 | 2012 | 2011 | ||||||||||||||||
| (dollars in thousands) | ||||||||||||||||||||
| Nonaccrual loans |
$ | 5,509 | $ | 2,695 | $ | 5,343 | $ | 9,361 | $ | 26,594 | ||||||||||
| 90 or more days past due and still accruing |
— | — | — | — | — | |||||||||||||||
|
|
|
|
|
|
|
|
|
|
|
|||||||||||
| Total nonperforming loans |
5,509 | 2,695 | 5,343 | 9,361 | 26,594 | |||||||||||||||
| Government guarantees |
(2,790 | ) | (706 | ) | (735 | ) | (905 | ) | (495 | ) | ||||||||||
|
|
|
|
|
|
|
|
|
|
|
|||||||||||
| Net nonperforming loans |
2,719 | 1,989 | 4,608 | 8,456 | 26,099 | |||||||||||||||
| Other real estate owned |
11,747 | 13,374 | 16,355 | 17,972 | 11,000 | |||||||||||||||
|
|
|
|
|
|
|
|
|
|
|
|||||||||||
| Total nonperforming assets |
$ | 14,466 | $ | 15,363 | $ | 20,963 | $ | 26,428 | $ | 37,099 | ||||||||||
|
|
|
|
|
|
|
|
|
|
|
|||||||||||
| Nonperforming assets as a percentage of total assets |
0.76 | % | 1.02 | % | 1.45 | % | 1.92 | % | 2.92 | % | ||||||||||
If interest on nonaccrual loans had been accrued, such income would have been approximately $194, $100, $421, $708 and $1,934, respectively, for the years ended December 31, 2015, 2014, 2013, 2012 and 2011.
20
Table of Contents
Allowance for Loan Losses
The following chart presents information about the Company’s allowance for loan losses. Management and the Board of Directors evaluate the allowance monthly and consider the amount to be adequate to absorb possible loan losses.
ALLOWANCE FOR LOAN LOSSES
| December 31, | ||||||||||||||||||||
| 2015 | 2014 | 2013 | 2012 | 2011 | ||||||||||||||||
| (dollars in thousands) | ||||||||||||||||||||
| Balance at beginning of year |
$ | 15,637 | $ | 15,917 | $ | 16,345 | $ | 14,941 | $ | 16,570 | ||||||||||
| Charges to the allowance |
||||||||||||||||||||
| Commercial and other loans |
(630 | ) | (610 | ) | (1,658 | ) | (1,401 | ) | (1,403 | ) | ||||||||||
| Real estate loans |
(61 | ) | (58 | ) | (407 | ) | (1,190 | ) | (5,555 | ) | ||||||||||
| Construction loans |
— | (155 | ) | — | (1,054 | ) | (8,792 | ) | ||||||||||||
| Consumer loans |
(9 | ) | (12 | ) | (23 | ) | (19 | ) | (54 | ) | ||||||||||
|
|
|
|
|
|
|
|
|
|
|
|||||||||||
| Total charges to the allowance |
(700 | ) | (835 | ) | (2,088 | ) | (3,664 | ) | (15,804 | ) | ||||||||||
| Recoveries against the allowance |
||||||||||||||||||||
| Commercial and other loans |
562 | 348 | 982 | 1,917 | 581 | |||||||||||||||
| Real estate loans |
76 | 186 | 360 | 55 | 176 | |||||||||||||||
| Construction loans |
16 | 16 | 60 | 1,188 | 498 | |||||||||||||||
| Consumer loans |
15 | 5 | 8 | 8 | 20 | |||||||||||||||
|
|
|
|
|
|
|
|
|
|
|
|||||||||||
| Total recoveries against the allowance |
669 | 555 | 1,410 | 3,168 | 1,275 | |||||||||||||||
|
|
|
|
|
|
|
|
|
|
|
|||||||||||
| Provisions |
1,695 | — | 250 | 1,900 | 12,900 | |||||||||||||||
|
|
|
|
|
|
|
|
|
|
|
|||||||||||
| Balance at end of the year |
$ | 17,301 | $ | 15,637 | $ | 15,917 | $ | 16,345 | $ | 14,941 | ||||||||||
|
|
|
|
|
|
|
|
|
|
|
|||||||||||
| Net charge offs as a percentage of total average loans |
0.00 | % | 0.03 | % | 0.70 | % | 0.06 | % | 1.74 | % | ||||||||||
| Allowance for loan losses as a percentage of gross loans |
1.23 | % | 1.49 | % | 1.60 | % | 1.88 | % | 1.82 | % | ||||||||||
The following table sets forth the allowance for loan losses allocated by loan type:
| December 31, | ||||||||||||||||||||||||||||||||||||||||
| 2015 | 2014 | 2013 | 2012 | 2011 | ||||||||||||||||||||||||||||||||||||
| (dollars in thousands) | ||||||||||||||||||||||||||||||||||||||||
| Amount | Percent of loans in each category to total loans |
Amount | Percent of loans in each category to total loans |
Amount | Percent of loans in each category to total loans |
Amount | Percent of loans in each category to total loans |
Amount | Percent of loans in each category to total loans |
|||||||||||||||||||||||||||||||
| Commercial and other loans |
$ | 6,349 | 36.20 | % | $ | 5,733 | 39.00 | % | $ | 5,113 | 39.30 | % | $ | 3,846 | 37.50 | % | $ | 2,776 | 33.50 | % | ||||||||||||||||||||
| Real estate loans |
8,297 | 55.90 | % | 7,494 | 53.50 | % | 7,668 | 50.40 | % | 9,456 | 53.00 | % | 8,267 | 58.20 | % | |||||||||||||||||||||||||
| Construction loans |
1,258 | 7.70 | % | 1,077 | 7.10 | % | 1,493 | 10.00 | % | 1,987 | 9.10 | % | 2,104 | 7.70 | % | |||||||||||||||||||||||||
| Consumer loans |
46 | 0.20 | % | 54 | 0.40 | % | 68 | 0.30 | % | 70 | 0.40 | % | 87 | 0.60 | % | |||||||||||||||||||||||||
| Unallocated |
1,351 | N/A | 1,279 | N/A | 1,575 | N/A | 986 | N/A | 1,707 | N/A | ||||||||||||||||||||||||||||||
|
|
|
|
|
|
|
|
|
|
|
|
|
|
|
|
|
|
|
|
|
|||||||||||||||||||||
| Allowance for loan losses |
$ | 17,301 | 100.00 | % | $ | 15,637 | 100.00 | % | $ | 15,917 | 100.00 | % | $ | 16,345 | 100.00 | % | $ | 14,941 | 100.00 | % | ||||||||||||||||||||
|
|
|
|
|
|
|
|
|
|
|
|
|
|
|
|
|
|
|
|
|
|||||||||||||||||||||
21
Table of Contents
During 2015, the Company recorded loan losses provision of $1,695. The Company did not record any provision for loan losses in 2014. At December 31, 2015, the Company’s recorded investment in impaired loans, net of government guarantees, was $7,527, with a specific allowance of $175 provided for in the ending allowance for loan losses. See Note 5 in the Notes to Consolidated Financial Statements in this Form 10-K for additional information regarding the Company’s allowance for loan losses.
While the Company saw improvement with regard to the overall credit quality of the loan portfolio in 2015, management cannot predict the level of the provision for loan losses, the level of the allowance for loan losses, or the level of nonperforming assets in future quarters as a result of continuing uncertain economic conditions. At December 31, 2015, and as shown above, the Company’s unallocated reserves were $1,351 or 7.81% of the total allowance for loan losses at year-end. Management believes that the allowance for loan losses at December 31, 2015, was adequate and that this level of unallocated reserves was prudent in light of the economic conditions and uncertainty that exists in the Northwest markets that the Company serves and the concentration in loans to dental professionals. See Note 6 in the Notes to Consolidated Financial Statements in this Form 10-K for additional information regarding the dental loan portfolio.
Deposits
Average balances and average rates paid by category of deposit are included in Management’s Discussion and Analysis of Financial Condition and Results of Operations in this Form 10-K. The chart below details period-end information related to the Company’s time deposits at December 31, 2015. The Company did not have any foreign deposits at December 31, 2015. Variable rate deposits are listed by first repricing opportunity.
TIME DEPOSITS
| December 31, 2015 | ||||||||||||
| Time of $100 or more |
Time of less than $100 |
Total Time | ||||||||||
| (dollars in thousands) | ||||||||||||
| <3 Months |
$ | 57,875 | $ | 3,149 | $ | 61,024 | ||||||
| 3-6 Months |
10,777 | 2,351 | 13,128 | |||||||||
| 6-12 Months |
13,374 | 2,581 | 15,955 | |||||||||
| >12 Months |
45,749 | 2,747 | 48,496 | |||||||||
|
|
|
|
|
|
|
|||||||
| $ | 127,775 | $ | 10,828 | $ | 138,603 | |||||||
|
|
|
|
|
|
|
|||||||
| Percentage of time deposits to total deposits |
8.00 | % | 0.68 | % | 8.68 | % | ||||||
Borrowings
The Company uses short-term borrowings to fund fluctuations in deposits and loan demand. The Bank has access to both secured and unsecured overnight borrowing lines. The secured borrowing lines are collateralized by loans. At December 31, 2015, the Company had secured borrowing lines with the Federal Home Loan Bank of Des Moines (the “FHLB”) and the Federal Reserve Bank of San Francisco (the “FRB”). At December 31, 2015, the FHLB borrowing line was limited by the amount of collateral pledged, which limited total borrowings to $422,362. The borrowing line with the FRB is limited by the value of discounted collateral pledged, which at December 31, 2015, was $76,912. At December 31, 2015, the Company also had unsecured borrowing lines with various correspondent banks totaling $129,000. At December 31, 2015, the Company had $0 in overnight borrowings outstanding on its unsecured borrowing lines. At December 31, 2015, there was $550,774 available on secured and unsecured borrowing lines with the FHLB, the FRB, and various correspondent banks.
22
Table of Contents
SHORT-TERM BORROWINGS
| December 31, | ||||||||||||
| 2015 | 2014 | 2013 | ||||||||||
| (dollars in thousands) | ||||||||||||
| Federal funds purchased, FHLB cash management advance, FRB, & short-term advances |
||||||||||||
| Average interest rate |
||||||||||||
| At year end |
0.34 | % | 0.48 | % | 0.25 | % | ||||||
| For the year |
0.18 | % | 0.40 | % | 0.32 | % | ||||||
| Average amount outstanding for the year |
$ | 129,665 | $ | 121,016 | $ | 124,671 | ||||||
| Maximum amount outstanding at any month-end |
$ | 117,000 | $ | 168,500 | $ | 158,740 | ||||||
| Amount outstanding at year-end |
$ | 47,000 | $ | 68,500 | $ | 124,150 | ||||||
In addition to the Company’s $47,000 in short-term borrowings outstanding at December, 31, 2015 the Company had $30,500 in long term FHLB borrowing, for a total of $77,500. The combined short and long-term borrowings had a weighted average interest rate of 1.07% and a remaining average maturity of approximately 1.25 years. More information on the Company’s long-term borrowings can be found in Note 12 in the Notes to Consolidated Financial Statements in this Form 10-K.
The Company’s other long-term borrowings consisted of $8,248 in junior subordinated debentures originated on November 28, 2005, and due on January 7, 2036. The interest rate on the debentures was 6.27% until January 2012 after which it was converted to a floating rate of three-month LIBOR plus 135 basis points. In April 2013, the Company entered into a swap agreement with a third party, which fixed the rate on its $8,000 of trust preferred securities at 2.73% for seven years.
| ITEM 1A | Risk Factors |
We are subject to numerous risks and uncertainties, including but not limited to the following information:
Industry Factors
The continued challenges in the U.S. and our region’s economies could have a material adverse effect on our future results of operations or market price of our stock; there can be no assurance that U.S. governmental measures responding to these challenges will successfully address these circumstances; the U.S. government continues to face significant fiscal and budgetary challenges which, if not resolved, may further exacerbate U.S. economic conditions.
The national economy and the financial services sector in particular are still facing challenges. A large percentage of our loans are to businesses in western Washington and Oregon, markets facing many of the same challenges as the national economy, including elevated unemployment and weakness in commercial and residential real estate values. Although some economic indicators are improving both nationally and in the markets we serve, there remains uncertainty regarding the strength of the economic recovery. A continued slow economic recovery could result in the following consequences, any of which could have an adverse impact, which may be material, on our business, financial condition, results of operations and prospects, and could also cause the market price of our stock to decline:
| • | Economic conditions may not stabilize, increasing the likelihood of credit defaults by borrowers. |
| • | Loan collateral values, especially as they relate to commercial and residential real estate, may decline, thereby increasing the severity of loss in the event of loan defaults. |
| • | Demand for banking products and services may decline, including loan products and services for low cost and noninterest-bearing deposits. |
| • | Changes and volatility in interest rates may negatively impact the yields on earning assets and the cost of interest-bearing liabilities. |
23
Table of Contents
Our earnings and growth are affected not only by general economic conditions, but also by the fiscal and monetary policies of the federal government, particularly the Federal Reserve. Refer to “Supervision and Regulation” in Item 1 of Part I of this Form 10-K for discussion of certain of these measures. In response to the adverse financial and economic developments that have, since 2008, impacted the U.S. and global economies and financial markets, and presented challenges for the banking and financial services industry and for our Company, various significant economic and monetary stimulus measures were implemented by the U.S. Congress. The Federal Reserve has pursued a highly accommodative monetary policy aimed at keeping interest rates at historically low levels although the Federal Reserve has begun to taper down certain aspects of this policy. See “— Fluctuating interest rates could adversely affect our profitability”. It cannot be predicted whether these or other U.S. governmental actions will result in lasting improvement in financial and economic conditions affecting the U.S. banking industry and the U.S. economy. It also cannot be predicted whether and to what extent the efforts of the U.S. government to combat the mixed economic conditions will continue. If, notwithstanding the government’s fiscal and monetary measures, the U.S. economy were to deteriorate, or its recovery were to slow, this would present significant challenges for the U.S. banking and financial services industry and for our Company.
The challenges to the level of economic activity in the U.S., and, therefore, to the banking industry, have also been exacerbated at times in recent years by extensive political disagreements regarding the statutory debt limit on U.S. federal government obligations and measures to address the substantial federal deficits. Following enactment of federal legislation in August 2011 which averted a default by the U.S. federal government on its sovereign obligations by raising the statutory debt limit and which established a process whereby cuts in federal spending may be accomplished, Standard & Poor’s Ratings Services (“Standard & Poor’s”) lowered its long-term sovereign credit rating on the U.S. to “AA+” from “AAA” while affirming its highest rating on short-term U.S. obligations. Standard & Poor’s also stated at the time that its outlook on the long-term rating remained negative; however, in June 2013, Standard & Poor’s revised its outlook on the U.S. credit rating to stable from negative. At the present time, both Fitch Ratings and Moody’s have reaffirmed the U.S.’s “AAA” credit rating and have stated that their outlooks on the long-term ratings continue to be stable. In the fourth quarter of 2015, Republican Congressional leaders and the Administration reached an agreement to modestly increase federal spending over the next two years, reduce spending on some social programs, and to raise the federal borrowing limit. After further negotiations between the Congress and the Administration, the President signed into law a compromise spending measure generally consistent with the initial compromise agreement. There can be no assurance that the earlier political disagreements regarding the federal budget and the substantial federal deficits will not occur again in the future. Any such future disagreements, if not resolved, could result in further downgrades by the rating agencies with respect to the obligations of the U.S. federal government. Any such further downgrades could increase over time the U.S. federal government’s cost of borrowing which may worsen its fiscal challenges, as well as generating upward pressure on interest rates generally in the U.S. which could, in turn, have adverse consequences for borrowers and the level of business activity.
The outcome and impact of these developments cannot be predicted with any certainty, but could have further adverse consequences for the credit ratings of U.S. debt and also present additional challenges for the U.S. economy and for the U.S. banking industry in general and for our business prospects as well. Any of the foregoing developments could generate further uncertainties and challenges for the U.S. economy which, in turn, could adversely affect the prospects of the banking industry in the U.S. and our business.
Tightening of credit markets and liquidity risk could adversely affect our business, financial condition and results of operations.
A tightening of the credit markets or any inability to obtain adequate funds at an acceptable cost for continued loan growth could adversely affect our asset growth and liquidity position and, therefore, our earnings capability. In addition to core deposit growth, maturity of investment securities, and loan payments, the Company also relies on wholesale funding sources including unsecured borrowing lines with correspondent banks, secured borrowing lines with the Federal Home Loan Bank of Seattle and the Federal Reserve Bank of San Francisco, public time certificates of deposits, and out-of-area and brokered time certificates of deposit. Our ability to access these funding sources could be impaired by deterioration in our financial condition as well as factors that are not specific to us, such as a disruption in the financial markets or negative views and expectations for the financial services industry or serious dislocation in the general credit markets. In the event such disruption should occur, our ability to access these funding sources could be adversely affected, both as to price and availability, which would limit, or potentially raise the cost of, the funds available to the Company.
24
Table of Contents
The FDIC has increased insurance premiums to rebuild and maintain the federal deposit insurance fund and there may be additional future premium increases and special assessments which would adversely affect our results of operations.
The Bank’s deposits are insured under the Federal Deposit Insurance Act, up to the maximum applicable limits, and are subject to deposit insurance assessments designed to tie what banks pay for deposit insurance more closely to the risks they pose. The Dodd-Frank Act broadened the base for FDIC insurance assessments. Assessments are now based on the average consolidated total assets less average tangible equity of a financial institution. In addition, the Dodd-Frank Act required the FDIC to increase the designated reserve ratio (the FDIC is required to set the reserve ratio each year) of the Deposit Insurance Fund from 1.15% to 1.35% of insured deposits; required that the fund meet that minimum ratio of insured deposits by 2020; and eliminated the requirement that the FDIC pay dividends to insured depository institutions when the reserve ratio exceeds certain thresholds. See “Supervision and Regulation- Deposit Insurance” in this Form 10-K.
Despite the FDIC’s actions to restore the deposit insurance fund, the fund may suffer additional losses in the future due to failures of insured institutions. There may be additional significant deposit insurance premium increases, special assessments or prepayments in order to restore the insurance fund’s reserve ratio. Any significant premium increases or special assessments could have a material adverse effect on the Company’s financial condition and results of operations.
Recent levels of market volatility were unprecedented and we cannot predict whether they will return.
From time-to-time since 2008, the capital and credit markets have experienced volatility and disruption at unprecedented levels. In some cases, the markets have produced downward pressure on stock prices and credit availability for certain issuers without regard to those issuers’ underlying financial strength. If similar levels of market disruption and volatility return, we could experience an adverse effect, which may be material, on our ability to access capital and funding and on our business, financial condition and results of operations.
We operate in a highly regulated environment and the effects of recent and pending federal legislation or of changes in, or supervisory enforcement of, banking or other laws and regulations could adversely affect us.
As discussed more fully in the section entitled “Supervision and Regulation” in this Form 10-K, we are subject to extensive regulation, supervision and examination by federal and state banking authorities. In addition, as a publicly traded company, we are subject to regulation by the SEC. Any change in applicable regulations or federal, state or local legislation could have a substantial impact on us and our operations. Additional legislation and regulations that could significantly affect our powers, authority and operations may be enacted or adopted in the future, which could have a material adverse effect on our financial condition and results of operations. New legislation and regulations are likely to increase the overall costs of regulatory compliance and, in many ways, have increased, or may increase in the future, the cost of doing business and present other challenges to the financial services industry.
Regulators have significant discretion and authority to prevent or remedy unsafe or unsound practices or violations of laws or regulations by financial institutions and bank holding companies in the performance of their supervisory and enforcement duties. In recent years, these powers have been utilized more frequently due to the serious national, regional and local economic conditions we are facing. The exercise of regulatory authority may have a negative impact on our financial condition and results of operations.
We cannot accurately predict the ultimate effects of recent legislation or the various governmental, regulatory, monetary and fiscal initiatives which have been and may be enacted on the financial markets, on the Company and on the Bank. The terms and costs of these activities, or the failure of these actions to help stabilize the financial markets, asset prices, market liquidity and a continuation or worsening of current financial market and economic conditions, could materially and adversely affect our business, financial condition, results of operations and the trading price of our common stock.
Fluctuating interest rates could adversely affect our profitability.
As is the case with many banks, our profitability is dependent to a large extent upon our net interest income, which is the difference between the interest earned on loans, securities and other interest-earning assets and interest paid on deposits, borrowings, and other interest-bearing liabilities. Because of the differences in maturities and repricing characteristics of our interest-earning assets and interest-bearing liabilities, changes in interest rates do not produce equivalent changes in interest income earned on interest-earning assets and interest paid on interest-bearing liabilities. Accordingly, fluctuations in interest rates could adversely affect, and has in past years, impacted, our net interest margin, and, in turn, our profitability. This impact could result in a decrease in our interest income relative to interest expense. Increases in interest rates may also adversely impact the value of our securities investment portfolio. At December 31, 2015, our balance sheet was liability sensitive, and an increase in interest rates could cause our net interest margin and our net interest income to decline. Since the financial crisis of
25
Table of Contents
2008, the banking industry has operated in an extremely low interest rate environment relative to historical averages, and the Federal Reserve has pursued highly accommodative monetary policies (including a very low Federal funds rate and substantial purchases of long-term U.S. Treasury and agency securities) in an effort to facilitate growth in the U.S. economy and a reduction in levels of unemployment. This environment has placed downward pressure on the net interest margins of U.S. banks, including the Bank. In December 2015, the Federal Reserve raised the target range for the federal funds rate from 1/4 to 1/2 percent. The Federal Reserve further indicated future policy actions to normalize interest rates will depend upon progress towards its objectives of maximum employment and two percent inflation, although the stance of monetary policy remains accommodative, and, even after employment and inflation are near its objectives, economic conditions may warrant for some time keeping the target federal funds rate below longer-term normal levels. The Federal Reserve also indicated that it intended to continue its policy of holding longer-term agency and Treasury securities at sizeable levels to help maintain accommodative financial conditions. The degree to which the Federal Reserve will continue its accommodative monetary policies, and the timing of any easing of those policies, will depend upon the Federal Reserve’s judgments regarding labor market conditions and the overall economic outlook, and are, therefore, subject to continuing uncertainty.
Company Factors
Our allowance for loan losses may not be adequate to cover actual loan losses, which could adversely affect our earnings.
We maintain an allowance for loan losses in an amount that we believe is adequate to provide for losses inherent in our loan portfolio. While we strive to carefully manage and monitor credit quality and to identify loans that may be deteriorating, at any time there are loans included in the portfolio that may result in losses, but that have not yet been identified as potential problem loans. Through established credit practices, we attempt to identify deteriorating loans and adjust the loan loss reserve accordingly. However, because future events are uncertain, there may be loans that deteriorate in an accelerated time frame. As a result, future additions to the allowance at elevated levels may be necessary. Because the loan portfolio contains a number of commercial real estate loans with relatively large balances, deterioration in the credit quality of one or more of these loans may require a significant increase to the allowance for loan losses. Future additions to the allowance may also be required based on changes in the financial condition of borrowers, such as have resulted due to the current, and potentially worsening, economic conditions. Additionally, federal banking regulators, as an integral part of their supervisory function, periodically review our allowance for loan losses. These regulatory agencies may require us to recognize further loan loss provisions or charge-offs based upon their judgments, which may be different from ours. Any increase in the allowance for loan losses would have an adverse effect, which may be material, on our financial condition and results of operations.
Concentration in real estate loans and further deterioration in the real estate markets we serve could require material increases in our allowance for loan losses and adversely affect our financial condition and results of operations.
We have a high degree of concentration in loans secured by real estate (see Note 5 in the Notes to Consolidated Financial Statements included in this Form 10-K). Further deterioration in the local economies we serve could have a material adverse effect on our business, financial condition and results of operations due to a weakening of our borrowers’ ability to repay these loans, higher default rates, and a decline in the value of the collateral securing these loans. In light of the continuing effects of the economic downturn, real estate values have been adversely affected. As we have experienced, significant declines in real estate collateral can occur quite suddenly as new appraisals are performed in the normal course of monitoring the credit quality of the loan. Significant declines in the value of real estate collateral due to new appraisals can occur due to declines in the real estate market, changes in methodology applied by the appraiser, and/or using a different appraiser than was used for the prior appraisal. Our ability to recover on these loans by selling or disposing of the underlying real estate collateral is adversely impacted by declining real estate values which increases the likelihood we will suffer losses on defaulted loans secured by real estate beyond the amounts provided for in the allowance for loan losses. This, in turn, could require material increases in our allowance for loan losses and adversely affects our financial condition and results of operations, perhaps materially.
We have a significant concentration in loans to dental professionals, and loan concentrations within one industry may create additional risk.
Bank regulatory authorities and investors generally view significant loan concentrations within any particular industry as carrying higher inherent risk than a loan portfolio without any significant concentration in one industry. We have a significant concentration of loans to dental professionals which represented 24.19% in principal amount of our total loan portfolio at December 31, 2015 (see Note 5 in the Notes to Consolidated Financial Statements included in this Form 10-K). While we
26
Table of Contents
apply credit practices which we believe to be prudent to these loans as well as all the other loans in our portfolio, due to our concentration in dental lending, we are exposed to the general risks of industry concentration, which include adverse market factors impacting that industry alone or disproportionately to other industries. In addition, bank regulatory authorities may in the future require us to limit additional lending in the dental industry if they have concerns that our concentration in that industry creates significant risks, which in turn could limit our ability to pursue new loans in an area where we believe we currently have a competitive advantage.
Nonperforming assets take significant time to resolve and adversely affect our results of operations and financial condition.
At December 31, 2015, our nonperforming loans (which include all nonaccrual loans, net of government guarantees) were 0.19% of the loan portfolio. At December 31, 2015, our nonperforming assets (which include foreclosed real estate) were 0.76% of total assets. Nonperforming loans and assets adversely affect our net income in various ways. Until economic and market conditions improve, we expect to continue to incur losses relating to nonperforming assets. We generally do not record interest income on nonperforming loans or other real estate owned, thereby adversely affecting our income and increasing our loan administration costs. When we take collateral in foreclosures and similar proceedings, we are required to mark the related asset to the then fair market value of the collateral, less estimated selling expenses, which may ultimately result in a loss. An increase in the level of nonperforming assets increases our risk profile and may impact the capital levels our regulators believe are appropriate in light of the ensuing risk profile. While we reduce problem assets through loan sales, workouts, and restructurings and otherwise, decreases in the value of the underlying collateral, or in these borrowers’ performance or financial condition, whether or not due to economic and market conditions beyond our control, could adversely affect our business, results of operations and financial condition, perhaps materially. In addition, the resolution of nonperforming assets requires significant commitments of time from management and our directors which can be detrimental to the performance of their other responsibilities. Any significant future increase in nonperforming assets could have a material adverse effect on our business, financial condition and results of operations.
We may not have the ability to continue paying dividends on our common stock at current or historic levels.
On January 20, 2016, we announced a quarterly cash dividend of $0.11 per share, payable to shareholders on February 16, 2016. For the year ended December 31, 2015, the Company paid $0.42 per share in dividends and has historically declared dividends quarterly. Our ability to pay dividends on our common stock depends on a variety of factors. It is possible in the future that we may not be able to continue paying quarterly dividends commensurate with historic levels, if at all. As a holding company, a substantial portion of our cash flow typically comes from dividends our bank subsidiary pays to us. Cash dividends will depend on sufficient earnings to support them and adherence to bank regulatory requirements. If the Bank is not able to pay dividends to the Company, the Company may not be able to pay dividends on its common stock. Consequently, the inability to receive dividends from the Bank could adversely affect the Company’s financial condition, results of operations and prospects.
Changes in accounting standards could materially impact our financial statements.
From time to time, the Financial Accounting Standards Board (FASB) and the SEC change the financial accounting and reporting standards that govern the preparation of our consolidated financial statements or new interpretations of existing standards emerge as standard industry practice. These changes can be very difficult to predict and can materially impact how we record and report our financial condition and results of operations. In some cases, we could be required to apply a new or revised standard retrospectively, resulting in our restating prior period financial statements.
We may be required, in the future, to recognize impairment with respect to investment securities, including the FHLB stock we hold.
Our securities portfolio contains whole loan private mortgage-backed securities and municipal securities and currently includes securities with unrecognized losses. We may continue to observe volatility in the fair market value of these securities. We evaluate the securities portfolio for any other than temporary impairment (“OTTI”) each reporting period, as required by GAAP. Future evaluations of the securities portfolio could require us to recognize impairment charges. The credit quality of securities issued by certain municipalities has deteriorated in recent quarters. Although management does not believe the credit quality of the Company’s municipal securities has similarly deteriorated, such deterioration could occur in the future. For example, it is possible that government-sponsored programs to allow mortgages to be refinanced to lower rates could materially adversely impact the yield on our portfolio of mortgage-backed securities, since a significant portion of our investment portfolio is composed of such securities.
27
Table of Contents
In addition, as a condition to membership in the FHLB, we are required to purchase and hold a certain amount of FHLB stock. Our stock purchase requirement is based, in part, upon the outstanding principal balance of advances from the FHLB. At December 31, 2015, we had stock in the FHLB totaling $5,208. The FHLB stock held by us is carried at cost and is subject to recoverability testing under applicable accounting standards. As of December 31, 2015, we did not recognize an impairment charge related to our FHLB stock holdings. Future negative changes to the financial condition of the FHLB could require us to recognize an impairment charge with respect to such holdings.
If the goodwill we have recorded in connection with acquisitions becomes impaired, it could have an adverse impact on our reported earnings.
At December 31, 2015, we had $39,255 of goodwill on our balance sheet. In accordance with GAAP, our goodwill is not amortized but rather evaluated for impairment on an annual basis or more frequently if events or circumstances indicate that a potential impairment exists. Such evaluation is based on a variety of qualitative and quantitative factors, including macroeconomic conditions, industry and market conditions, cost factors, overall financial performance, and other relevant entity-specific events. The last impairment test was performed at December 31, 2015. At December 31, 2015, we did not recognize an impairment charge related to our goodwill. Future evaluations of goodwill may result in findings of impairment and write-downs, which would impact our operating results and could be material.
We face strong competition from financial services companies and other companies that offer financial services.
Our three major markets are in Oregon and Washington. The banking and financial services businesses in our market area are highly competitive, and increased competition may adversely impact the level of our loans and deposits. Ultimately, we may not be able to compete successfully against current and future competitors. These competitors include national banks, foreign banks, regional banks and other community banks. We also face competition from many other types of financial institutions, including savings and loan associations, finance companies, brokerage firms, insurance companies, credit unions, mortgage banks and other financial intermediaries. In particular, our competitors include major financial companies whose greater resources may afford them a marketplace advantage by enabling them to maintain numerous locations and mount extensive promotional and advertising campaigns. Areas of competition include interest rates for loans and deposits, efforts to obtain loan and deposit customers and a range in quality of products and services provided, including new technology-driven products and services. We have also seen an increase in competition relative to our national dental lending program. If we are unable to attract and retain banking customers, we may be unable to develop loan growth or maintain our current level of deposits, which could adversely affect our business, financial condition and results of operations.
A failure in our operational systems or infrastructure, or those of third-parties, could impair our liquidity, disrupt our businesses, result in the unauthorized disclosure of confidential information, damage our reputation and cause financial losses.
We are dependent on third-parties and their ability to process and monitor, on a daily basis, a large number of transactions, many of which are highly complex, across numerous and diverse markets. These transactions, as well as the information technology services we provide to clients, often must adhere to client-specific guidelines, as well as legal and regulatory standards. Due to the breadth of our client base and our geographical reach, developing and maintaining our operational systems and infrastructure is challenging, particularly as a result of rapidly evolving legal and regulatory requirements and technological shifts. Our financial, accounting, data processing or other operating systems and facilities may fail to operate properly or become disabled as a result of events that are wholly or partially beyond our control, such as electrical, internet or telecommunications outages, a spike in transaction volume, a cybersecurity attack or other unforeseen catastrophic events, which may adversely affect our ability to process these transactions or provide services.
In addition, our operations rely on the secure processing, storage, transmission and reporting of personal, confidential and other sensitive information or data on our computer systems, networks and business applications. Although we take numerous protective measures to maintain the confidentiality, integrity and availability of our and our clients’ information across all geographic and product lines, and endeavor to modify these protective measures as circumstances warrant, the nature of the threats continues to evolve. As a result, our computer systems, software and networks may be vulnerable to breaches, unauthorized access, loss or destruction of data (including confidential client information), account takeovers, unavailability of service, computer viruses or other malicious code, cybersecurity attacks and other events that could have an adverse security
28
Table of Contents
impact and significant negative consequences to us. Despite the defensive measures we take to manage our internal technological and operational infrastructure, these threats may originate externally from third-parties, such as foreign governments, organized crime and other hackers, and outsource or infrastructure-support providers and application developers, or the threats may originate from within our organization. These events could result in litigation or financial losses that are either not insured against or not fully covered by insurance, regulatory consequences or reputational harm, any of which could harm our competitive position, operating results and financial condition. These types of incidents can remain undetected for extended periods of time, thereby increasing the associated risks. We may also be required to expend significant resources to modify our protective measures or to investigate and remediate vulnerabilities or exposures arising from cybersecurity risks.
We also face the risk of operational disruption, failure, termination or capacity constraints of any of the third-parties that facilitate our business activities, including exchanges, clearing agents, clearing houses or other financial intermediaries. Such parties could also be the source of an attack on, or breach of, our operational systems, data or infrastructure. In addition, as interconnectivity with our clients grows, we increasingly face the risk of operational failure with respect to our clients’ systems.
Other financial institutions have been the target of various denial-of-service or other cyberattacks as part of what appears to be a coordinated effort to disrupt the operations of financial institutions and potentially test their cybersecurity in advance of future and more advanced cyberattacks. These denial-of-service attacks require substantial resources to defend, and may affect customer satisfaction and behavior. In addition, there have been increasing efforts on the part of third parties to breach data security at financial institutions as well as the other types of companies, such as large retailers, or with respect to financial transactions, including through the use of social engineering schemes such as “phishing”. The ability of our customers to bank remotely, including online and through mobile devices, requires secure transmissions of confidential information and increase the risk of data security breaches which would expose us to financial claims by customers or others and which could adversely affect our reputation. Even if cyberattacks and similar tactics are not directed specifically at the Bank, such attacks on other large financial institutions could disrupt the overall functioning of the financial systems and undermine consumer confidence in banks generally, to the detriment of other financial institutions, including the Bank.
In March of 2015, the Federal bank regulators issued two related statements regarding cybersecurity. One statement indicates that financial institutions should design multiple layers of security controls to establish lines of defense and to ensure that their risk management processes also address the risk posed by compromised customer credentials, including security measures to reliably authenticate customers accessing internet-based services of the financial institution. The other statement indicates that a financial institution’s management is expected to maintain sufficient business continuity planning processes to ensure the rapid recovery, resumption and maintenance of the institution’s operations after a cyberattack involving destructive malware. A financial institution is also expected to develop appropriate processes that enable recovery of data and business operations and that address rebuilding network capabilities and restoring data if the institution or its critical service providers fall victim to this type of cyberattack. Although these regulatory statements state that they do not contain any new regulatory expectations, we are continuing to evaluate them, as they do indicate that the regulators regard cybersecurity to be a matter of great importance for U.S. financial institutions. A financial institution which fails to observe the regulatory guidance could be subject to various regulatory sanctions, including financial sanctions.
In July of 2015, the Federal bank regulators announced the issuance of a cybersecurity assessment tool, the output of which can assist a financial institution’s senior management and board of directors in assessing the institution’s cybersecurity risk and preparedness. The first part of the assessment tool is the inherent risk profile, which aims to assist management in determining an institution’s level of cybersecurity risk. The second part of the assessment tool is cybersecurity maturity, which is designed to help management assess whether their controls provide the desired level of preparedness. The Federal bank regulators plan to utilize the assessment tool as part of their examination process when evaluating financial institutions’ cybersecurity preparedness in information technology and safety and soundness examinations and inspections. Failure to effectively utilize this tool could result in regulatory criticism. Significant resources may be required to adequately implement the tool and address any assessment concerns regarding preparedness. We are evaluating the impact of this assessment tool.
To date we have not experienced any material losses relating to a cybersecurity incident or other information security breaches, but there can be no assurance that we will not suffer such losses or information security breaches in the future. If one or more of these events occurs, it could potentially jeopardize the confidential, proprietary and other information processed and stored in, and transmitted through, our computer systems and networks, or otherwise cause interruptions or malfunctions in our, as well as our clients’ or other third-parties’, operations which could result in damage to our reputation, substantial costs, regulatory penalties and/or client dissatisfaction or loss. Potential costs of a cybersecurity incident may include, but would not be limited to, remediation costs, increased protection costs, lost revenue from the unauthorized use of proprietary information or the loss of current and/or future customers, and litigation.
29
Table of Contents
We maintain an insurance policy which we believe provides sufficient coverage at a manageable expense for an institution of our size and scope with similar technological systems. However, we cannot assure that this policy would be sufficient to cover all financial losses, damages, penalties, including lost revenues, should we experience any one or more of our or a third-party’s systems failing or experiencing attack.
Our business and financial results could be impacted materially by adverse results in legal or regulatory proceedings.
As is the case with other banking institutions, we are from time to time subject to claims and proceedings related to our present or previous operations. In addition, we may be the subject of governmental investigations and other forms of regulatory inquiry from time to time. The results of these legal proceedings and governmental investigations and inquiries could lead to significant monetary damages or penalties, restrictions on the way in which we conduct our business, or reputational harm, and could involve significant defense or other costs. Although we establish accruals for legal proceedings when information related to the loss contingencies represented by those matters indicates both that a loss is probable and that the amount of loss can be reasonably estimated, we do not have accruals for all legal proceedings where we face a risk of loss. In addition, amounts accrued may not represent the ultimate loss to us from the legal proceedings in question. Thus, our ultimate losses may be higher or lower, and possibly significantly so, than the amounts accrued for legal loss contingencies. To mitigate the cost of some of these claims, we maintain insurance coverage in amounts and with deductibles that we believe are appropriate for our operations. However, our insurance coverage does not cover any civil money penalties or fines imposed by government authorities and may not cover all other claims that have been or might be brought against us, or continue to be available to us at a reasonable cost. As a result, we may be exposed to substantial uninsured liabilities, which could adversely affect our business, prospects, results of operations and financial condition.
Risks associated with potential acquisitions and expansion activities or divestitures may disrupt our business and adversely affect our operating results.
We regularly evaluate potential acquisitions and expansion opportunities. We have in the past, and may in the future, seek to expand our business by acquiring other businesses which we believe will enhance our business. We cannot predict the frequency, size or timing of our acquisitions, as this will depend on the availability of prospective target opportunities at valuation levels we find attractive and the competition for such opportunities from other parties. There can be no assurance that our acquisitions will have the anticipated positive results, including results related to: the total cost of integration; the retention of key personnel; the time required to complete the integration; the amount of longer-term cost savings; continued growth; or the overall performance of the acquired company or combined entity. We also may encounter difficulties in obtaining required regulatory approvals and unexpected contingent liabilities can arise from the businesses we acquire. Further, the asset quality or other financial characteristics of a business or assets we may acquire may deteriorate after an acquisition agreement is signed or after an acquisition closes, which could result in impairment or other expenses and charges which would reduce our operating results. Integration of an acquired business can be complex and costly. If we are not able to integrate successfully past or future acquisitions, there is a risk that results of operations could be adversely affected. To the extent that we grow through acquisitions, there is a risk that we will not be able to adequately or profitably manage this growth. In addition, we may sell or restructure portions of our business. Any divestitures or restructuring may result in significant expenses and write-offs, which would have a material adverse effect on our business, results of operations and financial condition, and may involve additional risks, including difficulties in obtaining any required regulatory approvals, the diversion of management’s attention from other business concerns, the disruption of our business and the potential loss of key employees. We may not be successful in addressing these or any other significant risks encountered in connection with any acquisition or divestitures we might make.
We may pursue additional capital in the future, which could dilute the holders of our outstanding common stock and may adversely affect the market price of our common stock.
From time to time, particularly in the current uncertain economic environment, we may consider alternatives for raising capital when opportunities present themselves, in order to further strengthen our capital and/or better position ourselves to take advantage of identified or potential opportunities that may arise in the future. Such alternatives may include issuance and sale of common or preferred stock, or borrowings by the Company, with proceeds contributed to the Bank. Any such capital raising alternatives could dilute the holders of our outstanding common stock and may adversely affect the market price of our common stock.
30
Table of Contents
Anti-takeover provisions in our amended and restated articles of incorporation and bylaws and Oregon law could make a third-party acquisition of us difficult.
Our amended and restated articles of incorporation contain provisions that could make it more difficult for a third-party to acquire us (even if doing so would be beneficial to our shareholders) and for holders of our common stock to receive any related takeover premium for their common stock. We are also subject to certain provisions of Oregon law that could delay, deter or prevent a change in control of us. These provisions could limit the price that investors might be willing to pay in the future for shares of our common stock.
| ITEM 1B | Unresolved Staff Comments |
None
| ITEM 2 | Properties |
The principal properties of the Company are comprised of the banking facilities owned by the Bank. At December 31, 2015 the Bank operated 15 full-service facilities and three loan production offices. The Bank owns a total of eight buildings and, with the exception of two of those buildings, owns the land on which these buildings are situated. Significant properties owned by the Bank are as follows:
| 1) | Three-story building and land with approximately 35,000 square feet located on Olive Street in Eugene, Oregon. |
| 2) | Building with approximately 4,000 square feet located on West 11th Avenue in Eugene, Oregon. The building is on leased land. |
| 3) | Building and land with approximately 8,000 square feet located on High Street in Eugene, Oregon. |
| 4) | Three-story building and land with approximately 36,000 square feet located in Springfield, Oregon. The Company occupies approximately 5,500 square feet of the first floor and approximately 10,763 square feet on the second floor and leases, or is seeking to lease, the remaining space. |
| 5) | Building and land with approximately 4,000 square feet located in Beaverton, Oregon. |
| 6) | Building and land with approximately 2,000 square feet located in Junction City, Oregon. |
| 7) | Building and land with approximately 5,000 square feet located near the Convention Center in Portland, Oregon. |
| 8) | Building with approximately 7,000 square feet located at the Nyberg Shopping Center in Tualatin, Oregon. The building is on leased land. |
The Bank leases facilities for branch offices in Eugene, Oregon, Portland, Oregon, Seattle, Washington, Bellevue, Washington, and Vancouver, Washington. The Company also leases facilities for a loan production office in Tacoma, Washington. In addition, the Company leases a portion of an adjoining building to the High Street office in Eugene, Oregon for administrative and training functions. Management considers all owned and leased facilities adequate for current use.
| ITEM 3 | Legal Proceedings |
On August 23, 2013, a putative class action lawsuit (“Class Action”) was filed in the Circuit Court of the State of Oregon for the County of Multnomah on behalf of individuals who placed money with Berjac of Oregon and Berjac of Portland (collectively, “Berjac”). The Berjac entities merged and the surviving company, Berjac of Oregon, is currently in Chapter 7 bankruptcy. The Class Action complaint, which has been amended several times, currently asserts three claims against Pacific Continental Bank, Fred “Jack” W. Holcomb, Holcomb Family Limited Partnership, Jones & Roth, P.C., and Umpqua Bank, as defendants. The lawsuit asserts that Pacific Continental Bank is jointly and severally liable for materially aiding or participating in Berjac’s sales of securities in violation of the Oregon Securities Law. Claimants seek the return of the money placed with Berjac of Oregon and Berjac of Portland, plus interest, and costs and attorneys’ fees. The current version of the complaint seeks $44 million in damages from all defendants.
After a lengthy proceeding to determine whether jurisdiction over the Class Action is properly in the state or federal court, on January 14, 2015, the federal court ruled that jurisdiction is properly in the state court. The Class Action is now pending in the Circuit Court of the State of Oregon for the County of Multnomah. Pacific Continental Bank and the other defendants filed motions to dismiss. The court declined to dismiss the claims against Pacific Continental Bank and the other defendants other than Jones & Roth, P.C. Plaintiffs have sought leave to reassert their claims against Jones & Roth, P.C.
31
Table of Contents
On August 28, 2014, the court-appointed bankruptcy trustee for Berjac of Oregon filed an adversary complaint (Trustee’s Lawsuit) in the U.S. Bankruptcy Court for the District of Oregon alleging that the Company, the Bank, Umpqua Bank, Century Bank and Summit Bank provided lines of credit that enabled continuation of the alleged Ponzi scheme operated by Berjac of Oregon and the two partners of the pre-existing Berjac general partnerships, Michael Holcomb and Gary Holcomb. Pacific Continental Corporation acquired Century Bank on February 1, 2013. The Trustee’s Lawsuit was transferred from the U.S. Bankruptcy Court to the U.S. District Court for the District of Oregon (Eugene Division), where it is currently pending.
In addition to seeking an award of punitive damages, the trustee is asserting fraudulent transfer law and unjust enrichment in an effort to recover payments made by Berjac to Century Bank and Pacific Continental Bank. Among other claims for relief, the trustee is seeking the disgorgement of monies advanced to the Holcomb Family Limited Partnership by Century Bank and returned to the estate by court order following the post-petition cash collateral hearing, and of monies received by Pacific Continental Bank from the proceeds of the sale of stock held by the Holcomb Family Limited Partnership and securing one of the lines of credit previously held by Century Bank. The trustee also asserts a claim for alleged aiding and abetting of breaches of duties owed to Berjac. The complaint in the Trustee’s Lawsuit indicates the range of damages sought by the trustee which include, among other claims for relief, an award of punitive damages not to exceed $10 million, recovery of payments associated with allegedly fraudulent transfers totaling up to approximately $55.3 million, including up to $20.7 million from Century Bank and up to $7.7 million from Pacific Continental Bank. On September 4, 2015, the Company’s and the Bank’s joint motion to dismiss was granted, in part, by the U.S. District Court for the District of Oregon. All claims against the Company and six of the eight claims against the Bank were dismissed, but the trustee was allowed to amend the complaint and the claims against the Company and the Bank in certain respects. The trustee filed a Second Amended Complaint on October 16, 2015, reasserting the claims against the Company and the Bank. The trustee also filed a motion asking the court to reconsider three of its rulings dismissing certain claims against the Bank, and that motion is pending. On November 16, 2015, the court stayed all deadlines in the Trustee’s Lawsuit and all parties were ordered to participate in a judicial settlement conference. The judicial settlement conference is ongoing.
We may from time to time be involved in claims, proceedings and litigation arising from our business and property ownership. Based on currently available information, the Company does not expect that the results of such proceedings, including the above-described proceeding, in the aggregate, to have a material adverse effect on our financial condition.
| ITEM 4 | Mine Safety Disclosures |
Not applicable.
| ITEM 5 | Market for Registrant’s Common Equity, Related Stockholder Matters and Issuer Purchases of Equity Securities |
Market Information and Shareholders
The Company’s common stock is traded on the NASDAQ Global Select Market under the symbol “PCBK”. At February 29, 2016, the Company had 19,604,780 shares of common stock outstanding held by approximately 4,501 beneficial shareholders.
The high, low and closing sales prices (based on daily closing price) for the last eight quarters are shown in the table below.
| YEAR | 2015 | 2014 | ||||||||||||||||||||||||||||||
| QUARTER | Fourth | Third | Second | First | Fourth | Third | Second | First | ||||||||||||||||||||||||
| Market value: |
||||||||||||||||||||||||||||||||
| High |
$ | 16.11 | $ | 13.63 | $ | 13.95 | $ | 13.81 | $ | 14.48 | $ | 14.18 | $ | 14.81 | $ | 16.02 | ||||||||||||||||
| Low |
13.10 | 12.63 | 12.74 | 12.64 | 12.83 | 12.85 | 13.07 | 13.32 | ||||||||||||||||||||||||
| Close |
14.88 | 13.31 | 13.53 | 13.22 | 14.18 | 12.85 | 13.73 | 13.76 | ||||||||||||||||||||||||
32
Table of Contents
Dividends
The Company has generally paid cash dividends on a quarterly basis. Cash dividends, when and if declared, are typically declared and announced simultaneously with the Company’s quarterly earnings releases in January, April, July, and October each year with dividends, if any, to be paid in February, May, August, and November. The Board of Directors considers the dividend amount quarterly and takes a broad perspective in its dividend deliberations, including a review of recent operating performance, capital levels, and concentrations of loans as a percentage of capital, as well as growth projections. The Board also considers dividend payout ratios, dividend yield, and other financial metrics in setting the quarterly dividend. Regulatory authorities may prohibit the Company from paying dividends in a manner that would constitute an unsafe or unsound banking practice or would reduce the amount of its capital below that necessary to meet minimum applicable regulatory capital requirements. Current guidance from the Federal Reserve provides, among other things, that dividends per share generally should not exceed earnings per share, measured over the previous four fiscal quarters.
| YEAR | 2015 | 2014 | ||||||||||||||||||||||||||||||
| QUARTER | Fourth | Third | Second | First | Fourth | Third | Second | First | ||||||||||||||||||||||||
| Regular cash dividend |
$ | 0.11 | $ | 0.11 | $ | 0.10 | $ | 0.10 | $ | 0.10 | $ | 0.10 | $ | 0.10 | $ | 0.10 | ||||||||||||||||
| Special cash dividend |
— | — | — | — | 0.05 | 0.03 | 0.11 | 0.10 | ||||||||||||||||||||||||
|
|
|
|
|
|
|
|
|
|
|
|
|
|
|
|
|
|||||||||||||||||
| Total dividend |
$ | 0.11 | $ | 0.11 | $ | 0.10 | $ | 0.10 | $ | 0.15 | $ | 0.13 | $ | 0.21 | $ | 0.20 | ||||||||||||||||
|
|
|
|
|
|
|
|
|
|
|
|
|
|
|
|
|
|||||||||||||||||
| Dividend payout ratio |
39.29 | % | 40.74 | % | 38.46 | % | 62.50 | % | 60.00 | % | 56.52 | % | 100.00 | % | 100.00 | % | ||||||||||||||||
Equity Compensation Plan Information
| Year Ended December 31, 2015 | ||||||||||||
| Number of shares to be | Number of shares remaining | |||||||||||
| issued upon exercise of | Weighted-average exercise | available for future issuance | ||||||||||
| outstanding options, warrants and rights (2) |
price of outstanding options, warrants and rights (2) (3) |
under equity compensation plans(2) |
||||||||||
| Equity compensation plans approved by security holders(1) |
889,717 | $ | 14.29 | 361,245 | ||||||||
| Equity compensation plans not approved by security holders |
— | — | — | |||||||||
|
|
|
|
|
|
|
|||||||
| Total |
889,717 | $ | 14.29 | 361,245 | ||||||||
|
|
|
|
|
|
|
|||||||
| (1) | Under the Company’s respective equity compensation plans, the Company may grant incentive stock options and non-qualified stock options, restricted stock, restricted stock units and stock appreciation rights to its employees and directors; however, only employees may receive incentive stock options. |
| (2) | Amounts have been adjusted to reflect subsequent stock splits and stock dividends. |
| (3) | Weighted average exercise price is based on equity grants which have an exercise price. |
Share Repurchase Plan
On July 27, 2015, the Company adopted a repurchase plan providing for authority to purchase up to five percent of the Company’s outstanding shares. There were no shares repurchased under the plan during the twelve months ended December 31, 2015.
33
Table of Contents
Performance Graph
The information contained in the following chart entitled “Total Return Performance” is not considered to be “soliciting material,” or “filed,” or incorporated by reference in any past or future filing by the Company under the Securities Exchange Act of 1934 or the Securities Act of 1933 unless and only to the extent that the Company may specifically incorporate it by reference.
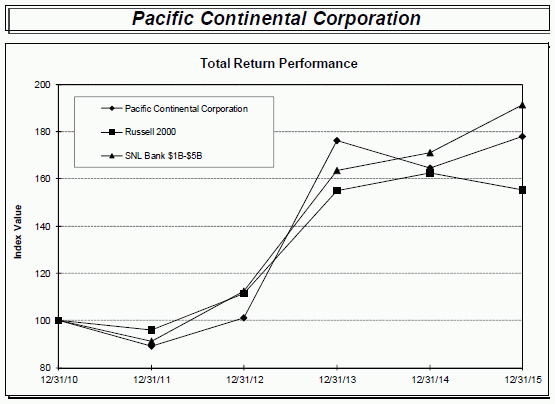
| Period Ended | ||||||||||||||||||||||||
| Index |
12/31/10 | 12/31/11 | 12/31/12 | 12/31/13 | 12/31/14 | 12/31/15 | ||||||||||||||||||
| Pacific Continental Corporation |
100.00 | 88.96 | 101.21 | 176.01 | 164.42 | 178.03 | ||||||||||||||||||
| Russell 2000 |
100.00 | 95.82 | 111.49 | 154.78 | 162.35 | 155.18 | ||||||||||||||||||
| SNL Bank $1B-$5B |
100.00 | 91.20 | 112.45 | 163.52 | 170.98 | 191.39 | ||||||||||||||||||
The above graph and following table compares the total cumulative shareholder return on the Company’s Common Stock, based on reinvestment of all dividends, to the cumulative total returns of the Russell 2000 Index and SNL Securities $1 Billion to $5 Billion Bank Asset Size Index. The graph assumes $100 invested on December 31, 20010, in the Company’s Common Stock and each of the indices.
34
Table of Contents
| ITEM 6 | Selected Financial Data |
Selected financial data for the past five years is shown in the table below. (Dollars in thousands, except for per share data)
| For the year ended December 31, | ||||||||||||||||||||
| 2015 | 2014 | 2013 | 2012 | 2011 | ||||||||||||||||
| (in thousands, except per share data) | ||||||||||||||||||||
| Net interest income |
$ | 69,800 | $ | 57,448 | $ | 56,139 | $ | 50,076 | $ | 51,169 | ||||||||||
| Provision for loan losses |
1,695 | — | 250 | 1,900 | 12,900 | |||||||||||||||
| Noninterest income |
6,625 | 4,995 | 5,826 | 5,741 | 5,866 | |||||||||||||||
| Noninterest expense |
45,890 | 37,729 | 40,732 | 35,105 | 37,076 | |||||||||||||||
| Income tax expense |
10,089 | 8,672 | 7,216 | 6,159 | 1,718 | |||||||||||||||
| Net income |
18,751 | 16,042 | 13,767 | 12,653 | 5,341 | |||||||||||||||
| Cash dividends |
8,041 | 12,308 | 13,050 | 5,588 | 1,842 | |||||||||||||||
| Per common share data |
||||||||||||||||||||
| Net income: |
||||||||||||||||||||
| Basic |
$ | 0.97 | $ | 0.90 | $ | 0.77 | $ | 0.70 | $ | 0.29 | ||||||||||
| Diluted |
0.97 | 0.89 | 0.76 | 0.69 | 0.29 | |||||||||||||||
| Regular cash dividends |
$ | 0.420 | $ | 0.40 | $ | 0.36 | $ | 0.24 | $ | 0.10 | ||||||||||
| Special cash dividends |
— | 0.29 | 0.37 | 0.07 | — | |||||||||||||||
|
|
|
|
|
|
|
|
|
|
|
|||||||||||
| Total dividends |
$ | 0.42 | $ | 0.69 | $ | 0.73 | $ | 0.31 | $ | 0.10 | ||||||||||
| Book value |
$ | 11.15 | $ | 10.39 | $ | 10.01 | $ | 10.28 | $ | 9.70 | ||||||||||
| Tangible book value(1) |
8.94 | 9.07 | 8.69 | 9.05 | 8.50 | |||||||||||||||
| Market value, end of year |
14.88 | 14.18 | 15.94 | 9.73 | 8.85 | |||||||||||||||
| At year end |
||||||||||||||||||||
| Assets |
$ | 1,909,478 | $ | 1,504,325 | $ | 1,449,726 | $ | 1,373,487 | $ | 1,270,232 | ||||||||||
| Gross loans (2) |
1,404,482 | 1,045,021 | 993,845 | 870,416 | 820,152 | |||||||||||||||
| Allowance for loan losses |
(17,301 | ) | (15,637 | ) | (15,917 | ) | (16,345 | ) | (14,941 | ) | ||||||||||
| Available-for-sale securities |
366,598 | 351,946 | 347,386 | 389,885 | 346,542 | |||||||||||||||
| Core deposits (3) |
1,533,942 | 1,110,861 | 990,315 | 938,629 | 885,843 | |||||||||||||||
| Total deposits |
1,597,093 | 1,209,093 | 1,090,981 | 1,046,154 | 965,254 | |||||||||||||||
| Shareholders’ equity |
218,491 | 184,161 | 179,184 | 183,381 | 178,866 | |||||||||||||||
| Tangible equity (1) |
175,332 | 160,666 | 155,568 | 161,350 | 156,631 | |||||||||||||||
| Average for the year |
||||||||||||||||||||
| Assets |
$ | 1,782,832 | $ | 1,477,060 | $ | 1,433,213 | $ | 1,317,094 | $ | 1,226,715 | ||||||||||
| Earning assets |
1,645,875 | 1,362,157 | 1,312,660 | 1,204,289 | 1,124,948 | |||||||||||||||
| Gross loans (2) |
1,270,129 | 1,025,889 | 959,873 | 832,787 | 833,643 | |||||||||||||||
| Allowance for loan losses |
(16,142 | ) | (15,707 | ) | (16,492 | ) | (16,132 | ) | (15,728 | ) | ||||||||||
| Available-for-sale securities |
378,747 | 348,049 | 365,889 | 384,810 | 304,424 | |||||||||||||||
| Core deposits (3) |
1,406,168 | 1,031,140 | 967,592 | 877,256 | 879,779 | |||||||||||||||
| Total deposits |
1,475,815 | 1,132,428 | 1,074,166 | 972,854 | 945,187 | |||||||||||||||
| Interest-paying liabilities |
1,049,248 | 913,018 | 912,022 | 833,680 | 781,925 | |||||||||||||||
| Shareholders’ equity |
208,500 | 181,762 | 180,857 | 181,475 | 177,256 | |||||||||||||||
| Financial ratios |
||||||||||||||||||||
| Return on average: |
||||||||||||||||||||
| Assets |
1.05 | % | 1.09 | % | 0.96 | % | 0.96 | % | 0.44 | % | ||||||||||
| Equity |
8.99 | % | 8.83 | % | 7.61 | % | 6.97 | % | 3.01 | % | ||||||||||
| Tangible equity (1) |
11.14 | % | 10.14 | % | 8.75 | % | 7.94 | % | 3.45 | % | ||||||||||
| Avg shareholders’ equity / avg assets |
11.69 | % | 12.31 | % | 12.62 | % | 13.78 | % | 14.45 | % | ||||||||||
| Dividend payout ratio |
43.30 | % | 77.53 | % | 96.05 | % | 44.93 | % | 34.48 | % | ||||||||||
| Regulatory Capital |
||||||||||||||||||||
| Tier I capital (to leverage assets) |
9.93 | % | 11.33 | % | 11.49 | % | 12.33 | % | 13.09 | % | ||||||||||
| Common equity tier I capital (to risk weighted assets)(4) |
10.97 | % | NA | NA | NA | NA | ||||||||||||||
| Tier I capital (to risk weighted assets) |
11.47 | % | 14.48 | % | 14.90 | % | 16.90 | % | 17.97 | % | ||||||||||
| Total capital (to risk weighted assets) |
12.58 | % | 15.73 | % | 16.15 | % | 18.15 | % | 19.22 | % | ||||||||||
| (1) | Tangible book value per share and tangible equity exclude goodwill and core deposit intangibles related to acquisitions. See “Management’s Discussion and Analysis of Financial Condition and Results of Operations” -“Results of Operations Overview” in this Form 10-K for a reconciliation of non-GAAP financial measures. |
| (2) | Outstanding loans include loans held for sale and net deferred fees. |
| (3) | Core deposits include all demand, interest checking, money market, savings and local non-public time deposits, including local non-public time deposits in excess of $100. |
| (4) | The Common equity Tier I capital ratio was established under the Basel Committee’s final rules. See “Management’s |
35
Table of Contents
| ITEM 7 | Management’s Discussion and Analysis of Financial Condition and Results of Operation |
The following discussion is intended to provide a more comprehensive review of the Company’s operating results and financial condition than can be obtained from reading the Consolidated Financial Statements alone. The discussion should be read in conjunction with the audited financial statements and the notes included later in this Form 10-K. All dollar amounts, except per share data, are expressed in thousands of dollars.
HIGHLIGHTS
| 2015 | 2014 | % Change 2015 vs. 2014 |
2013 | % Change 2014 vs. 2013 |
||||||||||||||||
| (in thousands, except per share data) | ||||||||||||||||||||
| Net income |
$ | 18,751 | $ | 16,042 | 16.89 | % | $ | 13,767 | 16.53 | % | ||||||||||
| Operating revenue (1) |
76,425 | 62,443 | 22.39 | % | 61,965 | 0.77 | % | |||||||||||||
| Earnings per share |
||||||||||||||||||||
| Basic |
$ | 0.97 | $ | 0.90 | 7.78 | % | $ | 0.77 | 16.88 | % | ||||||||||
| Diluted |
$ | 0.97 | $ | 0.89 | 8.99 | % | $ | 0.76 | 17.11 | % | ||||||||||
| Assets, period-end |
$ | 1,909,478 | $ | 1,504,325 | 26.93 | % | $ | 1,449,726 | 3.77 | % | ||||||||||
| Gross loans, period-end (2) |
1,406,012 | 1,046,011 | 34.42 | % | 994,769 | 5.15 | % | |||||||||||||
| Core deposits, period-end (3) |
1,533,942 | 1,110,861 | 38.09 | % | 990,315 | 12.17 | % | |||||||||||||
| Deposits, period-end |
1,597,093 | 1,209,093 | 32.09 | % | 1,090,981 | 10.83 | % | |||||||||||||
| Return on average assets |
1.05 | % | 1.09 | % | 0.96 | % | ||||||||||||||
| Return on average equity |
8.99 | % | 8.83 | % | 7.61 | % | ||||||||||||||
| Return on average tangible equity (4) |
11.14 | % | 10.14 | % | 8.75 | % | ||||||||||||||
| Avg shareholders’ equity / avg assets |
11.69 | % | 12.31 | % | 12.62 | % | ||||||||||||||
| Dividend payout ratio |
43.30 | % | 77.53 | % | 96.05 | % | ||||||||||||||
| Net interest margin (5) |
4.34 | % | 4.30 | % | 4.37 | % | ||||||||||||||
| Efficiency ratio |
59.22 | % | 59.41 | % | 65.73 | % | ||||||||||||||
| (1) | Operating revenue is defined as net interest income plus noninterest income. |
| (2) | Excludes net deferred fees and allowance for loan losses. |
| (3) | Defined by the Company as demand, interest checking, money market, savings and local non-public time deposits, including local non-public time deposits in excess of $100. |
| (4) | Tangible equity excludes goodwill and core deposit intangibles related to acquisitions. |
| (5) | Presentation of net interest margin for all periods reported has been adjusted to a tax- equivalent basis using a 35% tax rate. |
Results of Operations—Overview
The Company recorded net income of $18,751 for the year ended 2015, an improvement of $2,709 or 16.89% over the prior year. The results for 2015 and 2014 included $1,836 and $470, respectively, in merger-related expenses associated with the acquisition of Capital Pacific Bank. Improvement in 2015 net income over 2014 was due to increased revenues, specifically net interest income. A portion of the improvement in net interest income was offset by increased loan loss provision, higher noninterest expenses, primarily personnel expense, and merger-related expenses. The Company recorded $1,695 in provision for loan losses in 2015 compared to no provision in 2014. This increase was primarily due to a high level of growth in organic loans as the Bank’s credit quality indicators all improved from 2014 to 2015.
36
Table of Contents
The Company recorded net income of $16,042 for the year ended 2014, an improvement of $2,275 or 16.53% over the prior year. The results for 2014 and 2013 included $470 and $1,246, respectively, in merger-related expenses associated with the acquisition of Capital Pacific Bancorp and the February 2013 Century Bank acquisition. Improvement in 2014 net income over 2013 was due to increased revenues, specifically net interest income, lower provision for loan losses and a decline in noninterest expense. The increase in net interest income was attributable to an increase in organic loans and improvement in the yield on the securities portfolio. The Company made no provision for loan losses in 2014 compared to $250 in 2013. This decline was primarily due to reductions in classified assets and nonperforming loans. Net income also benefitted from a decline of $3,003 in noninterest expense, primarily due to reductions in the following categories of expense: 1) business development; 2) bankcard processing; 3) other real estate; 4) merger-related; and 5) the other expense category. A portion of the decline in these expense categories was offset by an increase of $1,435 or 6.49% in salaries and employee benefits.
Year-end assets at December 31, 2015, were $1,909,478, up $405,153 or 26.93% from December 31, 2014, asset totals. Growth in assets was primarily due to an increase in outstanding gross loans of $360,001, which included $203,406 of loans acquired in the Capital Pacific Bank acquisition. Total assets also grew $19,664 due to the goodwill and core deposit intangible associated with the Capital Pacific Bank acquisition. The Company experienced a typical seasonal core deposit pattern in 2015 with deposit outflows occurring during the first half of the year followed by growth in core deposits during the second half of the year. Outstanding core deposits were $1,533,942 at December 31, 2015, up $423,081 or 38.09% over the prior year-end. A portion of this growth was related to the Capital Pacific Bank acquisition, with acquired core deposits totaling $220,712 at March 6, 2015. The remainder of the core deposit growth was due to new relationships or growth in existing relationships in the bank’s current markets. Growth in the Company’s demand deposits accounted for $161,377 of the increase in core deposits and was up 39.62% over December 31, 2014, outstanding demand deposits.
During 2016, the Company believes the following factors could impact our financial results, in addition to those described in “Risk Factors” and elsewhere in this Form 10-K:
| • | Changes and volatility in interest rates could negatively impact yields on earning assets and the cost of interest-bearing liabilities, thus negatively affecting the Company’s net interest margin and net interest income. |
| • | Global economic weakness and a rise in short-term interest rates could lead to a slowdown of economic growth, thus negatively affecting loan demand, causing a decline in banking industry revenues. |
| • | Increased market competition for quality loans could cause a reduction in loan yields. |
| • | The ability to manage noninterest expense growth in light of regulatory compliance cost. |
| • | The competition to attract and retain qualified and experienced bankers in our markets. |
Reconciliation of non-GAAP financial information
Management utilizes certain non-GAAP financial measures to monitor the Company’s performance. While we believe the presentation of non-GAAP financial measures provides additional insight into our operating performance, readers of this report are urged to review the GAAP results as presented in Financial Statements and Supplementary Data in this Form 10-K.
The Company presents a computation of tangible equity and tangible assets along with tangible book value and return on average tangible equity. The Company defines tangible equity as total shareholders’ equity before goodwill and core deposit intangible assets. Tangible book value is calculated as tangible equity divided by total shares outstanding. Return on average tangible equity is calculated as net income divided by average tangible equity. We believe that tangible equity and certain tangible equity ratios are meaningful measures of capital adequacy which may be used when making period-to-period and company-to-company comparisons. Tangible equity and tangible equity ratios are considered to be non-GAAP financial measures and should be viewed in conjunction with total shareholders’ equity, book value and return on average equity.
37
Table of Contents
The following table presents a reconciliation of total shareholders’ equity to tangible equity.
| December 31, | ||||||||||||
| 2015 | 2014 | 2013 | ||||||||||
| (in thousands, except per share data) | ||||||||||||
| Total shareholders’ equity |
$ | 218,491 | $ | 184,161 | $ | 179,184 | ||||||
| Subtract: |
||||||||||||
| Goodwill |
(39,255 | ) | (22,881 | ) | (22,881 | ) | ||||||
| Core deposit intangibles |
(3,904 | ) | (614 | ) | (735 | ) | ||||||
|
|
|
|
|
|
|
|||||||
| Tangible shareholders’ equity (non-GAAP) |
$ | 175,332 | $ | 160,666 | $ | 155,568 | ||||||
|
|
|
|
|
|
|
|||||||
| Book value |
$ | 11.15 | $ | 10.39 | $ | 10.01 | ||||||
| Tangible book value (non-GAAP) |
$ | 8.94 | $ | 9.07 | $ | 8.69 | ||||||
| December 31, | ||||||||||||
| 2015 | 2014 | 2013 | ||||||||||
| Average Total shareholders’ equity |
$ | 209,943 | $ | 181,762 | $ | 180,856 | ||||||
| Subtract: |
||||||||||||
| Average goodwill |
(35,216 | ) | (22,881 | ) | (22,667 | ) | ||||||
| Average core deposit intangibles |
(3,467 | ) | (674 | ) | (724 | ) | ||||||
|
|
|
|
|
|
|
|||||||
| Average Tangible shareholders’ equity (non-GAAP) |
$ | 171,260 | $ | 158,207 | $ | 157,465 | ||||||
|
|
|
|
|
|
|
|||||||
| Return on average equity |
8.99 | % | 8.83 | % | 7.61 | % | ||||||
| Return on average tangible equity (non-GAAP) |
11.14 | % | 10.14 | % | 8.75 | % | ||||||
Non-GAAP financial measures have inherent limitations, are not required to be uniformly applied, and are not audited. Although we believe these non-GAAP financial measure are frequently used by stakeholders in the evaluation of a company, they have limitations as analytical tools, and should not be considered in isolation or as a substitute for analyses of results as reported under GAAP.
SUMMARY OF CRITICAL ACCOUNTING POLICIES
We follow accounting standards set by the Financial Accounting Standards Board, commonly referred to as the “FASB.” The FASB sets generally accepted accounting principles (“GAAP”) that we follow to ensure we consistently report our financial condition, results of operations, and cash flows. References to GAAP issued by the FASB in this report are to the “FASB Accounting Standards Codification”, sometimes referred to as the “Codification,” or “ASC.” The FASB finalized the Codification effective for periods ending on or after September 15, 2009. Prior FASB Statements, Interpretations, Positions, EITF consensuses, and AICPA Statements of Position are no longer being issued by the FASB. The Codification does not change how the Company accounts for its transactions or the nature of related disclosures made. However, when referring to guidance issued by the FASB, the Company refers to topics in the ASC rather than the specific FASB statement. We have updated references to GAAP in this report to reflect the guidance in the Codification.
The SEC defines “critical accounting policies” as those that require the application of management’s most difficult, subjective or complex judgments, often as a result of the need to make estimates about the effect of matters that are inherently uncertain and may change in future periods. Significant accounting policies are described in Note 1 of the Notes to Consolidated Financial Statements in this Form 10-K. Management believes that the following policies and those disclosed in the Notes to Consolidated Financial Statements should be considered critical under the SEC definition:
Nonaccrual Loans
Accrual of interest is discontinued on contractually delinquent loans when management believes that, after considering economic and business conditions and collection efforts, the borrower’s financial condition is such that collection of principal or interest is doubtful. At a minimum, loans that are past due as to maturity or payment of principal or interest by 90 days or more are placed on nonaccrual status, unless such loans are well-secured and in the process of collection. Interest income is
38
Table of Contents
subsequently recognized only to the extent cash payments are received satisfying all delinquent principal and interest amounts, and the prospects for future payments in accordance with the loan agreement appear relatively certain. In accordance with GAAP, payments received on nonaccrual loans are applied to the principal balance and no interest income is recognized.
Allowance for Loan Losses and Reserve for Unfunded Commitments
The allowance for loan losses on outstanding loans is classified as a contra-asset account offsetting outstanding loans, and the allowance for unfunded commitments is classified as an “other” liability on the balance sheet. The allowance for loan losses is established through a provision for loan losses charged against earnings. The balances of the allowance for loan losses for outstanding loans and unfunded commitments are maintained at an amount management believes will be adequate to absorb known and inherent losses in the loan portfolio and commitments to loan funds. The appropriate balance of the allowance for loan losses is determined by applying loss factors to the credit exposure from outstanding loans and unfunded loan commitments. Estimated loss factors are based on subjective measurements including management’s assessment of the internal risk classifications, changes in the nature of the loan portfolios, industry concentrations, and the impact of current local, regional, and national economic factors on the quality of the loan portfolio. Changes in these estimates and assumptions are reasonably possible and may have a material impact on the Company’s consolidated financial statements, results of operations or liquidity.
Troubled Debt Restructurings
In the normal course of business, the Company may modify the terms of certain loans, attempting to protect as much of its investment as possible. Management evaluates the circumstances surrounding each modification to determine whether it is a troubled debt restructuring (“TDR”). TDRs exist when 1) the restructuring constitutes a concession, and 2) the debtor is experiencing financial difficulties. Additional information regarding the Company’s troubled debt restructurings can be found in Note 5 of the Notes to Consolidated Financial Statements in this Form 10-K.
Goodwill and Intangible Assets
At December 31, 2015, the Company had a recorded balance of $39,255 in goodwill from the November 30, 2005, acquisition of Northwest Business Financial Corporation (“NWBF”), the February 1, 2013, acquisition of Century Bank and the March 6, 2015 acquisition of Capital Pacific Bank. In addition, at December 31, 2015, the Company had $3,904 of core deposit intangible assets resulting from the acquisition of Century Bank and Capital Pacific Bank. The Century Bank core deposit intangible was determined to have an expected life of seven years, and is being amortized over that period using the straight-line method. The Century Bank core deposit intangible will be fully amortized in January 2020. The Capital Pacific core deposit intangible was determined to have an expected life of ten years, and is being amortized over that period using the straight-line method. The Capital Pacific Bank core deposit intangible will be fully amortized in February 2025. In accordance with GAAP, the Company does not amortize goodwill or other intangible assets with indefinite lives but instead periodically tests these assets for impairment. Management performs an impairment analysis of the intangible assets with indefinite lives at least annually, but more frequently if an impairment triggering event is deemed to have occurred. The last impairment test was performed at December 31, 2015, at which time no impairment was determined to exist.
Share-based Compensation
Consistent with the provisions of FASB ASC 718, Stock Compensation, a revision to the previously issued guidance on accounting for stock options and other forms of equity-based compensation, we recognize expense for the grant-date fair value of stock options and other equity-based forms of compensation issued to employees over the employees’ requisite service period (generally the vesting period). The requisite service period may be subject to performance conditions. The fair value of each restricted stock unit is calculated using the stock closing price on the grant date with the expense recognized over the service period of the equity award. Additional information is included in Note 1 of the Notes to Consolidated Financial Statements in this Form 10-K.
Fair Value Measurements
Generally accepted accounting principles define fair value as the price that would be received to sell an asset or paid to transfer a liability in an orderly transaction between market participants at the measurement date. FASB ASC 820, Fair Value Measurements, establishes a three-level hierarchy for disclosure of assets and liabilities recorded at fair value. The classification of assets and liabilities within the hierarchy is based on whether the inputs to the valuation methodology used for
39
Table of Contents
measurement are observable or unobservable. Observable inputs reflect market-derived or market-based information obtained from independent sources while unobservable inputs reflect our estimates about market data. In general, fair values determined by Level 1 inputs utilize quoted prices for identical assets or liabilities traded in active markets that the Company has the ability to access. Fair values determined by Level 2 inputs utilize inputs other than quoted prices included in Level 1 that are observable for the asset or liability, either directly or indirectly. Level 2 inputs include quoted prices for similar assets and liabilities in active markets and inputs other than quoted prices that are observable for the asset or liability, such as interest rates and yield curves that are observable at commonly quoted intervals. Level 3 inputs are unobservable inputs for the asset or liability and include situations where there is little, if any, market activity for the asset or liability. In certain cases, the inputs used to measure fair value may fall into different levels of the fair value hierarchy. In such cases, the level in the fair value hierarchy within which the fair value measurement in its entirety falls has been determined based on the lowest level input that is significant to the fair value measurement in its entirety. The Company’s assessment of the significance of a particular input to the fair value measurement in its entirety requires judgment, and considers factors specific to the asset or liability.
Recent Accounting Pronouncements
Recent accounting pronouncements are discussed in Note 1 of the Notes to Consolidated Financial Statements in this Form 10-K. None of these pronouncements are expected to have a significant effect on the Company’s financial condition or results of operations.
RESULTS OF OPERATIONS
Net Interest Income
The largest component of the Company’s earnings is net interest income. Net interest income is the difference between interest income derived from earning assets, principally loans, and the interest expense associated with interest-bearing liabilities, principally deposits. The volume and mix of earning assets and funding sources, market rates of interest, demand for loans, and the availability of deposits affect net interest income.
Two tables follow which analyze the changes in net interest income for the years 2015, 2014 and 2013. Table I, “Average Balance Analysis of Net Interest Income,” provides information with regard to average balances of assets and liabilities as well as associated dollar amounts of interest income and interest expense, relevant average yields or rates, and net interest income as a percent of average earning assets. Net interest income and the net interest margin for all periods reported have been adjusted to a tax-equivalent basis using a 35.00% tax rate. Table II, “Analysis of Changes in Interest Income and Interest Expense,” shows the increase (decrease) in the dollar amount of interest income and interest expense and the differences attributable to changes in either volume or rates.
40
Table of Contents
Table I
Average Balance Analysis of Net Interest Income
(dollars in thousands)
| Twelve Months Ended | Twelve Months Ended | Twelve Months Ended | ||||||||||||||||||||||||||||||||||
| December 31, 2015 | December 31, 2014 | December 31, 2013 | ||||||||||||||||||||||||||||||||||
| Average Balance |
Interest Income or (Expense) |
Average Yields or Rates |
Average Balance |
Interest Income or (Expense) |
Average Yields or Rates |
Average Balance |
Interest Income or (Expense) |
Average Yields or Rates |
||||||||||||||||||||||||||||
| Interest-earning assets |
||||||||||||||||||||||||||||||||||||
| Federal funds sold and interest-bearing deposits |
$ | 13,141 | $ | 34 | 0.26 | % | $ | 3,926 | $ | 10 | 0.25 | % | $ | 3,390 | $ | 10 | 0.29 | % | ||||||||||||||||||
| Securities available-for-sale: |
||||||||||||||||||||||||||||||||||||
| Taxable |
305,850 | 6,532 | 2.14 | % | 276,625 | 6,191 | 2.24 | % | 296,574 | 5,730 | 1.93 | % | ||||||||||||||||||||||||
| Tax-exempt (1) |
72,898 | 3,040 | 4.17 | % | 71,424 | 3,032 | 4.25 | % | 69,315 | 2,951 | 4.26 | % | ||||||||||||||||||||||||
| Loans, net of deferred fees and allowance (2) |
||||||||||||||||||||||||||||||||||||
| Taxable |
1,223,763 | 64,557 | 5.28 | % | 1,004,438 | 53,627 | 5.34 | % | 937,368 | 53,036 | 5.66 | % | ||||||||||||||||||||||||
| Tax-exempt (3) |
30,224 | 1,749 | 5.79 | % | 5,744 | 350 | 6.09 | % | 6,013 | 368 | 6.12 | % | ||||||||||||||||||||||||
|
|
|
|
|
|
|
|
|
|
|
|
|
|||||||||||||||||||||||||
| Total interest-earning assets |
1,645,876 | 75,912 | 4.61 | % | 1,362,157 | 63,210 | 4.64 | % | 1,312,660 | 62,095 | 4.73 | % | ||||||||||||||||||||||||
| Non earning assets |
||||||||||||||||||||||||||||||||||||
| Cash and due from banks |
23,263 | 18,506 | 18,607 | |||||||||||||||||||||||||||||||||
| Premises and equipment |
17,822 | 18,324 | 19,223 | |||||||||||||||||||||||||||||||||
| Goodwill & intangible assets |
40,183 | 23,556 | 23,579 | |||||||||||||||||||||||||||||||||
| Interest receivable and other |
55,688 | 54,517 | 59,144 | |||||||||||||||||||||||||||||||||
|
|
|
|
|
|
|
|||||||||||||||||||||||||||||||
| Total nonearning assets |
136,956 | 114,903 | 120,553 | |||||||||||||||||||||||||||||||||
|
|
|
|
|
|
|
|||||||||||||||||||||||||||||||
| Total assets |
$ | 1,782,832 | $ | 1,477,060 | $ | 1,433,213 | ||||||||||||||||||||||||||||||
|
|
|
|
|
|
|
|||||||||||||||||||||||||||||||
| Interest-bearing liabilities |
||||||||||||||||||||||||||||||||||||
| Money market and NOW accounts |
$ | 747,918 | $ | (1,956 | ) | -0.26 | % | $ | 543,116 | $ | (1,491 | ) | -0.27 | % | $ | 518,031 | $ | (1,586 | ) | -0.31 | % | |||||||||||||||
| Savings deposits |
60,185 | (74 | ) | -0.12 | % | 51,164 | (67 | ) | -0.13 | % | 41,930 | (52 | ) | -0.12 | % | |||||||||||||||||||||
| Time deposits—core |
79,798 | (309 | ) | -0.39 | % | 60,685 | (326 | ) | -0.54 | % | 71,568 | (509 | ) | -0.71 | % | |||||||||||||||||||||
|
|
|
|
|
|
|
|
|
|
|
|
|
|||||||||||||||||||||||||
| Total interest-bearing core deposits (4) |
887,901 | (2,339 | ) | -0.26 | % | 654,965 | (1,884 | ) | -0.29 | % | 631,529 | (2,147 | ) | -0.34 | % | |||||||||||||||||||||
| Time deposits—non-core |
69,647 | (975 | ) | -1.40 | % | 101,288 | (1,368 | ) | -1.35 | % | 106,574 | (1,242 | ) | -1.17 | % | |||||||||||||||||||||
| Federal funds purchased |
1,555 | (11 | ) | -0.71 | % | 2,053 | (14 | ) | -0.68 | % | 3,369 | (16 | ) | -0.47 | % | |||||||||||||||||||||
| FHLB & FRB borrowings |
81,897 | (885 | ) | -1.08 | % | 146,464 | (1,088 | ) | -0.74 | % | 162,302 | (1,189 | ) | -0.73 | % | |||||||||||||||||||||
| Trust preferred |
8,248 | (226 | ) | -2.74 | % | 8,248 | (225 | ) | -2.73 | % | 8,248 | (200 | ) | -2.42 | % | |||||||||||||||||||||
|
|
|
|
|
|
|
|
|
|
|
|
|
|||||||||||||||||||||||||
| Total interest-bearing wholesale funding |
161,347 | (2,097 | ) | -1.30 | % | 258,053 | (2,695 | ) | -1.04 | % | 280,493 | (2,647 | ) | -0.94 | % | |||||||||||||||||||||
|
|
|
|
|
|
|
|
|
|
|
|
|
|||||||||||||||||||||||||
| Total interest-bearing liabilities |
1,049,248 | (4,436 | ) | -0.42 | % | 913,018 | (4,579 | ) | -0.50 | % | 912,022 | (4,794 | ) | -0.53 | % | |||||||||||||||||||||
| Noninterest-bearing liabilities |
||||||||||||||||||||||||||||||||||||
| Demand deposits |
518,267 | 376,175 | 336,063 | |||||||||||||||||||||||||||||||||
| Noninterest-bearing repurcahse agreements |
183 | 231 | — | |||||||||||||||||||||||||||||||||
| Interest payable and other |
6,634 | 5,874 | 4,271 | |||||||||||||||||||||||||||||||||
|
|
|
|
|
|
|
|||||||||||||||||||||||||||||||
| Total noninterest liabilities |
525,084 | 382,280 | 340,334 | |||||||||||||||||||||||||||||||||
|
|
|
|
|
|
|
|||||||||||||||||||||||||||||||
| Total liabilities |
1,574,332 | 1,295,298 | 1,252,356 | |||||||||||||||||||||||||||||||||
| Shareholders’ equity |
208,500 | 181,762 | 180,857 | |||||||||||||||||||||||||||||||||
|
|
|
|
|
|
|
|||||||||||||||||||||||||||||||
| Total liabilities and shareholders’ equity |
$ | 1,782,832 | $ | 1,477,060 | $ | 1,433,213 | ||||||||||||||||||||||||||||||
|
|
|
|
|
|
|
|||||||||||||||||||||||||||||||
| Net interest income |
$ | 71,476 | $ | 58,631 | $ | 57,301 | ||||||||||||||||||||||||||||||
|
|
|
|
|
|
|
|||||||||||||||||||||||||||||||
| Net interest margin (1)(3) |
4.34 | % | 4.30 | % | 4.37 | % | ||||||||||||||||||||||||||||||
|
|
|
|
|
|
|
|||||||||||||||||||||||||||||||
| (1) | Tax-exempt securities income has been adjusted to a tax-equivalent basis at a 35% tax rate. The amount of such adjustment was an addition to recorded income of approximately $1,064, $1,061, and $1,033 for the twelve months ended December 31, 2015, 2014, and 2013, respectively. Net interest margin was positively impacted by 6, 8, and 8 basis points, respectively. |
| (2) | Interest income includes recognized loan origination fees of $702, $574, and $523 for the twelve months ended December 31, 2015, 2014, and 2013, respectively. |
| (3) | Tax-exempt loan income has been adjusted to a tax-equivalent basis at a 35% tax rate. The amount of such adjustment was an addition to recorded income of approximately $612, $122, and $129 for the twelve months ended December 31, 2015, 2014, and 2013, respectively. Net interest margin was positively impacted by 4, 1, and 1 basis points, respectively. |
| (4) | Defined by the Company as interest checking, money market, savings and local non-public time deposits, including local non-public time deposits in excess of $100. |
41
Table of Contents
Table II
Analysis of Changes in Interest Income and Interest Expense
(dollars in thousands)
| 2015 compared to 2014 | 2014 compared to 2013 | |||||||||||||||||||||||
| Increase (decrease) due to | Increase (decrease) due to | |||||||||||||||||||||||
| Volume | Rate | Net | Volume | Rate | Net | |||||||||||||||||||
| Interest earned on: |
||||||||||||||||||||||||
| Federal funds sold and interest-bearing deposits |
$ | 23 | $ | 1 | $ | 24 | $ | 2 | $ | (2 | ) | $ | — | |||||||||||
| Securities available-for-sale: |
||||||||||||||||||||||||
| Taxable |
654 | (313 | ) | 341 | (385 | ) | 846 | 461 | ||||||||||||||||
| Tax-exempt (1) |
63 | (55 | ) | 8 | 90 | (9 | ) | 81 | ||||||||||||||||
| Loans, net of deferred fees and allowance |
||||||||||||||||||||||||
| Taxable |
11,710 | (780 | ) | 10,930 | 3,795 | (3,204 | ) | 591 | ||||||||||||||||
| Tax-exempt (2) |
1,492 | (93 | ) | 1,399 | (16 | ) | (2 | ) | (18 | ) | ||||||||||||||
|
|
|
|
|
|
|
|
|
|
|
|
|
|||||||||||||
| Total interest-earning assets |
$ | 13,942 | $ | (1,240 | ) | $ | 12,702 | $ | 3,486 | $ | (2,371 | ) | $ | 1,115 | ||||||||||
|
|
|
|
|
|
|
|
|
|
|
|
|
|||||||||||||
| Interest paid on: |
||||||||||||||||||||||||
| Money market and NOW accounts |
$ | 562 | $ | (97 | ) | $ | 465 | $ | 77 | $ | (172 | ) | $ | (95 | ) | |||||||||
| Savings deposits |
12 | (5 | ) | 7 | 11 | 4 | 15 | |||||||||||||||||
| Time deposits—core (3) |
103 | (120 | ) | (17 | ) | (77 | ) | (106 | ) | (183 | ) | |||||||||||||
|
|
|
|
|
|
|
|
|
|
|
|
|
|||||||||||||
| Total interest-bearing core deposits |
677 | (222 | ) | 455 | 11 | (274 | ) | (263 | ) | |||||||||||||||
| Time deposits—non-core |
(427 | ) | 34 | (393 | ) | (62 | ) | 188 | 126 | |||||||||||||||
| Federal funds purchased |
(3 | ) | — | (3 | ) | (6 | ) | 4 | (2 | ) | ||||||||||||||
| FHLB & FRB borrowings |
(480 | ) | 277 | (203 | ) | (116 | ) | 15 | (101 | ) | ||||||||||||||
| Trust preferred |
— | 1 | 1 | — | 25 | 25 | ||||||||||||||||||
|
|
|
|
|
|
|
|
|
|
|
|
|
|||||||||||||
| Total interest-bearing wholesale funding |
(910 | ) | 312 | (598 | ) | (184 | ) | 232 | 48 | |||||||||||||||
|
|
|
|
|
|
|
|
|
|
|
|
|
|||||||||||||
| Total interest-bearing liabilities |
(233 | ) | 90 | (143 | ) | (173 | ) | (42 | ) | (215 | ) | |||||||||||||
|
|
|
|
|
|
|
|
|
|
|
|
|
|||||||||||||
| Net interest income |
$ | 14,175 | $ | (1,330 | ) | $ | 12,845 | $ | 3,659 | $ | (2,329 | ) | $ | 1,330 | ||||||||||
|
|
|
|
|
|
|
|
|
|
|
|
|
|||||||||||||
| (1) | Tax-exempt securities income has been adjusted to a tax-equivalent basis at a 35% tax rate. The amount of such adjustment was an addition to recorded income of approximately $1,064, $1,061, and $1,033 for the twelve months ended December 31, 2015, 2014, and 2013, respectively. Net interest margin was positively impacted by 6, 8, and 8 basis points, respectively. |
| (2) | Tax-exempt loan income has been adjusted to a tax-equivalent basis at a 35% tax rate. The amount of such adjustment was an addition to recorded income of approximately $612, $122, and $129 for the twelve months ended December 31, 2015, 2014, and 2013, respectively. Net interest margin was positively impacted by 4, 1, and 1 basis points, respectively. |
| (3) | Defined by the Company as interest checking, money market, savings and local non-public time deposits, including local non-public time deposits in excess of $100. |
42
Table of Contents
Core Margin, non-GAAP
To better understand the Bank’s results of operations we have provided the following non-GAAP financial metric, which removes nonrecurring interest income and accretion income relating to the Bank’s acquired loan portfolio fair value discounts to provide a “core net interest margin.” While management believes the presentation of this non-GAAP financial measure provides additional insight into our operating performance, readers of this report are urged to review the GAAP results as presented in the Financial Statements and Supplementary Data in this Form 10-K.
Reconciliation of Adjusted Net Interest Income to Net Interest Income
| December 31, | ||||||||||||
| 2015 | 2014 | 2013 | ||||||||||
| (in thousands, except per share data) | ||||||||||||
| Tax equivalent net interest income (1) |
$ | 71,476 | $ | 58,631 | $ | 57,301 | ||||||
| Subtract |
||||||||||||
| Century Bank accretion |
341 | 527 | 913 | |||||||||
| Capital Pacific Bank accretion |
1,950 | — | — | |||||||||
| Interest recoveries on nonaccrual loans |
— | 100 | 982 | |||||||||
| Prepayment penalties on loans |
133 | 187 | 220 | |||||||||
| Prepayment penalties on brokered deposits |
(54 | ) | — | — | ||||||||
|
|
|
|
|
|
|
|||||||
| Adjusted net interest income (non-GAAP) |
$ | 69,106 | $ | 57,817 | $ | 55,186 | ||||||
|
|
|
|
|
|
|
|||||||
| Average earning assets |
$ | 1,645,876 | $ | 1,362,157 | $ | 1,312,660 | ||||||
| Net interest margin |
4.34 | % | 4.30 | % | 4.37 | % | ||||||
| Core net interest margin (non-GAAP) |
4.20 | % | 4.24 | % | 4.20 | % | ||||||
| (1) | Tax-exempt income has been adjusted to a tax-equivalent basis at a 35% tax rate. The amount of such adjustment was an addition to recorded income of $1,676, $1,184 and $1,162 for the twelve months ended December 31, 2015, 2014, and 2013, respectively. |
Nonrecurring items outlined above added 14 and 6 basis points to the 2015 and 2014 net interest margins, respectively. When comparing non-GAAP core net interest margin, we saw a decrease of 4 basis points from 4.24% in 2014 to 4.20% in 2015.
2015 Compared to 2014
The net interest margin for the year 2015 was 4.34%, representing an increase of 4 basis points from the 4.30% net interest margin reported for 2014. Table I shows earning asset yields declined by 3 basis points from 4.64% in 2014 to 4.61% in 2015, which was more than offset by the decrease in the cost of interest bearing liabilities from 0.50% in 2014 to 0.42% in 2015.
The yield on taxable loans dropped 6 basis points from 2014 to 2015, which is after the inclusion of $2,424 in nonrecurring interest income, primarily attributable to accretion on the acquired loan portfolios. Without the inclusion of the nonrecurring interest income, the yield on our taxable loan portfolio would have been 5.08%, which represents a reduction of 26 basis points from the prior year. Accretion income relating to the acquired portfolios is recognized in interest income using the interest method for amortizing loans, and on a straight-line basis for lines of credit. It is typical for accretion income to be higher toward the beginning of an acquired portfolio’s life and begin to taper as loans pay off, refinance, or balances reduce due to standard amortization. At December 31, 2015, the acquired loan portfolios had a remaining balance of $3,958 related to the purchased fair value discount for credit and interest rate.
The 2015 net interest margin benefitted from a decline in the cost of interest-bearing liabilities. The cost of interest-bearing core deposits declined by 3 basis points, which was partially offset by an increase in the cost of interest-bearing wholesale funding of 26 basis points. The Bank saw an increase in demand deposits of $142,092 over the prior year, which helped to reduce the average balance of wholesale funding by $96,706 from $258,053 in 2014 to $161,347 in 2015. Therefore, even though the cost of wholesale funding increased during the period, the impact of that increase was minimal as only 15.38% of interest bearing liabilities relate to non-core funding.
43
Table of Contents
The year ended December 31, 2015, rate/volume analysis in Table II shows that interest income including loan fees increased by $12,702 over 2014. Higher volume, primarily higher loan volume, resulted in an increase of $13,942 in interest income in 2015, which was partially offset by a $1,240 decline in interest income due to lower rates on loans. The rate/volume analysis shows that interest expense for the year 2015 decreased by $143. A reduction in the interest paid on wholesale funding of $598 was partially offset by an increase in the cost of interest-bearing core deposits. Overall, changes in the volume mix decreased interest expense by $233 in 2015, while higher rates on interest-bearing liabilities increased interest expense by $90.
2014 Compared to 2013
The net interest margin for the year 2014 was 4.30%, a decline of 7 basis points from the 4.37% net interest margin reported for 2013. Included in the noninterest income for both years were nonrecurring payments. In 2014 the bank recognized $814 of nonrecurring interest income comprised of $527 of Century Bank accretion, $187 of prepayment penalties, and $100 of interest income on loans previously on nonaccrual status. The 2013 net interest margin included $2,115 of nonrecurring items consisting of $913 of Century Bank accretion, $982 of interest income on loans previously on nonaccrual status and $220 of prepayment penalties.
Table I shows earning asset yields declined by 9 basis points from 4.73% in 2013 to 4.64% in 2014. The yield on taxable loans dropped 32 basis points from 2013 to 2014, which was partially offset by a 31 basis point improvement in the yield on the taxable portion of the securities portfolio over the same period. The 2014 net interest margin benefitted from a decline in the cost of interest-bearing liabilities and an increase in free funding over the prior year. The cost of interest-bearing liabilities fell 3 basis points from 0.53% in 2013 to 0.50% in 2014. In addition, free funding in the form of average noninterest bearing deposits increased $40,112 or 11.94% in 2014 over 2013. The decline in the cost of interest-bearing liabilities from 2013 to 2014 was due to a decrease in the cost of interest-bearing core deposits of 5 basis points, which was partially offset by an increase in the cost of interest-bearing wholesale funding of 10 basis points.
The year ended December 31, 2014, rate/volume analysis in Table II shows that interest income including loan fees increased by $1,115 over 2013. Higher volume, specifically higher loan volume, resulted in an increase of $3,486 in interest income in 2014, which was partially offset by a $2,371 decline in interest income due to lower rates on loans. The rate/volume analysis shows that interest expense for the year 2014 decreased by $215 from 2013 with interest expense on core deposits declining by $263 while wholesale funding expense increased by $48. Overall, changes in the volume mix decreased interest expense by $173 in 2014, while lower rates on interest-bearing liabilities decreased interest expense by $42.
44
Table of Contents
Provision for Loan Losses
Management provides for possible loan losses by maintaining an allowance. The level of the allowance is determined based upon judgments regarding the size and nature of the loan portfolio, historical loss experience, the financial condition of borrowers, the level of nonperforming loans, and current general economic conditions. Additions to the allowance are charged to expense. Loans are charged against the allowance when management believes the collection of principal is unlikely.
The Company made $1,695 in provision for loan losses in 2015, compared to no provision for 2014. The increase in the 2015 provision was primarily due to loan growth as all credit quality indicators saw improvement during 2015, including net charge offs, classified assets and nonperforming loans. The Bank’s organic loan portfolio grew by $156,595 during 2015, which is excluding the $203,406 of loans acquired in the Capital Bank acquisition, which are purchased net of their credit and interest fair value adjustments and only included in our provision to the extent their reserve exceeds the remaining credit related fair value discount. Of the $1,695 in 2015 provision for loan losses, $401 was allocated to the acquired portfolios. Net loan charge offs for the year 2015 were $31 compared to $280 in 2014. Recoveries experienced during 2015 helped offset additional provision needed for new loan production.
| December 31, | ||||||||||||
| 2015 | 2014 | 2013 | ||||||||||
| Substandard contingent liabilities |
$ | 726 | $ | 562 | $ | 532 | ||||||
| Impaired loans (less government guarantees) |
8,451 | 6,032 | 8,375 | |||||||||
| Substandard loans (less government guarantees) |
23,834 | 22,451 | 24,194 | |||||||||
| Classified securities |
1,517 | 1,879 | 2,593 | |||||||||
| Other real estate owned |
11,747 | 13,374 | 16,355 | |||||||||
|
|
|
|
|
|
|
|||||||
| Classified Assets |
$ | 46,275 | $ | 44,298 | $ | 52,049 | ||||||
|
|
|
|
|
|
|
|||||||
| Tier 1 Capital |
$ | 183,600 | $ | 164,864 | $ | 163,469 | ||||||
| Allowance for Loan Losses |
17,301 | 15,637 | 15,917 | |||||||||
|
|
|
|
|
|
|
|||||||
| $ | 200,901 | $ | 180,501 | $ | 179,386 | |||||||
|
|
|
|
|
|
|
|||||||
| Classified Asset Ratio |
23.03 | % | 24.54 | % | 29.02 | % | ||||||
When comparing December 31, 2015 to December 31, 2014, the Bank saw an increase in classified assets of $1,977. This increase primarily related to the acquisition of Capital Pacific Bank, which added approximately $6,833 in classified assets at the close of the acquisition. While December 31, 2015 total classified assets increased over the prior year, the Bank’s classified asset ratio, the ratio of classified assets to regulatory capital plus the allowance for loan losses, decreased from 24.54% at December 31, 2014 to 23.03% at December 31, 2015. This continues the same trend from 2013 to 2014 which saw a decrease in the classified asset ratio from 29.02% at December 31, 2013 to 24.54% at December 31, 2014.
45
Table of Contents
Nonperforming Assets
At December 31, 2015, the Company had $14,466 in nonperforming assets, net of government guarantees, or 0.76% of total assets, compared to $15,563 or 1.02% of total assets at December 31, 2014. The schedule below provides a more detailed breakdown of nonperforming assets by loan type:
NONPERFORMING ASSETS
| December 31, | ||||||||
| 2015 | 2014 | |||||||
| Nonaccrual loans |
||||||||
| Real estate secured loans: |
||||||||
| Permanent loans: |
||||||||
| Multi-family residential |
$ | — | $ | — | ||||
| Residential 1-4 family |
733 | 321 | ||||||
| Owner-occupied commercial |
2,369 | 599 | ||||||
| Nonowner-occupied commercial |
790 | 906 | ||||||
|
|
|
|
|
|||||
| Total permanent real estate loans |
3,892 | 1,826 | ||||||
| Construction loans: |
||||||||
| Multi-family residential |
— | — | ||||||
| Residential 1-4 family |
53 | — | ||||||
| Commercial real estate |
— | — | ||||||
| Commercial bare land and acquisition & development |
— | — | ||||||
| Residential bare land and acquisition & development |
— | — | ||||||
|
|
|
|
|
|||||
| Total real estate construction loans |
53 | — | ||||||
|
|
|
|
|
|||||
| Total real estate loans |
3,945 | 1,826 | ||||||
| Commercial loans |
1,564 | 869 | ||||||
| Consumer loans |
— | — | ||||||
|
|
|
|
|
|||||
| Total nonaccrual loans |
5,509 | 2,695 | ||||||
| 90 days past due and accruing interest |
— | — | ||||||
|
|
|
|
|
|||||
| Total nonperforming loans |
5,509 | 2,695 | ||||||
| Nonperforming loans guaranteed by government |
(2,790 | ) | (706 | ) | ||||
|
|
|
|
|
|||||
| Net nonperforming loans |
2,719 | 1,989 | ||||||
| Other real estate owned |
11,747 | 13,374 | ||||||
|
|
|
|
|
|||||
| Total nonperforming assets, net of guaranteed loans |
$ | 14,466 | $ | 15,363 | ||||
|
|
|
|
|
|||||
| Nonperforming loans to outstanding loans |
0.19 | % | 0.19 | % | ||||
| Nonperforming assets to total assets |
0.76 | % | 1.02 | % | ||||
Nonperforming assets at December 31, 2015, consisted of $2,719 of nonaccrual loans (net of $2,790 in government guarantees) and $11,747 of other real estate owned. Total nonperforming assets at December 31, 2015, were down $897 from nonperforming assets at December 31, 2014, as the Company disposed of a portion of its other real estate owned. At December 31, 2015, dental nonperforming assets totaled $513, down $84 from the $597 reported at December 31, 2014.
Other real estate owned at December 31, 2015, consisted of six properties, including one property valued at $641 acquired through the Capital Pacific Bank acquisition. Two properties, a commercial land development loan, which contains two separate parcels, and a commercial real estate property, valued at $9,988 and $960, respectively, made up 93.20% of total other real estate owned at December 31, 2015. While the Company is actively marketing both properties, the location and type of these properties make them susceptible to possible valuation write-downs as new appraisals become available.
46
Table of Contents
The allowance for loan losses at December 31, 2015, was $17,301 (1.23% of gross outstanding loans) compared to $15,637 (1.49% of loans) and $15,917 (1.60% of loans) at the years ended 2014 and 2013, respectively. The reduction in the allowance for loan losses to total loans ratio was primarily due to loans acquired in the Capital Pacific Bank and the Century Bank transaction, which were booked net of fair value adjustments, including the fair value adjustment for credit and potential losses. At December 31, 2015, the Company had also reserved $360 for possible losses on unfunded loan commitments, which was classified in other liabilities. The 2015 ending allowance included $175 in specific allowance for $7,527 in impaired loans (net of government guarantees). At December 31, 2014, the Company had $6,065 in impaired loans with a specific allowance of $245 assigned.
The dental allowance for loan losses at December 31, 2015, was $4,022 or 1.18% of dental loans. This is a decrease from the dental allowance of $4,141 or 1.35% of dental loans at December 31, 2014. Management has decreased the allowance as a percentage of outstanding loans over the prior year due to a reduction in the losses experienced in the portfolio as performance over the last year was very strong. For additional information on the dental portfolio statistics, please see Note 6 of the Consolidated Financial Statement in this Form 10-K.
While the Company saw some positive trends in 2015, with its resolution of classified assets and nonperforming assets, management cannot predict with certainty the level of the provision for loan losses, the level of the allowance for loans losses, nor the level of nonperforming assets in future quarters. At December 31, 2015, and as shown in this Form 10-K under Note 5 of the Notes to Consolidated Financial Statements, the Company had unallocated reserves of $1,351, representing 7.81% of the total allowance for loan losses. Management believes that the allowance for loan losses at December 31, 2015, is adequate and this level of unallocated reserves was prudent in light of the economic conditions that exist in the Northwest markets the Company serves and the increased growth experienced in the portfolio during the last three quarters of 2015.
Noninterest Income
Noninterest income is derived from sources other than fees and interest on earning assets. The Company’s primary sources of noninterest income are service charge fees on deposit accounts, merchant bankcard activity, and business credit card interchange fees. Below is a summary of noninterest income for 2015, 2014 and 2013.
| Years Ended | Year Ended | |||||||||||||||||||||||||||
| December 31, | December 31, | |||||||||||||||||||||||||||
| 2015 | 2014 | change $ | change % | 2013 | change $ | change % | ||||||||||||||||||||||
| Service charges on deposit accounts |
$ | 2,644 | $ | 2,134 | $ | 510 | 23.90 | % | $ | 1,926 | $ | 208 | 10.80 | % | ||||||||||||||
| Bankcard Income |
1,029 | 951 | 78 | 8.20 | % | 1,624 | (673 | ) | -41.44 | % | ||||||||||||||||||
| Bank-owned life insurance income |
592 | 473 | 119 | 25.16 | % | 515 | (42 | ) | -8.16 | % | ||||||||||||||||||
| Net gain (loss) on sale of investment securities |
672 | (34 | ) | 706 | -2076.47 | % | (8 | ) | (26 | ) | 325.00 | % | ||||||||||||||||
| Impairment losses on investment securities (OTTI) |
(22 | ) | — | (22 | ) | NA | (23 | ) | 23 | -100.00 | % | |||||||||||||||||
| Other noninterest income |
1,710 | 1,471 | 239 | 16.25 | % | 1,792 | (321 | ) | -17.91 | % | ||||||||||||||||||
|
|
|
|
|
|
|
|
|
|
|
|||||||||||||||||||
| $ | 6,625 | $ | 4,995 | $ | 1,630 | 32.63 | % | $ | 5,826 | $ | (831 | ) | -14.26 | % | ||||||||||||||
|
|
|
|
|
|
|
|
|
|
|
|||||||||||||||||||
2015 Compared to 2014
Noninterest income for the year 2015 was up $1,630 or 32.63% from the same period last year. The increase in noninterest income in 2015 when compared to the prior year was due to gains on sales in the securities portfolio, an increase in service charge and increased earnings on bank owned life insurance. During 2015, the Bank sold $52,760 of securities during 2015 generating a net gain of $672. The security sales were primarily related to a repositioning of the portfolio, which resulted in a gain. The increase in service charges on deposit accounts is partially attributable to an increase in outstanding deposits through the acquisition of Capital Pacific Bank in March 2015 and an increase in account analysis fees effective April 1, 2015. The increase in BOLI earnings related to the BOLI policies acquired through the Capital Pacific Bank acquisition, not an increase in the overall BOLI yield. When comparing 2014 and 2015, the yield on BOLI declined from 2.89% at December 31, 2014, to 2.75% at December 31, 2015, which was reflective of a decrease in the asset yields associated with the policies. The tax equivalent yield on the BOLI policies for the periods ended December 31, 2015 and 2014 were 4.23% and 4.45%, respectively.
47
Table of Contents
2014 Compared to 2013
Noninterest income for the year 2014 was $4,995, down $831 or 14.26% from the prior year. The decline in noninterest income in 2014 when compared to the prior year was due to a decline in merchant bankcard processing fees and the other income category. Merchant bankcard processing was outsourced during fourth quarter 2013 and resulted in a $673 drop in merchant fees in 2014. This outsourcing also resulted in the near elimination of bankcard processing expense. The decline in the other revenue category was related to a decrease in rental income on other real estate owned, as during the first quarter 2014, the Company sold a retail strip mall that provided the majority of rental income during 2013. Improved service charge revenue of $208 partially offset the decline in merchant fees. The improvement in service charge revenue was the result of implementing new account analysis charges effective January 1, 2014.
Noninterest Expense
Noninterest expense represents all expenses other than the provision for loan losses and interest costs associated with deposits and other interest-bearing liabilities. It incorporates personnel, premises and equipment, data processing and other operating expenses. Below is a summary of noninterest income for 2015, 2014 and 2013.
| Years Ended | Year Ended | |||||||||||||||||||||||||||
| December 31, | December 31, | |||||||||||||||||||||||||||
| 2015 | 2014 | change $ change % | 2013 | change $ change % | ||||||||||||||||||||||||
| Salaries and employee benefits |
$ | 27,501 | $ | 23,555 | $ | 3,946 | 16.75 | % | $ | 22,120 | $ | 1,435 | 6.49 | % | ||||||||||||||
| Property and equipment |
4,347 | 3,735 | 612 | 16.39 | % | 3,684 | 51 | 1.38 | % | |||||||||||||||||||
| Data processing |
3,259 | 2,720 | 539 | 19.82 | % | 2,605 | 115 | 4.41 | % | |||||||||||||||||||
| Business development |
1,640 | 1,531 | 109 | 7.12 | % | 1,805 | (274 | ) | -15.18 | % | ||||||||||||||||||
| Legal and professional services |
1,924 | 1,252 | 672 | 53.67 | % | 1,867 | (615 | ) | -32.94 | % | ||||||||||||||||||
| FDIC insurance assessment |
1,051 | 868 | 183 | 21.08 | % | 912 | (44 | ) | -4.82 | % | ||||||||||||||||||
| Merger-related expense |
1,836 | 470 | 1,366 | 290.64 | % | 1,246 | (776 | ) | -62.28 | % | ||||||||||||||||||
| Other real estate expense |
346 | 449 | (103 | ) | -22.94 | % | 2,401 | (1,952 | ) | -81.30 | % | |||||||||||||||||
| Other noninterest expense |
3,986 | 3,149 | 837 | 26.58 | % | 4,092 | (943 | ) | -23.04 | % | ||||||||||||||||||
|
|
|
|
|
|
|
|
|
|
|
|||||||||||||||||||
| $ | 45,890 | $ | 37,729 | $ | 8,161 | 21.63 | % | $ | 40,732 | $ | (3,003 | ) | -7.37 | % | ||||||||||||||
|
|
|
|
|
|
|
|
|
|
|
|||||||||||||||||||
2015 Compared to 2014
For the year 2015, noninterest expense was $45,890, an increase of $8,161 or 21.63% from the same period last year. When merger expenses relating to the acquisition of Capital Pacific Bank of $1,836 recorded in 2015, and $470 recorded in 2014, are excluded from noninterest expense, the 2015 expense was up $6,795 or 18.24% over 2014. The largest noninterest expense fluctuation was related to salary and benefits expense, which increased $3,946 or 16.75% over the prior year. Of the overall increase in salaries and benefits, $2,606 is attributable to increases in base salary expense associated with 34 FTE positions added during 2015, including 19 employees retained after the Capital Pacific Bank acquisition. The Bank also saw an increase in legal and professional services expense of $672 over the prior year, which was due in part, to a legal recovery booked during 2014 of $300. The Bank also saw an increase in property and equipment of $612, primarily attributable to the addition of the Capital Pacific Bank’s Fox Tower location to the Company’s office network.
2014 Compared to 2013
For the year 2014, noninterest expense was $37,729, a decrease of $3,003 or 7.37% from the prior year. When merger expenses of $470 recorded in 2014 relating to the acquisition of Capital Pacific Bank and $1,246 recorded in 2013 relating to the Century Bank acquisition are excluded from noninterest expense, noninterest expense for the year 2014 was down $2,227 or 5.64% from prior year. A $1,435 or 6.49% increase in personnel expense in 2014 was offset by declines in legal and professional fees of $615, business development costs of $274, other real estate expense of $1,952, and the other expense category of $943. The decline in legal and professional fees was due to the recovery of $300 of legal fees expensed in prior periods recorded during the third quarter 2014. The decline in business development costs reflects a more focused marketing strategy during 2014 at a lower cost than 2013. The significant decline in other real estate expense was the result of large valuation write-downs totaling approximately $1,100 recorded during 2013 on two commercial properties. No significant valuation write-downs were recorded during 2014.
48
Table of Contents
At the June 2014 board meeting, the Company’s board of directors approved a deferred compensation plan. The plan is a qualified unfunded plan, which contains no employer defined contribution or benefit. This plan is open to Senior Vice Presidents and above, and the board of directors. Deferrals began during August 2014, and deferred compensation expense totaled $108 and $45, for the period ended December 31, 2015 and 2014, which is reflected in the salaries and employee benefits line item of the income statement. The increase is primarily attributable to the plan being in effect for the full year 2015 compared to five months of 2014.
BALANCE SHEET
Securities Available-for-Sale
At December 31, 2015, the balance of securities available-for-sale was $366,598, up $14,652 over December 31, 2014. The increase in the securities portfolio during 2015 was primarily due to the acquisition of Capital Pacific Bank, which added $26,010 to the securities total. At December 31, 2015, the portfolio had an unrealized pre-tax gain of $4,341 compared to an unrealized pre-tax gain of $6,058, at December 31, 2014. The decline in the unrealized gain or market value of the securities portfolio during 2015 was due to an increase in the short term interest rates and the market widening of spreads in virtually all investment products. The average life and duration of the portfolio at December 31, 2015, was 4.1 years and 3.7 years respectively, up from 3.9 years and 3.6 years, respectively, at December 31, 2014. At December 31, 2015, securities with an estimated fair value of $33,163 were pledged as collateral for public deposits in Oregon and Washington and for repurchase agreements.
The Company continued to structure the portfolio to provide consistent cash flow and reduce the market value volatility of the portfolio in a rising rate environment in light of the Company’s current liability sensitive position. The portfolio is structured to generate sufficient cash flow to allow reinvestment at higher rates should interest rates move up or to fund loan growth in future periods. In a stable rate environment, approximately $48,000 in cash flow is anticipated over the next twelve months. Going forward, purchases will be dependent upon core deposit growth, loan growth, and the Company’s interest rate risk position.
At December 31, 2015, $2,789, or 0.76% of the total securities portfolio was composed of private-label mortgage-backed securities. During 2015, management booked $22 in other than temporary impairment on this portion of the portfolio. In total, the private label mortgage backed portfolio had a cumulative balance of $249 in other than temporary impairments at December 31, 2015.
In management’s opinion, the remaining securities in the portfolio in an unrealized loss position are considered only temporarily impaired. The Company has no intent, nor is it more likely than not that it will be required, to sell its impaired securities before their recovery. The impairment is due to changes in market interest rates or the widening of market spreads subsequent to the initial purchase of the securities, and not due to concerns regarding the underlying credit of the issuers or the underlying collateral. The decline in value of these securities resulted from current economic conditions. Although yields on these securities may be below market rates during the period, management does not currently anticipate the need to book any other-than-temporary impairment.
Loans
At December 31, 2015, outstanding gross loans were $1,406,012, up $360,001 over outstanding loans at December 31, 2014. A summary of outstanding loans by market, including national health care loans, for the years ended December 31, 2015, and December 31, 2014, follows:
| December 31, | 2015 vs . 2014 | |||||||||||||||
| 2015 | 2014 | $ Increase | % Increase | |||||||||||||
| Eugene market gross loans, period-end |
$ | 379,048 | $ | 363,953 | $ | 15,095 | 4.15 | % | ||||||||
| Portland market gross loans, period-end |
667,995 | 407,466 | 260,529 | 63.94 | % | |||||||||||
| Seattle market gross loans, period-end |
142,104 | 119,095 | 23,009 | 19.32 | % | |||||||||||
| National health care gross loans, period end |
216,865 | 155,497 | 61,368 | 39.47 | % | |||||||||||
|
|
|
|
|
|
|
|||||||||||
| Total gross loans, period-end |
$ | 1,406,012 | $ | 1,046,011 | $ | 360,001 | 34.42 | % | ||||||||
|
|
|
|
|
|
|
|||||||||||
49
Table of Contents
During 2015, all of the Company’s markets showed growth in outstanding loans over the prior year. Loan growth was strongest in the Portland market, due to the acquisition of Capital Pacific Bank, which added $203,406 to outstanding gross loans and another $156,595 in organic loan growth during 2015. Growth in the Seattle market of $23,009 was primarily tied to increased lending in the tax-exempt market, with the addition of a lender specializing in the Washington STEP Bond program. Growth in the Eugene market was primarily concentrated in construction lending, with advances on large owner-occupied construction projects occurring during 2015. Growth in national healthcare loans accounted for $61,368 of the organic loan growth recorded during 2015. At December 31, 2015 the Company had national healthcare loans in 39 states. The Company defines national healthcare loans as loans to healthcare professionals, primarily dentists located outside of the Company’s primary market area. The Company’s defined market area is within the States of Oregon and Washington west of the Cascade Mountain Range. This area is serviced by branch locations in Eugene, Oregon; Portland, Oregon; and Seattle, Washington. National health care loans, loans east of the Cascade Mountain Range and outside Oregon and Washington, are maintained and serviced by personnel located in the Portland market.
Outstanding loans to dental professionals, which are comprised of both local and national loans, at December 31, 2015, totaled $340,162 or 24.19% of the loan portfolio. Gross dental loans were up $33,771 over December 31, 2014, however the dental concentration decreased from the prior period due to growth in non-dental loans. Growth in national loans of $47,379 was partially offset by a $13,608 contraction in the local market dental loans. The more seasoned local dental loan portfolio experienced higher prepayment speeds due to competitive refinancing pricing offered. In addition, given the credit quality of dental loans in general, the Company encountered very competitive pricing in the national market. At December 31, 2015, $9,027 or 2.65% of the outstanding dental loans were supported by government guarantees. Loans to dental professionals include loans for such purposes as starting up a practice, acquisition of a practice, equipment financing, owner-occupied facilities, and working capital. National dental loans are limited to acquisition financing and owner-occupied facilities. Additional data on the Company’s dental loan portfolio and the credit quality of this portfolio can be found in Note 6 of the Notes to Consolidated Financial Statements in this report. Additional information regarding loan concentrations is included in Part II, Item 1A “Risk Factors” of this report under the heading “We have a significant concentration in loans to dental professionals, and loan concentrations within one industry may create additional risk.”
Detailed credit quality data on the entire loan portfolio can be found in Note 5 and Note 6 of the Notes to Consolidated Financial Statements in this report.
Goodwill
At December 31, 2015, the Company had a recorded balance of $39,255 in goodwill from the November 30, 2005, acquisition of NWB Financial Corporation and its wholly owned subsidiary, Northwest Business Bank (“NWBF”), the February 1, 2013, acquisition of Century Bank and the March 6, 2015, acquisition of Capital Pacific Bank. In accordance with GAAP, the Company does not amortize goodwill or other intangible assets with indefinite lives, but instead periodically tests these assets for impairment. Management performed an impairment analysis at December 31, 2015, and determined there was no impairment of the goodwill at the time of the analysis.
| December 31, 2015 | ||||||||||||||||
| Capital Pacific | Northwest | |||||||||||||||
| Bank | Century Bank | Business Bank | Total | |||||||||||||
| Goodwill |
$ | 16,373 | $ | 851 | $ | 22,031 | $ | 39,255 | ||||||||
Deferred Tax Assets
Deferred tax assets and liabilities are recognized for the future tax consequences attributable to differences between the financial statement carrying amounts of existing assets and liabilities and their respective tax bases and operating loss and tax credit carry forwards. At December 31, 2015, the Company had a net deferred tax asset of $5,670. This includes the addition of the deferred tax assets of Capital Pacific Bank, which has been adjusted for the effective rate differential between Pacific Continental and Capital Pacific. Any adjustment to the acquired deferred tax asset has affected the goodwill associated with the acquisition. Deferred tax assets are reviewed for recoverability and valuation allowances are provided, when necessary, to reduce deferred tax assets to the amounts expected to be realized. A valuation allowance is provided for deferred tax assets if it is more likely than not these items will either expire before the Company is able to realize their benefit, or that future deductibility is uncertain. In light of the Company’s performance, management anticipates that the deferred tax assets will be fully utilized to offset future income taxes and that no valuation allowance is required. Additional disclosures regarding the components of the net deferred tax asset are included in Note 15 of the Notes to Consolidated Financial Statements in this Form 10-K.
50
Table of Contents
Deposits
Outstanding deposits at December 31, 2015, were $1,597,093, an increase of $388,000 over outstanding deposits of $1,209,093 at December 31, 2014. Core deposits, which are defined by the Company as demand, interest checking, money market, savings, and local non-public time deposits, including local non-public time deposits in excess of $100, were $1,533,942, up $423,081 or 38.09% over outstanding core deposits of $1,110,861 at December 31, 2014. At December 31, 2015, and 2014, core deposits represented 96.05% and 91.88%, respectively, of total deposits. Year-to-date December 31, 2015, average core deposits, a measurement that removes daily volatility, were $1,406,168, an increase of $375,028 or 36.37% over average core deposits of $1,031,140 for the year 2014.
A summary of outstanding deposits by market for the years 2015 and 2014 follows:
| 2015 vs . 2014 | ||||||||||||||||
| December 31, | $ Increase | % Increase | ||||||||||||||
| 2015 | 2014 | (Decrease) | (Decrease) | |||||||||||||
| Eugene market core deposits, period-end |
$ | 787,521 | $ | 672,527 | $ | 114,994 | 17.10 | % | ||||||||
| Portland market core deposits, period-end |
552,283 | 276,453 | 275,830 | 99.77 | % | |||||||||||
| Seattle market core deposits, period-end |
194,138 | 161,881 | 32,257 | 19.93 | % | |||||||||||
|
|
|
|
|
|
|
|||||||||||
| Total core deposits, period-end |
1,533,942 | 1,110,861 | 423,081 | 38.09 | % | |||||||||||
| Public and brokered deposits, period-end |
63,151 | 98,232 | (35,081 | ) | -35.71 | % | ||||||||||
|
|
|
|
|
|
|
|||||||||||
| Total deposits, period-end |
$ | 1,597,093 | $ | 1,209,093 | $ | 388,000 | 32.09 | % | ||||||||
|
|
|
|
|
|
|
|||||||||||
All three of the Company’s primary markets showed an increase in core deposits during 2015, with a significant increase in balances occurring toward the end of 2015, as is the typical seasonal growth pattern of the deposit portfolio. The Portland market saw the largest growth, which included $220,712 in core deposits acquired through the Capital Pacific acquisition. All markets successfully acquired new deposit relationships and deepened deposit relationships with existing clients. Because of its strategic focus on business banking and banking for nonprofits, the Company attracts a number of large depositors that account for a relatively significant portion of the core deposit base. The Company continued to be successful in deepening deposit relationships with existing large depositors in 2015 and also attracting new large depositor relationships. Large depositor balances are subject to significant daily volatility. At December 31, 2015, large depositors, generally defined as relationships with $2,000 or more in deposits, accounted for $684,519 of the Company’s total core deposit base and represented 44.62% of outstanding core deposits, compared to $490,159 or 44.12% of outstanding core deposits at December 31, 2014. For more information on the Company’s large depositors and management of these relationships, see the “Liquidity and Cash Flows” section of Management’s Discussion and Analysis of Financial Condition and Results of Operations in this Form 10-K. Additional information on deposits may also be found in Note 10 of the Notes to Consolidated Financial Statements in this Form 10-K.
51
Table of Contents
Public and Brokered Deposits
The Company uses public and brokered deposits to provide short-term and long-term funding sources. The Company defines short-term as having a contractual maturity of less than one year. The Company uses brokered deposits to help mitigate interest rate risk in a rising rate environment. All long-term brokered deposits have a call feature, which provides the Company the option to redeem the deposits on a quarterly basis, allowing the Company to refinance long-term funding at lower rates should market rates fall. Below is a schedule detailing public and brokered deposits by type, including weighted average rate and weighted average maturity.
Non-Core Deposit Summary
| December 31, 2015 | December 31, 2014 | |||||||||||||||||||||||
| Balance | Weighted average rate |
Weighted average maturity |
Balance | Weighted average rate |
Weighted average maturity |
|||||||||||||||||||
| (dollars in thousands) | (dollars in thousands) | |||||||||||||||||||||||
| <3 Months |
$ | 30,000 | 0.37 | % | 55 days | $ | 46,500 | 0.19 | % | 40 days | ||||||||||||||
| 3-6 Months |
300 | 0.36 | % | 108 days | 2,545 | 0.20 | % | 134 days | ||||||||||||||||
| 6-12 Months |
235 | 0.40 | % | 331 days | 5,474 | 0.30 | % | 241 days | ||||||||||||||||
| >12 Months |
32,616 | 1.94 | % | 5.37 years | 43,713 | 2.12 | % | 6.21 years | ||||||||||||||||
|
|
|
|
|
|||||||||||||||||||||
| $ | 63,151 | $ | 98,232 | |||||||||||||||||||||
|
|
|
|
|
|||||||||||||||||||||
During 2015 the Company saw a contraction in brokered and public deposits. This contraction was related to the growth in the core deposit base, which was sufficient to fund the loan growth experienced during the year.
Borrowings
The Company has both secured and unsecured borrowing lines with the Federal Home Loan Bank, Federal Reserve Bank and various correspondent banks. The Federal Reserve and correspondent borrowings are generally short-term, with a maturity of less than 30 days. The FHLB borrowings can be either short-term or long-term in nature. See Note 12 of the Notes to Consolidated Financial Statements in Item 8 of this report for additional information on borrowings.
Junior Subordinated Debentures
The Company had $8,248 in junior subordinated debentures outstanding at December 31, 2015, which were issued in conjunction with the 2005 acquisition of NWBF. The junior subordinated debentures had an interest rate of 6.27% that was fixed through January 2011. In January 2011, the rate on the junior subordinated debentures changed to three-month LIBOR plus 135 basis points. On April 22, 2013, the Bank entered into a cash flow hedge on $8,000 of the trust preferred payment, swapping the variable interest rate for a fixed rate of 2.73% for a seven-year period. At December 31, 2015, the fair value of the interest rate swap on the Company’s subordinated debentures was $82, compared to $176 at December 31, 2014. At December 31, 2015, the $8,000 of the junior subordinated debentures qualified as Tier 1 capital under regulatory capital guidelines.
In July 2010, the Dodd-Frank Wall Street Reform and Consumer Protection Act (“Dodd-Frank Act”) was signed into law which, among other things, limits the ability of certain bank holding companies to treat trust preferred security debt issuances, such as the Company’s junior subordinated debentures, as Tier 1 capital. Under final rules, recently adopted by the Federal Reserve Board and the other U.S. federal banking agencies, our trust preferred securities would remain as Tier 1 capital since total assets of the Company are less than $15 billion. Additional information regarding these final capital rules is included in in Part I, Item 1 “Business – Supervision and Regulation” and Part I, Item 1A “Risk Factors” of the report under the heading “We operate in a highly regulated environment and the effects of recent and pending federal legislation or of changes in, or supervisory enforcement of, banking or other laws and regulations could adversely affect us.”
Additional information regarding the terms of the cash flow hedge is included in Note 14 of the Notes to Consolidated Financial Statements in Item 8 of this report.
52
Table of Contents
CAPITAL RESOURCES
Capital is the shareholders’ investment in the Company. Capital grows through the retention of earnings and the issuance of new stock or other equity securities whether through stock offerings or through the exercise of equity awards. Capital formation allows the Company to grow assets and provides flexibility in times of adversity. Shareholders’ equity at December 31, 2015, was $218,491, up $34,330 from December 31, 2014. The increase in shareholders’ equity was primarily due to the issuance of 1,778,142 shares of Company stock valued at $23,578 in conjunction with the acquisition of Capital Pacific Bank during the first quarter 2015, combined with retention of a portion of income earned during 2015.
On July 27, 2015, the Company’s Board of Directors authorized the repurchase of up to 5.00% of the Company’s outstanding shares, or 892,500 shares, with the purchases to take place over a 12-month period. During 2015, the Company did not repurchase any shares as the strike price was below the current share value. Throughout 2014, the Company has used a combination of regular dividends, special dividends, and share repurchases to maintain capital levels comparable with year-end December 31, 2011, capital levels. For additional details regarding the changes in equity, review the Consolidated Statements of Changes in Shareholders’ Equity in Item 8 of this report.
The Federal Reserve and the FDIC have in place guidelines for risk-based capital requirements applicable to U.S. bank holding companies and banks. In July 2013, the Federal Reserve Board and the other U.S. federal banking agencies have adopted final rules making significant changes to the U.S. regulatory capital framework for U.S. banking organizations and to conform this framework to the Basel Committee’s current international regulatory capital accord (Basel III). These rules were effective January 1, 2015 and replaced the federal banking agencies’ general risk-based capital rules, advanced approaches rule, market-risk rule, and leverage rules, in accordance with certain transition provisions. The new rules establish more restrictive capital definitions, create additional categories and higher risk-weightings for certain asset classes and off-balance sheet exposures, higher leverage ratios and capital conservation buffers that will be added to the minimum capital requirements and must be met for banking organizations to avoid being subject to certain limitations on dividends and discretionary bonus payments to executive officers. The new rules also implement higher minimum capital requirements, include a new common equity Tier 1 capital requirement, and establish criteria that instruments must meet in order to be considered common equity Tier 1 capital, additional Tier 1 capital, or Tier 2 capital. When fully phased in, the final rules will provide for increased minimum capital ratios as follows: (a) a common equity Tier 1 capital ratio of 4.50%; (b) a Tier 1 capital ratio of 6.00% (which is an increase from 4.00%); (c) a total capital ratio of 8.00%; and (d) a Tier 1 leverage ratio to average consolidated assets of 4.00%. The new rules permit depository institution holding companies with less than $15 billion in total consolidated assets as of December 31, 2009, such as the Company, to include trust preferred securities in Tier 1 capital. Under the new rules, in order to avoid limitations on capital distributions, including dividend payments and certain discretionary bonus payments to executive officers, a banking organization must hold a capital conservation buffer composed of common equity Tier 1 capital above its minimum risk-based capital requirements (equal to 2.50% of total risk-weighted assets). The phase-in of the capital conservation buffer will begin January 1, 2016, and be completed by January 1, 2019. The new rules also provide for various adjustments and deductions to the definitions of regulatory capital that will phase in from January 1, 2014, to December 31, 2017. The new rules made it optional for banks and bank holding companies to include accumulated other comprehensive income in their calculations of Tier 1 capital. The Company’s accumulated other comprehensive income consists primarily of the unrealized gain or loss on the securities portfolio as a result of marking securities available-for-sale to market. The Company opted to exclude accumulated other comprehensive income from its calculation of Tier 1 capital. Overall, the new rules did not materially impact the Company’s reported capital ratios. The Company will continue to evaluate the impact of the rules as they are phased in over the next few years.
For additional information regarding the Company’s regulatory capital levels, see Note 23 in Notes to Consolidated Financial Statements in Item 8 of this report.
The Company’s common equity Tier 1 capital ratio, Tier 1 risk based capital ratio, total risk based capital ratio, and Tier 1 leverage capital ratio were 12.58%, 11.47%, 10.97% and 9.93%, respectively, at December 31, 2015, with all capital ratios for the Company above the minimum regulatory “well capitalized” designations.
The Company has regularly paid cash dividends on a quarterly basis, typically in February, May, August and November of each year. The Board of Directors considers the dividend amount quarterly and takes a broad perspective in its dividend deliberations including a review of recent operating performance, capital levels, and concentrations of loans as a percentage of capital, and growth projections. The Board also considers dividend payout ratios, dividend yield, and other financial metrics in setting the quarterly dividend. There can be no assurance that dividends will be paid in the future.
53
Table of Contents
During 2015, the Company paid regular dividends totaling $0.42. The fourth quarter dividend represents a dividend payout of 39.29% of net income. Subsequent to the end of the year, on January 19, 2016, the Board of Directors approved a regular quarterly cash dividend to $0.11 per share payable to shareholders on February 16, 2016.
OFF-BALANCE SHEET ARRANGEMENTS AND COMMITMENTS
In the normal course of business, the Company commits to extensions of credit and issues letters of credit. The Company uses the same credit policies in making commitments to lend funds and conditional obligations as it does for other credit products. In the event of nonperformance by the customer, the Company’s exposure to credit loss is represented by the contractual amount of the instruments. Commitments to extend credit are agreements to lend to a customer as long as there is no violation of any condition established by the contract. Since some commitments may expire without being drawn upon, the total commitment amounts do not necessarily represent future cash requirements. At December 31, 2015, the Company had $289,156 in commitments to extend credit, up $132,184 from $156,972 reported at December 31, 2014.
Letters of credit written are conditional commitments issued by the Company to guarantee performance of a customer to a third-party. The credit risk involved is essentially the same as that involved in extending loan facilities to customers. At December 31, 2015, the Company had $1,184 in letters of credit and financial guarantees written.
The Company has certain other financial commitments. These future financial commitments at December 31, 2015, are outlined below:
| Total | Less than One Year |
1 - 3 Years | 3 - 5 Years | More than 5 Years |
||||||||||||||||
| Junior subordinated debentures |
$ | 8,248 | $ | — | $ | — | $ | — | $ | 8,248 | ||||||||||
| FHLB borrowings |
77,500 | 69,500 | 6,000 | — | 2,000 | |||||||||||||||
| Time deposits |
138,603 | 75,487 | 23,424 | 4,932 | 34,760 | |||||||||||||||
| Operating lease obligations |
11,534 | 1,390 | 3,206 | 2,008 | 4,930 | |||||||||||||||
| Employment contracts |
812 | 812 | — | — | — | |||||||||||||||
|
|
|
|
|
|
|
|
|
|
|
|||||||||||
| $ | 236,697 | $ | 147,189 | $ | 32,630 | $ | 6,940 | $ | 49,938 | |||||||||||
|
|
|
|
|
|
|
|
|
|
|
|||||||||||
LIQUIDITY AND CASH FLOWS
Liquidity is the term used to define the Company’s ability to meet its financial commitments. The Company maintains sufficient liquidity to ensure funds are available for both lending needs and the withdrawal of deposit funds. The Company derives liquidity through core deposit growth, maturity of investment securities, and loan payments. Core deposits include demand, interest checking, money market, savings, and local time deposits, including local nonpublic time deposits in excess of $100. Additional liquidity and funding sources are provided through the sale of loans, sales of securities, access to national CD markets, and both secured and unsecured borrowings. The Company uses a number of measurements to monitor its liquidity position on a daily, weekly, and monthly basis, which includes its ability to meet both short-term and long-term obligations, and requires the Company to maintain a certain amount of liquidity on the asset side of its balance sheet. The Company also prepares projections of its liquidity position. In addition, the Company prepares a Liquidity Contingency Plan at least semi-annually that is strategic in nature and forward-looking to test the ability of the Company to fund a liquidity shortfall arising from various escalating events. The Liquidity Contingency Plan is presented and reviewed by the Company’s Asset and Liability Committee.
Core deposits at December 31, 2015, were $1,533,942 and represented 96.05% of total deposits. Core deposits at December 31, 2015, were up $423,081 over December 31, 2014. The acquisition of Capital Pacific Bank during the first quarter 2015 accounted for approximately $223,000 of deposit growth during 2015, while organic growth accounted for the remaining increase in total deposits.
The Company experienced an increase in outstanding loans of $360,001 during 2015, which included organic growth and loans acquired in the Capital Pacific Bank acquisition. Organic loan growth was funded entirely by growth in core deposits.
54
Table of Contents
Core deposits not required to fund asset growth were used to pay down short-term borrowings and to fund purchases of securities. It is anticipated that core deposit growth and cash flows from the securities portfolio will provide a significant portion of the funding during 2016, as loans are expected to continue to increase. The securities portfolio represented 19.20% of total assets at December 31, 2015. At December 31, 2015, $33,163 of the securities portfolio was pledged to support public deposits and repurchase agreements, leaving $333,435 of the securities portfolio unencumbered and available-for-sale. In addition, at December 31, 2015, the Company had $31,037 of government guaranteed loans that could be sold in the secondary market to support the Company’s liquidity position.
Due to its strategic focus to market to specific segments, the Company has been successful in developing deposit relationships with several large clients, which are generally defined as deposit relationships of $2,000 or more, which are closely monitored by management and Company officers. The loss of any such deposit relationship or other large deposit relationships could cause an adverse effect on short-term liquidity. The Company uses a 10-point risk-rating system to evaluate each of its large depositors in order to assist management in its daily monitoring of the volatility of this portion of its core deposit base. The risk-rating system attempts to determine the stability of the deposits of each large depositor, evaluating, among other things, the length of time the depositor has been with the Company and the likelihood of loss of individual large depositor relationships. Risk ratings on large depositors are reviewed at least quarterly and adjusted if necessary. Company management and officers maintain close relationships and hold regular meetings with its large depositors to assist in management of these relationships. The Company generally expects to maintain these relationships, believes it has sufficient sources of liquidity to mitigate the loss of one or more of these clients and regularly tests its ability to mitigate the loss of multiple large depositor relationships in its Liquidity Contingency Plan. The Company currently has one deposit client rated a 10, the highest risk, with outstanding deposit balances of approximately $103,000 as of December 31, 2015. The client has a long standing relationship with the Company; however, it has recently been purchased by a national entity. The Company has received indications that the deposit relationship should remain unchanged for at least the next 12 to 18 months. The Company currently maintains sufficient short-term liquidity to cover any potential volatility in this relationship and is working on a longer term funding strategy in the event these deposits need to be replaced in the future. However, there can be no assurance that this deposit relationship or any of our other large depositor relationships will be maintained or that the loss of one or more of these clients will not adversely affect the Company’s liquidity.
At December 31, 2015, the Company had secured borrowing lines with the FHLB and the FRB, along with unsecured borrowing lines with various correspondent banks, totaling $614,883. The Company’s secured lines with the FHLB and FRB were limited by the amount of collateral pledged. At December 31, 2015, the Company had pledged $422,362 in discounted collateral value in commercial real estate loans, first and second lien single-family residential loans, multi-family loans, and securities to the FHLB. Additionally, certain commercial and commercial real estate loans with a discounted value of $76,912 were pledged to the FRB under the Company’s Borrower-In-Custody program. The Company’s unsecured correspondent bank lines totaled $129,000. At December 31, 2015, the Company had $77,500 in borrowings outstanding from the FHLB, no borrowings outstanding with the FRB, and no funds outstanding on its overnight correspondent bank lines, leaving a total of $421,774 available on its secured and unsecured borrowing lines as of such date.
As disclosed in the Consolidated Statements of Cash Flows in the Consolidated Financial Statements in this Form 10-K, net cash provided by operating activities was $30,013 for the year 2015. The difference between cash provided by operating activities and net income largely consisted of depreciation and amortization of $7,138. Net cash of $148,696 was used in investing activities for the year 2015, consisting principally of net loan originations of $156,746 and securities purchases of $101,500, which was offset by proceeds from maturities of investment securities of $106,332. Cash provided by financing activities was $129,571 for the year 2015, primarily due to an increase in deposits of $160,033.
INFLATION
Substantially all of the assets and liabilities of the Company are monetary. Therefore, inflation has a less significant impact on the Company than does fluctuation in market interest rates. Inflation can lead to accelerated growth in noninterest expenses, which could impact net earnings. During the last several years, inflation, as measured by the Consumer Price Index, did not change significantly. The effects of inflation have not had a material impact on the Company.
55
Table of Contents
| ITEM 7A | Quantitative and Qualitative Disclosures About Market Risk |
The Company’s results of operations are largely dependent upon its ability to manage market risks. Changes in interest rates can have a significant effect on the Company’s financial condition and results of operations. Although permitted by its funds management policy, the Company does not presently use derivatives, such as forward and futures contracts, options or interest rate swaps, to manage interest rate risk. Other types of market risk, such as foreign currency exchange rate risk and commodity price risk, do not arise in the normal course of the Company’s business activities.
Interest rate risk generally arises when the maturity or repricing structure of the Company’s assets and liabilities differ significantly. Asset and liability management, which among other things addresses such risk, is the process of developing, testing and implementing strategies that seek to maximize net interest income while maintaining sufficient liquidity. This process includes monitoring contractual maturity and prepayment expectations together with expected repricing of assets and liabilities under different interest rate scenarios. Generally, the Company seeks a structure that insulates net interest income from large deviations attributable to changes in market rates.
Interest rate risk is managed through the monitoring of the Company’s balance sheet by utilizing two key measurement tools; 1) Economic Value of Equity (EVE), and 2) Net Interest Income (NII). Economic Value of Equity is a measurement of net present value of assets less liabilities. Net interest income is a measurement of interest income less interest expense over a specified time horizon (usually 12, 24 and/or 36 months). Both measurements incorporate instantaneous parallel rate shocks of -100, +100, +200, +300, and +400 basis points. Key assumptions are applied to the analysis covering asset prepayments, liability decays and betas, and repricing characteristics. Other interest rate risk analysis includes stress-testing, back-testing, and forecast. Stress-testing the model provides a measurement of worst-case analysis and a degree of tolerance to the base model. Back-testing analysis provides a degree of validity of the base model as compared to actual results. Forecast provides management the what-if scenarios with predetermined balance and rate growth assumptions. In addition, forecasting takes into account growth in loans and deposits and management strategies that could be employed to maximize the net interest margin and net interest income.
The Company has recently outsourced its quarterly interest rate risk analysis to a third party vendor- Pacific Coast Bankers Bank. Pacific Coast Bankers Bank’s process and modeling software uses key internal assumptions for beta, decay, and prepayment speeds, as well as established policy limits, in order to determine the effect changes in interest rates have on Economic Value of Equity and Net Interest Income. Economic Value of Equity provides a long-term risk profile while Net Interest Income provides a short-term risk profile of the balance sheet. Although certain assets and liabilities may have similar repricing characteristics, they may not react correspondingly to changes in market interest rates. In the event of a change in interest rates, prepayment of loans and early withdrawal of time deposits would likely deviate from those previously assumed. Increases in market rates may also affect the ability of certain borrowers to make scheduled principal payments. Additionally, the Company utilizes Profitstar as its internal model to conduct interest rate risk analysis on a periodic basis, as well as budget and forecast purposes. Using PCBB as an independent analyst allows us to verify the outcomes of our internal models, which we believe provides better analytics for budgeting and forecasting purposes.
The models attempt to account for such limitations by imposing weights on the differences between repricing assets and repricing liabilities within each time segment. These weights are based on the ratio between the amount of rate change of each category of asset or liability and the amount of change in the federal funds rate. Certain non-maturing liabilities, such as checking accounts and money market deposit accounts, are allocated among the various repricing time segments to meet local competitive conditions and management’s strategies.
At December 31, 2015, the Company was liability sensitive, meaning that in a rising rate environment, the net interest margin and net interest income would decline. The Company’s interest rate risk position was primarily due to four factors: 1) active floors on variable rate loans; 2) the high concentration of fixed rate loans in the portfolio; 3) the composition of the Company’s core deposit base, which consists primarily of non-maturing deposits which are subject to immediate repricing, and 4) the Company’s overnight borrowings will also reprice immediately.
There are numerous critical assumptions in the modeling of interest rate sensitivity, including the deposit decay rate (the rate at which non-maturing deposits run off over time) and the beta factor (the projected change in rates paid on non-maturing deposits for every 100 basis point increase or decrease in market interest rates). Critical assumptions are based on historical behaviors and current market conditions. Due to the critical nature of these assumptions on the overall calculated interest rate risk position, actual results and changes in net interest income and the net interest margin in the event of an increase or decrease of market interest rates may be materially different from projections.
56
Table of Contents
The following table shows the estimated impact on Net Interest Income at one, two, and three year time horizons and Economic Value of Equity with instantaneous parallel rate shocks of -100, +100, +200, +300, and +400 basis points. Due to the various assumptions used for this modeling and potential balance sheet strategies management may implement to mitigate interest rate risk, no assurance can be given that projections will reflect actual results.
Interest Rate Shock Analysis
Net Interest Income and Economic Value of Equity Measurement
($ in thousands)
57
Table of Contents
| 1st Year Net Interest Income | ||||||||||||
| Interest Rate Shocks |
$ Estimated Value |
$ Change From Base |
Change From Base |
|||||||||
| 400 |
68,223 | (4,514 | ) | -6.21 | % | |||||||
| 300 |
69,498 | (3,239 | ) | -4.45 | % | |||||||
| 200 |
70,687 | (2,050 | ) | -2.82 | % | |||||||
| 100 |
71,800 | (937 | ) | -1.29 | % | |||||||
| Base |
72,737 | |||||||||||
| -100 |
70,627 | (2,110 | ) | -2.90 | % | |||||||
| 2nd Year Net Interest Income | ||||||||||||
| Interest Rate Shocks |
$ Estimated Value |
$ Change From Base |
Change From Base |
|||||||||
| 400 |
73,653 | 4,013 | 5.76 | % | ||||||||
| 300 |
73,025 | 3,385 | 4.86 | % | ||||||||
| 200 |
72,235 | 2,595 | 3.73 | % | ||||||||
| 100 |
71,294 | 1,654 | 2.38 | % | ||||||||
| Base |
69,640 | |||||||||||
| -100 |
65,066 | (4,574 | ) | -6.57 | % | |||||||
| 3rd Year Net Interest Income | ||||||||||||
| Interest Rate Shocks |
$ Estimated Value |
$ Change From Base |
Change From Base |
|||||||||
| 400 |
83,768 | 14,365 | 20.70 | % | ||||||||
| 300 |
80,849 | 11,446 | 16.49 | % | ||||||||
| 200 |
77,021 | 7,618 | 10.98 | % | ||||||||
| 100 |
73,426 | 4,023 | 5.80 | % | ||||||||
| Base |
69,403 | |||||||||||
| -100 |
62,325 | (7,078 | ) | -10.20 | % | |||||||
| Economic Value of Equity | ||||||||||||
| Interest Rate Shocks |
$ Estimated Value |
$ Change From Base |
Change From Base |
|||||||||
| 400 |
358,972 | (14,848 | ) | -3.97 | % | |||||||
| 300 |
366,343 | (7,477 | ) | -2.00 | % | |||||||
| 200 |
372,889 | (931 | ) | -0.25 | % | |||||||
| 100 |
376,235 | 2,415 | 0.65 | % | ||||||||
| Base |
373,820 | |||||||||||
| -100 |
366,506 | (7,314 | ) | -1.96 | % | |||||||
58
Table of Contents
| ITEM 8 | Financial Statements and Supplementary Data |

REPORT OF INDEPENDENT REGISTERED PUBLIC ACCOUNTING FIRM
To the Board of Directors and Shareholders
Pacific Continental Corporation and Subsidiary
We have audited the accompanying consolidated balance sheets of Pacific Continental Corporation and Subsidiary (the “Company”) as of December 31, 2015 and 2014, and the related consolidated statements of operations, comprehensive income, changes in shareholders’ equity, and cash flows for each of the three years in the period ended December 31, 2015. We also have audited the Company’s internal control over financial reporting as of December 31, 2015, based on criteria established in Internal Control -Integrated Framework (2013) issued by the Committee of Sponsoring Organizations of the Treadway Commission. The Company’s management is responsible for these financial statements, for maintaining effective internal control over financial reporting, and for its assessment of the effectiveness of internal control over financial reporting included in the accompanying Report of Management on Internal Control over Financial Reporting. Our responsibility is to express an opinion on these consolidated financial statements and an opinion on the effectiveness of the Company’s internal control over financial reporting based on our audits.
We conducted our audits in accordance with standards of the Public Company Accounting Oversight Board (United States). Those standards require that we plan and perform the audits to obtain reasonable assurance about whether the consolidated financial statements are free of material misstatement and whether effective internal control over financial reporting was maintained in all material respects. Our audits of the consolidated financial statements included examining, on a test basis, evidence supporting the amounts and disclosures in the consolidated financial statements, assessing the accounting principles used and significant estimates made by management, and evaluating the overall consolidated financial statements presentation. Our audit of internal control over financial reporting included obtaining an understanding of internal control over financial reporting, assessing the risk that a material weakness exists, and testing and evaluating the design and operating effectiveness of internal control based on the assessed risk. Our audits also included performing such other procedures as we considered necessary in the circumstances. We believe that our audits provide a reasonable basis for our opinions.
A company’s internal control over financial reporting is a process designed to provide reasonable assurance regarding the reliability of financial reporting and the preparation of financial statements for external purposes in accordance with generally accepted accounting principles. A company’s internal control over financial reporting includes those policies and procedures that (1) pertain to the maintenance of records that, in reasonable detail, accurately and fairly reflect the transactions and dispositions of the assets of the company; (2) provide reasonable assurance that transactions are recorded as necessary to permit preparation of financial statements in accordance with generally accepted accounting principles, and that receipts and expenditures of the company are being made

Table of Contents
REPORT OF INDEPENDENT REGISTERED PUBLIC ACCOUNTING FIRM
(continued)
only in accordance with authorizations of management and directors of the company; and (3) provide reasonable assurance regarding prevention or timely detection of unauthorized acquisition, use, or disposition of the company’s assets that could have a material effect on the financial statements.
Because of its inherent limitations, internal control over financial reporting may not prevent or detect misstatements. Also, projections of any evaluation of effectiveness to future periods are subject to the risk that controls may become inadequate because of changes in conditions, or that the degree of compliance with the policies or procedures may deteriorate.
In our opinion, the consolidated financial statements referred to above present fairly, in all material respects, the consolidated financial position of Pacific Continental Corporation and Subsidiary as of December 31, 2015 and 2014, and the consolidated results of their operations and their cash flows for each of the three years in the period ended December 31, 2015, in conformity with generally accepted accounting principles in the United States of America. Also in our opinion, Pacific Continental Corporation and Subsidiary maintained, in all material respects, effective internal control over financial reporting as of December 31, 2015 based on criteria established in Internal Control - Integrated Framework (2013) issued by the Committee of Sponsoring Organizations of the Treadway Commission.
| /s/ Moss Adams LLP |
| Portland, Oregon |
| March 14, 2016 |
60
Table of Contents
Pacific Continental Corporation and Subsidiary
Consolidated Balance Sheets
(In thousands, except share amounts)
| December 31, | ||||||||
| 2015 | 2014 | |||||||
| ASSETS |
||||||||
| Cash and due from banks |
$ | 23,819 | $ | 20,929 | ||||
| Interest-bearing deposits with banks |
12,856 | 4,858 | ||||||
|
|
|
|
|
|||||
| Total cash and cash equivalents |
36,675 | 25,787 | ||||||
| Securities available-for-sale |
366,598 | 351,946 | ||||||
| Loans, net of deferred fees |
1,404,482 | 1,045,021 | ||||||
| Allowance for loan losses |
(17,301 | ) | (15,637 | ) | ||||
|
|
|
|
|
|||||
| Net loans |
1,387,181 | 1,029,384 | ||||||
| Interest receivable |
5,721 | 4,773 | ||||||
| Federal Home Loan Bank stock |
5,208 | 10,019 | ||||||
| Property and equipment, net of accumulated depreciation |
18,014 | 17,820 | ||||||
| Goodwill and intangible assets |
43,159 | 23,495 | ||||||
| Deferred tax asset |
5,670 | 4,464 | ||||||
| Other real estate owned |
11,747 | 13,374 | ||||||
| Bank-owned life insurance |
22,884 | 16,609 | ||||||
| Other assets |
6,621 | 6,654 | ||||||
|
|
|
|
|
|||||
| Total assets |
$ | 1,909,478 | $ | 1,504,325 | ||||
|
|
|
|
|
|||||
| LIABILITIES AND SHAREHOLDERS’ EQUITY |
||||||||
| Deposits |
||||||||
| Noninterest-bearing demand |
$ | 568,688 | $ | 407,311 | ||||
| Savings and interest-bearing checking |
889,802 | 646,101 | ||||||
| Core time deposits |
75,452 | 57,449 | ||||||
|
|
|
|
|
|||||
| Total core deposits |
1,533,942 | 1,110,861 | ||||||
| Other deposits |
63,151 | 98,232 | ||||||
|
|
|
|
|
|||||
| Total deposits |
1,597,093 | 1,209,093 | ||||||
| Repurchase agreements |
71 | 93 | ||||||
| Federal Home Loan Bank borrowings |
77,500 | 96,000 | ||||||
| Junior subordinated debentures |
8,248 | 8,248 | ||||||
| Accrued interest and other payables |
8,075 | 6,730 | ||||||
|
|
|
|
|
|||||
| Total liabilities |
1,690,987 | 1,320,164 | ||||||
|
|
|
|
|
|||||
| Commitments and contingencies (Note 21) |
||||||||
| Shareholders’ equity |
||||||||
| Common stock, no par value, shares authorized: 50, 000, 000; shares issued and outstanding: 19,604,182 at December 31, 2015, and 17,717,676 at December 31, 2014 |
156,099 | 131,375 | ||||||
| Retained earnings |
59,693 | 48,984 | ||||||
| Accumulated other comprehensive income |
2,699 | 3,802 | ||||||
|
|
|
|
|
|||||
| 218,491 | 184,161 | |||||||
|
|
|
|
|
|||||
| Total liabilities and shareholders’ equity |
$ | 1,909,478 | $ | 1,504,325 | ||||
|
|
|
|
|
|||||
61
Table of Contents
Pacific Continental Corporation and Subsidiary
Consolidated Statements of Operations
(In thousands, except per share amounts)
| Years Ended December 31, | ||||||||||||
| 2015 | 2014 | 2013 | ||||||||||
| Interest and dividend income |
||||||||||||
| Loans |
$ | 65,694 | $ | 53,855 | $ | 53,275 | ||||||
| Taxable securities |
6,532 | 6,191 | 5,730 | |||||||||
| Tax-exempt securities |
1,976 | 1,971 | 1,918 | |||||||||
| Federal funds sold & interest-bearing deposits with banks |
34 | 10 | 10 | |||||||||
|
|
|
|
|
|
|
|||||||
| 74,236 | 62,027 | 60,933 | ||||||||||
|
|
|
|
|
|
|
|||||||
| Interest expense |
||||||||||||
| Deposits |
3,314 | 3,252 | 3,389 | |||||||||
| Federal Home Loan Bank & Federal Reserve borrowings |
885 | 1,088 | 1,189 | |||||||||
| Junior subordinated debentures |
226 | 225 | 200 | |||||||||
| Federal funds purchased |
11 | 14 | 16 | |||||||||
|
|
|
|
|
|
|
|||||||
| 4,436 | 4,579 | 4,794 | ||||||||||
|
|
|
|
|
|
|
|||||||
| Net interest income |
69,800 | 57,448 | 56,139 | |||||||||
| Provision for loan losses |
1,695 | — | 250 | |||||||||
|
|
|
|
|
|
|
|||||||
| Net interest income after provision for loan losses |
68,105 | 57,448 | 55,889 | |||||||||
|
|
|
|
|
|
|
|||||||
| Noninterest income |
||||||||||||
| Service charges on deposit accounts |
2,644 | 2,134 | 1,926 | |||||||||
| Bankcard income |
1,029 | 951 | 1,624 | |||||||||
| Bank-owned life insurance income |
592 | 473 | 515 | |||||||||
| Net gain (loss) on sale of investment securities |
672 | (34 | ) | (8 | ) | |||||||
| Impairment losses on investment securities (OTTI) |
(22 | ) | — | (23 | ) | |||||||
| Other noninterest income |
1,710 | 1,471 | 1,792 | |||||||||
|
|
|
|
|
|
|
|||||||
| 6,625 | 4,995 | 5,826 | ||||||||||
|
|
|
|
|
|
|
|||||||
| Noninterest expense |
||||||||||||
| Salaries and employee benefits |
27,501 | 23,555 | 22,120 | |||||||||
| Property and equipment |
4,347 | 3,735 | 3,684 | |||||||||
| Data processing |
3,259 | 2,720 | 2,605 | |||||||||
| Business development |
1,640 | 1,531 | 1,805 | |||||||||
| Legal and professional services |
1,924 | 1,252 | 1,867 | |||||||||
| FDIC insurance assessment |
1,051 | 868 | 912 | |||||||||
| Merger related expense |
1,836 | 470 | 1,246 | |||||||||
| Other real estate expense |
346 | 449 | 2,401 | |||||||||
| Other noninterest expense |
3,986 | 3,149 | 4,092 | |||||||||
|
|
|
|
|
|
|
|||||||
| 45,890 | 37,729 | 40,732 | ||||||||||
|
|
|
|
|
|
|
|||||||
| Income before income tax provision |
28,840 | 24,714 | 20,983 | |||||||||
| Income tax provision |
10,089 | 8,672 | 7,216 | |||||||||
|
|
|
|
|
|
|
|||||||
| Net income |
$ | 18,751 | $ | 16,042 | $ | 13,767 | ||||||
|
|
|
|
|
|
|
|||||||
| Earnings per share |
||||||||||||
| Basic |
$ | 0.97 | $ | 0.90 | $ | 0.77 | ||||||
|
|
|
|
|
|
|
|||||||
| Diluted |
$ | 0.97 | $ | 0.89 | $ | 0.76 | ||||||
|
|
|
|
|
|
|
|||||||
See accompanying notes.
62
Table of Contents
Pacific Continental Corporation and Subsidiary
Consolidated Statements of Comprehensive Income
(In thousands)
| Years Ended December 31, | ||||||||||||
| 2015 | 2014 | 2013 | ||||||||||
| Net income |
$ | 18,751 | $ | 16,042 | $ | 13,767 | ||||||
| Other comprehensive (loss) income: |
||||||||||||
| Available-for-sale securities: |
||||||||||||
| Unrealized (loss) gain arising during the year |
(1,064 | ) | 6,266 | (9,833 | ) | |||||||
| Reclassification adjustment for (gains) losses realized in net income |
(672 | ) | 34 | 8 | ||||||||
| Other than temporary impairment |
22 | — | 23 | |||||||||
| Income tax benefit (expense) |
668 | (2,457 | ) | 3,823 | ||||||||
| Derivative instrument—cash flow hedge |
||||||||||||
| Unrealized (loss) gain arising during the year |
(94 | ) | (230 | ) | 405 | |||||||
| Income tax benefit (expense) |
37 | 90 | (158 | ) | ||||||||
|
|
|
|
|
|
|
|||||||
| Total other comprehensive (loss) income , net of tax |
(1,103 | ) | 3,703 | (5,732 | ) | |||||||
|
|
|
|
|
|
|
|||||||
| Total comprehensive income |
$ | 17,648 | $ | 19,745 | $ | 8,035 | ||||||
|
|
|
|
|
|
|
|||||||
See accompanying notes.
63
Table of Contents
Pacific Continental Corporation and Subsidiary
Consolidated Statements of Changes in Shareholders’ Equity
(In thousands, except share amounts)
| Number of Shares |
Common Stock |
Retained Earnings |
Accumulated Other Comprehensive Income |
Total | ||||||||||||||||
| Balance, December 31, 2012 |
17,835,088 | $ | 133,017 | $ | 44,533 | $ | 5,831 | $ | 183,381 | |||||||||||
|
|
|
|
|
|
|
|
|
|
|
|||||||||||
| Net income |
13,767 | 13,767 | ||||||||||||||||||
| Other comprehensive loss, net of tax |
(5,732 | ) | (5,732 | ) | ||||||||||||||||
|
|
|
|
|
|||||||||||||||||
| Comprehensive income |
8,035 | |||||||||||||||||||
|
|
|
|||||||||||||||||||
| Stock issuance |
56,599 | — | ||||||||||||||||||
| Share-based compensation expense |
1,136 | 1,136 | ||||||||||||||||||
| Vested employee RSUs and SARs surrendered to cover tax consequesnces |
(318 | ) | (318 | ) | ||||||||||||||||
| Cash dividends ($0.73 per share) |
(13,050 | ) | (13,050 | ) | ||||||||||||||||
|
|
|
|
|
|
|
|
|
|
|
|||||||||||
| Balance, December 31, 2013 |
17,891,687 | $ | 133,835 | $ | 45,250 | $ | 99 | $ | 179,184 | |||||||||||
|
|
|
|
|
|
|
|
|
|
|
|||||||||||
| Net income |
16,042 | 16,042 | ||||||||||||||||||
| Other comprehensive income, net of tax |
3,703 | 3,703 | ||||||||||||||||||
|
|
|
|
|
|||||||||||||||||
| Comprehensive income |
19,745 | |||||||||||||||||||
|
|
|
|||||||||||||||||||
| Stock issuance and related tax benefit |
93,069 | 203 | 203 | |||||||||||||||||
| Stock repurchase |
(267,080 | ) | (3,600 | ) | (3,600 | ) | ||||||||||||||
| Share-based compensation expense |
1,454 | 1,454 | ||||||||||||||||||
| Vested employee RSUs and SARs surrendered to cover tax consequesnces |
(517 | ) | (517 | ) | ||||||||||||||||
| Cash dividends ($0.69 per share) |
(12,308 | ) | (12,308 | ) | ||||||||||||||||
|
|
|
|
|
|
|
|
|
|
|
|||||||||||
| Balance, December 31, 2014 |
17,717,676 | $ | 131,375 | $ | 48,984 | $ | 3,802 | $ | 184,161 | |||||||||||
|
|
|
|
|
|
|
|
|
|
|
|||||||||||
| Net income |
18,751 | 18,751 | ||||||||||||||||||
| Other comprehensive loss, net of tax |
(1,103 | ) | (1,103 | ) | ||||||||||||||||
|
|
|
|
|
|||||||||||||||||
| Comprehensive income |
17,648 | |||||||||||||||||||
|
|
|
|||||||||||||||||||
| Stock issuance and related tax benefit |
108,404 | 95 | 95 | |||||||||||||||||
| Stock issued through acquisition |
1,778,102 | 23,578 | 23,578 | |||||||||||||||||
| Share-based compensation expense |
1,700 | 1,700 | ||||||||||||||||||
| Vested employee RSUs and SARs surrendered to cover tax consequesnces |
(649 | ) | (649 | ) | ||||||||||||||||
| Cash dividends ($0.42 per share) |
(8,042 | ) | (8,042 | ) | ||||||||||||||||
|
|
|
|
|
|
|
|
|
|
|
|||||||||||
| Balance, December 31, 2015 |
19,604,182 | $ | 156,099 | $ | 59,693 | $ | 2,699 | $ | 218,491 | |||||||||||
|
|
|
|
|
|
|
|
|
|
|
|||||||||||
See accompanying notes.
64
Table of Contents
Pacific Continental Corporation and Subsidiary
Consolidated Statements of Cash Flows
(In thousands)
| Years Ended December 31, | ||||||||||||
| 2015 | 2014 | 2013 | ||||||||||
| Cash flows from operating activities: |
||||||||||||
| Net income |
$ | 18,751 | $ | 16,042 | $ | 13,767 | ||||||
| Adjustments to reconcile net income to net cash from operating activities: |
||||||||||||
| Depreciation and amortization, net of accretion |
7,138 | 6,834 | 8,596 | |||||||||
| Valuation adjustment on foreclosed assets |
129 | 82 | 1,948 | |||||||||
| Capitalized other real estate owned costs |
— | — | (67 | ) | ||||||||
| Loss (gain) on sale of other real estate owned |
2 | (7 | ) | — | ||||||||
| Provision for loan losses |
1,695 | — | 250 | |||||||||
| Deferred income tax provision |
1,153 | 2,766 | 743 | |||||||||
| BOLI income |
(592 | ) | (473 | ) | (515 | ) | ||||||
| Share-based compensation |
1,650 | 1,528 | 1,196 | |||||||||
| Excess tax benefit of stock options exercised |
(9 | ) | (14 | ) | — | |||||||
| Other than temporary impairment on investment securities |
22 | — | 23 | |||||||||
| (Gain) loss on sale of investment securities |
(672 | ) | 34 | 8 | ||||||||
| Change in: |
||||||||||||
| (Increase) decrease in interest receivable |
(401 | ) | (70 | ) | 67 | |||||||
| Deferred loan fees |
538 | 66 | 83 | |||||||||
| Accrued interest payable and other liabilities |
60 | 598 | 259 | |||||||||
| Income taxes (receivable) payable |
(1,461 | ) | 80 | 792 | ||||||||
| Decrease (increase) in other assets |
2,010 | (3,328 | ) | 138 | ||||||||
|
|
|
|
|
|
|
|||||||
| Net cash provided by operating activities |
30,013 | 24,138 | 27,288 | |||||||||
|
|
|
|
|
|
|
|||||||
| Cash flows from investing activities: |
||||||||||||
| Proceeds from maturities, sales and paydowns available-for-sale investment securities |
106,332 | 71,622 | 101,079 | |||||||||
| Purchase of available-for-sale investment securities |
(101,500 | ) | (75,184 | ) | (75,340 | ) | ||||||
| Net loan principal originations |
(156,746 | ) | (53,447 | ) | (61,604 | ) | ||||||
| Purchase of property and equipment |
(1,434 | ) | (428 | ) | (897 | ) | ||||||
| Proceeds on sale of foreclosed assets |
2,463 | 4,831 | 489 | |||||||||
| Redemption of FHLB stock |
5,438 | 406 | 391 | |||||||||
| Cash consideration paid, net of cash acquired in merger |
(3,249 | ) | — | (2,827 | ) | |||||||
|
|
|
|
|
|
|
|||||||
| Net cash used by investing activities |
(148,696 | ) | (52,200 | ) | (38,709 | ) | ||||||
|
|
|
|
|
|
|
|||||||
| Cash flows from financing activities: |
||||||||||||
| Change in deposits |
160,033 | 118,113 | (18,384 | ) | ||||||||
| Change in repurchase agreements |
(22 | ) | — | — | ||||||||
| (Increase) decrease in federal funds purchased and FHLB short-term borrowings |
(18,500 | ) | (69,150 | ) | 37,580 | |||||||
| FHLB advances paid-off |
— | — | (2,000 | ) | ||||||||
| Proceeds from stock options exercised |
86 | 189 | — | |||||||||
| Redemption of Capital Pacific Bell State Bank debt |
(3,344 | ) | — | — | ||||||||
| Excess tax benefit of stock options exercised |
9 | 14 | — | |||||||||
| Dividends paid |
(8,042 | ) | (12,308 | ) | (13,050 | ) | ||||||
| Repurchase of common stock |
— | (3,600 | ) | — | ||||||||
| Vested SARs and RSUs surrendered by employees to cover tax consequence |
(649 | ) | (517 | ) | (318 | ) | ||||||
|
|
|
|
|
|
|
|||||||
| Net cash provided by financing activities |
129,571 | 32,741 | 3,828 | |||||||||
|
|
|
|
|
|
|
|||||||
| Net increase (decrease) in cash and cash equivalents |
10,888 | 4,679 | (7,593 | ) | ||||||||
| Cash and cash equivalents, beginning of year |
25,787 | 21,108 | 28,701 | |||||||||
|
|
|
|
|
|
|
|||||||
| Cash and cash equivalents, end of year |
$ | 36,675 | $ | 25,787 | $ | 21,108 | ||||||
|
|
|
|
|
|
|
|||||||
| Supplemental information: |
||||||||||||
| Noncash investing and financing activities: |
||||||||||||
| Transfers of loans to other real estate owned |
$ | 967 | $ | 1,925 | $ | 753 | ||||||
| Change in fair value of securities, net of deferred income taxes |
$ | 1,046 | $ | 3,843 | $ | (5,979 | ) | |||||
| Acquisitions: |
||||||||||||
| Assets acquired |
$ | 257,924 | $ | — | $ | 76,076 | ||||||
| Liabilties assumed |
$ | 232,698 | $ | — | $ | 63,593 | ||||||
| Cash paid during the year for: |
||||||||||||
| Income taxes |
$ | 8,423 | $ | 8,701 | $ | 6,906 | ||||||
| Interest |
$ | 4,410 | $ | 4,540 | $ | 4,641 | ||||||
See accompanying notes.
65
Table of Contents
Pacific Continental Corporation and Subsidiary
Notes to Consolidated Financial Statements
In preparing these consolidated financial statements, the Company has evaluated events and transactions subsequent to the balance sheet date for potential recognition or disclosure. All dollar amounts in the following notes are expressed in thousands, except per share data.
NOTE 1 — SUMMARY OF SIGNIFICANT ACCOUNTING POLICIES:
Principles of Consolidation – The consolidated financial statements include the accounts of Pacific Continental Corporation (the “Company”), a bank holding company, and its wholly owned subsidiary, Pacific Continental Bank (the “Bank”) and the Bank’s wholly owned subsidiaries, PCB Service Corporation (which previously owned and operated bank-related real estate but is currently inactive) and PCB Loan Services Corporation (which previously owned and operated certain repossessed or foreclosed collateral but is currently inactive). The Bank provides commercial banking, financing, mortgage lending and other services through 15 offices located in Western Oregon and Western Washington. The Bank also operates three loan production offices in Tacoma, Washington, Denver, Colorado, and the San Francisco Bay Area, California. All significant intercompany accounts and transactions have been eliminated in consolidation.
In November 2005, the Company formed a wholly owned Delaware statutory business trust subsidiary, Pacific Continental Corporation Capital Trust (the “Trust”) which issued $8,248 of guaranteed undivided beneficial interests in Pacific Continental’s Junior Subordinated Deferrable Interest Debentures (“Trust Preferred Securities”). Pacific Continental has not consolidated the accounts of the Trust in its consolidated financial statements in accordance with generally accepted accounting principles, (“GAAP”). As a result, the junior subordinated debentures issued by Pacific Continental to the issuer trust, totaling $8,248, are reflected on Pacific Continental’s consolidated balance sheet at December 31, 2015, and 2014, under the caption “Junior Subordinated Debentures.” Pacific Continental also recognized its $248 investment in the Trust, which is recorded among “Other Assets” in its consolidated balance sheet at December 31, 2015, and 2014.
Use of Estimates – The preparation of financial statements in conformity with GAAP requires management to make estimates and assumptions that affect the reported amounts of assets and liabilities and disclosure of contingent assets and liabilities at the date of the financial statements and the reported amounts of revenues and expenses during the reporting period. Actual results could differ from those estimates. The most significant estimations made by management involve fair value calculations pertaining to financial assets and liabilities, the calculation of the allowance for loan losses, and the impairment assessment for goodwill.
Cash and Cash Equivalents – For purposes of reporting cash flows, cash and cash equivalents includes cash on hand, amounts due from or deposited with banks, interest-bearing balances due from banks, and federal funds sold. Generally, federal funds are sold for one-day periods.
Securities Available-for-Sale – Securities available-for-sale are held for indefinite periods of time and may be sold in response to movements in market interest rates, changes in the maturity or mix of Company assets and liabilities or demand for liquidity. Management determines the appropriate classification of securities at the time of purchase. The Company classified all of its securities as available-for-sale throughout 2015 and 2014.
Securities classified as available-for-sale are reported at estimated fair value based on available market prices. Net unrealized gains and losses are included in other comprehensive income or loss on an after-tax basis. Impaired securities are assessed quarterly for the presence of other-than-temporary impairment (“OTTI”). OTTI is considered to have occurred, (1) if we intend to sell the security, (2) if it is “more likely than not” we will be required to sell the security before recovery of its amortized cost basis, or (3) the present value of expected cash flows is not sufficient to recover the entire amortized cost basis. The “more likely than not” criteria is a lower threshold than the “probable” criteria used under previous guidance.
When OTTI is identified, the amount of the impairment is bifurcated into two components: the amount representing credit loss and the amount related to all other factors. The amount representing credit loss is recognized against earnings as a realized loss and the amount representing all other factors is recognized in other comprehensive income as an unrealized loss. The cost basis of an other-than-temporarily impaired security is written down by the amount of impairment
66
Table of Contents
recognized in earnings. The new cost basis is not adjusted for subsequent recoveries in fair value. However, the difference between the new amortized cost basis and the cash flows expected to be collected is accreted as interest income. Gains and losses on the sale of available-for-sale securities are determined using the specific-identification method. Purchase premiums and discounts are recognized in interest income using the interest method over the terms of the securities. Interest income on securities available-for-sale is included in income using the level yield method.
Loans, Income Recognition, and the Allowance for Loan Losses – Loans are stated at the amount of unpaid principal net of loan premiums or discounts for purchased loans, net deferred loan origination fees, discounts associated with retained portions of loans sold, and an allowance for loan losses. Interest on loans is calculated using the simple-interest method on daily balances of the principal amount outstanding. Loan origination fees, net of origination costs and discounts, are amortized over the lives of the loans as adjustments to yield.
Nonaccrual Loans
Accrual of interest is discontinued on contractually delinquent loans when management believes that, after considering economic and business conditions and collection efforts, the borrower’s financial condition is such that collection of principal or interest is doubtful. At a minimum, loans that are past due as to maturity or payment of principal or interest by 90 days or more are placed on nonaccrual status, unless such loans are well-secured and in the process of collection. Interest income is subsequently recognized only to the extent cash payments are received satisfying all delinquent principal and interest amounts, and the prospects for future payments in accordance with the loan agreement appear relatively certain. In accordance with GAAP, payments received on nonaccrual loans are applied to the principal balance and no interest income is recognized.
Purchased Credit Impaired Loans (“PCI Loans”)
Loans acquired with evidence of credit deterioration since origination for which it is probable that all contractually required payments will not be collected are accounted for under ASC 310-30, Loans and Debt Securities Acquired with Deteriorated Credit Quality, formerly SOP 03-3 Accounting for Certain Loans or Debt Securities Acquired in a Transfer. In situations where such loans have similar risk characteristics, loans are aggregated into pools to estimate cash flows. A pool is accounted for as a single asset with a single interest rate, cumulative loss rate and cash flow expectation. Expected cash flows at the acquisition date in excess of the fair value of loans are considered to be accretable yield, which is recognized as interest income over the life of the loan pool using a level yield method if the timing and amount of the future cash flows of the pool is reasonably estimable. Subsequent to the acquisition date, any increases in cash flow over those expected at purchase date in excess of fair value are recorded as interest income prospectively. Any subsequent decreases in cash flow over those expected at purchase date due to credit deterioration are recognized by recording an allowance for losses on purchased credit impaired loans. Any disposals of loans, including sales of loans, payments in full or foreclosures result in the removal of the loan from the loan pool at the carrying amount.
Allowance for Loan Losses Methodology
Management provides for possible loan losses by maintaining an allowance. The allowance for loan losses is established through a provision for loan losses charged to expense. Loans are charged against the allowance when management believes the collection of principal or interest is unlikely. The allowance is an amount that management considers adequate to absorb possible losses on existing loans based on its evaluation of the collectability of those loans and prior loss experience. Management’s evaluations take into consideration such factors as changes in the size and nature of the loan portfolio, the overall portfolio quality, the financial condition of borrowers, the level of nonperforming loans, the Company’s historical loss experience, the estimated value of underlying collateral, and current economic conditions that may affect the borrower’s ability to pay. This evaluation is inherently subjective as it requires estimates that are susceptible to significant subsequent revision as more information becomes available.
The allowance consists of general, specific and unallocated components. The general component covers all loans not specifically identified for impairment testing. The specific component relates to loans that are individually assessed for impairment. The combined general and specific components of the allowance constitute the Company’s allocated allowance for loan losses. An unallocated allowance may be maintained to provide for credit losses inherent in the loan portfolio that may not have been contemplated in the general risk factors or the specific allowance analysis.
The Company performs regular credit reviews of the loan portfolio to determine the credit quality of the portfolio and the Company’s adherence to underwriting standards. When loans are originated, they are assigned a risk rating that is reassessed periodically during the terms of the loans through the credit review process. The risk rating categories constitute a primary factor in determining an appropriate amount for the general allowance for loan losses. The general
67
Table of Contents
allowance is calculated by applying risk factors to pools of outstanding loans. Risk factors are assigned based on management’s evaluation of the losses inherent within each identified loan category. Loan categories with greater risk of loss are therefore assigned a higher risk factor. The Company’s Asset and Liability Committee (“ALCO”) and Board of Directors are responsible for, among other things, regularly reviewing the allowance for loan losses methodology, including loss factors, and ensuring that it is designed and applied in accordance with generally accepted accounting principles.
Regular credit reviews of the portfolio are performed to identify loans that are considered potentially impaired. Potentially impaired loans are referred to the ALCO Committee, which reviews loans recommended for impairment. A loan is considered impaired when, based on current information and events, the Company is unlikely to collect all principal and interest due according to the terms of the loan agreement. When a loan is deemed to be impaired, the amount of the impairment is measured using discounted cash flows except when the sole remaining source of the repayment is the liquidation of the collateral. In these cases, the current fair value of the collateral, less selling costs, is used. Impairment is recognized as a specific component within the allowance for loan losses if the value of the impaired loan is less than the recorded investment in the loan. When the amount of the impairment represents a confirmed loss, it is charged off against the allowance for loan losses. Loans specifically reviewed for impairment are excluded from the general allowance calculation to prevent double-counting the loss exposure. The Company’s ALCO Committee reviews loans recommended for impaired status and those recommended to be removed from impaired status. The Company’s ALCO Committee and Board provide oversight of the allowance for loan losses process and review and approve the allowance methodology on a quarterly basis.
During the second quarter 2013, the Company changed to full migration analysis from the method of probability of default and loss given default, to determine the appropriate amount of general reserves. This method of analysis involves tracking the loss experience on a rolling population of loans over a period of several quarters and the collection and analysis of historical data to determine what rate of loss the Bank has incurred on similarly criticized loans and how the current portfolio could migrate to loss. The change in methodology did not have a material impact on the allowance for loan losses calculation.
Charge-off Methodology
When it becomes evident that a loan has a probable loss and is deemed uncollectable, regardless of delinquent status, the loan is charged-off. A partial charge-off will occur to the extent of the portion of the loan that is not well secured and is in the process of collection. Additionally, a partial charge-off will occur to the extent of the portion of the loan that is not guaranteed by a federal or state government agency and is in the process of collection. In circumstances where it is evident that a government guarantee will not be honored, the loan will be charged-off to the extent of the portion of the loan that is not well secured. Commercial overdrafts will be charged-off within the month the delinquent checking account becomes 90 days delinquent.
Troubled Debt Restructuring
Loans are reported as a troubled debt restructuring when the Company grants a concession to a borrower experiencing financial difficulties that it would not otherwise consider. Examples of such concessions include a reduction in the loan rate, forgiveness of principal or accrued interest, extending the maturity date, or providing a lower interest rate than would be normally available for a transaction of similar risk. The Company will undertake a restructuring only when it occurs in ways which improve the likelihood that the credit will be repaid in full under the modified terms and in accordance with a reasonable repayment schedule.
Off-Balance Sheet Credit Exposure – A reserve for unfunded commitments is maintained at a level that, in the opinion of management, is adequate to absorb probable losses associated with the Company’s commitment to lend funds under existing agreements such as letters or lines of credit. Management determines the adequacy of the reserve for unfunded commitments based upon reviews of individual credit facilities, current economic conditions, the risk characteristics of the various categories of commitments and other relevant factors. These factors include the quality of the current loan portfolio: the trend in the loan portfolio’s risk ratings, current economic conditions, loan concentrations, loan growth rates, past-due and nonperforming trends, evaluation of specific loss estimates for all significant problem loans, historical charge-off and recovery experience, and other pertinent information. The reserve is based on estimates and ultimate losses may vary from the current estimates. These estimates are evaluated on a regular basis and, as adjustments become necessary, they are reported in earnings in the periods in which they become known. Draws on unfunded commitments that are considered uncollectible at the time funds are advanced are charged to the allowance. Provisions for unfunded commitment losses and recoveries on loans commitments previously charged-off are added to the reserve for unfunded commitments, which is included in the Accrued Interest and Other Payables section of the consolidated balance sheets. At December 31, 2015, the reserve for unfunded loan commitments totaled $360 compared to $227 at December 31, 2014.
68
Table of Contents
Foreclosed Assets – Assets acquired through foreclosure, or deeds in lieu of foreclosure, are initially recorded at fair value less the estimated cost of disposal, at the date of foreclosure. Any excess of the loan’s balance over the fair value of the foreclosed collateral is charged to the allowance for loan losses.
Improvements to foreclosed assets are capitalized to the extent that the improvements increase the fair value of the assets. Expenditures for routine maintenance and repairs of foreclosed assets are charged to expense as incurred. Management performs periodic valuations of foreclosed assets and may adjust the values to the lower of carrying amount or fair value less the estimated costs to sell. Write downs to net realizable value, if any, and disposition gains or losses are included in noninterest income or expense.
Federal Home Loan Bank Stock – The investment in Federal Home Loan Bank (“FHLB”) stock is carried at par value, which approximates its fair value. As a member of the FHLB system, the Company is required to maintain a minimum level of investment in FHLB stock based on specific percentages of its outstanding mortgages, total assets or FHLB advances.
FHLB stock is generally viewed as a long-term investment. Accordingly, when evaluating FHLB stock for impairment, its value is determined based on the ultimate recoverability of the par value rather than by recognizing temporary declines in value. The determination of whether the decline affects the ultimate recoverability is influenced by criteria such as the following:
| • | The significance of the decline in net assets of the FHLBs as compared to the capital stock amount for the FHLBs and the length of time this situation has persisted. |
| • | Commitments by the FHLBs to make payments required by law or regulation and the level of such payments in relation to the operating performance of the FHLBs. |
| • | The impact of legislative and regulatory changes on the institution and, accordingly, on the customer base of the FHLBs. |
| • | The liquidity position of the FHLBs. |
Property, Plant and Equipment – Property is stated at cost, net of accumulated depreciation and amortization. Additions, betterments and replacements of major units are capitalized. Expenditures for normal maintenance, repairs and replacements of minor units are charged to expense as incurred. Gains or losses realized from sales or retirements are reflected in operations currently.
Depreciation and amortization is computed by the straight-line method over the estimated useful lives of the assets. Estimated useful lives are 30 to 40 years for buildings, 3 to 10 years for furniture and equipment, and up to the lesser of the useful life or lease term for leasehold improvements.
Goodwill and Intangible Assets – Intangible assets are comprised of goodwill and other intangibles acquired in business combinations. Goodwill and intangible assets with indefinite useful lives are not amortized. Intangible assets with definite useful lives are amortized to their estimated residual values over their respective estimated useful lives, and also reviewed for impairment. The Company performs a goodwill impairment analysis on an annual basis as of December 31. Additionally, the Company performs a goodwill impairment evaluation on an interim basis when events or circumstances indicate impairment potentially exists. A significant amount of judgment is involved in determining if an indicator of impairment has occurred. Such indicators may include, among others, a significant decline in our expected future cash flows; a sustained, significant decline in our stock price and market capitalization; a significant adverse change in legal factors or in the business climate; adverse action or assessment by a regulator; and unanticipated competition.
Bank-owned Life Insurance – Bank-owned life insurance is recorded at the estimated cash-surrender value of the policies. Increases in the cash-surrender value are recorded as noninterest income.
69
Table of Contents
Advertising – Advertising costs are charged to expense during the year in which they are incurred. Advertising expenses were $718, $745, and $894, for the years ended December 31, 2015, 2014 and 2013, respectively.
Income Taxes – Income taxes are accounted for using the asset and liability method. Deferred tax assets and liabilities are recognized for the expected future tax consequences attributable to differences between financial statement carrying amounts of existing assets and liabilities and their respective tax bases. Deferred tax assets and liabilities are calculated using tax rates in effect for the year in which the differences are expected to reverse. Valuation allowances are established to reduce the net carrying amount of deferred tax assets if it is determined to be more likely than not that all or some of the potential deferred tax asset will not be realized.
The Company follows the provisions of the Financial Accounting Standards Boards’ (“FASB”) ASC 740, “Income Taxes,” relating to accounting for uncertain tax positions. Uncertain tax positions may arise when the Company takes or expects to take a tax position that is ultimately disallowed by the relevant taxing authority. The Company files income tax returns with the Internal Revenue Service and any states in which it has identified that it has nexus. Tax returns for the years subsequent to 2009 remain open to examination by the taxing jurisdictions. Management reviews the Company’s balance sheet, income statement, income tax provision and income tax returns as well as the permanent and temporary adjustments affecting current and deferred income taxes quarterly and assesses whether uncertain tax positions exist. At December 31, 2015, management does not believe that any uncertain tax positions exist, that are not more-likely-than-not, sustainable upon examination. The Company’s policy with respect to interest and penalties ensuing from income tax settlements is to recognize them as noninterest expense.
Earnings Per Share – Basic earnings per share are computed by dividing net income by the weighted average number of shares outstanding during the period. Diluted earnings per share include the effect of common stock equivalents that would arise from the exercise of stock options discussed in Note 17. Weighted shares outstanding are adjusted retroactively for the effect of stock dividends.
| Weighted average shares outstanding as of December 31, |
||||||||||||
| 2015 | 2014 | 2013 | ||||||||||
| Basic |
19,250,838 | 17,821,580 | 17,871,439 | |||||||||
| Common stock equivalents attributable to stock-based compensation plans |
141,241 | 223,448 | 188,484 | |||||||||
|
|
|
|
|
|
|
|||||||
| Diluted |
19,392,079 | 18,045,028 | 18,059,923 | |||||||||
|
|
|
|
|
|
|
|||||||
Equity grants, including options and Stock Appreciation Rights, for 320,864, 323,933 and 368,705 weighted average shares of common stock were excluded from the diluted earnings per share calculation in 2015, 2014 and 2013, respectively, due to their anti-dilutive effect.
Share-Based Payment Plans – Financial accounting standards require companies to measure and recognize compensation expense for all share-based payments at the grant date based on the fair value of the award, as defined in FASB ASC 718, “Stock Compensation,” and include such costs as an expense in their income statements over the requisite service (vesting) period. The Company estimates the impact of forfeitures based on historical experience with previously granted share-based compensation awards, and considers the impact of the forfeitures when determining the amount of expense to record. The Company generally issues new shares of common stock to satisfy stock option exercises. The Company uses the Black-Scholes option pricing model to measure fair value. No options or Stock Appreciation Rights (“SARs”) were granted in 2014 or 2015. Incentive stock options, nonqualified stock options, restricted stock, restricted stock units, and stock-settled SARs are recognized as equity-based awards and compensation expense is recorded to the income statement over the requisite vesting period based on the grant-date fair value. SARs settled in cash are recognized on the balance sheet as liability-based awards. The grant-date fair value of liability-based awards vesting in the current period, along with the change in fair value of the awards during the period, are recognized as compensation expense and as an adjustment to the recorded liability.
70
Table of Contents
Fair Value Measurements – Generally accepted accounting principles define fair value as the price that would be received to sell an asset or paid to transfer a liability in an orderly transaction between market participants at the measurement date. FASB ASC 820, “Fair Value Measurements,” establishes a three-level hierarchy for disclosure of assets and liabilities recorded at fair value. The classification of assets and liabilities within the hierarchy is based on whether the inputs to the valuation methodology used for measurement are observable or unobservable. Observable inputs reflect market-derived or market-based information obtained from independent sources while unobservable inputs reflect our estimates about market data. In general, fair values determined by Level 1 inputs utilize quoted prices for identical assets or liabilities traded in active markets that the Company has the ability to access. Fair values determined by Level 2 inputs utilize inputs other than quoted prices included in Level 1 that are observable for the asset or liability, either directly or indirectly. Level 2 inputs include quoted prices for similar assets and liabilities in active markets and inputs other than quoted prices that are observable for the asset or liability, such as interest rates and yield curves that are observable at commonly quoted intervals. Level 3 inputs are unobservable inputs for the asset or liability and include situations where there is little, if any, market activity for the asset or liability. In certain cases, the inputs used to measure fair value may fall into different levels of the fair value hierarchy. In such cases, the level in the fair value hierarchy within which the fair value measurement in its entirety falls has been determined based on the lowest level input that is significant to the fair value measurement in its entirety. The Company’s assessment of the significance of a particular input to the fair value measurement in its entirety requires judgment, and considers factors specific to the asset or liability.
Derivative Instruments—Derivative instruments are entered into primarily as a risk management tool of the Company to help manage its interest rate risk position. Financial derivatives are recorded at fair value as other assets and other liabilities. The accounting for changes in the fair value of a derivative depends on whether it has been designated and qualifies as part of a hedging relationship. For a fair value hedge, changes in the fair value of the derivative instrument and changes in the fair value of the hedged asset or liability are recognized currently in earnings. For a cash flow hedge, changes in the fair value of the derivative instrument, to the extent that it is effective, are recorded in accumulated other comprehensive income and subsequently reclassified to earnings as the hedged transaction impacts net income. Any ineffective portion of a cash flow hedge is recognized currently in earnings.
Operating Segments –Public enterprises are required to report certain information about their operating segments in a complete set of financial statements to shareholders. They are also required to report certain enterprise-wide information about the Company’s products and services, its activities in different geographic areas and its reliance on major customers. The basis for determining the Company’s operating segments is the manner in which management operates the business. During 2015, 2014 and 2013, the Company operated under one segment.
Recently Issued Accounting Pronouncements –
In January 2014, the FASB issued ASU No. 2014-01, Accounting for Investments in Qualified Affordable Housing Projects. ASU 2014-01 permits an entity to make an accounting policy election to account for its investments in qualified affordable housing projects using the proportional amortization method if certain conditions are met. Under the proportional amortization method, an entity amortizes the initial cost of the investment in proportion to the tax credits and other tax benefits received and recognizes the net investment performance in the income statement as a component of income tax expense (benefit). The amendments are effective for annual and interim reporting periods beginning on or after December 15, 2014 and should be applied prospectively. The adoption of ASU No. 2014-01 did not have a material impact on the Company’s consolidated financial statements.
In January 2014, the FASB issued ASU No. 2014-04, Reclassification of Residential Real Estate Collateralized Consumer Mortgage Loans upon foreclosure. ASU 2014-04 clarifies that an in substance repossession or foreclosure occurs, and a creditor is considered to have received physical possession of residential real estate property collateralizing a consumer mortgage loan, upon either (1) the creditor obtaining legal title to the residential real estate property upon completion of a foreclosure or (2) the borrower conveying all interest in the residential real estate property to the creditor to satisfy that loan through completion of a deed in lieu of foreclosure or through a similar legal agreement. Additionally, the amendments require interim and annual disclosure of both (1) the amount of foreclosed residential real estate property held by the creditor and (2) the recorded investment in consumer mortgage loans collateralized by residential real estate property that are in the process of foreclosure according to local requirements of the applicable jurisdiction. The amendments are effective for annual and interim reporting periods beginning on or after December 15, 2014 and can be applied with a modified retrospective transition method or prospectively. The adoption of ASU No. 2014-04 did not have a material impact on the Company’s consolidated financial statements.
71
Table of Contents
In May 2014, the FASB issued ASU No. 2014-09, Revenue from Contracts with Customers (Topic 606), with an original effective date for annual reporting periods beginning after December 15, 2016. The core principle of this Topic is that an entity recognizes revenue to depict the transfer of promised goods or services to customers in an amount that reflects the consideration to which the entity expects to be entitled in exchange for those goods or services. In general, the new guidance requires companies to use more judgment and make more estimates than under current guidance, including identifying performance obligations in the contract, estimating the amount of variable consideration to include in the transaction price and allocating the transaction price to each separate performance obligation. In August 2015, the FASB issued ASU No. 2015-14, Revenue from Contracts with Customers (Topic 606), which deferred the effective date of ASU 2014-09 to annual periods beginning after December 15, 2017. The adoption of ASU No. 2014-09 is not expected to have a material impact on the Company’s consolidated financial statements.
In June 2014, the FASB issued ASU No. 2014-11, Transfers and Servicing Repurchase-to-Maturity Transactions, Repurchase Financings, and Disclosures. ASU 2014-11 improves the financial reporting of repurchase agreements and other similar transactions by introducing two accounting changes: (1) repurchase-to-maturity transactions will be accounted for as secured borrowing transactions on the balance sheet; previously, they were accounted for as sales when certain conditions were met, and (2) for repurchase financing arrangements, an entity will account separately for a transfer of a financial asset executed contemporaneously with a repurchase agreement with the same counterparty. It also requires enhanced disclosures about repurchase agreements and other similar transactions. This ASU is effective for the first interim or annual period beginning after December 15, 2014. The adoption of ASU No. 2014-11 did not have a material impact on the Company’s consolidated financial statements.
In June 2014, the FASB issued ASU No. 2014-12, Accounting for Share-Based Payments When the Terms of an Award Provide That a Performance Target Could Be Achieved after the Requisite Service Period. ASU 2014-12 was issued to clarify that a performance target in a share-based payment that affects vesting and that could be achieved after the requisite service period should be accounted for as a performance condition under Accounting Standards Codification (ASC) 718, Compensation — Stock Compensation. As a result, the target is not reflected in the estimation of the award’s grant date fair value. Compensation cost would be recognized over the required service period, if it is probable that the performance condition will be achieved. The amendments in this ASU can be applied prospectively or retrospectively and are effective for annual periods and interim periods within those annual periods beginning after December 15, 2015 with early adoption permitted. The adoption of ASU No. 2014-12 is not expected to have a material impact on the Company’s consolidated financial statements.
In August 2014, the FASB issued ASU No. 2014-14, Classification of Certain Government-Guaranteed Mortgage Loans upon Foreclosure. ASU 2014-14 requires that a mortgage loan be derecognized and that a separate other receivable be recognized upon foreclosure if the following conditions are met (1) the loan has a government guarantee that is not separable from the loan before foreclosure; (2) at the time of foreclosure, the creditor has the intent to convey the real estate property to the guarantor and make a claim on the guarantee, and the creditor has the ability to recover under that claim, and (3) at the time of foreclosure, any amount of the claim that is determined on the basis of the fair value of the real estate is fixed. Upon foreclosure, the separate other receivable should be measured based on the amount of the loan balance (principal and interest) expected to be recovered from the guarantor. This ASU is effective for annual periods and interim periods within those annual periods beginning after December 15, 2015 with early adoption permitted. The adoption of ASU No. 2014-14, is not expected to have a material impact on the Company’s consolidated financial statements.
In February 2015, the FASB issued ASU No. 2015-02, Consolidation (Topic 810): Amendments to the Consolidation Analysis, which is intended to improve targeted areas of consolidation guidance for legal entities such as limited partnerships, limited liability corporations, and securitization structures (collateralized debt obligations, collateralized loan obligations, and mortgage-backed security transactions). The ASU focuses on simplifying the consolidation evaluation for reporting organizations that are required to evaluate whether they should consolidate certain legal entities by reducing the number of consolidation model from four to two, among other changes. The ASU will be effective for periods beginning after December 15, 2015, while early adoption is permitted. The Company does not expect this ASU to have a material impact on the Company’s consolidated financial statements.
72
Table of Contents
In April 2015, the FASB issued ASU No. 2015-03, Interest - Imputation of Interest (Subtopic 835-30): Simplifying the Presentation of Debt Issuance Costs. The amendments in this ASU require that debt issuance costs related to a recognized debt liability be presented in the balance sheet as a direct deduction from the carrying amount of that debt liability, consistent with debt discounts. The recognition and measurement guidance for debt issuance costs are not affected. ASU No. 2015-03 is effective for financial statements issued for fiscal years beginning after December 15, 2015, and interim periods within those fiscal years. ASU No. 2015-03 should be applied on a retrospective basis. The adoption of ASU No. 2015-03 is not expected to have a material impact on the Company’s consolidated financial statements.
In September 2015, the FASB issued ASU No. 2015-16, Business Combinations (Topic 805): Simplifying the Accounting for Measurement-Period Adjustments. ASU 2015-16 requires that an acquirer recognize adjustments to provisional amounts that are identified during the measurement period in the reporting period in which the adjustment amounts are determined. The amendments in this Update require that the acquirer record, in the same period’s financial statements, the effect on earnings of changes in depreciation, amortization, or other income effects, if any, as a result of the change to the provisional amounts, calculated as if the accounting had been completed at the acquisition date. The amendments in this Update require an entity to present separately on the face of the income statement or disclose in the notes the portion of the amount recorded in current-period earnings by line item that would have been recorded in previous reporting periods if the adjustment to the provisional amounts had been recognized as of the acquisition date. The new standard is effective for fiscal years beginning after December 15, 2015, and interim periods within those fiscal years. The adoption of ASU No. 2015-16 has a potential impact on the Company, depending on any future business combinations.
In January 2016, the FASB issued ASU No. 2016-01, Financial Instruments – Overall (Subtopic 825-10): Recognition and Measurement of Financial Assets and Financial Liabilities. The new guidance is intended to improve the recognition and measurement of financial instruments. This ASU requires equity investments (except those accounted for under the equity method of accounting, or those that result in consolidation of the investee) to be measured at fair value with changes in fair value recognized in net income. In addition, the amendment requires public business entities to use the exit price notion when measuring the fair value of financial instruments for disclosure purposes and requires separate presentation of financial assets and financial liabilities by measurement category and form of financial asset (i.e., securities or loans and receivables) on the balance sheet or the accompanying notes to the financial statements. This ASU also eliminates the requirement for public business entities to disclose the method(s) and significant assumptions used to estimate the fair value that is required to be disclosed for financial instruments measured at amortized cost on the balance sheet. The amendment also requires a reporting organization to present separately in other comprehensive income the portion of the total change in the fair value of a liability resulting from a change in the instrument specific credit risk (also referred to as “own credit”) when the organization has elected to measure the liability at fair value in accordance with the fair value option for financial instruments. ASU No. 2016-01 is effective for financial statements issued for fiscal years beginning after December 15, 2017, and interim periods within those fiscal years. Early adoption is permitted for certain provisions. The Company is currently evaluating the impact of this ASU on the Company’s consolidated financial statements.
Subsequent events – The Company has evaluated events and transactions subsequent to December 31, 2015, for potential recognition or disclosure.
Reclassifications – Certain amounts contained in the 2014 and 2013 consolidated financial statements have been reclassified where appropriate to conform to the financial statement presentation used in 2015. These reclassifications had no effect on previously reported net income.
73
Table of Contents
NOTE 2—BUSINESS COMBINATIONS:
On March 6, 2015, the Company completed its acquisition of all of the common stock of Capital Pacific Bancorp and its wholly-owned subsidiary, Capital Pacific Bank, of Portland, Oregon. The acquisition of Capital Pacific Bank reflects the Company’s overall banking expansion strategy, and expanded the combined Bank’s presence in the Portland market.
The transaction has been accounted for under the acquisition method of accounting. The assets and liabilities were recorded at their estimated fair values as of the acquisition dates. The application of the acquisition method resulted in the recognition of goodwill of $16,374, which is all attributable to the value of Capital Pacific’s lending and deposit gathering banking activities. None of the goodwill is deductible for income tax purposes as the Merger is accounted for as a tax-free exchange. Below is a reconciliation of the goodwill associated with the transaction:
| March 6, 2015 | ||||
| Cost basis net assets |
$ | 26,847 | ||
| Less: |
||||
| Cash payment to shareholders |
(16,413 | ) | ||
| Cash payment to employees and directors |
(1,609 | ) | ||
| Stock issued |
(23,578 | ) | ||
| Fair value adjustments: |
||||
| Loans and leases, net |
(5,376 | ) | ||
| Core deposit intangible |
3,721 | |||
| Other |
34 | |||
|
|
|
|||
| Goodwill |
$ | (16,374 | ) | |
|
|
|
|||
Pursuant to the terms of the merger agreement, former Capital Pacific Bancorp shareholders received either $16.00 per share in cash or 1.132 shares of Pacific Continental common stock for each share of Capital Pacific Bancorp common stock, or a combination of 40.0% in the form of cash and 60.0% in the form of Pacific Continental common stock. Pursuant to the merger agreement, the maximum aggregate cash component of the merger consideration was $16,413 and the aggregate stock component of the merger consideration was 1,778,102 shares of Pacific Continental common stock, the value of which was calculated based on a closing stock price of $13.21per share. The cash election was oversubscribed; therefore shareholders electing all cash received $7.55 in cash and 0.598 shares of Pacific Continental common stock for each share of Capital Pacific common stock. Former Capital Pacific shareholders making a valid mixed election received $6.40 in cash and 0.679 shares of Pacific Continental common stock for each share of Capital Pacific common stock.
The operations of Capital Pacific Bank are included in the operating results beginning March 6, 2015. Capital Pacific Bank’s results of operations prior to the acquisition are not included in the operating results. Revenue information for Capital Pacific Bank related revenue and expense cannot be practically separated from Pacific Continental, therefore proforma revenue disclosures have not been included. Merger-related expense of $1,836 was incurred during the first quarter 2015 in connection with the acquisition of Capital Pacific Bank and recognized within the merger-related expense line item on the Consolidated Statements of Income. Accrued restructuring charges relating to the Capital Pacific Bank acquisition were recorded in other liabilities and had a remaining balance of $12 at December 31, 2015.
Included in Capital Pacific Bancorp’s outstanding liabilities at March 6, 2015, was a note payable to Bell State Bank, in the amount of $3,344, including accrued interest. This figure represents debt Capital Pacific Bancorp incurred in connection with the payoff of their TARP funds. This debt was satisfied at merger closing by Pacific Continental Bank.
74
Table of Contents
The statement of assets acquired and liabilities assumed at their fair values are presented below as of the transaction closing date:
CAPITAL PACIFIC BANCORP
Opening balance sheet
(in thousands)
| March 6, 2015 | ||||
| ASSETS |
||||
| Securities available-for-sale |
$ | 26,010 | ||
| Gross loans |
208,782 | |||
| Fair value adjustments |
||||
| Credit quality-related |
(3,316 | ) | ||
| Interest rate-related |
(2,060 | ) | ||
|
|
|
|||
| Net loans |
203,406 | |||
| Interest receivable |
547 | |||
| Federal Home Loan Bank stock |
627 | |||
| Property and equipment |
229 | |||
| Goodwill |
16,374 | |||
| Core deposit intangible |
3,721 | |||
| Deferred tax asset |
1,226 | |||
| Taxes receivable |
656 | |||
| Other real estate owned |
845 | |||
| Bank-owned life insurance |
5,683 | |||
| Other asset |
201 | |||
|
|
|
|||
| Total assets |
$ | 259,525 | ||
|
|
|
|||
| LIABILITIES AND SHAREHOLDERS EQUITY |
||||
| Deposits |
$ | 227,967 | ||
| Other liabilities |
4,731 | |||
|
|
|
|||
| Total liabilities |
232,698 | |||
| Common stock |
23,578 | |||
| Cash paid, net of cash acquired |
3,249 | |||
|
|
|
|||
| Total liabilities and shareholders’ equity |
$ | 259,525 | ||
|
|
|
|||
The acquisition of Capital Pacific Bank is not considered significant to the Company’s consolidated financial statements and therefore pro forma financial information is not presented.
75
Table of Contents
NOTE 3—CASH AND CASH EQUIVALENTS:
The Company is required to maintain certain reserves with the Federal Reserve Bank. Such reserves totaling $11,015 and $3,123 were maintained within the Company’s cash balances at December 31, 2015, and 2014, respectively. The Company maintains cash held as collateral for interest rate swaps totaling $803 and $401 at December 31, 2015 and 2014, respectively.
NOTE 4—SECURITIES AVAILABLE-FOR-SALE:
The amortized cost and estimated fair values of securities available-for-sale at December 31, 2015, are as follows:
| Gross | Gross | Estimated | Percentage | |||||||||||||||||
| Amortized | Unrealized | Unrealized | Fair | of | ||||||||||||||||
| Cost | Gains | Losses | Value | Portfolio | ||||||||||||||||
| Unrealized Loss Positions | ||||||||||||||||||||
| Obligations of U.S. government agencies |
$ | 14,491 | $ | — | $ | (119 | ) | $ | 14,372 | 3.92 | % | |||||||||
| Obligations of states and political subdivisions |
13,438 | — | (149 | ) | 13,289 | 3.62 | % | |||||||||||||
| Private-label mortgage-backed securities |
663 | — | (33 | ) | 630 | 0.17 | % | |||||||||||||
| Mortgage-backed securities |
95,040 | — | (856 | ) | 94,184 | 25.69 | % | |||||||||||||
| SBA pools |
17,225 | — | (101 | ) | 17,124 | 4.67 | % | |||||||||||||
| Corporate securities |
899 | — | (5 | ) | 893 | 0.25 | % | |||||||||||||
|
|
|
|
|
|
|
|
|
|
|
|||||||||||
| $ | 141,756 | $ | — | $ | (1,263 | ) | $ | 140,492 | 38.32 | % | ||||||||||
|
|
|
|
|
|
|
|
|
|
|
|||||||||||
| Unrealized Gain Positions | ||||||||||||||||||||
| Obligations of U.S. government agencies |
$ | 29,669 | $ | 582 | $ | — | $ | 30,251 | 8.25 | % | ||||||||||
| Obligations of states and political subdivisions |
80,119 | 3,743 | — | 83,862 | 22.88 | % | ||||||||||||||
| Private-label mortgage-backed securities |
2,028 | 131 | — | 2,159 | 0.59 | % | ||||||||||||||
| Mortgage-backed securities |
90,126 | 1,060 | — | 91,186 | 24.87 | % | ||||||||||||||
| SBA pools |
18,560 | 88 | — | 18,648 | 5.09 | % | ||||||||||||||
| Corporate securities |
— | — | — | — | 0.00 | % | ||||||||||||||
|
|
|
|
|
|
|
|
|
|
|
|||||||||||
| $ | 220,502 | $ | 5,604 | $ | — | $ | 226,106 | 61.68 | % | |||||||||||
|
|
|
|
|
|
|
|
|
|
|
|||||||||||
| $ | 362,258 | $ | 5,604 | $ | (1,263 | ) | $ | 366,598 | 100.00 | % | ||||||||||
|
|
|
|
|
|
|
|
|
|
|
|||||||||||
At December 31, 2015, unrealized losses exist on certain securities classified as obligations of U.S. government agencies, obligations of states and political subdivisions, mortgage-backed securities, private-label mortgage-backed securities and SBA pools. The unrealized losses on all securities are deemed to be temporary, as these securities retain strong credit ratings, continue to perform adequately, and are backed by various government sponsored enterprises. These decreases in fair value are associated with the changes in market interest rates or the widening of market spreads subsequent to the initial purchase of the securities, and not due to concerns regarding the underlying credit of the issuers or the underlying collateral. The decline in value of these securities has resulted from to changes in interest rates relative to where these investments fall within the yield curve and their individual characteristics. Because the Company does not currently intend to sell these securities nor does the Company consider it more likely than not that it will be required to sell these securities before the recovery of amortized cost basis, which may be upon maturity, the Company does not consider these investments to be other-than-temporarily impaired at December 31, 2015.
76
Table of Contents
The following table presents a summary of securities in a continuous unrealized loss position as December 31, 2015:
| Securities in | Gross Unrealized |
Securities in | Gross Unrealized |
|||||||||||||
| Continuous | Loss on | Continuous | Loss on | |||||||||||||
| Unrealized | Securities in | Unrealized | Securities in | |||||||||||||
| Loss Positions | Loss Position | Loss Positions | Loss Position | |||||||||||||
| for less than 12 | for Less than | for 12 Months | for 12 Months | |||||||||||||
| Months | 12 Months | or Longer | or Longer | |||||||||||||
| Obligations of U.S. government agencies |
$ | 14,372 | $ | (119 | ) | $ | — | $ | — | |||||||
| Obligations of states and political subdivisions |
12,761 | (145 | ) | 528 | (4 | ) | ||||||||||
| Private-label mortgage-backed securities |
240 | (4 | ) | 390 | (29 | ) | ||||||||||
| Mortgage-backed securities |
87,896 | (711 | ) | 6,288 | (145 | ) | ||||||||||
| SBA variable rate pools |
13,539 | (78 | ) | 3,585 | (23 | ) | ||||||||||
| Corporate securities |
893 | (5 | ) | — | — | |||||||||||
|
|
|
|
|
|
|
|
|
|||||||||
| $ | 129,701 | $ | (1,062 | ) | $ | 10,791 | $ | (201 | ) | |||||||
|
|
|
|
|
|
|
|
|
|||||||||
On a monthly basis management reviewed all of its private-label mortgage-backed securities for the presence of OTTI and during 2015 recorded $22 on one security. Management’s evaluation included the use of independently-generated third-party credit surveillance reports that analyze the loans underlying each security. These reports include estimates of default rates and severities, life collateral loss rates, and static voluntary prepayment assumptions to generate estimated cash flows at the individual security level. Additionally, management considered factors such as downgraded credit ratings, severity and duration of the impairments, the stability of the issuers, and any discounts paid when the securities were purchased. Management has considered all available information related to the collectability of the impaired investment securities and believes that the estimated credit loss is appropriate.
Following is a tabular roll-forward of the amount of credit-related OTTI recognized in earnings during 2015, 2014 and 2013:
| December 31, | ||||||||||||
| 2015 | 2014 | 2013 | ||||||||||
| Balance, beginning of period: |
$ | 227 | $ | 227 | $ | 204 | ||||||
| Additions: |
||||||||||||
| OTTI credit loss recorded |
22 | — | 23 | |||||||||
| Less: |
||||||||||||
| OTTI reduction from sale or maturity |
— | — | — | |||||||||
|
|
|
|
|
|
|
|||||||
| Balance, end of period: |
$ | 249 | $ | 227 | $ | 227 | ||||||
|
|
|
|
|
|
|
|||||||
At December 31, 2015, six of the Company’s private-label mortgage-backed securities with an amortized cost of $1,506 were classified as substandard as their ratings were below investment grade. Securities with an amortized cost of $1,879 and $2,593 were classified as substandard at December 31, 2014, and December 31, 2013, respectively.
At December 31, 2015 the projected average life of the securities portfolio was 4.21 years and its modified duration was 3.73 years.
77
Table of Contents
The amortized cost and estimated fair values of securities available-for-sale at December 31, 2014, were as follows:
| Gross | Gross | Estimated | Percentage | |||||||||||||||||
| Amortized | Unrealized | Unrealized | Fair | of | ||||||||||||||||
| Cost | Gains | Losses | Value | Portfolio | ||||||||||||||||
| Unrealized Loss Positions | ||||||||||||||||||||
| Obligations of U.S. government agencies |
$ | 7,573 | $ | — | $ | (72 | ) | $ | 7,501 | 2.13 | % | |||||||||
| Obligations of states and political subdivisions |
11,755 | — | (253 | ) | 11,502 | 3.27 | % | |||||||||||||
| Private-label mortgage-backed securities |
847 | — | (64 | ) | 783 | 0.22 | % | |||||||||||||
| Mortgage-backed securities |
64,644 | — | (544 | ) | 64,100 | 18.21 | % | |||||||||||||
| SBA pools |
13,059 | — | (56 | ) | 13,003 | 3.70 | % | |||||||||||||
|
|
|
|
|
|
|
|
|
|
|
|||||||||||
| $ | 97,878 | $ | — | $ | (989 | ) | $ | 96,889 | 27.53 | % | ||||||||||
|
|
|
|
|
|
|
|
|
|
|
|||||||||||
| Unrealized Gain Positions | ||||||||||||||||||||
| Obligations of U.S. government agencies |
$ | 31,068 | $ | 616 | $ | — | $ | 31,684 | 9.00 | % | ||||||||||
| Obligations of states and political subdivisions |
69,172 | 3,307 | — | 72,479 | 20.59 | % | ||||||||||||||
| Private-label mortgage-backed securities |
2,924 | 109 | — | 3,033 | 0.86 | % | ||||||||||||||
| Mortgage-backed securities |
138,306 | 2,984 | — | 141,290 | 40.15 | % | ||||||||||||||
| SBA variable rate pools |
6,541 | 30 | — | 6,571 | 1.87 | % | ||||||||||||||
|
|
|
|
|
|
|
|
|
|
|
|||||||||||
| 248,011 | 7,046 | — | 255,057 | 72.47 | % | |||||||||||||||
|
|
|
|
|
|
|
|
|
|
|
|||||||||||
| $ | 345,889 | $ | 7,046 | $ | (989 | ) | $ | 351,946 | 100.00 | % | ||||||||||
|
|
|
|
|
|
|
|
|
|
|
|||||||||||
The following table presents a summary of securities in a continuous unrealized loss position at December 31, 2014:
| Gross | Gross | |||||||||||||||
| Securities in | Unrealized | Securities in | Unrealized | |||||||||||||
| Continuous | Loss on | Continuous | Loss on | |||||||||||||
| Unrealized | Securities in | Unrealized | Securities in | |||||||||||||
| Loss Positions | Loss Position | Loss Positions | Loss Position | |||||||||||||
| for less than 12 | for Less than | for 12 Months | for 12 Months | |||||||||||||
| Months | 12 Months | or Longer | or Longer | |||||||||||||
| Obligations of U.S. government agencies |
$ | 4,564 | $ | (10 | ) | $ | 2,936 | $ | (62 | ) | ||||||
| Obligations of states and political subdivisions |
2,620 | (38 | ) | 8,883 | (214 | ) | ||||||||||
| Private-label mortgage-backed securities |
303 | (12 | ) | 480 | (52 | ) | ||||||||||
| Mortgage-backed securities |
40,269 | (178 | ) | 23,831 | (366 | ) | ||||||||||
| SBA variable rate pools |
11,833 | (49) | 1,169 | (8) | ||||||||||||
| $ | 59,589 | $ | (287 | ) | $ | 37,299 | $ | (702 | ) | |||||||
78
Table of Contents
The amortized cost and estimated fair value of securities at December 31, 2015, and 2014, are shown below by maturity or projected average life, depending on the type of security. Obligations of U.S. government agencies and states and political subdivisions are shown by contractual maturity. Mortgage-backed securities are shown by projected average life.
| December 31, | ||||||||||||||||
| 2015 | 2014 | |||||||||||||||
| Amortized Cost |
Estimated Fair Value |
Amortized Cost |
Estimated Fair Value |
|||||||||||||
| Due in one year or less |
$ | 14,455 | $ | 14,513 | $ | 17,072 | $ | 17,273 | ||||||||
| Due after one year through 5 years |
235,926 | 238,637 | 220,908 | 223,540 | ||||||||||||
| Due after 5 years through 10 years |
109,017 | 110,539 | 69,523 | 71,584 | ||||||||||||
| Due after 10 years |
2,860 | 2,909 | 38,386 | 39,549 | ||||||||||||
|
|
|
|
|
|
|
|
|
|||||||||
| $ | 362,258 | $ | 366,598 | $ | 345,889 | $ | 351,946 | |||||||||
|
|
|
|
|
|
|
|
|
|||||||||
During 2015, 61 investment securities were sold resulting in proceeds of $52,371. The sales generated a gross gain of $922 and a gross loss of $250, totaling a net gain of $672. The specific identification method was used to determine the cost of the securities sold.
During 2014, 72 investment securities were sold resulting in proceeds of $25,570. The sales generated a gross gain of $318 and a gross loss of $352, totaling a net loss of $34. The specific identification method was used to determine the cost of the securities sold.
During 2013, four investment securities were sold resulting in proceeds of $1,843. The sales generated a gross loss of $8. The specific identification method was used to determine the cost of the securities sold.
The following table presents investment securities which were pledged to secure public deposits and repurchase agreements as permitted and required by law:
| December 31, | ||||||||||||||||
| 2015 | 2014 | |||||||||||||||
| Amortized Cost |
Estimated Fair Value |
Amortized Cost |
Estimated Fair Value |
|||||||||||||
| Pledged to secure public deposits |
$ | 27,938 | $ | 29,052 | $ | 31,937 | $ | 32,802 | ||||||||
| Pledged to secure repurchase agreements |
3,985 | 4,111 | 3,976 | 4,062 | ||||||||||||
|
|
|
|
|
|
|
|
|
|||||||||
| $ | 31,923 | $ | 33,163 | $ | 35,913 | $ | 36,864 | |||||||||
|
|
|
|
|
|
|
|
|
|||||||||
At December 31, 2015, and December 31, 2014, there was an outstanding balance for repurchase agreements of $71 and $93, respectively.
79
Table of Contents
NOTE 5 – LOANS, ALLOWANCE FOR LOAN LOSSES, AND CREDIT QUALITY INDICATORS:
Loans are stated at the amount of unpaid principal net of loan premiums or discounts for purchased loans, net deferred loan origination fees, discounts associated with retained portions of loans sold, and an allowance for loan losses. Interest on loans is calculated using the simple-interest method on daily balances of the principal amount outstanding. Loan origination fees, net of origination costs and discounts, are amortized over the lives of the loans as adjustments to yield.
Major classifications of loans at December 31 are as follows:
| December 31, | % of gross | December 31, | % of gross | |||||||||||||
| 2015 | loans | 2014 | loans | |||||||||||||
| Real estate secured loans: |
||||||||||||||||
| Multi-family residential |
$ | 66,445 | 4.7 | % | $ | 51,586 | 4.9 | % | ||||||||
| Residential 1-4 family |
53,776 | 3.8 | % | 47,222 | 4.5 | % | ||||||||||
| Owner-occupied commercial |
364,742 | 26.0 | % | 259,805 | 24.8 | % | ||||||||||
| Nonowner-occupied commercial |
300,774 | 21.4 | % | 201,558 | 19.3 | % | ||||||||||
|
|
|
|
|
|
|
|
|
|||||||||
| Total permanent real estate loans |
785,737 | 55.9 | % | 560,171 | 53.5 | % | ||||||||||
| Construction loans: |
||||||||||||||||
| Multi-family residential |
7,027 | 0.5 | % | 8,472 | 0.8 | % | ||||||||||
| Residential 1-4 family |
30,856 | 2.2 | % | 28,109 | 2.7 | % | ||||||||||
| Commercial real estate |
42,680 | 3.0 | % | 18,595 | 1.8 | % | ||||||||||
| Commercial bare land and acquisition & development |
20,537 | 1.5 | % | 12,159 | 1.2 | % | ||||||||||
| Residential bare land and acquisition & development |
7,268 | 0.5 | % | 6,632 | 0.6 | % | ||||||||||
|
|
|
|
|
|
|
|
|
|||||||||
| Total construction real estate loans |
108,368 | 7.7 | % | 73,967 | 7.1 | % | ||||||||||
|
|
|
|
|
|
|
|
|
|||||||||
| Total real estate loans |
894,105 | 63.6 | % | 634,138 | 60.6 | % | ||||||||||
| Commercial loans |
501,976 | 35.7 | % | 406,568 | 38.9 | % | ||||||||||
| Consumer loans |
3,351 | 0.2 | % | 3,862 | 0.4 | % | ||||||||||
| Other loans |
6,580 | 0.5 | % | 1,443 | 0.1 | % | ||||||||||
|
|
|
|
|
|
|
|
|
|||||||||
| Gross loans |
1,406,012 | 100.00 | % | 1,046,011 | 100.0 | % | ||||||||||
| Deferred loan origination fees |
(1,530 | ) | (990 | ) | ||||||||||||
|
|
|
|
|
|||||||||||||
| 1,404,482 | 1,045,021 | |||||||||||||||
| Allowance for loan losses |
(17,301 | ) | (15,637 | ) | ||||||||||||
|
|
|
|
|
|||||||||||||
| Total loans, net of allowance for loan losses and net deferred fees |
$ | 1,387,181 | $ | 1,029,384 | ||||||||||||
|
|
|
|
|
|||||||||||||
At December 31, 2015, outstanding loans to dental professionals totaled $340,162 and represented 24.19% of total outstanding loans compared to dental professional loans of $306,391 or 29.29% of total loans at December 31, 2014. Additional information about the Company’s dental portfolio can be found in Note 6. There are no other industry concentrations in excess of 10.00% of the total loan portfolio. However, as of December 31, 2015, 63.60% of the Company’s loan portfolio was collateralized by real estate and is, therefore, susceptible to changes in local market conditions. While appropriate action is taken to manage identified concentration risks, management believes that the loan portfolio is well diversified by geographic location and among industry groups.
80
Table of Contents
Purchased Loans
The following table represents the contractually required principal payments and the carrying balance of loans acquired in the Century Bank acquisition and the Capital Pacific Bank acquisition, at December 31, 2015, 2014 and 2013, respectively.
| December 31, | ||||||||||||
| 2015 | 2014 | 2013 | ||||||||||
| Contractually required principal payments |
$ | 183,347 | $ | 28,187 | $ | 44,358 | ||||||
| Purchase adjustment for credit and interest rate |
(3,958 | ) | (881 | ) | (1,341 | ) | ||||||
|
|
|
|
|
|
|
|||||||
| Balance of acquired loans |
$ | 179,389 | $ | 27,306 | $ | 43,017 | ||||||
|
|
|
|
|
|
|
|||||||
Purchased Credit Impaired Loans
On March 6, 2015, the Bank acquired purchased credit impaired loans with a fair value of $9,464, associated with the Capital Pacific Acquisition. The contractually required principal and interest payments at acquisition totaled $13,897, of which $646 were not expected to be collected .
The following table represents the contractually required principal balance of purchased impaired loans and the carrying balance at December 31, 2015, 2014 and 2013:
| December 31, | ||||||||||||
| 2015 | 2014 | 2013 | ||||||||||
| Contractually required principal payments for purchased credit impaired loans |
$ | 11,528 | $ | 2,753 | $ | 3,257 | ||||||
| Accretable yield |
(1,070 | ) | (151 | ) | (377 | ) | ||||||
| Nonaccretable yield |
(378 | ) | (321 | ) | (321 | ) | ||||||
|
|
|
|
|
|
|
|||||||
| Balance of purchased credit impaired loans |
$ | 10,080 | $ | 2,282 | $ | 2,559 | ||||||
|
|
|
|
|
|
|
|||||||
The following tables summarize the changes in the accretable yield for purchased impaired loans for the year ended December 31, 2015 and 2014:
| Year ended December 31, 2015 |
||||||||||||
| Century | Capital Pacific | Total | ||||||||||
| Balance, beginning of period |
$ | 151 | $ | — | $ | 151 | ||||||
| Additions |
— | 1,569 | 1,569 | |||||||||
| Accretion to interest income |
(111 | ) | (539 | ) | (650 | ) | ||||||
|
|
|
|
|
|
|
|||||||
| Balance, end of period |
$ | 40 | $ | 1,030 | $ | 1,070 | ||||||
|
|
|
|
|
|
|
|||||||
| Year ended December 31, 2014 |
||||
| Century | ||||
| Balance, beginning of period |
$ | 377 | ||
| Additions |
— | |||
| Accretion to interest income |
(226 | ) | ||
|
|
|
|||
| Balance, end of period |
$ | 151 | ||
|
|
|
|||
81
Table of Contents
Allowance for Loan Losses
The allowance for loan losses is established as an amount that management considers adequate to absorb possible losses on existing loans within the portfolio. The allowance consists of general, specific, and unallocated components. The general component is based upon all loans collectively evaluated for impairment. The specific component is based upon all loans individually evaluated for impairment. The unallocated component represents credit losses inherent in the loan portfolio that may not have been contemplated in the general risk factors or the specific allowance analysis. Loans are charged against the allowance when management believes the collection of principal and interest is unlikely.
The Company performs regular credit reviews of the loan portfolio to determine the credit quality and adherence to underwriting standards. When loans are originated, they are assigned a risk rating that is reassessed periodically during the term of the loan through the credit review process. The Company’s internal risk rating methodology assigns risk ratings ranging from one to ten, where a higher rating represents higher risk. The ten-point risk rating categories are a primary factor in determining an appropriate amount for the allowance for loan losses.
Estimated credit losses reflect consideration of all significant factors that affect the collectability of the loan portfolio. The historical loss rate for each group of loans with similar risk characteristics is determined based on the Company’s own loss experience in that group. Historical loss experience and recent trends in losses provides a reasonable starting point for analysis, however they do not by themselves form a sufficient basis to determine the appropriate level for the allowance for loan losses. Qualitative or environmental factors that are likely to cause estimated credit losses to differ from historical losses are also considered including but not limited to:
| • | Changes in international, regional, and local economic and business conditions and developments that affect the collectability of the portfolio, including the condition of various market segments, |
| • | Changes in the nature and volume of the portfolio and in the terms of loans, |
| • | Changes in the volume and severity of past due loans, the volume of nonaccrual loans, and the volume and severity of adversely classified or graded loans, |
| • | Changes in the quality of the institution’s loan review system, |
| • | Changes in the value of underlying collateral for collateral-dependent loans, |
| • | The existence and effect of any concentrations of credit, and changes in the level of such concentrations, |
| • | The effect of other external factors such as competition and legal and regulatory requirements on the level of estimated credit losses in the institution’s existing portfolio, |
| • | Changes in lending policies and procedures, including changes in underwriting standards and collection, charge-off, and recovery practices not considered elsewhere in estimating credit losses, and |
| • | Changes in the current and future US political environment, including debt ceiling negotiations, government shutdown and healthcare reform that may affect national, regional and local economic conditions, taxation, or disruption of national or global financial markets. |
The adequacy of the allowance for loan losses and the reserve for unfunded commitments is determined using a consistent, systematic methodology and is monitored regularly based on management’s evaluation of numerous factors. For each portfolio segment, these factors include:
| • | The quality of the current loan portfolio, |
| • | The trend in the migration of the loan portfolio’s risk ratings, |
| • | The velocity of migration of losses and potential losses, |
| • | Current economic conditions, |
| • | Loan concentrations, |
| • | Loan growth rates, |
| • | Past-due and nonperforming trends, |
| • | Evaluation of specific loss estimates for all significant problem loans, |
| • | Recovery experience, and |
| • | Peer comparison loss rates. |
82
Table of Contents
During 2013, the Company changed to full migration analysis from the method of probability of default and loss given default, to determine the appropriate amount of general reserves. The Company believes the change provides a more granular analysis accounting for changes in the composition of the portfolio and credit quality deterioration. This method of analysis involves tracking the loss experience on a rolling population of loans over a period of several quarters and the collection and analysis of historical data to determine what rate of loss the Bank has incurred on similarly criticized loans and how the current portfolio could migrate to loss. The change in methodology did not have a material impact on the allowance for loan losses calculation.
The following tables present a summary of the activity in the allowance for loan losses by major loan classification for the periods ended December 31, 2015, 2014 and 2013:
| For the year ended December 31, 2015 | ||||||||||||||||||||||||
| Commercial and Other |
Real Estate |
Construction | Consumer | Unallocated | Total | |||||||||||||||||||
| Beginning balance |
$ | 5,733 | $ | 7,494 | $ | 1,077 | $ | 54 | $ | 1,279 | $ | 15,637 | ||||||||||||
| Charge-offs |
(630 | ) | (61 | ) | — | (9 | ) | — | (700 | ) | ||||||||||||||
| Recoveries |
562 | 76 | 16 | 15 | — | 669 | ||||||||||||||||||
| Provision (reclassification) |
684 | 788 | 165 | (14 | ) | 72 | 1,695 | |||||||||||||||||
|
|
|
|
|
|
|
|
|
|
|
|
|
|||||||||||||
| Ending balance |
$ | 6,349 | $ | 8,297 | $ | 1,258 | $ | 46 | $ | 1,351 | $ | 17,301 | ||||||||||||
|
|
|
|
|
|
|
|
|
|
|
|
|
|||||||||||||
| For the year ended December 31, 2014 | ||||||||||||||||||||||||
| Commercial and Other |
Real Estate |
Construction | Consumer | Unallocated | Total | |||||||||||||||||||
| Beginning balance |
$ | 5,113 | $ | 7,668 | $ | 1,493 | $ | 68 | $ | 1,575 | $ | 15,917 | ||||||||||||
| Charge-offs |
(610 | ) | (58 | ) | (155 | ) | (12 | ) | — | (835 | ) | |||||||||||||
| Recoveries |
348 | 186 | 16 | 5 | — | 555 | ||||||||||||||||||
| Provision (reclassification) |
882 | (302 | ) | (277 | ) | (7 | ) | (296 | ) | — | ||||||||||||||
|
|
|
|
|
|
|
|
|
|
|
|
|
|||||||||||||
| Ending balance |
$ | 5,733 | $ | 7,494 | $ | 1,077 | $ | 54 | $ | 1,279 | $ | 15,637 | ||||||||||||
|
|
|
|
|
|
|
|
|
|
|
|
|
|||||||||||||
| For the year ended December 31, 2013 | ||||||||||||||||||||||||
| Commercial and Other |
Real Estate |
Construction | Consumer | Unallocated | Total | |||||||||||||||||||
| Beginning balance |
$ | 3,846 | $ | 9,456 | $ | 1,987 | $ | 70 | $ | 986 | $ | 16,345 | ||||||||||||
| Charge-offs |
(1,658 | ) | (407 | ) | — | (23 | ) | — | (2,088 | ) | ||||||||||||||
| Recoveries |
982 | 360 | 60 | 8 | — | 1,410 | ||||||||||||||||||
| Provision (reclassification) |
1,943 | (1,741 | ) | (554 | ) | 13 | 589 | 250 | ||||||||||||||||
|
|
|
|
|
|
|
|
|
|
|
|
|
|||||||||||||
| Ending balance |
$ | 5,113 | $ | 7,668 | $ | 1,493 | $ | 68 | $ | 1,575 | $ | 15,917 | ||||||||||||
|
|
|
|
|
|
|
|
|
|
|
|
|
|||||||||||||
83
Table of Contents
The following table presents the allowance and recorded investment in loans by major loan classification at December 31, 2015, and 2014:
| December 31, 2015 | ||||||||||||||||||||||||
| Commercial and Other |
Real Estate |
Construction | Consumer | Unallocated | Total | |||||||||||||||||||
| Ending allowance: collectively evaluated for impairment |
$ | 6,303 | $ | 8,267 | $ | 1,159 | $ | 46 | $ | 1,351 | $ | 17,126 | ||||||||||||
| Ending allowance: individually evaluated for impairment |
46 | 30 | 99 | — | — | 175 | ||||||||||||||||||
| Ending allowance: loans acquired with deteriorated credit quality |
— | — | — | — | — | — | ||||||||||||||||||
|
|
|
|
|
|
|
|
|
|
|
|
|
|||||||||||||
| Total ending allowance |
$ | 6,349 | $ | 8,297 | $ | 1,258 | $ | 46 | $ | 1,351 | $ | 17,301 | ||||||||||||
|
|
|
|
|
|
|
|
|
|
|
|
|
|||||||||||||
| Ending loan balance: collectively evaluated for impairment |
$ | 504,261 | $ | 771,543 | $ | 107,977 | $ | 3,351 | $ | — | $ | 1,387,132 | ||||||||||||
| Ending loan balance: individually evaluated for impairment |
2,627 | 5,782 | 391 | — | — | 8,800 | ||||||||||||||||||
| Ending loan balance: loans acquired with deteriorated credit quality |
1,668 | 8,412 | — | — | — | 10,080 | ||||||||||||||||||
|
|
|
|
|
|
|
|
|
|
|
|
|
|||||||||||||
| Total ending loan balance |
$ | 508,556 | $ | 785,737 | $ | 108,368 | $ | 3,351 | $ | — | $ | 1,406,012 | ||||||||||||
|
|
|
|
|
|
|
|
|
|
|
|
|
|||||||||||||
| December 31, 2014 | ||||||||||||||||||||||||
| Commercial and Other |
Real Estate |
Construction | Consumer | Unallocated | Total | |||||||||||||||||||
| Ending allowance: collectively evaluated for impairment |
$ | 5,662 | $ | 7,438 | $ | 959 | $ | 54 | $ | 1,279 | $ | 15,392 | ||||||||||||
| Ending allowance: individually evaluated for impairment |
71 | 56 | 118 | — | — | 245 | ||||||||||||||||||
| Ending allowance: loans acquired with deteriorated credit quality |
— | — | — | — | — | — | ||||||||||||||||||
|
|
|
|
|
|
|
|
|
|
|
|
|
|||||||||||||
| Total ending allowance |
$ | 5,733 | $ | 7,494 | $ | 1,077 | $ | 54 | $ | 1,279 | $ | 15,637 | ||||||||||||
|
|
|
|
|
|
|
|
|
|
|
|
|
|||||||||||||
| Ending loan balance: collectively evaluated for impairment |
$ | 405,414 | $ | 553,655 | $ | 73,610 | $ | 3,862 | $ | — | $ | 1,036,541 | ||||||||||||
| Ending loan balance: individually evaluated for impairment |
2,514 | 4,317 | 357 | — | — | 7,188 | ||||||||||||||||||
| Ending loan balance: loans acquired with deteriorated credit quality |
83 | 2,199 | — | — | — | 2,282 | ||||||||||||||||||
|
|
|
|
|
|
|
|
|
|
|
|
|
|||||||||||||
| Total ending loan balance |
$ | 408,011 | $ | 560,171 | $ | 73,967 | $ | 3,862 | $ | — | $ | 1,046,011 | ||||||||||||
|
|
|
|
|
|
|
|
|
|
|
|
|
|||||||||||||
The 2015 ending allowance includes $175 in specific allowance for $8,800 of impaired loans ($7,527 net of government guarantees). At December 31, 2014, the Company had $7,188 of impaired loans ($6,065 net of government guarantees) with a specific allowance of $245 assigned. Management believes that the allowance for loan losses was adequate as of December 31, 2015. However, future loan losses may exceed the levels provided for in the allowance for loan losses and could possibly result in additional charges to the provision for loan losses.
Credit Quality Indicators
The Company uses the following loan grades, which are also often used by regulators when assessing the credit quality of a loan portfolio.
Pass – Credit exposure in this category range between the highest credit quality to average credit quality. Primary repayment sources generate satisfactory debt service coverage under normal conditions. Cash flow from recurring sources is expected to continue to produce adequate debt service capacity. There are many levels of credit quality contained in the pass definition, but none of the loans contained in this category rise to the level of special mention.
84
Table of Contents
Special Mention – A special mention asset has potential weaknesses that deserve management’s close attention. If left uncorrected, these potential weaknesses may result in deterioration of the repayment prospects for the asset or in the institution’s credit position at some future date. Special mention assets are not adversely classified and do not expose an institution to sufficient risk to warrant adverse classification. The Bank strictly and carefully employs the FDIC definition in assessing assets that may apply to this category. It is apparent that in many cases asset weaknesses relevant to this definition either, (1) better fit a definition of a “well-defined weakness,” or (2) in our experience ultimately migrate to worse risk grade categories, such as Substandard and Doubtful. Consequently, management elects to downgrade most potential Special Mention credits to Substandard or Doubtful, and therefore adopts a conservative risk grade process in the use of the Special Mention risk grade.
Substandard – A substandard asset is inadequately protected by the current sound worth and paying capacity of the Borrower or of the collateral pledged, if any. Assets so classified must have a well-defined weakness or weaknesses that jeopardize the liquidation of the debt. Loans in this category are characterized by the distinct possibility that the Company will sustain some loss if the deficiencies are not corrected. Loss potential, while existing in the aggregate amount of substandard assets, does not have to exist in individual assets classified substandard.
Doubtful – An asset classified doubtful has all the weaknesses inherent in one classified substandard with the added characteristic that the weaknesses make collection or liquidation in full on the basis of currently existing facts, conditions, and values, highly questionable and improbable.
Management strives to consistently apply these definitions when allocating its loans by loan grade. The loan portfolio is continuously monitored for changes in credit quality and management takes appropriate action to update the loan risk ratings accordingly. Management has not changed the Company’s policy towards its use of credit quality indicators during the periods reported.
85
Table of Contents
The following tables present the Company’s loan portfolio information by loan type and credit grade at December 31, 2015, and 2014:
| Credit Quality Indicators | ||||||||||||||||||||
| As of December 31, 2015
|
||||||||||||||||||||
| Loan Grade | ||||||||||||||||||||
| Pass | Special Mention | Substandard | Doubtful | Totals | ||||||||||||||||
| Real estate loans |
||||||||||||||||||||
| Multi-family residential |
$ | 66,208 | $ | — | $ | 237 | $ | — | $ | 66,445 | ||||||||||
| Residential 1-4 family |
49,077 | — | 4,699 | — | 53,776 | |||||||||||||||
| Owner-occupied commercial |
353,249 | — | 11,493 | — | 364,742 | |||||||||||||||
| Nonowner-occupied commercial |
296,528 | — | 4,246 | — | 300,774 | |||||||||||||||
|
|
|
|
|
|
|
|
|
|
|
|||||||||||
| Total real estate loans |
765,062 | — | 20,675 | — | 785,737 | |||||||||||||||
| Construction |
||||||||||||||||||||
| Multi-family residential |
7,027 | — | — | — | 7,027 | |||||||||||||||
| Residential 1-4 family |
30,803 | — | 53 | — | 30,856 | |||||||||||||||
| Commercial real estate |
42,580 | — | 100 | — | 42,680 | |||||||||||||||
| Commercial bare land and acquisition & development |
20,265 | — | 272 | — | 20,537 | |||||||||||||||
| Residential bare land and acquisition & development |
4,969 | — | 2,299 | — | 7,268 | |||||||||||||||
|
|
|
|
|
|
|
|
|
|
|
|||||||||||
| Total construction loans |
105,644 | — | 2,724 | — | 108,368 | |||||||||||||||
| Commercial and other |
494,267 | — | 14,289 | — | 508,556 | |||||||||||||||
| Consumer |
3,350 | — | 1 | — | 3,351 | |||||||||||||||
|
|
|
|
|
|
|
|
|
|
|
|||||||||||
| Totals |
$ | 1,368,323 | $ | — | $ | 37,689 | $ | — | $ | 1,406,012 | ||||||||||
|
|
|
|
|
|
|
|
|
|
|
|||||||||||
| Percentage of total portfolio |
97.32 | % | 0.00 | % | 2.68 | % | 0.00 | % | 100.00 | % | ||||||||||
| Credit Quality Indicators | ||||||||||||||||||||
| As of December 31, 2014
|
||||||||||||||||||||
| Loan Grade | ||||||||||||||||||||
| Pass | Special Mention | Substandard | Doubtful | Totals | ||||||||||||||||
| Real estate loans |
||||||||||||||||||||
| Multi-family residential |
$ | 50,074 | $ | — | $ | 1,512 | $ | — | $ | 51,586 | ||||||||||
| Residential 1-4 family |
39,527 | — | 7,695 | — | 47,222 | |||||||||||||||
| Owner-occupied commercial |
254,166 | — | 5,639 | — | 259,805 | |||||||||||||||
| Nonowner-occupied commercial |
197,940 | — | 3,618 | — | 201,558 | |||||||||||||||
|
|
|
|
|
|
|
|
|
|
|
|||||||||||
| Total real estate loans |
541,707 | — | 18,464 | — | 560,171 | |||||||||||||||
| Construction |
||||||||||||||||||||
| Multi-family residential |
8,472 | — | — | — | 8,472 | |||||||||||||||
| Residential 1-4 family |
28,109 | — | — | — | 28,109 | |||||||||||||||
| Commercial real estate |
17,645 | — | 950 | — | 18,595 | |||||||||||||||
| Commercial bare land and acquisition & development |
11,917 | — | 242 | — | 12,159 | |||||||||||||||
| Residential bare land and acquisition & development |
5,954 | — | 678 | — | 6,632 | |||||||||||||||
|
|
|
|
|
|
|
|
|
|
|
|||||||||||
| Total construction loans |
72,097 | — | 1,870 | — | 73,967 | |||||||||||||||
| Commercial and other |
395,918 | — | 12,093 | — | 408,011 | |||||||||||||||
| Consumer |
3,854 | — | 8 | — | 3,862 | |||||||||||||||
|
|
|
|
|
|
|
|
|
|
|
|||||||||||
| Totals |
$ | 1,013,576 | $ | — | $ | 32,435 | $ | — | $ | 1,046,011 | ||||||||||
|
|
|
|
|
|
|
|
|
|
|
|||||||||||
| Percentage of total portfolio |
96.90 | % | 0.00 | % | 3.10 | % | 0.00 | % | 100.00 | % | ||||||||||
86
Table of Contents
Past Due and Nonaccrual Loans
The Company uses the terms “past due” and “delinquent” interchangeably. Amortizing loans are considered past due or delinquent based upon the number of contractually required payments not made. Delinquency status for all contractually matured loans, commercial and commercial real estate loans with non-monthly amortization, and all other extensions of credit is determined based upon the number of calendar months past due.
The following tables present an aged analysis of past due and nonaccrual loans at December 31, 2015, and 2014:
Aged Analysis of Loans Receivable
As of December 31, 2015
| Greater | ||||||||||||||||||||||||||||
| 30-59 Days | 60-89 Days | Than | Total Past | |||||||||||||||||||||||||
| Past Due | Past Due | 90 Days | Due and | Total | Total Loans | |||||||||||||||||||||||
| Still Accruing | Still Accruing | Still Accruing | Nonaccrual | Nonaccrual | Current | Receivable | ||||||||||||||||||||||
| Real estate loans |
||||||||||||||||||||||||||||
| Multi-family residential |
$ | — | $ | — | $ | — | $ | — | $ | — | $ | 66,445 | $ | 66,445 | ||||||||||||||
| Residential 1-4 family |
— | — | — | 733 | 733 | 53,043 | 53,776 | |||||||||||||||||||||
| Owner-occupied commercial |
— | — | — | 2,369 | 2,369 | 362,373 | 364,742 | |||||||||||||||||||||
| Nonowner-occupied commercial |
— | — | — | 790 | 790 | 299,984 | 300,774 | |||||||||||||||||||||
|
|
|
|
|
|
|
|
|
|
|
|
|
|
|
|||||||||||||||
| Total real estate loans |
— | — | — | 3,892 | 3,892 | 781,845 | 785,737 | |||||||||||||||||||||
| Construction |
||||||||||||||||||||||||||||
| Multi-family residential |
— | — | — | — | — | 7,027 | 7,027 | |||||||||||||||||||||
| Residential 1-4 family |
480 | — | — | 53 | 533 | 30,323 | 30,856 | |||||||||||||||||||||
| Commercial real estate |
— | — | — | — | — | 42,680 | 42,680 | |||||||||||||||||||||
| Commercial bare land and acquisition & development |
— | — | — | — | — | 20,537 | 20,537 | |||||||||||||||||||||
| Residential bare land and acquisition & development |
— | — | — | — | — | 7,268 | 7,268 | |||||||||||||||||||||
|
|
|
|
|
|
|
|
|
|
|
|
|
|
|
|||||||||||||||
| Total construction loans |
480 | — | — | 53 | 533 | 107,835 | 108,368 | |||||||||||||||||||||
| Commercial and other |
— | — | — | 1,564 | 1,564 | 506,992 | 508,556 | |||||||||||||||||||||
| Consumer |
1 | 3 | — | — | 4 | 3,347 | 3,351 | |||||||||||||||||||||
|
|
|
|
|
|
|
|
|
|
|
|
|
|
|
|||||||||||||||
| Total |
$ | 481 | $ | 3 | $ | — | $ | 5,509 | $ | 5,993 | $ | 1,400,019 | $ | 1,406,012 | ||||||||||||||
|
|
|
|
|
|
|
|
|
|
|
|
|
|
|
|||||||||||||||
| Percentage of total portfolio |
0.03 | % | 0.00 | % | 0.00 | % | 0.39 | % | 0.43 | % | 99.57 | % | 100.00 | % | ||||||||||||||
Aged Analysis of Loans Receivable
As of December 31, 2014
| Greater | ||||||||||||||||||||||||||||
| 30-59 Days | 60-89 Days | Than | Total Past | |||||||||||||||||||||||||
| Past Due | Past Due | 90 Days | Due and | Total | Total Loans | |||||||||||||||||||||||
| Still Accruing | Still Accruing | Still Accruing | Nonaccrual | Nonaccrual | Current | Receivable | ||||||||||||||||||||||
| Real estate loans |
||||||||||||||||||||||||||||
| Multi-family residential |
$ | — | $ | — | $ | — | $ | — | $ | — | $ | 51,586 | $ | 51,586 | ||||||||||||||
| Residential 1-4 family |
568 | — | — | 320 | 888 | 46,333 | 47,221 | |||||||||||||||||||||
| Owner-occupied commercial |
— | — | — | 599 | 599 | 259,206 | 259,805 | |||||||||||||||||||||
| Nonowner-occupied commercial |
605 | — | — | 906 | 1,511 | 200,047 | 201,558 | |||||||||||||||||||||
|
|
|
|
|
|
|
|
|
|
|
|
|
|
|
|||||||||||||||
| Total real estate loans |
1,173 | — | — | 1,825 | 2,998 | 557,172 | 560,170 | |||||||||||||||||||||
| Construction |
||||||||||||||||||||||||||||
| Multi-family residential |
— | — | — | — | — | 8,472 | 8,472 | |||||||||||||||||||||
| Residential 1-4 family |
— | — | — | — | — | 28,109 | 28,109 | |||||||||||||||||||||
| Commercial real estate |
— | — | — | — | — | 18,595 | 18,595 | |||||||||||||||||||||
| Commercial bare land and acquisition & development |
— | — | — | — | — | 12,159 | 12,159 | |||||||||||||||||||||
| Residential bare land and acquisition & development |
— | — | — | — | — | 6,632 | 6,632 | |||||||||||||||||||||
|
|
|
|
|
|
|
|
|
|
|
|
|
|
|
|||||||||||||||
| Total construction loans |
— | — | — | — | — | 73,967 | 73,967 | |||||||||||||||||||||
| Commercial and other |
327 | — | — | 870 | 1,197 | 406,815 | 408,012 | |||||||||||||||||||||
| Consumer |
4 | 1 | — | — | 5 | 3,857 | 3,862 | |||||||||||||||||||||
|
|
|
|
|
|
|
|
|
|
|
|
|
|
|
|||||||||||||||
| Total |
$ | 1,504 | $ | 1 | $ | — | $ | 2,695 | $ | 4,200 | $ | 1,041,811 | $ | 1,046,011 | ||||||||||||||
|
|
|
|
|
|
|
|
|
|
|
|
|
|
|
|||||||||||||||
| Percentage of total portfolio |
0.14 | % | 0.00 | % | 0.00 | % | 0.26 | % | 0.40 | % | 99.60 | % | 100.00 | % | ||||||||||||||
87
Table of Contents
Impaired Loans
Regular credit reviews of the portfolio are performed to identify loans that are considered potentially impaired. Potentially impaired loans are referred to the ALCO for review and are included in the specific calculation of allowance for loan losses. A loan is considered impaired when, based on current information and events, the Company is unlikely to collect all principal and interest due according to the terms of the loan agreement. When the amount of the impairment represents a confirmed loss it is charged off against the allowance for loan losses. Impaired loans are often reported net of government guarantees to the extent that the guarantees are expected to be collected. Impaired loans generally include all loans classified as nonaccrual and troubled debt restructurings.
Accrual of interest is discontinued on impaired loans when management believes that, after considering economic and business conditions and collection efforts, the borrower’s financial condition is such that collection of principal or interest is doubtful. Accrued, but uncollected interest is generally reversed when loans are placed on nonaccrual status. Interest income is subsequently recognized only to the extent cash payments are received satisfying all delinquent principal and interest amounts, and the prospects for future payments in accordance with the loan agreement appear relatively certain. In accordance with GAAP, payments received on nonaccrual loans are applied to the principal balance and no interest income is recognized. Interest income may be recognized on impaired loans that are not on nonaccrual status.
88
Table of Contents
The following tables display an analysis of the Company’s impaired loans at December 31, 2015, and 2014:
Impaired Loan Analysis
As of December 31, 2015
| Recorded Investment With No Specific Allowance Valuation |
Recorded Investment With Specific Allowance Valuation |
Recorded Investment |
Unpaid Principal Balance |
Average Recorded Investment |
Related Specific Allowance Valuation |
|||||||||||||||||||
| Real estate |
||||||||||||||||||||||||
| Multi-family residential |
$ | — | $ | — | $ | — | $ | — | $ | — | $ | — | ||||||||||||
| Residential 1-4 family |
374 | 308 | 682 | 911 | 766 | 5 | ||||||||||||||||||
| Owner-occupied commercial |
2,788 | — | 2,788 | 2,788 | 1,177 | — | ||||||||||||||||||
| Nonowner-occupied commercial |
2,287 | 25 | 2,312 | 2,374 | 2,395 | 25 | ||||||||||||||||||
|
|
|
|
|
|
|
|
|
|
|
|
|
|||||||||||||
| Total real estate loans |
5,449 | 333 | 5,782 | 6,073 | 4,338 | 30 | ||||||||||||||||||
| Construction |
||||||||||||||||||||||||
| Multi-family residential |
— | — | — | — | — | — | ||||||||||||||||||
| Residential 1-4 family |
53 | — | 53 | 72 | 32 | — | ||||||||||||||||||
| Commercial real estate |
— | — | — | — | — | — | ||||||||||||||||||
| Commercial bare land and acquisition & development |
— | — | — | — | — | — | ||||||||||||||||||
| Residential bare land and acquisition & development |
— | 338 | 338 | 338 | 347 | 99 | ||||||||||||||||||
|
|
|
|
|
|
|
|
|
|
|
|
|
|||||||||||||
| Total construction loans |
53 | 338 | 391 | 410 | 379 | 99 | ||||||||||||||||||
| Commercial and other |
2,091 | 536 | 2,627 | 3,018 | 2,404 | 46 | ||||||||||||||||||
| Consumer |
— | — | — | — | — | — | ||||||||||||||||||
|
|
|
|
|
|
|
|
|
|
|
|
|
|||||||||||||
| Total impaired loans |
$ | 7,593 | $ | 1,207 | $ | 8,800 | $ | 9,501 | $ | 7,121 | $ | 175 | ||||||||||||
|
|
|
|
|
|
|
|
|
|
|
|
|
|||||||||||||
Impaired Loan Analysis
As of December 31, 2014
| Recorded Investment With No Specific Allowance Valuation |
Recorded Investment With Specific Allowance Valuation |
Recorded Investment |
Unpaid Principal Balance |
Average Recorded Investment |
Related Specific Allowance Valuation |
|||||||||||||||||||
| Real estate |
||||||||||||||||||||||||
| Multi-family residential |
$ | — | $ | — | $ | — | $ | — | $ | — | $ | — | ||||||||||||
| Residential 1-4 family |
455 | 313 | 768 | 996 | 1,005 | 2 | ||||||||||||||||||
| Owner-occupied commercial |
1,046 | — | 1,046 | 1,046 | 1,756 | — | ||||||||||||||||||
| Nonowner-occupied commercial |
2,449 | 54 | 2,503 | 2,523 | 1,927 | 54 | ||||||||||||||||||
|
|
|
|
|
|
|
|
|
|
|
|
|
|||||||||||||
| Total real estate loans |
3,950 | 367 | 4,317 | 4,565 | 4,688 | 56 | ||||||||||||||||||
| Construction |
||||||||||||||||||||||||
| Multi-family residential |
— | — | — | — | — | — | ||||||||||||||||||
| Residential 1-4 family |
— | — | — | — | — | — | ||||||||||||||||||
| Commercial real estate |
— | — | — | — | — | — | ||||||||||||||||||
| Commercial bare land and acquisition & development |
— | — | — | — | — | — | ||||||||||||||||||
| Residential bare land and acquisition & development |
— | 357 | 357 | 357 | 365 | 118 | ||||||||||||||||||
|
|
|
|
|
|
|
|
|
|
|
|
|
|||||||||||||
| Total construction loans |
— | 357 | 357 | 357 | 365 | 118 | ||||||||||||||||||
| Commercial and other |
1,942 | 572 | 2,514 | 2,823 | 3,831 | 71 | ||||||||||||||||||
| Consumer |
— | — | — | — | — | — | ||||||||||||||||||
|
|
|
|
|
|
|
|
|
|
|
|
|
|||||||||||||
| Total impaired loans |
$ | 5,892 | $ | 1,296 | $ | 7,188 | $ | 7,745 | $ | 8,884 | $ | 245 | ||||||||||||
|
|
|
|
|
|
|
|
|
|
|
|
|
|||||||||||||
The impaired balances reported above are not adjusted for government guarantees of $1,273 and $1,123 at December 31, 2015, and December 31, 2014, respectively. The recorded investment in impaired loans, net of government guarantees, totaled $7,527 and $6,065 at December 31, 2015, and December 31, 2014, respectively.
89
Table of Contents
Troubled Debt Restructurings
In the normal course of business, the Company may modify the terms of certain loans, attempting to protect as much of its investment as possible. Management evaluates the circumstances surrounding each modification to determine whether it is a troubled debt restructuring (“TDR”). TDRs exist when 1) the restructuring constitutes a concession, and 2) the debtor is experiencing financial difficulties.
The following table displays the Company’s TDRs by class at December 31, 2015, and 2014:
| Troubled Debt Restructurings as of | ||||||||||||||||
| December 31, 2015 | December 31, 2014 | |||||||||||||||
| Number of Contracts |
Outstanding Recorded Investment |
Number of Contracts |
Outstanding Recorded Investment |
|||||||||||||
| Real estate |
||||||||||||||||
| Multifamily residential |
— | $ | — | — | $ | — | ||||||||||
| Residential 1-4 family |
6 | 682 | 7 | 768 | ||||||||||||
| Owner-occupied commercial |
3 | 2,788 | 2 | 1,046 | ||||||||||||
| Non owner-occupied commercial |
7 | 2,312 | 7 | 2,503 | ||||||||||||
|
|
|
|
|
|
|
|
|
|||||||||
| Total real estate loans |
16 | 5,782 | 16 | 4,317 | ||||||||||||
| Construction |
||||||||||||||||
| Multifamily residential |
— | — | — | — | ||||||||||||
| Residential 1-4 family |
— | — | — | — | ||||||||||||
| Commercial real estate |
— | — | — | — | ||||||||||||
| Commercial bare land and acquisition & development |
— | — | — | — | ||||||||||||
| Residential bare land and acquisition & development |
— | — | — | — | ||||||||||||
|
|
|
|
|
|
|
|
|
|||||||||
| Total construction loans |
— | — | — | — | ||||||||||||
| Commercial and other |
11 | 2,170 | 12 | 2,259 | ||||||||||||
| Consumer |
— | — | — | — | ||||||||||||
|
|
|
|
|
|
|
|
|
|||||||||
| 27 | $ | 7,952 | 28 | $ | 6,576 | |||||||||||
|
|
|
|
|
|
|
|
|
|||||||||
The recorded investment on TDRs in nonaccrual status totaled $1,807 and $1,649 at December 31, 2015, and December 31, 2014, respectively. The Bank’s policy is that loans placed on non-accrual will typically remain on non-accrual status until all principal and interest payments are brought current and the prospect for future payment in accordance with the loan agreement appear relatively certain. The Bank’s policy generally refers to six months of payment performance as sufficient to warrant a return to accrual status.
For the twelve months ended December 31, 2015, the Company restructured two loans into troubled debt testructurings for which impairment was previously measured under the Company’s general loan loss allowance methodology. The total recorded investment in such receivables was $2,077, and the associated allowance for loan losses was $0 at December 31, 2015.
The types of modifications offered can generally be described in the following categories:
Rate Modification —A modification in which the interest rate is modified.
Term Modification —A modification in which the maturity date, timing of payments, or frequency of payments is changed.
Interest Only Modification —A modification in which the loan is converted to interest only payments for a period of time.
Combination Modification —Any other type of modification, including the use of multiple types of modifications.
90
Table of Contents
The following tables present newly restructured loans that occurred during the twelve months ended December 31, 2015, and 2014, respectively:
| Troubled Debt Restructurings | ||||||||||||||||
| Identified during the twelve months ended December 31, 2015 | ||||||||||||||||
| Rate Modification |
Term Modification |
Interest Only Modification |
Combination Modification |
|||||||||||||
| Real estate |
||||||||||||||||
| Multifamily residential |
$ | — | $ | — | $ | — | $ | — | ||||||||
| Residential 1-4 family |
— | — | — | — | ||||||||||||
| Owner-occupied commercial |
— | 1,780 | — | — | ||||||||||||
| Non owner-occupied commercial |
— | — | — | — | ||||||||||||
|
|
|
|
|
|
|
|
|
|||||||||
| Total real estate loans |
— | 1,780 | — | — | ||||||||||||
| Construction |
||||||||||||||||
| Multifamily residential |
— | — | — | — | ||||||||||||
| Residential 1-4 family |
— | — | — | — | ||||||||||||
| Commercial real estate |
— | — | — | — | ||||||||||||
| Commercial bare land and acquisition & development |
— | — | — | — | ||||||||||||
| Residential bare land and acquisition & development |
— | — | — | — | ||||||||||||
|
|
|
|
|
|
|
|
|
|||||||||
| Total construction loans |
— | — | — | — | ||||||||||||
| Commercial and other |
297 | — | — | — | ||||||||||||
| Consumer |
— | — | — | — | ||||||||||||
|
|
|
|
|
|
|
|
|
|||||||||
| $ | 297 | $ | 1,780 | $ | — | $ | — | |||||||||
|
|
|
|
|
|
|
|
|
|||||||||
| Troubled Debt Restructurings | ||||||||||||||||
| Identified during the twelve months ended December 31, 2014 | ||||||||||||||||
| Rate Modification |
Term Modification |
Interest Only Modification |
Combination Modification |
|||||||||||||
| Real estate |
||||||||||||||||
| Multifamily residential |
$ | — | $ | — | $ | — | $ | — | ||||||||
| Residential 1-4 family |
— | — | — | — | ||||||||||||
| Owner-occupied commercial |
— | — | — | — | ||||||||||||
| Non owner-occupied commercial |
— | 1,597 | 548 | — | ||||||||||||
|
|
|
|
|
|
|
|
|
|||||||||
| Total real estate loans |
— | 1,597 | 548 | — | ||||||||||||
| Construction |
||||||||||||||||
| Multifamily residential |
— | — | — | — | ||||||||||||
| Residential 1-4 family |
— | — | — | — | ||||||||||||
| Commercial real estate |
— | — | — | — | ||||||||||||
| Commercial bare land and acquisition & development |
— | — | — | — | ||||||||||||
| Residential bare land and acquisition & development |
— | — | — | — | ||||||||||||
|
|
|
|
|
|
|
|
|
|||||||||
| Total construction loans |
— | — | — | — | ||||||||||||
| Commercial and other |
221 | 274 | 483 | — | ||||||||||||
| Consumer |
— | — | — | — | ||||||||||||
|
|
|
|
|
|
|
|
|
|||||||||
| $ | 221 | $ | 1,871 | $ | 1,031 | $ | — | |||||||||
|
|
|
|
|
|
|
|
|
|||||||||
91
Table of Contents
Subsequent to a loan being classified as a TDR, a borrower may become unwilling or unable to abide by the terms of the modified agreement. In such cases of default, the Company takes appropriate action to secure additional payments including the use of foreclosure proceedings. The following table presents loans receivable modified as troubled debt restructurings that subsequently defaulted within twelve months during the period:
| Troubled Debt
Restructurings That Subsequently Defaulted within the 12 Months ended December 31, |
||||||||||||||||
| 2015 | 2014 | |||||||||||||||
| Number of Contracts |
Recorded Investment |
Number of Contracts |
Recorded Investment |
|||||||||||||
| Real estate |
||||||||||||||||
| Multifamily residential |
— | $ | — | — | $ | — | ||||||||||
| Residential 1-4 family |
— | — | — | — | ||||||||||||
| Owner-occupied commercial |
— | — | — | — | ||||||||||||
| Non owner-occupied commercial |
— | — | 3 | 548 | ||||||||||||
|
|
|
|
|
|
|
|
|
|||||||||
| Total real estate loans |
— | — | 3 | 548 | ||||||||||||
| Construction |
||||||||||||||||
| Multifamily residential |
— | — | — | — | ||||||||||||
| Residential 1-4 family |
— | — | — | — | ||||||||||||
| Commercial real estate |
— | — | — | — | ||||||||||||
| Commercial bare land and acquisition & development |
— | — | — | — | ||||||||||||
| Residential bare land and acquisition & development |
— | — | — | — | ||||||||||||
|
|
|
|
|
|
|
|
|
|||||||||
| Total construction loans |
— | — | — | — | ||||||||||||
| Commercial and other |
— | — | — | — | ||||||||||||
| Consumer |
— | — | — | — | ||||||||||||
|
|
|
|
|
|
|
|
|
|||||||||
| — | $ | — | 3 | $ | 548 | |||||||||||
|
|
|
|
|
|
|
|
|
|||||||||
At December 31, 2015, and December 31, 2014, the Company had no commitments to lend additional funds on loans restructured as TDRs.
92
Table of Contents
NOTE 6 – DENTAL LOAN PORTFOLIO:
To assist in understanding the concentrations and risks associated with the Bank’s loan portfolio, the following Note has been included to provide additional information relating to the Bank’s dental lending portfolio. At December 31, 2015, and 2014, loans to dental professionals totaled $340,162 and $306,391, respectively, and represented 24.19% and 29.29% of outstanding loans. As of December 31, 2015, and 2014, dental loans supported by government guarantees totaled $9,027 and $12,700, respectively. This represented 2.65% and 4.15% of the outstanding dental loan balances, respectively as of such dates.
The Company defines a “dental loan” as loan to dental professionals for the purpose of practice expansion, acquisition or other purpose, supported by the cash flows of a dental practice.
Loan Classification
Major classifications of dental loans, at December 31, 2015, and 2014, are as follows:
| December 31, | ||||||||
| 2015 | 2014 | |||||||
| Real estate secured loans: |
||||||||
| Owner-occupied commercial |
$ | 56,145 | $ | 60,092 | ||||
| Other dental real estate loans |
2,198 | 2,785 | ||||||
|
|
|
|
|
|||||
| Total permanent real estate loans |
58,343 | 62,877 | ||||||
| Dental construction loans |
4,334 | 604 | ||||||
|
|
|
|
|
|||||
| Total real estate loans |
62,677 | 63,481 | ||||||
|
|
|
|
|
|||||
| Commercial loans |
277,485 | 242,910 | ||||||
|
|
|
|
|
|||||
| Gross loans |
$ | 340,162 | $ | 306,391 | ||||
|
|
|
|
|
|||||
Market Area
The Bank’s defined “market area” is within the States of Oregon and Washington west of the Cascade Mountain Range. This area is serviced by branch locations in Eugene, Portland and Seattle. The Company also makes national dental loans throughout the United States, and currently has dental loans in 37 states, outside of Oregon and Washington. National loan relationships are maintained and serviced by Bank personnel primarily located in Portland.
The following table represents the dental lending by borrower location:
| December 31, | ||||||||
| 2015 | 2014 | |||||||
| Local |
$ | 145,817 | $ | 159,425 | ||||
| National |
194,345 | 146,966 | ||||||
|
|
|
|
|
|||||
| Total |
$ | 340,162 | $ | 306,391 | ||||
|
|
|
|
|
|||||
93
Table of Contents
Allowance
The allowance for loan losses identified for the dental loan portfolio is established as an amount that management considers adequate to absorb possible losses on existing loans within the dental portfolio. The allowance related to the dental loan portfolio consists of general and specific components. The general component is based upon all dental loans collectively evaluated for impairment, including qualitative conditions associated with: loan type, out-of-market location, start-up financing, practice acquisition financing and specialty practice financing. The specific component is based upon dental loans individually evaluated for impairment.
| For the Years Ended December 31, | ||||||||||||
| 2015 | 2014 | 2013 | ||||||||||
| Balance, beginning of period |
$ | 4,141 | $ | 3,730 | $ | 2,683 | ||||||
| Provision (reclassification) |
(71 | ) | 918 | 2,208 | ||||||||
| Charge-offs |
(78 | ) | (631 | ) | (1,232 | ) | ||||||
| Recoveries |
30 | 124 | 71 | |||||||||
|
|
|
|
|
|
|
|||||||
| Balance, end of period |
$ | 4,022 | $ | 4,141 | $ | 3,730 | ||||||
|
|
|
|
|
|
|
|||||||
Credit Quality
Please refer to Note 5 for additional information on the definitions of the credit quality indicators.
The following tables present the Company’s dental loan portfolio information by market and credit grade at December 31, 2015 and 2014:
Dental Credit Quality Indicators
As of December 31, 2015
| Loan Grade | ||||||||||||||||||||
| Pass | Special Mention |
Substandard | Doubtful | Totals | ||||||||||||||||
| Local |
$ | 143,541 | $ | — | $ | 2,276 | $ | — | $ | 145,817 | ||||||||||
| National |
191,574 | — | 2,771 | — | 194,345 | |||||||||||||||
|
|
|
|
|
|
|
|
|
|
|
|||||||||||
| Total |
$ | 335,115 | $ | — | $ | 5,047 | $ | — | $ | 340,162 | ||||||||||
|
|
|
|
|
|
|
|
|
|
|
|||||||||||
Dental Credit Quality Indicators
As of December 31, 2014
| Loan Grade | ||||||||||||||||||||
| Pass | Special Mention |
Substandard | Doubtful | Totals | ||||||||||||||||
| Local |
$ | 156,589 | $ | — | $ | 2,836 | $ | — | $ | 159,425 | ||||||||||
| National |
144,120 | — | 2,846 | — | 146,966 | |||||||||||||||
|
|
|
|
|
|
|
|
|
|
|
|||||||||||
| Total |
$ | 300,709 | $ | — | $ | 5,682 | $ | — | $ | 306,391 | ||||||||||
|
|
|
|
|
|
|
|
|
|
|
|||||||||||
94
Table of Contents
Past Due and Nonaccrual Loans
Please refer to Note 5 for additional information on the definitions of “past due.”
The following tables present an aged analysis of the dental loans by market, including nonaccrual loans, at December 31, 2015 and 2014:
Aged Analysis of Dental Loans Receivable
As of December 31, 2015
| 30-59 Days Past Due Still Accruing |
60-89 Days Past Due Still Accruing |
Greater Than 90 Days Still Accruing |
Nonaccrual | Total Past Due and Nonaccrual |
Total Current |
Total Loans Receivable |
||||||||||||||||||||||
| Local |
$ | — | $ | — | $ | — | $ | 513 | $ | 513 | $ | 145,304 | $ | 145,817 | ||||||||||||||
| National |
— | — | — | — | — | 194,345 | 194,345 | |||||||||||||||||||||
|
|
|
|
|
|
|
|
|
|
|
|
|
|
|
|||||||||||||||
| Total |
$ | — | $ | — | $ | — | $ | 513 | $ | 513 | $ | 339,649 | $ | 340,162 | ||||||||||||||
|
|
|
|
|
|
|
|
|
|
|
|
|
|
|
|||||||||||||||
Aged Analysis of Dental Loans Receivable
As of December 31, 2014
| 30-59 Days Past Due Still Accruing |
60-89 Days Past Due Still Accruing |
Greater Than 90 Days Still Accruing |
Nonaccrual | Total Past Due and Nonaccrual |
Total Current |
Total Loans Receivable |
||||||||||||||||||||||
| Local |
$ | 327 | $ | — | $ | — | $ | 597 | $ | 924 | $ | 158,501 | $ | 159,425 | ||||||||||||||
| National |
— | — | — | — | — | 146,966 | 146,966 | |||||||||||||||||||||
|
|
|
|
|
|
|
|
|
|
|
|
|
|
|
|||||||||||||||
| Total |
$ | 327 | $ | — | $ | — | $ | 597 | $ | 924 | $ | 305,467 | $ | 306,391 | ||||||||||||||
|
|
|
|
|
|
|
|
|
|
|
|
|
|
|
|||||||||||||||
95
Table of Contents
NOTE 7 – LOAN PARTICIPATIONS AND SERVICING:
In the normal course of business the Company may sell portions of loans to other institutions for cash in order to extend its lending capacity or to mitigate risk. These sales are commonly referred to as loan participations. Loan participations are performed without recourse and the participant’s interest is ratably concurrent with that retained by the Company. Cash flows are shared proportionately and neither the Company’s nor the participant’s interest is subordinated. The Company retains servicing rights and manages the client relationships for a reasonable servicing fee. The participated portion of these loans is not included in the accompanying consolidated balance sheets, and the servicing component of these transactions in the aggregate is material to the consolidated financial statements. The Company’s exposure to loss is limited to its retained interest in the loans.
The following table reflects the amounts of loans participated.
| December 31, | ||||||||
| 2015 | 2014 | |||||||
| Total principal amount outstanding |
$ | 74,018 | $ | 22,840 | ||||
| less: principal amount derecognized |
(37,211 | ) | (11,821 | ) | ||||
|
|
|
|
|
|||||
| Principal amount included in gross loans on the balance sheet |
$ | 36,807 | $ | 11,019 | ||||
|
|
|
|
|
|||||
NOTE 8 – PROPERTY AND EQUIPMENT:
The balance of property and equipment net of accumulated depreciation and amortization at December 31, 2015 and 2014, consists of the following:
| December 31, | ||||||||
| 2015 | 2014 | |||||||
| Land |
$ | 3,831 | $ | 3,831 | ||||
| Buildings and improvements |
19,244 | 19,056 | ||||||
| Furniture and equipment |
14,310 | 12,835 | ||||||
|
|
|
|
|
|||||
| 37,385 | 35,722 | |||||||
| less: accumulated depreciation & amortization |
(19,371 | ) | (17,902 | ) | ||||
|
|
|
|
|
|||||
| Net property and equipment |
$ | 18,014 | $ | 17,820 | ||||
|
|
|
|
|
|||||
Depreciation expense was $1,531, $1,491, and $1,495, for the years ended December 31, 2015, 2014, and 2013, respectively.
The Company leases certain facilities for office locations under non-cancelable operating lease agreements expiring through 2031. Rent expense related to these leases totaled $1,542, $1,324, and $1,381, in 2015, 2014, and 2013, respectively. The Company leases approximately 26.00% of its Gateway building (Springfield, Oregon) to others under non-cancelable operating lease agreements extending through 2020.
96
Table of Contents
Future minimum payments required and anticipated lease revenues under these leases are:
| Lease Commitments |
Property Leased to Others |
|||||||
| 2016 |
$ | 1,390 | $ | 227 | ||||
| 2017 |
1,398 | 59 | ||||||
| 2018 |
1,808 | 59 | ||||||
| 2019 |
1,169 | 59 | ||||||
| 2020 |
839 | 24 | ||||||
| Thereafter |
4,930 | — | ||||||
|
|
|
|
|
|||||
| $ | 11,534 | $ | 428 | |||||
|
|
|
|
|
|||||
NOTE 9 – GOODWILL AND INTANGIBLE ASSETS:
The following table summarizes the changes in the Company’s goodwill and core deposit intangible asset for the three years ended December 31, 2013, 2014 and 2015:
| Goodwill | Core Deposit Intangible |
Total | ||||||||||
| Balance, December 31, 2012 |
$ | 22,031 | $ | — | $ | 22,031 | ||||||
| Increase due to Century Bank acquisition |
850 | 845 | 1,695 | |||||||||
| Amortization |
— | (110 | ) | (110 | ) | |||||||
|
|
|
|
|
|
|
|||||||
| Balance, December 31, 2013 |
$ | 22,881 | $ | 735 | $ | 23,616 | ||||||
| Amortization |
— | (121 | ) | (121 | ) | |||||||
|
|
|
|
|
|
|
|||||||
| Balance, December 31, 2014 |
$ | 22,881 | $ | 614 | $ | 23,495 | ||||||
| Increase due to Capital Pacific acquisition |
16,374 | 3,721 | 20,095 | |||||||||
| Amortization |
— | (431 | ) | (431 | ) | |||||||
|
|
|
|
|
|
|
|||||||
| Balance, December 31, 2015 |
$ | 39,255 | $ | 3,904 | $ | 43,159 | ||||||
|
|
|
|
|
|
|
|||||||
At December 31, 2015, the Company had a recorded balance of $39,255 in goodwill from the November 30, 2005, acquisition of Northwest Business Financial Corporation (“NWBF”), the February 1, 2013, acquisition of Century Bank, and the March 6, 2015, acquisition of Capital Pacific Bank.
The Century Bank and Capital Pacific Bank core deposit intangible was determined to have an expected life of seven years and ten years, respectively, and each is being amortized over its respective period using the straight-line method. The Century Bank core deposit intangible will be fully amortized in January 2020, and the Capital Pacific Bank core deposit intangible will be fully amortized in February 2025.
97
Table of Contents
The table below presents the forecasted amortization expense for intangible assets related to the acquisition of Century Bank and Capital Pacific Bank.
| Year |
Expected Amortization |
|||
| 2016 |
$ | 493 | ||
| 2017 |
493 | |||
| 2018 |
493 | |||
| 2019 |
493 | |||
| 2020 |
382 | |||
| Thereafter |
1,550 | |||
|
|
|
|||
| $ | 3,904 | |||
|
|
|
|||
NOTE 10 – DEPOSITS:
Scheduled maturities or repricing of time deposits at December 31, 2015, are as follows:
| December 31, | ||||
| 2015 | ||||
| 2016 |
$ | 90,132 | ||
| 2017 |
14,245 | |||
| 2018 |
9,179 | |||
| 2019 |
3,600 | |||
| 2020 |
1,331 | |||
| Thereafter |
20,116 | |||
|
|
|
|||
| $ | 138,603 | |||
|
|
|
|||
Time deposits with balances of $250 or greater were $97,147 at December 31, 2015.
NOTE 11 – FEDERAL FUNDS AND OVERNIGHT FUNDS PURCHASED:
The Company had unsecured federal funds borrowing lines with various correspondent banks totaling $129,000 at December 31, 2015 and 2014. At December 31, 2015, and December 31, 2014, there were no outstanding borrowings on this line.
The Company also had a secured overnight borrowing line available from the Federal Reserve Bank that totaled $76,912 and $65,084 at December 31, 2015, and 2014, respectively. The Federal Reserve Bank borrowing line is secured through the pledging of approximately $140,801 of commercial loans under the Company’s Borrower-In-Custody program. At December 31, 2015, and 2014, there were no outstanding borrowings on this line.
In addition to federal funds borrowing lines the Company maintains a letter of credit valued at $1,200 with a correspondent bank. The purpose of this line is to support commitments of the Company clients when conducting business internationally. At December 31, 2015, and 2014, there were no outstanding borrowings on this line.
98
Table of Contents
NOTE 12 – FEDERAL HOME LOAN BANK BORROWINGS:
The Company has a borrowing limit with the FHLB equal to 35.00% of total assets, subject to discounted collateral. The Company does have the ability to access the FHLB excess stock pool, thus borrowing is not limited by FHLB stock held. At December 31, 2015, the maximum borrowing line was $657,086; however, the FHLB borrowing line was limited by the discounted value of collateral pledged. The Company had pledged $666,297 in real estate loans to the FHLB that had a discounted value of $414,044. There was $77,500 borrowed on this line at December 31, 2015.
At December 31, 2014, the maximum FHLB borrowing line was $451,298, and the Company had pledged real estate loans and securities to the FHLB with a discounted value of $318,854. There was $96,000 borrowed on this line at December 31, 2014.
FHLB borrowings by year of maturity and applicable interest rate are summarized as follows as of December 31, 2015:
| Current | December 31, | |||||||
| Rates | 2015 | |||||||
| Cash management advance |
0.34 | % | $ | 47,000 | ||||
| 2016 |
2.12 | % | 22,500 | |||||
| 2017 |
2.28 | % | 3,000 | |||||
| 2018 |
1.55 | % | 3,000 | |||||
| 2019 |
— | — | ||||||
| Thereafter |
3.85 | % | 2,000 | |||||
|
|
|
|||||||
| $ | 77,500 | |||||||
|
|
|
|||||||
NOTE 13 – JUNIOR SUBORDINATED DEBENTURES:
In connection with the November 2005 acquisition of NWB Financial Corporation, the Company formed a wholly owned Delaware statutory business trust subsidiary, Pacific Continental Corporation Capital Trust (the “Trust”), which issued $8,248 of guaranteed undivided beneficial interests in the Company’s Junior Subordinated Deferrable Interest Debentures (“Trust Preferred Securities”). These debentures qualify as Tier 1 capital under Federal Reserve Board guidelines. All of the common securities of the Trust are owned by the Company. The proceeds from the issuance of the common securities and the Trust Preferred Securities were used by the Trust to purchase $8,248 of junior subordinated debentures of the Company. The debentures, which represent the sole asset of the Trust, accrued and paid distributions quarterly at a fixed rate of 6.265% per annum of the stated liquidation value of $1 per capital security. At January 7, 2012, the interest rate changed to a variable rate of three-month LIBOR plus 135 basis points. See Note 14 for additional information regarding the interest rate swap agreement executed on the debenture in 2013.
The Company has entered into contractual arrangements which, taken collectively, fully and unconditionally guarantee payment of (1) accrued and unpaid distributions required to be paid on the Trust Preferred Securities, (2) the redemption price with respect to any Trust Preferred Securities called for redemption by the Trust, and (3) payments due upon a voluntary or involuntary dissolution, winding up, or liquidation of the Trust. The Trust Preferred Securities are mandatorily redeemable upon maturity of the debentures on January 7, 2036, or upon earlier redemption as provided in the indenture. The Company has the right to redeem the debentures purchased by the Trust in whole or in part, on or after, January 7, 2012. As specified in the indenture, if the debentures are redeemed prior to maturity, the redemption price will be the principal amount and any accrued interest. For the years ended December 31, 2015, 2014, and 2013, the Company recognized net interest expense of $226, $225, and $200, respectively, related to the Trust Preferred Securities.
99
Table of Contents
NOTE 14 – DERIVATIVE INSTRUMENTS:
During the second quarter 2013, the Company entered into an interest rate swap agreement with an $8,000 notional amount to convert its variable-rate Junior Subordinated Debenture debt into a fixed rate for a term of approximately 7 years at a rate of 2.73%. The derivative is designated as a cash flow hedge. The hedge meets the definition of highly effective and the Company expects the hedge to be highly effective throughout the remaining term of the swap. The fair value of the derivative instrument at December 31, 2015, was an $82 unrealized gain, which is recorded in the other asset section of the balance sheet, net of the tax effect.
The Company maintains written documentation for the hedge. This documentation identifies the hedging objective and strategy, the hedging instrument, the instrument being hedged, the reasoning behind the assertion that the hedge is highly effective and the methodology for measuring ongoing hedge effectiveness and ineffectiveness. The Company deposited cash collateral totaling $401 with a counterparty as of April 22, 2013, to satisfy collateral requirements associated with the interest rate swap contract.
Upon the acquisition of Capital Pacific Bank on March 6, 2015, the Bank acquired three interest rate swaps entered into by Capital Pacific Bank with commercial banking customers tied to loans on the balance sheet. Those interest rate swaps are simultaneously hedged by offsetting the interest rate swaps that the Bank executes with a third party, such that the Bank minimizes its net risk exposure. As of December 31, 2015, the Bank had interest rate swaps with an aggregate notional amount of approximately $8,774, related to this program. The Bank does not require separately pledged collateral to secure its interest rate swaps with customers. However, it does make a practice of cross-collateralizing the interest rate swaps with collateral on the underlying loan.
The termination value of derivatives in a net liability position, which includes accrued interest but excludes any adjustment for nonperformance risk, related to these agreements was approximately $23 as of December 31, 2015. The Bank has minimum collateral posting thresholds with certain of its derivative counterparties, and has posted collateral totaling $250 consisting of cash held on deposit for the benefit of the counterparty against its obligations under these agreements as of December 31, 2015.
The Bank has also entered into a swap with a third party to serve as a hedge to an equal amount of fixed rate loans. As of December 31, 2015, the Bank had one swap designated a hedging instrument with a notional amount of $1,525 hedging a 10-year fixed rate note bearing interest at 5.71% and maturing August 2023. The notional amount does not represent direct credit exposure. Direct credit exposure is limited to the net difference between the calculated amount to be received and paid. As the Bank has designated the swap a fair value hedge, the underlying hedged loan is carried at fair value on the consolidated balance sheet and included in loans, net of allowance for loan losses and unearned fees. The following tables present quantitative information pertaining to the interest rate swaps as of December 31, 2015:
| December 31, 2015 | ||||||||
| Hedge - | Not-Hedge - | |||||||
| Designated | Designated | |||||||
| Notional amount |
$ | 1,525 | $ | 8,774 | ||||
| Weighted average pay rate |
5.71 | % | 4.85 | % | ||||
| Weighted average receive rate |
3.20 | % | 3.28 | % | ||||
| Weighted average maturity in years |
7.60 | 6.49 | ||||||
100
Table of Contents
The following table presents the fair values of interest rate swaps and their locations in the Consolidate Balance Sheets as of December 31, 2015 and 2014:
| Asset Derivatives | Liability Derivatives | |||||||||||||||||
| Balance sheet | December 31, | December 31, | ||||||||||||||||
| Derivative |
location | 2015 | 2014 | 2015 | 2014 | |||||||||||||
| Interest rate swap designated as a hedging instrument |
Other assets or other liabilities |
$ | 66 | $ | — | $ | 93 | $ | — | |||||||||
| Interest rate swaps not designated as hedging instruments |
Other assets or other liabilities |
$ | 24 | $ | — | $ | 24 | $ | — | |||||||||
The following table presents the income statement impact of these interest rate swaps for the years ended December 31, 2015, 2014 and 2013:
| Derivative |
Income statement location |
2015 | 2014 | 2013 | ||||||||||
| Interest rate swap designated as a hedging instrument |
Other noninterest income |
$ | — | $ | — | $ | — | |||||||
| Interest rate swaps not designated as a hedging instrument |
Other noninterest income |
$ | 5 | $ | — | $ | — | |||||||
|
|
|
|
|
|
|
|||||||||
| $ | 5 | $ | — | $ | — | |||||||||
|
|
|
|
|
|
|
|||||||||
101
Table of Contents
NOTE 15 – INCOME TAXES:
The provision for income taxes for the years ended December 31, 2015 and 2014 consists of the following:
| December 31, | ||||||||||||
| 2015 | 2014 | 2013 | ||||||||||
| Current payable: |
||||||||||||
| Federal |
$ | 8,136 | $ | 5,747 | $ | 6,682 | ||||||
| State |
800 | 159 | (209 | ) | ||||||||
|
|
|
|
|
|
|
|||||||
| 8,936 | 5,906 | 6,473 | ||||||||||
|
|
|
|
|
|
|
|||||||
| Deferred: |
||||||||||||
| Federal |
358 | 1,608 | (496 | ) | ||||||||
| State |
795 | 1,158 | 1,239 | |||||||||
|
|
|
|
|
|
|
|||||||
| 1,153 | 2,766 | 743 | ||||||||||
|
|
|
|
|
|
|
|||||||
| Total income tax provision |
$ | 10,089 | $ | 8,672 | $ | 7,216 | ||||||
|
|
|
|
|
|
|
|||||||
The provision for income taxes results in effective tax rates which are different than the federal income tax statutory rate. The nature of the differences for the years ended December 31, 2015, 2014 and 2013 were as follows:
| 2015 | 2014 | 2013 | ||||||||||||||||||||||
| Expected federal income tax provision |
$ | 10,094 | 35.00 | % | $ | 8,650 | 35.00 | % | $ | 7,344 | 35.00 | % | ||||||||||||
| State income tax, net of federal income tax effect |
1,365 | 4.73 | % | 948 | 3.84 | % | 908 | 4.33 | % | |||||||||||||||
| Municipal securities tax benefit |
(1,049 | ) | -3.64 | % | (747 | ) | -3.02 | % | (735 | ) | -3.50 | % | ||||||||||||
| Equity-based compensation |
— | 0.00 | % | 5 | 0.02 | % | 27 | 0.13 | % | |||||||||||||||
| Benefit of purchased tax credits |
1 | 0.00 | % | 25 | 0.10 | % | (150 | ) | -0.71 | % | ||||||||||||||
| Low-income housing tax credits |
(234 | ) | -0.81 | % | (199 | ) | -0.81 | % | (142 | ) | -0.68 | % | ||||||||||||
| Bank Owned Life Insurance |
(230 | ) | -0.80 | % | (184 | ) | -0.74 | % | (201 | ) | -0.96 | % | ||||||||||||
| Acquisition costs - Century Bank |
— | 0.00 | % | 150 | 0.61 | % | 106 | 0.51 | % | |||||||||||||||
| Acquisition costs - Capital Pacific Bank |
155 | 0.54 | % | — | 0.00 | % | — | 0.00 | % | |||||||||||||||
| Deferred tax rate adjustments and other |
(13 | ) | -0.05 | % | 24 | 0.10 | % | 59 | 0.28 | % | ||||||||||||||
|
|
|
|
|
|
|
|
|
|
|
|
|
|||||||||||||
| Income tax provision |
$ | 10,089 | 34.97 | % | $ | 8,672 | 35.10 | % | $ | 7,216 | 34.40 | % | ||||||||||||
|
|
|
|
|
|
|
|
|
|
|
|
|
|||||||||||||
The excess tax benefit associated with stock option plans reduced taxes payable by $9, $14, and $0, at December 31, 2015, 2014, and 2013, respectively. Such benefit is credited to common stock.
102
Table of Contents
The components of deferred tax assets and liabilities for the periods ended December 31, 2015 and 2014 are as follows:
| December 31, | ||||||||
| 2015 | 2014 | |||||||
| Assets: |
||||||||
| Allowance for loan losses |
$ | 7,868 | $ | 6,555 | ||||
| Basis adjustments on loans |
1,677 | 1,039 | ||||||
| Reserve for self-funded insurance |
104 | 78 | ||||||
| Oregon purchased tax credits |
— | 720 | ||||||
| Nonqualified stock options |
816 | 945 | ||||||
| Accrued compensation |
1,617 | 823 | ||||||
| OTTI credit impairment |
94 | 88 | ||||||
| Nonaccrual loan interest |
193 | 23 | ||||||
| Other |
91 | 76 | ||||||
|
|
|
|
|
|||||
| Total deferred tax assets |
$ | 12,460 | $ | 10,347 | ||||
|
|
|
|
|
|||||
| Liabilities: |
||||||||
| Federal Home Loan Bank stock dividends |
$ | 589 | $ | 591 | ||||
| Excess tax over book depreciation |
1,134 | 1,125 | ||||||
| Prepaid expenses |
466 | 364 | ||||||
| Acquisition adjustments |
1,512 | 205 | ||||||
| Loan origination fees |
1,346 | 1,132 | ||||||
| Net unrealized gains on swap |
32 | 69 | ||||||
| Net unrealized gains on securities |
1,694 | 2,362 | ||||||
| Other |
17 | 35 | ||||||
| Total deferred tax liabilities |
6,790 | 5,883 | ||||||
|
|
|
|
|
|||||
| Net deferred tax assets |
$ | 5,670 | $ | 4,464 | ||||
|
|
|
|
|
|||||
NOTE 16 – RETIREMENT PLAN:
The Company has a 401(k) profit sharing plan covering substantially all employees. The plan provides for employee and employer contributions. The total plan expenses, including employer contributions, were $861, $740, and $673 in 2015, 2014, and 2013, respectively.
NOTE 17 – SHARE-BASED COMPENSATION:
The Company’s 2006 Stock Option and Equity Compensation Plan (the “2006 SOEC Plan”) authorizes the award of up to 1,550,000 shares in stock-based awards. The awards granted under this plan are service-based and are subject to vesting. The Compensation Committee of the Board of Directors may impose any terms or conditions on the vesting of an award that it determines to be appropriate. Awards granted generally vest over four years and have a maximum life of ten years. Awards may be granted at exercise prices of not less than 100.00% of the fair market value of the Company’s common stock at the grant date.
103
Table of Contents
Pursuant to the 2006 SOEC Plan, incentive stock options (“ISOs”), nonqualified stock options, restricted stock, restricted stock units (“RSUs”), or stock appreciation rights (“SARs”) may be awarded to attract and retain the best available personnel to the Corporation and its subsidiaries. SARs may be settled in common stock or cash as determined at the date of issuance. Liability-based awards (including all cash-settled SARs) have no impact on the number of shares available to be issued within the plan. Additionally, non-qualified option awards and restricted stock awards may be granted to directors under the terms of this plan.
Prior to April 2006, incentive stock option (“ISO”) and non-qualified option awards were granted to employees and directors under the Company’s 1999 Employees’ Stock Option Plan and the Company’s 1999 Directors’ Stock Option Plan. The Company has stock options outstanding under both of these plans. Subsequent to the annual shareholders’ meeting in April 2006, all shares available under these plans were deregistered and are no longer available for future grants.
The following tables identify the compensation expenses recorded and tax benefits received by the Company in conjunction with its share-based compensation plans for the years ended December 31, 2015, 2014, and 2013:
| For the Year Ended December 31, | ||||||||||||||||||||||||
| 2015 | 2014 | 2013 | ||||||||||||||||||||||
| Compensation Expense |
Tax Benefit | Compensation Expense |
Tax Benefit | Compensation Expense |
Tax Benefit | |||||||||||||||||||
| Equity-based awards: |
||||||||||||||||||||||||
| Director restricted stock |
$ | 248 | $ | 87 | $ | 200 | $ | 70 | $ | 110 | $ | 39 | ||||||||||||
| Director stock options |
— | — | — | — | — | — | ||||||||||||||||||
| Employee stock options |
— | — | 13 | — | 70 | — | ||||||||||||||||||
| Employee stock SARs |
— | — | 26 | 9 | 126 | 44 | ||||||||||||||||||
| Employee RSUs |
1,452 | 508 | 1,215 | 425 | 830 | 291 | ||||||||||||||||||
| Liability-based awards: |
||||||||||||||||||||||||
| Employee cash SARs |
(50 | ) | (18 | ) | 75 | 26 | 60 | 21 | ||||||||||||||||
|
|
|
|
|
|
|
|
|
|
|
|
|
|||||||||||||
| $ | 1,650 | $ | 577 | $ | 1,529 | $ | 530 | $ | 1,196 | $ | 395 | |||||||||||||
|
|
|
|
|
|
|
|
|
|
|
|
|
|||||||||||||
Prior to 2011, the Company granted stock options to selected employees and directors. The following table summarizes information about stock option activity under all plans for the years ended December 31, 2015, 2014, and 2013:
| For the Years Ended December 31, | ||||||||||||||||||||||||
| 2015 | 2014 | 2013 | ||||||||||||||||||||||
| Options Outstanding |
Weighted Average Exercise Price |
Options Outstanding |
Weighted Average Exercise Price |
Options Outstanding |
Weighted Average Exercise Price |
|||||||||||||||||||
| Balance, beginning of year |
327,050 | $ | 14.16 | 367,906 | $ | 14.15 | 367,906 | $ | 14.15 | |||||||||||||||
| Granted |
— | — | — | — | — | — | ||||||||||||||||||
| Exercised |
(7,596 | ) | 11.44 | (16,779 | ) | 11.29 | — | — | ||||||||||||||||
| Forfeited or expired |
— | — | (24,077 | ) | 16.00 | — | — | |||||||||||||||||
|
|
|
|
|
|
|
|||||||||||||||||||
| Balance, end of year |
319,454 | $ | 14.23 | 327,050 | $ | 14.16 | 367,906 | $ | 14.15 | |||||||||||||||
|
|
|
|
|
|
|
|
|
|
|
|
|
|||||||||||||
| Options exercisable, end of year |
319,454 | $ | 14.23 | 327,050 | $ | 14.16 | 353,197 | $ | 14.27 | |||||||||||||||
|
|
|
|
|
|
|
|
|
|
|
|
|
|||||||||||||
The total intrinsic value (which is the amount by which the stock price exceeds the exercise price) of options outstanding as of December 31, 2015, was $469. The weighted average remaining contractual term of options exercisable was 2.42 years as of December 31, 2015. All stock options were vested as of December 31, 2015. There was no unrecognized compensation expense related to stock options at December 31, 2015.
Prior to 2011, the Company granted SARs settled in stock to selected employees. The following table summarizes information about activity of SARs settled in stock for the years ended December 31, 2015, 2014, and 2013:
104
Table of Contents
| For the Years Ended December 31, | ||||||||||||||||||||||||
| 2015 | 2014 | 2013 | ||||||||||||||||||||||
| Stock-settled SARs Outstanding |
Weighted Average Exercise Price |
Stock-settled SARs Outstanding |
Weighted Average Exercise Price |
Stock-settled SARs Outstanding |
Weighted Average Exercise Price |
|||||||||||||||||||
| Balance, beginning of year |
289,267 | $ | 13.97 | 337,759 | $ | 13.85 | 387,072 | $ | 13.74 | |||||||||||||||
| Granted |
— | — | — | — | — | — | ||||||||||||||||||
| Exercised |
(49,600 | ) | 12.12 | (26,155 | ) | 11.79 | (30,422 | ) | 12.08 | |||||||||||||||
| Forfeited or expired |
(400 | ) | 11.30 | (22,337 | ) | 14.74 | (18,891 | ) | 14.73 | |||||||||||||||
|
|
|
|
|
|
|
|||||||||||||||||||
| Balance, end of year |
239,267 | $ | 14.36 | 289,267 | $ | 13.97 | 337,759 | $ | 13.85 | |||||||||||||||
|
|
|
|
|
|
|
|
|
|
|
|
|
|||||||||||||
| Stock-settled SARs exercisable, end of year |
239,267 | $ | 14.36 | 289,267 | $ | 13.97 | 313,010 | $ | 14.05 | |||||||||||||||
|
|
|
|
|
|
|
|
|
|
|
|
|
|||||||||||||
The total intrinsic value (which is the amount by which the stock price exceeds the exercise price) of stock-settled SARs as of December 31, 2015, was $335. The weighted average remaining contractual term of exercisable stock-settled SARs was 2.38 years as of December 31, 2015. As of December 31, 2015, there was no unrecognized compensation cost related to non-vested stock-settled SARs.
Prior to 2010, the Company granted SARs settled in cash to selected employees. The following table summarizes information about activity of SARs settled in cash for the years ended December 31, 2015, 2014, and 2013:
| For the Years Ended December 31, | ||||||||||||||||||||||||
| 2015 | 2014 | 2013 | ||||||||||||||||||||||
| Cash-settled SARs Outstanding |
Weighted Average Exercise Price |
Cash-settled SARs Outstanding |
Weighted Average Exercise Price |
Cash-settled SARs Outstanding |
Weighted Average Exercise Price |
|||||||||||||||||||
| Balance, beginning of year |
158,993 | $ | 15.10 | 186,992 | $ | 14.95 | 206,763 | $ | 14.84 | |||||||||||||||
| Granted |
— | — | — | — | — | — | ||||||||||||||||||
| Exercised |
(12,087 | ) | 12.95 | (11,012 | ) | 12.21 | (8,353 | ) | 12.55 | |||||||||||||||
| Forfeited or expired |
(4,379 | ) | 15.77 | (16,987 | ) | 15.34 | (11,418 | ) | 14.73 | |||||||||||||||
|
|
|
|
|
|
|
|||||||||||||||||||
| Balance, end of year |
142,527 | $ | 15.27 | 158,993 | $ | 15.10 | 186,992 | $ | 14.95 | |||||||||||||||
|
|
|
|
|
|
|
|
|
|
|
|
|
|||||||||||||
| Cash-settled SARs exercisable, end of year |
142,527 | $ | 15.27 | 158,993 | $ | 15.10 | 186,992 | $ | 14.95 | |||||||||||||||
|
|
|
|
|
|
|
|
|
|
|
|
|
|||||||||||||
As of December 31, 2015, there was an intrinsic value of $114 on the Company’s outstanding cash-settled SARs. The weighted average remaining contractual term of exercisable cash-settled SARs was 1.84 years as of December 31, 2015.
105
Table of Contents
The following tables identify stock options, employee stock SARs, and employee cash SARs exercised during the periods ended December 31, 2015 and 2014:
| Twelve months ended December 31, 2015 |
||||||||||||||||||||
| Number Exercised |
Average Exercise Price |
Intrinsic Value |
Number of Shares Issued |
Net Cash Payment to Employees |
||||||||||||||||
| Stock options |
7,596 | $ | 11.44 | $ | 29 | — | NA | |||||||||||||
| Employee stock SARs |
49,600 | $ | 12.12 | $ | 94 | 6,250 | NA | |||||||||||||
| Employee cash SARs |
12,087 | $ | 12.95 | NA | NA | $ | 27 | |||||||||||||
| Twelve months ended December 31, 2014 |
||||||||||||||||||||
| Number Exercised |
Average Exercise Price |
Intrinsic Value |
Number of Shares Issued |
Net Cash Payment to Employees |
||||||||||||||||
| Stock options |
16,779 | $ | 11.29 | $ | 57 | — | NA | |||||||||||||
| Employee stock SARs |
26,155 | $ | 11.79 | $ | 40 | 2,776 | NA | |||||||||||||
| Employee cash SARs |
11,012 | $ | 12.21 | NA | NA | $ | 13 | |||||||||||||
In 2015, 19,185 restricted shares were granted and issued to directors with no restrictions imposed.
In 2015, the Company granted 157,195 RSUs to employees. Of the RSUs granted, 7,052 cliff vest on January 1, 2019, 1,297 cliff vest on May 1, 2016, 148,460 vest over four years, and 386 vested immediately. The Company’s RSUs do not accrue dividends and the grantees do not have voting rights.
The following table provides information regarding RSU activity during 2015, 2014 and 2013:
| For the Years Ended December 31, | ||||||||||||||||||||||||
| 2015 | 2014 | 2013 | ||||||||||||||||||||||
| Restricted Stock Units Outstanding |
Weighted Average Grant Date Fair Value |
Restricted Stock Units Outstanding |
Weighted Average Grant Date Fair Value |
Restricted Stock Units Outstanding |
Weighted Average Grant Date Fair Value |
|||||||||||||||||||
| Balance, beginning of year |
306,532 | $ | 11.18 | 299,696 | $ | 9.79 | 251,329 | $ | 8.99 | |||||||||||||||
| Granted |
157,195 | 13.00 | 127,051 | 13.21 | 145,420 | 10.80 | ||||||||||||||||||
| Vested shares issued |
(75,373 | ) | 10.59 | (58,518 | ) | 9.65 | (42,678 | ) | 9.03 | |||||||||||||||
| Vested shares forfeited for taxes |
(46,105 | ) | 10.59 | (36,384 | ) | 9.65 | (26,580 | ) | 9.03 | |||||||||||||||
| Forfeited or expired |
(11,252 | ) | 12.33 | (25,313 | ) | 10.67 | (27,795 | ) | 9.66 | |||||||||||||||
|
|
|
|
|
|
|
|
|
|
|
|
|
|||||||||||||
| Balance, end of year |
330,997 | $ | 12.23 | 306,532 | $ | 11.18 | 299,696 | $ | 9.79 | |||||||||||||||
|
|
|
|
|
|
|
|
|
|
|
|
|
|||||||||||||
Under the terms of the 2006 SOEC Plan, shares of Pacific Continental Corporation common stock are to be issued as soon as is practicable upon vesting of RSUs.
NOTE 18 – DEFERRED COMPENSATION PLAN:
During 2014, the Company established a nonqualified deferred compensation plan for certain eligible executives and eligible directors. Under the deferred compensation plan, eligible executives and eligible directors may elect to defer a portion of their base salary, bonuses, director fees, and/or long-term incentive compensation. The deferred compensation liability totaled $352 and $72 at December 31, 2015, and 2014, respectively and is included within the other liabilities on the consolidated balance sheet.
106
Table of Contents
NOTE 19 – ACCUMULATED OTHER COMPREHENSIVE INCOME
The following table shows the changes in accumulated other comprehensive income (loss) by component for the years ended December 31, 2015, 2014 and 2013:
| Unrealized gains and losses on available -for-sale securities |
Unrealized gains and losses on derivative instrument - cash flow hedge |
Total | ||||||||||
| Year ended December 31, 2015 |
||||||||||||
| Beginning balance |
$ | 3,695 | $ | 107 | $ | 3,802 | ||||||
| Other comprehensive income before |
(649 | ) | (57 | ) | (706 | ) | ||||||
| Amounts reclassified from accumulated other comprehensive income |
(397 | ) | — | (397 | ) | |||||||
|
|
|
|
|
|
|
|||||||
| Net current-period other comprehensive income |
(1,046 | ) | (57 | ) | (1,103 | ) | ||||||
| Ending balance |
$ | 2,649 | $ | 50 | $ | 2,699 | ||||||
|
|
|
|
|
|
|
|||||||
| Year ended December 31, 2014 |
||||||||||||
| Beginning balance |
$ | (148 | ) | $ | 247 | $ | 99 | |||||
| Other comprehensive income before reclassifications |
3,822 | (140 | ) | 3,682 | ||||||||
| Amounts reclassified from accumulated other comprehensive income |
21 | — | 21 | |||||||||
|
|
|
|
|
|
|
|||||||
| Net current-period other comprehensive income |
3,843 | (140 | ) | 3,703 | ||||||||
| Ending balance |
$ | 3,695 | $ | 107 | $ | 3,802 | ||||||
|
|
|
|
|
|
|
|||||||
| Year ended December 31, 2013 |
||||||||||||
| Beginning balance |
$ | 5,831 | $ | — | $ | 5,831 | ||||||
| Other comprehensive income before reclassifications |
(5,998 | ) | 247 | (5,751 | ) | |||||||
| Amounts reclassified from accumulated other comprehensive income |
19 | — | 19 | |||||||||
|
|
|
|
|
|
|
|||||||
| Net current-period other comprehensive income |
(5,979 | ) | 247 | (5,732 | ) | |||||||
| Ending balance |
$ | (148 | ) | $ | 247 | $ | 99 | |||||
|
|
|
|
|
|
|
|||||||
107
Table of Contents
NOTE 20 – TRANSACTIONS WITH RELATED PARTIES:
The Company has granted loans to officers and directors and to companies with which they are associated. Such loans are made on substantially the same terms, including interest rates and collateral, as those prevailing at the time for comparable transactions with unrelated parties. Activity with respect to these loans during the years ended December 31, 2015, 2014 and 2013, was as follows:
| For the Years Ended December 31, | ||||||||||||
| 2015 | 2014 | 2013 | ||||||||||
| Balance, beginning of year |
$ | 100 | $ | 100 | $ | 133 | ||||||
| Additions or renewals |
35 | — | 68 | |||||||||
| Amounts collected |
(110 | ) | — | (101 | ) | |||||||
|
|
|
|
|
|
|
|||||||
| Balance, end of year |
$ | 25 | $ | 100 | $ | 100 | ||||||
|
|
|
|
|
|
|
|||||||
In addition, there were $6 in commitments to extend credit to directors and officers at December 31, 2015, which are included among loan commitments, disclosed in Note 21.
At December 31, 2015, 2014, and 2013, deposits to related parties totaled $1,091, $1,304, and $1,456, respectively.
108
Table of Contents
NOTE 21 – COMMITMENTS AND CONTINGENCIES:
In the normal course of business under the provisions of the Company’s investment policy, additional investment securities may be purchased from time to time. Commitments to purchase securities are generally settled within a month and are not associated with repurchase agreements.
In order to meet the financing needs of its clients, the Company commits to extensions of credit and issues letters of credit. The Company uses the same credit policies in making commitments and conditional obligations as it does for other products. In the event of nonperformance by the client, the Company’s exposure to credit loss is represented by the contractual amount of the instruments. The Company’s collateral policies related to financial instruments with off-balance sheet risk conform to its general underwriting guidelines.
Commitments to extend credit are agreements to lend to a client as long as there is no violation of any condition established in the contract. Commitments generally have expiration dates or other termination clauses and may require payment of a fee. Since some of the commitments may expire without being drawn upon, the total commitment amounts do not necessarily represent future cash requirements.
Letters of credit written are conditional commitments issued by the Company to guarantee the performance of a client to a third-party. The credit risk involved in issuing letters of credit is essentially the same as that involved in extending loan facilities to clients.
109
Table of Contents
Off-balance sheet instruments at December 31, 2015 and 2014 consist of the following:
| December 31, | ||||||||
| 2015 | 2014 | |||||||
| Commitments to extend credit (principally variable rate) |
$ | 256,156 | $ | 156,972 | ||||
| Letters of credit and financial guarantees written |
$ | 1,184 | $ | 1,564 | ||||
The Company has entered into Executive Employment Agreements with two key executive officers. The employment agreements provide for minimum aggregate annual base salaries of $812, plus performance adjustments, life insurance coverage, and other perquisites commonly found in such agreements. The two employment agreements expire in 2016 unless extended or terminated earlier.
Legal contingencies arise from time-to-time in the normal course of business. Based upon analysis of management and in consultation with the Company’s legal counsel there are no current legal matters which are expected to have a material effect on the Company’s consolidated financial position.
NOTE 22 – FAIR VALUE:
The following disclosures about fair value of financial instruments are made in accordance with provisions of ASC 825 “Financial Instruments.” The use of different assumptions and estimation methods could have a significant effect on fair value amounts. Accordingly, the estimates of fair value herein are not necessarily indicative of the amounts that might be realized in a current market exchange.
The estimated fair values of the financial instruments at December 31, 2015 and 2014, are as follows:
110
Table of Contents
| December 31, | ||||||||||||||||
| 2015 | 2014 | |||||||||||||||
| Carrying Amount |
Fair Value | Carrying Amount |
Fair Value | |||||||||||||
| Financial assets: |
||||||||||||||||
| Cash and cash equivalents |
$ | 36,675 | $ | 36,675 | $ | 25,787 | $ | 25,787 | ||||||||
| Securities available-for-sale |
366,598 | 366,598 | 351,946 | 351,946 | ||||||||||||
| Loans |
1,404,482 | 1,389,562 | 1,045,021 | 1,033,254 | ||||||||||||
| Interest receivable |
5,721 | 5,721 | 4,773 | 4,773 | ||||||||||||
| Federal Home Loan Bank stock |
5,208 | 5,208 | 10,019 | 10,019 | ||||||||||||
| Bank-owned life insurance |
22,884 | 22,884 | 16,609 | 16,609 | ||||||||||||
| Interest rate swaps |
171 | 171 | 176 | 176 | ||||||||||||
| Financial liabilities: |
||||||||||||||||
| Deposits |
$ | 1,597,093 | $ | 1,597,280 | $ | 1,209,093 | $ | 1,209,240 | ||||||||
| Federal Home Loan Bank borrowings |
77,500 | 77,651 | 96,000 | 96,721 | ||||||||||||
| Junior subordinated debentures |
8,248 | 2,741 | 8,248 | 2,410 | ||||||||||||
| Accrued interest payable |
138 | 138 | 176 | 176 | ||||||||||||
| Interest rate swaps |
116 | 116 | — | — | ||||||||||||
Cash and Cash Equivalents – The carrying amount approximates fair value.
Securities available-for-sale – Fair value is based on quoted market prices. If a quoted market price is not available, fair value is estimated using quoted market prices for similar securities.
Accrued Interest receivable – The carrying amounts of accrued interest receivable approximate their fair value.
Loans – For variable rate loans that reprice frequently and have no significant change in credit risk, fair value is based on carrying values. Fair value of fixed rate loans is estimated by discounting the future cash flows using current rates at which similar loans would be made to borrowers with similar credit ratings and for the same remaining maturities. Fair values for impaired loans are estimated using discounted cash flow analyses or underlying collateral values, where applicable, and consider credit risk.
111
Table of Contents
Federal Home Loan Bank stock – The carrying amount approximates fair value.
Bank-owned life insurance – The carrying amount approximates fair value.
Swap Derivative –Fair value is based on quoted market prices.
Deposits – Fair value of demand, interest bearing demand and savings deposits is the amount payable on demand at the reporting date. Fair value of time deposits is estimated using the interest rates currently offered for deposits of similar remaining maturities.
Federal Home Loan Bank Borrowings – Fair value of Federal Home Loan Bank borrowings is estimated by discounting future cash flows at rates currently available for debt with similar terms and remaining maturities.
Junior Subordinated Debentures – Fair value of Junior Subordinated Debentures is estimated by discounting future cash flows at rates currently available for debt with similar credit risk, terms and remaining maturities.
Accrued Interest payable – The carrying amounts of accrued interest payable approximate their fair value
Off-Balance Sheet Financial Instruments – The carrying amount and fair value are based on fees charged for similar commitments and are not material.
The Company also adheres to the FASB guidance with regards to ASC 820, “Fair Value Measures.” This guidance defines fair value, establishes a framework for measuring fair value in generally accepted accounting principles, and expands disclosures about fair value measurements. The statement requires fair value measurement disclosure of all assets and liabilities that are carried at fair value on either a recurring or nonrecurring basis. The Company determines fair value based upon quoted prices when available or through the use of alternative approaches, such as matrix or model pricing, when market quotes are not readily accessible or available. The valuation techniques used are based on observable and unobservable inputs. Observable inputs reflect market data obtained from independent sources, while unobservable inputs reflect the Company’s market assumptions. These two types of inputs create the following fair value hierarchy:
Level 1 – Quoted prices for identical instruments in active markets.
Level 2 – Quoted prices for similar instruments in active markets, quoted prices for identical or similar instruments in markets that are not active or model-derived valuations whose inputs are observable or whose significant value drivers are observable.
Level 3 – Unobservable inputs are used to measure fair value to the extent that observable inputs are not available. The Company’s own data used to develop unobservable inputs is adjusted for market consideration when reasonably available.
Financial instruments, measured at fair value, are broken down in the tables below by recurring or nonrecurring measurement status. Recurring assets are initially measured at fair value and are required to be remeasured at fair value in the financial statements at each reporting date. Assets measured on a nonrecurring basis are assets that, due to an event or circumstance, were required to be remeasured at fair value after initial recognition in the financial statements at some time during the reporting period.
112
Table of Contents
The following table presents information about the level in the fair value hierarchy for the Company’s assets and liabilities not measured at fair value as of December 31, 2015, and 2014:
| Carrying Amount |
Fair Value at December 31, 2015 | |||||||||||||||
| Level 1 | Level 2 | Level 3 | ||||||||||||||
| Financial assets: |
||||||||||||||||
| Cash and cash equivalents |
$ | 36,675 | $ | 36,675 | $ | — | $ | — | ||||||||
| Loans |
1,404,482 | — | — | 1,389,562 | ||||||||||||
| Interest receivable |
5,721 | 5,721 | — | — | ||||||||||||
| Federal Home Loan Bank stock |
5,208 | 5,208 | — | — | ||||||||||||
| Bank-owned life insurance |
22,884 | 22,884 | — | — | ||||||||||||
| Interest rate swaps |
171 | 171 | — | — | ||||||||||||
| Financial liabilities: |
||||||||||||||||
| Deposits |
$ | 1,597,093 | $ | — | $ | 1,597,280 | $ | — | ||||||||
| Federal Home Loan Bank borrowings |
77,500 | — | 77,651 | — | ||||||||||||
| Junior subordinated debentures |
8,248 | — | 2,741 | — | ||||||||||||
| Accrued interest payable |
138 | 138 | — | — | ||||||||||||
| Interest rate swaps |
116 | 116 | — | — | ||||||||||||
| Carrying Amount |
Fair Value at December 31, 2014 | |||||||||||||||
| Level 1 | Level 2 | Level 3 | ||||||||||||||
| Financial assets: |
||||||||||||||||
| Cash and cash equivalents |
$ | 25,787 | $ | 25,787 | $ | — | $ | — | ||||||||
| Loans |
1,045,021 | — | — | 1,033,254 | ||||||||||||
| Interest receivable |
4,773 | 4,773 | — | — | ||||||||||||
| Federal Home Loan Bank stock |
10,019 | 10,019 | — | — | ||||||||||||
| Bank-owned life insurance |
16,609 | 16,609 | — | — | ||||||||||||
| Swap derivative |
176 | 176 | — | — | ||||||||||||
| Financial liabilities: |
||||||||||||||||
| Deposits |
$ | 1,209,093 | $ | — | $ | 1,209,240 | $ | — | ||||||||
| Federal Home Loan Bank borrowings |
96,000 | — | 96,721 | — | ||||||||||||
| Junior subordinated debentures |
8,248 | — | 2,410 | — | ||||||||||||
| Accrued interest payable |
176 | 176 | — | — | ||||||||||||
113
Table of Contents
The tables below show assets/liabilities measured at fair value on a recurring basis as of December 31, 2015, and December 31, 2014:
| Carrying Value |
Fair Value Measurements Using | |||||||||||||||
| December 31, 2015 | Quoted Prices in Active Markets for Identical Assets (Level1) |
Significant Other Observable Inputs (Level 2) |
Significant Unobservable Inputs (Level 3) |
|||||||||||||
| Available-for-sale securities |
||||||||||||||||
| Obligations of U.S government agencies |
$ | 44,623 | $ | — | $ | 44,623 | $ | — | ||||||||
| Obligation of states and political subdivisions |
97,151 | — | 97,151 | — | ||||||||||||
| Agency mortgage-backed securities |
185,370 | — | 185,370 | — | ||||||||||||
| Private-label mortgage-backed securities |
2,790 | — | 1,204 | 1,586 | ||||||||||||
| SBA variable vate pools |
35,771 | — | 35,771 | — | ||||||||||||
| Corporate Securities |
893 | — | 893 | — | ||||||||||||
| Interest rate swaps |
55 | 55 | — | — | ||||||||||||
|
|
|
|
|
|
|
|
|
|||||||||
| Total assets measured on a recurring basis |
$ | 366,653 | $ | 55 | $ | 365,012 | $ | 1,586 | ||||||||
|
|
|
|
|
|
|
|
|
|||||||||
| Carrying Value |
Fair Value Measurements Using | |||||||||||||||
| December 31, 2014 | Quoted Prices in Active Markets for Identical Assets (Level1) |
Significant Other Observable Inputs (Level 2) |
Significant Unobservable Inputs (Level 3) |
|||||||||||||
| Available-for-sale securities |
||||||||||||||||
| Obligations of U.S government agencies |
$ | 39,185 | $ | — | $ | 39,185 | $ | — | ||||||||
| Obligation of states and political subdivisions |
83,981 | — | 83,981 | — | ||||||||||||
| Agency mortgage-backed securities |
205,390 | — | 205,390 | — | ||||||||||||
| Private-label mortgage-backed securities |
3,816 | — | 2,248 | 1,568 | ||||||||||||
| SBA variable vate pools |
19,574 | — | 19,574 | — | ||||||||||||
| Interest rate swaps |
176 | 176 | — | — | ||||||||||||
|
|
|
|
|
|
|
|
|
|||||||||
| Total assets measured on a recurring basis |
$ | 352,122 | $ | 176 | $ | 350,378 | $ | 1,568 | ||||||||
|
|
|
|
|
|
|
|
|
|||||||||
No transfers to or from level 1 and 2 occurred on assets measured at fair value on a recurring basis during the twelve months ended December 31, 2015.
The following is a description of the inputs and valuation methodologies used for assets recorded at fair value on a recurring basis. Fair value for all classes of available-for-sale securities is estimated by obtaining quoted market prices for identical assets, where available. If such prices are not available, fair value is based on independent asset pricing services and models, the inputs of which are market-based or independently sourced market parameters, including, but not limited to, yield curves, interest rates, prepayments, defaults, cumulative loss projections, and cash flows. There have been no significant changes in the valuation techniques during the periods reported.
114
Table of Contents
The following table provides a reconciliation of assets measured at fair value on a recurring basis using unobservable inputs (Level 3) for the periods ended December 31, 2015, 2014 and 2013:
| For the Years Ended December 31, | ||||||||||||
| 2015 | 2014 | 2013 | ||||||||||
| Beginning balance |
$ | 1,568 | $ | 1,786 | $ | 1,682 | ||||||
| Transfers into Level 3 |
300 | — | 332 | |||||||||
| Transfers out of Level 3 |
— | — | — | |||||||||
| Total gains or losses |
||||||||||||
| Included in earnings |
— | — | — | |||||||||
| Included in other comprehensive income |
66 | (106 | ) | 80 | ||||||||
| Paydowns |
(348 | ) | (112 | ) | (308 | ) | ||||||
| Purchases, issuances, sales, and settlements |
||||||||||||
| Purchases |
— | — | — | |||||||||
| Issuances |
— | — | — | |||||||||
| Sales |
— | — | — | |||||||||
| Settlements |
— | — | — | |||||||||
|
|
|
|
|
|
|
|||||||
| Ending balance |
$ | 1,586 | $ | 1,568 | $ | 1,786 | ||||||
|
|
|
|
|
|
|
|||||||
Fair value for all classes of available-for-sale securities is estimated by obtaining quoted market prices for identical assets, where available. If such prices are not available, fair value is based on quoted prices for similar instruments or model-derived valuations whose inputs are observable or whose significant value drivers are observable. In instances where quoted prices for identical or similar instruments and observable inputs are not available, unobservable inputs, including the Company’s own data, are used.
The Company utilizes FTN Financial as an independent third-party asset pricing service to estimate fair value on all of its available-for-sale securities. The inputs used to value all securities include benchmark yields, reported trades, broker/dealer quotes, issuer spreads, two-sided markets, benchmark securities, bids, offers, and reference data including market research, market indicators, and industry and economic trends. Additional inputs specific to each asset type are as follows:
| • | Obligations of U.S. government agencies – TRACE reported trades. |
| • | Obligations of states and political subdivisions – MSRB reported trades, material event notices, and Municipal Market Data (MMD) benchmark yields. |
| • | Private-label mortgage-backed securities – new issue data, monthly payment information, and collateral performance (whole loan collateral). |
| • | Mortgage-backed securities – TBA prices and monthly payment information. |
| • | SBA variable pools – TBA prices and monthly payment information. |
| • | Corporate securities – TRACE reported trades. |
Inputs may be prioritized differently on any given day for any security and not all inputs listed are available for use in the evaluation process on any given day for each security evaluation.
The valuation methodology used by asset type includes:
| • | Obligations of U.S. government agencies – security characteristics, defined sector break-down, benchmark yields, applied base spread, yield to maturity (bullet structures), corporate action adjustment, and evaluations based on T+3 settlement. |
115
Table of Contents
| • | Obligations of states and political subdivisions – security characteristics, benchmark yields, applied base spread, yield to worst or market convention, ratings updates, prepayment schedules (housing bonds), material event notice adjustments, and evaluations based on T+3 settlement. |
| • | Private-label mortgage-backed securities – security characteristics, prepayment speeds, cash flows, TBA, Treasury and swap curves, IO/PO strips or floating indexes, applied base spread, spread adjustments, yield to worst or market convention, ratings updates (whole-loan collateral), and evaluations based on T+0 settlement. |
| • | Mortgage-backed securities – security characteristics, TBA, Treasury, or floating index benchmarks, spread to TBA levels, prepayment speeds, applied spreads, and evaluations based on T+0 settlement. |
| • | SBA pools – security characteristics, TBA, Treasury, or floating index benchmarks, spread to TBA levels, prepayment speeds, applied spreads, and evaluations based on T+0 settlement. |
| • | Corporate securities – security characteristics, defined sector break-down, benchmark yields, applied based spread, yield to maturity (bullet structures), corporate action adjustment, and evaluations based on T+3 settlement. |
The third-party pricing service follows multiple review processes to assess the available market, credit and deal-level information to support its valuation estimates. If sufficient objectively verifiable information is not available to support a security’s valuation, an alternate independent evaluation source will be used.
The Company’s securities portfolio was valued through its independent third-party pricing service using evaluated pricing models and quoted prices based on market data. For further assurance, the Company’s estimate of fair value was compared to an additional independent third-party estimate at June 30, 2015, and the Company obtained key inputs for a sample of securities across sectors and evaluated those inputs for reasonableness. This analysis was performed at the individual security level and no material variances were noted.
There have been no significant changes in the valuation techniques during the periods reported.
116
Table of Contents
The tables below show assets measured at fair value on a nonrecurring basis as of December 31, 2015, and 2014:
| Fair Value Measurements Using | ||||||||||||||||
| December 31, 2015 | Carrying Value |
Quoted Prices in Active Markets for Identical Assets (Level 1) |
Significant Other Observable Inputs (Level 2) |
Significant Unobservable Inputs (Level 3) |
||||||||||||
| Loans measured for impairment (net of guarantees and specific reserve) |
$ | 53 | $ | — | $ | — | $ | 53 | ||||||||
| Other real estate owned |
10,147 | — | — | 10,147 | ||||||||||||
|
|
|
|
|
|
|
|
|
|||||||||
| $ | 10,200 | — | — | $ | 10,200 | |||||||||||
|
|
|
|
|
|
|
|
|
|||||||||
| Fair Value Measurements Using | ||||||||||||||||
| December 31, 2014 | Carrying Value |
Quoted Prices in Active Markets for Identical Assets (Level 1) |
Significant Other Observable Inputs (Level 2) |
Significant Unobservable Inputs (Level 3) |
||||||||||||
| Loans measured for impairment (net of guarantees and specific reserve) |
$ | 135 | $ | — | $ | — | $ | 135 | ||||||||
| Other real estate owned |
449 | — | — | 449 | ||||||||||||
|
|
|
|
|
|
|
|
|
|||||||||
| $ | 584 | — | — | $ | 584 | |||||||||||
|
|
|
|
|
|
|
|
|
|||||||||
During second quarter 2015, there was one security that transferred from level 2 to level 3 as the Bank recorded OTTI on a security. For additional information, see Note 4.
The following is a description of the inputs and valuation methodologies used for assets recorded at fair value on a nonrecurring basis.
Loans measured for impairment (net of government guarantees and specific reserves) include the estimated fair value of collateral-dependent loans, less collectible government guarantees, as well as certain noncollateral-dependent loans measured for impairment with an allocated specific reserve. When a collateral-dependent loan is identified as impaired, the value of the loan is measured using the current fair value of the collateral less selling costs. The fair value of collateral is generally estimated by obtaining external appraisals which are usually updated every 6 to 12 months based on the nature of the impaired loans. Certain noncollateral-dependent loans measured for impairment with an allocated specific reserve are valued based upon the estimated net realizable value of the loan. If the estimated fair value of the impaired loan, less collectible government guarantees, is less than the recorded investment in the loan, impairment is recognized as a charge-off through the allowance for loan losses. The carrying value of the loan is adjusted to the estimated fair value. The carrying value of loans fully charged off is zero.
Other real estate owned represents real estate which the Company has taken control of in partial or full satisfaction of loans. At the time of foreclosure, other real estate owned is recorded at the lower of the carrying amount of the loan or fair value less costs to sell, which becomes the property’s new basis. Any write downs based on the asset’s fair value at the date of acquisition are charged to the allowance for loan losses. After foreclosure, management periodically orders appraisals or performs valuations to ensure that the real estate is carried at the lower of its new cost basis or fair value, net of estimated costs to sell. Appraisals are generally updated every 6 to 12 months on other real estate owned. Fair value adjustments on other real estate owned are recognized within net loss on real estate owned. The loss represents impairments on other real estate owned for fair value adjustments based on the fair value of the real estate.
117
Table of Contents
There have been no significant changes in the valuation techniques during the periods reported.
NOTE 23 – REGULATORY MATTERS:
The Company and the Bank are subject to the regulations of certain federal and state agencies and receive periodic examinations by those regulatory authorities. In addition, they are subject to various regulatory capital requirements administered by federal banking agencies. Failure to meet minimum capital requirements can initiate certain mandatory – and possibly additional discretionary – actions by regulators that, if undertaken, could have a direct material effect on the consolidated financial statements. Under capital adequacy guidelines and the regulatory framework for prompt corrective action, the Bank must meet specific capital guidelines that involve quantitative measures of the Bank’s assets, liabilities, and certain off-balance sheet items as calculated under regulatory accounting practices. The Company and the Bank’s capital amounts and classification are also subject to qualitative judgments by the regulators about components, risk weightings and other factors.
Quantitative measures established by regulation to ensure capital adequacy require the Company and the Bank to maintain minimum amounts and ratios of Total, Tier 1 capital, and common equity Tier 1 to risk-weighted assets and of tier 1 capital to leverage assets. Management believes that, as of December 31, 2015, the Company and the Bank met all capital adequacy requirements to which they were subject.
As of December 31, 2015, according to FDIC guidelines, the Bank is considered to be well-capitalized. To be categorized as well-capitalized, the Bank must maintain minimum total risk-based, tier 1 risk-based and tier 1 leverage ratios as set forth in the following table.
118
Table of Contents
The Company’s and the Bank’s actual capital amounts and ratios are presented in the table below:
| Actual | For Capital Adequacy Purposes |
To Be Well Capitalized Under Prompt Corrective Action Provisions |
||||||||||||||||||||||
| Amount | Ratio | Amount | Ratio | Amount | Ratio | |||||||||||||||||||
| As of December 31, 2015: |
||||||||||||||||||||||||
| Total capital (to risk weighted assets) |
||||||||||||||||||||||||
| Bank: |
$ | 200,236 | 12.52 | % | $ | 127,990 | 8.00 | % | $ | 159,988 | 10.00 | % | ||||||||||||
| Company: |
$ | 201,261 | 12.58 | % | NA | NA | ||||||||||||||||||
| Tier 1 capital (to risk weighted assets) |
||||||||||||||||||||||||
| Bank: |
$ | 182,575 | 11.41 | % | $ | 95,993 | 6.00 | % | $ | 127,990 | 8.00 | % | ||||||||||||
| Company: |
$ | 183,600 | 11.47 | % | NA | NA | ||||||||||||||||||
| Common Equity Tier 1 (to risk weighted assets) |
||||||||||||||||||||||||
| Bank: |
$ | 182,575 | 11.41 | % | $ | 71,995 | 4.50 | % | $ | 103,992 | 6.50 | % | ||||||||||||
| Company: |
$ | 175,600 | 10.97 | % | NA | NA | ||||||||||||||||||
| Tier 1 capital (to leverage assets) |
||||||||||||||||||||||||
| Bank: |
$ | 182,575 | 9.88 | % | $ | 73,938 | 4.00 | % | $ | 92,422 | 5.00 | % | ||||||||||||
| Company: |
$ | 183,600 | 9.93 | % | NA | NA | ||||||||||||||||||
| As of December 31, 2014: |
||||||||||||||||||||||||
| Total capital (to risk weighted assets) |
||||||||||||||||||||||||
| Bank: |
$ | 176,199 | 15.48 | % | $ | 91,040 | 8.00 | % | $ | 113,800 | 10.00 | % | ||||||||||||
| Company: |
$ | 179,109 | 15.73 | % | NA | NA | ||||||||||||||||||
| Tier 1 capital (to risk weighted assets) |
||||||||||||||||||||||||
| Bank: |
$ | 161,954 | 14.23 | % | $ | 45,520 | 4.00 | % | $ | 68,280 | 6.00 | % | ||||||||||||
| Company: |
$ | 164,864 | 14.48 | % | NA | NA | ||||||||||||||||||
| Tier 1 capital (to leverage assets) |
||||||||||||||||||||||||
| Bank: |
$ | 161,954 | 11.13 | % | $ | 58,193 | 4.00 | % | $ | 72,741 | 5.00 | % | ||||||||||||
| Company: |
$ | 164,864 | 11.33 | % | NA | NA | ||||||||||||||||||
On July 2, 2013, the federal banking regulators approved the final proposed rules that revised the regulatory capital rules to conform the U.S. regulatory capital framework for U.S. banking organizations to the Basel Committee’s Base III capital framework (“Basel III”). The phase-in period for the final rules began for the Company on January 1, 2015, with full compliance with the final rules entire requirement to be phased in by January 1, 2019.
The final rules, among other things, included a new common equity Tier 1 capital (“CET1”) to risk-weighted assets ratio, including a capital conservation buffer composed of CET1, which will gradually increase from 4.50% on January 1, 2015 to 7.00% on January 1, 2019. The final rules also raised the minimum ratio of Tier 1 capital to risk-weighted assets from 4.00% to 6.00%, as well as require a minimum total capital ratio of 8.00% and a minimum leverage ratio of 4.00%.
Also, under the final rules, trust preferred security debt issuances will be phased out of Tier 1 capital into Tier 2 capital over a 10-year period, except for bank holding companies with less than $15 billion assets as of December 31, 2009 which will be allowed to continue to include these issuances in Tier 1 capital, subject to certain restrictions. As the Company had less than $15 billion in assets at December 31, 2009, the Company will be able to continue to include its existing trust preferred securities, less the common stock of the Trusts, in the Company’s Tier 1 capital.
119
Table of Contents
NOTE 24 – PARENT COMPANY FINANCIAL INFORMATION:
Financial information for Pacific Continental Corporation (Parent Company only) is presented below:
BALANCE SHEET
| December 31, | ||||||||
| 2015 | 2014 | |||||||
| Assets: |
||||||||
| Cash deposited with the Bank |
$ | 1,078 | $ | 2,961 | ||||
| Prepaid expenses |
4 | 7 | ||||||
| Equity in Trust |
248 | 248 | ||||||
| Swap unrealized gain |
82 | 176 | ||||||
| Investment in the Bank |
225,416 | 189,143 | ||||||
|
|
|
|
|
|||||
| $ | 226,828 | $ | 192,535 | |||||
|
|
|
|
|
|||||
| Liabilities and shareholders’ equity: |
||||||||
| Liabilities |
$ | 57 | $ | 57 | ||||
| Deferred tax liability |
32 | 69 | ||||||
| Junior subordinated debentures |
8,248 | 8,248 | ||||||
| Shareholders’ equity |
218,491 | 184,161 | ||||||
|
|
|
|
|
|||||
| $ | 226,828 | $ | 192,535 | |||||
|
|
|
|
|
|||||
120
Table of Contents
STATEMENTS OF OPERATIONS
| For the Years Ended December 31, | ||||||||||||
| 2015 | 2014 | 2013 | ||||||||||
| Income: |
||||||||||||
| Cash dividends from the Bank |
$ | 6,554 | $ | 16,215 | $ | 13,995 | ||||||
|
|
|
|
|
|
|
|||||||
| 6,554 | 16,215 | 13,995 | ||||||||||
|
|
|
|
|
|
|
|||||||
| Expenses: |
||||||||||||
| Interest expense |
226 | 225 | 200 | |||||||||
| Investor relations |
132 | 84 | 123 | |||||||||
| Legal, registration expense, and other |
98 | 132 | 177 | |||||||||
| Personnel costs paid to Bank |
167 | 183 | 152 | |||||||||
|
|
|
|
|
|
|
|||||||
| 623 | 624 | 652 | ||||||||||
|
|
|
|
|
|
|
|||||||
| Income before income tax expense and equity in undistributed earnings from the Bank |
5,931 | 15,591 | 13,343 | |||||||||
| Income tax benefit |
139 | 140 | 159 | |||||||||
| Equity in undistributed earnings of the Bank |
12,681 | 311 | 265 | |||||||||
|
|
|
|
|
|
|
|||||||
| Net income |
$ | 18,751 | $ | 16,042 | $ | 13,767 | ||||||
|
|
|
|
|
|
|
|||||||
STATEMENTS OF CASH FLOWS
| For the Years Ended December 31, | ||||||||||||
| 2015 | 2014 | 2013 | ||||||||||
| Cash flows from operating activities: |
||||||||||||
| Net income |
$ | 18,751 | $ | 16,042 | $ | 13,767 | ||||||
| Adjustments to reconcile net income to net cash provided by operating activities: |
||||||||||||
| Equity in undistributed earnings from the Bank |
(12,681 | ) | (311 | ) | (265 | ) | ||||||
| Excess tax benefit of stock options exercised |
(9 | ) | (14 | ) | — | |||||||
| Other, net |
652 | 525 | 342 | |||||||||
|
|
|
|
|
|
|
|||||||
| Net cash provided by operating activities |
6,713 | 16,242 | 13,844 | |||||||||
|
|
|
|
|
|
|
|||||||
| Cash flows from financing activities: |
||||||||||||
| Proceeds from stock options exercised |
86 | 189 | — | |||||||||
| Income tax benefit for stock options exercised |
9 | 14 | — | |||||||||
| Repurchase of common stock |
— | (3,600 | ) | — | ||||||||
| Dividends paid |
(8,042 | ) | (12,308 | ) | (13,050 | ) | ||||||
| Vested RSUs surrendered to cover tax consequences |
(649 | ) | (517 | ) | (318 | ) | ||||||
|
|
|
|
|
|
|
|||||||
| Net cash provided by (used in) financing activities |
(8,596 | ) | (16,222 | ) | (13,368 | ) | ||||||
|
|
|
|
|
|
|
|||||||
| Net change in cash |
(1,883 | ) | 20 | 476 | ||||||||
| Cash, beginning of period |
2,961 | 2,941 | 2,465 | |||||||||
|
|
|
|
|
|
|
|||||||
| Cash, end of period |
$ | 1,078 | $ | 2,961 | $ | 2,941 | ||||||
|
|
|
|
|
|
|
|||||||
121
Table of Contents
| ITEM 9 | Changes in and Disagreements With Accountants on Accounting and Financial Disclosure |
None
| ITEM 9A | Controls and Procedures |
Evaluation of Disclosure Controls and Procedures
An evaluation was carried out under the supervision and with the participation of the Company’s management, including the Chief Executive Officer (“CEO”) and Chief Financial Officer (“CFO”), of the effectiveness of our disclosure controls and procedures, as defined in Rule 13a-15(e) and 15d-15(e) of the Securities Exchange Act of 1934 (the “Exchange Act”). Based on that evaluation, the CEO and CFO have concluded that, as of the end of the period covered by this report, our disclosure controls and procedures are effective to provide reasonable assurance that information required to be disclosed by us in reports that we file or submit under the Exchange Act is recorded, processed, summarized, and timely reported as provided in the SEC rules and forms. There were no changes in our internal control over financial reporting (as defined in Rules 13a-15(f) and 15d-15(f) of the Exchange Act) during the three months ended December 31, 2015, that have materially affected, or are reasonably likely to materially affect, our internal control over financial reporting.
Management’s Report on Internal Control Over Financial Reporting
The management of the Company is responsible for establishing and maintaining adequate internal control over financial reporting. This internal control system has been designed to provide reasonable assurance to the Company’s management and Board of Directors regarding the preparation and fair presentation of the Company’s published financial statements.
All internal control systems, no matter how well designed, have inherent limitations. Therefore, even those systems determined to be effective can provide only reasonable assurance with respect to financial statement preparation and presentation.
The management of the Company has assessed the effectiveness of its internal control over financial reporting at December 31, 2015. To make this assessment, the Company used the criteria for effective internal control over financial reporting described in Internal Control – Integrated Framework, issued by the Committee of Sponsoring Organizations of the Treadway Commission. Based on this assessment, at December 31, 2015, management has determined that internal controls over financial reporting were effective to provide reasonable assurance regarding the reliability of financial reporting and the preparation of financial statements in accordance with U.S. generally accepted accounting principles.
| ITEM 9B | Other Information |
None
| ITEM 10 | Directors, Executive Officers and Corporate Governance |
This Item is incorporated by reference to our definitive proxy statement on Schedule 14A, which will be filed within 120 days after the close of the fiscal year covered by this report on Form 10-K, or if our proxy statement is not filed by that date, will be included in an amendment to this Report on Form 10-K.
| ITEM 11 | Executive Compensation |
This Item is incorporated by reference to our definitive proxy statement on Schedule 14A, which will be filed within 120 days after the close of the fiscal year covered by this report on Form 10-K, or if our proxy statement is not filed by that date, will be included in an amendment to this Report on Form 10-K.
| ITEM 12 | Security Ownership of Certain Beneficial Owners and Management and Related Stockholder Matters |
This Item is incorporated by reference to our definitive proxy statement on Schedule 14A, which will be filed within 120 days after the close of the fiscal year covered by this report on Form 10-K, or if our proxy statement is not filed by that date, will be included in an amendment to this Report on Form 10-K.
122
Table of Contents
| ITEM 13 | Certain Relationships and Related Transactions and Director Independence |
This Item is incorporated by reference to our definitive proxy statement on Schedule 14A, which will be filed within 120 days after the close of the fiscal year covered by this report on Form 10-K, or if our proxy statement is not filed by that date, will be included in an amendment to this Report on Form 10-K.
| ITEM 14 | Principal Accountant Fees and Services |
This Item is incorporated by reference to our definitive proxy statement on Schedule 14A, which will be filed within 120 days after the close of the fiscal year covered by this report on Form 10-K, or if our proxy statement is not filed by that date, will be included in an amendment to this Report on Form 10-K.
| ITEM 15 | Exhibits and Financial Statement Schedules |
(a)(1)(2) See Index to Consolidated Financial Statements filed under Item 8 of this Form 10-K.
All other schedules to the financial statements required by Regulation S-X are omitted because they are not applicable, not material, or because the information is included in the financial statements or related notes.
(a)(3) Exhibit Index
| Exhibit | ||
| 3.1 | Second Amended and Restated Articles of Incorporation (1) | |
| 3.2 | Amended and Restated Bylaws (2) | |
| 4.1 | Form of Indenture relating to the issuance of debentures, notes, bonds or other evidences of indebtedness (3) | |
| 10.1* | 1999 Employee Stock Option Plan (4) | |
| 10.2* | 1999 Director’s Stock Option Plan (4) | |
| 10.3* | Amended 2006 Stock Option and Equity Compensation Plan (5) | |
| 10.4* | Form of Restricted Stock Award Agreement (6) | |
| 10.5* | Form of Stock Option Award Agreement (6) | |
| 10.6* | Form of Restricted Stock Unit Agreement (6) | |
| 10.7* | Form of Stock Appreciation Rights Agreement (6) | |
| 10.8* | Form of Executive Restricted Stock Unit Award Agreement (6) | |
| 10.9* | Form of Change in Control Agreement with executive officers (7) | |
| 10.10* | Amended and Restated Employment Agreement for Roger Busse dated November 18, 2014 | |
| 10.11* | Amended and Restated Employment Agreement for Casey Hogan dated November 18, 2014 | |
| 10.12* | NWB Financial Corporation Employee Stock Option Plan (8) | |
| 10.13* | NWB Financial Corporation Director Stock Option Plan (8) | |
| 10.14* | Director Fee Schedule, Effective January 1, 2013 (9) | |
| 10.15* | Director Stock Trading Plan (10) | |
| 10.15* | Deferred Compensation Plan (11) | |
| 14.1 | Code of Ethics for Senior Financial Officers and Principal Executive Officer (10) | |
| 23.1+ | Consent of Moss Adams LLP | |
| 24.1+ | Power of Attorney (included on signature page to this Form 10-K) | |
| 31.1+ | 302 Certification, Roger S. Busse, Chief Executive Officer | |
| 31.2+ | 302 Certification, Richard R. Sawyer, Executive Vice President and Chief Financial Officer | |
| 32+ | Certifications Pursuant to 18 U.S.C. Section 1350 | |
| 101+ | The following financial information from Pacific Continental Corporation’s Annual Report on Form 10-K for the year ended December 31, 2015, is formatted in XBRL; (i) the Audited Consolidated Balance Sheets, (ii) the Audited Consolidated Statements of Operations, (iii) the Audited Consolidated Statements of Comprehensive Income , (iv) the Audited Consolidated Statements of Changes in Shareholders’ Equity, (v) the Audited Consolidated Statements of Cash Flows, and (vi) the Notes to Consolidated Financial Statements. | |
123
Table of Contents
| (1) | Incorporated by reference to Exhibit 3.1 of the Company’s Quarterly Report on Form 10-Q for the Quarter ended March 31, 2010. |
| (2) | Incorporated by reference to Exhibit 3.1 of the Company’s Quarterly Report on Form 10-Q for the Quarter ended September 30, 2008. |
| (3) | Incorporated by reference to Exhibit 4.1 of the Company’s Form S-3 Registration Statement, filed March 29, 2013. (4) Incorporated by reference to Exhibits 99.1 and 99.2 of the Company’s S-8 Registration Statement (File No. 333-109501) filed October 6, 2003. |
| (5) | Incorporated by reference to Exhibit 10.3 of the Company’s Annual Report on Form 10-K for the fiscal year ended December 31, 2010. |
| (6) | Incorporated by reference to Exhibits 99.1 to 99.5 of the Company’s Form S-8 Registration Statement (File No. 333-181826) filed on June 1, 2012. |
| (7) | Incorporated by reference to Exhibits 10.1, 10.2 and 10.3 of the Company’s Current Report on Form 8-K filed February 2, 2013 (8) Incorporated by reference to Exhibits 99.1 and 99.2 of the Company’s Form S-8 Registration Statement (File No. 333-130886) filed January 1, 2006. |
| (9) | Incorporated by reference to Exhibit 10.15 of the Company’s Annual Report on Form 10-K for the fiscal year ended December 31, 2008. |
| (10) | Incorporated by reference to Exhibits 10.14 and 14 of the Company’s Annual Report on Form 10-K for the fiscal year ended December 31, 2007. |
| (11) | Incorporated by reference to Exhibit 10.1 of the Company’s Current Report on Form 8-K filed June 30, 2014. |
| * | Executive Contract, Compensatory Plan or Arrangement |
| + | Filed Herewith |
124
Table of Contents
Pursuant to the requirements of Section 13 or 15(d) of the Securities Exchange Act of 1934, the registrant has duly caused this report to be signed on its behalf by the undersigned thereunto duly authorized.
| PACIFIC CONTINENTAL CORPORATION (Registrant) | ||
| By: | /s/ Roger S. Busse | |
| Roger S. Busse | ||
| Chief Executive Officer | ||
| Date: March 14, 2016 | ||
Power of Attorney
Know all persons by these presents, that each person whose signature appears below constitutes and appoints Roger S. Busse and Richard R. Sawyer, and each of them, as such person’s true and lawful attorneys-in-fact and agents, with full power of substitution and resubstitution, for such person and in such person’s name, place and stead, in any and all capacities, to sign any and all amendments to the Report, and to file the same, with all exhibits thereto, and other documents in connection therewith, with the Securities and Exchange Commission, granting unto said attorneys-in-fact and agents, and each of them, full power and authority to do and perform each and every act and thing requisite or necessary to be done in connection therewith, as fully to all intents and purposes as such person might or could do in person, hereby, ratifying and confirming that all said attorneys-in-fact and agents, or any of them or their or such person’s substitute or substitutes, may lawfully do or cause to be done by virtue thereof.
Pursuant to the requirements of the Securities Exchange Act of 1934, this report has been signed below by the following persons on behalf of the registrant and in the capacities indicated on the 14th day of March 2016.
Principal Executive Officer
| By | /s/ Roger S. Busse | Chief Executive Officer | ||||||
| Roger S. Busse | and Director |
Principal Financial and Accounting Officer
| By | /s/ Richard R. Sawyer | Executive Vice President and | ||||||
| Richard R. Sawyer | Chief Financial Officer |
Directors
| By | /s/ Robert A. Ballin | Chairman | By | /s/ Michael E. Heijer | Director | |||||||
| Robert A. Ballin | Michael E. Heijer |
| By | /s/ Donald G. Montgomery | Vice Chairman | By | /s/ Michael D. Holzgang | Director | |||||||
| Donald G. Montgomery | Michael D. Holzgang |
| By | /s/ John H. Rickman | Director | By | /s/ Donald L. Krahmer, Jr. | Director | |||||||
| John H. Rickman | Donald L. Krahmer, Jr. |
| By | /s/ Jeffrey D. Pineo | Director | By | /s/ Judith Ann Johansen | Director | |||||||
| Jeffrey D. Pineo | Judith Ann Johansen |
| By | /s/ Eric Forrest | Director | By | /s/ Karen L. Whitman | Director | |||||||
| Eric S. Forrest | Karen L. Whitman |
| By | /s/ Roger S. Busse | Director | ||||||||||
| Roger S. Busse |
125