Attached files
| file | filename |
|---|---|
| EX-14 - EXHIBIT 14 - NATURES SUNSHINE PRODUCTS INC | ex14codeofconductpolicy.htm |
| EX-31.1 - EXHIBIT 31.1 - NATURES SUNSHINE PRODUCTS INC | natr-12312015xexhibit311.htm |
| EX-32.2 - EXHIBIT 32.2 - NATURES SUNSHINE PRODUCTS INC | natr-12312015xexhibit322.htm |
| EX-23.1 - EXHIBIT 23.1 - NATURES SUNSHINE PRODUCTS INC | natr-12312015xexhibit231.htm |
| EX-10.2 - EXHIBIT 10.2 - NATURES SUNSHINE PRODUCTS INC | ex102supplementalelectived.htm |
| EX-3.1 - EXHIBIT 3.1 - NATURES SUNSHINE PRODUCTS INC | ex31articlesofincorporatio.htm |
| EX-21 - EXHIBIT 21 - NATURES SUNSHINE PRODUCTS INC | ex21listofsubsidiaries.htm |
| EX-32.1 - EXHIBIT 32.1 - NATURES SUNSHINE PRODUCTS INC | natr-12312015xexhibit321.htm |
| EX-31.2 - EXHIBIT 31.2 - NATURES SUNSHINE PRODUCTS INC | natr-12312015xexhibit312.htm |
UNITED STATES
SECURITIES AND EXCHANGE COMMISSION
Washington, D.C. 20549
_________________________________________
FORM 10-K
x Annual report pursuant to Section 13 or 15(d) of the Securities Exchange Act of 1934
for the fiscal year ended December 31, 2015
OR
o Transition report under Section 13 or 15(d) of the Securities Exchange Act of 1934
for the transition period from to .
Commission file number 001-34483

NATURE’S SUNSHINE PRODUCTS, INC.
(Exact name of Registrant as specified in its charter)
Utah | 87-0327982 |
(State or other jurisdiction of | (IRS Employer |
incorporation or organization) | Identification No.) |
2500 West Executive Parkway, Suite 100
Lehi, Utah 84043
(Address of principal executive offices and zip code)
(801) 341-7900
(Registrant’s telephone number, including area code)
Securities registered pursuant to Section 12(b) of the Act: Common Stock, no par value.
Securities registered pursuant to Section 12(g) of the Act: None
_________________________________________
Indicate by check mark if the registrant is a well-known seasoned issuer, as defined in Rule 405 of the Securities Act. Yes o No x.
Indicate by check mark if the registrant is not required to file reports pursuant to Section 13 or Section 15(d) of the Act. Yes o No x.
Indicate by check mark whether the registrant has (1) filed all reports required to be filed by Section 13 or 15(d) of the Securities Exchange Act of 1934 during the preceding 12 months (or for such shorter period that the registrant was required to file such reports), and (2) has been subject to such filing requirements for the past 90 days. Yes x No o.
Indicate by check mark whether the registrant has submitted electronically and posted on its corporate Web site, if any, every Interactive Data File required to be submitted and posted pursuant to Rule 405 of Regulation S-T (§ 232.405 of this chapter) during the preceding 12 months (or for such shorter period that the registrant was required to submit and post such files). Yes x No o
Indicate by check mark if disclosure of delinquent filers pursuant to Item 405 of Regulation S-K is not contained herein, and will not be contained, to the best of registrant’s knowledge, in definitive proxy or information statements incorporated by reference in Part III of this Form 10-K or any amendment to this Form 10-K. o
Indicate by check mark whether the registrant is a large accelerated filer, an accelerated filer, a non-accelerated filer, or a smaller reporting company. See the definitions of “large accelerated filer,” “accelerated filer” and “smaller reporting company” in Rule 12b-2 of the Exchange Act.
Large accelerated filer o | Accelerated filer x |
Non-accelerated filer o | Smaller reporting company o |
(Do not check if a smaller reporting company) | |
Indicate by check mark whether the registrant is a shell company (as defined in Rule 12b-2 of the Act). Yes o No x.
The aggregate market value of the voting stock held by non-affiliates of the registrant on June 30, 2015 was approximately $258,266,000 based on the closing price of $13.75 as quoted by Nasdaq Capital Market on June 30, 2015.
The number of shares of Common Stock, no par value, outstanding on February 19, 2016 is 18,712,499 shares.
EXPLANATORY NOTES
Portions of the registrant’s Definitive Proxy Statement to be filed with the Securities and Exchange Commission no later than 120 days after the end of the Registrant’s fiscal year ended December 31, 2015, are incorporated by reference in Part III of this Annual Report on Form 10-K.
NATURE’S SUNSHINE PRODUCTS, INC.
FORM 10-K
For the Fiscal Year Ended December 31, 2015
Table of Contents
2
CAUTIONARY NOTE REGARDING FORWARD-LOOKING STATEMENTS
Certain information included or incorporated herein by reference in this report may be deemed to be “forward-looking statements” within the meaning of the Private Securities Litigation Reform Act of 1995. Forward-looking statements may include, but are not limited to, statements relating to the Company's objectives, plans and strategies. All statements (other than statements of historical fact) that address activities, events or developments that the Company intends, expects, projects, believes or anticipates will or may occur in the future are forward-looking statements. These statements are often characterized by terminology such as “believe,” “hope,” “may,” “anticipate,” “should,” “intend,” “plan,” “will,” “expect,” “estimate,” “project,” “positioned,” “strategy” and similar expressions, and are based on assumptions and assessments made by management in light of their experience and their perception of historical trends, current conditions, expected future developments and other factors they believe to be appropriate. For example, information appearing under “Management’s Discussion and Analysis of Financial Condition and Results of Operations” includes forward-looking statements. Forward-looking statements are not guarantees of future performance and are subject to risks and uncertainties. Important factors that could cause actual results, developments and business decisions to differ materially from forward-looking statements are more fully described in this report, including the risks set forth under “Risk Factors” in Item 1A, but include the following:
• | any negative consequences resulting from the economy, including the availability of liquidity to the Company, its independent distributors and its suppliers or the willingness of its customers to purchase products; |
• | its relationship with, and its inability to influence the actions of, its independent distributors, and other third parties with whom it does business; |
• | improper activity by its employees or independent distributors; |
• | negative publicity related to its products, ingredients, or direct selling organization and the nutritional supplement industry; |
• | changing consumer preferences and demands; |
• | its reliance upon, or the loss or departure of any member of, its senior management team which could negatively impact its distributor relations and operating results; |
• | increased state and federal regulatory scrutiny of the nutritional supplement industry, including, but not limited to targeting of ingredients, testing methodology and product claims; |
• | the competitive nature of its business and the nutritional supplement industry; |
• | regulatory matters governing its products, ingredients, the nutritional supplement industry, its direct selling program, or the direct selling market in which it operates; |
• | legal challenges to its direct selling program or to the classification of its independent distributors; |
• | risks associated with operating internationally and the effect of economic factors, including foreign exchange, inflation, disruptions or conflicts with the its third party importers, governmental sanctions, ongoing Ukraine and Russia political conflict, pricing and currency devaluation risks, especially in countries such as Ukraine, Russia and Belarus; |
• | uncertainties relating to the application of transfer pricing, duties, value-added taxes, and other tax regulations, and changes thereto; |
• | its dependence on increased penetration of existing markets; |
• | cyber security threats and exposure to data loss; |
• | its reliance on its information technology infrastructure; |
• | the sufficiency of trademarks and other intellectual property rights; |
• | changes in tax laws, treaties or regulations, or their interpretation; |
• | taxation relating to its independent distributors; |
• | product liability claims; |
• | the full implementation of its joint venture for operations in China with Fosun Industrial Co., Ltd., as well as the legal complexities, unique regulatory environment and challenges of doing business in China generally; |
• | its inability to register products for sale in Mainland China; |
• | managing rapid growth in China; and |
• | the slowing of the Chinese economy and/or the devaluation of the Chinese Renminbi. |
All forward-looking statements speak only as of the date of this report and are expressly qualified in their entirety by the cautionary statements included in or incorporated by reference into this report. Except as is required by law, the Company expressly disclaims any obligation to publicly release any revisions to forward-looking statements to reflect events after the date of this report. Throughout this report, it refers to Nature’s Sunshine Products, Inc., together with its subsidiaries, as “we,” “us,” “our Company” or “the Company.”
3
PART 1
Item 1. Business
The Company
Nature’s Sunshine Products, Inc., together with its subsidiaries (hereinafter referred to collectively as the “Company”), is a natural health and wellness company primarily engaged in the manufacturing and direct selling of nutritional and personal care products. The Company is a Utah corporation with its principal place of business in Lehi, Utah, and sells its products to a sales force of independent distributors who uses the products themselves or resells them to consumers. The formulation, manufacturing, packaging, labeling, advertising, distribution and sale of each of the Company’s major product groups are subject to regulation by one or more governmental agencies.
Business Segments
The Company has four business segments that are divided based on the different characteristics of their distributor bases, selling and distributor compensation plans and product formulations, as well as the internal organization of its officers and their responsibilities and business operations. Three business segments operate under the Nature’s Sunshine Products brand (NSP Americas; NSP Russia, Central and Eastern Europe; and China and New Markets). The Company’s China and New Markets segment is deploying a multi-channel go-to-market strategy that offers select Nature’s Sunshine branded products through a direct selling model across China as well as through e-commerce channels. The time to market will be dependent upon regulatory processes including product registration and permit approvals. Due to a change in the Chinese regulatory environment, the Company has indefinitely deferred its entry into the retail channel in China. The China and New Markets segment also includes the Company’s wholesale business, in which the Company sells its products to various locally managed entities independent of the Company that have distribution rights for the relevant market. All of the net sales revenue to date in the China and New Markets segment is through the Company’s wholesale business to foreign markets outside of China detailed below. The wholesale business was previously part of NSP Americas. The fourth business segment operates under the Synergy® WorldWide brand.
The Company markets its products in Australia, Austria, Belarus, Canada, Colombia, Costa Rica, the Czech Republic, Denmark, the Dominican Republic, Ecuador, El Salvador, Finland, Germany, Guatemala, Honduras, Hong Kong, Iceland, Indonesia, Ireland, Italy, Japan, Kazakhstan, Latvia, Lithuania, Malaysia, Mexico, Moldova, Mongolia, the Netherlands, New Zealand, Nicaragua, Norway, Panama, the Philippines, Poland, Russia, Singapore, Slovenia, South Korea, Spain, Sweden, Taiwan, Thailand, Ukraine, the United Kingdom, and the United States. The Company markets its products through a wholesale model to Argentina, Australia, Chile, Israel, New Zealand, Norway, Peru and the United Kingdom.
Product Categories
The Company’s line of over 700 products includes several different product classifications, such as immune, cardiovascular, digestive, personal care, weight management and other general health products. It purchases herbs and other raw materials in bulk and, after rigorous quality control testing, it formulates, encapsulates, tablets or concentrates them, labels and packages them for shipment. Most of its products are manufactured at its facility in Spanish Fork, Utah. Contract manufacturers produce some of the Company's products in accordance with its exacting specifications and standards. The Company has implemented stringent quality control procedures to verify that its contract manufacturers have complied with its specifications and standards.
Presented below are the U.S. dollar amounts and associated revenue percentages from the sale of general health, immune, cardiovascular, digestive, personal care and weight management products for the years ended December 31, 2015, 2014, and 2013, by business segment. This table should be read in conjunction with the information presented in the section entitled “Management’s Discussion and Analysis of Financial Condition and Results of Operations,” which discusses the factors impacting revenue trends and the costs associated with generating the aggregate revenue presented (in thousands).
4
Year Ended December 31, | 2015 | 2014 | 2013 | ||||||||||||||||||
NSP Americas: | |||||||||||||||||||||
General health | $ | 80,315 | 44.8 | % | $ | 78,218 | 42.9 | % | $ | 80,379 | 42.2 | % | |||||||||
Immune | 22,042 | 12.3 | 23,549 | 12.9 | 23,374 | 12.3 | |||||||||||||||
Cardiovascular | 12,331 | 6.9 | 12,566 | 6.9 | 13,018 | 6.8 | |||||||||||||||
Digestive | 49,239 | 27.5 | 53,133 | 29.1 | 55,936 | 29.3 | |||||||||||||||
Personal care | 3,575 | 2.0 | 4,000 | 2.2 | 5,162 | 2.7 | |||||||||||||||
Weight management | 11,649 | 6.5 | 10,929 | 6.0 | 12,815 | 6.7 | |||||||||||||||
Total NSP Americas | 179,151 | 100.0 | 182,395 | 100.0 | 190,684 | 100.0 | |||||||||||||||
NSP Russia, Central and Eastern Europe: | |||||||||||||||||||||
General health | $ | 11,433 | 41.7 | % | $ | 18,841 | 37.5 | % | $ | 22,690 | 36.2 | % | |||||||||
Immune | 3,328 | 12.1 | 6,512 | 13.0 | 7,902 | 12.6 | |||||||||||||||
Cardiovascular | 1,714 | 6.3 | 3,104 | 6.2 | 4,324 | 6.9 | |||||||||||||||
Digestive | 7,167 | 26.1 | 13,171 | 26.2 | 15,693 | 25.0 | |||||||||||||||
Personal care | 2,716 | 9.9 | 6,073 | 12.1 | 8,817 | 14.1 | |||||||||||||||
Weight management | 1,050 | 3.8 | 2,573 | 5.1 | 3,321 | 5.3 | |||||||||||||||
Total NSP Russia, Central and Eastern Europe | 27,408 | 100.0 | 50,274 | 100.0 | 62,747 | 100.0 | |||||||||||||||
Synergy WorldWide: | |||||||||||||||||||||
General health | $ | 43,829 | 38.4 | % | $ | 46,546 | 36.3 | % | $ | 36,723 | 33.9 | % | |||||||||
Immune | 752 | 0.7 | 974 | 0.8 | 1,394 | 1.3 | |||||||||||||||
Cardiovascular | 34,191 | 30.0 | 42,449 | 33.1 | 42,154 | 38.9 | |||||||||||||||
Digestive | 17,746 | 15.6 | 20,839 | 16.3 | 16,897 | 15.6 | |||||||||||||||
Personal care | 5,697 | 5.0 | 7,196 | 5.6 | 7,097 | 6.6 | |||||||||||||||
Weight management | 11,866 | 10.4 | 10,097 | 7.9 | 4,025 | 3.7 | |||||||||||||||
Total Synergy WorldWide | 114,081 | 100.0 | 128,101 | 100.0 | 108,290 | 100.0 | |||||||||||||||
China and New Markets: | |||||||||||||||||||||
General health | $ | 1,903 | 46.8 | % | $ | 2,370 | 42.3 | % | $ | 3,259 | 40.2 | % | |||||||||
Immune | 525 | 12.9 | 777 | 13.9 | 1,006 | 12.4 | |||||||||||||||
Cardiovascular | 292 | 7.2 | 334 | 6.0 | 461 | 5.7 | |||||||||||||||
Digestive | 1,011 | 24.9 | 1,608 | 28.7 | 2,365 | 29.2 | |||||||||||||||
Personal care | 93 | 2.3 | 108 | 1.9 | 126 | 1.6 | |||||||||||||||
Weight management | 241 | 5.9 | 400 | 7.1 | 888 | 11.0 | |||||||||||||||
Total China and New Markets | 4,065 | 100.0 | 5,597 | 100.0 | 8,105 | 100.0 | |||||||||||||||
Consolidated: | |||||||||||||||||||||
General health | $ | 137,480 | 42.3 | % | $ | 145,975 | 39.8 | % | $ | 143,051 | 38.7 | % | |||||||||
Immune | 26,647 | 8.2 | 31,812 | 8.7 | 33,676 | 9.1 | |||||||||||||||
Cardiovascular | 48,528 | 14.9 | 58,453 | 16.0 | 59,957 | 16.2 | |||||||||||||||
Digestive | 75,163 | 23.1 | 88,751 | 24.2 | 90,891 | 24.6 | |||||||||||||||
Personal care | 12,081 | 3.7 | 17,377 | 4.7 | 21,202 | 5.7 | |||||||||||||||
Weight management | 24,806 | 7.6 | 23,999 | 6.6 | 21,049 | 5.7 | |||||||||||||||
Total Consolidated | $ | 324,705 | 100.0 | $ | 366,367 | 100.0 | $ | 369,826 | 100.0 | ||||||||||||
5
The following table summarizes the Company's product lines by category:
Category | Description | Selected Representative Products | ||
General health | The Company distributes a wide selection of general health products. The general health line is a combination of assorted health products related to blood sugar support, bone health, cellular health, cognitive function, joint health, mood, sexual health, sleep, sports and energy, and vision. | NSP Americas; NSP Russia, Central and Eastern Europe; China and New Markets: Anxiouslesstm, CurcuminBP, Everflex®, Ionic Minerals, Mind-Max, Nutri-Calm®, Perfect Eyes®, Skeletal Strength®, Super Supplemental Vitamin and Mineral, Super Trio, Tai-Go®, Vitamin B-Complex, Vitamin D3 Synergy WorldWide: Core Greens®, Mistica®, Noni Plus, NutriBurst, Spirulina | ||
Immune | The Company distributes immune products. The immune line has been designed to offer products that support and strengthen the human immune system. | NSP Americas; NSP Russia, Central and Eastern Europe; China and New Markets: Elderberry D3fense, HistaBlock®, Immune Stimulator, Silver Shield, VS-C® Synergy WorldWide: BodyGuard, Colostrum | ||
Cardiovascular | The Company distributes cardiovascular products. The cardiovascular line has been designed to offer products that combine a variety of superior heart health ingredients to give the cardiovascular system optimum support. | NSP Americas; NSP Russia, Central and Eastern Europe; China and New Markets: CardioxLDL, Blood Pressurex, Co-Q10, Flax Seed Oil, Mega-Chel®, Red Yeast Rice, Super Omega-3 EPA Synergy WorldWide: E-9, ProArgi-9 Plus® | ||
Digestive | The Company distributes digestive products. The digestive line has been designed to offer products that regulate intestinal and digestive functions in support of the human digestive system. | NSP Americas; NSP Russia, Central and Eastern Europe; China and New Markets: Bifidophilus Flora Force®, CleanStart®, Food Enzymes, LBS II®, Liquid Chlorophyll, Proactazyme®, Probiotic Eleven® Synergy WorldWide: Detox Plus, Liquid Chlorophyll | ||
Personal care | The Company distributes a variety of personal care products for external use, including oils and lotions, aloe vera gel, herbal shampoo, herbal skin treatment, toothpaste and skin cleanser. | NSP Americas; NSP Russia, Central and Eastern Europe; China and New Markets: EverFlex® Cream , HSN-W®, Pau-D Arco Lotion, Pro-G Yam® Cream, Tei-Fu® Lotion, Vari-Gone® Synergy WorldWide: Bright Renewal Serum, Hydrating Toner, 5 in 1 Shampoo, Repair Complex | ||
Weight management | The Company distributes a variety of weight management products. The weight management line has been designed to simplify the weight management process by providing healthy meal replacements and products that increase caloric burn rate. | NSP Americas; NSP Russia, Central and Eastern Europe; China and New Markets: Fat Grabbers®, Garcinia Combination, Love and Peas, Nature’s Harvest, Nutri-Burn®, SmartMeal, Stixated™, Ultra Therm™ Synergy WorldWide: Double Burn, SLMSmart™ | ||
Distribution and Selling
The Company’s independent distributors, known as Managers and Distributors, market its products to customers through direct selling techniques, as well as sponsoring other independent distributors. The Company seeks to motivate and provide
6
incentives to its independent distributors by offering high quality products and providing its independent distributors with product support, training seminars, sales conventions, travel programs and financial incentives.
The Company’s products sold in the United States are shipped directly from its manufacturing and warehouse facilities located in Spanish Fork, Utah, as well as from its regional warehouses located in Georgia, Ohio and Texas. Many of the Company's international operations maintain warehouse facilities with inventory to supply their independent Managers, Distributors and customers. However, in foreign markets where it does not maintain warehouse facilities, it has contracted with third-parties to distribute its products and provide support services to its independent sales force of independent Managers and Distributors.
As of December 31, 2015, the Company had approximately 264,400 "active independent Distributors and customers" (as defined below). A person who joins the Company’s independent sales force begins as an independent distributor. Many independent distributors sell the Company’s products on a part-time basis to friends or associates or use the products themselves. An independent distributor may earn Manager status by attaining certain product sales levels. As of December 31, 2015, the Company had approximately 12,700 "active independent Managers" (as defined below) worldwide. In many of the Company's markets, its independent Managers and Distributors are primarily retailers of the Company's products, including practitioners, proprietors of retail stores and other health and wellness specialists.
In the United States, the Company generally sells its products on a cash or credit card basis. From time to time, the Company's U.S. operations extend short-term credit associated with product promotions. For certain of its international operations, the Company uses independent distribution centers and offers credit terms that are generally consistent with industry standards within each respective country.
The Company pays sales commissions, or “volume incentives” to its independent Managers and Distributors based upon their own product sales and the product sales of their sales organization. These volume incentives are recorded as an expense in the year earned. The amounts of volume incentives that the Company expensed during the years ended December 31, 2015, 2014, and 2013, are set forth in the Company's Consolidated Financial Statements in Item 8 of this report. In addition to the opportunity to receive volume incentives, independent Managers who attain certain levels of monthly product sales are eligible for additional incentive programs including automobile allowances, sales convention privileges and travel awards.
Distributor Information
The Company’s revenue is highly dependent upon the number and productivity of its independent Managers and Distributors. Growth in sales volume requires an increase in the productivity and/or growth in the total number of independent Managers and Distributors.
Within the Company, there are a number of different distributor compensation plans and qualifications, which generate active independent Managers and Distributors with different sales values in its different business segments. The declines in active independent Managers and Distributors within the NSP Americas and NSP Russia, Central and Eastern Europe segments have resulted in declines in overall sales revenues. Within Synergy WorldWide, the sales qualifications required for active independent Managers and Distributors varies by market according to local economic factors. As sales grow in markets with higher qualification values, and decline in those with lower qualification values, the resultant mix change influences the active independent Manager and Distributor counts. As a result, from time-to-time, changes in overall active independent Manager and Distributor counts may not be indicative of actual sales trends for the segment.
Due to the size of NSP Peru and United Kingdom markets, lack of net sales growth, and continuing operating losses, the Company made the decision to transition these markets to wholesale markets, in which it sells its products to a locally managed entity independent of the Company that has distribution rights for the market, effective December 30, 2014 and April 1, 2014, respectively. Manager, Distributor and customer totals for Peru and the United Kingdom are included in the table below in the China and New Markets segment for the years prior to their conversion to wholesale markets. There are no Managers, Distributors, and customers in the China and New Markets segment as the wholesale business accounts for all of the segment’s sales to date.
The following table provides information concerning the number of total independent Managers, Distributors and customers by segment, as of the dates indicated.
7
Total Managers, Distributors and Customers by Segment as of December 31,
2015 | 2014 | 2013 | ||||||||||||||||
Distributors & Customers | Managers | Distributors & Customers | Managers | Distributors & Customers | Managers | |||||||||||||
NSP Americas | 286,600 | 6,500 | 296,900 | 6,600 | 312,900 | 7,300 | ||||||||||||
NSP Russia, Central and Eastern Europe | 163,200 | 2,800 | 231,400 | 3,700 | 260,200 | 6,000 | ||||||||||||
Synergy WorldWide | 126,400 | 3,400 | 122,300 | 3,100 | 118,500 | 3,000 | ||||||||||||
China and New Markets | — | — | — | — | 9,300 | 100 | ||||||||||||
Total | 576,200 | 12,700 | 650,600 | 13,400 | 700,900 | 16,400 | ||||||||||||
“Total Managers” includes independent Managers under the Company’s various compensation plans that have achieved and maintained specified and personal groups sale volumes as of the date indicated. To maintain Manager status, an individual must continue to meet certain product sales volume levels. As such, all Managers are considered to be “Active Managers”.
“Total Distributors and customers” includes the Company’s independent Distributors and customers who have purchased products directly from the Company for resale and/or personal consumption during the previous twelve months ended as of the date indicated. This includes independent Manager, Distributor and customer accounts that may have become inactive since such respective dates.
The following table provides information concerning the number of active independent Managers and active independent Distributors and customers by segment, as of the dates indicated.
Active Distributors and Customers by Segment as of December 31,
2015 | 2014 | 2013 | ||||||||||||||||
Distributors & Customers | Managers | Distributors & Customers | Managers | Distributors & Customers | Managers | |||||||||||||
NSP Americas | 131,600 | 6,500 | 135,900 | 6,600 | 144,500 | 7,300 | ||||||||||||
NSP Russia, Central and Eastern Europe | 72,000 | 2,800 | 97,900 | 3,700 | 131,800 | 6,000 | ||||||||||||
Synergy WorldWide | 60,800 | 3,400 | 58,800 | 3,100 | 51,800 | 3,000 | ||||||||||||
China and New Markets | — | — | — | — | 4,300 | 100 | ||||||||||||
Total | 264,400 | 12,700 | 292,600 | 13,400 | 332,400 | 16,400 | ||||||||||||
“Active Distributors and customers” includes the Company’s independent Distributors and customers who have purchased products directly from the Company for resale and/or personal consumption during the previous three months ended as of the date indicated.
The following tables provide information concerning the number of new independent Managers, Distributors and customers by segment, as of the dates indicated.
New Managers, Distributors and Customers by Segment for the year ended December 31,
2015 | 2014 | 2013 | ||||||||||||||||
Distributors & Customers | Managers | Distributors & Customers | Managers | Distributors & Customers | Managers | |||||||||||||
NSP Americas | 127,900 | 3,000 | 130,300 | 3,200 | 137,100 | 3,100 | ||||||||||||
NSP Russia, Central and Eastern Europe | 47,000 | 700 | 66,400 | 1,200 | 89,300 | 1,600 | ||||||||||||
Synergy WorldWide | 76,600 | 2,300 | 73,500 | 2,200 | 71,800 | 1,900 | ||||||||||||
China and New Markets | — | — | 1,600 | — | 6,800 | 100 | ||||||||||||
Total | 251,500 | 6,000 | 271,800 | 6,600 | 305,000 | 6,700 | ||||||||||||
8
“New Managers” includes independent Managers under the Company’s various compensation plans that first achieved the rank of Manager during the previous twelve months ended as of the date indicated.
“New Distributors and Customers” include the Company’s independent Distributors and customers who have made their initial product purchase directly from the Company for resale and/or personal consumption during the previous twelve months ended as of the date indicated.
Source and Availability of Raw Materials
Raw materials used in the manufacture of the Company's products are generally available from a number of suppliers. To date, the Company has not experienced any major difficulty in obtaining and maintaining adequate sources of raw materials supply. The Company attempts to ensure the availability of many of its raw materials by contracting, in advance, for its annual requirements. In the past, it has been able to find alternative sources of raw materials when needed. Although there can be no assurance that it will be successful in locating such sources of supply in the future, the Company believes that it will be able to do so.
Trademarks and Trade Names
The Company has obtained trademark registrations for Nature’s Sunshine®, and the landscape logo for all of its Nature’s Sunshine Products product lines. It has also obtained trademark registrations for Synergy Worldwide® for all of the Company's Synergy WorldWide product lines. The Company holds trademark registrations in the United States and in many other countries. The Company's customers’ recognition and association of its brands and trademarks with quality is an important element of its operating strategy.
Seasonality
The Company operates in many regions around the world and, as a result, is affected by seasonal factors and trends such as weather changes, holidays and cultural traditions and vacation patterns throughout the world. For instance, in North America and Europe the Company typically experiences a decrease in activity during the third quarter due to the summer vacation season, while it experiences a decrease in activity in many of its Asia Pacific markets during the first quarter due to cultural events such as the Lunar New Year. As a result, there is some seasonality to the Company's revenues and expenses reflected in its reported quarterly results. Generally, reductions in one region of the world due to seasonality are offset by increases in another, minimizing the impact on the Company's reported consolidated revenues. Changes in the relative size of the Company's revenues in one region of the world compared to another could cause seasonality to more significantly affect the Company's reported quarterly results.
Inventories
In order to provide a high level of product availability to the Company's independent Managers, Distributors, and customers, it maintains a considerable inventory of raw materials in the United States and of finished goods in most countries in which it sells its products. Due to different regulatory requirements across the countries in which the Company sells its products, its finished goods inventories have product labels and sometimes product formulations specific for each country. The Company's inventories are subject to obsolescence due to finite shelf lives.
Dependence upon Customers
As a result of the Company's business model, it is not dependent upon a single Manager, Distributor or customer, the loss of which would not have a material adverse effect on its business.
Backlog
The Company typically ships orders for its products within 24 hours after receipt of payment. As a result, it has not historically experienced significant backlogs due to its high level of product availability as discussed above.
Competition
The Company's products are sold in competition with other companies, some of which have greater sales volumes and financial resources than the Company does, and sell brands that are, through advertising and promotions, better known to consumers. The Company competes in the nutritional and personal care industry against companies that sell through retail
9
stores, as well as against other direct selling companies. For example, it competes against manufacturers and retailers of nutritional and personal care products, which are distributed through supermarkets, drug stores, health food stores, vitamin outlets, discount stores, and mass market retailers, among others. It competes for product sales and managers and distributors with many other direct selling companies, including Amway, Herbalife, Pharmanex (NuSkin), Shaklee and USANA, among others. The Company believes that the principal components of competition in the direct selling of nutritional and personal care products are distributor expertise and service, product quality and differentiation, price and brand recognition. In addition, the Company relies on its independent Managers and Distributors to compete effectively in the direct selling markets, and its ability to attract and retain independent Managers and Distributors depends on various factors, including the recruitment, training, travel and financial incentives for the independent Managers and Distributors.
Research and Development
The Company conducts research and development activities at its manufacturing facility located in Spanish Fork, Utah. During 2015, the Company opened the Hughes Center for Research and Innovation, a new state of the art research and development facility at its corporate offices in Lehi, Utah, which will further advance the Company's research of innovative products. The Company's principal emphasis in its research and development activities is the development of new products and the enhancement of existing products. The amount, excluding capital expenditures, spent on research and development activities was approximately $2.8 million in 2015, $2.5 million in 2014 and $2.0 million in 2013.
Compliance with Environmental Laws and Regulations
The nature of the Company's business has not required any material capital expenditures to comply with federal, state or local provisions enacted or adopted regulating the discharge of materials into the environment. No material capital expenditures to meet such provisions are anticipated. Such regulatory provisions have not had any material effect upon the Company's results of operations or competitive position.
Regulation
General
In both United States and foreign markets, the Company is affected by extensive laws, governmental regulations, administrative determinations and guidance, court decisions and similar constraints (collectively “Regulations”). Such Regulations exist at the federal, state or local levels in the United States and at all levels of government in foreign jurisdictions, including Regulations pertaining to: (1) the formulation, manufacturing, packaging, labeling, distribution, importation, sale and storage of its products; (2) product claims and advertising, including direct claims and advertising by the Company, as well as claims and advertising by independent Distributors, for which the Company may be held responsible; (3) the Company's direct selling program; (4) transfer pricing and similar regulations that affect the level of U.S. and foreign taxable income and customs duties; (5) taxation of its independent Distributors (which in some instances may impose an obligation on the Company to collect the taxes and maintain appropriate records); and (6) currency exchange and repatriation.
Products
The formulation, manufacturing, packaging, labeling, advertising, distribution and sale of each of the Company's major product groups are subject to regulation by one or more governmental agencies in the United States and in other countries. The most active of these is the United States Food and Drug Administration (“FDA”), which regulates the Company's products under the Federal Food, Drug and Cosmetic Act, as amended and the regulations promulgated thereunder (“FDCA”). The FDCA defines the terms “food” and “dietary supplement” and sets forth various conditions that, unless complied with, may constitute adulteration or misbranding of such products. The FDCA has been adjusted several times with respect to dietary supplements, most recently by the Nutrition Labeling and Education Act of 1990 (“NLEA”) and the Dietary Supplement Health and Education Act of 1994, as amended, and the regulations promulgated thereunder (“DSHEA”).
FDA regulations relating specifically to foods and dietary supplements for human use are set forth in Title 21 of the Code of Federal Regulations. These regulations include basic labeling requirements for both foods and dietary supplements. Additionally, FDA regulations require the Company to meet relevant good manufacturing practice regulations for the preparation, packaging and storage of its food and dietary supplements.
FDA rules impose requirements on the manufacture, packaging, labeling, holding, and distribution of dietary supplement products. For example, it requires that companies establish written procedures governing areas such as: (1) personnel, (2) plant and equipment cleanliness, (3) production controls, (4) laboratory operations, (5) packaging and labeling, (6) distribution,
10
(7) product returns, and (8) complaint handling. The FDA also requires identity testing of all incoming dietary ingredients unless a company successfully petitions for an exemption from this testing requirement in accordance with the regulations. The current good manufacturing practices are designed to ensure that dietary supplements and dietary ingredients are not adulterated with contaminants or impurities, and are labeled to accurately reflect the active ingredients and other ingredients in the products.
In some countries, regulations applicable to the activities of the Company's independent Managers and Distributors also may affect its business because in some countries the Company is, or regulators may assert that the Company is, responsible for its independent Distributors’ conduct. In these countries, regulators may request or require that the Company take steps to ensure that its independent Distributors comply with regulations. The types of regulated conduct include: (1) representations concerning the Company's products; (2) income representations made by the Company and/or its independent Distributors; (3) public media advertisements, which in foreign markets may require prior approval by regulators; (4) sales of products in markets in which the products have not been approved, licensed or certified for sale; and (5) classification by government agencies of the Company's independent Managers and Distributors as employees of the Company.
In some markets, it is possible that improper product claims by independent Managers and Distributors could result in the Company's products being reviewed by regulatory authorities and, as a result, being classified or placed into another category as to which stricter regulations are applicable. In addition, the Company might be required to make labeling changes.
The Company is unable to predict the nature of any future regulations, nor can it predict what effect additional governmental regulations or administrative orders, when and if promulgated, would have on its business in the future. They could, however, require: (1) the reformulation of some products not capable of being reformulated; (2) imposition of additional record keeping requirements; (3) expanded documentation of the properties of some products; (4) expanded or different labeling; (5) additional scientific substantiation regarding product ingredients, safety or usefulness; and/or (6) additional distributor compliance surveillance and enforcement action by the Company. Any or all of these requirements could have a material adverse effect on the Company's results of operations and financial condition.
In foreign markets, prior to commencing operations and prior to making or permitting sales of the Company's products in the market, the Company may be required to obtain an approval, license or certification from the country’s ministry of health or comparable agency. Prior to entering a new market in which a formal approval, license or certificate is required, the Company works extensively with local authorities in order to obtain the requisite approvals. It must also comply with product labeling and packaging regulations that vary from country to country. Its failure to comply with these regulations can result in a product being removed from sale in a particular market, either temporarily or permanently.
In 2014, the Company passed several audits performed by the United States National Sanitation Foundation and independent auditors; as well as the Utah Department of Agriculture. Both entities noted that the Company continues to be in the top tier of companies with regard to compliance against GMP (Good Manufacturing Standards) requirements.
Direct Selling
The Company's business practices and products are also regulated by the following United States governmental entities: the Federal Trade Commission (“FTC”), Consumer Product Safety Commission (“CPSC”), Department of Agriculture (“USDA”) and Environmental Protection Agency (“EPA”). The Company's activities, including its direct selling distribution activities, are also regulated by various agencies of the states, localities and foreign countries in which its products are sold.
The FTC, which exercises jurisdiction over the advertising of all of the Company's products in the United States, has in the past several years instituted enforcement actions against several dietary supplement and food companies and against manufacturers of weight loss products generally for false and misleading advertising of some of their products. In addition, the FTC has increased its scrutiny of the use of testimonials, which it also utilizes, as well as the role of expert endorsers and product clinical studies. The Company cannot be sure that the FTC, or comparable foreign agencies, will not question its advertising or other operations in the future. It is unclear whether the FTC will subject the Company's advertisements to increased surveillance to ensure compliance with the principles set forth in its published advertising guidance.
Transfer Pricing
In many countries, including the United States, the Company is subject to transfer pricing and other tax regulations designed to ensure that appropriate levels of income are reported as earned by its U.S. or local entities and are taxed accordingly. In addition, the Company's operations are subject to regulations designed to ensure that appropriate levels of customs duties are assessed on the importation of its products.
11
Although the Company believes that it is in substantial compliance with all applicable regulations and restrictions, it is subject to the risk that governmental authorities could audit its transfer pricing and related practices and assert that additional taxes are owed.
In the event that the audits or assessments are concluded adversely to the Company, it may or may not be able to offset or mitigate the consolidated effect of foreign income tax assessments through the use of U.S. foreign tax credits. Because the laws and regulations governing U.S. foreign tax credits are complex and subject to periodic legislative amendment, the Company cannot be sure that it would in fact be able to take advantage of any foreign tax credits in the future.
Other Regulations
The Company is also subject to a variety of other regulations in various foreign markets, including regulations pertaining to social security assessments, employment and severance pay requirements, import/export regulations and antitrust issues. As an example, in many markets, the Company is substantially restricted in the amount and types of rules and termination criteria that it can impose on independent Distributors without having to pay social security assessments on behalf of the independent Distributors and without incurring severance obligations to terminated independent Distributors. In some countries, the Company may be subject to these obligations in any event.
The Company's failure to comply with these regulations could have a material adverse effect on its business in a particular market or in general. Assertions that the Company failed to comply with regulations or the effect of adverse regulations in one market could adversely affect it in other markets as well, by causing increased regulatory scrutiny in those other markets or as a result of the negative publicity generated in those other markets.
Compliance
In order to comply with regulations that apply to both the Company and its independent Distributors, the Company conducts considerable research into the applicable regulatory framework prior to entering any new market to identify all necessary licenses and approvals and applicable limitations on the Company's operations in that market. Typically, it conducts this research with the assistance of local legal counsel and other representatives. The Company devotes substantial resources to obtaining the necessary licenses and approvals and bringing its operations into compliance with the applicable limitations. It also researches laws applicable to independent Distributor operations and revises or alters its Distributor manuals and other training materials and programs to provide independent Distributors with guidelines for operating a business, selling and distributing its products and similar matters, as required by applicable regulations in each market. The Company is unable to monitor its independent Distributors effectively, however, to ensure that they refrain from distributing its products in countries where it has not commenced operations, and it does not devote significant resources to this type of monitoring.
In addition, regulations in existing and new markets often are ambiguous and subject to considerable interpretive and enforcement discretion by the responsible regulators. Moreover, even when the Company believes that it and its independent Distributors are initially in compliance with all applicable regulations, new regulations regularly are being added and the interpretation of existing regulations is subject to change. Further, the content and impact of regulations to which the Company is subject may be influenced by public attention directed at it, its products or its direct selling program, so that extensive adverse publicity about the Company's products or its direct selling program may result in increased regulatory scrutiny.
It is an ongoing part of the Company's business to anticipate and respond to new and changing regulations and to make corresponding changes in its operations to the extent practicable. Although the Company devotes considerable resources to maintaining its compliance with regulatory constraints in each of its markets, it cannot be sure that (1) it would be found to be in full compliance with applicable regulations in all of its markets at any given time or (2) the regulatory authorities in one or more markets will not assert, either retroactively or prospectively or both, that its operations are not in full compliance. These assertions or the effect of adverse regulations in one market could negatively affect the Company in other markets as well by causing increased regulatory scrutiny in those other markets or as a result of the negative publicity generated in those other markets. These assertions could have a material adverse effect on the Company in a particular market or in general. Furthermore, depending upon the severity of regulatory changes in a particular market and the changes in the Company's operations that would be necessitated to maintain compliance, these changes could result in the Company experiencing a material reduction in sales in the market or determining to exit the market altogether. In this event, the Company would attempt to devote the resources previously devoted to such market to a new market or markets or other existing markets. However, the Company cannot be sure that this transition would not have an adverse effect on its business and results of operations either in the short or long-term.
12
To further mitigate any compliance risk, a Compliance Committee of the Board of Directors (the "Compliance Committee") was created in 2014. The purpose of the Compliance Committee is to oversee the Company’s efforts with respect to operational compliance. “Operational Compliance” is defined by the Compliance Committee's charter to include: distributor compliance and direct selling best practices; employee compliance, including code of conduct and other mandated trainings; product and product distribution regulatory compliance, including adherence to FTC, FDA and other similar regulatory bodies’ mandates; and non-financial, whistleblower reports. For avoidance of doubt, "Operational Compliance" does not include adherence to the FCPA. The charter of the Compliance Committee requires that the Compliance Committee consist of at least three directors, one of whom must be the Chair of the Company’s Audit Committee, and that a majority of such members meet the independence and experience requirements of the NASDAQ Stock Market, Section 10A(m)(3) of the Securities Exchange Act of 1934 (the “Exchange Act”) and the rules and regulations of the Securities and Exchange Commission (“SEC”), as affirmatively determined by the Company’s Board. The Board may, at any time and in its complete discretion, replace a compliance committee member.
International Operations
A significant portion of the Company's net sales are generated within the United States, which represented 45.4 percent, 40.5 percent and 41.2 percent of net sales in 2015, 2014, and 2013, respectively. The Company's second largest market, South Korea, represented 14.9 percent, 14.8 percent and 9.2 percent of net sales in 2015, 2014, and 2013, respectively. Outside of the United States and South Korea, no one country accounted for 10.0 percent or more of net sales revenue in any year in the last three years. As the Company continues to grow its international business, its operating results will likely become more sensitive to economic and political conditions in foreign markets, as well as to foreign currency fluctuations. A breakdown of net sales revenue by region in 2015, 2014, and 2013, is set forth below.
(Dollar amounts in thousands) | |||||||||||||||||||||
Year Ended December 31, | 2015 | 2014 | 2013 | ||||||||||||||||||
Net Sales Revenue: | |||||||||||||||||||||
North America | $ | 171,486 | 52.8 | % | $ | 175,118 | 47.8 | % | $ | 179,919 | 48.6 | % | |||||||||
Europe | 53,237 | 16.4 | 83,048 | 22.7 | 98,299 | 26.6 | |||||||||||||||
Asia Pacific | 76,482 | 23.6 | 81,199 | 22.2 | 62,932 | 17.0 | |||||||||||||||
Central & South America | 23,500 | 7.2 | 27,002 | 7.4 | 28,676 | 7.8 | |||||||||||||||
$ | 324,705 | 100.0 | % | $ | 366,367 | 100.0 | % | $ | 369,826 | 100.0 | % | ||||||||||
The Company's international operations are conducted in a manner that it believe is comparable with its U.S. operations; however, in order to conform to local variations, economic realities, market customs, consumer habits and regulatory environments, differences often exist in the products that the Company sells and in its distribution and selling programs.
The Company's international operations are subject to many of the same risks faced by its U.S. operations, including competition and the strength of the local economy. In addition, its international operations are subject to certain risks inherent in doing business abroad, including foreign regulatory restrictions, fluctuations in monetary exchange rates, import-export controls, effective management and support services by contracted third-parties and the economic and political policies of foreign governments. The significance of these risks will increase as the Company grows its international operations.
The Company has international operations in Belarus, which is considered to be a highly inflationary economy. Also, in 2014, the Company ceased its operations in Venezuela due to the difficulties and uncertainties related to import controls, difficulties associated with repatriating cash and high inflation. See below for further discussion of the Company’s exit of the Venezuela market in Item 7, “Management’s Discussion and Analysis of Financial Condition and Results of Operations”.
13
Executive Officers
The Company’s executive officers, as of the date of this report, are as follows:
Name | Age | Position | Served in Position Since | |||
Gregory L. Probert | 59 | Chief Executive Officer and Chairman of the Board of Directors | 2013 | |||
Stephen M. Bunker | 57 | Executive Vice President, Chief Financial Officer and Treasurer | 2006 | |||
Richard D. Strulson | 47 | Executive Vice President, General Counsel, Chief Compliance Officer, and Secretary | 2013 | |||
Paul E. Noack | 54 | President of China and New Markets | 2014 | |||
Susan M. Armstrong | 51 | Executive Vice President and Chief Operations Officer | 2014 | |||
Gregory L. Probert. Mr. Probert has served as the Company's Chief Executive Officer since October 1, 2013. He has served as the Chairman of the Company's Board of Directors since January 2013, and as Executive Vice Chairman since June 2011. Mr. Probert served as an independent consultant to the Company from September 2010 to June 2011. Mr. Probert previously served as Chairman of the Board and Chief Executive Officer of Penta Water Company from 2008 to 2010, which filed for bankruptcy protection in 2009. Mr. Probert was President and Chief Operating Officer of Herbalife International of America, Inc. from 2003 to 2008, and Chief Executive Officer of DMX Music from 2001 to 2003. Prior to that, he held various senior positions at The Walt Disney Company from 1988. He has been a member of the Board of Trustees of the California Science Museum since 2007. Mr. Probert received his B.A. from the University of Southern California in 1979.
Stephen M. Bunker. Mr. Bunker has served as the Company's Executive Vice President, Chief Financial Officer and Treasurer since March 27, 2006. Before joining the Company, Mr. Bunker worked for Geneva Steel Holdings Corporation, where he served as Vice President of Finance and Treasurer from 2001 to 2006 and as Corporate Controller from 1990 until 2001. Mr. Bunker is a Certified Public Accountant, and worked for Arthur Andersen for six years. Mr. Bunker received his B.A. in Accounting from Brigham Young University in 1983 and his Masters of Accountancy from Brigham Young University in 1984.
Richard D. Strulson. Mr. Strulson was appointed as the Company's Executive Vice President, General Counsel, Chief Compliance Officer and Secretary of the Company in November 2013. From 2004 to October 2013, Mr. Strulson held various Vice President positions at Herbalife International of America, Inc., one of the world's largest direct selling companies, including Senior Vice President, Chief Privacy Officer, and Counsel from 2007 to October 2013. From 1998 to 2004, he served in a variety of senior legal counsel positions for The Walt Disney Company and FOX Cable Networks, where he was responsible for negotiating media rights and licensing agreements. Prior to his internal legal counsel positions, Mr. Strulson was a corporate attorney in Los Angeles with Latham and Watkins from 1995 to 1998 and clerked for Chief Justice E. Norman Veasey of the Delaware Supreme Court from 1994 to 1995. Mr. Strulson received a Doctor of Jurisprudence and Masters of Business Administration from Duke University in 1994, and a B.A. in Foreign Affairs and Economics from the University of Virginia in 1990.
Paul E. Noack. Mr. Noack was appointed as the Company's President of China and New Markets in October 2014. Mr. Noack served as President of ViSalus, Inc., a direct selling health and wellness company from January 2012 to October 2014. Prior to his appointment as President of ViSalus, Inc. in 2012, Mr. Noack consulted with the ViSalus, Inc. board of directors and management team. From 2009 to 2010, Mr. Noack served in several director and senior executive roles at Penta Water Company, LLC, which filed for bankruptcy protection in 2009. Mr. Noack previously served in a variety of executive roles at Herbalife International of America, Inc., one of the world’s largest direct selling companies, including Managing Director of the Asia Pacific Region, as Chief Strategic Officer, and as Senior Vice President, Corporate Planning and Strategy. Mr. Noack received a B.A. in Accounting from St. Johns University in 1983.
Susan M. Armstrong. Ms. Armstrong has served as the Company's Chief Operations Officer since December 2014. Prior to her appointment as the Company's Chief Operations Officer, Ms. Armstrong served as Executive Vice President, Operations since joining the Company in March 2013. From June 2011 to March 2013, Ms. Armstrong served as Senior Vice President, Value Chain at Metagenics, a leading manufacturer and distributor of high quality dietary supplements and medical foods sold through health care practitioners in the U.S. and pharmacies abroad. From 2006 until 2011, Ms. Armstrong was Vice President, Global Supply Chain at Carl Zeiss Vision, a leader in ophthalmic lenses and eye care solutions. Ms. Armstrong received a Bachelor of Science degree in Chemistry from the University of Sheffield in the United Kingdom.
14
Employees
The Company employed 901 individuals as of December 31, 2015. The Company believes that its relations with its employees are satisfactory.
Available Information
The Company's principal executive office is located at 2500 West Executive Parkway, Suite 100, Lehi, Utah 84043. Its telephone number is (801) 341-7900 and its Internet website address is www.natr.com. The Company makes available free of charge on its website its Annual Reports on Form 10-K, its Quarterly Reports on Form 10-Q, its Current Reports on Form 8-K, and amendments to those reports, filed or furnished pursuant to Section 13(a) or Section 15(d) of the Securities Exchange Act of 1934, as amended (the “Exchange Act”) as soon as practicable after electronically filing these documents with, or furnish them to, the Securities and Exchange Commission (the “SEC”). The SEC also maintains an Internet website that contains reports, and other information regarding issuers that file electronically with the SEC at www.sec.gov. The Company also makes available free of charge on its website its Code of Conduct Policy and the charters of its Audit Committee, Governance Committee, Compensation Committee and Compliance Committee.
Item 1A. Risk Factors
You should carefully consider the following risks in evaluating the Company and its business. The risks described below are the risks that the Company currently believes are material to its business. However, additional risks not presently known to the Company, or risks that it currently believes are not material, may also impair its business operations. You should also refer to the other information set forth in this report, including the information set forth in “Business” and “Management’s Discussion and Analysis of Financial Condition and Results of Operations” as well as the Company's consolidated financial statements and the related notes. The Company's business prospects, financial condition or results of operations could be adversely affected by any of the following risks. If the Company is adversely affected by such risks, then the market price of its common stock could decline.
Changes in laws and regulations regarding direct selling may prohibit or restrict the Company's ability to sell its products in some markets.
Direct selling systems are subject to laws and regulations by various government agencies throughout the world. These laws and regulations are generally intended to prevent fraudulent or deceptive practices and to ensure that sales are made to consumers of the products, and that compensation, recognition and advancement within the selling organization are based upon sales of the products. Failure to comply with these laws and regulations could result in significant penalties. Violations could result from misconduct by an associate, ambiguity in statutes, changes or new laws and regulations affecting Nature Sunshine's business and court-related decisions. Furthermore, the Company may be restricted or prohibited from using direct selling plans in some foreign countries. In addition, changes in existing laws or additional regulations could make it difficult to register or sell the Company's products in the countries in which it operates. For example, in Peru, changes in local regulations restricted the Company's ability to sell a majority of its key products in this market through its traditional direct selling business model. In response to this change in regulations, in 2014, the Company transitioned this market to an export market, in which it sells its products to a locally managed entity independent of the Company that has distribution rights for the market.
The Company's products, business practices and manufacturing activities are subject to extensive government regulations and could be subject to additional laws and regulations.
The formulation, manufacturing, packaging, labeling, advertising, distribution and sales of each of the Company’s major product groups are subject to regulation by numerous domestic and foreign governmental agencies and authorities. In the U.S., these governmental agencies and authorities include the FDA, the FTC, the CPSC, the EPA, the USDA and state regulatory agencies. In September 2015, the New York Attorney General issued a cease and desist letter to the Company and many other national retailers, related to the sale of a common herbal supplement known as Devil’s Claw. In the letter, the New York Attorney General requested, among other things, that the Company provide certain information with respect to the Company’s manufacture and sale of Devil’s Claw products. Although the Company believes it is lawfully selling Devil’s Claw products, the letters that it and other retailers received, demonstrate a focus by the New York Attorney General and other states’ Attorneys General on the manufacture and sale of various dietary supplements. As a result of such focus, such states’ Attorneys General could seek to take actions against the Company or other industry participants or amend applicable regulations in their State.
Generally, each international market in which the Company operates has regulatory agencies similar to the regulatory agencies in the U.S. These markets have varied regulations which often require it to reformulate products for specific markets,
15
conform product labeling to market regulations and register or qualify products or obtain necessary approvals with the applicable governmental authorities in order to market its products in these markets. Failure to comply with the regulatory requirements of these various governmental agencies and authorities could result in enforcement actions including: cease and desist orders, injunctions, limits on advertising, consumer redress, divestitures of assets, rescission of contracts, or such other relief as may be deemed necessary. Violation of these regulations could result in substantial financial or other penalties. Any action against the Company could materially affect its ability to successfully market its products.
In the future, the Company may be subject to additional laws or regulations administered by the FDA or other federal, state, local or foreign regulatory authorities, the repeal or amendment of laws or regulations which it considers favorable and/or more stringent interpretations of current laws or regulations. The Company can neither predict the nature of such future laws, regulations, interpretations or applications, nor what effect additional governmental regulations or administrative orders, when and if promulgated, would have on its business. They could, however, require reformulation of certain products to meet new standards, recall or discontinuance of certain products not able to be reformulated, imposition of additional record-keeping requirements, expanded documentation of the properties of certain products, expanded or altered labeling and/or scientific substantiation. Any or all such requirements could increase the Company's costs of operating the business and have a material negative impact on the Company's financial position, results of operations or cash flows.
The FTC, which exercises jurisdiction over the advertising of all of the Company’s products in the United States, has in the past several years instituted enforcement actions against several dietary supplement and food companies and against manufacturers of weight loss products generally for false and misleading advertising of some of their products. In addition, the FTC has increased its scrutiny of the use of testimonials, as well as the role of expert endorsers and product clinical studies. The Company cannot be sure that the FTC, or comparable foreign agencies, will not question its advertising or other operations in the future. It is unclear whether the FTC will subject the Company’s advertisements to increased surveillance to ensure compliance with the principles set forth in its published advertising guidance.
The Company is subject to the U.S. Foreign Corrupt Practices Act (the “FCPA”), which prohibits U.S. companies and their intermediaries from making improper payments to foreign officials for the purpose of obtaining or retaining business, and the anti-bribery laws of other jurisdictions. A finding of FCPA noncompliance could subject the Company to, among other things, significant penalties and legal expenses, as well as reputational harm, which could have a material adverse effect on its business, financial condition and results of operations.
The Company’s failure to comply with these regulations could have a material adverse effect on its business in a particular market or in general. Assertions that the Company failed to comply with regulations or the effect of adverse regulations in one market could adversely affect it in other markets as well, by causing increased regulatory scrutiny in those other markets or as a result of the negative publicity generated in those other markets.
If the Company is unable to attract and retain distributors, its business could suffer.
As a direct selling company, the Company relies on its independent distributors to market and sell its products. Many independent distributors sell the Company's products on a part-time basis to friends or associates or use the products for themselves. The Company's independent distributors may terminate their service at any time, and, like most direct selling companies, the Company experiences high turnover among its independent distributors from year to year. As a result, the Company needs to retain existing independent distributors and continue to attract additional independent distributors in order to maintain and/or increase sales in the future.
Several factors affect the Company's ability to attract and retain independent distributors, including:
• | any adverse publicity regarding the Company, its products, its distribution channels or its competitors; |
• | on-going motivation of Company's independent distributors; |
• | the public’s perceptions about the value and efficacy of the Company's products; |
• | the public’s perceptions and acceptance of direct selling; |
• | general and economic business conditions; |
• | government regulations; |
16
• | changes to the Company's compensation arrangements, training and support for its independent distributors; and |
• | competition in recruiting and retaining independent distributors and/or market saturation. |
The Company cannot provide any assurance that its independent distributors will continue to maintain their current levels of productivity, or that it will be able to retain existing independent distributors, or attract additional independent distributors, in sufficient numbers to sustain future growth or to maintain present sales levels.
Difficult economic conditions could harm the Company's business.
Global economic conditions continue to be challenging. Consumer spending habits, including spending for the Company's products, are affected by, among other things, prevailing economic conditions, levels of employment, fuel prices, salaries and wages, the availability of consumer credit, consumer confidence and consumer perception of economic conditions. Economic slowdowns in the markets in which the Company does business may adversely affect consumer spending habits and demand for the Company's products, which may result in lower net sales of the Company's products in future periods. A prolonged global or regional economic downturn could have a material negative impact on the Company's financial position, results of operation or cash flows. For example, recent economic declines in Mainland China's stock market and other negative economic indicators have caused uncertainty regarding the potential for growth in Mainland China's economy. Continued declines in economic conditions in Mainland China could negatively impact the Company's business prospects in that market and in other markets globally.
Currency exchange rate fluctuations affect the Company's net revenue and net income.
In 2015, the Company recognized approximately 54.6 percent of its revenue in markets outside the United States, the majority of which was recognized in each market’s respective local currency. The Company purchases inventory primarily in the United States in U.S. dollars. In preparing its financial statements, the Company translates revenues and expenses in foreign countries from their local currencies into U.S. dollars using average exchange rates. Because a majority of its sales are in foreign countries, exchange rate fluctuations may have a significant effect on its sales and earnings. The Company reported net earnings have in the past been, and are likely to continue to be, significantly affected by fluctuations in currency exchange rates, with net sales revenue and earnings generally increasing with a weaker U.S. dollar and decreasing with a strengthening U.S. dollar. These fluctuations had a generally negative effect on the Company's revenue in the years ended December 31, 2015, 2014, and 2013. As the Company's operations grow in countries where foreign currency transactions are made, its operating results will increasingly be subject to the risks of exchange rate fluctuations, and it may not be able to accurately estimate the impact of these changes on the Company's future results of operations or financial condition.
Some of the markets in which the Company operates may become highly inflationary.
Inflation is another risk associated with the Company's international operations. For example, in 2010, prior to the discontinuation of the Company's operations in Venezuela, the Venezuela was designated as a highly inflationary economy under generally accepted accounting principles in the United States (“U.S. GAAP”). A country is considered to have a highly inflationary economy if, among other qualitative factors, it has a cumulative inflation rate of approximately 100% or more over a three-year period. The functional currency in a highly inflationary economy is the U.S. dollar. As a result, all gains and losses resulting from the re-measurement of the Company's financial statements and other transactional foreign exchange gains and losses were reflected in the Company's earnings, which resulted in volatility within the its earnings, rather than as a component of comprehensive income within shareholders’ equity. It could have a negative impact on the Company's results of operations if the economy of other countries in which the Company does business are designated as highly inflationary.
Some of the markets in which the Company operates have currency controls in place which may restrict the repatriation of cash.
The possibility that foreign governments may impose currency remittance restrictions is another risk faced by the Company's international operations. Due to the possibility of government restrictions on transfers of cash out of the country and control of exchange rates, the Company may not be able to repatriate cash at exchange rates beneficial to the Company, which could have a material adverse effect on its financial position, results of operations or cash flows. For example, in 2014, the Company discontinued its operations in Venezuela due to the difficulties and uncertainties related to import controls, difficulties associated with repatriating cash and high inflation.
17
Availability and integrity of raw materials could become compromised.
The Company acquires all of its raw materials for the manufacture of its products from third-party suppliers. If the Company was to lose a significant supplier and experience difficulties in finding or transitioning to an alternative supplier, the Company could experience shortages or product back orders, which could harm its business. There can be no assurance that suppliers will be able to provide the Company with the raw materials in the quantities and at the appropriate level of quality that it requests or at a price that it is willing to pay. The Company is also subject to the delays caused by any interruption in the production of these materials including weather, crop conditions, climate change, transportation interruptions and natural disasters or other catastrophic events.
Occasionally, the Company's suppliers have experienced production difficulties with respect to its products, including the delivery of materials or products that do not meet the Company's quality control standards. These quality problems have in the past resulted in, and in the future could result in, stock outages or shortages of the Company's products, and could harm its sales and create inventory write-offs for unusable product.
Geopolitical issues and conflicts could adversely affect the Company's business.
Because a substantial portion of the Company's business is conducted outside of the United States, its business is subject to global political issues and conflicts. If these conflicts or issues escalate, it could harm the Company's foreign operations. In addition, changes in and actions by governments in foreign markets could harm its business. For example, the Company has cautioned that it anticipates sales in its NSP Russia, Central and Eastern Europe segment to continue to be affected by the political unrest in Ukraine and Russia, possible sanctions in Russia and the impact of currency devaluation.
The Company's business is subject to the effects of adverse publicity and negative public perception.
The Company's ability to attract and retain independent distributors, as well as its ability to maintain or grow sales in the future, may be affected by adverse publicity or negative public perception with regard to its industry, its competition, its direct selling model, the quality or efficacy of nutritional product supplements and ingredients, and its business generally. There can be no assurance that the Company will not be subject to adverse publicity or negative public perception in the future or that it would not have an adverse or material negative impact on its financial position, results of operations or cash flows.
Taxation and transfer pricing affect the Company's operations.
As a U.S. company doing business in many international markets, the Company is subject to foreign tax and intercompany pricing laws, including those relating to the flow of funds between the parent Company and its subsidiaries. These pricing laws are designed to ensure that appropriate levels of income and expense are reported by its U.S. and foreign entities, and that they are taxed appropriately. Regulators in the United States and in foreign markets closely monitor the Company's corporate structures, intercompany transactions, and how it effectuates intercompany fund transfers. If regulators challenge the Company's corporate structures, transfer pricing methodologies or intercompany transfers, its operations may be harmed, and its effective tax rate may increase. The Company is eligible to receive foreign tax credits in the United States for certain foreign taxes actually paid abroad. In the event any audits or assessments are concluded adversely to the Company, it may not be able to offset the consolidated effect of foreign income tax assessments through the use of U.S. foreign tax credits. Because the laws and regulations governing U.S. foreign tax credits are complex and subject to periodic legislative amendment, the Company cannot be sure that it would in fact be able to take advantage of any foreign tax credits in the future. The various customs, exchange control and transfer pricing laws are continually changing, and are subject to the interpretation of governmental agencies.
The Company collects and remits value-added taxes and sales taxes in jurisdictions and states in which it has determined that nexus exists. Other states may claim, from time to time, that the Company has state-related activities constituting a sufficient nexus to require such collection.
Despite the Company's efforts to be aware of and to comply with such laws and changes to the interpretations thereof, there is a risk that it may not continue to operate in compliance with such laws. The Company may need to adjust its operating procedures in response to these interpretational changes, and such changes could have a material negative impact on its financial position, results of operation or cash flows.
18
The Company's business is subject to intellectual property risks.
Most of the Company's products are not protected by patents. Restrictive regulations governing the precise labeling of ingredients and percentages for nutritional supplements, the large number of manufacturers that produce products with many active ingredients in common and the rapid change and frequent reformulation of products generally make obtaining patent protection for the Company's products impractical. The Company has other intellectual property that it considers valuable, including trademarks for the Nature’s Sunshine Products name and logo as well as the Synergy WorldWide name. The Company's efforts to protect its intellectual property may be unsuccessful and third parties may assert claims against the Company for infringement of intellectual property rights, which could result in the Company being required to obtain costly licenses for such rights, to pay royalties or to terminate its manufacturing of infringing products, all of which could have a material negative impact on the Company's financial position, results of operations or cash flows.
Product liability claims could harm the Company's business.
As a manufacturer and distributor of products that are ingested, the Company faces an inherent risk of exposure to product liability claims in the event that, among other things, the use of its products is alleged to results in injury to consumers. The Company has historically had a very limited number of product liability claims or reports from individuals who have asserted that they have suffered adverse consequences as a result of using its products. The Company has established a wholly-owned captive insurance company to provide it with product liability insurance coverage, and has accrued a reserve that it believes is sufficient to cover probable and reasonably estimable liabilities related to product liability claims based upon the Company's history. Such reserve may prove to be insufficient if the outcome of a product liability claim against the Company is beyond our estimate of probable and reasonably estimable liabilities, which could have a material negative impact on the Company's business prospects, financial position, results of operations or cash flows.
Inventory obsolescence due to finite shelf lives could adversely affect the Company's business.
To provide a high level of product availability to its independent distributors and customers, the Company generally maintains a considerable inventory of raw materials in the United States and of finished goods in most countries in which it does business. The Company's inventories of both raw materials and finished goods have finite shelf lives. If the Company overestimates the demand for its products, the Company could experience significant write-downs of its inventory due to obsolescence. Such write-downs could have a material negative impact on the Company's financial position, results of operations or cash flows.
Cyber security risks and the failure to maintain the integrity of data could expose the Company to data loss, litigation and liability, and the Company's reputation could be significantly harmed.
The Company collects and retains large volumes of data from employees and independent distributors, including credit card numbers and other personally identifiable information, for business purposes, including for transactional and promotional purposes, and its various information technology systems enter, process, summarize and report such data. The integrity and protection of this data is critical to the Company's business. The Company is subject to significant security and privacy regulations, as well as requirements imposed by the credit card industry. Maintaining compliance with these evolving regulations and requirements could be difficult and may increase the Company's expenses. In addition, a penetrated or compromised data system or the intentional, inadvertent or negligent release or disclosure of data could result in theft, loss or fraudulent or unlawful use of company, employee, distributor or guest data which could harm the Company's reputation, disrupt its operations, or result in remedial and other costs, fines or lawsuits.
System failures could harm the Company's business.
Like many companies, the Company's business is highly dependent upon its information technology infrastructure (websites, accounting and manufacturing applications, and product and customer information databases) to manage effectively and efficiently the Company's operations, including order entry, customer billing, accurately tracking purchases and volume incentives and managing accounting, finance and manufacturing operations. The occurrences of natural disasters, security breaches or other unanticipated problems could result in interruptions in the Company's day-to-day operations that could adversely affect its business. A long-term failure or impairment of any of the Company's information systems could adversely affect its ability to conduct its day-to-day business.
Beginning in 2013, the Company began to significantly reinvest in information technology systems. Included within this plan is an Oracle ERP implementation program to provide the Company with a single integrated software solution that will
19
integrate the Company’s business process on a worldwide basis. The unsuccessful implementation or failure of this ERP program could disrupt or adversely affect the Company's operations.
The Company could incur obligations relating to the activities of its independent distributors and contracted third-parties.
The Company sells its products worldwide to a sales force of independent distributors who use the products themselves or resell them to customers. In addition, in certain foreign markets, the Company contracts with third-parties to distribute its product and provide support services to its independent distributors. Independent distributors and contracted third-parties are not employees and operate their own business separate and apart from the Company, and the Company may not be able to control aspects of their activities that may impact its business. If local laws and regulations or the interpretation of locals laws and regulations change and require the Company to treat its independent distributors as employees, or if its independent distributors are deemed by local regulatory authorities in one or more of the jurisdictions in which the Company operates to be its employees rather than independent contractors under existing laws and interpretations, the Company may be held responsible for a variety of obligations that are imposed upon employers relating to their employees, including employment related taxes and penalties. The Company's independent distributors also operate in jurisdictions where local legislation and governmental agencies require it to collect and remit taxes such as sales tax or value-added taxes. In addition, there is the possibility that some jurisdictions could seek to hold the Company responsible for false product claims or the actions of an independent distributor. If the Company were found to be responsible for any of these issues related to its independent distributors, it could have a material negative impact on the Company's financial position, results of operations or cash flows.
If the Company's independent distributors fail to comply with advertising laws, then its financial condition and operating results would be harmed.
The advertisement of the Company's products is subject to extensive regulations in most of the markets in which the Company does business, including the United States. The Company's independent distributors may fail to comply with such regulations governing the advertising of the Company's products. In the U.S., the Company's products are sold principally as dietary supplements and cosmetics and are subject to rigorous FDA regulations limiting the types of therapeutic claims that can be made relating to the products. The treatment or cure of disease, for example, is not a permitted claim for the Company's products. Despite the Company's efforts to train its independent distributors and its attempts to monitor its independent distributors’ marketing materials, the Company cannot ensure that all such materials comply with applicable regulations, including bans on therapeutic claims. If the Company's independent distributors fail to comply with these restrictions, then the Company and its independent distributors could be subjected to claims of false advertising, significant financial penalties, costly mandatory product recalls or relabeling requirements, any of which could harm the Company's financial condition and operating results.
Changes in key management could materially adversely affect the Company.
The Company believes its success depends in part on its ability to retain its executive officers, and to continue to attract additional qualified individuals to its management team. The Company has entered into employment agreements with each of its executive officers. The Company cannot guarantee the continued service of its key officers. The loss or limitation of any of its executive officers or the inability to attract additional qualified management personnel could have a material negative impact on the Company's financial position, results of operations or cash flows. The Company does not carry key man insurance on the lives of any of its executive officers.
The Company's business is involved in an industry with intense competition.
The Company operates in an industry with numerous manufacturers, distributors and retailers of nutritional products. The market for these products is intensely competitive. Many of the Company's competitors are significantly larger, have greater financial resources, and have better name recognition than it does. The Company also relies on independent distributors to market and sell its products through direct selling techniques, as well as sponsoring other independent distributors. The Company's ability to compete with other direct selling companies depends greatly on its ability to retain existing independent distributors and attract new independent distributors. In addition, the Company currently does not have significant patent or other proprietary protection, and competitors may introduce products with the same or similar ingredients that the Company uses in its products. As a result, the Company may have difficulty differentiating its products from its competitors’ product and other competing products that enter the nutritional market. The Company's future operations could be harmed as a result of changing market conditions and future competition.
20
The Company may experience unintended negative effects from its independent distributor promotions or compensation plans.
The payment of volume incentives to the Company's independent distributors is its most significant expense. These incentives include commissions, bonuses and certain awards and prizes based on promotions and product sales levels. From time to time, the Company adjusts its compensation plan to better manage these incentives as a percentage of net sales. The Company closely monitors the amount of volume incentives that are paid as a percentage of net sales, and may periodically adjust its compensation plan to prevent volume incentives from having a significant adverse effect on the Company's earnings. In addition to the compensation plan, the Company frequently designs and implements economic and non-economic incentives and promotions to motivate and reward its independent distributors. Changes to the Company's compensation plan, product pricing, or promotions and incentives may not be successful in achieving target levels of volume incentives as a percentage of net sales. Furthermore, such programs, promotions or incentives could result in unintended or unforeseen negative economic and non-economic consequences to the Company's business, such as higher than anticipated costs.
The Company's manufacturing activity is subject to certain risks.
The Company manufacture approximately 80 percent of the products sold at its manufacturing facility located in Spanish Fork, Utah. As a result, the Company is dependent upon the uninterrupted and efficient operation of its manufacturing facility in Spanish Fork and its distribution facilities throughout the country. The Company's manufacturing facilities and distribution facilities are subject to the risk of catastrophic loss due to, among other things, earthquake, fire, flood, terrorism or other natural or man-made disasters, as well as occurrence of significant equipment failures. If any of these facilities were to experience a catastrophic loss, it would be expected to disrupt the Company's operations and could result in personal injury or property damage, damage relationships with its customers or result in large expenses to repair or replace the facilities or systems, as well as result in other liabilities and adverse impacts.
As the primary manufacturer of its own products, the Company is subject to FDA regulations on Good Manufacturing Practices, which require the Company to maintain good manufacturing processes, including ingredient identification, manufacturing controls and record keeping. The ingredient identification requirement, which requires the Company to confirm the levels, identity and potency of ingredients listed on its product labels within a narrow range, is particularly burdensome and difficult for the Company with respect to its product formulations, which contain many different ingredients. The Company's operations could be harmed if regulatory authorities make determinations that the Company is not in compliance with Good Manufacturing Practices. A finding of noncompliance may result in administrative warnings, penalties or actions impacting the Company's ability to continue selling certain products. In addition, compliance with these regulations has increased and may further increase the cost of manufacturing certain of the Company's products.
In addition, the Company contracts with third-party manufacturers to produce some of its vitamins, mineral and other nutritional supplements, personal care products and certain other miscellaneous products in accordance with the Company's specifications and standards. These contract manufacturers are subject to the same risks as the Company's manufacturing facility as noted above. In addition, while the Company has implemented stringent quality control procedures to verify that its contract manufacturers comply with its specifications and standards, the Company does not have full control over their manufacturing activities. Any difficulties, delays and defects in the Company's products resulting from the activities of its contract manufacturers may have an adverse effect on the Company's business and results of operations.
Failure of third party support could negatively impact the Company's sales revenue and profitability.
The Company has contracted with third-parties in several of its key markets to distribute its product and provide support services to the Company's independent sales force of independent distributors. The Company relies on these third parties to perform various required administrative functions in support of its independent distributors. Any failure of these third parties in this regard could result in the disruption of the Company's business in these markets and adversely affect revenue and profitability.
The Company's failure to appropriately respond to changing consumer preferences and demand for new products or product enhancements could significantly harm its distributor relationships and product sales and harm its financial condition and operating results.
The Company's business is subject to changing consumer trends and preferences. The Company's continued success depends in part on its ability to anticipate and react to these changes, and the Company may not react in a timely or commercially appropriate manner to such changes. Furthermore, the nutritional supplement industry is characterized by rapid and frequent changes in demand for products and new product introductions and enhancements. The Company's failure to
21
accurately predict these trends could negatively impact consumer opinion of its products, which in turn could harm its relationships with its independent distributors and cause the loss of sales. If the Company does not introduce new products or make enhancements to meet the changing needs of its customers in a timely manner, some of its products could be rendered obsolete, which could negatively impact the Company's revenues, financial condition and operating results.
The Company's expansion in China is subject to risks associated with operating a joint venture, as well as general, industry-specific, economic, political, currency and legal risks in China and requires it to utilize a different business model from that which it uses elsewhere in the world.
The Company's expansion of operations into China is subject to risks and uncertainties related to operating a joint venture, as well as general economic, political and legal developments in China, among other things. The Chinese government exercises significant control over all aspects of the Chinese economy, and the direct selling industry in particular. Accordingly, any adverse change in the Chinese economy, the Chinese legal system or Chinese governmental, economic or other policies could have a material adverse effect on the Company's business in China and its prospects generally.
On August 25, 2014, the Company completed a transaction with Shanghai Fosun Pharmaceutical (Group) Co., Ltd. (“Fosun Pharma”), which created a joint venture owned 80 percent by the Company and 20 percent by a wholly-owned subsidiary of Fosun Pharma. Smooth operation of the joint venture depends on good relations between the Company and Fosun Pharma, active synergies between the two companies and positive legal and regulatory recognition of the joint venture. Any disruption in relations, inability to work efficiently or disadvantageous treatment of the joint venture by the Chinese or other authorities could have a material adverse effect on the Company's business in China and its prospects generally.
In 2005, China published regulations governing direct selling and prohibiting pyramid promotional schemes, and a number of administrative methods and proclamations were issued in 2005 and in 2006. These regulations require the Company to use a business model different from that which it offers in other markets. The Company is creating a model specifically for China to operate under these regulations.
The direct selling regulations require the Company to apply for various approvals to conduct a direct selling enterprise in China. The process for obtaining the necessary licenses to conduct a direct selling business is protracted and cumbersome and involves multiple layers of Chinese governmental authorities and numerous governmental employees at each layer. While direct selling licenses are centrally issued, such licenses are generally valid only in the jurisdictions within which related approvals have been obtained. Such approvals are generally awarded on local and provincial bases, and the approval process requires involvement with multiple ministries at each level. The Company's participation and conduct during the approval process is guided not only by distinct Chinese practices and customs, but is also subject to applicable laws of China and the other jurisdictions in which the Company operates, including the U.S., as well as the Company's internal code of ethics. There is always a risk that in attempting to comply with local customs and practices in China during the application process or otherwise, the Company will fail to comply with requirements applicable in China itself or in other jurisdictions, and any such failure to comply with applicable requirements could prevent the Company from obtaining the direct selling licenses or related local or provincial approvals. Furthermore, the Company relies on certain key management, regulatory and legal personnel in China to assist during the approval process, and the loss of any such key personnel could delay or hinder the Company's ability to obtain licenses or related approvals. For all of the above reasons, there can be no assurance that the Company will obtain direct-selling licenses, or obtain related approvals to expand into any or all of the localities or provinces in China that are important to this venture. The Company's inability to obtain, retain, or renew any or all of the licenses or related approvals that are required to operate in China could negatively impact the Company.
Additionally, although certain regulations have been published with respect to obtaining and operating under such approvals and otherwise conducting business in China, other regulations are pending and there continues to be uncertainty regarding the interpretation and enforcement of Chinese regulations. The regulatory environment in China is evolving, and officials in the Chinese government exercise broad discretion in deciding how to interpret and apply regulations. The Company cannot be certain that its business model will continue to be deemed compliant by national or local Chinese regulatory authorities. The Chinese government rigorously monitors the direct selling market in China, and in the past has taken serious action against companies that the government believed were engaging in activities they regarded to be in violation of applicable law, including shutting down their businesses and imposing substantial fines. As a result, there can be no guarantee that the Chinese government’s current or future interpretation and application of the existing and new regulations will not negatively impact the Company's business in China, result in regulatory investigations or lead to fines or penalties.
Chinese regulations prevent persons who are not Chinese nationals from engaging in direct selling in China. The Company cannot guarantee that any of its Members living outside of China or any of its sales representatives or independent
22
service providers in China have not engaged or will not engage in activities that violate the Company's policies in this market, or that violate Chinese law or other applicable law, and therefore result in regulatory action and adverse publicity.
If the Company is not able to register products for sale in Mainland China, its business could be harmed.
The Company's registration of its products for sale in China is extremely time intensive. The requirements for obtaining product registrations and/or licenses involve extended periods of time that may delay the Company from offering products for sale or prevent it from launching new product initiatives in China on the same timelines as other markets around the world. For example, products marketed in China as “health foods” or for which certain claims are used are subject to “blue cap” or “blue hat” registrations, which involve extensive laboratory and clinical analysis by governmental authorities. This registration process can take anywhere from 18 months to 3 years, but may be substantially longer. The Company currently intends to market both “health foods” and “general foods” in China. There is risk associated with the common practice in China of marketing a product as a “general food” while seeking “health food” classification. If government officials feel the categorization of products is inconsistent with product claims, ingredients or function, this could end or limit the Company's ability to market such products in China.
If the Company is unable to effectively manage rapid growth in China, its operations could be harmed.
If the Company's operations in China are successful and it experiences rapid growth, there can be no assurances that the Company will be able to successfully manage rapid expansion of manufacturing operations and a rapidly growing and dynamic sales force. If the Company is unable to effectively manage such growth and expansion of its retail stores and manufacturing operations, the Company's government relations may be compromised and its operations in China may be harmed.
Item 1B. Unresolved Staff Comments
None.
Item 2. Properties
The Company's corporate offices are located in Lehi, Utah, and consist of approximately 66,000 square feet. These facilities are leased from an unaffiliated third party through a lease agreement which expires in 2017.
The Company's principal warehousing and manufacturing facilities are housed in a building consisting of approximately 270,000 square feet and located on approximately 10 acres in Spanish Fork, Utah. These facilities are owned by the Company and support all of its business segments.
The Company owns approximately 28,000 square feet of office space in Mexico.
The Company also owns approximately 53 acres of undeveloped land in Springville, Utah, and approximately 8 acres of undeveloped land in Provo, Utah.
The Company leases properties used primarily as distribution warehouses located in Georgia, Ohio, Texas and Utah, as well as offices and distribution warehouses in the majority of the countries in which it does business. The Company believes these facilities are suitable for their respective uses and are, in general, adequate for the Company's present and near-term future needs. During 2015, 2014 and 2013, the Company incurred approximately $6.3 million, $6.2 million, and $6.1 million, respectively, for all of its leased facilities in lease expense.
The Company believes that its current facilities are adequate for its business operation and that additional space, if required, will be available on commercially reasonable terms for the foreseeable future.
Item 3. Legal Proceedings
The Company is party to various legal proceedings. Management cannot predict the ultimate outcome of these proceedings, individually or in the aggregate, or their resulting effect on the Company’s business, financial position, results of operations or cash flows as litigation and related matters are subject to inherent uncertainties, and unfavorable rulings could occur. Were an unfavorable outcome to occur, there exists the possibility of a material adverse impact on the business, financial position, results of operations, or cash flows for the period in which the ruling occurs and/or future periods. The Company maintains product liability, general liability and excess liability insurance coverage. However, no assurances can be given that
23
such insurance will continue to be available at an acceptable cost to the Company, that such coverage will be sufficient to cover one or more large claims, or that the insurers will not successfully disclaim coverage as to a pending or future claim.
Item 4. Mine Safety Disclosures
Not applicable.
24
PART II
Item 5. Market for Registrant’s Common Equity, Related Shareholder Matters and Issuer Purchases of Equity Securities
Market and Share Prices
The Company's common stock is traded on the NASDAQ Global Market (symbol “NATR”).
The following table summarizes the quarterly high and low market prices of the Company's common stock for the years ended December 31, 2015 and 2014:
Market Prices | ||||||||
2015 | High | Low | ||||||
First Quarter | $ | 14.98 | $ | 11.88 | ||||
Second Quarter | $ | 14.11 | $ | 11.89 | ||||
Third Quarter | $ | 13.84 | $ | 11.30 | ||||
Fourth Quarter | $ | 12.63 | $ | 10.30 | ||||
Market Prices | ||||||||
2014 | High | Low | ||||||
First Quarter | $ | 18.81 | $ | 18.34 | ||||
Second Quarter | $ | 18.37 | $ | 12.91 | ||||
Third Quarter | $ | 17.35 | $ | 14.12 | ||||
Fourth Quarter | $ | 15.76 | $ | 13.40 | ||||
The approximate number of shareholders of record of the Company's common shares as of February 19, 2016, was 772. This number of holders of record does not represent the actual number of beneficial owners of the Company's common shares because shares are frequently held in “street name” by securities dealers and others for the benefit of individual owners who have the right to vote their shares.
Recent Sales of Unregistered Securities
None.
Dividends
There were 772 shareholders of record as of December 31, 2015.
The declaration of future dividends is subject to the discretion of the Company’s Board of Directors and will depend upon various factors, including the Company’s earnings, financial condition, restrictions imposed by any indebtedness that may be outstanding, cash requirements, future prospects and other factors deemed relevant by its Board of Directors.
On February 25, 2015, the Company announced a cash dividend of $0.10 per common share in an aggregate amount of $1.9 million that was paid on March 23, 2015, to shareholders of record on March 12, 2015. On May 7, 2015, the Company announced a cash dividend of $0.10 per common share in an aggregate amount of $1.9 million that was paid on June 2, 2015, to shareholders of record on May 22, 2015. On August 10, 2015, the Company announced a cash dividend of $0.10 per common share in an aggregate amount of $1.9 million that was paid on September 8, 2015, to shareholders of record on August 25, 2015. On November 3, 2015, the Company announced a cash dividend of $0.10 per common share in an aggregate amount of $1.9 million that was paid on November 30, 2015, to shareholders of record on November 18, 2015.
25
Securities Authorized for Issuance Under Equity Compensation Plans
The following table contains information regarding the Company’s equity compensation plans as of December 31, 2015:
Plan category | Number of securities to be issued upon exercise or vesting of outstanding options, warrants and rights | Weighted average exercise price of outstanding options, warrants and rights | Number of securities remaining available for issuance under equity compensation plans (excluding securities reflected in column (a)) | |||||||
(a) | (b) | (c) | ||||||||
Equity compensation plans approved by security holders (1) | 2,427,288 | $ | 12.21 | 885,850 | ||||||
________________________________________________________________________
(1) | Consists of two plans: The Nature’s Sunshine Products, Inc. 2012 Stock Incentive Plan (the “2012 Incentive Plan”) and the Nature’s Sunshine Products, Inc. 2009 Stock Incentive Plan (the “2009 Incentive Plan”). The 2012 Incentive Plan was approved by shareholders on August 1, 2012. The 2009 Incentive Plan was approved by shareholders on November 6, 2009. The terms of these plans are summarized in Note 11, “Capital Transactions”, of the Notes to Consolidated Financial Statements in Item 8, Part 2 of this report. |
Performance Graph
The graph below depicts the Company's common stock as an index, assuming $100.00 was invested on December 31, 2010, along with the composite prices of companies listed on the NASDAQ Stock Market and the Company's peer group. Standard & Poor’s Investment Services has provided this information. The comparisons in the graph are required by regulations of the SEC, and are not intended to forecast or be indicative of the possible future performance of the Company's common stock. The publicly-traded companies that comprise this peer group include Herbalife International, Ltd., NuSkin Enterprises, Inc. and USANA Health Sciences, Inc. The Company considers these companies to be its peer group as they have similar product lines and distribution techniques.
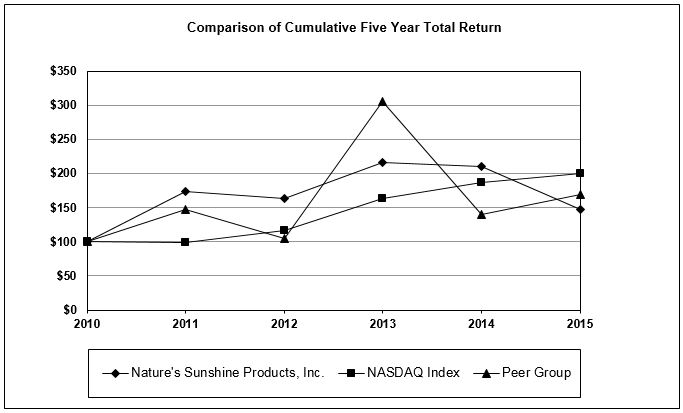
The material in this section captioned “Performance Graph” is being furnished and shall not be deemed “filed” with the SEC for purposes of Section 18 of the Exchange Act or otherwise subject to the liability of that section, nor shall the material in this section be deemed to be incorporated by reference in any registration statement or other document filed with the
26
SEC under the Securities Act of 1933, except to the extent the Company specifically and expressly incorporate it by reference into such filing.
12/31/2010 | 12/31/2011 | 12/31/2012 | 12/31/2013 | 12/31/2014 | 12/31/2015 | ||||||||||||||||||
Nature’s Sunshine Products, Inc. | $ | 100.00 | $ | 172.83 | $ | 162.84 | $ | 216.54 | $ | 209.55 | $ | 147.74 | |||||||||||
NASDAQ Index | 100.00 | 99.17 | 116.48 | 163.21 | 187.27 | 200.31 | |||||||||||||||||
Peer Group | 100.00 | 147.26 | 104.96 | 305.29 | 140.28 | 169.00 | |||||||||||||||||
Item 6. Selected Financial Data
The selected financial data presented below is summarized from the Company's results of consolidated operations for each of the five years in the period ended December 31, 2015, as well as selected consolidated balance sheet data as of December 31, 2015, 2014, 2013, 2012, and 2011.
(Dollar and Share Amounts in Thousands, Except for Per Share Information and Other Information)
Consolidated Statement of Operations Data
Year Ended December 31, | |||||||||||||||||||
2015 | 2014 | 2013 | 2012 | 2011 | |||||||||||||||
Net sales revenue | $ | 324,705 | $ | 366,367 | $ | 369,826 | $ | 360,826 | $ | 362,497 | |||||||||
Cost of sales | (85,345 | ) | (91,584 | ) | (92,344 | ) | (91,369 | ) | (87,906 | ) | |||||||||
Gross profit | 239,360 | 274,783 | 277,482 | 269,457 | 274,591 | ||||||||||||||
Operating expenses: | |||||||||||||||||||
Volume incentives | 117,786 | 135,808 | 135,516 | 130,875 | 131,840 | ||||||||||||||
Selling, general and administrative | 107,702 | 119,927 | 118,383 | 104,716 | 107,752 | ||||||||||||||
Contract termination costs | — | — | — | — | 14,750 | ||||||||||||||
Operating income | 13,872 | 19,048 | 23,583 | 33,866 | 20,249 | ||||||||||||||
Other income (loss), net | (592 | ) | (34 | ) | 1,993 | 1,573 | 1,256 | ||||||||||||
Income before income taxes | 13,280 | 19,014 | 25,576 | 35,439 | 21,505 | ||||||||||||||
Provision (benefit) for income taxes | 1,740 | (743 | ) | 7,923 | 10,531 | 5,136 | |||||||||||||
Net income from continuing operations | 11,540 | 19,757 | 17,653 | 24,908 | 16,369 | ||||||||||||||
Income (loss) from discontinued operations | 2,116 | (9,957 | ) | (44 | ) | 472 | 1,232 | ||||||||||||
Net income | 13,656 | 9,800 | 17,609 | 25,380 | 17,601 | ||||||||||||||
Loss attributable to noncontrolling interests | (1,031 | ) | (219 | ) | — | — | — | ||||||||||||
Net income attributable to common shareholders | $ | 14,687 | $ | 10,019 | $ | 17,609 | $ | 25,380 | $ | 17,601 | |||||||||
Consolidated Balance Sheet Data
December 31, | |||||||||||||||||||
2015 | 2014 | 2013 | 2012 | 2011 | |||||||||||||||
Cash and cash equivalents | $ | 41,420 | $ | 58,699 | $ | 77,247 | $ | 79,241 | $ | 58,969 | |||||||||
Working capital | 48,382 | 63,340 | 80,025 | 83,943 | 57,305 | ||||||||||||||
Inventories | 38,495 | 40,438 | 41,910 | 43,280 | 41,611 | ||||||||||||||
Property, plant and equipment, net | 68,728 | 51,343 | 32,022 | 27,950 | 25,137 | ||||||||||||||
Total assets | 200,520 | 196,799 | 199,612 | 193,919 | 175,811 | ||||||||||||||
Long-term liabilities | 11,119 | 9,933 | 25,784 | 16,893 | 20,575 | ||||||||||||||
Total shareholders’ equity | 136,265 | 128,957 | 105,259 | 115,636 | 87,438 | ||||||||||||||
27
Summary Cash Flow Information
December 31, | |||||||||||||||||||
2015 | 2014 | 2013 | 2012 | 2011 | |||||||||||||||
Operating activities | $ | 10,162 | $ | 14,182 | $ | 29,378 | $ | 26,651 | $ | 3,908 | |||||||||
Investing activities | (18,592 | ) | (26,674 | ) | (8,564 | ) | (2,989 | ) | (1,679 | ) | |||||||||
Financing activities | (7,578 | ) | (5,076 | ) | (21,331 | ) | (3,133 | ) | 9,588 | ||||||||||
Common Share Summary
December 31, | |||||||||||||||||||
2015 | 2014 | 2013 | 2012 | 2011 | |||||||||||||||
Cash dividend per share (1) | $ | 0.40 | $ | 1.90 | $ | 1.90 | $ | 0.15 | $ | — | |||||||||
Basic and diluted earnings per share | |||||||||||||||||||
Basic weighted average number of shares | 18,656 | 17,108 | 15,997 | 15,648 | 15,550 | ||||||||||||||
Diluted weighted average number of shares | 19,177 | 17,641 | 16,390 | 15,987 | 15,695 | ||||||||||||||
Basic earnings per share attributable to common shareholders: | |||||||||||||||||||
Net income from continuing operations | $ | 0.67 | $ | 1.15 | $ | 1.10 | $ | 1.59 | $ | 1.05 | |||||||||
Income (loss) from discontinued operations | $ | 0.11 | $ | (0.57 | ) | $ | — | $ | 0.03 | $ | 0.08 | ||||||||
Net income attributable to common shareholders | $ | 0.79 | $ | 0.58 | $ | 1.10 | $ | 1.62 | $ | 1.13 | |||||||||
Diluted earnings per share attributable to common shareholders: | |||||||||||||||||||
Net income from continuing operations | $ | 0.66 | $ | 1.12 | $ | 1.08 | $ | 1.56 | $ | 1.04 | |||||||||
Income (loss) from discontinued operations | $ | 0.11 | $ | (0.56 | ) | $ | (0.01 | ) | $ | 0.03 | $ | 0.08 | |||||||
Net income attributable to common shareholders | $ | 0.77 | $ | 0.56 | $ | 1.07 | $ | 1.59 | $ | 1.12 | |||||||||
________________________________________________________________________
(1) — 2014 and 2013 include a special cash dividend of $1.50 per share paid on September 19, 2014 and August 29, 2013, respectively.
Other Information
December 31, | ||||||||||||||
2015 | 2014 | 2013 | 2012 | 2011 | ||||||||||
Square footage of property in use | 703,696 | 754,548 | 771,439 | 768,513 | 763,389 | |||||||||
Number of employees | 901 | 964 | 1,010 | 995 | 1,003 | |||||||||
Item 7. Management’s Discussion and Analysis of Financial Condition and Results of Operations
The following discussion highlights the principal factors that have affected the Company's financial condition, results of operations, liquidity and capital resources for the periods described. This discussion should be read in conjunction with the Company's consolidated financial statements and the related notes in Item 8 of this report. This discussion contains forward-looking statements. Please see “Cautionary Note Regarding Forward-Looking Statements” for the risks, uncertainties and assumptions associated with these forward-looking statements.
OVERVIEW
The Company's Business, Industry and Target Market
Nature’s Sunshine Products, Inc., together with its subsidiaries (hereinafter referred to collectively as the “Company”), is a natural health and wellness company primarily engaged in the manufacturing and direct selling of nutritional and personal care products. The Company is a Utah corporation with its principal place of business in Lehi, Utah, and sells its products to a sales force of independent Managers and Distributors who use the products themselves and resell them to other independent
28
Distributors or consumers. The formulation, manufacturing, packaging, labeling, advertising, distribution and sale of each of the Company’s major product groups are subject to regulation by one or more governmental agencies.
The Company has four business segments that are divided based on the different characteristics of their Distributor bases, selling and Distributor compensation plans and product formulations, as well as the internal organization of its officers and their responsibilities and business operations. Three business segments operate under the Nature’s Sunshine Products brand (NSP Americas; NSP Russia, Central and Eastern Europe; and China and New Markets). The Company’s China and New Markets segment is deploying a multi-channel go-to-market strategy that offers select Nature’s Sunshine branded products through a direct selling model across China as well as through e-commerce channels. The time to market will be dependent upon regulatory processes including product registration and permit approvals. Due to a change in the Chinese regulatory environment, the Company has indefinitely deferred its entry into the retail channel in China. The China and New Markets segment also includes the Company’s wholesale business, in which the Company sells its products to various locally managed entities independent of the Company that have distribution rights for the relevant market. All of the net sales revenue to date in the China and New Markets segment is through the Company’s wholesale business to foreign markets outside of China detailed below. The wholesale business was previously part of NSP Americas. The fourth business segment operates under the Synergy® WorldWide brand.
The Company markets its products in Australia, Austria, Belarus, Canada, Colombia, Costa Rica, the Czech Republic, Denmark, the Dominican Republic, Ecuador, El Salvador, Finland, Germany, Guatemala, Honduras, Hong Kong, Iceland, Indonesia, Ireland, Italy, Japan, Kazakhstan, Latvia, Lithuania, Malaysia, Mexico, Moldova, Mongolia, the Netherlands, New Zealand, Nicaragua, Norway, Panama, the Philippines, Poland, Russia, Singapore, Slovenia, South Korea, Spain, Sweden, Taiwan, Thailand, Ukraine, the United Kingdom, and the United States. The Company markets its products through a wholesale model to Argentina, Australia, Chile, Israel, New Zealand, Norway, Peru and the United Kingdom. The Company discontinued operations in Vietnam during the second quarter of 2015, which were approximately 0.1 percent and 0.4 percent of consolidated net sales during the twelve month periods ended December 31, 2015 and 2014, respectively.
In 2015, the Company experienced a decrease in its consolidated net sales of 11.4 percent (or 6.7 percent in local currencies) compared to the same period in 2014. NSP Russia, Central and Eastern Europe net sales decreased approximately 45.5 percent compared to the same period in 2014. Synergy WorldWide net sales decreased approximately 10.9 percent compared to the same period in 2014 (or 1.8 percent in local currencies). NSP Americas net sales decreased approximately 1.8 percent compared to the same period in 2014 (or increased 1.0 percent in local currencies). China and New Markets net sales decreased approximately 27.4 percent compared to the same period in 2014. During 2015, the Synergy Worldwide segment experienced net sales growth in local currencies in Japan, Thailand and Indonesia and the NSP Americas experienced net sales growth in local currencies in North America. Excluding the NSP Russia, Central and Eastern Europe segment, net sales decreased by approximately 5.9 percent (or 0.7 percent in local currencies) during 2015. The strengthening of the U.S. dollar versus the local currencies of the Company’s European, Latin American and Asian markets resulted in an approximate 5.2 percent or $16.7 million reduction of its net sales during 2015.
The Company expects that sales in NSP Russia, Central and Eastern Europe will continue to be affected by political unrest in Ukraine and Russia, sanctions against Russia and the significant impact of currency devaluation. The Company does not expect this decline in net sales to reverse in the near term. The Company remains strongly supportive and engaged with its independent Distributors in the region, and believes its solid foundation and strong relationships in the region will allow it to reignite growth once the political situation and currency value stabilize.
In absolute terms, selling, general and administrative expenses decreased $12.2 million during 2015. Over the same period, selling, general and administrative expenses as a percentage of net sales revenue for 2015 increased to 33.2 percent from 32.7 percent in 2014. The percentage increase was primarily the result of the decrease in net sales from the Company’s NSP Russia, Central & Eastern Europe and the impact of foreign currency devaluation versus the U.S. dollar in certain of its other markets.
The Company distributes its products to consumers through an independent sales force comprised of independent Managers and Distributors, some of whom also consume its products. Typically a person who joins the Company’s independent sales force begins as a Distributor. A Distributor may earn Manager status by committing more time and effort to selling the Company’s products, recruiting productive independent Distributors and attaining certain product sales levels. On a worldwide basis, active independent Managers were approximately 12,700 and 13,400 and active independent Distributors and customers were approximately 264,400 and 292,600 at December 31, 2015 and 2014, respectively, primarily due to declines in the Company's NSP Russia, Central and Eastern Europe segment as a result of the conditions noted above, as well as the conversion of the NSP Peru and United Kingdom markets to wholesale markets.
29
As an international business, the Company has significant revenues and costs denominated in currencies other than the U. S. Dollar. Sales in international markets in foreign currencies are expected to continue to represent a substantial portion of the Company's revenues. Likewise, the Company expects its foreign markets with functional currencies other than the U.S. Dollar will continue to represent a substantial portion of its overall sales and related operating expenses. Accordingly, changes in foreign currency exchange rates could materially affect revenues and costs or the comparability of revenues and costs from period to period as a result of translating the market's financial statements into its reporting currency.
Critical Accounting Policies and Estimates
The Company's consolidated financial statements have been prepared in accordance with U.S. GAAP and form the basis for the following discussion and analysis on critical accounting policies and estimates. The preparation of these financial statements requires the Company to make estimates and assumptions that affect the reported amounts of assets, liabilities, revenues and expenses, and related disclosure of contingent assets and liabilities. On a regular basis, management evaluate its estimates and assumptions. Management bases its estimates on historical experience and on various other assumptions that are believed to be reasonable under the circumstances, the results of which form the basis for making judgments about the carrying values of assets and liabilities that are not readily apparent from other sources. Actual results could differ from these estimates and those differences could have a material effect on the Company's financial position and results of operations. Management has discussed the development, selection and disclosure of these estimates with the Board of Directors and its Audit Committee.
A summary of the Company's significant accounting policies is provided in Note 1 of the Notes to Consolidated Financial Statements in Item 8 of this report. Management believes the critical accounting policies and estimates described below reflect its more significant estimates and assumptions used in the preparation of the Company's consolidated financial statements. The impact and any associated risks on the Company's business that are related to these policies are also discussed throughout this “Management’s Discussion and Analysis of Financial Condition and Results of Operations” where such policies affect reported and expected financial results.
Revenue Recognition
Net sales revenue and related volume incentive expenses are recorded when persuasive evidence of an arrangement exists, collectability is reasonably assured, the amount is fixed and determinable, and title and risk of loss have passed. The amount of the volume incentive is determined based upon the amount of qualifying purchases in a given month. Amounts received for undelivered merchandise are recorded as deferred revenue.
From time to time, the Company’s U.S. operations extend short-term credit associated with product promotions. In addition, for certain of the Company’s international operations, the Company offers credit terms consistent with industry standards within the country of operation. Payments to independent Managers and Distributors for sales incentives or rebates are recorded as a reduction of revenue. Payments for sales incentives and rebates are calculated monthly based upon qualifying sales. Membership fees are deferred and amortized as revenue over the life of the membership, primarily one year. Prepaid event registration fees are deferred and recognized as revenues when the related event is held.
A reserve for product returns is recorded based upon historical experience. The Company allows independent Managers or Distributors to return the unused portion of products within ninety days of purchase if they are not satisfied with the product. In some of the Company’s markets, the requirements to return product are more restrictive. Sales returns for the years 2015, 2014 and 2013, were $1.2 million, $1.5 million, and $1.5 million, respectively.
Accounts Receivable Allowances
Accounts receivable have been reduced by an allowance for amounts that may be uncollectible in the future. This estimated allowance is based primarily on the aging category, historical trends and management’s evaluation of the financial condition of the customer. This reserve is adjusted periodically as information about specific accounts becomes available.
Investments
The Company’s available-for-sale investment portfolio is recorded at fair value and consists of various securities such as state and municipal obligations, U.S. government security funds, short-term deposits and various equity securities. These investments are valued using (a) quoted prices for identical assets in active markets or (b) from significant inputs that are observable or can be derived from or corroborated by observable market data for substantially the full term of the asset. The
30
Company’s trading portfolio is recorded at fair value and consists of various marketable securities that are valued using quoted prices in active markets.
For equity securities, when assessing whether a decline in fair value below the Company’s cost basis is other-than-temporary, the Company considers the fair market value of the security, the length of time and extent to which market value has been less than cost, the financial condition and near-term prospects of the issuer as well as specific events or circumstances that may influence the operations of the issuer, and the Company’s intent and ability to hold the investment for a sufficient time in order to enable recovery of the cost. New information and the passage of time can change these judgments. Where the Company has determined that it lacks the intent and ability to hold an equity security to its expected recovery, the security’s decline in fair value is deemed to be other-than-temporary and is recorded within earnings as an impairment loss.
Inventories
Inventories are stated at the lower-of-cost-or-market, using the first-in, first-out method. The components of inventory cost include raw materials, labor and overhead. To estimate any necessary obsolescence or lower-of-cost-or-market adjustments, various assumptions are made in regard to excess or slow-moving inventories, non-conforming inventories, expiration dates, current and future product demand, production planning and market conditions.
Self-Insurance Liabilities
Similar to other manufacturers and distributors of products that are ingested, the Company faces an inherent risk of exposure to product liability claims in the event that, among other things, the use of its products results in injury. The Company has a wholly-owned captive insurance company to provide it with product liability insurance coverage. The Company has accrued an amount that it believes is sufficient to cover probable and reasonably estimable liabilities related to product liability claims based on the Company’s history of such claims. However, there can be no assurance that these estimates will prove to be sufficient, nor can there be any assurance that the ultimate outcome of any litigation for product liability will not have a material negative impact on the Company’s business prospects, financial position, results of operations or cash flows.
The Company self-insures for certain employee medical benefits. The recorded liabilities for self-insured risks are calculated using actuarial methods and are not discounted. The liabilities include amounts for actual claims and claims incurred but not reported. Actual experience, including claim frequency and severity as well as health care inflation, could result in actual liabilities being more or less than the amounts currently recorded.
Impairment of Long-Lived Assets
The Company reviews its long-lived assets, such as property, plant and equipment and intangible assets for impairment when events or changes in circumstances indicate that the carrying value of an asset may not be recoverable. It may use an estimate of future undiscounted net cash flows of the related assets or groups of assets over their remaining lives in measuring whether the assets are recoverable. An impairment loss is calculated by determining the difference between the carrying values and the fair values of these assets. Due to the continual currency devaluation of the Venezuelan bolivar, as of September 30, 2014, the Company incurred a $2.9 million impairment charge to write down the value of its fixed assets in Venezuela to $0, which is included in the results from discontinued operations. During the year ended December 31, 2015, the Company received $1.3 million in net proceeds from the sales of its fixed assets in Venezuela, which is included in the results from discontinued operations.
Incentive Trip Accrual
The Company accrues for expenses associated with its direct sales program, which rewards independent Managers and Distributors with paid attendance for incentive trips, including Company conventions and meetings. Expenses associated with incentive trips are accrued over qualification periods as they are earned. It specifically analyzes incentive trip accruals based on historical and current sales trends as well as contractual obligations when evaluating the adequacy of the incentive trip accrual. Actual results could generate liabilities more or less than the amounts recorded. The Company has accrued incentive trip costs of approximately $4.8 million and $4.2 million at December 31, 2015 and 2014, respectively, which are included in accrued liabilities in the consolidated balance sheets.
Contingencies
The Company is involved in certain legal proceedings. When a loss is considered probable in connection with litigation or non-income tax contingencies and when such loss can be reasonably estimated with a range, it records its best estimate
31
within the range related to the contingency. If there is no best estimate, its records the minimum of the range. As additional information becomes available, it assesses the potential liability related to the contingency and revise the estimates. Revision in estimates of the potential liabilities could materially affect its results of operations in the period of adjustment. The Company's contingencies are discussed in further detail in Note 14, “Commitments and Contingencies”, of the Notes to Consolidated Financial Statements, in Item 8, Part 2 of this report.
Income Taxes
The Company’s income tax expense, deferred tax assets and liabilities, and contingent reserves reflect management’s best assessment of estimated future taxes to be paid. The Company is subject to income taxes in both the United States and numerous foreign jurisdictions. Significant judgments and estimates are required in determining the Company’s consolidated income tax expense.
Deferred income taxes arise from temporary differences between the tax and financial statement recognition of revenue and expense. In evaluating the Company’s ability to recover its deferred tax assets, management considers all available positive and negative evidence, including scheduled reversals of deferred tax liabilities, projected future taxable income, tax planning strategies and recent financial operations. In projecting future taxable income, the Company develops assumptions including the amount of future state, federal and foreign pretax operating income, the reversal of temporary differences, and the implementation of feasible and prudent tax planning strategies. These assumptions require significant judgment about the forecasts of future taxable income, and are consistent with the plans and estimates that the Company is using to manage the underlying businesses. Valuation allowances are recorded as reserves against net deferred tax assets by the Company when it is determined that net deferred tax assets are not likely to be realized in the foreseeable future. As of December 31, 2015 and 2014, the Company had recorded valuation allowances of $6.6 million and $13.2 million, respectively, as offsets to its net deferred tax assets.
At December 31, 2015, foreign subsidiaries had unused operating loss carryovers for tax purposes of approximately $5.4 million. The net operating losses will expire at various dates from 2016 through 2025, with the exception of those in some foreign jurisdictions where there is no expiration. For financial reporting purposes, the release of these valuation allowances would reduce income tax expenses. At December 31, 2015, the Company had approximately $11.7 million of foreign tax and withholding credits, most of which expire in 2024.
Changes in tax laws and rates could also affect recorded deferred tax assets and liabilities in the future. Management is not aware of any such changes that would have a material effect on the Company’s results of operations, cash flows or financial position.
The calculation of the Company’s tax liabilities involves dealing with uncertainties in the application of complex tax laws and regulations in a multitude of jurisdictions across its global operations. Income tax positions must meet a more-likely-than-not recognition threshold to be recognized.
Share-Based Compensation
The Company recognizes all share-based payments to Directors and employees, including grants of stock options and restricted stock units, to be recognized in the statement of operations based on their grant-date fair values. It records compensation expense, net of an estimated forfeiture rate, over the vesting period of the stock options based on the fair value of the stock options on the date of grant. The estimated forfeiture rate is based upon historical experience.
PRESENTATION
Net sales revenue represents net sales including shipping and handling revenues offset by volume rebates given to independent Managers, Distributors and customers. Volume rebates as a percentage of retail sales may vary by country depending upon regulatory restrictions that limit or otherwise restrict rebates. The Company also offers reduced volume rebates with respect to certain products and promotions worldwide.
The Company's gross profit consists of net sales less cost of sales, which represents its manufacturing costs, the price it pays to its raw material suppliers and manufacturers of its products, and duties and tariffs, as well as shipping and handling costs related to product shipments and distribution to its independent Managers, Distributors and customers.
Volume incentives are a significant part of the Company's direct sales marketing program, and represent commission payments made to its independent Managers and Distributors. These payments are designed to provide incentives for reaching
32
higher sales levels and for recruiting additional independent Distributors. Volume incentives vary slightly, on a percentage basis, by product due to the Company's pricing policies and commission plans in place in its various operations.
Selling, general and administrative expenses represent the Company's operating expenses, components of which include labor and benefits, sales events, professional fees, travel and entertainment, Distributor marketing, occupancy costs, communication costs, bank fees, depreciation and amortization, and other miscellaneous operating expenses.
Most of the Company's sales to independent Distributors outside the United States are made in the respective local currencies. In preparing its financial statements, the Company translates revenues into U.S. dollars using average exchange rates. Additionally, the majority of the Company's purchases from its suppliers generally are made in U.S. dollars. Consequently, a strengthening of the U.S. dollar versus a foreign currency can have a negative impact on the Company's reported sales and contribution margins and can generate transaction losses on intercompany transactions.
RESULTS OF OPERATIONS
The following table summarizes the Company's consolidated net income from continuing operations results as a percentage of net sales revenue for the periods indicated:
Year Ended December 31, | ||||||||
2015 | 2014 | 2013 | ||||||
Net sales revenue | 100.0 | % | 100.0 | % | 100.0 | % | ||
Cost of sales | (26.3 | ) | (25.0 | ) | (25.0 | ) | ||
Gross profit | 73.7 | 75.0 | 75.0 | |||||
Operating expenses: | ||||||||
Volume incentives | 36.3 | 37.1 | 36.6 | |||||
Selling, general and administrative | 33.2 | 32.7 | 32.0 | |||||
Operating income | 4.3 | 5.2 | 6.4 | |||||
Other income (expense): | ||||||||
Interest and other income, net | 0.5 | — | 0.2 | |||||
Interest expense | — | (0.1 | ) | (0.1 | ) | |||
Foreign exchange gains, net | (0.6 | ) | 0.1 | 0.4 | ||||
(0.2 | ) | — | 0.5 | |||||
Income before provision for income taxes | 4.1 | 5.2 | 6.9 | |||||
Provision (benefit) for income taxes | 0.5 | (0.2 | ) | 2.1 | ||||
Net income from continuing operations | 3.6 | % | 5.4 | % | 4.8 | % | ||
Net Sales Revenue
The Company’s international operations have provided, and are expected to continue to provide, a significant portion of its total net sales. As a result, total net sales will continue to be affected by fluctuations in the U.S. dollar against foreign currencies. In order to provide a framework for assessing how its underlying businesses performed excluding the effect of foreign currency fluctuations, in addition to comparing the percent change in net sales from one period to another in U.S. dollars, it compares the percentage change in net sales from one period to another period by excluding the effects of foreign currency exchange as shown below. Net sales excluding the impact of foreign exchange fluctuations is not a U.S. GAAP financial measure. Net sales in local currency removes from net sales in U.S. dollars the impact of changes in exchange rates between the U.S. dollar and the functional currencies of its foreign subsidiaries, by translating the current period net sales into U.S. dollars using the same foreign currency exchange rates that were used to translate the net sales for the previous comparable period. The Company believes presenting the impact of foreign currency fluctuations is useful to investors because it allows a more meaningful comparison of net sales of its foreign operations from period to period. However, net sales
33
excluding the impact of foreign currency fluctuations should not be considered in isolation or as an alternative to net sales in U.S. dollar measures that reflect current period exchange rates, or to other financial measures calculated and presented in accordance with U.S. GAAP. Throughout the last five years, foreign currency exchange rates have fluctuated significantly. See Item 7A. Quantitative and Qualitative Disclosures about Market Risk.
Year Ended December 31, 2015, as Compared to the Year Ended December 31, 2014
Net Sales Revenue
The following table summarizes the changes in the Company's net sales revenue by operating segment with a reconciliation to net sales revenue excluding the impact of currency fluctuations for the fiscal years ended December 31, 2015 and 2014 (dollar amounts in thousands).
Net Sales Revenue by Operating Segment | |||||||||||||||||
2015 | 2014 | Percent Change | Impact of Currency Exchange | Percent Change Excluding Impact of Currency | |||||||||||||
NSP Americas: | |||||||||||||||||
NSP North America | $ | 147,017 | $ | 145,650 | 0.9 | % | $ | (1,753 | ) | 2.1 | % | ||||||
NSP Latin America | 32,134 | 36,745 | (12.5 | )% | (3,292 | ) | (3.6 | )% | |||||||||
179,151 | 182,395 | (1.8 | )% | (5,045 | ) | 1.0 | % | ||||||||||
NSP Russia, Central and Eastern Europe | $ | 27,408 | $ | 50,274 | (45.5 | )% | $ | (463 | ) | (44.6 | )% | ||||||
Synergy WorldWide: | |||||||||||||||||
Synergy Asia Pacific | 76,479 | 81,199 | (5.8 | )% | (6,592 | ) | 2.3 | % | |||||||||
Synergy Europe | 25,829 | 31,732 | (18.6 | )% | (5,091 | ) | (2.6 | )% | |||||||||
Synergy North America | 11,773 | 15,170 | (22.4 | )% | — | (22.4 | )% | ||||||||||
114,081 | 128,101 | (10.9 | )% | (11,683 | ) | (1.8 | )% | ||||||||||
China and New Markets | $ | 4,065 | $ | 5,597 | (27.4 | )% | $ | — | (27.4 | )% | |||||||
$ | 324,705 | $ | 366,367 | (11.4 | )% | $ | (17,191 | ) | (6.7 | )% | |||||||
Consolidated net sales revenue for the year ended December 31, 2015, was $324.7 million compared to $366.4 million in 2014, or a decrease of approximately 11.4 percent. The decline was primarily related to a $22.9 million decline in net sales revenue in the Company's NSP Russia, Central and Eastern Europe segment for the year ended December 31, 2015, as well as a $16.7 million unfavorable impact in foreign currency exchange rate fluctuations in its other foreign markets during the same period. Excluding the unfavorable impact of foreign currency exchange rate fluctuations in its other foreign markets, the Company's consolidated net sales revenue would have decreased by 6.7 percent from 2014 for the year ended December 31, 2015.
34
NSP Americas
Net sales revenue related to NSP Americas for the year ended December 31, 2015, was $179.2 million compared to $182.4 million for the same period in 2014, a decrease of 1.8 percent. In local currency, net sales increased by 1.0 percent compared to the same period in 2014. Fluctuations in foreign exchange rates had a $5.0 million unfavorable impact on net sales for the year ended December 31, 2015. Active independent Managers within NSP Americas totaled approximately 6,500 and and 6,600 at December 31, 2015 and 2014, respectively. Active independent Distributors and customers within NSP Americas totaled approximately 131,600 and 135,900 at December 31, 2015 and 2014, respectively. The number of independent Managers, Distributors and customers decreased primarily due to lower recruiting in the Company's Latin American markets. Independent Managers were down 1.5 percent, and active independent Distributors and customers were down 3.5 percent, compared to the prior year. Despite the decline in active Distributors and customers year-over-year, net sales growth in local currency has come as a result of higher productivity within the Company's existing base of Distributors. The active independent Managers category includes independent Managers under the Company's various compensation plans that have achieved and maintained certain product sales levels. As such, all independent Managers are considered to be active independent Managers. The active independent Distributors and customers category includes the Company's independent Distributors and customers who have purchased products directly from the Company for resale and/or personal consumption during the previous three months.
Notable activity in the following markets contributed to the results of NSP Americas:
In the United States, net sales revenues increased approximately $2.7 million, or 2.1 percent, for the year ended December 31, 2015, compared to the same period in 2014, with growth for six consecutive quarters as it continued to see its new sales programs gain traction. This market has seen increased adoption of both the IN.FORM business model, which is focused on weight management and a daily habit of health, and retail sales tools. In addition, this year the Company launched two new patent pending products and re-launched an updated essential oils line in support of this key market.
In Canada, net sales revenues decreased approximately $1.4 million, or 10.8 percent, for the year ended December 31, 2015, compared to the same period in 2014. In local currency, net sales increased 3.1 percent compared to the same period in 2014. Increased momentum in this market has been a product of the increased adoption of the IN.FORM business model and the introduction of seven new products.
In Latin America, net sales revenues decreased approximately $4.6 million, or 12.5 percent, for the year ended December 31, 2015, compared to the same period in 2014. In local currency, net sales decreased 3.6 percent compared to the same period in 2014. Currency devaluation had a $3.3 million unfavorable impact on net sales for the year ended December 31, 2015. In NSP Latin America, the Company faced continued headwinds due to changing regulations for product registration. To address this, the Company is taking steps to transition its markets to adopt the IN.FORM business model, and at the same time, ensuring that its resources are aligned with this initiative.
NSP Russia, Central and Eastern Europe
Net sales revenue related to NSP Russia, Central and Eastern Europe markets (primarily Russia, the Ukraine, and Belarus) for the year ended December 31, 2015 was $27.4 million, compared to $50.3 million for the same period in 2014, a decrease of 45.5 percent. Active independent Managers within NSP Russia, Central and Eastern Europe totaled approximately 2,800 and 3,700 at December 31, 2015 and 2014, respectively. Active independent Distributors and customers within NSP Russia, Central and Eastern Europe totaled approximately 72,000 and 97,900 at December 31, 2015 and 2014, respectively. Net sales and the number of independent Managers, Distributors and customers buying and distributing the Company's products decreased primarily as a result of the current political uncertainty in Ukraine and across the region, and the market decline in the market value of the Ukrainian hryvnia and Russian ruble against the U.S. dollar. Although changes in exchange rates between the U.S. dollar and Ukrainian hryvnia do not result in currency fluctuations within the Company's financial statements, its products in Ukraine and Russia are priced local currencies pegged to current U.S. dollar exchange rates and therefore become more expensive when the local currency declines in value. The Company remains strongly supportive and engaged with its independent Distributors in the region, and is supporting their activity with additional promotions and training. However, at this time, the Company expects that sales in its NSP Russia, Central and Eastern Europe segment will continue to be affected by the political unrest in Ukraine and Russia, sanctions in Russia and the impact of currency devaluation. It is continuing to evaluate various options to keep its distributor base engaged by reviewing its pricing and providing product kits aligned with areas of distributor focus. The Company’s strong partnership with its local partner should provide a solid foundation to reignite growth once the situation stabilizes.
35
Synergy WorldWide
Synergy WorldWide reported net sales revenue for the year ended December 31, 2015, of $114.1 million, compared to $128.1 million for the same period in 2014, a decrease of 10.9 percent. Fluctuations in foreign exchange rates had a $11.7 million unfavorable impact on net sales for the year ended December 31, 2015. Excluding the impact of fluctuations in foreign exchange rates, local currency net sales in Synergy WorldWide would have decreased by 1.8 percent from the same period in 2014. Active independent Managers within Synergy WorldWide totaled approximately 3,400 and 3,100 at December 31, 2015 and 2014, respectively. Active independent Distributors and customers within Synergy WorldWide totaled approximately 60,800 and 58,800 at December 31, 2015 and 2014, respectively. Synergy WorldWide’s business model is operating under a traditional direct selling approach. Synergy WorldWide reported declines in net sales revenue in local currencies due to lower year-over-year sales in South Korea, Europe and North America, offset by improvements in Japan, Indonesia and Thailand.
Notable activity in the following markets contributed to the results of Synergy WorldWide:
In South Korea, net sales revenues decreased approximately $5.8 million, or 10.7 percent, for the year ended December 31, 2015, compared to the same period in 2014. This decline was partially related to the adverse impact of fluctuations in foreign exchange rates, which had a $3.5 million unfavorable impact on net sales for the year ended December 31, 2015. Excluding the impact of fluctuations in foreign exchange rates, local currency net sales decreased 4.2 percent for the year ended December 31, 2015. Despite the decline in local currency sales year-over-year, local currency sales for the fourth quarter of 2015 increased year-over-year by 13.0 percent. The decline in local currency net sales was primarily due to stricter enforcement of internet advertising restrictions on sites that were used successfully to promote net sales growth in 2014. To address this, the market launched new distributor acquisition programs, including a new Home Health Party program to provide the market’s distributors, affected by these internet advertising restrictions, additional tools to grow their businesses
In Europe, net sales revenues decreased approximately $5.9 million, or 18.6 percent, for the year ended December 31, 2015, compared to the same period in 2014. Fluctuations in foreign exchange rates, had a $5.1 million unfavorable impact on net sales for year ended December 31, 2015. Excluding the impact of fluctuations in foreign exchange rates, local currency net sales decreased 2.6 percent for the year ended December 31, 2015, compared to the same period in 2014. The decline in local currencies sales for the year ended December 31, 2015 is primarily due to strong sales from the launch and promotion of the Company's SLMsmart weight management product line in the fourth quarter of 2014. Despite the decline in local currency net sales year-over-year, local currency sales for the fourth quarter of 2015 did increase over the third quarter of 2015 by 6.4 percent.
In Japan, net sales revenues increased approximately $0.7 million, or 6.5 percent, for the year ended December 31, 2015, compared to the same period in 2014. Fluctuations in foreign exchange rates had $1.8 million unfavorable impact on net sales for the year ended December 31, 2015. In local currency, net sales increased 22.1 percent for the year ended December 31, 2015, compared to the same period in 2014. The Company continues to see the growth of new products and implemented programs to stimulate activity, which have had a positive impact on sales volume in this market since the first quarter of 2015.
In North America, net sales revenues decreased approximately $3.4 million, or 22.4 percent, for the year ended December 31, 2015, compared to the same period in 2014. The decline in sales is primarily driven by lower Distributor recruiting. Growth initiatives have been developed and implemented to more effectively support recruiting and Distributor training and motivation.
China and New Markets
China and New Markets reported wholesale related net sales revenue for the year ended December 31, 2015, of $4.1 million, compared to $5.6 million for the same period in 2014, a decrease of 27.4 percent. The changes in net sales is primarily related to the conversion of NSP Peru and United Kingdom to wholesale markets in 2014.
Due to the size of NSP Peru and United Kingdom markets, lack of net sales growth, and continuing operating losses, the Company made the decision to transition these markets to wholesale markets, in which it sells its products to a locally managed entity independent of the Company that has distribution rights for the market, effective December 30, 2014 and April 1, 2014, respectively.
Further information related to NSP Americas, NSP Russia, Central and Eastern Europe, Synergy WorldWide, and China and New Markets business segments is set forth in Note 15 of the Notes to Consolidated Financial Statements in Item 8 of this report.
36
Cost of Sales
Cost of sales as a percent of net sales revenue increased to 26.3 percent in 2015, compared to 25.0 percent in 2014. The increases in the cost of sales percentages are primarily due to the strengthening of the U.S. dollar against the local currencies in many of the Company’s foreign markets and the manufacture of most the Company's products in the U.S., which has made its products more expensive in those markets.
Volume Incentives
Volume incentives as a percent of net sales revenue decreased to 36.3 percent in 2015, compared to 37.1 percent in 2014. The decreases were primarily due to market mix changes from declines in the Company’s NSP Russia, Central and Eastern Europe market, which pay higher sales commission rates than its global commission rate average.
Selling, General and Administrative Expenses
Selling, general and administrative expenses decreased by approximately $12.2 million to $107.7 million for the year ended December 31, 2015. Selling, general and administrative expenses were 33.2 percent of net sales revenue for the year ended December 31, 2015, compared to 32.7 percent for the same period in 2014. The percentage increase was primarily the result of the decrease in net sales from the Company’s NSP Russia, Central & Eastern Europe and the impact of foreign currency devaluation versus the U.S. dollar in certain of its other markets.
The decrease in selling, general and administrative expenses during 2015, compared to the same period in 2014, were primarily related to:
• | $2.6 million of prior year non-recurring professional fees related to pursuing a strategic alliance with Fosun Pharma and the evaluation and negotiation with a company with an alternative distribution channel, which the Company ultimately declined to pursue; |
• | $3.9 million reduction of service costs due to lower net sales in Russia, Central and Eastern Europe; |
• | $4.3 million reduction of U.S. healthcare and other benefit costs for the period; |
• | $4.0 million of favorable exchange rate changes due to the strengthening of the U.S dollar relative to other foreign currencies, respectively; and |
• | $2.2 million of non-recurring costs in 2014 related to the Company’s former NSP Peru & United Kingdom markets and Synergy Vietnam market. |
Offset by:
• | $3.3 million of non-recurring restructuring charges to streamline the Company’s operations; and |
• | $4.0 million of increased investment in China. |
Other Income, Net
Other income (expense), net for the year ended December 31, 2015, decreased $0.6 million compared to the same period in 2014. The decrease in other income was primarily due to an increase in foreign exchange losses of $1.9 million offset by other income of $1.4 million primarily due to a gain on the sale of a warehouse in the Mexico market in 2015.
Income Taxes
Our effective income tax rate was 13.1 percent for 2015, compared to (3.9) percent for 2014. The effective rate for 2015 differed from the federal statutory rate of 35.0 percent primarily due to the following:
(i) | Adjustments to valuation allowances decreased the effective rate by 24.5 percent in 2015. Included was the effect of a removal of valuation allowances on U.S. foreign tax credits, offset partially by the impact of current year losses that will not provide tax benefit. The adjustment related to valuation allowances causing |
37
the 24.5 percent rate impact does not match the $6.6M change in valuation allowances on the balance sheet because there are elements of the balance sheet change that do not belong in the rate reconciliation, such as the removal of valuation allowances on expired foreign net operating loss carryforwards and currency translation adjustments.
(ii) | Changes in the unrecognized tax benefits increased the effective tax rate by 11.2 percent in 2015. These net gains and losses were recorded for financial reporting purposes, but were excluded from the calculation of taxable income. |
(iii) | Cumulative favorable adjustments related to foreign operations decreased the tax rate by 7.4 percent in 2015. These adjustments relate to foreign items that are treated differently for tax purposes than they are for financial reporting purposes. |
Adjustments relating to the U.S. impact of foreign operations increased the effective tax rate by 2.8 percentage points in 2015, and decreased the effective tax rate by 73.0 percentage points in 2014. The components of this calculation were:
Components of U.S. tax impact of foreign operations | 2015 | 2014 | ||||
Dividends received from foreign subsidiaries | 5.4 | % | 59.5 | % | ||
Foreign tax credits | (1.1 | ) | (121.3 | ) | ||
Foreign tax rate differentials | (1.2 | ) | (11.0 | ) | ||
Unremitted earnings | (0.3 | ) | (0.2 | ) | ||
Total | 2.8 | % | (73.0 | )% | ||
From 2014 to 2015, the changes in components of the U.S. tax impact of foreign operations were significant. The primary reason the dividends received from foreign subsidiaries and the foreign tax credits changed by such a large amount was due to a decrease in repatriation of foreign earnings to the U.S. from 2014 to 2015.
Changes to the effective rate due to dividends received from foreign subsidiaries, impact of foreign tax credits, foreign tax rate differentials and unremitted earnings calculation are expected to be recurring; however, depending on various factors, the changes may be favorable or unfavorable for a particular period. Given the large number of jurisdictions in which the Company does business and the number of factors that can impact effective tax rates in any given year, this rate is likely to reflect significant fluctuations from year-to-year.
38
Year Ended December 31, 2014, as Compared to the Year Ended December 31, 2013
Net Sales Revenue
The following table summarizes the changes in the Company's net sales revenue by operating segment for the fiscal years ended December 31, 2014 and 2013.
Net Sales Revenue by Operating Segment | |||||||||||||||||
2014 | 2013 | Percent Change | Impact of Currency Exchange | Percent Change Excluding Impact of Currency | |||||||||||||
NSP Americas: | |||||||||||||||||
NSP North America | $ | 145,650 | $ | 148,397 | (1.9 | )% | $ | (910 | ) | (1.2 | )% | ||||||
NSP Latin America | 36,746 | 38,960 | (5.7 | )% | (998 | ) | (3.1 | )% | |||||||||
NSP Other | — | 3,327 | (100.0 | )% | — | — | % | ||||||||||
182,396 | 190,684 | (4.3 | )% | (1,908 | ) | (3.3 | )% | ||||||||||
NSP Russia, Central and Eastern Europe | $ | 50,274 | $ | 62,747 | (19.9 | )% | $ | 4 | (19.9 | )% | |||||||
Synergy WorldWide: | |||||||||||||||||
Synergy North America | $ | 15,170 | $ | 17,079 | (11.2 | )% | $ | — | (11.2 | )% | |||||||
Synergy Asia Pacific | 81,199 | 59,605 | 36.2 | % | 130 | 36.0 | % | ||||||||||
Synergy Europe | 31,732 | 31,606 | 0.4 | % | 28 | 0.3 | % | ||||||||||
128,101 | 108,290 | 18.3 | % | 158 | 18.1 | % | |||||||||||
China and New Markets | $ | 5,596 | $ | 8,105 | (31.0 | )% | $ | — | (31.0 | )% | |||||||
$ | 366,367 | $ | 369,826 | (0.9 | )% | $ | (1,746 | ) | (0.5 | )% | |||||||
Consolidated net sales revenue for the year ended December 31, 2014, was $366.4 million compared to $369.8 million in 2013, a decrease of approximately 0.9 percent. The Company experienced a $1.7 million unfavorable impact in foreign currency exchange rate fluctuation in 2014, and its consolidated net sales revenue would have decreased by 0.5 percent from 2013, but for such negative impact. The decrease in net sales revenue for the year ended December 31, 2014 compared to the same period in 2013 is primarily due to a decline of net sales in the Company's NSP Americas and NSP Russia, Central and Eastern Europe segment, partially offset by an increase of net sales in its Synergy WorldWide and China and New Markets segments.
NSP Americas
Net sales revenue related to NSP Americas for the year ended December 31, 2014, was $182.4 million compared to $190.7 million for the same period in 2013, a decrease of 4.3 percent. Fluctuation in foreign exchange rates had a $1.9 million unfavorable impact on net sales for the year ended December 31, 2014, and net sales revenue would have decreased by 3.3 percent excluding this negative impact. Active independent Managers within NSP Americas totaled approximately 6,600 and 7,300 at December 31, 2014 and 2013, respectively. Active independent Distributors and customers within NSP Americas totaled approximately 135,900 and 144,500 at December 31, 2014 and 2013, respectively. Segment net sales revenue and the number of independent Managers, Distributors and customers decreased primarily due to combining the Company's NSP Japan business with its Synergy Japan business and lower net sales in the United States. The active independent Managers category includes independent Managers under the Company's various compensation plans that have achieved and maintained certain product sales levels. As such, all independent Managers are considered to be active independent Managers. The active independent Distributors and customers category includes the Company's independent Distributors and customers who have purchased products directly from the Company for resale and/or personal consumption during the previous three months.
39
Notable activity in the following markets contributed to the results of NSP Americas:
In the United States, net sales revenues decreased approximately $2.1 million, or 1.5 percent, for the year ended December 31, 2014, compared to the same period in 2013. Despite the overall decline in net sales in 2014 that occurred in the first half of the year, the market saw a growth in the third and fourth quarters in sales of 0.7 percent and 2.6 percent, respectively, as it continued to see its new sales programs gain traction. The U.S. market has seen increased adoption of both the IN.FORM sales method, which is focused on weight management, and its retail sales tools. Its August Leaders Conference held in Salt Lake City focused on this program as well as on sharing its business opportunity more effectively. In addition, in time for the winter season, the market re-launched the Silver immune product line, improving the formula to provide even greater efficacy, as well as rebranding its packaging, which has generated a positive uptake.
In Canada, net sales revenues decreased approximately $0.7 million, or 5.0 percent, for the year ended December 31, 2014, compared to the same period in 2013. In local currency, net sales increased 1.8 percent compared to the same period in 2013. Currency devaluation had a $0.9 million unfavorable impact on net sales for the year ended December 31, 2014, respectively. The NSP Canada market is following the same strategy as in the Company's NSP United States market, and it saw a growth in the third and fourth quarters in local currency sales of 5.1 percent and 9.6 percent, (the first quarters of growth since the first quarter of 2012), as it saw the uptake from the launch of weight management product line, ahead of its IN.FORM program launch in October.
In Latin America, net sales revenues decreased approximately $2.2 million, or 5.7 percent, for the year ended December 31, 2014, compared to the same period in 2013. In local currency, net sales decreased 3.1 percent compared to the same period in 2013. Currency devaluation had a $1.0 million unfavorable impact on net sales for the year ended December 31, 2014, respectively. In NSP Latin America, the Company faced continued headwinds due to changing regulations for product registration. To address this, the Company is taking steps to transition its sales motion to adopt the IN.FORM business method, and at the same time, ensuring that the Company's resources are aligned with this initiative.
Due to the continued challenges in returning the NSP Japan business to growth, the Company made the decision to cease operating under the NSP brand and to merge its NSP Japan business with its Synergy Japan business to create one unified approach to the market with a common product offering and business opportunity model. As part of this transition, the Company allowed NSP Japan independent Distributors to transfer their businesses to its Synergy Japan brand. The combined businesses began operating as Synergy Japan in January 2014, and provide a greater opportunity for a return to profitable growth. The Company therefore had no net sales revenue from NSP Japan for the year ended December 31, 2014, compared to approximately $3.3 million of net sales revenue in 2013.
NSP Russia, Central and Eastern Europe
Net sales revenue related to NSP Russia, Central and Eastern Europe markets (primarily Russia, the Ukraine, and Belarus) for the year ended December 31, 2014, was $50.3 million, compared to $62.7 million for the same period in 2013, a decrease of 19.9 percent. Active independent Managers within NSP Russia, Central and Eastern Europe totaled approximately 3,700 and 6,000 at December 31, 2014 and 2013, respectively. Active independent Distributors and customers within NSP Russia, Central and Eastern Europe totaled approximately 97,900 and 131,800 at December 31, 2014 and 2013, respectively. Net sales and the number of independent Managers, Distributors and customers buying and distributing the Company's products decreased primarily as a result of the current political uncertainty in Ukraine and across the region, and the market decline in the value of the Ukrainian hryvnia and Russian ruble against the U.S. dollar. Although changes in exchange rates between the U.S. dollar and Ukrainian hryvnia do not result in currency fluctuations within its financial statements, the Company’s products in Ukraine and Russia are priced local currencies pegged to current U.S. dollar exchange rates and therefore become more expensive when the local currency declines in value. The Company remains strongly supportive and engaged with its independent Distributors in the region, and is supporting their activity with additional promotions and training. However, at this time, the Company has cautioned that sales in its NSP Russia, Central and Eastern Europe segment will be significantly affected by the political unrest in Ukraine and Russia, possible sanctions in Russia and the impact of currency devaluation. It is continuing to evaluate various options to keep its distributor base engaged. Nevertheless, the Company's strong and renewed partnership with its local partner should provide a solid foundation to reignite growth once the situation stabilizes.
Synergy WorldWide
Synergy WorldWide reported net sales revenue for the year ended December 31, 2014, of $128.1 million, compared to $108.3 million for the same period in 2013, an increase of 18.3 percent. Fluctuations in foreign exchange rates had a $0.2 million favorable impact on net sales for the year ended December 31, 2014, and net sales revenue would have increased by
40
18.1 percent from 2013 excluding the positive impact. Active independent Managers within Synergy WorldWide totaled approximately 3,100 and 3,000 at December 31, 2014 and 2013, respectively. Active independent Distributors and customers within Synergy WorldWide totaled approximately 58,800 and 51,800 at December 31, 2014 and 2013, respectively. Synergy WorldWide’s business model is operating under a traditional direct selling approach. Synergy WorldWide reported a growth of net sales revenue due to improvements in South Korea and Japan, partially offset by lower net sales in North America.
Notable activity in the following markets contributed to the results of Synergy WorldWide:
In South Korea, net sales revenues increased approximately $20.1 million, or 58.8 percent, for the year ended December 31, 2014, compared to the same period in 2013. In local currency, net sales increased 52.6 percent for the year ended December 31, 2014, compared to the same period in 2013. Fluctuations in foreign exchange rates had a $2.1 million favorable impact on net sales for the year ended December 31, 2014. Momentum has been sustained since September 2013, due to the Synergy WorldWide global summit held in South Korea and the launch of the SLMsmart weight-management program, which further contributed to sustained growth in combination with the continued strong Distributor leadership in this market. However, due to certain internet advertising restrictions, the Company must caution that it does not expect to maintain this level of growth subsequent to December 31, 2014.
In Japan, net sales revenues increased approximately $3.0 million, or 34.8 percent, for the year ended December 31, 2014, compared to the same period in 2013. In local currency, net sales increased 46.1 percent for the year ended December 31, 2014, compared to the same period in 2013. Fluctuations in foreign exchange rates had a $1.0 million unfavorable impact on net sales for the year ended December 31, 2014. In the second half of 2013, the market introduced new products and implemented programs to stimulate activity, which had a positive impact in this market that continued through 2014. In addition, as referenced above, in order to provide a more stable platform for growth, the Company made the decision to cease to operate under the NSP brand in Japan and to combine the NSP Japan and Synergy Japan businesses, and operate as a single entity from January 2014 forward. As part of this transition, the Company provided certain NSP products, a business opportunity and encouraged NSP Japan independent Distributors to transfer their businesses to the Company's Synergy Japan brand. Net sales revenue of $1.5 million attributable NSP Japan’s historical sales force was included within these results for the year ended December 31, 2014.
In Europe, net sales revenues increased approximately $0.1 million, or 0.4 percent, for the year ended December 31, 2014, compared to the same period in 2013. The market is seeing growth across several regions, which led to its second consecutive quarterly net sales growth in local currencies in the third and fourth quarter of 2.3 percent and 23.3 percent, respectively. The growth has been driven by the investment in additional sales resources in the second half of 2013. In addition, momentum was created in the third quarter of 2014 as independent Distributors qualified for promotions ahead of the market's European Summit held in Barcelona at the end of September.
In North America, net sales revenues decreased approximately $1.9 million, or 11.2 percent, for the year ended December 31, 2014, compared to the same period in 2013. The decline in sales is primarily driven by lower Distributor recruiting. Growth initiatives have been developed and implemented to more effectively support recruiting and Distributor training and motivation.
China and New Markets
China and New Markets reported export related net sales revenue for the year ended December 31, 2014, of $5.6 million, compared to $8.1 million for the same period in 2013, a decrease of 31.0 percent. Active independent Managers and Active independent Distributors and customers within China and New Markets were approximately 100 and 4,300 at December 31, 2013, respectively. As NSP United Kingdom and NSP Peru were fully transitioned as export markets by December 31, 2014, there were no Managers, Distributors, and customers in the China and New Markets segment in 2014.
Due to the size of the NSP United Kingdom market, lack of net sales growth, and continuing operating losses, the Company made the decision to transition its NSP United Kingdom market to an export market, in which it sells its products to a locally managed entity independent of the Company that has distribution rights for the market, effective April 1, 2014. As a result of this change to a wholesale model, the Company's net sales revenue declined by $2.9 million for the year ended December 31, 2014, respectively, as compared to 2013.
Further information related to the Company's business segments is set forth in Note 15 of the Notes to Consolidated Financial Statements in Item 8 of this report.
41
Cost of Sales
Cost of sales as a percent of net sales revenue remained flat at 25.0 percent in 2014, compared to 25.0 percent in 2013.
Volume Incentives
Volume incentives as a percent of net sales revenue increased to 37.1 percent in 2014, compared to 36.6 percent in 2013. The increase was primarily due to net sales increases in markets such as South Korea and Japan that pay a higher sales commission in the Company's Synergy WorldWide segment.
Selling, General and Administrative Expenses
Selling, general and administrative expenses increased by approximately $1.5 million to $119.9 million for the year ended December 31, 2014. Selling, general and administrative expenses were 32.7 percent of net sales revenue for the year ended December 31, 2014, compared to 32.0 percent for the same period in 2013.
Significant increases to selling, general and administrative expenses during 2014 compared to the same period in 2013 included:
• | $2.1 million in start-up costs for the China joint venture; |
• | $1.1 million associated with the evaluation of and possible acquisition of a company with an alternative distribution channel that the Company ultimately declined to pursue. |
In addition, the increases in selling, general and administrative were partially offset by the following nonrecurring expenses incurred in 2013 but not in 2014:
• | $1.4 million of nonrecurring severance costs and the acceleration of stock option expense incurred in 2013 related to the resignation of the Company's former Chief Executive Officer; and |
• | $1.3 million of nonrecurring costs related to a five-year customs audit assessment in the Company's Synergy South Korea market incurred in 2013. |
Other Income, Net
There was minimal other income, net for the year ended December 31, 2014, compared to $2.0 million in 2013. The decrease in other income was primarily due to a decrease in foreign exchange gains in 2014.
Income Taxes
The Company's effective income tax rate was (3.9) percent for 2014, compared to 31.0 percent for 2013. The effective rate for 2014 differed from the federal statutory rate of 35.0 percent primarily due to the following:
(i) | Adjustments relating to the U.S. tax impact of foreign operations decreased the effective tax rate by 73.0 percentage points in 2014. Included were adjustments for dividends received from foreign subsidiaries and adjustments for foreign tax credits. |
(ii) | Adjustments to valuation allowances increased the effective rate by 48.8 percent in 2014. Included were the effect of valuation allowances on U.S. foreign tax credits and the impact of current year losses that will not provide tax benefit. |
(iii) | Changes in the unrecognized tax benefits decreased the effective tax rate by 8.6 percent in 2014. These net gains and losses were recorded for financial reporting purposes, but were excluded from the calculation of taxable income. |
Adjustments relating to the U.S. impact of foreign operations decreased the effective tax rate by 73.0 percentage points in 2014, and decreased the effective tax rate by 16.2 percentage points in 2013. The components of this calculation were:
42
Components of U.S. tax impact of foreign operations | 2014 | 2013 | ||||
Dividends received from foreign subsidiaries | 59.5 | % | 29.4 | % | ||
Foreign tax credits | (121.3 | ) | (34.3 | ) | ||
Foreign tax rate differentials | (11.0 | ) | (10.8 | ) | ||
Unremitted earnings | (0.2 | ) | (0.5 | ) | ||
Total | (73.0 | )% | (16.2 | )% | ||
From 2013 to 2014, the changes in components of the U.S. tax impact of foreign operations were significant. The primary reason the dividends received from foreign subsidiaries and the foreign tax credits changed by such a large amount was due to an increase in repatriation of foreign earnings to the U.S. from 2013 to 2014.
Changes to the effective rate due to dividends received from foreign subsidiaries, impact of foreign tax credits, foreign tax rate differentials and unremitted earnings calculation are expected to be recurring; however, depending on various factors, the changes may be favorable or unfavorable for a particular period. Given the large number of jurisdictions in which the Company does business and the number of factors that can impact effective tax rates in any given year, this rate is likely to reflect significant fluctuations from year-to-year.
43
SUMMARY OF QUARTERLY OPERATIONS — UNAUDITED
The following tables present the Company’s unaudited summary of quarterly operations during 2015 and 2014 for each of three month periods ended March 31, June 30, September 30, and December 31 (amounts in thousands).
For the Quarter Ended | |||||||||||||||
March 31, 2015 | June 30, 2015 | September 30, 2015 | December 31, 2015 | ||||||||||||
Net sales revenue | $ | 83,878 | $ | 81,247 | $ | 79,586 | $ | 79,994 | |||||||
Cost of sales | (21,881 | ) | (21,068 | ) | (20,643 | ) | (21,753 | ) | |||||||
Gross profit | 61,997 | 60,179 | 58,943 | 58,241 | |||||||||||
Volume incentives | 30,337 | 29,603 | 28,690 | 29,156 | |||||||||||
Selling, general and administrative | 26,330 | 27,392 | 27,115 | 26,865 | |||||||||||
Operating income | 5,330 | 3,184 | 3,138 | 2,220 | |||||||||||
Other expense | (318 | ) | (2 | ) | (247 | ) | (25 | ) | |||||||
Income from continuing operations before income taxes | 5,012 | 3,182 | 2,891 | 2,195 | |||||||||||
Provision (benefit) for income taxes | 809 | 787 | 1,284 | (1,140 | ) | ||||||||||
Net income from continuing operations | 4,203 | 2,395 | 1,607 | 3,335 | |||||||||||
Income from discontinued operations | 1,312 | — | 804 | — | |||||||||||
Net income | 5,515 | 2,395 | 2,411 | 3,335 | |||||||||||
Net loss attributable to noncontrolling interests | (152 | ) | (166 | ) | (355 | ) | (358 | ) | |||||||
Net income attributable to common shareholders | $ | 5,667 | $ | 2,561 | $ | 2,766 | $ | 3,693 | |||||||
Basic and diluted net income per common share | |||||||||||||||
Basic earnings per share attributable to common shareholders: | |||||||||||||||
Net income from continuing operations | $ | 0.23 | $ | 0.14 | $ | 0.10 | $ | 0.20 | |||||||
Income from discontinued operations | $ | 0.07 | $ | — | $ | 0.04 | $ | — | |||||||
Net income attributable to common shareholders | $ | 0.30 | $ | 0.14 | $ | 0.15 | $ | 0.20 | |||||||
Diluted earnings per share attributable to common shareholders: | |||||||||||||||
Net income from continuing operations | $ | 0.23 | $ | 0.13 | $ | 0.10 | $ | 0.19 | |||||||
Income from discontinued operations | $ | 0.07 | $ | — | $ | 0.04 | $ | — | |||||||
Net income attributable to common shareholders | $ | 0.30 | $ | 0.13 | $ | 0.14 | $ | 0.19 | |||||||
Dividends declared per common share | $ | 0.10 | $ | 0.10 | $ | 0.10 | $ | 0.10 | |||||||
44
For the Quarter Ended | |||||||||||||||
March 31, 2014 | June 30, 2014 | September 30, 2014 | December 31, 2014 | ||||||||||||
Net sales revenue | $ | 93,467 | $ | 92,831 | $ | 93,406 | $ | 86,663 | |||||||
Cost of sales | (22,581 | ) | (22,793 | ) | (22,742 | ) | (23,468 | ) | |||||||
Gross profit | 70,886 | 70,038 | 70,664 | 63,195 | |||||||||||
Volume incentives | 34,893 | 34,270 | 34,918 | 31,727 | |||||||||||
Selling, general and administrative | 29,152 | 29,941 | 30,200 | 30,634 | |||||||||||
Operating income | 6,841 | 5,827 | 5,546 | 834 | |||||||||||
Other income (expense) | (262 | ) | (79 | ) | (42 | ) | 349 | ||||||||
Income from continuing operations before income taxes | 6,579 | 5,748 | 5,504 | 1,183 | |||||||||||
Provision (benefit) for income taxes | (3,657 | ) | 2,198 | 407 | 309 | ||||||||||
Net income from continuing operations | 10,236 | 3,550 | 5,097 | 874 | |||||||||||
Loss from discontinued operations | (571 | ) | (316 | ) | (4,106 | ) | (4,964 | ) | |||||||
Net income (loss) | 9,665 | 3,234 | 991 | (4,090 | ) | ||||||||||
Net loss attributable to noncontrolling interests | — | — | (26 | ) | (193 | ) | |||||||||
Net income (loss) attributable to common shareholders | $ | 9,665 | $ | 3,234 | $ | 1,017 | $ | (3,897 | ) | ||||||
Basic and diluted net income per common share | |||||||||||||||
Basic earnings per share attributable to common shareholders: | |||||||||||||||
Net income from continuing operations | $ | 0.63 | $ | 0.22 | $ | 0.30 | $ | 0.05 | |||||||
Loss from discontinued operations | $ | (0.03 | ) | $ | (0.02 | ) | $ | (0.24 | ) | $ | (0.26 | ) | |||
Net income (loss) attributable to common shareholders | $ | 0.60 | $ | 0.20 | $ | 0.06 | $ | (0.21 | ) | ||||||
Diluted earnings per share attributable to common shareholders: | |||||||||||||||
Net income from continuing operations | $ | 0.61 | $ | 0.22 | $ | 0.29 | $ | 0.05 | |||||||
Income (loss) from discontinued operations | $ | (0.03 | ) | $ | (0.02 | ) | $ | (0.23 | ) | $ | (0.25 | ) | |||
Net income (loss) attributable to common shareholders | $ | 0.58 | $ | 0.20 | $ | 0.06 | $ | (0.20 | ) | ||||||
Dividends declared per common share | $ | 0.10 | $ | 0.10 | $ | 1.60 | $ | 0.10 | |||||||
Basic and diluted income per share is computed independently for each of the quarters presented. Therefore, the sum of the quarterly net income per share may not equal the total computed for the year.
LIQUIDITY AND CAPITAL RESOURCES
The Company's principal use of cash is to pay for operating expenses, including volume incentives, inventory and raw material purchases, capital assets and funding of international expansion. As of December 31, 2015, working capital was $48.4 million, compared to $63.3 million as of December 31, 2014. At December 31, 2015, the Company had $41.4 million in cash and cash equivalents, of which $38.4 million was held in its foreign markets and may be subject to various withholding taxes and other restrictions related to repatriation, and $1.8 million in unrestricted short-term investments, which were available to be used along with the Company's normal cash flows from operations to fund any unanticipated shortfalls in future cash flows.
45
The Company's net consolidated cash inflows (outflows) are as follows (in thousands):
Year Ended December 31, | |||||||||||
2015 | 2014 | 2013 | |||||||||
Operating activities | $ | 10,162 | $ | 14,182 | $ | 29,378 | |||||
Investing activities | (18,592 | ) | (26,674 | ) | (8,564 | ) | |||||
Financing activities | (7,578 | ) | (5,076 | ) | (21,331 | ) | |||||
In November 2014, the Company ceased its operations in Venezuela due to the difficulties and uncertainties related to import controls, difficulties associated with repatriating cash and high inflation. The loss from discontinued operations did not have a material impact on the Company’s operating cash flows during 2014.
Operating Activities
For the year ended December 31, 2015, operating activities provided cash in the amount of $10.2 million compared to $14.2 million for the same period in 2014. Operating cash flows decreased due to the timing of payments and receipts for other assets, accounts receivable, prepaid expenses and other, and income tax payable; and the decrease in non-cash expenses added back to net income. Those decreases were partially offset by the timing of payments and receipts for accounts payable, accrued liabilities, and liabilities related to unrecognized tax positions.
For the year ended December 31, 2014, the Company generated cash from operating activities of $14.2 million compared to $29.4 million in 2013. Operating cash flows decreased due to the timing of payments and receipts for inventories, accrued volume incentives, accrued liabilities, income tax payable and the liability related to unrecognized tax benefits, and was partially offset by the timing of payments and receipts for accounts receivable, prepaid expenses, accounts payable, and deferred revenue as well as the decrease in the Company's operating income.
Investing Activities
Cash paid for capital expenditures related to the purchase of equipment, computer systems and software for the years ended December 31, 2015, 2014, and 2013, were $22.5 million, $26.3 million, and $8.6 million, respectively. In 2013, the Company began to significantly reinvest in its information technology systems. Included within this plan is an Oracle ERP implementation program to provide the Company with a single integrated software solution that will integrate the Company’s business process on a worldwide basis. The Company anticipates completion of this project by early 2017. See below for further discussion of the Company’s contractual obligations related to future capital expenditures.
During the years ended December 31, 2015, 2014, and 2013, the Company used cash to purchase available-for-sale investments of $3,000, $0.7 million, and $0.4 million, respectively, and had cash proceeds of $0.8 million, $0.2 million, and $0.2 million for 2015, 2014, and 2013, respectively, from the sale of such investments.
Financing Activities
During the years ended December 31, 2015, 2014, and 2013, the Company used cash to pay dividends in an aggregate amount of $7.5 million, $35.2 million, and $30.4 million, respectively.
In December 2014, the Company completed share repurchases under its previously announced $10 million share repurchase program. In November 2014, the Board of Directors authorized a $20 million share repurchase program beginning January 1, 2015. Such purchases may be made in the open market, through block trades, in privately negotiated transactions or otherwise. The timing and amount of any shares repurchased will be determined based on the Company’s evaluation of market conditions and other factors and the program may be discontinued or suspended at any time. The Company will fund future dividends and the share repurchase program through available cash on hand, future cash flows from operations and borrowings under its revolving credit facility. During the year ended December 31, 2015, the Company repurchased 501,000 shares of its common stock under the share repurchase program for $6.6 million. At December 31, 2015, the remaining balance available for repurchases under the program was $13.4 million.
On August 25, 2014, the Company and Fosun Pharma completed a transaction pursuant to which, the parties entered into a joint venture in China, of which 80 percent is owned by the Company and 20 percent is owned by a wholly-owned subsidiary of Fosun Pharma, and completed a concurrent investment by Fosun Pharma in the Company's common stock issued pursuant to a private placement transaction with net proceeds of $44.8 million. Nature’s Sunshine used the net proceeds of the private
46
placement transaction to fund its 80 percent share of the initial $20.0 million capitalization of the China joint venture, or $16.0 million, and to pay its shareholders a cash dividend of $1.50 per share, or $28.5 million. The Company consolidated the joint venture in its consolidated financial statements, with the Fosun Pharma’s interest presented as a noncontrolling interest.
The joint venture, known as Nature’s Sunshine Hong Kong Limited, expects to market and distribute Nature’s Sunshine-branded products in China. Nature’s Sunshine Hong Kong Limited currently anticipates deploying a multi-brand, multi-channel go-to-market strategy, which will offer select Nature’s Sunshine-branded products a direct selling model. The time to market will be dependent upon regulatory processes including product registration, permit and license approvals.
Pursuant to a concurrent private placement transaction, Nature’s Sunshine issued 2.9 million shares of unregistered common stock to Fosun Pharma at a price of $16.19 per share, representing aggregate net proceeds to Nature’s Sunshine of $44.8 million. The purchase price represented a 10 percent premium to Nature’s Sunshine’s average stock price over the trailing 30 business day period as of June 26, 2014. As a result of the private placement transaction, Fosun Pharma owns approximately 15 percent of Nature’s Sunshine outstanding common shares with respect to which the Company has granted Fosun Pharma certain registration rights. In addition, Nature’s Sunshine appointed one director designated by Fosun Pharma to its board of directors.
During the years ended December 31, 2014 and 2013, the Company used cash to make principal payments of $12.3 million and $3.4 million, on long-term debt, respectively. The Company held no long-term debt during the year ended December 31, 2015.
The Company has a revolving credit agreement with Wells Fargo Bank, N.A. with a borrowing limit of $25.0 million that matures September 1, 2017. The Company pays interest at LIBOR plus 1.25 percent on any borrowings on the agreement (1.75 percent and 1.50 percent as of December 31, 2015 and 2014, respectively). The Company must pay an annual commitment fee of 0.25 percent on the unused portion of the commitment. The Company retains ample capital capacity to continue making long-term investments in its sales, marketing, science and product development initiatives and overall operations, as well as pursue strategic opportunities as they may arise. At December 31, 2015, and 2014, the outstanding balance under the revolving credit agreement was $2.7 million and $0, respectively.
The revolving credit agreement contains restrictions on leverage, minimum net income, and consecutive quarterly net losses. In addition, the agreement restricts capital expenditures, lease expenditures, other indebtedness, liens on assets, guaranties, loans and advances, and the merger, consolidation and the transfer of assets except in the ordinary course of business. As of December 31, 2015, the Company was in compliance with these debt covenants.
The Company believes that cash generated from operations, along with available cash and cash equivalents, will be sufficient to fund its normal operating needs; including dividends, share repurchases, and capital expenditures, as well as potential business development activity. However, among other things, a prolonged economic downturn, a decrease in demand for the Company's products, an unfavorable settlement of its unrecognized tax positions or non-income tax contingencies could adversely affect the Company's long-term liquidity.
CONTRACTUAL OBLIGATIONS
The following table summarizes information about contractual obligations as of December 31, 2015 (in thousands):
Total | Less than 1 year | 1-3 years | 3-5 years | After 5 years | |||||||||||||||
Operating lease obligations | $ | 13,374 | $ | 5,454 | $ | 7,053 | $ | 577 | $ | 290 | |||||||||
Self-insurance reserves(1) | 440 | 440 | — | — | — | ||||||||||||||
Other long-term liabilities reflected on the balance sheet(2) | — | — | — | — | — | ||||||||||||||
Unrecognized tax benefits(3) | — | — | — | — | — | ||||||||||||||
Revolving credit facility(4) | 2,696 | 2,696 | — | — | — | ||||||||||||||
ERP capital commitments(5) | 250 | 250 | — | — | — | ||||||||||||||
Other capital commitments(6) | 2,432 | 2,432 | — | — | — | ||||||||||||||
Total | $ | 19,192 | $ | 11,272 | $ | 7,053 | $ | 577 | $ | 290 | |||||||||
_______________________________________
(1) | At December 31, 2015, there were $2.3 million of liabilities. The Company retains a significant portion of the risks associated with certain employee medical benefits and product liability insurance. Recorded liabilities for self-insured |
47
risks are calculated using actuarial methods and are not discounted. Amounts for self-insurance obligations are included in accrued liabilities and long-term other liabilities on the Company’s consolidated balance sheet. Because of the high degree of uncertainty regarding the timing of future cash outflows associated with the product liability obligations the Company is unable to estimate the years in which cash settlement may occur.
(2) | At December 31, 2015, there were $1.0 million of liabilities. The Company provides a nonqualified deferred compensation plan for its officers and certain key employees. Under this plan, participants may defer up to 100 percent of their annual salary and bonus (less the participant’s share of employment taxes). The deferrals become an obligation owed to the participant by the Company under the plan. Upon separation of the participant from the service of the Company, the obligation owed to the participant under the plan will be paid as a lump sum or over a period of either three or five years. As the Company cannot easily determine when its officers and key employees will separate from the Company, the Company is unable to estimate the years in which cash settlement may occur. |
(3) | At December 31, 2015, there were $7.8 million of liabilities. Because of the high degree of uncertainty regarding the timing of future cash outflows associated with these liabilities, if any, the Company is unable to estimate the years in which cash settlement may occur with the respective tax authorities. |
(4) | The Company entered into a revolving credit agreement with Wells Fargo Bank, National Association that permits the Company to borrow up to $25 million through September 1, 2017, bearing interest at LIBOR plus 1.25 percent. The Company must pay an annual commitment fee of 0.25 percent on the unused portion of the commitment. At December 31, 2015, the Company had $22.3 million available under this facility. |
(5) | In 2013, the Company began to significantly reinvest in its information technology systems. Included within this plan is an Oracle ERP implementation program to provide the Company with a single integrated software solution that will integrate the Company’s business process on a worldwide basis. The Company anticipates completion of this project by early 2017. |
(6) | In 2015, the Company made commitments to purchase manufacturing equipment of $2.4 million in 2016. |
The Company has entered into long-term agreements with third-parties in the ordinary course of business, in which it has agreed to pay a percentage of net sales in certain regions in which it operates, or royalties on certain products. In 2015, 2014, and 2013, the aggregate amounts of these payments were $0.1 million, $0.2 million, and $1.5 million, respectively.
OFF-BALANCE SHEET ARRANGEMENTS
The Company has no off-balance sheet arrangements other than operating leases. It does not believe that these operating leases are material to its current or future financial position, results of operations, revenues or expenses, cash flows, capital expenditures or capital resources.
Item 7A. Quantitative and Qualitative Disclosures about Market Risk
The Company conducts business in several countries and intends to grow its international operations. Net sales revenue, operating income and net income are affected by fluctuations in currency exchange rates, interest rates and other uncertainties inherent in doing business and selling product in more than one currency. In addition, the Company's operations are exposed to risks associated with changes in social, political and economic conditions inherent in international operations, including changes in the laws and policies that govern international investment in countries where the Company has operations, as well as, to a lessor extent, changes in U.S. laws and regulations relating to international trade and investment.
Foreign Currency Risk
During the year ended December 31, 2015, approximately 54.6 percent of the Company's net sales revenue and approximately 53.6 percent of its operating expenses were realized outside of the United States. Inventory purchases are transacted primarily in U.S. dollars from vendors located in the United States. The local currency of each international subsidiary is generally the functional currency. It conducts business in multiple currencies with exchange rates that are not on a one-to-one relationship with the U.S. dollar. All revenues and expenses are translated at average exchange rates for the periods reported. Therefore, its operating results will be positively or negatively affected by a weakening or strengthening of the U.S. dollar in relation to another fluctuating currency. Given the uncertainty and diversity of exchange rate fluctuations, the Company cannot estimate the effect of these fluctuations on its future business, product pricing, results of operations or financial condition, but it has provided consolidated sensitivity analyses below of functional currency/reporting currency
48
exchange rate risks. Changes in various currency exchange rates affect the relative prices at which it sells its products. The Company regularly monitors its foreign currency risks and periodically takes measures to reduce the risk of foreign exchange rate fluctuations on its operating results. It does not use derivative instruments for hedging, trading or speculating on foreign exchange rate fluctuations. Additional discussion of the impact on the effect of currency fluctuations has been included in its management’s discussion and analysis included in Part II, Item 7 of this report.
The following table sets forth a composite sensitivity analysis of the Company’s net sales revenue, costs and expenses and operating income in connection with the strengthening of the U.S. dollar (its reporting currency) by 10%, 15%, and 25% against every other fluctuating functional currency in which it conducts business. The Company notes that its individual net sales revenue, cost and expense components and its operating income were equally sensitive to increases in the strength of the U.S. dollar against every other fluctuating currency in which it conducts business.
Exchange rate sensitivity for the year ended December 31, 2015 (dollar amounts in thousands)
With Strengthening of U.S. Dollar by: | ||||||||||||||||||||||||
10% | 15% | 25% | ||||||||||||||||||||||
($) | (%) | ($) | (%) | ($) | %) | |||||||||||||||||||
Net sales revenue | $ | 324,705 | $ | (12,479 | ) | (3.8 | )% | $ | (17,905 | ) | (5.5 | )% | $ | (27,454 | ) | (8.5 | )% | |||||||
Cost and expenses | ||||||||||||||||||||||||
Cost of sales | 85,345 | (3,878 | ) | (4.5 | )% | (5,565 | ) | (6.5 | )% | (8,532 | ) | (10.0 | )% | |||||||||||
Volume incentives | 117,786 | (4,758 | ) | (4.0 | )% | (6,827 | ) | (5.8 | )% | (10,468 | ) | (8.9 | )% | |||||||||||
Selling, general and administrative | 107,702 | (3,311 | ) | (3.1 | )% | (4,750 | ) | (4.4 | )% | (7,284 | ) | (6.8 | )% | |||||||||||
Operating income | $ | 13,872 | $ | (532 | ) | (3.8 | )% | $ | (763 | ) | (5.5 | )% | $ | (1,170 | ) | (8.4 | )% | |||||||
Certain of the Company’s operations, including Russia and Ukraine, are served by a U.S. subsidiary through third-party entities, for which all business is conducted in U.S. dollars. Although changes in exchange rates between the U.S. dollar and the Russian ruble or the Ukrainian hryvnia do not result in currency fluctuations within its financial statements, a weakening or strengthening of the U.S. dollar in relation to these other currencies can significantly affect the prices of its products and the purchasing power of its independent Managers, Distributors and customers within these markets. As a result of the current tension between Russia and Ukraine and resultant sanctions, the Russian ruble and the Ukrainian hryvnia have weakened significantly against the U.S. dollar, impacting net sales in this market. Should the conflict continue to escalate, exchanges rates for Russian ruble, as well as the Ukrainian hryvnia could weaken further against the U.S. dollar, further impacting net sales in these markets.
The following table sets forth a composite sensitivity analysis of the Company’s financial assets and liabilities by those balance sheet line items that are subject to exchange rate risk, together with the total gain or loss from the strengthening of the U.S. dollar in relation to its various fluctuating functional currencies. The sensitivity of its financial assets and liabilities, taken by balance sheet line items, is somewhat less than the sensitivity of its operating income to increases in the strength of the U.S. dollar in relation to other fluctuating currencies in which it conducts business.
49
Exchange Rate Sensitivity of Balance Sheet as of December 31, 2015 (dollar amounts in thousands)
With Strengthening of U.S. Dollar by: | ||||||||||||||||||||||||
10% | 15% | 25% | ||||||||||||||||||||||
(Loss) ($) | (Loss) (%) | (Loss) ($) | (Loss) (%) | (Loss) ($) | (Loss) (%) | |||||||||||||||||||
Financial Instruments Included in Current Assets Subject to Exchange Rate Risk | ||||||||||||||||||||||||
Cash and cash equivalents | $ | 41,420 | $ | (2,916 | ) | (7.0 | )% | $ | (4,108 | ) | (9.9 | )% | $ | (6,206 | ) | (15.0 | )% | |||||||
Accounts receivable, net | 7,700 | (166 | ) | (2.2 | )% | (238 | ) | (3.1 | )% | (365 | ) | (4.7 | )% | |||||||||||
Financial Instruments Included in Current Liabilities Subject to Exchange Rate Risk | ||||||||||||||||||||||||
Accounts payable | 6,341 | (71 | ) | (1.1 | )% | (101 | ) | (1.6 | )% | (156 | ) | (2.5 | )% | |||||||||||
Net Financial Instruments Subject to Exchange Rate Risk | $ | 42,779 | $ | (3,011 | ) | (7.0 | )% | $ | (4,245 | ) | (9.9 | )% | $ | (6,415 | ) | (15.0 | )% | |||||||
The following table sets forth the local currencies other than the U.S. dollar in which the Company’s assets that are subject to exchange rate risk were denominated as of December 31, 2015, and exceeded $1 million upon translation into U.S. dollars. None of its liabilities that are denominated in a local currency other than the U.S. dollar and that are subject to exchange rate risk exceeded $1 million upon translation into U.S. dollars. The Company uses the spot exchange rate for translating balance sheet items from local currencies into its reporting currency. The respective spot exchange rate for each such local currency meeting the foregoing thresholds is provided in the table as well.
Translation of Balance Sheet Amounts Denominated in Local Currency as of December 31, 2015 (dollar amounts in thousands)
Translated into U.S. Dollars | At Spot Exchange Rate per One U.S. Dollar | |||||
Cash and Cash Equivalents | ||||||
Shanghai (Yuan) | $ | 8,333 | 6.5 | |||
South Korea (Won) | 5,784 | 1,177.4 | ||||
Japan (Yen) | 3,794 | 120.4 | ||||
European Markets (Euro) | 3,633 | 0.9 | ||||
Canada (Dollar) | 1,430 | 1.4 | ||||
Thailand (Baht) | 1,257 | 36.14 | ||||
Other | 6,096 | Varies | ||||
Total foreign dominated cash and cash equivalents | $ | 30,327 | ||||
U.S. dollars held by foreign subsidiaries | $ | 8,065 | ||||
Total cash and cash equivalents held by foreign subsidiaries | $ | 38,392 | ||||
During the year ended December 31, 2015, the Company repatriated $7.1 million of foreign cash through intercompany dividends.
50
Finally, the following table sets forth the annual weighted average of fluctuating currency exchange rates of each of the local currencies per one U.S. dollar for each of the local currencies in which annualized net sales revenue would exceed $10.0 million during any of the three periods presented. The Company uses the annual average exchange rate for translating items from the statement of operations from local currencies into the Company’s reporting currency.
Year ended December 31, | 2015 | 2014 | 2013 | ||||||
Canada (Dollar) | 1.3 | 1.1 | 1.0 | ||||||
European Markets (Euro) | 0.9 | 0.8 | 0.8 | ||||||
Japan (Yen) | 121.0 | 105.6 | 97.4 | ||||||
South Korea (Won) | 1,132.5 | 1,055.3 | 1,098.3 | ||||||
Mexico (Peso) | 15.8 | 13.3 | 12.8 | ||||||
The local currency of the foreign subsidiaries is used as the functional currency, except for subsidiaries operating in highly inflationary economies or where the Company’s operations are served by a U.S. based subsidiary (for example, Russia and Ukraine). The financial statements of foreign subsidiaries, where the local currency is the functional currency, are translated into U.S. dollars using exchange rates in effect at year-end for assets and liabilities and average exchange rates during each year for the results of operations. Adjustments resulting from translation of financial statements are reflected in accumulated other comprehensive loss, net of income taxes. Foreign currency transaction gains and losses are included in other income (expense) in the consolidated statements of operations.
The functional currency in highly inflationary economies is the U.S. dollar and transactions denominated in the local currency are re-measured as if the functional currency were the U.S. dollar. The re-measurement of local currencies into U.S. dollars creates translation adjustments, which are included in the consolidated statements of operations. A country is considered to have a highly inflationary economy if it has a cumulative inflation rate of approximately 100 percent or more over a three-year period as well as other qualitative factors including historical inflation rate trends (increasing and decreasing), the capital intensiveness of the operation and other pertinent economic factors. During the year ended December 31, 2015, Belarus was considered to be highly inflationary. During the periods ended December 31, 2015, 2014 and 2013, the Company’s Belarusian subsidiary’s net sales revenue represented approximately 1.8 percent, 2.4 percent and 2.2 percent, of consolidated net sales revenue, respectively. With the exception of Belarus, there were no other countries considered to have a highly inflationary economy during the periods ended December 31, 2015, 2014 and 2013.
Interest Rate Risk
The primary objectives of the Company's investment activities are to preserve principal while maximizing yields without significantly increasing risk. These objectives are accomplished by purchasing investment grade securities. On December 31, 2015, the Company had investments of $1.8 million. A hypothetical 1.0 percent change in interest rates would not have had a material effect on the Company's liquidity, financial position or results of operations.
51
Item 8. Financial Statements and Supplementary Data
INDEX TO FINANCIAL STATEMENTS
52
REPORT OF INDEPENDENT REGISTERED PUBLIC ACCOUNTING FIRM
To the Board of Directors and Shareholders of Nature’s Sunshine Products, Inc.
We have audited the accompanying consolidated balance sheets of Nature’s Sunshine Products, Inc. and subsidiaries (the “Company”) as of December 31, 2015, and 2014, and the related consolidated statements of operations, comprehensive income, changes in shareholders’ equity, and cash flows for each of the three years in the period ended December 31, 2015. Our audits also included the consolidated financial statement schedule listed in the Index at Item 15. These consolidated financial statements and consolidated financial statement schedule are the responsibility of the Company’s management. Our responsibility is to express an opinion on the consolidated financial statements and consolidated financial statement schedule based on our audits.
We conducted our audits in accordance with the standards of the Public Company Accounting Oversight Board (United States). Those standards require that we plan and perform the audit to obtain reasonable assurance about whether the financial statements are free of material misstatement. An audit includes examining, on a test basis, evidence supporting the amounts and disclosures in the financial statements. An audit also includes assessing the accounting principles used and significant estimates made by management, as well as evaluating the overall financial statement presentation. We believe that our audits provide a reasonable basis for our opinion.
In our opinion, such consolidated financial statements present fairly, in all material respects, the financial position of Nature’s Sunshine Products, Inc. and subsidiaries as of December 31, 2015, and 2014, and the results of their operations and their cash flows for each of the three years in the period ended December 31, 2015, in conformity with accounting principles generally accepted in the United States of America. Also, in our opinion, such financial statement schedule, when considered in relation to the basic consolidated financial statements taken as a whole, presents fairly, in all material respects, the information set forth therein.
We have also audited, in accordance with the standards of the Public Company Accounting Oversight Board (United States), the Company’s internal control over financial reporting as of December 31, 2015, based on the criteria established in Internal Control — Integrated Framework (2013) issued by the Committee of Sponsoring Organizations of the Treadway Commission and our report dated March 14, 2016 expressed an unqualified opinion on the Company’s internal control over financial reporting.
/s/ Deloitte & Touche LLP
Salt Lake City, Utah
March 14, 2016
53
NATURE’S SUNSHINE PRODUCTS, INC. AND SUBSIDIARIES
CONSOLIDATED BALANCE SHEETS
(Amounts in thousands)
As of December 31, | 2015 | 2014 | ||||||
Assets | ||||||||
Current assets: | ||||||||
Cash and cash equivalents | $ | 41,420 | $ | 58,699 | ||||
Accounts receivable, net of allowance for doubtful accounts of $190 and $849, respectively | 7,700 | 6,732 | ||||||
Investments available for sale | 1,772 | 2,546 | ||||||
Inventories | 38,495 | 40,438 | ||||||
Deferred income tax assets | 5,021 | 4,950 | ||||||
Prepaid expenses and other | 7,110 | 7,884 | ||||||
Total current assets | 101,518 | 121,249 | ||||||
Property, plant and equipment, net | 68,728 | 51,343 | ||||||
Investment securities - trading | 1,044 | 1,038 | ||||||
Intangible assets, net | 559 | 704 | ||||||
Deferred income tax assets | 17,339 | 14,495 | ||||||
Other assets | 11,332 | 7,970 | ||||||
$ | 200,520 | $ | 196,799 | |||||
Liabilities and Shareholders’ Equity | ||||||||
Current liabilities: | ||||||||
Accounts payable | $ | 6,341 | $ | 5,237 | ||||
Accrued volume incentives | 14,913 | 16,867 | ||||||
Accrued liabilities | 23,726 | 28,957 | ||||||
Deferred revenue | 4,160 | 4,717 | ||||||
Revolving credit facility | 2,696 | — | ||||||
Income taxes payable | 1,300 | 2,131 | ||||||
Total current liabilities | 53,136 | 57,909 | ||||||
Liability related to unrecognized tax benefits | 7,809 | 6,598 | ||||||
Deferred compensation payable | 1,044 | 1,038 | ||||||
Other liabilities | 2,266 | 2,297 | ||||||
Total liabilities | 64,255 | 67,842 | ||||||
Commitments and Contingencies | ||||||||
Shareholders’ equity: | ||||||||
Common stock, no par value; 50,000 shares authorized, 18,588 and 18,662 shares issued and outstanding as of December 31, 2015, and 2014, respectively | 126,670 | 125,489 | ||||||
Retained earnings | 18,088 | 10,891 | ||||||
Noncontrolling interests | 2,750 | 3,781 | ||||||
Accumulated other comprehensive loss | (11,243 | ) | (11,204 | ) | ||||
Total shareholders’ equity | 136,265 | 128,957 | ||||||
$ | 200,520 | $ | 196,799 | |||||
See accompanying notes to consolidated financial statements.
54
NATURE’S SUNSHINE PRODUCTS, INC. AND SUBSIDIARIES
CONSOLIDATED STATEMENTS OF OPERATIONS
(Amounts in thousands, except per share information)
Year Ended December 31, | 2015 | 2014 | 2013 | |||||||||
Net sales revenue | $ | 324,705 | $ | 366,367 | $ | 369,826 | ||||||
Cost of sales | (85,345 | ) | (91,584 | ) | (92,344 | ) | ||||||
Gross profit | 239,360 | 274,783 | 277,482 | |||||||||
Operating expenses: | ||||||||||||
Volume incentives | 117,786 | 135,808 | 135,516 | |||||||||
Selling, general and administrative | 107,702 | 119,927 | 118,383 | |||||||||
Operating income | 13,872 | 19,048 | 23,583 | |||||||||
Other income (expense): | ||||||||||||
Interest and other income (expense), net | 1,486 | (72 | ) | 836 | ||||||||
Interest expense | (130 | ) | (187 | ) | (231 | ) | ||||||
Foreign exchange gains (losses), net | (1,948 | ) | 225 | 1,388 | ||||||||
(592 | ) | (34 | ) | 1,993 | ||||||||
Income from continuing operations before provision for income taxes | 13,280 | 19,014 | 25,576 | |||||||||
Provision (benefit) for income taxes | 1,740 | (743 | ) | 7,923 | ||||||||
Net income from continuing operations | 11,540 | 19,757 | 17,653 | |||||||||
Income (loss) from discontinued operations | 2,116 | (9,957 | ) | (44 | ) | |||||||
Net income | 13,656 | 9,800 | 17,609 | |||||||||
Net loss attributable to noncontrolling interests | (1,031 | ) | (219 | ) | — | |||||||
Net income attributable to common shareholders | $ | 14,687 | $ | 10,019 | $ | 17,609 | ||||||
Basic and diluted net income per common share | ||||||||||||
Basic earnings per share attributable to common shareholders: | ||||||||||||
Net income from continuing operations | $ | 0.67 | $ | 1.15 | $ | 1.10 | ||||||
Income (loss) from discontinued operations | $ | 0.11 | $ | (0.57 | ) | $ | — | |||||
Net income attributable to common shareholders | $ | 0.79 | $ | 0.58 | $ | 1.10 | ||||||
Diluted earnings per share attributable to common shareholders: | ||||||||||||
Net income from continuing operations | $ | 0.66 | $ | 1.12 | $ | 1.08 | ||||||
Income (loss) from discontinued operations | $ | 0.11 | $ | (0.56 | ) | $ | (0.01 | ) | ||||
Net income attributable to common shareholders | $ | 0.77 | $ | 0.56 | $ | 1.07 | ||||||
Weighted average basic common shares outstanding | 18,656 | 17,108 | 15,997 | |||||||||
Weighted average diluted common shares outstanding | 19,177 | 17,641 | 16,390 | |||||||||
Dividends declared per common share | $ | 0.40 | $ | 1.90 | $ | 1.90 | ||||||
See accompanying notes to consolidated financial statements.
55
CONSOLIDATED STATEMENTS OF COMPREHENSIVE INCOME
(Amounts in thousands)
Year Ended December 31, | 2015 | 2014 | 2013 | |||||||||
Net income | $ | 13,656 | $ | 9,800 | $ | 17,609 | ||||||
Foreign currency translation gain (loss) (net of tax) | 233 | (1,406 | ) | (3,480 | ) | |||||||
Net unrealized gains on investment securities (net of tax) | 22 | 30 | 83 | |||||||||
Reclassification of net realized gains on marketable securities in net income (net of tax) | (294 | ) | — | — | ||||||||
Write-off of Venezuela cumulative translation adjustments | — | 4,135 | — | |||||||||
Total comprehensive income | 13,617 | 12,559 | 14,212 | |||||||||
Net loss attributable to noncontrolling interests | (1,031 | ) | (219 | ) | — | |||||||
Total comprehensive income attributable to common shareholders | $ | 14,648 | $ | 12,778 | $ | 14,212 | ||||||
See accompanying notes to consolidated financial statements.
56
NATURE’S SUNSHINE PRODUCTS, INC. AND SUBSIDIARIES
CONSOLIDATED STATEMENTS OF CHANGES IN SHAREHOLDERS’ EQUITY
(Amounts in thousands, except per share data)
Common Stock | Retained Earnings | Noncontrolling Interests | Accumulated Other Comprehensive Income (Loss) | Total | ||||||||||||||||||
Shares | Value | |||||||||||||||||||||
Balance at January 1, 2013 | 15,810 | $ | 77,292 | $ | 48,910 | $ | — | $ | (10,566 | ) | $ | 115,636 | ||||||||||
Share-based compensation expense | — | 3,389 | — | — | — | 3,389 | ||||||||||||||||
Tax benefit from exercise of stock options | — | 653 | — | — | — | 653 | ||||||||||||||||
Proceeds from the exercise of stock options | 509 | 4,334 | — | — | — | 4,334 | ||||||||||||||||
Repurchase of common stock | (140 | ) | (2,546 | ) | — | — | — | (2,546 | ) | |||||||||||||
Cash dividends (1.90 per share) | — | — | (30,419 | ) | — | — | (30,419 | ) | ||||||||||||||
Net income | — | — | 17,609 | — | — | 17,609 | ||||||||||||||||
Other comprehensive loss | — | — | — | — | (3,397 | ) | (3,397 | ) | ||||||||||||||
Balance at December 31, 2013 | 16,179 | 83,122 | 36,100 | — | (13,963 | ) | 105,259 | |||||||||||||||
Share-based compensation expense | — | 3,948 | — | — | — | 3,948 | ||||||||||||||||
Net proceeds from the issuance of shares to noncontrolling interests | 2,855 | 44,795 | — | — | — | 44,795 | ||||||||||||||||
Tax benefit from exercise of stock options | — | 307 | — | — | — | 307 | ||||||||||||||||
Proceeds from the exercise of stock options | 124 | 772 | — | — | — | 772 | ||||||||||||||||
Repurchase of common stock | (496 | ) | (7,455 | ) | — | — | — | (7,455 | ) | |||||||||||||
Cash dividends (1.90 per share) | — | — | (35,228 | ) | — | — | (35,228 | ) | ||||||||||||||
Net income | — | — | 10,019 | (219 | ) | — | 9,800 | |||||||||||||||
Noncontrolling interests investment in Nature’s Sunshine Hong Kong Limited | — | — | — | 4,000 | — | 4,000 | ||||||||||||||||
Other comprehensive loss | — | — | — | — | 2,759 | 2,759 | ||||||||||||||||
Balance at December 31, 2014 | 18,662 | 125,489 | 10,891 | 3,781 | (11,204 | ) | 128,957 | |||||||||||||||
Share-based compensation expense | — | 4,485 | — | — | — | 4,485 | ||||||||||||||||
Tax deficiency from exercise of stock options | — | (520 | ) | — | — | — | (520 | ) | ||||||||||||||
Proceeds from the exercise of stock options | 427 | 3,861 | — | — | — | 3,861 | ||||||||||||||||
Repurchase of common stock | (501 | ) | (6,645 | ) | — | — | — | (6,645 | ) | |||||||||||||
Cash dividends (0.40 per share) | — | — | (7,490 | ) | — | — | (7,490 | ) | ||||||||||||||
Net income | — | — | 14,687 | (1,031 | ) | — | 13,656 | |||||||||||||||
Other comprehensive income | — | — | — | — | (39 | ) | (39 | ) | ||||||||||||||
Balance at December 31, 2015 | 18,588 | $ | 126,670 | $ | 18,088 | $ | 2,750 | $ | (11,243 | ) | $ | 136,265 | ||||||||||
See accompanying notes to consolidated financial statements.
57
NATURE’S SUNSHINE PRODUCTS, INC. AND SUBSIDIARIES
CONSOLIDATED STATEMENTS OF CASH FLOWS
(Amounts in Thousands)
Year Ended December 31, | 2015 | 2014 | 2013 | |||||||||
CASH FLOWS FROM OPERATING ACTIVITIES: | ||||||||||||
Net income | $ | 13,656 | $ | 9,800 | $ | 17,609 | ||||||
Adjustments to reconcile net income to net cash provided by operating activities: | ||||||||||||
Write-off of cumulative translation adjustments | — | 4,135 | — | |||||||||
Impairment of Venezuela property, plant and equipment, net | — | 2,947 | — | |||||||||
Provision for doubtful accounts | 21 | (121 | ) | 535 | ||||||||
Depreciation and amortization | 4,525 | 4,409 | 4,466 | |||||||||
Share-based compensation expense | 4,485 | 3,948 | 3,389 | |||||||||
Tax benefit from stock option exercise | — | (307 | ) | (653 | ) | |||||||
(Gain) loss on sale of property and equipment | (2,703 | ) | 132 | (128 | ) | |||||||
Deferred income taxes | (3,373 | ) | (3,927 | ) | 1,092 | |||||||
Amortization of bond discount | — | 3 | 1 | |||||||||
Purchase of trading investment securities | (252 | ) | (162 | ) | (88 | ) | ||||||
Proceeds from sale of trading investment securities | 239 | 151 | 510 | |||||||||
Realized and unrealized gains on investments | (470 | ) | (56 | ) | (122 | ) | ||||||
Foreign exchange losses (gains) | 1,948 | (225 | ) | (1,254 | ) | |||||||
Changes in assets and liabilities: | ||||||||||||
Accounts receivable | (1,091 | ) | 3,457 | (1,358 | ) | |||||||
Inventories | 933 | 748 | 838 | |||||||||
Prepaid expenses and other | 636 | 3,411 | (5,728 | ) | ||||||||
Other assets | (4,010 | ) | (1,235 | ) | (303 | ) | ||||||
Accounts payable | 593 | (359 | ) | (552 | ) | |||||||
Accrued volume incentives | (1,427 | ) | (1,905 | ) | 1,286 | |||||||
Accrued liabilities | (3,451 | ) | (5,360 | ) | 7,379 | |||||||
Deferred revenue | (557 | ) | 544 | (138 | ) | |||||||
Income taxes payable | (914 | ) | 25 | 1,071 | ||||||||
Liability related to unrecognized tax positions | 1,368 | (5,804 | ) | 1,831 | ||||||||
Deferred compensation payable | 6 | (67 | ) | (305 | ) | |||||||
Net cash provided by operating activities | 10,162 | 14,182 | 29,378 | |||||||||
CASH FLOWS FROM INVESTING ACTIVITIES: | ||||||||||||
Purchases of property, plant and equipment | (22,527 | ) | (26,285 | ) | (8,570 | ) | ||||||
Proceeds from sale of property, plant and equipment | 3,128 | 85 | 248 | |||||||||
Purchases of investments available for sale | (3 | ) | (721 | ) | (442 | ) | ||||||
Proceeds from sale/maturities of investments available for sale | 810 | 247 | 200 | |||||||||
Net cash used in investing activities | (18,592 | ) | (26,674 | ) | (8,564 | ) | ||||||
CASH FLOWS FROM FINANCING ACTIVITIES: | ||||||||||||
Payments of cash dividends | (7,490 | ) | (35,228 | ) | (30,419 | ) | ||||||
Borrowings on long-term debt | — | — | 10,000 | |||||||||
Net borrowings on revolving credit facility | 2,696 | — | — | |||||||||
Principal payments of long-term debt | — | (12,267 | ) | (3,353 | ) | |||||||
Net proceeds from the issuance of shares to noncontrolling interests | — | 44,795 | — | |||||||||
Investment by noncontrolling interests | — | 4,000 | — | |||||||||
Proceeds from exercise of stock options | 3,861 | 772 | 4,334 | |||||||||
Tax benefit from stock option exercise | — | 307 | 653 | |||||||||
Repurchase of common stock | (6,645 | ) | (7,455 | ) | (2,546 | ) | ||||||
Net cash used in financing activities | (7,578 | ) | (5,076 | ) | (21,331 | ) | ||||||
Effect of exchange rates on cash and cash equivalents | (1,271 | ) | (980 | ) | (1,477 | ) | ||||||
Net decrease in cash and cash equivalents | (17,279 | ) | (18,548 | ) | (1,994 | ) | ||||||
Cash and cash equivalents at beginning of the year | 58,699 | 77,247 | 79,241 | |||||||||
Cash and cash equivalents at end of the year | $ | 41,420 | $ | 58,699 | $ | 77,247 | ||||||
58
Year Ended December 31, | 2015 | 2014 | 2013 | |||||||||
Supplemental disclosure of cash flow information: | ||||||||||||
Cash paid for income taxes | $ | 9,782 | $ | 6,450 | $ | 10,278 | ||||||
Cash paid for interest | 56 | 171 | 128 | |||||||||
Supplemental disclosure of noncash investing and financing activities: | ||||||||||||
Purchases of property, plant and equipment included in accounts payable and accrued liabilities | $ | 1,081 | $ | 780 | $ | 155 | ||||||
See accompanying notes to consolidated financial statements.
59
NATURE’S SUNSHINE PRODUCTS, INC. AND SUBSIDIARIES
NOTES TO CONSOLIDATED FINANCIAL STATEMENTS
NOTE 1: NATURE OF OPERATIONS AND SIGNIFICANT ACCOUNTING POLICIES
Nature of Operations
Nature’s Sunshine Products, Inc., together with its subsidiaries (hereinafter referred to collectively as the “Company”), is a natural health and wellness company primarily engaged in the manufacturing and direct selling of nutritional and personal care products. The Company is a Utah corporation with its principal place of business in Lehi, Utah, and sells its products to a sales force of independent Managers and Distributors who use the products themselves or resell them to other independent Distributors or consumers. The formulation, manufacturing, packaging, labeling, advertising, distribution and sale of each of the Company’s major product groups are subject to regulation by one or more governmental agencies.
The Company markets its products in Australia, Austria, Belarus, Canada, Colombia, Costa Rica, the Czech Republic, Denmark, the Dominican Republic, Ecuador, El Salvador, Finland, Germany, Guatemala, Honduras, Hong Kong, Iceland, Indonesia, Ireland, Italy, Japan, Kazakhstan, Latvia, Lithuania, Malaysia, Mexico, Moldova, Mongolia, the Netherlands, New Zealand, Nicaragua, Norway, Panama, the Philippines, Poland, Russia, Singapore, Slovenia, South Korea, Spain, Sweden, Taiwan, Thailand, Ukraine, the United Kingdom, the United States and Vietnam. The Company also exports its products to Argentina, Australia, Chile, Israel, New Zealand, Norway, Peru and the United Kingdom.
Principles of Consolidation
The accompanying consolidated financial statements include the accounts and transactions of the Company and its subsidiaries. At December 31, 2015 and 2014, substantially all of the Company’s subsidiaries were wholly owned. The Company operates a limited number of markets in jurisdictions where local laws require the formation of a partnership with an entity domiciled in that market. These partners have no rights to participate in the sharing of revenues, profits, losses or distribution of assets upon liquidation of these partnerships.
Intercompany balances and transactions have been eliminated in consolidation.
Use of Estimates
The preparation of consolidated financial statements in accordance with accounting principles generally accepted in the United States (“GAAP”) requires management to make estimates and assumptions that affect the reported amounts of assets, liabilities, revenues and expenses, and related disclosure of contingent assets and liabilities, in these financial statements and accompanying notes. Actual results could differ from these estimates and those differences could have a material effect on the Company’s financial position and results of operations.
The significant accounting estimates inherent in the preparation of the Company’s financial statements include estimates associated with its evaluation of impairment of long-lived assets, the determination of liabilities related to Manager and Distributor incentives, the determination of income tax assets and liabilities, certain other non-income tax and value-added tax contingencies, legal contingencies, and the valuation of investments. In addition, significant estimates form the basis for allowances with respect to the collection of accounts receivable, inventory valuations and self-insurance liabilities associated with product liability and medical claims. Various assumptions and other factors enter into the determination of these significant estimates. The process of determining significant estimates takes into account historical experience and current and expected economic conditions.
Classification of Belarus as a Highly Inflationary Economy and Devaluation of Its Currency
Since June 30, 2012, Belarus has been designated as a highly inflationary economy. The U.S. dollar is the Company’s functional currency for this market. As a result, there were no resulting gains or losses from a re-measurement of the financial statements using official rates of the Company’s Belarusian subsidiary. However, as a result of the weakening of the Belarusian ruble, the purchasing power of the Company’s independent Distributors in this market has diminished. During the periods ended December 31, 2015, 2014, and 2013, the Company’s Belarusian subsidiary’s net sales revenue represented approximately 1.8 percent, 2.4 percent and 2.2 percent of consolidated net sales revenue, respectively.
60
Cash and Cash Equivalents
The Company considers all highly liquid short-term investments with original maturities of three months or less to be cash equivalents. Substantially all of the Company’s cash deposits either exceed the United States federally insured limit or are located in countries that do not have government insured accounts or are subject to tax withholdings when repatriating earnings.
Accounts Receivable
Accounts receivable consist principally of receivables from credit card companies, arising from the sale of products to the Company’s independent Distributors, and receivables from independent Distributors in foreign markets. Accounts receivable have been reduced by an allowance for amounts that may be uncollectible in the future. However, due to the geographic dispersion of credit card and Distributor receivables, the collection risk is not considered to be significant. Substantially all of the receivables from credit card companies were current as of December 31, 2015 and 2014. Although receivables from independent Distributors can be significant, the Company performs ongoing credit evaluations of its importers and maintains an allowance for potential credit losses. This estimated allowance is based primarily on the aging category, historical trends and management’s evaluation of the financial condition of the customer. This reserve is adjusted periodically as information about specific accounts becomes available.
Investment Securities
The Company’s available-for-sale investment portfolio is recorded at fair value and consists of U.S. government security funds. These investments are valued using (a) quoted prices for identical assets in active markets or (b) from significant inputs that are observable or can be derived from or corroborated by observable market data for substantially the full term of the asset. The Company’s trading portfolio is recorded at fair value and consists of various marketable securities that are valued using quoted prices in active markets.
Regardless of the Company’s intent to sell a security, the Company performs additional analysis on all securities with unrealized losses to evaluate losses associated with the creditworthiness of the security. Credit losses are identified where the Company does not expect to receive cash flows sufficient to recover the amortized cost basis of a security.
For equity securities, when assessing whether a decline in fair value below the Company’s cost basis is other-than-temporary, the Company considers the fair market value of the security, the length of time and extent to which market value has been less than cost, the financial condition and near-term prospects of the issuer as well as specific events or circumstances that may influence the operations of the issuer, and the Company’s intent and ability to hold the investment for a sufficient time in order to enable recovery of the cost. New information and the passage of time can change these judgments. Where the Company has determined that it lacks the intent and ability to hold an equity security to its expected recovery, the security’s decline in fair value is deemed to be other-than-temporary and is recorded within earnings as an impairment loss.
The Company also has certain investment securities classified as trading securities. The Company maintains its trading securities portfolio to generate returns that are offset by corresponding changes in certain liabilities related to the Company’s deferred compensation plans (see Note 13). The trading securities portfolio consists of marketable securities, which are recorded at fair value and are included in long-term investment securities on the consolidated balance sheets because they remain assets of the Company until they are actually paid out to the participants. These investment securities are not available to the Company to fund its operations as they are restricted for the payment of the deferred compensation payable. The Company has established a rabbi trust to finance obligations under the plan. Both realized and unrealized gains and losses on trading securities are included in interest and other income.
Fair Value of Financial Instruments
The Company’s financial instruments consist primarily of cash and cash equivalents, accounts receivable, investments, accounts payable and the revolving credit facility. Other than investments, which are carried at fair value, and the revolving credit facility, the carrying values of these financial instruments approximate their fair values due to their short-term nature. During the years ended December 31, 2015, and 2014, the Company did not have any write-offs related to the re-measurement of non-financial assets at fair value on a nonrecurring basis subsequent to their initial recognition.
61
Inventories
Inventories are stated at the lower-of-cost-or-market, using the first-in, first-out method. The components of inventory cost include raw materials, labor and overhead. To estimate any necessary obsolescence or lower-of-cost-or-market adjustments, various assumptions are made in regard to excess or slow-moving inventories, non-conforming inventories, expiration dates, current and future product demand, production planning and market conditions.
Property, Plant and Equipment
Property, plant and equipment are recorded at cost less accumulated depreciation and amortization. Depreciation is computed using the straight-line method over the estimated useful lives of the related assets. Estimated useful lives for buildings range from 20 to 50 years; building improvements range from 7 to 10 years; machinery and equipment range from 2 to 10 years; computer software and hardware range from 3 to 10 years; and furniture and fixtures range from 2 to 5 years. Leasehold improvements are amortized over the shorter of the lease term or the estimated useful lives of the related assets. Maintenance and repairs are expensed as incurred and major improvements are capitalized.
Intangible Assets
Intangible assets consist of purchased product formulations. Such intangible assets are amortized using the straight-line method over the estimated economic lives of the assets of 9 to 15 years. Intangible assets, net of accumulated amortization, totaled $0.6 million and $0.7 million, at December 31, 2015, and 2014, respectively.
Impairment of Long-Lived Assets
The Company reviews its long-lived assets, such as property, plant and equipment and intangible assets for impairment when events or changes in circumstances indicate that the carrying value of an asset may not be recoverable. The Company uses an estimate of future undiscounted net cash flows of the related assets or groups of assets over their remaining lives in measuring whether the assets are recoverable. An impairment loss is calculated by determining the difference between the carrying values and the fair values of these assets. Due to the continual currency devaluation of the Venezuelan bolivar, as of September 30, 2014, the Company incurred a $2.9 million impairment charge to write down the value of its fixed assets in Venezuela to $0.
Incentive Trip Accrual
The Company accrues for expenses associated with its direct sales program, which rewards independent Managers and Distributors with paid attendance for incentive trips, including Company conventions and meetings. Expenses associated with incentive trips are accrued over qualification periods as they are earned. The Company specifically analyzes incentive trip accruals based on historical and current sales trends as well as contractual obligations when evaluating the adequacy of the incentive trip accrual. Actual results could generate liabilities more or less than the amounts recorded. The Company has accrued convention and meeting costs of $4.8 million and $4.2 million at December 31, 2015, and 2014, respectively, which are included in accrued liabilities in the consolidated balance sheets.
Foreign Currency Translation
The local currency of the foreign subsidiaries is used as the functional currency, except for subsidiaries operating in highly inflationary economies or where the Company’s operations are served by a U.S. based subsidiary (for example Russia and Ukraine). The financial statements of foreign subsidiaries where the local currency is the functional currency are translated into U.S. dollars using exchange rates in effect at year end for assets and liabilities and average exchange rates during each year for the results of operations. Adjustments resulting from translation of financial statements are reflected in accumulated other comprehensive loss, net of income taxes. Foreign currency transaction gains and losses are included in other income (expense) in the consolidated statements of operations.
The functional currency in highly inflationary economies is the U.S. dollar and transactions denominated in the local currency are re-measured as if the functional currency were the U.S. dollar. The re-measurement of local currencies into U.S. dollars creates translation adjustments, which are included in the consolidated statements of operations. A country is considered to have a highly inflationary economy if it has a cumulative inflation rate of approximately 100 percent or more over a three year period as well as other qualitative factors including historical inflation rate trends (increasing and decreasing), the capital intensiveness of the operation, and other pertinent economic factors. Belarus was considered to be highly
62
inflationary as noted above. With the exception of Belarus, there were no countries considered to have a highly inflationary economy during 2015, 2014, or 2013.
Revenue Recognition
Net sales revenue and related volume incentive expenses are recorded when persuasive evidence of an arrangement exists, collectability is reasonably assured, the amount is fixed and determinable, and title and risk of loss have passed. The amount of the volume incentive is determined based upon the amount of qualifying purchases in a given month. Amounts received for undelivered merchandise are recorded as deferred revenue.
From time to time, the Company’s U.S. operations extend short-term credit associated with product promotions. In addition, for certain of the Company’s international operations, the Company offers credit terms consistent with industry standards within the country of operation. Payments to independent Managers and Distributors for sales incentives or rebates are recorded as a reduction of revenue. Payments for sales incentives and independent rebates are calculated monthly based upon qualifying sales. Membership fees are deferred and amortized as revenue over the life of the membership, primarily one year. Prepaid event registration fees are deferred and recognized as revenues when the related event is held.
A reserve for product returns is recorded based upon historical experience. The Company allows independent Managers or Distributors to return the unused portion of products within ninety days of purchase if they are not satisfied with the product. In some of the Company’s markets, the requirements to return product are more restrictive. Sales returns for the years 2015, 2014 and 2013, were $1.2 million, $1.5 million, and $1.5 million, respectively.
Amounts billed to customers for shipping and handling are reported as a component of net sales revenue. Shipping and handling revenues of approximately $9.2 million, $9.8 million, and $10.9 million were reported as net sales revenue for the years ended December 31, 2015, 2014, and 2013, respectively.
Taxes that have been assessed by governmental authorities and that are directly imposed on revenue-producing transactions between the Company and its customers, including sales, use, value-added, and some excise taxes, are presented on a net basis (excluded from net sales).
Advertising Costs
Advertising costs are expensed as incurred and classified in selling, general and administrative expenses. Advertising expense incurred for the years ended December 31, 2015, 2014, and 2013 totaled approximately $2.2 million, $2.3 million and $2.2 million, respectively.
Research and Development
All research and development costs are expensed as incurred and classified in selling, general and administrative expense. Total research and development expenses were approximately $2.8 million, $2.5 million, and $2.0 million in 2015, 2014, and 2013, respectively.
Contingencies
The Company is involved in certain legal proceedings. When a loss is considered probable in connection with litigation or non-income tax contingencies and when such loss can be reasonably estimated with a range, the Company records its best estimate within the range related to the contingency. If there is no best estimate, the Company records the minimum of the range. As additional information becomes available, the Company assesses the potential liability related to the contingency and revises the estimates. Revision in estimates of the potential liabilities could materially affect the Company's results of operations in the period of adjustment. The Company’s contingencies are discussed in further detail in Note 14.
Income Taxes
The Company’s income tax expense, deferred tax assets and liabilities and contingent reserves reflect management’s best assessment of estimated future taxes to be paid. The Company is subject to income taxes in both the U.S. and numerous foreign jurisdictions. Significant judgments and estimates are required in determining the consolidated income tax expense.
Deferred income taxes arise from temporary differences between the tax and financial statement recognition of revenue and expense. In evaluating the Company’s ability to recover its deferred tax assets, management considers all available positive
63
and negative evidence, including scheduled reversals of deferred tax liabilities, projected future taxable income, tax planning strategies and recent financial operations. In projecting future taxable income, the Company develops assumptions including the amount of future state, federal and foreign pretax operating income, the reversal of temporary differences, and the implementation of feasible and prudent tax planning strategies. These assumptions require significant judgment about the forecasts of future taxable income, and are consistent with the plans and estimates that the Company is using to manage the underlying businesses.
Changes in tax laws and rates could also affect recorded deferred tax assets and liabilities in the future. Management is not aware of any such changes that would have a material effect on the Company’s results of operations, cash flows or financial position.
The calculation of the Company’s tax liabilities involves dealing with uncertainties in the application of complex tax laws and regulations in a multitude of jurisdictions across its global operations. Income tax positions must meet a more-likely-than-not recognition threshold to be recognized.
Net Income (Loss) Per Common Share
Basic net income per common share (“Basic EPS”) is computed by dividing net income by the weighted average number of common shares outstanding during the period. Diluted net income per common share (“Diluted EPS”) reflects the potential dilution that could occur if stock options or other contracts to issue common stock were exercised or converted into common stock. The computation of Diluted EPS does not assume exercise or conversion of securities that would have an anti-dilutive effect on net income per common share.
64
Following is a reconciliation of the numerator and denominator of Basic EPS to the numerator and denominator of Diluted EPS for all years (dollar and share amounts in thousands, except for per share information):
2015 | 2014 | 2013 | |||||||||
Net income attributable to common shareholders: | |||||||||||
Net income from continuing operations | $ | 12,571 | $ | 19,976 | $ | 17,653 | |||||
Income (loss) from discontinued operations | $ | 2,116 | $ | (9,957 | ) | $ | (44 | ) | |||
Net income | $ | 14,687 | $ | 10,019 | $ | 17,609 | |||||
Basic weighted-average shares outstanding | 18,656 | 17,108 | 15,997 | ||||||||
Basic earnings per share attributable to common shareholders: | |||||||||||
Net income from continuing operations | $ | 0.67 | $ | 1.15 | $ | 1.10 | |||||
Income (loss) from discontinued operations | $ | 0.11 | $ | (0.57 | ) | $ | — | ||||
Net income | $ | 0.79 | $ | 0.58 | $ | 1.10 | |||||
Diluted Shares Outstanding | |||||||||||
Basic weighted-average shares outstanding | 18,656 | 17,108 | 15,997 | ||||||||
Stock-based awards | 521 | 533 | 393 | ||||||||
Diluted weighted-average shares outstanding | 19,177 | 17,641 | 16,390 | ||||||||
Diluted earnings per share attributable to common shareholders: | |||||||||||
Net income from continuing operations | $ | 0.66 | $ | 1.12 | $ | 1.08 | |||||
Income (loss) from discontinued operations | $ | 0.11 | $ | (0.56 | ) | $ | (0.01 | ) | |||
Net income | $ | 0.77 | $ | 0.56 | $ | 1.07 | |||||
Potentially dilutive shares excluded from diluted-per-share amounts: | |||||||||||
Stock options | 345 | 133 | 135 | ||||||||
Potentially anti-dilutive shares excluded from diluted-per-share amounts: | |||||||||||
Stock options | 688 | 210 | 210 | ||||||||
Potentially dilutive shares excluded from diluted-per-share amounts include performance-based options to purchase shares of common stock for which certain earnings metrics have not been achieved. Potentially anti-dilutive shares excluded from diluted-per-share amounts include both non-qualified stock options and unearned performance-based options to purchase shares of common stock with exercise prices greater than the weighted-average share price during the period and shares that would be anti-dilutive to the computation of diluted net income per share for each of the years presented.
Share-Based Compensation
The Company’s outstanding stock options include time-based stock options, which vest over differing periods ranging from the date of issuance up to 48 months from the option grant date; performance-based stock options, which have already vested upon achieving operating income margins of six, eight and ten percent as reported in four of five consecutive quarters over the term of the options; performance-based stock options, which vest upon achieving cumulative annual net sales revenue growth targets over a rolling two-year period, subject to the Company maintaining at least an eight percent operating income margin during the applicable period; and performance-based stock options, which vest upon achieving annual net sales targets over a rolling one-year period.
The Company recognizes all share-based payments to Directors and employees, including grants of stock options and restricted stock units, in the statement of operations based on their grant-date fair values. The Company records compensation expense, net of an estimated forfeiture rate, over the vesting period of the stock options based on the fair value of the stock options on the date of grant. The Company’s estimated forfeiture rate is based upon historical experience.
65
Comprehensive Income (Loss)
Comprehensive income (loss) includes all changes in shareholders’ equity except those resulting from investments by, and distributions to, shareholders. Accordingly, the Company’s comprehensive income (loss) includes net income (loss), net unrealized gains (losses) on investment securities, reclassifications of realized gains, and foreign currency adjustments that arise from the translation of the financial statements of the Company’s foreign subsidiaries.
Strategic Alliance with Fosun Pharma
On August 25, 2014, Nature’s Sunshine and Shanghai Fosun Pharmaceutical (Group) Co., Ltd. (“Fosun Pharma”), closed a transaction pursuant to which, the parties entered into a joint venture for operations in the People’s Republic of China (“China”), of which 80 percent is owned by Nature’s Sunshine and 20 percent is owned by a wholly-owned subsidiary of Fosun Pharma and completed a concurrent investment by Fosun Pharma in Nature’s Sunshine common stock issued pursuant to a private placement transaction with net proceeds of $44.8 million. Nature’s Sunshine used the net proceeds of the private placement transaction to fund its 80 percent share of the initial $20.0 million capitalization of the China joint venture, or $16.0 million, and to pay its shareholders a cash dividend of $1.50 per share, or $28.5 million. The Company consolidated the joint venture in its consolidated financial statements, with Fosun Pharma’s interest presented as a noncontrolling interest.
The joint venture, known as Nature’s Sunshine Hong Kong Limited, expects to market and distribute Nature’s Sunshine products in China. Nature’s Sunshine Hong Kong Limited currently anticipates deploying a multi-brand, multi-channel go-to-market strategy that will offer select Nature’s Sunshine-branded products through certain of Fosun Pharma’s existing retail locations across China, and select Synergy-branded products through a direct selling model. The time to market will be dependent upon regulatory processes, including product registration, permit and license approvals. Due to a change in the Chinese regulatory environment, the Company has indefinitely deferred its entry into the retail channel.
Pursuant to a concurrent private placement transaction, Nature’s Sunshine issued 2,855 shares of unregistered common stock to Fosun Pharma at a price of $16.19 per share, representing aggregate net proceeds to Nature’s Sunshine of $44.8 million. The purchase price represented a 10 percent premium to Nature’s Sunshine’s average stock price over the trailing 30 business day period as of June 26, 2014. As a result of the private placement transaction, Fosun Pharma owns approximately 15 percent of Nature’s Sunshine outstanding common shares with respect to which the Company has granted Fosun Pharma certain registration rights. In addition, Nature’s Sunshine appointed one director designated by Fosun Pharma to its board of directors.
Recent Accounting Pronouncements
In May 2014, the Financial Accounting Standards Board (“FASB”) issued Accounting Standards Update (“ASU”) No. 2014-09 Revenue from Contracts with Customers (Topic 606). This update requires an entity to recognize revenue to depict the transfer of promised goods and services to customers in an amount that reflects the consideration to which the entity expects to be entitled in exchange for those goods and services. As such, this update affects an entity that either enters into contracts with customers or transfers goods and services or enters into contracts for the transfer of nonfinancial assets unless those contracts are within the scope of other standards. This update will supersede the revenue recognition requirements in Topic 605, Revenue Recognition, and most industry-specific guidance, and creates a Topic 606. In July 2015, the FASB approved a proposal that extended the required implementation date one year to the interim and annual periods beginning after December 15, 2017, but would also permit companies to adopt the standard at the original effective date, which was the interim and annual periods beginning after December 15, 2016. The adoption of this ASU is not expected to have a material impact on the Company’s results of operations, consolidated financial statements and footnote disclosures.
In August 2014, the FASB issued ASU No. 2014-15, Presentation of Financial Statements - Going Concern (Subtopic 205-40). The purpose of this ASU is to incorporate into U.S. GAAP management’s responsibility to evaluate whether there is substantial doubt about an entity’s ability to continue as a going concern within one year after the date that the financial statements are issued, and to provide related footnote disclosures. This update is effective for the annual period ending after December 15, 2016, and for annual periods and interim periods thereafter. Early application is permitted. The adoption of this ASU is not expected to have a material impact on the Company’s results of operations, consolidated financial statements and footnote disclosures.
In February 2015, the FASB issued ASU No. 2015-02, Consolidations (Topic 810): “Amendments to the Consolidation Analysis.” This update makes amendments to the current consolidation guidance, including introducing a separate consolidation analysis specific to limited partnerships and other similar entities. Under this analysis, limited partnerships and
66
other similar entities will be considered a variable interest entity unless the limited partners hold substantive kick-out rights or participating rights. This update is effective for interim and annual periods beginning after December 15, 2015. The Company is currently evaluating both methods of adoption, as well as the effect this ASU will have on the Company’s results of operations, consolidated financial statements and footnote disclosures.
In July 2015, the FASB issued ASU No. 2015-11, Inventory (Topic 330): “Simplifying the Measurement of Inventory.” This update specifies that inventory should be subsequently measured at the lower of cost or net realizable value, which is the ordinary selling price less any completion, transportation and disposal costs. However, the ASU does not apply to inventory measured using the last-in-first-out or retail methods. This update is effective for interim and annual periods beginning after December 15, 2016. Adoption of the ASU is prospective. The adoption of this ASU is not expected to have a material impact on the Company’s results of operations, consolidated financial statements and footnote disclosures.
In November 2015, the FASB issued ASU 2015-17, Income Taxes (Topic 740): Balance Sheet Classification of Deferred Taxes. This guidance requires that entities with a classified statement of financial position present all deferred tax assets and liabilities as noncurrent. This update is effective for annual and interim periods for fiscal years beginning after December 15, 2016, which will require the Company to adopt the new guidance in the first quarter of fiscal 2018. Early adoption is permitted for financial statements that have not been previously issued and may be applied on either a prospective or retrospective basis. The adoption of this ASU is not expected to have a material impact on the Company’s results of operations, consolidated financial statements and footnote disclosures.
In January 2016, the FASB issued ASU No. 2016-01, Financial Instruments - Overall (Subtopic 825-10): "Recognition and Measurement of Financial Assets and Financial Liabilities." This update amends the guidance in U.S. GAAP on the classification and measurement of financial instruments. Although the ASU retains many current requirements, it significantly revises an entity’s accounting related to (1) the classification and measurement of investments in equity securities and (2) the presentation of certain fair value changes for financial liabilities measured at fair value. The ASU also amends certain disclosure requirements associated with the fair value of financial instruments. This update is effective for interim and annual periods beginning after December 15, 2017. The adoption of this ASU is not expected to have a material impact on the Company’s results of operations, consolidated financial statements and footnote disclosures.
In February 2016, the FASB issued ASU No. 2016-02, Leases (Topic 842): "Accounting for Leases." This update specifies that lessees should recognize assets and liabilities arising from all leases, except for leases with a lease term of 12 months or less. The recognition, measurement, and presentation of expenses and cash flows arising from a lease by a lessee will largely remain unchanged and continue to depend on its classification as a finance or operating lease. For public companies, the ASU will be effective for annual periods beginning after December 15, 2018 with early adoption permitted. The adoption of this ASU is not expected to have a material impact on the Company’s results of operations or footnote disclosures; however, it is expected to gross-up the consolidated balance sheet.
NOTE 2: DISCONTINUED OPERATIONS
In November 2014, the Company ceased its operations in Venezuela due to the difficulties and uncertainties related to import controls, difficulties associated with repatriating cash and high inflation. This market was part of the Company’s NSP Americas segment and all of the income (loss) from discontinued operations is related to the common shareholders of the Company.
The following table summarizes the operating results of the Company’s discontinued operations (dollar amounts in thousands):
2015 | 2014 | 2013 | |||||||||
Net sales revenue | $ | — | $ | 7,559 | $ | 8,270 | |||||
Income (loss) before income tax provision | $ | 2,604 | $ | (10,597 | ) | $ | 77 | ||||
Income tax provision (benefit) | 488 | (640 | ) | 121 | |||||||
Income (loss) from discontinued operations | $ | 2,116 | $ | (9,957 | ) | $ | (44 | ) | |||
Due to the economic instability of the Venezuelan market, as of September 30, 2014, the Company incurred a $2.9 million impairment charge to write down the value of its fixed assets in Venezuela to $0. The loss before income taxes for the year ended December 31, 2014, includes a charge of $7.8 million related to exiting Venezuela, of which $4.1 million is a non-
67
cash write-off of accumulated translation adjustments that were previously included in shareholders’ equity. The loss from discontinued operations did not have a material impact on the Company’s operating cash flows during 2014.
During the year ended December 31, 2015, the Company received $1.3 million in net proceeds from the sales of its fixed assets in Venezuela, which is included in the results from discontinued operations. During the year ended December 31, 2015, the Company released $1.3 million in accrued liabilities related to prior sales and use taxes as well as other litigation in Brazil, which is included in the results from discontinued operations. The Company ceased its operations in Brazil in 2010.
The income (loss) from discontinued operations did not have a material impact on the Company’s operating cash flows during the year ended December 31, 2015.
NOTE 3: RESTRUCTURING RELATED EXPENSES
In April 2015, the Company announced its plan to streamline its operations and refocus its activities on profitable growth opportunities. The planned streamlining is expected to reduce costs, improve efficiencies and renew focus on larger and more profitable Company markets. As part of the plan, the Company eliminated approximately 100 positions worldwide through both severance and attrition. It also ceased operations in Vietnam and abandoned the lease for the building in that market. The Company incurred approximately $3.3 million of non-recurring expenses during the year ended December 31, 2015, which are recorded primarily in selling, general and administrative expenses, of which $2.8 million was related to severance and termination benefits and $0.5 million was related to other exit costs. Of the restructuring costs incurred during the year ended December 31, 2015, only $0.6 million of severance costs and $0.2 million of other exit costs remained payable at year-end.
NOTE 4: INVENTORIES
The composition of inventories is as follows (dollar amounts in thousands):
As of December 31, | 2015 | 2014 | ||||||
Raw materials | $ | 13,351 | $ | 11,206 | ||||
Work in process | 789 | 534 | ||||||
Finished goods | 24,355 | 28,698 | ||||||
Total inventory | $ | 38,495 | $ | 40,438 | ||||
NOTE 5: PROPERTY, PLANT AND EQUIPMENT
The composition of property, plant and equipment is as follows (dollar amounts in thousands):
As of December 31, | 2015 | 2014 | ||||||
Land and improvements | $ | 2,518 | $ | 2,418 | ||||
Buildings and improvements | 30,013 | 31,245 | ||||||
Machinery and equipment | 22,293 | 19,716 | ||||||
Furniture and fixtures | 18,964 | 18,311 | ||||||
Computer software and hardware | 44,194 | 27,294 | ||||||
117,982 | 98,984 | |||||||
Accumulated depreciation and amortization | (49,254 | ) | (47,641 | ) | ||||
Total property, plant and equipment | $ | 68,728 | $ | 51,343 | ||||
Depreciation expense was $4.4 million, $4.3 million, and $4.3 million for the years ended December 31, 2015, 2014 and 2013, respectively.
NOTE 6: INTANGIBLE ASSETS
At December 31, 2015, and 2014, intangibles for product formulations had a gross carrying amount of $1.4 million, and $1.8 million, accumulated amortization of $0.8 million, and $1.1 million, and a net amount of $0.6 million, and $0.7 million, respectively. The estimated useful lives of the product formulations range from 9 to 15 years.
Amortization expense for intangible assets for the years ended December 31, 2015, 2014, and 2013 was $0.1 million, $0.1 million and $0.1 million, respectively. Estimated amortization expense for the five succeeding fiscal years and thereafter is as follows (dollar amounts in thousands):
Year Ending December 31, | |||
2016 | $ | 91 | |
2017 | 91 | ||
2018 | 91 | ||
2019 | 91 | ||
2020 | 91 | ||
Thereafter | 104 | ||
Total | $ | 559 | |
NOTE 7: ACCRUED LIABILITIES
The composition of accrued liabilities is as follows (dollar amounts in thousands):
As of December 31, | 2015 | 2014 | ||||||
Foreign non-income tax contingencies (See Note 14) | $ | 204 | $ | 2,622 | ||||
Sales, use and property tax | 3,231 | 3,575 | ||||||
Salaries and employee benefits | 9,706 | 13,445 | ||||||
Convention and meeting costs | 4,798 | 4,243 | ||||||
Other | 5,787 | 5,072 | ||||||
Total | $ | 23,726 | $ | 28,957 | ||||
NOTE 8: INVESTMENT SECURITIES
The amortized cost and estimated fair values of available-for-sale securities are as follows (dollar amounts in thousands):
As of December 31, 2015 | Amortized Cost | Gross Unrealized Gains | Gross Unrealized Losses | Fair Value | ||||||||||||
U.S. government securities funds | $ | 1,794 | $ | — | $ | (22 | ) | $ | 1,772 | |||||||
Total short-term investment securities | $ | 1,794 | $ | — | $ | (22 | ) | $ | 1,772 | |||||||
As of December 31, 2014 | Amortized Cost | Gross Unrealized Gains | Gross Unrealized Losses | Fair Value | ||||||||||||
Municipal obligations | $ | 100 | $ | 1 | $ | — | $ | 101 | ||||||||
U.S. government securities funds | 1,791 | — | (15 | ) | 1,776 | |||||||||||
Equity securities | 227 | 454 | (12 | ) | 669 | |||||||||||
Total short-term investment securities | $ | 2,118 | $ | 455 | $ | (27 | ) | $ | 2,546 | |||||||
During 2015, 2014, and 2013, the proceeds from the sales of available-for-sale securities were $0.8 million, $0.2 million, and $0.2 million, respectively. During the year ended December 31, 2015, the Company had gross realized gains of $0.3 million on sales of available-for-sale securities (net of tax). There were zero realized gains (losses) on sales of available-for-sales securities (net of tax) for the years ended December 31, 2014 and 2013, respectively.
The Company’s trading securities portfolio totaled $1.0 million and $1.0 million at December 31, 2015 and 2014, respectively, and generated losses of $5,000, and gains of $0.1 million, and $0.1 million, for the years ended December 31, 2015, 2014, and 2013, respectively.
NOTE 9: REVOLVING CREDIT FACILITY
The Company’s revolving credit agreement with Wells Fargo Bank, N.A., permits the Company to borrow up to $25.0 million through September 1, 2017, bearing interest at LIBOR plus 1.25 percent (1.75 percent and 1.50 percent as of
December 31, 2015 and 2014, respectively). The Company must pay an annual commitment fee of 0.25 percent on the unused portion of the commitment. Currently, the revolving credit agreement matures on September 1, 2017. The Company settles its net borrowings under the revolving credit agreement daily, and as a result, has classified its outstanding borrowings as current on its consolidated balance sheet as of December 31, 2105. At December 31, 2015, and 2014, the outstanding balance under the revolving credit agreement was $2.7 million and $0, respectively.
The revolving credit agreement contains restrictions on leverage, minimum net income, and consecutive quarterly net losses. In addition, the agreement restricts capital expenditures, lease expenditures, other indebtedness, liens on assets, guaranties, loans and advances, and the merger, consolidation and the transfer of assets except in the ordinary course of business. The Company remains in compliance with these debt covenants as of December 31, 2015.
NOTE 10: ACCUMULATED OTHER COMPREHENSIVE INCOME (LOSS)
The components of accumulated other comprehensive income (loss), net of tax, are as follows (dollar amounts in thousands):
Foreign Currency Translation Adjustments | Net Unrealized Gains (Losses) On Available-For-Sale Securities | Total Accumulated Other Comprehensive Loss | |||||||||
Balance as of January 1, 2013 | $ | (10,713 | ) | $ | 147 | $ | (10,566 | ) | |||
Activity, net of tax | (3,480 | ) | 83 | (3,397 | ) | ||||||
Balance as of December 31, 2013 | (14,193 | ) | 230 | (13,963 | ) | ||||||
Activity, net of tax | 2,729 | 30 | 2,759 | ||||||||
Balance as of December 31, 2014 | (11,464 | ) | 260 | (11,204 | ) | ||||||
Activity, net of tax | 233 | (272 | ) | (39 | ) | ||||||
Balance as of December 31, 2015 | $ | (11,231 | ) | (12 | ) | $ | (11,243 | ) | |||
NOTE 11: INCOME TAXES
Income from continuing operations before provision (benefit) for income taxes are taxed under the following jurisdictions (dollar amounts in thousands):
Year Ended December 31, | 2015 | 2014 | 2013 | |||||||||
Domestic | $ | 6,290 | $ | 4,577 | $ | 6,111 | ||||||
Foreign | 6,990 | 14,437 | 19,465 | |||||||||
Total | $ | 13,280 | $ | 19,014 | $ | 25,576 | ||||||
Components of the provision (benefit) for income taxes from continuing operations for each of the three years in the period ended December 31, 2015 are as follows (dollar amounts in thousands):
Year Ended December 31, | 2015 | 2014 | 2013 | |||||||||
Current: | ||||||||||||
Federal | $ | 537 | $ | (2,713 | ) | $ | (773 | ) | ||||
State | 73 | 514 | 399 | |||||||||
Foreign | 4,503 | 5,539 | 7,230 | |||||||||
Subtotal | 5,113 | 3,340 | 6,856 | |||||||||
Deferred: | ||||||||||||
Federal | (3,624 | ) | (3,804 | ) | 1,654 | |||||||
State | 430 | (326 | ) | 186 | ||||||||
Foreign | (179 | ) | 47 | (773 | ) | |||||||
Subtotal | (3,373 | ) | (4,083 | ) | 1,067 | |||||||
Total provision (benefit) for income taxes | $ | 1,740 | $ | (743 | ) | $ | 7,923 | |||||
The provision (benefit) for income taxes, as a percentage of income from continuing operations before provision (benefit) for income taxes, differs from the statutory U.S. federal income tax rate due to the following:
Year Ended December 31, | 2015 | 2014 | 2013 | ||||||
Statutory U.S. federal income tax rate | 35.0 | % | 35.0 | % | 35.0 | % | |||
State income taxes, net of U.S. federal income tax benefit | 2.7 | 0.6 | 1.4 | ||||||
U.S. tax impact of foreign operations | 2.8 | (73.0 | ) | (16.2 | ) | ||||
Valuation allowance change | (24.5 | ) | 48.8 | 4.3 | |||||
Unrecognized tax benefits | 11.2 | (8.6 | ) | 7.9 | |||||
Domestic manufacturing deduction | (1.3 | ) | (2.2 | ) | (1.3 | ) | |||
Nondeductible foreign expenses | (7.4 | ) | (1.8 | ) | 1.1 | ||||
Non-income tax contingencies | (2.0 | ) | (0.9 | ) | 0.2 | ||||
Other | (3.4 | ) | (1.8 | ) | (1.4 | ) | |||
Effective income tax rate | 13.1 | % | (3.9 | )% | 31.0 | % | |||
Pretax earnings of a foreign subsidiary or affiliate are subject to U.S. taxation when effectively repatriated. The Company does not intend to reinvest undistributed earnings indefinitely in the Company’s foreign subsidiaries.
Adjustments relating to the U.S. impact of foreign operations increased the effective tax rate by 2.8 percentage points in 2015, decreased the effective tax rate by 73.0 percentage points in 2014, and decreased the effective tax rate by 16.2 percentage points in 2013. The components of this calculation were:
Components of U.S. tax impact of foreign operations | 2015 | 2014 | 2013 | ||||||
Dividends received from foreign subsidiaries | 5.4 | % | 59.5 | % | 29.4 | % | |||
Foreign tax credits | (1.1 | ) | (121.3 | ) | (34.3 | ) | |||
Foreign tax rate differentials | (1.2 | ) | (11.0 | ) | (10.8 | ) | |||
Unremitted earnings | (0.3 | ) | (0.2 | ) | (0.5 | ) | |||
Total | 2.8 | % | (73.0 | )% | (16.2 | )% | |||
The significant components of the deferred tax assets (liabilities) are as follows (dollar amounts in thousands):
As of December 31, | 2015 | 2014 | ||||||
Inventory | $ | 1,200 | $ | 1,766 | ||||
Accrued liabilities | 4,104 | 5,023 | ||||||
Deferred compensation | 387 | 398 | ||||||
Equity-based compensation | 4,660 | 4,293 | ||||||
Intangibles assets | 267 | 442 | ||||||
Bad debts | 52 | 64 | ||||||
Net operating losses | 5,364 | 5,824 | ||||||
Foreign tax and withholding credits | 11,732 | 12,591 | ||||||
Non-income tax accruals | 54 | 53 | ||||||
Health insurance accruals | 154 | 230 | ||||||
Undistributed foreign earnings | — | 474 | ||||||
Other deferred tax assets | 2,070 | 1,488 | ||||||
Capital loss carryforward | 1,047 | 739 | ||||||
Valuation allowance | (6,565 | ) | (13,169 | ) | ||||
Total deferred tax assets | $ | 24,526 | 20,216 | |||||
Other deferred tax liabilities | (2,167 | ) | (778 | ) | ||||
Total deferred tax liabilities | (2,167 | ) | (778 | ) | ||||
Total deferred taxes, net | $ | 22,359 | $ | 19,438 | ||||
71
The components of deferred tax assets (liabilities), net are as follows (dollar amounts in thousands):
As of December 31, | 2015 | 2014 | ||||||
Net current deferred tax assets | $ | 5,021 | $ | 4,950 | ||||
Net non-current deferred tax assets | 17,339 | 14,495 | ||||||
Total net deferred tax assets | 22,360 | 19,445 | ||||||
Net current deferred tax liabilities | (1 | ) | (1 | ) | ||||
Net non-current deferred tax liabilities | — | (6 | ) | |||||
Total net deferred tax liabilities | (1 | ) | (7 | ) | ||||
Total deferred taxes, net | $ | 22,359 | $ | 19,438 | ||||
Net current deferred tax liabilities are included in accrued liabilities and net non-current deferred tax liabilities are included in other liabilities in the consolidated balance sheets.
Management has provided a valuation allowance of $6.6 million and $13.2 million as of December 31, 2015 and 2014, respectively, for certain deferred tax assets, including foreign net operating losses, for which management cannot conclude it is more likely than not that they will be realized. The Company reviewed its tax positions and decreased its valuation allowance by approximately $6.6 million in 2015 primarily due to a domestic decrease of $6.4 million and a foreign decrease of $0.2 million.
At December 31, 2015, foreign subsidiaries had unused operating loss carryovers for tax purposes of approximately $5.4 million. The net operating losses will expire at various dates from 2016 through 2025, with the exception of those in some foreign jurisdictions where there is no expiration. At December 31, 2015, the Company had approximately $11.7 million of foreign tax and withholding credits, most of which expire in 2024.
The Company is subject to regular audits by federal, state and foreign tax authorities. These audits may result in additional tax liabilities. The Company believes it has appropriately provided for income taxes for all years. Several factors drive the calculation of its tax reserves. Some of these factors include: (i) the expiration of various statutes of limitations; (ii) changes in tax law and regulations; (iii) the issuance of tax rulings; and (iv) settlements with tax authorities. Changes in any of these factors may result in adjustments to the Company’s reserves, which would impact its reported financial results.
The Company’s U.S. federal income tax returns for 2012 through 2014 are open to examination for federal tax purposes. The Company has several foreign tax jurisdictions that have open tax years from 2008 through 2015.
The total outstanding balance for liabilities related to unrecognized tax benefits at December 31, 2015 and 2014 were $7.8 million and $6.6 million, respectively, all of which would favorably impact the effective tax rate if recognized. Included in these amounts is approximately $2.0 million and $1.6 million, respectively, of combined interest and penalties. The Company increased interest and penalties approximately $0.3 million and $0.3 million for the years ended December 31, 2015 and 2014, respectively. The Company accounts for interest expense and penalties for unrecognized tax benefits as part of its income tax provision.
During the years ended December 31, 2015, 2014 and 2013, the Company added approximately $1.6 million, $2.3 million and $2.7 million, respectively, to its liability for unrecognized tax benefits. Included in these amounts are approximately $0.3 million, $0.3 million and $0.3 million for the years ended December 31, 2015, 2014 and 2013, respectively, related to interest expense and penalties. In addition, the Company recorded a benefit related to the lapse of applicable statute of limitations of approximately $0.1 million, $0.3 million and $0.3 million for the years ended December 31, 2015, 2014 and 2013, respectively, all of which favorably impacted the Company’s effective tax rate.
72
A reconciliation of the beginning and ending amount of liabilities associated with uncertain tax benefits, excluding interest and penalties, is as follows for the years (dollar amounts in thousands):
Year Ended December 31, | 2015 | 2014 | 2013 | |||||||||
Unrecognized tax benefits, opening balance | $ | 4,950 | $ | 11,050 | $ | 9,519 | ||||||
Settlement of liability reclassified as income tax payable | (104 | ) | (591 | ) | (10 | ) | ||||||
Payments on liability | — | — | — | |||||||||
Tax positions taken in a prior period | ||||||||||||
Gross increases | — | — | — | |||||||||
Gross decreases | (47 | ) | (6,614 | ) | (184 | ) | ||||||
Tax positions taken in the current period | ||||||||||||
Gross increases | 1,252 | 1,934 | 2,356 | |||||||||
Gross decreases | — | — | — | |||||||||
Lapse of applicable statute of limitations | (69 | ) | (244 | ) | (323 | ) | ||||||
Currency translation adjustments | (157 | ) | (585 | ) | (308 | ) | ||||||
Unrecognized tax benefits, ending balance | $ | 5,825 | $ | 4,950 | $ | 11,050 | ||||||
The Company anticipates that liabilities related to unrecognized tax benefits will increase approximately $0.8 million to $1.2 million within the next twelve months due to additional transactions related to commissions and transfer pricing.
The Company believes that it is reasonably possible that unrecognized tax benefits may change by $0 to $0.2 million within the next twelve months due to the expiration of statutes of limitations in various jurisdictions.
Although the Company believes its estimates are reasonable, the Company can make no assurance that the final tax outcome of these matters will not be different from that which it has reflected in its historical income tax provisions and accruals. Such differences could have a material impact on the Company’s income tax provision and operating results in the period in which the Company makes such determination.
NOTE 12: CAPITAL TRANSACTIONS
Dividends
The declaration of future dividends is subject to the discretion of the Company’s Board of Directors and will depend upon various factors, including the Company’s earnings, financial condition, restrictions imposed by any indebtedness that may be outstanding, cash requirements, future prospects and other factors deemed relevant by its Board of Directors.
On February 25, 2015, the Company announced a cash dividend of $0.10 per common share in an aggregate amount of $1.9 million that was paid on March 23, 2015, to shareholders of record on March 12, 2015. On May 7, 2015, the Company announced a cash dividend of $0.10 per common share in an aggregate amount of $1.9 million that was paid on June 2, 2015, to shareholders of record on May 22, 2015. On August 10, 2015, the Company announced a cash dividend of $0.10 per common share in an aggregate amount of $1.9 million that was paid on September 8, 2015, to shareholders of record on August 25, 2015. On November 3, 2015, the Company announced a cash dividend of $0.10 per common share in an aggregate amount of $1.9 million that was paid on November 30, 2015, to shareholders of record on November 18, 2015.
Share Repurchase Program
In December 2014, the Company completed share repurchases under its previously announced $10.0 million share repurchase program. In November 2014, the Board of Directors authorized a $20.0 million share repurchase program beginning January 1, 2015. Such purchases may be made in the open market, through block trades, in privately negotiated transactions or otherwise. The timing and amount of any shares repurchased will be determined based on the Company’s evaluation of market conditions and other factors and the program may be discontinued or suspended at any time. At December 31, 2015, the remaining balance available for repurchases under the program was $13.4 million.
73
The following is a summary of the Company’s repurchases of common shares during the year ended December 31, 2015 (dollar and share amounts in thousands, except for per share information):
Period | Number of Shares | Average Price Paid per Share (includes commissions) | Program Balance Used for Repurchases | ||||||||
January 1 — March 31, 2015 | 203 | $ | 14.06 | $ | 2,853 | ||||||
April 1 — June 30, 2015 | 94 | 13.13 | 1,228 | ||||||||
July 1 — September 30, 2015 | 162 | 12.64 | 2,045 | ||||||||
October 1 — December 31, 2015 | 42 | 12.07 | 519 | ||||||||
501 | $ | 13.26 | $ | 6,645 | |||||||
To enhance the Company’s ability to repurchase shares, the Company established a trading plan pursuant to Rule 10b5-1 under the Securities Exchange Act of 1934 (the “Exchange Act”). A plan under Rule 10b5-1 allows the Company to repurchase its shares at times when it otherwise might be prevented from doing so in compliance with insider trading laws or because of a self-imposed trading blackout period. Repurchases are subject to Securities and Exchange Commission (“SEC”) regulations as well as certain price, market volume and timing constraints specified in the trading plan.
Share-Based Compensation
During the year ended December 31, 2012, the Company’s shareholders adopted and approved the Nature’s Sunshine Products, Inc. 2012 Stock Incentive Plan (the “2012 Incentive Plan”). The 2012 Incentive Plan provides for the grant of incentive stock options, non-statutory stock options, stock appreciation rights, restricted stock, restricted stock units, dividend equivalent rights, performance awards, stock awards and other stock-based awards. The Compensation Committee of the Board of Directors has authority and discretion to determine the type of award as well as the amount, terms and conditions of each award under the 2012 Incentive Plan, subject to the limitations of the 2012 Incentive Plan. A total of 1,500,000 shares of the Company’s common stock were originally authorized for the granting of awards under the 2012 Stock Incentive Plan. In January 2015, the Company’s shareholders approved an amendment to the 2012 Incentive Plan, to increase the number of shares of Common Stock reserved for issuance by 1,500,000 shares. The number of shares available for awards, as well as the terms of outstanding awards, are subject to adjustment as provided in the 2012 Incentive Plan for stock splits, stock dividends, recapitalizations and other similar events.
The Company also maintains a stock incentive plan, which was approved by shareholders in 2009 (the “2009 Incentive Plan”). The 2009 Incentive Plan also provided for the grant of incentive stock options, non-statutory stock options, stock appreciation rights, restricted stock, restricted stock units, dividend equivalent rights, performance awards, stock awards and other stock-based awards. Under the 2012 Incentive Plan, any shares subject to award, or awards forfeited or reacquired by the Company issued under the 2009 Incentive Plan are available for award up to a maximum of 400,000 shares.
Stock Options
The Company’s outstanding stock options include time-based stock options, which vest over differing periods ranging from the date of issuance up to 48 months from the option grant date; performance-based stock options, which have already vested upon achieving operating income margins of six, eight and ten percent as reported in four of five consecutive quarters over the term of the options; performance-based stock options, which vest upon achieving cumulative annual net sales revenue growth targets over a rolling two-year period, subject to the Company maintaining at least an eight percent operating income margin during the applicable period; and performance-based stock options, which vest upon achieving annual net sales targets over a rolling one-year period.
74
Stock option activity for 2015, 2014, and 2013 consisted of the following (share amounts in thousands, except for per share information):
Number of Shares | Weighted Average Exercise Price Per Share | |||||
Options outstanding at January 1, 2013 | 1,784 | $ | 11.81 | |||
Granted | 832 | 15.85 | ||||
Forfeited or canceled | (184 | ) | 13.65 | |||
Exercised | (506 | ) | 8.56 | |||
Options outstanding at December 31, 2013 | 1,926 | 12.54 | ||||
Granted | 258 | 15.38 | ||||
Forfeited or canceled | (23 | ) | 13.33 | |||
Exercised | (124 | ) | 6.42 | |||
Options outstanding at December 31, 2014 | 2,037 | 11.69 | ||||
Granted | 335 | 14.04 | ||||
Forfeited or canceled | (284 | ) | 14.07 | |||
Exercised | (405 | ) | 9.78 | |||
Options outstanding at December 31, 2015 | 1,683 | $ | 12.21 | |||
On September 19, 2014, and August 29, 2013, the Company paid special non-recurring cash dividends of $1.50 per common share. In accordance with the provisions of the Company’s stock incentive plans, the exercise price of all outstanding stock options on the ex-dividend dates were decreased by $1.50 per share in order to prevent a dilution of benefits or potential benefits intended to be made available to the stock option holders. Because this modification was required by the provisions of the Company’s stock incentive plans, no additional share-based compensation expense was recorded.
During the year ended December 31, 2015, the Company issued time-based stock options to purchase 335,000 shares of common stock under the 2012 Stock Incentive Plan to the Company’s Board of Directors and executive officers. These options were issued with a weighted-average exercise price of $14.04 per share and a weighted-average grant date fair value of $4.79 per share. All of the options issued have an option termination date of ten years from the option grant date.
During the year ended December 31, 2014, the Company issued options to purchase 258,000 shares of common stock under the 2012 Stock Incentive Plan to the Company’s executive officers and other employees, which are composed of both time-based stock options and net sales revenue performance-based stock options. These options were issued with a weighted-average exercise price of $15.38 per share and a weighted-average grant date fair value of $6.53 per share. All of the options issued have an option termination date of ten years from the option grant date.
During the year ended December 31, 2013, the Company issued time-based options to purchase 832,000 shares of common stock under the 2009 Incentive Plan to the Company’s new senior executives. These options were issued with a weighted average exercise price of $15.85 per share and a weighted average grant date fair value of $6.55 per share. All of the options issued have an option termination date of ten years from the option grant date.
For the years ended December 31, 2015, 2014, and 2013, the Company issued 405,000, 124,000, and 506,000 shares of common stock upon the exercise of stock options at an average exercise price of $9.78, $6.42, and $8.56 per share, respectively. The aggregate intrinsic values of options exercised during the years ended December 31, 2015, 2014, and 2013 was $1.4 million, $1.1 million, and $4.6 million, respectively. For the years ended December 31, 2015, 2014, and 2013, the Company recognized $0.5 million, $0.3 million, and $0.7 million of tax benefits from the exercise of stock options during the period, respectively.
75
The fair value of each option grant was estimated on the date of the grant using the Black-Scholes option-pricing model with the following weighted average assumptions for the years ended December 31, 2015, 2014, and 2013:
2015 | 2014 | 2013 | |||||||||
Weighted average grant date fair value of grants | $ | 4.79 | $ | 6.53 | $ | 6.55 | |||||
Expected life (in years) | 5.0 to 6.0 | 6.0 | 5.0 to 6.0 | ||||||||
Risk-free interest rate | 1.5 to 1.8 | 1.5 | 0.6 to 1.5 | ||||||||
Expected volatility | 42.6 to 52.3 | 56.7 | 55.9 to 58.2 | ||||||||
Dividend yield | 2.8 to 3.6 | 2.6 | 2.1 to 2.7 | ||||||||
Expected option lives and volatilities are based on historical data of the Company. The risk-free interest rate is calculated as the average U.S. Treasury bill rate that corresponds with the option life. The dividend yield is based on the Company’s historical and expected amount of dividend payouts, at the time of grant. On August 29, 2013, and September 19, 2014, the Company paid special non-recurring cash dividends of $1.50 per common share. The Company has excluded these special non-recurring cash dividends from the dividend yield used in the Black-Scholes option-pricing model calculations as it is not representative of future dividends to be declared by the Company.
Share-based compensation expense from time-based stock options for the years ended December 31, 2015, 2014, and 2013 was $1.6 million, $2.9 million and $3.2 million, respectively. As of December 31, 2015, 2014, and 2013, the unrecognized share-based compensation cost related to grants described above was $1.1 million, $2.0 million, and $3.3 million, respectively. As of December 31, 2015, the remaining compensation cost is expected to be recognized over the weighted-average period of approximately 1.6 years.
The Company has not recognized any share-based compensation expense related to the net sales revenue performance-based stock options for the year ended December 31, 2015 and 2014. Should the Company attain all of the net sales revenue metrics related to the net sales revenue performance-based stock option grants, the Company would recognize up to $0.7 million of potential share-based compensation expense.
The following table summarizes information about options outstanding and exercisable at December 31, 2015 (share amounts in thousands, except per share information):
Options Outstanding | Options Exercisable | |||||||||||||||||
Range of Option Prices Per Share | Options Outstanding | Weighted-Avg. Remaining Contractual Life | Weighted-Avg. Exercise Price Per Share | Options Exercisable | Weighted-Avg. Remaining Contractual Life | Weighted-Avg. Exercise Price Per Share | ||||||||||||
$2.35 to $9.99 | 179 | 4.3 | $ | 4.97 | 179 | 4.3 | $ | 4.97 | ||||||||||
$10.00 to $11.99 | 505 | 7.0 | 11.79 | 249 | 7.1 | 11.73 | ||||||||||||
$12.00 to $13.99 | 579 | 6.7 | 12.85 | 405 | 6.2 | 12.52 | ||||||||||||
$14.00 to $17.70 | 420 | 8.7 | 14.95 | 125 | 4.7 | 15.79 | ||||||||||||
1,683 | 958 | |||||||||||||||||
At December 31, 2015, the aggregate intrinsic value of outstanding options to purchase 1,683,000 shares of common stock, the exercisable options to purchase 958,000 shares of common stock, and options to purchase 588,000 shares of common stock expected to vest was $0.9 million, $0.9 million, and $0, respectively. At December 31, 2014, the aggregate intrinsic value of outstanding options to purchase 2,037,000 shares of common stock, the exercisable options to purchase 1,069,000 shares of common stock, and options to purchase 794,000 shares of common stock expected to vest was $6.8 million, $4.9 million, and $1.8 million, respectively.
Restricted Stock Units
The Company’s outstanding restricted stock units (RSUs) are time-based RSUs, which vest over differing periods ranging from 12 months up to 48 months from the RSU grant date. RSUs given to the Board of Directors contain a restriction period in which the shares are not issued until two years after vesting. At December 31, 2015 and 2014, there were 60,000 and 32,000 vested RSUs given to the Board of Directors that had a restriction period.
76
Restricted stock unit activity for the period ended December 31, 2015, 2014, and 2013 is as follows: (share amounts in thousands, except per share information):
Number of Shares | Weighted Average Grant Date Fair Value | |||||
Units outstanding at January 1, 2013 | 18 | $ | 12.07 | |||
Granted | 17 | 12.90 | ||||
Issued | (3 | ) | 12.07 | |||
Forfeited | — | — | ||||
Units outstanding at December 31, 2013 | 32 | 12.47 | ||||
Granted | 156 | 10.73 | ||||
Issued | — | — | ||||
Forfeited | (8 | ) | 15.37 | |||
Units outstanding at December 31, 2014 | 180 | 15.09 | ||||
Granted | 679 | 12.61 | ||||
Issued | (30 | ) | 13.63 | |||
Forfeited | (85 | ) | 12.84 | |||
Units outstanding at December 31, 2015 | 744 | 12.48 | ||||
On September 19, 2014, and August 29, 2013, the Company paid special non-recurring cash dividends of $1.50 per common share. In accordance with the provisions of the Company’s stock incentive plans, additional RSUs were issued in order to prevent a dilution of benefits or potential benefits intended to be made available to the RSU holders. Because this RSU issuance was required by the provisions of the Company’s stock incentive plans, no additional share-based compensation expense was recorded.
During the year ended December 31, 2015, the Company granted 679,000 restricted stock units (RSUs) of common stock under the 2012 Incentive Plan to the Company’s board, executive officers and other employees, which are composed of both time-based RSUs and net sales operating income and earnings per share performance-based RSUs. The time-based RSUs were issued with a weighted-average grant date fair value of $12.97 per share and vest in annual installments over a three year from the grant date or after a three-year cliff. The net sales and operating income and earnings per share performance-based RSUs were issued with a weighted-average grant date fair value of $12.13 per share and vest upon achieving both (i) net sales and operating income targets over a three year period from the grant date and (ii) earnings per share targets over a six year period from the grant date.
During the period ended December 31, 2014, the Company granted 156,000 restricted stock units (RSUs) of common stock under the 2012 Incentive Plan to the Company's board, executive officers and other employees. The RSUs were issued with a weighted average grant date fair value of $10.73 per share and vest in annual installments over a four year period from the grant date.
During the period ended December 31, 2013, the Company granted 17,000 restricted stock units (RSUs) of common stock under the 2012 Incentive Plan to the Board of Directors. The RSUs were issued with a weighted average grant date fair value of $12.90 per share and vest in 12 monthly installments over a one year period from the grant date.
RSUs are valued at the market value on the date of grant, which is the grant date share price discounted for expected dividend payments during the vesting period. For RSUs with post-vesting restrictions, a Finnerty Model was utilized to calculate a valuation discount from the market value of common shares reflecting the restriction embedded in the RSUs preventing the sale of the underlying shares over a certain period of time. The Finnerty Model proposes to estimate a discount for lack of marketability such as transfer restrictions by using an option pricing theory. This model has gained recognition through its ability to address the magnitude of the discount by considering the volatility of a company’s stock price and the length of restriction. The concept underpinning the Finnerty Model is that restricted stock cannot be sold over a certain period of time. Using assumptions previously determined for the application of the option pricing model at the valuation date, the Finnerty Model discount for lack of marketability is approximately 17.5 percent for a common share.
Share-based compensation expense from RSUs for the period ended December 31, 2015, 2014, and 2013, was approximately $2.9 million, $1.0 million, and $0.2 million, respectively. As of December 31, 2015, and 2014, the unrecognized
77
share-based compensation expense related to the grants described above was $2.5 million and $0.8 million, respectively. As of December 31, 2015, the remaining compensation expense is expected to be recognized over the weighted average period of approximately 1.9 years.
The Company has not recognized any share-based compensation expense related to the net sales revenue and EPS performance-based RSUs for the years ended December 31, 2015, 2014 and 2013. Should the Company attain all of the metrics related to the performance-based RSU grant, the Company would recognize up to $2.8 million of potential share-based compensation expense.
The number of shares issued upon vesting or exercise for restricted stock units granted, pursuant to the Company’s share-based compensation plans, is net of shares withheld to cover the minimum statutory withholding requirements that the Company pays on behalf of its employees, which was 8,000 shares for the year ended December 31, 2015. Although shares withheld are not issued, they are treated as common share repurchases for accounting purposes, as they reduce the number of shares that would have been issued upon vesting. These shares do not count against the authorized capacity under the repurchase program described above.
Stock Appreciations Rights
The Company’s outstanding stock appreciation rights (SARs) are time-based SARs, which vest over differing periods ranging from 12 months up to 48 months from the SAR grant date. The SARs have a strike price equal to the fair market value of one share of common stock on the grant date. Subsequent to vesting, the employee has the option to exercise the SAR and will receive the intrinsic value of the SAR as income on the exercise date. SARs do not entitle a participant to receive or purchase shares and are settled in cash. SARs will not reduce the number of shares of common stock available for issuance under the Company’s Stock Incentive Plans.
Stock appreciation right activity for the period ended December 31, 2015, is as follows (share amounts in thousands, except per share information):
Number of Shares | Weighted Average Grant Date Fair Value | |||||
Units outstanding at January 1, 2015 | 30 | $ | 5.47 | |||
Granted | — | — | ||||
Forfeited or canceled | (10 | ) | 5.86 | |||
Exercised | — | — | ||||
Units outstanding at December 31, 2015 | 20 | 5.27 | ||||
During the year ended December 31, 2015, the Company issued no time-based stock appreciation rights under the 2012 Stock Incentive Plan to the Company’s employees.
During the year ended December 31, 2014, the Company issued 30,000 time-based stock appreciation rights under the 2012 Stock Incentive Plan to the Company’s employees. These SARs were issued with a weighted-average exercise price of $13.86 per share and a weighted-average grant date fair value of $5.47 per share. All of the SARs issued have an option termination date of ten years from the option grant date.
Expected SAR lives and volatilities are based on historical data of the Company. The risk-free interest rate is calculated as the average U.S. Treasury bill rate that corresponds with the option life. The dividend yield is based on the Company’s historical and expected amount of dividend payouts, at the time of grant. On August 29, 2013, and September 19, 2014, the Company paid special non-recurring cash dividends of $1.50 per common share. The Company has excluded these special non-recurring cash dividends from the dividend yield used in the Black-Scholes SAR-pricing model calculations as it is not representative of future dividends to be declared by the Company.
Share-based compensation expense from SARs for the period ended December 31, 2015, was approximately $22,000. As of December 31, 2015, the unrecognized share-based compensation expense related to the grants described above was $32,000. As of December 31, 2015, the remaining compensation expense is expected to be recognized over the weighted average period of approximately 1.8 years.
78
NOTE 13: EMPLOYEE BENEFIT PLANS
Deferred Compensation Plans
The Company sponsors a qualified deferred compensation plan which qualifies under Section 401(k) of the Internal Revenue Code. During 2015, the Company made matching contributions of 60 percent of employee contributions up to a maximum of five percent of the employee’s compensation (the match was increased from 50 percent to 60 percent of employee contributions up to a maximum of five percent beginning in 2013). The Company’s contributions to the plan vest after a period of three years. During 2015, 2014, and 2013, the Company contributed to the plan approximately $0.9 million, $0.8 million and $0.8 million, respectively.
The Company provides a nonqualified deferred compensation plan for its officers and certain key employees. Under this plan, participants may defer up to 100 percent of their annual salary and bonus. Although participants direct the investment of these funds, they are classified as trading securities and are included in long-term investment securities on the consolidated balance sheets because they remain assets of the Company until they are actually paid out to the participants. The Company has established a trust to finance obligations under the plan. At the end of each year and at other times provided under the plan, the Company adjusts its obligation to a participant by the investment return or loss on the funds selected by the participant under rules established in the plan. Upon separation of employment of the participant with the Company, the obligation owed to the participant under the plan will be paid as a lump sum or over a period of either three or five years (and will continue to be adjusted by the applicable investment return or loss during the period of pay-out). The Company had deferred compensation plan assets of approximately $1.0 million and $1.0 million as of December 31, 2015, and 2014, respectively. The change in the liability associated with the deferred compensation plan is recorded in the deferred compensation payable.
NOTE 14: COMMITMENTS AND CONTINGENCIES
Contractual Obligations
The Company leases certain facilities and equipment used in its operations and accounts for leases with escalating payments using the straight-line method. The Company incurred expenses of approximately $6.3 million, $6.2 million, and $6.1 million in connection with operating leases during 2015, 2014, and 2013, respectively. The approximate aggregate commitments under non-cancelable operating leases in effect at December 31, 2015, were as follows (dollar amounts in thousands):
Year Ending December 31, | |||
2016 | $ | 5,454 | |
2017 | 4,318 | ||
2018 | 2,735 | ||
2019 | 415 | ||
2020 | 162 | ||
Thereafter | 290 | ||
Total | $ | 13,374 | |
The Company has entered into long-term agreements with third-parties in the ordinary course of business, in which it has agreed to pay a percentage of net sales in certain regions in which it operates, or royalties on certain products. In 2015, 2014, and 2013, the aggregate amounts of these payments were $0.1 million, $0.2 million, and $1.5 million, respectively.
In 2013, the Company began to significantly reinvest in its information technology systems. Included within this plan is an Oracle ERP implementation program to provide the Company with a single integrated software solution that will integrate the Company’s business process on a worldwide basis. The Company has committed to invest an additional $0.3 million over the course of the project and anticipates completion of this project in early 2017. The remaining amount of $0.3 million is expected to be paid 2016. Also, as of December 31, 2015, the Company had commitments to purchase manufacturing equipment of $2.4 million in 2016.
Legal Proceedings
The Company is party to various legal proceedings. Management cannot predict the ultimate outcome of these proceedings, individually or in the aggregate, or their resulting effect on the Company’s business, financial position, results of
79
operations or cash flows as litigation and related matters are subject to inherent uncertainties, and unfavorable rulings could occur. Were an unfavorable outcome to occur, there exists the possibility of a material adverse impact on the business, financial position, results of operations, or cash flows for the period in which the ruling occurs and/or future periods. The Company maintains general liability and excess liability insurance coverage. In addition, the Company is self-insured for product liability claims. However, no assurances can be given that such insurance will continue to be available at an acceptable cost to the Company, that such coverage will be sufficient to cover one or more large claims, or that the insurers will not successfully disclaim coverage as to a pending or future claim.
Since late 2007, the Company has administered its sales in Belarus, Georgia, Kazakhstan, Moldova, Mongolia, Russia and Ukraine (the “Territories”) through an International Reseller Agreement (“Reseller Agreement”) with a third party general dealer (the “General Dealer”) based in Russia. The General Dealer administers the marketing and distribution of the Company’s products in the Territories. As a part of its services, the General Dealer provides certain discounts (the “Discounts”) to its network of dealers related to the costs associated with transporting the Company’s products from the General Dealer to the dealers. In July 2013, the General Dealer began to withhold the amount of these Discounts from the funds remitted each month to the Company for the sale of the products, claiming that it is entitled to reimbursement for these costs under the Reseller Agreement. These withholdings totaled approximately $3.0 million at March 31, 2014.
The parties negotiated a resolution to the dispute, whereby the General Dealer paid the Company the $3.0 million of Discounts withheld and relinquished all claims to the reimbursement of Discounts with respect to periods prior to July 2013, and the parties agreed to a new three-year international reseller agreement, effective April 1, 2014.
Other Litigation
The Company is party to various other legal proceedings in several foreign jurisdictions related to value-added tax assessments and other civil litigation. While there is a reasonable possibility that a loss may be incurred, either the losses are not considered to be probable or the Company cannot at this time estimate the loss, if any; therefore, no provision for losses has been provided. The Company believes future payments related to these matters could range from $0 to approximately $0.2 million.
Non-Income Tax Contingencies
The Company has reserved for certain state sales and use tax and foreign non-income tax contingencies based on the likelihood of an obligation in accordance with accounting guidance for probable loss contingencies. Loss contingency provisions are recorded for probable losses at management’s best estimate of a loss, or when a best estimate cannot be made, a minimum loss contingency amount is recorded. The Company provides provisions for potential payments of tax to various tax authorities for contingencies related to non-income tax matters, including value-added taxes and sales tax. The Company provides provisions for U.S. state sales taxes in each of the states where the Company has nexus. As of December 31, 2015 and 2014, accrued liabilities include $0.3 million and $2.8 million, respectively, related to non-income tax contingencies. While management believes that the assumptions and estimates used to determine this liability are reasonable, the ultimate outcome of those matters cannot presently be determined. The Company believes future payments related to these matters could range from $0 to approximately $2.9 million.
Self-Insurance Liabilities
Similar to other manufacturers and distributors of products that are ingested, the Company faces an inherent risk of exposure to product liability claims in the event that, among other things, the use of its products results in injury. The Company has a wholly owned captive insurance company to provide it with product liability insurance coverage. The Company has accrued an amount that it believes is sufficient to cover probable and reasonably estimable liabilities related to product liability claims based on the Company’s history of such claims. However, there can be no assurance that these estimates will prove to be sufficient, nor can there be any assurance that the ultimate outcome of any litigation for product liability will not have a material negative impact on the Company’s business prospects, financial position, results of operations or cash flows.
The Company self-insures for certain employee medical benefits. The recorded liabilities for self-insured risks are calculated using actuarial methods and are not discounted. The liabilities include amounts for actual claims and claims incurred but not reported. Actual experience, including claim frequency and severity as well as health care inflation, could result in actual liabilities being more or less than the amounts currently recorded.
The Company reviews its self-insurance accruals on a quarterly basis and determines, based upon a review of its recent claims history and other factors, which portions of its self-insurance accruals should be considered short-term and long-term.
80
The Company has accrued $2.3 million and $2.6 million for product liability and employee medical claims at December 31, 2015 and 2014, respectively, of which $0.4 million and $0.7 million was classified as short-term. Such amounts are included in accrued liabilities and other long-term liabilities on the Company’s consolidated balance sheets.
Government Regulations
The Company is subject to governmental regulations pertaining to product formulation, labeling and packaging, product claims and advertising, and to the Company’s direct selling system. The Company is also subject to the jurisdiction of numerous foreign tax and customs authorities. Any assertions or determinations that either the Company or the Company’s independent Distributors are not in compliance with existing statutes, laws, rules or regulations could potentially have a material adverse effect on the Company’s operations. In addition, in any country or jurisdiction, the adoption of new statutes, laws, rules or regulations, or changes in the interpretation of existing statutes, laws, rules or regulations could have a material adverse effect on the Company and its operations. Although management believes that the Company is in compliance, in all material respects, with the statutes, laws, rules and regulations of every jurisdiction in which it operates, no assurance can be given that the Company’s compliance with applicable statutes, laws, rules and regulations will not be challenged by foreign authorities or that such challenges will not have a material adverse effect on the Company’s financial position, results of operations or cash flows.
NOTE 15: OPERATING BUSINESS SEGMENT AND INTERNATIONAL OPERATION INFORMATION
The Company has four business segments. These business segments are components of the Company for which separate information is available that is evaluated regularly by the chief executive officer in deciding how to allocate resources and in assessing relative performance.
The Company has two business segments that operate under the Nature’s Sunshine® Products brand and are divided based on the characteristics of their Distributor base, similarities in compensation plans, as well as the internal organization of NSP’s officers and their responsibilities (NSP Americas and NSP Russia, Central and Eastern Europe). The Company’s third business segment operates under the Synergy® WorldWide brand, which distributes its products through different selling and Distributor compensation plans and has products with formulations that are sufficiently different from those of NSP Americas and NSP Russia, Central and Eastern Europe to warrant accounting for these operations as a separate business segment. The Company’s fourth business segment, China and New Markets, anticipates deploying a multi-brand, multi-channel go-to-market strategy that offers select Nature’s Sunshine branded products through Fosun Pharma’s retail locations across China as well as ecommerce, and select Synergy branded products through a direct selling model. The time to market will be dependent upon regulatory processes including product registration and permit approvals. Due to a change in the Chinese regulatory environment, the Company has indefinitely deferred its entry into the retail channel. The China and New Markets segment also includes Company’s export sales business, in which the Company sells its products to various locally managed entities independent of the Company that have distribution rights for the relevant market. All of the net sales revenue to date in the China and New Markets segment is through the Company’s export business to foreign markets outside of China set forth above that were previously part of NSP Americas. Net sales revenues for each segment have been reduced by intercompany sales as they are not included in the measure of segment profit or loss reviewed by the chief executive officer. The Company evaluates performance based on contribution margin (loss) by segment before consideration of certain inter-segment transfers and expenses.
In the fourth quarter of 2014, the Company created the China and New Markets segment. The Company moved the reporting of its wholesale business, in which the Company sells its products to a locally managed entity independent of the Company that has distribution rights for the market, from the NSP Americas segment to the China and New Markets segment during the year ended December 31, 2014, as well as the results of its NSP Peru and United Kingdom markets, which were converted to wholesale markets during the prior year. The net sales revenue and contribution margin of this business for the year ended December 31, 2015 were $4.1 million and $1.9 million, respectively. The net sales revenue and contribution margin of this business for the year ended December 31, 2014 were $5.6 million and $2.6 million, respectively. The net sales revenue and contribution margin of this business for the year ended December 31, 2013 were $8.1 million and $3.2 million, respectively.
81
Reportable business segment information for the years ended December 31, 2015, 2014, and 2013 is as follows (dollar amounts in thousands):
Year Ended December 31, | 2015 | 2014 | 2013 | |||||||||
Net sales revenue: | ||||||||||||
NSP Americas | $ | 179,151 | $ | 182,395 | $ | 190,684 | ||||||
NSP Russia, Central and Eastern Europe | 27,408 | 50,274 | 62,747 | |||||||||
Synergy WorldWide | 114,081 | 128,101 | 108,290 | |||||||||
China and New Markets | 4,065 | 5,597 | 8,105 | |||||||||
Total net sales revenue | 324,705 | 366,367 | 369,826 | |||||||||
Contribution margin (1): | ||||||||||||
NSP Americas | 74,953 | 74,603 | 78,171 | |||||||||
NSP Russia, Central and Eastern Europe | 9,474 | 17,851 | 22,542 | |||||||||
Synergy WorldWide | 35,277 | 43,888 | 38,011 | |||||||||
China and New Markets | 1,870 | 2,633 | 3,242 | |||||||||
Total contribution margin | 121,574 | 138,975 | 141,966 | |||||||||
Selling, general and administrative | 107,702 | 119,927 | 118,383 | |||||||||
Operating income | 13,872 | 19,048 | 23,583 | |||||||||
Other income (loss), net | (592 | ) | (34 | ) | 1,993 | |||||||
Income from continuing operations before provision for income taxes | $ | 13,280 | $ | 19,014 | $ | 25,576 | ||||||
___________________________
(1) Contribution margin consists of net sales revenue less cost of sales and volume incentives expense.
Year Ended December 31, | 2015 | 2014 | 2013 | |||||||||
Capital expenditures: | ||||||||||||
NSP Americas | $ | 21,437 | $ | 25,581 | $ | 8,018 | ||||||
NSP Russia, Central and Eastern Europe | — | 8 | 4 | |||||||||
Synergy WorldWide | 302 | 1,321 | 534 | |||||||||
China and New Markets | 487 | — | — | |||||||||
Total capital expenditures | $ | 22,226 | $ | 26,910 | $ | 8,556 | ||||||
Depreciation and amortization: | ||||||||||||
NSP Americas | $ | 3,603 | $ | 3,438 | $ | 3,568 | ||||||
NSP Russia, Central and Eastern Europe | 26 | 25 | 27 | |||||||||
Synergy WorldWide | 885 | 946 | 871 | |||||||||
China and New Markets | 11 | — | — | |||||||||
Total depreciation and amortization | $ | 4,525 | $ | 4,409 | $ | 4,466 | ||||||
As of December 31, | 2015 | 2014 | ||||||
Assets: | ||||||||
NSP Americas | $ | 141,428 | $ | 129,371 | ||||
NSP Russia, Central and Eastern Europe | 5,122 | 6,679 | ||||||
Synergy WorldWide | 38,048 | 40,797 | ||||||
China and New Markets | 15,922 | 19,952 | ||||||
Total assets | $ | 200,520 | $ | 196,799 | ||||
82
From an individual country perspective, only the United States and South Korea comprises approximately 10 percent or more of consolidated net sales revenue for any of the years ended December 31, 2015, 2014, and 2013 as follows (dollar amounts in thousands):
Year Ended December 31, | 2015 | 2014 | 2013 | |||||||||
Net sales revenue: | ||||||||||||
United States | $ | 147,553 | $ | 148,219 | $ | 152,209 | ||||||
South Korea | 48,476 | 54,314 | 34,207 | |||||||||
Other | 128,676 | 163,834 | 183,410 | |||||||||
Total net sales revenue | $ | 324,705 | $ | 366,367 | $ | 369,826 | ||||||
Revenue generated by each of the Company’s product lines is set forth below (dollars in thousands):
Year Ended December 31, | 2015 | 2014 | 2013 | |||||||||
NSP Americas: | ||||||||||||
General health | $ | 80,315 | $ | 78,218 | $ | 80,379 | ||||||
Immunity | 22,042 | 23,549 | 23,374 | |||||||||
Cardiovascular | 12,331 | 12,566 | 13,018 | |||||||||
Digestive | 49,239 | 53,133 | 55,936 | |||||||||
Personal care | 3,575 | 4,000 | 5,162 | |||||||||
Weight management | 11,649 | 10,929 | 12,815 | |||||||||
179,151 | 182,395 | 190,684 | ||||||||||
NSP Russia, Central and Eastern Europe: | ||||||||||||
General health | $ | 11,433 | $ | 18,841 | $ | 22,690 | ||||||
Immunity | 3,328 | 6,512 | 7,902 | |||||||||
Cardiovascular | 1,714 | 3,104 | 4,324 | |||||||||
Digestive | 7,167 | 13,171 | 15,693 | |||||||||
Personal care | 2,716 | 6,073 | 8,817 | |||||||||
Weight management | 1,050 | 2,573 | 3,321 | |||||||||
27,408 | 50,274 | 62,747 | ||||||||||
Synergy WorldWide: | ||||||||||||
General health | $ | 43,829 | $ | 46,546 | $ | 36,723 | ||||||
Immunity | 752 | 974 | 1,394 | |||||||||
Cardiovascular | 34,191 | 42,449 | 42,154 | |||||||||
Digestive | 17,746 | 20,839 | 16,897 | |||||||||
Personal care | 5,697 | 7,196 | 7,097 | |||||||||
Weight management | 11,866 | 10,097 | 4,025 | |||||||||
114,081 | 128,101 | 108,290 | ||||||||||
China and New Markets: | ||||||||||||
General health | $ | 1,903 | $ | 2,370 | $ | 3,259 | ||||||
Immunity | 525 | 777 | 1,006 | |||||||||
Cardiovascular | 292 | 334 | 461 | |||||||||
Digestive | 1,011 | 1,608 | 2,365 | |||||||||
Personal care | 93 | 108 | 126 | |||||||||
Weight management | 241 | 400 | 888 | |||||||||
4,065 | 5,597 | 8,105 | ||||||||||
Total net sales revenue | $ | 324,705 | $ | 366,367 | $ | 369,826 | ||||||
83
From an individual country perspective, only the United States comprise 10 percent or more of consolidated property, plant and equipment as follows (dollar amounts in thousands):
As of December 31 | 2015 | 2014 | ||||||
Property, plant and equipment | ||||||||
United States | $ | 66,044 | $ | 48,013 | ||||
Other | 2,684 | 3,330 | ||||||
Total property, plant and equipment | $ | 68,728 | $ | 51,343 | ||||
Due to the continual currency devaluation of the Venezuelan bolivar, as of September 30, 2014, the Company incurred a $2.9 million impairment charge to write down the value of its fixed assets in Venezuela to $0.
NOTE 16: RELATED PARTY TRANSACTIONS
The Company maintains split-dollar life insurance policies on certain executives. The cash surrender value of $48,000 and $48,000 related to such policies is recorded in other assets as of December 31, 2015 and 2014, respectively.
Mr. Eugene Hughes, a former member of the Company’s Board of Directors and a shareholder, retired as an employee of the Company effective as of December 22, 2008. Prior to his retirement, the Company and Mr. Hughes entered into a Retirement and Consulting Agreement, dated as of December 9, 2008, pursuant to which Mr. Hughes provides consulting services to the Company for an initial term of eight years following his retirement. In exchange for such consulting services, Mr. Hughes will receive an annual compensation of $0.2 million for the first two years of service, and an annual compensation of $0.1 million for the remainder of the initial term.
NOTE 17: FAIR VALUE
The fair value of a financial instrument is the amount that could be received upon the sale of an asset or paid to transfer a liability in an orderly transaction between market participants at the measurement date. Financial assets are marked to bid prices and financial liabilities are marked to offer prices. Fair value measurements do not include transaction costs. A fair value hierarchy is used to prioritize the quality and reliability of the information used to determine fair values of each financial instrument. Categorization within the fair value hierarchy is based on the lowest level of input that is significant to the fair value measurement. The fair value hierarchy is defined into the following three categories:
Level 1: Quoted market prices in active markets for identical assets or liabilities.
Level 2: Observable market based inputs or unobservable inputs that are corroborated by market data.
Level 3: Unobservable inputs that are not corroborated by market data.
The following table presents the Company’s hierarchy for its asset measured at fair value on a recurring basis as of December 31, 2015 (dollar amounts in thousands):
Level 1 | Level 2 | Level 3 | |||||||||||||
Quoted Prices in Active Markets for Identical Assets | Significant Other Observable Inputs | Significant Unobservable Inputs | Total | ||||||||||||
Investments available-for-sale | |||||||||||||||
U.S. government security funds | $ | 1,772 | $ | — | $ | — | $ | 1,772 | |||||||
Investment securities | 1,044 | — | — | 1,044 | |||||||||||
Total assets measured at fair value on a recurring basis | $ | 2,816 | $ | — | $ | — | $ | 2,816 | |||||||
84
The following table presents the Company’s hierarchy for its asset measured at fair value on a recurring basis as of December 31, 2014:
Level 1 | Level 2 | Level 3 | |||||||||||||
Quoted Prices in Active Markets for Identical Assets | Significant Other Observable Inputs | Significant Unobservable Inputs | Total | ||||||||||||
Investments available-for-sale | |||||||||||||||
Municipal obligations | $ | — | $ | 101 | $ | — | $ | 101 | |||||||
U.S. government security funds | 1,776 | — | — | 1,776 | |||||||||||
Equity securities | 669 | — | — | 669 | |||||||||||
Investment securities | 1,038 | — | — | 1,038 | |||||||||||
Total assets measured at fair value on a recurring basis | $ | 3,483 | $ | 101 | $ | — | $ | 3,584 | |||||||
Investments available-for-sale — The majority of the Company’s investment portfolio consist of various securities such as state and municipal obligations, U.S. government security funds, short-term deposits and various equity securities. The Level 1 securities are valued using quoted prices for identical assets in active markets including equity securities and U.S. government treasuries. The Level 2 securities include investments in state and municipal obligations whereby all significant inputs are observable or can be derived from or corroborated by observable market data for substantially the full term of the asset.
Investment securities — The majority of the Company’s trading portfolio consists of various marketable securities that are valued using quoted prices in active markets.
For the years ended December 31, 2015 and 2014, there were no fair value measurements using significant unobservable inputs (Level 3).
85
NOTE 18: SUMMARY OF QUARTERLY OPERATIONS — UNAUDITED
The following tables presents the Company’s unaudited summary of quarterly operations during 2015 and 2014 for each of three month periods ended March 31, June 30, September 30, and December 31 (dollar amounts in thousands, except per share information).
For the Quarter Ended | |||||||||||||||
March 31, 2015 | June 30, 2015 | September 30, 2015 | December 31, 2015 | ||||||||||||
Net sales revenue | $ | 83,878 | $ | 81,247 | $ | 79,586 | $ | 79,994 | |||||||
Cost of sales | (21,881 | ) | (21,068 | ) | (20,643 | ) | (21,753 | ) | |||||||
Gross profit | 61,997 | 60,179 | 58,943 | 58,241 | |||||||||||
Volume incentives | 30,337 | 29,603 | 28,690 | 29,156 | |||||||||||
Selling, general and administrative | 26,330 | 27,392 | 27,115 | 26,865 | |||||||||||
Operating income | 5,330 | 3,184 | 3,138 | 2,220 | |||||||||||
Other expense | (318 | ) | (2 | ) | (247 | ) | (25 | ) | |||||||
Income from continuing operations before income taxes | 5,012 | 3,182 | 2,891 | 2,195 | |||||||||||
Provision (benefit) for income taxes | 809 | 787 | 1,284 | (1,140 | ) | ||||||||||
Net income from continuing operations | 4,203 | 2,395 | 1,607 | 3,335 | |||||||||||
Income from discontinued operations | 1,312 | — | 804 | — | |||||||||||
Net income | 5,515 | 2,395 | 2,411 | 3,335 | |||||||||||
Net loss attributable to noncontrolling interests | (152 | ) | (166 | ) | (355 | ) | (358 | ) | |||||||
Net income attributable to common shareholders | $ | 5,667 | $ | 2,561 | $ | 2,766 | $ | 3,693 | |||||||
Basic and diluted net income per common share | |||||||||||||||
Basic earnings per share attributable to common shareholders: | |||||||||||||||
Net income from continuing operations | $ | 0.23 | $ | 0.14 | $ | 0.10 | $ | 0.20 | |||||||
Income from discontinued operations | $ | 0.07 | $ | — | $ | 0.04 | $ | — | |||||||
Net income attributable to common shareholders | $ | 0.30 | $ | 0.14 | $ | 0.15 | $ | 0.20 | |||||||
Diluted earnings per share attributable to common shareholders: | |||||||||||||||
Net income from continuing operations | $ | 0.23 | $ | 0.13 | $ | 0.10 | $ | 0.19 | |||||||
Income from discontinued operations | $ | 0.07 | $ | — | $ | 0.04 | $ | — | |||||||
Net income attributable to common shareholders | $ | 0.30 | $ | 0.13 | $ | 0.14 | $ | 0.19 | |||||||
Dividends declared per common share | $ | 0.10 | $ | 0.10 | $ | 0.10 | $ | 0.10 | |||||||
86
For the Quarter Ended | |||||||||||||||
March 31, 2014 | June 30, 2014 | September 30, 2014 | December 31, 2014 | ||||||||||||
Net sales revenue | $ | 93,467 | $ | 92,831 | $ | 93,406 | $ | 86,663 | |||||||
Cost of sales | (22,581 | ) | (22,793 | ) | (22,742 | ) | (23,468 | ) | |||||||
Gross profit | 70,886 | 70,038 | 70,664 | 63,195 | |||||||||||
Volume incentives | 34,893 | 34,270 | 34,918 | 31,727 | |||||||||||
Selling, general and administrative | 29,152 | 29,941 | 30,200 | 30,634 | |||||||||||
Operating income | 6,841 | 5,827 | 5,546 | 834 | |||||||||||
Other income (expense) | (262 | ) | (79 | ) | (42 | ) | 349 | ||||||||
Income from continuing operations before income taxes | 6,579 | 5,748 | 5,504 | 1,183 | |||||||||||
Provision (benefit) for income taxes | (3,657 | ) | 2,198 | 407 | 309 | ||||||||||
Net income from continuing operations | 10,236 | 3,550 | 5,097 | 874 | |||||||||||
Loss from discontinued operations | (571 | ) | (316 | ) | (4,106 | ) | (4,964 | ) | |||||||
Net income (loss) | 9,665 | 3,234 | 991 | (4,090 | ) | ||||||||||
Net loss attributable to noncontrolling interests | — | — | (26 | ) | (193 | ) | |||||||||
Net income (loss) attributable to common shareholders | $ | 9,665 | $ | 3,234 | $ | 1,017 | $ | (3,897 | ) | ||||||
Basic and diluted net income per common share | |||||||||||||||
Basic earnings per share attributable to common shareholders: | |||||||||||||||
Net income from continuing operations | $ | 0.63 | $ | 0.22 | $ | 0.30 | $ | 0.05 | |||||||
Loss from discontinued operations | $ | (0.03 | ) | $ | (0.02 | ) | $ | (0.24 | ) | $ | (0.26 | ) | |||
Net income (loss) attributable to common shareholders | $ | 0.60 | $ | 0.20 | $ | 0.06 | $ | (0.21 | ) | ||||||
Diluted earnings per share attributable to common shareholders: | |||||||||||||||
Net income from continuing operations | $ | 0.61 | $ | 0.22 | $ | 0.29 | $ | 0.05 | |||||||
Income (loss) from discontinued operations | $ | (0.03 | ) | $ | (0.02 | ) | $ | (0.23 | ) | $ | (0.25 | ) | |||
Net income (loss) attributable to common shareholders | $ | 0.58 | $ | 0.20 | $ | 0.06 | $ | (0.20 | ) | ||||||
Dividends declared per common share | $ | 0.10 | $ | 0.10 | $ | 1.60 | $ | 0.10 | |||||||
Basic and diluted income per share is computed independently for each of the quarters presented. Therefore, the sum of the quarterly net loss per share may not equal the total computed for the year.
87
Item 9. Change In and Disagreements with Accountants on Accounting and Financial Disclosure
None.
Item 9A. Controls and Procedures
This report includes the certifications of the Company's Chief Executive Officer and Chief Financial Officer required by Rule 13a-14 of the Securities Exchange Act of 1934 (the “Exchange Act”). See Exhibits 31.1 and 31.2. This Item 9A includes information concerning the controls and control evaluations referred to in those certifications.
Overview
Management is responsible for establishing and maintaining adequate internal controls over financial reporting for the Company.
The following discussion sets forth a summary of management’s evaluation of the Company's disclosure controls and procedures as of December 31, 2015. In addition, this item provides a discussion of management’s evaluation of internal control over financial reporting.
The Company's independent registered public accountants have also issued an audit report on the Company's internal control over financial reporting. This report appears below.
Evaluation of Disclosure Controls and Procedures
The Company's disclosure controls and procedures (as defined in Rule 13a-15(e) under the Exchange Act) are designed to ensure that information required to be disclosed in reports filed or submitted under the Exchange Act is recorded, processed, summarized, and reported within the time periods specified in rules and forms adopted by the SEC, and that such information is accumulated and communicated to management, including the Chief Executive Officer and the Chief Financial Officer, to allow timely decisions regarding required disclosures.
In connection with the preparation of the Company's Annual Report as of December 31, 2015, the Company's management, under the supervision and with the participation of the Chief Executive Officer and Chief Financial Officer, evaluated the effectiveness of the design and operation of the Company's disclosure controls and procedures as of December 31, 2015. Based on that evaluation, the Company's Chief Executive Officer and Chief Financial Officer have concluded that the Company's disclosure controls and procedures were effective as of December 31, 2015.
Management’s Report on Internal Control over Financial Reporting
Management, with the participation of the Company's Chief Executive Officer and Chief Financial Officer, has conducted an evaluation of the effectiveness of the Company's internal control over financial reporting based on the framework set forth in “Internal Control—Integrated Framework (2013)” issued by the Committee of Sponsoring Organizations of the Treadway Commission. Based on management’s assessment under this framework, management has concluded that the Company's internal control over financial reporting was effective as of December 31, 2015. The Company's internal control over financial reporting as of December 31, 2015 has been assessed by Deloitte & Touche LLP, an independent registered public accounting firm, as stated in their report which is included herein.
Changes in Internal Control over Financial Reporting
There were no changes in the Company's internal control over financial reporting (as defined in Rules 13a-15(f) under the Exchange Act) that occurred during the fourth quarter ended December 31, 2015, that have materially affected, or are reasonably likely to materially affect, the Company's internal control over financial reporting.
88
REPORT OF INDEPENDENT REGISTERED PUBLIC ACCOUNTING FIRM
To the Board of Directors and Stockholders of Nature’s Sunshine Products, Inc.:
We have audited the internal control over financial reporting of Nature’s Sunshine Products, Inc. and subsidiaries (the “Company”) as of December 31, 2015, based on criteria established in Internal Control — Integrated Framework (2013) issued by the Committee of Sponsoring Organizations of the Treadway Commission. The Company’s management is responsible for maintaining effective internal control over financial reporting and for its assessment of the effectiveness of internal control over financial reporting, included in the accompanying Management’s Report on Internal Control over Financial Reporting. Our responsibility is to express an opinion on the Company’s internal control over financial reporting based on our audit.
We conducted our audit in accordance with the standards of the Public Company Accounting Oversight Board (United States). Those standards require that we plan and perform the audit to obtain reasonable assurance about whether effective internal control over financial reporting was maintained in all material respects. Our audit included obtaining an understanding of internal control over financial reporting, assessing the risk that a material weakness exists, testing and evaluating the design and operating effectiveness of internal control based on the assessed risk, and performing such other procedures as we considered necessary in the circumstances. We believe that our audit provides a reasonable basis for our opinion.
A company’s internal control over financial reporting is a process designed by, or under the supervision of, the company’s principal executive and principal financial officers, or persons performing similar functions, and effected by the company’s board of directors, management, and other personnel to provide reasonable assurance regarding the reliability of financial reporting and the preparation of financial statements for external purposes in accordance with generally accepted accounting principles. A company’s internal control over financial reporting includes those policies and procedures that (1) pertain to the maintenance of records that, in reasonable detail, accurately and fairly reflect the transactions and dispositions of the assets of the company; (2) provide reasonable assurance that transactions are recorded as necessary to permit preparation of financial statements in accordance with generally accepted accounting principles, and that receipts and expenditures of the company are being made only in accordance with authorizations of management and directors of the company; and (3) provide reasonable assurance regarding prevention or timely detection of unauthorized acquisition, use, or disposition of the company’s assets that could have a material effect on the financial statements.
Because of the inherent limitations of internal control over financial reporting, including the possibility of collusion or improper management override of controls, material misstatements due to error or fraud may not be prevented or detected on a timely basis. Also, projections of any evaluation of the effectiveness of the internal control over financial reporting to future periods are subject to the risk that the controls may become inadequate because of changes in conditions, or that the degree of compliance with the policies or procedures may deteriorate.
In our opinion, the Company maintained, in all material respects, effective internal control over financial reporting as of December 31, 2015, based on the criteria established in Internal Control — Integrated Framework (2013)issued by the Committee of Sponsoring Organizations of the Treadway Commission.
We have also audited, in accordance with the standards of the Public Company Accounting Oversight Board (United States), the consolidated financial statements and consolidated financial statement schedule as of and for the year ended December 31, 2015 of the Company and our report dated March 14, 2016 expressed an unqualified opinion on those consolidated financial statements and consolidated financial statement schedule.
/s/ Deloitte & Touche LLP | |
Salt Lake City, Utah | |
March 14, 2016 | |
89
Item 9B. Other Information
None.
PART III
Item 10. Directors, Executive Officers and Corporate Governance
The information required by this Item is incorporated herein by reference to the Company's definitive proxy statement to be filed with the SEC no later than 120 days after the close of the Company's fiscal year ended December 31, 2015, except that the information required with respect to the Company's executive officers is set forth under Item 1. “Business”, of this Annual Report on Form 10-K, and is incorporated herein by reference.
Item 11. Executive Compensation
The information required by this Item is incorporated herein by reference to the Company's definitive proxy statement to be filed with the SEC no later than 120 days after the close of the Company's fiscal year ended December 31, 2015.
Item 12. Security Ownership of Certain Beneficial Owners and Management and Related Stockholder Matters.
The information required by this Item is incorporated herein by reference to the Company's definitive proxy statement to be filed with the SEC no later than 120 days after the close of the Company's fiscal year ended December 31, 2015.
Item 13. Certain Relationships and Related Transactions and Director Independence
The information required by this Item is incorporated herein by reference to the Company's definitive proxy statement to be filed with the SEC no later than 120 days after the close of the Company's fiscal year ended December 31, 2015.
Item 14. Principal Accounting Fees and Services.
The information required by this Item is incorporated herein by reference to the Company's definitive proxy statement to be filed with the SEC no later than 120 days after the close of the Company's fiscal year ended December 31, 2015.
PART IV
90
Item 15. Exhibits and Financial Statement Schedules
(a)(1) | List of Financial Statements |
The following are filed as part of this report: | |
Report of Independent Registered Public Accounting Firm | |
Consolidated balance sheets as of December 31, 2015 and 2014 | |
Consolidated statements of operations for the years ended December 31, 2015, 2014, and 2013 | |
Consolidated statements of comprehensive income for the years ended December 31, 2015, 2014, and 2013 | |
Consolidated statements of changes in shareholders’ equity for the years ended December 31, 2015, 2014, and 2013 | |
Consolidated statements of cash flows for the years ended December 31, 2015, 2014, and 2013 | |
Notes to consolidated financial statements | |
(a)(2) | List of Financial Statement Schedules |
Schedule II - Valuation and Qualifying Accounts. | |
Financial statement schedules other than the one listed are omitted for the reason that they are not required or are not applicable, or the required information is shown in the financial statements or notes thereto, or contained elsewhere in this report. | |
(a)(3) | List of Exhibits |
Exhibit Index as seen below | |
91
SIGNATURES
Pursuant to the requirements of Section 13 or 15(d) of the Securities Exchange Act of 1934, the registrant has duly caused this report to be signed on its behalf by the undersigned, thereunto duly authorized.
Nature’s Sunshine Products, Inc.
Date: | March 14, 2016 | By: | /s/ Gregory L. Probert |
Gregory L. Probert, | |||
Chief Executive Officer and Chairman of the Board | |||
Pursuant to the requirements of the Securities Exchange Act of 1934, this report has been signed below by the following persons on behalf of the registrant and in the capacities and on the dates indicated.
Signature | Title | Date | ||
/s/ Gregory L. Probert | Chief Executive Officer and Chairman of the Board | March 14, 2016 | ||
Gregory L. Probert | (Principal Executive Officer) | |||
/s/ Kristine F. Hughes | Vice Chair of the Board | March 14, 2016 | ||
Kristine F. Hughes | ||||
/s/ Stephen M. Bunker | Executive Vice President, | March 14, 2016 | ||
Stephen M. Bunker | Chief Financial Officer and Treasurer (Principal Financial and Accounting Officer) | |||
/s/ Albert R. Dowden | Director | March 14, 2016 | ||
Albert R. Dowden | ||||
/s/ Robert B. Mercer | Director | March 14, 2016 | ||
Robert B. Mercer | ||||
/s/ J. Christopher Teets | Director | March 14, 2016 | ||
J. Christopher Teets | ||||
/s/ Jeffrey D. Watkins | Director | March 14, 2016 | ||
Jeffrey D. Watkins | ||||
/s/ Mary Beth Springer | Director | March 14, 2016 | ||
Mary Beth Springer | ||||
/s/ Li Dongjiu | Director | March 14, 2016 | ||
Li Dongjiu | ||||
/s/ Rebecca Lee Steinfort | Director | March 14, 2016 | ||
Rebecca Lee Steinfort | ||||
92
NATURE’S SUNSHINE PRODUCTS, INC.
SCHEDULE II — VALUATION AND QUALIFYING ACCOUNTS
FOR THE YEARS ENDED DECEMBER 31, 2015, 2014, AND 2013
(Amounts in thousands)
Description | Balance at Beginning of Year | Provisions | Amounts Written Off | Amounts Recovered | Effect of Currency Translation | Balance at End of Year | ||||||||||||||||||
Year Ended December 31, 2015 | ||||||||||||||||||||||||
Allowance for doubtful accounts receivable | $ | 849 | $ | 83 | $ | (714 | ) | $ | — | $ | (28 | ) | $ | 190 | ||||||||||
Allowance for sales returns | 129 | 1,126 | (1,155 | ) | — | (6 | ) | 94 | ||||||||||||||||
Allowance for obsolete inventory | 2,188 | 885 | (962 | ) | — | (29 | ) | 2,082 | ||||||||||||||||
Tax valuation allowance | 13,169 | (6,088 | ) | — | — | (516 | ) | 6,565 | ||||||||||||||||
Year Ended December 31, 2014 | ||||||||||||||||||||||||
Allowance for doubtful accounts receivable | $ | 1,087 | $ | (121 | ) | $ | (75 | ) | $ | 4 | $ | (46 | ) | $ | 849 | |||||||||
Allowance for sales returns | 135 | 1,527 | (1,525 | ) | — | (8 | ) | 129 | ||||||||||||||||
Allowance for obsolete inventory | 2,407 | 1,503 | (1,666 | ) | 1 | (57 | ) | 2,188 | ||||||||||||||||
Tax valuation allowance | 11,340 | 1,829 | — | — | — | 13,169 | ||||||||||||||||||
Year Ended December 31, 2013 | ||||||||||||||||||||||||
Allowance for doubtful accounts receivable | $ | 631 | $ | 535 | $ | (18 | ) | $ | 1 | $ | (62 | ) | $ | 1,087 | ||||||||||
Allowance for sales returns | 154 | 1,435 | (1,454 | ) | — | — | 135 | |||||||||||||||||
Allowance for obsolete inventory | 2,254 | 1,600 | (1,577 | ) | 41 | 89 | 2,407 | |||||||||||||||||
Tax valuation allowance | 8,149 | 3,191 | — | — | — | 11,340 | ||||||||||||||||||
93
LIST OF EXHIBITS
Item No. | Exhibit | |
3.1(1) | Amended and Restated Articles of Incorporation, as amended. | |
3.3(2) | Third Amended and Restated By-laws. | |
10.1(3)* | Tax Deferred Retirement Plan, Restated January 1, 2012. | |
10.2(1)* | Supplemental Elective Deferral Plan, as Amended effective as of January 1, 2008. | |
10.3(4)* | Employment Agreement, dated as of December 21, 2007, between Nature’s Sunshine Products, Inc. and Stephen M. Bunker. | |
10.4(5)* | Amendment to Employment Agreement, dated as of December 30, 2008, by and between Nature’s Sunshine Products, Inc. and Stephen M. Bunker. | |
10.5(6)* | Retirement and Consulting Agreement, dated as of December 9, 2008, by and between Nature’s Sunshine Products, Inc. and Eugene Hughes. | |
10.6(7) | 2009 Stock Incentive Plan. | |
10.7(7)* | Form of Award Agreement (2009 Stock Incentive Plan). | |
10.8(8)* | Employment Agreement, dated February 11, 2014, by and between the Company and Gregory L. Probert. | |
10.9(9)* | Stock Option Agreement, dated June 17, 2011, by and between the Company and Gregory L. Probert. | |
10.10(10)* | Employment Agreement, dated January 25, 2012, by and between the Company and D. Wynne Roberts. | |
10.11(10)* | Stock Option Agreement, dated February 6, 2012, by and between the Company and D. Wynne Roberts. | |
10.12(11) | 2012 Stock Incentive Plan and Amendment No. 1 to 2012 Stock Incentive Plan. | |
10.13(11)* | Form of Award Agreement (2012 Stock Incentive Plan). | |
10.14(12)* | Employment Agreement, dated October 2, 2013, by and between the Company and Richard D. Strulson. | |
10.15(12)* | Stock Option Agreement, dated November 4, 2013, by and between the Company and Richard D. Strulson. | |
10.16(12)* | Employment Agreement, dated April 16, 2013, by and between the Company and Matthew L. Tripp. | |
10.17(12)* | Stock Option Agreement, dated May 6, 2013, by and between the Company and Matthew L. Tripp. | |
10.18(3)* | Employment Agreement, dated October 13, 2014, by and between the Company and Paul E. Noack. | |
10.19(3)* | Stock Option Agreement, dated January 15, 2015, by and between the Company and Paul E. Noack. | |
10.20(3)* | Employment Agreement, dated March 4, 2013, by and between the Company and Susan M. Armstrong. | |
10.21(3)* | Stock Option Agreement, dated February 11, 2014, by and between the Company and Susan M. Armstrong. | |
10.22(13)* | Separation Agreement, dated March 4, 2016, by and between the Company and Stephen M. Bunker. | |
14(1) | Code of Conduct. | |
21(1) | List of Subsidiaries of Registrant. | |
23.1(1) | Consent of Independent Registered Public Accounting Firm. | |
31.1(1) | Certification of Chief Executive Officer pursuant to Rule 13a-14(a) under the Securities Exchange Act of 1934, as adopted pursuant to Section 302 of the Sarbanes-Oxley Act of 2002. | |
31.2(1) | Certification of Chief Financial Officer pursuant to Rule 13a-14(a) under the Securities Exchange Act of 1934, as adopted pursuant to Section 302 of the Sarbanes-Oxley Act of 2002. | |
32.1(1) | Certification of Chief Executive Officer pursuant to 18 U.S.C. § 1350. | |
32.2(1) | Certification of Chief Financial Officer pursuant to 18 U.S.C. § 1350. | |
101.INS | XBRL Instance Document | |
101.SCH | XBRL Taxonomy Extension Schema Document | |
101.CAL | XBRL Taxonomy Extension Calculation Linkbase Document | |
101.LAB | XBRL Taxonomy Extension Label Linkbase Document | |
101.PRE | XBRL Taxonomy Extension Presentation Linkbase Document | |
101.DEF | XBRL Taxonomy Extension Definition Linkbase Document | |
94
_______________________________________________
(1) | Filed herewith. | |
(2) | Previously filed with the SEC on August 29, 2014, as an exhibit to the Current Report on Form 8-K and is incorporated herein by reference. | |
(3) | Previously filed with the SEC on March 13, 2015, as an exhibit to the Annual Report on Form 10-K and is incorporated herein by reference. | |
(4) | Previously filed with the SEC on December 31, 2007, as an exhibit to the Current Report on Form 8-K and is incorporated herein by reference. | |
(5) | Previously filed with the SEC on January 12, 2009, as an exhibit to the Current Report on Form 8-K and is incorporated herein by reference. | |
(6) | Previously filed with the SEC on February 12, 2009, as an exhibit to the registration statement on Form 10 and is incorporated herein by reference. | |
(7) | Previously filed with the SEC on October 19, 2009 as Appendix C, an exhibit to the Registrant’s Proxy Statement and is incorporated herein by reference. | |
(8) | Filed with the SEC on February 19, 2015, as an exhibit to the Current Report on Form 8-K and is incorporated herein by reference. | |
(9) | Filed with the SEC on June 22, 2011, as an exhibit to the Current Report on Form 8-K and is incorporated herein by reference. | |
(10) | Filed with the SEC on February 23, 2012, as an exhibit to the Current Report on Form 8-K and is incorporated herein by reference. | |
(11) | Filed with the SEC on January 15, 2015, as an exhibit to the Current Report on Form 8-K and is incorporated herein by reference. | |
(12) | Filed with the SEC on March 17, 2014, as an exhibit to the Annual Report on Form 10-K and is incorporated herein by reference. | |
(13) | Filed with the SEC on March 8, 2016, as an exhibit to the Current Report on Form 8-K and is incorporated herein by reference. | |
* | Management contract or compensatory plan. | |
95