Attached files
UNITED STATES
SECURITIES AND EXCHANGE COMMISSION
WASHINGTON, D.C. 20549
FORM 10-K
(Mark One)
☒ ANNUAL REPORT PURSUANT TO SECTION 13 OR 15(d) OF THE SECURITIES EXCHANGE ACT OF 1934
For the fiscal year ended December 31, 2015
☐ TRANSITION REPORT PURSUANT TO SECTION 13 OR 15(d) OF THE SECURITIES EXCHANGE ACT OF 1934
For the transition period from ______________to ______________
Commission File Number 001-35898
LINDBLAD EXPEDITIONS HOLDINGS, INC.
(Exact Name of Registrant as Specified in Its Charter)
| Delaware | 27-4749725 | |
| (State
or Other Jurisdiction of Incorporation or Organization) |
(I.R.S.
Employer Identification Number) |
| 96 Morton Street, 9th Floor, New York, New York | 10014 | |
| (Address of Principal Executive Offices) | (Zip Code) |
(212) 261-9000
(Registrant’s Telephone Number, Including Area Code)
Securities registered pursuant to Section 12(b) of the Act:
| Title of each class | Name of each exchange on which registered | |
| Common Stock, par value $0.0001 per share | The NASDAQ Stock Market LLC | |
| Warrants,
each to purchase one share of Common Stock at an exercise price of $11.50 |
The NASDAQ Stock Market LLC |
Securities registered pursuant to Section 12(g) of the Act:
None
Indicate by check mark if the registrant is a well-known seasoned issuer, as defined in Rule 405 of the Securities Act. Yes ☐ No ☒
Indicate by check mark if the registrant is not required to file reports pursuant to Section 13 or 15(d) of the Exchange Act. Yes ☐ No ☒
Indicate by check mark whether the registrant (1) has filed all reports required to be filed by Section 13 or 15(d) of the Exchange Act of 1934 during the past 12 months (or for such shorter period that the registrant was required to file such reports), and (2) has been subject to such filing requirement for the past 90 days. Yes ☒ No ☐
Indicate by check mark whether the registrant has submitted electronically and posted on its corporate Web site, if any, every Interactive Data File required to be submitted and posted pursuant to Rule 405 of Regulation S-T during the preceding 12 months (or for such shorter period that the registrant was required to submit and post such files). Yes ☒ No ☐
Indicate by check mark if disclosure of delinquent filers in response to Item 405 of Regulation S-K is not contained herein, and will not be contained, to the best of the registrant’s knowledge, in definitive proxy or information statements incorporated by reference in Part III of this Form 10-K or any amendment to this Form 10-K. ☒
Indicate by check mark whether the Registrant is a large accelerated filer, an accelerated filer, a non-accelerated filer or a smaller reporting company. See definition of “accelerated filer” and “large accelerated filer” in Rule 12b-2 of the Exchange Act. (Check one):
| Large accelerated filer ☐ | Accelerated filer ☒ |
| Non-accelerated filer ☐ | Smaller reporting company☐ |
| (Do not check if a smaller reporting company) |
Indicate by check mark whether the registrant is a shell company (as defined in Rule 12b-2 of the Exchange Act). Yes ☐ No ☒
As of June 30, 2015 (the last business day of the registrant’s most recently completed second fiscal quarter), the aggregate market value of the common stock held by non-affiliates of the registrant was approximately $178.7 million based on its last reported sales price of $10.55 on NASDAQ Stock Market LLC.
As of March 7, 2016, there were 45,505,228 shares of the registrant’s common stock outstanding, par value $0.0001 per share.
DOCUMENTS INCORPORATED BY REFERENCE:
Portions of the registrant’s Definitive Proxy Statement relating to its 2016 Annual Meeting of Stockholders are incorporated by reference in Part III, Items 10-14 of this Annual Report on Form 10-K as indicated herein.
LINDBLAD EXPEDITIONS HOLDINGS, INC.
Form 10-K
Table of Contents
Cautionary Note Regarding Forward-Looking Statements
Any statements in this Annual Report on Form 10-K (the “Form 10-K”) about our expectations, beliefs, plans, objectives, prospects, financial condition, assumptions or future events or performance are not historical facts and are “forward-looking statements” as that term is defined under the federal securities laws. These statements are often, but not always, made through the use of words or phrases such as “believe,” “anticipate,” “should,” “intend,” “plan,” “will,” “expects,” “estimates,” “projects,” “positioned,” “strategy,” “outlook” and similar words. You should read the statements that contain these types of words carefully. Such forward-looking statements are subject to a number of risks, uncertainties and other factors that could cause actual results to differ materially from what is expressed or implied in such forward-looking statements. There may be events in the future that we are not able to predict accurately or over which we have no control. Potential risks and uncertainties include, but are not limited to:
| ● | changes adversely affecting the business in which we are engaged; | |
| ● | management of our growth and our ability to execute on our planned growth; | |
| ● | general economic conditions; | |
| ● | our business strategy and plans; | |
| ● | compliance with laws and regulations, | |
| ● | compliance with the financial and/or operating covenants in our Amended Credit Agreement; | |
| ● | adverse publicity regarding the cruise industry in general; | |
| ● | loss of business due to competition; | |
| ● | the result of future financing efforts; | |
| ● | the inability to meet revenue and Adjusted EBITDA projections; and | |
| ● | those risks discussed in Item 1A. Risk Factors. |
We urge you not to place undue reliance on these forward-looking statements, which speak only as of the date of this report. We do not undertake any obligation to release publicly any revisions to such forward-looking statements to reflect events or uncertainties after the date hereof or to reflect the occurrence of unanticipated events.
Unless the context otherwise requires, in this Form 10-K, (i) “Company,” “LEX,” “we,” “us,” “our,” and “ours” refer to Lindblad Expeditions Holdings, Inc., the combined company and its subsidiaries following the mergers, (ii) “Capitol” refers Capitol Acquisition Corp. II and its subsidiaries prior to the mergers with Lindblad; and (iii) “Lindblad” refers to Lindblad Expeditions, Inc., a New York corporation, and its subsidiaries prior to the mergers with Capitol.
| Item 1. | Business |
History
We were originally incorporated in Delaware on August 9, 2010 with the name Capitol Acquisition Corp. II as a blank check company to acquire, through a merger, share exchange, asset acquisition, stock purchase, plan of arrangement, recapitalization, reorganization or other similar business combination, one or more businesses or entities.
On July 8, 2015, we completed a series of mergers whereby Lindblad Expeditions, Inc., a New York corporation, became our wholly-owned subsidiary. As consideration for the mergers, the total purchase price consisted of an aggregate of (i) $90.0 million in cash (a portion of which was paid as transaction bonuses) and (ii) 20,017,787 shares of our common stock. We also assumed outstanding stock options and converted such options into options to purchase an aggregate of 3,821,696 shares of our common stock with an exercise price of $1.76 per share.
Immediately following the mergers, we changed our name to Lindblad Expeditions Holdings, Inc.
| 1 |
Overview
We provide expedition cruising and adventure travel experiences. We provide itineraries that feature up-close encounters with wildlife and nature, history and culture and promote guest empowerment and interactivity. Our mission is offering life-changing adventures on all seven continents, and pioneering innovative ways to allow our guests to connect with exotic and remote places.
We currently operate a fleet of six expedition ships owned by our subsidiaries and four seasonal charter vessels. We also have two new 236-foot, 100-passenger cruise vessels being constructed with delivery expected in the second quarter of 2017 and the second quarter of 2018, respectively, as well as a definitive purchase agreement to acquire a vessel to replace one of our six owned expedition ships. Our expedition ships are customized, nimble and intimately-scaled vessels that are able to venture where larger cruise ships cannot, thus allowing us to offer truly authentic, up-close experiences in the planet’s wild and remote places and capitals of culture. Many of these expeditions involve travel to remote places with limited infrastructure and ports (such as Antarctica and the Arctic) or places that are best accessed by a ship (such as the Galápagos, Alaska, Baja’s Sea of Cortez, Costa Rica and Panama), and foster active engagement by guests. Each expedition ship is designed to be comfortable and inviting, while being fully equipped with state-of-the-art tools for in-depth exploration.
We have a strategic business alliance with the National Geographic Society (“National Geographic”) founded on a shared interest in exploration, research, technology, and conservation. This relationship includes a co-selling, co-marketing and branding arrangement whereby our owned vessels carry the National Geographic name and National Geographic sells our expeditions through its internal travel division. We collaborate with National Geographic on voyage planning to enhance the guest experience by having National Geographic experts, including photographers, writers, marine biologists, naturalists, field researchers, and film crews, join our expeditions. Guests have the ability to interface with these experts through lectures, excursions, dining, and other experiences throughout their voyage.
Our offerings appeal to a wide range of travelers, both individuals and families, but affluent individuals in the U.S. aged 50 years or older represent our largest segment. By providing such offerings, which we work continuously to innovate and further elevate, we have been able to achieve and maintain premium pricing in the market instead of pursuing the type of discounting in which most large cruise lines that are focused on the broader market engage. Our product offering, value proposition and differentiated pricing approach support our high net yields and occupancy rates.
Our business benefits from significant visibility into future revenues, as our guests generally plan and book their voyages far in advance of their departure dates. As of March 7, 2016, 85% of Lindblad’s expected guest ticket revenues for 2016 had been booked.
Expedition Heritage
Our leadership and expertise today is built on the Lindblad family’s decades of experience in expedition adventure travel. Sven-Olof Lindblad, the founder, President and Chief Executive Officer of the Company, comes from a rich expedition heritage. The International Association of Antarctica Tour Operators, which was established in 1991, believes that the concept of expedition cruising, coupled with education as a major theme, began when Lars-Eric Lindblad, Mr. Lindblad’s father, led the first traveler’s expedition to Antarctica in 1966. Lars-Eric Lindblad has also been recognized by The New York Times, Travel + Leisure Magazine and other publications for his vision and leadership in developing what is today known as expedition travel. Believing that educated people who saw things with their own eyes would be a potent force for the preservation of the places they visited, Lars-Eric Lindblad worked to promote conservation and restoration projects worldwide. Mr. Lindblad founded Lindblad in 1979, expanding the legacy of his father by providing expanded marine experiences around the world.
Under Mr. Lindblad’s leadership, we have led innovation in the expedition adventure travel industry. We pioneered expeditions in the High Arctic and Baja California’s Sea of Cortez and created what we view as the most innovative and in-depth expedition program in Alaska. We initiated the use of kayaks for active exploration in the Polar Regions and in the Galápagos, a feature which is now available on all of our expeditions to enable personal, water-level encounters with nature. We were also one of the first to develop an undersea exploration program as part of a small ship expedition utilizing state-of-the-art equipment and technology.
| 2 |
Competitive Strengths
Our management team believes the following characteristics of our business model will enable us to successfully execute our strategy:
Expertise and Name Recognition
For over 35 years, we have been offering expedition cruising, known for facilitating guests’ access to interpersonal educational experiences in remote places. As a pioneer in the sector, we have established deep expertise and knowledge of operating expedition cruises in extreme locations. We have earned awards and honors from various representatives of the travel industry, including recognition for the quality of our offerings and our support for conservation and sustainable tourism.
In 2015, we were awarded the Legacy in Travel Philanthropy Award by Tourism Cares, the charitable arm of the travel and tourism industry, recognizing our longstanding commitment to environmental conservation. We were also named the 2015 World’s Leading Green Cruise Line by the World Travel Awards.
Also in 2015, Conde Nast Traveler rated us as one of the Top Small Ship Cruise Lines for the second consecutive year. We have also been named to the Travel + Leisure World’s Best List for Small-Ship Cruise Lines six times since 2008.
In 2013, we won the Travel + Leisure Global Vision Award for Leadership. This award recognized travel operators with a focus on extraordinary ways that travelers can give back to the places they visit.
Virtuoso awarded us our Sustainable Tourism Leadership Supplier Award in 2013, an award honoring outstanding leadership and commitment to sustainable tourism principles and practices among Virtuoso suppliers.
When customers select an expedition provider for the types of journeys that we offer, we believe that being known as a trusted brand in the market is a significant competitive strength.
Compelling Expedition Offerings
Our brand is known for delivering voyages that offer in-depth exploration opportunities in locations around the world. Expeditions are operated on intimately-scaled ships with capacities ranging between 28 and 148 guests, fostering a friendly atmosphere on board and extensive interaction between guests, crew and the teams of world class scientists, naturalists, researchers, and photographers that participate in the expeditions. The vessels are nimble and can access locations that are unattainable for large cruise ships, allowing for in-depth exploration itineraries and viewpoints. The ships are customized to provide our signature adventure experiences and activities, such as kayaking among Antarctic icebergs to view penguins or traveling on a Zodiac for an up-close encounter with a whale. We are continuously focused on maintaining and elevating the guest experience and identifying new opportunities to help people discover the wonders of the world. We believe that our expedition offerings and our track record of innovation represent significant competitive advantages for us.
Strong Financial Profile
Our business model allows us to generate consistent free cash flow with high revenue visibility. Our guests plan and book their voyages on average nine months in advance, with a deposit due upon booking, providing us insight into future revenue and a source of cash flow. Based on our product offerings, we are able to support premium pricing with minimal discounting, and benefit from low requirements for maintenance capital expenditures, minimal working capital needs and favorable tax attributes. For the years ended December 31, 2015, 2014 and 2013, we achieved an Adjusted EBITDA of $46.8 million, $44.6 million and $36.5 million, respectively, which represents a compounded annual growth rate of 13.2% since 2013.
We also have a strong cash position, providing us with ample financial flexibility to pursue growth opportunities through investment in new vessels, new charters, tactical land-based products or potential acquisitions of ships or other operators, while still maintaining a prudent capital structure.
| 3 |
Significant Growth Opportunities
We believe affluent Americans aged 50 and above define their retirement as “a time to travel and explore new places,” favoring travel experiences such as expedition cruising. This has led to strong growth in the specialty cruise segment and we believe these trends will continue. We plan to expand the number of ships in our fleet, including chartered vessels, from 10 to 13 over the next several years, and have signed a construction agreement to build two new coastal vessels with expected deliveries on target for the second quarter of 2017 and 2018, respectively. Additionally, we believe that our platform will be well positioned to opportunistically seek accretive purchases of operators that lack scale and capital, further extending our growth prospects.
Experienced Management Team
We are led by a management team comprised of individuals drawing on a diverse knowledge base and skill sets acquired through extensive experience in expedition cruising and adventure travel. Mr. Lindblad, our founder, President and Chief Executive Officer, who has decades of experience in the sector, built the Company up to our current fleet of six owned and four chartered vessels while carefully establishing the values and brand for which we are now known. Ian T. Rogers, our Chief Operating Officer, joined us in 2009 and has over 25 years of hospitality and cruise experience. John T. McClain, our Chief Financial Officer, joined us in 2015 and brings a long history of leadership positions in a wide range of public companies. Overall, the members of our senior management team have many years of experience in the maritime, adventure, marketing and hospitality sectors.
Executive Officers of the Company
As of March 7, 2016, our executive officers are as follows:
| Name | Age | Position | ||
| Sven-Olof Lindblad | 65 |
Chief Executive Officer and President | ||
| Ian T. Rogers | 51 | Chief Operating Officer, Vice President and Treasurer | ||
| John T. McClain | 54 |
Chief Financial Officer | ||
| Dean (Trey) Byus III | 47 | Chief Expedition Officer | ||
| Richard P. Fontaine | 51 | Chief Marketing Officer | ||
| J. Tyler Skarda | 51 | Senior Vice President, Fleet Operations |
Sven-Olof Lindblad founded Lindblad and has been its President and Chief Executive Officer since its inception. Mr. Lindblad’s travel background and familiarity with adventure-travel and wildlife dates back to his childhood and his extensive travels with his father, Lars-Eric Lindblad. Mr. Lindblad founded Lindblad in order to offer innovative and educational travel expeditions to the world’s most remarkable places, capturing the true spirit of adventure. In May 2006, Mr. Lindblad received international recognition for his model of tourism in a ceremony hosted by HRH, Grand Duke Henri of Luxembourg at the Grand-Ducal Palace. In addition, a newly discovered endemic species of moth in the Galápagos Islands, Undulambia lindbladi, has been named in honor of Mr. Lindblad. Mr. Lindblad is an honorary member of the General Assembly of the Charles Darwin Foundation for the Galápagos Islands; serves on the Board of The Safina Center and on the National Geographic Council of Advisors; is commissioner of the Aspen Institute’s Commission on Arctic Climate Change; is a founding member of the non-profit organization, Ocean Elders, which brings together global leaders to pursue the protection of the ocean’s habitat and wildlife; and serves on the Board of Advisors for Pristine Seas.
Ian T. Rogers joined Lindblad in the spring of 2009 as its Chief Financial Officer and Treasurer and in 2014 his role expanded to also include the positions of Vice President and Chief Operating Officer. In connection with the appointment of John T. McClain as our Chief Financial Officer in November 2015, Mr. Rogers ceased serving as our Chief Financial Officer at such time. During 2008, Mr. Rogers served as an independent financial consultant to Lindblad. Mr. Rogers served as Chief Financial Officer for E Suites Hotels, LLC from 2007 to 2008 and was Chief Financial Officer of Tauck World Discovery from 2006 to 2007. From 1992 to 2006 Mr. Rogers was Senior Director of Finance, Vice President of Finance and Divisional CFO of Carlson Hotels Worldwide (Carlson Companies). Mr. Rogers has broad experience in hotel, travel, leisure and cruise businesses in the U.S., Eastern Europe, the Caribbean and the Middle East. Mr. Rogers holds an M.B.A. from the University of Minnesota and a B.S. in Hospitality Management from the University of Bournemouth, UK.
| 4 |
John T. McClain joined us as Chief Financial Officer in November 2015. Mr. McClain previously served as the Chief Financial Officer of The Jones Group Inc., a leading global designer, marketer and wholesaler of over 25 brands, from July 2007 until the sale of the company to Sycamore Partners in April 2014. From April 2014 to August 2014, he continued to provide Senior Advisor services related to financial operations to The Jones Group Inc. Mr. McClain has served on the board of Nine West Holdings from April 2014 through October 2015, the board and audit committee of Lands’ End since May 2014 and as a trustee of Seritage Growth Properties since June 2015. Mr. McClain has also held a number of roles at Avis Budget Group, Inc. formerly Cendant Corporation. He joined Cendant Corporation in September 1999, serving as the Senior Vice President, Finance & Corporate Controller until 2006. From July 2006 to 2007, Mr. McClain served as the Chief Accounting Officer of Avis and Chief Operating Officer of Cendant Finance Holdings. Mr. McClain previously held leadership roles at Sirius Satellite Radio Inc. and ITT Corporation. Mr. McClain holds a B.S. in Accounting from Lehigh University.
Dean (Trey) Byus III joined Lindblad in 1993 as an Expedition Leader and since 2009 has served as Lindblad’s Chief Expedition Officer, overseeing programming for Lindblad’s vessels. Prior to 2009, Mr. Byus served as Lindblad’s Vice President of Operations and Program Development, Director of Field Staff & Expedition Technology, Director of Field Staff and Expedition Leader. Mr. Byus has worked in regions around the world and has extensive experience in managing Lindblad’s naturalists, historians, Expedition Leaders, vessel itineraries and business development, including working with National Geographic. Mr. Byus holds a B.A. from the University of Washington.
Richard P. Fontaine joined Lindblad as Chief Marketing Officer in July 2013, and oversees all marketing and sales initiatives, including public relations, communications and corporate brand positioning efforts. Mr. Fontaine brings more than 25 years of experience in consumer-direct marketing for highly-regarded lifestyle media and merchandising brands. From February 1997 until July 2013, Mr. Fontaine served as SVP, Consumer Marketing for Martha Stewart Living Omnimedia, Inc. (MSLO). Previously, Mr. Fontaine served in product management/marketing roles at Time Inc./Sports Illustrated, and MBI, Inc./The Danbury Mint. Mr. Fontaine holds a B.A. in Economics from Cornell University.
J. Tyler Skarda joined us as Senior Vice President, Marine Operations in January 2016 and oversees our marine operations and marine fixed assets. Mr. Skarda brings over two decades of maritime industry experience, focused on strategy, capital equipment procurement cost reduction, and shipbuilding/ship operations process improvement for global maritime companies and their suppliers. Prior to joining us, Mr. Skarda served as a consultant with the leading global management consulting firm, A.T. Kearney. Mr. Skarda started his career in the United States Navy and later worked in the Office of the Secretary of Defense as a senior maritime industry analyst prior to leaving the service. Mr. Skarda holds a B.S. in electrical engineering from California State University, Sacramento and an M.B.A. from the Fuqua School of Business at Duke University.
Industry and Market
We believe the specialty and small ship cruising segment of the cruise industry demonstrates the following positive fundamentals:
Favorable Characteristics of Cruise Industry
Cruising is a vacation alternative with broad appeal, as it offers a wide range of products, destinations and experiences to suit the preferences of vacationing consumers of all ages, wealth levels and nationalities. The multi-night global cruise industry is predominantly made up of large ships of over 1,000 berths with per diem pricing of $100 to $250 per person, which is designed to reach a mass market audience. This market segment has grown significantly but still remains relatively small compared to the broader global vacation industry, reflecting significant room for growth. According to the Global Economic Contribution of Cruise Tourism 2014 by Business Research & Economic Advisors, published in October 2015, the cruise industry has experienced steady growth over the past 30 years. Between 2004 and 2014, demand for cruising worldwide increased from 13.1 million passengers to 22.0 million passengers, an increase of 68%, whereas over a similar period, global tourism has only risen by 45%. According to a Cruise Lines International Association (“CLIA”) 2015 State of the Cruise Industry Report and a STR Global census database, there were about 482,000 beds in the global cruise industry in 2014, which is less than 4% of the number of worldwide hotel rooms as of December 2015. Cruising is considered a well-established vacation sector in the North American market, a growing sector over the long-term in the European market and a developing but promising sector in several other markets.
| 5 |
Strong Growth in Specialty and Small Ship Cruising Segment
The specialty and small ship cruising segment of the cruise industry is characterized by the smallest vessel size, itineraries, active adventures, gourmet culinary programs, highly personalized service, and a more inclusive offering. These exclusive attributes, combined with limited supply growth and a growing worldwide target population, provide specialty and small ship cruising operators with significant pricing leverage as compared to the other segments of the cruise industry.
The specialty cruise segment has demonstrated strong growth as consumers increasingly prefer experiences over other forms of discretionary spending. According to CLIA, specialty cruises grew by 21% annually from 2009 to 2014. In a December 2015 survey of CLIA-member travel agents, 83% expect increased bookings in 2016 from the prior year, with 40% of the agents anticipating growth of 10% or greater. Despite this consistent growth, we believe the specialty cruise industry still has low penetration levels compared to similar land-based vacations, which we believe highlights the continued growth potential for the specialty cruise market.
The specialty cruise segment includes expeditions to destinations around the world, such as those included in our itineraries. This sub-segment also benefits from positive growth of the broader adventure travel industry. Adventure travel grew 65% year-over-year from 2009 to 2012 into a $263 billion industry, according to the 2013 Adventure Tourism Market Study conducted by George Washington University and the Adventure Travel Trade Association. This growth was partly attributed to a 59% increase in the appeal of adventure trips, and a 60% increase in average spending per adventure trip, driven partly by an increase in the average trip length from seven days in 2009 to nine days in 2012.
Attractive Target Market Demographics
Our offerings appeal to a wide range of travelers, both individuals and families, but affluent individuals in the U.S. aged 50 years or older represent our largest segment. We believe that our small ship expedition offerings, with itineraries that promote up-close encounters with wildlife, nature and culture, have significant appeal to this target market. These individuals are also generally near-retirement or retired and have the leisure time and disposable income available to pursue the type of activities that we provide. Based on the U.S. Census Bureau’s 2014 National Projections, the age group of 45 years and older numbered approximately 130 million individuals in 2014, or approximately 41% of the U.S. population, and is expected to grow to approximately 140 million in 2020, an increase of approximately 8%. In comparison, over the same time period the age group of 18 years and younger is projected to increase by approximately 1% and the age group of 18 year to 44 years is projected to increase by approximately 4%.
High Barriers to Entry
The adventure travel and specialty cruise industries in which we operate are characterized by high barriers to entry, which include the expertise and experience required to operate safely and effectively in remote locations, the existence of well-established and trusted brands, the time and personal relationships required to develop strong networks of experts to lead and support expeditions, the cost and time required to build the strong travel agent network partnerships necessary for success, local permits or licenses required to operate in a diverse range of geographies, large capital expenditures, and operational insight required to build new and sophisticated ships suited for such specialized activities.
The growth of the cruise industry depends, however, on consumers’ discretionary spending, and in the event that consumers’ disposable income or consumer confidence decreases as a result of an economic downturn or other factors, demand for cruises could decrease. See “Risk Factors – Risks Related to Our Business and Operations – Adverse worldwide economic, geopolitical or other conditions could reduce the demand for expedition cruises and adversely impact our operating results, cash flows and financial condition, including potentially impairing the value of our fleet and other assets.”
| 6 |
Business and Growth Strategies
The following are the key components of our business strategy:
Deliver Exceptional Guest Experiences
Our chief governing principle throughout the organization is to ensure that everything adds value to the guest experience. This applies to every step of the process from the first engagement with a potential guest, through the booking process and travel preparations, the actual expedition, whether onboard the vessel or off on explorations, and once back at home.
We believe that our guests do not want to be passive tourists, so our expeditions foster active engagement. Our ships are equipped with tools for exploration to get our guests out in the open for up-close forays, or to let guests see deeper into the marine or terrestrial environments surrounding them. It is our goal to provide guests with differentiated opportunities such as watching a killer whale circling a seal on an ice flow, while standing next to a marine biologist and an experienced nature photographer from National Geographic. An experienced expedition team adds to the guests’ understanding and appreciation, through dedicated observation, insightful commentary and engaging presentations that weave the expedition into a cohesive narrative. This intense focus on seeking to elevate the overall experience and engaging with guests has resulted in highly favorable customer feedback, as collected by us and as reflected in the numerous industry honors we have received. We believe that by consistently delivering exceptional experiences to our guests, we have built a highly valuable and trusted brand in the expedition cruising market which attracts a growing number of customers, and in particular, discerning and affluent guests who are prepared to pay a premium for our offerings.
High Visibility and Differentiated Revenue Management Strategy
Given the nature of our expeditions and the expectation that our guests will seek to plan such trips with substantial notice, we begin to market our voyages approximately 12 to 18 months in advance of the departure date, depending on the destination. Guests book their trips, on average, nine months prior to sail date, paying a deposit at booking and the final payment 60 to 120 days within the date of travel, dependent upon selected voyage. Unlike the large cruise line operators that serve the broader market, our product offering is inclusive of most costs and therefore the advance customer payments provide us strong visibility into future revenues and the associated cash flows. By having such visibility of future business, we can more effectively manage any additional sales and marketing efforts that may be required to ensure that the programs reach their targeted occupancy levels. We do not believe in driving participation through discounting and do not generally pursue such strategies. Instead, we focus on voyage enhancements that add significant value to the product without much incremental cost, as well as targeted marketing efforts in order to strengthen occupancy rates, if required. Based on our offerings, the targeted audience and premium pricing, our guests are generally older, more affluent and do not travel with three or four individuals in one cabin. As it is industry convention to base 100% occupancy on two persons per cabin, we may report occupancy levels that are somewhat lower than the large cruise lines serving the broader market. However, the occupancy statistics nevertheless reflect appropriately that we are operating close to full occupancy. We have achieved strong occupancy rates in the last three years (based on two persons per cabin), specifically 91.8% in 2015, 92.9% in 2014 and 92.4% in 2013. As of March 7, 2016, 85% of our expected guest ticket revenues for 2016 had been booked.
Maximize and Grow Net Yields
We have historically achieved high net yields and continue to see opportunities for growth. Net yield is a frequently referenced metric used in the cruise industry and refers to tour revenues net of commissions and certain direct costs in a specific period divided by the number of available guest nights. Our net yields are driven by our offerings, premium pricing and ancillary guest revenue, such as pre- or post-voyage trip extensions, add-on optional activities, trip insurance, and onboard spend, including spa services and alcoholic beverages. Our net yields were $971, $950 and $931 in 2015, 2014 and 2013, respectively. These net yield amounts reflect annual growth rates of 2.2% from 2014 to 2015 and 2.0% from 2013 to 2014. Furthermore, while our use of net yield may not be comparable to companies in the industry, our net yield in 2015 was significantly higher than the large scale cruise line operators. We expect to be able to continue our track record of maintaining strong pricing and growing ancillary guest revenues through increased sales focus and marketing efforts, particularly of pre- and post-voyage extensions on which we have not historically placed significant emphasis.
| 7 |
Elevate Brand Awareness and Loyalty
Our brand is recognizable by our guests primarily due to our heritage, decades of sales and marketing investment and long-standing strategic alliance with National Geographic. We believe we have fostered strong guest and brand loyalty, which is evidenced by our high levels of repeat guests. In 2015, 37% of guests booked through our U.S. office were past guests. We have closely aligned our marketing efforts with National Geographic to maximize impact in the marketplace and have engaged in a co-branding strategy with respect to our owned vessels. In addition, we are recognized as a leader in promoting the issue of conservation of the planet and encourage our guests to become engaged through the Lindblad Expeditions – National Geographic Joint Fund for Exploration and Conservation (“LEX-NG Fund”). In the past, we have organized high level meetings in the Arctic, Antarctic, Galápagos, and Baja California to put a spotlight on key environmental issues in conjunction with organizations such as the Aspen Institute, TED and the World Wildlife Fund. These efforts help to build our brand and network of relationships and enhance our thought leadership. We will continue to focus on ensuring that each of our guests associates our brand with high-quality overseas adventure vacation experiences.
Disciplined Expansion
We are focused on growing our business in a prudent and disciplined manner. When evaluating various strategies for expansion of guest capacity, we consider closely the expected return on invested capital and the range of possibilities, such as a newbuild program, adding selected charters and the acquisitions of existing ships or small operators, such as the 2013 acquisition of Fillmore Pearl Holdings Ltd. and its subsidiaries, including the owner of the vessel that was subsequently named National Geographic Orion. We currently have two new coastal vessels on order for delivery in 2017 and 2018, respectively. We believe that we have ample capital and financial flexibility to fund this investment and management considers it to be an important step to meet increasing demand for our offerings.
Strategic Alliance with National Geographic
We benefit from a strategic alliance with National Geographic, one of the world’s leading proponents of eco-tourism and natural history. The strategic alliance, which began in 2004, is built on our shared interest in exploration, research, technology, and conservation. Since 1888, National Geographic has enabled people to explore the world through its magazines and, more recently, its television programs, website and social media. It is one of the largest non-profit scientific and educational institutions in the world with interests ranging from geography, archaeology and natural science, to the promotion of environmental and historical conservation. Working to inspire, illuminate and teach, National Geographic reaches more than 600 million people a month through a wide range of media, including print, TV and digital. The National Geographic name has significant value for use in connection with travel-related goods and services. The Lindblad/National Geographic alliance includes a co-selling and co-marketing arrangement through which National Geographic promotes our offerings in its marketing campaigns across web-based, email, print, and other marketing platforms and sells our expeditions through its internal travel division. The National Geographic sales channel represents approximately 24% of our guest ticket revenues. We believe that the alliance with National Geographic provides us with a substantial competitive advantage in the expedition market based on the brand enhancement, expanded marketing reach and the relationship with National Geographic’s naturalists and photographers.
Through this alliance, we collaborate with National Geographic on exploration, research, technology, and conservation in order to provide travel experiences and disseminate geographic knowledge around the globe. The Lindblad/National Geographic alliance is set forth in (i) an Alliance and License Agreement and (ii) a Tour Operator Agreement.
| 8 |
Alliance and License Agreement. Pursuant to the Alliance and License Agreement, we and National Geographic have agreed to collaborate to identify key destinations and program enhancements as well as to develop marketing strategies, joint loyalty programs and materials for our expeditions in exchange for royalty payments from us. The royalty amount is calculated based upon a percentage of ticket revenue less travel agent commission, including the revenue received from cancellation fees and any revenue received for the sale of voyage extensions. As part of the agreement, National Geographic has granted us a (i) non-exclusive license to use certain licensed property (including licensed content and licensed marks, which include but are not limited to National Geographic’s name and images) for the advertising and promotion of certain expeditions in the U.S., its territories and possessions, Australia and New Zealand (the “Territory”) and (ii) a non-exclusive license to use the licensed property in association with our name, trademarks, services marks, and logos in connection with promotional and public relations communications in the Territory relating to certain expeditions to destinations worldwide. The agreement also provides us with a non-exclusive, non-transferable right and license to use the National Geographic marketing database for the purpose of promoting the sale of such expeditions.
The agreement includes a branding arrangement whereby our six owned and operated expedition cruise ships carry the National Geographic name. The names of the National Geographic branded vessels are National Geographic Orion, National Geographic Explorer, National Geographic Endeavour, National Geographic Islander, National Geographic Sea Lion, and National Geographic Sea Bird. We have the right to brand each future vessel we acquire under the name “National Geographic.” In addition, the agreement provides for us to use co-branded materials to showcase National Geographic as an institution on all of our National Geographic branded ships and on certain other Lindblad ships.
The agreement also provides us with access to the experts affiliated with National Geographic, including world-renowned scientists, researchers, explorers, and photographers, who participate in our voyages and provide guests, while onboard, with lectures, excursions and informal interactions. We are required to pay a stipend to National Geographic experts on a Lindblad expedition. The agreement also requires us to designate one of our employees as the National Geographic representative and to pay National Geographic 50% and 25%, respectively, of the total compensation for two employees of National Geographic that manage our relationship. Pursuant to the agreement, we are responsible for the development, administration and operation of all voyages as well as all associated expenses, including but not limited to hiring, managing and paying qualified staff.
As part of the agreement, we agreed not to enter into any agreements with Discovery Communications, Inc. or their affiliates other than with respect to the purchase of advertising media or the license of film, video or other items and National Geographic agreed not to license its marks or content to competitive cruise ships marketed within the U.S. Each party also agreed to a standard indemnification clause for negligent acts or breaches of representations and warranties in the agreement.
Each party may terminate the agreement for breaches that are not cured timely. In addition, each party may terminate the agreement if the year-on-year net revenue growth realized by us for our cruise expeditions is less than a specified percentage, provided that any exercise of such termination right is limited to the 30-day period following delivery of year-end results and is subject to 18 months prior notice. National Geographic also has the right to terminate the agreement in the event of a change of control of our company.
The agreement further provides for the support of the LEX-NG Fund administered by National Geographic. The LEX-NG Fund identifies and articulates to our guests regional issues in conservation, education, research, and community development that require financial support. In 2015, nine key areas were supported with an aggregate amount of $1.4 million. The majority of funds were donated by guests traveling aboard our fleet; National Geographic also contributed 10% of royalty payments we made to National Geographic. In some instances, matching funds have been negotiated with third parties. In connection with the merger of Lindblad and Capitol, the stockholders of Capitol prior to its initial public offering – Capitol Acquisition Management 2 LLC, L. Dyson Dryden, Lawrence Calcano, Richard C. Donaldson, and Piyush Sodha – collectively made a charitable contribution of an aggregate of 500,000 founder’s shares in Capitol to the LEX-NG Fund for no additional consideration. The LEX-NG Fund is managed jointly by one of our staff members and a National Geographic staff member, and the Board is currently comprised of four members, including Sven-Olof Lindblad, the founder, President and Chief Executive Officer of Lindblad Expeditions Holdings, Inc., and Terry Garcia, Chief Science and Exploration Officer of National Geographic Society.
Tour Operator Agreement. Pursuant to the Tour Operator Agreement, we are the exclusive provider of ocean-going ships to National Geographic marketed in the U.S., its territories and possessions, including Puerto Rico, subject to certain exceptions. For National Geographic trips that we operate, National Geographic will market the trips under the “National Geographic Expeditions” mark and, at its own cost, is responsible for product selection, marketing and providing its own experts while we, at our own cost, are responsible for the trip itinerary and operations, marketing support, staffing, customer service, administrative operations, fare collections, and other operations on the trip. As part of the agreement, we are required to pay fees to National Geographic as a percentage of the price charged to guests. Pursuant to the agreement, National Geographic granted us a license to use its trademarks in connection with the marketing of National Geographic trips. Each party may terminate the agreement for breaches of the agreement that are not cured timely. Each party also agreed to a standard indemnification clause for negligent acts.
| 9 |
Amendments to Alliance and License Agreements and Tour Operator Agreement in connection with the Mergers. We entered into amendments with National Geographic dated as of March 9, 2015 to each of the agreements to extend the expiration date of each agreement from December 31, 2017 until December 31, 2025 and reaffirm the continued effectiveness of the agreements notwithstanding the mergers with Capitol. The amendment to the Alliance and License Agreement also provides that we have the right to brand each vessel acquired in the future under the name “National Geographic.”
In connection with the merger on July 8, 2015, the Company, Mr. Lindblad and National Geographic entered into a Call Option agreement where Mr. Lindblad agreed to grant National Geographic an option to purchase 2,387,499 of Mr. Lindblad’s shares in the Company as consideration for the assumption of the Alliance and License agreements and the Tour Operator agreement (see Note 10 – Commitments and Contingencies for more details).
Mr. Lindblad also serves on National Geographic’s International Council of Advisors, which is composed of individuals identified by National Geographic as visionary leaders from a range of professions and industries across the globe that exemplify the intellectual curiosity and quest for adventure that has driven National Geographic’s mission since 1888. Mr. John M. Fahey, Jr., one of our directors, previously served as the Chairman and Chief Executive Officer of National Geographic.
Expedition Ships and Voyages
Itineraries
As of March 7, 2016, we operated a fleet of six expedition vessels owned through our subsidiaries and four chartered ships to provide our signature marine-based adventures to over 40 destinations along all seven continents of the world. We have extensive experience operating in the Galápagos Islands, Antarctica and the Arctic, with the Lindblad family having been among the first to bring non-scientist travelers to these regions. We currently operate two vessels in the Galápagos, providing week-long itineraries throughout the year. We operate two pole-to-pole vessels that serve in Antarctica during the northern hemisphere winter, in the Arctic during the summer and various destinations during the intermediate months, offering itineraries that last from five to 24 days. We also run two ships in Alaska during the summer months that travel south along the U.S. coastline to the Sea of Cortez and to Costa Rica and Panama for the winter. In addition, we charter four vessels for seasonal itineraries in the Amazon, Scotland, the Caribbean, the Mediterranean, Cambodia, and Vietnam.
We place a strong focus on innovation, which we seek to achieve by introducing new expedition options and continuously making improvements to our fleet and voyage experiences as new technology or operating procedures are developed. We make deployment decisions with the goal of optimizing the overall profitability of our portfolio, with these decisions generally made 18 to 24 months in advance. We have operated at a 91.8% occupancy rate in the year ended December 31, 2015, 92.9% in 2014 and 92.4% in 2013, indicating strong consumer interest in our offerings. Adding new capacity will allow us to expand our inventory of existing itineraries and expand into new markets and destinations. The following table presents summary information concerning the ships we currently operate and their geographic areas of operation based on 2016 itineraries:
| Vessel Name | Date Built | Guest Capacity | Cabins | Primary Areas of Operation | Flag | |||||||||
| National Geographic Explorer | 1982, rebuilt in 2008 | 148 | 81 | Arctic, Antarctica, Azores, British Isles, Canada, Patagonia, South America and Transatlantic | Bahamas | |||||||||
| National Geographic Orion | 2003 | 102 | 53 | Antarctica, Europe and Arctic | Bahamas | |||||||||
| National Geographic Endeavour | 1966 | 95 | 56 | Galápagos | Ecuador | |||||||||
| National Geographic Islander | 1995 | 47 | 24 | Galápagos | Ecuador | |||||||||
| National Geographic Sea Bird | 1981 | 62 | 31 | Alaska, Baja California and Pacific Northwest | U.S.A. | |||||||||
| National Geographic Sea Lion | 1982 | 62 | 31 | Alaska, Costa Rica, Panama and Pacific Northwest | U.S.A. | |||||||||
| Delfin II** | 2009 | 28 | 14 | Amazon | Peru | |||||||||
| Jahan** | 2011 | 48 | 24 | Vietnam and Cambodia | Vietnam | |||||||||
| Lord of the Glens** | 1985 | 48 | 26 | Scotland | UK | |||||||||
| Sea Cloud** | 1931 | 58 | 28 | Caribbean and Mediterranean | Malta | |||||||||
| ** | Chartered Vessel. |
| 10 |
The following table presents summary information concerning the two new passenger cruise vessels being constructed with delivery expected in the second quarter of 2017 and the second quarter of 2018, respectively, as well as the Via Australis that we expect to take possession of in the second quarter of 2016, renovate and deploy as a replacement of the National Geographic Endeavour in the fourth quarter of 2016.
| Vessel Name | Date Built | Guest Capacity | Cabins | Primary Areas of Operation | Flag | |||||||||
| Via Australis | 2005 | 95 | 50 | Galápagos | Chile/Ecuador* | |||||||||
| US Newbuild Hull S188 | 2017 | 100 | 50 | West Coast North America and Central America | U.S.A | |||||||||
| US Newbuild Hull S189 | 2018 | 100 | 50 | West Coast North America and Central America | U.S.A. | |||||||||
*The Via Australis is flagged by its current owner in Chile. Registration and flagging in Ecuador will take place upon completion of the acquisition and the vessel is put in service.
Owned Vessels
National Geographic Explorer, our flagship vessel, joined the fleet in 2008 as our ultimate expedition ship. The Explorer is equipped with an ice-strengthened hull, advanced navigation equipment for polar expeditions and a well-appointed interior with numerous windows for viewing nature. Accordingly, the Explorer is equipped to visit some of the most remote and extreme areas on the planet. The Explorer accommodates 148 guests in 81 cabins, including 13 cabins with private balconies and six suites. The Explorer is spacious and modern, with a variety of public areas that offer views of the passing landscape, including a window-lined library and observation lounge located at the top of the ship, several observation decks and a forward-facing chart room.
National Geographic Orion was designed and built in Germany in 2003 and was substantially enhanced in 2013 upon joining our fleet. The Orion is designed to be self-sufficient for expedition travel with operations focused in Antarctica, Europe and the Arctic. Engineered with comfort and safety in mind, the Orion is a blue water, ice class vessel equipped with advanced technology, including large retractable stabilizers, sonar, radar and an ice-strengthened hull. A shallow draft as well as bow and stern thrusters allow for maneuvering close to shore. The Orion accommodates 102 guests in 53 cabins, including several with balconies and a variety of public spaces that offer panoramic views of the passing landscape. The public rooms include a window-lined main lounge, as well as an observation lounge and library at the top of the ship, with numerous observation decks.
| 11 |
National Geographic Endeavour operates year-round in the Galápagos. Prior to its post to warm equatorial waters, the Endeavour voyaged from pole-to-pole with extensive periods in the icy waters of the Arctic and Antarctic. The Endeavour accommodates 95 guests in 56 outside cabins, including two suites, and offers comfortable public areas and extensive open deck space. The Via Australis is expected to join the fleet in the second quarter of 2016 and, following a significant renovation, is expected to be deployed during the fourth quarter of 2016. The Via Australis will replace the National Geographic Endeavour and will operate in the Galápagos. The Via Australis accommodates 95 guests in 50 cabins and offers public areas designed for maximum viewing with quick, easy access to decks to respond to bridge announcements of phenomenal sightings of nature and wildlife.
National Geographic Islander is a twin-hulled, yacht-scale ship designed for active exploration. The Islander was originally built for service in the Caribbean, and then later used for expeditions in the Scottish Highlands. Since 2004, the Islander has been sailing year-round in the Galápagos, which it is ideally suited for as its trim design and maneuvering abilities enable it to visit areas larger vessels cannot, allowing guests to experience the islands from a more up-close perspective. The Islander accommodates 47 guests in 24 outside cabins, including two suites. On board there are open decks that are complete with hammocks as well as a large dining room and large lounges that form part of the social hub of the ship.
National Geographic Sea Bird is the twin ship of the Sea Lion and offers expedition cruises in Alaska, the Pacific Northwest, Baja California and the Sea of Cortez. The Sea Bird has a shallow draft and small size and can reach places inaccessible to larger ships. The Sea Bird accommodates 62 guests in 31 outside cabins.
National Geographic Sea Lion is the twin ship of the Sea Bird and operates in Alaska, the Pacific Northwest, Baja California, the Sea of Cortez, Costa Rica, and Panama. The Sea Lion has a shallow draft and a small size so that it can reach places inaccessible to larger ships. The Sea Lion accommodates 62 guests in 31 outside cabins and has an open bow that provides for shared wildlife viewing experiences.
Chartered Vessels
Delfin II is a riverboat recently built to explore the Peruvian Amazon. Delfin II accommodates 28 guests in 10 suites and four master suites. The entire third deck is open-air, offering a view of the river and the rainforest. Furnishings are made of harvested local rain forest wood and the ship is decorated with handicrafts from the ribereños, native people of the wildlife preserves.
Jahan is a riverboat built in 2011 for exploring Vietnam and Cambodia. Jahan accommodates 48 guests in 24 cabins, including two suites. Every cabin has a private balcony and the suites each have a private jacuzzi. Jahan has four decks and has several public areas where the expedition community can gather to watch life along the riverbank. The public spaces include a covered, open-air observatory, open bow and a pool on the top deck.
Lord of the Glens is specifically sized to be able to sail through the Caledonian Canal in Scotland, which connects the North Sea to the Atlantic, and can also navigate the coastline and venture to the islands of the Inner Hebrides. Lord of the Glens accommodates 48 guests in 26 outside cabins.
Sea Cloud offers the experience of sailing aboard a fully-rigged ship in the Caribbean and Mediterranean and accommodates 58 guests in 28 outside cabins, including two original owner’s suites that still feature original marble baths and fireplaces. The Sea Cloud has extensive public spaces on the top deck, a dining room that can accommodate all guests at once for single seating and a lounge.
Ship Maintenance
In addition to routine repairs and maintenance performed on an ongoing basis and in accordance with applicable requirements, each of our expedition ships is taken out of service for a scheduled deeper maintenance period to conduct repairs and improvements. We maintain our fleet in accordance with applicable regulations, international conventions and insurance requirements. This includes regularly scheduled maintenance, periodic inspections, drydocking, wetdocking, and overhaul. In addition, renovations and replacements of various vessel elements are part of the ongoing process of maintaining the vessels to a high standard. On a year-to-year basis, increases in maintenance expense for the current owned fleet are anticipated to grow in line with inflation. For U.S. flagged ships, the statutory requirement is an annual docking and U.S. Coast Guard inspections, normally conducted in drydock. Internationally flagged ships have scheduled dockings approximately every 12 months, for a period of up to three to six weeks. Drydock interval and required inspections are statutory requirements controlled under chapters of the International Convention of the Safety of Life at Seas (“SOLAS”) and Classification Society instructions. Under these regulations, passenger ships must be inspected in drydock twice in five years, with the maximum duration between each drydock inspection not to exceed three years, and an underwater hull inspection is required annually. To the extent practical, each ship’s crew, catering and hotel staff remain with the ship during docking periods and assist in performing repair and maintenance work. We do not earn revenue while ships are in dock. Accordingly, dockings are typically planned during non-peak demand periods to minimize the adverse effect on revenue that results from ships being out of service.
| 12 |
Guest Activities and Services
We provide our guests the opportunity and the tools to be active and engaged explorers.
Vessels include a variety of equipment for exploration which, depending on the ship and destination, may include Zodiacs for water-level activities and quick transfers to shore, kayaks for personal exploration, motorized skiffs, an underwater camera, a remotely operated vehicle capable of reaching depths of 1,000 feet, a video microscope to study some of the smallest organisms of the marine ecosystem, a crow’s nest camera atop a ship’s mast, hydrophones for listening to vocalizations of marine mammals, snorkeling gear, scuba gear, and wetsuits. An experienced and knowledgeable expedition staff leads guests in exploration while hiking onshore, paddling on the water or observing wildlife from onboard the ship. All voyages feature a certified photo instructor onboard and many include photographers from National Geographic.
Our ships allow guests to be close to wild nature, but at the same time, enjoy a high level of comfort and convenience. High quality dining is an integral part of our expedition experience with influences and flavors that reflect the regions being explored, along with traditional fare. All food prepared aboard is sourced locally whenever practicable from sustainable providers. Seating is open and the atmosphere is relaxed. Our ships offer a range of services and amenities which allow our guests to travel in comfort. Depending on the ship, these may include a fitness center, a spa offering a variety of treatments, a photo kiosk for photographers to edit and sort photos, a pool, 24-hour beverage service, internet connection, laundry facilities, and a doctor on call.
We offer to handle virtually all travel aspects related to guest reservations and transportation, simplifying the planning and booking process for our guests. We also provide guests the opportunity to purchase pre- and post-expedition extensions or services that may include additional hotel nights, air travel, private transfers, excursions, land travel packages, and travel protection insurance.
Guests and Occupancy Rates
Selected statistical information regarding the company’s guests and occupancy is shown in the following table:
| For the Years Ended December 31, | ||||||||||||
| 2015 | 2014 | 2013 | ||||||||||
| Available Guest Nights | 184,366 | 180,206 | 177,135 | |||||||||
| Guest Nights Sold | 169,303 | 167,483 | 163,758 | |||||||||
| Occupancy | 91.8 | % | 92.9 | % | 92.4 | % | ||||||
| Maximum Guests | 21,459 | 20,216 | 20,858 | |||||||||
| Number of Guests | 19,824 | 18,819 | 19,327 | |||||||||
| Voyages | 281 | 262 | 265 | |||||||||
| 13 |
Operations
Sales and Marketing
We place a strong emphasis on identifying the needs of our guests and creating expedition opportunities and products that guests value. We use communication strategies and marketing campaigns designed to strengthen brand awareness and to emphasize the distinctive qualities of each expedition we offer. Marketing strategies include the use of traditional media, social media, brand websites, and travel agencies.
We source our business through a combination of direct selling, travel agency networks and our strategic alliance with National Geographic. We believe in the value of the travel agency network distribution channel and invest in maintaining strong relationships with our key travel agency network partners and seek to maintain commission rates and incentive structures that are competitive within the marketplace.
Historically, our focus has been to primarily source guests for our expeditions from the U.S. Expedition cruise guests sourced from the U.S. represented approximately 87%, 84% and 92% of our total global expedition cruise guests in 2015, 2014 and 2013, respectively. Guest ticket revenues generated by sales originating in countries outside of the U.S. were approximately 15%, 19% and 8% of total tour revenues in 2015, 2014 and 2013, respectively.
Our largest channel for guest bookings is direct contact, either by guests calling our toll-free number (1-800-EXPEDITION) and speaking with our expedition specialists, or requesting a reservation online at our website, expeditions.com. The direct channel represented nearly 43%, 49% and 46% of guest ticket revenues for 2015, 2014 and 2013, respectively.
Our second largest channel is bookings from travel agents and wholesalers, representing approximately 28%, 28% and 26% of guest ticket revenues for 2015, 2014 and 2013, respectively. Agent outreach efforts are focused primarily on consortiums, or travel agent networks, which target affluent travelers. The four consortiums with which we have preferred partner agreements are Virtuoso, Signature, American Express, and Ensemble. Preferred status provides their agents with financial incentives to book their customers on our expeditions and provides us the opportunity for enhanced marketing to their agents and end-user customers. Our agent and affinity sales team meet with hundreds of highly-targeted agents annually, at consortium conferences and training seminars, and in-person at agency offices to provide hands-on training, support and product knowledge. In addition, a very select group of highly-productive and motivated agents can earn incremental commissions as part of the LEX Leaders incentive program.
The National Geographic relationship also serves as a channel for bookings. Our alliance with National Geographic includes a co-selling and co-marketing arrangement through which National Geographic promotes our offerings in its marketing campaigns across web-based, email, print, and other marketing platforms and sells our expeditions through its internal travel division. The National Geographic channel represented approximately 24%, 20% and 22% of guest ticket revenues for 2015, 2014 and 2013, respectively. The remainder of bookings, 5%, 3% and 6% of guest ticket revenues for 2015, 2014 and 2013, respectively, comes from affinity groups and charters. Affinity groups are predominantly college and university alumni associations, and other travel organizations targeting specific market niches.
We have a broad and diverse marketing mix across multiple media platforms and channels, allowing us to effectively communicate our product offerings to past guests and prospective guests. We continually optimize our media mix to reach our target demographic. The majority of our annual global marketing spend is focused on consumer-direct channels, with direct mail being the largest segment of our marketing expenditures. Our detailed brochures present our expedition offerings comprehensively, providing guests with all the information needed to make an informed travel decision. We also execute direct mail campaigns with the primary purpose of generating qualified leads, upon which we will fulfill requests with the appropriate product brochure and/or DVD. We also promote our expeditions across a variety of print media, primarily magazines targeting affluent travelers, as well as nature and photography enthusiasts.
Our website, expeditions.com, is supported internally by a dynamic content management system, allowing frequent updates, a visually-impactful design, large photos, and video display with simple, straightforward navigation. We also send weekly mobile-optimized emails to our database of opt-in email subscribers, which link back to key areas on expeditions.com. In addition, we routinely offer webinars to offer greater insights into our expeditions, hosted by members of the expedition teams with intimate knowledge of the geographies featured.
| 14 |
We maintain an active presence on numerous social media platforms, focusing primarily on those with the greatest reach to our target demographic: Facebook, Instagram, Twitter, and YouTube. In addition, we routinely feed content to National Geographic’s social media platforms, which extend the reach of our brand significantly.
Our marketing and sales team is based in the U.S. and Sydney, Australia. The marketing team encompasses broad and diverse skill sets including product and channel marketing, digital marketing, database marketing, copywriting and creative, video production, and research and analytics.
Expedition Cruise Pricing
Our voyage prices include accommodations and all expedition activities and meals, other than items of a personal nature, such as alcohol, airfare to and from an expedition, spa treatments, and certain other specialized events or activities. Prices vary depending on many factors, including the destination, number of guest berths available, expedition length, cabin category selected, and time of year during which the expedition takes place. Payment terms generally require an upfront deposit to confirm a reservation, with the balance due prior to departure.
We focus on maintaining list pricing of our offerings and any discounting that we pursue is tactical, targeted and infrequent. In addition to our standard expedition packages, we may be able to offer a complete vessel for charter and may provide incentives for this type of arrangement. Group and multi-generational family travel may also be eligible for additional incentives based upon the voyage, duration and number of guests travelling. From time to time, we may incentivize guests to book with us with a variety of offers, including free or reduced price air transportation, hotel nights or other value added items. We offer rewards to our guests through our loyalty program, Friends for Life, to encourage repeat business.
Lindblad Expeditions – National Geographic Joint Fund for Exploration and Conservation
We seek to inspire people to explore and care about the planet. One of our governing principles is to positively impact the areas we explore and in which we work. To this end, we, along with National Geographic, created the LEX-NG Fund to support projects at the global, regional and local level. The objective of the LEX-NG Fund is to protect the last wild places in the ocean, support innovative local projects and facilitate conservation, research, educational, and community development projects in the places we explore. Together with our guests, we have raised more than $11.0 million since 1997, along with the 500,000 shares in Capitol contributed by the founders of Capitol in connection with the merger with Lindblad, to support the regions that we visit. Since we and National Geographic together cover the LEX-NG Fund’s operating costs, 100% of guest contributions go directly to on-the-ground projects.
Environmental Stewardship
Our staff is involved in organizations such as the International Association of Antarctic Tour Operators and the Association of Arctic Expedition Cruise Operators, which seek to lead the tourism industry with management best practices for visiting places such as Antarctica, the Arctic and the Galápagos Islands. Our staff also works with the MarViva Foundation (a non-governmental organization focused on promoting the conservation and sustainable use of coastal and marine ecosystems in the eastern tropical Pacific) to provide a consumer market for sustainably caught fish from the first designated responsible fishing area of Costa Rica. We also work with the Charles Darwin Research Station and Charles Darwin Foundation on conservation initiatives geared toward preserving the Galápagos Islands.
Seasonality
We choose to visit geographic areas based upon many factors, including weather, marine conditions, migration patterns, and various natural phenomena. In the northern hemisphere summer months, we visit the High Arctic regions of the world, the Canadian Maritimes, Europe, and Alaska. In the northern hemisphere winter months, we travel to Antarctica, South America, Costa Rica, Baja California, and the Caribbean. The Galápagos Islands are a year-round destination offering a diverse variety of marine, land and airborne wildlife.
| 15 |
Suppliers
Our largest capital expenditures are for ship maintenance and acquisition, and our largest operating expenditures are for payroll, fuel, food and beverage, travel agent services, and advertising and marketing. Most of the supplies that we require are available from numerous sources at competitive prices.
Insurance
We maintain comprehensive insurance coverage at commercially reasonable rates and believe that our current coverage is at appropriate levels to protect against most of the risk involved in the conduct of our business.
We maintain insurance on the hull and machinery of each of our ships that includes additional coverage for disbursements, earnings and increased value. We also maintain protection and indemnity insurance for each of our owned ships. In addition, we maintain war risk insurance on each ship, which covers damage due to acts of war, including invasion, insurrection, terrorism, rebellion, piracy and hijacking. This coverage includes coverage for physical damage to the ship which is not covered under the hull policies as a result of war exclusion clauses in such hull policies. We also maintain protection and indemnity war risk coverage. Consistent with most marine war risk policies, under the terms of the war risk insurance coverage, underwriters can give notice that the policy will be canceled and reinstated at higher premium rates. We also maintain insurance coverage for shoreside property, shipboard inventory and marine and non-marine general liability risks, as well as business interruption insurance for our owned ships based on the evaluation of the financial exposure per vessel for net income and fixed overhead expenses. In addition, we maintain workers compensation, directors and officers’ liability and other insurance coverage.
We historically have been able to obtain insurance coverage in amounts and at premiums we have deemed to be commercially acceptable. No assurance can be given that affordable and secure insurance markets will be available in the future, particularly for war risk insurance. All of our insurance coverage is subject to certain limitations, exclusions and deductible levels.
Regulation
Our ships are regulated by various international, national, state and local laws, regulations, and treaties in force in the jurisdictions in which they operate. In addition, certain ships are registered in the U.S., the Bahamas or Ecuador, as applicable. Each ship is subject to regulations issued by its country of registry, including regulations issued pursuant to international treaties governing the safety of the ships, guests and crew as well as environmental protection. Each country of registry conducts periodic inspections to verify compliance with these regulations. Ships operating out of U.S. ports are subject to inspection by the U.S. Coast Guard for compliance with international treaties and by the United States Public Health Service for sanitary and health conditions. Ships are also subject to similar inspections pursuant to the laws and regulations of various other countries visited. We consider ourselves to be in material compliance with all the regulations applicable to our ships and that we have all licenses necessary to conduct our business. Health, safety, security, environmental, and financial responsibility issues are, and will continue to be, an area of focus by the relevant government authorities in the U.S. and internationally. From time to time, various regulatory and legislative changes may be proposed that could impact operations and subject us to increasing compliance costs in the future.
Safety and Security Regulations
Our ships are required to comply with international safety standards defined in the International Convention for Safety of Life at Sea, which among other things, establishes requirements for ship design, structural features, materials, construction, life-saving equipment and safe management, and operation of ships to ensure guest and crew safety. The SOLAS standards are revised from time to time and the most recent modifications were phased in through 2010. SOLAS incorporates the International Safety Management Code (“ISM Code”), which provides an international standard for the safe management and operation of ships and for pollution prevention. The ISM Code is mandatory for all vessels, including passenger vessel operators. All of our operations and ships are regularly audited by various national authorities and maintain the required certificates of compliance with the ISM Code.
| 16 |
The ships are also subject to various security requirements, including the International Ship and Port Facility Security Code (“ISPS Code”), which is part of SOLAS, and the U.S. Maritime Transportation Security Act of 2002 (“MTSA”), which applies to ships that operate in U.S. ports. In order to satisfy these security requirements, we implement security measures, conduct vessel security assessments and develop security plans. The security plans for all of the ships have been submitted to, and approved by, the respective countries of registry for compliance with the ISPS Code and the MTSA.
The Cruise Vessel Security and Safety Act of 2010, which applies to passenger vessels that embark passengers from or include port stops within the U.S., requires the implementation of certain safety design features as well the establishment of practices for the reporting of and dealing with allegations of crime.
Environmental Regulations
We are subject to various U.S. and international laws and regulations relating to environmental protection. Under such laws and regulations, we are prohibited from, among other things, discharging certain materials, such as petrochemicals and plastics, into the waterways. From time to time, environmental and other regulators may consider more stringent regulations, which may affect our operations and increase compliance costs.
The ships are subject to the International Maritime Organization’s regulations under the International Convention for the Prevention of Pollution from Ships (the ‘‘MARPOL Regulations’’), which includes requirements designed to minimize pollution by oil, sewage, garbage, and air emissions. We have obtained the relevant international compliance certificates relating to oil, sewage and air pollution prevention for all of our ships.
The MARPOL Regulations impose global limitations on the sulfur content of fuel used by ships operating worldwide and also establish special Emission Control Areas (‘‘ECAs’’) with stringent limitations on sulfur and nitrogen oxide emissions in these areas. As of February 2014, there were four established ECAs: the Baltic Sea, the North Sea/English Channel, certain of the waters surrounding the North American coast, and the waters surrounding Puerto Rico and the U.S. Virgin Islands. Since July 1, 2010, ships operating in ECAs are required to operate on fuel with a sulfur content of 1.0%, which was reduced to 0.1% effective January 1, 2015. By January 1, 2020, the MARPOL Regulations will require the worldwide limitations on sulfur content of fuel to be further reduced to 0.5%.
In July 2011, new MARPOL Regulations introduced mandatory measures to reduce greenhouse gas emissions. These include the utilization of an energy efficiency design index (“EEDI”) for new ships as well as the establishment of an energy efficient management plan for all ships. The EEDI is a performance-based mechanism that requires a certain minimum energy efficiency in new ships. These regulations apply to new vessels commissioned after January 1, 2013. In June 2013, the European Commission proposed legislation which would require cruise ship operators using ports in the European Union to monitor and report on the vessels’ annual carbon dioxide emissions starting in 2018.
The Jones Act
As U.S. flag vessels, the National Geographic Sea Lion and the National Geographic Sea Bird are subject to the U.S. laws relating to the transport of passengers and cargo between U.S. ports in the U.S. coastwise trade. Our two newbuild coastal vessels currently under construction will also be U.S. flagged.
These laws relating to vessels are principally contained in 46 U.S.C. Chapter 551 and 46 U.S.C. §50501 and the federal regulations promulgated thereunder and are commonly referred to collectively as the “Jones Act.” Subject to limited exceptions, the Jones Act requires, among other things, that vessels engaged in U.S. coastwise trade be owned and operated by “citizens of the United States” within the meaning of the Jones Act. For purposes of the Jones Act, a corporation, for example, must satisfy at least the following requirements to be deemed a U.S. citizen: (i) the corporation must be organized under the laws of the U.S. or of a state, territory or possession thereof; (ii) each of the chief executive officer and the chairman of the board of directors of such corporation, and each person authorized to act in the absence or disability of such persons, must be a U.S. citizen; (iii) no more than a minority of the number of directors of such corporation necessary to constitute a quorum for the transaction of business can be non-U.S. citizens; and (iv) at least 75% of each class or series of stock in such corporation must be beneficially owned by U.S. citizens within the meaning of the Jones Act.
| 17 |
Labor Regulations
The International Labour Organization, an agency of the United Nations that develops worldwide employment standards, adopted a Consolidated Maritime Labour Convention (the “Convention”) in 2006, which became effective in August 2013. The Convention reflects a broad range of standards and conditions governing all aspects of crew management for ships in international commerce, including additional requirements not previously in effect relating to the health, safety, repatriation, entitlements and status of crewmembers and crew recruitment practices. Each of our ships, except for our two ships operating in Ecuador (not a signatory to the Convention), has received its certification of compliance with the requirements of the Convention.
Consumer Financial Responsibility Regulations
U.S. law requires the operators of passenger vessels embarking passengers at U.S. ports to be certified by the United States Federal Maritime Commission as to their ability to satisfy obligations with respect to unearned passenger revenue in case of non-performance, and for liability in case of casualty or personal injury. We satisfy these requirements with respect to our operation of the National Geographic Sea Bird and National Geographic Sea Lion through an escrow account for passenger deposits and through our liability insurers.
Certain jurisdictions require that we establish financial responsibility to our guests resulting from the non-performance of our obligations; however, the related amounts do not have a material effect on our costs.
In Australia and parts of Europe, we are obligated to honor guests’ cruise payments made by them to their travel agents regardless of whether we receive such payments.
Regulations Regarding Protection of Disabled Persons
In June 2013, the U.S. Architectural and Transportation Barriers Compliance Board proposed guidelines for the construction and alteration of passenger vessels to ensure that the vessels are readily accessible to and usable by passengers with disabilities. If and when finalized, these guidelines will be used by the U.S. Department of Transportation and U.S. Department of Justice to implement mandatory and enforceable standards for passenger vessels covered by the Americans with Disabilities Act. While we believe our vessels have been designed and outfitted to meet the needs of guests with disabilities, we cannot, at this time, accurately predict whether we will be required to make material modifications or incur significant additional expenses given the status of the proposed guidelines.
United States Income Taxation
The following is a discussion of the application of the U.S. federal and state income tax laws to us and is based on the current provisions of the United States Internal Revenue Code, Treasury Department regulations, administrative rulings, court decisions and the relevant state tax laws, regulations, rulings and court decisions of the states where we have business operations. All of the foregoing is subject to change, and any such change could affect the accuracy of this discussion.
At the present time, our subsidiaries that are foreign corporations do not derive any significant income from sources within the U.S., and are not subject to significant U.S. federal income taxes. Any income earned by these subsidiaries from sources within the U.S. generally is subject to U.S. federal income tax at a top rate of 35% (and to U.S. branch profits tax at a rate of 30% on effectively connected earnings and profits, subject to certain adjustments) unless the requirements of the exemption under Section 883 of the Internal Revenue Code are met. In general, any U.S. source income earned by one of our subsidiaries that is a foreign corporation qualifies for exemption under Section 883 if this income is derived from or incidental to the international operation of ships, and if the subsidiary is incorporated in a country that grants an equivalent exemption to U.S. corporations. The countries in which our subsidiaries that are foreign corporations are incorporated do grant equivalent exemptions to U.S. corporations. The income of our foreign subsidiaries that is treated as being derived from or incidental to the international operation of ships generally does not include any capital gains recognized upon a disposal of a vessel, or income from the sale of air and land transportation, shore excursions, and pre- and post-cruise tours. If one of our foreign subsidiaries recognizes a capital gain upon a disposal of a vessel, this capital gain will generally constitute income from sources within the U.S. and will generally not be entitled to exemption under Section 883.
| 18 |
Our subsidiaries that are U.S. corporations are subject to U.S. federal income tax at a top rate of 35% on all their income, and are subject to income tax in the various States within the U.S. in which they have operations. At the present time, the only State in which our U.S. subsidiaries are expected to pay significant amounts of state income taxes is Alaska.
We also pay income taxes in Australia, Ecuador and other countries within which we operate. In addition to, or instead of, income taxation, virtually all jurisdictions where our ships call impose some tax or fee, or both, based on guest headcount, tonnage or some other measure.
Competition
We compete with a number of cruise lines with competition varying by destination. The market is fragmented and primarily comprised of private operators. The primary competitors which operate in the geographic regions we serve include Silversea Expeditions, Compagnie du Ponant, Hurtigruten, and Un-Cruise Adventures. We also compete with other vacation alternatives such as land-based resort hotels and sightseeing destinations for guests’ leisure time. Demand for such activities is influenced by political and general economic conditions. Companies within the vacation market are dependent on consumer discretionary spending.
Our principal competitive strengths, particularly our established reputation, experienced management team, product offerings, and association with National Geographic, provide us with a competitive advantage in the specialty cruise segment of the market.
The cruise industry in general and the expedition cruise industry specifically are characterized by high barriers to entry, including the existence of several established and recognizable brands, the large investment required to build a new, sophisticated cruise or expedition ship, the long lead time necessary to construct new ships, and limited newbuild shipyard capacity.
Employees
As of December 31, 2015, we had approximately 368 employees, including 231 shipboard employees, 134 full-time employees and three part-time employees in our shoreside operations.
Business Segments
We are a specialty cruise operator with operations in one segment. We evaluate the performance of our business based largely on the results of our single operating segment. We provide discrete financial information in total, by ship and type of ship. The chief operating decision maker, or CODM, and management review operating results monthly, and base operating decisions on the total results. Our reports provided to the Board of Directors are at a consolidated level. Management performance and related compensation is based on total results. Based on this assessment, we concluded that we have one single operating segment and therefore one reportable segment.
Corporate Information
We are a Delaware corporation and our corporate headquarters are located at 96 Morton Street, 9th Floor, New York, New York 10014. Our telephone number is (212) 261-9000. Our Internet website address is www.expeditions.com. Our corporate filings, including our Annual Report on Form 10-K, our Quarterly Reports on Form 10-Q, our Current Reports on Form 8-K, our proxy statements and reports filed by our officers and directors under Section 16 (a) of the Securities Exchange Act, and any amendments to those filings, are available, free of charge, on our website as soon as reasonably practicable after we electronically file such material with the Securities and Exchange Commission. We do not intend for information contained on our website to be a part of this Annual Report on Form 10-K.
| 19 |
| Item 1A. | Risk Factors |
Set forth below are some of the risks and uncertainties that, if they were to occur, could materially and adversely affect our business or could cause our actual results to differ materially from the results contemplated by the forward-looking statements contained in this Form 10-K and the other public statements we make.
Risks Related to Our Business and Operations
Adverse worldwide economic, geopolitical or other conditions could reduce the demand for expedition cruises and adversely impact our operating results, cash flows and financial condition, including potentially impairing the value of our fleet, goodwill and other assets.
The demand for expedition cruises may be affected by international, national and local economic and geopolitical conditions. In particular, challenging global economic conditions that adversely affect discretionary income and consumer confidence may, in turn, result in expedition booking slowdowns, decreased expedition prices and lower onboard revenues for the cruise and expedition cruise industries as compared to more robust economic times. In addition, any significant deterioration of global economic conditions could result in a prolonged period of booking slowdowns, depressed expedition prices and reduced onboard revenues. Demand for our expedition cruises may also be influenced by geopolitical events. Unfavorable conditions, such as cross-border conflicts, civil unrest and governmental changes, can undermine consumer demand and/or pricing for expeditions in areas affected by such conditions.
We may not be able to obtain sufficient financing or capital for our needs or may not be able to do so on terms that are acceptable or consistent with our expectations.
To fund our capital expenditures and scheduled debt payments, we have historically relied on a combination of cash flows provided by operations, drawdowns under available credit facilities, the incurrence of additional indebtedness and the sale of equity securities in private securities markets. Any circumstance or event which leads to a decrease in consumer cruise spending, such as worsening global economic conditions or significant incidents impacting the cruise industry, the expedition cruise industry, or the travel industry, could negatively affect our operating cash flows.
Although we believe that we have sufficient cash flows from operations and will have sufficient access to capital to fund our operations and obligations as expected, there can be no assurances to that effect. Our ability to access additional funding as and when needed, our ability to timely refinance and/or replace outstanding debt and credit facilities on acceptable terms and our cost of funding will depend upon numerous factors including but not limited to the condition of the financial markets, our financial performance and credit ratings and the performance of our industry in general.
Any inability to satisfy any covenants required by existing or future credit facilities could adversely impact our liquidity.
On July 8, 2015, we entered into the Amended Credit Agreement with Credit Suisse A.G. as Administrative Agent and Collateral Agent. The Amended Credit Agreement (i) requires us to maintain a total net leverage ratio of 4.75 to 1.00 initially, which ratio is reduced by 0.25 on March 31, 2016 with equal reductions annually thereafter until March 31, 2020, when the total net leverage ratio shall be 3.50 to 1.00 thereafter; (ii) limits the amount of indebtedness we may incur generally and specifically for intercompany debt, debt incurred to finance acquisitions and improvements, for capital and synthetic lease obligations, for standby letters of credit, and in connection with refinancings; (iii) limits the amount we may spend in connection with certain types of investments; and (iv) requires the delivery of certain periodic financial statements and an operating budget. The Amended Credit Agreement is secured by substantially all of our assets.
| 20 |
Any failure to comply with such terms, conditions, and covenants could result in an event of default. Further, if an event of default under a credit facility were to occur, cross default provisions, if any, could cause our other outstanding debt, if any, to be immediately due and payable. Upon such an occurrence, there could be no assurance that we would have sufficient liquidity to repay or the ability to refinance the borrowings under any such credit facilities or settle other outstanding contracts if such amounts were accelerated upon an event of default.
Incidents or adverse publicity concerning the cruise vacation industry, the expedition cruise industry, or the travel industry, weather conditions and other natural disasters or disruptions could affect our reputation as well as impact our sales and results of operations.
The operation of cruise ships, airplanes, land tours, port facilities and shore excursions involves the risk of accidents, illnesses, mechanical failures, environmental incidents, including oil spills, and other incidents which may bring into question safety, health, security and vacation satisfaction which could negatively impact our reputation. Incidents involving cruise ships, and, in particular the safety and security of guests and crew, media coverage thereof, as well as adverse media publicity concerning the cruise vacation industry have impacted and could in the future impact demand for our expedition cruises and pricing in the industry. The considerable expansion in the use of social media over recent years has compounded the potential scope of the negative publicity that could be generated by those incidents. If any such incident occurs during a time of high seasonal demand, the effect could disproportionately impact our results of operations for the year. In addition, incidents involving cruise ships may result in additional costs to our business, increasing government or other regulatory oversight and, in the case of incidents involving our fleet, potential litigation.
Our fleet and port facilities may also be adversely impacted by weather patterns or natural disasters or disruptions, such as hurricanes, earthquakes and changes in ice flows. It is possible that we could be forced to alter itineraries or cancel an expedition or a series of expeditions due to these or other factors, which would have an adverse effect on our sales and profitability. In addition, these and any other events which impact the travel industry more generally may negatively impact our ability to deliver guests or crew to our expeditions and/or interrupt our ability to obtain services and goods from key vendors in our supply chain. Any of the foregoing could have an adverse impact on our results of operations and on industry performance.
Ship construction, repair or revitalization delays or mechanical faults may result in cancellation of expeditions or unscheduled drydockings and repairs and thus adversely affect our results of operations.
We depend on shipyards to construct, repair and revitalize our ships on a timely basis and to ensure they remain in good working order. The sophisticated nature of building, repairing and revitalizing a ship involves risks. Delays in ship construction, repair or revitalization or mechanical faults have in the past and may in the future result in delays or cancellation of expeditions or necessitate unscheduled drydocks and repairs of ships. Any unscheduled drydockings, interruptions or disruptions in service of any of our vessels resulting from weather conditions, natural disasters or otherwise could result, could have a severe impact on our business, results of operations and financial condition. These events and any related adverse publicity could result in lost revenue, increased operating expenses, or both, and thus adversely affect our results of operations.
Delays or cost overruns in building new vessels (including the failure to deliver new vessels) could harm us.
Building new vessels is subject to risks of delay (including the failure to timely deliver new vessels to customers) or cost overruns caused by one or more of the following:
| ● | financial difficulties of the shipyard building a vessel, including bankruptcy; | |
| ● | lack of shipyard availability; | |
| ● | unforeseen engineering or construction problems; | |
| ● | changes to design specifications; | |
| ● | work stoppages; | |
| ● | weather interference; | |
| ● | delays or unanticipated shortages with respect to necessary materials, equipment or skilled labor; and | |
| ● | inability to obtain the requisite permits, approvals or certifications from governmental authorities and the applicable classification society upon completion of work. |
Significant delays, cost overruns and failure to timely deliver new vessels we have committed to service one or more of our customers could adversely affect us in several ways, including delaying the implementation of our business strategies or materially increasing our cost of servicing our commitments to our customers.
We must make substantial capital expenditures to maintain and/or expand our fleet.
We must make substantial capital expenditures to maintain our fleet in good working order. Maintenance capital expenditures include capital expenditures associated with drydocking a vessel, modifying an existing vessel or acquiring a new vessel. These expenditures could increase as a result of changes in the cost of labor and materials; customer requirements; increases in our fleet size or the cost of replacement vessels; governmental regulations and maritime self-regulatory organization standards relating to safety, security or the environment; and competitive standards. In addition, maintenance capital expenditures will vary from quarter to quarter based on the number of vessels drydocked during that quarter. Significant unexpected maintenance capital expenditures could have an adverse impact on our operations.
We will be required to make substantial capital expenditures to increase the size of our fleet. We intend to expand our fleet by acquiring existing vessels from other parties or constructing new vessels. We generally will be required to make installment payments on any new shipbuild prior to their delivery in the future. Accordingly, we may be required to expend a significant amount of money to acquire or build a vessel for delivery well in the future.
| 21 |
An increase in capacity worldwide or excess capacity in a particular market could adversely impact our expedition sales and/or pricing.
Expedition sales and/or pricing may be impacted both by the introduction of new ships into the marketplace and by deployment decisions of us and our competitors. The further growth in capacity from these new ships and future orders, without an increase in the cruise industry’s share of the vacation market, could depress expedition prices and impede our ability to achieve yield improvement. In addition, to the extent that we or our competitors deploy ships to a particular itinerary and the resulting capacity in that region exceeds the demand, we may consider pricing adjustments, which may result in lower than anticipated profitability. Any of the foregoing could have an adverse impact on our results of operations, cash flows and financial condition including potentially impairing the value of our ships, goodwill and other assets.
If we are unable to appropriately balance our cost management strategies with our goal of satisfying guest expectations, our business may be adversely impacted.
Our goals call for us to provide high quality products and deliver high quality services. There can be no assurances that we can successfully balance these goals with our cost management strategies.
We may lose business to competitors throughout the vacation market.
We operate in the vacation market, and expedition cruising is one of many alternatives for people choosing a vacation. We therefore risk losing business not only to other cruise lines, but also to other vacation operators, which provide other leisure options including hotels, resorts and package holidays and tours.
We face significant competition from other vacation operators and cruise companies on the basis of pricing, destination, travel agent preference and also in terms of the nature of ships and services it offers to guests. Our competition within the expedition and cruise vacation industry depends on the destination and is fragmented and primarily comprised of private operators.
In the event that we do not compete effectively with other vacation operators and cruise companies, our results of operations and financial position could be adversely affected.
Fears of terrorist and pirate attacks, war, and other hostilities and the spread of contagious diseases could have a negative impact on our results of operations.
Events such as terrorist and pirate attacks, war, and other hostilities and the resulting political instability, travel restrictions, the spread of contagious diseases, such as the Zika virus, and concerns over safety, health and security aspects of traveling or the fear of any of the foregoing have had, and could have in the future, a significant adverse impact on demand and pricing in the travel and vacation industry. In view of our global operations, we are susceptible to a wide range of adverse events.
Fluctuations in foreign currency exchange rates could affect our financial results.
We earn revenues, pay expenses, recognize assets and incur liabilities in currencies other than the U.S. dollar, including, among others, the Euro, the Australian Dollar, the Swedish Krona, and the British Pound. In 2014 and 2015, we derived approximately 19% and 15%, respectively, of our guest ticket revenues from operations outside the United States. Because our consolidated financial statements are presented in U.S. dollars, we must convert revenues, income and expenses, as well as assets and liabilities, into U.S. dollars at exchange rates in effect during or at the end of each reporting period. Therefore, absent offsetting changes in other foreign currencies, increases or decreases in the value of the U.S. dollar against other major currencies will affect our revenues, net income and the value of balance sheet items denominated in foreign currencies. We use financial instruments to mitigate our net balance sheet exposure to currency exchange rate fluctuations. However, there can be no assurances that fluctuations in foreign currency exchange rates, particularly the strengthening of the U.S. dollar against major currencies, would not materially affect our financial results.
| 22 |
In addition, we have ship maintenance contracts and may in the future have ship construction contracts which are denominated in currencies other than the U.S. Dollar. While we have entered into, and may in the future enter into, forward contracts and collar options to manage a portion of the currency risk associated with these contracts, we are or may be exposed to fluctuations in the exchange rates for the portions of the contracts that have not been hedged. Additionally, if a shipyard is unable to perform under such a contract, any foreign currency forward contracts that were entered into to manage the currency risk would need to be terminated. Termination of these contracts could result in a significant loss.
Environmental, labor, health and safety, financial responsibility and other maritime regulations could affect operations and increase operating costs.
The United States and various state and foreign government or regulatory agencies have enacted or are considering new environmental regulations or policies, such as requiring the use of low sulfur fuels, increasing fuel efficiency requirements, further restricting emissions, or other initiatives to limit greenhouse gas emissions that could increase our cost for fuel, cause us to incur significant expenses to purchase and/or develop new equipment and adversely impact the cruise vacation industry. Some environmental groups have also lobbied for more stringent regulation of cruise ships and have generated negative publicity about the cruise vacation industry and its environmental impact. An increase in fuel prices not only impacts our fuel costs, but also some of our other expenses, such as crew travel, freight and commodity prices.
In addition, we are subject to various international, national, state and local laws, regulations and treaties that govern, among other things, safety standards applicable to our ships, treatment of disabled persons, health and sanitary standards applicable to our guests, security standards on board our ships and at the ship/port interface areas, and financial responsibilities to our guests. These issues are, and we believe will continue to be, an area of focus by the relevant authorities throughout the world, especially in light of several recent incidents involving cruise ships. This could result in the enactment of more stringent regulation of cruise ships that could subject us to increasing compliance costs in the future.
Conducting business globally may result in increased costs and other risks.
We operate our business globally. Operating internationally exposes us to a number of risks, including unstable local economic conditions, volatile local political conditions, potential changes in duties and taxes, including changing interpretations of existing tax laws and regulations, required compliance with additional laws and policies affecting cruising, vacation or maritime businesses or governing the operations of foreign-based companies, currency fluctuations, interest rate movements, government controlled fuel prices, difficulties in operating under local business environments, U.S. and global anti-bribery laws or regulations, imposition of trade barriers and restrictions on repatriation of earnings. If we are unable to address these risks adequately, our financial position and results of operations could be adversely affected, including potentially impairing the value of our ships, goodwill and other assets.
Operating globally also exposes us to numerous and sometimes conflicting legal and regulatory requirements. In many parts of the world, including countries in which we operate, practices in the local business communities might not conform to international business standards. We must adhere to policies designed to promote legal and regulatory compliance as well as applicable laws and regulations. However, we might not be successful in ensuring that our employees, agents, representatives and other third parties with whom we associate throughout the world properly adhere to them.
Failure by us, our employees or any of these third parties to adhere to our policies or applicable laws or regulations could result in penalties, sanctions, damage to our reputation and related costs which in turn could negatively affect our results of operations and cash flows.
| 23 |
Our attempts to expand our business into new markets may not be successful.
While our historical focus has been to serve guests from the North American expedition cruise market, we have expanded our focus to include other markets. Expansion into new markets requires significant levels of investment. There can be no assurance that any new markets will develop as anticipated or that we will have success in any new markets, and if we do not, we may be unable to recover our investment, which could adversely impact our business, financial condition and results of operations, including potentially impairing the value of our goodwill.
If our redeployment of vessels to a new market with new itineraries is not successful, our business and operating results may be adversely affected.
We cannot predict whether expeditions offered by any vessels redeployed will attract a number of guests comparable to previous expeditions. If redeployments and new expeditions do not attract as many guests as past expeditions or if there is a delay in finalizing or marketing the new itineraries, our business and operating results may be adversely affected.
Our operating costs, especially fuel expenditures, could increase due to market forces and economic or geopolitical factors beyond our control.
Expenditures for fuel represent a significant cost of operating our business. If fuel prices rise significantly in a short period of time, we may be unable to increase fares or other fees sufficiently to offset fully our increased fuel costs. In addition, volatility in fuel prices or disruptions in fuel supplies could have a material adverse effect on our results of operations, financial condition and liquidity.
Our other capital expenditure and operating costs, including food, hotel, payroll, maintenance and repair, airfare, taxes, insurance and security costs, are subject to increases due to market forces and economic or political conditions or other factors beyond our control. Increases in these capital expenditure and operating costs could adversely affect our profitability.
Price increases for commercial airline service for our guests or major changes or reductions in commercial airline service and/or availability could adversely impact the demand for cruises and undermine our ability to provide reasonably priced vacation packages to our guests.
Most of our guests depend on scheduled commercial airline services to transport them to or from the ports where our expeditions embark or disembark passengers. Increases in the price of airfare would increase the overall price of the expedition vacation to our guests, which may adversely impact demand for our expeditions. In addition, changes in the availability of commercial airline services could adversely affect our guests’ ability to obtain airfare, which could adversely affect our results of operations.
Our reliance on travel agencies to sell and market our cruises exposes us to certain risks that, if realized, could adversely impact our business.
Because we rely on travel agencies to generate bookings for our ships, we must ensure that our commission rates and incentive structures remain competitive. If we fail to offer competitive compensation packages, these agencies may be incentivized to sell vacation packages offered by our competitors to our detriment, which could adversely impact our operating results. In addition, the travel agent industry is sensitive to economic conditions that impact discretionary income. Significant disruptions or contractions in the industry could reduce the number of travel agencies available for us to market and sell our expeditions, which could have an adverse impact on our financial condition and results of operations.
| 24 |
Disruptions in our shoreside operations or our information systems may adversely affect our results of operations.
Our principal executive office is located in New York, New York, our principal shoreside operations are located in Seattle, Washington, and we have a sales office in Australia. Actual or threatened natural disasters (e.g., hurricanes, earthquakes, tornadoes, fires, floods), terrorist attacks, or other similar disruptive events in these locations may have a material impact on our business continuity, reputation and results of operations. In addition, substantial or repeated information systems failures, computer viruses or cyber-attacks impacting our shoreside or shipboard operations could adversely impact our business. We do not generally carry business interruption insurance for our shoreside operations or our information systems. As such, any losses or damages incurred by us could have an adverse impact on our results of operations.
Failure to develop the value of our brand and differentiate our products could adversely affect our results of operations.
Our success depends on the strength and continued development of our expedition brand and on the effectiveness of our brand strategies. Failure to protect and differentiate our brand from competitors throughout the vacation market could adversely affect our results of operations. We have a co-branding strategy with National Geographic, which is memorialized through an Alliance and License Agreement. Failure to maintain our relationship with National Geographic as a result of a breach of the Alliance and License Agreement, a termination event caused by a change of control in which Sven-Olof Lindblad or his designated successor ceases to hold a senior management role with the company, a failure to meet the conditions necessary to extend the relationship through 2025, or otherwise could adversely affect our results of operations.
We have an on-going relationship with National Geographic. Termination or alterations in this relationship may have an adverse effect on our business.
National Geographic is one of the largest non-profit scientific and educational institutions in the world. Its interests include geography, archaeology and natural science, the promotion of environmental and historical conservation, and the study of world culture and history. In furtherance of similar interests and goals, we have entered into a Tour Operator Agreement and an Alliance and License Agreement (collectively, the “Agreements”) with National Geographic.
Pursuant to the Agreements, our owned vessels contain the phrase “National Geographic” in their names, we have access to certain of National Geographic’s marks and images for advertising purposes and we and our guests have access to National Geographic photographers, naturalists and other experts. If the Agreements with National Geographic are terminated or the terms of the Agreements are modified in any material respect, our results of operations may be adversely affected.
The loss of key personnel, our inability to recruit or retain qualified personnel, or disruptions among our shipboard personnel due to strained employee relations could adversely affect our results of operations.
Our success depends, in large part, on the skills and contributions of key executives (including Sven-Olof Lindblad, in particular) and other employees, and on our ability to recruit and retain high quality personnel. We must continue to sufficiently recruit, retain, train and motivate our employees to maintain our current business and support our projected growth. A loss of key executives or other key employees or disruptions among our personnel could adversely affect our results of operations.
We rely on third-party providers of various services integral to the operation of our businesses. These third parties may act in ways that could harm our business.
In order to achieve cost and operational efficiencies, we outsource to third-party vendors certain services that are integral to the operations of our global businesses, such as our onboard concessionaires, certain of our call center operations and operation of a large part of our information technology systems. We are subject to the risk that certain decisions are subject to the control of third-party service providers and that these decisions may adversely affect our activities. A failure to adequately monitor a third-party service provider’s compliance with a service level agreement or regulatory or legal requirements could result in significant economic and reputational harm to us.
| 25 |
There is also a risk that the confidentiality, privacy and/or security of data held by third parties or communicated over third-party networks or platforms could become compromised. Such a breach could adversely affect our reputation and in turn adversely affect our business.
A failure to keep pace with developments in technology or technological obsolescence could impair our operations or competitive position.
Our business continues to demand the use of sophisticated technology and systems. These technologies and systems must be refined, updated, and/or replaced with more advanced systems in order to continue to meet our guests’ demands and expectations. If we are unable to do so in a timely manner or within reasonable cost parameters or if we are unable to appropriately and timely train our employees to operate any of these new systems, our business could suffer. We also may not achieve the benefits that we anticipate from any new technology or system, and a failure to do so could result in higher than anticipated costs or could impair our operating results.
We may be exposed to risks and costs associated with protecting the integrity and security of our guests’ and employees’ personal information.
We are subject to various risks associated with the collection, handling, storage and transmission of sensitive information, including risks related to compliance with applicable laws and other contractual obligations, as well as the risk that our systems collecting such information could be compromised. In the course of doing business, we collect large volumes of internal and guest data, including personally identifiable information for various business purposes. If we fail to maintain compliance with the various applicable data collection and privacy laws or with credit card industry standards or other applicable data security standards, we could be exposed to fines, penalties, restrictions, litigation or other expenses, and our business could be adversely impacted. In addition, even if we are fully compliant with legal standards and contractual requirements, we still may not be able to prevent security breaches involving sensitive data. Any breach, theft, loss, or fraudulent use of guest, employee or company data could cause consumers to lose confidence in the security of our information technology systems and choose not to purchase from us and expose us to risks of data loss, business disruption, litigation and other liability, any of which could adversely affect our business.
A change in our tax status under the United States Internal Revenue Code of 1986, as amended (the “Internal Revenue Code”), or other jurisdictions, may have adverse effects on our income.
At the present time, our subsidiaries that are foreign corporations do not derive any significant income from sources within the United States, and are not subject to significant United States federal income taxes. Any income earned by these subsidiaries from sources within the United States generally is subject to United States federal income tax (and United States branch profits tax) unless the requirements of the exemption under Section 883 of the Internal Revenue Code are met. Although we expect that any United States source income of our foreign subsidiaries will generally qualify for the benefits of the Section 883 exemption, there is no assurance that such benefits will be available.
If budgetary constraints adversely impact the jurisdictions in which we operate, such as Australia or Ecuador, increases in income tax regulations or tax reform affecting our operations may be imposed.
Litigation, enforcement actions, fines or penalties could adversely impact our financial condition or results of operations and/or damage our reputation.
Our business is subject to various United States and international laws and regulations that could lead to enforcement actions, fines, civil or criminal penalties or the assertion of litigation claims and damages. In addition, improper conduct by our employees, agents, partners, or expedition representatives could damage our reputation and/or lead to litigation or legal proceedings that could result in civil or criminal penalties, including substantial monetary fines. In certain circumstances it may not be economical to defend against such matters and/or a legal strategy may not ultimately result in us prevailing in a matter. Such events could lead to an adverse impact on our financial condition or results of operations.
| 26 |
Failure to comply with international safety regulations may subject us to increased liability that may adversely affect our insurance coverage resulting in a denial of access to, or detention in, certain ports which could adversely affect our business.
The operation of vessels is affected by the requirements of the International Maritime Organization’s International Safety Management Code for the Safe Operation of Ships and Pollution Prevention (“ISM Code”). The ISM Code requires ship owners and bareboat charterers to develop and maintain an extensive “Safety Management System” that includes the adoption of a safety and environmental protection policy setting forth instructions and procedures for safe operation and describing procedures for dealing with emergencies. Our failure to comply with the ISM Code may subject us to increased liability, invalidate existing insurance or decrease available insurance coverage for the affected vessels and result in a denial of access to or detention in certain ports, all of which could materially and adversely affect our results of operations and liquidity.
Compliance with environmental and other laws and regulations could adversely affect our business.
Extensive and changing environmental protection and other laws and regulations directly affect the operation of our vessels. These laws and regulations take the form of international conventions and agreements, including the International Maritime Organization conventions and regulations and the International Convention for the Safety of Life at Sea (“SOLAS”), which are applicable to all internationally trading vessels, and national, state and local laws and regulations, all of which are amended frequently. Under these laws and regulations, various governmental and quasi-governmental agencies and other regulatory authorities may require us to obtain permits, licenses and certificates in connection with our operations. Some countries in which we operate have laws that restrict the nationality of a vessel’s crew and prior and future ports of call, as well as other considerations relating to particular national interests. Changes in governmental regulations and safety or other equipment standards may require unbudgeted expenditures for alterations or the addition of new equipment for our vessels.
Restrictions on travel or access to certain protected or preserved areas could adversely affect our business.
We believe that our expedition itineraries are a major reason why guests choose our expedition cruises over competing cruises and vacation options. However, our ability to follow our planned itinerary for any particular expedition cruise may be affected by a number of factors, including security concerns, adverse weather conditions and natural disasters, local government regulations and restrictions, and other restrictions on access to protected or preserved areas.
For instance, the number of visitors admitted to the Galápagos National Park at any given time is limited by the number of cupos permits issued by the Galápagos National Parks Service. In June 2015, a new Ecuadorian Special Law for Protected Areas was approved and updated in November 2015. A Presidential Decree issued by President Correa of Ecuador in November 2015 established that cupos, which were in effect as of July 2015, will have a validity of nine years. Our operating rights are up for renewal in July 2024 and based on the new law, we will begin the renewal process in 2020. The current “owners” of the cupos will have the opportunity to re-apply for them, but any other enterprise or individual will have the opportunity to bid for the cupos. All bidders must present proof that they fulfill the conditions to properly utilize the license (access to a vessel, experience in tourism, proven environmental behavior, marketing, etc.). If the Galápagos National Parks Service were to further restrict access to the park, we might be required to alter certain of our travel itineraries, which would negatively impact our business and revenues.
Further, changes in other governmental and environmental rules and regulations in the Galápagos Islands and elsewhere could cause sudden losses in revenue and additional expenditures for alterations in our itineraries. In addition, restrictions on access by us and our guests to other protected or preserved areas, including national parks, may result in losses in revenues typically generated by our expeditions to such areas.
If we do not restrict the amount of ownership of our common stock by non-U.S. citizens, we could be prohibited from operating vessels in U.S. coastwise trade, which would adversely impact our business and operating results.
To the extent any of our United States flagged vessels are engaged in U.S. coastwise trade, we will be subject to the Jones Act, which governs, among other things, the ownership and operation of passenger vessels used to carry cargo and passengers between U.S. ports. Subject to limited exceptions, the Jones Act requires that vessels engaged in the U.S. coastwise trade be built in the United States, registered under the U.S. flag, manned by predominantly U.S. crews, and beneficially owned and operated by U.S. organized companies that are controlled and at least 75% owned by U.S. citizens within the meaning of the Jones Act. A failure to maintain compliance would adversely affect our financial position and our results of operations and we would be prohibited from operating vessels in the U.S. coastwise trade during any period in which we do not comply or cannot demonstrate to the satisfaction of the relevant governmental authorities our compliance with the Jones Act. In addition, a failure to maintain compliance could subject us to fines and our vessels could be subject to seizure and forfeiture for violations of the Jones Act and the related U.S. vessel documentation laws.
| 27 |
Restrictions on non-U.S. citizen ownership of certain U.S. flagged vessels could limit our ability to sell off a portion of our business or result in the forfeiture of certain of our vessels.
Compliance with the Jones Act requires that non-U.S. citizens within the meaning of the Jones Act beneficially own no more than 24.99% in the entities that directly or indirectly own the vessels that operate in the U.S. coastwise trade. If we were to seek to sell any portion of our business that owns any of these vessels, we would have fewer potential purchasers, because some potential purchasers might be unable or unwilling to satisfy the U.S. citizenship restrictions described above. As a result, the sales price for that portion of the business may not attain the amount that could be obtained in an unregulated market. Furthermore, if at any point we or any of the entities that directly or indirectly own our vessels cease to satisfy the requirements to be a U.S. citizen within the meaning of the Jones Act, we would become ineligible to operate in the U.S. coastwise trade and may become subject to penalties and risk forfeiture of our United States flagged vessels.
Compliance with the Sarbanes-Oxley Act of 2002 will require substantial financial and management resources.
Section 404 of the Sarbanes-Oxley Act of 2002 requires that we evaluate and report on our system of internal controls. If we fail to maintain the adequacy of our internal controls, we could be subject to regulatory scrutiny, civil or criminal penalties and/or stockholder litigation. Any inability to provide reliable financial reports could harm our business. Any failure to implement required new or improved controls, or difficulties encountered in the implementation of adequate controls over our financial processes and reporting in the future, could harm our operating results or cause us to fail to meet our reporting obligations. Inferior internal controls could also cause investors to lose confidence in our reported financial information, which could have a negative effect on the trading price of our securities.
| 28 |
Risks Related to an Investment in Our Securities
Our amended and restated certificate of incorporation limits the beneficial ownership of our common stock by individuals and entities that are not U.S. citizens within the meaning of the Jones Act. These restrictions may affect the liquidity of our common stock and may result in non-U.S. citizens being required to disgorge profits, sell their shares at a loss or relinquish their voting, dividend and distribution rights.
Under the Jones Act, and so long as we operate U.S. flagged vessels in coastwise trade, at least 75% of the outstanding shares of each class or series of our capital stock must be beneficially owned and controlled by U.S. citizens within the meaning of the Jones Act. Certain provisions of our amended and restated certificate of incorporation are intended to facilitate compliance with this requirement and may have an adverse effect on certain holders or proposed transferees of shares of our common stock.
Under the provisions of our amended and restated certificate of incorporation, any transfer, or attempted transfer, of any shares of capital stock will be void if the effect of such transfer, or attempted transfer, would be to cause one or more non-U.S. citizens in the aggregate to own (of record or beneficially) shares of any class or series of our capital stock in excess of 22% of the outstanding shares of such class or series. The liquidity or market value of the shares of common stock may be adversely impacted by such transfer restrictions.
In the event such restrictions voiding transfers would be ineffective for any reason, our amended and restated certificate of incorporation provides that if any transfer would otherwise result in the number of shares of any class or series of capital stock owned (of record or beneficially) by non-U.S. citizens being in excess of 22% of the outstanding shares of such class or series, such transfer will cause such excess shares to be automatically transferred to a trust for the exclusive benefit of one or more charitable beneficiaries that are U.S. citizens. The proposed transferee will have no rights in the shares transferred to the trust, and the trustee, who is a U.S. citizen chosen by us and unaffiliated with us or the proposed transferee, will have all voting, dividend and distribution rights associated with the shares held in the trust. The trustee will sell such excess shares to a U.S. citizen within 20 days of receiving notice from us and distribute to the proposed transferee the lesser of the price that the proposed transferee paid for such shares and the amount received from the sale, and any gain from the sale will be paid to the charitable beneficiary of the trust.
These trust transfer provisions also apply to situations where ownership of a class or series of capital stock by non-U.S. citizens in excess of 22% would be exceeded by a change in the status of a record or beneficial owner thereof from a U.S. citizen to a non-U.S. citizen, in which case such person will receive the lesser of the market price of the shares on the date of such status change and the amount received from the sale. In addition, under our amended and restated certificate of incorporation, if the sale or other disposition of shares of common stock would result in non-U.S. citizens owning (of record or beneficially) in excess of 22% of the outstanding shares of common stock, the excess shares shall be automatically transferred to a trust for disposal by a trustee in accordance with the trust transfer provisions described above. As part of the foregoing trust transfer provisions, the trustee will be deemed to have offered the excess shares in the trust to us at a price per share equal to the lesser of (i) the market price on the date we accept the offer and (ii) the price per share in the purported transfer or original issuance of shares, as described in the preceding paragraph, or the market price per share on the date of the status change, that resulted in the transfer to the trust.
As a result of the above trust transfer provisions, a proposed transferee that is a non-U.S. citizen or a record or beneficial owner whose citizenship status change results in excess shares may not receive any return on its investment in shares it purportedly purchases or owns, as the case may be, and it may sustain a loss.
To the extent that the above trust transfer provisions would be ineffective for any reason, our amended and restated certificate of incorporation provides that, if the percentage of the shares of any class or series of capital stock owned (of record or beneficially) by non-U.S. citizens is known to us to be in excess of 22% for such class or series, we, in our sole discretion, shall be entitled to redeem all or any portion of such shares most recently acquired (as determined by us in accordance with guidelines that are set forth in our amended and restated certificate of incorporation), by non-U.S. citizens, or owned (of record or beneficially) by non-U.S. citizens as a result of a change in citizenship status, in excess of such permitted percentage for such class or series at a redemption price based on a fair market value formula that is set forth in our amended and restated certificate of incorporation. Such excess shares shall not be accorded any voting, dividend or distribution rights until they have ceased to be excess shares, provided that they have not been already redeemed by us. As a result of these provisions, a stockholder who is a non-U.S. citizen may be required to sell its shares of common stock at an undesirable time or price and may not receive any return on its investment in such shares. Further, we may have to incur additional indebtedness, or use available cash (if any), to fund all or a portion of such redemption, in which case our financial condition may be materially weakened.
| 29 |
In order to assist our compliance with the Jones Act, our amended and restated certificate of incorporation permits us to require that any record or beneficial owner of any shares of our capital stock provide us with certain documentation concerning such owner’s citizenship. These provisions include a requirement that every person acquiring, directly or indirectly, five percent (5%) or more of the shares of any class or series of our capital stock must provide us with specified citizenship documentation. In the event that any person does not submit such requested or required documentation to us, our amended and restated certificate of incorporation provides us with certain remedies, including the suspension of the voting rights of the person’s shares owned by persons unable or unwilling to submit such documentation and the payment of dividends and distributions with respect to those shares into a segregated account. As a result of non-compliance with these provisions, a record or beneficial owner of the shares of our common stock may lose significant rights associated with those shares.
In addition to the risks described above, the foregoing ownership restrictions on non-U.S. citizens could delay, defer or prevent a transaction or change in control that might involve a premium price for common stock or otherwise be in the best interest of our stockholders.
If non-U.S. citizens own more than 22% of our common stock, we may not have the funds or the ability to redeem any excess shares and the charitable trust mechanism described above may be deemed invalid or unenforceable, all with the result that we could be forced to either suspend our operations in the U.S. coastwise trade or be subject to substantial penalties.
Our amended and restated certificate of incorporation contains provisions voiding transfers of shares of any class or series of our capital stock that would result in non-U.S. citizens within the meaning of the Jones Act, in the aggregate, owning in excess of 22% of the shares of such class or series. In the event that this transfer restriction would be ineffective, our amended and restated certificate of incorporation provides for the automatic transfer of such excess shares to a trust specified therein. These trust provisions also apply to excess shares that would result from a change in the status of a record or beneficial owner of shares of our capital stock from a U.S. citizen to a non-U.S. citizen. In the event that these trust transfer provisions would also be ineffective, our amended and restated certificate of incorporation permits us to redeem such excess shares. The per-share redemption price may be paid, as determined by our Board of Directors, by cash or redemption notes or the shares may be redeemed for warrants. However, we may not be able to redeem such excess shares for cash because our operations may not have generated sufficient excess cash flow to fund such redemption. Further, the methodology for transfer to and sale by a charitable trust could be deemed invalid or unenforceable in one or more jurisdictions. If, for any reason, we are unable to effect a redemption or charitable sale when beneficial ownership of shares by non-U.S. citizens is in excess of 24.99% of the common stock, or otherwise prevent non-U.S. citizens in the aggregate from beneficially owning shares in excess of 24.99% of any class or series of capital stock, or fail to exercise our redemption or forced sale rights because we are unaware that ownership exceeds such percentage, we will likely be unable to comply with the Jones Act and will likely be required by the applicable governmental authorities to suspend our operations in the U.S. coastwise trade. Any such actions by governmental authorities would have a severely detrimental impact on our financial position, results of operations and cash flows and any failure to suspend operations in violation of the Jones Act could cause us to be subject to material financial and operational penalties.
If we do not maintain a current and effective prospectus relating to the shares of common stock issuable upon exercise of the warrants, warrant holders will only be able to exercise such warrants on a “cashless basis.”
If we do not maintain a current and effective prospectus relating to the shares of common stock issuable upon exercise of the public warrants at the time that holders wish to exercise such warrants, they will only be able to exercise them on a “cashless basis” pursuant to the exemption provided by Section 3(a)(9) of the Securities Act of 1933, as amended. As a result, the number of shares of common stock that holders will receive upon exercise of the public warrants will be fewer than it would have been had such holder exercised his warrant for cash. Further, if an exemption from registration is not available, holders would not be able to exercise on a cashless basis and would only be able to exercise their warrants for cash if a current and effective prospectus relating to the common stock issuable upon exercise of the warrants is available. Under the terms of the warrant agreement, we have agreed to use our best efforts to meet these conditions and to maintain a current and effective prospectus relating to the shares of common stock issuable upon exercise of the warrants until the expiration of the warrants. However, we cannot assure you that we will be able to do so. If we are unable to do so, the potential “upside” of the holder’s investment in our company may be reduced or the warrants may expire worthless.
An investor will only be able to exercise a warrant if the issuance of shares of common stock upon such exercise has been registered or qualified or is deemed exempt under the securities laws of the state of residence of the holder of the warrants.
No warrants will be exercisable for cash and we will not be obligated to issue shares of common stock unless the shares of common stock issuable upon such exercise has been registered or qualified or deemed to be exempt under the securities laws of the state of residence of the holder of the warrants. If the shares of common stock issuable upon exercise of the warrants are not qualified or exempt from qualification in the jurisdictions in which the holders of the warrants reside, the warrants may be deprived of any value, the market for the warrants may be limited and they may expire worthless if they cannot be sold.
We may amend the terms of the warrants in a way that may be adverse to holders with the approval by the holders of a majority of the then outstanding warrants.
Our warrants are issued in registered form under a warrant agreement between Continental Stock Transfer & Trust Company, as warrant agent, and us. The warrant agreement provides that the terms of the warrants may be amended without the consent of any holder to cure any ambiguity or correct any defective provision. The warrant agreement requires the approval by the holders of a majority of the then outstanding warrants (including the sponsor’s warrants) in order to make any change that adversely affects the interests of the registered holders. Accordingly, we may amend the terms of the warrants in a manner adverse to a holder if the holders of a majority of the warrants approve of such amendment.
| 30 |
We are an “emerging growth company” and we cannot be certain if the reduced disclosure requirements applicable to emerging growth companies will make our shares of common stock less attractive to investors.
We are an “emerging growth company,” as defined in the Jumpstart our Business Startups Act of 2012 (“JOBS Act”). We will remain an “emerging growth company” for up to five years. However, if our non-convertible debt issued within a three year period or revenues exceeds $1 billion, or the market value of our shares of common stock that are held by non-affiliates exceeds $700 million on the last day of the second fiscal quarter of any given fiscal year, we would cease to be an emerging growth company as of the following fiscal year. As an emerging growth company, we are not required to comply with the auditor attestation requirements of section 404 of the Sarbanes-Oxley Act, we have reduced disclosure obligations regarding executive compensation in our periodic reports and proxy statements and we are exempt from the requirements of holding a nonbinding advisory vote on executive compensation and stockholder approval of any golden parachute payments not previously approved. Additionally, as an emerging growth company, we have elected to delay the adoption of new or revised accounting standards that have different effective dates for public and private companies until those standards apply to private companies. As such, our financial statements may not be comparable to companies that comply with public company effective dates. We cannot predict if investors will find our shares of common stock less attractive because we may rely on these provisions. If some investors find our shares of common stock less attractive as a result, there may be a less active trading market for our shares and our share price may be more volatile.
Our outstanding warrants may have an adverse effect on the market price of shares of common stock.
As of March 7, 2016, we had issued and outstanding warrants to purchase 12,040,937 shares of common stock. The sale, or even the possibility of sale, of the shares underlying the warrants could have an adverse effect on the market price for our securities or on our ability to obtain future financing. If and to the extent these warrants are exercised, you may experience dilution to your holdings.
We may redeem the warrants at a time that is not beneficial to public investors.
We may call the public warrants for redemption at any time after the redemption criteria described in the prospectus for our initial public offering have been satisfied. If we call the public warrants for redemption, public stockholders may be forced to accept a nominal redemption price or sell or exercise the warrants when they may not wish to do so.
Our management’s ability to require holders of our warrants to exercise such warrants on a cashless basis will cause holders to receive fewer shares of common stock upon their exercise of the warrants than they would have received had they been able to exercise their warrants for cash.
If we call our public warrants for redemption after the redemption criteria described in the prospectus for our initial public offering have been satisfied, our management will have the option to require any holder that wishes to exercise its warrant (including any warrants held by our initial stockholders or their permitted transferees) to do so on a “cashless basis.” If our management chooses to require holders to exercise their warrants on a cashless basis, the number of shares of common stock received by a holder upon exercise will be fewer than it would have been had such holder exercised his warrant for cash. This will have the effect of reducing the potential “upside” of the holder’s investment in our company.
We do not intend to pay any dividends to stockholders in the foreseeable future.
We have not paid any cash dividends on our shares of common stock to date and do not intend to pay cash dividends in the foreseeable future. The payment of cash dividends in the future will be dependent upon our revenues and earnings, if any, capital requirements and general financial conditions. The payment of any dividends is within the discretion of our Board of Directors. It is the present intention of our Board of Directors to retain all earnings, if any, for use in our business operations and, accordingly, our Board of Directors does not anticipate declaring any dividends in the foreseeable future. As a result, any gain you will realize on our securities will result solely from the appreciation of such securities.
| 31 |
| Item 1B. | Unresolved Staff Comments |
None.
| Item 2. | Properties |
Our principal executive office is located at 96 Morton Street, New York, New York. We lease our New York office, consisting of approximately 13,000 square feet. Our principal shoreside operations are located at 1415 Western Avenue, Seattle, Washington, consisting of approximately 7,200 square feet. We also lease a media studio in Burlington, Vermont and a sales office in Sydney, Australia. A description of our vessels is set forth in Item 1 under the subheading “Expedition Ships and Voyages.”
| Item 3. | Legal Proceedings |
We are involved in various claims, legal actions and regulatory proceedings arising from time to time in the ordinary course of business. The only pending litigation involved a former employee alleging damages for injuries allegedly sustained on one of Lindblad’s vessels. The employee filed suit in the United States District Court, Central District of California on April 7, 2014. The case was transferred to the United States District Court, Western District of Washington, on jurisdictional grounds. The case has now settled, pending settlement funding. That funding will be provided by our protection and indemnity insurance. The litigation has had no material impact on our results of operations.
| Item 4. | Mine Safety Disclosures |
None.
| 32 |
| Item 5. | Market for Registrant’s Common Equity, Related Stockholder Matters and Issuer Purchases of Equity Securities |
Market Information
Our common stock and warrants are traded on The NASDAQ Capital Market under the symbols “LIND” and “LINDW,” respectively. The following table sets forth the high and low sales prices for our common stock and warrants for the periods indicated.
| Units* | Common Stock | Warrants | ||||||||||||||||||||||
| Period | High | Low | High | Low | High | Low | ||||||||||||||||||
| Fiscal 2015: | ||||||||||||||||||||||||
| Fourth Quarter | N/A | N/A | $ | 11.33 | $ | 10.18 | $ | 3.20 | $ | 1.60 | ||||||||||||||
| Third Quarter | N/A | N/A | $ | 11.03 | $ | 8.70 | $ | 2.48 | $ | 0.80 | ||||||||||||||
| Second Quarter | $ | 13.80 | $ | 10.52 | $ | 12.00 | $ | 10.20 | $ | 2.71 | $ | 1.05 | ||||||||||||
| First Quarter | $ | 10.50 | $ | 9.85 | $ | 10.20 | $ | 8.91 | $ | 1.10 | $ | 0.26 | ||||||||||||
| Fiscal 2014: | ||||||||||||||||||||||||
| Fourth Quarter | $ | 10.37 | $ | 9.90 | $ | 9.88 | $ | 7.86 | $ | 0.54 | $ | 0.32 | ||||||||||||
| Third Quarter | $ | 10.60 | $ | 9.97 | $ | 10.05 | $ | 8.90 | $ | 0.55 | $ | 0.28 | ||||||||||||
| Second Quarter | $ | 12.21 | $ | 9.90 | $ | 10.53 | $ | 9.66 | $ | 0.69 | $ | 0.49 | ||||||||||||
| First Quarter | $ | 10.95 | $ | 10.05 | $ | 9.89 | $ | 9.62 | $ | 0.65 | $ | 0.49 | ||||||||||||
* Our units were separated into one share of common stock and 0.5 warrants in connection with the mergers with Lindblad.
| 33 |
Holders
As of March 7, 2016, there were ten record holders of our common stock, eight record holders of our warrants and four record holders of our restricted shares. Since certain of our shares are held by brokers and other institutions on behalf of shareholders, the foregoing number is not representative of the number of beneficial owners.
Dividends
We have not paid any cash dividends on our common stock to date. We intend to retain all earnings, if any, for use in our business operations and, accordingly, our Board does not anticipate declaring any dividends in the foreseeable future. Any determination to pay dividends in the future will be at the discretion of our Board and will depend upon our results of operations, financial condition, restrictions imposed by applicable law and our financing agreements and other factors that our Board deems relevant.
Securities Authorized for Issuance Under Equity Compensation Plans
| Number of securities to be issued upon exercise of outstanding options, warrants and rights (a) | Weighted average exercise price of outstanding options, warrants and rights | Number of securities remaining available for future issuance under equity compensation plans (excluding securities reflected in column (a)) | ||||||||||
| Plan category | ||||||||||||
| Equity compensation plans approved by security holders | 2,264,148 | $ | 3.03 | 2,146,700 | ||||||||
| Equity compensation plans not approved by security holders | ‒ | ‒ | ‒ | |||||||||
| Total (1) | 2,264,148 | (2) | N/A | 2,146,700 | (3) | |||||||
| (1) | Information is as of March 7, 2016. |
| (2) | Includes an aggregate of 33,300 unvested shares of restricted stock and restricted stock units. |
| (3) | Consists of shares available for issuance under our 2015 Long-Term Incentive Plan. |
Recent Sales by the Company of Unregistered Securities
There were no unregistered sales of equity securities during the quarter ended December 31, 2015.
Repurchases of Securities
On November 9, 2015, we announced that our Board of Directors had approved a $20.0 million stock and warrant repurchase plan (“Repurchase Plan”). This Repurchase Plan authorizes us to purchase from time to time our outstanding common stock and warrants through open market repurchases in compliance with Rule 10b-18 of the Securities Exchange Act of 1934, as amended, and/or in privately negotiated transactions discretion based on market and business conditions, applicable legal requirements and other factors. Any shares and warrants purchased will be retired. The Repurchase Plan has no time deadline and will continue until otherwise modified or terminated at the sole discretion of our Board of Directors at any time.
| 34 |
The following table represents information with respect to purchases by us of our warrants during the months presented. We did not repurchase any shares of our common stock during the quarter ended December 31, 2015.
| Period | Total number of warrants purchased | Average price paid per warrant | Total number of warrants purchased as part of publicly announced plans or programs | Maximum number or approximate dollar value of warrants that may yet be purchased under the plans or programs | ||||||||||||
| October 1-31, 2015 | - | $ | - | - | $ | - | ||||||||||
| November 1-30, 2015 | 935,000 | 2.50 | 935,000 | 17,667,063 | ||||||||||||
| December 1-31, 2015 | 1,156,618 | 2.69 | 1,156,618 | 14,556,003 | ||||||||||||
| Total | 2,091,618 | $ | 2.62 | 2,091,618 | ||||||||||||
Stock Performance Graph
The following stock performance graph compares the performance of our common stock from July 3, 2013 (the date our warrants and common stock commenced separate trading) to December 31, 2015 with the performance of the Standard and Poor's Corporation Composite 500 Index and the Standard and Poor's Leisure Time Select Industry Index (Net TR). The graph assumes an initial investment of $100 on July 3, 2013 and reinvestment of dividends. The stock performance graph should not be deemed filed or incorporated by reference into any other filing made by us under the Securities Act of 1933 or the Securities Exchange Act of 1934, except to the extent that we specifically incorporate the stock performance graph by reference in another filing.
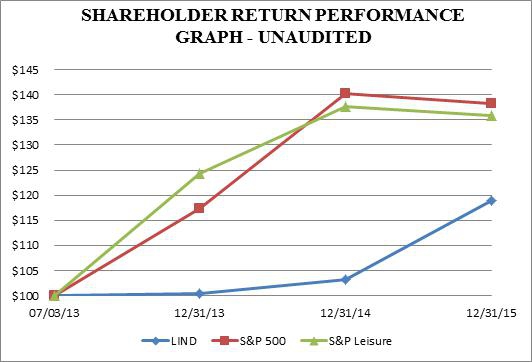
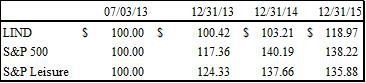
| 35 |
| Item 6. | Selected Financial Data |
The following selected financial data should be read in conjunction with Management’s Discussion and Analysis of Financial Condition and Results of Operations, the Consolidated Financial Statements and the Notes to Consolidated Financial Statements in this Form 10-K.
| For the Years Ended December 31, | ||||||||||||||||||||
| (In thousands, except per share and occupancy data) | 2015 | 2014 | 2013 | 2012 | 2011 | |||||||||||||||
| (unaudited) | ||||||||||||||||||||
| Income Statement Data: | ||||||||||||||||||||
| Tour revenues | $ | 209,985 | $ | 198,459 | $ | 192,237 | $ | 153,981 | $ | 133,427 | ||||||||||
| Operating income | $ | 15,502 | $ | 30,420 | $ | 23,522 | $ | 16,036 | $ | 19,697 | ||||||||||
| Net income | $ | 19,742 | $ | 22,245 | $ | 14,844 | $ | 5,170 | $ | 7,153 | ||||||||||
| Per Share Data: | ||||||||||||||||||||
| Earnings per share | ||||||||||||||||||||
| Basic | $ | 0.44 | $ | 0.44 | $ | 0.29 | $ | 0.10 | $ | 0.14 | ||||||||||
| Diluted | $ | 0.43 | $ | 0.44 | $ | 0.29 | $ | 0.10 | $ | 0.14 | ||||||||||
| Weighted average shares outstanding, basic | 44,917,829 | 50,878,894 | 51,106,436 | 51,106,436 | 51,106,436 | |||||||||||||||
| Weighted average shares outstanding, diluted | 45,575,387 | 50,878,894 | 51,106,436 | 51,106,436 | 51,106,436 | |||||||||||||||
| Balance Sheet Data: | ||||||||||||||||||||
| Total assets | $ | 381,613 | $ | 245,925 | $ | 207,028 | $ | 210,366 | $ | 144,039 | ||||||||||
| Total liabilities | $ | 267,692 | $ | 178,358 | $ | 151,455 | $ | 157,202 | $ | 124,852 | ||||||||||
| Total shareholders' equity | $ | 113,921 | $ | 67,567 | $ | 55,573 | $ | 53,007 | $ | 19,187 | ||||||||||
| Other Data: | ||||||||||||||||||||
| Occupancy | 91.8 | % | 92.9 | % | 92.4 | % | 92.1 | % | 87.0 | % | ||||||||||
| 36 |
| Item 7. | Management’s Discussion and Analysis of Financial Condition and Results of Operations |
The information contained in this section should be read in conjunction with our consolidated financial statements and related notes and the information contained elsewhere in this Form 10-K under the heading “Risk Factors,” “Selected Financial Data,” and “Business.”
Overview
We currently operate a fleet of six expedition ships owned by our subsidiaries and four seasonal charter vessels and have two new vessels on order for delivery in 2017 and 2018. Our mission is offering life-changing adventures on all seven continents, and pioneering innovative ways to allow our guests to connect with exotic and remote places. Our expedition ships are customized, nimble and intimately-scaled vessels that are able to venture where larger cruise ships cannot, thus allowing us to offer up-close experiences in the planet’s wild and remote places and capitals of culture. Many of these expeditions involve travel to remote places with limited infrastructure and ports (such as Antarctica and the Artic) or places that are best accessed by a ship (such as the Galápagos, Alaska, Baja’s Sea of Cortez, Costa Rica, and Panama), and foster active engagement by guests. Each expedition ship is designed to be comfortable and inviting, while being fully equipped with state-of-the-art tools for in-depth exploration. We also have an alliance with the National Geographic Society (“National Geographic”), who often provides lecturers and National Geographic experts, including photographers, writers, marine biologists, naturalists, field researchers, and film crews.
The key components of our business strategy are to deliver exceptional guest experiences, maximize occupancy levels, continually optimize pricing methodologies, effectively manage itinerary offerings to meet guest demand, maximize and grow net yields, elevate brand awareness and loyalty, and expand and operate the business in a safe, prudent and disciplined manner.
A perspective on how we maximize occupancy and optimize pricing is illustrated in the redeployment of the National Geographic Orion, which came under our management in 2013. We added departures from the Antarctic Peninsula and extensive travel across the Pacific Ocean as well as began marketing the vessel’s offerings in the U.S., a core marketing region where we command strong pricing. In 2016, we further repositioned the National Geographic Orion by redeploying the ship from serving the Western Australian geographies to voyages in Europe for the northern hemisphere summer. We deploy chartered vessels for various seasonal offerings and continually seek to optimize our charter fleet to balance our inventory with demand and maximized yields. We use our charter inventory as a mechanism to both increase travel options of our existing and prospective guests and also to test demand for certain areas and seasons to understand the potential for longer term deployments and additional vessel needs.
We continually evaluate a range of strategies for expansion of guest capacity. We consider closely the expected return on invested capital and the range of possibilities, such as a newbuild program, adding selected charters and the acquisition of existing ships or small operators. In December 2015, we executed definitive agreements for the construction of two new coastal vessels for delivery targeted in the second quarter of 2017 and the second quarter of 2018 at a purchase price of $48.0 million and $46.8 million, respectively. These 236-foot vessels are expected to have capacity of approximately 100 guests each and management considers this investment to be an important step to meet increasing demand for our offerings. The newbuild process will expose us to certain risks typically associated with new ship construction, which we are prepared to manage through detailed planning and close monitoring by our internal marine team. The purchase of the ships will be funded through a combination of cash available on our balance sheet and excess cash flows generated by our existing operations. Also in December 2015, we signed a definitive agreement for the purchase of the Via Australis to be used in our operations in the Galápagos Islands. We expect to take possession of the ship in the second quarter of 2016 and following a significant renovation expect to deploy the ship during the fourth quarter of 2016. The Via Australis will replace the National Geographic Endeavour. The purchase price for the ship is $18.0 million and we plan to spend up to $10.0 million to refurbish and outfit the ship immediately after closing.
| 37 |
We maintain our fleet in accordance with applicable regulations, international conventions and insurance requirements. This includes regularly scheduled maintenance, periodic inspections, drydocking, and overhaul. In addition, renovations and replacements of various vessel elements are part of the ongoing process of maintaining the vessels to a high standard. Following the acquisition of the National Geographic Orion, the vessel underwent an extensive drydock process during which we added our own specific modifications in order for the ship to meet its operational requirements. On a year-to-year basis, increases in maintenance expense for the current owned fleet are anticipated to grow in line with inflation.
Due to the specific geographies in which we operate and the cost of providing access to fuel in our remote destinations, we have historically not experienced significant fluctuations in fuel costs with changes in world fuel commodity prices. However, the continued downward pressure is now becoming evident on fuel prices in all areas of the world in which we operate. Fuel costs represented 4.3%, 5.9% and 6.4% of tour revenues for the years ended December 31, 2015, 2014 and 2013, respectively. We have not hedged our fuel purchases historically, but we are evaluating a hedging strategy to manage cash flows related to variable interest and fuel prices.
Similar to others in the industry, we have historically operated with a meaningful working capital deficit. This deficit is mainly attributable to the fact that, under our business model, a vast majority of guest ticket receipts are collected in advance of the applicable sailing date. These advance passenger receipts remain a current liability until the sailing date and the cash generated from them is used interchangeably with cash on hand from other cash from operations. However, as a result of the Amended Credit Agreement and the merger proceeds, we had net working capital of $130.0 million as of December 31, 2015 as compared to a working capital deficit of $59.7 million as of December 31, 2014.
The discussion and analysis of our financial condition and results of operations is organized as follows:
| ● | a review of our critical accounting policies and of our financial presentation, including the descriptions of certain line items and key operational and financial metrics; | |
| ● | a results and comparable discussion of our results of operations for the years ended December 31, 2015 and 2014 and for the years ended December 31, 2014 and 2013; and | |
| ● | a discussion of liquidity and capital resources, including future potential funding sources. |
Critical Accounting Policies and Estimates
Our consolidated financial statements are prepared in accordance with accounting principles generally accepted in the United States of America (“U.S. GAAP”), which require us to make estimates and assumptions that affect the reported amounts of assets and liabilities as of the date of the financial statements, the reported amounts of revenues and expenses during the reporting periods and the related disclosures in the consolidated financial statements and accompanying footnotes. Out of our significant accounting policies, which are described in Note 2 – Summary of Significant Accounting Policies of our consolidated financial statements included elsewhere in this Form 10-K, certain accounting policies are deemed “critical,” as they require management’s highest degree of judgment, estimates and assumptions. While management believes its judgments, estimates and assumptions are reasonable, they are based on information presently available and actual results may differ significantly from those estimates under different assumptions and conditions.
Stock-Based Compensation
We estimate the fair value of share-based payment awards on the date of the grant using an option-pricing model and restricted share values and recognize the expense over the required service periods.
For recording our stock-based compensation expense for service-based options, we have chosen to use:
| ● | the straight line method of allocating compensation cost for service-based options; |
| ● | the Black-Scholes option pricing formula for time-based options; |
| ● | the simplified method to calculate the expected term for options as discussed under the SEC’s guidance for share-based payments for service-based options; |
| ● | an estimate of expected volatility based on the historical volatility of our share price; and |
| ● | an estimate for expected forfeitures. |
| 38 |
The three factors which most affect stock-based compensation are the fair value of the common stock underlying the stock options, the vesting term of the options and the volatility of such fair value of the underlying common stock. If our estimates are too high or too low, we may overstate or understate our stock-based compensation expense.
Income Taxes
To measure deferred tax assets and liabilities, we provide a valuation allowance against deferred tax assets if, based upon the weight of available evidence, we do not believe it is “more-likely-than-not” that some or all of the deferred tax assets will be realized. We will continue to evaluate the deferred tax asset valuation allowance balances in all of our foreign and U.S. companies to determine the appropriate level of valuation allowances. While we believe that the amount of the recorded financial statement benefits and tax reserves reflect the more-likely-than-not criteria, it is possible that the ultimate outcome of current or future examinations may result in a reduction to the tax benefits previously recorded on our consolidated financial statements or may exceed the current income tax reserves in amounts that could be material.
Valuation of Long-Lived Assets
We review our long-lived assets, principally our vessels and operating rights, for impairment whenever events or changes in circumstances indicate that the carrying amounts of these assets may not be fully recoverable. Upon the occurrence of a triggering event, the assessment of possible impairment is based on our ability to recover the carrying value of our asset, which is determined by using the asset’s estimated undiscounted future cash flows. If these estimated undiscounted future cash flows are less than the carrying value of the asset, an impairment charge is recognized for the excess, if any, of the asset’s carrying value over its estimated fair value. A significant amount of judgment is required in estimating the future cash flows and fair values of our vessels and operating rights.
As of December 31, 2015 and 2014, there was no triggering event and we did not record an impairment of our long-lived assets. We reviewed the remaining useful life of the National Geographic Endeavour, which is expected to be replaced by the Via Australis in the fourth quarter of 2016. The evaluation of the National Geographic Endeavour’s useful life as of December 31, 2015 indicated a shorter remaining useful life of less than one year versus the previous estimated remaining useful life of seven years (see Note 5 – Property and Equipment). We do not expect any residual value for the National Geographic Endeavour after the end of the fourth quarter of 2016. We also evaluated a new law in Ecuador and its effect on our operating rights in the Galápagos Islands. As a result of the new law, the life of the cupos changed from indefinite lives to nine years and amortization of operating rights began in August 2015 (see Note 4 – Operating Rights).
Financial Presentation
Description of Certain Line Items
Tour revenues
Tour revenues consist of the following:
| ● | Guest ticket revenues recognized from the sale of guest tickets; and | |
| ● | Other revenues from the sale of pre- or post-expedition excursions, hotel accommodations, and land-based expeditions; air transportation to and from the ships, goods and services rendered onboard that are not included in guest ticket prices, trip insurance, and cancellation fees. |
Cost of tours
Cost of tours includes the following:
| ● | Direct costs associated with revenues, including cost of pre- or post-expedition excursions, hotel accommodations, and land-based expeditions, air and other transportation expenses, and cost of goods and services rendered onboard; |
| 39 |
| ● | Payroll costs and related expenses for shipboard personnel; | |
| ● | Food costs for guests and crew, including complimentary food and beverage amenities for guests; | |
| ● | Fuel costs and related costs of delivery, storage and safe disposal of waste; and | |
| ● | Other expenses, such as land costs, port costs, repairs and maintenance, equipment expense, drydock, ship insurance, and charter hire costs. |
Selling and marketing
Selling and marketing expenses include commissions and a broad range of advertising and promotional expenses.
General and administrative
General and administrative expenses include the cost of shoreside vessel support, reservations and other administrative functions, including salaries and related benefits, credit card commissions, professional fees and rent.
Key Operational and Financial Metrics
We use a variety of operational and financial metrics, which are defined below, to evaluate our performance and financial condition. We use certain non-GAAP financial measures, such as EBITDA, Adjusted EBITDA, Net Yields, and Net Cruise Costs, to enable us to analyze our performance and financial condition. We utilize these financial measures to manage our business on a day-to-day basis and believe that they are the most relevant measures of performance. Some of these measures are commonly used in the cruise industry to measure performance. We believe these non-GAAP measures provide expanded insight to measure revenue and cost performance, in addition to the standard GAAP-based financial measures. There are no specific rules or regulations for determining non-GAAP measures, and as such, they may not be comparable to measures used by other companies within the industry. The presentation of non-GAAP financial information should not be considered in isolation or as a substitute for, or superior to, the financial information prepared and presented in accordance with GAAP. You should read this discussion and analysis of our financial condition and results of operations together with the consolidated financial statements and the related notes thereto also included within.
EBITDA is net income (loss) excluding depreciation and amortization, net interest expense and income tax benefit (expense).
Adjusted EBITDA is net income (loss) excluding depreciation and amortization, net interest expense, other income (expense), income tax benefit (expense), and other supplemental adjustments. Other supplemental adjustments include certain non-operating items such as stock-based compensation, the National Geographic fee amortization, merger-related expenses, acquisition-related expenses and retention expenses. We believe Adjusted EBITDA, when considered along with other performance measures, is a useful measure as it reflects certain operating drivers of the business, such as sales growth, operating costs, selling and administrative expense, and other operating income and expense. We believe Adjusted EBITDA can provide a more complete understanding of the underlying operating results and trends and an enhanced overall understanding of our financial performance and prospects for the future. While Adjusted EBITDA is not a recognized measure under GAAP, management uses this financial measure to evaluate and forecast business performance. Adjusted EBITDA is not intended to be a measure of liquidity or cash flows from operations or a measure comparable to net income as it does not take into account certain requirements, such as unearned passenger revenue, capital expenditures and related depreciation, principal and interest payments, and tax payments. Our use of Adjusted EBITDA may not be comparable to other companies within the industry. Management compensates for these limitations by using Adjusted EBITDA as only one of several measures for evaluating our business performance. In addition, capital expenditures, which impact depreciation and amortization, interest expense, and income tax benefit (expense), are reviewed separately by management.
Available Guest Nights is a measurement of capacity and represents double occupancy per cabin (except single occupancy for a single capacity cabin) multiplied by the number of cruise days for the period. We also record the number of guest nights available on our limited land programs in this definition. We use this measure to perform capacity and rate analysis to identify the main non-capacity drivers that cause revenue and expense to vary.
| 40 |
Gross Cruise Cost represents the sum of cost of tours plus merger-related expenses, selling and marketing expense and general and administrative expense.
Gross Yield represents tour revenues divided by Available Guest Nights.
Guest Nights Sold represents the number of guests carried for the period multiplied by the number of nights sailed within the period.
Maximum Guests is a measure of capacity and represents the maximum number of guests in a period and is based on double occupancy per cabin (except single occupancy for a single capacity cabin).
Net Cruise Cost represents Gross Cruise Cost excluding commissions and certain other direct costs of guest ticket revenues and other revenues.
Net Cruise Cost excluding Fuel represents Net Cruise Cost excluding fuel costs.
Net Revenue represents tour revenues less commissions and direct costs of other revenues.
Net Yield represents Net Revenue divided by Available Guest Nights.
Number of Guests represents the number of guests that travel with us in a period.
Occupancy is calculated by dividing Guest Nights Sold by Available Guest Nights.
Voyages represent the number of ship expeditions completed during the period.
Foreign Currency Translation
The U.S. dollar is the functional currency in our foreign operations and remeasurement adjustments and gains or losses resulting from foreign currency transactions are recorded as foreign exchange gains or losses in the consolidated statements of income.
We became subject to foreign currency translation in connection with our acquisition of Fillmore Pearl Holdings Ltd., which operates partially in Australia and whose functional currency is the U.S. dollar.
Results of Operations
Results and demand for our business continued to improve in 2015.
In the year ended December 31, 2015, we generated revenues of $210.0 million compared to revenues of $198.5 million for the year ended December 31, 2014, which represents an increase of $11.5 million, or 5.8%. Net income was $19.7 million and $22.2 million for the years ended December 31, 2015 and 2014, respectively. For the year ended December 31, 2015, we generated Adjusted EBITDA (as defined below) of $46.8 million compared to $44.6 million for the year ended December 31, 2014.
| 41 |
We reported tour revenues, cost of tours, operating expenses, operating income and net income for the years ended December 31, 2015, 2014 and 2013 as shown in the following table:
| For the Years Ended December 31, | ||||||||||||
| (In thousands, except per share data) | 2015 | 2014 | 2013 | |||||||||
| Tour revenues | $ | 209,985 | $ | 198,459 | $ | 192,237 | ||||||
| Cost of tours | 95,417 | 90,002 | 96,655 | |||||||||
| Operating expenses | 99,066 | 78,037 | 72,060 | |||||||||
| Operating income | 15,502 | 30,420 | 23,522 | |||||||||
| Net income | 19,742 | 22,245 | 14,844 | |||||||||
| Earnings per share – Common | ||||||||||||
| Basic | $ | 0.44 | $ | 0.44 | $ | 0.29 | ||||||
| Diluted | 0.43 | 0.44 | 0.29 | |||||||||
| Earnings per share – Class B | ||||||||||||
| Basic | $ | - | $ | 0.44 | $ | 0.29 | ||||||
| Diluted | - | 0.44 | 0.29 | |||||||||
The following table sets forth our operating data as a percentage of total revenue:
| For the Years Ended December 31, | ||||||||||||
| 2015 | 2014 | 2013 | ||||||||||
| Tour revenues | 100.0 | % | 100.0 | % | 100.0 | % | ||||||
| Cost of tours | 45.4 | % | 45.4 | % | 50.3 | % | ||||||
| Gross profit | 54.6 | % | 54.6 | % | 49.7 | % | ||||||
| Operating expenses: | ||||||||||||
| General and administrative | 18.6 | % | 18.1 | % | 15.8 | % | ||||||
| Selling and marketing | 16.7 | % | 15.5 | % | 15.6 | % | ||||||
| Merger related expenses | 6.4 | % | 0.0 | % | 0.0 | % | ||||||
| Depreciation and amortization | 5.5 | % | 5.7 | % | 6.1 | % | ||||||
| Total operating expenses | 47.2 | % | 39.3 | % | 37.5 | % | ||||||
| Operating income | 7.4 | % | 15.3 | % | 12.2 | % | ||||||
| Other (expense) income: | ||||||||||||
| Change in fair value of obligation to repurchase shares of common stock | 0.0 | % | 0.0 | % | (0.2 | %) | ||||||
| (Loss) gain on foreign currency | 0.0 | % | 0.0 | % | 0.7 | % | ||||||
| Gain on transfer of assets | 3.6 | % | 0.0 | % | 0.0 | % | ||||||
| Other income, net | 2.4 | % | 0.0 | % | 0.0 | % | ||||||
| Interest expense, net | (5.2 | %) | (2.7 | %) | (4.1 | %) | ||||||
| Total other income (expense) | 0.8 | % | (2.7 | %) | (3.6 | %) | ||||||
| Income before income taxes | 8.2 | % | 12.6 | % | 8.6 | % | ||||||
| Income tax(benefit) expense | (1.2 | %) | 1.4 | % | 0.9 | % | ||||||
| Net income | 9.4 | % | 11.2 | % | 7.7 | % | ||||||
| 42 |
The following table sets forth our Available Guest Nights, Guest Nights Sold, Occupancy, Maximum Guests, Number of Guests and Voyages for the years ended December 31, 2015, 2014 and 2013:
| For the Years Ended December 31, | ||||||||||||
| 2015 | 2014 | 2013 | ||||||||||
| Available Guest Nights | 184,366 | 180,206 | 177,135 | |||||||||
| Guest Nights Sold | 169,303 | 167,483 | 163,758 | |||||||||
| Occupancy | 91.8 | % | 92.9 | % | 92.4 | % | ||||||
| Maximum Guests | 21,459 | 20,216 | 20,858 | |||||||||
| Number of Guests | 19,824 | 18,819 | 19,327 | |||||||||
| Voyages | 281 | 262 | 265 | |||||||||
The following table shows the calculations of Gross Yield and Net Yield for the years ended December 31, 2015, 2014 and 2013. Gross Yield is calculated by dividing tour revenues by Available Guest Nights, and Net Yield is calculated by dividing Net Revenue by Available Guest Nights.
| For the Years Ended December 31, | ||||||||||||
| (In thousands, except for Available Guest Nights, Gross and Net Yield) | 2015 | 2014 | 2013 | |||||||||
| Guest ticket revenues | $ | 183,805 | $ | 173,536 | $ | 157,288 | ||||||
| Other revenues | 26,180 | 24,923 | 34,949 | |||||||||
| Tour Revenues | 209,985 | 198,459 | 192,237 | |||||||||
| Less: Commissions | (14,460 | ) | (12,941 | ) | (13,111 | ) | ||||||
| Less: Other expense | (16,496 | ) | (14,403 | ) | (14,235 | ) | ||||||
| Net Revenue | $ | 179,029 | $ | 171,115 | $ | 164,891 | ||||||
| Available Guest Nights | 184,366 | 180,206 | 177,135 | |||||||||
| Gross Yield | $ | 1,139 | $ | 1,101 | $ | 1,085 | ||||||
| Net Yield | 971 | 950 | 931 | |||||||||
The following table shows the calculations of Gross Cruise Cost per Available Guest Night and Net Cruise Costs per Available Guest Night for the years ended December 31, 2015, 2014 and 2013.
| For the Years Ended December 31, | ||||||||||||
| (In thousands, except Available Guest Nights, Gross and Net Cruise Cost) | 2015 | 2014 | 2013 | |||||||||
| Cost of tours | $ | 95,417 | $ | 90,002 | $ | 96,655 | ||||||
| Plus: Merger-related expenses | 13,344 | - | - | |||||||||
| Plus: Selling and marketing | 34,980 | 30,718 | 29,984 | |||||||||
| Plus: General and administrative | 39,097 | 36,053 | 30,431 | |||||||||
| Gross Cruise Cost | 182,838 | 156,773 | 157,070 | |||||||||
| Less: Commission expense | (14,460 | ) | (12,941 | ) | (13,111 | ) | ||||||
| Less: Other expenses | (16,496 | ) | (14,403 | ) | (14,235 | ) | ||||||
| Net Cruise Cost | 151,882 | 129,429 | 129,724 | |||||||||
| Less: Fuel expense | (9,004 | ) | (11,671 | ) | (12,237 | ) | ||||||
| Net Cruise Cost Excluding Fuel | 142,878 | 117,758 | 117,487 | |||||||||
| Non-GAAP Adjustments: | ||||||||||||
| Stock-based compensation | (4,913 | ) | (274 | ) | - | |||||||
| National Geographic fee amortization | (1,397 | ) | - | - | ||||||||
| Merger-related expenses | (13,344 | ) | - | - | ||||||||
| Acquisition-related expenses | - | (112 | ) | (1,306 | ) | |||||||
| Retention expense | - | (2,500 | ) | - | ||||||||
| Adjusted Net Cruise Cost Excluding Fuel | $ | 123,224 | $ | 114,872 | $ | 116,181 | ||||||
| Available Guest Nights | 184,366 | 180,206 | 177,135 | |||||||||
| Gross Cruise Cost per Available Guest Night | $ | 992 | $ | 870 | $ | 887 | ||||||
| Net Cruise Cost per Available Guest Night | 824 | 718 | 732 | |||||||||
| Net Cruise Cost Excluding Fuel per Available Guest Night | 775 | 653 | 663 | |||||||||
| Adjusted Net Cruise Cost per Available Guest Night | 717 | 702 | 725 | |||||||||
| Adjusted Net Cruise Cost Excl. Fuel per Available Guest Night | 668 | 637 | 656 | |||||||||
| 43 |
The following outlines the calculation of EBITDA and Adjusted EBITDA for the years ended December 31, 2015, 2014 and 2013.
| For the Years Ended December 31, | ||||||||||||
| (In thousands) | 2015 | 2014 | 2013 | |||||||||
| Net income | $ | 19,742 | $ | 22,245 | $ | 14,844 | ||||||
| Income tax (benefit) expense | (2,649 | ) | 2,800 | 1,663 | ||||||||
| Interest expense, net | 10,901 | 5,293 | 7,896 | |||||||||
| Depreciation and amortization | 11,645 | 11,266 | 11,645 | |||||||||
| EBITDA | 39,639 | 41,604 | 36,048 | |||||||||
| Change in fair value of obligation to repurchase shares of common stock | - | (10 | ) | 401 | ||||||||
| Loss (gain) on foreign currency translation | 40 | 149 | (1,281 | ) | ||||||||
| Gain on transfer of assets | (7,502 | ) | - | - | ||||||||
| Other income | (5,030 | ) | (57 | ) | (1 | ) | ||||||
| Stock-based compensation | 4,913 | 274 | - | |||||||||
| National Geographic fee amortization -non-cash | 1,397 | - | - | |||||||||
| Merger-related expenses | 13,344 | - | - | |||||||||
| Acquisition-related expenses | - | 112 | 1,306 | |||||||||
| Retention expenses | - | 2,500 | - | |||||||||
| Adjusted EBITDA | $ | 46,801 | $ | 44,572 | $ | 36,473 | ||||||
Comparison of Years Ended December 31, 2015 and December 31, 2014
Tour Revenues
Tour revenues increased $11.5 million, or 5.8%, to $210.0 million in 2015 compared to $198.5 million in 2014. The change was primarily the result of a $10.3 million increase in guest ticket revenues to $183.8 million in 2015 from $173.5 million in 2014 from additional chartered and owned vessel voyages and an increase in tour prices, offset by a slight decrease in occupancy. Net Yield for 2015 amounted to $971 compared to $950 in 2014 with the increase primarily related to increased tour prices.
Cost of Tours
Total cost of tours increased $5.4 million, or 6.0%, to $95.4 million in 2015 from $90.0 million in 2014. This was primarily due to higher charter costs, land costs and air expense related to additional voyages offered, offset by decreases in fuel and maintenance expenditures for the owned fleet. Adjusted Net Cruise Cost per Available Guest Night increased 2.1% to $717 in 2015 compared to $702 in 2014, with the increase primarily related to higher charter costs.
General and Administrative Expenses
General and administrative expenses increased by $3.0 million to $39.1 million in 2015 from $36.1 million in 2014. This increase was primarily due to a $4.6 million increase in stock options incentive compensation expense and a $1.3 million increase in professional fees for additional staffing changes and executive searches, offset by a $2.9 million decrease in bonus expense.
Selling and Marketing Expenses
Selling and marketing expenses increased $4.3 million, or 14.0%, to $35.0 million in 2015 from $30.7 million in 2014. This increase was due to $3.6 million in higher commission expenses, which relates to a $1.4 million increase in National Geographic fee amortization in connection with the merger and a $2.2 million increase related to increased revenue from additional voyages offered, and $0.5 million in higher expense related to marketing printing and postage.
| 44 |
Merger-Related Expenses
Merger-related expenses in 2015 were $13.3 million, which included $8.3 million of one-time professional fees associated with the merger transaction between Lindblad and Capitol and $5.0 million in success fee compensation expense.
Depreciation and Amortization Expenses
Depreciation and amortization expenses increased $0.4 million to $11.7 million in 2015 from $11.3 million in 2014 primarily related to capital additions to current vessels.
Other (Expense) Income
Other income was $1.6 million in 2015 compared to a $5.4 million expense in 2014, which represents a $7.0 million increase in other income, net. This change was primarily due to the following factors.
| ● | Additional income of $12.5 million in 2015 related to the $5.0 million success fee income for the new debt financing in May 2015 and the gain on the disposal of assets of $7.5 million related to the junior debt in the Cruise/Ferry Master Fund I, N.V. (“CFMF”) transaction. | |
| ● | Interest expense, net, increased $5.6 million to $10.9 million in 2015 from $5.3 million in 2014. The increase was primarily the result of higher debt levels in the second half of 2015 from our new credit agreement, as well as accelerated amortization of deferred finance costs of $1.9 million related to the repayment of our senior debt in May 2015. | |
| ● | In 2015, we recorded a small loss in foreign currency translation compared to $0.2 million in foreign currency translation losses in 2014. The $0.2 million net change was primarily related to the strengthening of the Australian dollar compared to the U.S. dollar. |
Comparison of Years Ended December 31, 2014 and December 31, 2013
Tour Revenues
Tour revenues increased $6.3 million, or 3.3%, to $198.5 million in 2014 compared to $192.2 million in 2013. This increase was primarily due to the National Geographic Orion providing approximately $6.0 million of additional tour revenues in its second year of operation under our management. An increase in tour revenues of approximately $6.0 million for our owned fleet was offset by a reduction in inventory for the chartered vessels that resulted in a decrease in tour revenues of approximately $6.0 million for chartered vessel revenue in 2014. Net Yield for 2014 amounted to $950 compared to $931 in 2013.
Cost of Tours
Total cost of tours decreased $6.7 million, or 6.9%, to $90.0 million in 2014 from $96.7 million in 2013. This decrease was driven by a $4.3 million reduction in charter inventory related costs as we sought to maximize yields across all of our vessels. In addition, the National Geographic Orion experienced a $1.3 million reduction in drydock expense in 2014 compared to 2013. During 2013, the vessel underwent an extensive drydock process during which we added our own specific modifications in order for the ship to meet its operational requirements. Adjusted Net Cruise Cost per Available Guest Night decreased 3.2% to $702 in 2014 compared to $725 in 2013.
General and Administrative Expenses
General and administrative expenses increased $5.7 million to $36.1 million in 2014 from $30.4 million in 2013. This increase was primarily due to $2.5 million in payments made to certain executives as retention amounts in 2014 and no such payments were made in 2013. In addition, $1.8 million of the total increase was related to increases in salaries, headcount and certain incentive compensation payments.
| 45 |
Selling and Marketing Expenses
Selling and marketing expenses increased $0.7 million, or 2.3%, to $30.7 million in 2014 from $30.0 million in 2013. This increase was primarily due to higher expenditures in most sales and marketing categories to ensure high Occupancy and Net Yields as Available Guest Nights increased 1.7% from 177,135 in 2013 to 180,206 in 2014.
Depreciation and Amortization Expenses
Depreciation and amortization expenses decreased $0.3 million to $11.3 million in 2014 from $11.6 million in 2013.
Other (Expense) Income
Other expense was $5.4 million in 2014 compared to $7.0 million in 2013, which represents a $1.6 million decrease in other (expense) income, net. This change was primarily due to the following factors.
| ● | Interest expense, net, decreased $2.6 million to $5.3 million in 2014 from $7.9 million in 2013. The decrease was due to lower average debt levels during 2014 and debt discount amortization that was $1.4 million lower in 2014 as compared to 2013. | |
| ● | In 2014, we recorded a $0.2 million foreign currency translation loss compared to a $1.3 million foreign currency translation gain in 2013. |
Liquidity and Capital Resources
Sources and Uses of Cash for the Years Ended December 31, 2015, 2014 and 2013
Net cash provided by operating activities decreased by $2.8 million in 2015 to $40.3 million from $43.1 million in 2014 primarily due to merger-related costs and changes in the liabilities for unearned passenger revenue, offset by increases related to changes in accounts payable, accrued expenses and prepaid expenses. Net cash provided by operating activities increased by $9.8 million in 2014 to $43.1 million from $33.3 million in 2013 primarily due to a $7.4 million increase in net income.
Net cash used in investing activities was $81.5 million in 2015 compared to $29.0 million in 2014. The $52.5 million increase in cash used in investing activities was primarily related to the purchase in May 2015 of our investment in CFMF and an increase in purchases of property and equipment related to growth capital expenditures. The purchase of property and equipment increase includes $10.1 million in 2015 to build two new coastal vessels. Net cash used in investing activities increased by $18.7 million in 2014 to $29.0 million from $10.3 million in 2013 primarily due to a $25.0 million initial cash payment in connection with the purchase from DVB Bank America N.V. (“DVB”) of the Profit Participation Loan, which represented DVB’s interest in CFMF.
Net cash provided by financing activities was $208.5 million in 2015 compared to net cash used in financing activities of $17.4 million in 2014. The $225.9 million difference was primarily related to the $175.0 million in proceeds from the new debt and $186.8 million in net proceeds from the merger, partially offset by the related $90.0 million in payments to shareholders for the merger, an increase of $41.9 million in repayments of long-term debt and the addition of $11.0 million in deferred financing costs. Net cash used in financing activities decreased $0.2 million in 2014 to $17.4 million from $17.6 million in 2013. Net cash used in 2014 included $10.5 million for the repurchase of Class B shares and a $4.0 million principal reduction on our term loans.
| 46 |
Contractual Commitments and Contingencies
As of December 31, 2015, our contractual obligations were as follows:
| Payments due by period | ||||||||||||||||||||
| (In thousands) | Total | Less than 1 year | 1- 3 years | 3-5 years | After 5 years | |||||||||||||||
| Financing Activities: | ||||||||||||||||||||
| Long-term debt obligations | $ | 174,125 | $ | 1,750 | $ | 3,500 | $ | 3,500 | $ | 165,375 | ||||||||||
| Interest on long-term debt | 49,973 | 9,541 | 18,793 | 18,408 | 3,231 | |||||||||||||||
| Operating Activities: | ||||||||||||||||||||
| Operating lease obligations | 6,341 | 841 | 1,608 | 1,218 | 2,674 | |||||||||||||||
| Charter commitments | 18,918 | 8,053 | 9,383 | 1,482 | - | |||||||||||||||
| Other long-term liabilities | 677 | - | - | - | 677 | |||||||||||||||
| Investing activities: | ||||||||||||||||||||
| Purchase obligations - Fleet expansion | 118,807 | 69,289 | 49,518 | - | - | |||||||||||||||
| Total | $ | 368,841 | $ | 89,474 | $ | 82,802 | $ | 24,608 | $ | 171,957 | ||||||||||
Funding Needs and Sources
We have historically relied on a combination of cash flows provided by operations and the incurrence of additional debt and/or the refinancing of existing debt to fund obligations. As of December 31, 2015, we had $206.9 million in cash and cash equivalents, excluding restricted cash. As a result of the Amended Credit Agreement, we had net working capital of $130.0 million as of December 31, 2015 as compared to a working capital deficit of $59.7 million as of December 31, 2014. Similar to others in the industry, we historically operated with a meaningful working capital deficit. The deficit as of December 31, 2014 was mainly attributable to the fact that, under our business model, a vast majority of guest ticket receipts are collected in advance of the applicable sailing date. These advance passenger receipts remain a current liability until the sailing date. The cash generated from these advance receipts is used interchangeably with cash on hand from other cash from operations. The cash received as advanced receipts can be used to fund operating expenses for the applicable future sailing or otherwise, pay down credit facilities, invest in long-term investments or any other use of cash.
In November 2015, we announced that our Board of Directors authorized a $20.0 million stock and warrant repurchase plan (“Repurchase Plan”). This Repurchase Plan authorizes us to purchase from time to time our outstanding common stock and warrants through open market repurchases in compliance with Rule 10b-18 of the Securities Exchange Act of 1934, as amended, and/or in privately negotiated transactions discretion based on market and business conditions, applicable legal requirements and other factors. Any shares and warrants purchased will be retired. The Repurchase Plan has no time deadline and will continue until otherwise modified or terminated at the sole discretion of our Board of Directors at any time. We repurchased 2,091,618 warrants in the fourth quarter of 2015 for $5.5 million.
In December 2015, we executed definitive agreements for the construction of two new coastal vessels for delivery targeted in 2017 and 2018 at a purchase price of $48.0 million and $46.8 million, respectively. The newbuild process will expose us to certain risks typically associated with new ship construction, which we are prepared to manage through detailed planning and close monitoring by our internal marine team. The purchase of the ships will be funded through a combination of cash available on our balance sheet and excess cash flows generated by our existing operations. We also signed a definitive agreement for the purchase of the Via Australis to be used in our operations in the Galápagos Islands. The purchase price for the ship is $18.0 million and we plan to spend up to $10.0 million to refurbish and outfit the ship immediately after closing. The purchase and refurbishment will be funded through a combination of cash available on our balance sheet and excess cash flows generated by our existing operations.
As of December 31, 2015, we had approximately $164.4 million in long-term debt obligations, including the current portion of long-term debt offset by debt discounts and deferred financing costs. While this added debt puts us into a higher leveraged position, we believe that our cash on hand, our new revolving credit facility (described below) and expected future operating cash inflows will be sufficient to fund operations, debt service requirements, capital expenditures for our newbuilds and other assets and our Repurchase Plan. However, there can be no assurance that cash flows from operations will be available in the future to fund future obligations.
| 47 |
Debt Covenants
On May 8, 2015, Lindblad entered into a new credit agreement with Credit Suisse A.G. as Administrative Agent and Collateral Agent (“Credit Agreement”) for a $150.0 million facility, which was subsequently increased to $175.0 million upon syndication on July 8, 2015 (“Amended Credit Agreement”), in the form of a $155.0 million U.S. term loan (the “U.S. Term Loan”) and a $20.0 million Cayman term loan for the benefit of Lindblad’s foreign subsidiaries (the “Cayman Loan,” and together with the U.S. Term Loan, the “Loans”). The net proceeds from the Loans, net of discounts, fees and expenses, were approximately $164.1 million. The Loans bear interest at a rate based on an adjusted ICE Benchmark Administration LIBO Rate (subject to a floor of 1.00%) plus a spread of 4.50%. The U.S. Term Loan and the Cayman Loan both mature on May 8, 2021. The net proceeds from the term loan advances were used to repay Lindblad’s existing debt, fund a portion of the purchase consideration paid in connection with Lindblad’s purchase of the financial and equity interests in CFMF and for general corporate purposes.
The Amended Credit Agreement contains financial covenants that, among other things, (i) require us to maintain a total net leverage ratio (defined as on any date of determination, the ratio of total debt on such date, less up to $25.0 million of the unrestricted cash and cash equivalents to Adjusted EBITDA (as defined in the Amended Credit Agreement) for the trailing 12-month period) of 4.75 to 1.00 initially, with 0.25 equal reductions annually thereafter until March 31, 2020, when the total net leverage ratio shall be 3.50 to 1.00 thereafter; (ii) limit the amount of indebtedness we may incur generally and specifically for intercompany debt, debt incurred to finance acquisitions and improvements, for capital and synthetic lease obligations, for standby letters of credit, and in connection with refinancings; (iii) limit the amount we may spend in connection with certain types of investments; and (iv) require the delivery of certain periodic financial statements and an operating budget. As of December 31 2015, we were in compliance with the financial covenants.
On March 7, 2016, we entered into a second amended and restated credit agreement with Credit Suisse as Administrative Agent and Collateral Agent (“Restated Credit Agreement”), amending our existing senior secured credit facility with Credit Suisse (“Restated Credit Facility”). The Restated Credit Facility provides for our existing $175.0 million senior secured first lien term loan facility and a new $45.0 million senior secured incremental revolving credit facility (“Revolving Credit Facility”), which includes a $5.0 million letter of credit subfacility. Borrowings under the Revolving Credit Facility will bear interest at an adjusted ICE Benchmark administration LIBO Rate plus a spread of 4.00%, or, at our option, an alternative base rate plus a spread of 3.00%. We are also required to pay a 0.50% annual commitment fee on undrawn amounts under the Revolving Credit Facility, which matures on May 8, 2020. Our obligations under the Restated Credit Facility are secured by substantially all of our assets. The Restated Credit Agreement contains the same financial and operational covenants as the Amended Credit Agreement.
Off-Balance Sheet Arrangements
We did not have any off-balance sheet arrangements as of December 31, 2015 and 2014.
Future Application of Accounting Standards
Refer to Note 2 - Summary of Significant Accounting Policies to our consolidated financial statements for further information on Recent Accounting Pronouncements.
| Item 7A. | Quantitative and Qualitative Disclosures About Market Risk |
We are exposed to market risk in the normal course of our business, primarily due to our international operations. The primary exposure relates to the exchange rate fluctuations between our U.S. dollar functional reporting currency and other currencies. This exposure includes trade receivables denominated in currencies other than our functional currency. To date, fluctuations in exchange rates have not had a material impact on our results of operations.
In addition, we have ship maintenance contracts and may, in the future, have ship construction contracts, which are denominated in currencies other than the U.S. dollar. While we have entered into, and may, in the future, enter into, forward contracts and collar options to manage a portion of the currency risk associated with these contracts, we are, or may be, exposed to fluctuations in the exchange rates for the portions of the contracts that have not been hedged. Additionally, if a shipyard is unable to perform under such a contract, any foreign currency forward contracts that were entered into to manage the currency risk would need to be terminated.
Due to specific geographies in which we operate and the cost of providing access to fuel in remote destinations, we have historically not experienced significant fluctuations in fuel costs with changes in world fuel commodity prices and have not historically hedged our fuel purchases.
We are also exposed to market risk from changes in interest rates charged on debt. The impact on earnings is subject to change as a result of movements in market rates. A hypothetical increase in interest rates of 100 basis points would result in potential reduction of future pre-tax earnings of approximately $1.7 million per year for the $174.1 million outstanding under the Amended Credit Agreement as of December 31, 2015. Our ability to meet our debt service obligations will be dependent upon our future performance which, in turn, is subject to future economic conditions and to financial, business and other factors.
| 48 |
| Item 8. | Financial Statements and Supplementary Data |
The consolidated financial statements and related financial statement schedules required under Item 8 are included beginning on page F-1 of this Report.
| Item 9. | Changes In and Disagreements with Accountants on Accounting and Financial Disclosure |
None.
| Item 9A. | Controls and Procedures |
Evaluation of Disclosure Controls and Procedures
Under the supervision and with the participation of our principal executive officer and principal financial officer, our management conducted an evaluation of the effectiveness of the design and operation of our disclosure controls and procedures. The term “disclosure controls and procedures,” as defined in Rules 13a-15(e) under the Securities Exchange Act of 1934, as amended, or the Exchange Act, means controls and other procedures of a company that are designed to ensure that information required to be disclosed in the reports that it files or submits under the Exchange Act is recorded, processed, summarized and reported, within the time periods specified in the rules and forms of the Securities and Exchange Commission (“SEC”). Disclosure controls and procedures include, without limitation, controls and procedures designed to ensure that information required to be disclosed by a company in the reports that it files or submits under the Exchange Act is accumulated and communicated to the company’s management, including its principal executive and principal financial officers, as appropriate to allow timely decisions regarding required disclosure.
Based on this evaluation, our Chief Executive Officer and Chief Financial Officer concluded that our disclosure controls and procedures were effective as of December 31, 2015.
Management’s Annual Report on Internal Control over Financial Reporting
We produce our consolidated financial statements in accordance with the requirements of U.S. GAAP. Management is responsible for establishing and maintaining an adequate system of internal control over financial reporting of our company. Effective internal controls are necessary for us to provide reliable financial reports, to help mitigate the risk of fraud and to operate successfully as a publicly traded company. The design, monitoring and revision of the system of internal financial reporting controls involves, among other things, management’s judgments with respect to the relative cost and expected benefits of specific control measures. The effectiveness of the control system is supported by the selection, retention and training of qualified personnel and an organizational structure that provides an appropriate division of responsibility and formalized procedures. The system of internal accounting controls is periodically reviewed and modified in response to changing conditions. The Company used the internal control framework created by the Committee of Sponsoring Organizations of the Treadway Commission (COSO 2013) to define and measure the effectiveness of its internal financial reporting controls.
Under the supervision and with the participation of our management, including our principal executive officer and principal financial and accounting officer, we conducted an evaluation of the effectiveness of our disclosure controls and procedures as of the end of the year ended December 31, 2015, as such term is defined in Rules 13a-15(e) and 15d-15(e) under the Securities Exchange Act of 1934, as amended. Based on this evaluation, our principal executive officer and principal financial and accounting officer have concluded that during the period covered by this report, our disclosure controls and procedures were effective.
As long as we qualify as an “emerging growth company” as defined by the Jumpstart our Business Startups Act of 2012, we will not be required to obtain an auditor’s attestation report on our internal controls in future Annual Reports on Form 10-K as otherwise required by Section 404(b) of the Sarbanes-Oxley Act. Accordingly, our independent registered public accounting firm did not perform an audit of our internal control over financial reporting for the fiscal year ended December 31, 2015.
| 49 |
Changes in Internal Control Over Financial Reporting
There was no change in our internal control over financial reporting that occurred during the fiscal quarter covered by this Annual Report on Form 10-K that has materially affected, or is reasonably likely to materially affect, our internal control over financial reporting as of December 31, 2015.
Inherent Limitations on Effectiveness of Controls
We do not expect that our disclosure controls and procedures or our internal controls will prevent all error and all fraud. A control system, no matter how well conceived and operated, can provide only reasonable, not absolute, assurance that the objectives of the control system are met. Because of the inherent limitations in all control systems, no evaluation of controls can provide absolute assurance that all control issues and instances of fraud, if any, within the company have been detected. These inherent limitations include the realities that judgments in decision-making can be faulty, and that breakdowns can occur because of a simple error or mistake. Additionally, controls can be circumvented by the individual acts of some persons, by collusion of two or more people, or by management override of the control. The design of any system of controls also is based in part upon certain assumptions about the likelihood of future events, and there can be no assurance that any design will succeed in achieving its stated goals under all potential future conditions. Over time, controls may become inadequate because of changes in conditions, or the degree of compliance with the policies or procedures may deteriorate. Because of the inherent limitations in a cost-effective control system, misstatements due to error or fraud may occur and not be detected.
| Item 9B. | Other Information |
None.
| 50 |
| Item 10. | Directors, Executive Officers and Corporate Governance |
Information concerning our executive officers, directors and corporate governance is incorporated herein by reference to our Definitive Proxy Statement to be filed with the Securities and Exchange Commission (“SEC”) within 120 days after the end of our fiscal year covered by this Form 10-K with respect to our 2016 Annual Meeting of Stockholders.
Code of Conduct and Ethics
We have adopted Codes of Business Conduct and Ethics that applies to our employees, including our principal executive officer, principal financial officer and persons performing similar functions, and our directors. Our codes of ethics and business conduct can be found posted in the investor relations sections on our website at http://www.expeditions.com. None of the websites referenced in this Annual Report on or the information contained therein is incorporated herein by reference. Future material amendments or waivers relating to the Code of Ethics will be disclosed on our website referenced in this paragraph within four business days following the date of such amendment or waiver.
| Item 11. | Executive Compensation |
Information is incorporated herein by reference to our Definitive Proxy Statement to be filed with the SEC within 120 days after the end of our fiscal year covered by this Form 10-K with respect to our 2016 Annual Meeting of Stockholders.
| Item 12. | Security Ownership of Certain Beneficial Owners and Management and Related Stockholder Matters |
Information is incorporated herein by reference to our Definitive Proxy Statement to be filed with the SEC within 120 days after the end of our fiscal year covered by this Form 10-K with respect to our 2016 Annual Meeting of Stockholders.
| Item 13. | Certain Relationships and Related Transactions, and Director Independence |
Information is incorporated herein by reference to our Definitive Proxy Statement to be filed with the SEC within 120 days after the end of our fiscal year covered by this Form 10-K with respect to our 2016 Annual Meeting of Stockholders.
| Item 14. | Principal Accountant Fees and Services |
Information is incorporated herein by reference to our Definitive Proxy Statement to be filed with the SEC within 120 days after the end of our fiscal year covered by this Form 10-K with respect to our 2016 Annual Meeting of Stockholders.
| 51 |
| Item 15. | Exhibits, Financial Statement Schedules |
| (a) | The following documents are filed as part of this Form 10-K or incorporated herein by reference: |
| (1) | Consolidated Financial Statements. |
See Index to Consolidated Financial Statements on page F-1.
| (2) | Financial Statement Schedules. |
None.
| (3) | Exhibits. |
The following exhibits are filed or incorporated by reference as part of this Form 10-K.
| Number | Description | Included | Form | Filing Date | ||||
| 2.1 | Agreement and Plan of Merger, dated as of March 9, 2015, by and among Capitol Acquisition Corp. II, Argo Expeditions, LLC, Argo Merger Sub, Inc. and Lindblad Expeditions, Inc. | By Reference | 8-K | March 10, 2015 | ||||
| 2.2 | Amendment No. 1 to Agreement and Plan of Merger, dated as of April 30, 2015, by and among Capitol Acquisition Corp. II, Argo Expeditions, LLC, Argo Merger Sub, Inc. and Lindblad Expeditions, Inc. | By Reference | 8-K | May 4, 2015 | ||||
| 2.3 | Amendment No. 2 to Agreement and Plan of Merger, dated as of May 1, 2015, by and among Capitol Acquisition Corp. II, Argo Expeditions, LLC, Argo Merger Sub, Inc. and Lindblad Expeditions, Inc. | By Reference | 8-K | May 4, 2015 | ||||
| 3.1 | Second Amended and Restated Certificate of Incorporation. | By Reference | DEFM 14-A | June 24, 2015 | ||||
| 3.2 | Bylaws. | By Reference | S-1 | February 15, 2011 | ||||
| 4.1 | Specimen Common Stock Certificate. | By Reference | 8-K | July 10, 2015 | ||||
| 4.2 | Specimen Warrant Certificate. | By Reference | 8-K | July 10, 2015 | ||||
| 4.3 | Warrant Agreement. | By Reference | 8-K | May 15, 2013 | ||||
| 10.1 | Letter Agreement signed by each of Capitol Acquisition Management 2 LLC and Mark D. Ein. | By Reference | 8-K | May 15, 2013 | ||||
| 10.2 | Letter Agreement signed by L. Dyson Dryden. | By Reference | 8-K | May 15, 2013 |
| 52 |
| Number | Description | Included | Form | Filing Date | ||||
| 10.3 | Form of Letter Agreement signed by each of Lawrence Calcano, Piyush Sodha and Richard C. Donaldson | By Reference | 8-K | May 15, 2013 | ||||
| 10.4 | Investment Management Trust Agreement between Continental Stock Transfer & Trust Company and the Company. | By Reference | 8-K | May 15, 2013 | ||||
| 10.5 | Stock Escrow Agreement between the Company, Continental Stock Transfer & Trust Company and each of Capitol Acquisition Management 2 LLC, Lawrence Calcano, Richard C. Donaldson, Piyush Sodha and L. Dyson Dryden. | By Reference | 8-K | May 15, 2013 | ||||
| 10.6 | Registration Rights Agreement among the Company and each of Capitol Acquisition Management 2 LLC, Lawrence Calcano, Richard C. Donaldson, Piyush Sodha and L. Dyson Dryden. | By Reference | 8-K | May 15, 2013 | ||||
| 10.7 | Sponsor Warrants Purchase Agreement among the Company, Graubard Miller and each of Capitol Acquisition Management 2 LLC, Lawrence Calcano, Richard C. Donaldson, Piyush Sodha and L. Dyson Dryden. | By Reference | 8-K | May 15, 2013 | ||||
| 10.8 | 2015 Long-Term Incentive Plan.* | By Reference | DEFM 14-A | June 24, 2015 | ||||
| 10.9 | Credit Agreement, dated as of May 8, 2015, among Lindblad Expeditions, Inc. and Lindblad Maritime Enterprises, Ltd. as borrowers, the lenders party thereto, and Credit Suisse AG, as Administrative Agent and Collateral Agent. | By Reference | 8-K | July 10, 2015 | ||||
| 10.10 | Amended and Restated Credit Agreement, dated as of July 8, 2015, among Lindblad Expeditions, Inc. and Lindblad Maritime Enterprises, Ltd. as borrowers, the lenders from time to time party thereto, and Credit Suisse AG, as Administrative Agent and Collateral Agent. | By Reference | 8-K | July 10, 2015 | ||||
| 10.11 | Non-Competition Agreement between Sven-Olof Lindblad and the Company. | By Reference | 8-K | July 10, 2015 | ||||
| 10.12 | Employment Agreement between Ian Rogers and the Company and Assignment and Assumption of Option Award Agreement.* | By Reference | 8-K | July 10, 2015 | ||||
| 10.13 | Employment Agreement between Trey Byus and the Company and Assignment and Assumption of Option Award Agreement.* | By Reference | 8-K | July 10, 2015 | ||||
| 10.14 | Registration Rights Agreement between the stockholders of Lindblad Expeditions, Inc. and Capitol Acquisitions Corp. II. | By Reference | 8-K | July 10, 2015 | ||||
| 10.15 | Alliance and License Agreement, dated as of December 12, 2011, by and between National Geographic Society and Lindblad Expeditions, Inc.† | By Reference | 8-K | September 2, 2015 | ||||
| 10.16 | Amendment to Alliance and License Agreement, dated as of November 20, 2014, by and between National Geographic Society and Lindblad Expeditions, Inc.† | By Reference | 8-K | July 10, 2015 | ||||
| 10.17 | Second Amendment to Alliance and License Agreement, dated as of March 9, 2015, by and between National Geographic Society and Lindblad Expeditions, Inc.† | By Reference | 8-K | July 10, 2015 | ||||
| 10.18 | Tour Operator Agreement, dated as of December 12, 2011, by and between National Geographic Society and Lindblad Expeditions, Inc.† | By Reference | 8-K | July 10, 2015 | ||||
| 10.19 | Amendment to Tour Operator Agreement, dated as of November 20, 2014, by and between National Geographic Society and Lindblad Expeditions, Inc.† | By Reference | 8-K | July 10, 2015 | ||||
| 10.20 | Second Amendment to Tour Operator Agreement, dated as of March 9, 2015, by and between National Geographic Society and Lindblad Expeditions, Inc.† | By Reference | 8-K | July 10, 2015 | ||||
| 10.21 | Lindblad 2012 Stock Incentive Plan.* | By Reference | 8-K | July 10, 2015 | ||||
| 10.22 | Form of Executive Officer Stock Option Award Agreement.* | By Reference | 8-K | October 30, 2015 | ||||
| 10.23 | Employment Agreement by and between Lindblad Expeditions Holdings, Inc. and John T. McClain.* | By Reference | 8-K | October 30, 2015 |
| 53 |
| Number | Description | Included | Form | Filing Date | ||||
| 10.24 | Employment Agreement by and between Lindblad Expeditions Holdings, Inc. and Tyler Skarda.* | By Reference | 8-K | December 2, 2015 | ||||
| 10.25 | Second Amended and Restated Credit Agreement, dated as of March 7, 2016, among Lindblad Expeditions, Inc. and Lindblad Maritime Enterprises, Ltd. as borrowers, the lenders from time to time party thereto, and Credit Suisse AG, as Administrative Agent and Collateral Agent, Citibank, N.A. as Syndication Agent and SunTrust Bank as Documentation Agent. | By Reference |
8-K | March 11, 2016 | ||||
| 10.26 | Vessel Construction Agreement (Hull No. S189) between Lindblad Expeditions, LLC and Ice Floe, LLC, dated as of December 2, 2015.†† | Herewith | ||||||
| 10.27 | Vessel Construction Agreement (Hull No. S188) between Lindblad Expeditions, LLC and Ice Floe, LLC, dated as of December 2, 2015.†† | Herewith | ||||||
| 10.28 | Form of Non-Employee Director Restricted Stock Award Agreement. | Herewith | ||||||
| 10.29 | Non-Employee Director Deferred Compensation Plan. | Herewith | ||||||
| 21.1 | Subsidiaries. | Herewith | ||||||
| 23.1 | Consent of Marcum LLP. | Herewith | ||||||
| 31.1 | Certification of Principal Executive Officer pursuant to Section 302 of the Sarbanes-Oxley Act of 2002. | Herewith | ||||||
| 31.2 | Certification of Principal Financial and Accounting Officer pursuant to Section 302 of the Sarbanes-Oxley Act of 2002. | Herewith | ||||||
| 32.1 | Chief Executive Officer Certification pursuant to 18 U.S.C. Section 1350, as adopted pursuant to Section 906 of the Sarbanes-Oxley Act of 2002. | Herewith | ||||||
| 32.2 | Chief Financial Officer Certification pursuant to 18 U.S.C. Section 1350, as adopted pursuant to Section 906 of the Sarbanes-Oxley Act of 2002. | Herewith | ||||||
| 101.INS | XBRL Instance Document | Herewith | ||||||
| 101.SCH | XBRL Taxonomy Extension Schema | Herewith | ||||||
| 101.CAL | XBRL Taxonomy Extension Calculation Linkbase | Herewith | ||||||
| 101.DEF | XBRL Taxonomy Extension Definition Linkbase | Herewith | ||||||
| 101.LAB | XBRL Taxonomy Extension Label Linkbase | Herewith | ||||||
| 101.PRE | XBRL Taxonomy Extension Presentation Linkbase | Herewith |
* Management compensatory agreement.
† Certain portions of the exhibit have been omitted pursuant to a confidential treatment order. An unredacted copy of the exhibit has been filed separately with the United States Securities and Exchange Commission pursuant to the request for confidential treatment.
†† Certain portions of the exhibit have been omitted pursuant to a request for confidential treatment. An unredacted copy of the exhibit has been filed separately with the United States Securities and Exchange Commission pursuant to a request for confidential treatment.
| 54 |
Pursuant to the requirements of Section 13 or 15(d) of the Securities Exchange Act of 1934, as amended, the registrant has duly caused this Annual Report on Form 10-K to be signed on its behalf by the undersigned, thereunto duly authorized on March 14, 2016.
| LINDBLAD EXPEDITIONS HOLDINGS, INC. | ||
| (Registrant) | ||
| By: | /s/ Sven-Olof Lindblad | |
| Sven-Olof Lindblad | ||
| Chief Executive Officer and President | ||
| (Principal Executive Officer) | ||
Pursuant to the requirements of the Securities Exchange Act of 1934, as amended, this report has been signed below by the following persons on behalf of the registrant and in the capacities and on the dates indicated.
| Signature | Title | Date | ||
| /s/ Sven-Olof Lindblad | Chief Executive Officer and Director | March 14, 2016 | ||
| Sven-Olof Lindblad | (Principal Executive Officer) | |||
| /s/ John T. McClain | Chief Financial Officer | March 14, 2016 | ||
| John T. McClain | (Principal Financial and Accounting Officer) | |||
| /s/ Bernard W. Aronson | Director | March 14, 2016 | ||
| Bernard W. Aronson | ||||
| /s/ Paul J. Brown | Director | March 14, 2016 | ||
| Paul J. Brown | ||||
| /s/ L. Dyson Dryden | Director | March 14, 2016 | ||
| L. Dyson Dryden | ||||
| /s/ Mark D. Ein | Chairman of the Board | March 14, 2016 | ||
| Mark D. Ein | ||||
| /s/ John M. Fahey Jr. | Director | March 14, 2016 | ||
| John M. Fahey Jr. |
| 55 |
LINDBLAD EXPEDITIONS HOLDINGS, INC.
INDEX TO CONSOLIDATED FINANCIAL STATEMENTS
| F-1 |
REPORT OF INDEPENDENT REGISTERED PUBLIC ACCOUNTING FIRM
To the Audit Committee of the
Board of Directors and Shareholders
of Lindblad Expeditions Holdings, Inc.
We have audited the accompanying consolidated balance sheets of Lindblad Expeditions Holdings, Inc. and Subsidiaries (the “Company”) as of December 31, 2015 and 2014, and the related consolidated statements of income, shareholders’ equity and cash flows for the years ended December 31, 2015, 2014 and 2013. These consolidated financial statements are the responsibility of the Company’s management. Our responsibility is to express an opinion on these consolidated financial statements based on our audits.
We conducted our audits in accordance with the standards of the Public Company Accounting Oversight Board (United States). Those standards require that we plan and perform the audits to obtain reasonable assurance about whether the consolidated financial statements are free of material misstatement. The Company is not required to have, nor were we engaged to perform, an audit of its internal control over financial reporting. Our audits included consideration of internal control over financial reporting as a basis for designing audit procedures that are appropriate in the circumstances, but not for the purpose of expressing an opinion on the effectiveness of the Company’s internal control over financial reporting. Accordingly, we express no such opinion. An audit also includes examining, on a test basis, evidence supporting the amounts and disclosures in the consolidated financial statements, assessing the accounting principles used and significant estimates made by management, as well as evaluating the overall financial statement presentation. We believe that our audits provide a reasonable basis for our opinion.
In our opinion, the consolidated financial statements referred to above present fairly, in all material respects, the financial position of Lindblad Expeditions Holdings, Inc. and Subsidiaries, as of December 31, 2015 and 2014, and the results of its operations and its cash flows for the years ended December 31, 2015, 2014 and 2013 in conformity with accounting principles generally accepted in the United States of America.
/s/ Marcum LLP
Marcum LLP
Melville, NY
March 14, 2016
| F-2 |
Lindblad Expeditions Holdings, Inc.
Consolidated Balance Sheets
(In thousands, except share data)
| As of December 31, | ||||||||
| 2015 | 2014 | |||||||
| ASSETS | ||||||||
| Current Assets: | ||||||||
| Cash and cash equivalents | $ | 206,903 | $ | 39,679 | ||||
| Restricted cash and marketable securities | 8,460 | 8,335 | ||||||
| Inventories | 1,746 | 1,700 | ||||||
| Marine operating supplies | 4,969 | 5,078 | ||||||
| Prepaid expenses and other current assets | 12,266 | 11,321 | ||||||
| Total current assets | 234,344 | 66,113 | ||||||
| Property and equipment, net | 125,471 | 121,873 | ||||||
| Due from shareholder | - | 1,501 | ||||||
| Other long-term assets | 12,355 | 2,019 | ||||||
| Operating rights | 6,227 | 6,529 | ||||||
| Deferred tax assets | 3,216 | 102 | ||||||
| Investment in CFMF | - | 47,788 | ||||||
| Total assets | $ | 381,613 | $ | 245,925 | ||||
| LIABILITIES | ||||||||
| Current Liabilities: | ||||||||
| Unearned passenger revenues | $ | 76,604 | $ | 73,195 | ||||
| Accounts payable and accrued expenses | 25,968 | 20,028 | ||||||
| Long-term debt - current | 1,750 | 4,934 | ||||||
| Obligation to repurchase shares of common stock | - | 4,966 | ||||||
| Due to CFMF | - | 22,733 | ||||||
| Total current liabilities | 104,322 | 125,856 | ||||||
| Long-term debt, less current portion | 162,693 | 51,756 | ||||||
| Other long-term liabilities | 677 | 447 | ||||||
| Deferred income taxes - long-term | - | 299 | ||||||
| Total liabilities | 267,692 | 178,358 | ||||||
| COMMITMENTS AND CONTINGENCIES | ||||||||
| SHAREHOLDERS’ EQUITY | ||||||||
| Preferred stock, $0.0001 par value, 1,000,000 shares authorized; 0 shares issued and outstanding | - | - | ||||||
| Common stock, $0.0001 par value, 200,000,000 shares authorized; 45,224,881 and 44,717,759 issued and outstanding as of December 31, 2015 and 2014, respectively | 5 | 5 | ||||||
| Additional paid-in capital | 48,073 | 21,461 | ||||||
| Retained earnings | 65,843 | 46,101 | ||||||
| Total shareholders' equity | 113,921 | 67,567 | ||||||
| Total liabilities and shareholders' equity | $ | 381,613 | $ | 245,925 | ||||
The
accompanying notes are an integral part of these consolidated financial statements.
| F-3 |
Lindblad Expeditions Holdings, Inc.
Consolidated Statements of Income
(In thousands, except per share data)
| For the Years Ended December 31, | ||||||||||||
| 2015 | 2014 | 2013 | ||||||||||
| Tour revenues | $ | 209,985 | $ | 198,459 | $ | 192,237 | ||||||
| Cost of tours | 95,417 | 90,002 | 96,655 | |||||||||
| Gross profit | 114,568 | 108,457 | 95,582 | |||||||||
| Operating expenses: | ||||||||||||
| General and administrative | 39,097 | 36,053 | 30,431 | |||||||||
| Selling and marketing | 34,980 | 30,718 | 29,984 | |||||||||
| Merger-related expenses | 13,344 | - | - | |||||||||
| Depreciation and amortization | 11,645 | 11,266 | 11,645 | |||||||||
| Total operating expenses | 99,066 | 78,037 | 72,060 | |||||||||
| Operating income | 15,502 | 30,420 | 23,522 | |||||||||
| Other (expense) income: | ||||||||||||
| Change in fair value of obligation to repurchase shares of common stock | - | 10 | (401 | ) | ||||||||
| (Loss) gain on foreign currency | (40 | ) | (149 | ) | 1,281 | |||||||
| Gain on transfer of assets | 7,502 | - | - | |||||||||
| Other income, net | 5,030 | 57 | 1 | |||||||||
| Interest expense, net | (10,901 | ) | (5,293 | ) | (7,896 | ) | ||||||
| Total other income (expense) | 1,591 | (5,375 | ) | (7,015 | ) | |||||||
| Income before income taxes | 17,093 | 25,045 | 16,507 | |||||||||
| Income tax (benefit) expense | (2,649 | ) | 2,800 | 1,663 | ||||||||
| Net income | $ | 19,742 | $ | 22,245 | $ | 14,844 | ||||||
| Common stock | ||||||||||||
| Net income available to common stockholders | $ | 19,742 | $ | 19,551 | $ | 12,988 | ||||||
| Weighted average shares outstanding | ||||||||||||
| Basic | 44,917,829 | 44,717,759 | 44,717,759 | |||||||||
| Diluted | 45,575,387 | 44,717,759 | 44,717,759 | |||||||||
| Earnings per share | ||||||||||||
| Basic | $ | 0.44 | $ | 0.44 | $ | 0.29 | ||||||
| Diluted | $ | 0.43 | $ | 0.44 | $ | 0.29 | ||||||
| Class B common stock | ||||||||||||
| Net income available to Class B common stockholders | $ | - | $ | 2,694 | $ | 1,856 | ||||||
| Weighted average shares outstanding | ||||||||||||
| Basic | - | 6,161,135 | 6,388,677 | |||||||||
| Diluted | - | 6,161,135 | 6,388,677 | |||||||||
| Earnings per share | ||||||||||||
| Basic | $ | - | $ | 0.44 | $ | 0.29 | ||||||
| Diluted | $ | - | $ | 0.44 | $ | 0.29 | ||||||
The
accompanying notes are an integral part of these consolidated financial statements.
| F-4 |
Lindblad Expeditions Holdings, Inc.
Consolidated Statement of Shareholders’ Equity
(In thousands)
| Accumulated | ||||||||||||||||||||||||||||||||
| Class B | Additional | Other | Total | |||||||||||||||||||||||||||||
| Common Stock | Common Stock | Paid-In | Retained | Comprehesive | Shareholders' | |||||||||||||||||||||||||||
| Shares | Amount | Shares | Amount | Capital | Earnings | Income | Equity | |||||||||||||||||||||||||
| Balance as of December 31, 2012 | 44,717,759 | $ | 5 | 6,388,677 | $ | - | $ | 43,990 | $ | 9,012 | $ | 156 | $ | 53,163 | ||||||||||||||||||
| Distribution to CFMF - common acquisition of FPH | - | - | - | - | (12,278 | ) | - | (187 | ) | (12,465 | ) | |||||||||||||||||||||
| Change in comprehensive income | - | - | - | - | - | - | 31 | 31 | ||||||||||||||||||||||||
| Net income | - | - | - | - | - | 14,844 | - | 14,844 | ||||||||||||||||||||||||
| Balance as of December 31, 2013 | 44,717,759 | 5 | 6,388,677 | - | 31,712 | 23,856 | - | 55,573 | ||||||||||||||||||||||||
| Stock-based compensation - option shares | - | - | - | - | 274 | - | - | 274 | ||||||||||||||||||||||||
| Repurchase of Class B shares | - | - | (6,388,677 | ) | - | (10,525 | ) | - | - | (10,525 | ) | |||||||||||||||||||||
| Net income | - | - | - | - | - | 22,245 | - | 22,245 | ||||||||||||||||||||||||
| Balance as of December 31, 2014 | 44,717,759 | 5 | - | - | 21,461 | 46,101 | - | 67,567 | ||||||||||||||||||||||||
| Stock-based compensation - option shares | - | - | - | - | 4,913 | - | - | 4,913 | ||||||||||||||||||||||||
| CFMF transaction cancellation of warrant | - | - | - | - | (83,467 | ) | - | - | (83,467 | ) | ||||||||||||||||||||||
| Obligation to repurchase shares of common stock | - | - | - | - | 4,966 | - | - | 4,966 | ||||||||||||||||||||||||
| Merger recapitalization | - | - | - | - | 200,558 | - | - | 200,558 | ||||||||||||||||||||||||
Payments to shareholders for merger | - | - | - | - | (90,000 | ) | - | - | (90,000 | ) | ||||||||||||||||||||||
| Option shares exercise and exchange | 507,122 | - | - | - | (4,880 | ) | - | - | (4,880 | ) | ||||||||||||||||||||||
| Repurchase of warrants | - | - | - | - | (5,478 | ) | - | - | (5,478 | ) | ||||||||||||||||||||||
| Net income | - | - | - | - | - | 19,742 | - | 19,742 | ||||||||||||||||||||||||
| Balance as of December 31, 2015 | 45,224,881 | $ | 5 | - | $ | - | $ | 48,073 | $ | 65,843 | $ | - | $ | 113,921 | ||||||||||||||||||
The
accompanying notes are an integral part of these consolidated financial statements.
| F-5 |
Lindblad Expeditions Holdings, Inc.
Consolidated Statements of Cash Flows
(In thousands)
| For the Years Ended December 31, | ||||||||||||
| 2015 | 2014 | 2013 | ||||||||||
| Cash Flows From Operating Activities | ||||||||||||
| Net income | $ | 19,742 | $ | 22,245 | $ | 14,844 | ||||||
| Adjustments to reconcile net income to net cash provided by operating activities: | ||||||||||||
| Depreciation and amortization | 11,645 | 11,266 | 11,645 | |||||||||
| Amortization of National Geographic fee | 1,397 | - | - | |||||||||
| Amortization of debt discount and deferred financing costs | 3,576 | 744 | 2,142 | |||||||||
| Stock-based compensation | 4,913 | 274 | - | |||||||||
| Deferred income taxes | (3,413 | ) | 289 | (93 | ) | |||||||
| Loss (gain) on currency translation | 40 | 149 | (1,281 | ) | ||||||||
| Gain on transfer of assets | (7,502 | ) | - | - | ||||||||
| Change in fair value of obligation to repurchase shares of | ||||||||||||
| Class A common stock | - | - | 401 | |||||||||
| Changes in operating assets and liabilities | ||||||||||||
| Inventories and marine operating supplies | (163 | ) | (831 | ) | 334 | |||||||
| Prepaid expenses and other current assets | (1,100 | ) | (2,420 | ) | 2,173 | |||||||
| Unearned passenger revenues | 3,723 | 8,750 | 3,956 | |||||||||
| Other long-term liabilities | 230 | 184 | 119 | |||||||||
| Accounts payable and accrued expenses | 7,214 | 2,404 | (943 | ) | ||||||||
| Net cash provided by operating activities | 40,302 | 43,054 | 33,297 | |||||||||
| Cash Flows From Investing Activities | ||||||||||||
| Purchase of investment in CFMF | (68,087 | ) | (25,055 | ) | - | |||||||
| Acquisition of Fillmore, net of cash acquired | - | - | (3,835 | ) | ||||||||
| Purchase of property and equipment | (14,800 | ) | (5,922 | ) | (6,353 | ) | ||||||
| Advance from (to) shareholder | 1,501 | 517 | (94 | ) | ||||||||
| (Redemption) purchase of restricted cash and marketable securities | (125 | ) | 1,458 | (23 | ) | |||||||
| Net cash used in investing activities | (81,511 | ) | (29,002 | ) | (10,305 | ) | ||||||
| Cash Flows From Financing Activities | ||||||||||||
| Proceeds from long-term debt | 175,000 | - | - | |||||||||
| Net proceeds from merger | 186,806 | - | - | |||||||||
Payments to shareholders for the merger | (90,000 | ) | - | - | ||||||||
| Deferred financing costs | (11,045 | ) | - | (653 | ) | |||||||
| Repayments of Participation Certificates | - | - | (3,550 | ) | ||||||||
| Repayments of long-term debt | (41,879 | ) | (3,989 | ) | (13,392 | ) | ||||||
| Proceeds used in exchange of option shares | (4,880 | ) | - | - | ||||||||
| Repurchase of warrants | (5,478 | ) | - | - | ||||||||
| Repurchase of stock from common shareholders | - | (1,876 | ) | - | ||||||||
| Repurchase of stock from Class B shareholders | - | (10,525 | ) | - | ||||||||
| Repayment of due to stockholder | - | (1,000 | ) | - | ||||||||
| Net cash provided by (used in) financing activities | 208,524 | (17,390 | ) | (17,595 | ) | |||||||
| Effect of exchange rate changes on cash | (91 | ) | (1,337 | ) | (1,550 | ) | ||||||
| Net increase (decrease) in cash and cash equivalents | 167,224 | (4,675 | ) | 3,847 | ||||||||
| Cash and cash equivalents as of beginning of period | 39,679 | 44,354 | 40,507 | |||||||||
| Cash and cash equivalents as of end of period | $ | 206,903 | $ | 39,679 | $ | 44,354 | ||||||
Continued
| F-6 |
Lindblad Expeditions Holdings, Inc.
Consolidated Statements of Cash Flows-Continued
(In thousands)
| For the Years Ended December 31, | ||||||||||||
| 2015 | 2014 | 2013 | ||||||||||
| Supplemental disclosures of cash flow information: | ||||||||||||
| Cash paid during the period for: | ||||||||||||
| Interest | $ | 7,003 | $ | 4,844 | $ | 5,231 | ||||||
| Income taxes | $ | 379 | $ | 1,102 | $ | 1,575 | ||||||
| Non-cash investing and financing activities: | ||||||||||||
| Acquisition of Fillmore: | ||||||||||||
| Assets acquired and liabilities assumed: | ||||||||||||
| Current assets, including cash acquired | $ | - | $ | - | $ | 6,488 | ||||||
| Property and equipment | - | - | 53,302 | |||||||||
| Unearned passenger revenues | - | - | (12,332 | ) | ||||||||
| Accounts payable and accrued expenses | - | - | (3,459 | ) | ||||||||
| Total purchase price consideration | - | - | 43,999 | |||||||||
| Cash paid to acquire Fillmore | - | - | (5,000 | ) | ||||||||
| Non-cash consideration | $ | - | $ | - | $ | 38,999 | ||||||
| Non-cash consideration consisted of: | ||||||||||||
| Long-term debt | $ | - | $ | - | $ | 25,000 | ||||||
| Equity contribution from CFMF | - | - | 13,823 | |||||||||
| Contribution during the year ended December 31, 2012 | - | - | (26,100 | ) | ||||||||
| Equity (distribution) contribution to CFMF | $ | - | $ | - | $ | (12,277 | ) | |||||
| Investment to CFMF | $ | - | $ | 22,733 | $ | - | ||||||
| Due to CFMF | - | (22,733 | ) | - | ||||||||
| Investment in CFMF liquidation of Junior debt asset, warrant | 84,903 | - | - | |||||||||
| CFMF liquidation of Junior debt long-term debt, additional paid-in capital | (84,903 | ) | - | - | ||||||||
| Transfer from inventories and marine operating supplies | (414 | ) | - | - | ||||||||
| Transfer to property and equipment, net | 414 | - | - | |||||||||
| Additional paid-in capital exercise proceeds of option shares | 2,240 | - | - | |||||||||
| Additional paid-in capital exchange proceeds used for option shares | (2,240 | ) | - | - | ||||||||
The accompanying notes are an integral part of these consolidated financial statements.
| F-7 |
Lindblad Expeditions Holdings, Inc.
Notes to the Consolidated Financial Statements
NOTE 1 – BUSINESS
Organization
Lindblad Expeditions Holdings, Inc. and its wholly-owned subsidiaries (the “Company” or “LEX”) currently operate a fleet of six expedition ships owned by its subsidiaries and four seasonal charter vessels. LEX’s mission is offering life-changing adventures on all seven continents, and pioneering innovative ways to allow its guests to connect with exotic and remote places. LEX’s expedition ships are customized, nimble and intimately-scaled vessels that are able to venture where larger cruise ships cannot, thus allowing LEX to offer up-close experiences in the planet’s wild and remote places and capitals of culture. Many of these expeditions involve travel to remote places with limited infrastructure and ports (such as Antarctica and the Arctic) or places that are best accessed by a ship (such as the Galápagos, Alaska, Baja’s Sea of Cortez, Costa Rica, and Panama), and foster active engagement by guests. Each expedition ship is designed to be comfortable and inviting, while being fully equipped with state-of-the-art tools for in-depth exploration. The Company also has an alliance with the National Geographic Society (“National Geographic”), who often provides lecturers and National Geographic experts, including photographers, writers, marine biologists, naturalists, field researchers and film crews.
Lindblad Expeditions, Inc. (“Lindblad”), a New York corporation, was founded in 1979 by Sven-Olof Lindblad (“Mr. Lindblad”), whose father, adventure-travel pioneer Lars-Eric Lindblad, led some of the first non-scientific groups of travelers to Antarctica in 1966 and the Galápagos in 1967. Mr. Lindblad founded Lindblad in order to offer innovative and educational travel expeditions to the world’s most remarkable places.
Completion of Merger with Capitol
Capitol Acquisition Corp. II (“Capitol”) was originally incorporated in Delaware on August 9, 2010 as a blank check company to acquire, through a merger, share exchange, asset acquisition, stock purchase, plan of arrangement, recapitalization, reorganization or other similar business combination, one or more businesses or entities.
On July 8, 2015, Capitol completed a series of mergers whereby Lindblad became Capitol’s wholly-owned subsidiary. As consideration for the mergers, the total purchase price consisted of an aggregate of (i) $90.0 million in cash (a portion of which was paid as transaction bonuses) and (ii) 20,017,787 shares of Capitol common stock. Capitol also assumed outstanding Lindblad stock options and converted such options into options to purchase an aggregate of 3,821,696 shares of Capitol common stock with an exercise price of $1.76 per share (see Note 12 – Shareholders’ Equity). The Company has completed an analysis of the ownership change under Internal Revenue Code Section 382, and it allows the Company to utilize Capitol’s net operating losses with minor limitations.
As a result of the mergers, Lindblad became a direct wholly-owned subsidiary of Capitol. Immediately following the mergers, Capitol, which was a blank check company with no operations, changed its name to Lindblad Expeditions Holdings, Inc. and therefore we have presented Lindblad’s information as that of the Company.
The Company’s common stock and warrants are listed on The NASDAQ Capital Market under the symbols “LIND” and “LINDW,” respectively.
Capitol Initial Public Offering and Warrants
In connection with its initial public offering, on May 15, 2013, Capitol sold 20,000,000 units at $10.00 per unit, including 2,000,000 units under the underwriters’ over-allotment option, generating gross proceeds of $200.0 million. Each unit consisted of one share of Capitol’s common stock, $0.0001 par value, and one half of one redeemable warrant to purchase one share of common stock. The shares of common stock and the warrants included in the units traded as a unit until July 1, 2013 when separate trading of common stock and warrants began. In connection with the consummation of the merger with Lindblad, Capitol forced the separation of the units into the separate components of common stock and warrants. Each whole warrant entitles its holder, upon exercise, to purchase one share of common stock for $11.50 subject to certain adjustments, during the period that commenced thirty days after the completion by the Company of the Business Combination with Lindblad and terminating on the five-year anniversary of the completion by the Company of the Business Combination with Lindblad. At December 31, 2015, there were 14,008,382 warrants outstanding.
| F-8 |
The warrants may be redeemed by the Company, at its option, in whole and not in part, at a price of $0.01 per warrant at any time the warrants are exercisable, upon a minimum of 30 days’ prior written notice of redemption, if, and only if, the last sales price of the Company’s shares of common stock equals or exceeds $24.00 per share (as adjusted for stock splits, stock dividends, reorganizations and recapitalizations) for any 20 trading days within a 30 trading day period ending three business days before the Company sends the redemption notice; and if, and only if, there is a current registration statement in effect with respect to the shares of common stock underlying such warrants.
If the Company calls the warrants for redemption as described above, the Company’s management will have the option to require all holders that wish to exercise warrants to do so on a “cashless basis.” In such event, each holder would pay the exercise price by surrendering the warrants for that number of shares of common stock equal to the quotient obtained by dividing (x) the product of the number of shares of common stock underlying the warrants, multiplied by the difference between the exercise price of the warrants and the fair market value by (y) the fair market value. The fair market value will mean the average reported last sale price of the shares of common stock for the five trading days ending on the third trading day prior to the date on which the notice of redemption is sent to the holders of warrants.
Certain of the outstanding warrants were privately acquired from the Company by Capitol’s sponsor and certain of the Company’s initial officers and directors and are identical to the warrants included in the units sold in the offering except that such warrants: (i) are not be redeemable by the Company and (ii) may be exercised for cash or on a cashless basis, in each case so long as they are held by the initial purchasers or any of their permitted transferees.
New Credit Agreement
On May 8, 2015, Lindblad entered into a new credit agreement with Credit Suisse A.G. (“Credit Suisse”) as Administrative Agent and Collateral Agent (“Credit Agreement”) for a $150.0 million facility in the form of a $130.0 million U.S. term loan (the “U.S. Term Loan”) and a $20.0 million Cayman term loan for the benefit of Lindblad’s foreign subsidiaries (the “Cayman Loan,” and together with the U.S. Term Loan, the “Loans”). On July 8, 2015, the Company entered into a larger and syndicated amended and restated credit agreement with Credit Suisse (“Amended Credit Agreement”), increasing the facility by $25.0 million, resulting in a $155.0 million U.S. Term Loan. On March 7, 2016, the Company entered into a second amended and restated credit agreement with Credit Suisse (“Restated Credit Agreement”), adding a $45.0 million revolving credit facility (“Revolving Credit Facility”). See Note – Long-Term Debt for more details.
Stock and Warrant Repurchase Plan
On November 9, 2015, the Company announced that its Board of Directors has approved a $20.0 million stock and warrant repurchase plan (“Repurchase Plan”). This Repurchase Plan authorizes the Company to purchase from time to time the Company’s outstanding common stock and warrants through open market repurchases in compliance with Rule 10b-18 of the Securities Exchange Act of 1934, as amended, and/or in privately negotiated transactions discretion based on market and business conditions, applicable legal requirements and other factors. Any shares and warrants purchased will be retired. The Repurchase Plan has no time deadline and will continue until otherwise modified or terminated at the sole discretion of the Company’s Board of Directors at any time. The Company repurchased 2,091,618 warrants in the fourth quarter of 2015 for $5.5 million. In January 2016, the Company repurchased 1,967,445 warrants for $5.4 million.
| F-9 |
NOTE 2 – SUMMARY OF SIGNIFICANT ACCOUNTING POLICIES
Basis of Presentation
The accompanying consolidated financial statements and footnotes as of December 31, 2015 and 2014 and for the years ended December 31, 2015, 2014 and 2013 have been prepared in accordance with accounting principles generally accepted in the United States of America (“U.S. GAAP”).
The merger with Lindblad has been accounted for as a reverse acquisition in accordance with U.S. GAAP, Financial Accounting Standards Board (“FASB”), Accounting Standards Codification (“ASC”) 805-40-45. Under this method of accounting, Capitol has been treated as the “acquired” company for financial reporting purposes. This determination was primarily based on Lindblad comprising the ongoing operations and assets of the combined entity and Lindblad senior management comprising the senior management of the combined company. In accordance with guidance applicable to these circumstances, the merger has been considered to be a capital transaction in substance. Accordingly, for accounting purposes, the merger has been treated as the equivalent of Lindblad issuing shares for the net assets of Capitol, accompanied by a recapitalization. The net assets of Capitol have been stated at historical cost, with no goodwill or other intangible assets recorded. Operations prior to the merger are those of Lindblad. Additionally, the historical financial statements of Lindblad are now reflected as those of the Company.
Principles of Consolidation
The consolidated financial statements of the Company as of December 31, 2015 included Lindblad Expeditions Holdings, Inc. and its wholly-owned subsidiaries. The consolidated financial statements of the Company as of December 31, 2014 and 2013 included Lindblad, its wholly-owned subsidiary, Lindblad Maritime Enterprises, Ltd (“LME”), a Cayman Islands corporation, as well as the subsidiaries of LME, and Sea Lion and Sea Bird as variable interest entities (“VIEs”). Lindblad controlled the activities which most significantly impacted the economic performance of Sea Lion and Sea Bird. Lindblad determined itself to be the primary beneficiary and accordingly, these entities were determined to be VIEs. All significant inter-company accounts and transactions have been eliminated in consolidation. The VIEs were transferred to Lindblad and became wholly-owned subsidiaries of the Company at the merger date, July 8, 2015.
Reclassifications
Certain items in the consolidated financial statements of the Company have been reclassified to conform to the 2015 classification. The reclassifications had no effect on previously reported results of operations or retained earnings.
Use of Estimates
The preparation of consolidated financial statements in conformity with U.S. GAAP requires management to make estimates and assumptions that affect the reported amounts of assets and liabilities and the disclosure of contingent assets and liabilities as of the date of the consolidated financial statements, and also affect the amounts of revenues and expenses reported for each period. Actual results could differ from those which result from using such estimates. Management utilizes various estimates, including but not limited to determining the estimated lives of long-lived assets, determining the fair value of assets acquired and liabilities assumed in business combinations, the fair value of the Company’s common stock and related warrants, the valuation of securities underlying stock-based compensation, income tax expense, the valuation of deferred tax assets, the value of contingent consideration and to assess its litigation, other legal claims and contingencies. The results of any changes in accounting estimates are reflected in the consolidated financial statements in the period in which the changes become evident. Estimates and assumptions are reviewed periodically and the effects of revisions are reflected in the period that they are determined to be necessary.
Revenue Recognition
Tour revenues consist of guest ticket revenues recognized from the sale of guest tickets, and other revenues from the sale of pre- and post-expedition excursions, hotel accommodations, land-based expeditions, air transportation to and from the ships, goods and services rendered onboard that are not included in guest ticket prices, trip insurance, and cancellation fees. Revenue from the sale of guest tickets and other revenue are recognized gross, as the Company has the primary obligation in the arrangement, has discretion in supplier selection, and is involved in the determination of the service specifications.
| F-10 |
The Company’s tour guests remit deposits in advance of tour embarkation. Guest tour deposits consist of guest ticket revenues as well as revenues from the sale of pre- and post-expedition excursions, hotel accommodations, land-based expeditions, air transportation to and from the ships and trip insurance. Guest tour deposits represent unearned revenues and are initially included in unearned passenger revenue in the consolidated balance sheet when received. Guest deposits are subsequently recognized as tour revenues on the date of embarkation. Tour expeditions average ten days in duration. For tours in excess of ten days, the Company recognizes revenue based upon expeditions days earned. Guest cancellation fees are recognized as tour revenues at the time of the cancellation. Revenues from the sale of additional goods and services rendered onboard are recognized upon purchase.
Insurance
The Company maintains insurance to cover a number of risks including illness and injury to crew, guest injuries, pollution, other third-party claims in connections with its tour expedition activities, damages to hull and machinery for each of its vessels, war risks, workers’ compensation, employee health, directors and officers liability, property damages and general liabilities for third-party claims. The Company recognizes insurance recoverables from third-party insurers for incurred expenses at the time the recovery is probable and upon realization for amounts in excess of incurred expenses. All of the Company’s insurance policies are subject to coverage limits, exclusions and deductible levels.
The Company self-insures for medical insurance claims up to $60,000 and cancellation insurance extended to guests. The Company has Stop Loss coverage for medical claims in excess of the $60,000 amount. In 2015, the Company recorded a liability for Incurred-But-Not-Recorded (“IBNR”) medical claims, which was determined based on claims experience over the prior three years. The Company uses an insurance company to manage passenger insurance purchased to cover a variety of insurable losses including cancellations, interruption, missed connections, travel delays, accidental death and dismemberment, medical coverage and baggage issues. The Company is self-insured for the claims only which cover cancellations, interruption, missed connections and travel delays. The required reserve was determined based on claims experience over the prior four years. While the Company believes its estimated IBNR and accrued claims reserves are adequate, the ultimate losses may differ.
The Company participates in a traditional marine industry reinsurance solution for liability exposure through their Protection and Indemnity (“P&I Club”) Reinsurers, which are similar mutual marine P&I Club’s that join and severally indemnify each other to provide discounted primary and excess Protection and Indemnity coverage to club members. The resulting aggregated surplus of the clubs combines to provide the Company with below market primary and high excess liability coverage for covered losses. For consideration of long-term below market P&I rates, the joint and several liability obligation requires the down stream indemnification by their members, including the Company.
Selling and Administrative Expense
Selling expenses include commissions and a broad range of advertising and marketing expenses. These include direct mail, print and online advertising costs, as well as costs associated with website development and maintenance. Also included are social media and corporate sponsorship costs. Advertising is charged to expense as incurred. Advertising expenses totaled $12.9 million, $12.5 million and $12.1 million for the years ended December 31, 2015, 2014 and 2013, respectively. The largest component of advertising expense was direct mail, which totaled $5.8 million, $5.8 million and $5.5 million for the years ended December 31, 2015, 2014 and 2013, respectively.
Administrative expenses represent the costs of our shore-side vessel support, reservations and other administrative functions, and incudes salaries and related benefits, professional fees, and occupancy costs, which are typically expensed as incurred.
| F-11 |
Earnings per Common Share
Earnings per common share are computed by dividing net income by the weighted average number of common shares outstanding during the period. Diluted earnings per share are computed using the weighted average number of common shares and, if dilutive, potential common shares outstanding during the period. Potential common shares consist of the dilutive incremental common shares issuable upon the exercise of stock options (if such option is an equity instrument, using the treasury stock method). For the year ended December 31, 2015, the Company determined, using the treasury method, there were 657,558 dilutive common shares related to stock options. For the years ended December 31, 2014 and 2013, the Company determined there were no dilutive potential common shares.
In 2014 and 2013, the two-class method was used in the calculation of basic and diluted earnings per share. Under the two-class method, earnings per common share were allocated to the Class A (common as a result of the merger) and Class B common shareholders of Lindblad based on the weighted average shares outstanding.
On July 8, 2015, as a result of the mergers, in accordance with FASB ASC 805-40-45 and related to the reverse merger treatment and recapitalization, all historical weighted average common shares were adjusted by the exchange ratios established by the merger agreement.
Weighted average shares outstanding after the mergers excluded the shares underlying the outstanding warrants. The warrants have an exercise price of $11.50 per share and were anti-dilutive.
Basic weighted average shares outstanding prior to the mergers included the shares underlying a warrant to purchase 60% of the outstanding common shares. As the shares underlying this warrant could have been issued for little consideration (an aggregate exercise price of $10.00), these shares were formerly deemed to be issued for purposes of basic earnings per share. Effective May 8, 2015, in connection with Lindblad closing on a transaction to purchase 100% of Cruise/Ferry Master Fund I, N.V. (“CFMF”), the warrant was cancelled. On July 8, 2015, as a result of the merger agreement, and the reverse merger treatment and recapitalization, these shares were not considered part of the recapitalization and therefore not included in basic or dilutive weighted average shares outstanding. For the years ended December 31, 2015, 2014 and 2013, the Company excluded 1,912,833 (converted from 6,747 shares as a result of the merger) shares of common stock as these shares were subject to the warrants described above.
| F-12 |
For the years ended December 31, 2015, 2014 and 2013, the Company calculated earnings per share in accordance with FASB ASC 260 and 805-40-45 as follows:
| For the Years Ended December 31, | ||||||||||||
| (In thousands, except per share data) | 2015 | 2014 | 2013 | |||||||||
| Net income for basic and diluted earnings per share | $ | 19,742 | $ | 22,245 | $ | 14,844 | ||||||
| Weighted average shares outstanding: | ||||||||||||
| Shares outstanding, weighted for time outstanding | 44,917,829 | 50,878,894 | 51,106,436 | |||||||||
| Total weighted average shares outstanding, basic | 44,917,829 | 50,878,894 | 51,106,436 | |||||||||
| Effect of dilutive securities: | ||||||||||||
| Assumed exercise of stock options, treasury method | 657,558 | - | - | |||||||||
| Dilutive potential common shares | 657,558 | - | - | |||||||||
| Total weighted average shares outstanding, diluted | 45,575,387 | 50,878,894 | 51,106,436 | |||||||||
| Common stock | ||||||||||||
| Net income available to common stockholders | $ | 19,742 | $ | 19,551 | $ | 12,988 | ||||||
| Weighted average shares outstanding | ||||||||||||
| Basic | 44,917,829 | 44,717,759 | 44,717,759 | |||||||||
| Diluted | 45,575,387 | 44,717,759 | 44,717,759 | |||||||||
| Earnings per share | ||||||||||||
| Basic | $ | 0.44 | $ | 0.44 | $ | 0.29 | ||||||
| Diluted | $ | 0.43 | $ | 0.44 | $ | 0.29 | ||||||
| Class B common stock | ||||||||||||
| Net income available to Class B common stockholders | $ | - | $ | 2,694 | $ | 1,856 | ||||||
| Weighted average shares outstanding | ||||||||||||
| Basic | - | 6,161,135 | 6,388,677 | |||||||||
| Diluted | - | 6,161,135 | 6,388,677 | |||||||||
| Earnings per share | ||||||||||||
| Basic | $ | - | $ | 0.44 | $ | 0.29 | ||||||
| Diluted | $ | - | $ | 0.44 | $ | 0.29 | ||||||
As of December 31, 2015, there were 45,224,881 shares outstanding. Upon completion of the mergers on July 8, 2015, the Company had 44,717,759 shares of common stock outstanding. The Company is authorized to issue 200,000,000 shares of common stock, par value $0.0001, and 1,000,000 shares of preferred stock, par value $0.0001. The Company’s Board of Directors adopted the 2015 Long-Term Incentive Plan (the “2015 Plan”), subject to shareholder approval, which was obtained on July 8, 2015. The 2015 Plan includes the authority to issue up to 2,500,000 shares of LEX’s common stock under the 2015 Plan. In connection with the mergers with Lindblad, certain stock options previously granted by Lindblad under the Lindblad Expeditions, Inc. 2012 Stock Incentive Plan (the “Lindblad Plan”) were assumed and converted into options to purchase shares of the Company’s common stock. As of December 31, 2015, options to purchase an aggregate of 2,849,071 shares of the Company’s common stock with a weighted average exercise price of $2.69 per share were outstanding. As of December 31, 2015, 14,008,382 warrants to purchase common stock at a price of $11.50 per share were outstanding.
Cash and Cash Equivalents
The Company considers all highly liquid instruments with an original maturity of three months or less, as well as deposits in financial institutions, to be cash and cash equivalents.
Concentration of Credit Risk
The Company maintains cash in several financial institutions in the U.S. and other countries which, at times, may exceed the federally insured limits. Accounts held in the U.S. are guaranteed by the Federal Deposit Insurance Corporation up to certain limits. The Company has not experienced any losses in such accounts. As of December 31, 2015 and 2014, the Company’s cash held in financial institutions outside of the U.S. amounted to $3.9 million and $2.5 million, respectively.
| F-13 |
Restricted Cash and Marketable Securities
Included in “Restricted cash and marketable securities” on the accompanying consolidated balance sheets are restricted cash and marketable securities, consisting of six-month certificates of deposit and short-term investments. Restricted cash and marketable securities consist of the following:
| As of December 31, | ||||||||
| (In thousands) | 2015 | 2014 | ||||||
| Restricted cash and marketable securities: | ||||||||
| Credit negotiation and credit card processor reserves | $ | 5,030 | $ | 5,030 | ||||
| Federal Maritime Commission escrow | 2,233 | 2,115 | ||||||
| Certificates of deposit and other restricted securities | 1,197 | 1,190 | ||||||
| Total restricted cash and marketable securities | $ | 8,460 | $ | 8,335 | ||||
The amounts held in restricted cash and marketable securities represent principally funds required to be held in certificates of deposit by certain vendors and regulatory agencies and are classified as restricted assets since such amounts cannot be used by the Company until the restrictions are removed by those vendors and regulatory agencies. Interest income is recognized when earned.
The Company has classified marketable securities, principally money market funds, as trading securities which are recorded at market value. Unrealized gains and losses are included in current operations. Gains and losses on the disposition of securities are recognized by the specific identification method in the period in which they occur.
In order to operate guest tour expedition vessels from U.S. ports, the Company is required to post a performance bond with the Federal Maritime Commission or escrow all unearned guest deposits in restricted accounts. To satisfy this requirement, the Company entered into an agreement with a financial institution to escrow all unearned guest revenues collected for sailings from U.S. ports.
A $5.0 million cash reserve at December 31, 2015 and 2014 is required for credit card deposits by third-party credit card processors. The above arrangements are included in restricted cash and marketable securities on the accompanying consolidated balance sheets.
Amounts in the escrow accounts include cash, certificates of deposit, and marketable securities. Cost of these short-term investments approximates fair value.
Inventories and Marine Operating Supplies
Inventories consist primarily of gift shop merchandise and other items for resale and are stated at the lower of cost or net realizable value. Cost is determined using the first-in, first-out method.
Marine operating supplies consist primarily of fuel, provisions, spare parts, items required for maintenance, and supplies used in the operation of marine expeditions. Marine operating supplies are stated at the lower of cost or net realizable value. Cost is determined using the first-in first-out method.
In the third quarter of 2015, the Company adjusted cost of tours by $0.3 million due to a change in application of accounting procedures, and reclassified $0.4 million in items from inventories and marine operating supplies to property and equipment, net. The change in application of accounting procedures was a result of the Company’s review of its inventory process during the third quarter which found the counting of certain small supply items a disruption to operations, impractical and expensive and discontinued the count of these items in the third quarter and in the future.
| F-14 |
Prepaid Expenses and Other Current Assets
The Company records prepaid expenses and other current assets at cost and expenses them in the period the services are provided or the goods are delivered. The Company’s prepaid expenses and other current assets consist of the following:
| As of December 31, | ||||||||
| (In thousands) | 2015 | 2014 | ||||||
| Prepaid tour expenses | $ | 5,269 | $ | 5,181 | ||||
| Prepaid client insurance | 1,706 | 1,663 | ||||||
| Prepaid air expense | 1,379 | 856 | ||||||
| Prepaid port agent fees | 1,080 | 827 | ||||||
| Prepaid taxes | 938 | 653 | ||||||
| Prepaid corporate insurance | 673 | 523 | ||||||
| Other prepaid expenses and other current assets | 1,221 | 1,618 | ||||||
| Total prepaid expenses and other current assets | $ | 12,266 | $ | 11,321 | ||||
Property and Equipment
Property and equipment are stated at cost less accumulated depreciation and amortization. Depreciation and amortization were computed using the straight line method over the estimated useful lives of the assets, as follows:
| Years | ||
| Vessels and vessel improvements | 15-25 | |
| Furniture & equipment | 5 | |
| Computer hardware and software | 5 | |
| Leasehold improvements, including port facilities | Shorter of lease term or related asset life |
The tour and expedition industry is very capital intensive and as of December 31, 2015 and 2014, the Company owned and operated six vessels. Therefore, the Company has a capital program that it develops for the improvement of its vessels and for asset replacements in order to enhance the effectiveness and efficiency of its operations; comply with, or exceed all relevant legal and statutory requirements related to health, environment, safety, security and sustainability; and gain strategic benefits or provide newer improved product innovations to its guests.
Vessel improvement costs that add value to the Company’s vessels, such as those discussed above, are capitalized to the vessels and depreciated over the shorter of the improvements or the vessel’s estimated remaining useful life, while costs of repairs and maintenance, including minor improvement costs and drydock expenses, are charged to expense as incurred and included in other vessels operating expenses. Drydock costs primarily represent planned major maintenance activities that are incurred when a vessel is taken out of service for scheduled maintenance. For U.S. flagged ships, the statutory requirement is an annual docking and U.S. Coast Guard inspections, normally conducted in drydock. Internationally flagged ships have scheduled dockings approximately every 12 months, for a period of up to three to six weeks.
Long-Lived Assets
The Company reviews its long-lived assets, principally its vessels and operating rights, for impairment whenever events or changes in circumstances indicate that the carrying amounts of these assets may not be fully recoverable. Upon the occurrence of a triggering event, the assessment of possible impairment is based on the Company’s ability to recover the carrying value of its asset, which is determined by using the asset’s estimated undiscounted future cash flows. If these estimated undiscounted future cash flows are less than the carrying value of the asset, an impairment charge is recognized for the excess, if any, of the asset’s carrying value over its estimated fair value. A significant amount of judgment is required in estimating the future cash flows and fair values of its vessels and operating rights.
| F-15 |
As of December 31, 2015 and 2014, there was no triggering event and the Company did not record an impairment of its long-lived assets. The Company reviewed the remaining useful life of the National Geographic Endeavour, which is expected to be replaced by the Via Australis in the fourth quarter of 2016. The evaluation of the National Geographic Endeavour’s useful life as of December 31, 2015 indicated a shorter remaining useful life of less than one year versus the previous estimated remaining useful life of seven years (see Note 5 – Property and Equipment). The Company also does not expect any residual value for the National Geographic Endeavour after the end of the fourth quarter of 2016. The Company also evaluated a new law in Ecuador and its effect on our Operating rights. As a result of the new law, the life of the cupos changed from indefinite lives to nine years and amortization of operating rights began in August 2015 (see Note 4 – Operating Rights).
Operating Rights
The Company operates two vessels year-round in the Galápagos National Park in Ecuador; the National Geographic Endeavour with 95 berths and the National Geographic Islander with 47 berths. In order to operate these vessels within the park, the Company is required to have in its possession cupos (licenses) sufficient to cover the total available berths on each vessel.
In June 2015, a new Ecuadorian Special Law for Protected Areas was approved and updated in November 2015. A Presidential Decree issued by President Correa of Ecuador in November 2015 established that cupos, which were in effect as of July 2015, will have a validity of nine years. The Company’s operating rights are up for renewal in July 2024 and based on the new law, the Company will begin the renewal process in 2020. The current “owners” of the cupos will have the opportunity to re-apply for them, but any other enterprise or individual will have the opportunity to bid for the cupos. All bidders must present proof that they fulfill the conditions to properly utilize the license (access to a vessel, experience in tourism, proven environmental behavior, marketing, etc.). While the Company believes that, based on the expected criteria to retain cupos and its past operating history in the Galápagos, there is a strong possibility that the Company will retain its cupos, from an accounting perspective, it will assume they retain no value after July 2024. Once the renewal process is begun and if it can be determined that the Company will be successful in its bid, then the Company will adjust its amortization prospectively.
Investment in CFMF and Additional Paid-In Capital
The Company uses the equity method of accounting for business investments when it has active involvement, but not control, in the venture. In 2015, the Company changed its accounting treatment for the investment in CFMF to the cost method and derecognized any earnings previously reported in the current year and adjusted the treatment of the CFMF transaction.
On March 3, 2009, Lindblad issued a note payable to Cruise/Ferry Master Fund I, N.V. (see Note 8 – Long-Term Debt). On December 11, 2014, Lindblad entered into a Profit Participation Loan Purchase Agreement with DVB Bank America, N.V. (“DVB”), a Profit Participation Rights Purchase Agreement with Buss Kreuzfahrtfonds 1 GmbH & Co. KG and Buss Kreuzfahrtfonds 2 GmbH & Co. KG, and a Stock Purchase Agreement with Cruise/Ferry Finance Partners Private Foundation. These three agreements enabled Lindblad to purchase the financial and equity interests in CFMF in order to recapture and extinguish an outstanding warrant to purchase 60% of the outstanding equity of Lindblad on a fully diluted basis. On December 11, 2014, the date of the purchase agreements, an initial payment of $25.0 million was made to DVB under the Profit Participation Loan Purchase Agreement. The remaining payments of (i) $22.7 million to DVB, (ii) $48.4 million to Buss Kreuzfahrtfonds 1 GmbH & Co. KG and Buss Kreuzfahrtfonds 2 GmbH & Co. KG, as increased by $0.3 million per month from December 31, 2014 until the close of the transaction, and (iii) $1.00 to Cruise/Ferry Financing Partners Private Foundation were made on May 8, 2015 (“CFMF Closing”). In connection with the CFMF Closing, the 60% warrant was cancelled; the junior debt note receivable was cancelled; and the related junior debt facility offset by the outstanding unamortized balance of the debt discount was cancelled, resulting in a gain on the transfer of assets, and Lindblad commenced liquidation procedures on CFMF. Utilizing the proceeds from the new loans, Lindblad also paid in full its preexisting senior debt facility in the amount of $39.8 million held by DVB.
| F-16 |
The investment in CFMF was liquidated subsequent to the purchase of CFMF on May 8, 2015. The CFMF assets acquired were the junior mortgage note receivable and warrant and both were cancelled and resulted in the removal of the junior mortgage note receivable, which had a relative fair value of $8.5 million, and related junior debt, which had a fair value of $16.0 million (a face value of $20.0 million less the debt discount of $4.0 million). This resulted in a $7.5 million gain on the transfer of assets and an $83.7 million adjustment to additional paid-in capital for the cancellation of the warrant.
Assignment and Assumption Agreement
In connection with Lindblad’s agreement to purchase CFMF, Mr. Lindblad earned a success fee of $5.0 million from DVB for the purchase of CFMF (DVB was a partner in CFMF and the lender of Lindblad’s preexisting senior debt facility).
On March 9, 2015, Mr. Lindblad and Lindblad entered into an Assignment and Assumption Agreement pursuant to which Mr. Lindblad (i) assigned and transferred to Lindblad his right to receive a $5.0 million fee payable to Mr. Lindblad personally by DVB and (ii) exercised his outstanding option to purchase 809,984 shares (converted from 2,857 shares at the merger date) of Lindblad’s stock for $0.1 million in aggregate exercise proceeds. In exchange for the assignment to Lindblad of the fee payable by DVB, all of Mr. Lindblad’s obligations under his loan agreement with Lindblad (the “Mr. Lindblad Loan Agreement”), which had a balance of principal and accrued interest of $2.8 million as of March 9, 2015, were deemed satisfied in full, the Mr. Lindblad Loan Agreement and related promissory note were terminated, and Mr. Lindblad’s obligation to pay the aggregate exercise price for the exercise of the option described above was satisfied in full. On May 8, 2015, Lindblad received the $5.0 million fee from DVB and compensated Mr. Lindblad $5.0 million (success fee compensation expense), which was paid by settling the $2.8 million outstanding amount of principal and interest owed and the aggregate exercise proceeds of $0.1 million payable in connection with the exercise of the option (above), and also offset by $2.1 million in required withholding taxes.
Accounts Payable and Accrued Expenses
The Company records accounts payable and accrued expenses for the cost of such items when the service is provided or when the related product is delivered. The Company’s accounts payable and accrued expenses consist of the following:
| As of December 31, | ||||||||
| (In thousands) | 2015 | 2014 | ||||||
| Accounts payable | $ | 8,843 | $ | 5,109 | ||||
| Accrued liabilities | 7,175 | 5,637 | ||||||
| Bonus compensation | 3,465 | 3,150 | ||||||
| Income taxes | 2,045 | 1,836 | ||||||
| Royalty payable | 1,310 | 999 | ||||||
| Other | 3,130 | 3,297 | ||||||
| Total accounts payable and accrued expenses | $ | 25,968 | $ | 20,028 | ||||
Leases
The Company leases office space with lease terms ranging from one to ten years. The Company amortizes the total lease costs on a straight line basis over the minimum lease term.
The Company leases computer hardware and software, office equipment and vehicles with lease terms ranging from three to six years.
| F-17 |
Fair Value Measurements and Disclosure
The Company applies ASC 820, “Fair Value Measurements and Disclosures,” which expands disclosures for assets and liabilities that are measured and reported at fair value on a recurring basis. Fair value is defined as an exit price, representing the amount that would be received upon the sale of an asset or payment to transfer a liability in an orderly transaction between market participants. Fair value is a market-based measurement that is determined based on assumptions that market participants would use in pricing an asset or liability. A three-tier fair value hierarchy is used to prioritize the inputs in measuring fair value as follows:
| Level 1 | Quoted market prices (unadjusted) in active markets for identical assets or liabilities that the reporting entity has the ability to access at measurement date. |
| Level 2 | Quoted market prices for similar assets or liabilities in active markets, quoted prices for identical or similar assets or liabilities in markets that are not active, or other inputs that are observable, either directly or indirectly. Fair value is determined through the use of models or other valuation methodologies. |
| Level 3 | Significant unobservable inputs for assets or liabilities that cannot be corroborated by market data. Fair value is determined by the reporting entity’s own assumptions utilizing the best information available, and includes situations where there is little market activity for the investment. |
The carrying amounts of cash and cash equivalents, accounts payable and accrued expenses, approximate fair value due to the short-term nature of these instruments.
The carrying value of long-term debt approximates fair value given that the terms of the agreement were comparable to the market as of December 31, 2015.
The asset’s or liability’s fair value measurement within the fair value hierarchy is based upon the lowest level of any input that is significant to the fair value measurement.
The following table provides a summary of the liabilities that were measured at fair value on a recurring basis as of December 31, 2014. As of December 31, 2015, the Company had no liabilities that were measured at fair value on a recurring basis.
| (In thousands) | Total | Quoted
Prices in Active Markets for Identical Assets or Liabilities (Level 1) | Quoted Prices for Similar Assets or Liabilities in Active Markets (Level 2) | Significant Unobservable Inputs (Level 3) | ||||||||||||
| Obligation for the repurchase of common shares subject to put as of December 31, 2014 | $ | 4,966 | $ | - | $ | - | $ | 4,966 | ||||||||
| Obligation cancelled in the merger – July 8, 2015 | (4,966 | ) | - | - | (4,966 | ) | ||||||||||
| Obligation for the repurchase of common shares subject to put as of December 31, 2015 | $ | - | $ | - | $ | - | $ | - | ||||||||
Lindblad and certain of its stockholders who acquired shares through the exercise of stock options, entered into agreements providing for the redemption of outstanding shares at any time by the holder. Accordingly, these shares were subject to repurchase under the terms of these agreements. As of December 31, 2014, there were 1,912,833 (converted from 6,747 shares as a result of the merger) shares outstanding subject to such redemption.
The obligation for the repurchase of common shares was cancelled as a result of the merger on July 8, 2015.
Level 3 liabilities are valued using unobservable inputs to the valuation methodology that are significant to the measurement of fair value. For fair value measurements categorized within Level 3 of the fair value hierarchy, the Company’s Chief Financial Officer determined its valuation policies and procedures. The development and determination of the unobservable inputs for Level 3 fair value measurements and fair value calculations are the responsibility of the Company’s Chief Financial Officer with support from the Company’s consultants and which are approved by the Chief Financial Officer.
| F-18 |
Level 3 financial liabilities consist of obligations for which there is no current market for these securities such that the determination of fair value requires significant judgment or estimation. Changes in fair value measurements categorized within Level 3 of the fair value hierarchy are analyzed each period based on changes in estimates or assumptions and recorded as appropriate.
The fair value of the Company’s common stock was determined by the Company and was derived from a valuation prepared by the Company’s Chief Financial Officer using a weighted analysis of peer multiples of earnings before interest, taxes, depreciation and amortization (“EBITDA”) and discounted cash flows.
Income Taxes
Deferred tax assets and liabilities are recognized for the estimated future tax consequences attributable to differences between the financial statement carrying amounts of existing assets and liabilities and their respective tax bases, and operating loss and tax credit carryforwards. Deferred tax assets and liabilities are measured using enacted tax rates in effect for the year in which those temporary differences are expected to be recovered or settled. The measurement of net deferred tax assets is reduced by the amount of any tax benefit that, based on available evidence, is not expected to be realized, and a corresponding valuation allowance is established. The determination of the required valuation allowance against net deferred tax assets was made without taking into account the deferred tax liabilities created from the book and tax differences on indefinite-lived assets.
The Company accounts for income taxes using the asset and liability method, under which it recognizes deferred income taxes for the tax consequences attributable to differences between the financial statement carrying amounts and the tax bases of existing assets and liabilities, as well as for tax loss carryforwards and tax credit carryforwards. The Company measures deferred tax assets and liabilities using enacted tax rates expected to apply to taxable income in the years in which those temporary differences are expected to be recoverable or settled. The Company recognizes the effect on deferred taxes of a change in tax rates in income in the period that includes the enactment date. The Company provides a valuation allowance against deferred tax assets if, based upon the weight of available evidence, the Company does not believe it is “more-likely-than-not” that some or all of the deferred tax assets will be realized. The Company will continue to evaluate the deferred tax asset valuation allowance balances in all of our foreign and U.S. companies to determine the appropriate level of valuation allowances.
The Company is subject to income taxes in both the U.S. and the non-U.S. jurisdictions in which it operates. The Company regularly assesses the potential outcome of current and future examinations in each of the taxing jurisdictions when determining the adequacy of the provision for income taxes. The Company has only recorded financial statement benefits for tax positions which it believes reflect the “more-likely-than-not” criteria of FASB’s authoritative guidance on accounting for uncertainty in income taxes, and it has established income tax reserves in accordance with this guidance where necessary. Once a financial statement benefit for a tax position is recorded or a tax reserve is established, the Company adjusts it only when there is more information available or when an event occurs necessitating a change. While the Company believes that the amount of the recorded financial statement benefits and tax reserves reflect the more-likely-than-not criteria, it is possible that the ultimate outcome of current or future examinations may result in a reduction to the tax benefits previously recorded on its consolidated financial statements or may exceed the current income tax reserves in amounts that could be material. As of December 31, 2015 and 2014, the Company had a liability for unrecognized tax benefits of $0.4 million and $0.4 million, respectively, which was included in other long-term liabilities on the Company’s consolidated balance sheets. The guidance also discusses the classification of related interest and penalties on income taxes. The Company’s policy is to record interest and penalties on uncertain tax positions as a component of income tax expense. During the years ended December 31, 2015 and 2014, included in income tax expense was $60.6 thousand and $41.8 thousand, respectively, representing interest and penalties on uncertain tax positions.
The Company is subject to tax audits in all jurisdictions for which it files tax returns. Tax audits by their very nature are often complex and can require several years to complete. Currently, there is a U.S. federal tax audit pending for 2013, and no state or foreign jurisdiction tax audits pending. The Company’s corporate U.S. federal and state tax returns from 2012 to 2014 remain subject to examination by tax authorities and the Company’s foreign tax returns from 2011 to 2014 remain subject to examination by tax authorities.
| F-19 |
Other Long-Term Assets
As of December 31, 2014, other long-term assets included a balance of $2.0 million in deferred financing costs, related primarily to legal and bank financing fees incurred to negotiate and secure long-term financing, and were amortized over the term of the financing using the effective interest method. In 2015, the Company recorded deferred financing costs of $11.0 million for the New Credit Facility in long-term debt, amortizing the costs over the term of the financing using the straight-line and effective interest method (see Note 8 – Long-Term Debt).
In connection with the merger on July 8, 2015, the Company, Mr. Lindblad and National Geographic entered into a Call Option agreement where Mr. Lindblad agreed to grant National Geographic an option to purchase 2,387,499 of Mr. Lindblad’s shares in the Company as consideration for the assumption of the alliance and license agreements and the tour operator agreement. The Company recorded a $13.8 million long-term asset using a fair value of $5.76 per option share. As of December 31, 2015, the balance in other long-term assets was $12.4 million (see Note 10 – Commitments and Contingencies for more details).
Foreign Currency Translation
The Company’s functional currency is the U.S. dollar. Remeasurement adjustments and gains or losses resulting from foreign currency transactions are recorded as foreign exchange gains or losses in the consolidated statements of income.
The Company became subject to foreign currency translation in connection with its 2013 acquisition of Fillmore Pearl Holding, Ltd. (“FPH”), which operates partially in Australia and whose functional currency is the U.S. dollar. For the FPH operations included in these consolidated financial statements for periods prior to April 17, 2013, the functional currency was the Australian dollar.
Stock-Based Compensation
The Company accounts for equity instruments issued to employees in accordance with accounting guidance that requires that awards are recorded at their fair value on the date of grant and are amortized over the vesting period of the award. The Company recognizes compensation costs on a straight line basis over the requisite service period of the award, which is generally the vesting term of the equity instrument issued. To the extent that an equity award later becomes eligible to be put back to the Company, then the fair value of that award or those exercised shares is transferred out of additional paid-in-capital to a liability account and is thereafter marked-to-market annually to fair value.
Management’s Evaluation of Subsequent Events
Management evaluated events that have occurred after the balance sheet date through the date the financial statements are issued. Based upon the evaluation, management did identify a subsequent event that requires disclosure in the consolidated financial statements (see Note 14 – Subsequent Events).
Business Segments
The Company is a specialty cruise operator with operations in one segment and evaluates the performance of its business based largely on the results of its single operating segment. The Company provides discrete financial information in total, by ship and type of ship. The chief operating decision maker, or CODM, and management review operating results monthly, and base operating decisions on the total results. The Company’s reports provided to the Board of Directors are at a consolidated level. Management performance and related compensation is based on total results. Based on this assessment, the Company concluded that it has one single operating segment and therefore one reportable segment.
Recent Accounting Pronouncements
In February 2016, FASB issued Accounting Standards Update (“ASU”) No. 2016-02, “Leases” (Topic 842). The main difference between previous GAAP and Topic 842 is the recognition of lease assets and lease liabilities by lessees for those leases classified as operating leases under previous GAAP. The FASB is issuing this Update to increase transparency and comparability among organizations by recognizing lease assets and lease liabilities on the balance sheet and disclosing key information about leasing arrangements. To meet that objective, the FASB is amending the FASB ASC and creating Topic 842, Leases. For public business entities, the amendments in this ASU are effective for financial statements issued for annual periods beginning after December 15, 2018, and interim periods within those annual periods. The Company will evaluate the effects that adoption of this ASU will have on its consolidated financial statements.
In January 2016, FASB issued ASU No. 2016-01, “Financial Instruments- Overall” (Topic 825-10). The amendments in this ASU address certain aspects of recognition, measurement, presentation, and disclosure of financial instruments. They supersede the guidance to classify equity securities with readily determinable fair values into different categories (that is, trading or available-for-sale) and require equity securities (including other ownership interests, such as partnerships, unincorporated joint ventures, and limited liability companies) to be measured at fair value with changes in the fair value recognized through net income. An entity’s equity investments that are accounted for under the equity method of accounting or result in consolidation of an investee are not included within the scope of this Update. The amendments allow equity investments that do not have readily determinable fair values to be remeasured at fair value either upon the occurrence of an observable price change or upon identification of an impairment. The amendments also require enhanced disclosures about those investments. The amendments improve financial reporting by providing relevant information about an entity’s equity investments and reducing the number of items that are recognized in other comprehensive income. For public business entities, the amendments in this ASU are effective for financial statements issued for annual periods beginning after December 15, 2017, and interim periods within those annual periods. The Company will evaluate the effects, if any, that adoption of this ASU will have on its consolidated financial statements.
| F-20 |
In November 2015, FASB issued ASU No. 2015-17, “Income Taxes - Balance Sheet Classification of Deferred Taxes” (Topic 740). The amendments in this ASU require that deferred tax liabilities and assets be classified as noncurrent in a classified statement of financial position and apply to all entities that present a classified statement of financial position. The current requirement that deferred tax liabilities and assets of a tax-paying component of an entity be offset and presented as a single amount is not affected by the amendments in this ASU. For public business entities, the amendments in this Update are effective for financial statements issued for annual periods beginning after December 15, 2016, and interim periods within those annual periods. The Company adopted this ASU in the fourth quarter of 2015 and its adoption did not have a material impact on the Company’s consolidated financial statements.
In August 2015, FASB issued ASU No. 2015-15, “Interest-Imputation of Interest” (Subtopic 835-30). This ASU adds Securities and Exchange Commission (“SEC”) paragraphs pursuant to the SEC Staff Announcement at the June 18, 2015 Emerging Issues Task Force meeting about the presentation and subsequent measurement of debt issuance costs associated with line-of-credit arrangements. Given the absence of authoritative guidance within ASU No. 2015-03, “Interest—Imputation of Interest” (Subtopic 835-30): Simplifying the Presentation of Debt Issuance Costs, related to line-of-credit arrangements, the SEC staff would not object to an entity deferring and presenting debt issuance costs as an asset and subsequently amortizing the deferred debt issuance costs ratably over the term of the line-of-credit arrangement, regardless of whether there are any outstanding borrowings on the line-of-credit arrangement. The Company adopted this ASU in the third quarter of 2015 and its adoption did not have a material impact to the Company’s consolidated financial statements.
In August 2015, FASB issued ASU No. 2015-14, “Revenue from Contracts with Customers – Deferral of the Effective Date” (Topic 606). The amendments in this ASU defer the effective date of ASU No. 2014-09, “Revenue from Contracts with Customers,” for all entities by one year. Public business entities, certain not-for-profit entities, and certain employee benefit plans should apply the guidance in Update 2014-09 to annual reporting periods beginning after December 15, 2017, including interim reporting periods within that reporting period. Earlier application is permitted only as of annual reporting periods beginning after December 15, 2016, including interim reporting periods within that reporting period. The Company will evaluate the effects, if any, that adoption of this ASU will have on its consolidated financial statements.
In May 2014, FASB issued ASU No. 2014-09, “Revenue from Contracts with Customers” (Topic 606), which supersedes the revenue recognition requirements in ASC Topic 605, “Revenue Recognition,” and most industry-specific guidance. This ASU is based on the principle that revenue is recognized to depict the transfer of goods or services to customers in an amount that reflects the consideration to which the entity expects to be entitled in exchange for those goods or services. The ASU also requires additional disclosure about the nature, amount, timing and uncertainty of revenue and cash flows arising from customer contracts, including significant judgments and changes in judgments, and assets recognized from costs incurred to obtain or fulfill a contract. The amendments in the ASU must be applied using one of two retrospective methods and are effective for annual and interim periods beginning after December 15, 2016. Early adoption is not permitted. The Company will evaluate the effects, if any, that adoption of this ASU will have on its consolidated financial statements.
Management does not believe that any other recently issued, but not yet effective, accounting standards upon adoption would have a material effect on the accompanying consolidated financial statements.
| F-21 |
NOTE 3 – ACQUISITION OF FPH
On April 12, 2013, the Company acquired all of the capital stock of FPH. FPH, through its wholly-owned subsidiary, Fillmore Pearl II, Ltd. (“FP II”), a Cayman Islands company, owns the vessel National Geographic Orion. FP II charters the vessel National Geographic Orion to Fillmore Pearl Investment Pty, Ltd, an Australian company that conducts tours in destinations around the world. The acquisition was made pursuant to a stock purchase agreement, dated as of April 17, 2013 (the “FPH Agreement”), by and between the Company and FPH’s shareholders. The purchase price under the FPH Agreement was approximately $30.0 million with $5.0 million paid in cash and financing of the remaining $25.0 million through an increase in its senior secured credit facility with DVB. The $25.0 million (as part of the Senior Debt) bears an interest rate of 5.02%, has a term of 80 months and is secured by principally all the assets of the Company. On May 8, 2015, using the proceeds from the Credit Agreement, the senior secured credit facility was paid in full.
The assets and liabilities of FPH have been recorded in the Company’s consolidated balance sheet at the seller’s historical carrying value.
Current assets acquired included cash, accounts receivable, inventory, other current assets and prepaids. Non-current assets included the vessel and other lesser property and equipment. Liabilities assumed included accrued liabilities and most significantly, unearned guest revenue related to future voyages.
The following details the carryover basis of the purchase price, as adjusted, for the acquisition of FPH (in thousands):
| Cash | $ | 3,699 | ||
| Inventory | 771 | |||
| Prepaid expenses and other current assets | 2,018 | |||
| Property and equipment | 53,302 | |||
| Accrued liabilities | (3,458 | ) | ||
| Unearned revenue | (12,332 | ) | ||
| Equity investment by common control parent | (13,823 | ) | ||
| Total | $ | 30,177 | ||
| Less: net earnings of FPH while under common control | (177 | ) | ||
| Total net assets acquired | $ | 30,000 |
The following presents a summary of the purchase price consideration for the purchase of FPH (in thousands):
| Cash | $ | 5,000 | ||
| Long-term debt | 25,000 | |||
| Total Purchase Price Consideration | $ | 30,000 |
The results of operations for FPH are reflected in the Company’s results in the accompanying consolidated statements of income from November 30, 2012, the date that CFMF acquired control of FPH. The acquisition of FPH represents a change in reporting entity and a transaction between entities under common control. The excess net book value of FPH’s assets and liabilities over the purchase price was accounted for as a deemed contribution by CFMF, as the common control parent, to the Company.
NOTE 4 – OPERATING RIGHTS
The total carrying value of the cupos that the Company is required to have in its possession is included as “Operating rights” on the accompanying consolidated balance sheets and was $6.2 million and $6.5 million as of December 31, 2015 and 2014, respectively. Amortization of operating rights was $0.3 million for the year ended December 31, 2015, which began in August 2015. The Company did not record amortization for the years ended December 31, 2014 and 2013.
Future amortization of operating rights are as follows:
| For the Years Ended December 31, | Operating Rights Amortization | |||
| (In thousands) | ||||
| 2016 | $ | 725 | ||
| 2017 | 725 | |||
| 2018 | 725 | |||
| 2019 | 725 | |||
| 2020 | 725 | |||
| Thereafter | 2,602 | |||
| $ | 6,227 | |||
| F-22 |
NOTE 5 – PROPERTY AND EQUIPMENT
Property and equipment are as follows:
| As of December 31, | ||||||||
| (In thousands) | 2015 | 2014 | ||||||
| Vessels and improvements | $ | 214,170 | $ | 200,037 | ||||
| Furniture and equipment | 8,169 | 7,803 | ||||||
| Leasehold improvements | 1,439 | 1,438 | ||||||
| Total property and equipment, gross | 223,778 | 209,278 | ||||||
| Less: Accumulated depreciation and amortization | (98,307 | ) | (87,405 | ) | ||||
| Property and equipment, net | $ | 125,471 | $ | 121,873 | ||||
Total depreciation and amortization expense of the Company’s property and equipment for the years ended December 31, 2015, 2014 and 2013 were $11.3 million, $10.9 million and $11.2 million, respectively.
The Company has signed a definitive agreement to acquire a new vessel, the Via Australis, and place it in service in the fourth quarter of 2016. This vessel will replace the National Geographic Endeavour, which the Company expects to operate through the fourth quarter of 2016 and does not expect it to operate or have any salvage value beyond the fourth quarter of 2016. The Company evaluated the carrying value for the National Geographic Endeavour and its fixtures and determined that an impairment should not be recognized. The evaluation of the National Geographic Endeavour’s useful life as of December 31, 2015 indicated a shorter remaining useful life of less than one year versus the previous estimated remaining useful life of seven years. As a result, the Company estimates an accelerated depreciation of an additional $0.5 million per month through October 2016.
NOTE 6 – LETTERS OF CREDIT
As of December 31, 2015 and 2014, the Company had $4.65 million in letters of credit outstanding with financial institutions in the amounts of $150,000, $1.0 million, and $3.5 million. The annual fee for letters of credit is 1% of the outstanding balance. The letters of credit are secured by a certificate of deposit maintained at the financial institutions. The $150,000 letter of credit matured on September 8, 2015 and was renewed with an extended maturity date of March 8, 2016. The $1.0 million letter of credit matured on June 30, 2015 and was renewed with an extended maturity date of June 30, 2016. The $3.5 million letter of credit matures on January 1, 2017.
NOTE 7 – PARTICIPATION CERTIFICATES
During the year 2002, the Company completed a private placement and issued $3.7 million in “Participation Certificates” under Regulation D promulgated under securities laws. The Participation Certificates bear interest at a rate of 6% per annum and had an original maturity date of December 31, 2006, which was subsequently extended. In December of 2013, the Company redeemed $3.6 million representing the full amount of the outstanding balance of its Participation Certificates. Each Participation Certificate entitled its holder to receive “Travel Scrips”. Travel Scrips are credits toward the purchase of any tour, or trip offered to the public by the Company or any controlled affiliate of the Company, on the same terms and conditions (including availability) as offered to the public, at the most favorable price offered to the public at the time the holder makes the purchase. Travel Scrips unused in any year are cumulative without limitation as to time and may be freely transferred by holders. Travel Scrip obligations were $1.3 million and $1.4 million as of December 31, 2015 and 2014, respectively, and are reflected within accounts payable and accrued expenses in the consolidated balance sheet.
NOTE 8 – LONG-TERM DEBT
New Credit Facility
On May 8, 2015, Lindblad entered into a Credit Agreement with Credit Suisse as Administrative Agent and Collateral Agent for a $150.0 million facility in the form of a $130.0 million U.S. Term Loan and a $20.0 million Cayman Loan for the benefit of Lindblad’s foreign subsidiaries. The gross proceeds from the Loans, net of discounts, fees and expenses, were $139.5 million. The loans incurred interest at a rate based on an adjusted ICE Benchmark administration LIBO Rate (subject to a floor of 1.00%) plus a spread of 5.50%. The net proceeds from the term loan advances were used to repay Lindblad’s existing debt, fund a portion of the purchase consideration paid in connection with Lindblad’s purchase of the financial and equity interests owned by CFMF and for general corporate purposes.
| F-23 |
On July 8, 2015, the Company entered into an amended and restated credit agreement with Credit Suisse as Administrative Agent and Collateral Agent increasing by $25.0 million the U.S. Term Loan to a $155.0 million facility (total facility of $175.0 million excluded $11.0 million in deferred financing costs) (“Amended Credit Agreement”). The gross proceeds net of discounts, fees and expenses from the larger Amended Credit Agreement were $24.7 million, which will be used for general corporate purposes. The Loans bear interest at a rate based on an adjusted ICE Benchmark administration LIBO Rate (subject to a floor of 1.00%) plus a spread of 4.50%. As of December 31, 2015, the interest rate was 5.50%. The Credit Agreement (i) requires the Company to satisfy certain financial covenants as set forth in the Amended Credit Agreement; (ii) limits the amount of indebtedness the Company may incur; (iii) limits the amount the Company may spend in connection with certain types of investments; and (iv) requires the delivery of certain periodic financial statements and an operating budget and (v) requires the mortgaged vessels and related inventory to be maintained in good working condition.. The U.S. Term Loan and the Cayman Loan both mature on May 8, 2021. As of December 31 2015, the Company was in compliance with the financial covenants.
On March 7, 2016, the Company entered into a second amended and restated credit agreement with Credit Suisse as Administrative Agent and Collateral Agent, amending its existing senior secured credit facility with Credit Suisse (“Restated Credit Facility”). The Restated Credit Facility provides for the Company’s existing $175.0 million senior secured first lien term loan facility and a new $45.0 million senior secured incremental revolving credit facility, which includes a $5.0 million letter of credit subfacility. The Company’s obligations under the Restated Credit Facility are secured by substantially all the assets of the Company.
Borrowings under the term loan facility will continue to bear interest at an adjusted ICE Benchmark administration LIBO Rate (subject to a floor of 1.00%) plus a spread of 4.50%. Borrowings under the Revolving Credit Facility will bear interest at an adjusted ICE Benchmark administration LIBO Rate plus a spread of 4.00%, or, at the option of the Company, an alternative base rate plus a spread of 3.00%. The Company is also required to pay a 0.50% annual commitment fee on undrawn amounts under the Revolving Credit Facility.
The Restated Credit Agreement contains the same financial and operational covenants as the Amended Credit Agreement.
The Revolving Credit Facility will mature on May 8, 2020, whereas the term loan facility matures on May 8, 2021. Borrowings under the Revolving Credit Facility will be used for general corporate and working capital purposes and related fees and expenses. As of March 7, 2016, the Company had no borrowings under the Revolving Credit Facility.
Senior Credit Facility
On October 16, 2007, Lindblad entered into a senior secured term loan (the “Original Senior Credit Facility”) with DVB for up to the maximum of the lesser of $35.0 million or an amount equal to 60% of the fair market value of Lindblad’s vessels. On July 19, 2012 and April 12, 2013, Lindblad amended and restated the Original Senior Credit Facility (“Senior Credit Facility”).
On May 8, 2015, using the proceeds from the loans (as discussed above), Lindblad paid off the Senior Credit Facility in full. The outstanding principal and accrued interest balance on the Senior Credit Facility was $39.8 million and $0.2 million, respectively.
Junior Credit Facility
On October 16, 2007, Lindblad entered into a junior secured term loan (the “Original Junior Credit Facility”) with DVB for up to the maximum of the lesser of $11.0 million or an amount equal to 76% of the fair market value of Lindblad’s vessels. On March 9, 2009, Lindblad entered into an amendment to its Original Junior Credit Facility (the “Amended Junior Credit Facility”). The amendment (a) named DVB as agent for new lenders – Cruise Ferry Master Fund I N.V., (b) increased the facility to a term loan of $15.0 million and a revolving loan of $10.0 million, and (c) extended the maturity of the junior facility to January 18, 2014. In consideration for this amendment and certain other accommodations under the terms of the Original Junior Credit Facility, Lindblad issued a warrant for the purchase of 60% of the fully diluted shares of Lindblad to CFMF. On January 19, 2010 and on July 19, 2012, Lindblad amended its Amended Junior Credit Facility.
On May 8, 2015, using the proceeds from the loans (as discussed above), Lindblad paid off the Amended Junior Credit Facility in full. The outstanding principal balance and accrued interest on the Junior Credit Facility was $20.0 million and $1.2 million.
For the years ended December 31, 2015, 2014 and 2013, total debt discount and deferred financing costs charged to amortization and interest expense was $3.6 million, $0.7 million and $2.1 million, respectively.
| F-24 |
Long-Term Debt Outstanding
As of December 31, 2015 and 2014, the following long-term debt instruments were outstanding:
| As of December 31, | ||||||||||||||||||||||||
| 2015 | 2014 | |||||||||||||||||||||||
| (In thousands) | Principal | Discount and Deferred Financing Costs, net | Balance, net of discount | Principal | Discount | Balance, net of discount | ||||||||||||||||||
| Credit Facility | $ | 174,125 | $ | 9,682 | $ | 164,443 | $ | - | $ | - | $ | - | ||||||||||||
| Senior Credit Facility | - | - | - | 41,003 | - | 41,003 | ||||||||||||||||||
| Junior Credit Facility | - | - | - | 20,000 | 4,313 | 15,687 | ||||||||||||||||||
| Total long-term debt | 174,125 | 9,682 | 164,443 | 61,003 | 4,313 | 56,690 | ||||||||||||||||||
| Less current portion | 1,750 | - | 1,750 | 4,934 | - | 4,934 | ||||||||||||||||||
| Total long-term debt, non-current | $ | 172,375 | $ | 9,682 | $ | 162,693 | $ | 56,069 | $ | 4,313 | $ | 51,756 | ||||||||||||
Future minimum principal payments of long-term debt are as follows:
| Year | Amount | |||
| (In thousands) | ||||
| 2016 | $ | 1,750 | ||
| 2017 | 1,750 | |||
| 2018 | 1,750 | |||
| 2019 | 1,750 | |||
| 2020 | 1,750 | |||
| 2021 | 165,375 | |||
| $ | 174,125 | |||
NOTE 9 — INCOME TAXES
The Company (a “C” Corporation) provides for income taxes based on the Federal and state statutory rates on taxable income. U.S. and foreign components of income before incomes taxes are presented below:
The components of our income (loss) before income taxes for the years ended December 31, 2015, 2014 and 2013 are comprised of the following:
| For the Years Ended December 31, | ||||||||||||
| (In thousands) | 2015 | 2014 | 2013 | |||||||||
| Domestic | $ | (3,700 | ) | $ | 1,930 | $ | 2,647 | |||||
| Foreign | 20,793 | 23,115 | 13,860 | |||||||||
| Total | $ | 17,093 | $ | 25,045 | $ | 16,507 | ||||||
| F-25 |
The income tax provisions at December 31, 2015, 2014 and 2013 are comprised of the following:
| For the Years Ended December 31, | ||||||||||||
| (In thousands) | 2015 | 2014 | 2013 | |||||||||
| Current | ||||||||||||
| Federal | $ | (38 | ) | $ | 613 | $ | 1,256 | |||||
| State | (3 | ) | 109 | 212 | ||||||||
| Foreign - Other | 805 | 1,789 | 288 | |||||||||
| Total current | 764 | 2,511 | 1,756 | |||||||||
| Deferred | ||||||||||||
| Federal | $ | (3,140 | ) | $ | 283 | $ | (61 | ) | ||||
| State | (247 | ) | 32 | (6 | ) | |||||||
| Foreign - Other | (26 | ) | (26 | ) | (26 | ) | ||||||
| Total deferred | (3,413 | ) | 289 | (93 | ) | |||||||
| Income tax (benefit) expense | $ | (2,649 | ) | $ | 2,800 | $ | 1,663 | |||||
A reconciliation of the U.S. federal statutory income tax (benefit) expense to the Company’s effective income tax provision is as follows:
| For the Years Ended December 31, | ||||||||||||
| 2015 | 2014 | 2013 | ||||||||||
| Tax provision at statutory rate – federal | 35.0 | % | 34.0 | % | 34.0 | % | ||||||
| Tax provision at effective state and local rates | (1.5 | %) | 0.4 | % | 0.8 | % | ||||||
| Foreign tax rate differential | (46.5 | %) | (23.3 | %) | (28.7 | %) | ||||||
| GAAP gain transfer of assets | (15.3 | %) | 0.0 | % | 0.0 | % | ||||||
| Transaction costs | 8.3 | % | 0.0 | % | 0.0 | % | ||||||
| subpart F income | 5.2 | % | 0.0 | % | 0.0 | % | ||||||
| Uncertain tax provisions | 0.2 | % | 0.9 | % | 0.8 | % | ||||||
| Valuation allowance | 0.6 | % | (1.2 | %) | 2.4 | % | ||||||
| Incentive stock options | 0.0 | % | 0.4 | % | 0.8 | % | ||||||
| Other | (1.5 | %) | 0.0 | % | 0.0 | % | ||||||
| Total effective income tax rate | (15.5 | %) | 11.2 | % | 10.1 | % | ||||||
The Company, through its parent Lindblad Expeditions, Inc. and a series of subsidiaries and affiliated entities in the U.S., the Cayman Islands, Ecuador and Australia are subject to US Federal, US state, Ecuadorian Federal and Australian Federal income taxes. The Cayman Islands do not impose federal or local income taxes.
Deferred tax assets (liabilities) at December 31, 2015 and 2014 are comprised of the following:
| As of December 31, | ||||||||
| (In thousands) | 2015 | 2014 | ||||||
| Net operating loss carryforward | $ | 11,809 | $ | 7,448 | ||||
| Property and equipment | (274 | ) | (196 | ) | ||||
| Valuation allowance | (8,385 | ) | (7,448 | ) | ||||
| Stock-based compensation | (50 | ) | - | |||||
| Other | 116 | (1 | ) | |||||
| Deferred tax assets (liabilities) | $ | 3,216 | $ | (197 | ) | |||
The Company recognizes valuation allowances to reduce deferred tax assets to the amount that is more likely than not to be realized. In assessing the likelihood of realization, management considers: (i) future reversals of existing taxable temporary differences; (ii) future taxable income exclusive of reversing temporary differences and carryforwards; (iii) taxable income in prior carryback year(s) if carryback is permitted under applicable tax law; and (iv) tax planning strategies. As of December 31, 2015, the Company had deferred tax assets related to Australian loss carryforwards of approximately $21.1 million and capital loss carryforwards of $6.8 million, which may be carried forward indefinitely. The Company also had deferred tax assets related to U.S. loss carryforwards of $13.4 million, which begin to expire in 2021. The Company excluded $4.2 million of U.S. net operating loss carryforwards from the calculation of the deferred tax assets presented above because it represents excess stock option deductions that did not reduce taxes payable in the U.S. The tax effect of these unrealized excess stock option deductions, if realized in the future, will result in an increase to paid-in capital rather than a reduction to the income tax expense. The timing and manner in which the Company will utilize the net operating loss carryforwards in any year, or in total, may be limited in the future as a result of changes in the Company’s ownership and any limitations imposed by the jurisdictions in which the Company operates.
| F-26 |
We continued to assert our prior position regarding the repatriation of historical foreign earnings back to the U.S. Except for earnings that have been previously taxed in the U.S. under the subpart F rules and can be remitted to the U.S. without incurring additional income taxes, we currently have no intention to remit any additional undistributed earnings of our foreign subsidiaries in a taxable manner. As of December 31, 2015 and 2014, we have approximately $78.6 million and $61.0 million, respectively, of foreign undistributed earnings, respectively. Should additional amounts of our foreign subsidiaries’ undistributed earnings be remitted to the U.S. as taxable dividends, we would expect that this would result in additional U.S. tax at a statutory rate of up to 35% and offset by any potential foreign tax credits. Due to uncertainty surrounding the timing and manner in which such distributions could occur, it is not practicable to estimate the amount of such liability.
The Company is subject to income taxes in the U.S. and various state and foreign jurisdictions. Significant judgment is required in evaluating tax positions and determining the provision for income taxes. The Company establishes liabilities for tax-related uncertainties based on estimates of whether, and the extent to which, additional taxes may be due. These liabilities are established when the Company believes that certain positions might be challenged despite its belief that its tax return positions are fully supportable. The Company adjusts these liabilities in light of changing facts and circumstances, such as the outcome of a tax audit. The provision for income taxes includes the impact of changes to these liabilities.
The following is a tabular reconciliation of the total amounts of unrecognized tax benefits and does not include related interest and penalties for the years ended December 31, 2015, 2014 and 2013:
| For the Years Ended December 31, | ||||||||||||
| (In thousands) | 2015 | 2014 | 2013 | |||||||||
| Beginning of year | $ | 447 | $ | 263 | $ | 144 | ||||||
| Current year positions | 26 | 194 | 123 | |||||||||
| Currency adjustments | - | (10 | ) | (4 | ) | |||||||
| End of year | $ | 473 | $ | 447 | $ | 263 | ||||||
The amount of uncertain tax positions that, if recognized, would impact the effective tax rate at December 31, 2015 and December 31, 2014 was $0.3 million. Any changes are not anticipated to have significant impact on the results of operations, financial position or cash flows of the Company. All of the Company’s uncertain tax positions, if recognized, would affect its income tax expense.
The Company is subject to tax audits in all jurisdictions for which it files tax returns. Tax audits by their very nature are often complex and can require several years to complete. Currently, there is a U.S. federal tax audit pending for 2013, and no state or foreign jurisdiction tax audits pending. The Company’s corporate U.S. federal and state tax returns from 2012 to 2014 remain subject to examination by tax authorities and the Company’s foreign tax returns from 2011 to 2014 remain subject to examination by tax authorities.
| F-27 |
NOTE 10 – COMMITMENTS AND CONTINGENCIES
Lease Commitments
The Company leases office space and equipment under long-term leases, which are classified as operating leases.
Future minimum rental commitments, under non-cancellable operating leases as of December 31, 2015, inclusive of leases entered into in 2015, are as follows:
| Minimum Lease | ||||
| For the Years Ended December 31, | Payments | |||
| (In thousands) | ||||
| 2016 | $ | 841 | ||
| 2017 | 856 | |||
| 2018 | 752 | |||
| 2019 | 609 | |||
| 2020 | 609 | |||
| Thereafter | 2,674 | |||
| $ | 6,341 | |||
Rent expense was approximately $0.9 million, $0.8 million and $0.7 million for the years ended December 31, 2015, 2014 and 2013, respectively. These amounts are recorded within general and administrative expenses on the accompanying consolidated statements of income.
Fleet Expansion
During the third quarter of 2015, the Company signed a non-binding letter of intent to build two new coastal vessels with expected deliveries on target for the second quarter of 2017 and 2018, respectively. On December 2, 2015, the Company entered into two separate Vessel Construction Agreements, (collectively, the “Agreements”) with Ice Floe, LLC, a Washington limited liability company doing business as Nichols Brothers Boat Builders (the “Builder”). The Agreements provide for the Builder to construct two new 236-foot 100-passenger cruise vessels at a purchase price of $48.0 million and $46.8 million, respectively, payable monthly based on the value of the work performed through the end of the preceding month.
The Builder is required to deliver the vessels in the second quarter of 2017 and the second quarter of 2018, respectively, subject to extension for certain events, such as change orders. The risk of loss or damage to the vessels remains with the Builder until the vessel is delivered to and accepted by the Company. If the Builder fails to deliver either vessel within 30 days following the applicable delivery date, the Company is entitled to liquidated damages in the amount of $15,000 per day thereafter (not to exceed $500,000 for either vessel). The Agreements each provide for a one-year warranty of the vessels for defects in workmanship or materials under normal use and service, which is capped at $3.0 million in the aggregate for both vessels. The Company may terminate the applicable Agreements in the event the Builder fails to deliver the vessel within 180 days of the applicable due date or the Builder becomes insolvent or otherwise bankrupt. The Agreements also contain customary representations, warranties, covenants and indemnities.
Royalty Agreement – National Geographic
The Company is engaged in an alliance and license agreement with National Geographic, which allows the Company to use the National Geographic name and logo. In return for these rights, the Company is charged a royalty fee. The royalty fee is included within selling and marketing expense on the accompanying consolidated statements of income. The amount is calculated based upon a percentage of ticket revenue less travel agent commission, including the revenue received from cancellation fees and any revenue received from the sale of voyage extensions. A voyage extension occurs when a guest extends their trip with pre- or post-voyage hotel nights and is included within tour revenues on the accompanying consolidated statements of income. The royalty expense is recognized at the time of revenue recognition. See Note 2 – Summary of Significant Accounting Policies for a description of the Company’s revenue recognition policy. Royalty expense for the years ended December 31, 2015, 2014 and 2013 totaled $4.8 million, $4.1 million and $3.4 million, respectively.
The balances outstanding to National Geographic as of December 31, 2015 and 2014 are $1.3 million and $1.0 million, respectively, and are included in accounts payable and accrued expenses on the accompanying consolidated balance sheets.
| F-28 |
In March 2015, Lindblad and National Geographic extended their alliance and license agreement until the year 2025. Payment of royalties earned during the extension period will be valued and recorded in the Company’s consolidated financial statements in a manner consistent with the foregoing disclosure.
In connection with the merger on July 8, 2015, the Company, Mr. Lindblad and National Geographic entered into a Call Option agreement where Mr. Lindblad agreed to grant National Geographic an option to purchase 2,387,499 of Mr. Lindblad’s shares in the Company as consideration for the assumption of the alliance and license agreements and the tour operator agreement. The Company recorded a $13.8 million long-term asset using a fair value of $5.76 per option share. The Company is amortizing the cost until March 31, 2020. For the year ended December 31, 2015, the Company recorded within selling and marketing expense on the consolidated statements of income, $1.4 million in amortization of the National Geographic fee. The asset was valued using a Black-Scholes valuation method with the following assumptions:
| Stock price at July 9, 2015: | $ | 10.75 | ||
| Exercise price: | $ | 10.00 | ||
| Expected term: | 5 years | |||
| Volatility: | 60 | % | ||
| Risk free rate: | 1.58 | % | ||
| Dividend rate: | 0 | % |
Charter Commitments
From time to time, the Company enters into agreements to charter vessels onto which it holds its tours and expeditions. Future minimum payments on its charter agreements are as follows:
| For the Years Ended December 31, | Amount | |||
| (In thousands) | ||||
| 2016 | $ | 8,053 | ||
| 2017 | 7,135 | |||
| 2018 | 2,248 | |||
| 2019 | 1,482 | |||
| Total | $ | 18,918 | ||
Royalty Agreement – Islander
Under a perpetual royalty agreement, the Company is obligated to pay annually a royalty based upon net revenues generated through tours conducted on the National Geographic Islander as provided in the table below.
| Annual Net Revenue | Royalty | |
| Less than or equal to $6.0 million (minimum annual royalty payment) | $225,000 | |
| Less than or equal to $7.0 million but more than $6.0 million | $275,000 | |
| More than $7.0 million | $275,000 + 5% of excess |
Royalty payments from inception were charged against the contingent royalty obligation. Royalty payments in excess of the contingent royalty obligation were charged to cost of tours expenses. As of December 31, 2015 and 2014, there was no remaining balance of the contingent royalty obligation. Contingent royalty expense for the years ended December 31 2015, 2014 and 2013 was $0.7 million, $0.6 million and $0.6 million, respectively.
Other Commitments
The Company participates, with other tour operators, in the Consumer Protection Insurance Plan sponsored by the United States Tour Operators Association (“USTOA”). The USTOA requires a $1.0 million performance bond, letter of credit or assigned certificate of deposit from its members to insure this plan. The Company has assigned a $1.0 million letter of credit to the USTOA to satisfy this requirement. This letter of credit will be used only if the Company becomes insolvent and cannot refund its customers’ deposits.
| F-29 |
The Company self-insures cancellation insurance extended to guests. Further, the Company contracts with an unrelated insurance company to administer the guest insurance program, which includes additional guest-related insurance coverage purchased by guests. In connection with the program, the Company has provided a $150,000 letter of credit to the insurance company to cover unpaid premiums.
Operational Agreement
The Company maintains an agreement with a third party in the Galápagos who provides operations support for the Company’s vessels stationed there. The agreement expired in 2014, and was renewed in 2015 for a five-year term as discussed below.
On February 11, 2015, the Company entered into a renewal agreement with Empresa Turistica Internacional C.A., the third-party company that provides advisory and administrative services along with the required actions for the secure and successful operation of the National Geographic Endeavour and National Geographic Islander in the Galápagos. This agreement is in effect from January 1, 2015 through December 31, 2019.
Legal Proceedings
The Company is involved in various claims, legal actions and regulatory proceedings arising from time to time in the ordinary course of business. Other than the matters set forth below, in the opinion of management, the ultimate disposition of these matters will not have a material adverse effect on the combined financial position, results of operations or cash flows.
In November 2013, two shareholders of the Company holding minority interests filed a lawsuit against the Company and, derivatively, against its directors and certain of its lenders alleging, among other matters, a breach of the plaintiffs’ preemptive rights, conflicts of interest and breaches of fiduciary duty, all purportedly arising out of the Company’s 2009 and 2012 refinancings of its credit facilities, the grant in connection therewith to the Company’s lenders of a warrant to purchase stock of the Company, the adoption of the Company’s incentive stock option plan, and other transactions. The Company and the other defendants filed motions to dismiss. Prior to a ruling by the Court on the motions to dismiss, the parties entered into an agreement providing for the purchase by the Company of all the shares of Company stock held by plaintiffs and the settlement of all claims. Pursuant to the settlement agreement, the case was dismissed with prejudice in November 2014. In connection with the settlement and purchase of the plaintiffs’ shares, the Company paid $11.3 million in cash to the plaintiffs, net of amounts recovered through insurance.
NOTE 11 – EMPLOYEE BENEFIT PLAN
The Company has a 401(k) profit sharing plan and trust for its employees. The Company matches 25% of employee contributions up to annual maximum of $1,800, $1,500 and $1,000 for 2015, 2014 and 2013, respectively. For the years ended December 31, 2015, 2014 and 2013, the Company’s benefit plan contribution amounted to $0.2 million, $0.1 million and $0.1 million, respectively. The benefit plan contribution is recorded within general and administrative expenses on the accompanying consolidated statements of income.
NOTE 12 – SHAREHOLDERS’ EQUITY
Capital Stock
The Company has a total of 201,000,000 authorized shares of capital stock, consisting of 1,000,000 shares of preferred stock, $0.0001 par value and 200,000,000 shares of common stock, $0.0001 par value.
| F-30 |
Contributions and Distributions
In connection with the common control merger of FPH, CFMF was deemed to have made a distribution to the Company of $24.0 million on November 30, 2012, representing the net assets of FPH. During December 31, 2012, DVB made a contribution to FPH of $2.1 million in cash. On April 11, 2013 the Company was deemed to have distributed to CFMF $12.3 million in connection with the Company’s purchase of FPH for cash and notes with the simultaneous removal of the FPH entity originally recorded with the common control merger.
Shares Subject to Redemption
The Company and certain of its stockholders who acquired shares through the exercise of stock options, entered into agreements providing for the redemption of outstanding shares at any time by the holder. Accordingly, these shares are subject to repurchase under the terms of these agreements. As a result of the merger, these stockholders agreed to relinquish their rights of any kind to cause the Company to repurchase the shares of the Company subject to redemption.
As of December 31, 2015, there were no shares and options outstanding subject to such redemption, with no aggregate redemption value. As of December 31, 2014, there were 1,912,833 shares and options outstanding subject to such redemption, with aggregate redemption values of $5.0 million. The Company had recorded this redemption obligation as a liability on the consolidated balance sheet.
Adoption of the 2015 Long-Term Incentive Plan
The Company’s Board of Directors adopted the 2015 Plan subject to shareholder approval, which was obtained on July 8, 2015. The 2015 Plan is administered by the Board, and allows the Company to issue up to 2,500,000 shares of common stock to employees, consultants and non-employee directors providing a valuable service to the Company. The 2015 Plan provides for the grant of stock options, including incentive stock options and nonqualified stock options, stock appreciation rights, restricted stock, restricted stock units, and other stock or cash-based awards. The Board has the authority to determine the amount and type of each award. The 2015 Plan expires on July 8, 2025. All options granted under the 2015 Plan will be at exercise prices not less than 100% of the fair market value of the Company’s common stock on the date of grant.
Restricted Shares and Restricted Share Units
Restricted shares are shares of stock granted to an employee for which sale is prohibited for a specified period of time. Restricted share units (“RSUs”) represent a promise to deliver shares to the employee at a future date if certain vesting conditions are met. The difference between RSUs and restricted shares is primarily the timing of the delivery of the underlying shares. A company that grants RSUs does not deliver the shares to the employee until the vesting conditions are met.
| F-31 |
Under the 2015 Plan, four members of the Board were granted restricted shares and one member of the Board was granted RSUs on January 4, 2016. There were 6,660 restricted shares or RSUs granted to each member and they vest in three installments on August 8, 2016, 2017 and 2018 and are not subject to any performance-based conditions.
Based on the terms above, each share had a value of $11.26 per share for a total of $0.4 million for all five board members. Stock compensation of $0.4 million for all five board members will be amortized over the service period between January 4, 2016 and August 8, 2018. The amortization of the stock compensation for all board members is expected to be approximately $0.1 million per year.
Stock Options
The fair value of stock options is amortized on a straight line basis over the requisite service periods of the respective awards. Stock-based compensation expense related to stock options was $4.9 million, $0.3 million and $0 for the years ended December 31, 2015, 2014 and 2013, respectively. Stock compensation expense is included within general and administrative expenses on the accompanying consolidated statements of income. As of December 31, 2015, the unamortized value of options was $11.0 million and is expected to be expensed over a period of 2.6 years.
On December 11, 2014, the Company granted stock options for the purchase of 13,480 shares of its Class A common stock at an exercise price of $498 per share under the 2012 Stock Incentive Plan (the “Lindblad Plan”) to two officers of the Company. At the merger date, the Company assumed the 13,480 outstanding Lindblad stock options granted under the Lindblad Plan and converted such options into options to purchase an aggregate of 3,821,696 shares of common stock of the Company with an exercise price of $1.76 per share. Under the assumption agreement, the exercise proceeds, service period and other terms remained the same, except for the vesting dates and option term. There were no incremental costs resulting from the modification of the equity awards and the requisite service is expected to be rendered with no change in the service period. Therefore, the total recognized compensation cost for the equity awards remains the fair value at the original grant date (ASC 718-20). The original grant date value per share for the equity awards was $1,423.62 per share and at the merger date, the original grant date value was converted to $3.81 per share.
During September 2015, 1,272,625 option shares vested and were exercised. The option shares were issued using cashless transactions, approved by management, and were used in exchange for the required exercise proceeds and payment of any related payroll withholding taxes. Using a fair value of $9.30 per share and an exercise price of $1.76 per share, 240,841 shares were transferred to provide the $2.2 million in exercise proceeds required for the transactions. Using a fair value of $9.30 per share, 524,662 shares were transferred to provide the $4.9 million in proceeds required to pay the payroll withholding taxes for the transactions. The balance of the option shares of 507,122 shares were issued as a result of the transactions.
The Company estimated the fair value of employee stock options using the Black-Scholes option pricing model. The fair values of employee stock options granted under the Lindblad Plan and 2015 Plan were estimated using the following assumptions:
| December 11, 2014 Option Grants | November 10, 2015 Option Grants | |||||||
| Stock price | $ | 5.02 | $ | 10.58 | ||||
| Exercise price | $ | 1.76 | $ | 10.58 | ||||
| Dividend yield | 0 | % | 0 | % | ||||
| Expected volatility | 60.0 | % | 60.0 | % | ||||
| Risk-free interest rate | 2.19 | % | 1.72 | % | ||||
| Expected term | 5.11 years | 5.11 years | ||||||
| F-32 |
The following table is a summary of activity under the Lindblad Plan and 2015 Plan:
| Weighted | Weighted | Weighted | ||||||||||||||||||
| Average | Average | Average | Aggregate | |||||||||||||||||
| Exercise | Grant Date | Contractual | Intrinsic | |||||||||||||||||
| * Shares | * Price | * Fair Value | Life (Years) | * Value | ||||||||||||||||
| Options outstanding as of December 31, 2012 | 1,992,782 | $ | 0.11 | $ | 3.27 | 10.0 | $ | 6,622,583 | ||||||||||||
| Granted | - | - | - | |||||||||||||||||
| Exercised | - | - | - | |||||||||||||||||
| Forfeited | - | - | - | |||||||||||||||||
| Options outstanding as of December 31, 2013 | 1,992,782 | 0.11 | $ | 3.27 | 9.0 | 6,926,869 | ||||||||||||||
| Granted | 3,821,696 | 1.76 | 3.81 | |||||||||||||||||
| Exercised | (1,182,798 | ) | 0.11 | 3.27 | ||||||||||||||||
| Forfeited | - | - | - | |||||||||||||||||
| Options outstanding as of December 31, 2014 | 4,631,680 | 1.47 | $ | 3.72 | 9.7 | 16,315,198 | ||||||||||||||
| Granted | 300,000 | 10.58 | 5.54 | |||||||||||||||||
| Exercised | (2,082,609 | ) | 1.12 | 3.60 | ||||||||||||||||
| Forfeited | - | - | - | |||||||||||||||||
| Options outstanding as of December 31, 2015 | 2,849,071 | $ | 2.69 | $ | 9.02 | 3.7 | $ | 18,032,173 | ||||||||||||
| Vested and expected to vest after December 31, 2015 | 2,849,071 | $ | 2.69 | $ | 9.02 | 3.7 | $ | 18,032,173 | ||||||||||||
| Exercisable as of December 31, 2012 | 1,992,782 | $ | 0.11 | $ | 3.27 | |||||||||||||||
| Vested | - | - | - | |||||||||||||||||
| Exercised | - | - | - | |||||||||||||||||
| Forfeited | - | - | - | |||||||||||||||||
| Exercisable as of December 31, 2013 | 1,992,782 | 0.11 | 3.27 | |||||||||||||||||
| Vested | - | - | - | |||||||||||||||||
| Exercised | (1,182,798 | ) | 1.12 | 3.60 | ||||||||||||||||
| Forfeited | - | - | - | |||||||||||||||||
| Exercisable as of December 31, 2014 | 809,984 | 0.11 | 3.27 | |||||||||||||||||
| Vested | 1,272,625 | 1.76 | 3.81 | |||||||||||||||||
| Exercised | (2,082,609 | ) | 1.12 | 3.60 | ||||||||||||||||
| Forfeited | - | - | - | |||||||||||||||||
| Exercisable as of December 31, 2015 | - | |||||||||||||||||||
*Option shares and values were adjusted for conversion at the merger date, July 8, 2015.
NOTE 13 – RELATED PARTY TRANSACTIONS – SHAREHOLDER LOANS
Other than as described below, since January 1, 2015, the Company has not entered into, and there are no currently proposed, related party transactions.
Capitol Acquisition Corp. II
In February 2011, Capitol issued 4,417,684 shares of common stock to Capitol Acquisition Management 2 LLC (an affiliate of Mark D. Ein, Capitol’s former Chief Executive Officer and a the current Chairman of the Company) for $25,000 in cash, at a purchase price of approximately $0.006 share, in connection with Capitol’s organization. In March 2013, Capitol’s sponsor contributed an aggregate of 105,184 shares of Capitol’s common stock to Capitol’s capital, resulting in its sponsor owning an aggregate of 4,312,500 founder’s shares. The sponsor received no consideration for this contribution. Such contribution was made solely to maintain the sponsor’s collective 20% ownership interest in Capitol’s shares of common stock based on the current size of Capitol’s initial public offering. Thereafter, also in March 2013, Capitol’s sponsor transferred an aggregate of 1,078,126 founder’s shares to Capitol’s then executive officers and directors. In April 2013, Capitol’s sponsor and L. Dyson Dryden (Capitol’s former Chief Financial Officer and a current director of the Company) transferred an aggregate of 22,998 founder’s shares to Messrs. Calcano, Donaldson and Sodha (each a former director of Capitol), resulting in Capitol’s sponsor owning an aggregate of 3,222,875 founder’s shares and Mr. Dryden owning an aggregate of 974,626 founder’s shares. The sponsor received no consideration for these transfers. In May 2013, Capitol effected a stock dividend of 0.2 shares for each outstanding share of common stock, resulting in Capitol’s sponsor and officers and directors holding an aggregate of 5,175,000 founder’s shares, of which 175,000 shares were subsequently forfeited.
| F-33 |
All of the initial shares of common stock issued by Capitol to its sponsor and initial stockholders (Capitol Acquisition Management 2 LLC, L. Dyson Dryden, Lawrence Calcano, Richard C. Donaldson and Piyush Sodha) were placed in escrow with Continental Stock Transfer & Trust Company, as escrow agent, until one year after the date of the consummation of the Capitol’s merger with Lindblad (July 8, 2016) or earlier if, the last sales price of its common stock equals or exceeds $12.00 per share (as adjusted for stock splits, stock dividends, reorganizations and recapitalizations) for any 20 trading days within any 30-trading day period commencing at least 150 days after July 8, 2015 or the Company consummates a subsequent liquidation, merger, share exchange or other similar transaction which results in all of its stockholders having the right to exchange their shares of common stock for cash, securities or other property. In addition, initial shares held in escrow include certain founder forfeiture shares which are subject to forfeiture in the event the last sales price of our stock does not equal or exceed $13.00 per share (as adjusted for stock splits, stock dividends, reorganizations, recapitalizations and the like) for any 20 trading days within any 30-trading day period within four years following July 8, 2015. Such founder forfeiture shares will be released from escrow at the same time as the other initial shares to the extent they have been earned at such time.
Commencing on May 10, 2013, Capitol paid Venturehouse Group, LLC, an affiliate of Mark D. Ein, a fee of $7,500 per month for providing Capitol with office space and certain office and administrative services through the initial business combination of July 8, 2015. This arrangement was solely for Capitol’s benefit and was not intended to provide Mr. Ein compensation in lieu of a salary. For the years ended December 31, 2015, 2014 and 2013, the aggregate cash fee paid to Venturehouse Group, LLC was $45.0 thousand, $90.0 thousand and $62.4 thousand, respectively.
To meet Capitol’s working capital needs, from time to time, Capitol’s officers, directors, initial stockholders or their affiliates loaned Capitol funds in their sole discretion prior to the initial business combination. The aggregate amount of the loans was approximately $1.6 million. All loans were repaid upon consummation of the Company’s initial business combination, without interest, with the exception of $0.5 million of the notes that were converted into warrants at a price of $1.00 per warrant at such time.
The holders of Capitol’s initial shares, as well as the holders of the sponsor warrants and all note conversion warrants are entitled to registration rights pursuant to an agreement signed in connection with Capitol’s initial public offering. The Company filed a Form S-3 resale registration statement required by such registration rights agreement that was declared effective by the SEC on September 16, 2015.
Capitol reimbursed its officers and directors for reasonable out-of-pocket business expenses incurred by them in connection with certain activities on its behalf such as identifying and investigating possible target businesses and business combinations prior to the initial business combination. As of July 8, 2015, December 31, 2014 and December 31, 2013, Capitol had reimbursed its initial stockholders approximately $53.8 thousand, $38.2 thousand and $26.0 thousand, respectively, for out-of-pocket business expenses incurred by them in connection with activities on its behalf.
Other than the fees described above and reimbursable out-of-pocket expenses payable to Capitol’s officers and directors, no compensation or fees of any kind, including finder’s fees, consulting fees or other similar compensation, were paid to any of Capitol’s initial stockholders, including its officers or directors, or to any of their respective affiliates, prior to or for services rendered in connection with the business combination.
Lindblad Expeditions, Inc.
On November 3, 2014, Lindblad and Sven-Olof Lindblad entered into a certain Loan and Security Agreement (“Loan Agreement”) and a certain Promissory Note made by Mr. Lindblad in favor of Lindblad for a maximum aggregate principal amount of up to $3.5 million. The interest rates of the Promissory Note were the applicable federal rate for loans of equal tenor for the months in which amounts were provided to Mr. Lindblad by Lindblad, as published by the Internal Revenue Service for purposes of Section 1274(d) of the Internal Revenue Code. Mr. Lindblad pledged his right, title and interest in and to all of the issued and outstanding shares of capital stock of Lindblad held by him to Lindblad as collateral for repayment of the Promissory Note. The Promissory Note was satisfied and the Loan Agreement terminated on March 9, 2015 pursuant to the Assignment and Assumption Agreement described below. Prior to such satisfaction and termination, approximately $2.8 million had been advanced by Lindblad to Mr. Lindblad and no principal or interest had been repaid by Mr. Lindblad.
| F-34 |
On March 9, 2015, Mr. Lindblad and Lindblad entered into an Assignment and Assumption Agreement pursuant to which Mr. Lindblad (i) assigned and transferred to Lindblad his right to receive a $5.0 million fee payable by DVB and (ii) exercised his outstanding option to purchase 2,857 shares of Lindblad’s stock for an aggregate exercise price of $92.5 thousand. In exchange for the assignment to Lindblad of the fee payable by DVB, all of Mr. Lindblad’s obligations under the Loan Agreement described above were deemed satisfied in full, the Loan Agreement and related Promissory Note were terminated, and Mr. Lindblad’s obligation to pay the aggregate exercise price for the exercise of the option described above was satisfied in full. Following receipt of the fee from DVB, Lindblad paid to Mr. Lindblad an amount equal to (a) the fee paid by DVB, less (b) the outstanding amount of principal and interest owed under the Loan Agreement at the time of entry into the Assignment and Assumption Agreement, the aggregate exercise price payable in connection with the exercise of the option, and a collection premium equal to one percent of the outstanding amount of principal and interest payable in connection with the loan, and less (c) any required withholding taxes.
Prior to the debt refinancing and the completion of the purchase of CFMF on May 8, 2015, CFMF served as the junior lender pursuant to Lindblad’s junior credit facility. CFMF was deemed to have control of Lindblad through (a) CFMF’s possession of a warrant to purchase 60% of Lindblad for nominal consideration that could be exercised at any time and (b) a shareholder agreement between CFMF and Lindblad under which CFMF was declared to be in control of Lindblad and for which CFMF was awarded two of the three seats on Lindblad’s Board of Directors. On December 11, 2014, Lindblad entered into a Profit Participation Loan Purchase Agreement with DVB, a Profit Participation Rights Purchase Agreement with Buss Kreuzfahrtfonds 1 GmbH & Co. KG and Buss Kreuzfahrtfonds 2 GmbH& Co. KG, and a Stock Purchase Agreement with Cruise/Ferry Finance Partners Private Foundation. These three agreements enabled Lindblad to purchase the financial and equity interests in CFMF in order to recapture and extinguish a warrant to purchase 60% of the outstanding equity of Lindblad on a fully diluted basis. On December 11, 2014, the date of the purchase agreements, an initial payment of $25.0 million was made to DVB under the Profit Participation Loan Purchase Agreement. The remaining payments of (i) $22.7 million to DVB, (ii) $48.4 million to Buss Kreuzfahrtfonds 1 GmbH & Co. KG and Buss Kreuzfahrtfonds 2 GmbH & Co. KG, as increased by $339,100 per month from December 31, 2014 until the close of the transaction, and (iii) $1.00 to Cruise/Ferry Financing Partners Private Foundation were made on May 8, 2015. DVB served as agent and security trustee under Lindblad’s credit facilities prior to the refinancing on May 8, 2015, and was one of the Senior Lenders under the then current senior credit facility. In connection with the purchase of CFMF completed on May 8, 2015, the senior credit facility was paid off and the junior credit facility was cancelled.
Lindblad and National Geographic collaborate on exploration, research, technology and conservation in order to provide travel experiences and disseminate geographic knowledge around the globe. The Lindblad/National Geographic alliance is set forth in (i) an Alliance and License Agreement and (ii) a Tour Operator Agreement. During 2015, Lindblad paid an aggregate of $4.8 million to National Geographic under these agreements which is included within selling and marketing expenses on the accompanying consolidated statements of income. The extension of the agreements between Lindblad and National Geographic in connection with the mergers was contingent on the execution by Mr. Lindblad of an option agreement granting National Geographic the right to purchase from Mr. Lindblad, for a per share price of $10.00 per share, five percent of the issued and outstanding shares of Capitol’s common stock as July 8, 2015, including all outstanding options, warrants or other derivative securities (excluding options granted under the 2015 Plan, 15,600,000 shares issuable upon the exercise of warrants and 1,250,000 shares of escrowed common stock, unless such escrowed shares are released from escrow, in which case such shares will be included in the 5% calculation).
In connection with the mergers, the stockholders of Capitol prior to its initial public offering — Capitol Acquisition Management 2 LLC, L. Dyson Dryden, Lawrence Calcano, Richard C. Donaldson and Piyush Sodha —collectively agreed to make a charitable contribution of an aggregate of 500,000 founder’s shares in Capitol to the Lindblad Expeditions – National Geographic Joint Fund for Exploration and Conservation (“LEX-NG Fund”), established by National Geographic, for no additional consideration. The LEX-NG Fund is managed jointly by a Lindblad staff member and a National Geographic staff member and the board is comprised of five members with Mr. Lindblad acting as Chairman.
| F-35 |
NOTE 14 – SUBSEQUENT EVENTS
On March 7, 2016, the Company entered into a Restated Credit Agreement, amending its Restated Credit Facility. The Restated Credit Facility provides for the Company’s existing $175.0 million senior secured first lien term loan facility and a new $45.0 million Revolving Credit Facility, which includes a $5.0 million letter of credit subfacility. The Company’s obligations under the Restated Credit Facility are secured by substantially all the assets of the Company (see Note 8 – Long-Term Debt).
NOTE 15 – QUARTERLY FINANCIAL DATA – UNAUDITED
The following presents quarterly financial data for the fiscal periods ended December 31, 2015 and 2014:
| Fiscal Year 2015 | ||||||||||||||||||||
| First | Second | Third | Fourth | |||||||||||||||||
| (In thousands, except per share data) | Quarter | Quarter | Quarter | Quarter | Fiscal Year | |||||||||||||||
| Tour revenues | $ | 55,421 | $ | 49,531 | $ | 58,561 | $ | 46,472 | $ | 209,985 | ||||||||||
| Gross profit | $ | 31,019 | $ | 28,045 | $ | 33,118 | $ | 22,386 | $ | 114,568 | ||||||||||
| Net income (loss) | $ | 6,933 | $ | 8,835 | $ | 4,416 | $ | (442 | ) | $ | 19,742 | |||||||||
| Diluted earnings (loss) per share | $ | 0.16 | $ | 0.20 | $ | 0.10 | $ | (0.01 | ) | $ | 0.43 | |||||||||
| Fiscal Year 2014 | ||||||||||||||||||||
| First | Second | Third | Fourth | |||||||||||||||||
| (In thousands, except per share data) | Quarter | Quarter | Quarter | Quarter | Fiscal Year | |||||||||||||||
| Tour revenues | $ | 51,375 | $ | 50,791 | $ | 51,540 | $ | 44,753 | $ | 198,459 | ||||||||||
| Gross profit | $ | 29,398 | $ | 26,690 | $ | 28,946 | $ | 23,423 | $ | 108,457 | ||||||||||
| Net income | $ | 8,395 | $ | 5,164 | $ | 7,280 | $ | 1,406 | $ | 22,245 | ||||||||||
| Diluted earnings per share | $ | 0.16 | $ | 0.10 | $ | 0.14 | $ | 0.03 | $ | 0.44 | ||||||||||
F-36