Attached files
| file | filename |
|---|---|
| 8-K - 8-K - Assertio Therapeutics, Inc | a16-6363_18k.htm |
Exhibit 99.1
A Force in Pain and Neurology Focused on Accelerated Growth March 14, 2016

Forward-Looking Statements The statements that are not historical facts contained in this presentation are forward-looking statements that involve risks and uncertainties including, but not limited to, those related to Depomed’s strategy, plans, objectives, expectations (financial or otherwise) and intentions, future financial results and growth potential, and expectations regarding periods of exclusivity for the Nucynta® franchise, Gralise®, CAMBIA®, Lazanda®, Zipsor®, cebranopadol, as well as any other statements that are not historical facts. These forward-looking statements are based on Depomed’s current expectations and inherently involve significant risks and uncertainties. Actual results and the timing of events could differ materially from those anticipated in such forward-looking statements as a result of these risks and uncertainties, which include, without limitation, risks associated with product acquisition transactions, such as the risk that the acquired products will not be integrated successfully, that such integration may be more difficult, time-consuming or costly than expected or that the expected benefits of the transaction will not occur; risks related to Depomed’s future opportunities and plans, including uncertainty of Depomed’s expected financial performance following completion of the transaction; disruption from the transaction, making it more difficult to conduct business as usual or maintain relationships with customers, employees or suppliers; and the possibility that if Depomed does not achieve the perceived benefits of the transaction as rapidly or to the extent anticipated by financial analysts or investors, the market price of Depomed’s shares could decline, as well as other risks related to Depomed's business detailed from time-to-time under the caption "Risk Factors" and elsewhere in Depomed's SEC filings and reports, including in its Annual Report on Form 10-K for the year ended December 31, 2015 and its most recent Quarterly Report on Form 10-Q. Depomed undertakes no duty or obligation to update any forward-looking statements contained in this presentation as a result of new information, future events or changes in its expectations except as may be required by law. 2 March 2016
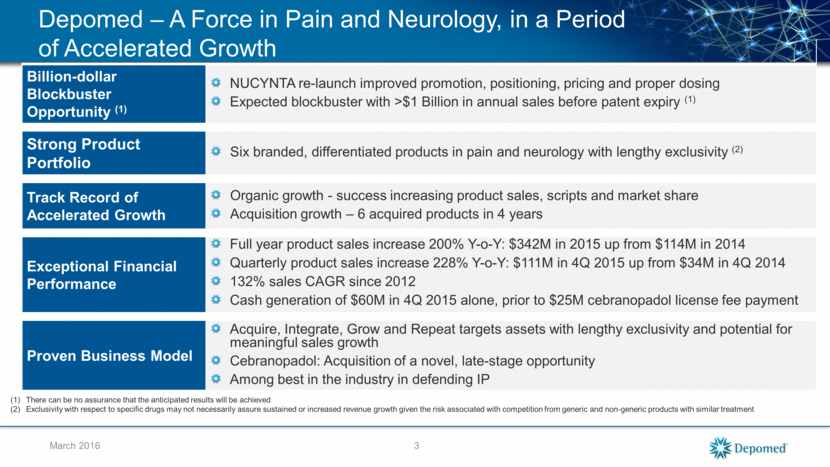
March 2016 Depomed – A Force in Pain and Neurology, in a Period of Accelerated Growth Billion-dollar Blockbuster Opportunity (1) NUCYNTA re-launch improved promotion, positioning, pricing and proper dosing Expected blockbuster with >$1 Billion in annual sales before patent expiry (1) Strong Product Portfolio Six branded, differentiated products in pain and neurology with lengthy exclusivity (2) Track Record of Accelerated Growth Organic growth - success increasing product sales, scripts and market share Acquisition growth – 6 acquired products in 4 years Exceptional Financial Performance Full year product sales increase 200% Y-o-Y: $342M in 2015 up from $114M in 2014 Quarterly product sales increase 228% Y-o-Y: $111M in 4Q 2015 up from $34M in 4Q 2014 132% sales CAGR since 2012 Cash generation of $60M in 4Q 2015 alone, prior to $25M cebranopadol license fee payment Proven Business Model Acquire, Integrate, Grow and Repeat targets assets with lengthy exclusivity and potential for meaningful sales growth Cebranopadol: Acquisition of a novel, late-stage opportunity Among best in the industry in defending IP There can be no assurance that the anticipated results will be achieved Exclusivity with respect to specific drugs may not necessarily assure sustained or increased revenue growth given the risk associated with competition from generic and non-generic products with similar treatment 3
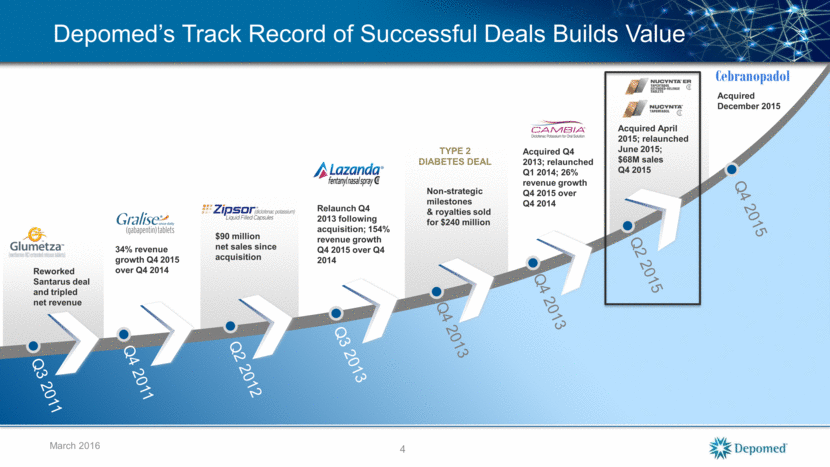
Reworked Santarus deal and tripled net revenue 34% revenue growth Q4 2015 over Q4 2014 Acquired Q4 2013; relaunched Q1 2014; 26% revenue growth Q4 2015 over Q4 2014 Q3 2011 Q4 2011 Q4 2013 TYPE 2 DIABETES DEAL Non-strategic milestones & royalties sold for $240 million Q4 2013 Relaunch Q4 2013 following acquisition; 154% revenue growth Q4 2015 over Q4 2014 Q3 2013 $90 million net sales since acquisition Q2 2012 Acquired April 2015; relaunched June 2015; $68M sales Q4 2015 Q2 2015 4 March 2016 Q4 2015 Acquired December 2015 Cebranopadol Depomed’s Track Record of Successful Deals Builds Value
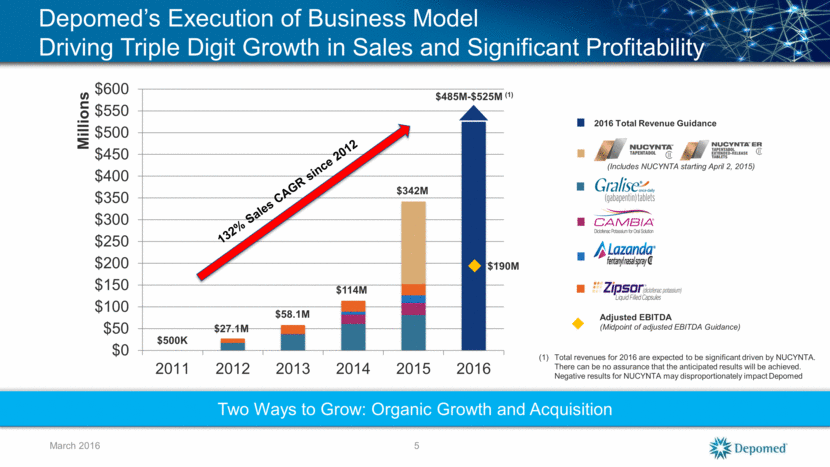
Depomed’s Execution of Business Model Driving Triple Digit Growth in Sales and Significant Profitability $500K $27.1M $58.1M $114M $485M-$525M (1) March 2016 2016 Total Revenue Guidance Adjusted EBITDA (Midpoint of adjusted EBITDA Guidance) $190M Two Ways to Grow: Organic Growth and Acquisition Total revenues for 2016 are expected to be significant driven by NUCYNTA. There can be no assurance that the anticipated results will be achieved. Negative results for NUCYNTA may disproportionately impact Depomed 5 $342M (Includes NUCYNTA starting April 2, 2015) $0 $50 $100 $150 $200 $250 $300 $350 $400 $450 $500 $550 $600 2011 2012 2013 2014 2015 2016 Millions
Consolidated Condensed Balance Sheet 6 March 2016 Cash, cash equivalents and marketable securities $ 209,768 $ 566,402 Accounts receivable 71,687 28,078 Inventories 10,494 8,456 Income taxes receivable 6,358 4,030 Property and equipment, net 14,794 7,055 Intangible assets, net 1,008,994 72,361 Deferred tax assets 22,995 9,601 Prepaid and other assets 18,342 15,082 Total assets $ 1,363,432 $ 711,065 Accounts payable and accrued liabilities $ 196,794 $ 52,686 Senior notes 563,473 - Convertible notes 243,035 229,891 Contingent consideration liability 14,971 14,252 Deferred tax liabilities - 32,589 Other liabilities 30,104 17,200 Shareholders’ equity 315,055 364,447 Total liabilities and shareholders’ equity $ 1,363,432 $ 711,065 (unaudited) CONSOLIDATED CONDENSED BALANCE SHEETS (in thousands) December 31, December 31, 2015 2014
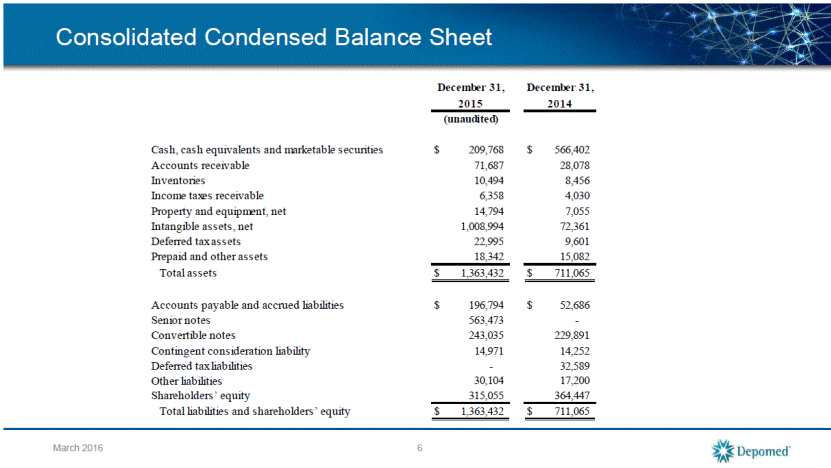
Revenue Table 7 March 2016 Product sales, net: Nucynta products $ 68,260 $ - $ 189,853 (1) $ - Gralise 21,737 18,110 81,054 60,411 Cambia 8,157 6,266 27,426 21,681 Lazanda 5,236 2,665 17,712 6,972 Zipsor 7,668 6,843 25,705 25,155 Total product sales, net 111,059 33,884 341,750 114,219 Royalties $ 113 $ 526 $ 985 $ 1,821 License and other revenue: Mallinckrodt $ - $ - $ - $ 15,000 Other - 13,235 - 16,515 Total license and other revenue - 13,235 - 31,515 Non-cash PDL royalty revenue $ - $ 146,956 $ - $ 242,808 Total revenues (GAAP Basis) $ 111,172 $ 194,601 $ 342,735 $ 390,363 (1) Nucynta acquisition closed in April 2015, and the results reflect nine-months of sales in 2015. REVENUES (GAAP BASIS) (in thousands, unaudited) Three Months Ended Twelve Months Ended December 31, December 31, 2015 2014 2015 2014
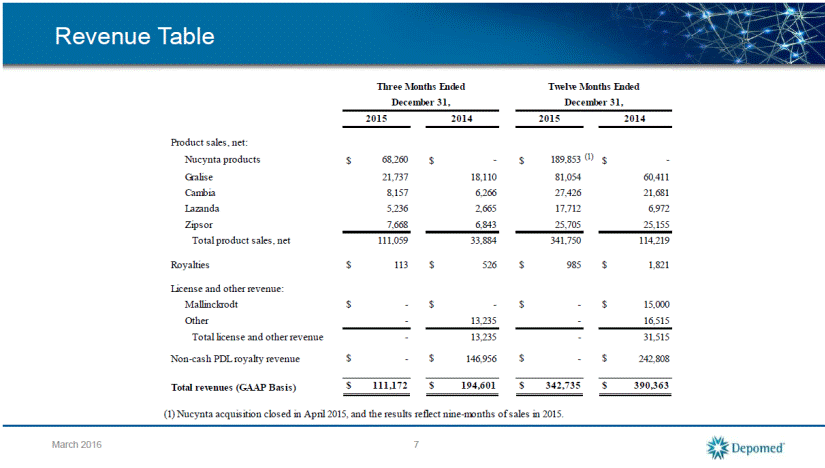
Reconciliations of GAAP Reported to Non-GAAP Adjusted Information 8 March 2016 Total revenues 111,172 (488) (a) 110,684 194,601 (146,956) (a) 47,645 Cost of sales 21,007 (47) (b) 20,960 3,246 (118) (b) 3,128 Research and development expense 6,340 (58) (c) 6,282 2,033 (84) (c) 1,949 Acquired in-process research and development 54,900 (54,900) (d) - - - - Selling, general and administrative expense 58,337 (12,752) (e) 45,585 28,960 (2,349) (e) 26,611 Gain on settlement agreement (29,900) 29,900 (f) - - - - Amortization of intangible assets 27,060 (27,060) (g) - 2,540 (2,540) (g) - Interest expense (22,701) (4,783) (h) (17,918) (6,122) (4,382) (h) (1,740) Benefit from (provision for) income taxes 18,189 27,845 (i) (9,656) (57,222) (57,222) (i) - Net income/adjusted earnings (30,667) 41,367 (j) 10,700 94,623 (80,261) (j) 14,362 Explanation of adjustments (j) Calculated by taking (a) minus sum of (b) through (i) (c) Stock-based compensation (f) Gain related to settlement of Endo litigation (i) Non-cash taxes GAAP Non-GAAP GAAP RECONCILATIONS OF GAAP REPORTED TO NON-GAAP ADJUSTED INFORMATION (in thousands) Three Months Ended Three Months Ended December 31, 2015 December 31, 2014 (unaudited) Non-GAAP (g) Amortization of intangible assets (b) Inventory step-up related to product acquisitions Adjustments Adjustments Reported Adjusted Reported (a) Non-cash PDL royalty revenue of $0 and $146,956, and product sales benefit from product acquisitions of $488 and $0, for the three months ended December 31, 2015 and 2014, respectively Adjusted (d) Cebranopodal license fee (e) Horizon defense costs of $8,249 and $0, stock-based compensation of $4,461 and $2,349, contingent consideration of $42 and $0, for the three months ended in December 31, 2015 and 2014, respectively (h) Non-cash interest expense of $4,173 and $3,375, contingent consideration expense of $610 and $1,007, for three months ended December 31, 2015 and 2014, respectively
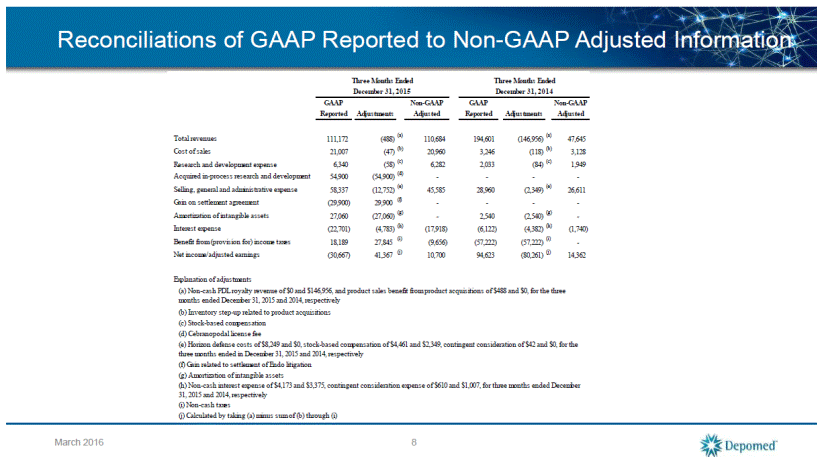
Reconciliations of GAAP Reported to Non-GAAP Adjusted Information 9 March 2016 Total revenues 342,735 9,977 (a) 352,712 405,009 (242,808) (a) 162,201 Cost of sales 67,898 (6,044) (b) 61,854 15,146 (5,010) (b) 10,136 Research and development expense 17,541 (277) (c) 17,264 7,116 (258) (c) 6,858 Acquired in-process research and development 54,900 (54,900) (d) - - - - Selling, general and administrative expense 199,352 (22,115) (e) 177,237 121,126 (9,076) (e) 112,050 Gain on settlement agreement (29,900) 29,900 (f) - - - - Amortization of intangible assets 83,344 (83,344) (g) - 10,161 (10,161) (g) - Interest expense (73,436) (17,937) (h) (55,499) (9,275) (6,572) (h) (2,703) Non-cash interest expense on PDL Liability - - - (14,646) (14,646) (i) - Benefit from (provision for) income taxes 47,499 41,137 (j) 6,362 (81,346) (81,346) (j) - Net income/adjusted earnings (75,738) 123,558 (k) 47,820 131,762 (115,738) (k) 16,024 Explanation of adjustments (i) Non-cash interest expense on PDL liability (k) Calculated by taking (a) minus sum of (b) through (j) (c) Stock-based compensation (h) Non-cash interest expense of $15,630 and $4,200, contingent consideration expense of $2,307 and $2,372, for twelve months ended December 31, 2015 and 2014, respectively (j) Non-cash taxes (a) Non-cash PDL royalty revenue of $0 and $242,808, product sales benefit from product acquisitions of ($9,977) and $0, for the twelve months ended December 31, 2015 and 2014, respectively (b) Inventory step-up related to product acquisitions, $1,094 non-cash PDL cost of sales (d) Cebranopodal license fee (e) Horizon defense costs of $11,869 and $0, stock-based compensation of $13,930 and $8,658, contingent consideration of ($3,684) and $418, for the twelve months ended in December 31, 2015 and 2014, respectively Twelve Months Ended Non-GAAP GAAP (f) Gain related to settlement of Endo litigation (g) Amortization of intangible assets Non-GAAP Adjusted Twelve Months Ended December 31, 2015 December 31, 2014 GAAP Reported Adjustments Adjusted Reported Adjustments
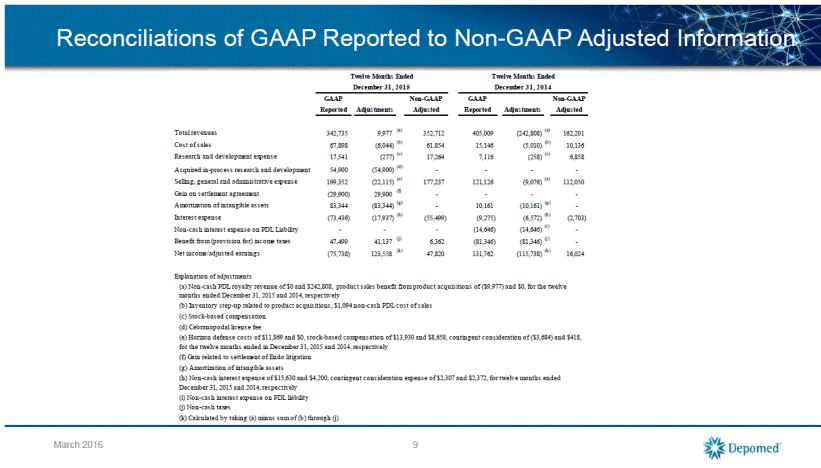
2016 Financial Guidance Total Revenue $485 to $525 million Total Non-GAAP SG&A Expense $180 to $195 million Total Non-GAAP R&D Expense $30 to $40 million Non-GAAP Adjusted Earnings $95 to $115 million Non-GAAP Adjusted EBITDA $175 to $205 million 10 March 2016 The Company expects Q1 2016 Revenues to be approximately 20 - 21% of Full Year Revenues.
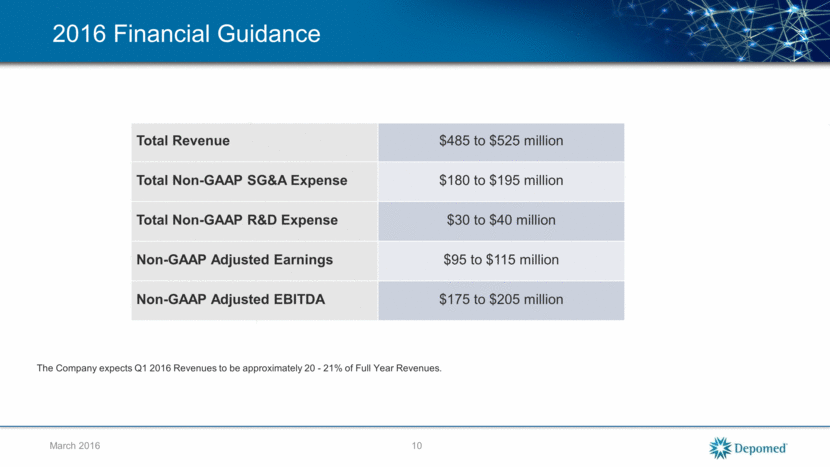
NUCYNTA Leading The Latest Chapter of Depomed’s Growth Story – Blockbuster Potential (1) Adds significant revenue and earnings to an already strong business Only new chemical entity in CII space approved by FDA in last 30 years Differentiated in multi-billion dollar pain market Exclusivity expected for a decade or more (2) Significant overlap with Depomed’s expertise in pain and neurology December 2015: All-time high NUCYTNA ER prescriptions March 2016 NUCYNTA: Potential to Exceed $1 Billion in Sales (1) There can be no assurance that the anticipated results will be achieved Exclusivity with respect to specific drugs may not necessarily assure sustained or increased revenue growth given the risk associated with competition from generic and non-generic products with similar treatment 11
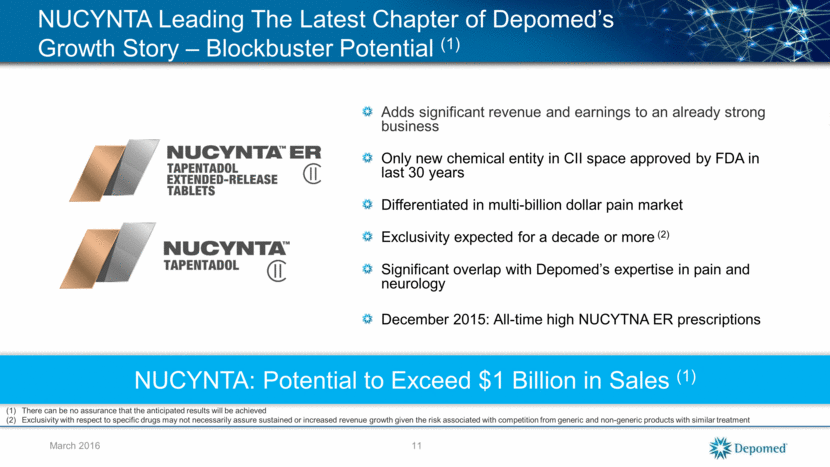
Depomed’s NUCYNTA Growth Strategy – Targeting to Surpass $1 Billion in Sales (1) March 2016 Proper Dosing Pricing and Access Positioning Promotion Significantly increased promotion and marketing efforts Revamped product positioning and messaging Maximize brand through pricing and access strategies Educate physicians on titration 1 2 3 4 = There can be no assurance that the anticipated results will be achieved 12
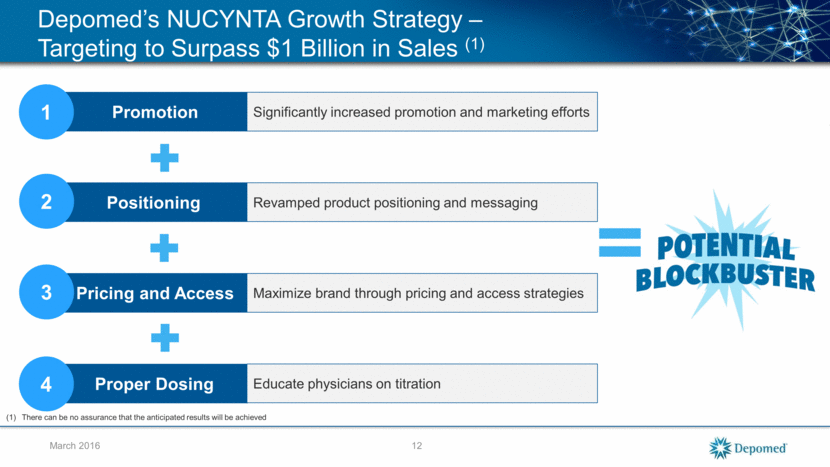
Promotion: Significantly Increased to Drive Prescriptions and Market Share 13 March 2016 Increased Sales Force 1 Optimized Medical Education Identifying Appropriate Target Prescribers Promotion strategy consists of: 3-fold increase to 277 reps Highly experienced in pain and neurology Resumed full medical support with medical science liaisons Since relaunch in June 2015 more than 850 medical support and speaker programs to date 25,000 target prescribers Targeting NUCYNTA users and current and prior top users of category
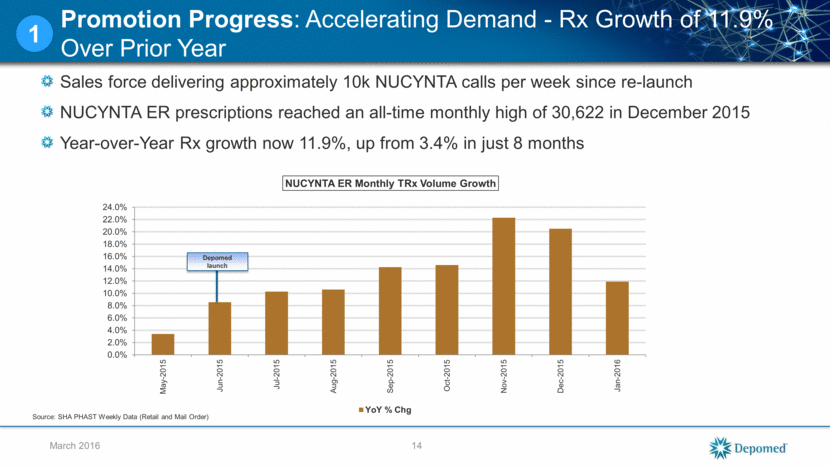
Sales force delivering approximately 10k NUCYNTA calls per week since re-launch NUCYNTA ER prescriptions reached an all-time monthly high of 30,622 in December 2015 Year-over-Year Rx growth now 11.9%, up from 3.4% in just 8 months 14 March 2016 Promotion Progress: Accelerating Demand - Rx Growth of 11.9% Over Prior Year 1 Depomed launch Source: SHA PHAST Weekly Data (Retail and Mail Order) 0.0% 2.0% 4.0% 6.0% 8.0% 10.0% 12.0% 14.0% 16.0% 18.0% 20.0% 22.0% 24.0% May-2015 Jun-2015 Jul-2015 Aug-2015 Sep-2015 Oct-2015 Nov-2015 Dec-2015 Jan-2016 NUCYNTA ER Monthly TRx Volume Growth YoY % Chg
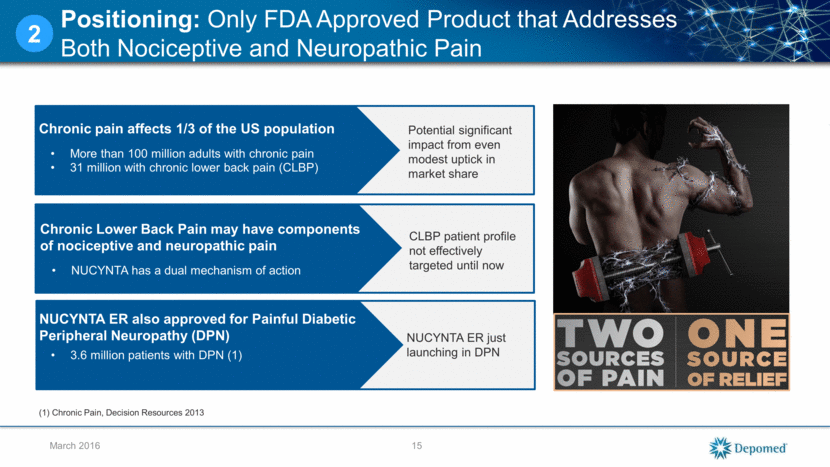
Positioning: Only FDA Approved Product that Addresses Both Nociceptive and Neuropathic Pain 15 March 2016 Chronic pain affects 1/3 of the US population More than 100 million adults with chronic pain 31 million with chronic lower back pain (CLBP) Potential significant impact from even modest uptick in market share Chronic Lower Back Pain may have components of nociceptive and neuropathic pain NUCYNTA has a dual mechanism of action CLBP patient profile not effectively targeted until now NUCYNTA ER also approved for Painful Diabetic Peripheral Neuropathy (DPN) 3.6 million patients with DPN (1) NUCYNTA ER just launching in DPN 2 (1) Chronic Pain, Decision Resources 2013
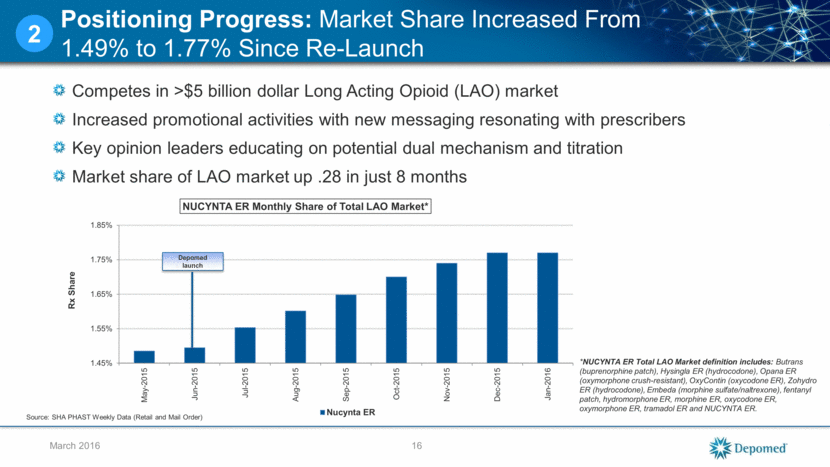
Competes in >$5 billion dollar Long Acting Opioid (LAO) market Increased promotional activities with new messaging resonating with prescribers Key opinion leaders educating on potential dual mechanism and titration Market share of LAO market up .28 in just 8 months 16 March 2016 Positioning Progress: Market Share Increased From 1.49% to 1.77% Since Re-Launch 2 *NUCYNTA ER Total LAO Market definition includes: Butrans (buprenorphine patch), Hysingla ER (hydrocodone), Opana ER (oxymorphone crush-resistant), OxyContin (oxycodone ER), Zohydro ER (hydrocodone), Embeda (morphine sulfate/naltrexone), fentanyl patch, hydromorphone ER, morphine ER, oxycodone ER, oxymorphone ER, tramadol ER and NUCYNTA ER. Depomed launch Source: SHA PHAST Weekly Data (Retail and Mail Order) 1.45% 1.55% 1.65% 1.75% 1.85% May-2015 Jun-2015 Jul-2015 Aug-2015 Sep-2015 Oct-2015 Nov-2015 Dec-2015 Jan-2016 Rx Share NUCYNTA ER Monthly Share of Total LAO Market* Nucynta ER
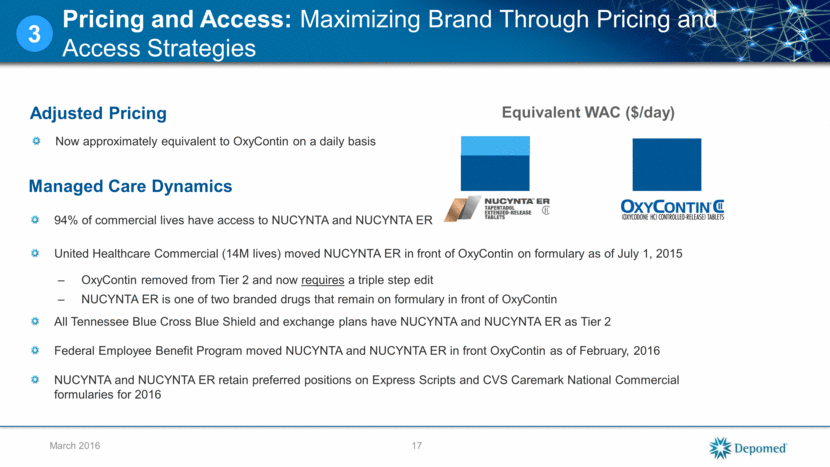
Pricing and Access: Maximizing Brand Through Pricing and Access Strategies 17 March 2016 94% of commercial lives have access to NUCYNTA and NUCYNTA ER 3 Now approximately equivalent to OxyContin on a daily basis Adjusted Pricing Managed Care Dynamics Equivalent WAC ($/day) United Healthcare Commercial (14M lives) moved NUCYNTA ER in front of OxyContin on formulary as of July 1, 2015 OxyContin removed from Tier 2 and now requires a triple step edit NUCYNTA ER is one of two branded drugs that remain on formulary in front of OxyContin All Tennessee Blue Cross Blue Shield and exchange plans have NUCYNTA and NUCYNTA ER as Tier 2 Federal Employee Benefit Program moved NUCYNTA and NUCYNTA ER in front OxyContin as of February, 2016 NUCYNTA and NUCYNTA ER retain preferred positions on Express Scripts and CVS Caremark National Commercial formularies for 2016
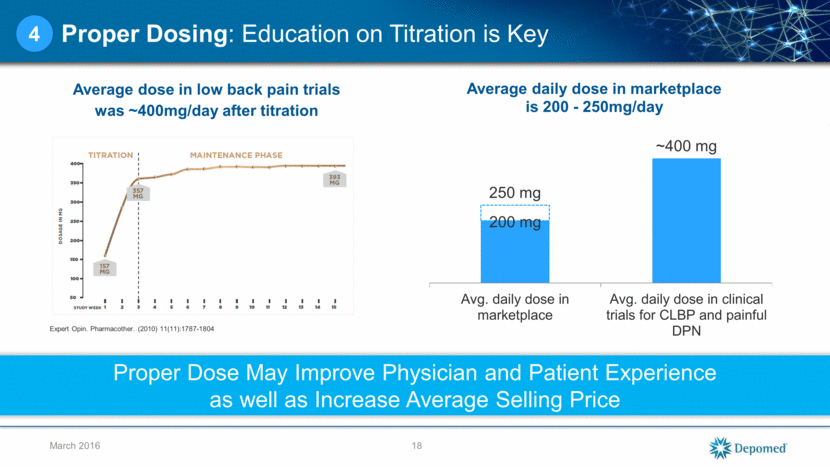
Proper Dosing: Education on Titration is Key Average dose in low back pain trials was ~400mg/day after titration 18 March 2016 4 200 mg Proper Dose May Improve Physician and Patient Experience as well as Increase Average Selling Price Expert Opin. Pharmacother. (2010) 11(11):1787-1804 250 mg ~400 mg Avg. daily dose in marketplace Avg. daily dose in clinical trials for CLBP and painful DPN Average daily dose in marketplace is 200 - 250mg/day
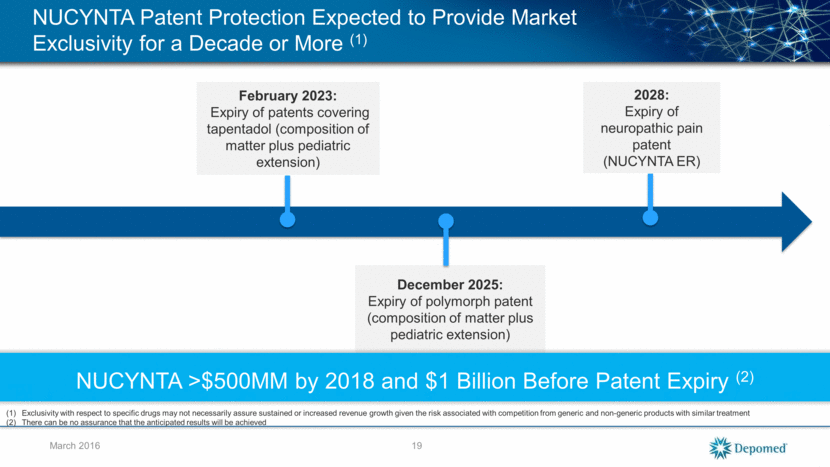
NUCYNTA Patent Protection Expected to Provide Market Exclusivity for a Decade or More (1) March 2016 February 2023: Expiry of patents covering tapentadol (composition of matter plus pediatric extension) December 2025: Expiry of polymorph patent (composition of matter plus pediatric extension) 2028: Expiry of neuropathic pain patent (NUCYNTA ER) Exclusivity with respect to specific drugs may not necessarily assure sustained or increased revenue growth given the risk associated with competition from generic and non-generic products with similar treatment There can be no assurance that the anticipated results will be achieved 19 NUCYNTA >$500MM by 2018 and $1 Billion Before Patent Expiry (2)
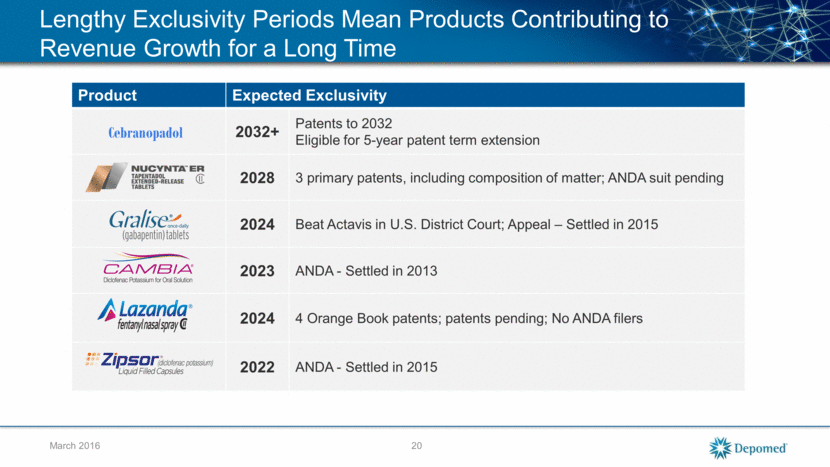
Lengthy Exclusivity Periods Mean Products Contributing to Revenue Growth for a Long Time March 2016 Product Expected Exclusivity 2032+ Patents to 2032 Eligible for 5-year patent term extension 2028 3 primary patents, including composition of matter; ANDA suit pending 2024 Beat Actavis in U.S. District Court; Appeal – Settled in 2015 2023 ANDA - Settled in 2013 2024 4 Orange Book patents; patents pending; No ANDA filers 2022 ANDA - Settled in 2015 20 Cebranopadol
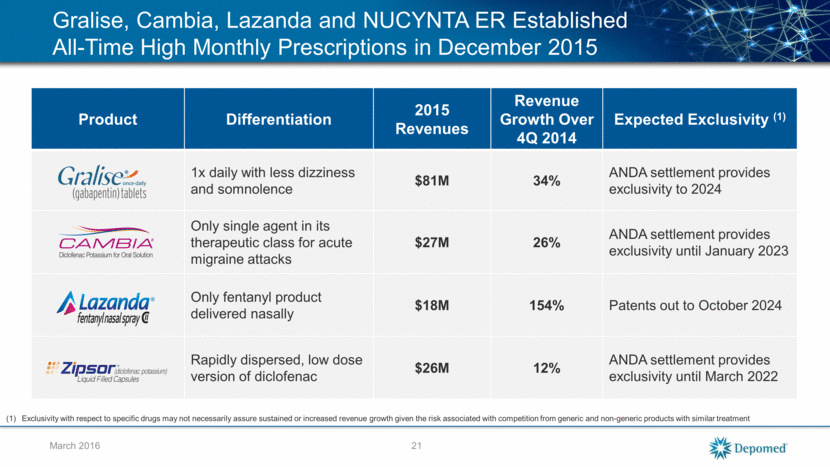
March 2016 Gralise, Cambia, Lazanda and NUCYNTA ER Established All-Time High Monthly Prescriptions in December 2015 Product Differentiation 2015 Revenues Revenue Growth Over 4Q 2014 Expected Exclusivity (1) 1x daily with less dizziness and somnolence $81M 34% ANDA settlement provides exclusivity to 2024 Only single agent in its therapeutic class for acute migraine attacks $27M 26% ANDA settlement provides exclusivity until January 2023 Only fentanyl product delivered nasally $18M 154% Patents out to October 2024 Rapidly dispersed, low dose version of diclofenac $26M 12% ANDA settlement provides exclusivity until March 2022 Exclusivity with respect to specific drugs may not necessarily assure sustained or increased revenue growth given the risk associated with competition from generic and non-generic products with similar treatment 21
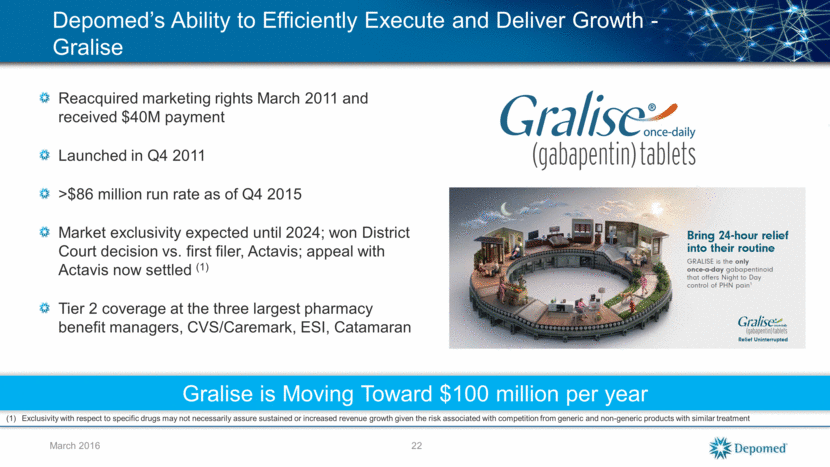
March 2016 Depomed’s Ability to Efficiently Execute and Deliver Growth - Gralise Reacquired marketing rights March 2011 and received $40M payment Launched in Q4 2011 >$86 million run rate as of Q4 2015 Market exclusivity expected until 2024; won District Court decision vs. first filer, Actavis; appeal with Actavis now settled (1) Tier 2 coverage at the three largest pharmacy benefit managers, CVS/Caremark, ESI, Catamaran Gralise is Moving Toward $100 million per year Exclusivity with respect to specific drugs may not necessarily assure sustained or increased revenue growth given the risk associated with competition from generic and non-generic products with similar treatment 22
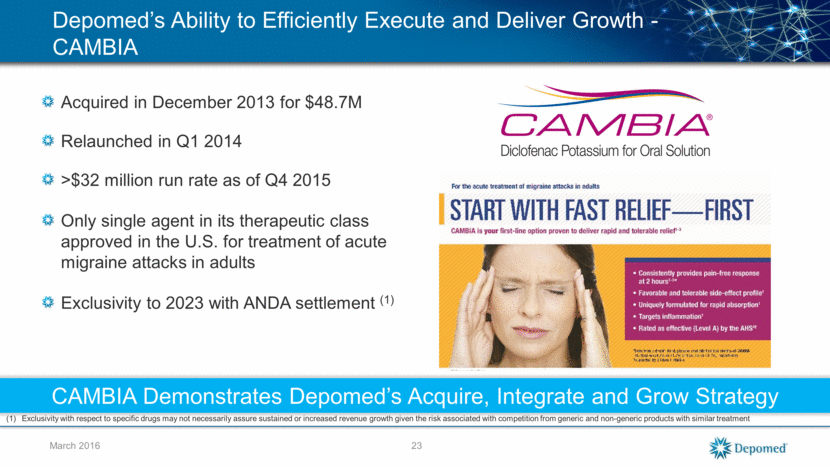
March 2016 Depomed’s Ability to Efficiently Execute and Deliver Growth - CAMBIA Acquired in December 2013 for $48.7M Relaunched in Q1 2014 >$32 million run rate as of Q4 2015 Only single agent in its therapeutic class approved in the U.S. for treatment of acute migraine attacks in adults Exclusivity to 2023 with ANDA settlement (1) CAMBIA Demonstrates Depomed’s Acquire, Integrate and Grow Strategy Exclusivity with respect to specific drugs may not necessarily assure sustained or increased revenue growth given the risk associated with competition from generic and non-generic products with similar treatment 23
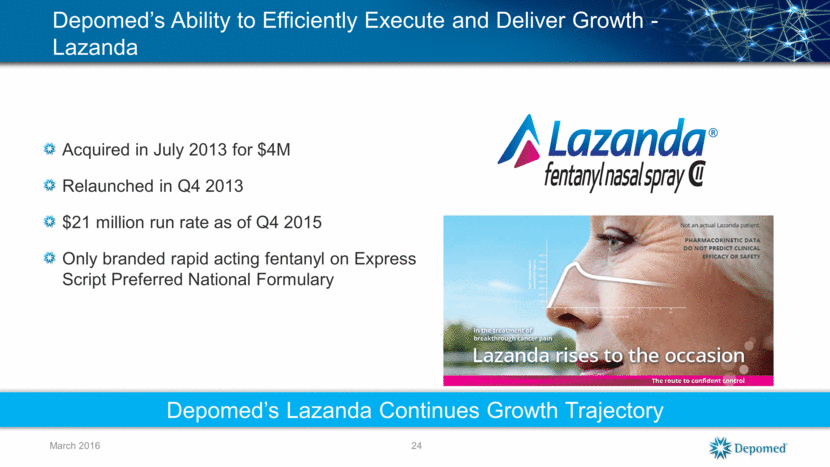
March 2016 Depomed’s Ability to Efficiently Execute and Deliver Growth - Lazanda Acquired in July 2013 for $4M Relaunched in Q4 2013 $21 million run rate as of Q4 2015 Only branded rapid acting fentanyl on Express Script Preferred National Formulary Depomed’s Lazanda Continues Growth Trajectory 24
March 2016 Cebranopadol – Late-Stage, Novel, First-in-Class Potent Analgesic Novel, First-In-Class Asset Acquired December 2015 to build on leading position in pain and neurology Unique dual mechanism-of-action that incorporates novel pharmacology: nociceptin/orphanin peptide (NOP) receptor agonist activity Treatment of moderate to severe chronic musculoskeletal and neuropathic pain No other high potency NOP agonists marketed or in clinical development Extensive Phase II Program Completed 7 Phase II trials completed in chronic lower back pain, painful DPN and osteoarthritis; publication of results starting in 2016 ~2,000 patient/subject exposures to date cLPB Trial: Clinically and statistically significant improvements in pain across all cebranopadol arms End-of-Phase II meeting with FDA and other preparation for Phase III is focus for 2016 Anticipate initiation of Phase III in 2017 Creative Acquisition Settlement agreement with Endo resolving ongoing patent litigation Provides limited covenant not to sue under certain Acuform® patents Upfront cash of $25 million Lengthy Patent Exclusivity Patent protection through at least 2032 plus up to 5 years of patent term extension 25 Unique Molecule May Provide Opioid-Like Efficacy with Lower Side Effect and Abuse Potential
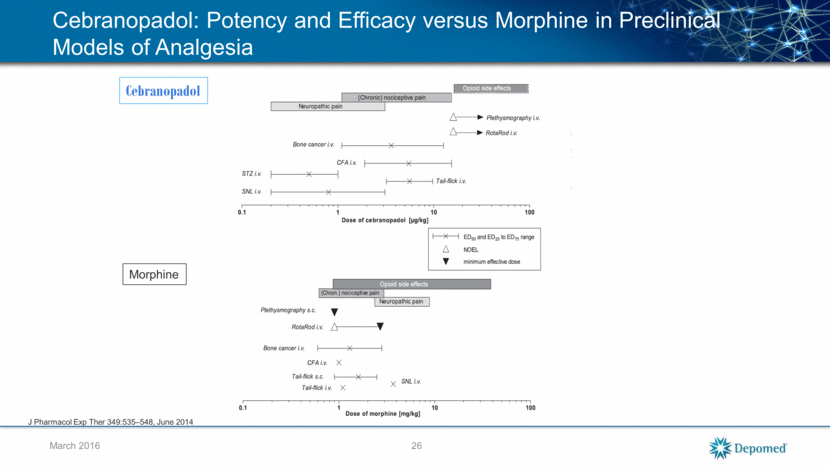
Cebranopadol: Potency and Efficacy versus Morphine in Preclinical Models of Analgesia 26 Cebranopadol Morphine J Pharmacol Exp Ther 349:535–548, June 2014 March 2016
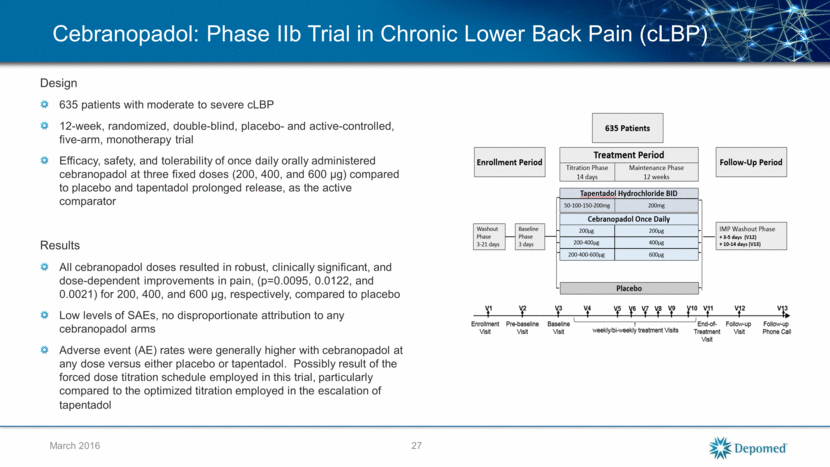
Cebranopadol: Phase IIb Trial in Chronic Lower Back Pain (cLBP) Design 635 patients with moderate to severe cLBP 12-week, randomized, double-blind, placebo- and active-controlled, five-arm, monotherapy trial Efficacy, safety, and tolerability of once daily orally administered cebranopadol at three fixed doses (200, 400, and 600) compared to placebo and tapentadol prolonged release, as the active comparator Results All cebranopadol doses resulted in robust, clinically significant, and dose-dependent improvements in pain, (p=0.0095, 0.0122, and 0.0021) for 200, 400, and 600, respectively, compared to placebo Low levels of SAEs, no disproportionate attribution to any cebranopadol arms Adverse event (AE) rates were generally higher with cebranopadol at any dose versus either placebo or tapentadol. Possibly result of the forced dose titration schedule employed in this trial, particularly compared to the optimized titration employed in the escalation of tapentadol 27 March 2016
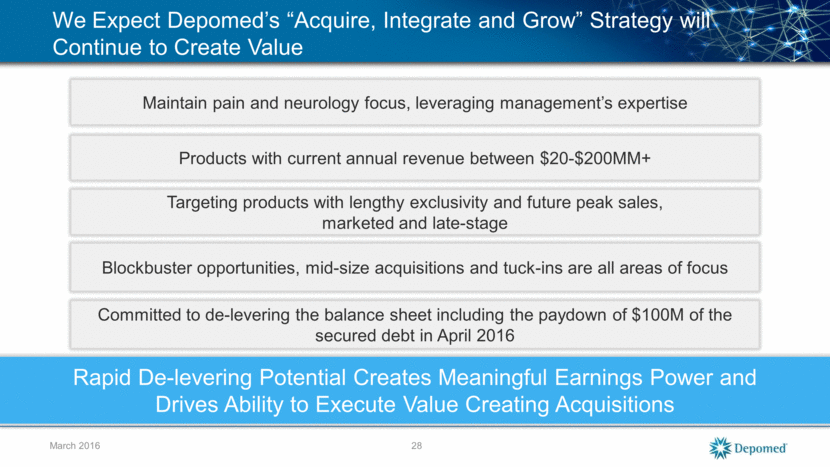
March 2016 We Expect Depomed’s “Acquire, Integrate and Grow” Strategy will Continue to Create Value Maintain pain and neurology focus, leveraging management’s expertise Products with current annual revenue between $20-$200MM+ Targeting products with lengthy exclusivity and future peak sales, marketed and late-stage Rapid De-levering Potential Creates Meaningful Earnings Power and Drives Ability to Execute Value Creating Acquisitions Blockbuster opportunities, mid-size acquisitions and tuck-ins are all areas of focus 28 Committed to de-levering the balance sheet including the paydown of $100M of the secured debt in April 2016
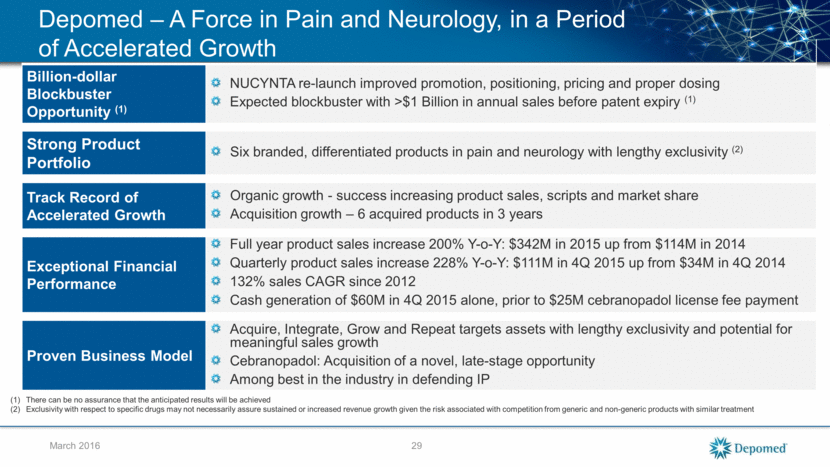
March 2016 Depomed – A Force in Pain and Neurology, in a Period of Accelerated Growth Billion-dollar Blockbuster Opportunity (1) NUCYNTA re-launch improved promotion, positioning, pricing and proper dosing Expected blockbuster with >$1 Billion in annual sales before patent expiry (1) Strong Product Portfolio Six branded, differentiated products in pain and neurology with lengthy exclusivity (2) Track Record of Accelerated Growth Organic growth - success increasing product sales, scripts and market share Acquisition growth – 6 acquired products in 3 years Exceptional Financial Performance Full year product sales increase 200% Y-o-Y: $342M in 2015 up from $114M in 2014 Quarterly product sales increase 228% Y-o-Y: $111M in 4Q 2015 up from $34M in 4Q 2014 132% sales CAGR since 2012 Cash generation of $60M in 4Q 2015 alone, prior to $25M cebranopadol license fee payment Proven Business Model Acquire, Integrate, Grow and Repeat targets assets with lengthy exclusivity and potential for meaningful sales growth Cebranopadol: Acquisition of a novel, late-stage opportunity Among best in the industry in defending IP There can be no assurance that the anticipated results will be achieved Exclusivity with respect to specific drugs may not necessarily assure sustained or increased revenue growth given the risk associated with competition from generic and non-generic products with similar treatment 29
Thank You www.depomed.com

