Attached files
| file | filename |
|---|---|
| 8-K - 8-K - TRANSATLANTIC PETROLEUM LTD. | tat-8k_20160311.htm |
| EX-99.1 - EX-99.1 - TRANSATLANTIC PETROLEUM LTD. | tat-ex991_6.htm |
28th annual Roth conference Value investing during a period of Market overreaction
The Company has not completed its audit of its 2015 financial results. As a result, the Company’s 2015 results of operations, Adjusted EBITDA and Adjusted EBITDAX presented herein are preliminary estimates and are subject to change, possibly materially. Investors should not place undue reliance on these preliminary, estimated financial results. Outlooks, projections, estimates, targets and business plans in this presentation or any related subsequent discussions are forward-looking statements. Actual future results, including TransAtlantic Petroleum Ltd.’s own production growth and mix; financial results; the amount and mix of capital expenditures; resource additions and recoveries; finding and development costs; project and drilling plans, timing, costs, and capacities; revenue enhancements and cost efficiencies; industry margins; margin enhancements and integration benefits; and the impact of technology could differ materially due to a number of factors. These include adjustments resulting from the completion by the Company of its review of the Company’s financial statements for the year ended December 31, 2015, our ability to access sufficient capital to fund our operations, sell assets, repay our borrowing base deficiency and restructure our debt; fluctuations in and volatility of the market prices for oil and natural gas products; the ability to produce and transport oil and natural gas; the results of exploration and development drilling and related activities; global economic conditions, particularly in the countries in which we carry on business, especially economic slowdowns; actions by governmental authorities including increases in taxes, legislative and regulatory initiatives related to fracture stimulation activities, changes in environmental and other regulations, and renegotiations of contracts; political uncertainty, including actions by insurgent groups or other conflicts; the negotiation and closing of material contracts or sale of assets; future capital requirements and the availability of financing; estimates and economic assumptions used in connection with our acquisitions; risks associated with drilling, operating and decommissioning wells; actions of third-party co-owners of interests in properties in which we also own an interest; our ability to effectively integrate companies and properties that we acquire; and other factors discussed here and under the heading “Risk Factors" in our Annual Report on Form 10-K for the year ended December 31, 2014, which is available on our website at www.transatlanticpetroleum.com and on www.sec.gov. See also TransAtlantic’s audited financial statements and the accompanying management discussion and analysis. Forward-looking statements are based on management’s knowledge and reasonable expectations on the date hereof, and we assume no duty to update these statements as of any future date. The information set forth in this presentation does not constitute an offer, solicitation or recommendation to sell or an offer to buy any securities of the Company. The information published herein is provided for informational purposes only. The Company makes no representation that the information and opinions expressed herein are accurate, complete or current. The information contained herein is current as of the date hereof, but may become outdated or subsequently may change. Nothing contained herein constitutes financial, legal, tax, or other advice. The SEC has generally permitted oil and gas companies, in their filing with the SEC, to disclose proved, probable and possible reserves. We may use descriptions of volumes of resources or reserves potentially recoverable through additional drilling or recovery techniques that the SEC’s guidelines may prohibit us from including in filings with the SEC. These estimates are by their nature more speculative that estimates of proved, probable and possible reserves and accordingly are subject to substantially greater risk of actually being realized by the Company. There is no certainty that any portion of estimated prospective resources will be discovered. If discovered, there is no certainty that it will be commercially viable to produce any portion of the estimated prospective resources. Possible reserves are those additional reserves that are less certain to be recovered than probable reserves. There is a 10% probability that the quantities actually recovered will equal or exceed the sum of proved plus probable plus possible reserves. Note on Adjusted EBITDAX and EBITDA: Adjusted EBITDAX is a non-GAAP financial measure that represents earnings from continuing operations before income taxes, interest, depreciation, depletion, amortization, impairment, abandonment, and exploration expenses, unrealized derivative gains and losses, foreign exchange gains and losses, non-cash share-based compensation expense and significant non-recurring expenses. The Company believes Adjusted EBITDAX and EBITDA assists management and investors in comparing the Company’s performance on a consistent basis without regard to depreciation, depletion and amortization and impairment of oil and natural gas properties and exploration expenses, which can vary significantly from period to period. In addition, management uses Adjusted EBITDAX as a financial measure to evaluate the Company’s operating performance. Adjusted EBITDAX and EBITDA is also widely used by investors and rating agencies. Adjusted EBITDAX and EBITDA is not a measure of financial performance under GAAP. Accordingly, it should not be considered as a substitute for net income, or income from operations prepared in accordance with GAAP. Net income, and income from operations may vary materially from Adjusted EBITDAX. Investors should carefully consider the specific items included in the computation of Adjusted EBITDAX. The Company has disclosed Adjusted EBITDAX to permit a comparative analysis of its operating performance relative to other companies. Note on Internally Generated Reserve Estimates: We have included in this presentation internally generated estimates of non-proved or P3 reserves, potential resources or potential reserves, potential well locations for non-proved or P3 reserves and production potential. These estimates are inherently more speculative than our estimates of proved reserves or the estimates included in our December 31, 2015 reserve reports, which were prepared by DeGolyer and MacNaughton. There is no assurance that we will drill these wells, recover the estimated quantities of oil and gas or reach certain levels of production. Our ultimate performance and recovery will be dependent upon numerous factors, including actual geological conditions, oil and gas prices, exploration and drilling costs, and our future drilling decisions and budgets based on our future evaluation of risk, returns and the availability of capital. Note on BOE: BOE (barrel of oil equivalent) is derived by converting natural gas to oil in the ratio of six thousand cubic feet (MCF) of natural gas to one barrel (bbl) of oil. BOE may be misleading, particularly if used in isolation. A BOE conversion ratio of 6 Mcf:1 bbl is based on an energy equivalency conversion method primarily applicable at the burner tip and does not represent a value equivalency at the wellhead. Forward looking statements/Non-GAAP Financial measures
On March 3rd, 2016, TransAtlantic announced completion of the Albania divestiture. Due to the discontinued nature of the Albania business, the materials in this presentation do not contain financial or operational information regarding our former Albania operations. Please see appendix for more details regarding the sale of the Albania business. Discontinued operations Albania
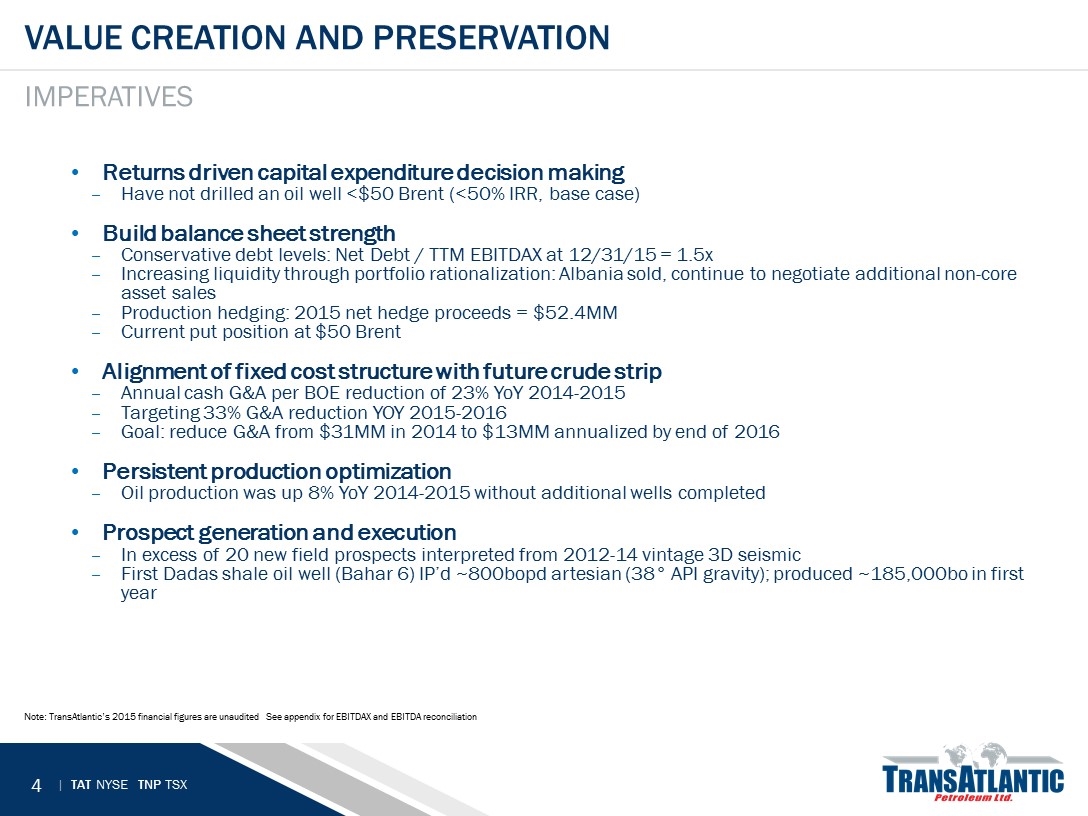
Returns driven capital expenditure decision making Have not drilled an oil well <$50 Brent (<50% IRR, base case) Build balance sheet strength Conservative debt levels: Net Debt / TTM EBITDAX at 12/31/15 = 1.5x Increasing liquidity through portfolio rationalization: Albania sold, continue to negotiate additional non-core asset sales Production hedging: 2015 net hedge proceeds = $52.4MM Current put position at $50 Brent Alignment of fixed cost structure with future crude strip Annual cash G&A per BOE reduction of 23% YoY 2014-2015 Targeting 33% G&A reduction YOY 2015-2016 Goal: reduce G&A from $31MM in 2014 to $13MM annualized by end of 2016 Persistent production optimization Oil production was up 8% YoY 2014-2015 without additional wells completed Prospect generation and execution In excess of 20 new field prospects interpreted from 2012-14 vintage 3D seismic First Dadas shale oil well (Bahar 6) IP’d ~800bopd artesian (38° API gravity); produced ~185,000bo in first year Value creation and preservation Imperatives Note: TransAtlantic’s 2015 financial figures are unaudited See appendix for EBITDAX and EBITDA reconciliation
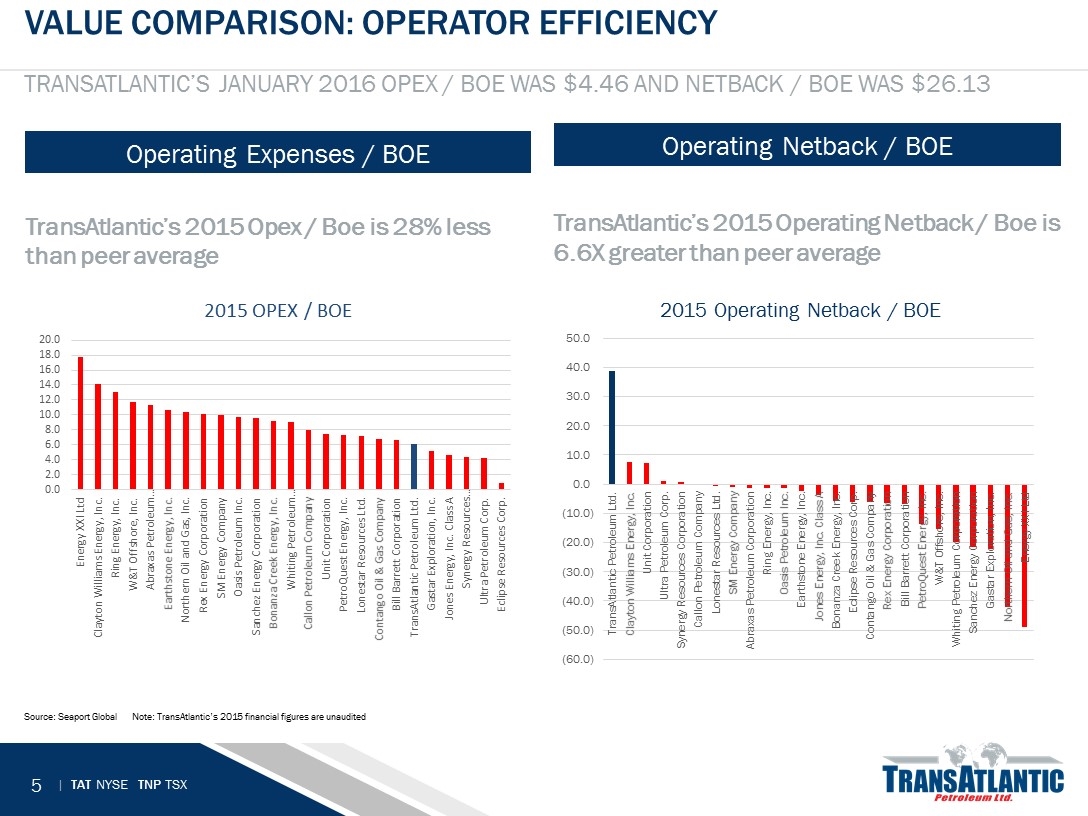
TransAtlantic’s 2015 Opex / Boe is 28% less than peer average Value comparison: Operator efficiency TRANSATLANTIC’S January 2016 Opex / Boe was $4.46 and netback / boe was $26.13 TransAtlantic’s 2015 Operating Netback / Boe is 6.6X greater than peer average Source: Seaport Global Note: TransAtlantic’s 2015 financial figures are unaudited Operating Expenses / BOE Operating Netback / BOE
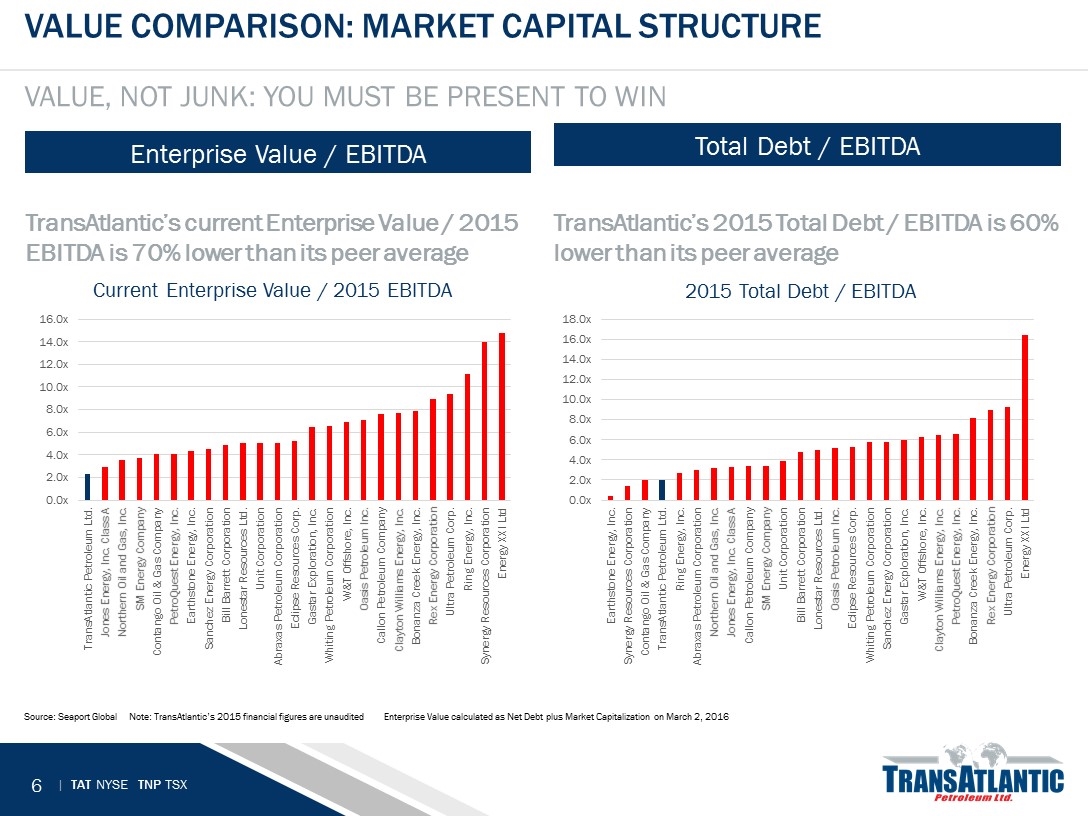
TransAtlantic’s current Enterprise Value / 2015 EBITDA is 70% lower than its peer average Value comparison: Market capital structure Value, not junk: you must be present to win TransAtlantic’s 2015 Total Debt / EBITDA is 60% lower than its peer average Source: Seaport Global Note: TransAtlantic’s 2015 financial figures are unaudited Enterprise Value calculated as Net Debt plus Market Capitalization on March 2, 2016 Enterprise Value / EBITDA Total Debt / EBITDA
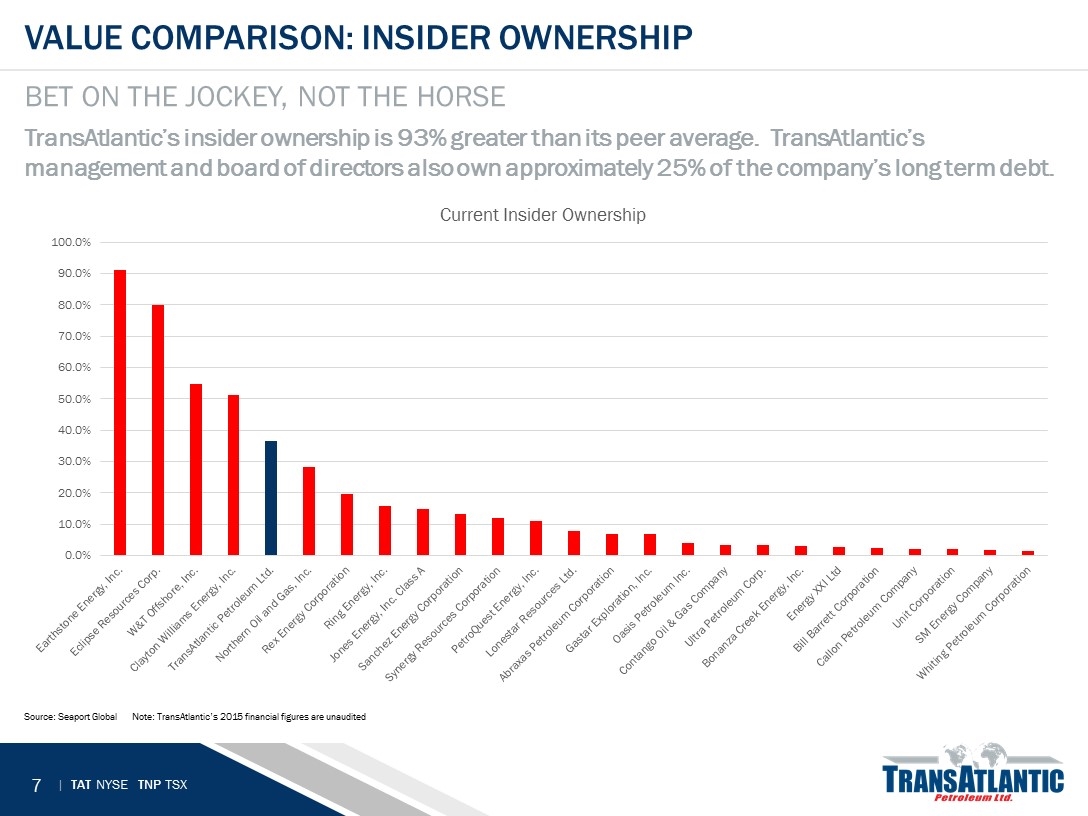
TransAtlantic’s insider ownership is 93% greater than its peer average. TransAtlantic’s management and board of directors also own approximately 25% of the company’s long term debt. Value comparison: Insider ownership Bet on the jockey, not the horse Source: Seaport Global Note: TransAtlantic’s 2015 financial figures are unaudited
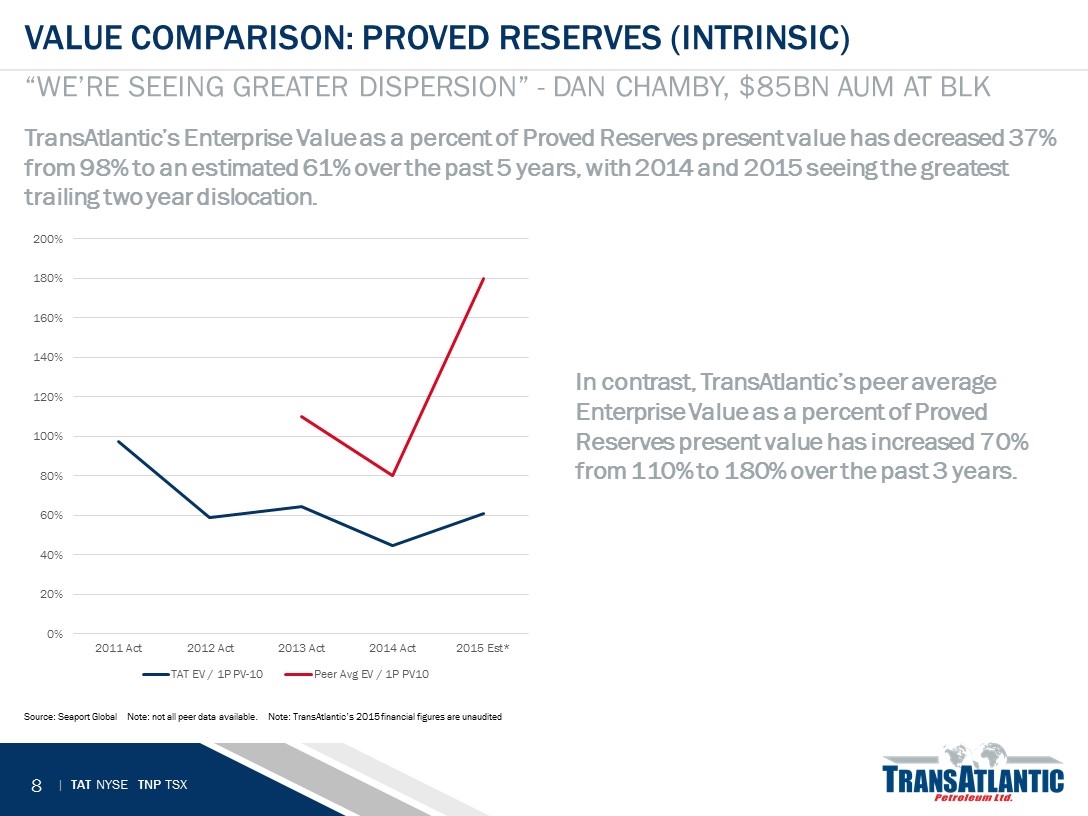
TransAtlantic’s Enterprise Value as a percent of Proved Reserves present value has decreased 37% from 98% to an estimated 61% over the past 5 years, with 2014 and 2015 seeing the greatest trailing two year dislocation. In contrast, TransAtlantic’s peer average Enterprise Value as a percent of Proved Reserves present value has increased 70% from 110% to 180% over the past 3 years. Value comparison: proved reserves (intrinsic) “We’re seeing greater dispersion” - Dan Chamby, $85bn AUM at BLK Source: Seaport Global Note: not all peer data available. Note: TransAtlantic’s 2015 financial figures are unaudited
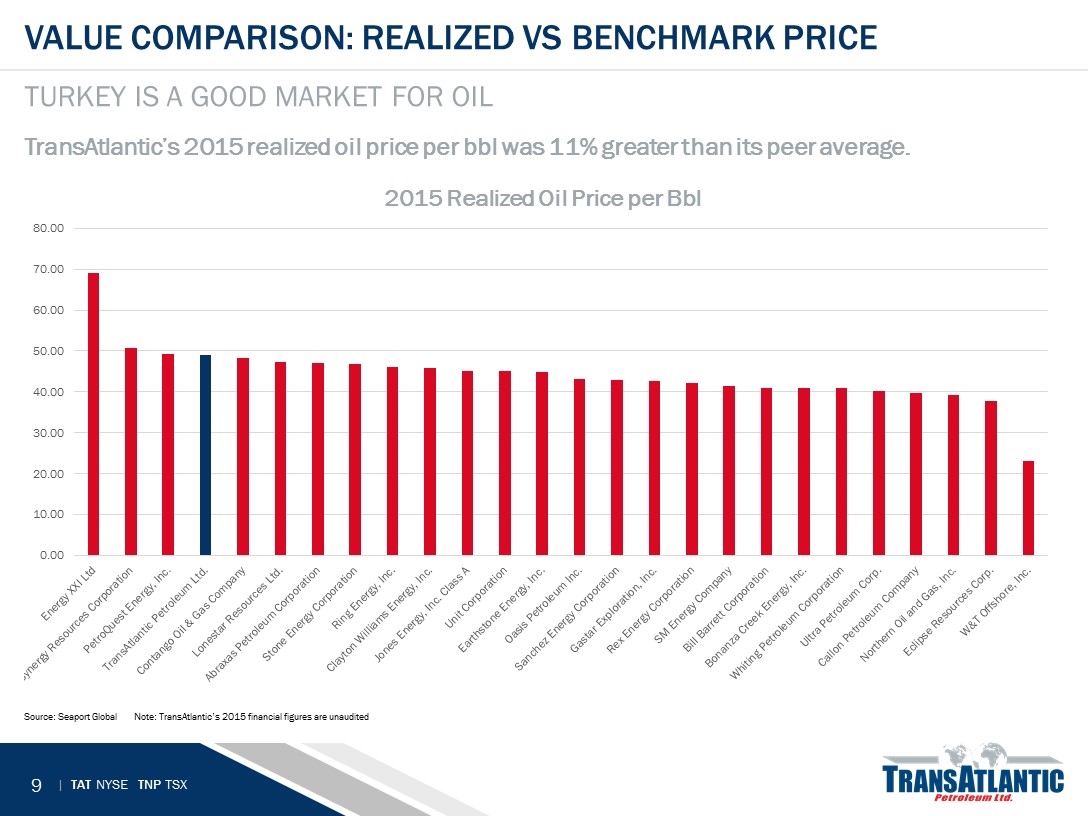
TransAtlantic’s 2015 realized oil price per bbl was 11% greater than its peer average. Value comparison: realized vs benchmark price Turkey is a good market for oil Source: Seaport GlobalNote: TransAtlantic’s 2015 financial figures are unaudited
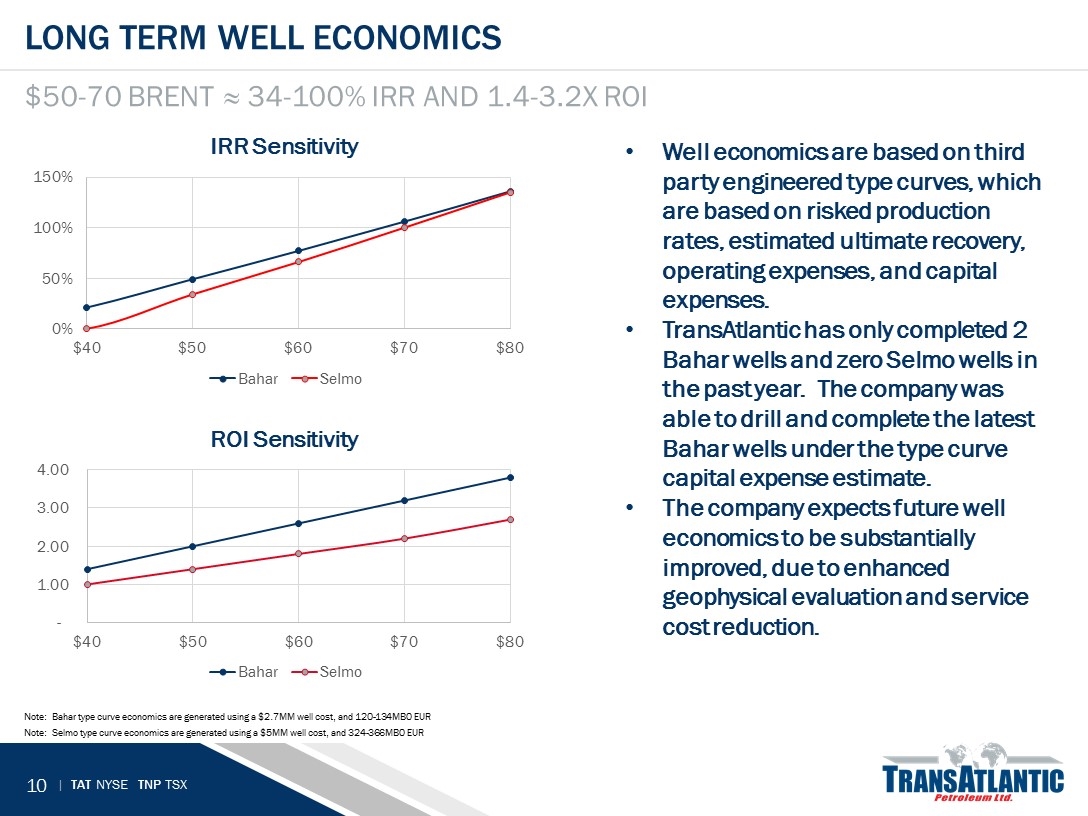
Long term well economics $50-70 Brent ≈ 34-100% IRR and 1.4-3.2x ROI Note: Bahar type curve economics are generated using a $2.7MM well cost, and 120-134MBO EUR Note: Selmo type curve economics are generated using a $5MM well cost, and 324-366MBO EUR Well economics are based on third party engineered type curves, which are based on risked production rates, estimated ultimate recovery, operating expenses, and capital expenses. TransAtlantic has only completed 2 Bahar wells and zero Selmo wells in the past year. The company was able to drill and complete the latest Bahar wells under the type curve capital expense estimate. The company expects future well economics to be substantially improved, due to enhanced geophysical evaluation and service cost reduction.
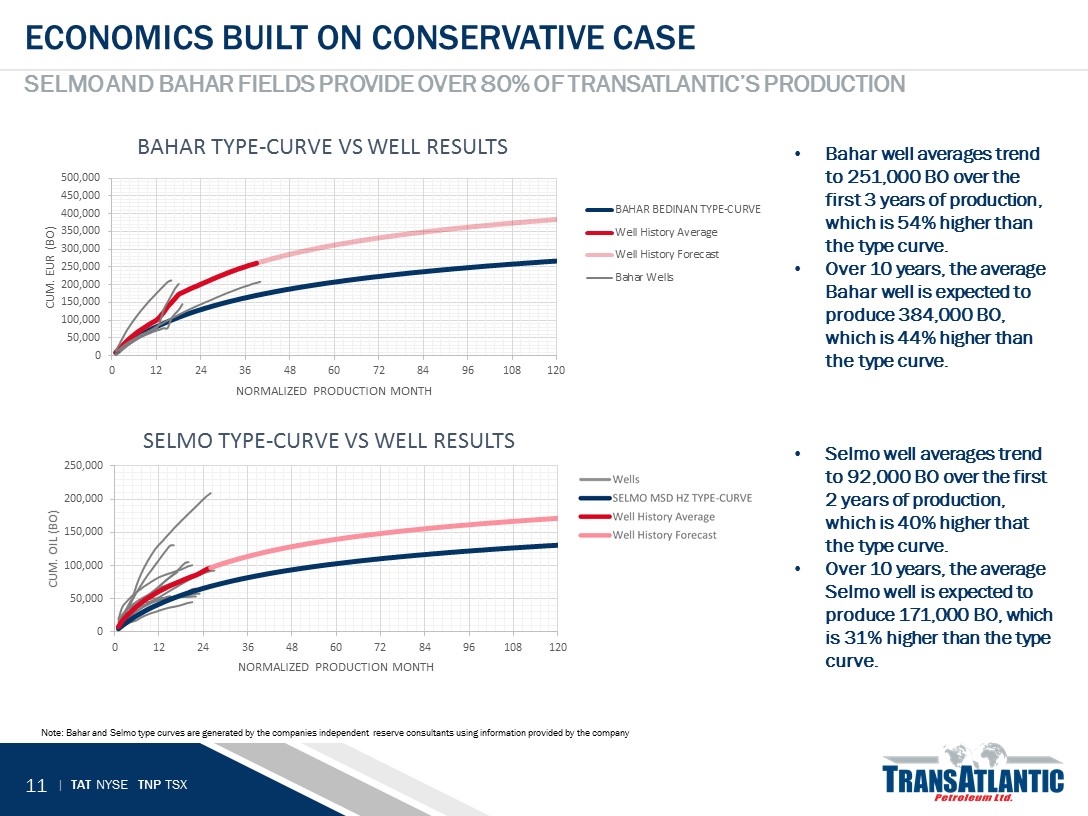
Economics built on conservative case Selmo and bahar fields provide over 80% of Transatlantic’s production Note: Bahar and Selmo type curves are generated by the companies independent reserve consultants using information provided by the company Bahar well averages trend to 251,000 BO over the first 3 years of production, which is 54% higher than the type curve. Over 10 years, the average Bahar well is expected to produce 384,000 BO, which is 44% higher than the type curve. Selmo well averages trend to 92,000 BO over the first 2 years of production, which is 40% higher that the type curve. Over 10 years, the average Selmo well is expected to produce 171,000 BO, which is 31% higher than the type curve.
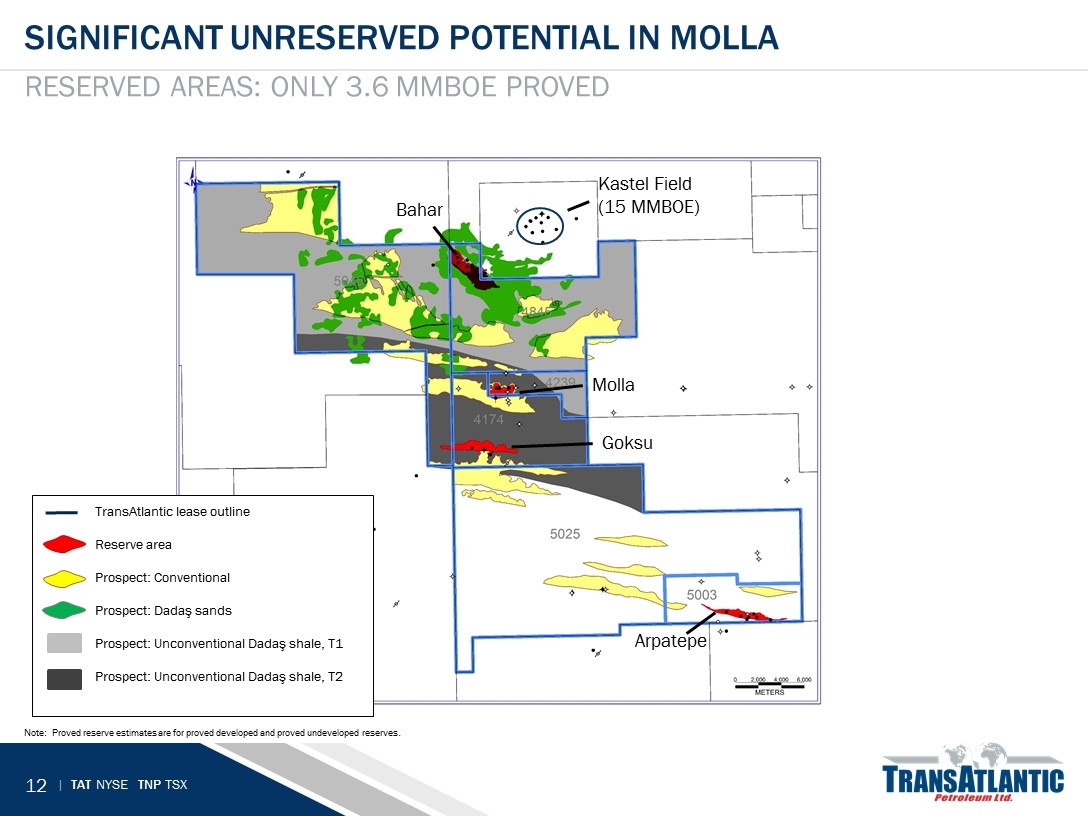
Significant unreserved potential in molla Reserved areas: Only 3.6 MMBOE Proved Note: Proved reserve estimates are for proved developed and proved undeveloped reserves. TransAtlantic lease outline Reserves TransAtlantic lease outline Reserve area Prospect: Conventional TransAtlantic lease outline Reserve area Prospect: Conventional Prospect: Dadaş sands TransAtlantic lease outline Reserve area Prospect: Conventional Prospect: Dadaş sands Prospect: Unconventional Dadaş shale, T1 Prospect: Unconventional Dadaş shale, T2 Kastel Field (15 MMBOE) Molla Bahar Goksu Arpatepe
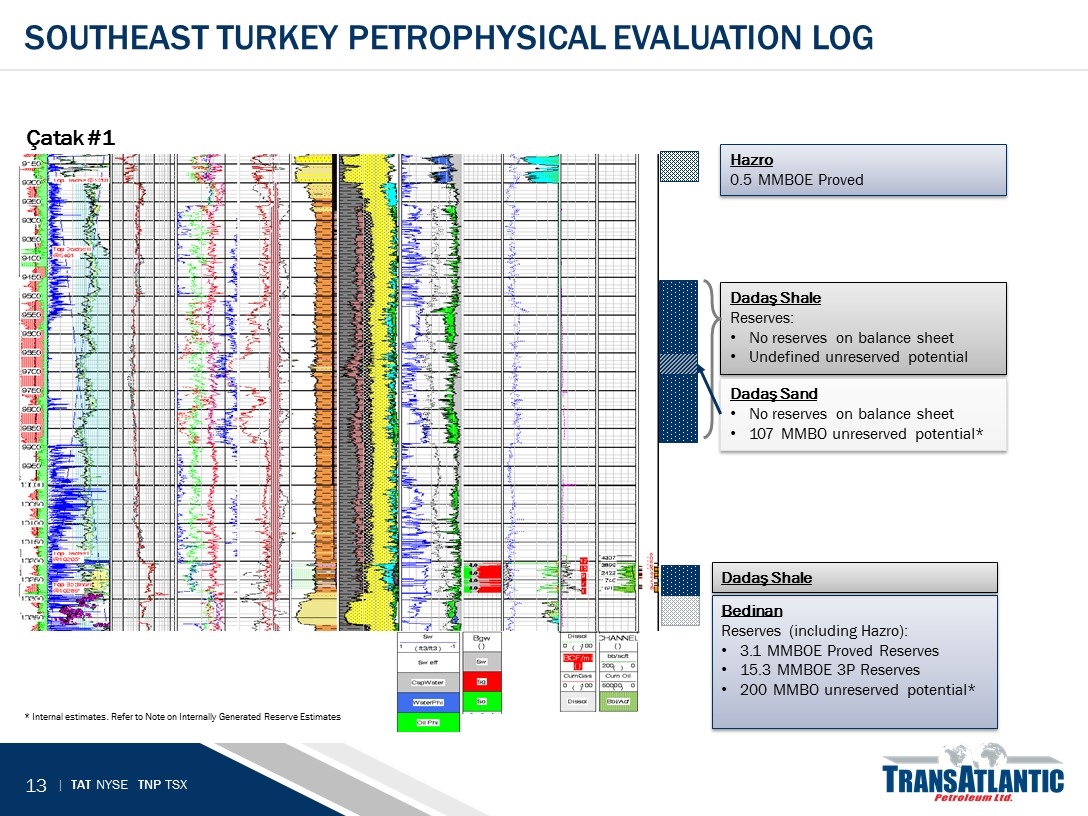
Southeast turkey petrophysical evaluation log * Internal estimates. Refer to Note on Internally Generated Reserve Estimates Çatak #1 Hazro 0.5 MMBOE Proved Bedinan Reserves (including Hazro): 3.1 MMBOE Proved Reserves 15.3 MMBOE 3P Reserves 200 MMBO unreserved potential* Dadaş Shale Dadaş Shale Reserves: No reserves on balance sheet Undefined unreserved potential Dadaş Sand No reserves on balance sheet 107 MMBO unreserved potential*
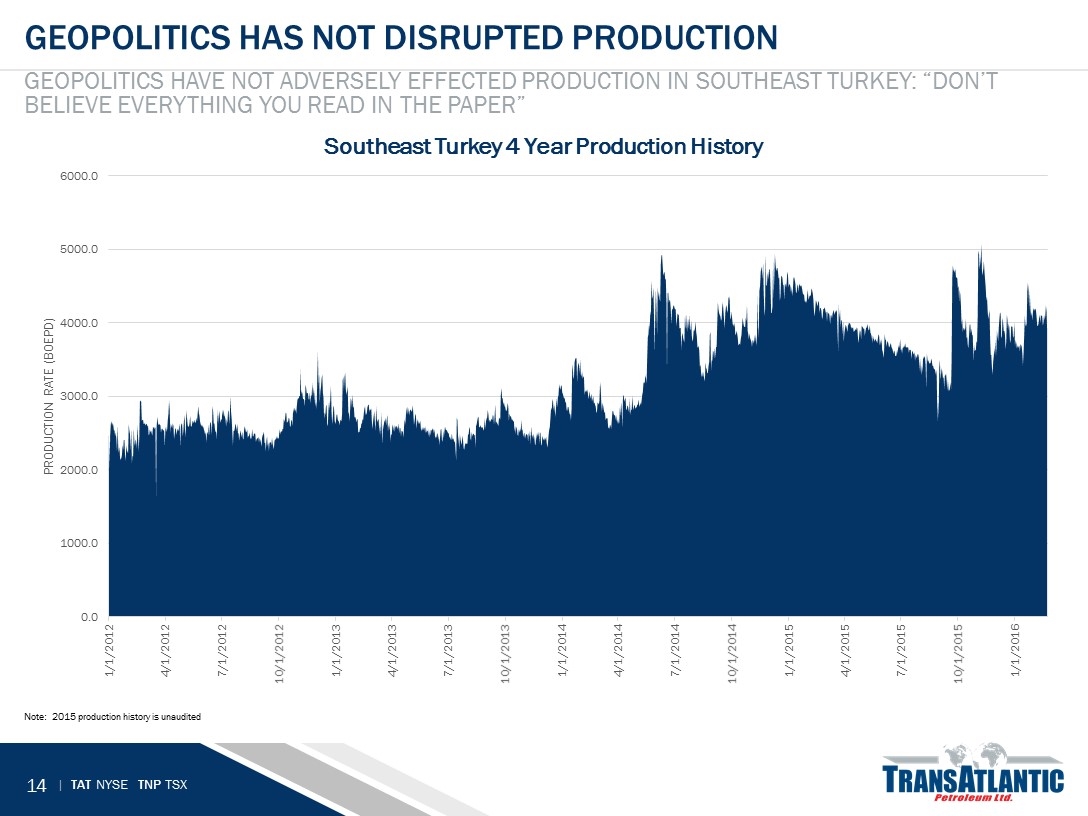
Geopolitics has not disrupted production Geopolitics have not adversely effected production in Southeast turkey: “don’t believe everything you read in the paper” Note: 2015 production history is unaudited
Appendix
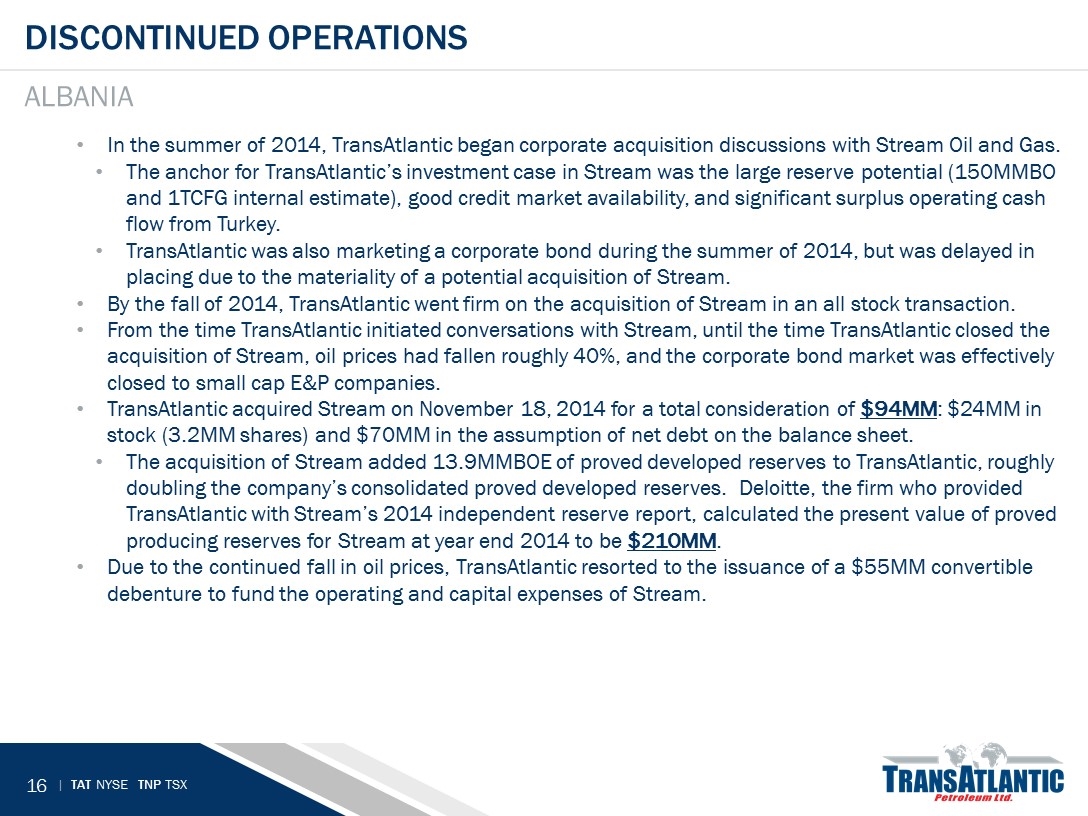
In the summer of 2014, TransAtlantic began corporate acquisition discussions with Stream Oil and Gas. The anchor for TransAtlantic’s investment case in Stream was the large reserve potential (150MMBO and 1TCFG internal estimate), good credit market availability, and significant surplus operating cash flow from Turkey. TransAtlantic was also marketing a corporate bond during the summer of 2014, but was delayed in placing due to the materiality of a potential acquisition of Stream. By the fall of 2014, TransAtlantic went firm on the acquisition of Stream in an all stock transaction. From the time TransAtlantic initiated conversations with Stream, until the time TransAtlantic closed the acquisition of Stream, oil prices had fallen roughly 40%, and the corporate bond market was effectively closed to small cap E&P companies. TransAtlantic acquired Stream on November 18, 2014 for a total consideration of $94MM: $24MM in stock (3.2MM shares) and $70MM in the assumption of net debt on the balance sheet. The acquisition of Stream added 13.9MMBOE of proved developed reserves to TransAtlantic, roughly doubling the company’s consolidated proved developed reserves. Deloitte, the firm who provided TransAtlantic with Stream’s 2014 independent reserve report, calculated the present value of proved producing reserves for Stream at year end 2014 to be $210MM. Due to the continued fall in oil prices, TransAtlantic resorted to the issuance of a $55MM convertible debenture to fund the operating and capital expenses of Stream. Discontinued operations Albania
By the fall of 2015, TransAtlantic realized that the prospects of refinancing its Albanian business were slim, and so the company chose to place the Albania business up for sale. On February 29, 2016, TransAtlantic entered into and closed a Share Purchase Agreement with GBC Oil for all of the equity interests in Stream. For consideration of the equity interest in Stream, GBC will assume the term loan facility to Raifeisen Bank, and assumed $29.2MM of other liabilities owed by Stream. In addition, GBC issued a warrant to TransAtlantic to acquire up to 25% of the equity interest in Stream for nominal consideration at any time on or before March 1, 2019. In accordance with the Share Purchase Agreement with GBC, and upon obtaining government approval, TransAtlantic will be assigned the Delvina gas assets and approximately $12.9mm of associated liabilities. The company is currently negotiating a joint venture with another third party for the purchase of a portion of the Delvina gas assets. There is no assurance that either of these events will occur. Discontinued operations Albania
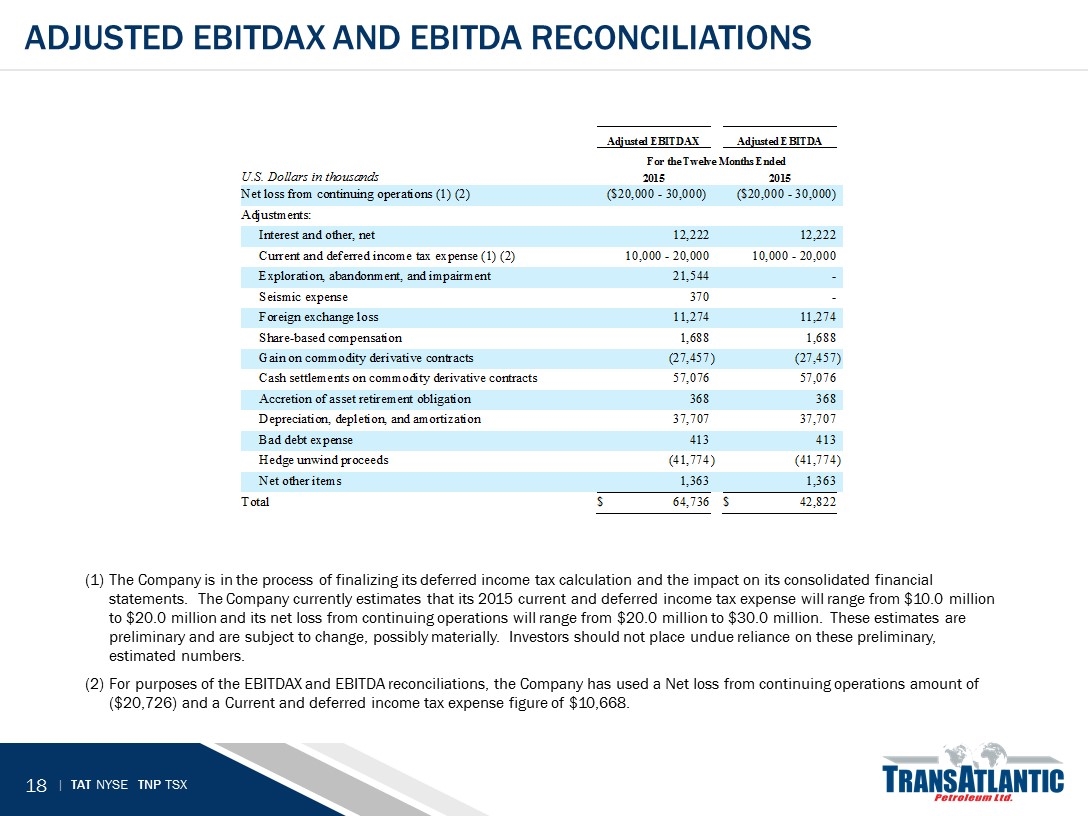
Adjusted ebitdax and ebitda reconciliations The Company is in the process of finalizing its deferred income tax calculation and the impact on its consolidated financial statements. The Company currently estimates that its 2015 current and deferred income tax expense will range from $10.0 million to $20.0 million and its net loss from continuing operations will range from $20.0 million to $30.0 million. These estimates are preliminary and are subject to change, possibly materially. Investors should not place undue reliance on these preliminary, estimated numbers. For purposes of the EBITDAX and EBITDA reconciliations, the Company has used a Net loss from continuing operations amount of ($20,726) and a Current and deferred income tax expense figure of $10,668.
Investor Relations +1 972 590 9936 IR@tapcor.com Contact www.TransAtlanticPetroleum.com
