Attached files
| file | filename |
|---|---|
| EX-21 - EX-21 - PREFORMED LINE PRODUCTS CO | d45086dex21.htm |
| EX-10.8 - EX-10.8 - PREFORMED LINE PRODUCTS CO | d45086dex108.htm |
| EX-32.2 - EX-32.2 - PREFORMED LINE PRODUCTS CO | d45086dex322.htm |
| EX-31.1 - EX-31.1 - PREFORMED LINE PRODUCTS CO | d45086dex311.htm |
| EX-31.2 - EX-31.2 - PREFORMED LINE PRODUCTS CO | d45086dex312.htm |
| EX-32.1 - EX-32.1 - PREFORMED LINE PRODUCTS CO | d45086dex321.htm |
| EX-23.1 - EX-23.1 - PREFORMED LINE PRODUCTS CO | d45086dex231.htm |
| EX-10.20 - EX-10.20 - PREFORMED LINE PRODUCTS CO | d45086dex1020.htm |
| EX-10.18 - EX-10.18 - PREFORMED LINE PRODUCTS CO | d45086dex1018.htm |
| EX-10.19 - EX-10.19 - PREFORMED LINE PRODUCTS CO | d45086dex1019.htm |
Table of Contents
UNITED STATES
SECURITIES AND EXCHANGE COMMISSION
Washington, D.C. 20549
FORM 10-K
Annual report pursuant to Section 13 or 15(d)
of the Securities Exchange Act of 1934
For the fiscal year ended December 31, 2015
Commission file number 0-31164
Preformed Line Products Company
(Exact name of registrant as specified in its charter)
| Ohio | 34-0676895 | |
| (State or Other Jurisdiction of Incorporation or Organization) |
(I.R.S. Employer Identification No.) |
| 660 Beta Drive Mayfield Village, Ohio |
44143 | |
| (Address of Principal Executive Office) | (Zip Code) |
(440) 461-5200
(Registrant’s telephone number, including area code)
Securities registered pursuant to Section 12(b) of the Act:
| Title of each class |
Name of each exchange on which registered | |
| Common Shares, $2 par value per share | NASDAQ |
Securities registered pursuant to Section 12(g) of the Act: (None)
Indicate by check mark if the registrant is a well-known seasoned issuer, as defined in Rule 405 of the Securities Act. Yes ¨ No x
Indicate by check mark if the registrant is not required to file reports pursuant to Section 13 or Section 15(d) of the Act. Yes ¨ No x
Indicate by check mark whether the registrant (1) has filed all reports required to be filed by Section 13 or 15 (d) of the Securities Exchange Act of 1934 during the preceding 12 months (or for such shorter period that the registrant was required to file such reports) and (2) has been subject to such filing requirements for the past 90 days. Yes x No ¨
Indicate by check mark whether the registrant has submitted electronically and posted on its corporate Web site, if any, every Interactive Data File required to be submitted and posted pursuant to Rule 405 of Regulation S-T (§232.405 of this chapter) during the preceding 12 months (or for such shorter period that the registrant was required to submit and post such files). Yes x No ¨
Indicate by check mark if disclosure of delinquent filers pursuant to Item 405 of Regulation S-K is not contained herein, and will not be contained, to the best of the registrant’s knowledge, in definitive proxy or information statements incorporated by reference in Part III of this Form 10-K or any amendment to this Form 10-K. ¨
Indicate by check mark whether the registrant is 7a large accelerated filer, an accelerated filer, a non-accelerated filer, or a smaller reporting company. See definitions of “accelerated filer,” “large accelerated filer” and “smaller reporting company” in Rule 12b-2 of the Exchange act.
| Large accelerated filer | ¨ | Accelerated filer | x | |||
| Non-accelerated filer | ¨ | Smaller Reporting Company | ¨ | |||
Indicate by check mark whether the registrant is a shell company (as defined in Rule 12b-2 of the Exchange Act). Yes ¨ No x
The aggregate market value of voting and non-voting common shares held by non-affiliates of the registrant as of June 30, 2015 was $100,583,850 based on the closing price of such common shares, as reported on the NASDAQ National Market System. As of March 7, 2016, there were 5,210,818 common shares of the Company ($2 par value) outstanding.
DOCUMENTS INCORPORATED BY REFERENCE
Portions of the Definitive Proxy Statement for the Annual Meeting of Shareholders to be held May 10, 2016 are incorporated by reference into Part III, Items 10, 11, 12, 13 and 14.
Table of Contents
| Page | ||||||
| Item 1. | 4 | |||||
| Item 1A. | 12 | |||||
| Item 1B. | 16 | |||||
| Item 2. | 16 | |||||
| Item 3. | 16 | |||||
| Item 4. | 16 | |||||
| Item 4A. | 16 | |||||
| Item 5. | 18 | |||||
| Item 6. | 20 | |||||
| Item 7. | Management’s Discussion and Analysis of Financial Condition and Results of Operations |
20 | ||||
| Item 7A. | 36 | |||||
| Item 8. | 38 | |||||
| Item 9. | Changes in and Disagreements with Accountants on Accounting and Financial Disclosure |
70 | ||||
| Item 9A. | 70 | |||||
| Item 9B. | 73 | |||||
| Item 10. | 73 | |||||
| Item 11. | 73 | |||||
| Item 12. | Security Ownership of Certain Beneficial Owners and Management and Related Stockholder Matters |
73 | ||||
| Item 13. | Certain Relationships, Related Transactions, and Director Independence |
73 | ||||
| Item 14. | 73 | |||||
| Item 15. | 73 | |||||
| 76 | ||||||
| 77 | ||||||
2
Table of Contents
Forward-Looking Statements
This Form 10-K and other documents we file with the Securities and Exchange Commission (“SEC”) contain forward-looking statements regarding Preformed Line Products Company’s (the “Company”) and management’s beliefs and expectations. As a general matter, forward-looking statements are those focused upon future plans, objectives or performance (as opposed to historical items) and include statements of anticipated events or trends and expectations and beliefs relating to matters not historical in nature. Such forward-looking statements are subject to uncertainties and factors relating to the Company’s operations and business environment, all of which are difficult to predict and many of which are beyond the Company’s control. Such uncertainties and factors could cause the Company’s actual results to differ materially from those matters expressed in or implied by such forward-looking statements.
The following factors, among others, could affect the Company’s future performance and cause the Company’s actual results to differ materially from those expressed or implied by forward-looking statements made in this report:
| • | The overall demand for cable anchoring and control hardware for electrical transmission and distribution lines on a worldwide basis, which has a slow growth rate in mature markets such as the United States (U.S.), Canada, Australia and Western Europe and may grow slowly or experience prolonged delay in developing regions despite expanding power needs; |
| • | The potential impact of the global economic condition on the Company’s ongoing profitability and future growth opportunities in our core markets in the U.S. and other foreign countries where the financial situation is expected to be similar going forward; |
| • | Decrease in infrastructure spending globally as a result of worldwide depressed spending; |
| • | The impact of low oil and other commodity prices on our growth opportunities, particularly with respect to energy projects; |
| • | The ability of our customers to raise funds needed to build the facilities their customers require; |
| • | Technological developments that affect longer-term trends for communication lines, such as wireless communication; |
| • | The decreasing demand for product supporting copper-based infrastructure due to the introduction of products using new technologies or adoption of new industry standards; |
| • | The Company’s success at continuing to develop proprietary technology and maintaining high quality products and customer service to meet or exceed new industry performance standards and individual customer expectations; |
| • | The Company’s success in strengthening and retaining relationships with the Company’s customers, growing sales at targeted accounts and expanding geographically; |
| • | The extent to which the Company is successful at expanding the Company’s product line or production facilities into new areas or implementing efficiency measures at existing facilities; |
| • | The effects of fluctuation in currency exchange rates upon the Company’s foreign subsidiaries’ operations and reported results from international operations, together with non-currency risks of investing in and conducting significant operations in foreign countries, including those relating to political, social, economic and regulatory factors; |
| • | The Company’s ability to identify, complete, obtain funding for and integrate acquisitions for profitable growth; |
3
Table of Contents
| • | The potential impact of consolidation, deregulation and bankruptcy among the Company’s suppliers, competitors and customers; |
| • | The relative degree of competitive and customer price pressure on the Company’s products; |
| • | The cost, availability and quality of raw materials required for the manufacture of products; |
| • | Strikes and other labor disruptions; |
| • | Changes in significant government regulations affecting environmental compliances; |
| • | The telecommunication market’s continued deployment of Fiber-to-the-Premises; |
| • | Those factors described under the heading “Risk Factors” on page 13. |
In light of these risks and uncertainties, the Company cautions you not to place undue reliance on these forward-looking statements. Any forward-looking statement that the Company makes in this report speaks only as of the date of such statement, and the Company undertakes no obligation to update any forward-looking statement or to publicly announce the results of any revision to any of those statements to reflect future events or developments. Comparisons of results for current and any prior periods are not intended to express any future trends or indications of future performance, unless specifically expressed as such, and should only be viewed as historical data.
Background
Preformed Line Products Company and its subsidiaries (the “Company”) is an international designer and manufacturer of products and systems employed in the construction and maintenance of overhead and underground networks for the energy, telecommunication, cable operators, information (data communication) and other similar industries. The Company’s primary products support, protect, connect, terminate and secure cables and wires. The Company also provides solar hardware systems and mounting hardware for a variety of solar power applications. The Company’s goal is to continue to achieve profitable growth as a leader in the research, innovation, development, manufacture and marketing of technically advanced products and services related to energy, communications and cable systems and to take advantage of this leadership position to sell additional quality products in familiar markets.
The Company serves a worldwide market through strategically located domestic and international manufacturing facilities. Each of the Company’s domestic and international manufacturing facilities have obtained an International Organization of Standardization (“ISO”) 9001:2008 Certified Management System, with the exception of Direct Power and Water Corporation (DPW), which was acquired during 2007. The ISO 9001:2008 certified management system is a globally recognized quality standard for manufacturing and assists the Company in marketing its products throughout the world. The Company’s customers include public and private energy utilities and communication companies, cable operators, financial institutions, governmental agencies, contractors and subcontractors, distributors and value-added resellers. The Company is not dependent on a single customer or a few customers. No single customer accounts for more than ten percent of the Company’s consolidated revenues.
The Company’s products include:
| • | Formed Wire and Related Hardware Products |
| • | Protective Closures |
| • | Plastic Products |
| • | Other Products |
4
Table of Contents
Formed Wire Products and Related Hardware Products are used in the energy, communications, cable and special industries (i.e., metal building, tower and antenna industries, the agriculture and arborist industries, and marine systems industry) to support, protect, terminate and secure both power conductor and communication cables and to control cable dynamics (e.g., vibration). Formed wire products are based on the principle of forming a variety of stiff wire materials into a helical (spiral) shape. Advantages of using the Company’s helical formed wire products are that they are economical, dependable and easy to use. The Company introduced formed wire products to the power industry nearly 70 years ago and such products enjoy an almost universal acceptance in the Company’s markets. Related hardware products include hardware for supporting and protecting transmission conductors, spacers, spacer-dampers, stockbridge dampers, corona suppression devices and various compression fittings for dead-end applications. Formed wire and related hardware products were approximately 61%, 65% and 68% of the Company’s revenues in 2015, 2014 and 2013, respectively.
Protective Closures, including splice cases, are used to protect fixed line communication networks, such as copper cable or fiber optic cable, from moisture, environmental hazards and other potential contaminants. Protective closures were approximately 17%, 18% and 16% of the Company’s revenues in 2015, 2014 and 2013, respectively.
Plastic Products, including guy markers, tree guards, fiber optic cable markers and pedestal markers, are used in energy, communications, cable and special industries to identify power conductors, communication cables and guy wires. Plastic products were approximately 4% of the Company’s revenues each year in 2015, 2014 and 2013.
Other Products include data communication cabinets, hardware assemblies, pole line hardware, resale products, underground connectors, solar hardware systems and urethane products. They are used by energy, renewable energy, communications, cable and special industries for various applications and are defined as products that complement the Company’s core line offerings. Other products were approximately 18%, 13% and 12% of the Company’s revenues in 2015, 2014 and 2013, respectively.
Corporate History
The Company was incorporated in Ohio in 1947 to manufacture and sell helically shaped “armor rods” which are sets of stiff helically shaped wires applied on an electrical conductor at the point where they are suspended or held. Thomas F. Peterson, the Company’s founder, developed and patented a unique method to manufacture and apply these armor rods to protect electrical conductors on overhead power lines. Over the years, Mr. Peterson and the Company developed, tested, patented, manufactured and marketed a variety of helically shaped products for use by the electrical and telephone industries. Although all of Mr. Peterson’s patents have now expired, those patents served as the nucleus for licensing the Company’s formed wire products abroad.
The success of the Company’s formed wire products in the U.S. led to expansion abroad. The first international license agreement was established in the mid-1950s in Canada. In the late 1950s, the Company’s products were being sold through joint ventures and licensees in Canada, England, Germany, Spain and Australia. Additionally, the Company began export operations and promoted products into other selected offshore markets. The Company continued its expansion program, bought out most of the original licensees, and, by the mid-1990s, had complete ownership of operations in Australia, Brazil, Canada, Great Britain, South Africa and Spain and by 2002, it had complete ownership of operations in Mexico and China. The Company’s international subsidiaries have the necessary infrastructure (i.e. manufacturing, engineering, marketing and general management) to support local business activities. Each is staffed with local personnel to ensure that the Company is well versed in local business practices, cultural constraints, technical requirements and the intricacies of local client relationships.
In 1968, the Company expanded into the underground telecommunications field by its acquisition of the Smith Company located in California. The Smith Company had a patented line of buried closures and pressurized splice cases. These closures and splice cases protect copper cable openings from environmental damage and degradation. The Company continued to build on expertise acquired through the acquisition of the Smith Company and in 1995 introduced the highly successful COYOTE® Closure line of products. Since 1995, 14 domestic and three international patents have been granted to the Company on the COYOTE Closure. The earliest COYOTE Closure patent was filed April 1995 and expired in April 2015.
5
Table of Contents
In 2007, the Company acquired the shares of Direct Power and Water Corporation (DPW), located in New Mexico, U.S. This acquisition broadened the Company’s product lines, because DPW manufactures mounting hardware for a variety of solar power applications and provides designs and installations of solar power systems. During 2015, the Company integrated the DPW manufacturing processes into its other domestic operations to reduce future infrastructure and manufacturing costs for the product line.
In 2007, the Company acquired 83.74% of Belos SA (Belos), located in Bielsko-Biala, Poland. Belos is a manufacturer and supplier of fittings for various voltage power networks. This acquisition complemented the Company’s existing line of energy products. From 2008 to 2010, the Company acquired the remaining outstanding shares of Belos.
In 2009, the Company acquired a 33.3% investment in Proxisafe Ltd. Proxisafe is a Canadian developmental company formed to design and commercialize new industrial safety equipment located in Calgary, Alberta. As of December 31, 2015, the Company owned 25.93% in Proxisafe.
In 2009, the Company acquired the Dulmison business from Tyco Electronics Group S.A. (Tyco Electronics), which included both the acquisition of equity of certain Tyco Electronics entities and the acquisition of assets from other Tyco Electronics entities. Dulmison was a leader in the supply and manufacturer of electrical transmission and distribution products. Dulmison designed, manufactured and marketed pole line hardware and vibration control products for the global electrical utility industry. Dulmison had operations in Australia, Thailand, Indonesia, Malaysia, Mexico and the United States. The Dulmison business has been fully integrated into the Company’s core businesses.
In 2010, the Company acquired Electropar Limited (Electropar), a New Zealand corporation. Electropar designs, manufactures and markets pole line and substation hardware for the global electrical utility industry. Electropar is based in New Zealand with a subsidiary operation in Australia. The acquisition has strengthened the Company’s position in the power distribution, transmission and substation hardware markets and expanded the Company’s presence in the Asia-Pacific region.
In January 2012, the Company acquired Australian Electricity Systems Pty Ltd. (AES), an Australian company. AES designs, manufactures and markets hardware for the electrical utility industry.
In January 2014, the Company acquired Helix Uniformed Limited (Helix), located in Montreal, Quebec, Canada. Helix designs, manufacturers and markets helical products and spacer dampers for the electrical utility industry. The acquisition has diversified the Company’s business in Canada, expanded its manufacturing footprint and enhanced its engineering capabilities
The Company’s World headquarters is located at 660 Beta Drive, Mayfield Village, Ohio, U.S.A. 44143.
Business
The demand for the Company’s products comes primarily from new, maintenance and repair construction for the energy (including solar), telecommunication, data communication and special industries. The Company’s customers use many of the Company’s products, including formed wire products, to revitalize the aging outside plant infrastructure. Many of the Company’s products are used on a proactive basis by the Company’s customers to reduce and prevent lost revenue. A single malfunctioning line could cause the loss of thousands of dollars per hour for a power or communication customer. A malfunctioning fiber cable could also result in substantial revenue loss to the Company’s customers. Repair construction by the Company’s customers generally occurs in the case of emergencies or natural disasters, such as hurricanes, tornados, earthquakes, floods or ice storms. Under these circumstances, the Company quickly provides the repair products to customers.
The Company has adapted the formed wire products’ helical technology for use in a wide variety of fiber optic cable applications that have special requirements. The Company’s formed wire products are uniquely
6
Table of Contents
qualified for these applications due to the gentle gripping over a greater length of the fiber cable. This is an advantage over traditional pole line hardware clamps that compress the cable to the point of possible fatigue and optical signal deterioration.
The Company’s protective closures and splice cases are used to protect cable from moisture, environmental hazards and other potential contaminants. The Company’s splice cases are easily re-enterable closures that allow utility maintenance workers access to the cables located inside the closure to repair or add communications services. Over the years, the Company has made many significant improvements in splice cases that have greatly increased its versatility and application in the market place. The Company also designs and markets custom splice cases to satisfy specific customer requirements. This has allowed the Company to remain a strong partner with several primary customers and has earned the Company the reputation as a responsive and reliable supplier.
Fiber optic cable was first deployed in the outside plant environment in the early 1980s. Through fiber optic technologies, a much greater amount of both voice and data communication can be transmitted reliably. In addition, this technology solved the cable congestion problem that the large count copper cable was causing in underground, buried and aerial applications. The Company developed and adapted copper closures for use in the emerging fiber optic world. In the late 1980s, the Company developed a series of splice cases designed specifically for fiber optic application. In the mid-1990s, the Company developed its plastic COYOTE® Closure, and has since expanded the product line to address Fiber-to-the-Premise (FTTP) applications. The COYOTE Closure is an example of the Company developing a new line of proprietary products to meet the changing needs of its customers.
The Company also designs and manufactures data communication cabinets and enclosures for data communication networks, offering a comprehensive line of copper and fiber optic cross-connect systems. The product line enables reliable, high-speed transmission of data over customers’ local area networks.
In 2007, the Company expanded into the renewable energy sector. It provides a comprehensive line of mounting hardware for a variety of solar power applications including residential roof mounting, commercial roofing systems, utility scale ground-mount, top of pole mounting and customized solutions.
Markets
The Company markets its products to the energy, telecommunication, cable, data communication and special industries. While rapid changes in technology have blurred the distinctions between telephone, cable, and data communication, the energy industry is clearly distinct. The Company’s role in the energy industry is to supply formed wire products and related hardware used with the electrical conductors, cables and wires that transfer power from the generating facility to the ultimate user of that power. Formed wire products are used to support, protect, terminate and secure both power conductor and communication cables and to control cable dynamics.
Electric Utilities - Transmission. The electric transmission grid is the interconnected network of high voltage aluminum conductors used to transport large blocks of electric power from generating facilities to distribution networks. Currently, there are three major power grids in the U.S.: the Eastern Interconnect, the Western Interconnect and the Texas Interconnect. Virtually all electrical energy utilities are connected with at least one other utility by one of these major grids. The Company believes that transmission grids have been neglected throughout much of the U.S. With demand for power now exceeding supply in some areas, the need for the movement of bulk power from the energy-rich areas to the energy-deficient areas means that new transmission lines will likely be built and many existing lines will likely be refurbished. Connecting renewable energy sources to the grid should also continue to attract new investment to fund transmission infrastructure projects in the future. The Company believes that this may generate opportunities for the Company’s products in this market over at least the next several years. In addition, increased construction of international transmission grids is occurring in many regions of the world. However, consolidations in the markets that the Company services with increased global competition, as well as stagnant economic conditions, limited government funding and lower energy prices, may also have an adverse impact on the Company’s sales.
Electric Utilities - Distribution. The distribution market includes those utilities that distribute power from a substation where voltage is reduced to levels appropriate for the consumer. Unlike the transmission market, distribution is still handled primarily by local electric utilities. These utilities are motivated to reduce cost in order
7
Table of Contents
to maintain and enhance their profitability. The Company believes that its growth in the distribution market will be achieved primarily as a result of incremental gains in market share driven by emphasizing the Company’s quality products and service over price. Internationally, particularly in the developing regions, there is increasing political pressure to extend the availability of electricity to additional populations. Through its global network of factories and sales offices, the Company is prepared to take advantage of this new growth in construction.
Renewable Energy. The renewable energy market includes residential consumers, commercial businesses, off-grid operators, and utility companies that have an interest in alternative energy sources. Environmental concerns along with federal, state and local utility incentives have fueled demand for renewable energy systems including solar, wind and biofuel. While low prices of traditional energy sources have slowed or stalled demand in some areas, the industry continues to grow as advancements in technology lead to greater efficiencies which drive down overall system costs. The Company currently provides hardware solutions and system design for solar power applications. The Company markets and sells these products and services to end-users, distributors, installers and integrators.
Communication and Cable. Major developments, including growing competition between the cable and communications industries and increasing overall demand for high-speed communication services, have led to a changing regulatory and competitive environment in many markets throughout the world. The deployment of new access networks and improvements to existing networks for advanced applications continues to gain momentum.
Cable operators, local communication operators and power utilities are building, rebuilding or upgrading signal delivery networks in developed countries. These networks are designed to deliver video and voice transmissions and provide Internet connectivity to individual residences and businesses. Operators deploy a variety of network technologies and architectures to carry broadband and narrowband signals. These architectures are constructed of electronic hardware connected via coaxial cables, copper wires or optical fibers. The Company manufactures closures that these industries use to securely connect and protect these vital networks.
As critical components of the outdoor infrastructure, closures provide protection against weather and vandalism, and permit technicians who maintain and manage the system ready access to the devices. Cable operators and local telephone network operators place great reliance on manufacturers of protective closures because any material damage to the signal delivery networks is likely to disrupt communication services. In addition to closures, the Company supplies the communication and cable industry with its formed wire products to hold, support, protect and terminate the copper wires and cables and the fiber optic cables used by that industry to transfer voice, video or data signals.
The industry has developed technological methods to increase the usage of copper-based products through high-speed digital subscriber lines (DSLs). The popularity of these services, the regulatory environment and the increasingly fierce competition between communications and cable operators has driven the move toward building out the “last mile” in fiber optic networks. FTTP technology supports the next wave in broadband innovation by carrying fiber optic technology into homes and businesses. The Company has been actively developing products that address this market.
Data Communication. The data communication market is driven by the continual demand for increased bandwidth. Growing Internet Service Providers (ISPs), construction in Wide Area Networks (WANs) and demand for products in the workplace are all key elements to the increased demand for the racking and cabinet products made by the Company. The Company’s products are sold to a number of categories of customers including, (i) ISPs, (ii) large companies and organizations which have their own local area network for data communication, and (iii) distributors of structured cabling systems and components for use in the above markets.
Special Industries. The Company’s formed wire products are also used in other industries which require a method of securing or terminating cables, including the metal building, tower and antenna industries, the agriculture and arborist industries, and various applications within the marine systems industry. Products other than formed wire products are also marketed to other industries. For example, the Company’s urethane capabilities allow it to market products to the light rail industry. The Company continues to explore new and innovative uses of its manufacturing capabilities; however, these markets remain a small portion of overall consolidated sales.
8
Table of Contents
International Operations
The international operations of the Company are essentially the same as its domestic (PLP-USA) business. The Company manufactures similar types of products in its international plants as are sold domestically, sells to similar types of customers and faces similar types of competition (and in some cases, the same competitors). Sources of supply of raw materials are not significantly different internationally. See Note L in the Notes to Consolidated Financial Statements for information and financial data relating to the Company’s international operations that represent reportable segments.
While a number of the Company’s international plants are in developed countries, the Company believes it has strong market opportunities in developing countries where the need for the transmission and distribution of electrical power is significant, although the pace of this development may remain slow. In addition, as the need arises, the Company is prepared to establish new manufacturing facilities abroad.
Sales and Marketing
Domestically and internationally, the Company markets its products through a direct sales force and manufacturing representatives. The direct sales force is employed by the Company and works with the manufacturer’s representatives, as well as key direct accounts and distributors who also buy and resell the Company’s products. The manufacturer’s representatives are independent organizations that represent the Company as well as other complimentary product lines. These organizations are paid a commission based on the sales amount they generate.
Research and Development
The Company is committed to providing technical leadership through scientific research and product development in order to continue to expand the Company’s position as a supplier to the communications and power industries. Research is conducted on a continuous basis using internal experience in conjunction with outside professional expertise to develop state-of-the-art materials for several of the Company’s products. These products capitalize on cost-efficiency while offering exacting mechanical performance that meets or exceeds industry standards. The Company’s research and development activities have resulted in numerous patents being issued to the Company (see “Patents and Trademarks” below).
Early in its history, the Company recognized the need to understand the performance of its products and the needs of its customers. To that end, the Company developed a 29,000 square foot Research and Engineering Center located at its corporate headquarters in Mayfield Village, Ohio. In 2013, the Company expanded its Research and Engineering Center by an additional 8,000 square feet. Using the Research and Engineering Center, engineers and technicians simulate a wide range of external conditions encountered by the Company’s products to ensure quality, durability and performance. The work performed in the Research and Engineering Center includes advanced studies and experimentation with various forms of vibration and environmental changes. This work has contributed significantly to the collective knowledge base of the industries the Company serves and is the subject matter of many papers and seminars presented to these industries.
The Company believes that its Research and Engineering Center is one of the most sophisticated in the world in its specialized field. The Research and Engineering Center also has an advanced prototyping technology machine on-site to develop models of new designs where intricate part details are studied prior to the construction of expensive production tooling. Today, the Company’s reputation for vibration testing, tensile testing, fiber optic cable testing, environmental testing, field vibration monitoring and third-party contract testing is a competitive advantage. In addition to testing, the work done at the Company’s Research and Development Center continues to fuel product development efforts. For example, the Company estimates that approximately 16.4% of 2015 revenues were attributed to products developed by the Company in the past five years. In addition, the Company’s position in the industry is further reinforced by its long-standing leadership role in many key international technical organizations which are charged with the responsibility of establishing industry wide specifications and performance criteria, including IEEE (Institute of Electrical and Electronics Engineers), CIGRE (Counsiel Internationale des Grands Reseaux Electriques a Haute Tension), and IEC (International Electromechanical Commission). Research and development costs are expensed as incurred. Research and development costs for new products were $2.9 million in 2015, $2.7 million in 2014 and $2.3 million in 2013.
9
Table of Contents
Patents and Trademarks
The Company applies for patents in the U.S. and other countries, as appropriate, to protect its significant patentable developments. As of December 31, 2015, the Company had in force 30 U.S. patents and 98 international patents in 21 countries and had 16 pending U.S. patent applications and 37 pending international applications. While such domestic and international patents expire from time to time, the Company continues to apply for and obtain patent protection on a regular basis. Patents held by the Company in the aggregate are of material importance in the operation of the Company’s business. The Company, however, does not believe that any single patent, or group of related patents, is essential to the Company’s business as a whole or to any of its businesses. Additionally, the Company owns and uses a substantial body of proprietary information and numerous trademarks. The Company relies on nondisclosure agreements to protect trade secrets and other proprietary data and technology. As of December 31, 2015, the Company had obtained U.S. registration on 35 trademarks and two trademark applications remained pending. International registrations amounted to 247 registrations in 36 countries, with three pending international registrations.
U.S. patents are issued for terms of 20 years beginning with the date of filing of the patent application. Patents issued by international countries generally expire 20 years after filing. U.S. and international patents are not renewable after expiration of their initial term. U.S. and international trademarks are generally perpetual, renewable in 10-year increments upon a showing of continued use. To the knowledge of management, the Company is not subject to any significant allegation or charges of infringement of intellectual property rights by any organization.
In the normal course of business, the Company occasionally makes and receives inquiries with regard to possible patent and trademark infringement. The extent of such inquiries from third parties has been limited generally to verbal remarks to Company representatives. The Company believes that it is unlikely that the outcome of these inquiries will have a material adverse effect on the Company’s financial position.
Competition
All of the markets that the Company serves are highly competitive. In each market, the principal methods of competition are price, performance, and service. The Company believes, however, that several factors (described below) provide the Company with a competitive advantage.
| • | The Company has a strong and stable workforce. This consistent and continuous knowledge base has afforded the Company the ability to provide superior service to the Company’s customers and representatives. |
| • | The Company’s Research and Engineering Center in Mayfield Village, Ohio and the engineering departments at the Company’s subsidiary operations around the world maintain a strong technical support function to develop unique solutions to customer problems. |
| • | The Company is vertically integrated both in manufacturing and distribution and is continually upgrading equipment and processes. |
| • | The Company is sensitive to the marketplace and provides an extra measure of service in cases of emergency, storm damage and other rush situations. This high level of customer service and customer responsiveness is a hallmark of the Company. |
| • | The Company’s 29 sales and manufacturing locations ensure close support and proximity to customers worldwide. |
Domestically, there are several competitors for formed wire products. Although it has other competitors in many of the countries where it has plants, the Company has leveraged its expertise and is very strong in the global
10
Table of Contents
market. The Company believes that it is the world’s largest manufacturer of formed wire products for energy and communications markets. However, the Company’s formed wire products compete against other pole line hardware products manufactured by other companies.
The Company’s primary domestic competitor for pressurized copper closures is the 3M Company (“3M”). Based on its experience in the industry, the Company believes it maintains a strong market share position.
The fiber optic closure market is one of the most competitive product areas for the Company, with the Company competing against, among others, Tyco Electronics, 3M and Corning Cable Systems. There are a number of primary competitors and several smaller niche competitors that compete at all levels in the marketplace. The Company believes that it is one of four leading suppliers of fiber optic closures.
Sources and Availability of Raw Materials
The principal raw materials used by the Company are galvanized wire, stainless steel, aluminum covered steel wire, aluminum rod, plastic resins, glass-filled plastic compounds, neoprene rubbers and aluminum castings. The Company also uses certain other materials such as fasteners, packaging materials and communications cable. The Company believes that it has adequate sources of supply for the raw materials used in its manufacturing processes and it regularly attempts to develop and maintain sources of supply in order to extend availability and encourage competitive pricing of these products.
Most plastic resins are purchased under contracts to stabilize costs and improve delivery performance and are available from a number of reliable suppliers. Wire and aluminum rods are purchased in standard stock diameters and coils under contracts from a number of reliable suppliers. Contracts have firm prices except for fluctuations of base metals and petroleum prices, which result in surcharges when global demand is greater than the available supply.
The Company also relies on certain other manufacturers to supply products that complement the Company’s product lines, such as aluminum and ferrous castings, fiber optic cable and connectors and various metal racks and cabinets. The Company believes there are multiple sources of supply for these products.
The Company relies on sole source manufacturers for certain raw materials used in production. The current state of economic uncertainty presents a risk that existing suppliers could go out of business. However, there are other potential sources available for these materials, and the Company could relocate the tooling and processes to other manufacturers if necessary.
Raw material costs were flat for the beginning of 2015 and trended down toward the end of 2015. The Company expects stable prices with potential trending up toward the end of 2016.
Backlog Orders
The Company’s backlog was approximately $53.0 million at the end of 2015 and $61.4 million at the end of 2014. All customer orders entered are firm at the time of entry. Substantially all orders are shipped within a two to four week period unless the customer requests an alternative date.
Seasonality
The Company markets products that are used by utility maintenance and construction crews worldwide. The products are marketed through distributors and directly to end users, who maintain stock to ensure adequate supply for their customers or construction crews. As a result, the Company does not have a wide variation in sales from quarter to quarter.
11
Table of Contents
Environmental
The Company is subject to extensive and changing federal, state, and local environmental laws, including laws and regulations that (i) relate to air and water quality, (ii) impose limitations on the discharge of pollutants into the environment, (iii) establish standards for the treatment, storage and disposal of toxic and hazardous waste, and (iv) require proper storage, handling, packaging, labeling, and transporting of products and components classified as hazardous materials. Stringent fines and penalties may be imposed for noncompliance with these environmental laws. In addition, environmental laws could impose liability for costs associated with investigating and remediating contamination at the Company’s facilities or at third-party facilities at which the Company has arranged for the disposal treatment of hazardous materials.
The Company believes it is in compliance in all material respects, with all applicable environmental laws and the Company is not aware of any noncompliance or obligation to investigate or remediate contamination that could reasonably be expected to result in a material liability. The Company does not expect to make any material capital expenditure during 2016 for environmental control facilities. The environmental laws continue to be amended and revised to impose stricter obligations, and compliance with future additional environmental requirements could necessitate capital outlays. However, the Company does not believe that these expenditures will ultimately result in a material adverse effect on its financial position or results of operations. The Company cannot predict the precise effect such future requirements, if enacted, would have on the Company. The Company believes that such regulations would be enacted over time and would affect the industry as a whole.
Employees
At December 31, 2015, the Company had 2,645 employees. Approximately 27% of the Company’s employees are located in the U.S.
Available Information
The Company maintains an Internet site at http://www.preformed.com, on which the Company makes available, free of charge, the annual report on Form 10-K, quarterly reports on Form 10-Q, current reports on Form 8-K and any amendments to those reports, as soon as reasonably practicable after the Company electronically files such material with, or furnishes it to, the SEC. The Company’s SEC reports can be accessed through the investor relations section of its Internet site. The information found on the Company’s Internet site is not part of this or any other report that is filed or furnished to the SEC.
The public may read and copy any materials the Company files with or furnishes to the SEC at the SEC’s Public Reference Room at 100 F. Street, NE., Washington, DC 20549. Information on the operation of the Public Reference Room is available by calling the SEC at 1-800-SEC-0330. In addition, the SEC maintains an Internet site that contains reports, proxy and information statements, and other information filed with the SEC by electronic filers. The SEC’s Internet site is http://www.sec.gov. The Company also has a link from its Internet site to the SEC’s Internet site. This link can be found on the investor relations page of the Company’s Internet site.
Due to the Company’s dependency on the energy and telecommunication industries, the Company is susceptible to negative trends relating to those industries that could adversely affect the Company’s operating results.
The Company’s sales to the energy and telecommunication industries represent a substantial portion of the Company’s historical sales. The concentration of revenue in such industries is expected to continue into the foreseeable future. Demand for products to these industries depends primarily on capital spending by customers for constructing, rebuilding, maintaining or upgrading their systems. The amount of capital spending and, therefore, the Company’s sales and profitability are affected by a variety of factors, including general economic conditions, access by customers to financing, government regulation, demand for energy and cable services, energy prices and technological factors. As a result, some customers may significantly reduce their spending or may not continue as going concerns, which could have a material adverse effect on the Company’s business, operating results and financial condition. In addition, the Company may incur exit-related costs and impairments of goodwill, definite
12
Table of Contents
and indefinite-lived intangible assets and property, fixtures and equipment as the Company makes corresponding changes to its business to reflect these changes and uncertainties in the Company’s industries and customer demand, and these costs and impairments could have a significant negative impact on the Company’s results for the period in which they are incurred. Consolidation presents an additional risk to the Company in that merged customers will rely on relationships with a source other than the Company. Consolidation may also increase the pressure on suppliers, such as the Company, to sell product at lower prices.
The Company’s business will suffer if the Company fails to develop and successfully introduce new and enhanced products that meet the changing needs of the Company’s customers.
The Company’s ability to anticipate changes in technology and industry standards and to successfully develop and introduce new products on a timely basis is a significant factor in the Company’s ability to grow and remain competitive. New product development often requires long-term forecasting of market trends, development and implementation of new designs and processes and a substantial capital commitment. The trend toward consolidation of the energy, telecommunication and data communication industries may require the Company to quickly adapt to rapidly changing market conditions and customer requirements. Any failure by the Company to anticipate or respond in a cost-effective and timely manner to technological developments or changes in industry standards or customer requirements, or any significant delays in product development or introduction or any failure of new products to be widely accepted by the Company’s customers, could have a material adverse effect on the Company’s business, operating results and financial condition as a result of reduced net sales.
The intense competition in the Company’s markets, particularly telecommunication, may lead to a reduction in sales and earnings.
The markets in which the Company operates are highly competitive. The level of intensity of competition may increase in the foreseeable future due to anticipated growth in the telecommunication and data communication industries. The Company’s competitors in the telecommunication and data communication markets are larger companies with significant influence over the distribution network. The Company may not be able to compete successfully against its competitors, many of which may have access to greater financial resources than the Company. In addition, the pace of technological development in the telecommunication market is rapid and these advances (i.e., wireless, fiber optic network infrastructure, etc.) may adversely affect the Company’s ability to compete in this market.
Competitors’ introduction of products embodying new technologies or the emergence of new industry standards can render existing products or products under development obsolete or unmarketable and result in lost sales.
The energy and telecommunication industries are characterized by rapid technological change. Satellite, wireless and other communication technologies currently being deployed may represent a threat to copper, coaxial and fiber optic-based systems by reducing the need for wire-line networks. Future advances or further development of these or other new technologies may have a material adverse effect on the Company’s business, operating results and financial condition as a result of lost sales.
Price increases or decreased availability of raw materials could result in lower earnings.
The Company’s cost of sales may be materially adversely affected by increases in the market prices of the raw materials used in the Company’s manufacturing processes. The Company may not be able to pass on price increases in raw materials to the Company’s customers through increases in product prices. As a result, the Company’s operating results could be adversely affected. In addition, any decrease or delay in the availability of these materials could slow production and delivery to the Company’s customers. Under the Dodd-Frank Wall Street Reform and Consumer Protection Act, the Securities and Exchange Commission established disclosure requirements regarding the supply of certain minerals, known as conflict minerals, originating from the Democratic Republic of Congo and adjoining countries (“Conflict Mineral Rules”). These requirements could adversely affect the availability and pricing of minerals subject to the Conflict Mineral Rules used in the Company’s products.
13
Table of Contents
The Company’s international operations subject the Company to additional business risks that may have a material adverse effect on the Company’s business, operating results and financial condition.
International sales account for a substantial portion of the Company’s net sales (60%, 61% and 60% in 2015, 2014 and 2013, respectively) and the Company expects these sales will increase as a percentage of net sales in the future. Due to its international sales, the Company is subject to the risks of conducting business internationally, including unexpected changes in, or impositions of, legislative or regulatory requirements, which could materially adversely affect U.S. dollar sales or operating expenses, tariffs and other barriers and restrictions, potentially longer payment cycles, greater difficulty in accounts receivable collection, reduced or limited protection of intellectual property rights, potentially adverse taxes and the burdens of complying with a variety of international laws and communications standards. The Company is subject to foreign currency volatility which could materially impact the Company’s results. The Company is also subject to general geopolitical risks, such as political and economic instability, social unrest, terrorism and changes in diplomatic and trade relationships, in connection with its international operations. These risks of conducting business internationally may have a material adverse effect on the Company’s business, operating results and financial condition.
The Company may not be able to successfully integrate businesses that it may acquire in the future or complete acquisitions on satisfactory terms, which could have a material adverse effect on the Company’s business, operating results and financial condition.
A portion of the Company’s growth in sales and earnings has been generated from acquisitions. The Company expects to continue a strategy of identifying and acquiring businesses with complementary products. In connection with this strategy, the Company faces certain risks and uncertainties relating to acquisitions. The factors affecting this exposure are in addition to the risks faced in the Company’s day-to-day operations. Acquisitions involve a number of special risks, including the risks pertaining to integrating acquired businesses, realizing the benefits of acquired technology and utilizing new personnel. In addition, the Company may incur debt to finance future acquisitions, and the Company may issue securities in connection with future acquisitions that may dilute the holdings of current and future shareholders. Covenant restrictions relating to additional indebtedness could restrict the Company’s ability to pay dividends, fund capital expenditures, consummate additional acquisitions and significantly increase the Company’s interest expense. Any failure to successfully complete acquisitions or to successfully integrate such strategic acquisitions could have a material adverse effect on the Company’s business, operating results and financial condition.
The Company may have interruptions in or lose business due to the uncertainty of the global economy, specifically related to the lack of available funding for the Company’s customers.
The demand for the Company’s products is significantly affected by the amount of discretionary business and consumer spending, each of which is impacted by the uncertainty of the global economy. The liquidity and financial position of the Company’s customers could also impact their ability to pay in full and/or on a timely basis. This lack of funding could have a negative impact on the Company’s results of operations.
The Company may be adversely impacted by laws, regulation, and litigation.
The Company is subject to various laws and regulation. For example, extensive environmental regulations related to air and water quality, the discharge of pollutants, the handling of toxic waste and the handling and transport of products and components classified as hazardous impact its daily operations. The introduction of new laws or regulations, or changes in existing laws or regulations, could increase the costs of doing business.
The Company may not be able to successfully manage its intellectual property and may be subject to infringement claims.
The Company relies on a combination of contractual rights and patent, trademark, copyright and trade secret laws to establish and protect its proprietary technology. Third parties may challenge, invalidate, circumvent, infringe or misappropriate the Company’s intellectual property, or such intellectual property may not be sufficient to permit the Company to take advantage of current market trends or otherwise to provide competitive advantages, which could result in costly redesign efforts, discontinuance of certain product offerings or other competitive harm. Others, including its competitors may independently develop similar technology, duplicate or design around the Company’s intellectual property, and in such cases it could not assert its intellectual property rights against such
14
Table of Contents
parties. The Company may also be subject to costly litigation in the event its technology infringes upon or otherwise violate a third party’s proprietary rights. Any claim from third parties may result in a limitation on its ability to use the intellectual property subject to these claims. The Company may be forced to litigate to enforce or determine the scope and enforceability of its intellectual property rights, trade secrets and know-how, which is expensive, could cause a diversion of resources and may not prove successful, especially in countries where such rights are more difficult to enforce. The loss of intellectual property protection or the inability to obtain third party intellectual property could harm its business and ability to compete.
Tax matters, including changes in tax rates, disagreements with taxing authorities and imposition of new taxes could impact our results of operations and financial condition.
A significant percentage of the Company’s profit is earned outside the U.S. and taxed at lower rates than the U.S. federal statutory rate. Historically, the cash the Company generates outside the U.S. has principally been used to fund the Company’s international development. However, if cash generated by the Company’s U.S. operations is not sufficient to meet its need for cash in the U.S., the Company may need to repatriate a greater portion of its international earnings to the U.S. in the future. The Company is required to record U.S. income tax expense in its financial statements at the point in time when its management determines that such funds are not permanently invested outside the U.S. This could cause the Company’s worldwide effective tax rate to increase materially.
As a multinational corporation, the Company is subject to income taxes as well as non-income based taxes, such as payroll, sales, use, value-added, net worth, property, withholding and franchise taxes in both the U.S. and various foreign jurisdictions. The Company is also subject to regular reviews, examinations and audits by the Internal Revenue Service and other taxing authorities with respect to such income and non-income based taxes inside and outside the U.S. The reviews could include challenges of the Company’s methodologies for transfer pricing. To date, the Company has been audited in several taxing jurisdictions with no significant impact on its financial condition, results of operations or cash flows. While the Company believes is has complied with all applicable income tax and non-income based tax laws, there can be no assurance that the Internal Revenue Service or other taxing authority will not have a different interpretation of the law and assess us with an additional tax liability, including interest and penalties that could have a material impact on the Company’s results of operations and financial positions.
In addition, the Company is directly and indirectly affected by new tax legislation and regulation and the interpretation of tax laws and regulations worldwide. Changes in such legislation, regulation or interpretation could increase the Company’s tax liability and have an adverse effect on its operating results and financial condition.
The Company employs information technology systems to support its business, and any material breach, interruption or failure may adversely impact our business.
The Company employs information technology systems to support its business. Security breaches and other disruptions to the Company’s information technology infrastructure could interfere with the Company’s operations, and compromise information belonging to the Company and its customers, suppliers and employees, exposing the Company to liability which could adversely impact the Company’s business and reputation. In the ordinary course of business, the Company relies on information technology networks and systems, some of which are managed by third parties, to process, transmit and store electronic information, and to manage or support a variety of business processes and activities. Additionally, the Company collects and stores certain data, including proprietary business information, and may have access to confidential or personal information in certain of its businesses that is subject to privacy and security laws, regulations and customer-imposed controls. Despite the Company’s cybersecurity measures, which are continuously reviewed and upgraded, the Company’s information technology networks and infrastructure may still be vulnerable to damage, disruptions or shutdowns due to attack by hackers or breaches, employee error or malfeasance, power outages, computer viruses, telecommunication or utility failures, systems failures, service providers including cloud services, natural disasters or other catastrophic events. It is possible for such vulnerabilities to remain undetected for an extended period, up to and including several years. Any such events could result in legal claims or proceedings, liability or penalties under privacy laws, disruption in operations, and damage to the Company’s reputation, which could adversely affect the Company’s business.
15
Table of Contents
Item 1B. Unresolved Staff Comments
The Company does not have any unresolved staff comments.
The Company currently owns or leases 32 facilities, which together contain approximately 2.2 million square feet of manufacturing, warehouse, research and development, sales and office space worldwide. Most of the Company’s international facilities contain space for offices, research and engineering (R&E), warehousing and manufacturing with manufacturing using a majority of the space. The following table provides information regarding the Company’s principal facilities:
| Number of Facilities | Total Approximate Square Feet |
|||||||||||||||||||||||||
| Segment | Location | Manufacturing | Warehouse | R&E | Office | Owned | Leased | |||||||||||||||||||
| Americas |
United States | 4 | 4 | 3 | 5 | 705,000 | 27,700 | |||||||||||||||||||
| Brazil | 1 | 1 | 1 | 1 | 215,500 | |||||||||||||||||||||
| Canada | 2 | 2 | 1 | 2 | 124,500 | |||||||||||||||||||||
| Mexico | 1 | 1 | 2 | 84,000 | ||||||||||||||||||||||
| Asia-Pac |
Australia | 1 | 2 | 1 | 4 | 122,895 | 78,328 | |||||||||||||||||||
| China | 1 | 1 | 1 | 1 | 132,100 | |||||||||||||||||||||
| Indonesia | 2 | 1 | 1 | 2 | 60,100 | |||||||||||||||||||||
| Thailand | 1 | 1 | 1 | 135,700 | ||||||||||||||||||||||
| New Zealand | 1 | 3 | 1 | 2 | 39,600 | |||||||||||||||||||||
| EMEA |
Great Britain | 1 | 1 | 1 | 1 | 89,400 | ||||||||||||||||||||
| South Africa | 1 | 1 | 1 | 1 | 68,800 | |||||||||||||||||||||
| Spain | 1 | 1 | 1 | 1 | 74,000 | |||||||||||||||||||||
| Poland | 1 | 1 | 1 | 1 | 174,400 | |||||||||||||||||||||
From time to time, the Company may be subject to litigation incidental to its business. The Company is not a party to any pending legal proceedings that the Company believes would, individually or in the aggregate, have a material adverse effect on its financial condition, results of operations or cash flows.
Item 4. Mine Safety Disclosures
Not applicable
Item 4A. Executive Officers of the Registrant
Each executive officer is elected by the Board of Directors, serves at its pleasure and holds office until a successor is appointed, or until the earliest of death, resignation or removal.
16
Table of Contents
| Name |
Age |
Position | ||
| Robert G. Ruhlman |
59 | Chairman, President and Chief Executive Officer | ||
| Eric R. Graef |
63 | Chief Financial Officer, Vice President - Finance and Treasurer | ||
| William H. Haag |
52 | Vice President - International Operations | ||
| J. Cecil Curlee Jr. |
59 | Vice President - Human Resources | ||
| Dennis F. McKenna |
49 | Executive Vice President - Global Business Development | ||
| David C. Sunkle |
57 | Vice President - Research and Engineering and Manufacturing | ||
| Caroline S. Vaccariello |
49 | General Counsel and Corporate Secretary | ||
| John M. Hofstetter |
51 | Vice President - Sales and Global Communications Markets | ||
| J. Ryan Ruhlman |
32 | Vice President - Marketing and Business Development |
The following sets forth the name and recent business experience for each person who is an executive officer of the Company at March 1, 2016:
Robert G. Ruhlman was elected Chairman in July 2004. Mr. Ruhlman has served as Chief Executive Officer since July 2000 and as President since 1995 (positions he continues to hold). Mr. Ruhlman is the son of Barbara P. Ruhlman and the father of J. Ryan Ruhlman, both Directors of the Company.
Eric R. Graef was elected Vice President—Finance and Treasurer in December 1999 and Chief Financial Officer in December 2007.
William H. Haag was elected Vice President—International Operations in April 1999.
J. Cecil Curlee Jr. was elected Vice President—Human Resources in January 2003.
Dennis F. McKenna was elected Executive Vice President Global Business Development in January 2015 and expanded his role to include worldwide marketing and business development strategies. Prior to that, he was elected Vice President—Marketing and Global Business Development in April 2004.
David C. Sunkle was elected Vice President-Research and Engineering in January 2007. In addition, Mr. Sunkle has taken on the role of Vice President – Manufacturing since July 2008.
Caroline S. Vaccariello was elected General Counsel and Corporate Secretary in January 2007.
John M. Hofstetter was elected Vice President – Sales and Global Communications Markets and Business Development in April 2012. Effective January 1, 2013, his role expanded to include domestic sales responsibility for the Energy Markets and Special Industries. He has served a variety of positions in Marketing and Sales since 1988, including General Manager of Sales – Communications Markets and Special Industries, Director – Marketing and Sales Communications Markets, and Director – Global Communications Markets.
J. Ryan Ruhlman was elected to the Company’s Board of Directors in July 2015 and as Vice President – Marketing and Business Development in December 2015, which expanded his role to include new acquisition and market opportunities. Prior to that, he was promoted to Director Marketing and Business Development in January 2015 including responsibilities for Special Industries, Distribution and Transmission Markets, as well as Marketing Communications. He has served a variety of positions in Research and Engineering, International and Marketing and Sales departments since 2002, including Laboratory Technician, International Operations Project Specialist, Business Development Specialist and Manager of New Business Development and Marketing Communications. Mr. Ruhlman is the son of Robert G. Ruhlman and the grandson of Barbara P. Ruhlman, both Directors of the Company.
17
Table of Contents
Item 5. Market for Registrant’s Common Equity, Related Shareholder Matters and Issuer Purchases of Equity Securities
The Company’s common shares are traded on NASDAQ under the trading symbol “PLPC”. As of March 7, 2016, the Company had approximately 1,500 shareholders of record. The following table sets forth for the periods indicated (i) the high and low closing sale prices per share of the Company’s common shares as reported by the NASDAQ and (ii) the amount per share of cash dividends paid by the Company.
| Year ended December 31 | ||||||||||||||||||||||||
| 2015 | 2014 | |||||||||||||||||||||||
| Quarter |
High | Low | Dividend | High | Low | Dividend | ||||||||||||||||||
| First |
$ | 54.27 | $ | 42.13 | $ | 0.20 | $ | 73.74 | $ | 59.67 | $ | 0.20 | ||||||||||||
| Second |
45.40 | 37.72 | 0.20 | 69.51 | 51.88 | 0.20 | ||||||||||||||||||
| Third |
37.96 | 30.30 | 0.20 | 58.53 | 52.76 | 0.20 | ||||||||||||||||||
| Fourth |
45.77 | 38.24 | 0.20 | 57.50 | 46.67 | 0.20 | ||||||||||||||||||
While the Company expects to continue to pay dividends of a comparable amount in the near term, the declaration and payment of future dividends will be made at the discretion of the Company’s Board of Directors in light of the current needs of the Company. Therefore, there can be no assurance that the Company will continue to make such dividend payments in the future.
| Plan Category |
Number of securities to be issued upon exercise of outstanding options, warrants and rights (a) |
Weighted-average exercise price of outstanding options, warrants and rights |
Number of securities remaining available for future issuance under equity compensation plans (excluding securities reflected in column a) (1) |
|||||||||
| Equity compensation plans approved by security holders |
158,725 | $ | 54.39 | 323,398 | ||||||||
| Equity compensation plans not approved by security holders |
0 | $ | 0.00 | 0 | ||||||||
|
|
|
|
|
|||||||||
| Total |
158,725 | 323,398 | ||||||||||
| (1) | Up to 312,398 shares may be issued in the form of restricted shares or units under the Company’s Long-Term Incentive Plan of 2008. |
18
Table of Contents
Performance Graph
Set forth below is a line graph comparing the cumulative total return of a hypothetical investment in the Company’s common shares with the cumulative total return of hypothetical investments in the NASDAQ Composite Index and the Peer Group Index based on the respective market price of each investment at December 31, 2010, December 31, 2011, December 31, 2012, December 31, 2013, December 31, 2014, and December 31, 2015, assuming in each case an initial investment of $100 on December 31, 2010, and reinvestment of dividends.
COMPARISON OF 5 YEAR CUMULATIVE TOTAL RETURN*
Among Preformed Line Products, the NASDAQ Composite Index,
and Peer Group Index
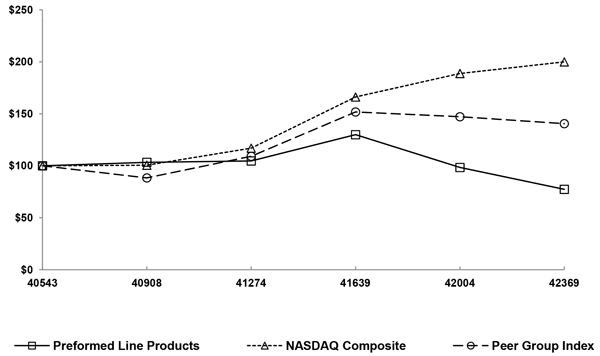
| * | $100 invested on 12/31/10 in stock or index, including reinvestment of dividends. |
Fiscal year ending December 31.
| 2010 | 2011 | 2012 | 2013 | 2014 | 2015 | |||||||||||||||||||
| PREFORMED LINE PRODUCTS CO |
100.00 | 103.31 | 104.63 | 129.91 | 98.36 | 77.33 | ||||||||||||||||||
| NASDAQ MARKET INDEX |
100.00 | 100.53 | 116.92 | 166.19 | 188.78 | 199.95 | ||||||||||||||||||
| PEER GROUP INDEX |
100.00 | 88.32 | 109.15 | 151.78 | 147.18 | 140.54 | ||||||||||||||||||
19
Table of Contents
Purchases of Equity Securities
On August 12, 2015, the Board of Directors authorized a plan to repurchase up to an additional 238,000 of Preformed Line Products Company common shares, resulting in a total of 250,000 shares available for repurchase with no expiration date. The following table includes repurchases for the three months ended December 31, 2015:
| Period (2015) |
Total Number of Shares Purchased |
Average Price Paid per Share |
Total Number of Shares Purchased as Part of Publicly Announced Plans or Programs |
Maximum Number of Shares that may yet be Purchased under the Plans or Programs |
||||||||||||
| October |
30,890 | $ | 40.28 | 138,004 | 111,996 | |||||||||||
| November (1) |
25,040 | $ | 41.39 | 163,044 | 86,956 | |||||||||||
| December (2) |
39,658 | $ | 42.34 | 202,702 | 47,298 | |||||||||||
|
|
|
|||||||||||||||
| Total |
95,588 | |||||||||||||||
|
|
|
|||||||||||||||
| (1) | Includes an aggregate of 4,929 common shares repurchased from the Company’s executive officers to offset tax obligations, which were not part of the repurchase program and were separately authorized by the Board. |
| (2) | Includes an aggregate of 3,190 common shares repurchased from the Company’s executive officers to offset tax obligations, which were not part of the repurchase program and were separately authorized by the Board. |
| Item 6. | Selected Financial Data |
| 2015 | 2014 | 2013 | 2012 | 2011 | ||||||||||||||||
| (Thousands of dollars, except per share data) | ||||||||||||||||||||
| Net Sales and Income |
||||||||||||||||||||
| Net sales |
$ | 354,666 | $ | 388,185 | $ | 409,776 | $ | 439,192 | $ | 424,404 | ||||||||||
| Operating income |
12,349 | 21,238 | 31,148 | 44,122 | 45,354 | |||||||||||||||
| Income before income taxes |
11,706 | 21,410 | 31,794 | 44,827 | 45,994 | |||||||||||||||
| Income from continuing operations, net of tax |
6,675 | 12,861 | 20,587 | 29,286 | 30,984 | |||||||||||||||
| Net income |
6,675 | 12,861 | 20,587 | 29,286 | 30,984 | |||||||||||||||
| Per Share Amounts |
||||||||||||||||||||
| Net income - basic |
$ | 1.25 | $ | 2.39 | $ | 3.84 | $ | 5.50 | $ | 5.89 | ||||||||||
| Net income - diluted |
1.24 | 2.39 | 3.77 | 5.45 | 5.78 | |||||||||||||||
| Dividends declared |
0.80 | 0.80 | 0.60 | 1.00 | 0.80 | |||||||||||||||
| Shareholders’ equity |
41.94 | 45.01 | 46.81 | 44.83 | 39.91 | |||||||||||||||
| Other Financial Information |
||||||||||||||||||||
| Current assets |
$ | 188,497 | $ | 200,663 | $ | 185,734 | $ | 194,101 | $ | 205,490 | ||||||||||
| Total assets |
324,573 | 353,967 | 332,406 | 333,064 | 327,348 | |||||||||||||||
| Current liabilities |
51,891 | 55,327 | 52,215 | 58,243 | 61,833 | |||||||||||||||
| Long-term debt (including current portion) |
31,864 | 31,865 | 13,249 | 9,573 | 28,592 | |||||||||||||||
| Capital leases |
268 | 173 | 310 | 504 | 484 | |||||||||||||||
| Shareholders’ equity |
218,984 | 242,925 | 252,330 | 241,069 | 212,858 | |||||||||||||||
| Item 7. | Management’s Discussion and Analysis of Financial Condition and Results of Operations |
This Management’s Discussion and Analysis of Financial Condition and Results of Operations (MD&A) is intended to help the readers of our financial statements better understand our results of operations, financial condition and present business environment. The MD&A is provided as a supplement to, and should be read in conjunction with, our audited consolidated financial statements and related notes included elsewhere in this report.
The MD&A is organized as follows:
| • | Overview |
| • | Recent Developments |
| • | Market Overview |
| • | Preface |
| • | Results of Operations |
| • | Working Capital, Liquidity and Capital Resources |
20
Table of Contents
| • | Critical Accounting Policies and Estimates |
| • | Recently Adopted Accounting Pronouncements |
| • | New Accounting Standards to be Adopted |
OVERVIEW
Preformed Line Products Company (the “Company”, “PLPC”, “we”, “us”, or “our”) was incorporated in Ohio in 1947. We are an international designer and manufacturer of products and systems employed in the construction and maintenance of overhead and underground networks for the energy, telecommunication, cable operators, information (data communication), and other similar industries. Our primary products support, protect, connect, terminate, and secure cables and wires. We also provide solar hardware systems, mounting hardware for a variety of solar power applications, and fiber optic and copper splice closures. PLPC is respected around the world for quality, dependability and market-leading customer service. Our goal is to continue to achieve profitable growth as a leader in the research, innovation, development, manufacture, and marketing of technically advanced products and services related to energy, communications and cable systems and to take advantage of this leadership position to sell additional quality products in familiar markets. We have 29 sales and manufacturing operations in 17 different countries.
We report our segments in four geographic regions: PLP-USA (including corporate), The Americas (includes operations in North and South America without PLP-USA), EMEA (Europe, Middle East & Africa) and Asia-Pacific in accordance with accounting standards codified in Financial Accounting Standards Board (FASB) Accounting Standards Codification (ASC) 280, Segment Reporting. Each segment distributes a full range of our primary products. Our PLP-USA segment is comprised of our U.S. operations manufacturing our traditional products primarily supporting our domestic energy, telecommunications and solar products. Our other three segments, The Americas, EMEA and Asia-Pacific, support our energy, telecommunications, data communication and solar products in each respective geographical region.
The segment managers responsible for each region report directly to the Company’s Chief Executive Officer, who is the chief operating decision maker, and are accountable for the financial results and performance of their entire segment for which they are responsible. The business components within each segment are managed to maximize the results of the entire operating segment and company rather than the results of any individual business component of the segment.
We evaluate segment performance and allocate resources based on several factors primarily based on sales and net income.
RECENT DEVELOPMENTS
In the fourth quarter of 2015, we reconfigured a product line in The Americas segment and consolidated its manufacturing processes into the PLP-USA segment operations. This action is expected to reduce future infrastructure and manufacturing costs for the product line. As a result, certain reclassifications have been made to the 2014 financial results to be comparable to the 2015 financial results for The Americas and PLP-USA reporting segments.
On January 31, 2014, we acquired Helix Uniformed Limited (Helix), located in Montreal, Quebec, Canada. The acquisition of Helix diversified our business in Canada and The Americas segment in total, expanded our manufacturing footprint and enhanced our engineering capabilities locally.
MARKET OVERVIEW
Our business continues to be highly concentrated in the energy and communications markets. During the past several years, industry consolidation continued as distributor and service provider consolidations occurred in our major markets. The devaluation of foreign currencies, particularly commodity-based currencies, coupled with the sluggish global economy and retraction of manufacturing in some of the regions that we serve has led to a challenging environment to sustain sales levels and achieve sales growth. There has been a lack of commitment by developed countries to upgrade and strengthen their electrical grids and communication networks, despite the
21
Table of Contents
growing need. Low oil and commodity prices have continued to affect construction projects worldwide and negatively impacted growth opportunities in our core markets in the U.S. and countries such as Brazil, Canada and the Asia-Pacific region where the financial situation is expected to be challenging going forward.
In 2015, sales in the energy market declined again due to a slowdown in the number and scale of transmission projects in North America. Additionally, there was a continued decline and pull-back in transmission, substation, and distribution construction and maintenance in the Asia-Pacific region. We expect the energy market to be relatively flat in 2016 given continued uncertainty in global markets. We believe that our leadership position in the market and ability to deliver reliable products quickly will enable us to take advantage of prospects for continued growth as transmission grids are enhanced and extended. There was a significant increase in sales in our solar sector on a worldwide basis.
Our international business is more concentrated in the energy markets and we experienced our most significant top line growth in 2015 in our solar products, primarily in our Asia-Pacific region. Historically, our international sales were primarily related to the medium voltage distribution segment of the energy market but have grown through acquisition and new product development to include a significant contribution from the transmission and solar markets. We believe that we are well positioned to supply the needs of the world’s diverse energy market requirements as a result of our strategically located operations and array of product designs and technologies.
When economic conditions improve, we believe our efforts internationally will lead to growth in our communications business from opportunities where deployment of fixed line and wireless telecommunications services and broadband penetration rates remain low as a percentage of the total population.
PREFACE
Our consolidated financial statements are prepared in conformity with U.S. generally accepted accounting principles (GAAP). Our discussions of the financial results include non-GAAP measures (e.g., foreign currency impact) to provide additional information concerning our financial results and provide information that we believe is useful to the readers of our financial statements in the assessment of our performance and operating trends. The 2015 and 2014 financial results reflect the integration of the DPW operations from The Americas segment to PLP-USA reporting segment.
Our financial statements are subject to fluctuations in the exchange rates of foreign currencies in relation to the U.S. dollar. As foreign currencies weaken against the U.S. dollar, our revenues and costs decrease as the foreign currency-denominated financial statements translate into fewer U.S. dollars. Foreign currencies weakened against the U.S. dollar in 2015. The most significant currencies that contributed to this movement were the Australian dollar, the Brazilian real, the Canadian dollar, the Malaysian ringgit, the New Zealand dollar and the Thai Baht. The fluctuations of foreign currencies during the year ended December 31, 2015 had an unfavorable impact on net sales of $36.9 million as compared to 2014. On a reportable segment basis, the favorable (unfavorable) impact of foreign currency on net sales and net income for the years ended December 31, 2015 and 2014 was as follows:
| Foreign Currency Translation Impact | ||||||||||||||||
| Net Sales | Net Income (Loss) | |||||||||||||||
| (Thousands of dollars) | 2015 | 2014 | 2015 | 2014 | ||||||||||||
| The Americas |
$ | (15,987 | ) | $ | (4,942 | ) | $ | (858 | ) | $ | (141 | ) | ||||
| EMEA |
(8,425 | ) | (491 | ) | (378 | ) | 12 | |||||||||
| Asia-Pacific |
(12,462 | ) | (3,855 | ) | 1,176 | 218 | ||||||||||
|
|
|
|
|
|
|
|
|
|||||||||
| Total |
$ | (36,874 | ) | $ | (9,288 | ) | $ | (60 | ) | $ | 89 | |||||
|
|
|
|
|
|
|
|
|
|||||||||
22
Table of Contents
While the effect of currency translation had only a slight impact on net income in both years, there was an incremental $4.5 million in losses on foreign currency transactions for the year ended December 31, 2015 that negatively impacted the operating results as summarized in the following table:
| Foreign Currency Translation Impact | ||||||||
| Year Ended December 31 | ||||||||
| (Thousands of dollars) | 2015 | 2014 | ||||||
| Operating income |
$ | 12,349 | $ | 21,238 | ||||
| Translation (gain) loss |
635 | (56 | ) | |||||
| Transaction loss |
7,413 | 2,900 | ||||||
|
|
|
|
|
|||||
| Operating income excluding currency impact |
$ | 20,397 | $ | 24,082 | ||||
|
|
|
|
|
|||||
Despite the current global economy, we believe our business fundamentals and our financial position are sound and strategically well-positioned. We remain focused on assessing our business structure, global facilities and overall capacity in conjunction with the requirements of local manufacturing in the markets that we serve. If necessary, we will utilize our global manufacturing network to manage costs, while driving increased sales volumes and delivering value to our customers. We have continued to invest in the business to improve efficiency, develop new products, increase our capacity and become an even stronger supplier to our customers. We currently have a bank debt to equity ratio of 14.7% and can borrow needed funds at an attractive interest rate under our credit facility. While debt declined $1.4 million, there was a slight increase in our bank debt to equity ratio, compared to 13.9% at December 31, 2014, primarily related to a decrease in equity from an unfavorable foreign currency translation impact in Accumulated other comprehensive loss along with the repurchase of stock in 2015.
The following table sets forth a summary of the Company’s consolidated income statements and the percentage of net sales for the years ended December 31, 2015 and 2014. The Company’s past operating results are not necessarily indicative of future operating results.
| Year Ended December 31 | ||||||||||||||||||||
| (Thousands of dollars) | 2015 | 2014 | Change | |||||||||||||||||
| Net sales |
$ | 354,666 | 100.0 | % | $ | 388,185 | 100.0 | % | $ | (33,519 | ) | |||||||||
| Cost of products sold |
251,214 | 70.8 | 267,237 | 68.8 | (16,023 | ) | ||||||||||||||
|
|
|
|
|
|
|
|||||||||||||||
| GROSS PROFIT |
103,452 | 29.2 | 120,948 | 31.2 | (17,496 | ) | ||||||||||||||
| Costs and expenses |
91,103 | 25.7 | 99,710 | 25.7 | (8,607 | ) | ||||||||||||||
|
|
|
|
|
|
|
|||||||||||||||
| OPERATING INCOME |
12,349 | 3.5 | 21,238 | 5.5 | (8,889 | ) | ||||||||||||||
| Other income (expense) |
(643 | ) | (0.2 | ) | 172 | 0.0 | (815 | ) | ||||||||||||
|
|
|
|
|
|
|
|||||||||||||||
| INCOME BEFORE INCOME TAXES |
11,706 | 3.3 | 21,410 | 5.5 | (9,704 | ) | ||||||||||||||
| Income taxes |
5,031 | 1.4 | 8,549 | 2.2 | (3,518 | ) | ||||||||||||||
|
|
|
|
|
|
|
|||||||||||||||
| NET INCOME |
$ | 6,675 | 1.9 | % | $ | 12,861 | 3.3 | % | $ | (6,186 | ) | |||||||||
|
|
|
|
|
|
|
|||||||||||||||
23
Table of Contents
2015 RESULTS OF OPERATIONS COMPARED TO 2014
Net sales. In 2015, net sales were $354.7 million, a decrease of $33.5 million, or 9%, compared to 2014. Excluding the unfavorable effect of currency translation, net sales increased 1% as summarized in the following table:
| Year Ended December 31 | ||||||||||||||||||||||||
| (Thousands of dollars) |
2015 | 2014 | Change | Change Due to Currency Translation |
Change Excluding Currency Translation |
% Change |
||||||||||||||||||
| Net sales |
||||||||||||||||||||||||
| PLP-USA |
$ | 142,470 | $ | 152,567 | $ | (10,097 | ) | $ | 0 | $ | (10,097 | ) | (7 | )% | ||||||||||
| The Americas |
59,290 | 75,868 | (16,578 | ) | (15,987 | ) | (591 | ) | (1 | ) | ||||||||||||||
| EMEA |
53,778 | 65,446 | (11,668 | ) | (8,425 | ) | (3,243 | ) | (5 | ) | ||||||||||||||
| Asia-Pacific |
99,128 | 94,304 | 4,824 | (12,462 | ) | 17,286 | 18 | |||||||||||||||||
|
|
|
|
|
|
|
|
|
|
|
|||||||||||||||
| Consolidated |
$ | 354,666 | $ | 388,185 | $ | (33,519 | ) | $ | (36,874 | ) | $ | 3,355 | 1 | % | ||||||||||
|
|
|
|
|
|
|
|
|
|
|
|
|
|||||||||||||
The decrease in PLP-USA net sales of $10.1 million, or 7%, was primarily due to a reduction in transmission sales as a result of fewer projects in the United States along with a decline in domestic solar sales. International net sales for the year ended December 31, 2015 were unfavorably affected by $36.9 million when local currencies were converted to U.S. dollars. The following discussion of changes in net sales excludes the effect of currency translation. The Americas net sales of $59.3 million decreased $.6 million, or 1%, primarily due to a net $2.2 million decline in transmission sales volume partially offset by an increase in distribution sales volume. EMEA net sales of $53.8 million decreased $3.2 million, or 5%, primarily due to volume decreases in telecommunications and distribution products. The Asia-Pacific net sales of $99.1 million increased $17.3 million, or 18%, compared to 2014. The increase in net sales is primarily related to a significant increase in solar sales.
Gross Profit. Gross profit of $103.5 million for 2015 decreased $17.5 million, or 14%, compared to 2014. Excluding the unfavorable effect of currency translation, gross profit decreased $8.2 million, or 7%, as summarized in the following table:
| Year Ended December 31 | ||||||||||||||||||||||||
| (Thousands of dollars) | 2015 | 2014 | Change | Change Due to Currency Translation |
Change Excluding Currency Translation |
% Change |
||||||||||||||||||
| Gross profit |
||||||||||||||||||||||||
| PLP-USA |
$ | 47,752 | $ | 52,807 | $ | (5,055 | ) | $ | 0 | $ | (5,055 | ) | (10 | )% | ||||||||||
| The Americas |
17,754 | 19,998 | (2,244 | ) | (4,850 | ) | 2,606 | 13 | ||||||||||||||||
| EMEA |
19,052 | 22,776 | (3,724 | ) | (2,737 | ) | (987 | ) | (4 | ) | ||||||||||||||
| Asia-Pacific |
18,894 | 25,367 | (6,473 | ) | (1,720 | ) | (4,753 | ) | (19 | ) | ||||||||||||||
|
|
|
|
|
|
|
|
|
|
|
|||||||||||||||
| Consolidated |
$ | 103,452 | $ | 120,948 | $ | (17,496 | ) | $ | (9,307 | ) | $ | (8,189 | ) | (7 | )% | |||||||||
|
|
|
|
|
|
|
|
|
|
|
|
|
|||||||||||||
PLP-USA gross profit of $47.8 million decreased $5.1 million compared to 2014. PLP-USA’s $5.1 million decrease in gross profit was predominantly related to the reduction in sales volume along with $1.0 million of restructuring charges. International gross profit for the year ended December 31, 2015 was unfavorably impacted by $9.3 million when local currencies were translated to U.S. dollars. The following discussion of gross profit changes excludes the effects of currency translation. The Americas gross profit increase of $2.6 million was primarily the result of product margin improvement in the region. With the acquisition of Helix in 2014, inventories were adjusted to fair value on the acquisition date and the subsequent sale of that inventory garnered a lower product margin in 2014 as The Americas recognized $1.9 million of the acquired inventories fair value adjustment in Cost of products sold. The remaining increase in gross profit was due to product margin expansion achieved on 2015 sales. The EMEA gross profit decreased $1.0 million primarily as a result of the decline in sales in the region. Asia-Pacific gross profit decreased $4.8 million primarily due to a shift in the product sales mix to lower margin products along with $.7 million in net costs associated with the continued reconfiguration of the operations of one location in the segment.
24
Table of Contents
Costs and expenses. Costs and expenses of $91.1 million for the year ended December 31, 2015 decreased $8.6 million, or 9%, compared to 2014. Excluding the effect of currency translation, costs and expenses were essentially flat as summarized in the following table:
| Year Ended December 31 | ||||||||||||||||||||||||
| (Thousands of dollars) | 2015 | 2014 | Change | Change Due to Currency Translation |
Change Excluding Currency Translation |
% Change |
||||||||||||||||||
| Costs and expenses |
||||||||||||||||||||||||
| PLP-USA |
$ | 42,946 | $ | 40,668 | $ | 2,278 | $ | 0 | $ | 2,278 | 6 | % | ||||||||||||
| The Americas |
13,451 | 16,535 | (3,084 | ) | (3,636 | ) | 552 | 3 | ||||||||||||||||
| EMEA |
12,739 | 14,752 | (2,013 | ) | (2,186 | ) | 173 | 1 | ||||||||||||||||
| Asia-Pacific |
21,967 | 27,755 | (5,788 | ) | (2,850 | ) | (2,938 | ) | (11 | ) | ||||||||||||||
|
|
|
|
|
|
|
|
|
|
|
|||||||||||||||
| Consolidated |
$ | 91,103 | $ | 99,710 | $ | (8,607 | ) | $ | (8,672 | ) | $ | 65 | 0 | % | ||||||||||
|
|
|
|
|
|
|
|
|
|
|
|
|
|||||||||||||
PLP-USA costs and expenses increased $2.3 million primarily due to $2.8 million increase in net foreign currency exchange losses and a decrease in intercompany royalty income of $1.8 million. The foreign currency exchange losses were primarily related to translating into U.S. dollars its foreign denominated loans, trade receivables and royalty receivables from its foreign subsidiaries at the December 2015 year-end exchange rates. These increases in cost and expenses were partially mitigated with a reduction in personnel costs and tighter expense controls reducing expense by $2.3 million. International costs and expenses for the year ended December 31, 2015 were favorably impacted by $8.7 million when local currencies were translated to U.S. dollars. The following discussions of costs and expenses exclude the effect of currency translation. The Americas costs and expenses increase of $.6 million was primarily due to foreign currency exchange losses of $1.5 million, partially offset by the non-recurrence of a $.7 million charge recorded in 2014 for the write-down of interest and inflation related to a tax refund along with an additional $.2 million value added tax recovery in 2015. The foreign currency exchange losses were principally related to intercompany purchases. EMEA costs and expenses increased $.2 million due primarily to the start-up expenses for additional offices in the region of $1.0 million predominantly offset by a reduction in personnel costs and overall tightened expense management. Asia-Pacific costs and expenses decreased $2.9 million primarily due to savings in personnel costs from staffing modifications implemented in 2014 along with overall tighter expense management.
Other income (expense). Other expense for the year ended December 31, 2015 of $.6 million increased $.8 million compared to 2014. This increase was due to the reversal of a receivable recorded at the opening balance sheet date of a previous acquisition. The receivable represented the indemnification by the prior owner for unrecognized tax benefits. The resolution of a foreign income tax audit resulted in a tax liability for less than the previously recorded accrual. The difference was recorded as a tax benefit in income tax expense and the reduction to the corresponding receivable was recognized as other expense, after receipt of the indemnified tax related amount from the prior owner.
Income taxes. Income taxes for the years ended December 31, 2015 and 2014 were $5.0 million and $8.5 million, respectively, based on pretax income of $11.7 million and $21.4 million, respectively. The effective tax rate for the years ended December 31, 2015 and 2014 was 43.0% and 39.9%, respectively, compared to the U.S. federal statutory rate of 35%. Our effective tax rate is affected by recurring items, such as tax rates in foreign jurisdictions, which differ from the U.S. federal statutory income tax rate, and the relative amount of income earned in those jurisdictions. It is also affected by discrete items that may occur in any given period but are not consistent from year to year. The following items had the most significant impact on the difference between our statutory U.S. federal income tax rate of 35% and our effective tax rate:
2015
| 1. | $1.8 million, or 15.0%, increase resulting from losses in certain jurisdictions where no tax benefit is recognized. |
25
Table of Contents
| 2. | $.6 million, or 5.4%, increase resulting primarily from incremental tax from the repatriation of foreign earnings and partially offset by other U.S. permanent items and state and local income taxes. |
| 3. | $.8 million, or 6.6%, decrease of unrecognized tax benefits resulting primarily from a favorable resolution of a foreign audit in our Asia Pacific segment for which a larger tax liability had previously been accrued. |
| 4. | $.7 million, or 5.8%, decrease resulting from earnings in jurisdictions with lower tax rates than the U.S. federal statutory rate where such earnings are permanently reinvested. |
2014
| 1. | $1.9 million, or 9.0%, increase resulting from losses in certain jurisdictions where no tax benefit is recognized. |
| 2. | $.3 million, or 1.1%, increase resulting from U.S. permanent items, primarily related to the repatriation of foreign earnings and state and local income taxes. |
| 3. | $1.3 million, or 6.1%, decrease resulting from earnings in jurisdictions with lower tax rates than the U.S. federal statutory rate where such earnings are permanently reinvested. |
| 4. | $.2 million, or .9%, increase resulting from the recognition of previously unrecognized tax benefits. |
Net income. As a result of the preceding items, net income for the year ended December 31, 2015 was $6.7 million, compared to $12.9 million for 2014. Excluding the effect of currency translation, net income decreased $6.1 million as summarized in the following table:
| Year Ended December 31 | ||||||||||||||||||||||||
| (Thousands of dollars) | 2015 | 2014 | Change | Change Due to Currency Translation |
Change Excluding Currency Translation |
% Change |
||||||||||||||||||
| Net income (loss) |
||||||||||||||||||||||||
| PLP-USA |
$ | 2,031 | $ | 7,233 | $ | (5,202 | ) | $ | 0 | $ | (5,202 | ) | (72 | )% | ||||||||||
| The Americas |
3,178 | 2,647 | 531 | (858 | ) | 1,389 | 55 | |||||||||||||||||
| EMEA |
4,881 | 6,192 | (1,311 | ) | (378 | ) | (933 | ) | (15 | ) | ||||||||||||||
| Asia-Pacific |
(3,415 | ) | (3,211 | ) | (204 | ) | 1,176 | (1,380 | ) | (43 | ) | |||||||||||||
|
|
|
|
|
|
|
|
|
|
|
|||||||||||||||
| Consolidated |
$ | 6,675 | $ | 12,861 | $ | (6,186 | ) | $ | (60 | ) | $ | (6,126 | ) | (48 | )% | |||||||||
|
|
|
|
|
|
|
|
|
|
|
|
|
|||||||||||||
PLP-USA net income decreased $5.2 million due to a $7.4 million decrease in operating income partially offset by lower income taxes of $2.2 million. International net income for the year ended December 31, 2015 was unfavorably affected by $.1 million when local currencies were converted to U.S. dollars. The following discussion of net income excludes the effect of currency translation. The Americas net income increased $1.4 million as a result of a $2.1 million increase in operating income and a $.2 million decrease in interest expense as a portion of loan balances were repaid. These improvements were partially offset with an increase in income taxes of $.9 million. EMEA net income decreased $.9 million as a result of a $1.2 million decrease in operating income partially offset by a decrease in income taxes of $.3 million. Asia-Pacific net loss increased $1.4 million as a result of a $1.8 million decrease in operating income offset by the net tax benefit for the region, which was $.4 million inclusive of the previously mentioned tax indemnification receivable reduction.
26
Table of Contents
2014 RESULTS OF OPERATIONS COMPARED TO 2013
The following table sets forth a summary of the Company’s consolidated income statements and the percentage of net sales for the years ended December 31, 2014 and 2013.
| Year Ended December 31 | ||||||||||||||||||||
| (Thousands of dollars) | 2014 | 2013 | Change | |||||||||||||||||
| Net sales |
$ | 388,185 | 100.0 | % | $ | 409,776 | 100.0 | % | $ | (21,591 | ) | |||||||||
| Cost of products sold |
267,237 | 68.8 | 278,875 | 68.1 | (11,638 | ) | ||||||||||||||
|
|
|
|
|
|
|
|||||||||||||||
| GROSS PROFIT |
120,948 | 31.2 | 130,901 | 31.9 | (9,953 | ) | ||||||||||||||
| Costs and expenses |
99,710 | 25.7 | 99,753 | 24.3 | (43 | ) | ||||||||||||||
|
|
|
|
|
|
|
|||||||||||||||
| OPERATING INCOME |
21,238 | 5.5 | 31,148 | 7.6 | (9,910 | ) | ||||||||||||||
| Other income (expense) |
172 | 0.0 | 646 | 0.2 | (474 | ) | ||||||||||||||
|
|
|
|
|
|
|
|||||||||||||||
| INCOME BEFORE INCOME TAXES |
21,410 | 5.5 | 31,794 | 7.8 | (10,384 | ) | ||||||||||||||
| Income taxes |
8,549 | 2.2 | 11,207 | 2.7 | (2,658 | ) | ||||||||||||||
|
|
|
|
|
|
|
|||||||||||||||
| NET INCOME |
$ | 12,861 | 3.3 | % | $ | 20,587 | 5.0 | % | $ | (7,726 | ) | |||||||||
|
|
|
|
|
|
|
|||||||||||||||
Net sales. In 2014, net sales were $388.2 million, a decrease of $21.6 million, or 5%, compared to 2013. Excluding the unfavorable effect of currency translation, net sales decreased 3% as summarized in the following table:
| Year Ended December 31 | ||||||||||||||||||||||||
| (Thousands of dollars) | 2014 | 2013 | Change | Change Due to Currency Translation |
Change Excluding Currency Translation |
% Change |
||||||||||||||||||
| Net sales |
||||||||||||||||||||||||
| PLP-USA |
$ | 152,567 | $ | 163,033 | $ | (10,466 | ) | $ | 0 | $ | (10,466 | ) | (6 | )% | ||||||||||
| The Americas |
75,868 | 72,518 | 3,350 | (4,942 | ) | 8,292 | 11 | |||||||||||||||||
| EMEA |
65,446 | 61,543 | 3,903 | (491 | ) | 4,394 | 7 | |||||||||||||||||
| Asia-Pacific |
94,304 | 112,682 | (18,378 | ) | (3,855 | ) | (14,523 | ) | (13 | ) | ||||||||||||||
|
|
|
|
|
|
|
|
|
|
|
|||||||||||||||
| Consolidated |
$ | 388,185 | $ | 409,776 | $ | (21,591 | ) | $ | (9,288 | ) | $ | (12,303 | ) | (3 | )% | |||||||||
|
|
|
|
|
|
|
|
|
|
|
|
|
|||||||||||||
The decrease in PLP-USA net sales of $10.5 million, or 6%, was primarily due to a reduction in transmission sales as a result of fewer projects in the United States coupled with a $4.9 million decrease in solar sales. International net sales for the year ended December 31, 2014 were unfavorably affected by $9.3 million when local currencies were converted to U.S. dollars. The following discussion of changes in net sales excludes the effect of currency translation. The Americas net sales of $75.9 million increased $8.3 million, or 11%, primarily due to $13.2 million in sales at Helix, which was acquired in January of 2014, partially offset by lower net transmission sales of $4.9 million. EMEA net sales of $65.4 million increased $4.4 million, or 7%, primarily due to volume increases in telecommunications and distribution. The Asia-Pacific net sales of $94.3 million decreased $14.5 million, or 13%, compared to 2013. The decrease in net sales was primarily related to lower volume in transmission and substation sales as a result of slowing economies, government deferral of projects and political uncertainty in various locations within the region.
27
Table of Contents
Gross Profit. Gross profit of $120.9 million for 2014 decreased $10.0 million, or 8%, compared to 2013. Excluding the unfavorable effect of currency translation, gross profit decreased $7.8 million, or 6%, as summarized in the following table:
| Year Ended December 31 | ||||||||||||||||||||||||
| (Thousands of dollars) | 2014 | 2013 | Change | Change Due to Currency Translation |
Change Excluding Currency Translation |
% Change |
||||||||||||||||||
| Gross profit |
||||||||||||||||||||||||
| PLP-USA |
$ | 52,807 | $ | 58,447 | $ | (5,640 | ) | $ | 0 | $ | (5,640 | ) | (10 | )% | ||||||||||
| The Americas |
19,998 | 22,337 | (2,339 | ) | (1,300 | ) | (1,039 | ) | (5 | ) | ||||||||||||||
| EMEA |
22,776 | 21,146 | 1,630 | (94 | ) | 1,724 | 8 | |||||||||||||||||
| Asia-Pacific |
25,367 | 28,971 | (3,604 | ) | (793 | ) | (2,811 | ) | (10 | ) | ||||||||||||||
|
|
|
|
|
|
|
|
|
|
|
|||||||||||||||
| Consolidated |
$ | 120,948 | $ | 130,901 | $ | (9,953 | ) | $ | (2,187 | ) | $ | (7,766 | ) | (6 | )% | |||||||||
|
|
|
|
|
|
|
|
|
|
|
|
|
|||||||||||||
PLP-USA gross profit of $52.8 million decreased $5.6 million compared to 2013. PLP-USA’s $5.6 million decrease in gross profit was predominantly related to the reduction in sales volume. International gross profit for the year ended December 31, 2014 was unfavorably impacted by $2.2 million when local currencies were translated to U.S. dollars. The following discussion of gross profit changes excludes the effects of currency translation. The Americas gross profit decrease of $1.0 million was primarily the result of lower product margin transmission sales. Additionally, while Helix provided a positive contribution to gross profit, it was negatively impacted by the sale of inventories which were adjusted to fair value on the acquisition date. The acquisition was accounted for pursuant to the current business combination standards. In accordance with the standards, we recorded, as of the acquisition date, the acquired inventories at their respective fair values. We recognized $1.9 million of the acquired inventories fair value adjustment in Cost of products sold. The EMEA gross profit increased $1.7 million primarily as a result of higher net sales in the region. Asia-Pacific gross profit decreased $2.8 million primarily due to a $3.5 million decrease in gross profit from lower net sales partially offset by a $.7 million reduction in production costs and freight expense.
Costs and expenses. Costs and expenses of $99.7 million for the year ended December 31, 2014 decreased less than $.1 million, or less than 1%, compared to 2013. Excluding the effect of currency translation, costs and expenses increased 2% as summarized in the following table:
| Year Ended December 31 | ||||||||||||||||||||||||
| (Thousands of dollars) | 2014 | 2013 | Change | Change Due to Currency Translation |
Change Excluding Currency Translation |
% Change |
||||||||||||||||||
| Costs and expenses |
||||||||||||||||||||||||
| PLP-USA |
$ | 40,668 | $ | 41,873 | $ | (1,205 | ) | $ | 0 | $ | (1,205 | ) | (3 | )% | ||||||||||
| The Americas |
16,535 | 13,552 | 2,983 | (1,117 | ) | 4,100 | 30 | |||||||||||||||||
| EMEA |
14,752 | 13,325 | 1,427 | (110 | ) | 1,537 | 12 | |||||||||||||||||
| Asia-Pacific |
27,755 | 31,003 | (3,248 | ) | (1,021 | ) | (2,227 | ) | (7 | ) | ||||||||||||||
|
|
|
|
|
|
|
|
|
|
|
|||||||||||||||
| Consolidated |
$ | 99,710 | $ | 99,753 | $ | (43 | ) | $ | (2,248 | ) | $ | 2,205 | 2 | % | ||||||||||
|
|
|
|
|
|
|
|
|
|
|
|
|
|||||||||||||
PLP-USA costs and expenses decreased $1.2 million primarily due to $1.5 million decline in personnel related and commission expenses, along with a decrease in net foreign currency exchange losses of $.5 million. The foreign currency exchange losses were primarily related to translating into U.S. dollars our foreign denominated loans, trade receivables and royalty receivables from our foreign subsidiaries at the December 2014 year-end exchange rates. These reductions in expense were partially offset by a $.9 million decline in intercompany royalty income. International costs and expenses for the year ended December 31, 2014 were favorably impacted by $2.2 million when local currencies were translated to U.S. dollars. The following discussions of costs and expenses exclude the effect of currency translation. The Americas costs and expenses increase of $4.1 million was primarily due to a $1.7 million impact related to a refund of VAT and interest and inflation from an income tax refund
28
Table of Contents
recorded at our Brazilian location in 2013 that was not repeated in 2014 coupled with a $1.7 million increase in costs and expenses of Helix acquired in January 2014. Additionally, there was an increase of $.3 million in personnel expenses and professional fees along with $.4 million for net interest expense and royalty expense. EMEA costs and expenses increased $1.5 million due primarily to the start-up expenses for additional offices in the region of $1.2 million in addition to personnel cost increases of $.4 million. Asia-Pacific costs and expenses decreased $2.2 million primarily due to lower intercompany expenses of $1 million, a $.3 million decrease in net foreign currency exchange losses, and a $.9 million reduction in employee related and consulting costs.
Other income (expense). Other income for the year ended December 31, 2014 of $.2 million decreased $.5 million compared to 2013 due to a $.4 million increase in net interest expense and a $.1 million decrease in net other income.
Income taxes. Income taxes for the years ended December 31, 2014 and 2013 were $8.5 million and $11.2 million, respectively, based on pretax income of $21.4 million and $31.8 million, respectively. The effective tax rate for the years ended December 31, 2014 and 2013 was 39.9% and 35.3%, respectively, compared to the U.S. federal statutory rate of 35%. Our tax rate is affected by recurring items, such as tax rates in foreign jurisdictions, which differ from the U.S. federal statutory income tax rate, and the relative amount of income earned in those jurisdictions. It is also affected by discrete items that may occur in any given period but are not consistent from year to year. The following items had the most significant impact on the difference between our statutory U.S. federal income tax rate of 35% and our effective tax rate:
2014
| 1. | $1.9 million, or 9.0%, increase resulting from losses in certain jurisdictions where no tax benefit is recognized |
| 2. | $.3 million, or 1.1%, increase resulting from U.S. permanent items, primarily related to the repatriation of foreign earnings and state and local income taxes. |
| 3. | $1.3 million, or 6.1%, decrease resulting from earnings in jurisdictions with lower tax rates than the U.S. federal statutory rate where such earnings are permanently reinvested. |
| 4. | $.2 million, or .9%, increase resulting from the recognition of previously unrecognized tax benefits. |
2013
| 1. | $1.0 million, or 3.4%, increase resulting from losses in certain jurisdictions where no tax benefit is recognized. |
| 2. | $1.2 million, or 3.8%, increase resulting from U.S. permanent items, primarily related to the repatriation of foreign earnings and state and local income taxes. |
| 3. | $1.4 million, or 4.6%, decrease resulting from earnings in jurisdictions with lower tax rates than the U.S. federal statutory rate where such earnings are permanently reinvested. |
| 4. | $.7 million, or 2.3%, decrease resulting primarily from a favorable resolution of a domestic audit. |
29
Table of Contents
Net income. As a result of the preceding items, net income for the year ended December 31, 2014 was $12.9 million, compared to $20.6 million for 2013. Excluding the effect of currency translation, net income decreased $7.8 million as summarized in the following table:
| Year Ended December 31 | ||||||||||||||||||||||||
| (Thousands of dollars) | 2014 | 2013 | Change | Change Due to Currency Translation |
Change Excluding Currency Translation |
% Change |
||||||||||||||||||
| Net income (loss) |
||||||||||||||||||||||||
| PLP-USA |
$ | 7,233 | $ | 10,356 | $ | (3,123 | ) | $ | 0 | $ | (3,123 | ) | (30 | )% | ||||||||||
| The Americas |
2,647 | 6,415 | (3,768 | ) | (141 | ) | (3,627 | ) | (57 | ) | ||||||||||||||
| EMEA |
6,192 | 6,047 | 145 | 12 | 133 | 2 | ||||||||||||||||||
| Asia-Pacific |
(3,211 | ) | (2,231 | ) | (980 | ) | 218 | (1,198 | ) | (54 | ) | |||||||||||||
|
|
|
|
|
|
|
|
|
|
|
|||||||||||||||
| Consolidated |
$ | 12,861 | $ | 20,587 | $ | (7,726 | ) | $ | 89 | $ | (7,815 | ) | (38 | )% | ||||||||||
|
|
|
|
|
|
|
|
|
|
|
|
|
|||||||||||||
PLP-USA net income decreased $3.1 million due to a $4.4 million decrease in operating income partially offset by lower income taxes of $1.4 million. International net income for the year ended December 31, 2014 was favorably affected by $.1 million when local currencies were converted to U.S. dollars. The following discussion of net income excludes the effect of currency translation. The Americas net income decreased $3.6 million as a result of a $5.2 million decrease in operating income and a $.5 million increase in interest expense primarily due from funding for the Helix acquisition partially offset with lower income taxes of $1.9 million. EMEA net income increased $.1 million as a result of a $.2 million increase in operating income partially offset by increased income taxes. Asia-Pacific net loss increased $1.2 million as a result of a $.5 million decrease in operating income coupled with a decrease in other income of $.1 million and an increase in income taxes of $.6 million due to the Company’s decision not to recognize tax benefits attributable to operating losses.
WORKING CAPITAL, LIQUIDITY AND CAPITAL RESOURCES
Management Assessment of Liquidity
We measure liquidity on the basis of our ability to meet short-term and long-term operating needs, fund additional investments, including acquisitions, and make dividend payments to shareholders. Significant factors affecting the management of liquidity are cash flows from operating activities, capital expenditures, cash dividends, business acquisitions and access to bank lines of credit.
Our investments include expenditures required for equipment and facilities as well as expenditures in support of our strategic initiatives. In 2015, we used cash of $10.8 million for capital expenditures. We ended 2015 with $30.4 million of cash and cash equivalents. Our cash and cash equivalents are held in various locations throughout the world. At December 31, 2015, the majority of our cash and cash equivalents are held outside the U.S. We expect the majority of accumulated non-U.S. cash balances will remain outside of the U.S. and that we will meet U.S. liquidity needs through future cash flows, use of U.S. cash balances, external borrowings, or some combination of these sources. We complete comprehensive reviews of our significant customers and their creditworthiness by analyzing financial statements for customers where we have identified a measure of increased risk. We closely monitor payments and developments which may signal possible customer credit issues. We currently have not identified any potential material impact on our liquidity from customer credit issues.
Our financial position remains strong and our current ratio at December 31, 2015 and 2014 was 3.6 to 1. Total debt at December 31, 2015 was $32.3 million. At December 31, 2015, our unused availability under our line of credit was $16.8 million and our bank debt to equity percentage was 14.7%. The term of our credit facility extends through August 2017 at an interest rate of LIBOR plus 1.125%. The line of credit agreement contains, among other provisions, requirements for maintaining levels of net worth and profitability. At December 31, 2015 and throughout the year, we were in compliance with these covenants.
We expect that our major source of funding for 2016 and beyond will be our operating cash flows, our existing cash and cash equivalents as well as our line of credit agreement. We earn a significant amount of our operating income outside the United States, which, except for current earnings in certain jurisdictions, is deemed to be indefinitely reinvested in foreign jurisdictions. We currently do not intend nor foresee a need to repatriate these funds. We believe our future operating cash flows will be more than sufficient to cover debt repayments, other
30
Table of Contents
contractual obligations, capital expenditures and dividends for the next 12 months and thereafter for the foreseeable future. In addition, we believe our borrowing capacity provides substantial financial resources, if needed, to supplement funding of capital expenditures and/or acquisitions. We also believe that we can expand our borrowing capacity, if necessary; however, we do not believe we would increase our debt to a level that would have a material adverse impact upon results of operations or financial condition.
Sources and Uses of Cash
Cash increased $.8 million for the year ended December 31, 2015. Net cash provided by operating activities was $20.2 million. The major investing and financing uses of cash were capital expenditures of $10.8 million, common share repurchases of $7.6 million and dividends of $4.4 million. Currency had a positive $4.0 million impact on cash and cash equivalents when translating foreign denominated financial statements to U.S. dollars.
Net cash provided by operating activities decreased $5.0 million compared to 2014 primarily as a result of a decrease in net income of $6.2 million, a decrease of non-cash items of $1.5 million along with a decrease in operating assets (net of operating liabilities) of $2.6 million.
Net cash used in investing activities of $10.9 million for the year ended December 31, 2015 represents a decrease of $22.4 million when compared to cash used in investing activities for the year ended December 31, 2014. The decrease was primarily related to the business acquisition of Helix for $15.0 million, net of cash acquired, in 2014 along with a decline in capital expenditures of $6.9 million for 2015 when compared to 2014 along with an increase in proceeds in property disposals of $.8 million. These decreases in invested cash were partially offset by an increase in purchases of fixed term deposits of $.3 million in 2015. The decrease in capital expenditures was due primarily to the non-recurrence of the 2014 land and building purchase at Helix for $2.8 million and plant expansion of $4.8 million at our PLP-USA segment.
Cash used by financing activities for the year ended December 31, 2015 was $12.7 million compared to cash generation of $13.2 million in 2014. The $25.9 million decrease was primarily a result of a decrease in debt borrowings in 2015 compared to 2014 of $23.8 million and a net increase in cash used in capital stock transactions of $5.4 million partially offset by a decrease in repayments of debt of $3.4 million. The 2014 borrowings were used primarily to finance the acquisition of Helix.
We have commitments under operating leases primarily for office and manufacturing space, transportation equipment, office and computer equipment and capital leases primarily for equipment. One such lease is for our aircraft with a lease commitment through February 2017. Under the terms of the lease, we maintain the risk to make up a deficiency from market value attributable to damage, extraordinary wear and tear, excess air hours or exceeding maintenance overhaul schedules required by the Federal Aviation Administration. At the present time, we do not believe we have incurred any obligation for any contingent rent under the lease.
31
Table of Contents
Contractual obligations and other commercial commitments are summarized in the following tables:
| Payments Due by Period | ||||||||||||||||||||
| Contractual Obligations |
Total | Less than 1 year |
1-3 years | 4-5 years | After 5 years | |||||||||||||||
| (Thousands of dollars) | ||||||||||||||||||||
| Notes payable to bank (A) |
$ | 413 | $ | 413 | $ | 0 | $ | 0 | $ | 0 | ||||||||||
| Long-term debt (B) |
31,864 | 110 | 31,754 | 0 | 0 | |||||||||||||||
| Capital leases |
268 | 83 | 110 | 67 | 8 | |||||||||||||||
| Operating leases |
18,308 | 2,438 | 3,108 | 2,685 | 10,077 | |||||||||||||||
| Purchase commitments |
2,428 | 2,428 | 0 | 0 | 0 | |||||||||||||||
| Pension contribution and other retirement plans (C) |
0 | 0 | 0 | 0 | 0 | |||||||||||||||
| Income taxes payable, non-current (D) |
0 | 0 | 0 | 0 | 0 | |||||||||||||||
| Amount of Commitment Expiration by Period | ||||||||||||||||||||
| Other Commercial Commitments |
Total | Less than 1 year |
1-3 years | 4-5 years | After 5 years | |||||||||||||||
| (Thousands of dollars) | ||||||||||||||||||||
| Letters of credit |
$ | 6,122 | $ | 3,157 | $ | 1,366 | $ | 1,599 | $ | 0 | ||||||||||
| Guarantees |
536 | 522 | 14 | 0 | 0 | |||||||||||||||
| (A) | Interest on short-term debt is included in the table at an interest rate of 3.17% in effect at December 31, 2015. |
| (B) | Interest on long-term debt is included in the table at interest rates from 1.29% to 5.59% based on the variable interest rates in effect at December 31, 2015. |
| (C) | The Company does not expect to make a contribution to the Company’s defined benefit pension plan in 2016. Future expected amounts beyond one year have not been disclosed as such amounts are subject to change based on performance of the assets in the plan as well as the discount rate used to determine the obligation. At December 31, 2015, our unfunded contractual obligation was $11.6 million. Our Supplemental Profit Sharing Plan accrued liability at December 31, 2015 was $3.9 million. |
| (D) | As of December 31, 2015, there were $.2 million of tax liabilities, including interest and penalties, related to unrecognized tax benefits. Because of the high degree of uncertainty regarding the timing of future cash outflows associated with these liabilities, if any, we are unable to estimate the years in which cash settlement may occur with the respective tax authorities. |
CRITICAL ACCOUNTING POLICIES AND ESTIMATES
Our discussion and analysis of our financial condition and results of operations are based upon the consolidated financial statements, which have been prepared in accordance with GAAP. The preparation of these consolidated financial statements requires us to make estimates and judgments that affect the reported amount of assets and liabilities, revenues and expenses and related disclosure of contingent assets and liabilities at the date of the consolidated financial statements. Actual results may differ from these estimates under different assumptions or conditions.
Critical accounting policies are defined as those that are reflective of significant judgment and uncertainties, and potentially may result in materially different outcomes under different assumptions and conditions.
Revenue Recognition
Our revenue recognition policy is in accordance with Financial Accounting Standards Board (FASB) Accounting Standards Codification (ASC) 605, Revenue Recognition. We recognize sales when title passes to the customer either when goods are shipped or when they are delivered and based on the terms of the sale, there is persuasive evidence of an agreement, the price is fixed or determinable and collectability is reasonably assured. Revenue related to shipping and handling costs billed-to customers are included in net sales and the related shipping and handling costs are included in cost of products sold.
32
Table of Contents
Receivable Allowances
We maintain an allowance for doubtful accounts for estimated losses resulting from the inability of our customers to make required payments. We record estimated allowances for uncollectible accounts receivable based upon the number of days the accounts are past due, the current business environment, and specific information such as bankruptcy or liquidity issues of customers. If the financial condition of our customers were to deteriorate, resulting in an impairment of their ability to make payments, additional allowances may be required. During 2015, we recorded a provision for doubtful accounts of $.5 million. The allowance for doubtful accounts represents approximately 2.8% of our trade receivables balance at December 31, 2015 and 2014.
Excess and Obsolescence Reserves
We provide excess and obsolescence reserves to state inventories at the lower of cost or estimated market value. We identify inventory items which have had no usage or are in excess of the usages over the historical 12 to 24 months. A management team with representatives from marketing, manufacturing, engineering and finance reviews these inventory items, determines the disposition of the inventory and assesses the estimated market value based on their knowledge of the product and market conditions. These conditions include, among other things, future demand for product, product utility, unique customer order patterns or unique raw material purchase patterns, changes in customer and quality issues. At December 31, 2015, the allowance for excess and obsolete inventory was 12.9% of gross inventory and at December 31, 2014, the allowance for excess and obsolete inventory was 9.3% of gross inventory. If the impact of market conditions deteriorates from those projected by management, additional inventory reserves may be necessary.
Impairment of Long-Lived Assets
We record impairment losses on long-lived assets used in operations when events and circumstances indicate that the assets are impaired and the discounted cash flows estimated to be generated by those assets are less than the carrying value of those items. Our cash flows are based on historical results adjusted to reflect the best estimate of future market and operating conditions. The net carrying value of assets not recoverable is then reduced to fair value. The estimates of fair value represent the best estimate based on industry trends and reference to market rates and transactions.
Goodwill
We perform our annual impairment test for goodwill utilizing a discounted cash flow methodology, market comparables, and an overall market capitalization reasonableness test in computing fair value by reporting unit. We then compare the fair value of the reporting unit with its carrying value to assess if goodwill has been impaired. Based on the assumptions as to growth, discount rates and the weighting used for each respective valuation methodology, results of the valuations could be significantly changed. However, we believe that the methodologies and weightings used are reasonable and result in appropriate fair values of the reporting units.
Our measurement date for our annual impairment test is October 1 of each year. We performed our annual impairment tests for goodwill as of October 1, 2015. We did not have any impairment for goodwill or other intangibles for the year ended December 31, 2015. See Note J for additional information.
Deferred Tax Assets
Deferred taxes are recognized at currently enacted tax rates for temporary differences between the financial reporting and income tax basis of assets and liabilities and operating loss and tax credit carryforwards. We establish a valuation allowance to record our deferred tax assets at an amount that is more-likely-than-not to be realized. In the event we were to determine that we would be able to realize our deferred tax assets in the future in excess of their recorded amount, an adjustment to the valuation allowance would increase income in the period such determination was made. Likewise, should we determine that we would not be able to realize all or part of our net deferred tax assets in the future, an adjustment to the valuation allowance would be charged to expense in the period such determination was made.
33
Table of Contents
Uncertain Tax Positions
We identify tax positions taken on the federal, state, local and foreign income tax returns filed or to be filed. A tax position can include: a reduction in taxable income reported in a previously filed tax return or expected to be reported on a future tax return that impacts the measurement of current or deferred income tax assets or liabilities in the period being reported; a decision not to file a tax return; an allocation or a shift of income between jurisdictions; the characterization of income or a decision to exclude reporting taxable income in a tax return; or a decision to classify a transaction, entity or other position in a tax return as tax exempt. We determine whether a tax position is an uncertain or a routine business transaction tax position that is more-likely-than-not to be sustained at the full amount upon examination.
Under FASB ASC 740 (formerly FIN 48), tax benefits from uncertain tax positions that reduce our current or future income tax liability, are reported in our financial statements only to the extent that each benefit is recognized and measured under a two-step approach. The first step requires us to assess whether each tax position based on its technical merits and facts and circumstances as of the reporting date, is more-likely-than-not to be sustained upon examination. The second step measures the amount of tax benefit that we would recognize in the financial statements based on a cumulative probability approach. A tax position that meets the more-likely-than-not threshold that is not highly certain is measured based on the largest amount of benefit that is greater than 50% likely of being realized upon ultimate settlement with the tax authority, assuming that the tax authority has examined the position and has full knowledge of all relevant information.
ASC 740 requires subjectivity to identify outcomes and to assign probability in order to estimate the settlement amount. We provide estimates in order to determine settlement amounts. During the year ended December 31, 2015, we recorded a reduction in the liability of $.6 million for uncertain tax positions. At December 31, 2015, the total reserve for uncertain tax positions was $.2 million.
Pensions
We record obligations and expenses related to pension benefit plans based on actuarial valuations, which include key assumptions on discount rates, expected returns on plan assets and compensation increases. These actuarial assumptions are reviewed annually and modified as appropriate. The effect of modifications is generally recorded or amortized over future periods. The discount rate of 4.25% at December 31, 2015 reflects an analysis of yield curves as of the end of the year and the schedule of expected cash needs of the plan. The expected long-term return on plan assets of 8.0% reflects the plan’s historical returns and represents our best estimate of the likely future returns on the plan’s asset mix. We believe the assumptions used in recording obligations under the plans are reasonable based on prior experience, market conditions and the advice of plan actuaries. However, an increase in the discount rate would decrease the plan obligations and the net periodic benefit cost, while a decrease in the discount rate would increase the plan obligations and the net periodic benefit cost. In addition, an increase in the expected long-term return on plan assets would decrease the net periodic pension cost, while a decrease in expected long-term return on plan assets would increase the net periodic pension cost.
RECENTLY ADOPTED ACCOUNTING PRONOUNCEMENTS
In April 2014, the Financial Accounting Standards Board (FASB) issued Accounting Standards Update (ASU) 2014-08, “Presentation of Financial Statements (Topic 205) and Property, Plant, and Equipment (Topic 360): Reporting Discontinued Operations and Disclosures of Disposals of Components of an Entity,” or ASU 2014-08. ASU 2014-08 changes the criteria for reporting a discontinued operation. Under the new pronouncement, a disposal of a part of an organization that has a major effect on its operations and financial results is a discontinued operation. We are required to adopt ASU 2014-08 prospectively for all disposals or components of the business classified as held for sale during the fiscal period beginning after December 15, 2014. We adopted the guidance in the first quarter of 2015 and it did not have an effect on our results of operations, financial condition or cash flows.
34
Table of Contents
NEW ACCOUNTING STANDARDS TO BE ADOPTED
In February 2016, the FASB issued ASU 2016-02, “Leases (Topic 842).” The amendments in this Update require the recognition of assets and liabilities arising from lease transactions on the balance sheet and the disclosure of key information about leasing arrangements. Accordingly, a lessee will recognize a lease asset for its right to use the underlying asset and a lease liability for the corresponding lease obligation. Both the asset and liability will initially be measured at the present value of the future minimum lease payments over the lease term. Subsequent measurement, including the presentation of expenses and cash flows, will depend on the classification of the lease as either a finance or an operating lease. Initial costs directly attributable to negotiating and arranging the lease will be included in the asset. For leases with a term of 12 months or less, a lessee can make an accounting policy election by class of underlying asset to not recognize an asset and corresponding liability. Lessees will also be required to provide additional qualitative and quantitative disclosures regarding the amount, timing and uncertainty of cash flows arising from leases. These disclosures are intended to supplement the amounts recorded in the financial statements and provide additional information about the nature of an organization’s leasing activities. The amendments in this Update are effective for fiscal years, and interim periods within those fiscal years, beginning after December 15, 2018, with early adoption permitted. We are currently evaluating what impact, if any, its adoption will have to the presentation of our consolidated financial statements.
In November 2015, the FASB issued ASU 2015-17, “Income Taxes (Topic 740): Balance Sheet Classification of Deferred Taxes.” To simplify the presentation of deferred income taxes, the amendments in this Update require that deferred tax liabilities and assets be classified as noncurrent in a classified statement of financial position. The amendments in this Update apply to all entities that present a classified statement of financial position. The current requirement that deferred tax liabilities and assets of a tax-paying component of an entity be offset and presented as a single amount is not affected by the amendments in this Update. The amendments in this Update are effective for fiscal years, and interim periods within those fiscal years, beginning after December 15, 2016. Earlier application is permitted as of the beginning of an interim or annual reporting period. The amendments in this Update may be applied either prospectively to all deferred tax liabilities and assets or retrospectively to all periods presented. We are currently evaluating what impact, if any, its adoption will have to the presentation of our consolidated financial statements.
In July 2015, the FASB issued ASU 2015-11, “Inventory (Topic 330): Simplifying the Measurement of Inventory.” The amendments in this Update more closely align the measurement of inventory in GAAP with the measurement of inventory in International Financial Reporting Standards (IFRS). An entity should measure inventory within the scope of this Update at the lower of cost and net realizable value. Net realizable value is defined as the estimated selling prices in the ordinary course of business, less reasonably predictable costs of completion, disposal, and transportation. Subsequent measurement is unchanged for inventory measured using LIFO or the retail inventory method. The amendments in this Update are effective for fiscal years beginning after December 15, 2016 and interim periods within fiscal years beginning after December 15, 2017. The amendments in this Update should be applied prospectively with earlier application permitted as of the beginning of an interim or annual reporting period. We are currently evaluating what impact, if any, its adoption will have to the presentation of our consolidated financial statements.
In April 2015, the FASB issued ASU 2015-05, “Intangibles – Goodwill and Other – Internal-Use Software (Topic 350-40): Customer’s Accounting for Fees Paid in a Cloud Computing Arrangement.” The amendments in this Update provide guidance to customers about whether a cloud computing arrangement includes a software license. If a cloud computing arrangement includes a software license, then the customer should account for the software license element of the arrangement consistent with the acquisition of other software licenses. If a cloud computing arrangement does not include a software license, the customer should account for the arrangement as a service contract. The amendments in this Update are effective for fiscal years, and interim periods within those fiscal years, beginning after December 15, 2015. Earlier application is permitted. Amendments in this Update can be applied retrospectively or prospectively. We are currently not engaged in a cloud computing arrangement; however, we are evaluating what impact, if any, its adoption will have to the presentation of our consolidated financial statements if it enters such an arrangement.
In April 2015, the FASB issued ASU 2015-04, “Compensation – Retirement Benefits (Topic 715): Practical Expedient for the Measurement Date of an Employer’s Defined Benefit Obligation and Plan Assets.” For an entity that has a significant event in an interim period that calls for a re-measurement of defined benefit plan
35
Table of Contents
assets and obligations, the amendments in this Update provide a practical expedient that permits the entity to re-measure defined benefit plan assets and obligations using the month-end that is closest to the date of the significant event. The amendments in this Update are effective for fiscal years, and interim periods within those fiscal years, beginning after December 15, 2015. Earlier application is permitted. Amendments in this Update should be applied prospectively. We are currently evaluating what impact, if any, its adoption will have to the presentation of our consolidated financial statements.
In January 2015, the FASB issued ASU 2015-01, “Income Statement-Extraordinary and Unusual Items (Subtopic 225-20): Simplifying Income Statement Presentation by Eliminating the Concept of Extraordinary Items.” This Update eliminates from GAAP the concept of extraordinary items. A material event or transaction that an entity considers to be of an unusual nature or of a type that indicates infrequency of occurrence or both shall be reported as a separate component of income from continuing operations. The nature and financial effects of each event or transaction shall be presented as a separate component of income from continuing operations or, alternatively, disclosed in notes to financial statements. The amendments in this Update are effective for fiscal years, and interim periods within those fiscal years, beginning after December 15, 2015. A reporting entity may apply the amendments prospectively. A reporting entity also may apply the amendments retrospectively to all prior periods presented in the financial statements. Early adoption is permitted provided that the guidance is applied from the beginning of the fiscal year of adoption. We are currently evaluating what impact, if any, its adoption will have to the presentation of our consolidated financial statements.
In August 2014, the FASB issued ASU 2014-15 “Presentation of Financial Statements – Going Concern (Subtopic 205-40): Disclosure of Uncertainties about an Entity’s Ability to Continue as a Going Concern.” ASU 2014-15 provides guidance in GAAP about management’s responsibility to evaluate whether there is substantial doubt about an entity’s ability to continue as a going concern and to provide related footnote disclosures. The Company is required to adopt ASU 2014-15 prospectively for the annual period ending after December 15, 2016, and for annual periods and interim periods thereafter. Early application is permitted. We are currently evaluating what impact, if any, its adoption will have to the presentation of our consolidated financial statements.
In May 2014, the FASB issued ASU No. 2014-09, “Revenue from Contracts with Customers (Topic 606),” or ASU 2014-09. ASU 2014-09 requires an entity to recognize revenue in a matter that depicts the transfer of promised goods or services to customers in an amount that reflects the consideration to which the entity expects to be entitled in exchange for those goods or services. To achieve that core principle, the amendment provides five steps that an entity should apply when recognizing revenue. The amendment also specifies the accounting of some costs to obtain or fulfill a contract with a customer and expands the disclosure requirements around contracts with customers. An entity can either adopt this amendment retrospectively to each prior reporting period presented or retrospectively with cumulative effect of initially applying the update recognized at the date of initial application. In August 2015, the FASB issued ASU No. 2015-14 deferring the effective date of the amendment to annual reporting periods beginning after December 15, 2017. Early adoption is not permitted. We are currently evaluating what impact, if any, its adoption will have to the presentation of our consolidated financial statements.
| Item 7A. | Quantitative and Qualitative Disclosures About Market Risk |
The Company operates manufacturing facilities and offices around the world and uses fixed and floating rate debt to finance the Company’s global operations. As a result, the Company is subject to business risks inherent in non-U.S. activities, including political and economic uncertainty, import and export limitations and market risk related to changes in interest rates and foreign currency exchange rates. The Company believes that the political and economic risks related to the Company’s international operations are mitigated due to the geographic diversity in which the Company’s international operations are located.
As of December 31, 2015, the Company had no foreign currency forward exchange contracts outstanding. The Company does not hold derivatives for trading purposes.
The Company’s primary currency rate exposures are related to foreign denominated debt, intercompany debt, forward exchange contracts, foreign denominated receivables and payables and cash and short-term investments. A hypothetical 10% change in currency rates would have a favorable/unfavorable impact on fair values on such instruments of $5.9 million and on income before tax of $2.5 million.
36
Table of Contents
The Company is exposed to market risk, including changes in interest rates. The Company is subject to interest rate risk on its variable rate revolving credit facilities and term notes, which consisted of borrowings of $32.3 million at December 31, 2015. A 100 basis point increase in the interest rate would have resulted in an increase in interest expense of approximately $.3 million for the year ended December 31, 2015.
Included in our accounting for defined benefit pension plan are assumptions on future discount rates and the expected return on Plan assets. The Company considers current market conditions, including changes in interest rates and plan asset investment returns. Actuarial assumptions may differ materially from actual results due to changing market and economic conditions or higher or lower withdrawal rates. These differences may result in a significant impact to the amount of net pension expense or income recorded in the future.
A discount rate is used to determine the present value of future payments. In general, our liability increases as the discount rate decreases and decreases as the discount rate increases. The discount rate used to determine our future benefit obligation was 4.25% and 4.0% at December 31, 2015 and 2014, respectively. The discount rate is a significant factor in determining the amounts reported. A 50 basis point change in the discount rate of 4.25% used at December 31, 2015 would have a $.8 million effect on the Plan’s projected benefit obligation.
The Company developed the expected return on plan assets by considering various factors which include targeted asset allocation percentages, historical returns, and expected future returns. The Company assumed an expected rate of return of 8.0% in both 2015 and 2014. A 50 basis point change in the expected rate of return would have a $.7 million effect on the Plan’s subsequent year’s net periodic pension cost.
37
Table of Contents
| Item 8. | Financial Statements and Supplementary Data |
Report of Independent Registered Public Accounting Firm
The Board of Directors and Shareholders
of Preformed Line Products Company
We have audited the accompanying consolidated balance sheets of Preformed Line Products Company as of December 31, 2015 and 2014, and the related statements of consolidated income, comprehensive income (loss), cash flows, and shareholders’ equity for each of the three years in the period ended December 31, 2015. Our audits also included the financial statement schedule listed in the Index at Item 15(a). These financial statements and schedule are the responsibility of the Company’s management. Our responsibility is to express an opinion on these financial statements and schedule based on our audits.
We conducted our audits in accordance with the standards of the Public Company Accounting Oversight Board (United States). Those standards require that we plan and perform the audit to obtain reasonable assurance about whether the financial statements are free of material misstatement. An audit includes examining, on a test basis, evidence supporting the amounts and disclosures in the financial statements. An audit also includes assessing the accounting principles used and significant estimates made by management, as well as evaluating the overall financial statement presentation. We believe that our audits provide a reasonable basis for our opinion.
In our opinion, the financial statements referred to above present fairly, in all material respects, the consolidated financial position of Preformed Line Products Company at December 31, 2015 and 2014, and the consolidated results of its operations and its cash flows for each of the three years in the period ended December 31, 2015, in conformity with U.S. generally accepted accounting principles. Also, in our opinion, the related financial statement schedule, when considered in relation to the basic financial statements taken as a whole, presents fairly in all material respects the information set forth therein.
We also have audited, in accordance with the standards of the Public Company Accounting Oversight Board (United States), Preformed Line Products Company’s internal control over financial reporting as of December 31, 2015, based on criteria established in Internal Control-Integrated Framework issued by the Committee of Sponsoring Organizations of the Treadway Commission (2013 framework) and our report dated March 12, 2015 expressed an unqualified opinion thereon.
/s/ Ernst & Young LLP
Cleveland, Ohio
March 11, 2016
38
Table of Contents
PREFORMED LINE PRODUCTS COMPANY
CONSOLIDATED BALANCE SHEETS
| December 31 | ||||||||
| 2015 | 2014 | |||||||
| (Thousands of dollars, except share and per share data) | ||||||||
| ASSETS |
||||||||
| Cash and cash equivalents |
$ | 30,393 | $ | 29,643 | ||||
| Accounts receivable, less allowances of $2,326 ($2,370 in 2014) |
63,626 | 67,942 | ||||||
| Inventories - net |
69,912 | 80,037 | ||||||
| Deferred income taxes |
8,608 | 7,249 | ||||||
| Prepaids |
4,030 | 6,926 | ||||||
| Prepaid taxes |
5,585 | 2,241 | ||||||
| Other current assets |
6,343 | 6,625 | ||||||
|
|
|
|
|
|||||
| TOTAL CURRENT ASSETS |
188,497 | 200,663 | ||||||
| Property, plant and equipment - net |
91,965 | 102,531 | ||||||
| Patents and other intangibles - net |
11,288 | 14,121 | ||||||
| Goodwill |
15,821 | 17,792 | ||||||
| Deferred income taxes |
5,299 | 5,773 | ||||||
| Other assets |
11,703 | 13,087 | ||||||
|
|
|
|
|
|||||
| TOTAL ASSETS |
$ | 324,573 | $ | 353,967 | ||||
|
|
|
|
|
|||||
| LIABILITIES AND SHAREHOLDERS’ EQUITY |
||||||||
| Notes payable to banks |
$ | 413 | $ | 1,809 | ||||
| Current portion of long-term debt |
110 | 116 | ||||||
| Trade accounts payable |
20,377 | 22,332 | ||||||
| Accrued compensation and amounts withheld from employees |
9,306 | 9,876 | ||||||
| Accrued expenses and other liabilities |
13,334 | 13,021 | ||||||
| Accrued profit-sharing and other benefits |
5,648 | 5,151 | ||||||
| Dividends payable |
1,057 | 1,220 | ||||||
| Income taxes payable and deferred income taxes |
1,646 | 1,802 | ||||||
|
|
|
|
|
|||||
| TOTAL CURRENT LIABILITIES |
51,891 | 55,327 | ||||||
| Long-term debt, less current portion |
31,754 | 31,749 | ||||||
| Unfunded pension obligation |
11,627 | 12,503 | ||||||
| Income taxes payable |
195 | 1,735 | ||||||
| Deferred income taxes |
3,447 | 3,283 | ||||||
| Other noncurrent liabilities |
6,675 | 6,445 | ||||||
| SHAREHOLDERS’ EQUITY |
||||||||
| Shareholders’ equity: |
||||||||
| Common shares - $2 par value per share, 15,000,000 shares authorized, 5,221,062 and 5,397,138 issued and outstanding, at December 31, 2015 and December 31, 2014 |
12,478 | 12,433 | ||||||
| Common shares issued to rabbi trust, 296,635 and 292,609 shares at December 31, 2015 and December 31, 2014, respectively |
(12,052 | ) | (11,790 | ) | ||||
| Deferred compensation liability |
12,052 | 11,790 | ||||||
| Paid-in capital |
22,916 | 22,795 | ||||||
| Retained earnings |
292,311 | 289,849 | ||||||
| Treasury shares, at cost, 1,018,013 and 819,424 shares at December 31, 2015 and December 31, 2014 |
(54,570 | ) | (47,018 | ) | ||||
| Accumulated other comprehensive loss |
(54,151 | ) | (35,134 | ) | ||||
|
|
|
|
|
|||||
| TOTAL SHAREHOLDERS’ EQUITY |
218,984 | 242,925 | ||||||
|
|
|
|
|
|||||
| TOTAL LIABILITIES AND SHAREHOLDERS’ EQUITY |
$ | 324,573 | $ | 353,967 | ||||
|
|
|
|
|
|||||
See notes to consolidated financial statements.
39
Table of Contents
PREFORMED LINE PRODUCTS COMPANY
STATEMENTS OF CONSOLIDATED INCOME
| Year Ended December 31 | ||||||||||||
| 2015 | 2014 | 2013 | ||||||||||
| (In thousands, except per share data) | ||||||||||||
| Net sales |
$ | 354,666 | $ | 388,185 | $ | 409,776 | ||||||
| Cost of products sold |
251,214 | 267,237 | 278,875 | |||||||||
|
|
|
|
|
|
|
|||||||
| GROSS PROFIT |
103,452 | 120,948 | 130,901 | |||||||||
| Costs and expenses |
||||||||||||
| Selling |
30,593 | 35,655 | 35,704 | |||||||||
| General and administrative |
36,878 | 42,563 | 44,557 | |||||||||
| Research and engineering |
14,879 | 16,302 | 14,708 | |||||||||
| Other operating expenses - net |
8,753 | 5,190 | 3,922 | |||||||||
| Goodwill impairment |
0 | 0 | 862 | |||||||||
|
|
|
|
|
|
|
|||||||
| 91,103 | 99,710 | 99,753 | ||||||||||
| OPERATING INCOME |
12,349 | 21,238 | 31,148 | |||||||||
| Other income (expense) |
||||||||||||
| Interest income |
391 | 483 | 618 | |||||||||
| Interest expense |
(565 | ) | (658 | ) | (450 | ) | ||||||
| Other income (expense) |
(469 | ) | 347 | 478 | ||||||||
|
|
|
|
|
|
|
|||||||
| (643 | ) | 172 | 646 | |||||||||
|
|
|
|
|
|
|
|||||||
| INCOME BEFORE INCOME TAXES |
11,706 | 21,410 | 31,794 | |||||||||
| Income taxes |
5,031 | 8,549 | 11,207 | |||||||||
|
|
|
|
|
|
|
|||||||
| NET INCOME |
$ | 6,675 | $ | 12,861 | $ | 20,587 | ||||||
|
|
|
|
|
|
|
|||||||
| BASIC EARNINGS PER SHARE |
||||||||||||
| Net income |
$ | 1.25 | $ | 2.39 | $ | 3.84 | ||||||
|
|
|
|
|
|
|
|||||||
| DILUTED EARNINGS PER SHARE |
||||||||||||
| Net income |
$ | 1.24 | $ | 2.39 | $ | 3.77 | ||||||
|
|
|
|
|
|
|
|||||||
| Cash dividends declared per share |
$ | 0.80 | $ | 0.80 | $ | 0.60 | ||||||
|
|
|
|
|
|
|
|||||||
| Weighted-average number of shares outstanding - basic |
5,350 | 5,377 | 5,361 | |||||||||
|
|
|
|
|
|
|
|||||||
| Weighted-average number of shares outstanding - diluted |
5,366 | 5,382 | 5,467 | |||||||||
|
|
|
|
|
|
|
|||||||
See notes to consolidated financial statements.
40
Table of Contents
PREFORMED LINE PRODUCTS COMPANY
STATEMENTS OF CONSOLIDATED COMPREHENSIVE INCOME (LOSS)
| Year Ended December 31 | ||||||||||||
| 2015 | 2014 | 2013 | ||||||||||
| (Thousands of dollars) | ||||||||||||
| Net income |
$ | 6,675 | $ | 12,861 | $ | 20,587 | ||||||
| Other comprehensive income (loss), net of tax: |
||||||||||||
| Foreign currency translation adjustment |
(19,789 | ) | (12,330 | ) | (8,457 | ) | ||||||
| Recognized net actuarial loss |
364 | 10 | 306 | |||||||||
| Gain (loss) on unfunded pension obligations |
408 | (5,112 | ) | 4,113 | ||||||||
|
|
|
|
|
|
|
|||||||
| Other comprehensive income (loss), net of tax |
(19,017 | ) | (17,432 | ) | (4,038 | ) | ||||||
|
|
|
|
|
|
|
|||||||
|
|
||||||||||||
|
|
|
|
|
|
|
|||||||
| Comprehensive income (loss) |
$ | (12,342 | ) | $ | (4,571 | ) | $ | 16,549 | ||||
|
|
|
|
|
|
|
|||||||
See notes to consolidated financial statements.
41
Table of Contents
PREFORMED LINE PRODUCTS COMPANY
STATEMENTS OF CONSOLIDATED CASH FLOWS
| Year Ended December 31 | ||||||||||||
| 2015 | 2014 | 2013 | ||||||||||
| (Thousands of dollars) | ||||||||||||
| OPERATING ACTIVITIES |
||||||||||||
| Net income |
$ | 6,675 | $ | 12,861 | $ | 20,587 | ||||||
| Adjustments to reconcile net income to net cash provided by operations: |
||||||||||||
| Depreciation and amortization |
11,532 | 12,857 | 12,088 | |||||||||
| Provision for accounts receivable allowances |
961 | 1,211 | 837 | |||||||||
| Provision for inventory reserves |
2,477 | 2,244 | 2,672 | |||||||||
| Deferred income taxes |
(944 | ) | (1,697 | ) | (1,105 | ) | ||||||
| Share-based compensation expense |
248 | 1,542 | 3,057 | |||||||||
| Excess tax benefits from share-based awards |
20 | (97 | ) | (357 | ) | |||||||
| Goodwill impairment |
0 | 0 | 862 | |||||||||
| Loss (gain) on sale of property and equipment |
363 | 115 | (57 | ) | ||||||||
| Other - net |
67 | 26 | 11 | |||||||||
| Changes in operating assets and liabilities (excluding impact of acquired assets): |
||||||||||||
| Accounts receivable |
(2,965 | ) | (2,435 | ) | (10,273 | ) | ||||||
| Inventories |
(2,297 | ) | (5,704 | ) | 3,040 | |||||||
| Trade accounts payables and accrued liabilities |
5,652 | 6,716 | (3,906 | ) | ||||||||
| Income taxes payable |
(4,038 | ) | (882 | ) | (4,670 | ) | ||||||
| Other - net |
2,478 | (1,501 | ) | (1,247 | ) | |||||||
|
|
|
|
|
|
|
|||||||
| NET CASH PROVIDED BY OPERATING ACTIVITIES |
20,229 | 25,256 | 21,539 | |||||||||
| INVESTING ACTIVITIES |
||||||||||||
| Capital expenditures |
(10,754 | ) | (17,663 | ) | (21,034 | ) | ||||||
| Business acquisitions, net of cash acquired |
0 | (14,975 | ) | 0 | ||||||||
| Proceeds from the sale of property and equipment |
929 | 142 | 532 | |||||||||
| Restricted cash and purchase of fixed-term deposits |
(1,037 | ) | (797 | ) | (3,642 | ) | ||||||
|
|
|
|
|
|
|
|||||||
| NET CASH USED IN INVESTING ACTIVITIES |
(10,862 | ) | (33,293 | ) | (24,144 | ) | ||||||
| FINANCING ACTIVITIES |
||||||||||||
| Increase (decrease) in notes payable to banks |
(775 | ) | 941 | 922 | ||||||||
| Proceeds from the issuance of long-term debt |
51,942 | 75,774 | 73,638 | |||||||||
| Payments of long-term debt |
(51,940 | ) | (57,123 | ) | (69,884 | ) | ||||||
| Dividends paid |
(4,391 | ) | (4,412 | ) | (2,305 | ) | ||||||
| Excess tax benefits from share-based awards |
(20 | ) | 97 | 357 | ||||||||
| Earn-out consideration payments |
0 | 0 | (513 | ) | ||||||||
| Proceeds from issuance of common shares |
80 | 166 | 1,519 | |||||||||
| Purchase of common shares for treasury |
(6,003 | ) | (104 | ) | (2,881 | ) | ||||||
| Purchase of common shares for treasury from related parties |
(1,550 | ) | (2,130 | ) | (4,030 | ) | ||||||
|
|
|
|
|
|
|
|||||||
| NET CASH PROVIDED BY (USED IN) FINANCING ACTIVITIES |
(12,657 | ) | 13,209 | (3,177 | ) | |||||||
| Effects of exchange rate changes on cash and cash equivalents |
4,040 | 180 | 1,953 | |||||||||
|
|
|
|
|
|
|
|||||||
| Net increase (decrease) in cash and cash equivalents |
750 | 5,352 | (3,829 | ) | ||||||||
| Cash and cash equivalents at beginning of year |
29,643 | 24,291 | 28,120 | |||||||||
|
|
|
|
|
|
|
|||||||
| CASH AND CASH EQUIVALENTS AT END OF YEAR |
$ | 30,393 | $ | 29,643 | $ | 24,291 | ||||||
|
|
|
|
|
|
|
|||||||
See notes to consolidated financial statements.
42
Table of Contents
PREFORMED LINE PRODUCTS COMPANY
STATEMENTS OF CONSOLIDATED SHAREHOLDERS’ EQUITY
| Accumulated Other Comprehensive Income (Loss) |
||||||||||||||||||||||||||||||||||||
| Common Shares |
Common Shares Issued to Rabbi Trust |
Deferred Compensation Liability |
Paid in Capital |
Retained Earnings |
Treasury Shares |
Cumulative Translation Adjustment |
Unrecognized Pension Benefit Cost |
Total | ||||||||||||||||||||||||||||
| (In thousands, except share and per share data) | ||||||||||||||||||||||||||||||||||||
| Balance at January 1, 2013 |
$ | 12,135 | $ | (6,522 | ) | $ | 6,522 | $ | 16,355 | $ | 264,115 | $ | (37,872 | ) | $ | (7,340 | ) | $ | (6,324 | ) | $ | 241,069 | ||||||||||||||
| Net income |
20,587 | 20,587 | ||||||||||||||||||||||||||||||||||
| Foreign currency translation adjustment |
(8,457 | ) | (8,457 | ) | ||||||||||||||||||||||||||||||||
| Recognized net actuarial loss, net of tax provision of $187 |
306 | 306 | ||||||||||||||||||||||||||||||||||
| Gain on unfunded pension obligations, net of tax provision of $2,506 |
4,113 | 4,113 | ||||||||||||||||||||||||||||||||||
|
|
|
|||||||||||||||||||||||||||||||||||
| Total comprehensive income |
16,549 | |||||||||||||||||||||||||||||||||||
| Share-based compensation |
3,057 | (100 | ) | 2,957 | ||||||||||||||||||||||||||||||||
| Excess tax benefits from share-based awards |
357 | 357 | ||||||||||||||||||||||||||||||||||
| Purchase of 89,807 common shares |
(6,911 | ) | (6,911 | ) | ||||||||||||||||||||||||||||||||
| Issuance of 34,575 common shares |
69 | 1,450 | 1,519 | |||||||||||||||||||||||||||||||||
| Restricted shares awards of 68,369 |
137 | (137 | ) | 0 | ||||||||||||||||||||||||||||||||
| Common shares issued to rabbi trust of 69,120 |
(2,784 | ) | 2,784 | 0 | ||||||||||||||||||||||||||||||||
| Cash dividends declared - $.60 per share |
(3,210 | ) | (3,210 | ) | ||||||||||||||||||||||||||||||||
|
|
|
|
|
|
|
|
|
|
|
|
|
|
|
|
|
|
|
|||||||||||||||||||
| Balance at December 31, 2013 |
$ | 12,341 | $ | (9,306 | ) | $ | 9,306 | $ | 21,082 | $ | 281,392 | $ | (44,783 | ) | $ | (15,797 | ) | $ | (1,905 | ) | $ | 252,330 | ||||||||||||||
|
|
|
|
|
|
|
|
|
|
|
|
|
|
|
|
|
|
|
|||||||||||||||||||
| Net income |
12,861 | 12,861 | ||||||||||||||||||||||||||||||||||
| Foreign currency translation adjustment |
(12,330 | ) | (12,330 | ) | ||||||||||||||||||||||||||||||||
| Recognized net actuarial loss, net of tax provision of $6 |
10 | 10 | ||||||||||||||||||||||||||||||||||
| Loss on unfunded pension obligations, net of tax benefit of $3,115 |
(5,112 | ) | (5,112 | ) | ||||||||||||||||||||||||||||||||
|
|
|
|||||||||||||||||||||||||||||||||||
| Total comprehensive income |
(4,571 | ) | ||||||||||||||||||||||||||||||||||
| Share-based compensation |
1,542 | (106 | ) | 1,436 | ||||||||||||||||||||||||||||||||
| Excess tax benefits from share-based awards |
97 | 97 | ||||||||||||||||||||||||||||||||||
| Purchase of 40,145 common shares |
(2,235 | ) | (2,235 | ) | ||||||||||||||||||||||||||||||||
| Issuance of 3,531 common shares |
7 | 159 | 166 | |||||||||||||||||||||||||||||||||
| Restricted shares awards of 42,678 |
85 | (85 | ) | 0 | ||||||||||||||||||||||||||||||||
| Common shares issued to rabbi trust of 43,592 |
(2,484 | ) | 2,484 | 0 | ||||||||||||||||||||||||||||||||
| Cash dividends declared - $.80 per share |
(4,298 | ) | (4,298 | ) | ||||||||||||||||||||||||||||||||
|
|
|
|
|
|
|
|
|
|
|
|
|
|
|
|
|
|
|
|||||||||||||||||||
| Balance at December 31, 2014 |
$ | 12,433 | $ | (11,790 | ) | $ | 11,790 | $ | 22,795 | $ | 289,849 | $ | (47,018 | ) | $ | (28,127 | ) | $ | (7,007 | ) | $ | 242,925 | ||||||||||||||
|
|
|
|
|
|
|
|
|
|
|
|
|
|
|
|
|
|
|
|||||||||||||||||||
| Net income |
6,675 | 6,675 | ||||||||||||||||||||||||||||||||||
| Foreign currency translation adjustment |
(19,789 | ) | (19,789 | ) | ||||||||||||||||||||||||||||||||
| Recognized net actuarial loss, net of tax provision of $219 |
364 | 364 | ||||||||||||||||||||||||||||||||||
| Gain on unfunded pension obligations, net of tax provision of $245 |
408 | 408 | ||||||||||||||||||||||||||||||||||
|
|
|
|||||||||||||||||||||||||||||||||||
| Total comprehensive income |
(12,342 | ) | ||||||||||||||||||||||||||||||||||
| Share-based compensation |
248 | 47 | 295 | |||||||||||||||||||||||||||||||||
| Excess tax benefits from share-based awards |
(20 | ) | (20 | ) | ||||||||||||||||||||||||||||||||
| Purchase of 198,589 common shares |
(7,552 | ) | (7,552 | ) | ||||||||||||||||||||||||||||||||
| Issuance of 1,899 common shares |
4 | 76 | 80 | |||||||||||||||||||||||||||||||||
| Restricted shares awards of 20,614 |
41 | (41 | ) | 0 | ||||||||||||||||||||||||||||||||
| Common shares issued to rabbi trust of 7,113 |
(262 | ) | 262 | 0 | ||||||||||||||||||||||||||||||||
| Cash dividends declared - $.80 per share |
(142 | ) | (4,260 | ) | (4,402 | ) | ||||||||||||||||||||||||||||||
|
|
|
|
|
|
|
|
|
|
|
|
|
|
|
|
|
|
|
|||||||||||||||||||
| Balance at December 31, 2015 |
$ | 12,478 | $ | (12,052 | ) | $ | 12,052 | $ | 22,916 | $ | 292,311 | $ | (54,570 | ) | $ | (47,916 | ) | $ | (6,235 | ) | $ | 218,984 | ||||||||||||||
|
|
|
|
|
|
|
|
|
|
|
|
|
|
|
|
|
|
|
|||||||||||||||||||
See notes to consolidated financial statements.
43
Table of Contents
PREFORMED LINE PRODUCTS COMPANY
NOTES TO CONSOLIDATED FINANCIAL STATEMENTS
(Tables in thousands of dollars, except share and per share data, unless specifically noted)
Note A - Significant Accounting Policies
Nature of Operations
Preformed Line Products Company and subsidiaries (the “Company”) is a designer and manufacturer of products and systems employed in the construction and maintenance of overhead and underground networks for the energy, telecommunication, cable operators, data communication and other similar industries. The Company’s primary products support, protect, connect, terminate and secure cables and wires. The Company also provides solar hardware systems and mounting hardware for a variety of solar power applications. The Company’s customers include public and private energy utilities and communication companies, cable operators, governmental agencies, contractors and subcontractors, distributors and value-added resellers. The Company serves its worldwide markets through strategically located domestic and international manufacturing facilities.
Principles of Consolidation
The consolidated financial statements include the accounts of the Company and its wholly-owned subsidiaries for which it has a controlling interest. All intercompany accounts and transactions have been eliminated upon consolidation.
Investments in Foreign Joint Ventures
Investments in joint ventures, where the Company owns between 20% and 50%, or where the Company does not have control but has the ability to exercise significant influence over operations or financial policies, are accounted for by the equity method. As of December 31, 2015, the Company owns 25.93% in Proxisafe Ltd. (“Proxisafe”), located in Calgary, Alberta. The Company accounts for its joint venture interest in Proxisafe accounts using the equity method.
Cash and Cash Equivalents
Cash equivalents are stated at fair value and consist of highly liquid investments with original maturities of three months or less at the time of acquisition.
Receivable Allowances
The Company maintains an allowance for doubtful accounts for estimated losses resulting from the inability of its customers to make required payments. The allowances for uncollectible accounts receivable is based upon the number of days the accounts are past due, the current business environment and specific information such as bankruptcy or liquidity issues of customers. The Company also maintains an allowance for future sales credits related to sales recorded during the year. The estimated allowance is based on historical sales credits issued in the subsequent year related to the prior year and any significant, preapproved open return good authorizations as of the balance sheet date.
Inventories
The Company uses the last-in, first-out (LIFO) method of determining cost for the majority of its material portion of inventories in PLP-USA. All other inventories are determined by the first-in, first-out (FIFO) or average cost methods. Inventories are carried at the lower of cost or market. Reserves are maintained for estimated obsolescence or excess inventory based on past usage and future demand.
44
Table of Contents
Fair Value of Financial Instruments
Financial Accounting Standards Board’s (FASB) Accounting Standards Codification (ASC) 825, Disclosures about Fair Value of Financial Instruments, requires disclosures of the fair value of financial instruments. The carrying value of the Company’s current financial instruments, which include cash and cash equivalents, accounts receivable, accounts payable and short-term debt, approximates fair value because of the short-term maturity of these instruments. At December 31, 2015, the fair value of the Company’s long-term debt was estimated using discounted cash flow analysis, based on the Company’s current incremental borrowing rates for similar types of borrowing arrangements, which is considered to be a level two input. Based on the analysis performed, the carrying value of the Company’s long-term debt approximates fair value at December 31, 2015.
Property, Plant and Equipment and Depreciation
Property, plant, and equipment is recorded at cost. Depreciation is computed using the straight-line method over the estimated useful lives. The estimated useful lives used, when purchased new, are: land improvements, ten years; buildings, forty years; building improvements, five to forty years; and machinery and equipment, three to ten years. Appropriate reductions in estimated useful lives are made for property, plant and equipment purchased in connection with an acquisition of a business or in a used condition when purchased.
Long-Lived Assets
The Company records impairment losses on long-lived assets used in operations when events and circumstances indicate that the carrying value of the assets are impaired and the discounted future cash flows estimated to be generated by such assets are less than the carrying value. The Company’s cash flows are based on historical results adjusted to reflect the Company’s best estimate of future market and operating conditions. The net carrying value of assets not recoverable is then reduced to fair value. The estimate of fair value represent the Company’s best estimate based on industry trends and reference to market rates and transactions. The Company did not record any impairment to long-lived assets during the years ended December 31, 2015 and 2014.
Goodwill and Other Intangibles
Goodwill and other intangible assets generally result from business acquisitions. Goodwill and intangible assets with indefinite lives are not subject to amortization, but are subject to annual impairment testing. Intangible assets with definite lives, consisting primarily of purchased customer relationships, patents, technology, customer backlogs, trademarks and land use rights, are generally amortized over periods from less than one year to twenty years. The Company’s intangible assets with finite lives are generally amortized using a projected cash flow basis method over their useful lives unless another method was demonstrated to be more appropriate. Customer relationships, technology and trademark intangibles acquired in 2014 and 2012 are amortized using a projected cash flow basis method over the period in which the economic benefits of the intangibles are consumed. Customer relationships, technology and trademarks acquired in July 2010 are being amortized using the straight-line method over their useful lives. This straight-line method was more appropriate because it better reflected the pattern in which the economic benefits of the intangible asset are consumed or otherwise expire compared to using a projected cash flow basis method. An evaluation of the remaining useful life of intangible assets with a determinable life is performed on a periodic basis and when events and circumstances warrant an evaluation. The Company assesses intangible assets with a determinable life for impairment consistent with its policy for assessing other long-lived assets. Goodwill and intangible assets are also reviewed for impairment annually or more frequently when changes in circumstances indicate the carrying amount may be impaired, or in the case of finite-lived intangible assets, when the carrying amount may not be recoverable. Events or circumstances that would result in an impairment review primarily include operations reporting losses or a significant change in the use of an asset. Impairment charges are recognized pursuant to FASB ASC 350-20, Goodwill.
The Company performs the annual impairment test for goodwill utilizing a combination of discounted cash flow methodology, market comparables, and an overall market capitalization reasonableness test in computing fair value by reporting unit. The Company compares the fair value of the reporting unit with its carrying value to assess if goodwill has been impaired. Based on the assumptions as to growth, discount rates and the weighting used for each respective valuation methodology, results of the valuations could be significantly changed. However, the Company believes that the methodologies and weightings used are reasonable and result in appropriate fair values of the reporting units.
45
Table of Contents
The Company performed its annual impairment test for goodwill as of October 1, 2015 and 2014 and determined that no adjustment to the carrying value was required for the years ended December 31, 2015 and 2014.
Revenue Recognition
Sales are recognized when title passes to the customer either when goods are shipped or when they are delivered and based on the terms of the sale, there is persuasive evidence of an agreement, the price is fixed or determinable and collectability is reasonably assured. Revenue related to shipping and handling costs billed to customers is included in net sales and the related shipping and handling costs are included in cost of products sold.
Research and Development
Research and development costs for new products are expensed as incurred and totaled $2.9 million in 2015, $2.7 million in 2014 and $2.3 million in 2013.
Income Taxes
Income taxes are computed in accordance with the provisions of ASC 740, Income Taxes. In the Consolidated Financial Statements, the benefits of a consolidated return have been reflected where such returns have or could be filed based on the entities and jurisdictions included in the financial statements. Deferred tax liabilities and assets are recognized for the expected future tax consequences of events that have been reflected on the Consolidated Financial Statements. Deferred tax liabilities and assets are determined based on the differences between the book and tax basis of particular assets and liabilities and operating loss carryforwards using tax rates in effect for the years in which the differences are expected to reverse.
Net deferred tax assets are recognized to the extent that the Company believes these assets are more likely than not to be realized. In making such a determination, the Company considers all available positive and negative evidence, including future reversals of existing taxable temporary differences, projected future taxable income, tax-planning strategies and results of recent operations. If the Company determines that it would be able to realize its deferred tax assets in the future in excess of their net recorded amount, the Company would make an adjustment to the deferred tax asset valuation allowance, which would reduce the provision for income taxes.
Uncertain tax positions are recorded in accordance with ASC 740 on the basis of a two-step process whereby (1) the Company determines whether it is more likely than not that the tax positions will be sustained on the basis of the technical merits of the position and (2) for those tax positions that meet the more-likely-than-not recognition threshold, the Company recognizes the largest amount of tax benefit that is more than 50 percent likely to be realized upon ultimate settlement with the related tax authority.
Advertising
Advertising costs are expensed as incurred and totaled $1.7 million in 2015, $2.0 million in 2014 and 2013.
Foreign Currency Translation
Asset and liability accounts are translated into U.S. dollars using exchange rates in effect at the date of the Consolidated Balance Sheet. The translation adjustments are recorded in Accumulated other comprehensive income (loss). Revenues and expenses are translated at weighted average exchange rates in effect during the period. Transaction gains and losses arising from exchange rate changes on transactions denominated in a currency other than the functional currency are included in income and expense as incurred. Aggregate transaction losses for the year ended December 31, 2015, 2014 and 2013 were $7.4 million, $2.9 million and $3.8 million, respectively. Upon sale or substantially complete liquidation of an investment in a foreign entity, the cumulative translation adjustment for that entity is reclassified from Accumulated other comprehensive income (loss) to earnings.
46
Table of Contents
Use of Estimates
The preparation of financial statements in conformity with accounting principles generally accepted in the U.S. requires management to make estimates and assumptions that affect the reported amounts of assets and liabilities and disclosure of contingent assets and liabilities at the date of the financial statements and the reported amounts of revenues and expenses during the reporting period. Actual results could differ from these estimates.
Business Combinations
The Company accounts for acquisitions in accordance with ASC 805.
Derivative Financial Instruments
The Company does not hold derivatives for trading purposes.
Reclassifications
Certain prior year amounts have been reclassified to conform to current year presentation.
Recently Adopted Accounting Pronouncements
In April 2014, the FASB issued ASU 2014-08, “Presentation of Financial Statements (Topic 205) and Property, Plant, and Equipment (Topic 360): Reporting Discontinued Operations and Disclosures of Disposals of Components of an Entity,” or ASU 2014-08. ASU 2014-08 changes the criteria for reporting a discontinued operation. Under the new pronouncement, a disposal of a part of an organization that has a major effect on its operations and financial results is a discontinued operation. The Company is required to adopt ASU 2014-08 prospectively for all disposals or components of the business classified as held for sale during the fiscal period beginning after December 15, 2014. The Company adopted the guidance in the first quarter of 2015 and it did not have an effect on the Company’s results of operations, financial condition or cash flows.
New Accounting Standards To Be Adopted
In February 2016, the FASB issued ASU 2016-02, “Leases (Topic 842).” The amendments in this Update require the recognition of assets and liabilities arising from lease transactions on the balance sheet and the disclosure of key information about leasing arrangements. Accordingly, a lessee will recognize a lease asset for its right to use the underlying asset and a lease liability for the corresponding lease obligation. Both the asset and liability will initially be measured at the present value of the future minimum lease payments over the lease term. Subsequent measurement, including the presentation of expenses and cash flows, will depend on the classification of the lease as either a finance or an operating lease. Initial costs directly attributable to negotiating and arranging the lease will be included in the asset. For leases with a term of 12 months or less, a lessee can make an accounting policy election by class of underlying asset to not recognize an asset and corresponding liability. Lessees will also be required to provide additional qualitative and quantitative disclosures regarding the amount, timing and uncertainty of cash flows arising from leases. These disclosures are intended to supplement the amounts recorded in the financial statements and provide additional information about the nature of an organization’s leasing activities. The amendments in this Update are effective for fiscal years, and interim periods within those fiscal years, beginning after December 15, 2018, with early adoption permitted. The Company is currently evaluating what impact, if any, its adoption will have to the presentation of the Company’s consolidated financial statements.
In November 2015, the FASB issued Accounting Standards Update 2015-17, “Income Taxes (Topic 740): Balance Sheet Classification of Deferred Taxes.” To simplify the presentation of deferred income taxes, the amendments in this Update require that deferred tax liabilities and assets be classified as noncurrent in a classified statement of financial position. The amendments in this Update apply to all entities that present a classified statement of financial position. The current requirement that deferred tax liabilities and assets of a tax-paying component of an entity be offset and presented as a single amount is not affected by the amendments in this Update. The amendments in this Update are effective for fiscal years, and interim periods within those fiscal years,
47
Table of Contents
beginning after December 15, 2016. Earlier application is permitted as of the beginning of an interim or annual reporting period. The amendments in this Update may be applied either prospectively to all deferred tax liabilities and assets or retrospectively to all periods presented. The Company is currently evaluating what impact, if any, its adoption will have to the presentation of the Company’s consolidated financial statements.
In July 2015, the FASB issued Accounting Standards Update 2015-11, “Inventory (Topic 330): Simplifying the Measurement of Inventory.” The amendments in this Update more closely align the measurement of inventory in GAAP with the measurement of inventory in International Financial Reporting Standards (IFRS). An entity should measure inventory within the scope of this Update at the lower of cost and net realizable value. Net realizable value is defined as the estimated selling prices in the ordinary course of business, less reasonably predictable costs of completion, disposal, and transportation. Subsequent measurement is unchanged for inventory measured using LIFO or the retail inventory method. The amendments in this Update are effective for fiscal years beginning after December 15, 2016 and interim periods within fiscal years beginning after December 15, 2017. The amendments in this Update should be applied prospectively with earlier application permitted as of the beginning of an interim or annual reporting period. The Company is currently evaluating what impact, if any, its adoption will have to the presentation of the Company’s consolidated financial statements.
In April 2015, the FASB issued Accounting Standards Update 2015-05, “Intangibles – Goodwill and Other – Internal-Use Software (Topic 350-40): Customer’s Accounting for Fees Paid in a Cloud Computing Arrangement.” The amendments in this Update provide guidance to customers about whether a cloud computing arrangement includes a software license. If a cloud computing arrangement includes a software license, then the customer should account for the software license element of the arrangement consistent with the acquisition of other software licenses. If a cloud computing arrangement does not include a software license, the customer should account for the arrangement as a service contract. The amendments in this Update are effective for fiscal years, and interim periods within those fiscal years, beginning after December 15, 2015. Earlier application is permitted. Amendments in this Update can be applied retrospectively or prospectively. The Company is currently not engaged in a cloud computing arrangement; however, it is evaluating what impact, if any, its adoption will have to the presentation of the Company’s consolidated financial statements if it enters such an arrangement.
In April 2015, the FASB issued Accounting Standards Update 2015-04, “Compensation – Retirement Benefits (Topic 715): Practical Expedient for the Measurement Date of an Employer’s Defined Benefit Obligation and Plan Assets.” For an entity that has a significant event in an interim period that calls for a re-measurement of defined benefit plan assets and obligations, the amendments in this Update provide a practical expedient that permits the entity to re-measure defined benefit plan assets and obligations using the month-end that is closest to the date of the significant event. The amendments in this Update are effective for fiscal years, and interim periods within those fiscal years, beginning after December 15, 2015. Earlier application is permitted. Amendments in this Update should be applied prospectively. The Company is currently evaluating what impact, if any, its adoption will have to the presentation of the Company’s consolidated financial statements.
In January 2015, the FASB issued Accounting Standards Update 2015-01, “Income Statement-Extraordinary and Unusual Items (Subtopic 225-20): Simplifying Income Statement Presentation by Eliminating the Concept of Extraordinary Items.” This Update eliminates from GAAP the concept of extraordinary items. A material event or transaction that an entity considers to be of an unusual nature or of a type that indicates infrequency of occurrence or both shall be reported as a separate component of income from continuing operations. The nature and financial effects of each event or transaction shall be presented as a separate component of income from continuing operations or, alternatively, disclosed in notes to financial statements. The amendments in this Update are effective for fiscal years, and interim periods within those fiscal years, beginning after December 15, 2015. A reporting entity may apply the amendments prospectively. A reporting entity also may apply the amendments retrospectively to all prior periods presented in the financial statements. Early adoption is permitted provided that the guidance is applied from the beginning of the fiscal year of adoption. The Company is currently evaluating what impact, if any, its adoption will have to the presentation of the Company’s consolidated financial statements.
In August 2014, the FASB issued ASU 2014-15 “Presentation of Financial Statements – Going Concern (Subtopic 205-40): Disclosure of Uncertainties about an Entity’s Ability to Continue as a Going Concern.” ASU 2014-15 provides guidance in GAAP about management’s responsibility to evaluate whether there is substantial
48
Table of Contents
doubt about an entity’s ability to continue as a going concern and to provide related footnote disclosures. The Company is required to adopt ASU 2014-15 prospectively for the annual period ending after December 15, 2016, and for annual periods and interim periods thereafter. Early application is permitted. The Company is currently evaluating what impact, if any, its adoption will have to the presentation of the Company’s consolidated financial statements.
In May 2014, the FASB issued ASU No. 2014-09, “Revenue from Contracts with Customers (Topic 606),” or ASU 2014-09. ASU 2014-09 requires an entity to recognize revenue in a matter that depicts the transfer of promised goods or services to customers in an amount that reflects the consideration to which the entity expects to be entitled in exchange for those goods or services. To achieve that core principle, the amendment provides five steps that an entity should apply when recognizing revenue. The amendment also specifies the accounting of some costs to obtain or fulfill a contract with a customer and expands the disclosure requirements around contracts with customers. An entity can either adopt this amendment retrospectively to each prior reporting period presented or retrospectively with cumulative effect of initially applying the update recognized at the date of initial application. In August 2015, the FASB issued ASU No. 2015-14 deferring the effective date of the amendment to annual reporting periods beginning after December 15, 2017. Early adoption is not permitted. The Company is currently evaluating what impact, if any, its adoption will have to the presentation of the Company’s consolidated financial statements.
Note B - Other Financial Statement Information
Inventories – net
| December 31 | ||||||||
| 2015 | 2014 | |||||||
| Finished products |
$ | 37,812 | $ | 41,634 | ||||
| Work-in-process |
6,902 | 7,964 | ||||||
| Raw materials |
34,854 | 40,423 | ||||||
|
|
|
|
|
|||||
| 79,568 | 90,021 | |||||||
| Excess of current cost over LIFO cost |
(3,538 | ) | (4,471 | ) | ||||
| Noncurrent portion of inventory |
(6,118 | ) | (5,513 | ) | ||||
|
|
|
|
|
|||||
| $ | 69,912 | $ | 80,037 | |||||
|
|
|
|
|
|||||
Costs for inventories of certain material are determined using the LIFO method and totaled approximately $26.8 million and $27.0 million at December 31, 2015 and 2014, respectively.
Property and equipment – net
Major classes of property, plant and equipment are as follows:
| December 31 | ||||||||
| 2015 | 2014 | |||||||
| Land and improvements |
$ | 12,260 | $ | 14,173 | ||||
| Buildings and improvements |
71,711 | 75,587 | ||||||
| Machinery and equipment |
137,599 | 144,213 | ||||||
| Construction in progress |
3,369 | 3,382 | ||||||
|
|
|
|
|
|||||
| 224,939 | 237,355 | |||||||
| Less accumulated depreciation |
132,974 | 134,824 | ||||||
|
|
|
|
|
|||||
| $ | 91,965 | $ | 102,531 | |||||
|
|
|
|
|
|||||
Depreciation of property and equipment was $10.3 million in 2015, $11.3 million in 2014 and $10.6 million in 2013. Machinery and equipment includes $.3 million of capital leases at December 31, 2015 and 2014.
49
Table of Contents
Legal proceedings
From time to time, the Company may be subject to litigation incidental to its business. The Company is not a party to any pending legal proceedings that the Company believes would, individually or in the aggregate, have a material adverse effect on its financial condition, results of operations or cash flows.
Note C - Pension Plans
PLP-USA hourly employees of the Company who meet specific requirements as to age and length and date of service are covered by a defined benefit pension plan (“Plan”). On December 12, 2012, the Company approved a freeze on further benefit accruals under the Plan and notified the participants of the freeze on December 19, 2012. Beginning February 1, 2013, participants ceased earning additional benefits under the Plan and no new participants entered the Plan. The Company uses a December 31 measurement date for its Plan.
Net periodic pension cost for the Plan consists of the following components for the year ended December 31:
| 2015 | 2014 | 2013 | ||||||||||
| Service cost |
$ | 189 | $ | 118 | $ | 222 | ||||||
| Interest cost |
1,436 | 1,362 | 1,251 | |||||||||
| Expected return on plan assets |
(1,849 | ) | (1,792 | ) | (1,436 | ) | ||||||
| Recognized net actuarial loss |
583 | 16 | 493 | |||||||||
|
|
|
|
|
|
|
|||||||
| Net periodic pension cost (income) |
$ | 359 | $ | (296 | ) | $ | 530 | |||||
|
|
|
|
|
|
|
|||||||
The following tables set forth benefit obligations, plan assets and the accrued benefit cost of the Plan at December 31:
| 2015 | 2014 | |||||||
| Projected benefit obligation at beginning of the year |
$ | 36,193 | $ | 27,525 | ||||
| Service cost |
189 | 118 | ||||||
| Interest cost |
1,436 | 1,362 | ||||||
| Actuarial (gain) loss |
(2,105 | ) | 7,991 | |||||
| Benefits paid |
(950 | ) | (803 | ) | ||||
|
|
|
|
|
|||||
| Projected benefit obligation at end of year |
$ | 34,763 | $ | 36,193 | ||||
|
|
|
|
|
|||||
| Fair value of plan assets at beginning of the year |
$ | 23,690 | $ | 22,499 | ||||
| Actual return on plan assets |
396 | 1,555 | ||||||
| Employer contributions |
0 | 439 | ||||||
| Benefits paid |
(950 | ) | (803 | ) | ||||
|
|
|
|
|
|||||
| Fair value of plan assets at end of the year |
$ | 23,136 | $ | 23,690 | ||||
|
|
|
|
|
|||||
| Unfunded pension obligation |
$ | 11,627 | $ | 12,503 | ||||
|
|
|
|
|
|||||
50
Table of Contents
In accordance with ASC 715-20, the Company recognizes the underfunded status of the Plan as a liability. The amount recognized in Accumulated other comprehensive loss related to the Plan at December 31 is comprised of the following:
| 2015 | 2014 | |||||||
| Balance at January 1 |
$ | (6,988 | ) | $ | (1,886 | ) | ||
| Reclassification adjustments: |
||||||||
| Pretax amortized net actuarial loss |
583 | 16 | ||||||
| Tax provision |
(219 | ) | (6 | ) | ||||
|
|
|
|
|
|||||
| 364 | 10 | |||||||
|
|
|
|
|
|||||
| Adjustment to recognize gain (loss) on unfunded pension obligations: |
||||||||
| Pretax gain (loss) |
653 | (8,227 | ) | |||||
| Tax (benefit) provision |
(245 | ) | 3,115 | |||||
|
|
|
|
|
|||||
| 408 | (5,112 | ) | ||||||
|
|
|
|
|
|||||
| Balance at December 31 |
$ | (6,216 | ) | $ | (6,988 | ) | ||
|
|
|
|
|
|||||
The pretax unfunded pension obligation gain of $.7 million included a decreased cost of $1.5 million resulting from a .25% increase in the discount rate used to calculate the estimated future benefit costs along with an additional gain of $.7 million associated with the industry updates to the mortality table used. The estimated net loss for the Plan that will be amortized from Accumulated other comprehensive income into periodic benefit cost for 2016 is $.5 million. There is no prior service cost to be amortized in the future.
The Plan had accumulated benefit obligations in excess of Plan assets as follows:
| 2015 | 2014 | |||||||
| Accumulated benefit obligation |
$ | 34,763 | $ | 36,193 | ||||
| Fair market value of assets |
23,136 | 23,690 | ||||||
Weighted-average assumptions used to determine benefit obligations at December 31 are as follows:
| 2015 | 2014 | |||||||
| Discount rate |
4.25 | % | 4.00 | % | ||||
| Rate of compensation increase |
n/a | n/a | ||||||
Weighted-average assumptions used to determine net periodic benefit cost for the year ended December 31 are as follows:
| 2015 | 2014 | 2013 | ||||||||||
| Discount rate |
4.00 | % | 5.00 | % | 4.00 | % | ||||||
| Rate of compensation increase |
n/a | n/a | n/a | |||||||||
| Expected long-term return on plan assets |
8.00 | 8.00 | 8.00 | |||||||||
The net periodic pension cost for 2015 was based on a long-term asset rate-of-return of 8.0%. This rate is based upon management’s estimate of future long-term rates of return on similar assets and is consistent with historical returns on such assets. Using the Plan’s current mix of assets and based on the average historical returns and expected future returns for such mix, an expected long-term rate-of-return of 8.0% is justified.
51
Table of Contents
At December 31, 2015, the fair value of the Plan assets included inputs in Level 1: Quoted market prices in active markets for identical assets or liabilities and Level 2: Observable market based inputs or unobservable inputs that are corroborated by market data. The fair value of the Plan assets as of December 31, 2015 and 2014, by category, are as follows:
| At December 31, 2015 | ||||||||||||||||
| Total Assets at Fair Value |
Quoted Prices in Active Markets for Identical Assets (Level 1) |
Significant Observable Inputs (Level 2) |
Significant Unobservable Inputs (Level 3) |
|||||||||||||
| Asset Category |
||||||||||||||||
| Cash |
$ | 545 | $ | 545 | $ | 0 | $ | 0 | ||||||||
| Equity Securities |
14,086 | 14,086 | 0 | 0 | ||||||||||||
| U.S. Treasury Bonds |
3,729 | 3,729 | 0 | 0 | ||||||||||||
| Corporate Bonds |
4,776 | 0 | 4,776 | 0 | ||||||||||||
|
|
|
|
|
|
|
|
|
|||||||||
| Total |
$ | 23,136 | $ | 18,360 | $ | 4,776 | $ | 0 | ||||||||
|
|
|
|
|
|
|
|
|
|||||||||
| At December 31, 2014 | ||||||||||||||||
| Total Assets at Fair Value |
Quoted Prices in Active Markets for Identical Assets (Level 1) |
Significant Observable Inputs (Level 2) |
Significant Unobservable Inputs (Level 3) |
|||||||||||||
| Asset Category |
||||||||||||||||
| Cash |
$ | 410 | $ | 410 | $ | 0 | $ | 0 | ||||||||
| Equity Securities |
8,231 | 8,231 | 0 | 0 | ||||||||||||
| U.S. Treasury Bonds |
4,834 | 4,834 | 0 | 0 | ||||||||||||
| Mutual Funds - Equity |
6,474 | 6,474 | 0 | 0 | ||||||||||||
| Corporate Bonds |
3,741 | 0 | 3,741 | 0 | ||||||||||||
|
|
|
|
|
|
|
|
|
|||||||||
| Total |
$ | 23,690 | $ | 19,949 | $ | 3,741 | $ | 0 | ||||||||
|
|
|
|
|
|
|
|
|
|||||||||
The Plan weighted-average asset allocations at December 31, 2015 and 2014, by asset category, are as follows:
| Plan assets at December 31 |
||||||||
| 2015 | 2014 | |||||||
| Asset category |
||||||||
| Equity securities |
61 | % | 62 | % | ||||
| Debt securities |
37 | 36 | ||||||
| Cash and equivalents |
2 | 2 | ||||||
|
|
|
|
|
|||||
| 100 | % | 100 | % | |||||
|
|
|
|
|
|||||
Management seeks to maximize the long-term total return of financial assets consistent with the fiduciary standards of ERISA. The ability to achieve these returns is dependent upon the need to accept moderate risk to achieve long-term capital appreciation.
In recognition of the expected returns and volatility from financial assets, Plan assets are invested in the following ranges with the target allocation noted:
| Range | Target | |||||||
| Equities |
30-80 | % | 60 | % | ||||
| Fixed Income |
20-70 | % | 40 | % | ||||
| Cash Equivalents |
0-10 | % | ||||||
Investment in these markets is projected to provide performance consistent with expected long-term returns with appropriate diversification.
52
Table of Contents
The Company’s policy is to fund amounts deductible for federal income tax purposes. The Company does not expect to contribute to the Plan in 2016.
The benefits expected to be paid out of the Plan assets in each of the next five years and the aggregate benefits expected to be paid for the subsequent five years are as follows:
| Year |
Pension Benefits |
|||
| 2016 |
$ | 879 | ||
| 2017 |
951 | |||
| 2018 |
1,019 | |||
| 2019 |
1,104 | |||
| 2020 |
1,196 | |||
| 2021-2025 |
7,600 | |||
The Company also provides retirement benefits through various defined contribution plans including PLP-USA’s Profit Sharing Plan. Expense for these defined contribution plans was $5.5 million in 2015, $6.1 million in 2014 and $5.6 million in 2013.
Further, the Company also provides retirement benefits through the Supplemental Profit Sharing Plan. To the extent an employee’s award under PLP-USA’s Profit Sharing Plan exceeds the maximum allowable contribution permitted under existing tax laws, the excess is accrued for (but not funded) under a non-qualified Supplemental Profit Sharing Plan. The return under this Supplemental Profit Sharing Plan is calculated at a weighted average of the one-year Treasury Bill rate plus 1%. At December 31, 2015 and 2014, the interest rate for the Supplemental Profit Sharing Plan was 1.22% and 1.12%, respectively. Expense for the Supplemental Profit Sharing Plan was $.3 million for 2015, $.5 million for 2014 and $.3 million for 2013, respectively. The Supplemental Profit Sharing Plan unfunded status as of December 31, 2015 and 2014 was $3.9 million and $3.5 million and is included in Other noncurrent liabilities.
Note D - Accumulated Other Comprehensive Income (“AOCI”)
The following tables set forth the total changes in AOCI by component, net of tax:
| Year Ended December 31, 2015 | Year Ended December 31, 2014 | |||||||||||||||||||||||
| Unrecognized Benefit Cost |
Cumulative Translation Adjustment |
Total | Unrecognized Benefit Cost |
Cumulative Translation Adjustment |
Total | |||||||||||||||||||
| Balance at January 1 |
$ | (7,007 | ) | $ | (28,127 | ) | $ | (35,134 | ) | $ | (1,905 | ) | $ | (15,797 | ) | $ | (17,702 | ) | ||||||
| Other comprehensive income before reclassifications: |
||||||||||||||||||||||||
| Loss on foreign currency translation adjustment |
0 | (19,789 | ) | (19,789 | ) | 0 | (12,330 | ) | (12,330 | ) | ||||||||||||||
| Gain (loss) on unfunded pension obligations |
408 | 0 | 408 | (5,112 | ) | 0 | (5,112 | ) | ||||||||||||||||
| Amounts reclassified from AOCI: |
||||||||||||||||||||||||
| Amortization of defined benefit pension actuarial loss (a) |
364 | 0 | 364 | 10 | 0 | 10 | ||||||||||||||||||
|
|
|
|
|
|
|
|
|
|
|
|
|
|||||||||||||
| Net current period other comprehensive income (loss) |
772 | (19,789 | ) | (19,017 | ) | (5,102 | ) | (12,330 | ) | (17,432 | ) | |||||||||||||
|
|
|
|
|
|
|
|
|
|
|
|
|
|||||||||||||
| Balance at December 31 |
$ | (6,235 | ) | $ | (47,916 | ) | $ | (54,151 | ) | $ | (7,007 | ) | $ | (28,127 | ) | $ | (35,134 | ) | ||||||
|
|
|
|
|
|
|
|
|
|
|
|
|
|||||||||||||
| (a) | This AOCI component is included in the computation of net periodic pension costs as noted in Note C – Pension Plans. |
53
Table of Contents
Note E - Debt and Credit Arrangements
| December 31 | ||||||||
| 2015 | 2014 | |||||||
| Short-term debt |
||||||||
| Secured notes |
||||||||
| Brazilian Real denominated at 5.35% in 2015 and 3.38% to 3.69% in 2014, due 2016 |
$ | 301 | $ | 1,809 | ||||
| Australian dollar denominated at 3.17% in 2015, due 2016 |
112 | 0 | ||||||
| Current portion of long-term debt |
110 | 116 | ||||||
|
|
|
|
|
|||||
| Total short-term debt |
523 | 1,925 | ||||||
|
|
|
|
|
|||||
| Long-term debt |
||||||||
| USD denominated at 1.29%, due 2017 |
30,505 | 31,451 | ||||||
| Australian dollar denominated at 3.185%, due 2017 |
1,093 | 0 | ||||||
| Australian dollar denominated term loans, at 5.59% in 2015 and 2014, due 2018, secured by land and building |
266 | 414 | ||||||
|
|
|
|
|
|||||
| Total long-term debt |
31,864 | 31,865 | ||||||
| Less current portion |
(110 | ) | (116 | ) | ||||
|
|
|
|
|
|||||
| Total long-term debt, less current portion |
31,754 | 31,749 | ||||||
|
|
|
|
|
|||||
| Total debt |
$ | 32,277 | $ | 33,674 | ||||
|
|
|
|
|
|||||
The PLP-USA line of credit makes $50 million available to the Company at an interest rate of LIBOR plus 1.125% with a term expiring August 2017. The PLP-USA line of credit makes $5.0 million available to the Company’s subisidiaries. At December 31, 2015, our Australian subsidiary had borrowed $1.5 million Australian dollars at a rate of 1.125% plus the Australian Bank Bill Swap Bid Rate with a term expiring August 2017. At December 31, 2015, the interest rate on the Australian line of credit agreement was 3.185%. There was $16.8 million available at December 31, 2015 under the line of credit net of long-term outstanding letter of credits. The line of credit agreement contains, among other provisions, requirements for maintaining levels of net worth and profitability. At December 31, 2015, the Company was in compliance with these covenants.
Aggregate maturities of long-term debt during the next five years are as follows: $.1 million for 2016, $31.7 million for 2017, less than $.1 million for 2018, and $0 thereafter.
Interest paid was $.5 million in 2015, $.6 million in 2014 and $.4 million in 2013.
Guarantees and Letters of Credit
The Company has provided financial guarantees for uncompleted work and financial commitments. The terms of these guarantees vary with end dates ranging from the current year through the completion of such transactions. The guarantees would typically be triggered in the event of nonperformance. As of December 31, 2015, the Company had total outstanding guarantees of $.5 million. Additionally, certain domestic and foreign customers require the Company to issue letters of credit or performance bonds as a condition of placing an order. As of December 31, 2015, the Company had total outstanding letters of credit of $6.1 million.
Note F - Leases
The Company has commitments under operating leases primarily for office and manufacturing space, transportation equipment, office equipment and computer equipment. Rental expense was $3.4 million in 2015 and $3.8 million in both 2014 and 2013. Future minimum rental commitments having non-cancelable terms exceeding one year are $2.4 million in 2016, $1.6 million in 2017, $1.5 million in 2018, $1.4 million in 2019, $1.3 million in
54
Table of Contents
2020, and an aggregate $10.1 million thereafter. One such lease is for the Company’s aircraft with a lease commitment through February 2017. Under the terms of the lease, the Company maintains the risk to make up a deficiency from market value attributable to damage, extraordinary wear and tear, excess air hours or exceeding maintenance overhaul schedules required by the Federal Aviation Administration. At the present time, the Company does not believe it has incurred any obligation for any contingent rent under the lease.
The Company has commitments under capital leases for equipment and vehicles. Amounts recognized as capital lease obligations are reported in Accrued expense and other liabilities and Other noncurrent liabilities in the Consolidated Balance Sheets. Future minimum rental commitments for capital leases are approximately less than $.1 million in 2016, 2017, 2018, 2019 and 2020. The imputed interest for the capital leases is less than $.1 million. Leased property and equipment under capital leases are amortized using the straight-line method over the term of the lease. Routine maintenance, repairs and replacements are expensed as incurred.
Note G - Income Taxes
Income before income taxes was derived from the following sources:
| 2015 | 2014 | 2013 | ||||||||||
| United States |
$ | 4,421 | $ | 11,810 | $ | 16,388 | ||||||
| Foreign |
7,285 | 9,600 | 15,406 | |||||||||
|
|
|
|
|
|
|
|||||||
| $ | 11,706 | $ | 21,410 | $ | 31,794 | |||||||
|
|
|
|
|
|
|
|||||||
The components of income taxes for the year ended December 31 are as follows:
| 2015 | 2014 | 2013 | ||||||||||
| Current |
||||||||||||
| Federal |
$ | 2,679 | $ | 4,718 | $ | 6,308 | ||||||
| Foreign |
2,951 | 5,081 | 5,018 | |||||||||
| State and local |
345 | 447 | 986 | |||||||||
|
|
|
|
|
|
|
|||||||
| 5,975 | 10,246 | 12,312 | ||||||||||
|
|
|
|
|
|
|
|||||||
| Deferred |
||||||||||||
| Federal |
(611 | ) | (425 | ) | (1,081 | ) | ||||||
| Foreign |
(309 | ) | (1,110 | ) | 157 | |||||||
| State and local |
(24 | ) | (162 | ) | (181 | ) | ||||||
|
|
|
|
|
|
|
|||||||
| (944 | ) | (1,697 | ) | (1,105 | ) | |||||||
|
|
|
|
|
|
|
|||||||
| Income taxes |
$ | 5,031 | $ | 8,549 | $ | 11,207 | ||||||
|
|
|
|
|
|
|
|||||||
55
Table of Contents
The differences between the provision for income taxes at the U.S. federal statutory rate and the tax shown in the Statements of Consolidated Income for the year ended December 31 are summarized as follows:
| 2015 | 2014 | 2013 | ||||||||||
| U. S. federal statutory tax rate |
35 | % | 35 | % | 35 | % | ||||||
| Federal tax at statutory rate |
$ | 4,097 | $ | 7,494 | $ | 11,128 | ||||||
| State and local taxes, net of federal benefit |
89 | 290 | 583 | |||||||||
| U.S. federal permanent items |
251 | 208 | 124 | |||||||||
| Domestic production activities deduction |
(321 | ) | (536 | ) | (372 | ) | ||||||
| Foreign earnings and related tax credits |
700 | 700 | 701 | |||||||||
| Non-U.S. tax rate variances |
(685 | ) | (1,313 | ) | (1,467 | ) | ||||||
| Unrecognized tax benefits |
(768 | ) | 186 | (770 | ) | |||||||
| Valuation allowance |
1,754 | 1,925 | 1,091 | |||||||||
| Tax credits |
(212 | ) | (184 | ) | (453 | ) | ||||||
| Other, net |
126 | (221 | ) | 642 | ||||||||
|
|
|
|
|
|
|
|||||||
| $ | 5,031 | $ | 8,549 | $ | 11,207 | |||||||
|
|
|
|
|
|
|
|||||||
Deferred tax assets and liabilities are recognized for the expected future tax consequences of temporary differences between the tax basis of assets and liabilities and their carrying value for financial statement purposes. The tax effects of temporary differences that give rise to the Company’s deferred tax assets and liabilities at December 31 are as follows:
| 2015 | 2014 | |||||||
| Deferred tax assets: |
||||||||
| Accrued compensation and benefits |
$ | 1,199 | $ | 1,358 | ||||
| Inventory valuation reserves |
3,080 | 2,849 | ||||||
| Allowance for doubtful accounts |
335 | 316 | ||||||
| Benefit plan reserves |
10,878 | 11,331 | ||||||
| Net operating loss carryforwards |
3,851 | 2,751 | ||||||
| Tax credit carryforwards |
534 | 745 | ||||||
| Other accrued expenses |
2,350 | 2,226 | ||||||
| Unrealized foreign exchange |
3,179 | 1,805 | ||||||
|
|
|
|
|
|||||
| Gross deferred tax assets |
25,406 | 23,381 | ||||||
| Valuation allowance |
(5,209 | ) | (3,614 | ) | ||||
|
|
|
|
|
|||||
| Net deferred tax assets |
20,197 | 19,767 | ||||||
|
|
|
|
|
|||||
| Deferred tax liabilities: |
||||||||
| Depreciation and other basis differences |
(5,841 | ) | (5,814 | ) | ||||
| Intangibles |
(2,959 | ) | (3,706 | ) | ||||
| Undistributed foreign earnings |
(1,094 | ) | (444 | ) | ||||
| Other |
(67 | ) | (65 | ) | ||||
|
|
|
|
|
|||||
| Deferred tax liabilities |
(9,961 | ) | (10,029 | ) | ||||
|
|
|
|
|
|||||
| Net deferred tax assets |
$ | 10,236 | $ | 9,738 | ||||
|
|
|
|
|
|||||
56
Table of Contents
| 2015 | 2014 | |||||||
| Change in net deferred tax assets: |
||||||||
| Deferred income tax benefit |
$ | 944 | $ | 1,697 | ||||
| Items of other comprehensive income (loss) |
(464 | ) | 3,109 | |||||
| Currency translation |
18 | 140 | ||||||
| Deferred tax balances from business acquisition |
0 | (2,025 | ) | |||||
|
|
|
|
|
|||||
| Total change in net deferred tax assets |
$ | 498 | $ | 2,921 | ||||
|
|
|
|
|
|||||
Deferred taxes are recorded at a rate at which such items are expected to reverse, based on currently enacted tax rates for temporary differences between the financial reporting and income tax basis of assets and liabilities and operating loss and tax credit carryforwards.
At December 31, 2015, the Company had $3.6 million of foreign net operating loss carryfowards of which $.5 million will expire between the years 2017 and 2025.
The Company assesses the available positive and negative evidence to determine if it is more likely than not sufficient future taxable income will be generated to utilize the existing deferred tax assets by jurisdiction. Based on this evaluation, the Company has established a valuation allowance of $5.2 million at December 31, 2015 in order to measure only the portion of the deferred tax asset that is more likely than not to be realized. The net increase in valuation allowance during the year was $1.6 million, of which $1.8 million impacts the income tax provision and ($.2) million is reflected through Other Comprehensive Income.
The Company has not established a deferred tax liability associated with approximately $130.6 million of its undistributed foreign earnings at December 31, 2015 as these earnings are considered to be permanently reinvested outside the U.S. These earnings would be taxable upon the sale or liquidation of these foreign subsidiaries, or upon the remittance of such earnings. While the measurement of the unrecognized U.S. income taxes with respect to these earnings is not practicable, foreign tax credits would be available to offset some or all of such earnings that would be remitted as dividends.
Income taxes paid net of refunds were approximately $12.3 million in 2015, $7.7 million in 2014 and $19.9 million in 2013.
The Company is subject to taxation in the U.S. and various state and foreign jurisdictions. As of December 31, 2015, with few exceptions, the Company is no longer subject to U.S. federal examinations by tax authorities for years before 2012 and state, local or foreign examinations by tax authorities for years before 2009.
The following is a tabular reconciliation of the total amounts of unrecognized tax benefits, excluding interest and penalties, for the year ended December 31:
| 2015 | 2014 | 2013 | ||||||||||
| Balance at January 1 |
$ | 794 | $ | 608 | $ | 1,361 | ||||||
| Additions for tax positions of prior years |
0 | 186 | 0 | |||||||||
| Reductions for tax positions of prior years |
(616 | ) | 0 | (588 | ) | |||||||
| Expiration of statutes of limitations |
0 | 0 | (165 | ) | ||||||||
|
|
|
|
|
|
|
|||||||
| Balance at December 31 |
$ | 178 | $ | 794 | $ | 608 | ||||||
|
|
|
|
|
|
|
|||||||
The Company records accrued interest as well as penalties related to unrecognized tax benefits as part of the provision for income taxes. The Company recognized less than $.1 million, net of the amount lapsed through expiring statutes, during each of the years ended December 31, 2015, 2014 and 2013. During the year ended December 31, 2015, the Company reduced previously unrecognized tax benefits by $.6 million, primarily due to final resolution of an audit in the Asia Pacific region, the resolution of which resulted in a $.2 million reduction of unrecognized tax benefits from the amount that was previously accrued. The Company also recognized a related tax benefit during the year for the reduction of accrued interest and penalties of $.5 million and $.1 million, respectively. The Company had approximately less than $.1 million, $.6 million, and $.6 million accrued for the payment of
57
Table of Contents
interest for the years ended December 31, 2015, 2014 and 2013, respectively. The Company had approximately $0, $.3 million, and $.3 million accrued for the payment of penalties for the year ended December 31, 2015, 2014 and 2013, respectively. If recognized, approximately $.2 million, $.2 million, and $0 of unrecognized tax benefits would affect the tax rate for the year ended December 31, 2015, 2014 and 2013, respectively. The Company anticipates a decrease in its unrecognized tax benefits by approximately $.2 million within the next twelve months due to effective settlement.
Note H - Share-Based Compensation
The 1999 Stock Option Plan
Activity in the Company’s 1999 Stock Option Plan for the year ended December 31, 2015 was as follows:
| Number of Shares |
Weighted Average Exercise Price per Share |
Weighted Average Remaining Contractual Term (Years) |
Aggregate Intrinsic Value |
|||||||||||||
| Outstanding at January 1, 2015 |
12,000 | $ | 41.44 | |||||||||||||
| Exercised |
0 | $ | 0.00 | |||||||||||||
| Forfeited |
0 | $ | 0.00 | |||||||||||||
|
|
|
|||||||||||||||
| Outstanding (exercisable and vested) at December 31, 2015 |
12,000 | $ | 41.44 | 1.8 | $ | 47 | ||||||||||
|
|
|
|||||||||||||||
There were 0, 1,000 and 19,150 in stock options exercised during the year ended December 31, 2015, 2014 and 2013, respectively. The total intrinsic value of stock options exercised during the year ended December 31, 2015, 2014 and 2013 was $0, less than $.1 million and $.6 million, respectively. Cash received for the exercise of stock options during 2015 and 2014 was $0 and less than $.1 million, respectively.
The Company recorded compensation expense related to the stock options currently vesting of $0 for each of the years ended December 31, 2015, 2014 and 2013, as all compensation has been recognized as of December 2012.
The excess tax benefits from share-based awards for the year ended December 31, 2015, 2014 and 2013 were $0, $0 and $.2 million, respectively, as reported on the Consolidated Statements of Cash Flows in financing activities, and represents the reduction in income taxes otherwise payable during the period, attributable to the actual gross tax benefits in excess of the expected tax benefits for options exercised in the current period.
Long Term Incentive Plan of 2008
Under the Preformed Line Products Company Long Term Incentive Plan of 2008 (the “LTIP”), certain employees, officers and directors are eligible to receive awards of options and restricted share units. The purpose of this LTIP is to give the Company a competitive advantage in attracting, retaining and motivating officers, employees and directors and to provide an incentive to those individuals to increase shareholder value through long-term incentives directly linked to the Company’s performance. The total number of Company common shares reserved for awards under the LTIP is 900,000. Of the 900,000 common shares, 800,000 common shares have been reserved for restricted share units and restricted shares and 100,000 common shares have been reserved for share options. The LTIP expires on April 17, 2018.
Restricted Share Units
For all of the participants except the CEO, a portion of the restricted share units (RSUs) award is subject to time-based cliff vesting and a portion is subject to vesting based upon the Company’s financial performance over a three-year period. All of the CEO’s RSUs are subject to vesting based upon the Company’s financial performance over a three-year period.
58
Table of Contents
The RSUs are offered at no cost to the employees; however, the participant must remain employed with the Company until the restrictions on the RSUs lapse. The fair value of RSUs is based on the market price of a common share on the grant date. The Company currently estimates that no RSUs will be forfeited related to the time-based awards. Dividends declared are accrued in cash.
A summary of the RSUs for the year ended December 31, 2015 is as follows:
| Restricted Share Awards | ||||||||||||||||
| Performance and Service Required |
Service Required |
Total Restricted Awards |
Weighted-Average Grant-Date Fair Value |
|||||||||||||
| Nonvested as of January 1, 2015 |
88,508 | 10,413 | 98,921 | $ | 67.36 | |||||||||||
| Granted |
50,927 | 21,073 | 72,000 | 45.02 | ||||||||||||
| Vested |
0 | (20,614 | ) | (20,614 | ) | 49.60 | ||||||||||
| Forfeited |
(47,832 | ) | 0 | (47,832 | ) | 70.27 | ||||||||||
|
|
|
|
|
|
|
|
|
|||||||||
| Nonvested as of December 31, 2015 |
91,603 | 10,872 | 102,475 | $ | 53.88 | |||||||||||
|
|
|
|
|
|
|
|
|
|||||||||
For time-based RSUs, the Company recognizes stock-based compensation expense on a straight-line basis over the requisite service period of the award in General and administrative expense in the accompanying Statement of Consolidated Income. Compensation expense related to the time-based RSUs for the year ended December 31, 2015, 2014 and 2013 was $.3 million annually for each year. As of December 31, 2015, there was $.3 million of total unrecognized compensation cost related to time-based RSUs that is expected to be recognized over the weighted-average remaining period of approximately 1.6 years.
For the performance-based RSUs, the number of RSUs in which the participants will vest depends on the Company’s level of performance measured by growth in pretax income or operating income and sales over a requisite performance period. Depending on the extent to which the performance criterions are satisfied under the LTIP, the participants are eligible to earn common shares over the vesting period. For the year ended December 31, 2015 a $1.0 million reduction to performance-based compensation expense was recorded. Performance-based compensation expense for the years ended December 31, 2014 and 2013 was $1.0 million and $2.7 million, respectively. During the year ended December 31, 2015, a $.5 million reduction in performance-based compensation was recorded related to the 2013 performance-based RSU grant, due to lower results for growth in pretax income and sales, resulting in a forfeiture of 47,832 RSUs granted in 2013. During the year ended December 31, 2015, a $.8 million reduction in performance-based compensation expense was recorded related to the 2014 performance-based RSU grant, due to changes in estimates for growth in pretax income and sales. During the year ended December 31, 2014, a $.2 million reduction in performance-based compensation expense was recorded related to the 2012 performance-based RSU grant, due to lower results for growth in pretax income, resulting in a forfeiture of 3,537 RSU’s granted in 2012. During the year ended December 31, 2014, a $1.3 million reduction in performance-based compensation expense was recorded related to the 2013 performance-based RSU grant, due to changes in estimates for growth in pretax income. As of December 31, 2015, the remaining performance-based RSUs compensation expense of $.8 million is expected to be recognized over a period of approximately 2 years.
In November 2015, a special, one-time grant of restricted stock was awarded to the CEO and other officers that fully vested on the issuance date of November 30, 2015, as a shorter-term reward for achievements not tied to the performance metrics. Compensation expense recorded for the restricted stock was $.6 million.
The excess tax benefits from service and performance-based RSUs for the years ended December 31, 2015, 2014 and 2013 was less than $.1 million, $.1 million and $.1 million, respectively, as reported on the Consolidated Statements of Cash Flows in financing activities, and represents the reduction in income taxes otherwise payable during the period, attributable to the actual gross tax benefits in excess of the expected tax benefits for restricted shares vested in the current period.
59
Table of Contents
In the event of a Change in Control (as defined in the LTIP), vesting of the RSUs will be accelerated and all restrictions will lapse. Unvested performance-based awards are based on a maximum potential payout. Actual shares awarded at the end of the performance period may be less than the maximum potential payout level depending on achievement of performance-based award objectives.
To satisfy the vesting of its RSUs, the Company has reserved new shares from its authorized but unissued shares. Any additional granted awards will also be issued from the Company’s authorized but unissued shares. Under the LTIP, there are 312,398 common shares currently available for additional restricted share grants.
Deferred Compensation Plan
The Company maintains a trust, commonly referred to as a rabbi trust, in connection with the Company’s deferred compensation plan. This plan allows for two deferrals. First, Directors make elective deferrals of Director fees payable and held in the rabbi trust. The deferred compensation plan allows the Directors to elect to receive Director fees in shares of common stock of the Company at a later date instead of fees paid each quarter in cash. Second, this plan allows certain Company employees to defer LTIP restricted shares or RSUs for future distribution in the form of common shares. Assets of the rabbi trust are consolidated, and the value of the Company’s stock held in the rabbi trust is classified in Shareholders’ equity and generally accounted for in a manner similar to treasury stock. The Company recognizes the original amount of the deferred compensation (fair value of the deferred stock award at the date of grant) as the basis for recognition in common shares issued to the rabbi trust. Changes in the fair value of amounts owed to certain employees or Directors are not recognized as the Company’s deferred compensation plan does not permit diversification and must be settled by the delivery of a fixed number of the Company’s common shares. As of December 31, 2015, 296,635 LTIP shares have been deferred and are being held by the rabbi trust.
Share Option Awards
The LTIP plan permits the grant of 100,000 options to buy common shares of the Company to certain employees at not less than fair market value of the shares on the date of grant. At December 31, 2015, there were 11,000 shares remaining available for issuance under the LTIP. Options issued to date under the Plan vest 50% after one year following the date of the grant, 75% after two years, and 100% after three years and expire from five to ten years from the date of grant. Shares issued as a result of stock option exercises will be funded with the issuance of new shares.
The Company utilizes the Black-Scholes option pricing model for estimating fair values of options. The Black-Scholes model requires assumptions regarding the volatility of the Company’s stock, the expected life of the stock award and the Company’s dividend yield. The company utilizes historical data in determining these assumptions. The risk-free rate for periods within the contractual life of the option is based on the U.S. zero coupon Treasury yield in effect at the time of grant. Forfeitures have been estimated to be zero.
There were 10,500, 35,500, and 0 options granted for the year ended December 31, 2015, 2014 and 2013, respectively. The fair values for the stock options granted were estimated at the date of grant using the Black-Scholes option-pricing model with the following weighted-average assumptions:
| 2015 | 2014 | |||||||
| Risk-free interest rate |
2.1 | % | 1.9 | % | ||||
| Dividend yield |
1.6 | % | 1.7 | % | ||||
| Expected life (years) |
5 | 5 | ||||||
| Expected volatility |
37.9 | % | 42.9 | % | ||||
60
Table of Contents
Activity in the Company’s LTIP plan for the year ended December 31, 2015 was as follows:
| Number of Shares |
Weighted Average Exercise Price per Share |
Weighted Average Remaining Contractual Term (Years) |
Aggregate Intrinsic Value |
|||||||||||||
| Outstanding at January 1, 2015 |
47,750 | $ | 58.11 | |||||||||||||
| Granted |
10,500 | $ | 41.92 | |||||||||||||
| Exercised |
0 | $ | 0.00 | |||||||||||||
| Forfeited |
(2,000 | ) | $ | 52.21 | ||||||||||||
|
|
|
|||||||||||||||
| Outstanding (vested and expected to vest) at December 31, 2015 |
56,250 | $ | 55.30 | 6.7 | $ | 9 | ||||||||||
|
|
|
|||||||||||||||
| Exercisable at December 31, 2015 |
29,000 | $ | 57.54 | 7.5 | $ | 0 | ||||||||||
|
|
|
|||||||||||||||
The weighted-average grant-date fair value of options granted during 2015 and 2014 was $13.16 and $20.83, respectively. There were 0, 1,250, and 14,250 stock options exercised during the year ended December 31, 2015, 2014 and 2013, respectively. The total intrinsic value of stock options exercised during the year ended December 31, 2015 and 2014 was $0 and less than $.1 million, respectively. Cash received for the exercise of stock options during 2015 and 2014 was $0 and $.1 million, respectively.
For the year ended December 31, 2015, 2014 and 2013, the Company recorded compensation expense related to the stock options currently vesting of $.3 million, $.3 million and $.1 million, respectively. The total compensation cost related to nonvested awards not yet recognized at December 31, 2015 is expected to be a combined total of $.4 million over a weighted-average period of approximately 2 years.
The excess tax benefits from share based awards for the year ended December 31, 2015, 2014 and 2013 was $0, $.1 million and $.1 million, respectively, as reported on the Consolidated Statements of Cash Flows in financing activities, and represents the reduction in income taxes otherwise payable during the period, attributable to the actual gross tax benefits in excess of the expected tax benefits for options exercised in the current period.
Note I - Computation of Earnings Per Share
Basic earnings per share were computed by dividing net income by the weighted-average number of shares of common stock outstanding for each respective period. Diluted earnings per share were calculated by dividing net income by the weighted-average of all potentially dilutive shares of common stock that were outstanding during the years presented.
61
Table of Contents
The calculation of basic and diluted earnings per share for the year ended December 31 was as follows:
| 2015 | 2014 | 2013 | ||||||||||
| Numerator |
||||||||||||
| Net income |
$ | 6,675 | $ | 12,861 | $ | 20,587 | ||||||
|
|
|
|
|
|
|
|||||||
| Denominator |
||||||||||||
| Determination of shares (in thousands) |
||||||||||||
| Weighted-average common shares outstanding |
5,350 | 5,377 | 5,361 | |||||||||
| Dilutive effect - share-based awards |
16 | 5 | 106 | |||||||||
|
|
|
|
|
|
|
|||||||
| Diluted weighted-average common shares outstanding |
5,366 | 5,382 | 5,467 | |||||||||
|
|
|
|
|
|
|
|||||||
| Earnings per common share |
||||||||||||
| Basic |
$ | 1.25 | $ | 2.39 | $ | 3.84 | ||||||
|
|
|
|
|
|
|
|||||||
| Diluted |
$ | 1.24 | $ | 2.39 | $ | 3.77 | ||||||
|
|
|
|
|
|
|
|||||||
For the year ended December 31, 2015, 2014 and 2013, 58,350, 25,000 and 1,500 stock options, respectively, were excluded from the calculation of diluted earnings per share as the effect would have been anti-dilutive.
For the year ended December 31, 2015, 2014 and 2013, 0, 52,368 and 0 restricted share units, respectively, were excluded from the calculation of diluted earnings per share as the effect of the settlement in common shares would have been anti-dilutive.
Note J - Goodwill and Other Intangibles
The Company’s finite and indefinite-lived intangible assets consist of the following:
| December 31, 2015 | December 31, 2014 | |||||||||||||||
| Gross Carrying Amount |
Accumulated Amortization |
Gross Carrying Amount |
Accumulated Amortization |
|||||||||||||
| Finite-lived intangible assets |
||||||||||||||||
| Patents |
$ | 4,815 | $ | (4,799 | ) | $ | 4,823 | $ | (4,730 | ) | ||||||
| Land use rights |
1,155 | (173 | ) | 1,247 | (164 | ) | ||||||||||
| Trademark |
1,713 | (899 | ) | 1,888 | (814 | ) | ||||||||||
| Technology |
3,021 | (860 | ) | 3,432 | (734 | ) | ||||||||||
| Customer relationships |
11,816 | (4,501 | ) | 13,104 | (3,931 | ) | ||||||||||
|
|
|
|
|
|
|
|
|
|||||||||
| $ | 22,520 | $ | (11,232 | ) | $ | 24,494 | $ | (10,373 | ) | |||||||
|
|
|
|
|
|
|
|
|
|||||||||
| Indefinite-lived intangible assets |
||||||||||||||||
|
|
|
|
|
|||||||||||||
| Goodwill |
$ | 15,821 | $ | 17,792 | ||||||||||||
|
|
|
|
|
|||||||||||||
The Company performs its annual impairment test for goodwill utilizing a combination of discounted cash flow methodology, market comparables and an overall market capitalization reasonableness test in computing fair value by reporting unit. The Company then compares the fair value of the reporting unit with its carrying value to assess if goodwill has been impaired. Based on the assumptions as to growth, discount rates and the weighting used for each respective valuation methodology, results of the valuations could be significantly different. The Company believes that the methodologies and weightings used are reasonable and result in appropriate fair values of the reporting units.
The Company performed its annual impairment test for goodwill as of October 1, 2015 and October 1, 2014 and determined that no adjustment to the carrying value was required. During the third quarter of 2015, the Company’s market capitalization dropped below its equity carrying value. This was identified as an interim
62
Table of Contents
indicator of impairment. As such, the Company performed an interim goodwill impairment assessment of its Asia-Pacific reporting unit and one of its reporting units within The Americas segment. The result of this interim assessment was the Company passed step one by a margin of 16% and 24%, respectively, for the two reporting units, which compares to a margin of 24% and 39%, respectively, at October 1, 2014. The Company had goodwill balances of $8.3 million and $4.1 million, respectively, for these reporting units at September 30, 2015. The weighted average cost of capital and long-term growth assumptions used in the Company’s assessment were 14.7% and 3%, respectively, for its Asia Pacific reporting unit and 13.5% and 3%, respectively, for the reporting unit within The America’s segment. While it was determined that there was no impairment at September 30, 2015, the Company will continue to monitor the results of these operations as there is a reasonable possibility of a future impairment charge and significant uncertainties regarding the recoverability of the respective carrying values. The Company determined there were no indicators of impairment during the fourth quarter, while similar margins were present.
During the fourth quarter of 2015, the Company transferred a product line from The Americas segment and consolidated its manufacturing processes into the PLP-USA segment and therefore transferred $3.1 million of goodwill from The Americas to PLP-USA. As such, certain prior year amounts have been reclassified to conform to current year presentation. The changes in the carrying amount of goodwill by segment for the year ended December 31, 2015 and 2014 are as follows:
| USA | The Americas | EMEA | Asia-Pacific | Total | ||||||||||||||||
| Balance at January 1, 2014 |
$ | 3,078 | $ | 0 | $ | 1,754 | $ | 9,041 | $ | 13,873 | ||||||||||
| Additions |
0 | 4,909 | 0 | 0 | 4,909 | |||||||||||||||
| Currency translation |
0 | (237 | ) | (226 | ) | (527 | ) | (990 | ) | |||||||||||
|
|
|
|
|
|
|
|
|
|
|
|||||||||||
| Balance at December 31, 2014 |
3,078 | 4,672 | 1,528 | 8,514 | 17,792 | |||||||||||||||
|
|
|
|
|
|
|
|
|
|
|
|||||||||||
| Currency translation |
0 | (754 | ) | (227 | ) | (990 | ) | (1,971 | ) | |||||||||||
|
|
|
|
|
|
|
|
|
|
|
|||||||||||
| Balance at December 31, 2015 |
$ | 3,078 | $ | 3,918 | $ | 1,301 | $ | 7,524 | $ | 15,821 | ||||||||||
|
|
|
|
|
|
|
|
|
|
|
|||||||||||
The Company’s only intangible asset with an indefinite life is goodwill. The Company’s goodwill is not deductible for tax purposes. The increase in goodwill of $4.9 million in 2014 is related to the acquisition of Helix resulting in an incremental $4.9 million of goodwill which was partially offset by a $1.0 million decline related to foreign currency translation. The decrease in goodwill of $2.0 million in 2015 is related to foreign currency translation.
The aggregate amortization expense for other intangibles with finite lives, ranging from 4 to 82 years, for the year ended December 31, 2015, 2014 and 2013 was $1.2 million, $1.6 million and $1.5 million, respectively. Amortization expense is estimated to be $1.0 million for 2016, $1.0 million for 2017, $.9 million for 2018, $.9 million for 2019 and $.9 million for 2020. The weighted-average remaining amortization period is approximately 20.6 years. The weighted-average remaining amortization period by intangible asset class; patents, 10 years; land use rights, 58.9 years; trademark, 10.3 years; technology, 15.9 years and customer relationships, 14.1 years.
63
Table of Contents
Note K – Fair Value of Financial Assets and Liabilities
The carrying value of the Company’s current financial instruments, which include cash and cash equivalents, accounts receivable, accounts payable, notes payable and short-term debt, approximates its fair value because of the short-term maturity of these instruments. At December 31, 2015, the fair value of the Company’s long-term debt was estimated using discounted cash flows analysis, based on the Company’s current incremental borrowing rates for similar types of borrowing arrangements that are considered to be Level 2 inputs. There have been no transfers in or out of Level 2 for the year ended December 31, 2015. Based on the analysis performed, the fair value and the carrying value of the Company’s long-term debt are as follows:
| December 31, 2015 | December 31, 2014 | |||||||||||||||
| Fair Value |
Carrying Value |
Fair Value |
Carrying Value |
|||||||||||||
|
|
|
|
|
|
|
|
|
|||||||||
| Long-term debt and related current maturities |
$ | 31,866 | $ | 31,864 | $ | 31,876 | $ | 31,865 | ||||||||
|
|
|
|
|
|
|
|
|
|||||||||
Note L – Segment Information
The Company designs, manufactures and sells hardware employed in the construction and maintenance of telecommunication, energy and other utility networks, data communication products and mounting hardware for solar power applications. Principal products include cable anchoring, control hardware and splice enclosures which are sold primarily to customers in North and South America, Europe, South Africa and Asia Pacific.
The Company reports its segments in four geographic regions: PLP-USA, The Americas, EMEA (Europe, Middle East & Africa) and Asia-Pacific in accordance with accounting standards codified in FASB ASC 280, Segment Reporting. Each segment distributes a full range of the Company’s primary products. The PLP-USA segment is comprised of U.S. operations manufacturing the Company’s traditional products primarily supporting domestic energy, telecommunications and solar products. The other three segments, The Americas, EMEA and Asia-Pacific support the Company’s energy, telecommunications, data communication and solar products in each respective geographical region.
The segment managers responsible for each region report directly to the Company’s Chief Executive Officer, who is the chief operating decision maker and are accountable for the financial results and performance of their entire segment for which they are responsible. The business components within each segment are managed to maximize the results of the entire company rather than the results of any individual business component of the segment.
The amount of each segment’s performance reported to the chief operating decision maker is for purposes of making decisions about allocating resources to the segment and assessing its performance. The Company evaluates segment performance and allocates resources based on several factors primarily based on sales and income from continuing operations, net of tax.
The accounting policies of the operating segments are the same as those described in Note A in the Notes To Consolidated Financial Statements. No single customer accounts for more than ten percent of the Company’s consolidated revenues. It is not practical to present revenues by product line. U.S. net sales for the year ended December 31, 2015, 2014, and 2013 were $142.5 million, $152.6 million and $163 million, respectively. U.S. long-lived assets as of December 31, 2015 and 2014 were $40.6 million and $41.1 million, respectively.
64
Table of Contents
The following table presents a summary of the Company’s reportable segments for the year ended December 31, 2015, 2014 and 2013. Financial results for the PLP-USA segment include the elimination of all segments’ intercompany profits in inventory. During the fourth quarter of 2015, the Company reconfigured a product line in The Americas segment and consolidated its manufacturing processes into the PLP-USA segment. As such, certain prior year amounts have been reclassified to conform to current year presentation.
| Year Ended December 31 | ||||||||||||
| 2015 | 2014 | 2013 | ||||||||||
| Net sales |
||||||||||||
| PLP-USA |
$ | 142,470 | $ | 152,567 | $ | 163,033 | ||||||
| The Americas |
59,290 | 75,868 | 72,518 | |||||||||
| EMEA |
53,778 | 65,446 | 61,543 | |||||||||
| Asia-Pacific |
99,128 | 94,304 | 112,682 | |||||||||
|
|
|
|
|
|
|
|||||||
| Total net sales |
$ | 354,666 | $ | 388,185 | $ | 409,776 | ||||||
|
|
|
|
|
|
|
|||||||
| Intersegment sales |
||||||||||||
| PLP-USA |
$ | 9,339 | $ | 12,690 | $ | 10,944 | ||||||
| The Americas |
5,074 | 5,875 | 5,949 | |||||||||
| EMEA |
1,652 | 1,848 | 2,080 | |||||||||
| Asia-Pacific |
8,364 | 11,921 | 10,491 | |||||||||
|
|
|
|
|
|
|
|||||||
| Total intersegment sales |
$ | 24,429 | $ | 32,334 | $ | 29,464 | ||||||
|
|
|
|
|
|
|
|||||||
| Interest income |
||||||||||||
| PLP-USA |
$ | 0 | $ | 0 | $ | 0 | ||||||
| The Americas |
145 | 129 | 290 | |||||||||
| EMEA |
123 | 223 | 215 | |||||||||
| Asia-Pacific |
123 | 131 | 113 | |||||||||
|
|
|
|
|
|
|
|||||||
| Total interest income |
$ | 391 | $ | 483 | $ | 618 | ||||||
|
|
|
|
|
|
|
|||||||
| Interest expense |
||||||||||||
| PLP-USA |
$ | (440 | ) | $ | (427 | ) | $ | (305 | ) | |||
| The Americas |
(56 | ) | (130 | ) | (41 | ) | ||||||
| EMEA |
(23 | ) | (54 | ) | (68 | ) | ||||||
| Asia-Pacific |
(46 | ) | (47 | ) | (36 | ) | ||||||
|
|
|
|
|
|
|
|||||||
| Total interest expense |
$ | (565 | ) | $ | (658 | ) | $ | (450 | ) | |||
|
|
|
|
|
|
|
|||||||
| Income taxes |
||||||||||||
| PLP-USA |
$ | 2,387 | $ | 4,576 | $ | 6,032 | ||||||
| The Americas |
1,399 | 930 | 2,839 | |||||||||
| EMEA |
1,646 | 2,122 | 2,052 | |||||||||
| Asia-Pacific |
(401 | ) | 921 | 284 | ||||||||
|
|
|
|
|
|
|
|||||||
| Total income taxes |
$ | 5,031 | $ | 8,549 | $ | 11,207 | ||||||
|
|
|
|
|
|
|
|||||||
| Net income (loss) |
||||||||||||
| PLP-USA |
$ | 2,031 | $ | 7,233 | $ | 10,356 | ||||||
| The Americas |
3,178 | 2,647 | 6,415 | |||||||||
| EMEA |
4,881 | 6,192 | 6,047 | |||||||||
| Asia-Pacific |
(3,415 | ) | (3,211 | ) | (2,231 | ) | ||||||
|
|
|
|
|
|
|
|||||||
| Total net income |
$ | 6,675 | $ | 12,861 | $ | 20,587 | ||||||
|
|
|
|
|
|
|
|||||||
65
Table of Contents
| Year Ended December 31 | ||||||||||||
| 2015 | 2014 | 2013 | ||||||||||
| Expenditure for long-lived assets |
||||||||||||
| PLP-USA |
$ | 5,164 | $ | 7,673 | $ | 12,349 | ||||||
| The Americas |
2,074 | 4,788 | 3,020 | |||||||||
| EMEA |
1,673 | 1,375 | 2,573 | |||||||||
| Asia-Pacific |
1,843 | 3,827 | 3,092 | |||||||||
|
|
|
|
|
|
|
|||||||
| Total expenditures for long-lived assets |
$ | 10,754 | $ | 17,663 | $ | 21,034 | ||||||
|
|
|
|
|
|
|
|||||||
| Depreciation and amortization |
||||||||||||
| PLP-USA |
$ | 4,551 | $ | 4,521 | $ | 4,185 | ||||||
| The Americas |
1,862 | 2,464 | 2,052 | |||||||||
| EMEA |
1,464 | 1,790 | 1,792 | |||||||||
| Asia-Pacific |
3,655 | 4,082 | 4,059 | |||||||||
|
|
|
|
|
|
|
|||||||
| Total depreciation and amortization |
$ | 11,532 | $ | 12,857 | $ | 12,088 | ||||||
|
|
|
|
|
|
|
|||||||
| As of December 31 | ||||||||
| 2015 | 2014 | |||||||
| Identifiable assets |
||||||||
| PLP-USA |
$ | 106,854 | $ | 109,115 | ||||
| The Americas |
60,294 | 75,752 | ||||||
| EMEA |
51,006 | 51,691 | ||||||
| Asia-Pacific |
106,105 | 117,093 | ||||||
|
|
|
|
|
|||||
| 324,259 | 353,651 | |||||||
| Corporate assets |
314 | 316 | ||||||
|
|
|
|
|
|||||
| Total identifiable assets |
$ | 324,573 | $ | 353,967 | ||||
|
|
|
|
|
|||||
| Long-lived assets |
||||||||
| PLP-USA |
$ | 40,638 | $ | 41,131 | ||||
| The Americas |
14,937 | 19,451 | ||||||
| EMEA |
11,232 | 12,504 | ||||||
| Asia-Pacific |
25,158 | 29,445 | ||||||
|
|
|
|
|
|||||
| Total long-lived assets |
$ | 91,965 | $ | 102,531 | ||||
|
|
|
|
|
|||||
Note M -Related Party Transactions
On March 26, 2015, the Company purchased 1,290 common shares of the Company from Robert G. Ruhlman, at a price per share of $45.39, which was calculated from a 30-day average of market price. On November 30, 2015, the Company purchased 1,479 common shares of the Company from Robert G. Ruhlman, at a price per share of $41.50, which was calculated from a 30-day average of market price. Additionally, on December 8, 2015, the Company purchased 1,510 common shares of the Company from Robert G. Ruhlman, at a price per share of $40.83, which was calculated from a 30-day average of market price. Mr. Ruhlman is Chairman, President and CEO of the Company. The Audit Committee of the Board of Directors approved these transactions.
On August 11, 2015, the Company purchased 30,713 Common Shares of the Company from a trust for the benefit of Barbara P. Ruhlman and a foundation of which Barbara P. Ruhlman, Robert G. Ruhlman and Bernard Karr are officers, at a price per share of $35.00 which was calculated from a 30-day average of market price. Barbara P. Ruhlman is a member of the Company’s Board of Directors and the mother of Robert G. Ruhlman and grandmother of J. Ryan Ruhlman, both of whom are also members of the Board of Directors. The purchase was consummated pursuant to Share Purchase Agreements both dated August 11, 2015, between the Company and the foundation. The Audit Committee of the Board of Directors approved this transaction.
66
Table of Contents
J. Ryan Ruhlman has worked for the Company for over eleven years, was elected to the Company’s Board of Directors in July 2015 and as Vice President-Marketing and Business Development in December 2015. He is the son of Robert G. Ruhlman, Chairman, President and CEO of the Company, and grandson of Barbara P. Ruhlman, a member of the Board of Directors. He received $189,870 in reportable compensation for 2015 of which $33,725 is attributable to his 2015 award of stock options, and $153,273 in reportable compensation for 2014 of which $39,100 is attributable to his 2014 award of stock options, which amounts are in line with the Company’s compensation for mid-level managers.
On March 20, 2014, the Company purchased 2,098 common shares of the Company from Robert G. Ruhlman, at a price per share of $62.99, which was calculated from a 30-day average of market price. Mr. Ruhlman is Chairman, President and Chief Executive Officer (CEO) of the Company. The Audit Committee of the Board of Directors approved this transaction.
On August 14, 2014, the Company purchased 34,106 Common Shares of the Company from a trust for the benefit of Barbara P. Ruhlman and a foundation of which Barbara P. Ruhlman, Robert G. Ruhlman and Bernard Karr are officers, at a price per share of $54.83. Barbara P. Ruhlman is a member of the Company’s Board of Directors and the mother of Robert G. Ruhlman , who is also a member of the Board of Directors and Chairman, President and CEO of the Company. The purchase was consummated pursuant to Share Purchase Agreements both dated August 14, 2014, between the Company and the foundation. The Audit Committee of the Board of Directors approved these transactions.
On May 8, 2013, the Company purchased 2,500 common shares of the Company from J. Ryan Ruhlman, at a price per share of $76.98, which was calculated from a 30-day average of market price. On November 12, 2013, the Company purchased 3,200 common shares of the Company from J. Ryan Ruhlman, at a price per share of $78.91, which was calculated from a 30-day average of market price. Mr. Ruhlman is the son of Robert G. Ruhlman, Chairman, President and Chief Executive Officer (CEO) of the Company. The Audit Committee of the Board of Directors approved this transaction.
On May 8, 2013, the Company purchased 3,000 common shares of the Company from David C. Sunkle, at a price per share of $76.98, which was calculated from a 30-day average of market price. Additionally, on November 12, 2013, the Company purchased 1,000 common shares of the Company from David C. Sunkle, at a price per share of $78.91, which was calculated from a 30-day average of market price. Mr. Sunkle is an Officer of the Company. The Audit Committee of the Board of Directors approved these transactions.
On May 9, 2013, the Company purchased 9,757 Common Shares of the Company from a foundation of which Barbara P. Ruhlman, Robert G. Ruhlman and Bernard Karr are officers, at a price per share of $76.87. Barbara P. Ruhlman is a member of the Company’s Board of Directors and the mother of Robert G. Ruhlman who is also a member of the Board of Directors and Chairman, President and CEO of the Company. The purchase was consummated pursuant to a Shares Purchase Agreement dated May 9, 2013, between the Company and the foundation. The Audit Committee of the Board of Directors approved this transaction.
On November 12, 2013, the Company purchased 25,000 common shares of the Company from Robert G. Ruhlman, at a price per share of $78.91, which was calculated from a 30-day average of market price. Mr. Ruhlman is Chairman, President and CEO of the Company. The Audit Committee of the Board of Directors approved this transaction.
On November 12, 2013, the Company purchased 2,750 common shares of the Company from Dennis F. McKenna, at a price per share of $78.91, which was calculated from a 30-day average of market price. Mr. McKenna is an Officer of the Company. The Audit Committee of the Board of Directors approved this transaction.
On November 12, 2013, the Company purchased 2,500 common shares of the Company from J. Cecil Curlee, at a price per share of $78.91, which was calculated from a 30-day average of market price. Mr. Curlee is an Officer of the Company. The Audit Committee of the Board of Directors approved this transaction.
On November 12, 2013, the Company purchased 1,750 common shares of the Company from Caroline S. Vaccariello, at a price per share of $78.91, which was calculated from a 30-day average of market price. Mrs. Vaccariello is an Officer of the Company. The Audit Committee of the Board of Directors approved this transaction.
67
Table of Contents
The Company’s Australian subsidiary utilizes copper extrusion services from Cast Alloy. For the year ended December 31, 2015, 2014 and 2013, PLP-Australia incurred a total of $.2 million, $.1 million and $.1 million for these expenses, respectively. Cast Alloy is owned by Simi Almasan, Continuous Improvement Engineer, a current PLP employee. The Audit Committee of the Board of Directors approved these transactions.
The Company’s New Zealand subsidiary, Electropar currently leases two parcels of property, on which it has its corporate office, manufacturing and warehouse space. The entities leasing the property to Electropar are owned, in part, by Grant Wallace a Director. For each year ended December 31, 2015, 2014 and 2013, Electropar incurred a total of $.3 million annually for such lease expense. The Audit Committee of the Board of Directors approved these transactions.
The Company’s DPW operation rents two properties owned by RandReau Properties, LLC and RaRe Properties, LLC., which are owned by Kevin Goodreau, Vice President of Business Development – Solar Division, and Jeffrey Randall, Vice President of Product Design – Solar Division. For the year ended December 31, 2015, 2014 and 2013, DPW paid rent expense of $.2 million, $.2 million and $.3 million, respectively, for the properties. The Audit Committee of the Board of Directors approved these transactions.
The Company’s Belos operation hires temporary employees through a temporary work agency, Flex-Work Sp. Z.o.o., which is 50% owned by Agnieszka Rozwadowska. Agnieszka Rozwadowska is the wife of Piotr Rozwadowski, the Managing Director of the Belos operation located in Poland. For the year ended December 31, 2015, 2014 and 2013, Belos incurred a total of $.4 million, $.5 million and $.3 million, respectively, for such temporary labor expense. The Audit Committee of the Board of Directors approved these transactions.
Note N -Business Combinations
On January 31, 2014, the Company acquired Helix Uniformed Limited (Helix), located in Montreal, Quebec, Canada. From an accounting perspective, the acquisition is not considered material. The acquisition of Helix will diversify the Company’s business in Canada, expand its manufacturing footprint and enhance its engineering capabilities. The results of Helix are included in The Americas reportable segment. The values related to the acquisition have been finalized.
Note O – Product Warranty Reserve
The Company records an accrual for estimated warranty costs to Costs of products sold in the Consolidated Statements of Income. These amounts are recorded in Accrued expenses and other liabilities in the Consolidated Balance Sheets. The Company records and accounts for its warranty reserve based on specific claim incidents. Should the Company become aware of a specific potential warranty claim for which liability is probable and reasonably estimable, a specific charge is recorded and accounted for accordingly. Adjustments are made quarterly to the accruals as claim information changes.
The following is a rollforward of the product warranty reserve:
| 2015 | 2014 | 2013 | ||||||||||
| Balance at January 1 |
$ | 892 | $ | 1,140 | $ | 1,229 | ||||||
| Additions charged to costs and expenses |
74 | (45 | ) | 443 | ||||||||
| Warranty usage |
(158 | ) | (133 | ) | (475 | ) | ||||||
| Currency translation |
(94 | ) | (70 | ) | (57 | ) | ||||||
|
|
|
|
|
|
|
|||||||
| Balance at December 31 |
$ | 714 | $ | 892 | $ | 1,140 | ||||||
|
|
|
|
|
|
|
|||||||
68
Table of Contents
Note P - Quarterly Financial Information (unaudited)
The following table summarizes our results of operations for each of the quarters in 2015 and 2014:
| Quarter ended | ||||||||||||||||
| March 31 | June 30 | September 30 | December 31 | |||||||||||||
| 2015 |
||||||||||||||||
| Net sales |
$ | 85,790 | $ | 87,869 | $ | 89,046 | $ | 91,961 | ||||||||
| Gross profit |
24,760 | 26,444 | 26,159 | 26,089 | ||||||||||||
| Income (loss) before income taxes |
(59 | ) | 4,466 | 2,141 | 5,158 | |||||||||||
| Net income (loss) |
(256 | ) | 3,680 | 206 | 3,045 | |||||||||||
| Net income, basic |
$ | (0.05 | ) | $ | 0.68 | $ | 0.04 | $ | 0.58 | |||||||
| Net income, diluted |
$ | (0.05 | ) | $ | 0.68 | $ | 0.04 | $ | 0.58 | |||||||
| 2014 |
||||||||||||||||
| Net sales |
$ | 89,925 | $ | 99,981 | $ | 102,100 | $ | 96,179 | ||||||||
| Gross profit |
27,448 | 31,197 | 32,455 | 29,848 | ||||||||||||
| Income before income taxes |
4,137 | 7,606 | 5,294 | 4,373 | ||||||||||||
| Net income |
2,738 | 5,080 | 2,555 | 2,488 | ||||||||||||
| Net income, basic |
$ | 0.51 | $ | 0.94 | $ | 0.48 | $ | 0.46 | ||||||||
| Net income, diluted |
$ | 0.50 | $ | 0.94 | $ | 0.48 | $ | 0.46 | ||||||||
Note Q – Charges related to restructuring activities
During 2015, the Company reconfigured one of its operations within its Asia Pacific segment by reducing its workforce and manufacturing facilities while outsourcing its production predominantly to its locations with lower cost operations. This was done in response to a slowdown in economic activity in the region as well as continued downward market pressure on prices. Total costs related to this reconfiguration were $2.7 million. Additionally, the Company initiated a reconfiguration in the PLP-USA segment which was primarily a reduction in personnel and facilities in response to downward market pressure on prices. The total charges for the PLP-USA segment are anticipated to be $1.3 million. Both of these actions are expected to reduce infrastructure and manufacturing costs. The restructuring liability is recorded in Accrued compensation and amounts withheld from employees, Accrued expenses and other liabilities and Other noncurrent liabilities. These costs are included in Cost of products sold ($3.4 million), Research and engineering expense ($.1 million) and Other operating expense ($.5 million).
69
Table of Contents
A summary by reporting segment of the accruals recorded as a result of the restructuring is as follows:
| Severance | Lease Termination Costs |
Asset Disposals |
Other | Total | ||||||||||||||||
| December 31, 2014 Balance |
||||||||||||||||||||
|
|
|
|
|
|
|
|
|
|
|
|||||||||||
| Total |
$ | 0 | $ | 0 | $ | 0 | $ | 0 | $ | 0 | ||||||||||
|
|
|
|
|
|
|
|
|
|
|
|||||||||||
| Charges |
||||||||||||||||||||
| PLP-USA |
$ | 416 | $ | 402 | $ | 306 | $ | 166 | $ | 1,290 | ||||||||||
| Asia-Pacific |
1,232 | 1,241 | 188 | 0 | 2,661 | |||||||||||||||
|
|
|
|
|
|
|
|
|
|
|
|||||||||||
| Total |
1,648 | 1,643 | 494 | 166 | 3,951 | |||||||||||||||
| Payments and other adjustments |
||||||||||||||||||||
| PLP-USA |
(266 | ) | (98 | ) | (306 | ) | (161 | ) | $ | (831 | ) | |||||||||
| Asia-Pacific |
(1,232 | ) | (637 | ) | (188 | ) | 0 | (2,057 | ) | |||||||||||
|
|
|
|
|
|
|
|
|
|
|
|||||||||||
| Total |
(1,498 | ) | (735 | ) | (494 | ) | (161 | ) | (2,888 | ) | ||||||||||
| December 31, 2015 Balance |
||||||||||||||||||||
| PLP-USA |
150 | 304 | 0 | 5 | 459 | |||||||||||||||
| Asia-Pacific |
0 | 604 | 0 | 0 | 604 | |||||||||||||||
|
|
|
|
|
|
|
|
|
|
|
|||||||||||
| Total |
$ | 150 | $ | 908 | $ | 0 | $ | 5 | $ | 1,063 | ||||||||||
|
|
|
|
|
|
|
|
|
|
|
|||||||||||
| Item 9. | Changes in and Disagreements with Accountants on Accounting and Financial Disclosure |
None.
Item 9A. Controls and Procedures
Evaluation of Disclosure Controls and Procedures
The Company’s Principal Executive Officer and Principal Financial Officer have concluded based on their review thereof that the Company’s disclosure controls and procedures as defined in Rule 13a-15(e) or Rule 15d-15(e) of the Securities Exchange Act of 1934, as amended, were effective as of December 31, 2015.
Management’s Report on Internal Control Over Financial Reporting
The management of the Company is responsible for establishing and maintaining adequate internal control over financial reporting, as such term is defined in Exchange Act Rules 13a-15(f) and 15d-15(f). The Company’s internal control over financial reporting is a process designed to provide reasonable assurance regarding the reliability of financial reporting and preparation of the consolidated financial statements in accordance with generally accepted accounting principles.
Because of inherent limitations, internal control over financial reporting may not prevent or detect misstatements and even when determined to be effective, can only provide reasonable assurance with respect to financial statement preparation and presentation.
Management, with the participation of the Company’s Chief Executive Officer and Chief Financial Officer and Vice President of Finance, assessed the effectiveness of the Company’s internal control over financial reporting as of December 31, 2015. In making this assessment, management used the criteria set forth by the Committee of Sponsoring Organizations of the Treadway Commission (COSO) in Internal Control—Integrated Framework (2013).
70
Table of Contents
Based upon its assessment, management concluded that the Company’s internal control over financial reporting was effective as of December 31, 2015.
The effectiveness of the Company’s internal control over financial reporting as of December 31, 2015 has been audited by Ernst & Young LLP, an independent registered public accounting firm, who expressed an unqualified opinion as stated in their report, a copy of which is included below.
Changes in Internal Control Over Financial Reporting
There have not been any changes in the Company’s internal control over financial reporting (as defined in Rule 13a-15(f) and 15d-15(f)) during the quarter ended December 31, 2015 that materially affected, or is reasonably likely to materially affect, the Company’s internal control over financial reporting.
71
Table of Contents
Report of Independent Registered Public Accounting Firm
The Board of Directors and Shareholders
of Preformed Line Products Company
We have audited Preformed Line Products Company’s internal control over financial reporting as of December 31, 2015, based on criteria established in Internal Control—Integrated Framework issued by the Committee of Sponsoring Organizations of the Treadway Commission (2013 framework) (the COSO criteria). Preformed Line Products Company’s management is responsible for maintaining effective internal control over financial reporting, and for its assessment of the effectiveness of internal control over financial reporting included in the accompanying Management’s Report on Internal Control Over Financial Reporting. Our responsibility is to express an opinion on the company’s internal control over financial reporting based on our audit.
We conducted our audit in accordance with the standards of the Public Company Accounting Oversight Board (United States). Those standards require that we plan and perform the audit to obtain reasonable assurance about whether effective internal control over financial reporting was maintained in all material respects. Our audit included obtaining an understanding of internal control over financial reporting, assessing the risk that a material weakness exists, testing and evaluating the design and operating effectiveness of internal control based on the assessed risk, and performing such other procedures as we considered necessary in the circumstances. We believe that our audit provides a reasonable basis for our opinion.
A company’s internal control over financial reporting is a process designed to provide reasonable assurance regarding the reliability of financial reporting and the preparation of financial statements for external purposes in accordance with generally accepted accounting principles. A company’s internal control over financial reporting includes those policies and procedures that (1) pertain to the maintenance of records that, in reasonable detail, accurately and fairly reflect the transactions and dispositions of the assets of the company; (2) provide reasonable assurance that transactions are recorded as necessary to permit preparation of financial statements in accordance with generally accepted accounting principles, and that receipts and expenditures of the company are being made only in accordance with authorizations of management and directors of the company; and (3) provide reasonable assurance regarding prevention or timely detection of unauthorized acquisition, use or disposition of the company’s assets that could have a material effect on the financial statements.
Because of its inherent limitations, internal control over financial reporting may not prevent or detect misstatements. Also, projections of any evaluation of effectiveness to future periods are subject to the risk that controls may become inadequate because of changes in conditions, or that the degree of compliance with the policies or procedures may deteriorate.
In our opinion, Preformed Line Products Company maintained, in all material respects, effective internal control over financial reporting as of December 31, 2015, based on the COSO criteria.
We also have audited, in accordance with the standards of the Public Company Accounting Oversight Board (United States), the consolidated balance sheets of Preformed Line Products Company as of December 31, 2015 and 2014 and the related statements of consolidated income, comprehensive income (loss), shareholders’ equity and cash flows for each of the three years in the period ended December 31, 2015 and our report dated March 11, 2016 expressed an unqualified opinion thereon.
| /s/ Ernst & Young LLP |
| Cleveland, Ohio |
| March 11, 2016 |
72
Table of Contents
None
| Item 10. | Directors, Executive Officers and Corporate Governance |
The information required by this Item 10 is incorporated by reference to the information under the captions “Corporate Governance - Election of Directors”, “Section 16(a) Beneficial Ownership Compliance”, “Corporate Governance – Code of Conduct” and “Corporate Governance – Board and Committee Meetings – Audit Committee” in the Company’s Proxy Statement, for the Annual Meeting of Shareholders to be held May 10, 2016 (the “Proxy Statement”). Information relative to executive officers of the Company is contained in Part I of this Annual Report on Form 10-K.
| Item 11. | Executive Compensation |
The information set forth under the caption “Director and Executive Officer Compensation” in the Proxy Statement is incorporated herein by reference.
Item 12. Security Ownership of Certain Beneficial Owners and Management and Related Stockholder Matters
Other than the information required by Item 201(d) of Regulation S-K the information set forth under the caption “Security Ownership of Certain Beneficial Owners and Management” in the Proxy Statement is incorporated herein by reference. The information required by Item 201(d) of Regulation S-K is set forth in Item 5 of this report.
| Item 13. | Certain Relationships, Related Transactions and Director Independence |
The information set forth under the captions “Transactions with Related Persons” and “Election of Directors” in the Proxy Statement is incorporated herein by reference.
| Item 14. | Principal Accounting Fees and Services |
The information set forth under the captions “Independent Public Accountants”, “Audit Fees”, “Audit-Related Fees”, “Tax Fees” and “All Other Fees” in the Proxy Statement is incorporated herein by reference.
| Item 15. | Exhibits and Financial Statement Schedules |
| (a) | Financial Statements and Schedule |
| Page |
Financial Statements | |
| 40 |
Consolidated Balance Sheets | |
| 41 |
Statements of Consolidated Income | |
| 42 |
Statements of Consolidated Comprehensive Income (Loss) | |
| 43 |
Statements of Consolidated Cash Flows | |
| 44 |
Statements of Consolidated Shareholders’ Equity | |
| 45 |
Notes to Consolidated Financial Statements | |
| Page |
Schedule | |
| 78 |
II - Valuation and Qualifying Accounts | |
73
Table of Contents
| (b) | Exhibits |
| Exhibit |
Exhibit | |
| 3.1 | Amended and Restated Articles of Incorporation (incorporated by reference to the Company’s Registration Statement on Form 10). | |
| 3.2 | Amended and Restated Code of Regulations of Preformed Line Products Company (incorporated by reference to the Company’s Registration Statement on Form 10). | |
| 4 | Description of Specimen Share Certificate (incorporated by reference to the Company’s Registration Statement on Form 10). | |
| 10.1 | Preformed Line Products Company 1999 Employee Stock Option Plan (incorporated by reference to the Company’s Registration Statement on Form 10).* | |
| 10.2 | Preformed Line Products Company Officers Bonus Plan (incorporated by reference to the Company’s 10-K filed for the year ended December 31, 2007).* | |
| 10.3 | Preformed Line Products Company Executive Life Insurance Plan – Summary (incorporated by reference to the Company’s Registration Statement on Form 10).* | |
| 10.4 | Preformed Line Products Company Supplemental Profit Sharing Plan (incorporated by reference to the Company’s Registration Statement on Form 10).* | |
| 10.5 | Revolving Credit Agreement between National City Bank (now, PNC Bank, National Association) and Preformed Line Products Company, dated December 30, 1994 (incorporated by reference to the Company’s Registration Statement on Form 10). | |
| 10.6 | Amendment to the Revolving Credit Agreement between National City Bank (now, PNC Bank, National Association) and Preformed Line Products Company, dated October 31, 2002 (incorporated by reference to the Company’s 10-K filing for the year ended December 31, 2003). | |
| 10.7 | Line of Credit Note dated February 5, 2010 between the Company and PNC Bank, National Association (incorporated by reference to the Company’s 10-K filing for the fiscal year ended December 31, 2010). | |
| 10.8 | Amended and Restated Loan Agreement dated September 24, 2015 between the Company and PNC Bank, National Association, filed herewith. | |
| 10.9 | Preformed Line Products Company 1999 Employee Stock Option Plan Incentive Stock Option agreement (incorporated by reference to the Company’s 10-K filing for the year ended December 31, 2004).* | |
| 10.10 | Preformed Line Products Company Chief Executive Officer Bonus Plan (incorporated by reference to the Company’s 10-K filing for the year ended December 31, 2007).* | |
| 10.11 | Preformed Line Products Company Amended and Restated Long Term Incentive Plan of 2008 (incorporated by reference to the Company’s Definitive Proxy Statement filed on March 11, 2011).* | |
| 10.12 | Deferred Shares Plan (incorporated by reference to the Company’s 8-K current report filing dated August 21, 2008). | |
| 10.13 | Form of Restricted Shares Grant Agreement under the Amended and Restated Long Term Incentive Plan of 2008 (incorporated by reference to the Company’s 10-Q filing for the quarter ended September 30, 2008).* | |
| 10.14 | Form of Restricted Stock Unit Award Agreement under the Amended and Restated Long Term Incentive Plan of 2008 (incorporated by reference to the Company’s 10-K filing for the year ended December 31, 2013).* | |
| 10.15 | Form of Restricted Stock Unit Award Agreement under the Amended and Restated Long Term Incentive Plan of 2008 (incorporated by reference to the Company’s 10-K filing for the year ended December 31, 2014).* | |
| 10.16 | Shares Purchase Agreement, dated August 11, 2015, between the Company and the trustee under the Irrevocable Trust Agreement between Barbara P. Ruhlman and Bernard L. Karr dated July 29, 2008 (incorporated by reference to the Company’s Form 8-K filed on August 11, 2015). | |
| 10.17 | Shares Purchase Agreement, dated August 11, 2015, between the Company and the Thomas F. Peterson Foundation (incorporated by reference to the Company’s Form 8-K filed on August 11, 2015). | |
74
Table of Contents
| 10.18 | Form of Restricted Stock Agreement under the Amended and Restated Long Term Incentive Plan of 2008, filed herewith.* | |
| 10.19 | Form of Restricted Stock Unit Award Agreement under the Amended and Restated Long Term Incentive Plan of 2008, filed herewith.* | |
| 10.20 | Amendment to Amended and Restated Loan Agreement dated November 6, 2015 between the Company and PNC Bank, National Association, filed herewith. | |
| 14.1 | Preformed Line Products Company Code of Conduct (incorporated by reference to the Company’s 8-K current report filing dated August 6, 2007). | |
| 21 | Subsidiaries of Preformed Line Products Company, filed herewith. | |
| 23.1 | Consent of Ernst & Young LLP, Independent Registered Public Accounting Firm, filed herewith. | |
| 31.1 | Certification of the Principal Executive Officer, Robert G. Ruhlman, pursuant to Section 302 of the Sarbanes-Oxley Act of 2002, filed herewith. | |
| 31.2 | Certification of the Principal Financial Officer, Eric R. Graef, pursuant to Section 302 of the Sarbanes-Oxley Act of 2002, filed herewith. | |
| 32.1 | Certification of the Principal Executive Officer, Robert G. Ruhlman, pursuant to Section 906 of the Sarbanes-Oxley Act of 2002, furnished. | |
| 32.2 | Certification of the Principal Accounting Officer, Eric R. Graef, pursuant to Section 906 of the Sarbanes-Oxley Act of 2002, furnished. | |
| 101.INS | XBRL Instance Document. | |
| 101.SCH | XBRL Taxonomy Extension Schema Document. | |
| 101.CAL | XBRL Taxonomy Extension Calculation Linkbase Document. | |
| 101.DEF | XBRL Taxonomy Extension Definition Linkbase Document. | |
| 101.LAB | XBRL Taxonomy Extension Label Linkbase Document. | |
| 101.PRE | XBRL Taxonomy Extension Presentation Linkbase Document. | |
| * | Indicates management contracts or compensatory plan or arrangement. |
75
Table of Contents
Pursuant to the requirements of Section 13 or 15(d) of the Securities Exchange Act of 1934, the registrant has duly caused this registration statement to be signed on its behalf by the undersigned, thereunto duly authorized.
| Preformed Line Products Company | ||||
| March 11, 2016 | /s/ Robert G. Ruhlman | |||
| Robert G. Ruhlman | ||||
| Chairman, President and Chief Executive Officer | ||||
| (principal executive officer) | ||||
| March 11, 2016 | /s/ Eric R. Graef | |||
| Eric R. Graef | ||||
| Chief Financial Officer, Vice President - Finance and Treasurer | ||||
| (principal financial officer) | ||||
Pursuant to the requirements of the Securities Exchange Act of 1934, this report has been signed below by the following persons on behalf of the registrant in the capacity and on the dates indicated.
| March 11, 2016 | /s/ Robert G. Ruhlman | |||
| Robert G. Ruhlman | ||||
| Chairman, President and Chief Executive Officer | ||||
| March 11, 2016 | /s/ Barbara P. Ruhlman | |||
| Barbara P. Ruhlman | ||||
| Director | ||||
| March 11, 2016 | /s/ Glenn E. Corlett | |||
| Glenn E. Corlett | ||||
| Director | ||||
| March 11, 2016 | /s/ Michael E. Gibbons | |||
| Michael E. Gibbons | ||||
| Director | ||||
| March 11, 2016 | /s/ R. Steven Kestner | |||
| R. Steven Kestner | ||||
| Director | ||||
| March 11, 2016 | /s/ Richard R. Gascoigne | |||
| Richard R. Gascoigne | ||||
| Director | ||||
| March 11, 2016 | /s/ J. Ryan Ruhlman | |||
| J. Ryan Ruhlman | ||||
| Director | ||||
76
Table of Contents
PREFORMED LINE PRODUCTS COMPANY
SCHEDULE II – VALUATION AND QUALIFYING ACCOUNTS
Year Ended December 31, 2015, 2014 and 2013
(Thousands of dollars)
| For the year ended December 31, 2015: | Balance at beginning of period |
Additions charged to costs and expenses |
Deductions | Other additions or deductions (a) |
Balance at end of period |
|||||||||||||||
| Allowance for doubtful accounts |
$ | 1,943 | $ | 524 | $ | (414 | ) | $ | (182 | ) | $ | 1,871 | ||||||||
| Reserve for credit memos |
428 | 437 | (408 | ) | (2 | ) | 455 | |||||||||||||
| Slow-moving and obsolete inventory reserves |
9,183 | 2,477 | (1,509 | ) | 79 | 10,230 | ||||||||||||||
| Accrued product warranty |
892 | 74 | (158 | ) | (94 | ) | 714 | |||||||||||||
| Foreign net operating loss tax carryforwards |
3,614 | 2,105 | (287 | ) | (223 | ) | 5,209 | |||||||||||||
| For the year ended December 31, 2014: | Balance at beginning of period |
Additions charged to costs and expenses |
Deductions | Other additions or deductions (a) |
Balance at end of period |
|||||||||||||||
| Allowance for doubtful accounts |
$ | 1,441 | $ | 803 | $ | (260 | ) | $ | (41 | ) | $ | 1,943 | ||||||||
| Reserve for credit memos |
672 | 408 | (652 | ) | 0 | 428 | ||||||||||||||
| Slow-moving and obsolete inventory reserves |
8,075 | 2,244 | (701 | ) | (435 | ) | 9,183 | |||||||||||||
| Accrued product warranty |
1,140 | (45 | ) | (133 | ) | (70 | ) | 892 | ||||||||||||
| Foreign net operating loss tax carryforwards |
1,420 | 2,553 | (232 | ) | (127 | ) | 3,614 | |||||||||||||
| For the year ended December 31, 2013: | Balance at beginning of period |
Additions charged to costs and expenses |
Deductions | Other additions or deductions (a) |
Balance at end of period |
|||||||||||||||
| Allowance for doubtful accounts |
$ | 1,395 | $ | 419 | $ | (368 | ) | $ | (5 | ) | $ | 1,441 | ||||||||
| Reserve for credit memos |
644 | 418 | (390 | ) | 0 | 672 | ||||||||||||||
| Slow-moving and obsolete inventory reserves |
6,773 | 2,672 | (1,006 | ) | (364 | ) | 8,075 | |||||||||||||
| Accrued product warranty |
1,229 | 443 | (475 | ) | (57 | ) | 1,140 | |||||||||||||
| U.S. tax capital loss |
2,034 | 0 | (49 | ) | (1,985 | ) | 0 | |||||||||||||
| Foreign net operating loss tax carryforwards |
295 | 1,310 | (115 | ) | (70 | ) | 1,420 | |||||||||||||
| (a) | Other additions or deductions relate to translation adjustments and 2013 reflects the expiration of U.S. capital loss and certain foreign net operating loss carryforwards and 2014 reflects the expiration of certain foreign net operating loss carryforwards. |
77
Table of Contents
Exhibit Index
| 3.1 | Amended and Restated Articles of Incorporation (incorporated by reference to the Company’s Registration Statement on Form 10). | |
| 3.2 | Amended and Restated Code of Regulations of Preformed Line Products Company (incorporated by reference to the Company’s Registration Statement on Form 10). | |
| 4 | Description of Specimen Stock Certificate (incorporated by reference to the Company’s Registration Statement on Form 10). | |
| 10.1 | Preformed Line Products Company 1999 Employee Stock Option Plan (incorporated by reference to the Company’s Registration Statement on Form 10).* | |
| 10.2 | Preformed Line Products Company Officers Bonus Plan (incorporated by reference to the Company’s 10-K filing for the year ended December 31, 2007).* | |
| 10.3 | Preformed Line Products Company Executive Life Insurance Plan – Summary (incorporated by reference to the Company’s Registration Statement on Form 10).* | |
| 10.4 | Preformed Line Products Company Supplemental Profit Sharing Plan (incorporated by reference to the Company’s Registration Statement on Form 10).* | |
| 10.5 | Revolving Credit Agreement between National City Bank (now, PNC Bank, National Association) and Preformed Line Products Company, dated December 30, 1994 (incorporated by reference to the Company’s Registration Statement on Form 10). | |
| 10.6 | Amendment to the Revolving Credit Agreement between National City Bank (now, PNC Bank, National Association) and Preformed Line Products Company, dated October 31, 2002 (incorporated by reference to the Company’s 10-K filing for the year ended December 31, 2003). | |
| 10.7 | Line of Credit Note and Loan Agreement dated February 5, 2010 between the Company and PNC Bank, National Association (incorporated by reference to the Company’s 10-K filing for the fiscal year ended December 31, 2010). | |
| 10.8 | Amended and Restated Loan Agreement dated September 24, 2015 between the Company and PNC Bank, National Association, filed herewith. | |
| 10.9 | Preformed Line Products Company 1999 Employee Stock Option Plan Incentive Stock Option Agreement (incorporated by reference to the Company’s 10-K filing for the year ended December 31, 2004).* | |
| 10.10 | Preformed Line Products Company Chief Executive Officer Bonus Plan (incorporated by reference to the Company’s 10-K filing for the year ended December 31, 2007). | |
| 10.11 | Preformed Line Products Company Amended and Restated Long Term Incentive Plan of 2008 (incorporated by reference to the Company’s Definitive Proxy Statement filed on March 11, 2011).* | |
| 10.12 | Deferred Shares Plan (incorporated by reference to the Company’s 8-K current report filing dated August 21, 2008).* | |
| 10.13 | Form of Restricted Shares Grant Agreement under the Amended and Restated Long Term Incentive Plan of 2008 (incorporated by reference to the Company’s 10-Q filing for the quarter ended September 30, 2008).* | |
| 10.14 | Form of Restricted Stock Unit Award Agreement under the Amended and Restated Long Term Incentive Plan of 2008 (incorporated by reference to the Company’s 10-K filing for the year ended December 31, 2013).* | |
| 10.15 | Form of Restricted Stock Unit Award Agreement under the Amended and Restated Long Term Incentive Plan of 2008 (incorporated by reference to the Company’s 10-K filing for the year ended December 31, 2014).* | |
| 10.16 | Shares Purchase Agreement, dated August 11, 2015, between the Company and the trustee under the Irrevocable Trust Agreement between Barbara P. Ruhlman and Bernard L. Karr dated July 29, 2008 (incorporated by reference to the Company’s Form 8-K filed on August 11, 2015). | |
| 10.17 | Shares Purchase Agreement, dated August 11, 2015, between the Company and the Thomas F. Peterson Foundation (incorporated by reference to the Company’s Form 8-K filed on August 11, 2015). | |
| 10.18 | Form of Restricted Stock Agreement under the Amended and Restated Long Term Incentive Plan of 2008, filed herewith.* | |
78
Table of Contents
| 10.19 | Form of Restricted Stock Unit Award Agreement under the Amended and Restated Long Term Incentive Plan of 2008, filed herewith.* | |
| 10.20 | Amendment to Amended and Restated Loan Agreement dated November 6, 2015 between the Company and PNC Bank, National Association, filed herewith. | |
| 14.1 | Preformed Line Products Company Code of Conduct (incorporated by reference to the Company’s 8-K current report filing dated August 6, 2007). | |
| 21 | Subsidiaries of Preformed Line Products Company, filed herewith. | |
| 23.1 | Consent of Ernst & Young LLP, Independent Registered Public Accounting Firm, filed herewith. | |
| 31.1 | Certifications of the Principal Executive Officer, Robert G. Ruhlman, pursuant to Section 302 of the Sarbanes-Oxley Act of 2002, filed herewith. | |
| 31.2 | Certification of the Principal Financial Officer, Eric R. Graef, pursuant to Section 302 of the Sarbanes-Oxley Act of 2002, filed herewith. | |
| 32.1 | Certification of the Principal Executive Officer, Robert G. Ruhlman, pursuant to Section 906 of the Sarbanes-Oxley Act of 2002, furnished. | |
| 32.2 | Certification of the Principal Accounting Officer, Eric R. Graef, pursuant to Section 906 of the Sarbanes-Oxley Act of 2002, furnished. | |
| 101.INS | XBRL Instance Document. | |
| 101.SCH | XBRL Taxonomy Extension Schema Document. | |
| 101.CAL | XBRL Taxonomy Extension Calculation Linkbase Document. | |
| 101.DEF | XBRL Taxonomy Extension Definition Linkbase Document. | |
| 101.LAB | XBRL Taxonomy Extension Label Linkbase Document. | |
| 101.PRE | XBRL Taxonomy Extension Presentation Linkbase Document. | |
| * | Indicates management contracts or compensatory plan or arrangement. |
79