Attached files
| file | filename |
|---|---|
| EX-31.2 - EXHIBIT 31.2 - MATTSON TECHNOLOGY INC | mtsn20151231-ex312.htm |
| EX-32.1 - EXHIBIT 32.1 - MATTSON TECHNOLOGY INC | mtsn20151231-ex321.htm |
| EX-31.1 - EXHIBIT 31.1 - MATTSON TECHNOLOGY INC | mtsn20151231-ex311.htm |
| EX-21.1 - EXHIBIT 21.1 - MATTSON TECHNOLOGY INC | mtsn20151231-ex211.htm |
| EX-23.2 - EXHIBIT 23.2 - MATTSON TECHNOLOGY INC | mtsn20151231-ex232.htm |
| EX-23.1 - EXHIBIT 23.1 - MATTSON TECHNOLOGY INC | mtsn20151231-ex231.htm |
UNITED STATES SECURITIES AND EXCHANGE COMMISSION
Washington, D.C. 20549
_________________________________________________
FORM 10-K
__________________________________________________
[X] ANNUAL REPORT PURSUANT TO SECTION 13 OR 15(d) OF THE SECURITIES EXCHANGE ACT OF 1934
FOR THE FISCAL YEAR ENDED DECEMBER 31, 2015
OR
[ ] TRANSITION REPORT PURSUANT TO SECTION 13 OR 15(d) OF THE SECURITIES EXCHANGE ACT OF 1934
For the transition period from ________to _________
Commission file number 000-24838
____________________________________________________

MATTSON TECHNOLOGY, INC.
(Exact name of Registrant as Specified in its Charter)
____________________________________________________
Delaware | 77-0208119 | |
(State or Other Jurisdiction of Incorporation or Organization) | (I.R.S. Employer Identification Number) | |
47131 Bayside Parkway, Fremont, California 94538
(Address of Principal Executive Offices including Zip Code)
(510) 657-5900
(Registrant's Telephone Number, Including Area Code)
____________________________________________________________________________
Securities registered pursuant to Section 12(b) of the Act:
Title of each class | Name of each exchange on which registered | |
Common Stock, $.001 Par Value | NASDAQ Global Select Market | |
Preferred Share Purchase Rights | ||
Securities registered pursuant to Section 12(g) of the Act:
None
____________________________________________________
Indicate by check mark if the registrant is a well-known seasoned issuer, as defined in Rule 405 of the Securities Act. Yes ¨ No x
Indicate by check mark if the registrant is not required to file reports pursuant to Section 13 or Section 15(d) of the Act. Yes ¨ No x
Indicate by check mark whether the registrant (1) has filed all reports required to be filed by Section 13 or 15 (d) of the Securities Exchange Act of 1934 during the preceding 12 months (or for such shorter period that the registrant was required to file reports), and (2) has been subject to such filing requirements for the past 90 days. Yes x No ¨
Indicate by check mark whether the registrant has submitted electronically and posted on its corporate Web site, if any, every Interactive Data File required to be submitted and posted pursuant to Rule 405 of Regulation S-T (§232.405 of this chapter) during the preceding 12 months (or for such shorter period that the registrant was required to submit and post such files). Yes x No ¨
Indicate by check mark if disclosure of delinquent filers pursuant to Item 405 of Regulation S-K (§229.405 of this chapter) is not contained herein, and will not be contained, to the best of registrant's knowledge, in definitive proxy or information statements incorporated by reference in Part III of this Form 10-K or any amendment to this Form 10-K. ¨
Indicate by check mark whether the registrant is a large accelerated filer, an accelerated filer, a non-accelerated filer or a smaller reporting company. See definitions of "large accelerated filer," "accelerated filer" and "smaller reporting company" in Rule 12b-2 of the Exchange Act. (Check one):
Large accelerated filer | ¨ | Accelerated filer | x | Non-accelerated filer | ¨ | Smaller reporting company | ¨ |
(Do not check if a smaller reporting company) | |||||||
Indicate by check mark whether the registrant is a shell company (as defined in Rule 12b-2 of the Exchange Act). Yes ¨ No x
As of June 28, 2015, the aggregate market value of the common stock of the registrant held by non-affiliates was approximately $257,678,608 based on the closing sale price for the registrant's common stock reported by the NASDAQ Global Select Market on that date.
There were 75,602,144 shares of the registrant’s common stock issued and outstanding as of the close of business on March 4, 2016.
DOCUMENTS INCORPORATED BY REFERENCE
As noted herein, the information called for by Part III is incorporated by reference to specified portions of the Registrant's definitive proxy statement to be filed in conjunction with the Registrant's 2016 Annual Meeting of Stockholders, if held, which is expected to be filed not later than 120 days after the Registrant's fiscal year ended December 31, 2015. If the definitive proxy statement is not filed within such time-frame, the Registrant will file an amendment to this Form 10-K to set forth the information required by Part III of this Report, to the extent not set forth herein.
MATTSON TECHNOLOGY, INC.
FORM 10-K
FOR THE YEAR ENDED DECEMBER 31, 2015
TABLE OF CONTENTS
Page | ||
Item 1. | ||
Item 1A. | ||
Item 1B. | ||
Item 2. | ||
Item 3. | ||
Item 4. | ||
Item 5. | ||
Item 6. | ||
Item 7. | ||
Item 7A. | ||
Item 8. | ||
Item 9. | ||
Item 9A. | ||
Item 9B. | ||
Item 10. | ||
Item 11. | ||
Item 12. | ||
Item 13. | ||
Item 14. | ||
Item 15. | ||
Schedule II. | ||
1
FORWARD‑LOOKING STATEMENTS
This Annual Report on Form 10-K contains forward‑looking statements, which are subject to the Safe Harbor provisions created by the Private Securities Litigation Reform Act of 1995. These forward‑looking statements are based on management's current expectations and beliefs, including estimates and projections about our industry. Forward-looking statements typically are identified by use of terms such as "anticipates," "expects," "intends," "plans," "seeks," "estimates," "believes" and similar expressions, although some forward-looking statements are expressed differently. Our forward-looking statements may include statements that relate to: our proposed merger with Beijing E-town Dragon Semiconductor Industry Investment Center; our future net revenue, earnings, cash flow and cash position; growth of the industry and the size of our served available market; market demand for our products; the timing of significant customer orders for our products; our ability to attract new customers, customer acceptance of delivered products and our ability to collect amounts due upon shipment and upon acceptance; end-user demand for semiconductors, including the growing mobile device industry; customer demand for semiconductor manufacturing equipment; our ability to timely manufacture, deliver and support ordered products; our ability to bring new products to market, to gain market share with such products and the overall mix of our products; our ability to generate significant net revenue; customer rate of adoption of new technologies; risks inherent in the development of complex technology; the timing and competitiveness of new product releases by our competitors; margins; product development plans and levels of research, development and engineering activity; our ability to align our cost structure with market conditions, including operating expenses, and our quarterly break-even point; tax expenses; excess inventory reserves, including the level of our vendor commitments compared to our requirements; economic conditions in general and in our industry; our dependence on international sales and our expectation of growth in international markets; the impact of any litigation or investigation on our operating results or financial position; any offering and sale of securities pursuant to our shelf registration statement or otherwise; volatility in our stock price; the sufficiency of our financial resources, including availability under our revolving credit agreement, to support future operations and capital expenditures and the availability of all financing resources; compliance with financial covenants related to our revolving credit facility and our control environment including our disclosure control and procedures, internal control over our financial reporting, and any related remediation efforts. These statements are not guarantees of future performance and are subject to numerous risks, uncertainties and assumptions that are difficult to predict. Such risks and uncertainties include those set forth in Item 1A. “Risk Factors” in this Annual Report on Form 10-K. Our actual results could differ materially from those anticipated by these forward-looking statements. The forward-looking statements in this report speak only as of the time they are made and do not necessarily reflect our outlook at any other point in time. We undertake no obligation to update publicly any forward-looking statements, whether as a result of new information, future event, or for any other reason. However, readers should carefully review the risk factors set forth in other reports or documents we file from time to time with the Securities and Exchange Commission.
As used herein, “Mattson Technology,” the “Company,” “we,” “our,” and similar terms include Mattson Technology, Inc. and its subsidiaries, unless the context indicates otherwise.
2
PART I
Item 1. Business
Overview of Mattson Technology
We design, manufacture, market and globally support semiconductor wafer processing equipment used in the fabrication of integrated circuits ("ICs" or chips). We are a key supplier of plasma and rapid thermal processing equipment to the global semiconductor industry, and operate in four primary product sectors: dry strip, etch, conventional rapid thermal processing ("RTP") and millisecond anneal ("MSA"). Our manufacturing equipment utilizes innovative technologies to deliver advanced processing capabilities and high productivity for the fabrication of current- and next-generation ICs.
In 2015, we focused on expanding the installed base of each of our major products. Our etch products, specifically our paradigmE XP systems, continue to run high volume production in advanced DRAM, NAND and 3D-NAND wafer fabs. The combination of the paradigmE XP’s technical capabilities and high productivity have established an etch market position in the memory segment. Our conventional RTP product, the Helios XP, has established industry leading technical performance in 20 nanometer foundry/logic and memory volume production sites with its dual side wafer heating and differential thermal energy control. Our millisecond anneal system, the Millios, is running advanced foundry/logic volume production at multiple manufacturing sites. The Millios, with our proprietary arc lamp technology, achieves leading device performance as well as higher production throughput and system availability. Our dry strip products continue to make a steady contribution to our business as our established customers in foundry/logic and memory continue to make investments.
Our customer base includes memory, foundry and logic device manufacturers. We have a global sales and support organization focused on developing strong, long-term customer relationships. We have a design and manufacturing center in the United States and we have a design and manufacturing facility in Germany. Our customer sales and support teams are located in Korea, Japan, Taiwan, China, Germany, Singapore and the United States.
We were incorporated in California in 1988 and reincorporated in Delaware in 1997. Our principal executive office is located at 47131 Bayside Parkway, Fremont, CA 94538. Our telephone number is (510) 657-5900.
Recent Developments
On December 1, 2015, we entered into an Agreement and Plan of Merger (the “Merger Agreement”) with Beijing E-town Dragon Semiconductor Industry Investment Center (Limited Partnership), a People's Republic of China ("PRC") limited partnership (“Parent”), providing for the merger of an indirect subsidiary of Parent (“Merger Sub”) with and into Mattson (the “Merger”), with Mattson surviving the Merger as a subsidiary of Parent (the “Surviving Corporation”). The Merger Agreement was unanimously approved by our Board of Directors.
Pursuant to the terms and subject to the conditions of the Merger Agreement, at the Effective Time of the Merger, each share of our common stock, par value $0.001 per share, outstanding immediately prior to the Effective Time will be cancelled and automatically converted into the right to receive $3.80 in cash, without interest, excluding any shares owned by us, Parent or Merger Sub or any of their respective wholly-owned subsidiaries (which will be cancelled) and any shares with respect to which appraisal rights have been properly exercised under Delaware law.
The closing of the Merger is subject to the adoption of the Merger Agreement by the affirmative vote of holders of a majority of the outstanding shares of our common stock. The obligations of the parties to consummate the Merger are also subject to the satisfaction (or waiver, if applicable) of various customary conditions, including (i) the expiration or termination of the applicable waiting period under the Hart-Scott-Rodino Antitrust Improvements Act of 1976, as amended, (ii) filings and approvals with or by certain governmental authorities, including governmental authorities in the PRC and Taiwan, (iii) the absence of certain governmental orders prohibiting the Merger, (iv) the accuracy of the representations and warranties of each party contained in the Merger Agreement (subject to certain materiality qualifications) and (v) each party’s compliance with or performance of the covenants and agreements in the Merger Agreement in all material respects.
See Note 4. Business Combinations in the notes to the consolidated financial statements included in this Annual Report on Form 10-K for additional details related to the pending Merger.
3
Industry Background
The manufacture of ICs is a highly complex process with hundreds of individual processing steps, many of which are performed multiple times until the IC is complete and fully functional. To build an IC, transistors are created on the surface of the silicon wafer, and then microscopically wired together by means of interconnecting metal layers. The steps require the wafer to be subjected to a tightly controlled series of chemical, thermal and photolithographic processes, resulting in the formation of millions, and in some cases billions, of transistors per IC and thousands of ICs on a single wafer.
Over the last four decades, the semiconductor industry has been able to uphold Moore's Law, which postulates that the number of transistors on a chip doubles approximately every 18 to 24 months. The process of reducing feature sizes will continue as the demand for smaller and faster electronic devices increases. Producing smaller features cost-effectively, while avoiding functional restrictions, has driven development of 3-dimensional IC technologies such as finFET transistors and 3D NAND memory arrays. These developments increase manufacturing complexity and create the need for manufacturing equipment with more precise process control capability, increased reliability, low defect rates and high productivity. The increased difficulty of achieving transistor performance at advanced nodes has made high yields important in selecting process equipment. Semiconductor manufacturers demand systems that can achieve consistent, reliable and repeatable process results within critical tolerance limits while still achieving desired throughput rates.
Consumer Electronics Driving Industry Growth
The introduction of connected devices categorized as "Internet of Things" ("IoT"), is expected to continue growing the overall consumer electronic market, thereby increasing the mobile microprocessor, DRAM memory and NAND memory demand in the coming years. Mobile processor ICs allow lower power operation and streamlined operating systems required to deliver the long battery life and fast application switching on today's products. At the memory level, the mobility era requires faster mobile DRAM technology than the traditional DRAM requirements and larger memory capacity NAND for long-term file storage. IoT and connected mobile devices, with embedded internet access capabilities, are driving an increase in improved wireless technology and cloud computing.
Mattson has prepared for this shift, with concerted efforts to build upon our existing dry strip positions in memory and foundry/logic, and to expand our etch, conventional RTP and MSA products into these same memory and foundry/logic customer accounts.
Our Strategy
Our core competency is the ability to deliver leading-edge wafer processing at leading productivity levels to provide our customers with the most cost-effective manufacturing solution. Our tools are selected at the leading technology companies and are in full production at advanced semiconductor manufacturing, including DRAM, NAND and foundry/logic manufacturing companies.
Semiconductor manufacturers demand processes that deliver results with an unprecedented level of precision. We work closely with our customers, supply chain vendors and technology partners to deliver on these demands. An important element of our growth strategy is our commitment to technology leadership in the markets we serve. We plan to extend our market by developing robust processing solutions that provide semiconductor manufacturers with technology, productivity and total cost of ownership advantages. Investments in research and development have enabled us to make process improvements and product innovations that we believe are ahead of current device requirements.
4
Markets, Applications and Products
Dry Strip
Dry strip is the removal of the masking layers from the wafer after the patterning process has been completed for that step of IC manufacturing. The objective is to eliminate the masking material from the wafer as quickly as possible, without allowing any surface materials to become damaged.
We continue to be a leader in the dry strip market. Our SUPREMA strip systems utilize an innovative wafer handling architecture to deliver low cost of ownership for IC manufacturing. The SUPREMA features our patented Faraday-Shielded inductively coupled plasma ("ICP") technology offering superior resist dry strip capability to leading edge memory and foundry/logic customers. Our product development focus has been to develop incremental enhancements to enable dry strip of advanced materials and for advanced 3-dimensional IC structures. The SUPREMA XP is the result of this development and is installed at many global semiconductor companies for production and process development of advanced 3D devices.
Etch
Etching is the process of selectively removing mask patterned materials from the wafer's surface to create desired patterns on the wafer's surface. Plasma etch is the use of a radio frequency ("RF") excited plasma to produce chemically reactive species from various gases. The reactive plasma is exposed to the wafer surface and etches away the material not protected by a masking layer.
Our plasma etch products, the paradigmE and Alpine, are built on our high-throughput platform to provide high overall equipment efficiency. Our plasma etch products feature proprietary Faraday-Shielded ICP plasma source combined with etch bias control. Our paradigmE XP etch system, with a unique dual ICP source, allows enhanced on-wafer performance to meet the increasingly stringent technology requirements for sub-20 nanometer and 3D device production. The paradigmE and Alpine systems are installed at global semiconductor companies for production and process development at advanced memory and foundry/logic wafer fabs.
Rapid Thermal Processing (conventional)
Conventional RTP refers to a semiconductor manufacturing process that heats silicon wafers to high temperatures (up to 1200°C or greater) using high intensity lamps on a timescale of several seconds or less to set the electrical properties of the semiconductor devices. RTP consists of heating a single wafer at a time in order to affect its electrical properties. The single-wafer approach allows for faster wafer processing with shorter annealing times from less than one second to three minutes, and more precise control of the annealing profile and ambient processing parameters on the wafer.
Our Helios XP product continues to run high-volume production for DRAM, NAND and foundry customers. The Helios XP is established in industry leading IC production for 20 nanometer and below based on its dual side wafer heating and differential thermal energy control ("DTEC"). The Helios XP system's temperature control architecture specifically aims at addressing advanced logic processing requirements, through its differentiated capabilities. Mattson serves major foundry/logic customers who have purchased the Helios XP beyond the 20 nanometer technology node.
Millisecond Anneal
MSA refers to a semiconductor manufacturing process that heats silicon wafers to high temperatures (up to 1200°C or greater) on a millisecond timescale of 10 milliseconds or less to set the electrical properties of the semiconductor devices. MSA consists of rapidly heating the top surface of a wafer for extremely short times in order to affect its electrical properties only near that top surface without increasing the temperature of the rest of the wafer which could cause adverse effects on the overall IC device performance.
Millios, which features a patented arc lamp technology capable of greatly reducing thermal cycle time, is designed to enable our customers to meet advanced gate anneal and activation process requirements at the 20 nanometer technology node and beyond. MSA is required for key processes in most advanced technology nodes where the high temperature exposure requires less than a tenth of a second. The capability to control anneal times in the millisecond time regime, has enabled leading foundry/logic customers to improve transistor performance in sub-20 nanometer technology nodes. The Millios system has been qualified and released for sub-20 nanometer high volume advanced foundry/logic production at multiple manufacturing sites.
5
Research, Development and Engineering
The semiconductor equipment industry is characterized by rapid technological change and product innovation. To be successful and competitive we continuously and aggressively develop more advanced processes and process integration solutions for our customers. The products that we develop and market allow our customers to address their advanced requirements. Only by continuously striving to develop new intellectual property ("IP") for processes and hardware, we can maintain and advance our competitive position in the markets we serve. Accordingly, we devote a significant portion of our resources to research, development and engineering programs. We seek to maintain close relationships with our global customers and to remain responsive to their product and processing needs.
In plasma etch, we continued to extend the features and capabilities of our etch product offerings and expand the system's etch applications portfolio to include a new set of processes, focused on finFET and 3-dimensional IC technologies. The enhancements of the plasma source in the paradigmE XP have enabled process capabilities for the most demanding advanced DRAM and 3D NAND memory technologies. The paradigmE and paradigmE XP are released for production in all segments of our customer base: foundry/logic, DRAM and NAND manufacturers. In addition, our etch products are enabling development of leading-edge technologies while maintaining our focus on cost of ownership for our customers.
We have continued to extend the capability of our latest-generation RTP tools for 20 nanometer technology requirements and beyond. Improved tool reliability and productivity are helping reduce our customers' cost of ownership. For Helios XP, we successfully engineered capabilities for more precise temperature measurement, as well as for low temperature processing. We also have developed and introduced the DTEC capability to specifically address the pattern loading effect for pattern independent processing, an increasing problem below 40 nanometer logic processing. These innovative engineering improvements enable the formation of silicide and ultra-shallow junction ("USJ") for the most advanced devices.
We continue to work closely with leading device manufacturers to demonstrate Millios' process and manufacturing advantages. Based on the system's high throughput, stability and reliability, these customers qualified and released the Millios for sub-20 nanometer high volume advanced foundry/logic production at multiple manufacturing sites.
Our SUPREMA strip system, which incorporates our Faraday Shielded ICP RF source and an innovative, high-productivity platform, continues to set new standards for technology and cost of ownership in the industry. The SUPREMA has become a requirement for processing of leading-edge logic devices and is being put into production at 28 nanometer and 20 nanometer technology nodes. In response to the industry's continued demand for higher productivity coupled with advanced processing technology, we continued to improve the performance of our SUPREMA throughout the year.
We maintain applications development and engineering laboratories in California and Germany to address new tool and process development activities and customer specific requirements. Our research, development and engineering expenses were $18.8 million in 2015, $19.4 million in 2014 and $16.9 million in 2013, representing as a percentage of net revenues 11 percent, 11 percent and 14 percent, respectively.
Intellectual Property
We rely on a combination of patent, copyright, trademark and trade secret laws, non-disclosure agreements and other IP protection methods to protect our proprietary technology. We hold a number of U.S. patents and corresponding foreign patents, and have a number of patent applications pending covering various aspects of our products and processes. We also have licensed a small number of patents and where appropriate, we intend to file additional patent applications on inventions resulting from our ongoing research, development and engineering activities to grow and strengthen all of our individual product IP portfolios.
As is customary in our industry, from time to time we receive or make inquiries regarding possible infringement of patents or other IP rights. Although there are no pending claims against us regarding infringement of any existing patents or other IP rights or any unresolved notices that we are infringing IP rights of others, such infringement claims could be asserted against us, or our suppliers, by third parties in the future. Any claims, with or without merit, could be time-consuming, result in costly litigation, result in loss or cancellation of customer orders, cause product shipment delays, subject us to significant liabilities to third parties, require us to enter into royalty or licensing agreements or prevent us from manufacturing and selling our products. If our products were found to infringe a third party's proprietary rights, we could be required to enter into royalty or licensing agreements in order to continue to sell our products. Royalty or licensing agreements, if required, may not be available on terms acceptable to us, if at all, which could seriously harm our business. Our involvement in any patent or other IP dispute or action to protect trade secrets and know-how could have a material adverse effect on our business.
6
Competition
The global semiconductor equipment industry is intensely competitive and is characterized by rapid technological change and demanding customer service requirements. Our ability to compete depends upon our ability to continually improve products, processes and services, and our ability to develop new products that meet constantly evolving customer requirements.
Substantial capital investments are required by semiconductor manufacturers to install and integrate new processing equipment into a semiconductor production line. As a result, once a semiconductor manufacturer has selected a particular supplier's products, the manufacturer often relies upon that equipment for the specific production line application, and frequently will attempt to consolidate its other capital equipment requirements with the same supplier. Accordingly, it is difficult for a competitor to sell to a customer for a significant period of time in the event a customer has selected our product. It also may be difficult for us to replace an existing relationship that a potential customer has with a competitor.
Each of our product lines competes in markets defined by the particular IC fabrication process it performs. In each of these markets, we have multiple competitors. At present, however, no single competitor competes with us in all of the process areas in which we serve. Competitors in a given technology tend to have different degrees of market presence in the various regional geographic markets. Competition is based on many factors, primarily technological innovation; productivity; total cost of ownership of the systems, including yield, price, product performance and throughput capability; quality; contamination control; reliability and customer support. We believe that our competitive position in each of our markets is based on the ability of our products and services to address customer requirements related to these competitive factors.
Our principal competitors in the dry strip market include Lam Research Corporation and PSK, Inc. Principal competitors for our thermal annealing systems are Applied Materials, Inc., Dainippon Screen Manufacturing Company and Ultratech, Inc. Principal competitors for our etch systems include Applied Materials, Inc., Lam Research Corporation and Tokyo Electron Limited.
Customers
In 2015, Samsung Electronics, Ltd. ("Samsung") and Global Foundries combined represented approximately 65 percent of total net revenue, and each customer individually represented greater than 10 percent of total net revenue. In 2014, Samsung represented approximately 61 percent of our total net revenue. In 2013, Taiwan Semiconductor Manufacturing Company, Ltd. ("TSMC") and Samsung combined represented approximately 68 percent of total net revenue, and each customer individually represented greater than 10 percent of total net revenue. For each of the years ended December 31, 2015, 2014 and 2013, our three largest customers accounted for approximately 74 percent, 76 percent and 73 percent of our net revenue, respectively.
The percentage of net revenue from our ten largest customers for the years ended December 31 are as follows:
2015 | 2014 | 2013 | |||
Percentage of net revenue from our ten largest customers | 93% | 94% | 90% | ||
The following table summarizes net revenue by geographic areas based on the installation locations of the systems and the location of services rendered (in thousands):
Year Ended December 31, | ||||||||||||
2015 | 2014 | 2013 | ||||||||||
Net revenue: | ||||||||||||
United States | $ | 25,061 | $ | 25,716 | $ | 12,350 | ||||||
Korea | 73,798 | 87,585 | 22,173 | |||||||||
Taiwan | 17,537 | 32,304 | 50,782 | |||||||||
China | 29,209 | 17,369 | 20,250 | |||||||||
Other Asia | 19,560 | 6,869 | 8,740 | |||||||||
Europe and others | 7,367 | 8,561 | 5,139 | |||||||||
$ | 172,532 | $ | 178,404 | $ | 119,434 | |||||||
7
Sales and Marketing
Our sales and marketing efforts are focused on building long-term relationships with our customers. We sell our systems primarily through our direct sales force and distribution agreements in certain regions and countries. Our sales and marketing personnel work closely with our customers to develop solutions to meet their processing needs. In addition to the direct sales force residing in our Fremont, California headquarters and other locations in the United States, we also have sales and support offices in Korea, Taiwan, China, Germany and Singapore. We maintain a relationship with Canon Marketing, Japan for the distribution and support of our products in Japan. We also have a sales representative relationship with Sullevon Pte Ltd in Singapore to expand our sales coverage into markets such as back-end wafer-level packaging.
International sales accounted for 85 percent of our total net revenue in 2015, 86 percent of our total net revenue in 2014 and 90 percent of our total net revenue in 2013. We anticipate that international sales will continue to account for a significant portion of our future total net revenue. Asia remains a particularly important region for our business. Our sales to customers located in Asia accounted for 81 percent of our total net revenue in 2015, 81 percent of our total net revenue in 2014 and 85 percent of our total net revenue in 2013. Our foreign sales are subject to certain governmental regulations, including the Export Administration Act.
Customer Support
One of our primary goals is to build strong and productive partnerships with our customers. Our customer support organization is headquartered in Fremont, California, with additional resources located in Korea, Taiwan, China, Germany, Singapore and the United States. We also maintain a relationship with Canon Marketing, Japan for the distribution and support of our products in Japan. Our global support infrastructure is composed of a network of product and process technologists, along with experienced field service teams with diverse technical backgrounds in mechanical and electronics engineering. After-sales support is an essential part of our customer service program, and our international customer support teams provide the following services: system installation, on-site repair, telephone support, used tool refurbishment, relocation services, process development applications and upgrades for extending the useful life and value of our products.
We offer warranties on all of our products. We maintain spare parts depots, consignment locations at customer sites and local support in most regions. As part of our global support services, we also offer technical training courses, from maintenance and service training to basic and advanced applications and operation. We also are engaged with our customers to collaborate on product and process development, with a focus on improving the integration of our products into the customer's manufacturing process and increase the level of customer support.
Backlog
We schedule production of our systems based on both backlog and regular sales forecasts. For several of our key customers, we typically receive orders within the quarter of the scheduled shipment. We include in backlog only those systems for which we have accepted purchase orders and assigned shipment dates within the next 12 months. Orders may be subject to cancellation or delay by the customer with limited or no penalty. Our system backlog was $7.9 million as of December 31, 2015, $21.1 million as of December 31, 2014 and $9.7 million as of December 31, 2013. Because of possible future changes in delivery schedules and cancellations of orders, our backlog at any particular date is not necessarily representative of actual sales to be expected for any succeeding period. During periods of industry downturn, we have experienced cancellations, delays and push-outs of orders that were previously included in backlog.
Manufacturing
We have direct manufacturing operations in the United States and Germany. Our direct manufacturing operations consist of procurement, assembly, test, quality assurance and/or manufacturing engineering. Our direct manufacturing teams are an integral part of our new product development process, working closely with our engineering teams to ensure that new products meet design-for-manufacturability, cost and quality targets. We have established sales and operations planning processes and systems to manage our production capacity and inventory levels and quickly respond to fluctuating market demands.
8
Long-Lived Assets
Geographical information relating to our property and equipment, net, as of December 31 was as follows (in thousands):
2015 | 2014 | ||||||
Property and equipment, net: | |||||||
United States | $ | 3,350 | $ | 4,140 | |||
Germany | 4,712 | 3,185 | |||||
Others | 174 | 209 | |||||
$ | 8,236 | $ | 7,534 | ||||
Employees
As of December 31, 2015, we had 299 employees. The success of our future operations will depend in large part on our ability to recruit and retain qualified employees, particularly those highly-skilled design, process and test engineers involved in the manufacture of existing systems and the development of new systems and processes. In Germany, some of our employees are represented by a labor union and the majority of our employees are represented by a workers' councils. None of our employees at other locations are represented by a labor union, and we have never experienced a work stoppage, slowdown or strike.
Environmental Matters
We are subject to international, Federal, state and local environmental laws, rules and regulations. These laws, rules and regulations govern the transport, receipt, storage, use, treatment, discharge and disposal of hazardous and non-hazardous chemicals and wastes during manufacturing, research and development and sales demonstrations. Neither compliance with international, Federal, state and local provisions regulating discharge of materials into the environment, nor remedial agreements or other actions relating to the environment have had, or are expected to have, a material effect on our capital expenditures, financial condition, results of operations or competitive position. However, if we fail to comply with applicable regulations, we could be subject to substantial liability for cleanup efforts, personal injuries, fines or suspension or cessation of our operations.
Available Information
We file reports required of public companies with the U.S. Securities and Exchange Commission ("SEC"). These include annual reports on Form 10-K, quarterly reports on Form 10-Q, current reports on Form 8-K, proxy statements and other reports, and amendments to these reports or statements. The public may read and copy the materials we file with the SEC at the SEC's Public Reference Room at 100 F Street, N.E., Washington, D.C. 20549. The public may obtain information on the operation of the Public Reference Room by calling the SEC at 1-800-SEC-0330. The SEC also maintains a website (www.sec.gov) that contains reports, proxy and information statements, and other information regarding issuers that file electronically with the SEC. We make available free of charge on the Investor Relations section of our corporate website (http://www.mattson.com) all of the reports we file with or furnish to the SEC as soon as reasonably practicable after the reports are filed or furnished. Additional information about us is available on our website at http://www.mattson.com. The information on our website is not incorporated herein by reference and is not a part of this Form 10-K. We make available free of charge on our corporate website our Annual Report on Form 10-K, Quarterly Reports on Form 10-Q and Current Reports on Form 8-K, and any amendments to those reports filed or furnished pursuant to Section 13(a) or 15(d) of the Securities Exchange Act of 1934, as soon as reasonably practicable after those reports are electronically filed with, or furnished to, the SEC. To access these filings, go to our website, click on "Investors" and then click on "SEC Filings" on the ribbon on the left under the "Financial Information" heading. From time to time, we may use our website as a channel of distribution of material company information. Our financial and other material information is routinely posted on and accessible at http://ir.mattson.com/
9
ITEM 1A. Risk Factors
Because of the following factors, as well as other variables affecting our operating results, cash flows and financial condition, past financial performance may not be a reliable indicator of future performance, and historical trends should not be used to anticipate results or trends in future periods. Other events that we do not currently anticipate or that we currently deem immaterial also may affect our results of operations, cash flows and financial condition.
We are dependent on a highly concentrated customer base, and any delays, reduction or cancellation of purchases by these customers could harm our business. Additionally, we may not achieve anticipated revenue levels if we are not selected as “vendor of choice” for new or expanded customer fabrication facilities.
We derive most of our net revenue from the sale of systems to a relatively small number of customers, which makes our relationship with each customer critical to our business. For example, for the year ended December 31, 2015, two customers accounted for 10 percent or more of our total net revenues, representing approximately 54 percent and 11 percent of our total net revenue, respectively. For each of the years ended December 31, 2015, 2014 and 2013, our three largest customers accounted for approximately 74 percent, 76 percent and 73 percent of our net revenue, respectively. We currently depend on a few customers for a significant portion of our net revenue, and the delay, significant reduction in, or loss of, orders from these customers would significantly reduce our revenue and adversely impact our operating results. See Item 1. Business - Customers in this Annual Report on Form 10-K for a detailed description of our customer concentration.
Because semiconductor manufacturers must make a substantial investment to install and integrate capital equipment into a semiconductor fabrication facility, these manufacturers will tend to choose semiconductor equipment manufacturers based on product compatibility and proven performance. Changes in forecasts or the timing of orders from customers could expose us to the risks of inventory shortages or excess inventory. In addition, changes in customer demand and order cancellations, could result in the loss of anticipated sales without allowing us sufficient time to reduce our inventory and operating expenses. Any such changes, delays and cancellations in orders in turn could cause our operating results to fluctuate. If customer relationships are disrupted due to an inability to deliver sufficient products or for any other reason, it could have a significant negative impact on our business.
Although we maintain a backlog of customer orders with expected shipment dates within the next 12 months, customers may request delivery delays or cancellations, as they have been doing more regularly in our business. More recently, we have seen delays in our customers' spending in DRAM and across sub-20 nanometer foundry and logic businesses during 2015. Customers in some regions place orders a few weeks before the shipment. As a result, our backlog may not be a reliable indication of future net revenue. If shipments of orders in backlog are canceled or delayed, net revenue could fall below our expectations and the expectations of market analysts and investors.
Once a semiconductor manufacturer selects a particular vendor’s capital equipment, the manufacturer generally relies upon equipment from this vendor of choice (“VOC”) for the specific production line application. In addition, the semiconductor manufacturer frequently will attempt to consolidate other capital equipment requirements with the same vendors. Accordingly, we may face narrow windows of opportunity to be selected as the VOC by new customers with significant needs. It may be difficult for us to sell to a particular customer for a significant period of time once that customer selects a competitor’s product. If we are unable to achieve broader market acceptance of our systems and technology, we may be unable to maintain and grow our business and our operating results and financial condition will be adversely affected.
The cyclical nature of the semiconductor industry has caused us to experience losses and reduced liquidity, and it may continue to negatively impact our financial performance.
The semiconductor equipment industry is highly cyclical and periodically has severe and prolonged downturns, which causes our operating results to fluctuate significantly. We are exposed to the risks associated with industry overcapacity, including decreased demand for our products and increased price competition.
The semiconductor industry historically has experienced periodic downturns due to sudden changes in customers’ requirements for new manufacturing capacity and advanced technology, which depend in part on customers’ capacity utilization, production volumes, access to affordable capital, end-user demand, consumer buying patterns, and inventory levels relative to demand, as well as the rate of technology transitions, and general economic conditions. Our business depends, in significant part, upon capital expenditures by manufacturers of semiconductor devices, including manufacturers that open new or expand existing facilities. Periods of overcapacity and reductions in capital expenditures by our customers cause decreases in demand for our products. This could result in significant under-utilization in our factories. If existing customer fabrication facilities are not expanded and new facilities are not built, we may be unable to generate significant new orders and sales for
10
our systems. During periods of declining demand for semiconductor manufacturing equipment, our customers typically reduce purchases, delay delivery of ordered products and/or cancel orders, resulting in reduced net sales and backlog, delays in revenue recognition and excess inventory for us. Increased price competition may also result as we compete for the smaller demand in the market, causing pressure on our gross margin and net income.
We are dependent on our revenue and the success of our cost reduction measures to ensure adequate liquidity and capital resources during the next twelve months.
We incurred annual operating losses from 2008 through 2013 and have generated negative cash flows from operating activities from 2008 through 2014. As of December 31, 2015, we had cash and cash equivalents of $33.4 million and working capital of $79.9 million. Our operations require careful management of our cash and working capital balances. Our liquidity is affected by many factors including, among others, fluctuations in our revenue, gross margin and operating expenses, as well as changes in our operating assets and liabilities, and availability of financing sources, including under our revolving credit facility. The cyclicality of the semiconductor industry makes it difficult for us to predict our future liquidity needs with certainty. Any upturn in the semiconductor industry would result in short-term uses of our cash to fund inventory purchases. In addition, the ineffectiveness of our cost reduction efforts may cause us to incur additional losses in the future and lower our cash balances.
We may need additional funds to support our working capital requirements and operating expenses, or for other requirements. Historically, we have relied on a combination of fundraising from the sale of equity securities and cash generated from product, service and royalty revenues to provide funding for our operations. On April 12, 2013, we entered into a three-year $25.0 million senior secured revolving credit facility with Silicon Valley Bank, and amended it on October 21, 2014, extending the term of credit facility to October 12, 2017. As of December 31, 2015, we had no outstanding borrowing under the credit facility. If we do not comply with the affirmative and negative covenants contained in the credit facility, we may be in default under the credit facility, which may have a negative impact on our liquidity position through our inability to utilize any availability under the credit facility or an acceleration of any future amounts outstanding under the credit facility.
We will continue to review our expected cash requirements and take appropriate cost reduction measures to ensure that we have sufficient liquidity. Although we will pursue cost reduction measures if circumstances require, we are largely dependent upon improvement in the semiconductor equipment industry specifically, and general continued improvement in the economy as a whole, to increase our sales in order to improve our profitability and cash position. We periodically review our liquidity position and, in addition to the net proceeds from our February 2014 registered common stock offering of approximately $31.7 million, we may opportunistically seek to raise additional funds from a combination of sources including the issuance of equity or debt securities through public or private financings. In the event additional needs for cash arise, we also may seek to raise these funds externally through other means. The availability of additional financing will depend on a variety of factors, including among others, market conditions, the general availability of credit, our credit ratings, and our ability to maintain our listing on NASDAQ. As a consequence, these financing options may not be available to us on a timely basis, or on terms acceptable to us, and could be dilutive to our stockholders.
Our current liquidity position may result in risks and uncertainties affecting our operations and financial position, including the following:
• | we may be required to reduce planned expenditures or investments; |
• | we may be unable to compete in our newer or developing markets; |
• | suppliers may require standby letters of credit before delivering goods and services, which will result in additional demands on our cash; |
• | we may not be able to obtain and maintain normal terms with suppliers; |
• | customers may delay or discontinue entering into contracts with us; and |
• | our ability to retain management and other key individuals may be negatively affected. |
Failure to generate sufficient cash flows from operations, raise additional capital or reduce spending could have a material adverse effect on our ability to achieve our intended long-term business objectives.
11
We face stiff competition in the semiconductor equipment industry.
The semiconductor equipment industry is both highly competitive and subject to rapid technological change. Significant competitive factors include the following:
• | system performance; |
• | cost of ownership; |
• | size of the installed base; |
• | breadth of product line; |
• | delivery speed; and |
• | customer support. |
Competitive pressure has been increasing in several areas. In addition to increased price competition, customers are waiting to make purchase commitments based on their end-user demand, which are then placed with requests for rapid delivery dates and increased product support. Most of our major competitors are larger than we are, have greater capital resources and may have a competitive advantage over us by virtue of having:
• | broader product lines; |
• | greater experience with handling manufacturing cycles; |
• | substantially larger customer bases; and |
• | substantially greater customer support, financial, technical and marketing resources. |
Our competitors include Applied Materials, Inc., Dainippon Screen Manufacturing Company, Lam Research Corporation, PSK, Inc., Tokyo Electron Limited and Ultratech Inc. As we derive a substantial percentage of our revenues from a limited number of products, our business, operating results, financial condition, and cash flows could be adversely affected by a decline in demand for even a limited number of our products and a failure to achieve continued market acceptance of our key products.
Growth in the semiconductor equipment industry is increasingly concentrated in the largest companies, continuing the trend in increasing industry consolidation, which has accelerated over the last year, such as the pending merger of Lam Research and KLA-Tencor Corp., announced in October 2015, and the previously completed merger of Lam Research and Novellus Systems in 2012. Semiconductor companies are consolidating their vendor base and prefer to purchase from vendors with a strong, worldwide support infrastructure.
To expand our sales we must often displace the systems of our competitors or sell new systems to customers of our competitors. Our competitors may develop new or enhanced competitive products that offer price or performance features that are superior to our systems. Our competitors also may be able to respond more quickly to new or emerging technologies and changes in customer requirements or to devote greater resources to the development, promotion, sale and on-site customer support of their product lines. We may not be able to maintain or expand our sales if competition increases and we are unable to respond effectively.
12
Our proposed Merger with Beijing E-Town Dragon Semiconductor Industry Investment Center (Limited Partnership (“E-Town Dragon” or "Parent") may not be completed within the expected time-frame, or at all, and the failure to complete the merger could adversely affect our business and the market price of our common stock.
On December 1, 2015, we entered into the Merger Agreement with Parent, as joined by Merger Sub, pursuant to which, and on the terms and conditions contained in the Merger Agreement, Merger Sub will merge with and into Mattson with Mattson surviving the Merger as a subsidiary of Parent. The closing of the Merger is subject to the adoption of the Merger Agreement by the affirmative vote of holders of a majority of the outstanding shares of our common stock. The obligations of the parties to consummate the Merger are also subject to the satisfaction (or waiver, if applicable) of various customary conditions, including (i) the expiration or termination of the applicable waiting period under the Hart-Scott-Rodino Antitrust Improvements Act of 1976, as amended, (ii) filings and approvals with or by certain governmental authorities, including governmental authorities in the PRC and Taiwan, (iii) the absence of certain governmental orders prohibiting the Merger, (iv) the accuracy of the representations and warranties of each party contained in the Merger Agreement (subject to certain materiality qualifications) and (v) each party’s compliance with or performance of the covenants and agreements in the Merger Agreement in all material respects. In addition, the Merger Agreement may be terminated under specified circumstances. Failure to complete the Merger could adversely affect our business and the market price of our common stock in a number of ways, including:
• | if the Merger is not completed, and no other party is willing and able to acquire us at a price of $3.80 per share or higher, on terms acceptable to us, the share price of our common stock is likely to decline; |
• | we have incurred, and continue to incur, significant transaction costs in connection with the proposed Merger, for which we will have received little or no benefit if the Merger is not completed. Many of these costs will be payable even if the Merger is not completed and may relate to activities that we would not have undertaken other than to complete the Merger; |
• | a failed Merger may result in negative publicity and/or give a negative impression of us in the investment community or business community generally, and could have an adverse effect on our on-going operations including, but not limited to, retaining and attracting employees, and reduced ability to attract evaluation engagements and to sell our products; and |
• | if the Merger Agreement is terminated under specified circumstances, we may be required to pay Parent a termination fee. |
The announcement and pendency of our proposed merger with Parent could adversely affect our business, financial condition, and results of operations.
The announcement and pendency of the proposed Merger could disrupt our business and create uncertainty about it, which could have an adverse effect on our business, results of operations and financial condition, regardless of whether the Merger is completed. These risks to our business, all of which could be exacerbated by a delay in the completion of the Merger, include:
• | diversion of significant management time and resources towards the completion of the Merger; |
• | impairment of our ability to attract and retain key personnel; |
• | difficulties maintaining relationships with employees, customers and other business partners; |
• | restriction on the conduct of our business prior to the completion of the Merger, which prevent us from taking specified actions without the prior consent of Parent, which we might otherwise take in the absence of the Merger Agreement; and |
• | litigation relating to the Merger, of which several suits have been filed to date, and the related costs of such litigation. |
13
If the Merger Agreement is terminated, we may, under certain circumstances, be obligated to pay a termination fee to Parent. These costs could require us to use available cash that would have otherwise been available for other uses.
If the Merger is not completed, in certain circumstances, we could be required to pay a termination fee of approximately $8.6 million to Parent. If the Merger Agreement is terminated, the termination fee we may be required to pay, if any, under the Merger Agreement may require us to use available cash that would have otherwise been available for general corporate purposes or other uses. For these and other reasons, termination of the Merger Agreement could materially and adversely affect our business, results of operations or financial condition, which in turn would materially and adversely affect the price per share of our common stock. Further, an adverse ruling may prevent the Merger from being completed.
We are involved in litigation relating to the Merger Agreement that could divert management's attention and adversely affect our business.
We, including the individual members of our Board of Directors, have been named as defendants in litigation related to the Merger Agreement and the transactions contemplated thereby. The plaintiffs, purported stockholders of the Company, generally allege that the members of our Board of Directors breached their fiduciary duties to our stockholders by approving the Merger Agreement. They further allege that we aided and abetted these alleged breaches of fiduciary duty. Although we believe that these suits are without merit, the defense of these suits may be expensive and may divert management's attention and resources, which could adversely affect our business.
We must continually anticipate technology trends, improve our existing products and develop new products in order to be competitive. The development of new or enhanced products involves significant risks, additional costs and delays in revenue recognition. Technical and manufacturing difficulties experienced in the introduction of new products could be costly and could adversely affect our customer relationships.
The markets in which our customers and we compete are characterized by rapidly changing technology, evolving industry standards and continuous improvements in products and services. Consequently, our success depends upon our ability to anticipate future technology trends and customer needs, to develop new systems and processes that meet industry standards and customer requirements and that compete effectively on the basis of price and performance.
Our development of new products involves significant risk, since the products are very complex and the development cycle is long and expensive. The success of any new system we develop and introduce is dependent on a number of factors, including our ability to correctly predict customer requirements for new processes, to assess and select the potential technologies for research and development and to timely complete new system designs that are acceptable to the market. We may make substantial investments in new technologies before we can know whether they are technically or commercially feasible or advantageous, and without any assurance that revenue from future products or product enhancements will be sufficient to recover the associated development costs. Not all development activities result in commercially viable products. We may not be able to improve our existing systems or develop new technologies or systems in a timely manner. We may exceed the budgeted cost of reaching our research, development and engineering objectives, and planned product development schedules may require extension. Any delays or additional development costs could have a material adverse effect on our business and results of operations.
Our products are complex, and we may experience technical or manufacturing inefficiencies, delays or difficulties in the prototype introduction of new systems and enhancements, or in achieving volume production of new systems or enhancements that meet customer requirements. Our inability, or the inability of our supply chain partners, to overcome such difficulties, to meet the technical specifications of any new systems or enhancements or to manufacture and ship these systems or enhancements in the required volume and in a timely manner would materially adversely affect our business and results of operations, as well as our customer relationships.
Our revenue recognition policies require that during the initial evaluation phase of a new product, customer acceptance needs to be obtained before we can recognize revenue on the product. Customer acceptance may not be completed in a timely manner for a variety of reasons, whether or not related to the quality and performance of our products. Any delays in customer acceptance may result in revenue recognition delays and have an adverse impact on our results of operations.
We may from time to time incur unanticipated costs to ensure the functionality and reliability of our products early in their life cycles, and such costs can be substantial. If we encounter reliability or quality problems with our new products or enhancements, we could face a number of difficulties, including reduced orders, higher manufacturing costs, delays in collection of accounts receivable and additional service and warranty expenses, all of which could materially adversely affect our business and results of operations. The costs associated with our warranties may be significant, and in the event our
14
projections and estimates of these costs are inaccurate, our financial performance could be seriously harmed. In addition, if we experience product failures at an unexpectedly high level, our reputation in the marketplace could be damaged, and our business would suffer.
We are highly dependent on international sales, and face significant international business risks.
International sales accounted for 85 percent, 86 percent and 90 percent of our net revenue for the years ended December 31, 2015, 2014 and 2013, respectively. We anticipate international sales will continue to account for the vast majority of our future net sales. Asia has been a particularly important region for our business, and we anticipate that it will continue to be important going forward. Our sales to customers located in Asia accounted for 81 percent, 81 percent and 85 percent of our net revenue for the years ended December 31, 2015, 2014 and 2013, respectively. Because of our continuing dependence upon international sales, we are subject to a number of risks associated with international business activities, including:
• | burdensome governmental controls, laws, regulations, tariffs, duties, taxes, restrictions, embargoes or export license requirements; |
• | unexpected changes in laws or regulations prompted by economic stress, such as protectionism, and other attempts to rectify real or perceived international trade imbalances; |
• | exchange rate volatility; |
• | the need to comply with a wide variety of foreign and U.S. customs, export and other laws; |
• | political and economic instability; |
• | government-sponsored competition; |
• | differing labor regulations; |
• | reduced protection for, and increased misappropriation of, intellectual property; |
• | difficulties in accounts receivable collections; |
• | increased costs for product shipments and potential difficulties from shipment delays; |
• | difficulties in managing distributors, representatives, contract manufacturers and suppliers; |
• | difficulties in staffing and managing foreign subsidiary operations; and |
• | natural disasters, acts of war, terrorism, widespread illness or other catastrophes affecting foreign countries. |
Our sales to date have been denominated primarily in U.S. dollars; however future sales to Asian customers may be denominated in the customer's local currency. Our sales in foreign currencies are subject to risks of currency fluctuation. For U.S. dollar sales in foreign countries, our products may become less price competitive when the local currency is declining in value compared to the dollar. This could cause us to lose sales or force us to lower our prices, which would reduce our gross margins.
Significant fluctuations in our operating results are difficult to predict due to our lengthy sales cycle, and our results may fall short of anticipated levels, which could cause our stock price to decline.
Our systems revenues depend upon the decision of a prospective customer to increase or replace manufacturing capacity, typically involving a significant capital commitment. Accordingly, the decision to purchase our systems requires time-consuming internal procedures associated with the evaluation, testing, implementation and introduction of new technologies into our customers' manufacturing facilities. Even after the customer determines that our systems meet their qualification criteria, we may experience delays finalizing system sales while the customer obtains approval for the purchase, constructs new facilities or expands its existing facilities. Consequently, the time between our first contact with a customer regarding a specific potential purchase and the customer's placing its first order may last from one to two years or longer. We may incur significant sales and marketing expenses during this evaluation period, in addition to tying up substantial inventory in customer product
15
evaluations. The length of this period makes it difficult to accurately forecast future sales. Also, any unexpected delays in orders could impact our revenue and operating results. If sales forecast for a specific customer are not realized, we may experience an unplanned shortfall in net revenue, and our quarterly and annual revenue and operating results may fluctuate significantly from period to period.
Our quarterly and annual revenue and operating results have varied significantly in the past and are likely to vary significantly in the future, which makes it very difficult for us to predict our future operating results. We incurred significant net losses between 2001 and 2003, yet were profitable for each of the years 2004 to 2007. We again incurred net losses from 2008 through the third quarter of 2013, due to our fluctuating revenues and/or declining demand as a result of the weakness in the semiconductor equipment market and the global economy. We may not achieve profitability in future quarters and years. We will need to generate significant sales to achieve profitability, and we may not be able to do so. A substantial percentage of our operating expenses are fixed in the short term and we may continue to be unable to adjust spending to compensate for shortfalls in net revenue. As a result, we may incur losses in the future, which could cause the price of our common stock to decline further or remain at a low level for an extended period of time.
Any weakness in the global economy may negatively impact our financial performance.
The recessionary conditions of 2008 and 2009 in the global economy and the slowdown in the semiconductor industry impacted customer demand for our products and correspondingly, negatively impacted our financial performance. There remains high unemployment in developed countries, concerns regarding the availability of credit, uncertainty about a sustained economic recovery in the U.S. and fears of further economic deterioration in Europe, China, and the developing world, which in turn, may lead to a global downturn. Any of these factors could have a negative impact on our business or our financial condition.
Demand for semiconductor equipment depends on consumer spending. Future economic uncertainty may lead to a decrease in consumer spending and may cause certain of our customers to cancel or delay orders. In addition, if our customers have difficulties obtaining capital or financing, this could result in lower sales. Customers with liquidity issues could lead to charges to our bad debt expense, if we are unable to collect accounts receivables. These conditions could also affect our key suppliers, which could affect their ability to supply parts to us, and result in delays of the completion of our systems and the shipment of these systems to our customers.
If as a result of any economic downturn and the uncertainty of any future decline in demand for our products due to slowdowns in the semiconductor industry, we may have to take additional, actions to reduce costs. These actions could further reduce our ability to invest in research and development at levels we believe are desirable. If we are unable to effectively align our cost structure with prevailing market conditions, we will experience additional losses and additional reductions in our cash and cash equivalents. If we are not able to suitably adapt to these economic conditions in a timely manner or at all, our performance, cash flows, results of operations and ability to access capital could be materially and adversely impacted.
Because of competition for qualified personnel, we may not be able to recruit or retain necessary personnel, which could impede development or sales of our products.
Our growth will depend on our ability to attract and retain qualified, experienced employees. Our ability to attract employees may be harmed by our recent financial losses, which have impacted our available cash and our ability to provide performance-based annual cash incentives. Also, part of our total compensation program includes share-based compensation. Share-based compensation is an important tool in attracting and retaining employees in our industry. If the market price of our common shares declines or remains low, it may adversely affect our ability to attract or retain employees.
During periods of growth in the semiconductor industry, there is substantial competition for experienced engineering, technical, financial, sales and marketing personnel in our industry. In particular, we must attract and retain highly skilled design and process engineers. If we are unable to retain existing key personnel, or attract and retain additional qualified personnel, we may from time to time experience inadequate levels of staffing to develop and market our products and perform services for our customers. As a result, our growth could be limited, we could fail to meet our delivery commitments or we could experience deterioration in service levels or decreases in customer satisfaction.
The price of our common stock has fluctuated in the past and may continue to fluctuate significantly in the future, which may lead to losses by investors, delisting, securities litigation or hostile or otherwise unfavorable takeover offers.
The market price of our common stock has been highly volatile in the past, and our stock price may decline in the future. For example, for the year ended December 31, 2015, the closing price range for our common stock was between $2.20 and
16
$5.02 per share. Our stock may be subject to eventual delisting from NASDAQ if we do not maintain a minimum $1.00 per share trading price. Any future decline below $1.00 per share may trigger a possible delisting by NASDAQ, and any delisting from NASDAQ would likely lead to less liquidity for our shareholders and increased volatility in our stock price.
The relatively low stock price makes us attractive to hedge funds and other short-term investors. This could result in substantial stock price volatility and cause fluctuations in trading volumes for our stock. Fluctuations in the trading price or liquidity of our common stock may harm the value of your investment in our common stock.
In addition, in recent years the stock market in general, and the market for shares of high technology stocks in particular, has experienced extreme price fluctuations. These fluctuations have frequently been unrelated to the operating performance of the affected companies. In the past, securities class action litigation often has been instituted against a company following periods of volatility in its stock price. This type of litigation, if filed against us, could result in substantial costs and divert our management's attention and resources.
Other factors that may have a significant impact on the market price and marketability of our securities include changes in securities analysts' recommendations, short selling, and halting or suspension of trading in our common stock by NASDAQ.
We may outsource select manufacturing activities to third-party service providers, which decreases our control over the performance of these functions and quality of our products.
From time to time, we may outsource product manufacturing to third-party service providers. Outsourcing has a number of risks and reduces our control over the performance of the outsourced functions. Significant performance problems by these third-party service providers could result in cost overruns, delayed deliveries, shortages, quality issues or other problems that could result in significant customer dissatisfaction and could materially and adversely affect our business, financial condition and results of operations. If for any reason one or more of these third-party service providers becomes unable or unwilling to continue to provide services of acceptable quality, at acceptable costs and in a timely manner, our ability to deliver our products to our customers could be severely impaired.
We depend upon a limited number of suppliers for some components and sub-assemblies, and supply shortages or the loss of these suppliers could result in increased cost or delays in the manufacture and sale of our products.
We rely, to a substantial extent, on outside vendors to provide many of the components and sub-assemblies of our systems. We obtain some of these components and sub-assemblies from a sole source or a limited group of suppliers. We generally acquire these components on a purchase order basis and not under long-term supply contracts. Because of our reliance on these vendors and suppliers, we may be unable to obtain an adequate supply of required components. When demand for semiconductor equipment is strong, our suppliers may have difficulty providing components on a timely basis.
In addition, during periods of shortages of components, we may have reduced control over pricing and timely delivery of components. We often quote prices to our customers and accept customer orders for our products prior to purchasing components and sub-assemblies from our suppliers. If our suppliers increase the cost of components or sub-assemblies, we may not have alternative sources of supply and may no longer be able to increase the price of the system being evaluated by our customers to cover all or part of the increased cost of components.
The manufacture of some of these components is an extremely complex process and requires long lead times. If we are unable to obtain adequate and timely deliveries of our required components, we may have to seek alternative sources of supply or manufacture such components internally. This could delay our ability to manufacture or ship our systems in a timely manner, causing us to lose sales, incur additional costs, delay new product introductions and harm our reputation. Historically, we have not experienced any significant delays in manufacturing due to an inability to obtain components, and we are not currently aware of any specific problems regarding the availability of components that might significantly delay the manufacturing of our systems in the future. Any inability to obtain adequate deliveries, or any other circumstance that would require us to seek alternative sources of supply or to manufacture such components internally, could delay our ability to ship our systems and could have a material adverse effect on us.
Our gross margins may be impacted if we do not effectively manage our inventory and costs.
We need to manage our inventory of component parts, work-in-process and finished goods (principally comprised of products undergoing customer evaluations) effectively to meet customer delivery demands at an acceptable risk and cost. For both the inventories that support manufacture of our products and our spare parts inventories, if the anticipated customer demand does not materialize in a timely manner, we will incur increased carrying costs and some inventory could become
17
excess or obsolete, resulting in write-offs, which would adversely affect our cash position and results of operations. The sale of this inventory during periods of increasing revenue could temporarily impact our gross margins favorably due to the adjusted carrying value of this inventory, and could result in future unpredictability in our gross margin estimates. In addition, we may be subject to higher production costs due to increasing freight, labor and other operating expenses in connection with the shipment of our products due to market factors, particularly heightened when we experience accelerated shipment schedules.
Our gross margins for sales of products that we manufacture in Germany may fluctuate due to changes in the value of the Euro.
We develop and manufacture our Millios product in Germany, where our costs for labor and materials are primarily denominated in Euros. Future increases in the value of the Euro, if any, could increase our development costs, our costs to manufacture systems, and our costs to purchase spare parts for products from our suppliers, which would make it more difficult for us to compete and could adversely affect our results of operations.
We primarily manufacture our products at one manufacturing facility and are thus subject to risk of disruption.
Although, from time to time, we outsource select core product manufacturing to third parties, we continue to produce our latest generation products at our principal manufacturing plant in Fremont, California and produce our Millios product at our research and manufacturing facility in Dornstadt, Germany. We have limited ability to interchangeably produce our products at either facility, and in the event of a disruption of operations at one facility, our other facility may not be able to make up the capacity loss. Our operations could be subject to disruption for a variety of reasons, including, but not limited to, natural disasters, including earthquakes in California, work stoppages, operational facility constraints and terrorism. Such disruption could cause delays in shipments of products to our customers, result in cancellation of orders or loss of customers and seriously harm our business.
We self-insure certain risks including earthquake risk. If one or more of the uninsured events occurs, we could suffer major financial losses.
We purchase insurance to help mitigate the economic impact of certain insurable risks; however, certain other risks are uninsurable or are insurable only at significant cost or cannot be mitigated with insurance. An earthquake could significantly disrupt our principal manufacturing operations in Fremont, California, an area highly susceptible to earthquakes. It could also significantly delay our research and development efforts on new products, a significant portion of which is conducted in California. We self-insure earthquake risks because we believe this is a prudent financial decision based on the high cost and limited coverage available in the earthquake insurance market. If a major earthquake were to occur, we could suffer a major financial loss and face significant disruption in our business.
If we are unable to protect our intellectual property, we may lose valuable assets and experience reduced market share. Efforts to protect our intellectual property may be costly to resolve, require costly litigation and could divert management attention. We also agree to indemnify customers for certain claims, and such obligations are more likely to increase during downturns.
We rely on a combination of patents, copyrights, trademark and trade secret laws, non-disclosure agreements, and other intellectual property protection methods to protect our proprietary technology. Despite our efforts to protect our intellectual property, we may from time to time be subject to claims of infringement of other parties' patents or other proprietary rights. If this occurs, we may not be able to prevent their use of such technology. Our means of protecting our proprietary rights may not be adequate and our patents may not be sufficiently broad to protect our technology. Any patents owned by us could be challenged, invalidated or circumvented and any rights granted under any patent may not provide adequate protection to us.
Furthermore, we may not have sufficient resources to protect our rights. When we outsource portions of our manufacturing, we are less able to protect our intellectual property, and rely more on our service providers to do so. Our service providers may not always be able to assure that their employees or former employees do not use our intellectual property for their own account to compete with us. Our competitors may independently develop similar technology, or design around patents that may be issued to us. In addition, the laws of some foreign countries may not protect our proprietary rights to as great an extent as do the laws of the United States and it may be more difficult to monitor the use of our intellectual property in such foreign countries. As a result of these threats to our proprietary technology, we may have to resort to costly litigation to enforce our intellectual property rights.
Customers may request that we indemnify them or otherwise compensate them because of claims of intellectual property infringement made against them by third parties. Our involvement in any patent dispute or other intellectual property dispute or
18
action to protect trade secrets, even if the claims are without merit, could be very expensive to defend and could divert the attention of our management. Adverse determinations in any litigation could subject us to significant liabilities to third parties, require us to seek costly licenses from third parties and prevent us from manufacturing and selling our products. Royalty or license agreements, if required, may not be available on terms acceptable to us, or at all. Any of these situations could have a material adverse effect on our business and operating results in one or more countries where we do business.
In the normal course of business, we indemnify customers with respect to certain matters, for example if our tool infringes the intellectual property rights of any third party or if we breach any promise in our contract with the customer. During downturns in general or adverse industry specific economic conditions, our customers may feel they have greater leverage in negotiating with us and may require that the extent and scope of our obligation to indemnify them be expanded. In the future, our financial performance could be materially adversely affected if we expend significant amounts in defending or settling any claims raised under customer indemnification provisions in our contract.
Data breaches and cyber-attacks could compromise our operations, or the operations of our third party service providers whom we rely upon, and cause significant damage to our business and reputation.
Over the past year, cyber-attacks have become more prevalent and much harder to detect and defend against. We believe that companies have been increasingly subject to a wide variety of security incidents, cyber-attacks and other attempts to gain unauthorized access. These threats can come from a variety of sources, all ranging in sophistication from an individual hacker to a state-sponsored attack. Cyber threats may be generic, or they may be custom-crafted against our information systems.
In the ordinary course of our business, we maintain sensitive data on our networks, including our intellectual property and proprietary or confidential business information relating to our business and that of our customers and business partners. The secure maintenance of this information is critical to our business and reputation. Our network and storage applications may be subject to unauthorized access by hackers or breached due to operator error, malfeasance or other system disruptions. It is often difficult to anticipate or immediately detect such incidents and the damage caused by such incidents. These data breaches and any unauthorized access or disclosure of our information or intellectual property could compromise our intellectual property and expose sensitive business information. A data security breach could also lead to public exposure of personal information of our employees, customers and others. Cyber-attacks could cause us to incur significant remediation costs, result in product development delays, disrupt key business operations and divert attention of management and key information technology resources. These incidents could also subject us to liability, expose us to significant expense and cause significant harm to our reputation and business.
We also rely on third party service providers to maintain some of our networks and information technology infrastructure. All of these third party service providers face risks relating to cyber-security similar to ours, which could disrupt their businesses and therefore materially impact ours.
We are exposed to various risks relating to compliance with the regulatory environment, including export control laws material contracts provisions and conflict-mineral reporting, and non-compliance or non-performance with any of these items could result in adverse consequences and monetary fines or damages.
We are subject to various risks related to (1) disagreements and disputes between national and regional regulatory agencies related to international trade; (2) new, inconsistent and conflicting rules by regulatory agencies in the countries in which we operate; and (3) interpretation and application of different laws and regulations. If we are found by a court or regulatory agency to not be in compliance with the applicable laws and regulations, our business, financial condition and results of operations could be adversely affected.
As an exporter, we must comply with various laws and regulations relating to the export of products and technology from the U.S. and other countries having jurisdiction over our operations. In the U.S. these laws include the International Traffic in Arms Regulations (“ITAR”) administered by the State Department's Directorate of Defense Trade Controls, the Export Administration Regulations (“EAR”) administered by the Bureau of Industry and Security (“BIS”), and trade sanctions against embargoed countries and destinations administered by the U.S. Department of Treasury, Office of Foreign Assets Control (“OFAC”). The EAR governs products, parts, technology and software which present military or weapons proliferation concerns, so-called “dual use” items, and ITAR governs military items listed on the United States Munitions List. Prior to shipping certain items, we must obtain an export license or verify that license exemptions are available. In addition, we must comply with certain requirements related to documentation, record keeping, plant visits and hiring of foreign nationals. Any failures to comply with these laws and regulations could result in fines, adverse publicity and restrictions on our ability to export our products, and repeat failures could carry more significant penalties. In 2008, we self-disclosed to BIS certain
19
inadvertent EAR violations, and in April 2012, we entered into a settlement agreement with BIS that resolved in full all matters contained in our voluntary self-disclosure and paid a civil penalty of $250,000.
We are a party to a governmental contract with the Canadian Minister of Industries ("Minister") that provides for liquidated damages in the event that we fail to comply with their covenants or requirements. Under the provisions of this agreement, if Mattson Technology, Canada, Inc. ("MTC") is dissolved, files for bankruptcy or we, or MTC, do not materially satisfy the obligations pursuant to any material terms or conditions, the Minister could demand payment of liquidated damages in the amount of C$14.3 million less any royalties paid to the Minister. These liquidated damage payments could be significant and may adversely impact our financial condition or results of operations.
In accordance with the Dodd-Frank Wall Street Reform and Consumer Protection Act, the SEC established new disclosure and reporting requirements for those companies who use "conflict" minerals mined from the Democratic Republic of Congo and adjoining countries in their products, whether or not these products are manufactured by third parties. These new requirements could affect the sourcing and availability of minerals used in the manufacture of our products. We have to date incurred costs and expect to incur additional costs associated with complying with the disclosure requirements, including for example, due diligence in regard to the sources of any conflict minerals used in our products and the initial filing that reported our results, in addition to the cost of remediation and other changes to products, processes, or sources of supply as a consequence of such verification activities. Additionally, we may face reputational challenges with our customers and other stakeholders because we have, to date, been unable to sufficiently verify the origins of all minerals used in our products through the due diligence procedures that we implement. We may also face challenges with government regulators and our customers and suppliers if we are unable to sufficiently verify that the metals used in our products are conflict free. We expect to continue to incur significant costs associated with complying with the disclosure requirements, such as costs related to determining the source of certain minerals used in our products.
Our failure to comply with environmental or safety regulations could result in substantial liability.
We are subject to a variety of federal, state, local and foreign laws, rules, and regulations relating to environmental protection and workplace safety. These laws, rules and regulations govern the use, storage, discharge and disposal of hazardous chemicals during manufacturing, research and development and sales demonstrations, as well as governmental standards for workplace safety. If we fail to comply with present or future regulations, especially in our manufacturing facilities in the U.S. and Germany, we could be subject to substantial liability for cleanup efforts, personal injury, fines or suspension or cessation of our operations. We may be subject to liability if we have past violations. Restrictions on our ability to expand or continue to operate at our present locations could be imposed upon us as a result of such laws, rules and regulations, and we could be required to acquire costly remediation equipment or incur other significant expenses.
To the extent we are leveraged financially, it could adversely affect our ability to adjust our business to respond to competitive pressures and to obtain sufficient funds to satisfy our future research and development needs, to protect and enforce our intellectual property and other needs.
In April 2013, we entered into a three-year $25.0 million senior secured revolving credit facility with Silicon Valley Bank. In October 2014, we entered into an amendment to the credit facility, extending the term of the loan, among other things. As of December 31, 2015, we had no outstanding borrowing under the credit facility and had availability to borrow an additional $25.0 million under the credit facility. The degree to which we are leveraged could have important consequences, including, but not limited to, the following:
• | our ability to obtain additional financing in the future for working capital, capital expenditures, acquisitions, litigation, general corporate or other purposes may be limited; |
• | a substantial portion of our cash flows from operations in the future will be dedicated to the repayment of the credit facility; and |
• | we may be more vulnerable to economic downturns, less able to withstand competitive pressures and less flexible in responding to changing business and economic conditions. |
In 2014, we entered into several amendments and waivers of our credit facility with Silicon Valley Bank that amended certain financial covenants and waived compliance with certain financial covenants. We may not be able to obtain waivers of covenants in the future, and a failure to comply with the covenants and other provisions of the credit facility could result a lack of availability for borrowing under the credit facility or events of default, which could permit acceleration of repayment of all
20
amounts due under the credit facility. Any required repayment of our credit facility as a result of a fundamental change or other acceleration would lower our current cash on hand such that we would not have those funds available for use in our business.
If we are at any time unable to generate sufficient cash flows from operations to service our indebtedness when payment is due, we may be required to attempt to renegotiate the terms of the instruments relating to the indebtedness, seek to refinance all or a portion of the indebtedness or obtain additional financing. There can be no assurance that we will be able to successfully renegotiate such terms, that any such refinancing would be possible or that any additional financing could be obtained on terms that are favorable or acceptable to us.
Our failure to establish and maintain effective internal control over financial reporting could result in our failure to meet our reporting obligations and cause investors to lose confidence in our reported financial information, which in turn could cause the trading price of our common stock to decline.
In connection with our assessment of the effectiveness of internal control over financial reporting and the preparation of our financial statements for the year ended December 31, 2013, we identified three significant deficiencies in our internal control over financial reporting with respect to inventory that, when aggregated, constituted a material weakness in our internal control over financial reporting as of December 31, 2013. While none of these significant deficiencies was individually considered a material weakness, our management determined that, in the aggregate, these control deficiencies constituted a material weakness, because they could result in a material misstatement of the consolidated financial statements that would not be prevented or detected. Because of this material weakness, which arose from our failure to maintain effective controls over the accounting for the existence, valuation and presentation of inventory, management concluded that we did not maintain effective internal control over financial reporting as of December 31, 2013.
During the year ended December 31, 2014, we implemented enhancements to our internal controls over financial reporting, including new processes and procedures to ensure inventory is valued timely and accurately. Our remediation efforts, including the testing of these controls continued throughout 2014. Once these controls were shown to be operational for a sufficient period of time to allow management to conclude that these controls were operating effectively, the material weakness related to the accounting for the existence, valuation and presentation of inventory was considered remediated in the fourth quarter of 2014.
We cannot assure you that similar material weaknesses will not recur. Any failure to maintain or implement new or improved internal controls, or any difficulties that we may encounter in their maintenance or implementation, could result in additional significant deficiencies or material weaknesses, result in material misstatements in our financial statements and cause us to fail to meet our reporting obligations, which in turn could cause the trading price of our common stock to decline. In addition, any such failure could, in the future, adversely affect the results of our periodic management evaluations and annual auditor attestation reports regarding the effectiveness of our internal control over financial reporting required by Section 404 of the Sarbanes-Oxley Act of 2002.
Changes in tax rates or tax liabilities could affect results.
We are subject to taxation in the U.S. and various other countries. Significant judgment is required to determine and estimate worldwide tax liabilities. Our future annual and quarterly tax rates could be affected by numerous factors, including changes in the applicable tax laws, composition of earnings in countries with differing tax rates or our valuation and utilization of deferred tax assets and liabilities. In addition, we are subject to regular examination of our income tax returns by the Internal Revenue Service and other tax authorities. We regularly assess the likelihood of favorable or unfavorable outcomes resulting from these examinations to determine the adequacy of our provision for income taxes. Although we believe our tax estimates are reasonable, there can be no assurance that any final determination will not be materially different from the treatment reflected in our historical income tax provisions and accruals, which could materially and adversely affect our results of operations.
Our restated certificate of incorporation and restated bylaws and Delaware law contain provisions that could discourage transactions resulting in a change in control, which may negatively affect the market price of our common stock.
Our restated certificate of incorporation, our restated bylaws and Delaware law contain provisions that might enable our management to discourage, delay or prevent a change in control. In addition, these provisions could limit the price that investors would be willing to pay in the future for shares of our common stock. Pursuant to such provisions:
• | our board of directors is authorized, without prior stockholder approval, to create and issue preferred stock, commonly referred to as “blank check” preferred stock, with rights senior to those of common stock; |
21
• | our board of directors is staggered into three classes, only one of which is elected at each annual meeting; |
• | stockholder action by written consent is prohibited; |
• | nominations for election to our board of directors and the submission of matters to be acted upon by stockholders at a meeting are subject to advance notice requirements; |
• | certain provisions in our bylaws and certificate of incorporation such as notice to stockholders, the ability to call a stockholder meeting, advance notice requirements and action of stockholders by written consent may only be amended with the approval of stockholders holding 66 2/3 percent of our outstanding voting stock; |
• | the ability of our stockholders to call special meetings of stockholders is prohibited; and |
• | subject to certain exceptions requiring stockholder approval, our board of directors is expressly authorized to make, alter or repeal our bylaws. |
We are subject to Section 203 of the Delaware General Corporation Law, which provides, subject to enumerated exceptions, that if a person acquires 15 percent or more of our outstanding voting stock, the person is an “interested stockholder” and may not engage in any “business combination” with us for a period of three years from the time the person acquired 15 percent or more of our outstanding voting stock.
Item 1B. Unresolved Staff Comments
None.
Item 2. Properties
Our principal properties as of December 31, 2015 are set forth below:
Location | Type | Principal Use | Square Footage | Ownership | ||||
Fremont, California | Office, plant and warehouse | Headquarters, marketing, manufacturing, distribution, research and engineering | 101,000 | Leased | ||||
Dornstadt, Germany | Office, plant and warehouse | Manufacturing, research and engineering | 66,000 | Leased | ||||
In addition to the above properties, we lease an aggregate of approximately 40,000 square feet of office space for sales and customer support offices, worldwide.
We lease office space for headquarters, manufacturing, operations, research and engineering, distribution, marketing, sales and customer support at two locations in the U.S. and approximately 14 locations throughout the world, including China, Germany, Korea, Singapore and Taiwan. We consider these current facilities suitable and adequate to meet our requirements.
Item 3. Legal Proceedings
Overview
In the ordinary course of business, we are subject to claims and litigation, including claims that we infringe third party patents, trademarks and other intellectual property rights. Although we believe that it is unlikely that any current claims or actions will have a material adverse impact on our operating results or our financial position, given the uncertainty of litigation, we cannot be certain of this. The defense of claims or actions against us, even if without merit, could result in the expenditure of significant financial and managerial resources.
22
We record a legal liability when we believe it is both probable that a liability has been incurred, and the amount can be reasonably estimated. We monitor developments in our legal matters that could affect the estimate we have previously accrued. Significant judgment is required to determine both probability and the estimated amount.
Class Action Merger Litigation
On December 14, 2015, a putative shareholder class action complaint was filed in the Court of Chancery of the State of Delaware against Mattson, Mattson’s Board of Directors, Beijing E-town Dragon Semiconductor Industry Investment Center (“Parent”), and Dragon Acquisition Sub, Inc. (“Merger Sub”), captioned Sally Mogle v. Mattson Technology, et al., Case No. 11807 (Del. Ch.). On December 22, 2015, a second putative shareholder class action complaint was filed in the Court of Chancery of the State of Delaware against Mattson’s Board of Directors, Parent, and Merger Sub, captioned Philip Durgin v. Kannappan, et al., Case No. 11837 (Del. Ch.). The complaints allege, among other things, that the Company’s directors breached their fiduciary duties by approving the Merger Agreement and that Parent and Merger Sub aided and abetted the alleged breaches of fiduciary duty. The complaints seek, among other things, either to enjoin the proposed transaction or to rescind it should it be consummated, as well as unspecified damages, including attorneys’ and experts’ fees.
On January 12, 2016, a putative shareholder class action complaint was filed in the Superior Court of the State of California, Alameda County against Mattson, Mattson’s Board of Directors, Parent, and Merger Sub, captioned Mary Salinas v. Mattson Technology, et al., Case No. RG16799807. The complaint alleges, among other things, that the Company’s directors breached their fiduciary duties by approving the Merger Agreement, and that Mattson, Parent, and Merger Sub aided and abetted the alleged breaches of fiduciary duty. The complaint seeks, among other things, to enjoin the stockholder vote on the proposed transaction and unspecified damages, including attorneys’ and experts’ fees. On February 11, 2016, the plaintiff filed an Amended Class Action Complaint alleging, among other things, that Mattson’s directors breached their fiduciary duties by approving the Merger Agreement and issuing an incomplete and misleading Preliminary Proxy Statement, and that Mattson, Parent and Merger Sub aided and abetted the alleged breaches of fiduciary duty. The complaint seeks, among other things, either to enjoin the proposed transaction or to rescind it should it be consummated, as well as unspecified damages, including attorneys’ and experts’ fees. On February 22, 2016, a second putative shareholder class action complaint was filed in the Superior Court of the State of California, Alameda County against Mattson, Mattson’s Board of Directors, Parent, and Merger Sub, captioned Darrell Brown v. Mattson Technology, et al., Case No. RG16804802. The complaint alleges, among other things, that Mattson’s directors breached their fiduciary duties by approving the Merger Agreement and issuing an incomplete and misleading Preliminary Proxy Statement, and that Mattson, Parent, and Merger Sub aided and abetted the alleged breaches of fiduciary duty. The complaint seeks, among other things, either to enjoin the proposed transaction or to rescind it should it be consummated, as well as unspecified damages, including attorneys’ and experts’ fees.
On February 18, 2016, a putative shareholder class action complaint was filed in the United States District Court for the Northern District of California against the Board, captioned Talbert v. Mattson Technology, et al., No. 8:16-cv-00811-LHK. The complaint alleges, among other things, that Mattson and Mattson’s Board of Directors violated Sections 14(a) and 20(a) of the Securities Exchange Act of 1934 by making materially incomplete and misleading statements and/or omitting material information from the Preliminary Proxy Statement. The complaint seeks to enjoin the stockholder vote on the proposed transaction, unspecified damages, certain other equitable relief, and attorneys’ fees and costs.
Mattson is reviewing the complaints and has not yet formally responded to them, but believes the plaintiffs’ allegations are without merit and intends to defend against them vigorously. However, litigation is inherently uncertain and there can be no assurance regarding the likelihood that Mattson’s defense of these actions will be successful. Additional complaints containing substantially similar allegations may be filed in the future. We are unable at this time to estimate the effect of these lawsuits on our financial position, results of operations or cash flows.
Item 4. Mine Safety Disclosures
Not applicable.
23
PART II
Item 5. Market for Registrant's Common Equity, Related Stockholder Matters and Issuer Purchases of Equity Securities
Market for Registrant's Common Equity
Our common stock has been traded on The NASDAQ Global Select Market since our initial public offering on September 28, 1994. Our stock is quoted under the symbol “MTSN.” The following table sets forth the low and high trading prices as reported by The NASDAQ Global Select Market for the periods indicated:
Fiscal Year 2015 Quarter Ended | Fiscal Year 2014 Quarter Ended | ||||||||||||||||||||||||||||||
March 29, 2015 | June 28, 2015 | September 27, 2015 | December 31, 2015 | March 30, 2014 | June 29, 2014 | September 28, 2014 | December 31, 2014 | ||||||||||||||||||||||||
Low | $ | 3.11 | $ | 3.18 | $ | 2.20 | $ | 2.13 | $ | 2.27 | $ | 1.81 | $ | 2.00 | $ | 2.00 | |||||||||||||||
High | $ | 5.10 | $ | 3.99 | $ | 3.52 | $ | 3.68 | $ | 3.22 | $ | 2.64 | $ | 2.81 | $ | 3.69 | |||||||||||||||
On March 4, 2016, our common stock on the NASDAQ Global Select Market was $3.62 per share; and according to the records of our transfer agent, we had 155 stockholders of record of our common stock on that date. Because brokers and other institutions hold many of our shares on behalf of stockholders, we are unable to estimate the total number of stockholders represented by these record holders.
Dividends
We have never paid cash dividends on our common stock and have no present plans to pay cash dividends. We intend to retain all future earnings for use in our business. Additionally, our credit facility with Silicon Valley Bank restricts our ability to pay dividends, subject to certain limited exceptions.
Equity Compensation Plan Information
Information regarding our securities authorized for issuance under equity compensation plans will be included in Item 12. Security Ownership of Certain Beneficial Owners and Management and Related Stockholder Matters of this Annual Report on Form 10-K and is incorporated herein by reference.
24
Comparison of Stockholder Return
The following graph compares the cumulative five-year total return on Mattson Technology, Inc.'s common stock relative to the cumulative total returns of The NASDAQ Composite index and the NASDAQ Electronic Components index:
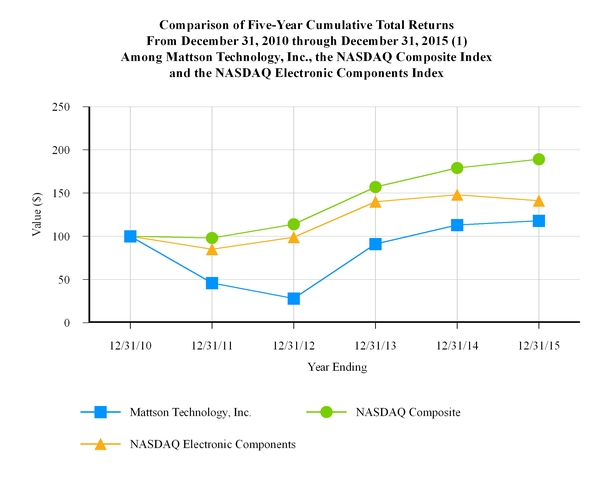
As of December 31, | |||||||||||
2010 | 2011 | 2012 | 2013 | 2014 | 2015 | ||||||
Mattson Technology, Inc. | 100 | 46 | 28 | 91 | 113 | 118 | |||||
NASDAQ Composite | 100 | 98 | 114 | 157 | 179 | 189 | |||||
NASDAQ Electronic Components | 100 | 85 | 99 | 140 | 148 | 141 | |||||
(1) Assumes that $100 was invested in Mattson Technology, Inc. common stock and in each index at market closing prices on December 31, 2010, and that all dividends were reinvested. No cash dividends have been declared on our common stock. Stockholder returns over the indicated period should not be considered indicative of future stockholder returns.
25
Item 6. Selected Financial Data
The following tables set forth the selected consolidated financial data for each of the years in the five-year period ended December 31, 2015. The selected consolidated financial data is qualified in its entirety and should be read in conjunction with the consolidated financial statements and accompanying notes and Management’s Discussion and Analysis of Financial Condition and Results of Operations. We have derived the consolidated statement of operations data for the years ended December 31, 2015, 2014 and 2013 and the consolidated balance sheets data as of December 31, 2015 and 2014 from the consolidated audited financial statements included in Item 8. Financial Statements and Supplementary Data in this Annual Report on Form 10-K. The consolidated statement of operations data for the years ended December 31, 2012 and 2011 and the consolidated balance sheets data as of December 31, 2013, 2012 and 2011 were derived from the consolidated audited financial statements that are not included in this Annual Report on Form 10-K. For presentation purposes, certain prior period amounts have been reclassified to conform to the reporting in the current period financial statements. These reclassifications do not affect our net income (loss), cash flows or stockholders' equity.
Consolidated Statements of Operations Data : | |||||||||||||||||||
(in thousands, except per share amounts) | |||||||||||||||||||
Year Ended December 31, | |||||||||||||||||||
2015 | 2014 | 2013 | 2012 | 2011 | |||||||||||||||
Net revenue | $ | 172,532 | $ | 178,404 | $ | 119,434 | $ | 126,526 | $ | 184,947 | |||||||||
Cost of goods sold | $ | 107,785 | $ | 119,587 | $ | 82,028 | $ | 81,626 | $ | 128,699 | |||||||||
Gross margin | $ | 64,747 | $ | 58,817 | $ | 37,406 | $ | 44,900 | $ | 56,248 | |||||||||
Income (loss) from operations | $ | 11,520 | $ | 10,113 | $ | (11,013 | ) | $ | (19,284 | ) | $ | (16,550 | ) | ||||||
Net income (loss) | $ | 10,315 | $ | 9,881 | $ | (10,975 | ) | $ | (19,319 | ) | $ | (17,950 | ) | ||||||
Net income (loss) per share: | |||||||||||||||||||
Basic | $ | 0.14 | $ | 0.14 | $ | (0.19 | ) | $ | (0.33 | ) | $ | (0.32 | ) | ||||||
Diluted | $ | 0.13 | $ | 0.13 | $ | (0.19 | ) | $ | (0.33 | ) | $ | (0.32 | ) | ||||||
Shares used in computing net income (loss) per share: | |||||||||||||||||||
Basic | 74,916 | 71,897 | 58,944 | 58,538 | 55,299 | ||||||||||||||
Diluted | 76,815 | 73,403 | 58,944 | 58,538 | 55,299 | ||||||||||||||
Consolidated Balance Sheets Data: | |||||||||||||||||||
(in thousands) | |||||||||||||||||||
December 31, | |||||||||||||||||||
2015 | 2014 | 2013 | 2012 | 2011 | |||||||||||||||
Cash, cash equivalents and restricted cash | $ | 35,238 | $ | 24,753 | $ | 16,665 | $ | 16,231 | $ | 32,950 | |||||||||
Working capital | $ | 79,870 | $ | 68,562 | $ | 26,996 | $ | 39,634 | $ | 54,300 | |||||||||
Total assets | $ | 123,313 | $ | 121,487 | $ | 95,923 | $ | 80,069 | $ | 113,843 | |||||||||
Total stockholders' equity | $ | 87,524 | $ | 75,110 | $ | 34,149 | $ | 43,292 | $ | 60,145 | |||||||||
26
Item 7. Management's Discussion and Analysis of Financial Condition and Results of Operations
The following discussion and analysis of our financial condition and results of operations should be read in conjunction with Item 6. “Selected Financial Data,” our consolidated financial statements and related notes included elsewhere in this document. In addition to historical information, the discussion below contains certain forward‑looking statements that involve risks and uncertainties. These forward-looking statements include, but are not limited to, those matters discussed under the heading “Forward-looking Statements.” Our actual results could differ materially from those anticipated by these forward‑looking statements due to various factors, including, but not limited to, those set forth under Item 1A. Risk Factors in this Annual Report on Form 10-K and elsewhere in this document.
Overview
We are a supplier of semiconductor wafer processing equipment used in the fabrication of integrated circuits ("ICs"). Our manufacturing equipment is primarily used for semiconductor manufacturing, utilizing innovative technology to deliver advanced processing capabilities and high productivity for the fabrication of current and next-generation ICs. We were incorporated in California in 1988 and reincorporated in Delaware in 1997.
Our business depends upon capital expenditures by the manufacturers of semiconductor devices. The level of capital expenditures by these manufacturers depends upon the current and anticipated market demand for such devices which is dependent upon the consumer product industry. Since the demand for semiconductor devices is highly cyclical, the demand for wafer processing equipment is also highly cyclical. The semiconductor equipment industry is typically characterized by wide swings in operating results as the industry rotates between cycles.
A summary of our major products is as follows:
• | Our etch products, specifically our paradigmE XP systems, continue to run high volume production in advanced DRAM, NAND and 3D-NAND wafer fabs. The combination of the paradigmE XP’s technical capabilities and high productivity have established an etch market position in the memory segment. |
• | Our conventional RTP product, the Helios XP, has established industry leading technical performance in 20 nanometer foundry/logic and memory volume production sites with its dual side wafer heating and differential thermal energy control. |
• | Our millisecond anneal system, the Millios, is running advanced foundry/logic volume production at multiple manufacturing sites. The Millios, with our proprietary arc lamp technology, achieves leading device performance as well as higher production throughput and system availability. |
• | Our dry strip products continue to make a steady contribution to our business. |
As of December 31, 2015, we had cash, cash equivalents and restricted cash of $35.2 million and working capital of $79.9 million.
We believe our available financial resources are sufficient to fund our working capital and other capital requirements over the course of the next twelve months. As a result of the restructuring activities and operational improvements over the past few years, our expected quarterly cash flow break-even point approximates a low-point of $30.0 million in quarterly net revenue. We will continue to review our operations and take further actions, as necessary, to minimize the cash used in operations and retain sufficient liquidity to fund our operating activities. However, improvements in our results of operations and resulting cash position are largely dependent upon the continuation of improvements and maintenance of stability in the semiconductor equipment industry.
The future success of our business will depend on numerous factors, including, but not limited to, the market demand for semiconductors and semiconductor wafer processing equipment. Such factors also will include our ability to (a) enhance our competitiveness and profitability; (b) develop and bring to market new products that address our customers' needs; (c) grow customer loyalty through collaboration with and support of our customers; (d) maintain a cost structure that will enable us to operate effectively and profitably throughout changing industry cycles; and (e) generate the gross margin necessary to enable us to make the necessary investments in our business.
27
Recent Developments
On December 1, 2015, we entered into an Agreement and Plan of Merger (the “Merger Agreement”) with Beijing E-town Dragon Semiconductor Industry Investment Center (Limited Partnership), a People's Republic of China ("PRC") limited partnership (“Parent”), providing for the merger of an indirect subsidiary of Parent (“Merger Sub”) with and into Mattson (the “Merger”), with Mattson surviving the Merger as a subsidiary of Parent. The Merger Agreement was unanimously approved by our Board of Directors.
Pursuant to the terms and subject to the conditions of the Merger Agreement, at the Effective Time of the Merger, each share of our common stock, par value $0.001 per share, outstanding immediately prior to the Effective Time will be cancelled and automatically converted into the right to receive $3.80 in cash, without interest, excluding any shares owned by us, Parent or Merger Sub or any of their respective wholly-owned subsidiaries (which will be cancelled) and any shares with respect to which appraisal rights have been properly exercised under Delaware law.
The closing of the Merger is subject to the adoption of the Merger Agreement by the affirmative vote of holders of a majority of the outstanding shares of our common stock. The obligations of the parties to consummate the Merger are also subject to the satisfaction (or waiver, if applicable) of various customary conditions, including (i) the expiration or termination of the applicable waiting period under the Hart-Scott-Rodino Antitrust Improvements Act of 1976, as amended, (ii) filings and approvals with or by certain governmental authorities, including governmental authorities in the PRC and Taiwan, (iii) the absence of certain governmental orders prohibiting the Merger, (iv) the accuracy of the representations and warranties of each party contained in the Merger Agreement (subject to certain materiality qualifications) and (v) each party’s compliance with or performance of the covenants and agreements in the Merger Agreement in all material respects.
See Note 4. Business Combinations in the notes to the consolidated financial statements included in this Annual Report on Form 10-K for additional details related to the pending Merger.
Critical Accounting Policies and Use of Estimates
Management's Discussion and Analysis of Financial Condition and Results of Operations discusses our consolidated financial statements, which have been prepared in accordance with accounting principles generally accepted in the United States of America. The preparation of these financial statements requires management to make estimates and assumptions that affect the reported amounts of assets and liabilities, the disclosure of contingent assets and liabilities at the date of the financial statements and the reported amounts of revenues and expenses during the reporting periods. On an on-going basis, management evaluates its estimates and judgments, including those related to excess and obsolete inventory, warranty obligations, bad debts, income taxes, restructuring costs, contingencies and litigation. Management bases its estimates and judgments on historical experience and on various other factors that are believed to be reasonable under the circumstances. These form the basis for making judgments about the carrying values of assets and liabilities that are not readily apparent from other sources. Actual results may differ from these estimates under different assumptions or conditions.
We consider our accounting policies related to revenue recognition, allowance for doubtful accounts, warranty obligations, inventories, fair value measurements of assets and liabilities, restructuring, income taxes, stock-based compensation and long-lived assets as critical to our business operations and an understanding of our results of operations.
Revenue Recognition. We derive revenues from the following primary sources - equipment (tool or system) sales, spare part sales and service and maintenance contracts. In accordance with the authoritative guidance on revenue recognition, we recognize revenue on equipment sales as follows: 1) for equipment sales of existing products with new specifications and for sales of new products, revenue is recognized upon customer acceptance; 2) for equipment sales to existing customers with previously demonstrated equipment acceptance, or equipment sales to new customers purchasing equipment with established reliability, we recognize revenue on a multiple element approach in which revenue is recognized upon the delivery of the separate elements to the customer. The revenue we recognize on a delivered element is limited to the amount that is not contingent upon the delivery of additional items such as installation and customer acceptance, and upon transfer of title. For equipment sales we generally recognize revenue for 90 percent of the total invoice amount as revenue upon shipment while 100 percent of the equipment's cost is recognized upon shipment. The remaining portion, generally 10 percent of the total invoice amount, is contingent upon customer acceptance and is recognized once installation services are completed and final customer acceptance of the equipment is received.
28
The revenue relating to the undelivered elements is deferred using the relative selling price method, which allocates revenue to each element using the estimated selling prices for the deliverables when vendor-specific objective evidence or third-party evidence is not available. We have determined that the fair value of installation services is substantially less than the 10 percent of the total invoice amount typically assigned to the installation element in our customer agreements. As such, since the amount collectible upon successful installation and customer acceptance exceeds the fair value of the installation services, we defer the amount collectible upon successful installation and customer acceptance.
From time to time, we allow customers to evaluate equipment, with the customer maintaining the right to return the equipment at its discretion with limited or no penalty. For this type of arrangement, we do not recognize revenue until customer acceptance is received. For spare parts, we recognize revenue upon shipment. For service and maintenance contracts, we recognize revenue on a straight-line basis over the service period of the related contract or as services are performed. In all cases, revenue is only recognized when persuasive evidence of an arrangement exists, delivery has occurred, the price is fixed or determinable and collectability is reasonably assured. Accounts receivable for which revenue has not been recognized are classified as advance billings.
Allowance for Doubtful Accounts. We perform ongoing credit evaluations of our customers and record specific allowances for doubtful accounts when a customer is unable to meet its financial obligations, as in the case of bankruptcy filings or deteriorated financial position. We estimate the allowance for doubtful accounts for all other customers based on factors such as current trends, the length of time the receivables are past due and historical collection experience. We write-off a receivable when all rights, remedies and recourses against the account and its principals are exhausted and record a benefit when previously reserved accounts are collected.
Warranty. The warranty we offer on equipment sales is generally twelve months, except where previous customer agreements state otherwise. A provision for the estimated cost of warranty, based on historical costs, is recorded as a cost of goods sold when the revenue is recognized for the sale of the related equipment. Our warranty obligations require us to repair or replace defective products or parts during the warranty period at no cost to the customer. The actual system performance and/or field expense profiles may differ from historical experience, and in those cases we adjust our warranty reserves accordingly. Actual warranty reserves and settlements against reserves are highly dependent on our equipment volumes.
Inventory Valuation. We assess the valuation of all inventories, including manufacturing raw materials, work-in-process, finished goods and spare parts, at the end of each reporting period. Although we attempt to forecast future inventory demand, given the competitive pressures and cyclical nature of the semiconductor industry, there may be significant unanticipated changes in demand or technological developments that could have a significant impact on the value of our inventories and reported operating results in future periods. The carrying value of our inventory is reduced for estimated excess and obsolescence, which is the difference between its cost and the estimated market value based upon assumptions about future demand. We evaluate the inventory carrying value for potential excess and obsolete inventory exposures by analyzing historical and anticipated demand. In addition, inventories are evaluated for potential obsolescence due to the effect of known and anticipated engineering change orders and new products. If actual demand were to be substantially lower than estimated, additional inventory adjustments for excess or obsolete inventory might be required, which could have a material adverse effect on our business, financial condition and results of operations.
Fair Value Measurements of Assets and Liabilities. We measure certain of our assets at fair value, using observable market data. The authoritative guidance on fair value measurement defines fair value as an exit price, representing the amount that would be received to sell an asset or paid to transfer a liability in an orderly transaction between market participants at the measurement date, and establishes valuation hierarchy based on the level of independent objective evidence available regarding the value of assets or liabilities. The authoritative guidance also establishes three classes of assets or liabilities: Level 1 consists of assets and liabilities for which there are quoted prices for identical instruments in active markets; Level 2 consists of assets and liabilities for which observable inputs other than Level 1 inputs are used such as prices for similar assets or liabilities in active markets or for identical assets or liabilities in less active markets and model-derived valuations for which the variables are derived from or corroborated by observable market data; and Level 3 consists of assets and liabilities for which there are unobservable inputs to the valuation methodology that are significant to the measurement of the fair value. The category within the valuation hierarchy is based on the lowest level of input that is significant to the fair value measurement. Our cash equivalents are classified within Level 1 of the fair value hierarchy, as these instruments are valued using quoted market prices. We had no assets or liabilities classified within Level 2 or 3 as of December 31, 2015 and 2014.
Restructuring. We recognize expenses related to employee termination benefits when the benefit arrangement is communicated to the employee and no significant future services are required of the employee. If an employee is required to
29
render service until a specific termination date, which goes beyond the legal requirement or contractual notice period, in order to receive the termination benefits, the fair value of the associated liability would be recognized ratably over the future service period. Severance costs are determined in accordance with local statutory requirements and our policies.
We recognize the present value of facility lease termination obligations, net of estimated sublease income and other exit costs, when there are future lease payments with no future economic benefit. Sublease income is estimated based on current market rates for similar properties. If we are unable to sublease the facility on a timely basis or if we are forced to sublease the facility at lower rates due to changes in market conditions, we would adjust the restructuring liability accordingly.
Income Taxes. We recognize the tax benefit from an uncertain tax position only if it is more likely than not that the tax position will be sustained on examination by taxing authorities, based on the technical merits of the position. The tax benefits recognized in the financial statements from such a position are measured based on the largest benefit that has a greater than fifty percent likelihood of being realized upon ultimate resolution.
For all tax jurisdictions, except Korea, we recorded a 100 percent valuation allowance against our net deferred tax asset as we expect it is more likely than not that we will not realize our net deferred tax asset as of December 31, 2015. In assessing the need for a valuation allowance, we consider historical levels of income and losses, expectations and risks associated with estimates of future taxable income and ongoing prudent and feasible tax planning strategies. In the event we determine that we would be able to realize additional deferred tax assets in the future in excess of the net recorded amount, or if we subsequently determine that realization of an amount previously recorded is unlikely, we would record an adjustment to the deferred tax asset valuation allowance, which would change income in the period of the adjustment.
Stock-based Compensation. We measure the fair value of all stock-based awards, including stock options, restricted stock units, and purchase rights under our employee stock purchase plan, on the date of grant and recognize the related stock-based compensation expense on a straight-line basis over the requisite service period, which is generally the vesting period.
We use the Black-Scholes option-pricing model to determine the fair value of certain of our stock-based awards. The determination of fair value using the Black-Scholes model is affected by our stock price as well as assumptions regarding a number of complex and subjective variables, which includes expected stock price volatility over the term of the awards, actual and projected employee exercise and cancellation behaviors, risk-free interest rates, and expected dividends.
We estimate the expected life of options based on an analysis of our historical experience of employee exercise and post-vesting termination behavior considered in relation to the contractual life of the option; expected volatility is based on the historical volatility of our common stock; and the risk-free interest rate is equal to the U.S. Treasury rate with a maturity approximating the expected life of the option. We do not currently pay cash dividends on our common stock and do not anticipate doing so in the foreseeable future; accordingly, the expected dividend yield is zero.
We estimate forfeiture rates on stock-based awards at the time of grant and revise those estimates in subsequent periods if actual forfeitures differ from those estimates. Such forfeiture estimates are based on historical experience. If the assumptions for estimating stock-based compensation expense change in future periods, the amount of future stock-based compensation may differ significantly from the amount that we recorded in the current and prior periods.
Long-Lived Assets We review our long-lived assets, including property and equipment and intangibles, for impairment whenever events or changes in circumstances indicate that the carrying amounts of these assets may not be recoverable. Recoverability is measured by a comparison of the assets' carrying amount to their expected future undiscounted net cash flows. If such assets are considered to be impaired, the impairment to be recognized is measured based on the amount by which the carrying amount of the asset exceeds its fair value.
Recent Accounting Pronouncements
Information with respect to recent accounting pronouncements may be found in Note 1. Basis of Presentation and Significant Accounting Policies in the notes to the consolidated financial statements included in this Annual Report on Form 10-K, which section is incorporated herein by reference.
30
Results of Operations
A summary of our results of operations for the years ended December 31 are as follows (in thousands, except for percentages):
2015 | 2014 | Increase (Decrease) | |||||||||||||||||||
Amount | Percent | Amount | Percent | Amount | Percent | ||||||||||||||||
Net revenue | $ | 172,532 | 100.0 | $ | 178,404 | 100.0 | $ | (5,872 | ) | (3.3 | ) | ||||||||||
Cost of goods sold | 107,785 | 62.5 | 119,587 | 67.0 | (11,802 | ) | (9.9 | ) | |||||||||||||
Gross margin | 64,747 | 37.5 | 58,817 | 33.0 | 5,930 | 10.1 | |||||||||||||||
Operating expenses: | |||||||||||||||||||||
Research, development and engineering | 18,831 | 10.9 | 19,426 | 10.9 | (595 | ) | (3.1 | ) | |||||||||||||
Selling, general and administrative | 31,870 | 18.5 | 28,866 | 16.2 | 3,004 | 10.4 | |||||||||||||||
Restructuring and other charges | 2,526 | 1.5 | 412 | 0.2 | 2,114 | 513.1 | |||||||||||||||
Total operating expenses | 53,227 | 30.9 | 48,704 | 27.3 | 4,523 | 9.3 | |||||||||||||||
Income from operations | 11,520 | 6.7 | 10,113 | 5.7 | 1,407 | 13.9 | |||||||||||||||
Interest income (expense), net | (135 | ) | (0.1 | ) | (228 | ) | (0.2 | ) | 93 | (40.8 | ) | ||||||||||
Other income (expense), net | (208 | ) | (0.1 | ) | 335 | 0.2 | (543 | ) | n/m | (1) | |||||||||||
Income before income taxes | 11,177 | 6.5 | 10,220 | 5.7 | 957 | 9.4 | |||||||||||||||
Provision for income taxes | 862 | 0.5 | 339 | 0.2 | 523 | 154.3 | |||||||||||||||
Net income | $ | 10,315 | 6.0 | $ | 9,881 | 5.5 | $ | 434 | 4.4 | ||||||||||||
2014 | 2013 | Increase (Decrease) | |||||||||||||||||||
Amount | Percent | Amount | Percent | Amount | Percent | ||||||||||||||||
Net revenue | $ | 178,404 | 100.0 | $ | 119,434 | 100.0 | $ | 58,970 | 49.4 | ||||||||||||
Cost of goods sold | 119,587 | 67.0 | 82,028 | 68.7 | 37,559 | 45.8 | |||||||||||||||
Gross margin | 58,817 | 33.0 | 37,406 | 31.3 | 21,411 | 57.2 | |||||||||||||||
Operating expenses: | |||||||||||||||||||||
Research, development and engineering | 19,426 | 10.9 | 16,915 | 14.1 | 2,511 | 14.8 | |||||||||||||||
Selling, general and administrative | 28,866 | 16.2 | 27,842 | 23.3 | 1,024 | 3.7 | |||||||||||||||
Restructuring and other charges | 412 | 0.2 | 3,662 | 3.1 | (3,250 | ) | (88.7 | ) | |||||||||||||
Total operating expenses | 48,704 | 27.3 | 48,419 | 40.5 | 285 | 0.6 | |||||||||||||||
Income (loss) from operations | 10,113 | 5.7 | (11,013 | ) | (9.2 | ) | 21,126 | n/m | (1) | ||||||||||||
Interest income (expense), net | (228 | ) | (0.2 | ) | (494 | ) | (0.4 | ) | 266 | (53.8 | ) | ||||||||||
Other income (expense), net | 335 | 0.2 | (10 | ) | — | 345 | n/m | (1) | |||||||||||||
Income (loss) before income taxes | 10,220 | 5.7 | (11,517 | ) | (9.6 | ) | 21,737 | n/m | (1) | ||||||||||||
Provision for (benefit from) income taxes | 339 | 0.2 | (542 | ) | (0.4 | ) | 881 | n/m | (1) | ||||||||||||
Net income (loss) | $ | 9,881 | 5.5 | $ | (10,975 | ) | (9.2 | ) | $ | 20,856 | n/m | (1) | |||||||||
(1)Not meaningful.
31
Net Revenue
A summary of our net revenues for the years ended December 31 are as follows (in thousands, except for percentages):
Increase (Decrease) | Increase (Decrease) | ||||||||||||||||||||||||
2015 | 2014 | Amount | Percent | 2013 | Amount | Percent | |||||||||||||||||||
Net revenue: | |||||||||||||||||||||||||
United States | $ | 25,061 | $ | 25,716 | $ | (655 | ) | (2.5 | ) | $ | 12,350 | $ | 13,366 | 108.2 | |||||||||||
International: | |||||||||||||||||||||||||
Korea | 73,798 | 87,585 | (13,787 | ) | (15.7 | ) | 22,173 | 65,412 | 295.0 | ||||||||||||||||
Taiwan | 17,537 | 32,304 | (14,767 | ) | (45.7 | ) | 50,782 | (18,478 | ) | (36.4 | ) | ||||||||||||||
China | 29,209 | 17,369 | 11,840 | 68.2 | 20,250 | (2,881 | ) | (14.2 | ) | ||||||||||||||||
Other Asia | 19,560 | 6,869 | 12,691 | 184.8 | 8,740 | (1,871 | ) | (21.4 | ) | ||||||||||||||||
Europe and others | 7,367 | 8,561 | (1,194 | ) | (13.9 | ) | 5,139 | 3,422 | 66.6 | ||||||||||||||||
147,471 | 152,688 | (5,217 | ) | (3.4 | ) | 107,084 | 45,604 | 42.6 | |||||||||||||||||
Total net revenue | $ | 172,532 | $ | 178,404 | $ | (5,872 | ) | (3.3 | ) | $ | 119,434 | $ | 58,970 | 49.4 | |||||||||||
The decrease in net revenue during the year ended December 31, 2015 as compared to 2014, was primarily attributable to lower overall net revenue from our etch systems, partially offset by higher revenue from spares, service and upgrades. During 2015, net revenue from customers in Asia continued to account for a significant portion of our total net revenue. For the year ended December 31, 2015 and 2014, international sales comprised approximately 85 percent and 86 percent, respectively, of our total net revenue.
The increase in net revenue during the year ended December 31, 2014 as compared to 2013, was largely attributable to higher overall net revenue from our etch systems into memory applications as well as growth in our Millios shipments to 20 nanometer and sub-20 nanometer production sites in the foundry and logic sector. For the year ended December 31, 2014 and 2013, international sales comprised approximately 86 percent and 90 percent, respectively, of our total net revenue. Revenue in Korea increased approximately $65.4 million in 2014, or 295 percent, primarily as a result of increased demand in the memory segment for our etch products.
Cost of Goods Sold and Gross Margin
Our cost of goods sold consists of the costs associated with manufacturing our products, and includes the purchase of raw materials and related overhead, labor, warranty costs and charges for excess and obsolete inventory.
Our gross margin increased approximately 5 percentage points from 33 percent in 2014 to 38 percent in 2015. Gross margin in 2015 was positively impacted as compared to 2014 by an increase in high margin revenue from spares, service and upgrades and as a result of a net benefit from the recognition of deferred revenue relating to previously shipped systems awaiting acceptance.
Our gross margin increased 2 percentage points from 31 percent in 2013 to 33 percent in 2014. The increase in gross margin in 2014 was primarily attributable to improved absorption of fixed costs resulting from the increase in production as well as a more favorable product mix, partially offset by higher than expected installation and warranty costs for certain of our newer products.
Our gross margin has varied over the years and will continue to be affected by many factors, including competitive pressures, product mix, inventory reserves, economies of scale, material and other costs, overhead absorption levels and the timing of revenue recognition.
Operating Expenses
Our financial results for the years ended December 31, 2015 and 2014 continued to benefit from the favorable impact of our cost reduction initiatives in 2012 and 2013, including the consolidation of our manufacturing and research and development facilities, moving a portion of our outsourced spare parts logistics operations in-house, and workforce reductions. Our total
32
operating expenses increased approximately 9 percent in 2015 as compared to 2014, and remained relatively flat in 2014 as compared to 2013.
Research, Development and Engineering
Research, development and engineering expenses consist primarily of salaries and related costs of employees engaged in research, development and engineering activities, costs of product development and depreciation on equipment used in the course of research, development and engineering activities.
Research, development and engineering expenses decreased by $0.6 million, or 3 percent, in 2015 as compared to 2014. The decrease was primarily attributable to a decrease in spending on outside services and a decrease in employee-related costs.
Research, development and engineering expenses increased by $2.5 million, or 15 percent, in 2014 as compared to 2013. The increase was largely attributable to an increase in activity resulting from the development of new process applications for our products and an increase in salaries and related costs due to the termination of a work furlough program in the third quarter of 2013.
Selling, General and Administrative
Selling, general and administrative expenses consist primarily of employee-related expenses, as well as legal and professional fees, insurance costs, amortization of evaluation systems and certain facilities and information technology costs.
Selling, general and administrative expenses increased by $3.0 million, or 10 percent, in 2015 as compared to 2014. The increase in selling, general and administrative expenses was primarily due to an increase in employee-related costs to support customer engagements and general business activities.
Selling, general and administrative expenses increased by $1.0 million, or 4 percent, in 2014 as compared to 2013. The increase in selling, general and administrative expenses was primarily due to increased investments in headcount and infrastructure to support the higher revenue levels and an increase in salaries and related costs due to the termination of a work furlough program in the third quarter of 2013.
Restructuring and Other Charges
For the year ended December 31, 2015, restructuring and other charges included $2.5 million in professional fees and deal -related costs associated with the Merger Agreement with Parent.
For the year ended December 31, 2014, restructuring charges included $0.5 million related to workforce reductions and a $0.1 million benefit from a revised estimate of our future rent obligations for one of our vacant facilities.
For the year ended December 31, 2013, restructuring charges included $2.8 million in employee severance and other costs relating primarily to recruiting costs for our new chief executive officer and severance expense for our former chief executive officer totaling approximately $0.6 million, as well as other workforce reductions. We also incurred $0.8 million in contract termination costs related to future rent obligations, net of sublease income, associated with two vacated leased facilities.
As of December 31, 2015, we had a minimal balance in accrued restructuring charges, which was classified within other current liabilities in our consolidated balance sheet. As of December 31, 2015, we also had approximately $2.5 million in accounts payable related to professional fees and deal-related costs associated with the Merger Agreement with Parent. As of December 31, 2014, we had $0.4 million in accrued restructuring charges, which was classified within other current liabilities in our consolidated balance sheet.
Interest Income (Expense), net
Interest income (expense), net was $0.1 million, $0.2 million and $0.5 million in expense in 2015, 2014 and 2013, respectively, which primarily consisted of interest charges on borrowings under our credit facility.
33
Other Income (Expense), net
Other income (expense), net was $0.2 million of expense in 2015, $0.3 million of income in 2014, and a de minimis expense in 2013, which primarily consisted of foreign currency exchange gains and losses related to the re-measurement of inter-company balances denominated in foreign currencies.
Provision for (Benefit from) Income Taxes
In 2015, there was a net provision for income taxes of $0.9 million, which consisted of $0.1 million of deferred tax expense relating to an accrual for deferred tax liability on foreign earnings that may be repatriated and current foreign taxes of $0.7 million and current state taxes of $0.1 million.
In 2014, there was a net provision for income taxes of $0.3 million, which consisted of $0.1 million of deferred tax expense relating to an accrual for deferred tax liability on foreign earnings that may be repatriated and current foreign taxes of $0.3 million, partially offset by a $0.2 million benefit from the release of a foreign reserve.
In 2013, there was a net benefit from income taxes of $0.5 million, which consisted of a $0.6 million benefit from the release of various Federal and foreign reserves due to the lapse of the statute of limitations, partially offset by foreign and state taxes of $0.1 million.
We have provided a full valuation allowance against deferred tax assets for all jurisdictions, except for Korea, due to uncertainties and other negative evidence in our current operations and our expectations of future operations. It is more likely than not that our deferred tax assets will not be realized. Our income tax provision could be favorably impacted going forward if our results of operations and forecasts for future profitability improve sufficiently to indicate that the related deferred tax assets will be realized. Such a change in management's expectations could result in a material change to our valuation allowance assessment and the resulting income tax provision.
Liquidity and Capital Resources
Our cash and cash equivalents as of December 31, 2015 and 2014 were $33.4 million and $22.8 million, respectively. Working capital as of December 31, 2015 was $79.9 million, compared to $68.6 million as of December 31, 2014. Stockholders' equity as of December 31, 2015 was $87.5 million, compared to $75.1 million as of December 31, 2014. The aforementioned increases in working capital and stockholders' equity are primarily related to an increase in net cash from operations and 1.6 million newly issued shares of common stock from stock option exercises and shares issued in connection with our employee stock purchase plan, which resulted in net proceeds of approximately $1.7 million.
The net increases (decreases) in cash and cash equivalents are summarized in the following table (in thousands):
Year Ended December 31, | |||||||||||
2015 | 2014 | 2013 | |||||||||
Net cash provided by (used in) operating activities | $ | 10,741 | $ | (7,658 | ) | $ | (12,836 | ) | |||
Net cash used in investing activities | (1,190 | ) | (1,314 | ) | (1,373 | ) | |||||
Net cash provided by financing activities | 1,701 | 18,213 | 14,187 | ||||||||
Effect of exchange rate changes on cash and cash equivalents | (585 | ) | (1,059 | ) | 246 | ||||||
Net increase (decrease) in cash and cash equivalents | $ | 10,667 | $ | 8,182 | $ | 224 | |||||
Liquidity and Capital Resources Outlook
On April 12, 2013, we entered into a three-year $25.0 million senior secured revolving credit facility with Silicon Valley Bank. On October 21, 2014, we entered into Amendment Agreement No. 4 with Silicon Valley Bank ("Amendment"), which extends the term of our credit facility to October 12, 2017. In the absence of an event of default, any amounts outstanding under the credit facility may be repaid and re-borrowed anytime until the termination date. This Amendment also allows us to make a one-time request to increase the existing credit facility up to an additional $25.0 million. Under the Amendment, the advances available to us under the borrowing base formula increased to 85 percent of eligible accounts receivable and advance billings and 50 percent of eligible inventory. As of December 31, 2015, we had no outstanding borrowings under the credit facility. As of December 31, 2015, the effective interest rate on any outstanding borrowing would have been 3.50 percent per annum.
34
We believe our available financial resources are sufficient to fund our working capital and other capital requirements over the course of the next twelve months. Our operations require careful management of our cash and working capital balances. Our liquidity is affected by many factors including, among others, fluctuations in our net revenue, gross margin and operating expenses, as well as changes in our operating assets and liabilities. The cyclical nature of the semiconductor industry makes it difficult to predict our future liquidity needs with certainty. Any upturn in the semiconductor industry would result in short-term uses of cash to fund inventory purchases. In addition, any ineffectiveness in our cost containment efforts may cause us to incur additional losses in the future and lower our cash balances. We may need additional funds to support our working capital requirements and operating expenses, or for other requirements.
Improvements in our results of operations and resulting cash position are largely dependent upon an improvement in the semiconductor equipment industry. We periodically review our liquidity position and may decide to raise additional funds on an opportunistic basis from sources such as an asset-backed financing agreement or the issuance of equity or debt securities through public or private financings. We currently have an effective omnibus shelf registration statement on file with the SEC that registers up to $25.5 million in securities that we may offer. These financing options may not be available on a timely basis, or on terms acceptable to us, and could be dilutive to our stockholders. If adequate funds are not available on acceptable terms, our ability to achieve our intended long-term business objectives could be limited.
On December 1, 2015, we entered into a Merger Agreement with Parent and Merger Sub, providing for the merger of Merger Sub into Mattson, with Mattson surviving as a subsidiary of Parent. If the Merger Agreement is terminated under certain circumstances, Mattson would have to pay a termination fee of approximately $8.6 million.
Operating Activities
Net cash provided by operations was $10.7 million in 2015, comprised primarily of $10.3 million in net income and $5.3 million of non-cash charges, partially offset by a $4.9 million decrease in cash reflected in the net change in assets and liabilities. Non-cash charges consisted primarily of $2.9 million of depreciation and amortization and $2.3 million of stock-based compensation. Cash flow decreases resulting from the net change in assets and liabilities primarily consisted of a $12.9 million increase in inventory resulting from the receipt of inventory intended for sale in future quarters; a $5.3 million decrease in accounts payable largely attributable to the timing of purchases and payments to vendors and service providers; a $4.7 million decrease in deferred revenue; and a $0.4 million decrease in accrued compensation and benefits and other current liabilities, which primarily consists of a $0.4 million decrease in accrued restructuring charges and a $0.3 million decrease in accrued value added taxes, partially offset by a $0.2 million increase in warranty accruals based on the product mix of shipments throughout 2015; partially offset by a $14.8 million decrease in accounts receivable and advance billings attributable to the timing of shipments and collections; a $3.2 million decrease in prepaid expenses and other current assets; a $0.3 million increase in other liabilities; and a $0.3 million decrease in other assets.
Net cash used in operations was $7.7 million in 2014, comprised primarily of a $22.1 million decrease in cash reflected in the net change in assets and liabilities, partially offset by $9.9 million in net income and $4.5 million of non-cash charges. Cash flow decreases resulting from the net change in assets and liabilities primarily consisted of an $8.6 million increase in accounts receivable and advance billings attributable to shipments late in the fourth quarter for which collections are anticipated primarily in early 2015; a $7.5 million increase in inventory resulting from the receipt of inventory intended for sale in future quarters; a $4.9 million increase in prepaid expenses and other current assets, which primarily relates to a $3.7 million increase in prepaid inventory intended for sale in future quarters; a $4.0 million decrease in accounts payable largely attributable to the timing of purchases and payments to vendors and service providers; a $0.8 million decrease in deferred revenue; and a $0.4 million decrease in other liabilities; partially offset by $4.1 million increase in accrued compensation and benefits and other current liabilities, which primarily consists of a $1.5 million increase in accrued value-added taxes, a $1.2 million increase in accrued employee bonuses for 2014 and a $1.0 million increase in warranty accruals based on the higher volume and product mix of shipments throughout 2014. Non-cash charges consisted primarily of $2.8 million of depreciation and amortization and $1.5 million of stock-based compensation.
35
Net cash used in operations was $12.8 million in 2013, comprised primarily of $11.0 million in net loss and a $6.7 million decrease in cash reflected in the net change in assets and liabilities, partially offset by non-cash charges of $4.8 million. Cash flow decreases resulting from the net change in assets and liabilities primarily consisted of a $12.3 million increase in accounts receivable and advance billings primarily due to the timing of billing and collections during the fourth quarter of 2013, with our increased equipment sales back-end loaded during the quarter; and a $5.3 million increase in inventory; partially offset by a $10.1 million increase in accounts payable, accrued compensation and benefits, and other current liabilities primarily attributable to the timing of purchases and payments to vendors and service providers; and a $1.8 million increase in deferred revenue. Non-cash charges consisted primarily of $4.0 million of depreciation and amortization and $1.4 million of stock-based compensation.
Cash provided by operations may fluctuate in future periods as a result of a number of factors, including fluctuations in our net revenues and operating results, amount of revenue deferred, inventory purchases, collection of accounts receivable and timing of payments.
Investing Activities
Net cash used in investing activities was $1.2 million, $1.3 million and $1.4 million in 2015, 2014 and 2013, respectively, primarily consisting of purchases of property and equipment.
Financing Activities
Net cash provided by financing activities was $1.7 million in 2015 from the issuance of common stock in connection with stock option exercises and purchases under our employee stock purchase plan.
Net cash provided by financing activities was $18.2 million in 2014, which consisted of $31.7 million in net proceeds from our stock offering in February 2014 and $0.5 million from the issuance of common stock under our employee stock plans, partially offset by the repayment of $14.0 million of borrowings under our credit facility.
Net cash provided by financing activities was $14.2 million in 2013, which consisted of $13.6 million in proceeds from our credit facility, net of repayments and borrowing costs, and $0.6 million in proceeds from the issuance of common stock under our employee stock plans.
Off-Balance Sheet Arrangements
As of December 31, 2015, we did not have any significant "off-balance sheet" arrangements, as defined in Item 303 (a)(4)(ii) of Regulation S-K.
Contractual Obligations
Under U.S. generally accepted accounting principles, certain obligations and commitments are not required to be included in our Consolidated Balance Sheets. These obligations and commitments, while entered into in the normal course of business, may have a material impact on our liquidity.
Our contractual commitments as of December 31, 2015 are summarized in the following table (in thousands):
For the Years Ending December 31. | |||||||||||||||||||||||||||
2016 | 2017 | 2018 | 2019 | 2020 | Thereafter | Total | |||||||||||||||||||||
Operating leases | $ | 2,378 | $ | 2,288 | $ | 2,235 | $ | 2,272 | 2,324 | $ | 13,329 | $ | 24,826 | ||||||||||||||
Vendor commitments | 11,722 | — | — | — | — | — | 11,722 | ||||||||||||||||||||
Total | $ | 14,100 | $ | 2,288 | $ | 2,235 | $ | 2,272 | $ | 2,324 | $ | 13,329 | $ | 36,548 | |||||||||||||
In connection with our acquisition of Vortek Industries, Ltd. ("Vortek") in 2004, we became party to an agreement between Vortek and the Canadian Minister of Industries (the "Minister") relating to an investment in Vortek by Technology Partnerships Canada. Under the agreement, as amended, we, or Vortek (renamed Mattson Technology, Canada, Inc. ("MTC")) agreed to various terms, including (i) payment by us of a royalty to the Minister of 1.4 percent of net revenues from certain Flash RTP products, up to a total of C$14.3 million (approximately $10.3 million based on the applicable exchange rate as of December 31, 2015), (ii) MTC through October 27, 2009 maintaining a specified average workforce of employees in Canada,
36
making certain investments and complying with certain manufacturing, and (iii) certain other covenants concerning protection of intellectual property rights. Under the provisions of this agreement, if MTC is dissolved, files for bankruptcy or we, or MTC, do not materially satisfy the obligations pursuant to any material terms or conditions, the Minister could demand payment of liquidated damages in the amount of C$14.3 million less any royalties paid to the Minister. As of October 27, 2009, we were no longer subject to covenant (ii), as discussed above but are still subject to the remaining terms and conditions until the earlier of payment of the C$14.3 million royalty (approximately $10.3 million based on the applicable exchange rate as of December 31, 2015) or December 31, 2020. We have recorded approximately C$0.6 million in cumulative royalty charges to date. MTC was not dissolved upon the transition of our Canadian operations to Germany.
Item 7A. Quantitative and Qualitative Disclosures About Market Risks
We are exposed to various market risks related to fluctuations in foreign currency exchange rates and interest rates. We may use derivative financial instruments to mitigate certain risks related foreign exchange rates. We do not use derivatives or other financial instruments for trading or speculative purposes.
Interest Rate Risk
We are exposed to interest rate risk related to our borrowings. On April 12, 2013, we entered into a three-year $25.0 million senior secured revolving credit facility with Silicon Valley Bank. On October 21, 2014, we entered into Amendment Agreement No. 4 with Silicon Valley Bank, extending the term of our credit facility to October 12, 2017, and allowing us to make a one-time request to increase the existing credit facility up to an additional $25.0 million.
At our option, the borrowings under this credit facility can bear interest at an Alternate Base Rate (“ABR”) or Eurodollar Rate. ABR loans bear interest at a per annum rate equal to the greater of the Federal Funds Effective Rate plus 0.50 percent or the prime rate. Eurodollar loans bear interest at a margin over British Bankers' Association LIBOR Rate divided by 1 minus Eurocurrency Reserve Requirements. The applicable margin on a Eurodollar loan is 2.75 percent. As of December 31, 2015, we had no borrowings outstanding under the credit facility.
An increase in the interest rate on the credit facility by 1.0 percent would increase the annual interest expense by $0.3 million, assuming we had borrowed $25.0 million for the entire year.
We generally invest most of our cash in non-interest bearing bank accounts, an immediate increase or decrease in interest rates of 100 basis points would not have a material adverse effect on the fair value of our investment portfolio.
Foreign Currency Risk
The functional currency of our foreign subsidiaries is their local currencies. Accordingly, all assets and liabilities of these foreign operations are translated using exchange rates in effect at the end of the period, and net sales and costs are translated using average exchange rates for the period. Gains or losses from translation of foreign operations are included as a component of accumulated other comprehensive income in the accompanying consolidated balance sheets. Foreign currency transaction gains and losses are recognized in the accompanying consolidated statements of operations as they are incurred. Because much of our net revenues and capital spending are transacted in U.S. dollars, we are subject to fluctuations in foreign currency exchange rates that could have a material adverse effect on our overall financial position, results of operations or cash flows, depending on the strength of the U.S. dollar relative to the currencies of other countries in which we operate. Exchange rate fluctuations of greater than ten percent, primarily for the U.S. dollar relative to the Euro, South Korean won, New Taiwan dollar and Singapore dollar, could have a material impact on our financial statements. Additionally, foreign currency transaction gains and losses fluctuate depending upon the mix of foreign currency denominated assets and liabilities and whether the local currency of an entity strengthens or weakens during a period. As of December 31, 2015, our U.S. operations had approximately $0.4 million in foreign denominated operating inter-company receivables net of payables. It is estimated that a ten percent fluctuation in the U.S. dollar relative to these foreign currencies would lead to a minimal profit (U.S. dollar weakening), or a minimal loss (U.S. dollar strengthening) on the re-measurement of these inter-company payables, which would be recorded as other income (expense), net in our consolidated statement of operations.
We recorded $0.3 million net foreign currency exchange loss, $0.3 million net foreign currency exchange gain and $0.6 million net foreign currency exchange loss in the years ended December 31, 2015, 2014 and 2013, respectively, in other income (expense), net in our consolidated statements of operations.
37
Item 8. Financial Statements and Supplementary Data
INDEX TO CONSOLIDATED FINANCIAL STATEMENTS
Page | |
Consolidated Financial Statements: | |
Financial Statement Schedule: | |
38
Report of Independent Registered Public Accounting Firm
To the Board of Directors and Shareholders
Mattson Technology, Inc.
Fremont, CA
We have audited the accompanying consolidated balance sheets of Mattson Technology, Inc. and subsidiaries ("the Company") as of December 31, 2015 and 2014, and the related consolidated statements of operations, comprehensive income (loss), stockholders' equity, and cash flows for each of the years in the two-year period ended December 31, 2015. We also have audited the Company's internal control over financial reporting as of December 31, 2015, based on criteria established in Internal Control - Integrated Framework (2013) issued by the Committee of Sponsoring Organizations of the Treadway Commission (COSO). Our audits also included the financial statement schedule listed in the Index under Item 15(a)(2). The Company's management is responsible for these consolidated financial statements and schedule, for maintaining effective internal control over financial reporting, and for its assessment of the effectiveness of internal control over financial reporting, included in the accompanying Management's Report on Internal Control over Financial Reporting, appearing under Item 9A. Our responsibility is to express an opinion on these consolidated financial statements and schedule and an opinion on the Company's internal control over financial reporting based on our audits. The consolidated financial statements of the Company as of and for the years ended December 31, 2013 were audited by other auditors whose report dated March 17, 2014, expressed an unqualified opinion on those statements.
We conducted our audits in accordance with the standards of the Public Company Accounting Oversight Board (United States). Those standards require that we plan and perform the audits to obtain reasonable assurance about whether the financial statements are free of material misstatement and whether effective internal control over financial reporting was maintained in all material respects. Our audit of the financial statements included examining, on a test basis, evidence supporting the amounts and disclosures in the financial statements, assessing the accounting principles used and significant estimates made by management, and evaluating the overall financial statement presentation. Our audit of internal control over financial reporting included obtaining an understanding of internal control over financial reporting, assessing the risk that a material weakness exists, and testing and evaluating the design and operating effectiveness of internal control based on the assessed risk. Our audits also included performing such other procedures as we considered necessary in the circumstances. We believe that our audits provide a reasonable basis for our opinions.
A company's internal control over financial reporting is a process designed to provide reasonable assurance regarding the reliability of financial reporting and the preparation of financial statements for external purposes in accordance with generally accepted accounting principles. A company's internal control over financial reporting includes those policies and procedures that (1) pertain to the maintenance of records that, in reasonable detail, accurately and fairly reflect the transactions and dispositions of the assets of the company; (2) provide reasonable assurance that transactions are recorded as necessary to permit preparation of financial statements in accordance with generally accepted accounting principles, and that receipts and expenditures of the company are being made only in accordance with authorizations of management and directors of the company; and (3) provide reasonable assurance regarding prevention or timely detection of unauthorized acquisition, use, or disposition of the company's assets that could have a material effect on the financial statements.
Because of its inherent limitations, internal control over financial reporting may not prevent or detect misstatements. Also, projections of any evaluation of effectiveness to future periods are subject to the risk that controls may become inadequate because of changes in conditions, or that the degree of compliance with the policies or procedures may deteriorate.
In our opinion, the consolidated financial statements referred to above present fairly, in all material respects, the financial position of the Company as of December 31, 2015 and 2014, and the results of its operations and its cash flows for each of the years in the two-year period ended December 31, 2015 in conformity with accounting principles generally accepted in the United States of America. Also, in our opinion, the related financial statement schedule for the year ended December 31, 2015, when considered in relation to the consolidated financial statements as a whole, presents fairly in all material respects the information set forth therein. Also, in our opinion, the Company maintained, in all material respects, effective internal control over financial reporting as of December 31, 2015, based on criteria established in Internal Control - Integrated Framework (2013) issued by the Committee of Sponsoring Organizations of the Treadway Commission (COSO).
/s/ ArmaninoLLP
San Ramon, California
March 11, 2016
39
Report of Independent Registered Public Accounting Firm
To the Board of Directors and Stockholders of Mattson Technology, Inc.
In our opinion, the Consolidated Statements of Operations, Consolidated Statements of Comprehensive Loss, Stockholders’ Equity, and Cash Flows for the year ended December 31, 2013 present fairly, in all material respects, the results of operations and cash flows of Mattson Technology, Inc. and its subsidiaries for the year ended December 31, 2013, in conformity with accounting principles generally accepted in the United States of America. In addition, in our opinion, the financial statement schedule for the year ended December 31, 2013 presents fairly, in all material respects, the information set forth therein when read in conjunction with the related consolidated financial statements. These financial statements and financial statement schedule are the responsibility of the Company's management. Our responsibility is to express an opinion on these financial statements and financial statement schedule based on our audit. We conducted our audit of these statements in accordance with the standards of the Public Company Accounting Oversight Board (United States). Those standards require that we plan and perform the audit to obtain reasonable assurance about whether the financial statements are free of material misstatement. An audit includes examining, on a test basis, evidence supporting the amounts and disclosures in the financial statements, assessing the accounting principles used and significant estimates made by management, and evaluating the overall financial statement presentation. We believe that our audit provides a reasonable basis for our opinion.
/s/ PricewaterhouseCoopers LLP
San Jose, California
March 17, 2014
40
MATTSON TECHNOLOGY, INC.
CONSOLIDATED STATEMENTS OF OPERATIONS
(In thousands, except per share amounts)
Year Ended December 31, | |||||||||||
2015 | 2014 | 2013 | |||||||||
Net revenue | $ | 172,532 | $ | 178,404 | $ | 119,434 | |||||
Cost of goods sold | 107,785 | 119,587 | 82,028 | ||||||||
Gross margin | 64,747 | 58,817 | 37,406 | ||||||||
Operating expenses: | |||||||||||
Research, development and engineering | 18,831 | 19,426 | 16,915 | ||||||||
Selling, general and administrative | 31,870 | 28,866 | 27,842 | ||||||||
Restructuring and other charges | 2,526 | 412 | 3,662 | ||||||||
Total operating expenses | 53,227 | 48,704 | 48,419 | ||||||||
Income (loss) from operations | 11,520 | 10,113 | (11,013 | ) | |||||||
Interest income (expense), net | (135 | ) | (228 | ) | (494 | ) | |||||
Other income (expense), net | (208 | ) | 335 | (10 | ) | ||||||
Income (loss) before income taxes | 11,177 | 10,220 | (11,517 | ) | |||||||
Provision for (benefit from) income taxes | 862 | 339 | (542 | ) | |||||||
Net income (loss) | $ | 10,315 | $ | 9,881 | $ | (10,975 | ) | ||||
Net income (loss) per share: | |||||||||||
Basic | $ | 0.14 | $ | 0.14 | $ | (0.19 | ) | ||||
Diluted | $ | 0.13 | $ | 0.13 | $ | (0.19 | ) | ||||
Shares used in computing net income (loss) per share: | |||||||||||
Basic | 74,916 | 71,897 | 58,944 | ||||||||
Diluted | 76,815 | 73,403 | 58,944 | ||||||||
The accompanying notes are an integral part of these consolidated financial statements.
41
MATTSON TECHNOLOGY, INC.
CONSOLIDATED STATEMENTS OF COMPREHENSIVE INCOME (LOSS)
(In thousands)
Year Ended December 31, | |||||||||||
2015 | 2014 | 2013 | |||||||||
Net income (loss) | $ | 10,315 | $ | 9,881 | $ | (10,975 | ) | ||||
Other comprehensive loss, net of tax | |||||||||||
Changes in foreign currency translation adjustments | (1,882 | ) | (2,659 | ) | (148 | ) | |||||
Change in unrealized investment loss | — | — | (29 | ) | |||||||
Other comprehensive loss | (1,882 | ) | (2,659 | ) | (177 | ) | |||||
Comprehensive income (loss) | $ | 8,433 | $ | 7,222 | $ | (11,152 | ) | ||||
The accompanying notes are an integral part of these consolidated financial statements.
42
MATTSON TECHNOLOGY, INC.
CONSOLIDATED BALANCE SHEETS
(In thousands, except par value)
December 31, | |||||||
2015 | 2014 | ||||||
ASSETS | |||||||
Current assets: | |||||||
Cash and cash equivalents | $ | 33,427 | $ | 22,760 | |||
Accounts receivable, net of allowance for doubtful accounts of $672 as of December 31, 2015 and $669 as of December 31, 2014 | 21,685 | 33,578 | |||||
Advance billings | 1,639 | 4,653 | |||||
Inventories | 50,020 | 40,579 | |||||
Prepaid expenses and other current assets | 6,057 | 9,767 | |||||
Total current assets | 112,828 | 111,337 | |||||
Property and equipment, net | 8,236 | 7,534 | |||||
Restricted cash | 1,811 | 1,993 | |||||
Other assets | 438 | 623 | |||||
Total assets | $ | 123,313 | $ | 121,487 | |||
LIABILITIES AND STOCKHOLDERS' EQUITY | |||||||
Current liabilities: | |||||||
Accounts payable | $ | 16,912 | $ | 22,434 | |||
Accrued compensation and benefits | 4,707 | 4,601 | |||||
Deferred revenues, current | 5,144 | 9,110 | |||||
Other current liabilities | 6,195 | 6,630 | |||||
Total current liabilities | 32,958 | 42,775 | |||||
Deferred revenues, non-current | 375 | 1,160 | |||||
Other liabilities | 2,456 | 2,442 | |||||
Total liabilities | 35,789 | 46,377 | |||||
Commitments and contingencies (Note 7) | |||||||
Stockholders' equity: | |||||||
Preferred stock, 2,000 shares authorized; none issued and outstanding | — | — | |||||
Common stock, par value $0.001, 120,000 shares authorized; 79,853 shares issued and 75,443 shares outstanding as of December 31, 2015; 78,267 shares issued and 74,009 shares outstanding as of December 31, 2014 | 80 | 78 | |||||
Additional paid-in capital | 692,407 | 687,871 | |||||
Accumulated other comprehensive income | 16,289 | 18,171 | |||||
Treasury stock, 4,410 shares as of December 31, 2015 and 4,258 shares as of December 31, 2014 | (38,640 | ) | (38,083 | ) | |||
Accumulated deficit | (582,612 | ) | (592,927 | ) | |||
Total stockholders' equity | 87,524 | 75,110 | |||||
Total liabilities and stockholders' equity | $ | 123,313 | $ | 121,487 | |||
The accompanying notes are an integral part of these consolidated financial statements.
43
MATTSON TECHNOLOGY, INC.
CONSOLIDATED STATEMENTS OF STOCKHOLDERS' EQUITY
(In thousands)
Common Stock | Additional Paid-in Capital | Accumulated Other Comprehensive Income | Treasury Stock | ||||||||||||||||||||||||||
Shares | Amount | Shares | Amount | Accumulated Deficit | Total Stockholders' Equity | ||||||||||||||||||||||||
Balance at December 31, 2012 | 62,908 | $ | 63 | $ | 652,041 | $ | 21,007 | (4,181 | ) | $ | (37,986 | ) | $ | (591,833 | ) | $ | 43,292 | ||||||||||||
Net loss | — | — | — | — | — | — | (10,975 | ) | (10,975 | ) | |||||||||||||||||||
Other comprehensive loss, net of tax | — | — | — | (177 | ) | — | — | — | (177 | ) | |||||||||||||||||||
Shares issued under employee stock plan, net | 413 | — | 445 | — | — | — | — | 445 | |||||||||||||||||||||
Shares issued under employee stock purchase plan | 63 | — | 131 | — | — | — | — | 131 | |||||||||||||||||||||
Stock-based compensation expense | — | — | 1,433 | — | — | — | — | 1,433 | |||||||||||||||||||||
Balance at December 31, 2013 | 63,384 | 63 | 654,050 | 20,830 | (4,181) | (37,986 | ) | (602,808 | ) | 34,149 | |||||||||||||||||||
Net income | — | — | — | — | — | — | 9,881 | 9,881 | |||||||||||||||||||||
Other comprehensive loss, net of tax | — | — | — | (2,659 | ) | — | — | — | (2,659 | ) | |||||||||||||||||||
Shares issued under employee stock plan, net | 718 | 1 | 403 | — | (77 | ) | (97 | ) | — | 307 | |||||||||||||||||||
Shares issued under employee stock purchase plan | 83 | — | 181 | — | — | — | — | 181 | |||||||||||||||||||||
Shares issued in connection with public offering, net of offering costs | 14,082 | 14 | 31,711 | — | — | — | — | 31,725 | |||||||||||||||||||||
Stock-based compensation expense | — | — | 1,526 | — | — | — | — | 1,526 | |||||||||||||||||||||
Balance at December 31, 2014 | 78,267 | 78 | 687,871 | 18,171 | (4,258 | ) | (38,083 | ) | (592,927 | ) | 75,110 | ||||||||||||||||||
Net income | — | — | — | — | — | — | 10,315 | 10,315 | |||||||||||||||||||||
Other comprehensive loss, net of tax | — | — | — | (1,882 | ) | — | — | — | (1,882 | ) | |||||||||||||||||||
Shares issued under employee stock plan, net | 1,479 | 2 | 1,939 | — | (152 | ) | (557 | ) | — | 1,384 | |||||||||||||||||||
Shares issued under employee stock purchase plan | 107 | — | 317 | — | — | — | — | 317 | |||||||||||||||||||||
Stock-based compensation expense | — | — | 2,280 | — | — | — | — | 2,280 | |||||||||||||||||||||
Balance at December 31, 2015 | 79,853 | $ | 80 | $ | 692,407 | $ | 16,289 | (4,410 | ) | $ | (38,640 | ) | $ | (582,612 | ) | $ | 87,524 | ||||||||||||
The accompanying notes are an integral part of these consolidated financial statements.
44
MATTSON TECHNOLOGY, INC.
CONSOLIDATED STATEMENTS OF CASH FLOWS
(In thousands)
Year Ended December 31, | |||||||||||
2015 | 2014 | 2013 | |||||||||
Cash flows from operating activities: | |||||||||||
Net income (loss) | $ | 10,315 | $ | 9,881 | $ | (10,975 | ) | ||||
Adjustments to reconcile net income (loss) to net cash provided by (used in) operating activities: | |||||||||||
Depreciation and amortization | 2,927 | 2,805 | 3,971 | ||||||||
Stock-based compensation | 2,280 | 1,526 | 1,433 | ||||||||
Deferred income taxes | 163 | 145 | (450 | ) | |||||||
Other non-cash items | (86 | ) | 59 | (156 | ) | ||||||
Changes in assets and liabilities: | |||||||||||
Accounts receivable | 11,805 | (7,332 | ) | (10,702 | ) | ||||||
Advance billings | 3,014 | (1,307 | ) | (1,626 | ) | ||||||
Inventories | (12,939 | ) | (7,519 | ) | (5,317 | ) | |||||
Prepaid expenses and other current assets | 3,179 | (4,878 | ) | (536 | ) | ||||||
Other assets | 250 | 34 | 85 | ||||||||
Accounts payable | (5,292 | ) | (3,979 | ) | 14,687 | ||||||
Accrued compensation and benefits and other current liabilities | (395 | ) | 4,149 | (4,554 | ) | ||||||
Deferred revenue | (4,744 | ) | (808 | ) | 1,830 | ||||||
Other liabilities | 264 | (434 | ) | (526 | ) | ||||||
Net cash provided by (used in) operating activities | 10,741 | (7,658 | ) | (12,836 | ) | ||||||
Cash flows from investing activities: | |||||||||||
(Increase) decrease in restricted cash | 167 | 69 | (202 | ) | |||||||
Purchases of property and equipment | (1,357 | ) | (1,395 | ) | (1,171 | ) | |||||
Proceeds from sales of property and equipment | — | 12 | — | ||||||||
Net cash used in investing activities | (1,190 | ) | (1,314 | ) | (1,373 | ) | |||||
Cash flows from financing activities: | |||||||||||
Proceeds from revolving credit facility, net of borrowing costs | — | — | 28,611 | ||||||||
Repayment of revolving credit facility | — | (14,000 | ) | (15,000 | ) | ||||||
Proceeds from issuance of common stock, net | 1,701 | 32,213 | 576 | ||||||||
Net cash provided by financing activities | 1,701 | 18,213 | 14,187 | ||||||||
Effect of exchange rate changes on cash and cash equivalents | (585 | ) | (1,059 | ) | 246 | ||||||
Net increase in cash and cash equivalents | 10,667 | 8,182 | 224 | ||||||||
Cash and cash equivalents, beginning of period | 22,760 | 14,578 | 14,354 | ||||||||
Cash and cash equivalents, end of period | $ | 33,427 | $ | 22,760 | $ | 14,578 | |||||
Supplemental Disclosure: | |||||||||||
Cash paid for interest | $ | 94 | $ | 210 | $ | 578 | |||||
Cash paid for income taxes, net of refunds | $ | 419 | $ | 107 | $ | 422 | |||||
The accompanying notes are an integral part of these consolidated financial statements.
45
MATTSON TECHNOLOGY, INC.
NOTES TO CONSOLIDATED FINANCIAL STATEMENTS
1. BASIS OF PRESENTATION AND SIGNIFICANT ACCOUNTING POLICIES
Nature of Operations
Mattson Technology, Inc. (referred to in this Annual Report on Form 10-K as "Mattson," "we," "us," or "our") was incorporated in California in 1988 and reincorporated in Delaware in 1997. We design, manufacture, market and globally support semiconductor wafer processing equipment used in the fabrication of integrated circuits.
Basis of Presentation
The consolidated financial statements include the accounts of Mattson and all our subsidiaries. All inter-company balances and transactions have been eliminated. Our fiscal year ends on December 31. Our interim fiscal quarters are based upon the first quarter ending on the Sunday closest to March 31, with the second and third fiscal quarters each being exactly 13 weeks long.
Use of Estimates
The preparation of financial statements in conformity with accounting principles generally accepted in the United States of America ("U.S. GAAP") requires management to make estimates and assumptions that affect the reported amounts of assets and liabilities, disclosure of contingent assets and liabilities at the date of the financial statements and the reported amounts of revenue and expenses during the reported periods. We evaluate our estimates on an ongoing basis, including those related to the useful lives and fair value of long-lived assets, measurement of warranty obligations, valuation allowances for deferred tax assets, the fair value of stock-based compensation, estimates for allowance for doubtful accounts, and valuation of excess and obsolete inventories. Our estimates and assumptions can be subjective and complex and, consequently, actual results could differ materially from those estimates.
Reclassifications
For presentation purposes, certain prior period amounts have been reclassified to conform to the reporting in the current period financial statements. These reclassifications do not affect our net income, cash flows or stockholders' equity.
Cash and Cash Equivalents
We consider all highly liquid investments purchased with an original maturity of three months or less to be cash equivalents. Our cash and cash equivalents are carried at fair market value, and consist primarily of cash balances and high-grade money market funds.
Concentration of Credit Risk
We maintain our cash and cash equivalents with several financial institutions. Deposits held with banks may exceed the amount of insurance provided by the Federal Deposit Insurance Corporation on such deposits. Generally these deposits may be redeemed upon demand and are maintained with financial institutions with reputable credit.
We may invest in a variety of financial instruments, such as U.S. treasury bills and notes, commercial paper, money market funds and corporate bonds. We limit the amount of credit exposure to any one financial institution or commercial issuer. Historically, we have not experienced significant losses on these investments.
Our trade accounts receivable are concentrated with companies in the semiconductor industry and are derived from sales in the U.S., Asia and Europe. As of December 31, 2015, five customers accounted for 10 percent or more of our accounts receivable, with each representing approximately 36 percent, 12 percent, 12 percent, 11 percent and 10 percent of our total net accounts receivable, respectively. As of December 31, 2014, one customer accounted for 74 percent of our total net accounts receivable.
46
Allowance for Doubtful Accounts
We perform ongoing credit evaluations of our customers and record specific allowances for doubtful accounts when a customer is unable to meet its financial obligations, as in the case of bankruptcy filings or deteriorated financial position. We estimate the allowance for doubtful accounts for all other customers based on factors such as current trends, the length of time the receivables are past due and historical collection experience. We write-off a receivable when all rights, remedies and recourses against the account and its principals are exhausted and record a benefit when previously reserved accounts are collected.
Fair Value Measurements of Assets and Liabilities
We measure certain of our assets and liabilities at fair value, using observable market data. The authoritative guidance on fair value measurement defines fair value as an exit price, representing the amount that would be received to sell an asset or paid to transfer a liability in an orderly transaction between market participants at the measurement date, and establishes a valuation hierarchy based on the level of independent objective evidence available regarding the value of assets or liabilities. The authoritative guidance also establishes three classes of assets or liabilities: Level 1 consisting of assets and liabilities for which there are quoted prices for identical instruments in active markets; Level 2 consisting of assets and liabilities for which observable inputs other than Level 1 inputs are used such as prices for similar assets or liabilities in active markets or for identical assets or liabilities in less active markets and model-derived valuations for which the variables are derived from or corroborated by observable market data; and Level 3 consisting of assets or liabilities for which there are unobservable inputs to the valuation methodology that are significant to the measurement of the fair value. The category within the valuation hierarchy is based on the lowest level of input that is significant to the fair value measurement.
Inventories
Inventories are stated at the lower of cost or market, with cost determined on a first-in, first-out basis, and include material, labor and manufacturing overhead costs. Finished goods are reported as inventories until title transfers to the customer. Under our terms of sale, title generally transfers when we complete physical transfer of the products to the freight carrier, unless other customer practices or terms and conditions prevail. All inter-company profits pertaining to the sales and purchases of inventory among our subsidiaries are eliminated from the consolidated financial statements.
We assess the valuation of all inventories, including manufacturing raw materials, work-in-process, finished goods and spare parts, at the end of each reporting period. Although we attempt to forecast future inventory demand, given the competitive pressures and cyclical nature of the semiconductor industry, there may be significant unanticipated changes in demand or technological developments that could have a significant impact on the value of our inventories and reported operating results in future periods. The carrying value of our inventory is reduced for estimated excess and obsolescence, which is the difference between its cost and the estimated market value based upon assumptions about future demand. We evaluate the inventory carrying value for potential excess and obsolete inventory exposures by analyzing historical and anticipated demand. In addition, inventories are evaluated for potential obsolescence due to the effect of known and anticipated engineering change orders and new products. If actual demand were to be substantially lower than estimated, additional inventory adjustments for excess or obsolete inventory might be required, which could have a material adverse effect on our business, financial condition and results of operations.
Inventory includes evaluation tools placed at customer sites as part of our marketing efforts. We typically amortize the cost of the evaluation tools over an estimated period of five years, taking into consideration the estimated cost to refurbish the tools and the estimated net realizable value of the tools. The amortization charges are reported as selling, general and administrative expenses. Amortization expense was $0.1 million, $0.4 million and $1.5 million for the years ended December 31, 2015, 2014 and 2013, respectively.
Property and Equipment
Property and equipment are stated at cost. Depreciation is computed using the straight-line method based upon the estimated useful lives of the assets, which range from three to seven years. Leasehold improvements are amortized using the straight-line method over the useful lives or the term of the related lease, whichever is shorter.
Depreciation expense was $2.8 million, $2.2 million and $2.2 million for the years ended December 31, 2015, 2014 and 2013, respectively. When assets are retired or otherwise disposed of, the assets and the associated accumulated depreciation are removed from the accounts. Repair and maintenance costs are expensed as incurred.
47
Long-Lived Assets
We review our long-lived assets, including property and equipment and intangibles, for impairment whenever events or changes in circumstances indicate that the carrying amounts of these assets may not be recoverable. Recoverability is measured by a comparison of the assets' carrying amount to their expected future undiscounted net cash flows. If such assets are considered to be impaired, the impairment to be recognized is measured based on the amount by which the carrying amount of the asset exceeds its fair value. We had no impairment charges in 2015, 2014 and 2013.
Warranty
The warranty we offer on equipment sales is generally twelve months, except where previous customer agreements state otherwise. A provision for the estimated cost of warranty, based on historical costs, is recorded as a cost of goods sold when the revenue is recognized for the sale of the related equipment. Our warranty obligations require us to repair or replace defective products or parts during the warranty period at no cost to the customer. The actual system performance and/or field expense profiles may differ from historical experience, and in those cases we adjust our warranty reserves accordingly. Actual warranty reserves and settlements against reserves are highly dependent on our equipment volumes.
Revenue Recognition
We derive revenues from the following primary sources - equipment (tool or system) sales, spare part sales and service and maintenance contracts. In accordance with the authoritative guidance on revenue recognition, we recognize revenue on equipment sales as follows: 1) for equipment sales of existing products with new specifications and for sales of new products, revenue is recognized upon customer acceptance; 2) for equipment sales to existing customers with previously demonstrated equipment acceptance, or equipment sales to new customers purchasing equipment with established reliability, we recognize revenue on a multiple element approach in which revenue is recognized upon the delivery of the separate elements to the customer. The revenue we recognize on a delivered element is limited to the amount that is not contingent upon the delivery of additional items such as installation and customer acceptance, and upon transfer of title. For equipment sales we generally recognize revenue for 90 percent of the total invoice amount as revenue upon shipment while 100 percent of the equipment's cost is recognized upon shipment. The remaining portion, generally 10 percent of the total invoice amount, is contingent upon customer acceptance and is recognized once installation services are completed and final customer acceptance of the equipment is received.
The revenue relating to the undelivered elements is deferred using the relative selling price method, which allocates revenue to each element using the estimated selling prices for the deliverables when vendor-specific objective evidence or third-party evidence is not available. We have determined that the fair value of installation services is substantially less than the 10 percent of the total invoice amount typically assigned to the installation element in our customer agreements. As such, since the amount collectible upon successful installation and customer acceptance exceeds the fair value of the installation services, we defer the amount collectible upon successful installation and customer acceptance.
From time to time, we allow customers to evaluate equipment, with the customer maintaining the right to return the equipment at its discretion with limited or no penalty. For this type of arrangement, we do not recognize revenue until customer acceptance is received. For spare parts, we recognize revenue upon shipment. For service and maintenance contracts, we recognize revenue on a straight-line basis over the service period of the related contract or as services are performed. In all cases, revenue is only recognized when persuasive evidence of an arrangement exists, delivery has occurred, the price is fixed or determinable and collectability is reasonably assured. Accounts receivable for which revenue has not been recognized are classified as advance billings.
Research, Development and Engineering Expenses
Research, development and engineering expenses include the personnel-related costs and outside consulting expenses associated with the research, development and engineering of new products and enhancements to existing products, facility related costs and other corporate allocations. These costs are expensed as incurred.
Restructuring
We recognize expenses related to employee termination benefits when the benefit arrangement is communicated to the employee and no significant future services are required of the employee. If an employee is required to render service until a specific termination date, which goes beyond the legal requirement or contractual notice period, in order to receive the termination
48
benefits, the fair value of the associated liability would be recognized ratably over the future service period. Severance costs are determined in accordance with local statutory requirements and our policies.
We recognize the present value of facility lease termination obligations, net of estimated sublease income and other exit costs, when there are future lease payments with no future economic benefit. Sublease income is estimated based on current market rates for similar properties. If we are unable to sublease the facility on a timely basis or if we are forced to sublease the facility at lower rates due to changes in market conditions, we would adjust the restructuring liability accordingly.
Stock-Based Compensation
We measure the fair value of all stock-based awards, including stock options, restricted stock units, and purchase rights under our employee stock purchase plan, on the date of grant and recognize the related stock-based compensation expense on a straight-line basis over the requisite service period, which is generally the vesting period.
We use the Black-Scholes option-pricing model to determine the fair value of certain of our stock-based awards. The determination of fair value using the Black-Scholes model is affected by our stock price as well as assumptions regarding a number of complex and subjective variables, which includes expected stock price volatility over the term of the awards, actual and projected employee exercise and cancellation behaviors, risk-free interest rates, and expected dividends.
We estimate the expected life of options based on an analysis of our historical experience of employee exercise and post-vesting termination behavior considered in relation to the contractual life of the option; expected volatility is based on the historical volatility of our common stock; and the risk-free interest rate is equal to the U.S. Treasury rate with a maturity approximating the expected life of the option. We do not currently pay cash dividends on our common stock and do not anticipate doing so in the foreseeable future; accordingly, the expected dividend yield is zero.
We estimate forfeiture rates on stock-based awards at the time of grant and revise those estimates in subsequent periods if actual forfeitures differ from those estimates. Such forfeiture estimates are based on historical experience. If the assumptions for estimating stock-based compensation expense change in future periods, the amount of future stock-based compensation may differ significantly from the amount that we recorded in the current and prior periods.
Stock-based compensation expense for the years ended December 31, 2015, 2014 and 2013 was $2.3 million, $1.5 million and $1.4 million, respectively. We did not capitalize any stock-based compensation as inventory in the years ended December 31, 2015, 2014 and 2013 as such amounts were immaterial.
Foreign Currency
The functional currencies of our foreign subsidiaries are their local currencies. All assets and liabilities of these foreign operations are translated into the U.S. dollar using exchange rates in effect at the end of the period, and revenues and costs are translated using average exchange rates for the period. Gains or losses from translation of foreign operations where the local currencies are the functional currency are included as a component of accumulated other comprehensive income in the accompanying consolidated balance sheets. Foreign currency transaction gains and losses are recorded in other income (expense), net in the accompanying consolidated statements of operations.
For the years ended December 31, 2015, 2014 and 2013, we recorded a $0.3 million net foreign currency transaction loss, a $0.3 million net foreign currency transaction gain and a $0.6 million net foreign currency transaction loss, respectively. At December 31, 2015 and 2014, the cumulative translation adjustment was $16.3 million and $18.2 million, respectively.
Income Taxes
We provide for income taxes in accordance with the authoritative guidance, which requires a liability-based approach in accounting for income taxes. Deferred income tax assets and liabilities are recorded based on the differences between the financial statement and tax bases of assets and liabilities using enacted tax rates. Valuation allowances are provided against deferred income tax assets, which are not likely to be realized.
We recognize the tax benefit from an uncertain tax position only if it is more likely than not that the tax position will be sustained on examination by taxing authorities, based on the technical merits of the position. The tax benefits recognized in the financial statements from such a position are measured based on the largest benefit that has a greater than fifty percent likelihood of being realized upon ultimate resolution.
49
Recent Accounting Pronouncements
In February 2016, the Financial Accounting Standards Board ("FASB") issued Accounting Standards Update ("ASU") No. 2016-02, Leases, which requires recognizing lease assets and lease liabilities on the balance sheet and disclosing key information about leasing arrangements. This guidance will be effective for us in the first quarter of fiscal 2019, with early adoption permitted. We are currently evaluating the impact that the implementation of this standard will have on our financial statements and footnote disclosures.
In November 2015, the FASB issued ASU No. 2015-17, Income Taxes: Balance Sheet Classification of Deferred Taxes. This amendment eliminates the requirement to bifurcate deferred taxes between current and non-current on the balance sheet and requires that deferred tax liabilities and assets be classified as non-current on the balance sheet. This guidance will be effective for us in the first quarter of fiscal 2018, with early adoption permitted. We are currently evaluating the impact that the implementation of this standard will have on our financial statements and footnote disclosures.
In April 2015, the FASB issued ASU 2015-03, Simplifying the Presentation of Debt Issuance Costs. Debt issuance costs are specified incremental costs, other than those paid to the lender, that are directly attributable to issuing a debt instrument (i.e., third party costs). Prior to the adoption of this standard, debt issuance costs were required to be presented in the balance sheet as a deferred charge (i.e., an asset). This presentation differed from the presentation for a debt discount, which is a direct adjustment to the carrying value of the debt (i.e., a contra liability). This new standard requires that all costs incurred to issue debt be presented in the balance sheet as a direct deduction from the carrying value of the debt. This guidance will be effective for us in the first quarter of fiscal 2016, with early adoption permitted. We do not expect the adoption of this accounting standard to have a material impact on our financial statements and footnote disclosures. In August 2015, the FASB issued ASU No. 2015-15, Interest – Imputation of Interest: Presentation and Subsequent Measurement of Debt Issuance Costs Associated with Line-of-Credit Arrangements. ASU 2015-15 provides additional guidance to ASU 2015-03, which did not address presentation or subsequent measurement of debt issuance costs related to line of credit arrangements. ASU 2015-15 noted that the SEC staff would not object to an entity deferring and presenting debt issuance costs as an asset and subsequently amortizing the deferred debt issuance costs ratably over the term of the line of credit arrangement, regardless of whether there are any outstanding borrowings on the line of credit arrangement. As of December 31, 2015, we continue to record our unamortized debt issuance costs in connection with our revolving credit facility as an asset.
In May 2014, the FASB issued ASU 2014-09, Revenue from Contracts with Customers. The FASB issued ASU 2014-09 to clarify the principles for recognizing revenue and to develop a common revenue standard for GAAP and International Financial Reporting Standards. The standard outlines a single comprehensive model for entities to use in accounting for revenue arising from contracts with customers and supersedes the most current revenue recognition guidance. In August 2015, the FASB issued ASU No. 2015-14, Revenue from Contracts with Customers: Deferral of the Effective Date, deferring the effective date of ASU 2014-09 by one year. This guidance will be effective for us in the first quarter of fiscal 2018, with early adoption permitted for annual periods beginning after December 15, 2016. We are currently evaluating the impact that the implementation of this standard will have on our financial statements and footnote disclosures.
In July 2015, the FASB issued ASU No. 2015-11, Inventory: Simplifying the Measurement of Inventory. Under ASU 2015-11, we are required to measure inventory at the lower of cost and net realizable value. The new guidance clarifies that net realizable value is the estimated selling prices in the ordinary course of business, less reasonably predictable costs of completion, disposal and transportation. This guidance is effective for us in the first quarter of fiscal 2017, with early adoption permitted. We are currently evaluating the impact that the implementation of this standard will have on our financial statements and footnote disclosures.
In August 2014, the FASB issued ASU No. 2014-15, Presentation of Financial Statements—Going Concern. The update provides U.S. GAAP guidance on management’s responsibility in evaluating whether there is substantial doubt about a company’s ability to continue as a going concern and about related footnote disclosures. For each reporting period, management will be required to evaluate whether there are conditions or events that raise substantial doubt about a company’s ability to continue as a going concern within one year from the date the financial statements are issued. This guidance is effective for us beginning with our annual financial statements for fiscal 2017. We are currently evaluating the impact that the implementation of this standard will have on our financial statements and footnote disclosures.
50
2. | BALANCE SHEET DETAILS |
At December 31, 2015 and 2014, we had restricted cash of $1.8 million and $2.0 million, respectively, which is primarily related to secured standby letters of credit for our long-term leases. Accordingly, such amounts are classified as long term in the accompanying consolidated balance sheets. See Note 7. Commitments and Contingencies for additional details related to the standby letters of credit.
Components of inventories as of December 31 are shown below (in thousands):
2015 | 2014 | ||||||
Inventories: | |||||||
Purchased parts and raw materials | $ | 33,624 | $ | 28,143 | |||
Work-in-process | 12,793 | 10,832 | |||||
Finished goods | 3,603 | 1,604 | |||||
$ | 50,020 | $ | 40,579 | ||||
Components of prepaid expenses and other current assets as of December 31 are shown below (in thousands):
2015 | 2014 | ||||||
Prepaid expenses and other current assets: | |||||||
Value-added tax | $ | 3,194 | $ | 4,184 | |||
Other current assets | 2,863 | 5,583 | |||||
$ | 6,057 | $ | 9,767 | ||||
Components of property and equipment as of December 31 are shown below (in thousands):
2015 | 2014 | ||||||
Property and equipment, net: | |||||||
Machinery and equipment | $ | 41,463 | $ | 40,777 | |||
Furniture and fixtures | 8,531 | 9,079 | |||||
Leasehold improvements | 16,396 | 17,646 | |||||
66,390 | 67,502 | ||||||
Less: accumulated depreciation | (58,154 | ) | (59,968 | ) | |||
$ | 8,236 | $ | 7,534 | ||||
Components of other current liabilities as of December 31 are shown below (in thousands):
2015 | 2014 | ||||||
Other current liabilities: | |||||||
Warranty | $ | 3,040 | $ | 2,803 | |||
Value-added tax | 1,250 | 1,547 | |||||
Accrued restructuring charge - current | 8 | 366 | |||||
Other | 1,897 | 1,914 | |||||
$ | 6,195 | $ | 6,630 | ||||
3. | FAIR VALUE MEASUREMENT |
Our money market funds are classified within Level 1 of the fair value hierarchy, as these instruments are valued using quoted market prices. Specifically, we value our investments in money market securities and certificates of deposit on quoted market prices in active markets. As of December 31, 2015 and 2014, we had no assets or liabilities classified within Level 2 or Level 3 and there were no transfers of instruments between Level 1, Level 2 and Level 3 regarding fair value measurement.
51
Cash and cash equivalents and restricted cash are carried at fair value. Accounts receivable and accounts payable are valued at their carrying amounts, which approximate fair value due to their short-term nature.
Assets and Liabilities Measured at Fair Value on a Recurring Basis
Assets and liabilities measured at fair value on a recurring basis are shown in the table below by their corresponding balance sheet captions and consisted of the following types of instruments as of December 31 (in thousands):
2015 | 2014 | ||||||||||||||
Fair Value Measurements at Reporting Date Using | Fair Value Measurements at Reporting Date Using | ||||||||||||||
(Level 1) | Total | (Level 1) | Total | ||||||||||||
Assets measured at fair value: | |||||||||||||||
Cash and cash equivalents: (1) | |||||||||||||||
Money market funds | $ | 15,011 | $ | 15,011 | $ | 7,007 | $ | 7,007 | |||||||
Restricted cash: | |||||||||||||||
Money market funds | 1,808 | 1,808 | 1,806 | 1,806 | |||||||||||
Total assets measured at fair value | $ | 16,819 | $ | 16,819 | $ | 8,813 | $ | 8,813 | |||||||
(1) Excludes $18.4 million and $15.8 million in cash held in our bank accounts at December 31, 2015 and December 31, 2014, respectively.
4. | BUSINESS COMBINATION |
Agreement and Plan of Merger
On December 1, 2015, Mattson entered into an Agreement and Plan of Merger (the “Merger Agreement”) with Beijing E-town Dragon Semiconductor Industry Investment Center (Limited Partnership), a People's Republic of China ("PRC") limited partnership (“Parent”), providing for the merger of an indirect subsidiary of Parent (“Merger Sub”) with and into Mattson (the “Merger”), with Mattson surviving the Merger as a subsidiary of Parent (the “Surviving Corporation”). The Merger Agreement was unanimously approved by Mattson’s Board of Directors (the “Board”).
Pursuant to the terms and subject to the conditions of the Merger Agreement, at the Effective Time of the Merger, each share of Mattson’s common stock, par value $0.001 per share (the “Company Common Stock”), outstanding immediately prior to the Effective Time will be cancelled and automatically converted into the right to receive $3.80 in cash, without interest (the “Merger Consideration”), excluding any shares owned by Mattson, Parent or Merger Sub or any of their respective wholly-owned subsidiaries (which will be cancelled) and any shares with respect to which appraisal rights have been properly exercised under Delaware law. Beijing E-Town International Investment & Development Co., Ltd., the parent company to Parent, has irrevocably and unconditionally guaranteed to the Company the due and punctual payment and performance of Parent’s and Merger Sub’s obligations under the Merger Agreement.
At the Effective Time, each option to purchase shares of Company Common Stock (a “Company Option”) that is outstanding and either (i) vested as of the Effective Time or (ii) held by a non-employee member of the Board will be converted into the right to receive an amount in cash, without interest, equal to the product obtained by multiplying (a) the aggregate number of shares of Company Common Stock subject to such Company Option immediately prior to the Effective Time, by (b) the Merger Consideration, less the per share exercise price of such Company Option.
At the Effective Time, each Company Option that is outstanding, unvested and held by an employee who continues employment with Parent or any of its subsidiaries (including the Surviving Corporation) after the Merger will either (i) conditioned upon receipt of an executed Award Surrender Agreement (included in the Merger Agreement) by the Company at least one business day prior to the Effective Time, be converted into the right to receive an amount in cash determined by multiplying (a) the aggregate number of shares of Company Common Stock represented by such Company Option immediately prior to the Effective Time by (b) the Merger Consideration, less the per share exercise price of such Company Option (the “Unvested Option Consideration”), or (ii) be assumed by the Surviving Corporation, on the same terms, conditions and vesting schedule applicable to such Company Option immediately prior to the Effective Time (an “Assumed Option”), except that (x) the number of shares of the Surviving Corporation’s common stock for which such Assumed Option will be exercisable will
52
equal the product (rounded down to the next whole number, with no cash paid for any fractional share eliminated by such rounding) of the number of shares of Company Common Stock that were issuable upon exercise of such Company Option immediately prior to the Effective Time and the Exchange Ratio (as defined in the Merger Agreement) and (y) the per share exercise price for the shares of the Surviving Corporation’s common stock issuable upon exercise of such Assumed Option will equal the quotient (rounded up to the next whole cent) obtained by dividing the exercise price per share of such Company Option immediately prior to the Effective Time by the Exchange Ratio. The Unvested Option Consideration will be subject to the same vesting restrictions and continued service requirements applicable to such Company Option as are in effect immediately prior to the Effective Time, except that any portion of the Unvested Option Consideration remaining outstanding as of December 31, 2016 will fully accelerate in full and be paid as of such date.
At the Effective Time, each Company restricted stock unit (a “Company RSU”) that is outstanding and either (i) vested as of the Effective Time or (ii) held by a non-employee member of the Board will be converted into the right to receive an amount in cash, without interest, equal to the product obtained by multiplying (a) the aggregate number of shares of Company Common Stock subject to such Company RSU immediately prior to the Effective Time by (b) the Merger Consideration. At the Effective Time, all other outstanding Company RSUs not described in the immediately preceding sentence will be converted into the right to receive an amount in cash, without interest, equal to the product obtained by multiplying (x) the aggregate number of shares of Company Common Stock subject to such Company RSU immediately prior to the Effective Time by (y) the Merger Consideration (the “Unvested RSU Consideration”). The Unvested RSU Consideration will be subject to the same vesting restrictions and continued service requirements applicable to such Company RSU immediately prior to the Effective Time.
The closing of the Merger is subject to the adoption of the Merger Agreement by the affirmative vote of holders of a majority of the outstanding shares of the Company Common Stock (the “Company Stockholder Approval”). The obligations of the parties to consummate the Merger are also subject to the satisfaction (or waiver, if applicable) of various customary conditions, including (i) the expiration or termination of the applicable waiting period under the Hart-Scott-Rodino Antitrust Improvements Act of 1976, as amended, (ii) filings and approvals with or by certain governmental authorities, including governmental authorities in the PRC and Taiwan, (iii) the absence of certain governmental orders prohibiting the Merger, (iv) the accuracy of the representations and warranties of each party contained in the Merger Agreement (subject to certain materiality qualifications) and (v) each party’s compliance with or performance of the covenants and agreements in the Merger Agreement in all material respects.
The Company has made customary representations, warranties and covenants in the Merger Agreement, including, among others, covenants (i) to conduct its business in all material respects in the ordinary course consistent with past practices during the period between the execution of the Merger Agreement and the closing of the Merger, (ii) not to engage in specified types of transactions or take certain actions during the interim period unless consented to in writing by Parent, (iii) to convene and hold a meeting of its stockholders for the purpose of obtaining the Company Stockholder Approval and (iv) subject to certain exceptions, not to withdraw (or qualify or modify in a manner adverse to Parent) the recommendation of the Board that the Company’s stockholders adopt the Merger Agreement. The Company is also subject to customary restrictions on its ability to solicit alternative acquisition proposals from third parties and to provide non-public information to, and participate in discussions and engage in negotiations with, third parties regarding alternative acquisition proposals, with customary exceptions for alternative acquisition proposals that the Board determines either constitutes or could reasonably be expected to lead to a Superior Proposal (as defined in the Merger Agreement).
Parent also has agreed to various covenants in the Merger Agreement, including, among others, covenants to take actions that may be necessary in order to obtain approval of the Merger with certain governmental authorities, subject to certain exceptions.
The Merger Agreement contains certain termination rights for the Company and Parent. Upon termination of the Merger Agreement under specified circumstances, including in connection with the Company’s entry into a definitive agreement providing for the consummation of a Superior Proposal as permitted under the Merger Agreement, the Company will be required to pay Parent a termination fee of approximately $8.6 million.
The Merger Agreement also provides that, upon termination of the Merger Agreement under specified circumstances, Parent will be required to pay the Company a termination fee of approximately $17.2 million (the “Parent Termination Fee”). The Parent Termination Fee will become payable from Parent to the Company if the Merger Agreement is terminated by the Company in the event that (i) Parent breaches its covenants such that the applicable closing condition regarding performance of covenants would not be satisfied or (ii) all of Parent’s conditions to closing are satisfied or waived and Parent has failed to consummate the Merger.
53
Voting Agreement
Concurrent with the execution of the Merger Agreement, the directors and certain executive officers of Mattson, in their capacities as holders of Company Common Stock or other equity interests of the Company, entered into a Voting Agreement with Parent (the “Voting Agreement”) pursuant to which each agreed, among other things, to (i) vote their Company Common Stock for the approval of the Merger Agreement and against any alternative proposal, and (ii) comply with certain restrictions on the disposition of their Company Common Stock, subject to the terms and conditions contained in the Voting Agreement. Each stockholder party to the Voting Agreement has granted an irrevocable proxy in favor of Parent to vote his or her shares or other equity interests as required by the terms of the Voting Agreement. The Voting Agreement will terminate upon the earlier of (a) the Effective Time, (b) the termination of the Voting Agreement by Parent, (c) the termination of the Merger Agreement in accordance with its terms or (d) a material modification, waiver or amendment of the Merger Agreement that (x) reduces the amount or changes the form of consideration to be paid to such stockholder party or (y) creates any additional conditions to the consummation of the Merger (unless such stockholder consents to such modification, waiver or amendment).
5. | REVOLVING CREDIT FACILITY |
On April 12, 2013, we entered into a three-year $25.0 million senior secured revolving credit facility ("credit facility") with Silicon Valley Bank. On October 21, 2014, we entered into Amendment Agreement No. 4 with Silicon Valley Bank ("Amendment"), which extends the term of our credit facility to October 12, 2017. In the absence of an event of default, any amounts outstanding under the credit facility may be repaid and re-borrowed anytime until the termination date. This Amendment also allows us to make a one-time request to increase the existing credit facility up to an additional $25.0 million. The Amendment also retroactively lowered our required minimum consolidated earnings before interest, tax, depreciation, and amortization ("EBITDA") from $6.0 million to $2.0 million for the two consecutive quarters immediately prior to the end of the reporting period, commencing with the fiscal quarter ended September 28, 2014; established a minimum quick ratio requirement equal to or greater than 1.00 through March 29, 2015 and 1.25 thereafter; and removed certain financial covenants when our "Available Funds," as defined in the Amendment to be cash, cash equivalents and availability under the credit agreement, are equal to or greater than $30.0 million as of the last day of such fiscal quarter.
Under the Amendment, the advances available to us under the borrowing base formula increased to 85 percent of eligible accounts receivable and advance billings and 50 percent of eligible inventory.
At our option, the borrowings under the credit facility can bear interest at an Alternate Base Rate (“ABR”) or Eurodollar Rate. ABR loans bear interest at a per annum rate equal to the greater of the Federal Funds Effective Rate plus 0.5 percent or the prime rate, plus an applicable margin. Eurodollar loans bear interest at a margin over British Bankers' Association LIBOR Rate divided by 1 minus Eurocurrency Reserve Requirements. The Amendment lowered the applicable margin, as defined in the Amendment, with respect to our interest rate on outstanding borrowings to zero percent for ABR loans and 2.75 percent per annum for Eurodollar loans. As of December 31, 2015, the effective interest rate on any outstanding borrowings would have been 3.50 percent per annum, which is variable and represents the greater of the Federal Funds Effective Rate plus 0.50 percent or the prime rate. If an event of default occurs under the credit facility, the interest rate will increase by 2.0 percent per annum.
The obligations under the credit facility are guaranteed by Mattson International, Inc., our wholly-owned subsidiary (together with Mattson, collectively referred to as the “Loan Parties”), and are secured by substantially all of the assets of the Loan Parties, including a pledge of the capital stock holdings of the Loan Parties in certain of our direct subsidiaries.
The credit facility contains customary affirmative covenants and negative covenants including financial covenants requiring us and our subsidiaries to maintain a minimum level of consolidated EBITDA, for two consecutive quarters, and a minimum quick ratio, as well as restrictions on liens, investments, indebtedness, fundamental changes, sale leaseback transactions, swap agreements, accounting changes, dispositions of property, making certain restricted payments (including restrictions on dividends and stock repurchases), entering into new lines of business, and transactions with affiliates. Additionally, our credit facility restricts our ability to pay dividends, subject to certain limited exceptions.
The obligations under the credit facility may be accelerated upon the occurrence of an event of default under the credit facility, which includes customary events of default, including payment defaults, defaults in the performance of affirmative and negative covenants, the material inaccuracy of representations or warranties, bankruptcy and insolvency related defaults, defaults relating to matters such as ERISA, judgments, and a change of control. Due to the potential for acceleration of obligations under the credit facility upon the occurrence of certain events, some of which are outside our control, borrowings under the credit facility are classified within current liabilities in the consolidated balance sheets.
54
We incurred $0.4 million in debt issuance costs in connection with the credit facility and a commitment fee of $62,500 related to the extension of the term of the facility from April 12, 2016 to October 12, 2017. These costs are being amortized over the term of the credit facility. In addition, we pay monthly commitment fees equal to 0.375 percent per annum on the unused portion of the credit facility.
At December 31, 2015 and 2014, we had no outstanding borrowings under the credit facility.
6. | RESTRUCTURING CHARGES |
In December 2011, our management approved and initiated a cost reduction plan ("2011 Restructuring Plan") as part of a broad-based cost reduction initiative. The 2011 Restructuring Plan included the consolidation of our manufacturing and research and development facilities, including contract termination costs related to two vacant facilities; moving a portion of our outsourced spare parts logistics operations in-house; and workforce reductions.
The following table summarizes changes in our restructuring accrual for the years ended December 31, 2015, 2014 and 2013 (in thousands):
Employee Severance Costs | Contract Termination Costs | Other Costs | Total | ||||||||||||
Balance at December 31, 2012 | $ | 2,005 | $ | 1,600 | $ | — | $ | 3,605 | |||||||
Restructuring charges | 2,413 | 825 | 424 | 3,662 | |||||||||||
Payments | (4,406 | ) | (1,322 | ) | (399 | ) | (6,127 | ) | |||||||
Reserve adjustments | (12 | ) | — | (25 | ) | (37 | ) | ||||||||
Balance at December 31, 2013 | — | 1,103 | — | 1,103 | |||||||||||
Restructuring charges | 506 | (94 | ) | — | 412 | ||||||||||
Payments | (358 | ) | (739 | ) | — | (1,097 | ) | ||||||||
Reserve adjustments | (20 | ) | (32 | ) | — | (52 | ) | ||||||||
Balance at December 31, 2014 | 128 | 238 | — | 366 | |||||||||||
Restructuring charges | — | — | — | — | |||||||||||
Payments | (123 | ) | (205 | ) | — | (328 | ) | ||||||||
Reserve adjustments | (5 | ) | (25 | ) | — | (30 | ) | ||||||||
Balance at December 31, 2015 | $ | — | $ | 8 | $ | — | $ | 8 | |||||||
For the year ended December 31, 2015, we had no restructuring charges, and made scheduled payments of $0.3 million to settle these restructuring liabilities. During 2015, we also incurred $2.5 million in costs associated with the Merger Agreement with Parent, which was recorded as restructuring and other charges in our consolidated statement of operations for the year ended December 31, 2015, and for which the unpaid portions are reflected within our accounts payable and other current liabilities in our consolidated balance sheet at December 31, 2015.
For the year ended December 31, 2014, we recorded restructuring charges of $0.4 million, which included $0.5 million related to workforce reductions and a $0.1 million benefit from a revised estimate of our future rent obligations for one of our vacant facilities. We paid $0.4 million in employee severance and $0.7 million in contract termination costs during 2014.
For the year ended December 31, 2013, we recorded restructuring charges of $3.7 million, which included $2.8 million in employee severance and other costs relating primarily to recruiting costs for our new chief executive officer and severance expense for our former chief executive officer totaling approximately $0.6 million, and other workforce reductions. We also incurred $0.8 million in contract termination costs related to future rent obligations, net of sublease income, associated with two vacated leased facilities. We paid $4.8 million in employee severance and other costs and $1.3 million in contract termination costs during 2013.
As of December 31, 2015, we had a minimal balance in accrued restructuring charges, which was classified within other current liabilities in our consolidated balance sheet. As of December 31, 2015, we also had approximately $2.5 million in accounts payable related to professional fees and deal-related costs associated with the Merger Agreement with Parent. As of
55
December 31, 2014, we had $0.4 million in accrued restructuring charges, which was classified within other current liabilities in our consolidated balance sheet.
7. | COMMITMENTS AND CONTINGENCIES |
Warranty
The warranty offered by us on our system sales is generally twelve months, except where previous customer agreements state otherwise, and excludes certain consumable maintenance items. A provision for the estimated cost of warranty, based on historical costs, is recorded as cost of sales when the revenue is recognized. Our warranty obligations require us to repair or replace defective products or parts during the warranty period at no cost to the customer. The actual system performance and/or field warranty expense profiles may differ from historical experience, and in those cases, we adjust our warranty accruals accordingly.
The following table summarizes changes in our product warranty accrual for the years ended December 31 (in thousands):
2015 | 2014 | 2013 | |||||||||
Beginning balance | $ | 2,803 | $ | 1,786 | $ | 1,691 | |||||
Warranties issued in the period | 3,021 | 2,783 | 2,031 | ||||||||
Costs to service warranties | (3,974 | ) | (3,059 | ) | (1,981 | ) | |||||
Warranty accrual adjustments | 1,190 | 1,293 | 45 | ||||||||
Ending balance | $ | 3,040 | $ | 2,803 | $ | 1,786 | |||||
Operating Leases
We hold various operating leases related to our worldwide facilities and equipment. Our minimum annual lease commitments with respect to our operating leases were as follows as of December 31, 2015 (in thousands):
Year Ending December 31, | Minimum Future Lease Payments | ||
2016 | $ | 2,378 | |
2017 | 2,288 | ||
2018 | 2,235 | ||
2019 | 2,272 | ||
2020 | 2,324 | ||
Thereafter | 13,329 | ||
$ | 24,826 | ||
Rent expense was $3.7 million, $4.1 million and $3.9 million in 2015, 2014 and 2013, respectively.
We recorded sublease income related to our Exton, Pennsylvania and Vancouver, Canada facilities of $0.2 million, $0.2 million and $0.4 million for the years ended December 31, 2015, 2014 and 2013, respectively. During 2015, our leases in Exton, Pennsylvania and Vancouver, Canada expired and were not renewed.
In 2005, we entered into a lease agreement for the building which serves as our corporate headquarters in Fremont, California. The lease is for a period of ten years, which commenced on May 31, 2007, and has an initial annual base rent cost of approximately $1.4 million, with annual increases of approximately 3.5 percent. We also are responsible for an additional minimum lease payment at the end of the lease term of approximately $1.5 million, subject to adjustment, under a restoration cost obligation provision, which is being recognized on a straight-line basis over the lease term. To secure this obligation, we provided the landlord a standby letter of credit of $1.5 million. On January 7, 2016, we entered into an amendment with the landlord, which extends the lease term through December 31, 2026. Under the terms of the amendment, the annual base rent was adjusted upwards to approximately $1.6 million during 2016, with annual increases of 3.0 percent through 2026.
56
Guarantees
Standby Letters of Credit
In the ordinary course of business, our bank provides standby letters of credit or other guarantee instruments on our behalf to certain parties as required. The standby letters of credit are primarily secured by money market accounts, which are classified as restricted cash in the accompanying consolidated balance sheets. We have never recorded any liability in connection with these guarantee arrangements beyond what is required to appropriately account for the underlying transaction being guaranteed. We do not believe, based on historical experience and information currently available, that it is probable that any amounts will be required to be paid under such guarantee arrangements. As of December 31, 2015, the maximum potential amount that we could be required to pay under our outstanding standby letters of credit was $1.7 million, which was secured by $1.8 million in money market fund accounts and recorded as restricted cash.
Canadian Minister of Industries
In connection with our acquisition of Vortek Industries, Ltd. ("Vortek") in 2004, we became party to an agreement between Vortek and the Canadian Minister of Industries (the "Minister") relating to an investment in Vortek by Technology Partnerships Canada. Under the agreement, as amended, we, or Vortek (renamed Mattson Technology, Canada, Inc. ("MTC")) agreed to various terms, including (i) payment by us of a royalty to the Minister of 1.4 percent of net revenues from certain Flash RTP products, up to a total of C$14.3 million (approximately $10.3 million based on the applicable exchange rate as of December 31, 2015), (ii) MTC maintaining a specified average workforce of employees in Canada, making certain investments and complying with certain manufacturing, each, through October 27, 2009, and (iii) certain other covenants concerning protection of intellectual property rights. Under the provisions of this agreement, if MTC is dissolved, files for bankruptcy or we, or MTC, do not materially satisfy the obligations pursuant to any material terms or conditions, the Minister could demand payment of liquidated damages in the amount of C$14.3 million less any royalties paid to the Minister. As of October 27, 2009, we were no longer subject to covenant (ii), as discussed above but are still subject to the remaining terms and conditions until the earlier of payment of royalty of C$14.3 million (approximately $10.3 million based on the applicable exchange rate as of December 31, 2015) or through December 31, 2020. We have recorded approximately C$0.6 million in cumulative royalty charges to date. The movement of our Canadian operations to Germany did not result in the dissolution of MTC.
Indemnification Agreements
We are a party to a variety of agreements, pursuant to which we may be obligated to indemnify other parties with respect to certain matters. Typically, these obligations arise in the context of contracts under which we may agree to hold other parties harmless against losses arising from a breach of representations or with respect to certain intellectual property, operations or tax-related matters. Our obligations under these agreements may be limited in terms of time and/or amount, and in some instances, we may have defenses to asserted claims and/or recourse against third parties for payments made. It is not possible to predict the maximum potential amount of future payments under these or similar agreements due to the conditional nature of our obligations and the unique facts and circumstances involved in each particular agreement. Historically, our payments under these agreements have not had a material effect on our financial position, results of operations or cash flows. We believe if we were to incur a loss in any of these matters, such loss would not have a material effect on our financial position, results of operations or cash flows.
We indemnify our directors and certain employees as permitted by law, and have entered into indemnification agreements with our directors and certain senior officers. We have not recorded a liability associated with these indemnification agreements, as we historically have not incurred any material costs associated with such indemnification agreements. Costs associated with such indemnification agreements may be mitigated, in whole or only in part, by insurance coverage that we maintain.
Government Agencies
As an exporter, we must comply with various laws and regulations relating to the export of products and technology from the U.S. and other countries having jurisdiction over our operations. In the U.S. these laws include the International Traffic in Arms Regulations ("ITAR") administered by the State Department's Directorate of Defense Trade Controls, the Export Administration Regulations ("EAR") administered by the Bureau of Industry and Security ("BIS"), and trade sanctions against embargoed countries and destinations administered by the U.S. Department of Treasury, Office of Foreign Assets Control ("OFAC"). The EAR governs products, parts, technology and software which present military or weapons proliferation concerns, so-called "dual use" items, and ITAR governs military items listed on the United States Munitions List. Prior to
57
shipping certain items, we must obtain an export license or verify that license exemptions are available. In addition, we must comply with certain requirements related to documentation, record keeping, plant visits and hiring of foreign nationals.
As previously reported, in 2008 we self-disclosed to BIS certain inadvertent EAR violations. In April 2012, we entered into a settlement agreement with BIS that resolved in full all matters contained in our voluntary self-disclosure. Under the settlement, we agreed to a civil penalty of $0.9 million of which we paid $0.3 million in May 2012. Payment of the remaining $0.6 million was suspended for a one-year period ended April 30, 2013 and was waived given there were no violations during that period.
Litigation
Overview
In the ordinary course of business, we are subject to claims and litigation, including claims that we infringe third party patents, trademarks and other intellectual property rights. Although we believe that it is unlikely that any current claims or actions will have a material adverse impact on our operating results or our financial position, given the uncertainty of litigation, we cannot be certain of this. The defense of claims or actions against us, even if without merit, could result in the expenditure of significant financial and managerial resources.
We record a legal liability when we believe it is both probable that a liability has been incurred, and the amount can be reasonably estimated. We monitor developments in our legal matters that could affect the estimate we have previously accrued. Significant judgment is required to determine both probability and the estimated amount.
Class Action Merger Litigation
On December 14, 2015, a putative shareholder class action complaint was filed in the Court of Chancery of the State of Delaware against Mattson, Mattson’s Board of Directors, Beijing E-town Dragon Semiconductor Industry Investment Center (“Parent”), and Dragon Acquisition Sub, Inc. (“Merger Sub”), captioned Sally Mogle v. Mattson Technology, et al., Case No. 11807 (Del. Ch.). On December 22, 2015, a second putative shareholder class action complaint was filed in the Court of Chancery of the State of Delaware against Mattson’s Board of Directors, Parent, and Merger Sub, captioned Philip Durgin v. Kannappan, et al., Case No. 11837 (Del. Ch.). The complaints allege, among other things, that the Company’s directors breached their fiduciary duties by approving the Merger Agreement and that Parent and Merger Sub aided and abetted the alleged breaches of fiduciary duty. The complaints seek, among other things, either to enjoin the proposed transaction or to rescind it should it be consummated, as well as unspecified damages, including attorneys’ and experts’ fees.
On January 12, 2016, a putative shareholder class action complaint was filed in the Superior Court of the State of California, Alameda County against Mattson, Mattson’s Board of Directors, Parent, and Merger Sub, captioned Mary Salinas v. Mattson Technology, et al., Case No. RG16799807. The complaint alleges, among other things, that the Company’s directors breached their fiduciary duties by approving the Merger Agreement, and that Mattson, Parent, and Merger Sub aided and abetted the alleged breaches of fiduciary duty. The complaint seeks, among other things, to enjoin the stockholder vote on the proposed transaction and unspecified damages, including attorneys’ and experts’ fees. On February 11, 2016, the plaintiff filed an Amended Class Action Complaint alleging, among other things, that Mattson’s directors breached their fiduciary duties by approving the Merger Agreement and issuing an incomplete and misleading Preliminary Proxy Statement, and that Mattson, Parent and Merger Sub aided and abetted the alleged breaches of fiduciary duty. The complaint seeks, among other things, either to enjoin the proposed transaction or to rescind it should it be consummated, as well as unspecified damages, including attorneys’ and experts’ fees. On February 22, 2016, a second putative shareholder class action complaint was filed in the Superior Court of the State of California, Alameda County against Mattson, Mattson’s Board of Directors, Parent, and Merger Sub, captioned Darrell Brown v. Mattson Technology, et al., Case No. RG16804802. The complaint alleges, among other things, that Mattson’s directors breached their fiduciary duties by approving the Merger Agreement and issuing an incomplete and misleading Preliminary Proxy Statement, and that Mattson, Parent, and Merger Sub aided and abetted the alleged breaches of fiduciary duty. The complaint seeks, among other things, either to enjoin the proposed transaction or to rescind it should it be consummated, as well as unspecified damages, including attorneys’ and experts’ fees.
On February 18, 2016, a putative shareholder class action complaint was filed in the United States District Court for the Northern District of California against the Board, captioned Talbert v. Mattson Technology, et al., No. 8:16-cv-00811-LHK. The complaint alleges, among other things, that Mattson and Mattson’s Board of Directors violated Sections 14(a) and 20(a) of the Securities Exchange Act of 1934 by making materially incomplete and misleading statements and/or omitting material information from the Preliminary Proxy Statement. The complaint seeks to enjoin the stockholder vote on the proposed transaction, unspecified damages, certain other equitable relief, and attorneys’ fees and costs.
58
Mattson is reviewing the complaints and has not yet formally responded to them, but believes the plaintiffs’ allegations are without merit and intends to defend against them vigorously. However, litigation is inherently uncertain and there can be no assurance regarding the likelihood that Mattson’s defense of these actions will be successful. Additional complaints containing substantially similar allegations may be filed in the future. We are unable at this time to estimate the effect of these lawsuits on our financial position, results of operations or cash flows.
8. | STOCKHOLDERS' EQUITY |
Common Stock
In February 2014, we completed a registered public offering of 14.1 million newly issued shares of our common stock. The common stock was issued at a price to the public of $2.45 per share. We received net proceeds of approximately $31.7 million from the offering after deducting approximately $2.8 million in underwriting discounts and offering expenses.
Treasury Stock
We report common stock repurchased as treasury stock in the accompanying consolidated balance sheets. Treasury stock as of December 31, 2015 and 2014 was 4.4 million and 4.3 million shares, respectively, at a total purchase price of $38.6 million and $38.1 million, respectively.
Accumulated Other Comprehensive Income
The activity in accumulated other comprehensive income ("AOCI") for the years ended December 31 is as follows (thousands):
2015 | 2014 | 2013 | |||||||||
Foreign currency translation adjustments: | |||||||||||
Balance at beginning of period | $ | 18,171 | $ | 20,830 | $ | 20,978 | |||||
Reclassification to earnings, net of tax impact | — | — | (488 | ) | |||||||
Change in currency translation adjustment, net of tax | (1,882 | ) | (2,659 | ) | 340 | ||||||
Balance at end of period | 16,289 | 18,171 | 20,830 | ||||||||
Unrealized investment gain: | |||||||||||
Balance at beginning of period | — | — | 29 | ||||||||
Reclassification to earnings, net of tax | — | — | (29 | ) | |||||||
Balance at end of period | — | — | — | ||||||||
Accumulated other comprehensive income end of period | $ | 16,289 | $ | 18,171 | $ | 20,830 | |||||
During the fourth quarter of fiscal year 2013, we recorded $0.5 million in other income (expense), net within our consolidated statement of operations related to the liquidation of our Japan and Italy subsidiaries and the release of the corresponding cumulative translation adjustment.
Stockholder Rights Plan
On July 28, 2005, we adopted a Stockholder Rights Plan ("the Rights Plan"), under which stockholders of record at the close of business on August 15, 2005 received one share purchase right ("Right") for each share of our common stock held on that date. The description and terms of the Rights are set forth in a Rights Agreement between us and Computershare Trust Company, N.A. (the “Rights Agent”), as successor to Mellon Investor Services, LLC, dated July 28, 2005 (as amended from time to time, the “Rights Agreement”). On May 5, 2015, we entered into Amendment No. 3 to Rights Agreement (the “Amendment”) to change the “Final Expiration Date” of the Rights Agreement from July 27, 2015 to May 5, 2015. As a result of the Amendment, effective as of the close of business on May 5, 2015, the Rights expired and were no longer outstanding and the Rights Agreement terminated by its terms.
59
9. | EMPLOYEE STOCK PLANS |
As of December 31, 2015, we had approximately 4.1 million shares available for future grant under our 2012 Equity Incentive Plan (the "2012 Plan").
On May 28, 2015, the stockholders approved an amendment to our 2012 Plan: (i) increasing the number of shares reserved for issuance under the 2012 Plan by an additional 2.5 million shares, bringing the total shares reserved thereunder, to 19.5 million shares; and (ii) removing the 1.75 share accounting ratio applicable to stock awards and restricted stock units.
Stock Options
Options to purchase common stock granted under the 2012 Plan generally have terms not exceeding seven years. Options to purchase stock under our equity incentive plans are granted at exercise prices that are at least 100 percent of the fair market value of our common stock on the date of grant. Generally, 25 percent of the options vest on the first anniversary of the vesting commencement date, and the remaining options vest 1/36 per month for the next 36 months thereafter. In December 2013, our Board of Directors approved the adoption of monthly vesting of stock options for employees with a minimum of one year of service.
We granted 0.7 million, 0.7 million and 1.6 million stock options during 2015, 2014 and 2013, respectively, with an estimated total grant date fair value of $1.2 million, $0.9 million and $1.4 million, respectively. We settle employee stock option exercises with newly issued common shares.
The following table summarizes the stock option activity under all of our equity incentive plans for the years ended December 31, 2015 and 2014:
Number of Shares | Weighted- Average Exercise Price Per Share | Weighted Average Remaining Contractual Life | Aggregate Intrinsic Value | |||||||||
(thousands) | (years) | (thousands) | ||||||||||
Outstanding at December 31, 2013 | 4,993 | $ | 2.18 | 4.9 | $ | 5,281 | ||||||
Granted | 746 | 2.42 | ||||||||||
Exercised | (486 | ) | 1.03 | |||||||||
Forfeited or expired | (333 | ) | 7.01 | |||||||||
Outstanding at December 31, 2014 | 4,920 | $ | 2.01 | 4.2 | $ | 7,513 | ||||||
Granted | 716 | 3.37 | ||||||||||
Exercised | (1,017 | ) | 1.91 | |||||||||
Forfeited or expired | (447 | ) | 4.16 | |||||||||
Outstanding at December 31, 2015 | 4,172 | $ | 2.04 | 4.1 | $ | 6,254 | ||||||
Vested and expected to vest at December 31, 2015 | 3,928 | $ | 2.00 | 4.0 | $ | 6,059 | ||||||
Exercisable at December 31, 2015 | 2,785 | $ | 1.80 | 3.5 | $ | 4,818 | ||||||
The aggregate intrinsic value represents the pre-tax differences between the exercise price of stock options and the quoted market price of our stock on December 31, 2015 for all in-the-money stock options.
The following table provides supplemental information pertaining to our stock options for the years ended December 31 (in thousands, except weighted-average fair values):
2015 | 2014 | 2013 | |||||||||
Weighted-average fair value of options granted | $ | 1.70 | $ | 1.24 | $ | 0.87 | |||||
Intrinsic value of options exercised | $ | 2,449 | $ | 685 | $ | 386 | |||||
Cash received from options exercised | $ | 1,940 | $ | 502 | $ | 445 | |||||
60
Restricted Stock Units
The 2012 Plan provides for grants of time-based and performance-based restricted stock units ("RSUs"). As of December 31, 2015, we only had time-based RSUs outstanding.
Historically, 25 percent of the time-based RSUs vest on each anniversary of the vesting commencement date or date of grant. In December 2013, our Board of Directors approved a quarterly vesting schedule for RSUs. On occasion, we grant time-based RSUs for varying purposes with different vesting schedules. Time-based RSUs granted under the 2012 Plan prior to May 28, 2015 are counted against the total number of shares of common stock available for grant at a ratio of 1.75 shares of common stock for every one share of common stock subject thereto, and RSUs granted on or after May 28, 2015 are counted against the total number of shares of common stock available for grant at a ratio of 1.00 share of common stock for every one share of common stock subject thereto.
The following table summarizes RSU activity under all of our equity incentive plans for the years ended December 31, 2015 and 2014:
Number of Shares | Weighted Average Grant Date Fair Value | |||||
(thousands) | ||||||
Outstanding at December 31, 2013 | 429 | $ | 1.45 | |||
Granted | 697 | 2.42 | ||||
Released | (232 | ) | 1.99 | |||
Forfeited or Expired | (17 | ) | 2.49 | |||
Outstanding at December 31, 2014 | 877 | $ | 2.06 | |||
Granted | 994 | 3.33 | ||||
Released | (462 | ) | 2.57 | |||
Forfeited or Expired | (120 | ) | 2.86 | |||
Outstanding at December 31, 2015 | 1,289 | $ | 2.78 | |||
Employee Stock Purchase Plan
Our 1994 Employee Stock Purchase Plan (“1994 Plan”) was originally adopted by the Board of Directors and approved by the stockholders in 1994. In May 2014, the Board of Directors amended and restated the 1994 Plan, which was then approved by the stockholders, extending the term of the 1994 Plan by an additional ten years, with an expiration date of May 19, 2024.
Our 1994 Plan is a non-compensatory employee stock purchase plan ("ESPP"), which allows each eligible employee to withhold up to 15 percent of gross compensation over semi-annual six month ESPP periods to purchase shares of our common stock, limited to 2,000 shares per ESPP period through December 2013, and 4,000 shares per ESPP period thereafter. Under the ESPP, employees purchase stock at a price equal to 90 percent of the fair market value (generally the closing price of our common stock) on the last trading day prior to the end of the six month ESPP offering period.
We reserved approximately 6.2 million shares of common stock for issuance under the ESPP, of which 2.4 million shares were available for issuance as of December 31, 2015. We issued approximately 0.1 million shares under the ESPP in each of the years ended December 31, 2015, 2014 and 2013, with average purchase prices of $2.99, $2.17 and $2.09, respectively.
Employee Savings Plan
We have an employee retirement and savings plan (the "ESP"), which qualifies under section 401(k) of the Internal Revenue Code. All full-time employees of eligible age (over 21 years old) can participate in the ESP and can contribute up to an amount allowed by the applicable Internal Revenue Service guidelines. At our discretion, we can make matching contributions to the ESP equal to a percentage of the participants' contributions. For the years ended December 31, 2015,
61
2014 and 2013, we recorded 401(k) match contributions in the amount of $0.2 million, $0.2 million and $0.1 million, respectively.
10.STOCK-BASED COMPENSATION
We account for stock-based compensation in accordance with the applicable authoritative guidance, which requires the measurement of stock-based compensation on the date of grant based on the fair value of the award, and the recognition of the expense over the requisite service period for the employee. Compensation related to RSUs is the intrinsic value on the date of grant, which is the closing price of our common stock less the employee exercise price, if any. Compensation related to stock options is determined using a stock option valuation model.
Valuation Assumptions
We use the Black-Scholes valuation model to determine the fair value of stock options. The Black-Scholes model requires the input of highly subjective assumptions, which are summarized in the table below for the years ended December 31:
2015 | 2014 | 2013 | |||
Expected dividend yield | — | — | — | ||
Expected stock price volatility | 66% | 67% | 83% | ||
Risk-free interest rate | 1.2% | 1.3% | 0.9% | ||
Expected life of options in years | 4.0 | 4.0 | 4.4 | ||
We estimate the expected life of options based on an analysis of our historical experience of employee exercise and post-vesting termination behavior considered in relation to the contractual life of the option. Expected volatility is based on the historical volatility of our common stock. The risk-free interest rate is the rate on a U.S. Treasury Bill, with a maturity approximating the expected life of the option. We do not currently pay cash dividends on our common stock and do not anticipate doing so in the foreseeable future. Accordingly, the expected dividend yield is zero.
Stock-based compensation expense on time-based RSUs is determined based on the fair value of our common stock on the date of grant of the RSU and recognized over the vesting period.
Our stock-based compensation for the years ended December 31 was as follows (in thousands):
2015 | 2014 | 2013 | |||||||||
Stock-based compensation by type of award: | |||||||||||
Stock options | $ | 1,018 | $ | 994 | $ | 1,289 | |||||
Restricted stock units | 1,227 | 484 | 124 | ||||||||
Employee stock purchase plan | 35 | 48 | 20 | ||||||||
$ | 2,280 | $ | 1,526 | $ | 1,433 | ||||||
Stock-based compensation by category of expense: | |||||||||||
Cost of goods sold | $ | 167 | $ | 40 | $ | 52 | |||||
Research, development and engineering | 253 | 181 | 254 | ||||||||
Selling, general and administrative | 1,860 | 1,305 | 1,127 | ||||||||
$ | 2,280 | $ | 1,526 | $ | 1,433 | ||||||
We did not capitalize any stock-based compensation as inventory in the years ended December 31, 2015, 2014 and 2013, as such amounts were immaterial. As of December 31, 2015, we had $1.3 million in unrecognized stock-based compensation expense, net of estimated forfeitures, related to stock options that will be recognized over a weighted-average period of 2.2 years. As of December 31, 2015, we had $2.6 million in unrecognized stock-based compensation expense, net of estimated forfeitures, related to unvested RSUs that will be recognized over a weighted-average period of 2.5 years.
62
11. | GEOGRAPHIC AND CUSTOMER CONCENTRATION INFORMATION |
The authoritative guidance on segment reporting and disclosure defines an operating segment as a component of an enterprise for which separate financial information is available that is evaluated regularly by the chief operating decision maker in deciding how to allocate resources and in assessing performance. For the purposes of evaluating our reportable segments, our Chief Executive Officer is the chief operating decision maker.
We have one operating segment in which we design, manufacture and market advanced fabrication equipment for the semiconductor manufacturing industry. As our business is completely focused on one industry segment, the design, manufacture and marketing of advanced fabrication equipment to the semiconductor manufacturing industry, management believes that we have one reportable segment. Our net sales and profits are generated from the sales of systems and services in this one segment.
The following table summarizes net revenue by geographic areas based on the installation locations of the systems and the location of services rendered (in thousands, except percentages):
For the Years Ended December 31, | |||||||||||||||||
2015 | 2014 | 2013 | |||||||||||||||
Amount | Percent | Amount | Percent | Amount | Percent | ||||||||||||
Net revenue: | |||||||||||||||||
United States | $ | 25,061 | 15 | $ | 25,716 | 14 | $ | 12,350 | 10 | ||||||||
Korea | 73,798 | 43 | 87,585 | 49 | 22,173 | 19 | |||||||||||
Taiwan | 17,537 | 10 | 32,304 | 18 | 50,782 | 43 | |||||||||||
China | 29,209 | 17 | 17,369 | 10 | 20,250 | 17 | |||||||||||
Other Asia | 19,560 | 11 | 6,869 | 4 | 8,740 | 7 | |||||||||||
Europe and others | 7,367 | 4 | 8,561 | 5 | 5,139 | 4 | |||||||||||
$ | 172,532 | 100 | $ | 178,404 | 100 | $ | 119,434 | 100 | |||||||||
In 2015, two customers accounted for 10 percent or more of our total net revenues. Sales to these customers represented 54 percent and 11 percent of our total net revenues, respectively. In 2014, one customer accounted for 10 percent or more of our total net revenues. Sales to this customer represented 61 percent of our total net revenues. In 2013, two customers accounted for 10 percent or more of our total net revenues. Sales to these customers represented approximately 35 percent and 33 percent of our total net revenues, respectively.
As of December 31, 2015, five customers accounted for 10 percent or more of our total net accounts receivable, representing approximately 36 percent, 12 percent, 12 percent, 11 percent and 10 percent of our total net accounts receivable, respectively. As of December 31, 2014, one customer accounted for 10 percent or more of our net accounts receivable representing approximately 74 percent of our total net accounts receivable.
Geographical information relating to our property and equipment, net, as of December 31 was as follows (in thousands):
2015 | 2014 | ||||||
Property and equipment, net: | |||||||
United States | $ | 3,350 | $ | 4,140 | |||
Germany | 4,712 | 3,185 | |||||
Others | 174 | 209 | |||||
$ | 8,236 | $ | 7,534 | ||||
63
12. | INCOME TAXES |
The components of income (loss) before income taxes for the years ended December 31 are as follows (in thousands):
2015 | 2014 | 2013 | |||||||||
Domestic income (loss) | $ | 8,104 | $ | 7,248 | $ | (21,743 | ) | ||||
Foreign income | 3,073 | 2,972 | 10,226 | ||||||||
Income (loss) before income taxes | $ | 11,177 | $ | 10,220 | $ | (11,517 | ) | ||||
The provision for (benefit from) income taxes for the years ended December 31 consists of the following (in thousands):
2015 | 2014 | 2013 | |||||||||
Current: | |||||||||||
Federal | $ | — | $ | — | $ | (466 | ) | ||||
State | 51 | 28 | 52 | ||||||||
Foreign | 667 | 160 | (125 | ) | |||||||
Total current | 718 | 188 | (539 | ) | |||||||
Deferred: | |||||||||||
Federal | — | — | — | ||||||||
State | — | — | — | ||||||||
Foreign | 144 | 151 | (3 | ) | |||||||
Total deferred | 144 | 151 | (3 | ) | |||||||
Provisions for (benefit from) income taxes | $ | 862 | $ | 339 | $ | (542 | ) | ||||
The provision for (benefit from) income taxes reconciles to the amount computed by multiplying income (loss) before income taxes by the U.S. statutory rate of 35 percent as follows (in thousands):
Years Ended December 31, | |||||||||||
2015 | 2014 | 2013 | |||||||||
Benefits at statutory rate | $ | 3,912 | $ | 3,577 | $ | (4,031 | ) | ||||
Deferred tax asset valuation allowance | (3,705 | ) | (3,182 | ) | 5,256 | ||||||
Foreign earnings taxed at U.S. rates | 208 | 403 | 1,966 | ||||||||
Foreign earnings taxed at different rates | (388 | ) | (540 | ) | (3,315 | ) | |||||
State taxes, net of Federal benefit | 416 | 18 | 34 | ||||||||
Nondeductible stock option expense | 173 | 244 | 322 | ||||||||
Uncertain tax position reserve release | 41 | (188 | ) | (579 | ) | ||||||
Other | 205 | 7 | (195 | ) | |||||||
Provision for (benefit from) income taxes | $ | 862 | $ | 339 | $ | (542 | ) | ||||
64
Deferred tax assets (liabilities) as of December 31 are comprised of the following (in thousands):
2015 | 2014 | ||||||
Net operating loss carryforwards | $ | 159,722 | $ | 161,422 | |||
Reserves not currently deductible | 6,106 | 7,547 | |||||
Tax credit carryforwards | 849 | 849 | |||||
Depreciation | 5,073 | 6,006 | |||||
Deferred revenue | 1,749 | 1,186 | |||||
Other | 1,599 | (161 | ) | ||||
Total deferred tax asset | 175,098 | 176,849 | |||||
Valuation allowance | (173,081 | ) | (176,786 | ) | |||
Net deferred tax asset | 2,017 | 63 | |||||
Deferred tax liability | (2,291 | ) | (192 | ) | |||
Net deferred tax asset (liability) | $ | (274 | ) | $ | (129 | ) | |
The valuation allowance as of December 31, 2015 and 2014 is against all deferred tax assets for all jurisdictions except Korea. Our valuation allowance was determined in accordance with the applicable authoritative guidance, which requires an assessment of both positive and negative evidence when determining whether it is more likely than not that deferred assets are recoverable, with such assessment being required on a jurisdiction-by-jurisdiction basis. In assessing the need for a valuation allowance in the current year, management considered historical levels of income and losses, expectations and risks associated with estimates of future taxable income and ongoing prudent and feasible tax planning strategies. Factors considered in providing a valuation allowance include the lack of a significant history of consistent profits, the cyclical nature of the overall semiconductor market thereby negatively impacting our ability to sustain or grow revenues and earnings and the lack of carry-back capacity to realize these assets. Based on the absence of sufficient positive objective evidence, management is unable to assert that it is more likely than not that we will generate sufficient taxable income to realize these remaining net deferred assets. The amount of the deferred tax asset valuation allowance, however, could be reduced in future periods to the extent that future taxable income is realized.
As of December 31, 2015, we had Federal and state net operating loss carryforwards of approximately $447.9 million and $113.0 million, respectively, which will begin expiring in 2018 for Federal and 2016 for state. We also have foreign net operating loss carryforwards in Canada and Germany of approximately $38.0 million and $29.2 million, respectively. Canada's net operating loss carryforwards begin expiring in 2026. The German net operating loss carryforward has an indefinite carryover life.
Our net operating losses include those acquired as a result of our acquisitions of Vortek, STEAG Semiconductor Division, CFM and Concept Systems Design, Inc. ("Concept"). The Federal and state net operating losses acquired from the STEAG Semiconductor Division, CFM and Concept are also subject to change in control limitations as defined in Section 382 of the Internal Revenue Code. If certain substantial changes in our ownership occur, there would be an additional annual limitation on the amount of the net operating loss carryforwards that can be utilized.
As of December 31, 2015, we had research credit carryforwards of approximately $2.7 million and $4.0 million for Federal and state income tax purposes, respectively. If not utilized, the Federal carryforward will expire in various amounts beginning in 2017. The California tax credit can be carried forward indefinitely.
We provide U.S. income taxes on the earnings of foreign subsidiaries unless the subsidiaries' earnings are considered indefinitely reinvested outside the U.S. As of December 31, 2015, U.S. income taxes were not provided for on a cumulative total of $0.4 million of undistributed earnings for certain foreign subsidiaries. If these earnings were repatriated, we would be subject to additional U.S. income taxes (subject to an adjustment for foreign tax credits). It is not practical to determine the income tax liability that might be incurred if these earnings were to be repatriated. We intend to permanently reinvest all foreign unremitted earnings of foreign subsidiaries outside of the U.S., except for Germany, Korea and Canada. Our indefinitely reinvested non-U.S. earnings have been deployed in active business operations, and it is unlikely that we will repatriate any portion of our indefinitely reinvested non-U.S. earnings in the future.
As of December 31, 2015, our total unrecognized tax benefits were approximately $24.3 million exclusive of interest and penalties described below. Included in the $24.3 million is approximately $0.2 million of unrecognized tax benefits (net of
65
Federal benefit), that if recognized, would favorably affect the effective tax rate in a future period before consideration of changes in the valuation allowance. We anticipate there will be no significant decrease in our unrecognized tax benefits within the next twelve months.
Our practice is to recognize interest and/or penalties related to unrecognized tax benefits in income tax expense. Provisions for income taxes included estimated interest of zero, $0.1 million and $0.1 million for each of the years ended December 31, 2015, 2014 and 2013, respectively. As of December 31, 2015 and 2014, we had $0.1 million and $0.1 million, respectively, accrued for estimated interest. We had no accruals for estimated penalties as of December 31, 2015 and 2014.
We are subject to United States Federal income tax as well as to income taxes in Germany, Korea and various other foreign and U.S. state jurisdictions. Our Federal and state income tax returns are generally not subject to examination by tax authorities for years before 2012 and 2011, respectively. However, due to the fact that we have net operating losses and credits carried forward, certain items attributable to technically closed years are still subject to adjustment by the relevant taxing authority through an adjustment to the tax attributes carried forward to open years. Our German and Korea income tax returns are generally not subject to examination by tax authorities before 2010. We had no material tax audits in progress as of December 31, 2015.
A reconciliation of unrecognized tax benefits is as follows (in thousands):
Years Ended December 31, | |||||||||||
2015 | 2014 | 2013 | |||||||||
Balance at the beginning of the year | $ | 25,100 | $ | 25,500 | $ | 25,900 | |||||
Tax positions related to current and prior years: | |||||||||||
Additions | — | — | 1,000 | ||||||||
Reductions | — | (100 | ) | (100 | ) | ||||||
Expiration of statutes of limitations | (800 | ) | (300 | ) | (1,300 | ) | |||||
Balance at the end of the year | $ | 24,300 | $ | 25,100 | $ | 25,500 | |||||
13. | NET INCOME (LOSS) PER SHARE |
We present both basic and diluted net income (loss) per share on the face of our consolidated statements of operations in accordance with the authoritative guidance on earnings per share. Basic net income (loss) per share is computed by dividing net income (loss) by the weighted-average number of shares of common stock outstanding for the period. Diluted net income (loss) per share is computed using the weighted-average number of shares of common stock outstanding plus the effect of common stock equivalents, unless the common stock equivalents are anti-dilutive. The potential dilutive shares of our common stock are determined using the treasury stock method. Under the treasury stock method, the amount the employee must pay for exercising stock options, the amount of compensation cost yet to be recognized for future service, and the amount of tax benefits that is to be recorded when the award becomes deductible are assumed be used to repurchase shares.
66
The following table presents the computation of net income (loss) per share of common stock (in thousands, except for per share data):
Years Ended December 31, | |||||||||||
2015 | 2014 | 2013 | |||||||||
Basic and diluted net income (loss) per share of common stock: | |||||||||||
Numerator: | |||||||||||
Net income (loss) | $ | 10,315 | $ | 9,881 | $ | (10,975 | ) | ||||
Denominator: | |||||||||||
Weighted-average shares outstanding - basic | 74,916 | 71,897 | 58,944 | ||||||||
Effect of dilutive stock options and restricted stock units | 1,899 | 1,506 | — | ||||||||
Weighted-average shares outstanding - diluted | 76,815 | 73,403 | 58,944 | ||||||||
Net income (loss) per share of common stock: | |||||||||||
Basic | $ | 0.14 | $ | 0.14 | $ | (0.19 | ) | ||||
Diluted | $ | 0.13 | $ | 0.13 | $ | (0.19 | ) | ||||
For the years ended December 31, 2015 and 2014, options and RSUs totaling 1.2 million and 2.3 million, respectively, were excluded from diluted net income per share because their inclusion would have been anti-dilutive. Options are considered anti-dilutive if the exercise price exceeds the average stock price for the applicable period. For the year ended December 31, 2013, options to purchase our common stock and restricted stock units totaling 4.7 million were excluded from diluted net loss per share because their inclusion would have been anti-dilutive, since we had a net loss for the year ended December 31, 2013. Accordingly, basic and diluted net loss per share were the same for the year ended December 31, 2013.
67
Supplementary Financial Information
Selected Quarterly Consolidated Financial Data (Unaudited)
The following tables set forth our unaudited condensed consolidated statements of operations data for the eight quarterly periods ended December 31, 2015. We have prepared this unaudited information on a basis consistent with our audited consolidated financial statements, reflecting all normal recurring adjustments that we consider necessary for a fair presentation of our financial position and operating results for the fiscal quarters presented. Basic and diluted income (loss) per share is computed independently for each of the quarters presented. Therefore, the sum of quarterly basic and diluted per share information may not equal annual basic and diluted income (loss) per share.
The following tables set forth selected unaudited financial data for each quarter for the last two fiscal years (in thousands, except for per share amounts):
Three Months Ended | |||||||||||||||
March 29, 2015 | June 28, 2015 | September 27, 2015 | December 31, 2015 | ||||||||||||
Net revenue | $ | 58,254 | $ | 43,334 | $ | 38,894 | $ | 32,049 | |||||||
Gross margin | $ | 21,394 | $ | 16,019 | $ | 13,547 | $ | 13,787 | |||||||
Income (loss) from operations | $ | 7,303 | $ | 2,677 | $ | 1,702 | $ | (162 | ) | ||||||
Net income (loss) | $ | 6,305 | $ | 2,581 | $ | 2,023 | $ | (594 | ) | ||||||
Net income (loss) per share: | |||||||||||||||
Basic | $ | 0.08 | $ | 0.03 | $ | 0.03 | $ | (0.01 | ) | ||||||
Diluted | $ | 0.08 | $ | 0.03 | $ | 0.03 | $ | (0.01 | ) | ||||||
Shares used in computing net income (loss) per share: | |||||||||||||||
Basic | 74,700 | 74,920 | 75,129 | 75,287 | |||||||||||
Diluted | 77,265 | 77,019 | 76,546 | 75,287 | |||||||||||
Three Months Ended | |||||||||||||||
March 30, 2014 | June 29, 2014 | September 28, 2014 | December 31, 2014 | ||||||||||||
Net revenue | $ | 43,198 | $ | 42,029 | $ | 38,430 | $ | 54,747 | |||||||
Gross margin | $ | 14,646 | $ | 13,296 | $ | 12,998 | $ | 17,877 | |||||||
Income from operations | $ | 2,701 | $ | 2,049 | $ | 546 | $ | 4,817 | |||||||
Net income | $ | 2,465 | $ | 1,916 | $ | 537 | $ | 4,963 | |||||||
Net income per share: | |||||||||||||||
Basic | $ | 0.04 | $ | 0.03 | $ | 0.01 | $ | 0.07 | |||||||
Diluted | $ | 0.04 | $ | 0.03 | $ | 0.01 | $ | 0.07 | |||||||
Shares used in computing net income per share: | |||||||||||||||
Basic | 66,275 | 73,532 | 73,731 | 73,861 | |||||||||||
Diluted | 67,971 | 74,679 | 75,023 | 75,486 | |||||||||||
68
Item 9. Changes in and Disagreements with Accountants on Accounting and Financial Disclosure
None.
Item 9A. Controls and Procedures
Evaluation of Disclosure Controls and Procedures
Our management, with the participation of our Chief Executive Officer and Chief Financial Officer, evaluated the effectiveness of the design and operation of our disclosure controls and procedures, as such term is defined in Rule 13a-15(e) promulgated under the Securities Exchange Act of 1934, as amended, as of December 31, 2015.
The term “disclosure controls and procedures,” as defined in Rules 13a-15(e) and 15d-15(e) under the Securities Exchange Act of 1934, as amended (the "Exchange Act"), means controls and other procedures that are designed to ensure that information required to be disclosed by us in the reports that we file or submit under the Exchange Act is (i) recorded, processed, summarized and reported within the time periods specified in the Securities and Exchange Commission's rules and forms and (ii) accumulated and communicated to our management, including the Chief Executive Officer and Chief Financial Officer, as the principal executive and financial officers, respectively, to allow timely decisions regarding required disclosures.
Based on this evaluation, our Chief Executive Officer and Chief Financial Officer concluded that our disclosure controls and procedures were effective as of the end of the period covered by this report.
Management's Report on Internal Control over Financial Reporting
Our management is responsible for establishing and maintaining adequate internal control over financial reporting, as such term is defined in Rules 13a-15(f) and 15d-15(f) under the Exchange Act. Our internal control over financial reporting is a process designed to provide reasonable assurance regarding the reliability of financial reporting and the preparation of financial statements for external purposes in accordance with generally accepted accounting principles.
Under the supervision and with the participation of our management, including our Chief Executive Officer and Chief Financial Officer, we conducted an assessment of the effectiveness of our internal control over financial reporting as of December 31, 2015. In making this assessment, management used the criteria set forth in the framework established by the Committee of Sponsoring Organizations of the Treadway Commission (COSO) entitled Internal Control-Integrated Framework (2013). Based on our assessment, management concluded that, as of December 31, 2015, our internal control over financial reporting is effective based on these criteria.
The effectiveness of our internal control over financial reporting as of December 31, 2015 has been audited by Armanino LLP, an independent registered public accounting firm, as stated in their report, which appears under Item 8 of this annual report on Form 10-K.
Changes in Internal Control over Financial Reporting
There were no changes in our internal control over financial reporting identified in connection with the evaluation required by paragraph (d) of Exchange Act Rules 13a-15 or 15d-15 that occurred during our fourth fiscal quarter that have materially affected, or are reasonably likely to materially affect, our internal control over financial reporting.
Limitations on Effectiveness of Controls and Procedures
It should be noted that any system of controls, however well designed and operated, can provide only reasonable, and not absolute, assurance that the objectives of the system will be met. In addition, the design of any control system is based in part upon certain assumptions about the likelihood of future events, and there can be no assurance that any design will succeed in achieving its stated goals under all potential future conditions. Over time, controls may become inadequate because of changes in conditions or deterioration in the degree of compliance with policies or procedures. Because of the inherent limitations in a cost-effective control system, misstatements due to error or fraud may occur and not be detected.
69
Item 9B. Other information
None.
PART III
Item 10. Directors, Executive Officers and Corporate Governance
The information required by this item will be included under the captions “Executive Compensation,” “Election of Directors,” “Report of the Audit Committee” and “Section 16(a) Beneficial Ownership Reporting Compliance” for the 2016 Annual Meeting in our Proxy Statement with the SEC within 120 days of the year end December 31, 2015 (2016 Proxy Statement) and is incorporated herein by reference. If the definitive proxy statement is not filed within such timeframe, the Registrant will file an amendment to this Form 10-K to set forth the information required by Part III of this Report, to the extent not set forth herein.
We have adopted a Code of Ethics and Business Conduct for all officers, directors and employees. We have posted the Code of Ethics and Business Conduct on our website located at http://www.mattson.com. We intend to satisfy the disclosure requirement under Item 5.05 of Form 8-K regarding an amendment to, or a waiver from, this Code of Ethics by posting such information on our website.
Item 11. Executive Compensation
The information required by this item will be set forth in our 2016 Proxy Statement under the captions “Executive Compensation” and “Report of the Compensation Committee on Executive Compensation” and is incorporated herein by reference. If the definitive proxy statement is not filed within such timeframe, the Registrant will file an amendment to this Form 10-K to set forth the information required by Part III of this Report, to the extent not set forth herein.
Item 12. Security Ownership of Certain Beneficial Owners and Management and Related Stockholder Matters
Information related to the security ownership of certain beneficial owners and management will be set forth in our 2016 Proxy Statement under the caption “Security Ownership of Management and Principal Stockholders,” and is incorporated herein by reference. If the definitive proxy statement is not filed within such timeframe, the Registrant will file an amendment to this Form 10-K to set forth the information required by Part III of this Report, to the extent not set forth herein.
Item 13. Certain Relationships and Related Transactions, and Director Independence
The information required by this item will be set forth in our 2016 Proxy Statement under the caption “Certain Relationships and Related Transactions, and Director Independence” and is incorporated herein by reference. If the definitive proxy statement is not filed within such timeframe, the Registrant will file an amendment to this Form 10-K to set forth the information required by Part III of this Report, to the extent not set forth herein.
Item 14. Principal Accountant Fees and Services
The information required by this item will be set forth in our 2016 Proxy Statement under the captions “Audit and Related Fees” and “Policy on Audit Committee Pre-Approval of Audit and Permissible Non-Audit Services of Independent Auditors” and is incorporated herein by reference. If the definitive proxy statement is not filed within such timeframe, the Registrant will file an amendment to this Form 10-K to set forth the information required by Part III of this Report, to the extent not set forth herein.
70
PART IV
Item 15. Exhibits and Financial Statement Schedules
(a)(1) Financial Statements
The financial statements filed as part of this report are listed on the index to consolidated financial statements in Item 8.
(a)(2) Financial Statement Schedules
Schedule II - Valuation and Qualifying Accounts for the three years ended December 31, 2015, 2014 and 2013, which is included in Schedule II of this Form 10-K.
(a)(3) Exhibits
Exhibit | Incorporated By Reference | Filed | ||||||||
Number | Description | Form | Date | Number | Within | |||||
2.1 | Agreement and Plan of Merger by and among Beijing E-Town Dragon Semiconductor Industry Investment Center (Limited Partnership), Dragon Acquisition Sub, Inc. and Mattson Technology, Inc., dated December 1, 2015 | 8-K | 12/2/2015 | 2.1 | ||||||
2.2 | Guarantee, dated December 1, 2015, by Beijing E-Town International Investment & Development Co., Ltd. in favor of Mattson Technology, Inc. | 8-K | 12/2/2015 | 2.2 | ||||||
3.1 | Amended and Restated Certificate of Incorporation of Mattson Technology, Inc. | 8-K/A | 1/30/2001 | 3(i) | ||||||
3.2 | Amended and Restated Bylaws of Mattson Technology, Inc. | 8-K | 12/22/2010 | 3.1 | ||||||
3.3 | Certificate of Elimination of Series A Preferred Stock of Mattson Technology, Inc. | 8-K | 5/5/2015 | 3.1 | ||||||
10.1 | Credit Agreement between Mattson Technology, Inc. and Silicon Valley Bank | 10-Q | 5/9/2013 | 10.4 | ||||||
10.2 | Waiver and Amendment Agreement Between Mattson Technology, Inc. and Silicon Valley Bank dated February 5, 2014 | 8-K | 2/5/2014 | 10.1 | ||||||
10.3 | Waiver and Amendment Agreement Between Mattson Technology, Inc. and Silicon Valley Bank dated April 23, 2014 | 8-K | 4/28/2014 | 10.1 | ||||||
10.4 | Amendment Agreement No. 4 Between Mattson Technology, Inc. and Silicon Valley Bank dated October 21, 2014 | 8-K | 10/23/2014 | 10.1 | ||||||
10.5 | Industrial Space Lease, dated August 1, 2005, between Mattson Technology, Inc. and Renco Equities IV, a California partnership | 10-Q | 11/4/2005 | 10.14 | ||||||
10.6 | First Lease Amendment, dated January 7, 2016, between Mattson Technology, Inc. and Sir Properties Trust | 8-K | 1/13/2016 | 10.1 | ||||||
10.7+ | Mattson Technology, Inc. Amended and Restated 1989 Stock Option Plan | 10-Q | 8/14/2002 | 10.2 | ||||||
10.8+ | Mattson Technology, Inc. 2005 Equity Incentive Plan | DEF 14A | 4/20/2005 | Appendix A | ||||||
10.9+ | Amendment #1 to Mattson Technology, Inc. 2005 Equity Incentive Plan | DEF 14A | 4/26/2007 | Appendix 1 | ||||||
10.10+ | Mattson Technology, Inc. 2012 Equity Incentive Plan | DEF 14A | 3/23/2012 | Appendix 1 | ||||||
10.11+ | Mattson Technology, Inc. 2012 Equity Incentive Plan, Amended and Restated | 8-K | 5/29/2015 | 10.1 | ||||||
10.12+ | Amended and Restated Mattson Technology, Inc. 1994 Employee Stock Purchase Plan | 10-K | 3/11/2011 | 10.5 | ||||||
10.13+ | Amended and Restated Mattson Technology, Inc. 1994 Employee Stock Purchase Plan | 10-Q | 8/1/2014 | 10.2 | ||||||
10.14+ | Offer Letter between Mattson Technology, Inc. and Fusen E. Chen | 10-K | 3/15/2013 | 10.16 | ||||||
10.15+ | Offer Letter between Mattson Technology, Inc. and J. Michael Dodson | 10-Q | 11/7/2011 | 10.2 | ||||||
10.16+ | Offer Letter Between Mattson Technology, Inc. and Hoang H. Hoang | 10-Q | 8/9/2013 | 10.3 | ||||||
10.17+ | Severance and Executive Change of Control Agreement for Fusen E. Chen, Chief Executive Officer | 10-K | 3/15/2013 | 10.15 | ||||||
71
Exhibit | Incorporated By Reference | Filed | ||||||||
Number | Description | Form | Date | Number | Within | |||||
10.18+ | Severance and Executive Change of Control Agreement for J. Michael Dodson, Chief Financial Officer | 8-K | 1/6/2012 | 10.1 | ||||||
10.19+ | Change of Control Agreement Between Mattson Technology, Inc. and Hoang H. Hoang | 10-Q | 8/9/2013 | 10.4 | ||||||
10.20+ | Change of Control Agreement Between Mattson Technology, Inc. and Tyler Purvis | 10-Q | 11/5/2014 | 10.2 | ||||||
10.21+ | Form of Indemnity Agreement | 8-K | 6/10/2010 | 10.1 | ||||||
21.1 | Subsidiaries of Registrant | X | ||||||||
23.1 | Consent of Independent Registered Public Accounting Firm | X | ||||||||
23.2 | Consent of Independent Registered Public Accounting Firm | X | ||||||||
31.1 | Certification of Chief Executive Officer Pursuant to Sarbanes‑Oxley Act Section 302(a) | X | ||||||||
31.2 | Certification of Chief Financial Officer Pursuant to Sarbanes‑Oxley Act Section 302(a) | X | ||||||||
32.1 | Certification of Chief Executive Officer and Chief Financial Officer Pursuant to 18 U.S.C. Section 1350 | X | ||||||||
101.INS | XBRL Instance Document. | X | ||||||||
101.SCH | XBRL Taxonomy Extension Schema Document. | X | ||||||||
101.CAL | XBRL Taxonomy Extension Calculation Linkbase Document. | X | ||||||||
101.DEF | XBRL Taxonomy Extension Definition Linkbase Document. | X | ||||||||
101.LAB | XBRL Taxonomy Extension Label Linkbase Document. | X | ||||||||
101.PRE | XBRL Taxonomy Extension Presentation Linkbase Document. | X | ||||||||
Notes:
+ | Management contract or compensatory plan or arrangement. |
72
SIGNATURES
Pursuant to the requirements of the Securities Exchange Act of 1934, the registrant has duly caused this report to be signed on its behalf by the undersigned hereunto duly authorized.
MATTSON TECHNOLOGY, INC. | |
(Registrant) | |
Date: March 11, 2016 | By: /s/ FUSEN E. CHEN |
Fusen E. Chen President and Chief Executive Officer and Director (Principal Executive Officer) | |
Date: March 11, 2016 | By: /s/ J. MICHAEL DODSON |
J. Michael Dodson Chief Operating Officer, Chief Financial Officer, Executive Vice President and Secretary (Principal Financial Officer) | |
Date: March 11, 2016 | By: /s/ TYLER PURVIS |
Tyler Purvis Senior Vice President, Chief Accounting Officer and Corporate Controller (Principal Accounting Officer) | |
Pursuant to the requirements of the Securities Exchange Act of 1934, this report has been signed below by the following persons on behalf of the Registrant and in the capacities and on the date indicated.
Signature | Title | Date | ||
/s/ Kenneth Kannappan | Chairman of the Board and Director | March 11, 2016 | ||
Kenneth Kannappan | ||||
/s/ Kenneth Smith | Vice Chairman of the Board and Director | March 11, 2016 | ||
Kenneth Smith | ||||
/s/ Richard E. Dyck | Director | March 11, 2016 | ||
Richard E. Dyck | ||||
/s/ Scott Kramer | Director | March 11, 2016 | ||
Scott Kramer | ||||
/s/ Scott Peterson | Director | March 11, 2016 | ||
Scott Peterson | ||||
/s/ Thomas St. Dennis | Director | March 11, 2016 | ||
Thomas St. Dennis | ||||
73
SCHEDULE II
VALUATION AND QUALIFYING ACCOUNTS
(in thousands)
Allowance for Doubtful Accounts
Year Ended December 31, | Balance at Beginning of Year | Charged (Credited) to Income | Deduction and Other | Balance at End of Year | |||||||||||
2015 | $ | 669 | $ | 3 | $ | — | $ | 672 | |||||||
2014 | $ | 704 | $ | — | $ | (35 | ) | $ | 669 | ||||||
2013 | $ | 541 | $ | 163 | $ | — | $ | 704 | |||||||
Deferred Tax Asset Valuation Allowance
Year Ended December 31, | Balance at Beginning of Year | Charged (Credited) to Income | Deduction and Other | Balance at End of Year | |||||||||||
2015 | $ | 176,786 | $ | — | $ | (3,705 | ) | $ | 173,081 | ||||||
2014 | $ | 181,499 | $ | — | $ | (4,713 | ) | $ | 176,786 | ||||||
2013 | $ | 175,300 | $ | 6,199 | $ | — | $ | 181,499 | |||||||
74