Attached files
| file | filename |
|---|---|
| EX-21 - EXHIBIT 21 - INVESTORS TITLE CO | itic_20151231xex-21.htm |
| EX-23 - EXHIBIT 23 - INVESTORS TITLE CO | itic_20151231xex23.htm |
| EX-31.1 - EXHIBIT 31.1 - INVESTORS TITLE CO | itic_20151231xex-311.htm |
| EX-32 - EXHIBIT 32 - INVESTORS TITLE CO | itic_20151231xex-32.htm |
| EX-31.2 - EXHIBIT 31.2 - INVESTORS TITLE CO | itic_20151231xex-312.htm |
UNITED STATES
SECURITIES AND EXCHANGE COMMISSION
Washington, D.C. 20549
FORM 10-K
[X] ANNUAL REPORT PURSUANT TO SECTION 13 OR 15(d) OF
THE SECURITIES EXCHANGE ACT OF 1934
for the fiscal year ended December 31, 2015
[ ] TRANSITION REPORT PURSUANT TO SECTION 13 OR 15(d)
OF THE SECURITIES EXCHANGE ACT OF 1934
for the transition period from __to __
Commission file number 0-11774
INVESTORS TITLE COMPANY
(Exact name of registrant as specified in its charter)
North Carolina | 56-1110199 |
(State or other jurisdiction of | (I.R.S. Employer |
incorporation or organization) | Identification No.) |
121 North Columbia Street
Chapel Hill, North Carolina 27514
(919) 968-2200
(Address and telephone number of principal executive office)
Securities registered pursuant to section 12(b) of the Act: | Name of each exchange on which registered: |
Common Stock, no par value | The NASDAQ Stock Market LLC |
Rights to Purchase Series A Junior Participating Preferred Stock | The NASDAQ Stock Market LLC |
Securities registered pursuant to section 12(g) of the Act: None
Indicate by check mark whether the registrant is a well-known seasoned issuer, as defined in Rule 405 of the Securities Act. Yes [ ] No [X]
Indicate by check mark if the registrant is not required to file reports pursuant to Section 13 or Section 15(d) of the Exchange Act. Yes [ ] No [X]
Indicate by check mark whether the registrant (1) has filed all reports required to be filed by Section 13 or 15(d) of the Securities Exchange Act of 1934 during the preceding 12 months (or for such shorter period that the registrant was required to file such reports), and (2) has been subject to such filing requirements for the past 90 days. Yes [X] No [ ]
Indicate by check mark whether the registrant has submitted electronically and posted on its corporate Web site, if any, every Interactive Data File required to be submitted and posted pursuant to Rule 405 of Regulation S-T (Section 232.405 of this chapter) during the preceding 12 months (or for such shorter period that the registrant was required to submit and post such files). Yes [X] No [ ]
Indicate by check mark if disclosure of delinquent filers pursuant to Item 405 of Regulation S-K is not contained herein, and will not be contained, to the best of registrant’s knowledge, in definitive proxy or information statements incorporated by reference in Part III of this Form 10-K or any amendment to this Form 10-K. [X]
Indicate by check mark whether the registrant is a large accelerated filer, an accelerated filer, a non-accelerated filer, or a smaller reporting company. See the definitions of “large accelerated filer,” “accelerated filer” and “smaller reporting company” in Rule 12b-2 of the Exchange Act. (Check one):
Large accelerated filer [ ] Accelerated filer [X] Non-accelerated filer [ ] (Do not check if a smaller reporting company) Smaller reporting company [ ]
Indicate by check mark whether the registrant is a shell company (as defined in Rule 12b-2 of the Act). Yes [ ] No [X]
The aggregate market value of the shares held by non-affiliates of the registrant as of June 30, 2015 was $106,404,827 based on the closing price on the NASDAQ Stock Market LLC.
As of February 15, 2016, there were 1,936,646 common shares of the registrant outstanding.
DOCUMENTS INCORPORATED BY REFERENCE
Portions of Investors Title Company’s definitive proxy statement for the Annual Meeting of Shareholders to be held May 18, 2016 are incorporated by reference in Part III hereof.
SAFE HARBOR FOR FORWARD-LOOKING STATEMENTS
This Annual Report on Form 10-K, as well as information included in future filings by the Company with the Securities and Exchange Commission (“SEC”) and information contained in written material, press releases and oral statements issued by or on behalf of the Company, contains, or may contain, “forward-looking statements” within the meaning of Section 27A of the Securities Act of 1933 and Section 21E of the Securities Exchange Act of 1934, that reflect management’s current outlook for future periods. These statements may be identified by the use of words such as “plan,” “expect,” “aim,” “believe,” “project,” “anticipate,” “intend,” “estimate,” “should,” “could,” “would” and other expressions that indicate future events and trends. All statements that address expectations or projections about the future, including statements about the Company’s strategy for growth, product and service development, market share position, claims, expenditures, financial results and cash requirements, are forward-looking statements. Without limitation, projected developments in mortgage interest rates and the overall economic environment set forth in “Management’s Discussion and Analysis of Financial Condition and Results of Operations - Business Trends and Recent Conditions” constitute forward-looking statements. Forward-looking statements are based on certain assumptions and expectations of future events that are subject to a number of risks and uncertainties. For a description of factors that may cause actual results to differ materially from such forward-looking statements, see Item 1A, “Risk Factors” of this Annual Report on Form 10-K.
Actual future results and trends may differ materially from historical results or those projected in any such forward-looking statements depending on a variety of factors, including, but not limited to, the following:
• | the level of real estate transactions, the level of mortgage origination volumes (including refinancing) and changes to the insurance requirements of the participants in the secondary mortgage market, and the effect of these factors on the demand for title insurance; |
• | changes in general economic, business, and political conditions, including the performance of the financial and real estate markets; |
• | the possible inadequacy of provisions for claims to cover actual claim losses; |
• | the incidence of fraud-related losses; |
• | unanticipated adverse changes in securities markets, including interest rates, could result in material losses to the Company’s investments; |
• | significant competition that the Company’s operating subsidiaries face, including the Company’s ability to develop and offer products and services that meet changing industry standards in a timely and cost-effective manner and expansion into new geographic locations; |
• | the Company’s reliance upon the North Carolina and Texas markets for a significant portion of its premiums, comprising approximately 32.8% and 22.4% of premiums written, respectively; |
• | the Company’s receipt of a significant percentage of its net premiums written from a single title agent, which was recently acquired by another title insurer; |
• | compliance with government regulation, including pricing regulation, and significant changes to applicable regulations or in their application by regulators; |
• | the impact of governmental oversight of compliance by service providers, including insurance title insurance agents, with federal consumer financial laws; |
• | possible downgrades from a rating agency, which could result in a loss of underwriting business; |
• | the inability of the Company to manage, develop and implement technological advancements and prevent system interruptions or unauthorized system intrusions; |
• | statutory requirements applicable to the Company’s insurance subsidiaries that require them to maintain minimum levels of capital, surplus and reserves and that restrict the amount of dividends they may pay to the Company without prior regulatory approval; |
• | the desirability to maintain capital above statutory minimum requirements for competitive, marketing and other reasons; |
• | heightened regulatory scrutiny and investigations of the title insurance industry; |
• | the Company’s dependence on key management and marketing personnel, the loss of whom could have a material adverse effect on the Company’s business; |
• | reform of government-sponsored entities that could adversely impact the Company; |
• | policies and procedures for the mitigation of risks that may be insufficient to prevent losses; |
• | the shareholder rights plan could discourage transactions involving actual or potential changes of control; and |
• | other risks detailed elsewhere in this document and in the Company’s other filings with the SEC. |
These and other risks and uncertainties may be described from time to time in the Company’s other reports and filings with the SEC. The Company is not under any obligation (and expressly disclaims any such obligation) and does not undertake to update or alter any forward-looking statements to reflect circumstances or events that occur after the date the forward-looking statements are made. You should consider the possibility that actual results may differ materially from our forward-looking statements.
2
INVESTORS TITLE COMPANY AND SUBSIDIARIES
TABLE OF CONTENTS
3
PART I
ITEM 1. BUSINESS
GENERAL
Investors Title Company (the “Company”) is a holding company that operates through its subsidiaries and was incorporated in the state of North Carolina in 1973. The Company became operational in 1976, when it acquired Investors Title Insurance Company (“ITIC”), which had itself been operating since 1972, as a wholly owned subsidiary under a plan of exchange of shares of common stock. In 1983, the Company acquired National Investors Title Insurance Company (“NITIC”), formerly Northeast Investors Title Insurance Company, which had itself been operating since 1973, as a wholly owned subsidiary under a plan of exchange of shares of common stock. The Company’s executive offices are located at 121 North Columbia Street, Chapel Hill, North Carolina 27514 and its telephone number is (919) 968-2200. The Company maintains a website at www.invtitle.com.
OVERVIEW OF THE BUSINESS
The Company’s primary business activity, and its only reportable operating segment, is the issuance of residential and commercial title insurance through ITIC and NITIC. Additionally, the Company provides tax-deferred real property exchange services through its subsidiaries, Investors Title Exchange Corporation (“ITEC”) and Investors Title Accommodation Corporation (“ITAC”); investment management and trust services to individuals, trusts and other entities through its subsidiary Investors Trust Company (“Investors Trust”); and management services to title insurance agencies through its subsidiary, Investors Title Management Services (“ITMS”). See “Item 7. Management’s Discussion and Analysis of Financial Condition and Results of Operations” and Note 12 of Notes to Consolidated Financial Statements in this Annual Report on Form 10-K for additional information related to the revenues, income and assets attributable to the Company’s primary operating segment.
Title Insurance
Through its two wholly owned title underwriting subsidiaries, ITIC and NITIC, the Company underwrites title insurance for owners and mortgagees as a primary insurer. ITIC and NITIC offer primary title insurance coverage to owners and mortgagees of real estate and assume reinsurance of title insurance risks from other title insurance companies. The commitments and policies are predominantly issued using standard forms approved by the American Land Title Association (“ALTA”).
Title insurance protects against losses resulting from title defects affecting real property. Upon a real estate closing, the seller of real property executes a deed to the new owner, and typically, the property is encumbered with a new mortgage. When real property is conveyed from one party to another, occasionally there is an undisclosed defect in the title or a mistake or omission in a prior deed or mortgage that may give a third party a legal claim against such property or result in the invalidity or unenforceability of the insured mortgage. If a claim is made against the title to real property, title insurance provides indemnification against covered defects.
Numerous types of defects could jeopardize the property owner’s or mortgagee’s interest in the property for which a title policy may provide coverage. Such risks include title being vested in an individual or entity other than the insured, lack of a right of access to the property, invalidity or unenforceability of the insured mortgage, or other defects, liens, or encumbrances that make the property unmarketable. The policy may provide coverage for defects arising from prior unsatisfied mortgages, tax liens or confirmed assessments, judgments attaching to the property or encumbrances against the property arising through easements, restrictions or other existing covenants. Title insurance may also protect against deeds or mortgages that were forged or improperly acknowledged or delivered, that were executed by spouses without the other spouse’s signature or that were conveyed by minors or other persons who lack legal capacity.
Title Insurance Policies. The Company issues title insurance policies based on a search of public records. The title search documents the current status of title to the property. There are two basic types of title insurance policies - one for the mortgage lender and one for the real property owner. A lender often requires property owners to purchase title insurance to protect the priority of its mortgage loan, but the lender’s title insurance policy does not protect the property owner. The property owner has to purchase a separate owner’s title insurance policy to protect its investment.
Insured Risk on Policies in Force. Generally, the amount of the insured risk under a title insurance policy is equal to the purchase price, the loan amount or the fair market value of the insured property. If a claim is made against an insured property’s title, the insurer can choose to pay the cost of eliminating the covered title defects or to defend the insured party against covered title defects affecting the property. In the alternative, the insurer may opt to pay the policy limits to the insured or, if the loss is less than policy limits, the amount of the insured’s actual loss due to such title defects, at which time the insurer’s duty to defend the claim and all other obligations of the insurer with respect to the claim are satisfied.
4
At any given time, the insurer’s actual risk of monetary loss under outstanding policies is only a portion of the aggregate insured risk, or total face amount, of all policies in force. The lower risk results primarily from the reissuance of title insurance policies for the same property by other underwriters over time when such property is subsequently conveyed or refinanced. The coverage on a lender’s title insurance policy is reduced and eventually terminated as the mortgage loan it secures is paid. An owner’s policy is effective as long as the insured has an ownership interest in the property or has liability under warranties of title. Due to the variability of these factors, the aggregate contingent liability of a title underwriter on outstanding policies of the Company and its subsidiaries cannot be determined with precision.
Losses and Reserves. While most other forms of insurance provide for the assumption of risk of loss arising from unforeseen events, title insurance is based upon a process of loss avoidance. Title insurance generally serves to protect the policyholder from the risk of loss from events that predate the issuance of the policy. Losses on policies typically occur when a title defect is not discovered during the examination and settlement process or upon the occurrence of certain hidden risks which cannot be determined from an accurate search of public land records. The maximum amount of liability under a title insurance policy is generally the face amount of the policy plus the cost of defending the insured’s title against an adverse claim, if agreed to by the insurer prior to payment of loss under the policy, and any inflation protection clause associated with the policy. Reserves for claim losses are established from known claims, as well as estimated losses incurred but not yet reported to the Company based upon historical experience and other factors.
Title claims can often be complex, vary greatly in dollar amounts, are affected by economic and market conditions and may involve uncertainties as to ultimate exposure. Therefore, reserve estimates are subject to variability. For a more complete description of the Company’s reserves for claims, see “Item 7. Management’s Discussion and Analysis of Financial Condition and Results of Operations” in this Annual Report on Form 10-K.
Title Insurance Underwriting Operations. ITIC and NITIC issue title insurance through its home and branch offices and through a network of agents. Issuing agents are typically real estate attorneys, independent agents or subsidiaries of community and regional mortgage lending institutions, depending on local customs and regulations and the Company’s marketing strategy in a particular territory. The Company’s title insurance subsidiaries determine the terms and conditions upon which they will insure title to real property according to the Company’s underwriting standards, policies and procedures. Title insurance premiums written reflect a one-time premium payment, with no recurring premiums.
Generally, premiums for title insurance are recorded and recognized as revenue at the closing of the related transaction, when the earnings process is considered complete. When the policy is issued directly through a branch office, the premiums collected are retained by the Company. When the policy is issued through a title insurance agent, the agent retains a majority of the premium as a commission and remits the net amount to the Company. Title insurance commissions earned by the Company’s agents are recognized as expenses concurrently with premium recognition. The percentage of the premium retained by agents varies by region and is sometimes regulated by the states where the property is located.
For a description of the level of net premiums written by direct and agency operations, refer to “Item 7. Management’s Discussion and Analysis of Financial Condition and Results of Operations” in this Annual Report on Form 10-K.
Geographic Operations. ITIC was incorporated in North Carolina in 1972, and is licensed to write title insurance in 44 states and the District of Columbia. ITIC currently writes title insurance as a primary insurer in 21 states and the District of Columbia, primarily in the eastern half of the United States, and as a reinsurer for NITIC and third party title insurance companies.
NITIC was incorporated in South Carolina in 1973, and is licensed to write title insurance in 20 states and the District of Columbia. In November 2014, NITIC redomesticated to the Texas. It currently writes title insurance as a primary insurer in Texas and New York, and as a reinsurer for ITIC.
Premiums from title insurance written on properties located in North Carolina and Texas represent the largest source of revenue for the title insurance segment. In North Carolina, ITIC primarily issues title insurance commitments and policies through branch offices. In Texas and other states, title policies are primarily issued through issuing agents. For a description of the level of net premiums written geographically for significant states, refer to “Item 7. Management’s Discussion and Analysis of Financial Condition and Results of Operations” in this Annual Report on Form 10-K.
Each state license authorizing ITIC or NITIC to write title insurance must be renewed annually. These licenses are necessary for the companies to operate as a title insurer in each state in which they write premiums.
Ratings. The Company’s title insurance subsidiaries are regularly assigned ratings by independent agencies designed to indicate their financial condition and/or their claims paying ability. The rating agencies determine ratings primarily by analyzing financial data.
5
Reinsurance. The Company assumes and cedes reinsurance with other insurance companies in the normal course of business. Reinsurance is a contractual arrangement whereby one insurer assumes some or all of the risk exposure written by another insurer. Ceded reinsurance is comprised of excess of loss treaties, which outlines the conditions in which the reinsurance company will pay claims and protect the ceding insurer against losses over certain agreed amounts.
In the ordinary course of business, ITIC and NITIC reinsure certain risks with other title insurers to limit their risk exposure and to comply with state insurance regulations. They also assume reinsurance for certain risks of other title insurers for which they receive additional income in the form of reinsurance premiums. For each of the last three years, revenues from reinsurance activities accounted for less than 1% of total premium volume.
Exchange Services, Investment Management and Trust Services, and Management Services
The Company’s other lines of business include services offered by wholly owned subsidiaries ITEC, ITAC, Investors Trust, and ITMS.
In 1988, the Company established ITEC to provide services in connection with tax-deferred exchanges of like-kind property pursuant to Section 1031 of the Internal Revenue Code. ITEC acts as a qualified intermediary in tax-deferred exchanges of property held for productive use in a trade or business or for investments, and its income is derived from fees for handling exchange transactions and interest earned on client deposits held by the Company. ITAC provides services as an exchange accommodation titleholder for accomplishing reverse exchanges when taxpayers decide to acquire replacement property before selling the relinquished property. The services provided by the Company’s exchange division, ITEC and ITAC, are pursuant to provisions in the Internal Revenue Code. From time to time, these laws are subject to review and changes, which may negatively affect the demand for tax-deferred exchanges in general, and consequently the revenues and profitability of the Company’s exchange division.
Investors Trust provides investment management and trust services to individuals, companies, banks and trusts.
ITMS offers various consulting and management services to provide clients with the technical expertise to start and successfully operate a title insurance agency.
None of these subsidiaries is currently a reportable segment for which separate financial information is presented; instead, they are collectively included and reported in the category “All Other” in the Company’s financial statements.
CYCLICALITY AND SEASONALITY
Real estate activity, home sales and mortgage lending are cyclical in nature. Title insurance premiums are closely related to the level of real estate activity and the average price of real estate sales. The availability of funds to finance purchases directly affects real estate sales. Other factors include mortgage interest rates, consumer confidence, economic conditions, supply and demand and family income levels. The Company’s premiums in future periods are likely to fluctuate due to these and other factors which are beyond management’s control.
Historically, the title insurance business tends to be seasonal as well as cyclical. Because home sales are typically strongest in periods of favorable weather, the first calendar quarter tends to have the lowest activity levels, while the spring and summer quarters tend to be more active. Refinance activity is generally less seasonal, but is subject to interest rate fluctuations.
MARKETING
The Company markets its title insurance services to a broad range of customers in the residential and commercial market sectors of the real estate industry. Issuing agents are typically real estate attorneys, independent agents or subsidiaries of community and regional mortgage lending institutions, depending on local customs and regulations and the Company’s marketing strategy in a particular territory.
ITIC and NITIC strive to provide superior service to their customers and consider this an important factor in attracting and retaining customers. Branch and corporate personnel strive to develop new business and agency relationships to increase market share while ITIC’s Commercial Services Division focuses on services provided to commercial clients.
6
REGULATION
Title Insurance
The Company is an insurance holding company and therefore it is subject to regulation in the states in which its insurance subsidiaries do business. These regulations, among others, require insurance holding companies to register and file certain reports, and require prior regulatory approval of the payment of extraordinary dividends and other intercompany distributions or transfers.
Title insurance companies are extensively regulated under applicable state laws. All states have requirements for admission to do business as an insurance company, including minimum levels of capital, surplus and reserves. State regulatory authorities monitor the stability and service of insurance companies and possess broad powers with respect to the licensing of title insurers and agents, approving rate schedules and policy forms, financial reporting and accounting practices, reserve requirements, investments and dividend restrictions, approving related party transactions, as well as examining and auditing title insurers. At December 31, 2015, both ITIC and NITIC met the statutory premium reserve requirements and the minimum capital and surplus requirements of the states where they are licensed. A substantial portion of the assets of the Company’s title insurance subsidiaries consists of their portfolios of investment securities. Both of these subsidiaries are required by various state laws to maintain assets of a defined minimum quality and amount.
The Company’s insurance subsidiaries are subject to examination at any time by the insurance regulators in the states where they are licensed as well as required examinations every five years. These and other governmental authorities have the power to enforce state and federal laws to which the title insurance subsidiaries are subject. These governmental authorities include, but are not limited to, the Consumer Financial Protection Bureau (“CFPB”), which enforces the Real Estate Settlement Procedures Act (“RESPA”), the primary federal regulatory guidance covering the real estate settlement industry. The CFPB has the authority to identify and address, through regulation, unfair, deceptive and abusive practices in the mortgage industry and certain other settlement service industries.
On November 20, 2013, the CFPB released a final rule to integrate mortgage disclosures under the RESPA and the Truth in Lending Act (“TILA”). The final rule went into effect on October 3, 2015. Under this rule, the early disclosure forms required by TILA and the good faith estimate required by RESPA have been combined into one form, titled the Loan Estimate. The final disclosure required by TILA and the HUD-1 settlement statement required by RESPA have been combined into one form, titled the Closing Disclosure. The Company actively prepared for any anticipated effect this rule would have on both its direct and agency operations, with respect to its processes and procedures, systems and compliance costs. The measures adopted by the Company to comply with the final rule did not have a material impact on the Company's financial position and results of operations.
The CFPB, Office of the Comptroller of Currency and the Federal Reserve have issued memorandums to banks that communicated those agencies’ heightened focus on vetting third party providers. Such increased regulatory involvement may affect the Company's agents and approved providers. Further proposals to change regulations governing insurance holding companies and the title insurance industry are often introduced in Congress, in state legislatures and before various insurance regulatory agencies. Although the Company regularly monitors such proposals, the likelihood and timing of passage of any such regulation, and the possible effects of any such regulation on the Company and its subsidiaries, cannot be determined at this time.
Any material change in the Company’s regulatory environment may have an adverse effect on its business.
Exchange Services, Investment Management and Trust Services, and Management Services
Investors Trust is regulated by the North Carolina Commissioner of Banks.
COMPETITION
The title insurance industry is highly competitive. The four largest title insurance companies typically maintain greater than eighty-five percent of the market for title insurance in the United States, with smaller regional companies holding the balance of the market. The number and size of competing companies varies in the respective geographic areas in which the Company conducts business. Key competitive factors in the title insurance industry are the financial strength and size of the insurer, timeliness and quality of service, price and expertise in certain transactions. Title insurance underwriters also compete for agents based upon service and commission levels. Some title insurers currently have greater financial resources, larger distribution networks and more extensive computerized databases of property records and related information than the Company. In addition, there are numerous industry-related regulations and statutes that set out conditions and requirements to conduct business. Changes to or the removal of such regulations and statutes could result in additional competition from alternative title insurance products or new entrants into the industry that could materially affect the Company’s business operations and financial condition.
7
CUSTOMER, LENDER AND AGENT CONCENTRATION
The Company is not dependent upon any single title insurance customer or a few customers, and the loss of any single customer would not have a material adverse effect on the Company.
Based on information from the Mortgage Daily Second Quarter 2015 Mortgage Origination Survey, there are ten lending institutions in the United States that account for approximately 49% of all mortgage originations in the country. These lending institutions benefit from title insurance policies that are purchased by borrowers on the lending institutions’ behalf as a condition to the making of a loan. Refusal by major market lenders to accept our product offerings could have a material adverse effect on the Company.
In 2015, 2014 and 2013, the Company had one agent that accounted for 10.3%, 23.6% and 16.4% of net premiums written, respectively.
INVESTMENT POLICIES
The Company and its subsidiaries derive a substantial portion of their income from investments in municipal government securities and investment grade corporate bonds and equity securities. The Company’s debt and equity securities are classified as available for sale and carried at fair market value. The Company’s investment policy is designed to maintain a high quality portfolio and maximize income. Some state laws impose restrictions upon the types and amounts of investments that can be made by the Company’s insurance subsidiaries. The Company’s investment portfolio is managed internally and via an affiliated entity. The securities in the Company’s portfolio are subject to economic conditions and normal market risks. Equity securities at December 31, 2015 and 2014 consisted of investments in various industry groups. There were not any significant investments in banks, trust or insurance companies at December 31, 2015 or 2014. Short-term investments, which consist primarily of money market instruments and certificates of deposit which have an original maturity of one year or less, are carried at cost, which approximates fair value due to the short duration to maturity. In addition, at December 31, 2015 and 2014, the Company held investments that are accounted for using the equity method (see Note 1 of the Notes to the Consolidated Financial Statements in this Annual Report on Form 10-K.)
See Note 3 of the Notes to the Consolidated Financial Statements in this Annual Report on Form 10-K for the major categories of investments, scheduled maturities, fair values of investment securities and earnings by category.
ENVIRONMENTAL MATTERS
The title insurance policies ITIC and NITIC currently issue exclude any liability for environmental risks and contamination unless a notice of violation relating to an environmental protection law, ordinance or regulation is recorded prior to the date of such policy or the Company issues a specific policy endorsement providing coverage for environmental liens recorded prior to the date of such policy. The Company has not experienced and does not anticipate that it or its subsidiaries will incur any significant expenses related to environmental claims.
In connection with tax-deferred exchanges of like-kind property, ITAC may temporarily hold title to property pursuant to an accommodation titleholder agreement. In order for ITAC to enter into such arrangements, each person or entity for which title is being held must first (i) execute an indemnification agreement under which it agrees to indemnify ITAC for any environmental or other claims which may arise as a result of the arrangement, and (ii) provide due diligence materials regarding any known environmental issues, in the form of an environmental questionnaire and/or applicable environmental engineering studies, if indicated for review by ITAC, as applicable.
EMPLOYEES
The Company and its subsidiaries had 237 full-time employees and 28 part-time employees as of December 31, 2015. None of the employees are covered by any collective bargaining agreements. Management considers its relationship with its employees to be favorable.
8
ADDITIONAL INFORMATION
The Company’s internet address is www.invtitle.com. The contents of the Company’s website are not and shall not be deemed a part of this document or any other Securities and Exchange Commission (“SEC”) filing. The Company makes available free of charge through its internet website its annual reports on Form 10-K, its quarterly reports on Form 10-Q, its current reports on Form 8-K, and all amendments to those reports filed or furnished pursuant to Section 13(a) or 15(d) of the Securities Exchange Act of 1934 as soon as reasonably practicable after such materials are electronically filed with, or furnished to, the SEC, and also makes available the Section 16 reports on Forms 3, 4 and 5 of its insiders no later than the end of the business day following such filings. The information is free of charge and may be reviewed and downloaded from the website at any time. The public may read any material it has filed with the SEC at the SEC’s Public Reference Room at 100 F Street, N.E., Washington, D.C. 20549. The “Investor Relations” section of the Company’s website also includes its code of business conduct and ethics and the charters of the Audit, Compensation and Nominating Committees of its Board of Directors.
EXECUTIVE OFFICERS OF THE COMPANY
Following is information regarding the executive officers of the Company as of February 26, 2016. Each officer is appointed at the annual meeting of the Board of Directors to serve until the next annual meeting of the Board or until his or her respective successor has been elected and qualified.
Name | Age | Position with Registrant | ||
J. Allen Fine | 81 | Chief Executive Officer and Chairman of the Board | ||
James A. Fine, Jr. | 53 | President, Treasurer, Chief Financial Officer, Chief Accounting Officer and Director | ||
W. Morris Fine | 49 | Executive Vice President, Secretary and Director | ||
J. Allen Fine has been Chief Executive Officer and Chairman of the Board of the Company since its incorporation in 1973. He also served as President of the Company until May 1997. He is the father of James A. Fine, Jr. and W. Morris Fine.
James A. Fine, Jr. was named Vice President of the Company in 1987. In 1997, he was named President and Treasurer and appointed as a Director of the Company. In 2002, he was appointed as Chief Financial Officer and Chief Accounting Officer. He is the son of J. Allen Fine and the brother of W. Morris Fine.
W. Morris Fine was named Vice President of the Company in 1992. In 1993, he was named Treasurer of the Company and served in that capacity until 1997. In 1997, he was named Executive Vice President and Secretary of the Company. In 1999, he was appointed as a Director of the Company. He is the son of J. Allen Fine and the brother of James A. Fine, Jr.
ITEM 1A. RISK FACTORS
The risk factors listed in this section and other factors noted herein could cause actual results to differ materially from those contained in any forward-looking statements or could result in a significant or material adverse effect on the Company’s results of operations.
Adverse changes in real estate activity may negatively impact the Company’s results of operations and financial condition.
The demand for the Company’s title insurance and other real estate transaction products and services varies from year to year and is dependent upon, among other factors, the volume of residential and commercial real estate transactions and mortgage financing transactions. The volume of these transactions has historically been influenced by factors such as the state of the overall economy, the average price level of real estate sales and the availability and pricing of mortgage financing. During periods of economic uncertainty, or when the availability of mortgage credit is limited or when mortgage interest rates are increasing, real estate activity typically declines. The cyclical nature of the Company’s business has caused volatility in revenue and profitability in the past and could do so in the future.
Demand for title insurance also depends in part upon the requirement by mortgage lenders and other participants in the secondary mortgage market that title insurance policies be obtained on residential and commercial real property.
9
The Company may experience material losses resulting from fraud, defalcation or misconduct.
Fraud, defalcation and other misconduct by the Company’s agents, approved attorneys and employees are risks inherent in the Company’s business. Agents and approved attorneys typically handle large sums of money in trusts pursuant to the closing of real estate transactions. Misappropriation of funds by any of these parties could result in title claims, some of which could have a material negative impact on the Company’s results of operations and financial condition.
In recent years, the Company received a significant portion of its premiums from one agent. This agent was recently acquired by another title insurer. Significant declines in the agent’s business would have a negative impact on premiums written.
The Company has one agent that accounted for 10.3%, 23.6% and 16.4% of net premiums written for the years ended December 31, 2015, 2014 and 2013, respectively. On July 1, 2015, a competing title insurer acquired the assets of the agency. The agent is under no legal commitment to remit a minimum amount of premiums to the Company, and could cease doing so at any time. A continued significant decline in business originated by this agent for the Company, whether due to that business being diverted to its new title insurer owner or otherwise, could have a material negative impact on the Company’s premiums written.
The Company relies upon the North Carolina and Texas markets for a significant portion of its premiums. Changes in the economic or regulatory environments in North Carolina or Texas could have an adverse impact on the Company.
North Carolina and Texas are the largest sources of premium revenue for the Company’s title insurance subsidiaries. In 2015, North Carolina and Texas represented 32.8% and 22.4% of total premiums written by the Company, respectively. A decrease in the level of real estate activity in either North Carolina and/or Texas, whether driven by weak economic conditions, changes in regulatory environments or other factors that influence demand, could have a negative impact on the Company’s financial results.
Adverse deviation from expected claims experience will result in lower net earnings.
The Company’s net income is affected by the extent to which its actual claims experience differs from the assumptions used in establishing reserves for claims. Reserves for claims are established based on actuarial estimates of future payments for reported claims, as well as claims which have been incurred but not yet reported. In addition, management considers factors such as the Company’s historical claims experience, case reserve estimates on reported claims, large claims and other relevant factors in determining loss provision rates and the aggregate recorded expected liability for claims.
Due to the nature of the underlying risks and the high degree of uncertainty associated with the estimation of reserves for claims, the Company cannot determine precisely the amounts which it will ultimately pay to settle its claims. Factors contributing to the complexity in establishing reserves can include varying loss potentials, timing, unfavorable market or economic conditions and the legal environment. The timing of claims is difficult to estimate as payments may not occur until well into the future. Higher levels of defaults and foreclosures upon insured properties are more prevalent in times of unfavorable economic conditions and can lead to an increase in title insurance claims. The Company may also incur higher than normal claim payment experience or large losses. To the extent that actual claims experience is greater than estimated, the Company could be required to increase reserves.
The Company’s insurance subsidiaries are subject to complex government regulations. Changes in regulations may have an adverse effect on the Company’s results of operations.
The Company’s title insurance subsidiaries are subject to extensive regulations that are intended to protect policyholders and consumers.
The Company’s title insurance subsidiaries are subject to regulations by the CFPB, created by the Dodd-Frank Act. The CFPB has extensive regulatory and enforcement authority over real estate and mortgage markets, including RESPA, the primary federal regulatory guidance covering the real estate settlement industry. The manner and extent to which the CFPB will implement new regulations is not fully known; however, any new regulations implemented could result in changes to internal processes through changes to systems and forms. Additionally, the CFPB has issued extensive regulations for the integration of mortgage disclosures which became effective on October 3, 2015. These new regulations impacted the way in which mortgage market participants create, process and deliver disclosures to consumers; however, implementation did not have a material impact on the Company’s financial position or results of operations.
10
In addition to federal regulation, title insurance subsidiaries are subject to state regulations. The nature and extent of state regulations, which vary from state to state, typically involve, among other matters, licensing and renewal requirements and trade and marketing practices, including, but not limited to the following:
• | licensing of insurers and agents; |
• | capital and surplus requirements; |
• | approval, regulation or establishment of premium rates for insurance; |
• | limitations on types and amounts of investments; |
• | limitations on the size of risks that may be insured by a single company; |
• | filing of annual and other reports with respect to financial condition; |
• | the amount of dividends and other payments made by insurance subsidiaries; |
• | establishing reserves; |
• | accounting and financing practices; |
• | deposits of securities for the benefit of policyholders; |
• | trade and marketing practices; |
• | regulation of reinsurance; |
• | approval of policy forms; and |
• | use of personal information. |
Insurance holding companies are subject to periodic examinations and the regulation of acquisitions, intercompany transactions and changes in control, among others, by state regulators.
The Company and its subsidiaries are also subject to certain federal regulations established by the Office of the Comptroller of Currency, the Federal Reserve and various other governmental agencies.
The Company’s other businesses also operate within state and federal guidelines. Any changes in the regulatory environment could restrict its existing or future operations and could possibly make it more burdensome and costly to conduct them.
New regulations, or differing interpretations of existing laws, could change business processes, products and services and have a negative impact on the Company’s results of operations and financial condition.
Competition affects the Company’s results of operations.
The title insurance industry is highly competitive. Key competitive factors are quality of service, price within regulatory parameters, expertise, timeliness and the financial strength and size of the insurer. Title insurance underwriters compete for premiums by choosing various distribution channels which may include company-owned operations, independent agents and agency relationships with real estate attorneys, subsidiaries of community and regional lending institutions, realtors, builders and other settlement service providers. Title insurance underwriters compete for agents on the basis of service, technology and commission levels. Some title insurers currently have greater financial resources, larger distribution networks and more extensive computerized databases of property records and information than the Company. The number and size of competing companies varies in the different geographic areas in which the Company operates, and any reductions to current regulatory barriers within any of the different geographic areas could increase the number of competitors entering into the title insurance market. Competition among the major providers of title insurance or the acceptance of alternative products to traditional title products by the regulatory authorities and the marketplace could adversely affect the Company’s operations and financial condition.
Deterioration in financial markets may cause a decline in the performance of the Company’s investments and could have a material adverse impact on net income.
The Company derives a substantial portion of its income from its investment portfolio. The Company’s investment policy is designed to comply with regulatory requirements and to balance the competing objectives of asset quality and investment returns. The Company’s investment portfolio is subject to risk from changes in general economic conditions, interest rates, credit markets, and other external factors. The risk of loss is increased during periods of economic uncertainty and tight credit markets as these factors could limit the ability of some issuers to repay their debt obligations. If the carrying value of the Company’s investments exceeds the fair value, and the decline in fair value is deemed to be other-than-temporary, the Company will be required to write down the value of its investments, which could have a material negative impact on the Company’s results of operations and financial condition.
11
A downgrade from a rating agency could result in a loss of underwriting business.
The competitive positions of title insurance companies rely partly on ratings published by independent rating services. Government sponsored entities and lending institutions utilize these ratings, among other items, to evaluate a title insurer’s strength and stability. The Company’s title insurance subsidiaries are currently rated by A.M. Best Company, Kroll Bond Agency and Demotech, Inc. The ratings issued by independent rating agencies are not credit ratings, but represent the opinion of the individual rating agency in regards to the title insurance subsidiaries’ financial strength, operating performance, and ability to meet policyholder obligations. These insurer ratings are subject to periodic review and there can be no assurance that the Company’s insurance subsidiaries will maintain their current respective ratings. A significant downgrade in the ratings of either of the Company’s insurance subsidiaries could negatively impact the ability to compete for new business, retain existing business and maintain the necessary licenses to operate as title insurance companies in various states.
Title insurance rate regulation could have an adverse impact on the Company’s results of operations.
Rates for title insurance vary by state and are subject to extensive regulation. Statutes generally provide that rates must not be excessive, inadequate or unfairly discriminatory. The process of implementing a rate change in most states involves pre-approval by the applicable state insurance regulator. This regulation could impact the Company’s ability to adjust prices in the face of rapidly changing market conditions, which could adversely affect results of operations.
Financial institution failures could adversely affect the Company.
The Company has substantial deposits with financial institutions, including fiduciary deposits that are owned by third parties. There is no guarantee the Company, whether through the Federal Deposit Insurance Corporation or otherwise, would recover the funds it has deposited should one or more of the financial institutions at which the Company maintains deposits fail.
The Company may encounter difficulties managing system or technological changes, which could adversely affect its financial and operating results.
Technological changes in the title insurance industry are driven primarily by evolution in technology, competitive factors, and regulatory changes. These changes have resulted in faster information delivery and efficient, highly automated production processes. The inability of the Company to manage, develop or successfully implement new systems or technological changes could negatively impact profitability.
Unauthorized access to the Company’s systems, or other system interruptions, and unauthorized data disclosures may harm the Company’s reputation, disrupt the Company’s operations, or result in monetary losses.
The Company utilizes electronic systems to deliver products and services. These electronic systems are used to, among other things, receive, process, store, and transmit data. Non-public information may include, among other things, names, addresses, social security numbers, and banking information. In addition, the Company utilizes electronic systems to receive and transfer money. While the Company takes normal precautions to minimize the risk of unauthorized access to and disclosure of non-public information, this risk cannot be entirely eliminated. Events beyond control of the Company, including unauthorized system intrusions, fraud, telecommunication failures or natural disasters could disrupt operations both internally and externally, increase the possibility of unauthorized release of proprietary and/or non-public information and increase the possibility of defalcation of corporate or client funds. Additionally, certain laws and contracts to which the Company or its subsidiaries are subject to require notification to various parties, consumers and customers in the event that confidential or personal information may have been or was accessed by unauthorized third parties. Such notifications could result in, among other things, the loss of customers, negative publicity, distraction of management, fines, regulatory inquiries or involvement and a decline in sales. To counter these risks, the Company invests significant resources in maintaining the security of our network and adapting to evolving security threats. In addition, the Company further mitigates the financial risk associated with unauthorized disclosure of non-public information by maintaining cyber liability insurance coverage.
12
The Company relies on distributions from its insurance subsidiaries.
The Company is an insurance holding company and it has no substantial operations of its own. Its principal assets are investments in its operating subsidiaries, primarily its insurance subsidiaries. The Company’s ability to pay dividends and meet its obligations is dependent, among other factors, on the ability of its subsidiaries to pay dividends or repay intercompany loans. The Company’s insurance subsidiaries are subject to regulations that limit the amount of dividends, loans or advances they may make to the Company. The restriction on these amounts is based on the amount of the insurance subsidiaries’ unassigned surplus and net income, with certain adjustments. Additionally, these subsidiaries are required to maintain minimum amounts of capital, surplus and reserves. As of December 31, 2015, approximately $89,489,000 of consolidated stockholders’ equity represented the net assets of the Company’s subsidiaries that cannot be transferred in the form of dividends, loans or advances to the Company. In general, dividends in excess of prescribed limits are deemed “extraordinary” and require prior approval by the appropriate regulatory body. These dividend restrictions could limit the Company’s ability to pay dividends to its shareholders or fund growth opportunities.
Regulatory investigations of the title insurance industry by governmental entities could adversely impact the Company’s results of operations.
The title insurance industry is subject to increased scrutiny by both federal and state regulators focusing on violations of state insurance codes, RESPA and similar state and federal laws, among others. The Company’s insurance subsidiaries routinely receive inquiries from regulators involving market conduct. Future inquiries could lead to fines for violations, settlements with regulating authorities that could result in fines or requirements to pay claims and the potential for further regulation, all of which could adversely affect our results of operations and financial condition.
The Company depends on its ability to attract and retain key personnel and agents, and its inability to do so could adversely affect its business.
Competition for skilled and experienced personnel in the Company’s industry is high, and the success of the Company is substantially dependent on its ability to attract and retain such personnel. The Company may have difficulty hiring and retaining the necessary marketing and management personnel to support future growth plans. Also, the Company’s results of operations and financial condition could be adversely affected if it is unsuccessful in attracting and retaining new agents.
Policies and procedures for the mitigation of risk may not be sufficient.
The Company has policies and procedures in place to help identify, analyze, and measure the risks associated with the issuance of title insurance policies, investment risks, interest rate risks and legal risks, among others. Because a significant degree of judgment is involved with the establishment of policies and processes as well as the measurement of risks, it is possible not all risks have been identified or anticipated. Misidentified or unanticipated risks could adversely impact the Company and its results of operations.
The Company may encounter difficulties managing growth, which could adversely affect its results.
The Company’s future growth plans involve expansion into new geographic locations and further penetration in established markets. Expansion into new markets may subject the Company to associated risks, such as the diversion of management’s attention and other risks related to establishing operations in new territories.
The Company could be adversely affected by the possible reform of government-sponsored enterprises.
The federal government is currently in discussions regarding reform of the Federal National Mortgage Association (“Fannie Mae”) and the Federal Home Loan Mortgage Corporation (“Freddie Mac”). Fannie Mae and Freddie Mac often require the purchase of title insurance for home loans they securitize. Changes to these entities could impact the entire mortgage loan process and as a result, could impact the demand for title insurance. The timing and results of reform are currently unknown; however, changes to these entities could adversely impact the Company and its results of operations.
Certain provisions of the Company’s shareholder rights plan may deter or discourage a takeover of the Company.
The Company has adopted a shareholders rights plan. The rights set forth in the plan are not intended to prevent a takeover of the Company, and we believe the rights would be beneficial to the Company and its shareholders in the event of negotiations with a potential acquirer. However, the shareholder rights plan could discourage transactions involving actual or potential changes of control, including transactions that may involve payment of a premium over prevailing market prices to the Company’s common shareholders.
13
ITEM 1B. UNRESOLVED STAFF COMMENTS
None
ITEM 2. PROPERTIES
The Company owns two adjacent office buildings and property located on the corner of North Columbia and West Rosemary streets in Chapel Hill, North Carolina, which serve as the Company’s corporate headquarters. The main building contains approximately 23,000 square feet and has on-site parking facilities. The Company’s subsidiaries, principally ITIC and NITIC, lease office space in 33 locations throughout North Carolina, South Carolina, Texas and Nebraska. The Company believes that each of the office facilities occupied by the Company and its subsidiaries are in good condition, adequately insured and sufficient for its present operations.
ITEM 3. LEGAL PROCEEDINGS
The Company and its subsidiaries are involved in legal proceedings that are incidental to their business. In the Company’s opinion, based on the present status of these proceedings, any potential liability of the Company or its subsidiaries with respect to these legal proceedings, will not, in the aggregate, be material to the Company’s consolidated financial condition or operations.
ITEM 4. MINE SAFETY DISCLOSURES
Not Applicable
14
PART II
ITEM 5. MARKET FOR REGISTRANT’S COMMON EQUITY, RELATED STOCKHOLDER MATTERS AND ISSUER PURCHASES OF EQUITY SECURITIES
Common Stock Data and Dividends
The Common Stock of the Company is traded under the symbol “ITIC” on the NASDAQ Stock Market LLC. The number of record holders of common stock at December 31, 2015 was 309. The number of record holders is based upon the actual number of holders registered on the books of the Company at such date and does not include holders of shares in “street name” or persons, partnerships, associations, corporations or other entities identified in security position listings maintained by securities depositories. The following table shows, for the periods indicated, the high and low sales prices of the Company’s Common Stock as reported on the NASDAQ Global Market, and cash dividends declared.
2015 | 2014 | ||||||||||||||||||||||
High | Low | Dividend Paid | High | Low | Dividend Paid | ||||||||||||||||||
First Quarter | $ | 81.75 | $ | 66.55 | $ | 0.08 | $ | 82.22 | $ | 73.18 | $ | 0.08 | |||||||||||
Second Quarter | $ | 77.75 | $ | 69.51 | $ | 0.08 | $ | 76.24 | $ | 62.53 | $ | 0.08 | |||||||||||
Third Quarter | $ | 72.50 | $ | 67.25 | $ | 0.08 | $ | 82.08 | $ | 66.61 | $ | 0.08 | |||||||||||
Fourth Quarter | $ | 102.41 | $ | 71.00 | $ | 0.16 | $ | 80.00 | $ | 64.41 | $ | 0.08 | |||||||||||
The Company’s current dividend policy anticipates the payment of quarterly dividends in the future. The declaration and payment of dividends will be at the discretion of the Board of Directors and will be dependent upon the Company’s future earnings, financial condition and capital requirements. The Company’s ability to pay dividends is also subject to certain regulatory restrictions on the payment of dividends by its insurance subsidiaries as described in the “Liquidity and Capital Resources” section of “Item 7. Management’s Discussion and Analysis of Financial Condition and Results of Operations,” and Note 2 to the Consolidated Financial Statements included in Item 8 of this Form 10-K.
The following table provides information about purchases by the Company (and all affiliated purchasers) during the quarter ended December 31, 2015 of equity securities that are registered by the Company pursuant to Section 12 of the Exchange Act:
Issuer Purchases of Equity Securities
Period | Total Number of Shares Purchased | Average Price Paid per Share | Total Number of Shares Purchased as Part of Publicly Announced Plan | Additional Shares Approved For Repurchase Under the Plan | Maximum Number of Shares that May Yet Be Purchased Under the Plan | ||||||||||
Beginning of period | 336,866 | ||||||||||||||
October 2015 | 201 | $ | 72.66 | 201 | — | 336,665 | |||||||||
November 2015 | — | — | — | 163,335 | 500,000 | ||||||||||
December 2015 | 3,420 | 88.45 | 3,420 | — | 496,580 | ||||||||||
Total | 3,621 | $ | 87.58 | 3,621 | 163,335 | 496,580 | |||||||||
For the quarter ended December 31, 2015, the Company purchased an aggregate of 3,621 shares of the Company’s common stock pursuant to the Company’s ongoing purchase program that was initially announced on June 5, 2000. On November 9, 2015, the Board of Directors of the Company approved the purchase of an additional 163,335 shares pursuant to the Company’s repurchase plan, such that there was authority remaining under the plan to purchase up to an aggregate of 500,000 shares of the Company’s common stock pursuant to the plan immediately after this approval. Unless terminated earlier by resolution of the Board of Directors, the plan will expire when all shares authorized for purchase under the plan (as such number may be amended by the Board from time to time) have been purchased. The Company anticipates making further purchases under this plan from time to time in the future, depending on such factors as the prevailing market price of the Company’s common stock, the Company’s available cash and then existing alternative uses for such cash.
15
Common Stock Performance Graph
Presented below is a line graph comparing the yearly percentage change in the cumulative total return on the Company’s common stock to the cumulative return of the NASDAQ Composite Index and a peer group consisting of certain companies in the title insurance industry (SIC Code 6361) for the period commencing December 31, 2010 and ending December 31, 2015. The graph assumes that $100 was invested in the Company’s common stock, the NASDAQ Composite Index and the peer group on December 31, 2010 and that all dividends were reinvested on a quarterly basis. Returns for the companies included in the peer group have been weighted on the basis of the total market capitalization for each company.
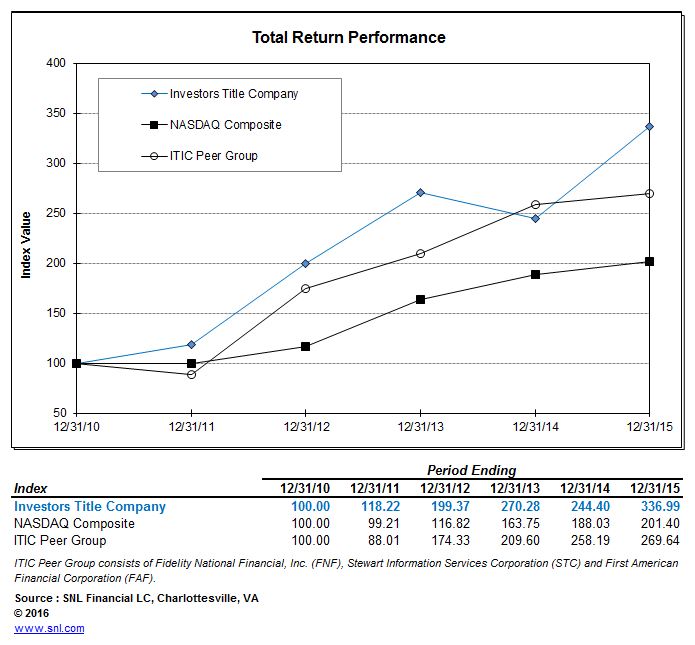
The performance graph above and the related information shall not be deemed “soliciting material” or to be “filed” with the SEC, nor shall such information be incorporated by reference into any future filing under the Securities Act of 1933, as amended, or the Exchange Act, as amended, except to the extent that the Company specifically incorporates it by reference into such filing.
16
ITEM 6. SELECTED FINANCIAL DATA
(amounts in thousands except per share data)
For the Year | 2015 | 2014 | 2013 | 2012 | 2011 | ||||||||||||||
Net premiums written | $ | 112,476 | $ | 109,964 | $ | 113,886 | $ | 102,331 | $ | 81,529 | |||||||||
Revenues | 127,200 | 123,119 | 126,251 | 115,079 | 90,685 | ||||||||||||||
Investment income | 4,531 | 4,260 | 3,895 | 3,980 | 3,595 | ||||||||||||||
Net income attributable to the Company | 12,534 | 9,649 | 14,708 | 11,102 | 6,934 | ||||||||||||||
Per Share Data | |||||||||||||||||||
Basic earnings per common share | $ | 6.32 | $ | 4.75 | $ | 7.15 | $ | 5.33 | $ | 3.22 | |||||||||
Weighted average shares outstanding – Basic | 1,984 | 2,032 | 2,056 | 2,082 | 2,151 | ||||||||||||||
Diluted earnings per common share | $ | 6.30 | $ | 4.74 | $ | 7.08 | $ | 5.24 | $ | 3.20 | |||||||||
Weighted average shares outstanding – Diluted | 1,990 | 2,038 | 2,077 | 2,117 | 2,170 | ||||||||||||||
Cash dividends per share | $ | 0.40 | $ | 0.32 | $ | 0.32 | $ | 0.29 | $ | 0.28 | |||||||||
At Year-End | |||||||||||||||||||
Assets | $ | 211,522 | $ | 198,039 | $ | 188,306 | $ | 171,918 | $ | 157,958 | |||||||||
Investments | 160,552 | 159,411 | 142,764 | 130,779 | 125,701 | ||||||||||||||
Stockholders’ equity attributable to the Company | 142,670 | 137,564 | 128,062 | 114,639 | 106,512 | ||||||||||||||
Book value/share attributable to the Company | 73.17 | 67.99 | 62.86 | 56.10 | 50.54 | ||||||||||||||
Performance Ratios | |||||||||||||||||||
Net income attributable to the Company to: | |||||||||||||||||||
Average stockholders’ equity attributable to the Company | 8.95 | % | 7.27 | % | 12.12 | % | 10.04 | % | 6.59 | % | |||||||||
Total revenues | 9.85 | % | 7.84 | % | 11.65 | % | 9.65 | % | 7.65 | % | |||||||||
17
ITEM 7. MANAGEMENT’S DISCUSSION AND ANALYSIS OF FINANCIAL CONDITION AND RESULTS OF OPERATIONS
The following discussion should be read in conjunction with the Consolidated Financial Statements and the related notes in this report. Forward-looking statements are based on certain assumptions and expectations of future events that are subject to a number of risks and uncertainties. Actual results may vary.
Overview
Investors Title Company (the “Company”) is a holding company that engages primarily in issuing title insurance through two subsidiaries, Investors Title Insurance Company (“ITIC”) and National Investors Title Insurance Company (“NITIC”). Total revenues from the title segment accounted for 95.3% of the Company’s revenues in 2015. Through ITIC and NITIC, the Company underwrites land title insurance for owners and mortgagees as a primary insurer. Title insurance protects against loss or damage resulting from title defects that affect real property.
There are two basic types of title insurance policies - one for the mortgage lender and one for the real estate owner. A lender often requires the property owner to purchase a lender’s title insurance policy to protect its position as a holder of a mortgage loan, but the lender’s title insurance policy does not protect the property owner. The property owner has to purchase a separate owner’s title insurance policy to protect its investment. When real property is conveyed from one party to another, occasionally there is an undisclosed defect in the title or a mistake or omission in a prior deed, will or mortgage that may give a third party a legal claim against such property. If a covered claim is made against real property, title insurance provides indemnification against insured defects.
The Company issues title insurance policies through its home and branch offices and through a network of agents. Issuing agents are typically real estate attorneys, independent agents or subsidiaries of community and regional mortgage lending institutions, depending on local customs and regulations and the Company’s marketing strategy in a particular territory. The ability to attract and retain issuing agents is a key determinant of the Company’s growth in title insurance premiums written.
Revenues for this segment primarily result from purchases of new and existing residential and commercial real estate, refinance activity and certain other types of mortgage lending such as home equity lines of credit.
Volume is a factor in the Company’s profitability due to fixed operating costs which are incurred by the Company regardless of title insurance premium volume. The resulting operating leverage tends to amplify the impact of changes in volume on the Company’s profitability. The Company’s profitability also depends, in part, upon its ability to manage its investment portfolio to maximize investment returns and minimize risks such as interest rate changes, defaults and impairments of assets.
The Company’s volume of title insurance premiums is affected by the overall level of residential and commercial real estate activity, which includes sales, mortgage financing and mortgage refinancing. Real estate activity, home sales and mortgage lending are cyclical in nature. In turn, real estate activity is affected by a number of factors, including the availability of mortgage credit, the cost of real estate, consumer confidence, employment and family income levels and general United States economic conditions. Interest rate volatility is also an important factor in the level of residential and commercial real estate activity.
Services other than title insurance provided by operating divisions of the Company are not reported separately and are reported collectively in a category called “All Other.” These other services include those offered by the Company and by its wholly owned subsidiaries, Investors Title Exchange Corporation (“ITEC”), Investors Title Accommodation Corporation (“ITAC”), Investors Trust Company (“Investors Trust”), Investors Capital Management Company (“ICMC”) and Investors Title Management Services, Inc. (“ITMS”).
The Company’s exchange services division, ITEC and ITAC, provides customer services in connection with tax-deferred real property exchanges. ITEC serves as a qualified intermediary in like-kind exchanges of real or personal property under Section 1031 of the Internal Revenue Code of 1986, as amended. In its role as qualified intermediary, ITEC coordinates the exchange aspects of the real estate transaction, and its duties include drafting standard exchange documents, holding the exchange funds between the sale of the old property and the purchase of the new property, and accepting the formal identification of the replacement property within the required identification period. ITAC serves as exchange accommodation titleholder in reverse exchanges. An exchange accommodation offers a vehicle for accommodating a reverse exchange when the taxpayer must acquire replacement property before selling the relinquished property.
The Company’s trust services division, Investors Trust, provides investment management and trust services to individuals, companies, banks and trusts. In July 2013, Investors Trust assumed responsibility for the management of all accounts previously managed by ICMC.
18
ITMS offers various consulting services to provide clients with the technical expertise to start and successfully operate a title insurance agency.
Business Trends and Recent Conditions
Beginning in 2008, the United States economy experienced a material economic downturn, resulting in a recession. Events leading to the recession were primarily the collapse of the housing market and frozen credit markets, prompting the federal government to take unprecedented monetary and fiscal action in an attempt to slow the economic rate of decline and instill consumer confidence. The economy has been gradually recovering from this downturn with housing values rebounding and the unemployment rate declining.
Current Initiatives
In efforts to stimulate the economy, the Federal Reserve announced in September 2012 Quantitative Easing, “QE3,” in which it would purchase mortgage-backed securities and longer-term Treasury securities. Through QE3, the Federal Reserve initially purchased mortgage-backed securities at a rate of $40 billion per month and longer-term Treasury securities at a rate of $45 billion per month. Beginning in 2014, the Federal Open Market Committee ("FOMC") of the Federal Reserve steadily reduced the purchase of securities, and, at the end of October 2014, the FOMC concluded the QE3 program.
The FOMC also issues disclosures on a periodic basis that include projections of the federal funds rate and expected actions. At the December 2015 meeting, the FOMC voted to raise the federal funds rate for the first time since December 2008 to a target range between 0.25% and 0.50%. Any future adjustments to the rate will be based on realized and expected economic developments to achieve maximum employment and 2 percent inflation. The FOMC anticipates future economic conditions to evolve in ways that will only warrant gradual increases, and that for some time, the federal funds rate is expected to be below long range levels.
On October 20, 2014, the Federal Housing Finance Agency ("FHFA"), which regulates the Federal National Mortgage Association (“Fannie Mae”) and the Federal Home Loan Mortgage Corporation (“Freddie Mac”), announced that Fannie Mae and Freddie Mac were negotiating guidelines with mortgage lenders that resulted in less strict lending requirements and lower barriers to mortgage loans for borrowers who are seeking access to home loans. The FHFA noted in its announcement that it intended to clarify the rules that allow Fannie Mae and Freddie Mac to require mortgage lenders to repurchase troubled loans. The FHFA also sought to increase the supply of credit available, particularly to creditworthy lower and middle-income families, by collaborating with mortgage lenders to provide guidelines for mortgage loans with down payments as low as three percent. In December 2014, both Fannie Mae and Freddie Mac officially approved ninety-seven percent loan-to-value products (three percent down payment mortgages). The Fannie Mae program is targeted to first-time home buyers and became available to lenders in December 2014. The Freddie Mac program became available to lenders on March 23, 2015 and is available to both first-time home buyers and other qualified borrowers with limited down payment savings.
In an effort to expand home ownership for lower-income buyers, the Federal Housing Authority (“FHA”) announced in January 2015 that it would cut its rates on mortgage insurance premiums. Mortgage insurance premium rates for 30-year FHA insured mortgages with less than a 5% down payment decreased from 1.35% to 0.85%. Mortgage insurance premium rates for 30-year FHA insured mortgages with more than a 5% down payment decreased from 1.30% to 0.80%. The new rates took effect on January 26, 2015 and will not apply to borrowers with existing mortgages, unless refinanced, or to 15-year mortgages.
Regulation and Reform
In 2008, the federal government took control of Fannie Mae and Freddie Mac in an effort to keep these government-sponsored entities from failing. The primary functions of Fannie Mae and Freddie Mac are to provide liquidity to the nation's mortgage finance system by purchasing mortgages on the secondary market, pooling them and selling them as mortgage-backed securities. In order to securitize, Fannie Mae and Freddie Mac typically require the purchase of title insurance for loans they acquire. Since the federal takeover, there have been various discussions and proposals regarding their reform. Changes to these entities could impact the entire mortgage loan process and, as a result, could affect the demand for title insurance. The timing and results of reform are currently unknown; however, any changes to these entities could affect the Company and its results of operations.
19
On November 20, 2013, the CFPB, which enforces the Real Estate Settlement Procedures Act (“RESPA”), the primary federal regulatory guidance covering the real estate settlement industry, released a final rule to integrate mortgage disclosures under the RESPA and the Truth in Lending Act (“TILA”). The final rule went into effect on October 3, 2015. Under this rule, the early disclosure forms required by TILA and the good faith estimate required by RESPA have been combined into one form, titled the Loan Estimate. The final disclosure required by TILA and the HUD-1 settlement statement required by RESPA have been combined into one form, titled the Closing Disclosure. The Company actively prepared for any anticipated effect this rule would have on both its direct and agency operations, with respect to its processes and procedures, systems and compliance costs. The measures adopted by the Company to comply with the final rule did not have a material impact on the Company's financial position and results of operations.
The CFPB, Office of the Comptroller of Currency and the Federal Reserve have issued memorandums to banks that communicated those agencies’ heightened focus on vetting third party providers. Such increased regulatory involvement may affect the Company's agents and approved providers. Further proposals to change regulations governing insurance holding companies and the title insurance industry are often introduced in Congress, in state legislatures and before various insurance regulatory agencies. Although the Company regularly monitors such proposals, the likelihood and timing of passage of any such regulation, and the possible effects of any such regulation on the Company and its subsidiaries, cannot be determined at this time.
Real Estate Environment
Overall, the economy is expanding and there has been a steady reduction in unemployment. The Mortgage Bankers Association's (“MBA”) January 2016 Economic and Mortgage Finance Commentary predicts 2016 overall economic growth of approximately 2.0% with continued improvement in the unemployment sector with monthly payrolls growing at over 200,000 jobs per month, the unemployment rate down to approximately 5% and unemployment claims trending down.
The MBA January 20, 2016 Mortgage Finance Forecast (“MBA Forecast”) projects 2016 purchase activity to increase 12.8% to $926 billion and refinance activity to decrease 31.7% to $454 billion, resulting in a decrease in total mortgage originations of 7.1% to $1,380 billion, all from 2015 levels. In 2015, refinance activity accounted for 44.8% of all mortgage originations and is projected to represent 32.9% of all mortgage originations in 2016.
According to data published by Freddie Mac, the average 30-year fixed mortgage interest rate in the United States was 3.8%, 4.2%, and 4.0% for the years ended December 31, 2015, 2014, and 2013, respectively. According to the MBA Forecast, refinancing is expected to be lower in 2016 as mortgage interest rates continue to climb to a projected 4.6% in the fourth quarter of 2016.
Historically, activity in real estate markets has varied over the course of market cycles by geographic region and in response to evolving economic factors. Operating results can vary from year to year based on cyclical market conditions and do not necessarily indicate the Company's future operating results and cash flows.
Critical Accounting Estimates and Policies
This discussion and analysis of the Company’s financial condition and results of operations is based upon the Company’s accompanying Consolidated Financial Statements, which have been prepared in accordance with accounting principles generally accepted in the United States. The Company’s management makes various estimates and judgments when applying policies affecting the preparation of the Consolidated Financial Statements. Actual results could differ from those estimates. Significant accounting policies of the Company are discussed in Note 1 to the accompanying Consolidated Financial Statements. Following are the accounting estimates and policies considered critical to the Company.
Reserves for Claim Losses
The Company’s reserves for claims are established using estimates of amounts required to settle claims for which notice has been received (reported) and the amount estimated to be required to satisfy incurred claims of policyholders which may be reported in the future (incurred but not reported, or “IBNR”). The total reserve for all losses incurred but unpaid as of December 31, 2015 is represented by the reserve for claims totaling $37,788,000 in the accompanying Consolidated Balance Sheets. Of that total, approximately $5,066,000 was reserved for specific claims which have been reported to the Company, and approximately $32,722,000 was reserved for IBNR claims.
20
A provision for estimated future claims payments is recorded at the time the related policy revenue is recorded. The Company records the claims provision as a percentage of net premiums written. This loss provision rate is set to provide for losses on current year policies. By their nature, title claims can often be complex, vary greatly in dollar amounts, vary in number due to economic and market conditions such as an increase in mortgage foreclosures, and involve uncertainties as to ultimate exposure. In addition, some claims may require a number of years to settle and determine the final liability for indemnity and loss adjustment expense. The payment experience may extend for more than 20 years after the issuance of a policy. Events such as fraud, defalcation and multiple property defects can substantially and unexpectedly cause increases in estimates of losses. Due to the length of time over which claim payments are made and regularly occurring changes in underlying economic and market conditions, these estimates are subject to variability.
Management considers factors such as the Company’s historical claims experience, case reserve estimates on reported claims, large claims, actuarial projections and other relevant factors in determining its loss provision rates and the aggregate recorded expected liability for claims. In establishing reserves, actuarial projections are compared with recorded reserves to evaluate the adequacy of such recorded claims reserves and any necessary adjustments are then recorded in the current period’s income statement. As the most recent claims experience develops and new information becomes available, the loss reserve estimate related to prior periods will change to more accurately reflect updated and improved emerging data. The Company reflects any adjustments to reserves in the results of operations in the period in which new information (principally claims experience) becomes available.
The Company initially reserves for each known claim based upon an assessment of specific facts and updates the reserve amount as necessary over the course of administering each claim. Loss ratios for earlier years tend to be more reliable than recent policy years, as those years are more fully developed. In making loss estimates, management determines a loss provision rate, which it then applies to net premiums written.
There are key assumptions that materially affect the reserve estimates. During the third quarter of 2013, certain actuarial inputs were changed to provide a more refined IBNR reserve estimate. The Company considered these modifications in actuarial inputs to be a change in estimate. The Company believes that these changes in actuarial inputs were necessary in response to favorable reserve development and claims experience incurred in several policy years reported in the 2013 calendar year. The approximate impact of the change in estimate for the year ended December 31, 2013 was a reduction of $2,200,000 to the reserves for claims in the Consolidated Balance Sheets, and in the Consolidated Statements of Income, a decrease of $2,200,000 to the provision (benefit) for claims, an increase of $750,000 in the provision for income taxes and an increase of approximately $1,450,000 in net income, or $0.71 per basic share and $0.70 per diluted share, compared with the amounts that would have been recorded under the Company’s prior estimate. This change in estimate, coupled with several historical policy years which continued to emerge favorably in comparison with prior expectations, contributed to a benefit in the claims provision for 2013. The change in estimate was primarily driven by the following:
• | changing the specific weightings used in estimating expected loss ratios for use in actuarial methods, including the weighting between policy years and weighting of title industry loss data; |
• | adjusting for premium rate changes and the Company’s improved underwriting efforts related to construction business; and |
• | increasing the ratios used to estimate projected payments of unallocated loss adjustment expenses to more accurately reflect expected payments. |
The Company assumes the reported liability for known claims and IBNR, in the aggregate, will be comparable to its historical claims experience unless factors, such as loss experience and charged premium rates, change significantly. Also affecting the Company’s assumptions are large losses related to fraud and defalcation, as these can cause significant variances in loss emergence patterns. Management defines a large loss as one where incurred losses exceed $250,000. Due to the small volume of large claims, the long-tail nature of title insurance claims and the inherent uncertainty in loss emergence patterns, large claim activity can vary significantly between policy years. The estimated development of large claims by policy year is therefore subject to significant changes as experience develops. The loss provision rate is set to provide for losses on current year policies and changes in prior year estimates.
Management also considers actuarial analyses in evaluating claims reserves. The actuarial methods used to evaluate reserves are loss development methods, expected loss methods and Cape Cod methods, all of which are accepted actuarial methods for estimating ultimate losses and, therefore, loss reserves. In the loss development method, each policy year’s paid or incurred losses are projected to an “ultimate” level using loss development factors. In the expected loss method, losses for each policy year are estimated based on the loss development results for all policy years, trended to the level of the policy year being estimated. Expected loss methods produce more stable ultimate loss estimates than do loss development methods, which are more responsive to the current loss data but can lead to volatile results. The Cape Cod method, a special case of the Bornhuetter-Ferguson method, blends the results of the loss development and expected loss methods. For more recent policy years, the Cape Cod method gives more weight to the results of the expected loss methods; for older policy years, more weight is given to the loss development method results.
21
The key actuarial assumptions are principally loss development factors and expected loss ratios. The selected loss development factors are based on a combination of the Company’s historical loss experience and title industry loss experience. Expected loss ratios are estimated for each policy year based on the Company’s own experience and title industry loss ratios. When updated data is incorporated into the actuarial models, the resulting loss development factors and expected loss ratios will likely change from the prior values. Changes in these values from 2013 through 2015 have been the result of actual Company and industry experience during the calendar year in addition to changes in assumptions for 2013.
If one or more of the variables or assumptions used changed such that the Company’s recorded loss ratio, or loss provision as a percentage of net title premiums, increased or decreased three loss ratio percentage points, the impact on after-tax income for the year ended December 31, 2015 would be as follows:
Increase in Loss Ratio of three percentage points | $ | (2,227,000 | ) |
Decrease in Loss Ratio of three percentage points | $ | 2,227,000 | |
Company management believes that using a sensitivity of three loss percentage points for the loss ratio provides a reasonable benchmark for analysis of the calendar year loss provision of the Company based on historical loss ratios by year.
Despite the variability of such estimates, management believes that, based on historical claims experience and actuarial analysis, the Company’s reserves are adequate to cover claim losses resulting from pending and future claims for policies issued through December 31, 2015. The ultimate settlement of claims will likely vary from the reserve estimates included in the Company’s Consolidated Financial Statements. The Company continually reviews and adjusts its reserve estimates to reflect its loss experience and any new information that becomes available. There are no known claims that are expected to have a material adverse effect on the Company’s financial position or operating results.
Premiums Written and Commissions to Agents
Title insurance premiums are generally recognized at the time of closing of the related real estate transaction, as the earnings process is then considered complete. Policies or commitments are issued upon receipt of final certificates or preliminary reports with respect to titles. Title insurance commissions earned by the Company’s agents, taxes and a provision for claims losses are recognized as expenses concurrent with recognition of related premium revenue.
Generally, the Company’s premium revenues from certain agency operations include accruals based on estimates. These accruals estimate unreported agency premiums related to transactions which have settled as of the balance sheet date. Accruals for premiums from certain agencies are necessary because of the lag between policy effective dates and the reporting of these transactions to the Company by the agents. The current lag time used in the Company’s estimates typically ranges between 0 and 180 days after the policy effective date, with the majority of agencies reporting within 60 to 90 days. The lag time is reviewed periodically to monitor accruals. To determine the estimated premiums, the Company uses historical experience, as well as other factors, to make certain assumptions about the average elapsed time between the policy effective date and the date the policies are reported. From time to time, the Company adjusts the inputs to the calculation of these estimates as agents report transactions and information on more current trends becomes available. In addition to estimating revenues, the Company also estimates and accrues agent commissions, claims provisions, premium taxes, income taxes, and other expenses associated with the estimated revenues which have been accrued. The Company reflects any adjustments to the accruals in the result of operations in the period in which new information becomes available.
Quarterly, the Company evaluates the collectability of receivables. Premiums not collected within 7 months are fully reserved. Write-offs of receivables have not been material to the Company.
Valuation and Impairment of Investments in Securities
Securities held principally for resale in the near term are classified as trading securities and recorded at fair value. Realized and unrealized gains and losses on trading securities are included in other income. Securities not classified as either trading or held-to-maturity are classified as available-for-sale and reported at estimated fair value with unrealized gains and losses, net of tax, adjusted for other-than-temporary declines in estimated fair value, reported as accumulated other comprehensive income. As of December 31, 2015 and 2014, all of the Company’s invested securities were classified as available-for-sale. Realized gains and losses on the sale of investments are determined using the specific identification method.
22
Securities are regularly evaluated and reviewed for differences between the cost and estimated fair value of each security for factors that may indicate that a decline in estimated fair value is other-than-temporary. When, in the opinion of management, a decline in the estimated fair value of an investment is considered to be other-than-temporary, such investment is written down to its estimated fair value. Some factors considered in evaluating whether or not a decline in estimated fair value is other-than-temporary include, but are not limited to:
• | the duration and extent to which the fair value has been less than cost; |
• | with respect to equity securities, whether the Company’s ability and intent to retain the investment for a period of time is sufficient to allow for a recovery in value; and |
• | with respect to fixed maturity securities, whether the Company has the intent to sell or will more likely than not be required to sell a particular security before recovery in value. |
These factors are reviewed quarterly and any material degradation in the prospect for recovery will be considered in the other-than-temporary impairment analysis. Such reviews are inherently uncertain and the value of the investment may not fully recover or may decline in future periods resulting in a realized loss. The fair values of the majority of the Company’s investments are based on quoted market prices from independent pricing services. See Note 3 to the Consolidated Financial Statements included in this Annual Report on Form 10-K for further information about the Company’s valuation techniques.
Deferred Taxes
The Company recorded net deferred tax liabilities at December 31, 2015 and 2014. The deferred tax liabilities recorded during both periods primarily relates to net unrealized gains on investments and recorded reserves for claims, net of statutory premium reserves. See Note 8 to the Consolidated Financial Statements in this Annual Report on Form 10-K for further information on the Company’s deferred taxes.
Cyclicality and Seasonality
Real estate activity, home sales and mortgage lending are cyclical in nature. Title insurance premiums are closely related to the level of real estate activity and the average price of real estate sales. The availability of funds to finance purchases directly affects real estate sales. Other factors include mortgage interest rates, consumer confidence, economic conditions, supply and demand and family income levels. The Company’s premiums in future periods are likely to fluctuate due to these and other factors which are beyond management’s control.
Historically, the title insurance business tends to be seasonal as well as cyclical. Because home sales are typically strongest in periods of favorable weather, the first calendar quarter tends to have the lowest activity levels, while the spring and summer seasons tend to be more active. Refinance activity is generally less seasonal, but is subject to interest rate fluctuations.
23
Results of Operations
The following table presents certain income statement data for the years ended December 31, 2015, 2014 and 2013:
For the Years Ended December 31, | 2015 | 2014 | 2013 | |||||||||
Revenues: | ||||||||||||
Net premiums written | $ | 112,475,686 | $ | 109,963,556 | $ | 113,886,266 | ||||||
Investment income – interest and dividends | 4,531,319 | 4,259,501 | 3,894,608 | |||||||||
Net realized (loss) gain on investments | (116,163 | ) | 268,294 | 195,800 | ||||||||
Other | 10,309,230 | 8,627,935 | 8,274,823 | |||||||||
Total Revenues | 127,200,072 | 123,119,286 | 126,251,497 | |||||||||
Operating Expenses: | ||||||||||||
Commissions to agents | 62,174,301 | 65,632,353 | 67,150,810 | |||||||||
Provision (benefit) for claims | 4,478,494 | 5,229,716 | (571,596 | ) | ||||||||
Salaries, employee benefits and payroll taxes | 28,041,213 | 25,218,225 | 25,386,511 | |||||||||
Office occupancy and operations | 5,885,336 | 5,049,962 | 4,430,220 | |||||||||
Business development | 2,373,270 | 2,333,491 | 2,145,639 | |||||||||
Filing fees, franchise and local taxes | 732,985 | 817,909 | 681,935 | |||||||||
Premium and retaliatory taxes | 2,161,571 | 1,851,767 | 2,558,227 | |||||||||
Professional and contract labor fees | 2,691,411 | 2,676,483 | 2,171,606 | |||||||||
Other | 884,438 | 820,882 | 755,407 | |||||||||
Total Operating Expenses | 109,423,019 | 109,630,788 | 104,708,759 | |||||||||
Income before Income Taxes | 17,777,053 | 13,488,498 | 21,542,738 | |||||||||
Provision for Income Taxes | 5,228,000 | 3,816,000 | 6,746,000 | |||||||||
Net Income Attributable to the Company | $ | 12,533,905 | $ | 9,648,975 | $ | 14,708,210 | ||||||
Insurance and Other Services Revenue
Insurance and other services revenues include net premiums written plus other fee income, trust income, management services income, and exchange services income. Investment income and realized investment gains and losses are not included in insurance and other service revenues and are discussed separately under “Investment-Related Revenues” below. The following is a summary of the Company’s insurance and other services revenues with intersegment eliminations netted with each segment; therefore, the individual segment amounts will not agree to Note 12 in the accompanying Consolidated Financial Statements.
2015 | % | 2014 | % | 2013 | % | |||||||||||||||
Title Insurance | $ | 117,281,588 | 95.5 | % | $ | 113,592,742 | 95.8 | % | $ | 117,522,872 | 96.2 | % | ||||||||
All Other | 5,503,328 | 4.5 | % | 4,998,749 | 4.2 | % | 4,638,217 | 3.8 | % | |||||||||||
Total | $ | 122,784,916 | 100.0 | % | $ | 118,591,491 | 100.0 | % | $ | 122,161,089 | 100.0 | % | ||||||||
Title Insurance
Net Premiums and Title Orders: Net premiums written increased 2.3% in 2015 to $112,475,686 compared with $109,963,556 in 2014, and decreased 3.4% in 2014 compared with $113,886,266 in 2013. The volume of title orders increased 3.7% in 2015 to 211,200 compared with 203,657 in 2014, and decreased 15.4% in 2014 compared with 240,639 in 2013. The 2015 increase in net premiums and title orders versus the prior year is primarily attributable to an increase in the level of both purchase and refinance transactions. The 2014 decrease in net premiums and title orders versus the prior year is primarily attributable to a decline in the number of refinance transactions. Premiums written may not move proportionally with the level of title orders due to the mix of refinance and purchase transactions as well as the mix of premiums written by state, as rates vary by state. Refinance transactions typically have lower premium rates than purchase transactions.
24
Title insurance companies typically issue title insurance policies directly through home and branch offices or through title agencies. Following is a breakdown of premiums generated by branch and agency operations for the years ended December 31:
2015 | % | 2014 | % | 2013 | % | |||||||||||||||
Home and Branch | $ | 28,400,531 | 25.3 | % | $ | 24,057,032 | 21.9 | % | $ | 24,811,602 | 21.8 | % | ||||||||
Agency | 84,075,155 | 74.7 | % | 85,906,524 | 78.1 | % | 89,074,664 | 78.2 | % | |||||||||||
Total | $ | 112,475,686 | 100.0 | % | $ | 109,963,556 | 100.0 | % | $ | 113,886,266 | 100.0 | % | ||||||||
Home and Branch Office Net Premiums: In the Company’s home and branch operations, the Company issues the insurance policy and retains the entire premium, as no commissions are paid in connection with these policies. Net premiums written from home and branch operations increased 18.1% in 2015 to $28,400,531 compared with $24,057,032 in 2014, and decreased 3.0% in 2014 compared with $24,811,602 in 2013. The increase in 2015 net premiums was primarily attributable to increases in both refinance and purchase activity. Refinance activity increased as mortgage interest rates were lower from prior year levels. Premiums from purchase transactions increased as well, due to both increased volume from favorable interest rates and overall economic conditions, and increases in average home prices. The decrease in 2014 net premiums for home and branch operations primarily reflects a decrease in refinance transactions, partially offset by an increase in purchase transactions. All of the Company’s home office operations and the majority of branch offices are located in North Carolina; as a result, the home and branch office net premiums written are primarily for North Carolina title insurance policies.
Agency Net Premiums: When a policy is written through a title agency, the premium is shared between the agency and the underwriter. Total premiums include an estimate of premiums for policies that have been issued, but not reported as of the balance sheet date. To determine the estimated premiums, the Company uses historical experience, as well as other factors, to make certain assumptions about the average elapsed time between the policy effective date and the date the policies are reported. From time to time, the Company adjusts the inputs to the estimation process as agents report transactions and new information becomes available. In addition to estimating revenues, the Company also estimates and accrues agent commissions, claims provisions, premium taxes, income taxes, and other expenses associated with the estimated revenues that have been accrued. The Company reflects any adjustments to the accruals in the result of operations in the period in which new information becomes available.
Agency net premiums written decreased 2.1% in 2015 to $84,075,155 compared with $85,906,524 in 2014, and decreased 3.6% in 2014 compared with $89,074,664 in 2013. The decrease in 2015 agency premiums was primarily attributable to a decrease in the amount of premiums written by one agent in the Texas market due to reductions in unreported agency premiums and lower levels of purchase transactions, partially offset by increases in most states in which the Company operates attributable to higher average real estate prices and higher levels of real estate activity. The decrease in 2014 agency net premiums written compared with 2013 was primarily attributable to a decrease in the number of refinance transactions, partially offset by purchase transactions.
Agency Relationship: The Company receives a significant percentage of its net premiums written from a single title agent, which was recently acquired by another title insurer. Net premiums written by such agent are for title insurance policies written in Texas. For further details, refer to Note 11 to the Notes to Consolidated Financial Statements herein.
Following is a schedule of net premiums written in select states where the Company’s two insurance subsidiaries, ITIC and NITIC, currently underwrite title insurance:
State | 2015 | 2014 | 2013 | ||||||||
North Carolina | 36,921,195 | 31,264,486 | 31,274,229 | ||||||||
Texas | 25,211,496 | 40,139,495 | 30,618,661 | ||||||||
South Carolina | 11,327,702 | 8,462,014 | 13,059,982 | ||||||||
Georgia | 7,682,820 | 4,335,216 | 2,738,214 | ||||||||
Virginia | 5,706,769 | 4,821,900 | 5,114,937 | ||||||||
Michigan | 4,631,176 | 3,673,649 | 5,254,631 | ||||||||
All Others | 21,175,592 | 17,368,821 | 26,030,803 | ||||||||
Premiums Written | 112,656,750 | 110,065,581 | 114,091,457 | ||||||||
Reinsurance Assumed | 33,603 | 37,992 | 6,291 | ||||||||
Reinsurance Ceded | (214,667 | ) | (140,017 | ) | (211,482 | ) | |||||
Net Premiums Written | $ | 112,475,686 | $ | 109,963,556 | $ | 113,886,266 | |||||
25
Other Revenues
Other revenues primarily include other fee income, trust income, management services income, exchange services income, and income related to the Company’s equity method investments. Other revenues were $10,309,230, $8,627,935 and $8,274,823 in 2015, 2014 and 2013, respectively. Other revenues increased in 2015 compared with 2014 primarily due to increases in earnings of unconsolidated affiliates, title fees and exchange services income, partially offset by a decline in trust and investment management services. Other revenues increased in 2014 compared with 2013 primarily due to increases in management services income, exchange services income, earnings of unconsolidated affiliates and trust and investment management services, partially offset by a decrease in fee income.
Investment-Related Revenues
Investment income and realized gains and losses from investments are included in investment-related revenues.
Investment Income
The Company derives a substantial portion of its income from investments in municipal and corporate bonds and equity securities. The Company's title insurance subsidiaries are required by statute to maintain minimum levels of investments in order to protect the interests of policyholders. The Company’s investment policy is designed to comply with regulatory requirements and to balance the competing objectives of asset quality and investment returns. The Company’s title insurance subsidiaries are required by statute to maintain minimum levels of investments in order to protect the interests of policyholders. Bonds totaling approximately $7,159,000 and $7,060,000 at December 31, 2015 and 2014, respectively, are deposited with the insurance departments of the states in which business is conducted.
In formulating its investment strategy, the Company has emphasized after-tax income and principal preservation. The Company’s investments are primarily in bonds and, to a lesser extent, equity securities. The effective maturity of the majority of the bonds is within 10 years. The Company’s invested assets are managed to fund its obligations and evaluated to ensure long term stability of capital accounts.
As the Company generates cash from operations, it is invested in accordance with the Company’s investment policy and corporate goals. The Company’s investment policy has been designed to balance multiple goals, including the assurance of a stable source of income from interest and dividends, the preservation of principal, and the provision of liquidity sufficient to meet insurance underwriting and other obligations as they become payable in the future. Securities purchased may include a combination of taxable bonds, tax-exempt bonds and equity securities. The Company strives to maintain a high quality investment portfolio. Interest and investment income levels are primarily a function of general market performance, interest rates and the amount of cash available for investment.
Investment income was $4,531,319 in 2015 compared with $4,259,501 in 2014 and $3,894,608 in 2013. The increase in investment income in 2015 compared with 2014 was primarily due to higher levels of interest and dividends earned in conjunction with a higher average portfolio balance for both fixed maturities and equity securities during the current year. The increase in investment income in 2014 compared with 2013 was primarily due to higher levels of interest and dividends earned coupled with a larger portfolio of both fixed maturities and equity securities. See Note 3 in the accompanying Consolidated Financial Statements for the major categories of investments, scheduled maturities, amortized cost, fair values of investment securities and earnings by security category.
Net Realized (Loss) Gain on Investments
Dispositions of equity securities at a realized gain or loss reflect such factors as industry sector allocation decisions, ongoing assessments of issuers’ business prospects and tax planning considerations. Additionally, the amounts of net realized investment gains and losses are affected by assessments of securities’ valuation for other-than-temporary impairment. As a result of the interaction of these factors and considerations, the net realized investment gain or loss can vary significantly from period to period.
The net realized (loss) gain on investments was $(116,163) for 2015 compared with $268,294 for 2014 and $195,800 for 2013. The net realized (loss) gain on investments included impairment charges of $984,128, $24,604, and $34,070 on certain investments and other assets that were deemed to be other-than temporarily-impaired in 2015, 2014 and 2013, respectively, offset by a net realized gain on the sales of investments and other assets of $867,965, $292,898 and $229,870 in 2015, 2014, and 2013, respectively. Management believes unrealized losses on remaining fixed income and equity securities at December 31, 2015 are temporary in nature.
26
The securities in the Company’s investment portfolio are subject to economic conditions and market risks. The Company considers relevant facts and circumstances in evaluating whether a credit or interest-related impairment of a security is other-than-temporary. Relevant facts and circumstances include the extent and length of time the fair value of an investment has been below cost.
There are a number of risks and uncertainties inherent in the process of monitoring impairments and determining if an impairment is other-than-temporary. These risks and uncertainties include the risk that the economic outlook will be worse than expected or have more of an impact on the issuer than anticipated, the risk that the Company’s assessment of an issuer’s ability to meet all of its contractual obligations will change based on changes in the characteristics of that issuer, the risk that information obtained by the Company or changes in other facts and circumstances leads management to change its intent to hold the equity security until it recovers in value or its intent to sell the debt security, and the risk that management is making decisions based on misstated information in the financial statements provided by issuers.
Expenses
The Company’s operating expenses consist primarily of commissions to agents, salaries, employee benefits and payroll taxes, provision for claims and office occupancy and operations. Operating Expenses decreased 0.2% in 2015 compared with 2014 primarily due to decreases in commissions to agents and the provision for claims, partially offset by increases in salaries, employee benefits and payroll taxes and office occupancy and operations. Operating expenses increased 4.7% in 2014 compared with 2013 primarily due to an increase in the provision for claims, partially offset by a decline in commissions to agents.
On a combined basis, the after-tax profit margins were 9.9%, 7.8% and 11.6% in 2015, 2014 and 2013, respectively. The Company continually strives to enhance its competitive strengths and market position, including ongoing initiatives to reduce its operating expenses.
Following is a summary of the Company’s operating expenses for 2015, 2014 and 2013. Intersegment eliminations have been netted; therefore, the individual segment amounts will not agree to Note 12 in the accompanying Consolidated Financial Statements.
2015 | % | 2014 | % | 2013 | % | |||||||||||||||
Title Insurance | $ | 102,895,701 | 94.0 | % | $ | 103,850,090 | 94.7 | % | $ | 98,521,919 | 94.1 | % | ||||||||
All Other | 6,527,318 | 6.0 | % | 5,780,698 | 5.3 | % | 6,186,840 | 5.9 | % | |||||||||||
Total | $ | 109,423,019 | 100.0 | % | $ | 109,630,788 | 100.0 | % | $ | 104,708,759 | 100.0 | % | ||||||||
Total Company
Salaries, Employee Benefits and Payroll Taxes: Personnel costs include base salaries, benefits and bonuses paid to employees. Salaries, employee benefits and payroll taxes were $28,041,213, $25,218,225 and $25,386,511 for 2015, 2014 and 2013, respectively. Salaries and related costs increased by approximately 11.2% in 2015 from 2014 and decreased 0.7% in 2014 from 2013. The increase in 2015 compared with 2014 was primarily related to normal inflationary increases in compensation and benefit costs, higher staffing levels to support ongoing software development activities and higher levels of incentive compensation. The decrease in 2014 compared with 2013 primarily relates to a reduction in incentive compensation, partially offset by an increase in salaries. On a consolidated basis, salaries and employee benefits as a percentage of total revenues were 22.0%, 20.5% and 20.1% in 2015, 2014 and 2013, respectively.
Office Occupancy and Operations: Office occupancy and operations expenses primarily include office rent and utilities, depreciation, maintenance, telecommunications and insurance expenses. Overall office occupancy and operations expenses were $5,885,336, $5,049,962 and $4,430,220 for 2015, 2014 and 2013, respectively. As a percentage of total revenues, office occupancy and operations expenses were 4.6%, 4.1% and 3.5% for 2015, 2014 and 2013, respectively. The dollar increase in office occupancy and operations expense in 2015 compared with 2014 was primarily related to increases in depreciation, maintenance and telecommunications. The dollar increase in office occupancy and operations expense in 2014 compared with 2013 was primarily related to increases in hardware upgrade projects, depreciation, and office rent and utilities.
Business Development: Business development expenses primarily include marketing and travel-related expenses. Business development expenses increased to $2,373,270 in 2015 compared with $2,333,491 in 2014 and $2,145,639 in 2013, primarily due to increases in travel and marketing expenses.
Filing Fees, Franchise and Local Taxes: Filing fees, franchise and local tax expenses include insurance filing and licensing fees, franchise taxes, excise taxes and local taxes. Filing fees, franchise and local tax expenses were $732,985 in 2015 compared with $817,909 in 2014 and $681,935 in 2013.
27
Professional and Contract Labor Fees: Professional and contract labor fees were $2,691,411 in 2015 compared with $2,676,483 in 2014 and $2,171,606 in 2013. Professional and contract labor fees remained virtually unchanged for 2015 compared with 2014. The increase in 2014 compared with 2013 primarily related to increases in consulting fees associated with the Company's ongoing software initiatives.
Other Expenses: Other operating expenses primarily include miscellaneous operating expenses of the trust division and other miscellaneous expenses of the title segment. These amounts typically fluctuate with transaction volume of the title segment and the trust division. Other expenses increased to $884,438 in 2015, compared with $820,882 in 2014 and $755,407 in 2013.
Title Insurance
Profit Margin: The Company’s title insurance after-tax profit margin varies according to a number of factors, including the volume and type of real estate activity. Profit margins for the title insurance segment were 10.9%, 8.5% and 13.0% in 2015, 2014 and 2013, respectively. The increase in after-tax profit margin in 2015 compared with 2014 is primarily related to an increase in premiums written, lower commissions expense and provision for claims, partially offset by an increase in salaries, employee benefits and payroll taxes. The decrease in after-tax profit margin in 2014 compared with 2013 is primarily related to a higher provision for claims.
Commissions: Agent commissions represent the portion of premiums retained by agents pursuant to the terms of their respective agency contracts. In 2015, commissions to agents decreased 5.3% to $62,174,301 compared with $65,632,353 in 2014, and decreased 2.3% in 2014 compared with $67,150,810 in 2013. Commission expense as a percentage of net premiums written by agents was 74.0%, 76.4% and 75.4% in 2015, 2014 and 2013, respectively. Commission rates may vary due to geographic locations, different levels of premium rate structures and state regulations.
Provision (Benefit) for Claims: The provision (benefit) for claims as a percentage of net premiums written was 4.0%, 4.8% and (0.5%) in 2015, 2014 and 2013, respectively. The decrease in 2015 compared with 2014 was primarily attributable to fewer new claim filings and favorable claims experience. The increase in 2014 compared with 2013 was primarily due to a change in estimate that occurred during 2013 related to changes in certain actuarial assumptions stemming from improved claims experience in recent policy years. A more detailed discussion related to the change in actuarial assumptions can be found in the Critical Accounting Estimates and Policies section of this Management’s Discussion and Analysis. The Company continues to benefit from the absence of large claims related to defalcations in recent policy years.
The decrease in the loss provision rate in 2015 from the 2014 level resulted in approximately $871,000 less in reserves than would have been recorded at the higher 2014 level. Loss provision ratios are subject to variability and are reviewed and adjusted as experience develops.
Title claims are typically reported and paid within the first several years of policy issuance. The provision for claims reflects actual payments of claims, net of recovery amounts, plus adjustments to the specific and incurred but not reported claims reserves, the latter of which are actuarially determined based on historical claims experience. Actual payments of claims, net of recoveries, were $3,367,494, $3,912,716 and $3,146,404 in 2015, 2014 and 2013, respectively.
Reserves for Claims: At December 31, 2015, the total reserve for claims was $37,788,000. Of that total, approximately $5,066,000 was reserved for specific claims, and approximately $32,722,000 was reserved for claims for which the Company had no notice. Because of the uncertainty of future claims, changes in economic conditions and the fact that many claims do not materialize for several years, reserve estimates are subject to variability.
Changes from prior periods in the expected liability for claims reflect the uncertainty of the claims environment, as well as the limited predictive power of historical data. The Company continually updates and refines its reserve estimates as current experience develops and credible data emerges. Such data includes payments on claims closed during the quarter, new details that emerge on still-open cases that cause claims adjusters to increase or decrease the case reserves, and the impact that these types of changes have on the Company’s total loss provision. Adjustments may be required as new information develops which often varies from past experience.
Premium and Retaliatory Taxes: Title insurance companies are generally not subject to state income or franchise taxes. However, in most states they are subject to premium and retaliatory taxes, as defined by statute. Premium and retaliatory tax rates vary from state to state; accordingly, the total premium and retaliatory tax incurred is dependent upon the geographical mix of insurance revenues. Premium and retaliatory taxes as a percentage of net premiums written were 1.9%, 1.7% and 2.2% in 2015, 2014 and 2013, respectively.
28
Income Taxes
The provision for income taxes was $5,228,000, $3,816,000 and $6,746,000 for the years ended December 31, 2015, 2014 and 2013, respectively. Income tax expense as a percentage of earnings before income taxes was 29.4%, 28.3% and 31.3%, for the years ended December 31, 2015, 2014 and 2013, respectively. The increase in the effective rate in 2015 compared with 2014 was primarily due to a lower proportion of tax-exempt to taxable income. The decrease in the effective rate in 2014 compared with 2013 was primarily due to a higher proportion of tax-exempt to taxable income. The effective income tax rate for 2015, 2014 and 2013 was below the U.S. federal statutory income tax rate (34%), primarily due to the effect of tax-exempt income.
The Company believes it is more likely than not that the tax benefits associated with recognized impairments and unrecognized losses recorded through December 31, 2015 will be realized. However, this judgment could be impacted by further market fluctuations. Information regarding the components of income tax expense and the items included in the reconciliation of the effective rate with the federal statutory rate can be found in Note 8 to the accompanying Consolidated Financial Statements.
Net Income Attributable to the Company
The Company reported net income attributable to the Company of $12,533,905, $9,648,975 and $14,708,210, or $6.30, $4.74 and $7.08 per share on a diluted basis in 2015, 2014 and 2013, respectively. Net income attributable to the Company in 2015 increased in 2015 compared with 2014 primarily due to a 3.3% increase in total revenues, while operating expenses remained virtually flat. The increase in revenues was attributable to a 2.3% increase in net premiums written due to higher levels of purchase and refinance activity and a 19.5% increase in other income attributable to an increase in earnings from unconsolidated affiliates, title fees and exchange services income, partially offset by a decline in trust and investment management services. The slight decrease in operating expenses was primarily attributable to a 5.3% decrease in commissions due to a favorable mix of direct business and a 14.4% decrease in the provision for claims related to fewer new claims filings and favorable claims experience, partially offset by an 11.2% increase in payroll expenses due to normal inflationary increases in wages and benefits, higher staffing level needs to support ongoing software development activities and higher levels of incentive compensation. Net income attributable to the Company declined in 2014 compared with 2013 primarily due to an increase in operating expenses of 4.7% and a decrease in premiums written of 3.4%. Operating expenses increased primarily as a result of a reduction in the reserves for claims in the prior year period. The prior period reduction reflected a change in estimate related to certain actuarial assumptions stemming from improved claims experience in recent policy years. Office and occupancy expenses, as well as professional fees and contract labor, also increased largely as a result of long-term software development initiatives. The 2014 decrease in premiums written compared with 2013 primarily related to a decline in refinance transactions.
Liquidity and Capital Resources
The Company’s current cash requirements include general operating expenses, income taxes, capital expenditures, dividends on its common stock and repurchases of its commons stock. Cash flows from operations have historically been the primary source of financing for expanding operations, whether through organic growth or outside investments.
The Company evaluates nonorganic growth opportunities, such as mergers and acquisitions, from time to time in the ordinary course of business. Because of the episodic nature of these events, related incremental liquidity and capital resource needs can be difficult to predict.
The Company’s operating results and cash flows are heavily dependent on the real estate market. The Company’s business has certain fixed costs such as personnel; therefore, changes in the real estate market are monitored closely, and operating expenses such as staffing levels are managed and adjusted accordingly. The Company believes that its significant working capital position and management of operating expenses will aid its ability to manage cash resources through fluctuations in the real estate market.
Cash Flows: Net cash flows provided by operating activities were $16,889,631, $9,683,980 and $15,304,485 for 2015, 2014 and 2013, respectively. Cash flows from operating activities increased in 2015 from 2014 due to the timing of payable disbursements and an increase in net income, partially offset by an increase in other assets. Cash flows from operating activities decreased from 2013 to 2014 due to the timing of payable disbursements, declines in net income and deferred tax expense, and an increase in claim payments, partially offset by an increase in the provision for claims.
Cash flows from non-operating activities have historically consisted of purchases and proceeds from investing activities, repurchases of common stock and the issuance of dividends. In 2015, the Company had a lower level of investment purchase activity, a higher level of proceeds from the sales and maturities of investments, and a higher level of common stock repurchases compared with 2014. In 2014, the Company had a higher level of investment purchase activity, a comparable level of proceeds from sales and maturities of investments, and a lower level of common stock repurchases compared with 2013.
29
The Company maintains a high degree of liquidity within its investment portfolio, classified as available for sale, in the form of cash, short-term investments, and other readily marketable securities. As of December 31, 2015, the Company held cash and cash equivalents of $21,790,068, short-term investments of $6,865,406, fixed maturity securities of $106,066,384 and equity securities of $37,513,464. The net effect of all activities on total cash and cash equivalents was an increase of $5,963,553 for 2015, a decrease of $7,800,246 for 2014, and an increase of $2,816,743 for 2013.
Capital Resources: The amount of capital resources the Company maintains is influenced by state regulation, the need to maintain superior financial ratings from third party rating agencies and other marketing and operational considerations.
The Company's significant sources of funds are dividends and distributions from its subsidiaries, primarily its two title insurance subsidiaries. Cash is received from its subsidiaries in the form of dividends and as reimbursements for operating and other administrative expenses that it incurs. The reimbursements are executed within the guidelines of management agreements between the Company and its subsidiaries.
The ability of the Company's title insurance subsidiaries to pay dividends to the Company is subject to state regulation from their respective states of domicile. Each state regulates the extent to which title underwriters can pay dividends or make distributions and requires prior regulatory approval of the payment of dividends and other intercompany transfers. The maximum dividend permitted by law is not necessarily indicative of an insurer’s actual ability to pay dividends. Depending on regulatory conditions, the Company may in the future need to retain cash in its title insurance subsidiaries in order to maintain their statutory capital position. As of December 31, 2015, both ITIC and NTIIC met the minimum capital, surplus and reserve requirements for each state in which they are licensed.
As of December 31, 2015, approximately $89,489,000 of the consolidated stockholders’ equity represented net assets of the Company’s subsidiaries that cannot be transferred in the form of dividends, loans or advances to the parent company under statutory regulations without prior approval from the respective state insurance department. These regulations require prior regulatory approval of the payment of dividends and other intercompany transfers. The Company believes, however, that amounts available for transfer from the insurance and other subsidiaries are adequate to meet the Company’s current operating needs.
During 2016, the maximum distributions the insurance subsidiaries can make to the Company without prior approval from applicable regulators total approximately $14,352,000.
While state regulation and the need to cover risks may set a minimum level for capital requirements, other factors necessitate maintaining capital resources in excess of the required minimum amounts. For instance, the Company’s capital resources help it maintain high ratings from insurance company rating agencies. Superior ratings strengthen the Company's ability to compete with larger, well known title insurers with national footprints.
A strong financial position provides necessary flexibility to fund potential acquisition activity, to invest in the Company's core business, and to minimize the financial impact of potential adverse developments. Adverse developments that generally require additional capital include adverse financial results, changes in statutory accounting requirements by regulators, reserve charges, investment losses or costs incurred to adapt to a changing regulatory environment, including costs related to emerging CFPB regulation of the real estate industry.
Historically, the Company's geographical focus has been concentrated in states with premium rates that are typically lower than the national average, contributing to the need to maintain higher levels of capital to accommodate risk exposure beyond the industry average.
Due to the Company’s historical ability to consistently generate positive cash flows from its consolidated operations and investment income, management believes that funds generated from operations will enable the Company to adequately meet its current operating needs for the foreseeable future. However, there can be no assurance that future experience will be similar to historical experience, since it is influenced by such factors as the interest rate environment, real estate activity, the Company’s claims-paying ability and its financial strength ratings. In addition to operational and investment considerations, taking advantage of opportunistic external growth opportunities may necessitate obtaining additional capital resources. The Company is unaware of any trend that is likely to result in material adverse liquidity changes, but continually assesses its capital allocation strategy, including decisions relating to repurchasing the Company’s stock and/or conserving cash.
30
Purchase of Company Stock: On November 9, 2015, the Board of Directors of the Company approved the purchase of an additional 163,335 shares pursuant to the Company’s repurchase plan, such that there was authority remaining under the plan to purchase up to an aggregate of 500,000 shares of the Company’s common stock pursuant to the plan immediately after this approval. Unless terminated earlier by resolution of the Board of Directors, the plan will expire when all shares authorized for purchase under the plan have been purchased. Pursuant to the Company’s ongoing purchase program, the Company has purchased 75,665 shares in the twelve months ended December 31, 2015, 15,372 shares in the twelve months ended December 31, 2014, and 56,223 shares in the twelve months ended December 31, 2013 at an average per share price of $72.48, $68.68 and $75.81, respectively. The Company anticipates making further purchases under this plan from time to time in the future, depending on such factors as the prevailing market price of the Company’s common stock, the Company’s available cash and then existing alternative uses for such cash.
Capital Expenditures: Capital expenditures were approximately $2,743,000, $2,017,000 and $1,424,000 during 2015, 2014 and 2013, respectively. The increases in capital expenditures for 2015 and 2014 compared with 2013 primarily relates to capital improvement projects, including increased investment in a number of technology and system development initiatives and hardware purchases that are anticipated to be funded via cash flows from operations. All material anticipated capital expenditures are subject to periodic review and revision and may vary depending on a number of factors.
Off-Balance Sheet Arrangements
As a service to its customers, the Company, through ITIC, administers escrow and trust deposits representing earnest money received under real estate contracts, undisbursed amounts received for settlement of mortgage loans and indemnities against specific title risks. Cash held by the Company for these purposes was approximately $20,510,000 and $18,674,000 as of December 31, 2015 and 2014, respectively. These amounts are not considered assets of the Company and, therefore, are excluded from the accompanying Consolidated Balance Sheets. However, the Company remains contingently liable for the disposition of these deposits.
In addition, in administering tax-deferred property exchanges, ITEC serves as a qualified intermediary for exchanges, holding the net sales proceeds from relinquished property to be used for purchase of replacement property. ITAC serves as exchange accommodation titleholder and, through limited liability companies that are wholly owned subsidiaries of ITAC, holds property for exchangers in reverse exchange transactions. Like-kind exchange deposits and reverse exchange property held by the Company for the purpose of completing such transactions totaled approximately $171,010,000 and $82,477,000 as of December 31, 2015 and 2014, respectively. These exchange deposits are held at third-party financial institutions. These amounts are not considered assets of the Company for accounting purposes and, therefore, are excluded from the accompanying Consolidated Balance Sheets. Exchange services revenues include earnings on these deposits; therefore, investment income is shown as exchange services revenue, rather than investment income. The Company remains contingently liable to customers for the transfers of property, disbursements of proceeds, and the return on the proceeds at the agreed upon rate.
External assets under management by the Investors Trust Company totaled approximately $440,000,000 for the years ended December 31, 2015 and 2014. These amounts are not considered assets of the Company and, therefore, are excluded from the accompanying Consolidated Balance Sheets.
It is not the general practice of the Company to enter into off-balance sheet arrangements or issue guarantees to third parties. The Company does not have any material source of liquidity or financing that involves off-balance sheet arrangements. Other than items noted above, off-balance sheet arrangements are generally limited to the future payments under noncancelable operating leases and payments due under various agreements with third party service providers.
The following table summarizes the Company’s future estimated cash payments under existing contractual obligations at December 31, 2015, including, payments due by period:
Payments due by period | |||||||||||||||||||
Contractual Obligations Including Off-Balance Sheet Arrangements | Total | Less than 1 year | 1-3 years | 3-5 years | More than 5 years | ||||||||||||||
Operating lease obligations | $ | 1,627,005 | $ | 658,060 | $ | 684,854 | $ | 202,694 | $ | 81,397 | |||||||||
Reserves for claims | 37,788,000 | 6,310,596 | 10,580,640 | 7,179,720 | 13,717,044 | ||||||||||||||
Other obligations | 1,877,477 | 1,252,338 | 501,389 | 123,750 | — | ||||||||||||||
Obligations under executive employment plans and agreements | 8,274,156 | 361,662 | 184,809 | 42,205 | 7,685,480 | ||||||||||||||
Total | $ | 49,566,638 | $ | 8,582,656 | $ | 11,951,692 | $ | 7,548,369 | $ | 21,483,921 | |||||||||
31
As of December 31, 2015, the Company had claims reserves totaling $37,788,000. The amounts and timing of these obligations are estimated and not set contractually. Nonetheless, based on historical insurance claims experience, the Company anticipates the payments shown in the Contractual Obligations table. Events such as fraud, defalcation, and multiple property title defects can substantially and unexpectedly cause increases in both the amount and timing of estimated title insurance loss payments and loss cost trends whereby increases or decreases in inflationary factors (including the value of real estate) will influence the ultimate amount of title insurance loss payments and could increase total obligations and influence claim payout patterns. Due to the length of time over which claim payments are made and regularly occurring changes in underlying economic and market conditions, claim estimates are subject to variability and future payments could increase or decrease from these estimated amounts in the future.
Recently Issued Accounting Standards
In February 2016, the FASB updated guidance to improve financial reporting for leasing transactions. The core principle of the guidance is that lessees will be required to recognize assets and liabilities on the balance sheet for all leases with terms of more than 12 months. A lessee would recognize a liability to make lease payments and a right-of-use asset representing its right to use the underlying asset for the lease term. The accounting applied by a lessor is largely unchanged from current GAAP, with some targeted improvements. Disclosures will be required by lessees and lessors to meet the objective of enabling users of financial statements to assess the amount, timing, and uncertainty of cash flows arising from leases. In transition, both lessees and lessors are required to recognize and measure leases at the beginning of the earliest period presented using a modified retrospective approach. The amendments of this update are effective for fiscal years beginning after December 15, 2018, including interim periods within those fiscal years. The Company is currently evaluating the impact that the recently issued accounting standard will have on the Company's financial position and results of operations, and is currently uncertain as to whether it will have a material effect.
In January 2016, the FASB updated guidance to enhance the reporting model for financial instruments. Among the main principles of the guidance applicable to the Company are provisions to require equity investments, except those accounted for under the equity method of accounting or those that result in consolidation of the investee, to be measured at fair value with changes in fair value recognized in net income; simplify the impairment assessment of equity investments without readily determinable fair values by requiring a qualitative assessment to identify impairment, noting that when a qualitative assessment indicates that impairment exists that an entity is required to measure the investment at fair value; eliminate the requirement to disclose methods and significant assumptions used to estimate the fair value for financial instruments measured at amortized cost; require entities to use the exit price notion when measuring the fair value of financial instruments for disclosure purposes; require separate presentation of financial assets and financial liabilities by measuring category and form of financial asset on the balance sheet or accompanying notes to the financial statements; and clarify that an entity should evaluate the need for a valuation allowance on a deferred tax asset related to available-for-sale securities in combination with the entity’s other deferred tax assets. The amendments of this update are effective for fiscal years beginning after December 15, 2017, including interim periods within those fiscal years. The Company will be required to apply the amendments of this update by means of a cumulative-effect adjustment to the balance sheet as of the beginning of the fiscal year of adoption, with the amendments related to equity securities without readily determinable fair values being applied prospectively to equity investments that exist as of the date of adoption. The guidance is expected to have a material impact on the Company’s financial condition and results of operations once effective, primarily resulting from fluctuations in security exchanges or markets.
In February 2015, the FASB updated guidance to change the analysis that a reporting entity must perform to determine whether it should consolidate certain types of legal entities. All legal entities are subject to reevaluation under the revised consolidation model. Specifically, the amendments: modify the evaluation of whether limited partnerships and similar legal entities are variable interest entities ("VIEs") or voting interest entities; eliminate the presumption that a general partner should consolidate a limited partnership; affect the consolidation analysis of reporting entities that are involved with VIEs, particularly those that have fee arrangements and related party relationships; and provide a scope exception from consolidation guidance for reporting entities that are required to comply with or operate in accordance with certain requirements similar to those for registered money market funds. For public entities, this update becomes effective for annual reporting periods beginning after December 15, 2015, including interim periods within that reporting period. Early adoption is permitted. The Company is currently evaluating the impact that the recently issued accounting standard will have on the Company's financial position and results of operations, but does not expect it to have a material impact.
In May 2014, the FASB updated guidance to improve the comparability of revenue recognition practices for entities that either enter into contracts with customers to transfer goods or services or enter into contracts for the transfer of nonfinancial assets, unless those contracts are within the scope of other standards such as insurance contracts or lease standards. The core principle of the guidance is that an entity should recognize revenue to depict the transfer of promised goods or services to customers in an amount that reflects the consideration to which the entity expects to be entitled in exchange for those goods or services. For public entities, this update originally became effective for interim and annual reporting periods beginning after December 15, 2016. In August 2015, the FASB updated guidance to defer the effective date of the standard by one year. Early adoption is not permitted, although public entities are permitted to elect to adopt the amendments on the original effective date. The Company is currently evaluating the impact
32
that the recently issued accounting standard will have on the Company's financial position and results of operations, but does not expect it to have a material impact.
ITEM 7A. QUANTITATIVE AND QUALITATIVE DISCLOSURES ABOUT MARKET RISK
The Company’s primary exposure to market risk relates to the impact of adverse changes in the fair value of financial instruments as a result of changes in interest rates and equity market prices of its investment portfolio. Increases in interest rates diminish the value of fixed income securities and preferred stock, and decreases in stock market values diminish the value of common stocks held. The fair value of the majority of marketable securities is determined based on quoted market prices.
Although the Company monitors its risks associated with fluctuations in interest rates, it does not currently use derivative financial instruments to hedge these risks.
There were no material changes in the Company’s market risk or market strategy during the year ended December 31, 2015.
Credit Risk
Credit risk is the risk that the Company will incur economic losses due to an issuer’s inability to repay a contractual obligation. The Company’s investment portfolio, primarily municipal and corporate bonds, and to a lesser extent, equity securities, is subject to credit risk. The Company mitigates this risk by actively monitoring changes in credit ratings, security pricing and financial reports.
The Company’s average credit quality for fixed maturity securities is A+, determined by using the using the lower rating reported by the credit reporting agencies.
Interest Rate Risk
Interest rate risk is the risk that the Company will incur economic losses due to adverse changes in interest rates. This risk arises from the Company’s investments in interest-sensitive debt securities. These securities are primarily fixed-rate municipal bonds and corporate bonds. The Company typically does not purchase such securities for trading purposes. At December 31, 2015, the Company had approximately $106.1 million in fixed maturities. The Company manages the interest rate risk inherent in its assets by monitoring its liquidity needs and by targeting a specific range for the portfolio’s duration or weighted average maturity.
To determine the potential effect of interest rate risk on interest-sensitive assets, the Company calculates the effect of a 100 basis point shock in prevailing interest rates (“rate shock”) on the fair market value of these securities considering stated interest rates and time to maturity. Based upon the information and assumptions the Company uses in its calculation, management estimates that a 100 basis point increase in prevailing interest rates would decrease the net fair market value of its fixed-rate debt securities by approximately $5.4 million. The selection of a 100 basis point increase in prevailing interest rates should not be construed as a prediction by the Company’s management of future market events, but rather, to illustrate the potential impact of such an event. To the extent that actual results differ from the assumptions utilized, the Company’s rate shock measures could be significantly impacted. Additionally, the Company’s calculation assumes that the current relationship between short-term and long-term interest rates (the term structure of interest rates) will remain constant over time. As a result, these calculations may not fully capture the impact of nonparallel changes in the term structure of interest rates and/or large changes in interest rates.
Equity Price Risk
The Company also holds investments in marketable equity securities, which exposes it to market volatility, as discussed in Note 3 to the accompanying Consolidated Financial Statements. The sensitivity analysis presented does not consider the effects that such adverse changes may have on overall economic activity, nor does it consider additional actions the Company may take to mitigate its exposure. Equity price risk is the risk that the Company will incur economic losses due to adverse changes in a particular common stock or stock index. The Company had approximately $37.5 million in equity securities at December 31, 2015. Equity price risk is addressed in part by varying the specific allocation of equity investments over time pursuant to management’s assessment of market and business conditions and ongoing liquidity needs analysis. The Company’s equity exposure is a decline in market prices. Based upon the information and assumptions the Company used in its calculation, management estimates that an immediate decrease in market prices of 10% would decrease the net fair value of the Company’s assets identified above by approximately $3.8 million in 2015.
33
The selection of a 10% immediate decrease should not be construed as a prediction by the Company’s management of future market events, but rather, to illustrate the potential impact of such an event. The Company’s exposure will change as a result of changes in its mix of common stocks. Since this calculation is based on historical performance, projecting future price volatility using this method involves an inherent assumption that historical volatility and correlation relationships will remain stable. Therefore, the results noted above may not reflect the Company’s actual experience if future volatility and correlation relationships differ from such historical relationships.
34
ITEM 8. FINANCIAL STATEMENTS AND SUPPLEMENTARY DATA
1. | ||
2. | ||
3. | ||
4. | ||
5. | ||
6. | ||
7. | ||
8. | ||
9. | ||
The financial statement schedules meeting the requirements of Regulation S-X are attached hereto as Schedules I, II, III, IV and V.
Selected Quarterly Financial Data (unaudited)
2015 | March 31 | June 30 | September 30 | December 31 | |||||||||||
Net premiums written | $ | 24,962,041 | $ | 30,464,581 | $ | 30,945,532 | $ | 26,103,532 | |||||||
Net income | 1,726,124 | 4,120,497 | 4,495,498 | 2,206,934 | |||||||||||
Net income attributable to the Company | 1,726,124 | 4,120,497 | 4,490,962 | 2,196,322 | |||||||||||
Basic earnings per common share | 0.86 | 2.06 | 2.28 | 1.13 | |||||||||||
Diluted earnings per common share | 0.86 | 2.05 | 2.28 | 1.12 | |||||||||||
2014 | March 31 | June 30 | September 30 | December 31 | |||||||||||
Net premiums written | $ | 24,909,252 | $ | 29,849,853 | $ | 26,356,835 | $ | 28,847,616 | |||||||
Net income | 985,515 | 3,398,044 | 2,594,490 | 2,694,449 | |||||||||||
Net income attributable to the Company | 986,438 | 3,373,598 | 2,594,490 | 2,694,449 | |||||||||||
Basic earnings per common share | 0.48 | 1.66 | 1.28 | 1.33 | |||||||||||
Diluted earnings per common share | 0.48 | 1.65 | 1.28 | 1.33 | |||||||||||
2013 | March 31 | June 30 | September 30 | December 31 | |||||||||||
Net premiums written | $ | 23,925,997 | $ | 30,429,761 | $ | 30,431,560 | $ | 29,098,948 | |||||||
Net income | 3,386,418 | 4,024,050 | 5,543,523 | 1,842,747 | |||||||||||
Net income attributable to the Company | 3,376,730 | 4,005,675 | 5,515,798 | 1,810,007 | |||||||||||
Basic earnings per common share | 1.65 | 1.94 | 2.67 | 0.88 | |||||||||||
Diluted earnings per common share | 1.62 | 1.92 | 2.66 | 0.88 | |||||||||||
35
Report of Independent Registered Public Accounting Firm
To the Board of Directors and Stockholders
Investors Title Company
Chapel Hill, North Carolina
We have audited the accompanying consolidated balance sheets of Investors Title Company and subsidiaries (the Company) as of December 31, 2015 and 2014, and the related consolidated statements of income, comprehensive income, stockholders’ equity and cash flows for each of the years in the three-year period ended December 31, 2015. Our audits also included the financial statement schedules listed in the Index at Item 15(a)(2). These financial statements and schedules are the responsibility of the Company’s management. Our responsibility is to express an opinion on these financial statements and schedules based on our audits.
We conducted our audits in accordance with the standards of the Public Company Accounting Oversight Board (United States). Those standards require that we plan and perform the audit to obtain reasonable assurance about whether the financial statements are free of material misstatement. An audit includes examining, on a test basis, evidence supporting the amounts and disclosures in the financial statements. An audit also includes assessing the accounting principles used and significant estimates made by management, as well as evaluating the overall financial statement presentation. We believe that our audits provide a reasonable basis for our opinion.
In our opinion, the financial statements referred to above present fairly, in all material respects, the consolidated financial position of the Company as of December 31, 2015 and 2014, and the consolidated results of their operations and their cash flows for each of the years in the three-year period ended December 31, 2015, in conformity with accounting principles generally accepted in the United States of America. Also, in our opinion, the related financial statement schedules, when considered in relation to the basic financial statements taken as a whole, present fairly, in all material respects, the information set forth therein.
We also have audited, in accordance with the standards of the Public Company Accounting Oversight Board (United States), the effectiveness of the Company’s internal control over financial reporting as of December 31, 2015, based on criteria established in Internal Control-Integrated Framework (2013) issued by the Committee of Sponsoring Organizations of the Treadway Commission, and our report dated March 11, 2016, expressed an unqualified opinion thereon.
/s/ Dixon Hughes Goodman LLP
High Point, North Carolina
March 11, 2016
36
MANAGEMENT’S REPORT ON INTERNAL CONTROL OVER FINANCIAL REPORTING
Management of Investors Title Company and Subsidiaries is responsible for establishing and maintaining adequate internal control over financial reporting, as such term is defined in the Exchange Act Rules 13a-15(f) and 15(d)-15(f). The Company’s internal control over financial reporting has been designed to provide reasonable assurance regarding the reliability of the Company’s financial reporting and the preparation of published financial statements in accordance with generally accepted accounting principles.
The Company’s internal control over financial reporting includes policies and procedures that (1) pertain to the maintenance of records that, in reasonable detail, accurately and fairly reflect transactions and dispositions of assets of the Company; (2) provide reasonable assurance that transactions are recorded as necessary to permit preparation of financial statements in accordance with accounting principles generally accepted in the United States of America, and that receipts and expenditures are being made only in accordance with authorization of management and directors of the Company; and (3) provide reasonable assurance regarding prevention or timely detection of unauthorized acquisition, use or disposition of the Company’s assets that could have a material effect on the Company’s Consolidated Financial Statements.
Because of its inherent limitation, internal control over financial reporting may not prevent or detect misstatements. Also, projections of any evaluation of effectiveness to future periods are subject to the risk that controls may become inadequate because of changes in conditions, or that the degree of compliance with policies or procedures may deteriorate.
Management conducted an evaluation of the effectiveness of the Company’s internal control over financial reporting based on the framework in Internal Control-Integrated Framework (2013) issued by the Committee of Sponsoring Organizations of the Treadway Commission (“COSO”) and concluded that the Company’s internal control over financial reporting was effective as of December 31, 2015.
37
Report of Independent Registered Public Accounting Firm
To the Board of Directors and Stockholders
Investors Title Company
Chapel Hill, North Carolina
We have audited Investors Title Company’s (the Company) internal control over financial reporting as of December 31, 2015, based on criteria established in Internal Control-Integrated Framework (2013) issued by the Committee of Sponsoring Organizations of the Treadway Commission (COSO). The Company’s management is responsible for maintaining effective internal control over financial reporting and for its assessment of the effectiveness of internal control over financial reporting, included in the accompanying Management’s Report on Internal Control Over Financial Reporting. Our responsibility is to express an opinion on the Company’s internal control over financial reporting based on our audit.
We conducted our audit in accordance with the standards of the Public Company Accounting Oversight Board (United States). Those standards require that we plan and perform the audit to obtain reasonable assurance about whether effective internal control over financial reporting was maintained in all material respects. Our audit included obtaining an understanding of internal control over financial reporting, assessing the risk that a material weakness exists, and testing and evaluating the design and operating effectiveness of internal control based on the assessed risk. Our audit also included performing such other procedures as we considered necessary in the circumstances. We believe that our audit provides a reasonable basis for our opinion.
A company's internal control over financial reporting is a process designed to provide reasonable assurance regarding the reliability of financial reporting and the preparation of financial statements for external purposes in accordance with generally accepted accounting principles. A company's internal control over financial reporting includes those policies and procedures that (1) pertain to the maintenance of records that, in reasonable detail, accurately and fairly reflect the transactions and dispositions of the assets of the company; (2) provide reasonable assurance that transactions are recorded as necessary to permit preparation of financial statements in accordance with generally accepted accounting principles, and that receipts and expenditures of the company are being made only in accordance with authorizations of management and directors of the company; and (3) provide reasonable assurance regarding prevention or timely detection of unauthorized acquisition, use, or disposition of the company's assets that could have a material effect on the financial statements.
Because of its inherent limitations, internal control over financial reporting may not prevent or detect misstatements. Also, projections of any evaluation of effectiveness to future periods are subject to the risk that controls may become inadequate because of changes in conditions, or that the degree of compliance with the policies or procedures may deteriorate.
38
To the Board of Directors and Stockholders
Investors Title Company
March 11, 2016
Page 2
In our opinion, the Company maintained, in all material respects, effective internal control over financial reporting as of December 31, 2015, based on criteria established in Internal Control-Integrated Framework (2013) issued by the Committee of Sponsoring Organizations of the Treadway Commission (COSO).
We also have audited, in accordance with the standards of the Public Company Accounting Oversight Board (United States), the consolidated financial statements of the Company as of December 31, 2015 and 2014, and for each of the years in the three-year period ended December 31, 2015, and our report dated March 11, 2016, expressed an unqualified opinion on those consolidated financial statements.
/s/ Dixon Hughes Goodman LLP
High Point, North Carolina
March 11, 2016
39
Investors Title Company and Subsidiaries
Consolidated Balance Sheets
As of December 31, | 2015 | 2014 | |||||
Assets: | |||||||
Investments in securities: | |||||||
Fixed maturities, available-for-sale, at fair value (amortized cost: 2015: $102,015,826; 2014: $104,421,050) | $ | 106,066,384 | $ | 109,048,290 | |||
Equity securities, available-for-sale, at fair value (cost: 2015: $23,855,873; 2014: $24,128,753) | 37,513,464 | 39,254,981 | |||||
Short-term investments | 6,865,406 | 2,576,993 | |||||
Other investments | 10,106,828 | 8,530,929 | |||||
Total investments | 160,552,082 | 159,411,193 | |||||
Cash and cash equivalents | 21,790,068 | 15,826,515 | |||||
Premium and fees receivable | 8,392,697 | 8,544,183 | |||||
Accrued interest and dividends | 1,004,126 | 1,063,837 | |||||
Prepaid expenses and other assets | 12,634,105 | 7,732,677 | |||||
Property, net | 7,148,951 | 5,460,805 | |||||
Total Assets | $ | 211,522,029 | $ | 198,039,210 | |||
Liabilities and Stockholders’ Equity | |||||||
Liabilities: | |||||||
Reserves for claims | $ | 37,788,000 | $ | 36,677,000 | |||
Accounts payable and accrued liabilities | 25,043,588 | 18,290,819 | |||||
Current income taxes payable | 210,355 | 92,192 | |||||
Deferred income taxes, net | 5,703,006 | 5,415,493 | |||||
Total liabilities | 68,744,949 | 60,475,504 | |||||
Commitments and Contingencies | — | — | |||||
Stockholders’ Equity: | |||||||
Preferred stock (1,000,000 authorized shares; no shares issued) | — | — | |||||
Common stock – no par value (10,000,000 authorized shares; 1,949,797 and 2,023,270 shares issued and outstanding 2015 and 2014, respectively, excluding 291,676 shares for 2015 and 2014 of common stock held by the Company’s subsidiary) | 1 | 1 | |||||
Retained earnings | 131,186,866 | 124,707,196 | |||||
Accumulated other comprehensive income | 11,483,015 | 12,856,509 | |||||
Total stockholders’ equity attributable to the Company | 142,669,882 | 137,563,706 | |||||
Noncontrolling interests | 107,198 | — | |||||
Total stockholders’ equity | $ | 142,777,080 | $ | 137,563,706 | |||
Total Liabilities and Stockholders’ Equity | $ | 211,522,029 | $ | 198,039,210 | |||
See notes to the Consolidated Financial Statements.
40
Investors Title Company and Subsidiaries
Consolidated Statements of Income
For the Years Ended December 31, | 2015 | 2014 | 2013 | |||||||||
Revenues: | ||||||||||||
Net premiums written | $ | 112,475,686 | $ | 109,963,556 | $ | 113,886,266 | ||||||
Investment income – interest and dividends | 4,531,319 | 4,259,501 | 3,894,608 | |||||||||
Net realized (loss) gain on investments | (116,163 | ) | 268,294 | 195,800 | ||||||||
Other | 10,309,230 | 8,627,935 | 8,274,823 | |||||||||
Total Revenues | 127,200,072 | 123,119,286 | 126,251,497 | |||||||||
Operating Expenses: | ||||||||||||
Commissions to agents | 62,174,301 | 65,632,353 | 67,150,810 | |||||||||
Provision (benefit) for claims | 4,478,494 | 5,229,716 | (571,596 | ) | ||||||||
Salaries, employee benefits and payroll taxes | 28,041,213 | 25,218,225 | 25,386,511 | |||||||||
Office occupancy and operations | 5,885,336 | 5,049,962 | 4,430,220 | |||||||||
Business development | 2,373,270 | 2,333,491 | 2,145,639 | |||||||||
Filing fees, franchise and local taxes | 732,985 | 817,909 | 681,935 | |||||||||
Premium and retaliatory taxes | 2,161,571 | 1,851,767 | 2,558,227 | |||||||||
Professional and contract labor fees | 2,691,411 | 2,676,483 | 2,171,606 | |||||||||
Other | 884,438 | 820,882 | 755,407 | |||||||||
Total Operating Expenses | 109,423,019 | 109,630,788 | 104,708,759 | |||||||||
Income before Income Taxes | 17,777,053 | 13,488,498 | 21,542,738 | |||||||||
Provision for Income Taxes | 5,228,000 | 3,816,000 | 6,746,000 | |||||||||
Net Income | 12,549,053 | 9,672,498 | 14,796,738 | |||||||||
Net Income Attributable to Noncontrolling Interests | (15,148 | ) | (23,523 | ) | (88,528 | ) | ||||||
Net Income Attributable to the Company | $ | 12,533,905 | $ | 9,648,975 | $ | 14,708,210 | ||||||
Basic Earnings per Common Share | $ | 6.32 | $ | 4.75 | $ | 7.15 | ||||||
Weighted Average Shares Outstanding – Basic | 1,984,360 | 2,031,760 | 2,056,169 | |||||||||
Diluted Earnings per Common Share | $ | 6.30 | $ | 4.74 | $ | 7.08 | ||||||
Weighted Average Shares Outstanding – Diluted | 1,989,799 | 2,037,534 | 2,076,628 | |||||||||
Cash Dividends Paid per Common Share | $ | 0.40 | $ | 0.32 | $ | 0.32 | ||||||
See notes to the Consolidated Financial Statements.
41
Investors Title Company and Subsidiaries
Consolidated Statements of Comprehensive Income
For the Years Ended December 31, | 2015 | 2014 | 2013 | |||||||||
Net income | $ | 12,549,053 | $ | 9,672,498 | $ | 14,796,738 | ||||||
Other comprehensive (loss) income, before tax: | ||||||||||||
Amortization (accretion) related to prior year service cost | 4,390 | 2,217 | (1,518 | ) | ||||||||
Amortization of unrecognized loss | 3,514 | — | 6,293 | |||||||||
Accumulated postretirement (benefit) provision obligation adjustment | (63,566 | ) | (47,121 | ) | 77,213 | |||||||
Unrealized (losses) gains on investments arising during the period | (2,077,542 | ) | 2,848,256 | 3,959,623 | ||||||||
Reclassification adjustment for sale of securities included in net income | (718,837 | ) | (518,279 | ) | (229,869 | ) | ||||||
Reclassification adjustment for write-down of securities included in net income | 751,059 | 14,542 | 34,070 | |||||||||
Other comprehensive (loss) income, before tax | (2,100,982 | ) | 2,299,615 | 3,845,812 | ||||||||
Income tax (benefit) expense related to postretirement health benefits | (18,924 | ) | (15,269 | ) | 27,887 | |||||||
Income tax (benefit) expense related to unrealized (losses) gains on investments arising during the year | (722,226 | ) | 974,145 | 1,354,439 | ||||||||
Income tax benefit related to reclassification adjustment for sale of securities included in net income | (245,200 | ) | (173,403 | ) | (78,622 | ) | ||||||
Income tax expense related to reclassification adjustment for write-down of securities included in net income | 258,862 | 5,037 | 13,134 | |||||||||
Net income tax (benefit) expense on other comprehensive (loss) income | (727,488 | ) | 790,510 | 1,316,838 | ||||||||
Other comprehensive (loss) income | (1,373,494 | ) | 1,509,105 | 2,528,974 | ||||||||
Comprehensive Income | $ | 11,175,559 | $ | 11,181,603 | $ | 17,325,712 | ||||||
Less: Comprehensive income attributable to noncontrolling interests | (15,148 | ) | (23,523 | ) | (88,528 | ) | ||||||
Comprehensive Income Attributable to the Company | $ | 11,160,411 | $ | 11,158,080 | $ | 17,237,184 | ||||||
See notes to the Consolidated Financial Statements.
42
Investors Title Company and Subsidiaries
Consolidated Statements of Stockholders’ Equity
Common Stock | Retained Earnings | Accumulated Other Comprehensive Income | Noncontrolling Interests | Total Stockholders’ Equity | ||||||||||||||||||
Shares | Amount | |||||||||||||||||||||
Balance, January 1, 2013 | 2,043,359 | $ | 1 | $ | 105,820,459 | $ | 8,818,430 | $ | — | $ | 114,638,890 | |||||||||||
Net income attributable to the Company | 14,708,210 | 14,708,210 | ||||||||||||||||||||
Dividends ($0.32 per share) | (657,914 | ) | (657,914 | ) | ||||||||||||||||||
Shares of common stock repurchased and retired | (56,223 | ) | (4,262,260 | ) | (4,262,260 | ) | ||||||||||||||||
Stock options and stock appreciation rights exercised | 49,999 | 75,797 | 75,797 | |||||||||||||||||||
Share-based compensation expense | 83,852 | 83,852 | ||||||||||||||||||||
Amortization related to postretirement health benefits | 3,140 | 3,140 | ||||||||||||||||||||
Accumulated postretirement benefit obligation adjustment | 50,961 | 50,961 | ||||||||||||||||||||
Net unrealized gain on investments | 2,474,873 | 2,474,873 | ||||||||||||||||||||
Income tax benefit from share-based compensation | 946,605 | 946,605 | ||||||||||||||||||||
Balance, December 31, 2013 | 2,037,135 | $ | 1 | $ | 116,714,749 | $ | 11,347,404 | $ | — | $ | 128,062,154 | |||||||||||
Net income attributable to the Company | 9,648,975 | 9,648,975 | ||||||||||||||||||||
Dividends ($0.32 per share) | (650,433 | ) | (650,433 | ) | ||||||||||||||||||
Shares of common stock repurchased and retired | (15,372 | ) | (1,055,765 | ) | (1,055,765 | ) | ||||||||||||||||
Stock options and stock appreciation rights exercised | 1,507 | 27,100 | 27,100 | |||||||||||||||||||
Share-based compensation expense | 120,891 | 120,891 | ||||||||||||||||||||
Amortization related to postretirement health benefits | 1,465 | 1,465 | ||||||||||||||||||||
Accumulated postretirement benefit obligation adjustment | (31,100 | ) | (31,100 | ) | ||||||||||||||||||
Net unrealized gain on investments | 1,538,740 | 1,538,740 | ||||||||||||||||||||
Purchase of redeemable noncontrolling interest of subsidiary | (114,320 | ) | (114,320 | ) | ||||||||||||||||||
Income tax benefit from share-based compensation | 15,999 | 15,999 | ||||||||||||||||||||
Balance, December 31, 2014 | 2,023,270 | $ | 1 | $ | 124,707,196 | $ | 12,856,509 | $ | — | $ | 137,563,706 | |||||||||||
Net income attributable to the Company | 12,533,905 | 12,533,905 | ||||||||||||||||||||
Dividends ($0.40 per share) | (789,907 | ) | (789,907 | ) | ||||||||||||||||||
Shares of common stock repurchased and retired | (75,665 | ) | (5,483,953 | ) | (5,483,953 | ) | ||||||||||||||||
Stock options and stock appreciation rights exercised | 2,192 | 54,988 | 54,988 | |||||||||||||||||||
Share-based compensation expense | 137,762 | 137,762 | ||||||||||||||||||||
Amortization related to postretirement health benefits | 5,216 | 5,216 | ||||||||||||||||||||
Accumulated postretirement benefit obligation adjustment | (41,954 | ) | (41,954 | ) | ||||||||||||||||||
Net unrealized loss on investments | (1,336,756 | ) | (1,336,756 | ) | ||||||||||||||||||
Net effect changes of ownership | 127,050 | 127,050 | ||||||||||||||||||||
Subsidiary return of capital | (35,000 | ) | (35,000 | ) | ||||||||||||||||||
Net income attributable to noncontrolling interests | 15,148 | 15,148 | ||||||||||||||||||||
Income tax benefit from share-based compensation | 26,875 | 26,875 | ||||||||||||||||||||
Balance, December 31, 2015 | 1,949,797 | $ | 1 | $ | 131,186,866 | $ | 11,483,015 | $ | 107,198 | $ | 142,777,080 | |||||||||||
See notes to the Consolidated Financial Statements.
43
Investors Title Company and Subsidiaries
Consolidated Statements of Cash Flows
For the Years Ended December 31, | 2015 | 2014 | 2013 | ||||||||
Operating Activities | |||||||||||
Net income | $ | 12,549,053 | $ | 9,672,498 | $ | 14,796,738 | |||||
Adjustments to reconcile net income to net cash provided by operating activities: | |||||||||||
Depreciation | 1,105,839 | 833,104 | 669,727 | ||||||||
Amortization, net | 728,510 | 630,782 | 507,111 | ||||||||
Amortization related to postretirement benefits obligation | 7,904 | 2,217 | 4,765 | ||||||||
Share-based compensation expense related to stock options | 137,762 | 120,891 | 83,852 | ||||||||
Net (gain) loss on disposals of property | (24,867 | ) | 24,608 | 7,831 | |||||||
Net realized loss (gain) on investments | 116,163 | (268,294 | ) | (195,800 | ) | ||||||
Net earnings from other investments | (2,002,276 | ) | (1,450,980 | ) | (1,257,266 | ) | |||||
Provision (benefit) for claims | 4,478,494 | 5,229,716 | (571,596 | ) | |||||||
Provision for deferred income taxes | 1,015,000 | 611,000 | 1,804,000 | ||||||||
Changes in assets and liabilities: | |||||||||||
Decrease in receivables | 217,594 | 206,041 | 2,287,489 | ||||||||
Increase in other assets | (4,879,418 | ) | (393,359 | ) | (2,906,224 | ) | |||||
Decrease (increase) in current income taxes recoverable | — | 366,772 | (366,772 | ) | |||||||
Increase (decrease) in accounts payable and accrued liabilities | 6,689,204 | (2,080,492 | ) | 4,923,858 | |||||||
Increase (decrease) in current income taxes payable | 118,163 | 92,192 | (1,336,824 | ) | |||||||
Payments of claims, net of recoveries | (3,367,494 | ) | (3,912,716 | ) | (3,146,404 | ) | |||||
Net cash provided by operating activities | 16,889,631 | 9,683,980 | 15,304,485 | ||||||||
Investing Activities | |||||||||||
Purchases of available-for-sale securities | (20,164,353 | ) | (30,899,452 | ) | (23,466,037 | ) | |||||
Purchases of short-term securities | (4,593,240 | ) | (911,188 | ) | (2,638,908 | ) | |||||
Purchases of other investments | (3,717,978 | ) | (1,689,950 | ) | (1,369,210 | ) | |||||
Investment in/purchase of subsidiary | (72,600 | ) | — | — | |||||||
Proceeds from sales and maturities of available-for-sale securities | 22,151,408 | 12,472,817 | 9,892,634 | ||||||||
Proceeds from sales and maturities of short-term securities | 304,827 | 6,260,568 | 8,280,183 | ||||||||
Proceeds from sales and distributions of other investments | 3,911,286 | 1,584,337 | 2,107,675 | ||||||||
Proceeds from sales of other assets | 149,128 | 38,052 | 40,366 | ||||||||
Purchase of redeemable noncontrolling interest of subsidiary | — | (515,275 | ) | — | |||||||
Purchases of property, equipment and software | (2,742,619 | ) | (2,017,379 | ) | (1,424,108 | ) | |||||
Proceeds from disposals of property | 75,060 | 24,400 | 24,335 | ||||||||
Net cash used in investing activities | (4,699,081 | ) | (15,653,070 | ) | (8,553,070 | ) | |||||
Financing Activities | |||||||||||
Repurchases of common stock | (5,483,953 | ) | (1,055,765 | ) | (4,262,260 | ) | |||||
Exercise of options | 54,988 | 27,100 | 75,797 | ||||||||
Distribution to noncontrolling interest | — | (168,057 | ) | (36,900 | ) | ||||||
Subsidiary return of capital | (35,000 | ) | — | — | |||||||
Excess tax benefits related to exercise of stock options and SARs | 26,875 | 15,999 | 946,605 | ||||||||
Dividends paid | (789,907 | ) | (650,433 | ) | (657,914 | ) | |||||
Net cash used in financing activities | (6,226,997 | ) | (1,831,156 | ) | (3,934,672 | ) | |||||
Net Increase (Decrease) in Cash and Cash Equivalents | 5,963,553 | (7,800,246 | ) | 2,816,743 | |||||||
Cash and Cash Equivalents, Beginning of Period | 15,826,515 | 23,626,761 | 20,810,018 | ||||||||
Cash and Cash Equivalents, End of Period | $ | 21,790,068 | $ | 15,826,515 | $ | 23,626,761 | |||||
44
Consolidated Statements of Cash Flows, continued | |||||||||||
2015 | 2014 | 2013 | |||||||||
Supplemental Disclosures: | |||||||||||
Cash Paid During the Year for: | |||||||||||
Income tax payments, net | $ | 4,658,000 | $ | 2,744,100 | $ | 5,724,000 | |||||
Non Cash Investing and Financing Activities | |||||||||||
Non cash net unrealized loss (gain) on investments, net of deferred tax benefit (provision) of $708,564, $(805,779) and $(1,288,951) for 2015, 2014 and 2013, respectively | $ | 1,336,756 | $ | (1,538,740 | ) | $ | (2,474,873 | ) | |||
Adjustments to postretirement benefits obligation, net of deferred tax benefit (provision) of $21,612, $16,021 and $(26,252) for 2015, 2014 and 2013, respectively | $ | 41,954 | $ | 31,100 | $ | (50,961 | ) | ||||
See notes to the Consolidated Financial Statements.
45
Investors Title Company and Subsidiaries
Notes to Consolidated Financial Statements
1. Basis of Presentation and Summary of Significant Accounting Policies
Description of Business – Investors Title Company’s (the “Company”) primary business, and only reportable segment, is title insurance. The title insurance segment, through its two subsidiaries, Investors Title Insurance Company (“ITIC”) and National Investors Title Insurance Company (“NITIC”), is licensed to insure titles to residential, institutional, commercial and industrial properties. The Company issues title insurance policies primarily through approved attorneys from underwriting offices and through independent issuing agents in 22 states and the District of Columbia, primarily in the eastern half of the United States. The majority of the Company’s business is concentrated in Georgia, Michigan, North Carolina, South Carolina, Texas and Virginia.
Principles of Consolidation and Basis of Presentation – The accompanying Consolidated Financial Statements include the accounts and operations of Investors Title Company and its subsidiaries, and have been prepared in accordance with accounting principles generally accepted in the United States (“GAAP”). Earnings attributable to noncontrolling interests in majority-owned insurance agencies, including redeemable noncontrolling interests, are recorded in the Consolidated Statements of Income. Noncontrolling interests representing the portion of equity not related to the Company's ownership interests are recorded in separate sections of the Consolidated Balance Sheets. All intercompany balances and transactions have been eliminated in consolidation.
Significant Accounting Policies – The significant accounting policies of the Company are summarized below.
Cash and Cash Equivalents
For the purpose of presentation in the Company’s Consolidated Statements of Cash Flows, cash equivalents are highly liquid instruments with remaining original maturities of three months or less. The carrying amount of cash and cash equivalents is a reasonable estimate of fair value due to the short-term maturity at purchase of these instruments.
Investments in Securities
Securities for which the Company has the intent and ability to hold to maturity are classified as held-to-maturity and reported at cost, adjusted for amortization of premiums or accretion of discounts, and other-than-temporary declines in fair value. Securities held principally for resale in the near term are classified as trading securities and recorded at fair values. Realized and unrealized gains and losses on trading securities are included in other income. Securities not classified as either trading or held-to-maturity are classified as available-for-sale and reported at fair value with unrealized gains and losses, net of tax and adjusted for other-than-temporary declines in fair value, reported as accumulated other comprehensive income. As of December 31, 2015 and 2014, all investments in securities are classified as available-for-sale. Securities are regularly reviewed for differences between the cost and estimated fair value of each security for factors that may indicate that a decline in fair value is other-than-temporary. Some factors considered in evaluating whether or not a decline in fair value is other-than-temporary include the duration and extent to which the fair value has been less than cost and the Company’s ability and intent to retain the investment for a period of time sufficient to allow for a recovery in value. Such reviews are inherently uncertain and the value of the investment may not fully recover or may decline in future periods resulting in a realized loss. Fair values of the majority of investments are based on quoted market prices. Realized gains and losses are determined on the specific identification method. Refer to Note 3 for further information regarding investments in securities and fair value.
Short-term Investments
Short-term investments are comprised of money market accounts which are invested in short-term funds, time deposits with banks and savings and loan associations, and other investments expected to have maturities or redemptions greater than three months and less than twelve months. The Company monitors any events or changes in circumstances that may have a significant adverse effect on the fair value of these investments.
46
Other Investments
Other investments consist primarily of investments in title insurance agencies structured as limited liability companies (“LLCs”), which are accounted for under the equity or cost methods of accounting. The aggregate cost of the Company’s cost method investments totaled $3,572,914 and $2,423,408 at December 31, 2015 and 2014, respectively. The Company monitors any events or changes in circumstances that may have had a significant adverse effect on the fair value of these investments and makes any necessary adjustments.
Property Acquired in Settlement of Claims
Property acquired in settlement of claims is held for sale and valued at the lower of cost or market. Adjustments to reported estimated realizable values and realized gains or losses on dispositions are recorded as increases or decreases in claim costs. Properties acquired in settlement of claims are included in prepaid expenses and other assets in the Consolidated Balance Sheets.
Property and Equipment
Property and equipment are recorded at cost and are depreciated principally under the straight-line method over the estimated useful lives (3 to 25 years) of the respective assets. Maintenance and repairs are charged to operating expenses and improvements are capitalized.
Reserves for Claims
Total reserves for all reported and unreported losses the Company incurred through December 31, 2015 are represented by the reserves for claims. The Company’s reserves for unpaid losses and loss adjustment expenses are established using estimated amounts required to settle claims for which notice has been received (reported) and the amount estimated to be required to satisfy incurred claims of policyholders which may be reported in the future. Despite the variability of such estimates, management believes that the reserves are adequate to cover claim losses resulting from pending and future claims for policies issued through December 31, 2015. The Company continually reviews and adjusts its reserve estimates as necessary to reflect its loss experience and any new information that becomes available. Adjustments resulting from such reviews may be significant.
Claims and losses paid are charged to the reserves for claims. Although claims losses are typically paid in cash, occasionally claims are settled by purchasing the interest of the insured or the claimant in the real property. When this event occurs, the acquiring company carries assets at the lower of cost or estimated realizable value, net of any indebtedness on the property.
Income Taxes
The Company makes certain estimates and judgments in determining income tax expense (benefit) for financial statement purposes. These estimates and judgments occur in the calculation of certain tax assets and liabilities which arise from differences in the timing of recognition of revenue and expense for tax and financial statement purposes. The Company provides for deferred income taxes (benefits) for the tax consequences in future years of temporary differences between the financial statements’ carrying values and the tax bases of assets and liabilities using currently enacted tax rates. The Company establishes a valuation allowance if it believes that it is more likely than not that some or all of its deferred tax assets will not be realized. Refer to Note 8 for further information regarding income taxes.
Premiums Written and Commissions to Agents
Generally, title insurance premiums are recognized at the time of closing of the related real estate transaction, as the earnings process is then considered complete. Policies or commitments are issued upon receipt of final certificates or preliminary reports with respect to titles. Title insurance commissions earned by the Company’s agents, taxes and a provision for claims losses are recognized as expenses concurrent with recognition of related premium revenue.
Allowance for Doubtful Accounts
Company management continually evaluates the collectability of receivables and provides an allowance for doubtful accounts equal to estimated losses expected to be incurred in the collection of premiums and fees receivable. Changes to the allowance for doubtful accounts are reflected within net premiums written in the Consolidated Statements of Income. Amounts are charged off in the period they are deemed to be uncollectible.
Quarterly, the Company evaluates the collectability of receivables. Premiums not collected within 7 months are fully reserved. Write-offs of receivables have not been material to the Company.
47
Exchange Services Revenue
Fees are recognized at the signing of a binding agreement and investment earnings are recognized as they are earned. Exchange services revenues are included in other revenues in the Consolidated Statements of Income.
Fair Values of Financial Instruments
The carrying amounts reported in the Consolidated Balance Sheets for cash and cash equivalents, short-term investments, premium and fees receivable, accrued interest and dividends, accounts payable, commissions payable, reinsurance payable and current income taxes recoverable/payable approximate fair value due to the short-term nature of these assets and liabilities. Estimated fair values for the majority of investment securities are based on quoted market prices. Auction rate securities (“ARS”) are valued using discounted cash flow models to determine the estimated fair value of these investments. Some of the inputs for determining the fair value of ARS are unobservable in the securities markets and are significant. Refer to Note 3 for further information regarding investments in securities and fair value.
Comprehensive Income
The Company’s accumulated other comprehensive income is comprised of unrealized holding gains/losses on available-for-sale securities, net of tax, and unrecognized prior service cost and unrealized gains/losses associated with postretirement benefit liabilities, net of tax. Accumulated other comprehensive income as of December 31, 2015 consists of $11,597,741 of unrealized holding gains on available-for-sale securities and $114,726 of unrecognized prior service cost and unrecognized actuarial losses associated with postretirement benefit liabilities. Accumulated other comprehensive income as of December 31, 2014 consists of $12,934,497 of unrealized holding gains on available-for-sale securities and $77,988 of unrecognized prior service cost and unrecognized actuarial losses associated with postretirement benefit liabilities. Accumulated other comprehensive income as of December 31, 2013 consists of $11,395,757 of unrealized holding gains on available-for-sale securities and $48,353 of unrecognized prior service cost and unrecognized actuarial losses associated with postretirement benefit liabilities.
Share-Based Compensation
The Company accounts for share-based compensation in accordance with the fair value based principles required by the Financial Accounting Standards Board (“FASB”). Share-based compensation cost is generally measured at the grant date, based on the estimated fair value of the award, and is recognized as an expense over the employee’s requisite service period.
As the share-based compensation expense recognized in the Consolidated Statements of Income is based on awards ultimately expected to vest, it has been reduced for estimated forfeitures. Forfeitures are estimated at the time of grant and revised, if necessary, in subsequent periods if actual forfeitures differ from those estimates.
Other Intangible Assets
The Company’s other intangible assets consist of a non-compete agreement and referral relationships resulting from an agency acquisition and are recorded at the acquisition date fair value. The referral relationships are amortized on a straight-line basis over the useful life and amortization of the non-compete contract will start at a future date when the related employment agreement is terminated. Intangible assets are reviewed for impairment at least quarterly.
Subsequent Events
The Company has evaluated and concluded that there were no material subsequent events requiring adjustment or disclosure to its Consolidated Financial Statements.
Recently Issued Accounting Standards
In February 2016, the FASB updated guidance to improve financial reporting for leasing transactions. The core principle of the guidance is that lessees will be required to recognize assets and liabilities on the balance sheet for all leases with terms of more than 12 months. A lessee would recognize a liability to make lease payments and a right-of-use asset representing its right to use the underlying asset for the lease term. The accounting applied by a lessor is largely unchanged from current GAAP, with some targeted improvements. Disclosures will be required by lessees and lessors to meet the objective of enabling users of financial statements to assess the amount, timing, and uncertainty of cash flows arising from leases. In transition, both lessees and lessors are required to recognize and measure leases at the beginning of the earliest period presented using a modified retrospective approach. The amendments of this update are effective for fiscal years beginning after December 15, 2018, including interim periods within those fiscal years. The Company is currently evaluating the impact that the recently issued accounting standard will have on the Company's financial position and results of operations, and is currently uncertain as to whether it will have a material effect.
48
In January 2016, the FASB updated guidance to enhance the reporting model for financial instruments. Among the main principles of the guidance applicable to the Company are provisions to require equity investments, except those accounted for under the equity method of accounting or those that result in consolidation of the investee, to be measured at fair value with changes in fair value recognized in net income; simplify the impairment assessment of equity investments without readily determinable fair values by requiring a qualitative assessment to identify impairment, noting that when a qualitative assessment indicates that impairment exists that an entity is required to measure the investment at fair value; eliminate the requirement to disclose methods and significant assumptions used to estimate the fair value for financial instruments measured at amortized cost; require entities to use the exit price notion when measuring the fair value of financial instruments for disclosure purposes; require separate presentation of financial assets and financial liabilities by measuring category and form of financial asset on the balance sheet or accompanying notes to the financial statements; and clarify that an entity should evaluate the need for a valuation allowance on a deferred tax asset related to available-for-sale securities in combination with the entity’s other deferred tax assets. The amendments of this update are effective for fiscal years beginning after December 15, 2017, including interim periods within those fiscal years. The Company will be required to apply the amendments of this update by means of a cumulative-effect adjustment to the balance sheet as of the beginning of the fiscal year of adoption, with the amendments related to equity securities without readily determinable fair values being applied prospectively to equity investments that exist as of the date of adoption. The guidance is expected to have a material impact on the Company’s financial condition and results of operations once effective, primarily resulting from fluctuations in security exchanges or markets.
In February 2015, the FASB updated guidance to change the analysis that a reporting entity must perform to determine whether it should consolidate certain types of legal entities. All legal entities are subject to reevaluation under the revised consolidation model. Specifically, the amendments: modify the evaluation of whether limited partnerships and similar legal entities are variable interest entities ("VIEs") or voting interest entities; eliminate the presumption that a general partner should consolidate a limited partnership; affect the consolidation analysis of reporting entities that are involved with VIEs, particularly those that have fee arrangements and related party relationships; and provide a scope exception from consolidation guidance for reporting entities that are required to comply with or operate in accordance with certain requirements similar to those for registered money market funds. For public entities, this update becomes effective for annual reporting periods beginning after December 15, 2015, including interim periods within that reporting period. Early adoption is permitted. The Company is currently evaluating the impact that the recently issued accounting standard will have on the Company's financial position and results of operations, but does not expect it to have a material impact.
In May 2014, the FASB updated guidance to improve the comparability of revenue recognition practices for entities that either enter into contracts with customers to transfer goods or services or enter into contracts for the transfer of nonfinancial assets, unless those contracts are within the scope of other standards such as insurance contracts or lease standards. The core principle of the guidance is that an entity should recognize revenue to depict the transfer of promised goods or services to customers in an amount that reflects the consideration to which the entity expects to be entitled in exchange for those goods or services. For public entities, this update originally became effective for interim and annual reporting periods beginning after December 15, 2016. In August 2015, the FASB updated guidance to defer the effective date of the standard by one year. Early adoption is not permitted, although public entities are permitted to elect to adopt the amendments on the original effective date. The Company is currently evaluating the impact that the recently issued accounting standard will have on the Company's financial position and results of operations, but does not expect it to have a material impact.
Use of Estimates and Assumptions
The preparation of financial statements in conformity with GAAP requires management to make estimates and assumptions that affect the reported amounts of assets and liabilities, and disclosures of contingent assets and liabilities at the date of the financial statements, and the reported amounts of revenues and expenses during the reporting period and accompanying notes. Actual results could differ materially from those estimates and assumptions used. The more significant of these estimates and assumptions include the following:
Claims – The Company’s reserves for claims are established using estimated amounts required to settle claims for which notice has been received (reported) and the amount estimated to be required to satisfy incurred claims of policyholders which may be reported in the future (incurred but not reported, or “IBNR”). A provision for estimated future claims payments is recorded at the time policy revenue is recorded as a percentage of premium income. By their nature, title claims can often be complex, vary greatly in dollar amounts, vary in number due to economic and market conditions such as an increase in mortgage foreclosures, and involve uncertainties as to ultimate exposure. In addition, some claims may require a number of years to settle and determine the final liability for indemnity and loss adjustment expense. The payment experience may extend for more than 20 years after the issuance of a policy. Events such as fraud, defalcation and multiple property defects can substantially and unexpectedly cause increases in estimates of losses. Due to the length of time over which claim payments are made and regularly occurring changes in underlying economic and market conditions, these estimates are subject to variability.
49
Management considers factors such as the Company’s historical claims experience, case reserve estimates on reported claims, large claims, actuarial projections and other relevant factors in determining loss provision rates and the aggregate recorded expected liability for claims. In establishing reserves, actuarial projections are compared with recorded reserves to evaluate the adequacy of such recorded claims reserves and any necessary adjustments are then recorded in current operations. As the most recent claims experience develops and new information becomes available, the loss reserve estimate related to prior periods will change to more accurately reflect updated and improved emerging data. The Company reflects any adjustments to reserves in the results of operations in the period in which new information (principally claims experience) becomes available.
The Company’s reserves for claims are established using estimated amounts required to settle claims for which notice has been received (reported) and the amount estimated to be required to satisfy incurred claims of policyholders which have been incurred but not reported (“IBNR”). During the third quarter of 2013 certain actuarial inputs were changed to reflect recent trends. See Note 6 in the accompanying Consolidated Financial Statements for further information regarding this change in accounting estimate.
Premiums written – The Company’s premium revenues from certain agency operations include accruals based on estimates. These accruals estimate unreported agency premiums related to transactions which have settled as of the balance sheet date. Accruals for premiums from certain agencies are necessary because of the lag between policy effective dates and the reporting of these transactions to the Company by the agents. The current lag time used in the Company’s estimates typically ranges between 0 and 180 days after the policy effective date, with the majority of agencies reporting within 60 to 90 days. The lag time is reviewed periodically to monitor accruals. To determine the estimated premiums, the Company uses historical experience, as well as other factors, to make certain assumptions about the average elapsed time between the policy effective date and the date the policies are reported. From time to time, the Company adjusts the inputs to the calculation of these estimates as agents report transactions and information on more current trends becomes available. The Company reflects any adjustments to the accruals in the results of operations in the period in which new information becomes available.
Impairments – Securities are regularly evaluated and reviewed for differences between the cost and estimated fair value of each security for factors that may indicate that a decline in estimated fair value is other-than-temporary. When, in the opinion of management, a decline in the estimated fair value of an investment is considered to be other-than-temporary, such investment is written down to its estimated fair value. Some factors considered in evaluating whether or not a decline in estimated fair value is other-than-temporary include the duration and extent to which the estimated fair value has been less than cost; the probability that the Company will be unable to collect all amounts due under the contractual terms of the security; with respect to equity securities, whether the Company’s ability and intent to retain the investment for a period of time is sufficient to allow for a recovery in value; with respect to fixed maturity securities, whether the Company has the intent to sell or will more likely than not be required to sell a particular security before recovery in value; and the financial condition and prospects of the issuer (including credit ratings). These factors are reviewed quarterly and any material degradation in the prospect for recovery will be considered in the other-than-temporary impairment analysis. Such reviews are inherently uncertain and the value of the investment may not fully recover or may decline in future periods resulting in a realized loss. The estimated fair values of the majority of the Company’s investments are based on quoted market prices from independent pricing services.
2. Statutory Accounting and Restrictions on Consolidated Stockholders’ Equity and Investments
The Consolidated Financial Statements have been prepared in conformity with GAAP which differ in some respects from statutory accounting practices prescribed or permitted in the preparation of financial statements for submission to insurance regulatory authorities.
Combined capital and surplus on a statutory basis was $133,363,375 and $127,314,429 as of December 31, 2015 and 2014, respectively. Net income on a statutory basis was $13,621,174, $9,737,634 and $11,858,699 for the twelve months ended December 31, 2015, 2014 and 2013, respectively.
The Company has designated approximately $50,508,000 and $48,423,000 of retained earnings as of December 31, 2015 and 2014, respectively, as appropriated to reflect the required statutory premium and supplemental reserves. See Note 8 for the tax treatment of the statutory premium reserve.
As of December 31, 2015 and 2014, approximately $89,489,000 and $90,384,000, respectively, of consolidated stockholders’ equity represents net assets of the Company’s subsidiaries that cannot be transferred in the form of dividends, loans or advances to the parent company under statutory regulations without prior insurance department approval. During 2016, the maximum distributions the insurance subsidiaries can make to the Company without prior approval from applicable regulators total approximately $14,352,000.
Bonds totaling approximately $7,159,000 and $7,060,000 at December 31, 2015 and 2014, respectively, are deposited with the insurance departments of the states in which business is conducted.
50
3. Investments in Securities and Estimated Fair Value
The aggregate estimated fair value, gross unrealized holding gains, gross unrealized holding losses, and amortized cost for securities by major security type at December 31 were as follows:
December 31, 2015 | Amortized Cost | Gross Unrealized Gains | Gross Unrealized Losses | Estimated Fair Value | |||||||||||
Fixed maturities, available-for-sale, at fair value: | |||||||||||||||
General obligations of U.S. states, territories and political subdivisions | $ | 31,883,439 | $ | 987,595 | $ | 11,734 | $ | 32,859,300 | |||||||
Special revenue issuer obligations of U.S. states, territories and political subdivisions | 52,202,815 | 2,604,152 | 26,127 | 54,780,840 | |||||||||||
Corporate debt securities | 17,004,985 | 539,832 | 58,473 | 17,486,344 | |||||||||||
Auction rate securities | 924,587 | 15,313 | — | 939,900 | |||||||||||
Total | $ | 102,015,826 | $ | 4,146,892 | $ | 96,334 | $ | 106,066,384 | |||||||
Equity securities, available-for-sale, at fair value: | |||||||||||||||
Common stocks | $ | 23,855,873 | $ | 13,785,968 | $ | 128,377 | $ | 37,513,464 | |||||||
Total | $ | 23,855,873 | $ | 13,785,968 | $ | 128,377 | $ | 37,513,464 | |||||||
Short-term investments: | |||||||||||||||
Money market funds and certificates of deposit | $ | 6,865,406 | $ | — | $ | — | $ | 6,865,406 | |||||||
Total | $ | 6,865,406 | $ | — | $ | — | $ | 6,865,406 | |||||||
December 31, 2014 | Amortized Cost | Gross Unrealized Gains | Gross Unrealized Losses | Estimated Fair Value | |||||||||||
Fixed maturities, available-for-sale, at fair value: | |||||||||||||||
General obligations of U.S. states, territories and political subdivisions | $ | 35,215,247 | $ | 1,527,794 | $ | 19,542 | $ | 36,723,499 | |||||||
Special revenue issuer obligations of U.S. states, territories and political subdivisions | 46,707,033 | 2,405,725 | 55,502 | 49,057,256 | |||||||||||
Corporate debt securities | 21,576,641 | 823,133 | 71,339 | 22,328,435 | |||||||||||
Auction rate securities | 922,129 | 16,971 | — | 939,100 | |||||||||||
Total | $ | 104,421,050 | $ | 4,773,623 | $ | 146,383 | $ | 109,048,290 | |||||||
Equity securities, available-for sale, at fair value: | |||||||||||||||
Common stocks and nonredeemable preferred stocks | $ | 24,128,753 | $ | 15,225,459 | $ | 99,231 | $ | 39,254,981 | |||||||
Total | $ | 24,128,753 | $ | 15,225,459 | $ | 99,231 | $ | 39,254,981 | |||||||
Short-term investments: | |||||||||||||||
Money market funds and certificates of deposit | $ | 2,576,993 | $ | — | $ | — | $ | 2,576,993 | |||||||
Total | $ | 2,576,993 | $ | — | $ | — | $ | 2,576,993 | |||||||
The special revenue category for both periods presented includes over 50 individual bonds with revenue sources from a variety of industry sectors.
51
The scheduled maturities of fixed maturity securities at December 31, 2015 were as follows:
Available-for-Sale | |||||||
Amortized Cost | Fair Value | ||||||
Due in one year or less | $ | 14,677,669 | $ | 14,877,469 | |||
Due after one year through five years | 41,214,199 | 42,796,111 | |||||
Due five years through ten years | 42,879,329 | 44,682,558 | |||||
Due after ten years | 3,244,629 | 3,710,246 | |||||
Total | $ | 102,015,826 | $ | 106,066,384 | |||
Earnings on investments for the years ended December 31 were as follows:
2015 | 2014 | 2013 | |||||||||
Fixed maturities | $ | 3,439,296 | $ | 3,282,810 | $ | 2,997,901 | |||||
Equity securities | 1,086,365 | 973,419 | 890,917 | ||||||||
Invested cash and other short-term investments | 5,605 | 3,202 | 5,754 | ||||||||
Miscellaneous interest | 53 | 70 | 36 | ||||||||
Investment income | $ | 4,531,319 | $ | 4,259,501 | $ | 3,894,608 | |||||
Gross realized gains and losses on sales of investments for the years ended December 31 are summarized as follows:
2015 | 2014 | 2013 | |||||||||
Gross realized gains: | |||||||||||
Corporate debt securities | $ | 5,417 | $ | 6,670 | $ | — | |||||
Common stocks and nonredeemable preferred stocks | 1,572,636 | 1,021,463 | 369,673 | ||||||||
Total | 1,578,053 | 1,028,133 | 369,673 | ||||||||
Gross realized losses: | |||||||||||
General obligations of U.S. states, territories and political subdivisions | (12,319 | ) | — | — | |||||||
Special revenue issuer obligations of U.S. states, territories and political subdivisions | (397 | ) | — | — | |||||||
Common stocks and nonredeemable preferred stocks | (846,500 | ) | (509,854 | ) | (180,169 | ) | |||||
Other than temporary impairment of securities | (751,059 | ) | (14,542 | ) | — | ||||||
Total | (1,610,275 | ) | (524,396 | ) | (180,169 | ) | |||||
Net realized (loss) gain | $ | (32,222 | ) | $ | 503,737 | $ | 189,504 | ||||
Net realized (loss) gain on other investments: | |||||||||||
Impairments of other assets and investments | $ | (233,069 | ) | $ | (10,062 | ) | $ | (34,070 | ) | ||
Net gain on other assets and investments | 149,128 | 45,288 | 48,946 | ||||||||
Net loss on other assets and investments | — | (270,669 | ) | (8,580 | ) | ||||||
Total | $ | (83,941 | ) | $ | (235,443 | ) | $ | 6,296 | |||
Net realized (loss) gain on investments | $ | (116,163 | ) | $ | 268,294 | $ | 195,800 | ||||
Realized gains and losses are determined on the specific identification method.
52
The following table presents the gross unrealized losses on investment securities and the estimated fair value of the related securities, aggregated by investment category and length of time that individual securities have been in a continuous loss position at December 31, 2015 and 2014:
Less than 12 Months | 12 Months or Longer | Total | |||||||||||||||||||||
December 31, 2015 | Estimated Fair Value | Unrealized Loss | Estimated Fair Value | Unrealized Loss | Estimated Fair Value | Unrealized Loss | |||||||||||||||||
General obligations of U.S. states, territories and political subdivisions | $ | 1,758,345 | $ | (11,734 | ) | $ | — | $ | — | $ | 1,758,345 | $ | (11,734 | ) | |||||||||
Special revenue issuer obligations of U.S. states, territories and political subdivisions | 1,672,217 | (5,139 | ) | 1,183,963 | (20,989 | ) | 2,856,180 | (26,128 | ) | ||||||||||||||
Corporate debt securities | 6,981,275 | (58,472 | ) | — | — | 6,981,275 | (58,472 | ) | |||||||||||||||
Total fixed maturity securities | $ | 10,411,837 | $ | (75,345 | ) | $ | 1,183,963 | $ | (20,989 | ) | $ | 11,595,800 | $ | (96,334 | ) | ||||||||
Equity securities | 5,533,667 | (128,377 | ) | — | — | 5,533,667 | (128,377 | ) | |||||||||||||||
Total temporarily impaired securities | $ | 15,945,504 | $ | (203,722 | ) | $ | 1,183,963 | $ | (20,989 | ) | $ | 17,129,467 | $ | (224,711 | ) | ||||||||
December 31, 2014 | |||||||||||||||||||||||
General obligations of U.S. states, territories and political subdivisions | $ | 2,113,194 | $ | (19,542 | ) | $ | — | $ | — | $ | 2,113,194 | $ | (19,542 | ) | |||||||||
Special revenue issuer obligations of U.S. states, territories and political subdivisions | 3,946,977 | (13,453 | ) | 1,182,390 | (42,049 | ) | 5,129,367 | (55,502 | ) | ||||||||||||||
Corporate debt securities | 6,924,430 | (71,339 | ) | — | — | 6,924,430 | (71,339 | ) | |||||||||||||||
Total fixed maturity securities | $ | 12,984,601 | $ | (104,334 | ) | $ | 1,182,390 | $ | (42,049 | ) | $ | 14,166,991 | $ | (146,383 | ) | ||||||||
Equity securities | 930,208 | (71,669 | ) | 141,280 | (27,562 | ) | 1,071,488 | (99,231 | ) | ||||||||||||||
Total temporarily impaired securities | $ | 13,914,809 | $ | (176,003 | ) | $ | 1,323,670 | $ | (69,611 | ) | $ | 15,238,479 | $ | (245,614 | ) | ||||||||
As of December 31, 2015, the Company held $11,595,800 in fixed maturity securities with unrealized losses of $96,334. As of December 31, 2014, the Company held $14,166,991 in fixed maturity securities with unrealized losses of $146,383. The decline in estimated fair value of the fixed maturity securities can be attributed primarily to changes in market interest rates and changes in credit spreads over Treasury securities. Because the Company does not have the intent to sell these securities and likely will not be compelled to sell them before it can recover its cost basis, the Company does not consider these investments to be other-than-temporarily impaired.
As of December 31, 2015, the Company held $5,533,667 in equity securities with unrealized losses of $128,377. As of December 31, 2014, the Company held $1,071,488 in equity securities with unrealized losses of $99,231. The unrealized losses related to holdings of equity securities were caused by market changes that the Company considers to be temporary. Since the Company has the intent and ability to hold these equity income securities until a recovery of fair value, the Company does not consider these investments other-than-temporarily impaired.
Factors considered in determining whether a loss is temporary include the length of time and extent to which fair value has been below cost, the financial condition and prospects of the issuer (including credit ratings and analyst reports) and macro-economic changes. A total of 30 and 25 securities had unrealized losses at December 31, 2015 and December 31, 2014, respectively. Reviews of the values of securities are inherently uncertain and the value of the investment may not fully recover, or may decline in future periods resulting in a realized loss. During 2015, the Company recorded other-than-temporary impairment charges in the amount of $751,059 related to securities. During 2014, the Company recorded other-than-temporary impairment charges in the amount of $14,542 related to securities. During 2013, the Company did not record other-than-temporary impairment charges related to securities. Other-than-temporary impairment charges are included in net realized (loss) gain on investments in the Consolidated Statements of Income.
53
Valuation of Financial Assets and Liabilities
The FASB has established a valuation hierarchy for disclosure of the inputs used to measure fair value of financial assets and liabilities, such as securities. This hierarchy categorizes the inputs into three broad levels as follows. Level 1 inputs are quoted prices (unadjusted) in active markets for identical assets or liabilities. Level 2 inputs are quoted prices for similar assets and liabilities in active markets or inputs that are observable for the asset or liability, either directly or indirectly through market corroboration, for substantially the full term of the financial instrument. Level 3 inputs are unobservable inputs based on the Company’s own assumptions used to measure assets and liabilities at fair value.
A financial instrument’s classification within the valuation hierarchy is based upon the lowest level of input that is significant to the fair value measurement—consequently, if there are multiple significant valuation inputs that are categorized in different levels of the hierarchy, the instrument’s hierarchy level is the lowest level (with Level 3 being the lowest level) within which any significant input falls.
Debt and Equity Securities
The Level 1 category includes equity securities that are measured at fair value using quoted active market prices.
The Level 2 category includes fixed maturity investments such as corporate bonds, U.S. government and agency bonds and municipal bonds. Estimated fair value is principally based on market values obtained from a third party pricing service. Factors that are used in determining estimated fair market value include benchmark yields, reported trades, broker/dealer quotes, issuer spreads, two-sided markets, benchmark securities, bids, offers and reference data. The Company receives one quote per security from a third party pricing service, although as discussed below, the Company does consult other pricing resources when confirming that the prices it obtains reflect the estimated fair values of the instruments in accordance with Accounting Standards Codification (“ASC”) 820, Fair Value Measurements and Disclosures. Generally, quotes obtained from the pricing service for instruments classified as Level 2 are not adjusted and are not binding. As of December 31, 2015 and December 31, 2014, the Company did not adjust any Level 2 fair values.
A number of the Company’s investment grade corporate bonds are frequently traded in active markets, and trading prices are consequently available for these securities. However, these securities are classified as Level 2 because the pricing service from which the Company has obtained fair values for these instruments uses valuation models which use observable market inputs in addition to trading prices. Substantially all of the input assumptions used in the service’s model are observable in the marketplace or can be derived or supported by observable market data.
The Level 3 category only includes the Company’s investments in student loan auction rate securities (“ARS”) because quoted prices are unavailable due to the failure of auctions. The Company’s ARS portfolio is comprised entirely of investment grade student loan ARS. The par value of these securities was $1,000,000 as of December 31, 2015 and December 31, 2014, with approximately 97.0% as of December 31, 2015 and December 31, 2014, guaranteed by the U.S. Department of Education.
Some of the inputs to ARS valuation are unobservable in the market and are significant; therefore, the Company utilizes another third party pricing service to assist in the determination of the estimated fair market value of these securities. This service uses a proprietary valuation model that considers factors such as the following: the financial standing of the issuer; reported prices and the extent of public trading in similar financial instruments of the issuer or comparable companies; the ability of the issuer to obtain required financing; changes in the economic conditions affecting the issuer; pricing by other dealers in similar securities; time to maturity; and interest rates. The following table summarizes key assumptions the service used to determine fair value as of December 31, 2015 and 2014:
2015 | 2014 | ||
Cumulative probability of earning maximum rate until maturity | —% | —% | |
Cumulative probability of principle returned prior to maturity | 95.2% | 95.2% | |
Cumulative probability of default at some future point | 4.8% | 4.8% | |
Significant increases or decreases in any of the inputs in isolation could result in significant changes to the estimated fair value measurement. Generally, increases in default probabilities and liquidity risk premiums lower the estimated fair market value while increases in principal being returned and earning maximum rates increase estimated fair market values.
Based upon these inputs and assumptions, the pricing service provides a range of values to the Company for its ARS. The Company records the estimated fair value based on the midpoint of the range and believes that this valuation is the most reasonable estimate of fair value. In 2015 and 2014, the difference in the low and high values of the ranges was approximately one and four percent of the carrying value of the Company’s ARS.
54
The following table presents, by level, the financial assets carried at estimated fair value measured on a recurring basis as of December 31, 2015 and 2014. The table does not include cash on hand and also does not include assets which are measured at historical cost or any basis other than fair value. Level 3 assets are comprised solely of ARS.
As of December 31, 2015 | Level 1 | Level 2 | Level 3 | Total | |||||||||||
Short-term investments | $ | 6,865,406 | $ | — | $ | — | $ | 6,865,406 | |||||||
Equity securities: | |||||||||||||||
Common stocks | 37,513,464 | — | — | 37,513,464 | |||||||||||
Fixed maturities: | |||||||||||||||
Obligations of U.S. states, territories and political subdivisions* | — | 87,640,140 | — | 87,640,140 | |||||||||||
Corporate debt securities* and auction rate security | — | 17,486,344 | 939,900 | 18,426,244 | |||||||||||
Total | $ | 44,378,870 | $ | 105,126,484 | $ | 939,900 | $ | 150,445,254 | |||||||
As of December 31, 2014 | Level 1 | Level 2 | Level 3 | Total | |||||||||||
Short-term investments | $ | 2,576,993 | $ | — | $ | — | $ | 2,576,993 | |||||||
Equity securities: | |||||||||||||||
Common stocks and nonredeemable preferred stock | 39,254,981 | — | — | 39,254,981 | |||||||||||
Fixed maturities: | |||||||||||||||
Obligations of U.S. states, territories and political subdivisions* | — | 85,780,755 | — | 85,780,755 | |||||||||||
Corporate debt securities* and auction rate security | — | 22,328,435 | 939,100 | 23,267,535 | |||||||||||
Total | $ | 41,831,974 | $ | 108,109,190 | $ | 939,100 | $ | 150,880,264 | |||||||
*Denotes fair market value obtained from pricing services.
There were no transfers into or out of Levels 1 and 2 during the period.
To help ensure that estimated fair value determinations are consistent with ASC 820, prices from our pricing services go through multiple review processes to ensure appropriate pricing. Pricing procedures and inputs used to price each security include, but are not limited to, the following: unadjusted quoted market prices for identical securities such as stock market closing prices; non-binding quoted prices for identical securities in markets that are not active; interest rates; yield curves observable at commonly quoted intervals; volatility; prepayment speeds; loss severity; credit risks and default rates. The Company reviews the procedures and inputs used by its pricing services, and verifies a sample of the services’ quotes by comparing them to values obtained from other pricing resources. In the event the Company disagrees with a price provided by its pricing services, the respective service reevaluates the price to corroborate the market information and then reviews inputs to the evaluation in light of potentially new market data. The Company believes that these processes and inputs result in appropriate classifications and estimated fair values consistent with ASC 820.
Other Financial Instruments
The Company uses various financial instruments in the normal course of its business. In the measurement of the estimated fair value of certain financial instruments, other valuation techniques were utilized if quoted market prices were not available. These derived fair value estimates are significantly affected by the assumptions used. Additionally, ASC 820 excludes from its scope certain financial instruments including those related to insurance contracts, pension and other postretirement benefits, and equity method investments.
In estimating the fair value of the financial instruments presented, the Company used the following methods and assumptions:
Cash and cash equivalents
The carrying amount for cash and cash equivalents is a reasonable estimate of fair value due to the short-term maturity of these investments.
Cost-basis investments
The estimated fair value of cost-basis investments is calculated from the book value of the underlying entities, which is not materially different from the fair value of the underlying entity. These items are included in other investments in the Consolidated Balance Sheets.
55
Accrued dividends and interest
The carrying amount for accrued dividends and interest is a reasonable estimate of fair value due to the short-term maturity of these assets.
The carrying amounts and fair values of these financial instruments (please note investments are disclosed in a previous table) as of December 31, 2015 and 2014 are presented in the following table:
As of December 31, 2015 | |||||||||||||||||||
Financial Assets | Carrying Value | Estimated Fair Value | Level 1 | Level 2 | Level 3 | ||||||||||||||
Cash and cash equivalents | $ | 21,790,068 | $ | 21,790,068 | $ | 21,790,068 | $ | — | $ | — | |||||||||
Cost-basis investments | 3,588,314 | 3,684,020 | — | — | 3,684,020 | ||||||||||||||
Accrued dividends and interest | 1,004,126 | 1,004,126 | 1,004,126 | — | — | ||||||||||||||
Total | $ | 26,382,508 | $ | 26,478,214 | $ | 22,794,194 | $ | — | $ | 3,684,020 | |||||||||
As of December 31, 2014 | |||||||||||||||||||
Financial Assets | Carrying Value | Estimated Fair Value | Level 1 | Level 2 | Level 3 | ||||||||||||||
Cash and cash equivalents | $ | 15,826,515 | $ | 15,826,515 | $ | 15,826,515 | $ | — | $ | — | |||||||||
Cost-basis investments | 2,516,608 | 2,675,817 | — | — | 2,675,817 | ||||||||||||||
Accrued dividends and interest | 1,063,837 | 1,063,837 | 1,063,837 | — | — | ||||||||||||||
Total | $ | 19,406,960 | $ | 19,566,169 | $ | 16,890,352 | $ | — | $ | 2,675,817 | |||||||||
The following table presents a reconciliation of the Company’s assets measured at fair value on a recurring basis using significant unobservable inputs (Level 3), which are all ARS securities, for the twelve months ended December 31, 2015 and 2014:
Changes in fair value during the year ended December 31: | 2015 | 2014 | |||||
Beginning balance at January 1 | $ | 939,100 | $ | 935,700 | |||
Redemptions and sales | — | — | |||||
Realized gain – included in net realized (loss) gain on investments | — | — | |||||
Realized loss – included in net realized (loss) gain on investments | — | — | |||||
Unrealized gain – included in other comprehensive income | 800 | 3,400 | |||||
Ending balance at December 31 | $ | 939,900 | $ | 939,100 | |||
Certain cost-basis investments are measured at estimated fair value on a non-recurring basis, such as investments that are determined to be other-than temporarily impaired during the period and recorded at estimated fair value in the Consolidated Financial Statements as of December 31, 2015 and 2014. The following table summarizes the corresponding estimated fair value hierarchy of such investments at December 31, 2015 and 2014 and the related impairments recognized:
December 31, 2015 | Valuation Method | Impaired | Level 1 | Level 2 | Level 3 | Total at Estimated Fair Value | Impairment Losses | ||||||||||||||||
Cost-basis investments | Fair Value | Yes | $ | — | $ | — | $ | 163,350 | $ | 163,350 | $ | (233,069 | ) | ||||||||||
Total cost-basis investments and other assets | $ | — | $ | — | $ | 163,350 | $ | 163,350 | $ | (233,069 | ) | ||||||||||||
56
December 31, 2014 | Valuation Method | Impaired | Level 1 | Level 2 | Level 3 | Total at Estimated Fair Value | Impairment Losses | ||||||||||||||||
Cost-basis investments | Fair Value | Yes | $ | — | $ | — | $ | 22,682 | $ | 22,682 | $ | (10,062 | ) | ||||||||||
Total cost-basis investments and other assets | $ | — | $ | — | $ | 22,682 | $ | 22,682 | $ | (10,062 | ) | ||||||||||||
4. Property and Equipment
Property and equipment and estimated useful lives at December 31 are summarized as follows:
2015 | 2014 | ||||||
Land | $ | 1,122,582 | $ | 1,107,582 | |||
Office buildings and improvements (25 years) | 3,495,338 | 3,416,096 | |||||
Furniture, fixtures and equipment (3 to 10 years) | 8,948,535 | 7,159,250 | |||||
Automobiles (3 years) | 968,210 | 847,905 | |||||
Total | 14,534,665 | 12,530,833 | |||||
Less accumulated depreciation | (7,385,714 | ) | (7,070,028 | ) | |||
Property and equipment, net | $ | 7,148,951 | $ | 5,460,805 | |||
Included within furniture, fixtures and equipment is software developed by the Company for internal use. Capitalized costs include both direct and indirect costs, such as payroll costs of employees associated with developing software, incurred during the software development stage.
5. Reinsurance
The Company assumes and cedes reinsurance with other insurance companies in the normal course of business. Premiums assumed and ceded were approximately $34,000 and $215,000, respectively, for 2015, $38,000 and $140,000, respectively, for 2014 and $6,000 and $211,000, respectively, for 2013. Ceded reinsurance is comprised of excess of loss treaties, which outline the conditions in which the reinsurance company will pay claims and protect against losses over certain agreed amounts. The Company remains liable to the insured for claims under ceded insurance policies in the event that the assuming insurance companies are unable to meet their obligations under these contracts. The Company has not paid or recovered any reinsured losses during the three years ended December 31, 2015.
6. Reserves for Claims
Changes in the reserves for claims for the years ended December 31 are summarized as follows based on the year in which the policies were written:
2015 | 2014 | 2013 | |||||||||
Balance, beginning of period | $ | 36,677,000 | $ | 35,360,000 | $ | 39,078,000 | |||||
Provision (benefit) related to: | |||||||||||
Current year | 7,295,013 | 6,860,335 | 7,239,628 | ||||||||
Prior year | (2,816,519 | ) | (1,630,619 | ) | (7,811,224 | ) | |||||
Total provision (benefit) charged to operations | 4,478,494 | 5,229,716 | (571,596 | ) | |||||||
Claims paid, net of recoveries, related to: | |||||||||||
Current year | (97,116 | ) | (102,947 | ) | (110,240 | ) | |||||
Prior year | (3,270,378 | ) | (3,809,769 | ) | (3,036,164 | ) | |||||
Total claims paid, net of recoveries | (3,367,494 | ) | (3,912,716 | ) | (3,146,404 | ) | |||||
Balance, end of year | $ | 37,788,000 | $ | 36,677,000 | $ | 35,360,000 | |||||
57
The Company continually refines its reserve estimates as current loss experience develops and credible data emerges. Movements in the reserves related to prior periods were primarily the result of changes to estimates to better reflect the latest reported loss data. The 2015 calendar year change in the provision relating to prior years resulted mostly from changes to certain actuarial inputs and favorable development in 2015 versus the prior year related primarily to policy years 2009 through 2014. Due to variances between actual and expected loss payments, loss development is subject to significant variability.
The Company does not recognize claim recoveries until an actual payment has been received by the Company. The Company realized claim recoveries of approximately $467,000, $790,000 and $1,165,000 during 2015, 2014 and 2013, respectively.
The provision (benefit) for claims as a percentage of net premiums written was 4.0%, 4.8% and (0.5)% in 2015, 2014 and 2013, respectively.
A large claim is defined as a claim with incurred losses exceeding $250,000. Due to the small volume of large claims, the long-tail nature of title insurance claims and the inherent uncertainty in loss emergence patterns, large claim activity can vary significantly between policy years. The estimated development of large claims by policy year is therefore subject to significant changes as experience develops.
During 2013 certain actuarial inputs were changed to reflect recent trends. The Company considers these modifications in actuarial inputs to be a change in estimate. The Company believes that these changes in actuarial inputs were necessary in response to favorable reserve development and claims experience incurred in several recent reporting periods. The approximate impact of this change in estimate for the year ended December 31, 2013 was a reduction of $2,200,000 to the reserves for claims in the Consolidated Balance Sheets, and in the Consolidated Statements of Income a decrease of $2,200,000 to the provision (benefit) for claims, an increase of $750,000 in the provision for income taxes and an increase of $1,450,000 in net income, or $0.71 per basic share and $0.70 per diluted share, compared with the amounts that would have been recorded under the Company’s prior estimate. This change in estimate, coupled with several recent policy years which continued to emerge favorably in comparison with prior expectations, contributed to a benefit in the claims provision for the 2013 year. The change in estimate was primarily driven by the following:
• | changing the specific weightings used in performing certain actuarial methods, including weighting between policy years and weighting of title industry loss data; |
• | adjusting for premium rate changes and the Company’s improved underwriting efforts related to construction business; and |
• | increasing the ratios used to estimate projected payments of unallocated loss adjustment expenses to more accurately reflect expected payments. |
A summary of the Company’s loss reserves, broken down into its components of known title claims and IBNR, follows:
2015 | % | 2014 | % | ||||||||
Known title claims | $ | 5,066,469 | 13.4 | $ | 5,364,645 | 14.6 | |||||
IBNR | 32,721,531 | 86.6 | 31,312,355 | 85.4 | |||||||
Total loss reserves | $ | 37,788,000 | 100.0 | $ | 36,677,000 | 100.0 | |||||
In management’s opinion, the reserves are adequate to cover claim losses which might result from pending and future claims.
7. Earnings Per Common Share and Share Awards
Basic earnings per common share is computed by dividing net income attributable to the Company by the weighted average number of common shares outstanding during the reporting period. Diluted earnings per common share is computed by dividing net income attributable to the Company by the combination of dilutive potential common stock, comprised of shares issuable under the Company’s share-based compensation plans and the weighted average number of common shares outstanding during the reporting period. Dilutive common share equivalents include the dilutive effect of in-the-money share-based awards, which are calculated based on the average share price for each period using the treasury stock method. Under the treasury stock method, when share-based awards are exercised, (a) the exercise price of a share-based award; (b) the amount of compensation cost, if any, for future service that the Company has not yet recognized; and (c) the amount of estimated tax benefits that would be recorded in additional paid-in capital, if any, are assumed to be used to repurchase shares in the current period. The incremental dilutive potential common shares, calculated using the treasury stock method, were 5,439, 5,774 and 20,459 for 2015, 2014 and 2013, respectively.
58
The following table sets forth the computation of basic and diluted earnings per share for the years ended December 31:
For the Years Ended December 31, | 2015 | 2014 | 2013 | ||||||||
Net income attributable to the Company | $ | 12,533,905 | $ | 9,648,975 | $ | 14,708,210 | |||||
Weighted average common shares outstanding – Basic | 1,984,360 | 2,031,760 | 2,056,169 | ||||||||
Incremental shares outstanding assuming the exercise of dilutive stock options and SARs (share-settled) | 5,439 | 5,774 | 20,459 | ||||||||
Weighted average common shares outstanding – Diluted | 1,989,799 | 2,037,534 | 2,076,628 | ||||||||
Basic earnings per common share | $ | 6.32 | $ | 4.75 | $ | 7.15 | |||||
Diluted earnings per common share | $ | 6.30 | $ | 4.74 | $ | 7.08 | |||||
There were no potential shares excluded from the computation of diluted earnings per share in 2015, 2014 and 2013.
The Company has adopted employee stock award plans under which restricted stock, and options or stock appreciation rights (“SARs”) to acquire shares (not to exceed 500,000 shares) of the Company’s stock, may be granted to key employees or directors of the Company at a price not less than the market value on the date of grant. SARs and options (which have predominantly been incentive stock options) awarded under the plans thus far generally expire in five to ten years from the date of grant and are exercisable and vest: immediately; within one year; or at 10% to 20% per year beginning on the date of grant. All SARs issued to date have been share-settled only.
A summary of share-based award transactions for all share-based award plans follows:
Number Of Shares | Weighted Average Exercise Price | Average Remaining Contractual Term (Years) | Aggregate Intrinsic Value | |||||||||
Outstanding as of January 1, 2013 | 98,150 | $ | 30.74 | 3.17 | $ | 2,871,710 | ||||||
SARs granted | 3,000 | 71.59 | ||||||||||
SARs exercised | (79,500 | ) | 28.77 | |||||||||
Options exercised | (2,650 | ) | 28.63 | |||||||||
Outstanding as of December 31, 2013 | 19,000 | $ | 45.74 | 3.43 | $ | 669,610 | ||||||
SARs granted | 4,500 | 68.70 | ||||||||||
SARs exercised | (1,500 | ) | 49.04 | |||||||||
Options exercised | (1,000 | ) | 27.21 | |||||||||
Outstanding as of December 31, 2014 | 21,000 | $ | 51.30 | 3.64 | $ | 453,510 | ||||||
SARs granted | 4,500 | 73.00 | ||||||||||
SARs exercised | (2,000 | ) | 47.88 | |||||||||
Options exercised | (1,500 | ) | 36.79 | |||||||||
Outstanding as of December 31, 2015 | 22,000 | $ | 57.04 | 3.93 | $ | 945,055 | ||||||
Exercisable as of December 31, 2015 | 20,875 | $ | 56.18 | 3.80 | $ | 914,680 | ||||||
Unvested as of December 31, 2015 | 1,125 | $ | 73.00 | 6.39 | $ | 30,375 | ||||||
The aggregate intrinsic value is calculated as the difference between the exercise price of the underlying awards and the quoted price of the Company’s common stock at December 31, 2015. The intrinsic values of options exercised during 2015, 2014 and 2013 were approximately $104,000, $82,000 and $3,486,000, respectively.
59
There were no options outstanding at December 31, 2015. The following tables summarize information about SARs outstanding at December 31, 2015:
SARs Outstanding at Year-End | SARs Exercisable at Year-End | |||||||||||||||||||||||
Range of Exercise Prices | Number Outstanding | Weighted Average Remaining Contractual Life | Weighted Average Exercise Price | Number Exercisable | Weighted Average Exercise Price | |||||||||||||||||||
$ | 32.00 | — | $ | 32.00 | 2,000 | 0.39 | $ | 32.00 | 2,000 | $ | 32.00 | |||||||||||||
33.31 | — | 33.31 | 2,500 | 1.38 | 33.31 | 2,500 | 33.31 | |||||||||||||||||
36.80 | — | 73.00 | 17,500 | 4.70 | 63.30 | 16,375 | 62.63 | |||||||||||||||||
$ | 32.00 | — | $ | 73.00 | 22,000 | 3.93 | $ | 57.05 | 20,875 | $ | 56.18 | |||||||||||||
In 2015, 4,500 SARs vested with a fair value of $137,762.
During the second quarters of 2015, 2014 and 2013, the Company issued share-settled SARs to the directors of the Company. SARs give the holder the right to receive stock equal to the appreciation in the value of shares of stock from the grant date for a specified period of time, and as a result, are accounted for as equity instruments. The fair value of each award is estimated on the date of grant using the Black-Scholes option valuation model with the weighted average assumptions noted in the table shown below. Expected volatilities are based on both the implied and historical volatility of the Company’s stock. The Company uses historical data to project SAR exercises and pre-exercise forfeitures within the valuation model. The expected term of awards represents the period of time that SARs granted are expected to be outstanding. The interest rate assumed for the expected life of the award is based on the U.S. Treasury yield curve in effect at the time of the grant. The weighted average fair values for the SARs issued during 2015, 2014 and 2013 were $31.16, $28.98 and $27.55, respectively, and were estimated using the weighted average assumptions shown in the table below.
2015 | 2014 | 2013 | |||
Expected Life in Years | 7.0 | 6.9 | 5.0 | ||
Volatility | 40.7% | 39.9% | 44.6% | ||
Interest Rate | 2.0% | 2.1% | 1.3% | ||
Yield Rate | 0.4% | 0.4% | 0.5% | ||
There was approximately $138,000, $121,000 and $84,000 of compensation expense relating to SARs or options vesting on or before December 31, 2015, 2014 and 2013, respectively, included in salaries, employee benefits and payroll taxes in the Consolidated Statements of Income. As of December 31, 2015, there was approximately $35,000 of total unrecognized compensation cost related to unvested share-based compensation arrangements granted under the Company’s stock award plans. That cost is expected to be recognized over a weighted average period of approximately 3 months.
The estimated weighted average grant-date fair value of SARs granted for the years ended December 31 was as follows:
For the Years Ended December 31, | 2015 | 2014 | 2013 | ||||||||
Exercise price equal to market price on date of grant: | |||||||||||
Weighted average market price | $ | 73.00 | $ | 68.70 | $ | 71.59 | |||||
Weighted average grant-date fair value | $ | 31.16 | $ | 28.98 | $ | 27.55 | |||||
There have been no stock options or SARs granted where the exercise price was less than the market price on the date of grant.
60
8. Income Taxes
The components of income tax expense for the years ended December 31 are summarized as follows:
For the Years Ended December 31, | 2015 | 2014 | 2013 | ||||||||
Current: | |||||||||||
Federal | $ | 4,179,000 | $ | 3,121,000 | $ | 4,873,000 | |||||
State | 34,000 | 84,000 | 69,000 | ||||||||
Total current | 4,213,000 | 3,205,000 | 4,942,000 | ||||||||
Deferred: | |||||||||||
Federal | 976,624 | 620,156 | 1,805,215 | ||||||||
State | 38,376 | (9,156 | ) | (1,215 | ) | ||||||
Total deferred | 1,015,000 | 611,000 | 1,804,000 | ||||||||
Total | $ | 5,228,000 | $ | 3,816,000 | $ | 6,746,000 | |||||
For state income tax purposes, ITIC and NITIC generally pay only a gross premium tax found in premium and retaliatory taxes in the Consolidated Statements of Income.
At December 31, the approximate tax effect of each component of deferred income tax assets and liabilities is summarized as follows:
For the Years Ended December 31, | 2015 | 2014 | |||||
Deferred income tax assets: | |||||||
Accrued benefits and retirement services | $ | 3,262,719 | $ | 3,061,144 | |||
Allowance for doubtful accounts | 1,199,777 | 1,033,624 | |||||
Other-than-temporary impairment of assets | 428,614 | 323,089 | |||||
Excess of book over tax depreciation | — | 90,409 | |||||
Postretirement benefit obligation | 59,108 | 40,183 | |||||
Reinsurance and commission payable | 13,752 | 15,668 | |||||
Net operating loss carryforward | 22,000 | 25,000 | |||||
Other | 426,463 | 305,119 | |||||
Total | 5,412,433 | 4,894,236 | |||||
Deferred income tax liabilities: | |||||||
Net unrealized gain on investments | 6,073,431 | 6,781,994 | |||||
Recorded reserves for claims, net of statutory premium reserves | 3,322,336 | 2,871,114 | |||||
Excess of tax over book depreciation | 986,422 | — | |||||
Other | 733,250 | 656,621 | |||||
Total | 11,115,439 | 10,309,729 | |||||
Net deferred income tax liabilities | $ | (5,703,006 | ) | $ | (5,415,493 | ) | |
At December 31, 2015 and 2014, no valuation allowance was recorded. Based upon the Company’s historical results of operations, the existing financial condition of the Company and management’s assessment of all other available information, management believes that it is more likely than not that the benefit of these deferred income tax assets will be realized.
61
A reconciliation of income tax as computed for the years ended December 31 at the U.S. federal statutory income tax rate of 34.4% for 2015, 34.3% for 2014 and 34.1% for 2013, respectively, to income tax expense follows:
For the Years Ended December 31, | 2015 | 2014 | 2013 | ||||||||
Anticipated income tax expense | $ | 6,115,306 | $ | 4,626,555 | $ | 7,346,074 | |||||
Increase (decrease) related to: | |||||||||||
State income taxes, net of federal income tax benefit | 22,304 | 55,188 | 45,471 | ||||||||
Tax-exempt interest income (net of amortization) | (981,712 | ) | (876,365 | ) | (772,545 | ) | |||||
Other, net | 72,102 | 10,622 | 127,000 | ||||||||
Provision for income taxes | $ | 5,228,000 | $ | 3,816,000 | $ | 6,746,000 | |||||
In accounting for uncertainty in income taxes, the Company is required to recognize in its financial statements the impact of a tax position if that position is more likely than not of being sustained on an audit, based on the technical merits of the position. In this regard, an uncertain tax position represents the Company’s expected treatment of a tax position taken in a filed tax return, or planned to be taken in a future tax return, that has not been reflected in measuring income tax expense for financial reporting purposes. There were no unrecognized tax benefits or liabilities as of December 31, 2015.
The amount of unrecognized tax benefit or liability may increase or decrease in the future for various reasons, including adding amounts for current tax year positions, expiration of open income tax returns due to the expiration of the applicable statute of limitations, changes in management’s judgment about the level of uncertainty, status of examinations, litigation and legislative activity and the additions or eliminations of uncertain tax positions.
The Company’s policy is to report interest and penalties related to income taxes in the other line item in the Consolidated Statements of Income.
The Company, or one of its subsidiaries, files income tax returns in the U.S. federal jurisdiction and various states. With few exceptions, the Company is no longer subject to U.S. federal or state and local examinations by taxing authorities for years before 2012.
9. Leases
The Company leases certain office facilities and equipment under operating leases. Rental expense also includes occasional rental of automobiles. Rent expense totaled approximately $793,000, $766,000, and $699,000 in 2015, 2014 and 2013, respectively. The future minimum lease payments under operating leases that have initial or remaining noncancelable lease terms in excess of one year as of December 31, 2015, are summarized as follows:
Year Ended: | |||
2016 | $ | 658,060 | |
2017 | 448,792 | ||
2018 | 236,062 | ||
2019 | 107,124 | ||
2020 | 95,570 | ||
Thereafter | 81,397 | ||
Total | $ | 1,627,005 | |
10. Retirement Agreements and Other Postretirement Benefit Plan
The Company has a 401(k) savings plan. In order to participate in the plan, individuals must have worked at the Company for at least 3 months. In order to be eligible for employer contributions, individuals must be employed for one full year and work at least 1,000 hours annually. The Company makes a 3% Safe Harbor contribution and also has the option annually to make a discretionary profit share contribution. Individuals may elect to make contributions up to the maximum deductible amount as determined by the Internal Revenue Code. Expenses related to the 401(k) plan were approximately $741,000, $676,000 and $579,000 for 2015, 2014 and 2013, respectively.
62
In November 2003, ITIC, a wholly owned subsidiary of the Company, entered into employment agreements with the Chief Executive Officer, Chief Financial Officer and Chief Operating Officer of ITIC. These individuals also serve as the Chairman, President and Executive Vice President, respectively, of the Company. The agreements provide compensation and life, health, dental and vision benefits upon the occurrence of specific events, including death, disability, retirement, termination without cause or upon a change in control. The employment agreements also prohibit each of these executives from competing with ITIC and its parent, subsidiaries and affiliates in the North Carolina while employed by ITIC and for a period of two years following termination of their employment.
In addition, during the second quarter of 2004, ITIC entered into nonqualified deferred compensation plan agreements with these executives. The amount accrued for all agreements at December 31, 2015 and 2014 was approximately $7,818,000 and $7,111,000, respectively, which includes postretirement compensation and health benefits, and was calculated based on the terms of the contract. Both the 2015 and 2014 accruals are included in the accounts payable and accrued liabilities line item of the Consolidated Balance Sheets. These executive contracts are accounted for on an individual contract basis. On December 24, 2008, the executive contracts were amended effective January 1, 2009 to bring them into compliance with Section 409A of the Internal Revenue Code, and were amended and restated to provide for an annual cash payment to the officers equal to the amounts the Company would have contributed to their accounts under its 401(k) plan if such contributions were not limited by the federal tax laws, less the amount of any contributions that the Company actually makes to their accounts under the Company’s 401(k) plan.
On November 17, 2003, ITIC entered into employment agreements with key executives that provide for the continuation of certain employee benefits upon retirement. The executive employee benefits include health insurance, dental insurance, vision insurance and life insurance. The benefits are unfunded. Estimated future benefit payouts expected to be paid for each of the next five years are $9,119 in 2016, $13,456 in 2017, $18,511 in 2018, $20,198 in 2019, $22,007 in 2020 and $192,134 in the next five years thereafter.
Cost of the Company’s postretirement benefits included the following components:
2015 | 2014 | 2013 | |||||||||
Net periodic benefit cost | |||||||||||
Service cost – benefits earned during the year | $ | 16,748 | $ | 14,667 | $ | 15,782 | |||||
Interest cost on the projected benefit obligation | 30,772 | 30,472 | 28,412 | ||||||||
Amortization (accretion) of unrecognized prior service cost | 4,390 | 2,217 | (1,518 | ) | |||||||
Amortization of unrecognized loss | 3,514 | — | 6,293 | ||||||||
Net periodic benefits cost at end of year | $ | 55,424 | $ | 47,356 | $ | 48,969 | |||||
The Company is required to recognize the funded status (i.e., the difference between the fair value of the assets and the accumulated postretirement benefit obligations of its postretirement benefits) in its Consolidated Balance Sheet, with a corresponding adjustment to accumulated other comprehensive income, net of tax. The net amount in accumulated other comprehensive income is $(173,812), $(114,726) net of tax, for December 31, 2015, and $(118,150), $(77,988) net of tax, for December 31, 2014, and represents the net unrecognized actuarial losses and unrecognized prior service costs. The effects of the funded status on the Company’s Consolidated Balance Sheets at December 31, 2015 and 2014 are presented in the following table:
2015 | 2014 | ||||||
Funded status | |||||||
Actuarial present value of future benefits: | |||||||
Fully eligible active employee | $ | (483,985 | ) | $ | (409,492 | ) | |
Non-eligible active employees | (398,638 | ) | (362,045 | ) | |||
Plan assets | — | — | |||||
Funded status of accumulated postretirement benefit obligation, recognized in other liabilities | $ | (882,623 | ) | $ | (771,537 | ) | |
63
Development of the accumulated postretirement benefit obligation for the years ended December 31, 2015 and 2014 includes the following:
2015 | 2014 | ||||||
Accrued postretirement benefit obligation at beginning of year | $ | (771,537 | ) | $ | (679,277 | ) | |
Service cost – benefits earned during the year | (16,748 | ) | (14,667 | ) | |||
Interest cost on projected benefit obligation | (30,772 | ) | (30,472 | ) | |||
Actuarial loss | (63,566 | ) | (47,121 | ) | |||
Accrued postretirement benefit obligation at end of year | $ | (882,623 | ) | $ | (771,537 | ) | |
The changes in amounts related to accumulated other comprehensive income, pre-tax, are as follows:
2015 | 2014 | ||||||
Balance at beginning of year | $ | 118,150 | $ | 73,246 | |||
Components of accumulated other comprehensive income: | |||||||
Unrecognized prior service cost | (4,390 | ) | (2,217 | ) | |||
Amortization of loss, net | (3,514 | ) | — | ||||
Actuarial loss | 63,566 | 47,121 | |||||
Balance at end of year | $ | 173,812 | $ | 118,150 | |||
The amounts currently in accumulated other comprehensive income, pre-tax, that will be reclassified to the Consolidated Statements of Income and recognized as components of net periodic benefit costs in 2015 are:
Projected 2016 | |||
Amortization of unrecognized prior service cost | $ | — | |
Amortization of unrecognized loss | 8,941 | ||
Net periodic benefit cost at end of year | $ | 8,941 | |
Assumed health care cost trend rates do have an effect on the amounts reported for the postretirement benefit obligations. The following illustrates the effects on the net periodic postretirement benefit cost (“NPPBC”) and the accumulated postretirement benefit obligation (“APBO”) of a one percentage point increase and one percentage point decrease in the assumed health care cost trend rate as of December 31, 2015:
One Percentage Point Increase | One Percentage Point Decrease | ||||||
Net periodic postretirement benefit cost | |||||||
Effect on the service cost component | $ | 2,600 | $ | (1,989 | ) | ||
Effect on interest cost | 7,339 | (5,721 | ) | ||||
Total effect on the net periodic postretirement benefit cost | $ | 9,939 | $ | (7,710 | ) | ||
Accumulated postretirement benefit obligation (including active employees who are not fully eligible) | |||||||
Effect on those currently receiving benefits (retirees and spouses) | $ | — | $ | — | |||
Effect on active fully eligible | 81,657 | (65,192 | ) | ||||
Effect on actives not yet eligible | 101,813 | (77,845 | ) | ||||
Total effect on the accumulated postretirement benefit obligation | $ | 183,470 | $ | (143,037 | ) | ||
64
11. Commitments and Contingencies
Legal Proceedings. The Company and its subsidiaries are involved in legal proceedings that are incidental to their business. In the Company’s opinion, based on the present status of these proceedings, any potential liability of the Company or its subsidiaries with respect to these legal proceedings, will not, in the aggregate, be material to the Company’s consolidated financial condition or operations.
Regulation. The Company’s title insurance and trust subsidiaries are regulated by various federal, state and local governmental agencies and are subject to various audits and inquiries. It is the opinion of management based on its present expectations that these audits and inquiries will not have a material impact on the Company’s consolidated financial condition or operations.
Escrow and Trust Deposits. As a service to its customers, the Company, through ITIC, administers escrow and trust deposits representing earnest money received under real estate contracts, undisbursed amounts received for settlement of mortgage loans and indemnities against specific title risks. Cash held by the Company for these purposes was approximately $20,510,000 and $18,674,000 as of December 31, 2015 and 2014, respectively. These amounts are not considered assets of the Company and, therefore, are excluded from the accompanying Consolidated Balance Sheets. However, the Company remains contingently liable for the disposition of these deposits.
Like-Kind Exchange Proceeds. In administering tax-deferred property exchanges, the Company’s subsidiary, Investors Title Exchange Corporation (“ITEC”), serves as a qualified intermediary for exchanges, holding the net sales proceeds from relinquished property to be used for purchase of replacement property. Another Company subsidiary, Investors Title Accommodation Corporation (“ITAC”), serves as exchange accommodation titleholder and, through limited liability companies (“LLCs”) that are wholly owned subsidiaries of ITAC, holds property for exchangers in reverse exchange transactions. Like-kind exchange deposits and reverse exchange property totaled approximately $171,010,000 and $82,477,000 as of December 31, 2015 and 2014, respectively. These amounts are not considered assets of the Company and, therefore, are excluded from the accompanying Consolidated Balance Sheets; however, the Company remains contingently liable for the disposition of the transfers of property, disbursements of proceeds and the return on the proceeds at the agreed upon rate. Exchange services revenues include earnings on these deposits; therefore, investment income is shown as other revenue rather than investment income. These like-kind exchange funds are primarily invested in money market and other short-term investments.
Agency Relationship. On July 1, 2015, Title Resource Group LLC's wholly owned subsidiary, title insurer Texas American Title Company, acquired the assets of ITCOA, LLC, which does business throughout Texas as Independence Title. In 2015, 2014 and 2013 Independence Title originated 10.3%, 23.6% and 16.4%, respectively, of the net premiums written for the Company. Independence Title is under no legal commitment to remit a minimum amount of premiums to the Company, and could cease doing so at any time. A continued significant decline in business originated by Independence Title for the Company, whether due to that business being diverted to its new title insurer owner or otherwise, could have a material negative impact on the Company's premiums written. Any reduction in premiums would be largely offset by related reductions in commissions, premium and income taxes, the provision for claims and other operating expenses. The Company did not have any ownership interest in Independence Title before or after the July 1, 2015 acquisition by Texas American Title Company.
12. Segment Information
The Company has one reportable segment, title insurance services. The remaining immaterial segments have been combined into a group called “All Other.”
The title insurance segment primarily issues title insurance policies through approved attorneys from underwriting offices and through independent issuing agents. Title insurance policies insure titles to real estate.
65
Provided below is selected financial information about the Company’s operations by segment for the periods ended December 31, 2015, 2014 and 2013:
2015 | Title Insurance | All Other | Intersegment Eliminations | Total | |||||||||||
Insurance and other services revenues | $ | 118,144,981 | $ | 6,479,484 | $ | (1,839,549 | ) | $ | 122,784,916 | ||||||
Investment income | 4,073,857 | 574,132 | (116,670 | ) | 4,531,319 | ||||||||||
Net realized loss on investments | (13,603 | ) | (102,560 | ) | — | (116,163 | ) | ||||||||
Total revenues | $ | 122,205,235 | $ | 6,951,056 | $ | (1,956,219 | ) | $ | 127,200,072 | ||||||
Operating expenses | 104,594,829 | 6,598,055 | (1,769,865 | ) | 109,423,019 | ||||||||||
Income before income taxes | $ | 17,610,406 | $ | 353,001 | $ | (186,354 | ) | $ | 17,777,053 | ||||||
Total assets | $ | 163,582,898 | $ | 47,939,131 | $ | — | $ | 211,522,029 | |||||||
2014 | Title Insurance | All Other | Intersegment Eliminations | Total | |||||||||||
Insurance and other services revenues | $ | 114,279,532 | $ | 5,904,059 | $ | (1,592,100 | ) | $ | 118,591,491 | ||||||
Investment income | 3,835,209 | 517,628 | (93,336 | ) | 4,259,501 | ||||||||||
Net realized gain on investments | 213,709 | 54,585 | — | 268,294 | |||||||||||
Total revenues | $ | 118,328,450 | $ | 6,476,272 | $ | (1,685,436 | ) | $ | 123,119,286 | ||||||
Operating expenses | 105,290,627 | 5,862,577 | (1,522,416 | ) | 109,630,788 | ||||||||||
Income before income taxes | $ | 13,037,823 | $ | 613,695 | $ | (163,020 | ) | $ | 13,488,498 | ||||||
Total assets | $ | 153,072,950 | $ | 44,966,260 | $ | — | $ | 198,039,210 | |||||||
2013 | Title Insurance | All Other | Intersegment Eliminations | Total | |||||||||||
Insurance and other services revenues | $ | 118,153,904 | $ | 5,507,069 | $ | (1,499,884 | ) | $ | 122,161,089 | ||||||
Investment income | 3,599,106 | 388,838 | (93,336 | ) | 3,894,608 | ||||||||||
Net realized gain (loss) on investments | 225,661 | (29,861 | ) | — | 195,800 | ||||||||||
Total revenues | $ | 121,978,671 | $ | 5,866,046 | $ | (1,593,220 | ) | $ | 126,251,497 | ||||||
Operating expenses | 99,899,804 | 6,239,155 | (1,430,200 | ) | 104,708,759 | ||||||||||
Income (loss) before income taxes | $ | 22,078,867 | $ | (373,109 | ) | $ | (163,020 | ) | $ | 21,542,738 | |||||
Total assets | $ | 146,110,146 | $ | 42,195,670 | $ | — | $ | 188,305,816 | |||||||
13. Stockholders’ Equity
On November 12, 2002, the Company’s Board of Directors amended the Company’s Articles of Incorporation, creating a series of Class A Junior Participating Preferred Stock (the “Class A Preferred Stock”). The Class A Preferred Stock is senior to common stock in dividends or distributions of assets upon liquidations, dissolutions or winding up of the Company. Dividends on the Class A Preferred Stock are cumulative and accrue from the quarterly dividend payment date. Each share of Class A Preferred Stock entitles the holder thereof to 100 votes on all matters submitted to a vote of shareholders of the Company. These shares were reserved for issuance under the Shareholder Rights Plan (the “Plan”), which was adopted on November 21, 2002, by the Company’s Board of Directors. Under the terms of the Plan, the Company’s common stock acquired by a person or a group buying 15% or more of the Company’s common stock would be diluted, except in transactions approved by the Board of Directors.
In connection with the Plan, the Company’s Board of Directors declared a dividend distribution of one right (a “Right”) for each outstanding share of the Company’s common stock paid on December 16, 2002, to shareholders of record at the close of business on December 2, 2002. Each Right entitles the registered holder to purchase from the Company a unit (a “Unit”) consisting of one one-hundredth of a share of Class A Preferred Stock. Under the Plan, the Rights detach and become exercisable upon the earlier of (a) ten (10) days following public announcement that a person or group of affiliated or associated persons has acquired, or obtained the right to acquire, beneficial ownership of 15% or more of the outstanding shares of the Company’s common stock, or (b) ten (10) business days following the commencement of, or first public announcement of the intent of a person or group to commence, a tender offer or exchange offer that would result in a person or group beneficially owning 15% or more of such outstanding shares of the Company’s common stock. The exercise price, the kind and the number of shares covered by each right are subject to adjustment upon the occurrence of certain events described in the Plan.
66
If any person or group of affiliated or associated persons acquires beneficial ownership of 15% or more of the outstanding common stock, each holder of a Right (other than the acquiring person or group) will have the right to buy, at the exercise price, common stock of the Company having a market value of twice the exercise price. If the Company is acquired in a merger or consolidation in which the Company is not the surviving corporation, or the Company engages in a merger or consolidation in which the Company is the surviving corporation and the Company’s common stock is changed or exchanged, or more than 50% of the Company’s assets or earning power is sold or transferred, the Rights entitle a holder (other than the acquiring person or group) to buy, at the exercise price, stock of the acquiring company having a market value equal to twice the exercise price. At any time after a person or group of affiliated or associated persons has acquired beneficial ownership of 15% or more of the outstanding common stock and prior to the acquisition by such person or group of 50% or more of the outstanding common stock, the Company’s Board of Directors may exchange the Rights (other than the Rights owned by such person or group), in whole or in part, at an exchange ratio of one share of the Company’s common stock, or one one-hundredth of a share of Preferred Stock, per Right.
The Rights are redeemable upon action by the Board of Directors at a price of $0.01 per right at any time before they become exercisable. Until the Rights become exercisable, they are evidenced only by the common stock certificates and are transferred with and only with such certificates.
On October 31, 2012, the Plan was amended to, among other things, extend the expiration date of the plan from November 11, 2012 to October 31, 2022 and increase the exercise price of the stock purchase rights from $80 per unit to $220 per unit. In connection with the amendments to the shareholders’ rights plan, the Board of Directors of the Company also amended the Company’s Articles of Incorporation to increase the number of shares designated under the rights plan as Series A Participating Preferred Stock from 100,000 shares to 200,000 shares. There were 1,000,000 shares of Preferred Stock authorized as of December 31, 2015 and 2014, with 200,000, being designated Class A Junior Participating Preferred Stock.
14. Concentration of Credit Risk
Financial instruments that potentially subject the Company to concentrations of credit risk consist primarily of cash and cash equivalents. The Company invests its cash and cash equivalents into high credit quality security instruments. Deposits which exceed $250,000 at each institution are not insured by the Federal Deposit Insurance Corporation (“FDIC”). Of the $21.8 million in cash and cash equivalents at December 31, 2015, $21.3 million was not insured by the FDIC. Of the $15.8 million in cash and cash equivalents at December 31, 2014, $15.3 million was not insured by the FDIC. The Company mitigates the risk of having cash and cash equivalents not insured by the FDIC by monitoring the credit quality of the financial institutions in which the funds are held.
15. Business Concentration
The Company generates a significant amount of title insurance premiums in Texas, North Carolina and South Carolina. In 2015, 2014 and 2013, Texas accounted for 22.4%, 36.5% and 26.8% of total title premiums, respectively. In 2015, 2014 and 2013, North Carolina accounted for 32.8%, 28.4% and 27.4% of total title premiums, respectively. In 2015, 2014 and 2013, South Carolina accounted for 10.1%, 7.7% and 11.4% of total title premiums, respectively.
In 2015, 2014 and 2013, the Company had one agent that accounted for 10.3%, 23.6% and 16.4% of net premiums written, respectively. This agent was acquired by another title insurer during 2015. Refer to Note 11 for further information.
16. Related Party Transactions
The Company does business with, and has investments in, unconsolidated limited liability companies that are primarily title insurance agencies. The Company utilizes the equity method to account for its investments in these limited liability companies. The following table sets forth the approximate values by year found within each financial statement classification:
Financial Statement Classification, | 2015 | 2014 | |||||
Consolidated Balance Sheets | |||||||
Other investments | $ | 6,519,000 | $ | 6,014,000 | |||
Premiums and fees receivable | $ | 719,000 | $ | 666,000 | |||
Financial Statement Classification, | |||||||||||
Consolidated Statements of Income | 2015 | 2014 | 2013 | ||||||||
Net premiums written | $ | 14,015,000 | $ | 11,783,000 | $ | 12,442,000 | |||||
Other income | $ | 2,618,000 | $ | 2,043,000 | $ | 1,839,000 | |||||
Commissions to agents | $ | 9,700,000 | $ | 8,049,000 | $ | 8,465,000 | |||||
67
During the second quarter of 2013, the Company repurchased 17,524 shares of Company common stock from officers of the Company at a price of $71.50 per share to cover withholding taxes payable by the officers upon the exercise of SARs. During the fourth quarter of 2013, the Company repurchased 28,130 shares of Company common stock from officers of the Company at a price of $80.01 per share.
17. Acquisition
Effective August 1, 2015, a subsidiary of the Company, ITIC, acquired a 20% ownership interest in 1st Investors Title Agency, LLC ("1st Investors") for a purchase price of $72,600. 1st Investors, a Michigan limited liability company, is an insurance agency doing business in the State of Michigan. Prior to August 1, 2015, the Company had an ownership interest in 1st Investors of 45%. The Company's Consolidated Financial Statements include the accounts and operations of 1st Investors, based on the Company's resulting 65% ownership interest at August 1, 2015. ITIC’s purchase of 1st Investors was accounted for using the acquisition method required by ASC 805, Business Combinations. There were no intangible assets or goodwill recorded as a result of the acquisition.
In January 2012, ITIC entered into a membership interest purchase and sale agreement under which it agreed to acquire a majority ownership interest of United Title Agency Co., LLC (“United”). United, a Michigan limited liability company, is an insurance agency doing business in the State of Michigan. ITIC’s purchase of United was accounted for using the acquisition method required by ASC 805, Business Combinations. On April 2, 2012, ITIC purchased a 70% ownership interest in United, with both ITIC and the seller having the option to require ITIC to purchase the remaining 30% interest at a later date. ITIC purchased the 70% interest for a purchase price of $1,041,250. On May 21, 2014, ITIC purchased the remaining 30% ownership interest in United for an additional $515,275, making United a wholly owned subsidiary of ITIC.
The Company recognized the required identifiable intangible assets of United. There was no goodwill recorded as a result of the acquisition. The fair values of intangible assets, all Level 3 inputs, are principally based on values obtained from a third party valuation service. At closing of the initial acquisition, intangible assets included $645,685 relating to a non-compete contract resulting from the acquisition and $836,215 from referral relationships. The non-compete contract is being amortized over a 10-year period using the straight-line method, starting at a future date when the related employment agreement is terminated. The referral relationships are being amortized over a 12-year period using the straight-line method. At December 31, 2015 and 2014, accumulated amortization of intangible assets was $261,315 and $191,631, respectively. Net intangible assets of $1,220,585 and $1,290,269 are categorized as prepaid expenses and other assets in the Consolidated Balance Sheets as of December 31, 2015 and 2014. In accordance with ASC 350, Intangibles – Goodwill and Other, management determined that no events or changes in circumstances occurred that would indicate the carrying amount may not be recoverable, and therefore determined that the intangible assets assigned to United were not impaired at December 31, 2015.
The amortization of the non-compete contract will start at a future date when the related employment agreement is terminated. There are currently no plans to terminate the employment agreement, and the Company does not believe it is probable that termination of the employment agreement will occur within the calendar year. Assuming that the amortization of the non-complete agreement begins on the first day of 2017, estimated aggregate amortization expense for each of the five succeeding fiscal years are as follows:
Year Ended: | |||
2016 | $ | 69,685 | |
2017 | 134,253 | ||
2018 | 134,253 | ||
2019 | 134,253 | ||
2020 | 134,253 | ||
Thereafter | 613,888 | ||
Total | $ | 1,220,585 | |
68
A reconciliation of the noncontrolling interest equity of 1st Investors is presented in the Consolidated Statements of Stockholders’ Equity. The following table provides a reconciliation of total redeemable equity of United for the periods ended December 31, 2015, 2014 and 2013:
Changes in carrying value during the period ended: | 2015 | 2014 | 2013 | ||||||||
Beginning balance at January 1 | $ | — | $ | 545,489 | $ | 493,861 | |||||
Net income attributable to redeemable noncontrolling interest | — | 23,523 | 88,528 | ||||||||
Distributions to noncontrolling interest | — | (168,057 | ) | (36,900 | ) | ||||||
Redeemable noncontrolling interest resulting from subsidiary purchase | — | (515,275 | ) | — | |||||||
Adjustment to retained earnings for purchase of noncontrolling interest | — | 114,320 | — | ||||||||
Balance, net | $ | — | $ | — | $ | 545,489 | |||||
18. Accumulated Other Comprehensive Income
The following tables provide changes in the balances of each component of accumulated other comprehensive income, net of tax, for the periods ended December 31, 2015, 2014 and 2013:
2015 | Unrealized Gains and Losses On Available-for-Sale Securities | Postretirement Benefits Plans | Total | ||||||||
Beginning balance at January 1 | $ | 12,934,497 | $ | (77,988 | ) | $ | 12,856,509 | ||||
Other comprehensive loss before reclassifications | (1,355,316 | ) | (41,954 | ) | (1,397,270 | ) | |||||
Amounts reclassified from accumulated other comprehensive income (loss) | 18,560 | 5,216 | 23,776 | ||||||||
Net current-period other comprehensive loss | (1,336,756 | ) | (36,738 | ) | (1,373,494 | ) | |||||
Ending balance | $ | 11,597,741 | $ | (114,726 | ) | $ | 11,483,015 | ||||
2014 | Unrealized Gains and Losses On Available-for-Sale Securities | Postretirement Benefits Plans | Total | ||||||||
Beginning balance at January 1 | $ | 11,395,757 | $ | (48,353 | ) | $ | 11,347,404 | ||||
Other comprehensive income (loss) before reclassifications | 1,874,111 | (31,100 | ) | 1,843,011 | |||||||
Amounts reclassified from accumulated other comprehensive income (loss) | (335,371 | ) | 1,465 | (333,906 | ) | ||||||
Net current-period other comprehensive income (loss) | 1,538,740 | (29,635 | ) | 1,509,105 | |||||||
Ending balance | $ | 12,934,497 | $ | (77,988 | ) | $ | 12,856,509 | ||||
2013 | Unrealized Gains and Losses On Available-for-Sale Securities | Postretirement Benefits Plans | Total | ||||||||
Beginning balance at January 1 | $ | 8,920,884 | $ | (102,454 | ) | $ | 8,818,430 | ||||
Other comprehensive income before reclassifications | 2,605,184 | 50,961 | 2,656,145 | ||||||||
Amounts reclassified from accumulated other comprehensive income (loss) | (130,311 | ) | 3,140 | (127,171 | ) | ||||||
Net current-period other comprehensive income | 2,474,873 | 54,101 | 2,528,974 | ||||||||
Ending balance | $ | 11,395,757 | $ | (48,353 | ) | $ | 11,347,404 | ||||
69
The following tables provide significant amounts reclassified out of each component of accumulated other comprehensive income for the periods ended December 31, 2015, 2014 and 2013:
2015 | |||||
Details about Accumulated Other Comprehensive Income Components | Amount Reclassified from Accumulated Other Comprehensive Income | Affected Line Item in the Consolidated Statements of Income | |||
Unrealized gains and losses on available-for-sale securities: | |||||
Net realized gain on investment | $ | 718,837 | |||
Other-than-temporary impairments | (751,059 | ) | |||
Total | $ | (32,222 | ) | Net realized (loss) gain on investment | |
Tax | 13,662 | Provision for Income Taxes | |||
Net of Tax | $ | (18,560 | ) | ||
Amortization related to postretirement benefit plans: | |||||
Prior year service cost | $ | (4,390 | ) | ||
Unrecognized loss | (3,514 | ) | |||
Total | $ | (7,904 | ) | (a) | |
Tax | 2,688 | Provision for Income Taxes | |||
Net of Tax | $ | (5,216 | ) | ||
Reclassifications for the period | $ | (23,776 | ) | ||
2014 | |||||
Details about Accumulated Other Comprehensive Income Components | Amount Reclassified from Accumulated Other Comprehensive Income | Affected Line Item in the Consolidated Statements of Income | |||
Unrealized gains and losses on available-for-sale securities: | |||||
Net realized gain on investment | $ | 518,279 | |||
Other-than-temporary impairments | (14,542 | ) | |||
Total | $ | 503,737 | Net realized (loss) gain on investment | ||
Tax | (168,366 | ) | Provision for Income Taxes | ||
Net of Tax | $ | 335,371 | |||
Amortization related to postretirement benefit plans: | |||||
Prior year service cost | $ | (2,217 | ) | ||
Unrecognized loss | — | ||||
Total | $ | (2,217 | ) | (a) | |
Tax | 752 | Provision for Income Taxes | |||
Net of Tax | $ | (1,465 | ) | ||
Reclassifications for the period | $ | 333,906 | |||
70
2013 | |||||
Details about Accumulated Other Comprehensive Income Components | Amount Reclassified from Accumulated Other Comprehensive Income | Affected Line Item in the Consolidated Statements of Income | |||
Unrealized gains and losses on available-for-sale securities: | |||||
Net realized gain on investment | $ | 229,869 | |||
Other-than-temporary impairments | (34,070 | ) | |||
Total | $ | 195,799 | Net realized (loss) gain on investment | ||
Tax | (65,488 | ) | Provision for Income Taxes | ||
Net of Tax | $ | 130,311 | |||
Accretion (amortization) related to postretirement benefit plans: | |||||
Prior year service cost | $ | 1,518 | |||
Unrecognized loss | (6,293 | ) | |||
Total | $ | (4,775 | ) | (a) | |
Tax | 1,635 | Provision for Income Taxes | |||
Net of Tax | $ | (3,140 | ) | ||
Reclassifications for the period | $ | 127,171 | |||
(a) | These accumulated other comprehensive income components are not reclassified to net income in their entirety in the same reporting period. The amounts are presented within salaries, employee benefits and payroll taxes on the Consolidated Statements of Income as amortized. Amortization related to postretirement benefit plans is included in the computation of net periodic pension costs, as discussed in Note 10. |
71
ITEM 9. CHANGES IN AND DISAGREEMENTS WITH ACCOUNTANTS ON ACCOUNTING AND FINANCIAL DISCLOSURE
None
ITEM 9A. CONTROLS AND PROCEDURES
Disclosure Controls and Procedures
The Company’s disclosure controls and procedures are designed to ensure that information required to be disclosed by the Company in the reports that it files or submits under the Securities Exchange Act of 1934 (the “Exchange Act”) is recorded, processed, summarized and reported within the time periods specified by the Securities and Exchange Commission’s rules and forms. Disclosure controls and procedures include controls and procedures designed to ensure that information required to be disclosed in such reports is accumulated and communicated to the Company’s management as appropriate to allow timely decisions regarding required disclosure.
No system of controls, no matter how well designed and operated, can provide absolute assurance that the objectives of the system of controls are met, and no evaluation of controls can provide absolute assurance that the system of controls has operated effectively in all cases. The Company’s disclosure controls and procedures, however, are designed to provide reasonable assurance that the objectives of disclosure controls and procedures are met.
Pursuant to Rule 13a-15(b) under the Exchange Act, an evaluation was performed under the supervision and with the participation of the Company’s management, including its Chief Executive Officer and Chief Financial Officer, of the effectiveness of the design and operation of the Company’s disclosure controls and procedures. Based on that evaluation, the Company’s Chief Executive Officer and Chief Financial Officer concluded that the Company’s disclosure controls and procedures were effective as of December 31, 2015 to provide reasonable assurance that the objectives of disclosure controls and procedures are met.
Changes in Internal Control Over Financial Reporting
During the quarter ended December 31, 2015, there were no changes in the Company’s internal control over financial reporting that have materially affected, or are reasonably likely to materially affect, the Company’s internal control over financial reporting.
Reports of Management and Independent Registered Public Accounting Firm on Internal Control Over Financial Reporting
Management has assessed, and the Company’s independent registered public accounting firm, Dixon Hughes Goodman LLP, has audited, the Company’s internal control over financial reporting as of December 31, 2015. The reports of management and Dixon Hughes Goodman LLP thereon are included in Item 8 of this Annual Report on Form 10-K and are incorporated by reference herein.
ITEM 9B. OTHER INFORMATION
There was no information required to be disclosed in a report on Form 8-K during the fourth quarter of the year that has not been reported.
72
PART III
ITEM 10. DIRECTORS, EXECUTIVE OFFICERS AND CORPORATE GOVERNANCE
The information called for by this item is incorporated by reference to the material under the captions “Proposals Requiring Your Vote – Proposal 1 – Election of Directors,” “General Information - Section 16(a) Beneficial Ownership Reporting Compliance,” “Corporate Governance – Board of Directors and Committees – The Audit Committee” and “Corporate Governance – Code of Business Conduct and Ethics” in the Company’s definitive Proxy Statement for the Annual Meeting of Shareholders to be held on May 18, 2016. Other information with respect to the executive officers of the Company is included at the end of Part I of this Annual Report on Form 10-K under the separate caption “Executive Officers of the Company.”
ITEM 11. EXECUTIVE COMPENSATION
The information called for by this item is set forth under the captions “Executive Compensation” and “Compensation of Directors” in the Company’s definitive Proxy Statement relating to the Annual Meeting of Shareholders to be held on May 18, 2016 and is incorporated by reference in this Annual Report on Form 10-K.
ITEM 12. SECURITY OWNERSHIP OF CERTAIN BENEFICIAL OWNERS AND MANAGEMENT AND RELATED STOCKHOLDER MATTERS
The information pertaining to securities ownership of certain beneficial owners and management is set forth under the caption “Stock Ownership of Certain Beneficial Owners and Management” in the Company’s definitive Proxy Statement relating to the Annual Meeting of Shareholders to be held on May 18, 2016 and is incorporated by reference in this Annual Report on Form 10-K.
The following table provides information about the Company’s compensation plans under which equity securities are authorized for issuance as of December 31, 2015. The Company does not have any equity compensation plans that have not been approved by its shareholders.
Equity Compensation Plan Information
Plan Category | Number of Securities to be Issued Upon Exercise of Outstanding Options, Warrants and Rights | Weighted Average Exercise Price of Outstanding Options, Warrants and Rights | Number of Securities Remaining Available for Future Issuance Under Equity Compensation Plans | ||||||
Equity compensation plans approved by shareholders | 22,000 | $ | 57.04 | 232,000 | |||||
Equity compensation plans not approved by shareholders | — | — | — | ||||||
Total | 22,000 | $ | 57.04 | 232,000 | |||||
ITEM 13. CERTAIN RELATIONSHIPS AND RELATED TRANSACTIONS, AND DIRECTOR INDEPENDENCE
The information called for by this item is set forth under the captions “Certain Relationships and Related Transactions,” “Corporate Governance – Independent Directors” and “Proposals Requiring Your Vote – Proposal 1 – Election of Directors” set forth in the Company’s definitive Proxy Statement relating to the Annual Meeting of Shareholders to be held on May 18, 2016 and is incorporated by reference in this Annual Report on Form 10-K.
ITEM 14. PRINCIPAL ACCOUNTANT FEES AND SERVICES
The information pertaining to principal accountant fees and services is set forth under the caption “Proposals Requiring Your Vote – Proposal 3 – Ratification of Appointment of Independent Registered Public Accounting Firm” in the Company’s definitive Proxy Statement relating to the Annual Meeting of Shareholders to be held on May 18, 2016 and is incorporated by reference in this Annual Report on Form 10-K.
73
PART IV
ITEM 15. EXHIBITS, FINANCIAL STATEMENT SCHEDULES
(a)(1) Financial Statements
The following financial statements are filed under Item 8 of this Annual Report on Form 10-K:
Report of Independent Registered Public Accounting Firm
Management’s Report on Internal Control Over Financial Reporting
Report of Independent Registered Public Accounting Firm
Consolidated Balance Sheets as of December 31, 2015 and 2014
Consolidated Statements of Income for the Years Ended December 31, 2015, 2014 and 2013
Consolidated Statements of Comprehensive Income for the Years Ended December 31, 2015, 2014 and 2013
Consolidated Statements of Stockholders’ Equity for the Years Ended December 31, 2015, 2014 and 2013
Consolidated Statements of Cash Flows for the Years Ended December 31, 2015, 2014 and 2013
Notes to Consolidated Financial Statements
(a)(2) Financial Statement Schedules
The following is a list of financial statement schedules filed as part of this Form 10-K Annual Report:
Schedule Number | Description | |
I | Summary of Investments - Other Than Investments in Related Parties | |
II | Condensed Financial Information of Registrant | |
III | Supplementary Insurance Information | |
IV | Reinsurance | |
V | Valuation and Qualifying Accounts | |
All other schedules are omitted, as the required information either is not applicable, is not required, or is presented in the Consolidated Financial Statements or the notes thereto.
(a)(3) Exhibits
The exhibits filed as a part of this report and incorporated herein by reference to other documents are listed in the Index to Exhibits to this Annual Report on Form 10-K.
74
SIGNATURES
Pursuant to the requirements of Section 13 or 15(d) of the Securities Exchange Act of 1934, the registrant has duly caused this report to be signed on its behalf by the undersigned, thereunto duly authorized.
INVESTORS TITLE COMPANY | ||
(Registrant) | ||
By: | /s/ J. Allen Fine | |
J. Allen Fine, Chairman and Chief Executive | ||
Officer (Principal Executive Officer) | ||
March 11, 2016 | ||
Pursuant to the requirements of the Securities Exchange Act of 1934, this report has been signed below by the following persons on behalf of the Registrant and in the capacities indicated on the 11th day of March, 2016.
/s/ J. Allen Fine | /s/ R. Horace Johnson | |
J. Allen Fine, Chairman of the Board and | R. Horace Johnson, Director | |
Chief Executive Officer | ||
(Principal Executive Officer) | ||
/s/ James A. Fine, Jr. | /s/ H. Joe King, Jr. | |
James A. Fine, Jr., President, Treasurer and | H. Joe King, Jr., Director | |
Director (Principal Financial Officer and | ||
Principal Accounting Officer) | ||
/s/ W. Morris Fine | /s/ James R. Morton | |
W. Morris Fine, Executive Vice President, | James R. Morton, Director | |
Secretary and Director | ||
/s/ David L. Francis | /s/ James H. Speed, Jr. | |
David L. Francis, Director | James H. Speed, Jr., Director | |
/s/ Richard M. Hutson, II | ||
Richard M. Hutson, II, Director | ||
75
SCHEDULE I
INVESTORS TITLE COMPANY AND SUBSIDIARIES
SUMMARY OF INVESTMENTS - OTHER THAN INVESTMENTS IN RELATED PARTIES
AS OF DECEMBER 31, 2015
Type of Investment | Cost (1) | Market Value | Amount at which shown in the Balance Sheet (2) | ||||||||
Fixed maturities: | |||||||||||
Bonds: | |||||||||||
General obligations of U.S. states, territories and political subdivisions | $ | 31,670,491 | $ | 32,648,914 | $ | 32,648,914 | |||||
Special revenue issuer obligations of U.S. states, territories and political subdivisions | 40,563,639 | 42,452,224 | 42,452,224 | ||||||||
Public utilities | 11,852,124 | 12,539,002 | 12,539,002 | ||||||||
Corporate debt securities | 17,004,985 | 17,486,344 | 17,486,344 | ||||||||
Auction rate securities | 924,587 | 939,900 | 939,900 | ||||||||
Total fixed maturities | 102,015,826 | 106,066,384 | 106,066,384 | ||||||||
Equity securities: | |||||||||||
Common stocks: | |||||||||||
Public utilities | 563,857 | 778,908 | 778,908 | ||||||||
Banks, trusts and insurance companies | 4,839,060 | 6,242,784 | 6,242,784 | ||||||||
Industrial, miscellaneous and all other | 15,988,095 | 25,916,387 | 25,916,387 | ||||||||
Technology | 2,464,861 | 4,575,385 | 4,575,385 | ||||||||
Total equity securities | 23,855,873 | 37,513,464 | 37,513,464 | ||||||||
Other investments: | |||||||||||
Short-term investments | 6,865,406 | 6,865,406 | 6,865,406 | ||||||||
Other investments | 9,217,947 | 9,217,947 | 9,217,947 | ||||||||
Total other investments | 16,083,353 | 16,083,353 | 16,083,353 | ||||||||
Total investments (3) | $ | 141,955,052 | $ | 159,663,201 | $ | 159,663,201 | |||||
(1) Fixed maturities are shown at amortized cost and equity securities are shown at original cost.
(2) All fixed maturities presented are classified as available-for-sale and shown at estimated fair value. Equity securities are shown at fair value.
(3) The above summary of investments does not include investments in related parties accounted for under the cost and equity methods of accounting in the amount of $888,881.
76
SCHEDULE II
INVESTORS TITLE COMPANY (PARENT COMPANY)
CONDENSED FINANCIAL INFORMATION OF REGISTRANT
BALANCE SHEETS
AS OF DECEMBER 31, 2015 AND 2014
2015 | 2014 | ||||||
Assets: | |||||||
Cash and cash equivalents | $ | 8,347,004 | $ | 7,942,481 | |||
Investments in fixed maturities, available-for-sale | 21,779,123 | 24,358,323 | |||||
Investments in equity securities, available-for-sale | 2,638,330 | 2,529,982 | |||||
Short-term investments | 3,005,647 | 284,069 | |||||
Investments in affiliated companies | 99,951,433 | 96,395,352 | |||||
Other investments | 3,089,550 | 1,578,236 | |||||
Premium and fees receivable | 43,690 | 56,428 | |||||
Other receivables | 3,080,245 | 2,220,330 | |||||
Income taxes recoverable | 1,733,314 | 1,876,242 | |||||
Accrued interest and dividends | 120,369 | 128,221 | |||||
Property, net | 2,288,776 | 2,371,078 | |||||
Total Assets | $ | 146,077,481 | $ | 139,740,742 | |||
Liabilities and Stockholders’ Equity | |||||||
Liabilities: | |||||||
Accounts payable and accrued liabilities | $ | 3,267,274 | $ | 2,074,347 | |||
Deferred income taxes, net | 140,325 | 102,689 | |||||
Total liabilities | 3,407,599 | 2,177,036 | |||||
Stockholders’ Equity: | |||||||
Preferred stock (1,000,000 authorized shares; no shares issued) | — | — | |||||
Common stock - no par value (10,000,000 authorized shares; 1,949,797 and 2,023,270 shares issued and outstanding 2015 and 2014, respectively, excluding 291,676 shares for 2015 and 2014 of common stock held by the Company’s subsidiary) | 1 | 1 | |||||
Retained earnings | 131,186,866 | 124,707,196 | |||||
Accumulated other comprehensive income | 11,483,015 | 12,856,509 | |||||
Total stockholders’ equity | 142,669,882 | 137,563,706 | |||||
Total Liabilities and Stockholders’ Equity | $ | 146,077,481 | $ | 139,740,742 | |||
See notes to Condensed Financial Statements.
77
SCHEDULE II
INVESTORS TITLE COMPANY (PARENT COMPANY)
CONDENSED FINANCIAL INFORMATION OF REGISTRANT
STATEMENTS OF INCOME
FOR THE YEARS ENDED DECEMBER 31, 2015, 2014 AND 2013
2015 | 2014 | 2013 | ||||||||||
Revenues: | ||||||||||||
Investment income – interest and dividends | $ | 535,963 | $ | 482,711 | $ | 348,933 | ||||||
Net realized (loss) gain on investments | (152,026 | ) | 9,169 | (50,778 | ) | |||||||
Rental income | 765,134 | 772,256 | 748,764 | |||||||||
Miscellaneous income | 385,058 | 59,569 | 68,966 | |||||||||
Total | 1,534,129 | 1,323,705 | 1,115,885 | |||||||||
Operating Expenses: | ||||||||||||
Salaries, employee benefits and payroll taxes | 651,957 | 673,729 | 576,429 | |||||||||
Office occupancy and operations | 239,176 | 270,881 | 408,373 | |||||||||
Business development | 76,684 | 49,059 | 45,022 | |||||||||
Taxes – other than payroll and income | 213,466 | 200,718 | 188,314 | |||||||||
Professional and contract labor fees | 378,265 | 192,064 | 351,093 | |||||||||
Other expenses | 198,788 | 193,681 | 177,810 | |||||||||
Total | 1,758,336 | 1,580,132 | 1,747,041 | |||||||||
Equity in Net Income of Affiliated Companies | 12,640,260 | 9,777,925 | 15,164,894 | |||||||||
Income before Income Taxes | 12,416,053 | 9,521,498 | 14,533,738 | |||||||||
Income Tax Benefit | (133,000 | ) | (151,000 | ) | (263,000 | ) | ||||||
Net Income | 12,549,053 | 9,672,498 | 14,796,738 | |||||||||
Net Income Attributable to Noncontrolling Interests | (15,148 | ) | (23,523 | ) | (88,528 | ) | ||||||
Net Income Attributable to the Company | $ | 12,533,905 | $ | 9,648,975 | $ | 14,708,210 | ||||||
Basic Earnings per Common Share | $ | 6.32 | $ | 4.75 | $ | 7.15 | ||||||
Weighted Average Shares Outstanding – Basic | 1,984,360 | 2,031,760 | 2,056,169 | |||||||||
Diluted Earnings per Common Share | $ | 6.30 | $ | 4.74 | $ | 7.08 | ||||||
Weighted Average Shares Outstanding – Diluted | 1,989,799 | 2,037,534 | 2,076,628 | |||||||||
Cash Dividends Paid per Common Share | $ | 0.40 | $ | 0.32 | $ | 0.32 | ||||||
See notes to Condensed Financial Statements.
78
SCHEDULE II
INVESTORS TITLE COMPANY (PARENT COMPANY)
CONDENSED FINANCIAL INFORMATION OF REGISTRANT
STATEMENTS OF CASH FLOWS
FOR THE YEARS ENDED DECEMBER 31, 2015, 2014 AND 2013
2015 | 2014 | 2013 | |||||||||
Operating Activities | |||||||||||
Net income | $ | 12,549,053 | $ | 9,672,498 | $ | 14,796,738 | |||||
Adjustments to reconcile net income to net cash provided by (used in) operating activities: | |||||||||||
Equity in net earnings of subsidiaries | (12,640,260 | ) | (9,777,925 | ) | (15,164,894 | ) | |||||
Depreciation | 112,690 | 136,369 | 136,031 | ||||||||
Amortization, net | 192,654 | 210,768 | 69,969 | ||||||||
Issuance of common stock in payment of bonuses and fees | 137,759 | 164,730 | 76,110 | ||||||||
Net loss on disposals of property | 1,683 | 2,722 | — | ||||||||
Net realized loss (gain) on investments | 152,026 | (19,231 | ) | 50,778 | |||||||
Net (earnings) loss from other investments | (237,686 | ) | 322 | (32,499 | ) | ||||||
Provision (benefit) for deferred income taxes | 13,000 | (40,000 | ) | (93,000 | ) | ||||||
Increase in receivables | (847,177 | ) | (685,052 | ) | (146,247 | ) | |||||
Decrease (increase) in income taxes recoverable | 142,928 | 1,354,735 | (1,646,373 | ) | |||||||
Decrease (increase) in other assets | 7,852 | (24,650 | ) | (101 | ) | ||||||
Increase (decrease) in accounts payable and accrued liabilities | 1,192,927 | 516,252 | (8,118 | ) | |||||||
Net cash provided by (used in) operating activities | 777,449 | 1,511,538 | (1,961,606 | ) | |||||||
Investing Activities | |||||||||||
Dividends received from subsidiaries | 7,630,835 | 5,051,664 | 9,252,919 | ||||||||
Purchases of available-for-sale securities | (260,044 | ) | (6,883,612 | ) | (10,360,919 | ) | |||||
Purchases of short-term securities | (2,721,578 | ) | (104,207 | ) | (58,283 | ) | |||||
Purchases of and net earnings from other investments | (2,007,798 | ) | (964,197 | ) | (49,485 | ) | |||||
Proceeds from sales and maturities of available-for-sale securities | 2,475,557 | 1,631,987 | 3,027,896 | ||||||||
Proceeds from sales and maturities of short-term securities | — | 2,033,634 | 2,748,876 | ||||||||
Proceeds from sales and distributions of other investments | 734,170 | 123,017 | 45,384 | ||||||||
Proceeds from sales of other assets | — | — | 4,832 | ||||||||
Purchases of property | (32,071 | ) | (5,200 | ) | (24,820 | ) | |||||
Proceeds from disposals of property | — | — | 7,200 | ||||||||
Net cash provided by investing activities | 5,819,071 | 883,086 | 4,593,600 | ||||||||
Financing Activities | |||||||||||
Repurchases of common stock | (5,483,953 | ) | (1,055,765 | ) | (4,262,260 | ) | |||||
Exercise of options | 54,988 | 27,100 | 75,797 | ||||||||
Excess tax benefit | 26,875 | 15,999 | 9,042 | ||||||||
Dividends paid | (789,907 | ) | (650,433 | ) | (657,914 | ) | |||||
Net cash used in financing activities | (6,191,997 | ) | (1,663,099 | ) | (4,835,335 | ) | |||||
Net Increase (Decrease) in Cash and Cash Equivalents | 404,523 | 731,525 | (2,203,341 | ) | |||||||
Cash and Cash Equivalents, Beginning of Period | 7,942,481 | 7,210,956 | 9,414,297 | ||||||||
Cash and Cash Equivalents, End of Period | $ | 8,347,004 | $ | 7,942,481 | $ | 7,210,956 | |||||
Supplemental Disclosures: | |||||||||||
Income tax payments, net | $ | 4,598,000 | $ | 2,699,000 | $ | 5,583,000 | |||||
See notes to Condensed Financial Statements.
79
SCHEDULE II
INVESTORS TITLE COMPANY (PARENT COMPANY)
CONDENSED FINANCIAL INFORMATION OF REGISTRANT
NOTES TO THE CONDENSED FINANCIAL STATEMENTS
FOR THE YEARS ENDED DECEMBER 31, 2015, 2014 AND 2013
1. | The accompanying Condensed Financial Statements should be read in conjunction with the consolidated financial statements and notes thereto of Investors Title Company and Subsidiaries. |
2. | Cash dividends paid to Investors Title Company by its wholly owned subsidiaries were as follows: |
Subsidiaries | 2015 | 2014 | 2013 | ||||||||
Investors Title Insurance Company, net* | $ | 7,134,823 | $ | 4,906,664 | $ | 9,102,919 | |||||
Investors Title Exchange Corporation | 245,000 | 50,000 | 50,000 | ||||||||
Investors Title Accommodation Corporation | 12,000 | 10,000 | — | ||||||||
Investors Capital Management Company | 9,012 | 40,000 | — | ||||||||
Investors Trust Company | — | — | 100,000 | ||||||||
Investors Title Commercial Agency, LLC | 230,000 | 45,000 | — | ||||||||
Total | $ | 7,630,835 | $ | 5,051,664 | $ | 9,252,919 | |||||
* Total dividends of $7,251,493, $5,000,000 and $9,196,255 paid to the Parent Company in 2015, 2014 and 2013, respectively, netted with dividends of $116,670, $93,336 and $93,336 received from the Parent Company in 2015, 2014 and 2013, respectively.
80
SCHEDULE III
INVESTORS TITLE COMPANY AND SUBSIDIARIES
SUPPLEMENTARY INSURANCE INFORMATION
FOR THE YEARS ENDED DECEMBER 31, 2015, 2014 AND 2013
Segment | Deferred Policy Acquisition Cost | Future Policy Benefits, Losses, Claims and Loss Expenses | Unearned Premiums | Other Policy Claims and Benefits Payable | Premium Revenue | Net Investment Income | Benefits, Claims. Losses and Settlement Expenses | Amortization of Deferred Policy Acquisition Costs | Other Operating Expenses | Premiums Written | |||||||||||||||||||||||||||
Year Ended December 31, 2015 | |||||||||||||||||||||||||||||||||||||
Title Insurance | $ | — | $ | 37,788,000 | $ | — | $ | 341,191 | $ | 112,475,686 | $ | 3,957,187 | $ | 4,478,494 | $ | — | $ | 98,417,207 | N/A | ||||||||||||||||||
All Other | — | — | — | — | — | 574,132 | — | — | 6,527,318 | N/A | |||||||||||||||||||||||||||
$ | — | $ | 37,788,000 | $ | — | $ | 341,191 | $ | 112,475,686 | $ | 4,531,319 | $ | 4,478,494 | $ | — | $ | 104,944,525 | N/A | |||||||||||||||||||
Year Ended December 31, 2014 | |||||||||||||||||||||||||||||||||||||
Title Insurance | $ | — | $ | 36,677,000 | $ | — | $ | 236,401 | $ | 109,963,556 | $ | 3,741,873 | $ | 5,229,716 | $ | — | $ | 98,620,374 | N/A | ||||||||||||||||||
All Other | — | — | — | — | — | 517,628 | — | — | 5,780,698 | N/A | |||||||||||||||||||||||||||
$ | — | $ | 36,677,000 | $ | — | $ | 236,401 | $ | 109,963,556 | $ | 4,259,501 | $ | 5,229,716 | $ | — | $ | 104,401,072 | N/A | |||||||||||||||||||
Year Ended December 31, 2013 | |||||||||||||||||||||||||||||||||||||
Title Insurance | $ | — | $ | 35,360,000 | $ | — | $ | 389,807 | $ | 113,886,266 | $ | 3,505,770 | $ | (571,596 | ) | $ | — | $ | 99,093,515 | N/A | |||||||||||||||||
All Other | — | — | — | — | — | 388,838 | — | — | 6,186,840 | N/A | |||||||||||||||||||||||||||
$ | — | $ | 35,360,000 | $ | — | $ | 389,807 | $ | 113,886,266 | $ | 3,894,608 | $ | (571,596 | ) | $ | — | $ | 105,280,355 | N/A | ||||||||||||||||||
81
SCHEDULE IV
INVESTORS TITLE COMPANY AND SUBSIDIARIES
REINSURANCE
FOR THE YEARS ENDED DECEMBER 31, 2015, 2014 AND 2013
Gross Amount | Ceded to Other Companies | Assumed from Other Companies | Net Amount | Percentages of Amount Assumed to Net | ||||||||||||||
Year Ended December 31, 2015 | ||||||||||||||||||
Title Insurance | $ | 112,656,750 | $ | 214,667 | $ | 33,603 | $ | 112,475,686 | 0.03 | % | ||||||||
Year Ended December 31, 2014 | ||||||||||||||||||
Title Insurance | $ | 110,065,581 | $ | 140,017 | $ | 37,992 | $ | 109,963,556 | 0.03 | % | ||||||||
Year Ended December 31, 2013 | ||||||||||||||||||
Title Insurance | $ | 114,091,457 | $ | 211,482 | $ | 6,291 | $ | 113,886,266 | 0.01 | % | ||||||||
82
SCHEDULE V
INVESTORS TITLE COMPANY AND SUBSIDIARIES
VALUATION AND QUALIFYING ACCOUNTS
FOR THE YEARS ENDED DECEMBER 31, 2015, 2014 AND 2013
Description | Balance at Beginning of Period | Additions Charged to Costs and Expenses | Additions Charge to Other Accounts - Describe | Deductions - Describe | Balance at End of Period | |||||||||||||||
2015 | ||||||||||||||||||||
Premiums Receivable: | ||||||||||||||||||||
Valuation Provision | $ | 3,022,731 | $ | 6,267,911 | $ | — | $ | (5,737,863 | ) | (a) | $ | 3,552,779 | ||||||||
Reserves for Claims | $ | 36,677,000 | $ | 4,478,494 | $ | — | $ | (3,367,494 | ) | (b) | $ | 37,788,000 | ||||||||
2014 | ||||||||||||||||||||
Premiums Receivable: | ||||||||||||||||||||
Valuation Provision | $ | 2,620,903 | $ | 6,287,694 | $ | — | $ | (5,885,866 | ) | (a) | $ | 3,022,731 | ||||||||
Reserves for Claims | $ | 35,360,000 | $ | 5,229,716 | $ | — | $ | (3,912,716 | ) | (b) | $ | 36,677,000 | ||||||||
2013 | ||||||||||||||||||||
Premiums Receivable: | ||||||||||||||||||||
Valuation Provision | $ | 1,902,581 | $ | 7,536,381 | $ | — | $ | (6,818,059 | ) | (a) | $ | 2,620,903 | ||||||||
Reserves for Claims | $ | 39,078,000 | $ | (571,596 | ) | $ | — | $ | (3,146,404 | ) | (b) | $ | 35,360,000 | |||||||
(a) | Canceled premiums |
(b) | Payments of claims, net of recoveries |
83
INDEX TO EXHIBITS
Exhibit Number | Description | Location | |
3.1(a) | Articles of Incorporation dated January 22, 1973 | Incorporated by reference to Exhibit 4.1 to Form S-8 filed August 10, 2009, File No. 333-161209 | |
3.1(b) | Articles of Amendment to the Articles of Incorporation, dated February 8, 1973 | Incorporated by reference to Exhibit 4.2 to Form S-8 filed August 10, 2009, File No. 333-161209 | |
3.1(c) | Articles of Amendment to Articles of Incorporation, dated May 14, 1987 | Incorporated by reference to Exhibit 4.3 to Form S-8 filed August 10, 2009, File No. 333-161209 | |
3.1(d) | Articles of Amendment to Articles of Incorporation, dated May 15, 2002 | Incorporated by reference to Exhibit 3.3 to Form 10-Q for the quarter ended June 30, 2002, File No. 11774 | |
3.1(e) | Articles of Amendment to Articles of Incorporation, dated November 2, 2002 | Incorporated by reference to Exhibit 3.4 to Form 10-Q for the quarter ended March 31, 2003, File No. 11774 | |
3.1(f) | Articles of Amendment to Articles of Incorporation, dated October 31, 2012 | Incorporated by reference to Exhibit 3.1 to Form 8-K filed on October 31, 2012, File No. 11774 | |
3.2 | Amended and Restated By-laws, dated November 9, 2015 | Incorporated by reference to Exhibit 3.1 to Form 10-Q filed on November 9, 2015, File No. 11774 | |
4.1 | Amended and Restated Rights Agreement dated October 31, 2012, between the Company and Broadridge Issuer Solutions, Inc., as Rights Agent, dated October 31, 2012 | Incorporated by reference to Exhibit 4.1 to Form 8-K filed on November 2, 2012, File No. 11774 | |
10.1(a)* | 2001 Stock Option and Restricted Stock Plan, as amended and restated effective May 17, 2006 | Incorporated by reference to Exhibit 10.1 to Form 8-K filed on May 23, 2006, File No. 11774 | |
10.1(b)* | Form of Stock Appreciation Rights Award Agreement under 2001 Stock Option and Restricted Stock Plan | Incorporated by reference to Exhibit 10.2 to Form 8-K filed on May 23, 2006, File No. 11774 | |
10.1(c)* | Form of Stock Appreciation Rights Agreement under 2001 Stock Option and Restricted Stock Plan | Incorporated by reference to Exhibit 10.1 to Form 8-K filed on March 6, 2009, File No. 11774 | |
10.2* | Amended and Restated Employment Agreement effective January 1, 2009 for J. Allen Fine | Incorporated by reference to Exhibit 10.7 to Form 10-K for the year ended December 31, 2008, File No. 11774 | |
10.3* | Amended and Restated Employment Agreement effective January 1, 2009 for James A. Fine, Jr. | Incorporated by reference to Exhibit 10.8 to Form 10-K for the year ended December 31, 2008, File No. 11774 | |
10.4* | Amended and Restated Employment Agreement effective January 1, 2009 for W. Morris Fine | Incorporated by reference to Exhibit 10.9 to Form 10-K for the year ended December 31, 2008, File No. 11774 | |
10.5* | Amended and Restated Death Benefit Plan Agreement effective January 1, 2009 for J. Allen Fine | Incorporated by reference to Exhibit 10.10 to Form 10-K for the year ended December 31, 2008, File No. 11774 | |
10.6* | Amended and Restated Death Benefit Plan Agreement effective January 1, 2009 for James A. Fine, Jr. | Incorporated by reference to Exhibit 10.11 to Form 10-K for the year ended December 31, 2008, File No. 11774 | |
10.7* | Death Benefit Plan Agreement effective January 1, 2009 for W. Morris Fine | Incorporated by reference to Exhibit 10.12 to Form 10-K for the year ended December 31, 2008, File No. 11774 | |
10.8* | Amended and Restated Nonqualified Deferred Compensation Plan effective January 1, 2009 | Incorporated by reference to Exhibit 10.13 to Form 10-K for the year ended December 31, 2008, File No. 11774 | |
10.9* | Amended and Restated Nonqualified Supplemental Retirement Benefit Plan effective January 1, 2009 | Incorporated by reference to Exhibit 10.14 to Form 10-K for the year ended December 31, 2008, File No. 11774 | |
84
10.10(a)* | 2009 Stock Appreciation Right Plan effective March 2, 2009 | Incorporated by reference to Appendix A to the Proxy Statement dated May 26, 2009, File No. 11774 | |
10.10(b)* | Form of Stock Appreciation Rights Agreement under 2009 Stock Appreciation Right Plan | Incorporated by reference to Exhibit 10 to Form 10-Q for the quarter ended June 30, 2011, File No. 11774 | |
21 | Subsidiaries of Registrant | Filed herewith | |
23 | Consent of Independent Registered Public Accounting Firm | Filed herewith | |
31.1 | Certification of Chief Executive Officer pursuant to Section 302 of the Sarbanes-Oxley Act of 2002 | Filed herewith | |
31.2 | Certification of Chief Financial Officer pursuant to Section 302 of the Sarbanes-Oxley Act of 2002 | Filed herewith | |
32 | Certification of Chief Executive Officer and Chief Financial Officer pursuant to Section 906 of the Sarbanes-Oxley Act of 2002 | Furnished herewith | |
101.INS | XBRL Instance Document | Filed herewith | |
101.SCH | XBRL Taxonomy Extension Schema Document | Filed herewith | |
101.CAL | XBRL Taxonomy Extension Calculation Linkbase Document | Filed herewith | |
101.LAB | XBRL Taxonomy Extension Label Linkbase Document | Filed herewith | |
101.PRE | XBRL Taxonomy Extension Presentation Linkbase Document | Filed herewith | |
101.DEF | XBRL Taxonomy Extension Definition Linkbase Document | Filed herewith | |
* | Management contract or compensatory plan or arrangement |
85