Attached files
| file | filename |
|---|---|
| EX-32.1 - EXHIBIT 32.1 - First Connecticut Bancorp, Inc. | t1600130_ex32-1.htm |
| EX-31.1 - EXHIBIT 31.1 - First Connecticut Bancorp, Inc. | t1600130_ex31-1.htm |
| EX-32.2 - EXHIBIT 32.2 - First Connecticut Bancorp, Inc. | t1600130_ex32-2.htm |
| EX-31.2 - EXHIBIT 31.2 - First Connecticut Bancorp, Inc. | t1600130_ex31-2.htm |
UNITED STATES
SECURITIES AND EXCHANGE COMMISSION
Washington, D.C. 20549
FORM 10-K
| x | ANNUAL REPORT PURSUANT TO SECTION 13 OR 15(d) OF THE SECURITIES EXCHANGE ACT OF 1934 |
For the Fiscal Year Ended December 31, 2015
OR
| ¨ | TRANSITION REPORT PURSUANT TO SECTION 13 or 15(d) OF THE SECURITIES EXCHANGE ACT OF 1934 |
For the transition period from________ to ________
Commission File No. 333-171913
First Connecticut Bancorp, Inc.
(Exact name of Registrant as Specified in its Charter)
| Maryland | 45-1496206 | |
(State or Other Jurisdiction of Incorporation or Organization) |
(IRS Employer Identification Number) | |
| One Farm Glen Boulevard, Farmington, CT | 06032 | |
| (Address of Principal Executive Office) | (Zip Code) |
(860) 676-4600
(Registrant’s Telephone Number including Area Code)
Securities Registered Pursuant to Section 12(b) of the Act:
| Title of Class | Name of Each Exchange On Which Registered | |
| Common Stock, par value $0.01 per share | The NASDAQ Global Select Market |
Securities Registered Pursuant to Section 12(g) of the Act:
None
Indicate by check mark if the Registrant is a well-known seasoned issuer, as defined in Rule 405 of the Securities Act YES ¨ NO x
Indicate by check mark if the Registrant is not required to file reports pursuant to Section 13 or 15(d) of the Act. YES ¨ NO x
Indicate by check mark whether the Registrant (1) has filed all reports required to be filed by Section 13 or 15(d) of the Securities Exchange Act of 1934 during the preceding twelve months (or for such shorter period that the Registrant was required to file such reports) and (2) has been subject to such filing requirements for the past 90 days YES x NO ¨
Indicate by check mark whether the registrant has submitted electronically and posted on its corporate Web site, if any, every Interactive Data File required to be submitted and posted pursuant to Rule 405 of Regulation S-T (§ 232.405 of this chapter) during the preceding 12 months (or for shorter period that the registrant was required to submit and post such files) YES ¨ NO x
Indicate by check mark if disclosure of delinquent filers pursuant to Item 405 of Regulation S-K is not contained herein, and will not be contained, to the best of Registrant’s knowledge, in definitive proxy or information statements incorporated by reference in Part III of this Form 10-K or any amendments to this Form 10-K. x
Indicate by check mark whether the Registrant is a large accelerated filer, an accelerated filer, or a non-accelerated filer — See definition of “accelerated and large accelerated filer” in Rule 12b-2 of the Exchange Act (check one).
| Large Accelerated Filer | ¨ | Accelerated Filer | x | |||
| Non-Accelerated Filer | ¨ | Smaller Reporting Company | ¨ |
Indicate by check mark whether the registrant is a shell company (as defined in Rule 12b-2 of the Exchange Act). YES ¨ NO x
The aggregate market value of the voting stock held by non-affiliates of the Registrant, computed by reference to the closing price of the common stock as of June 30, 2015 was approximately $242.5 million.
As of February 29, 2016, there were outstanding 15,737,863 shares of the Registrant’s common stock.
DOCUMENT INCORPORATED BY REFERENCE
Portions of the Proxy Statement for the Annual Meeting of Stockholders (Part III) expected to be filed within 120 days after the end of the Registrant’s fiscal year ended December 31, 2015, are incorporated herein by reference.
First Connecticut Bancorp, Inc.
Form 10-K Table of Contents
December 31, 2015
| PART I | Page | ||
| ITEM 1. | Business | 1 | |
| ITEM 1A. | Risk Factors | 35 | |
| ITEM 1B. | Unresolved Staff Comments | 38 | |
| ITEM 2. | Properties | 39 | |
| ITEM 3. | Legal Proceedings | 40 | |
| ITEM 4. | Mine Safety Disclosures | 40 | |
| PART II | |||
| ITEM 5. | Market for Registrant’s Common Equity, Related Stockholder Matters and Issuer Purchases of Equity Securities | 40 | |
| ITEM 6. | Selected Financial Data | 42 | |
| ITEM 7. | Management’s Discussion and Analysis of Financial Condition and Results of Operations | 44 | |
| ITEM 7A. | Quantitative and Qualitative Disclosures about Market Risk | 61 | |
| ITEM 8. | Financial Statements and Supplementary Data | 61 | |
| ITEM 9. | Changes in and Disagreements with Accountants on Accounting and Financial Disclosure | 130 | |
| ITEM 9A. | Controls and Procedures | 130 | |
| ITEM 9B. | Other Information | 130 | |
| PART III | 131 | ||
| ITEM 10. | Directors, Executive Officers, and Corporate Governance | 131 | |
| ITEM 11. | Executive Compensation | 131 | |
| ITEM 12. | Security Ownership of Certain Beneficial Owners and Management and Related Stockholder Matters | 131 | |
| ITEM 13. | Certain Relationships and Related Transactions, and Director Independence | 131 | |
| ITEM 14. | Principal Accountant Fees and Services | 131 | |
| PART IV | |||
| ITEM 15. | Exhibits and Financial Statement Schedules | 131 | |
| SIGNATURES | 134 |
Part I
Item 1. Business
Forward-Looking Statements
From time to time the Company has made and may continue to make written or oral forward-looking statements regarding our outlook or expectations for earnings, revenues, expenses, capital levels, asset quality or other future financial or business performance, strategies or expectations, or the impact of legal, regulatory or supervisory matters on our business operations or performance. This Annual Report on Form 10-K also includes forward-looking statements. With respect to all such forward-looking statements, you should review our Risk Factors discussion in Item 1A. and our Cautionary Statement Regarding Forward-Looking Information included in Item 7.
First Connecticut Bancorp, Inc.
First Connecticut Bancorp, Inc. (“First Connecticut Bancorp”, “FCB” or the “Company”) is a Maryland-chartered stock holding company that wholly owns its only subsidiary, Farmington Bank (“Bank”). At December 31, 2015, the Company had, on a consolidated basis, $2.7 billion in assets, of which $2.3 billion were in loans, $2.0 billion in deposits and stockholders’ equity of $245.7 million.
On July 2, 2012, the Company received regulatory approval to repurchase up to 1,788,020 shares, or 10% of its current outstanding common stock. On May 30, 2013, the Company completed its repurchase of 1,788,020 shares at a cost of $24.9 million, of which 486,947 shares were reissued as part of the 2012 Stock Incentive Plan. On June 21, 2013, the Company received regulatory approval to repurchase up to an additional 1,676,452 shares, or 10% of its current outstanding common stock. As of December 31, 2015, the Company has repurchased 918,707 of these shares at a cost of $13.7 million. Repurchased shares are held as treasury stock and are available for general corporate purposes.
On September 5, 2012, the Company registered 2,503,228 shares to be reserved for issuance to the First Connecticut Bancorp, Inc. 2012 Stock Incentive Plan.
Farmington Bank
Farmington Bank is a full-service, community bank with 23 branch locations throughout central Connecticut and western Massachusetts, offering commercial and residential lending as well as wealth management services. Established in 1851, Farmington Bank is a diversified consumer and commercial bank with an ongoing commitment to contribute to the betterment of the communities in our region. Farmington Bank is regulated by the Connecticut Department of Banking and the Federal Deposit Insurance Corporation (“FDIC”). Farmington Bank’s deposits are insured to the maximum allowable under the Deposit Insurance Fund, which is administered by the FDIC. Farmington Bank is a member of the Federal Home Loan Bank of Boston (“FHLBB”). Farmington Bank is the wholly-owned subsidiary of First Connecticut Bancorp.
The executive office of the Company is located at One Farm Glen Boulevard, Farmington, Connecticut, 06032.
Farmington Bank’s website (www.farmingtonbankct.com) contains a direct link to the Company’s filings with the Securities and Exchange Commission, including copies of our annual report on Form 10-K, quarterly reports on Form 10-Q, current reports on Form 8-K and amendments to these filings, as well as ownership reports on Forms 3, 4 and 5 filed by the Company’s directors and executive officers. Copies may also be obtained, without charge, by written request to First Connecticut Bancorp, Inc. Investor Relations, One Farm Glen Boulevard, Farmington, Connecticut, 06032, Attention: Jennifer Daukas or send an email to: investor-relations@firstconnecticutbancorp.com. Information on our website is not part of this Annual Report on Form 10-K.
Market Area
We operate in a primarily suburban market area that has a stable population and household base. All but two of our current branch offices are in Hartford County, Connecticut; two of our branch offices are located in Hampden County, Massachusetts. Our primary market area is central Connecticut and western Massachusetts. Our main office is in Farmington, Connecticut and is approximately ten miles from the City of Hartford, Connecticut. The counties we serve have a mix of industry groups and employment sectors including insurance, health services, finance, manufacturing, not-for-profit, education, government and technology. Our primary market area for deposits includes the communities in which we maintain our banking office locations. Our lending area is broader than our deposit market area and primarily includes Connecticut and western Massachusetts, however, we will selectively lend to borrowers in other northeastern states. During 2015, we opened branch offices in East Longmeadow, MA and West Springfield, MA and a loan production office in Branford, CT.
| 1 |
Based on the most recent data available from the Federal Deposit Insurance Corporation (“FDIC”) as of June 30, 2015, we possess a 5.32% deposit market share in Hartford County. Our market share rank is 5th out of 27 financial institutions.
Lending Activities
Historically, our principal lending activities have been residential, consumer and commercial lending. As part of our growth strategy, we have been increasing our commercial portfolio and attracting larger, more comprehensive long-term borrowing relationships in the areas of commercial real estate lending (both owner and non-owner-occupied) and commercial lending, and supplementing these areas with more extensive cash management and depository services in an effort to increase interest income, diversify our loan portfolio and better serve the community.
The resulting overall loan portfolio performance has been strong with total loan growth of 10.4% in 2015, 17.5% in 2014, 18.4% in 2013, and 17.1% in 2012. Our total loans at December 31, 2015 increased by $222.8 million or 10.4% from December 31, 2014 primarily due to increases in our commercial loan portfolio which grew $195.7 million or 17.3% from December 31, 2014 to December 31, 2015.
Our senior management team has carefully built the infrastructure necessary to support this growth and provide critical on-going portfolio management and risk assessment. A risk management program is in place to enable us to evaluate the risk in our portfolio and to implement changes in our underwriting standards so as to minimize overall portfolio risk. As part of this program, our loan portfolio is subject to concentration limits, market analyses, stress testing, ongoing monitoring, and reporting and review of underwriting standards.
The following table sets forth the composition of our loan portfolio by type of loans at the dates indicated:
| At December 31, | ||||||||||||||||||||||||||||||||||||||||
| 2015 | 2014 | 2013 | 2012 | 2011 | ||||||||||||||||||||||||||||||||||||
| Amount | Percent | Amount | Percent | Amount | Percent | Amount | Percent | Amount | Percent | |||||||||||||||||||||||||||||||
| Real estate: | (Dollars in Thousands) | |||||||||||||||||||||||||||||||||||||||
| Residential | $ | 849,722 | 36.1 | % | $ | 827,005 | 38.7 | % | $ | 693,046 | 38.2 | % | $ | 620,991 | 40.5 | % | $ | 503,361 | 38.4 | % | ||||||||||||||||||||
| Commercial | 887,431 | 37.6 | % | 765,066 | 35.8 | % | 633,764 | 34.9 | % | 473,788 | 30.9 | % | 408,169 | 31.2 | % | |||||||||||||||||||||||||
| Construction(1) | 30,895 | 1.3 | % | 57,371 | 2.7 | % | 78,191 | 4.3 | % | 64,362 | 4.2 | % | 46,381 | 3.5 | % | |||||||||||||||||||||||||
| Installment | 2,970 | 0.1 | % | 3,356 | 0.2 | % | 4,516 | 0.2 | % | 6,719 | 0.4 | % | 10,333 | 0.8 | % | |||||||||||||||||||||||||
| Commercial | 409,550 | 17.4 | % | 309,708 | 14.5 | % | 252,032 | 13.9 | % | 192,210 | 12.6 | % | 154,300 | 11.8 | % | |||||||||||||||||||||||||
| Collateral | 1,668 | 0.1 | % | 1,733 | 0.1 | % | 1,600 | 0.1 | % | 2,086 | 0.1 | % | 2,348 | 0.2 | % | |||||||||||||||||||||||||
| Home equity line of credit | 174,701 | 7.4 | % | 169,768 | 8.0 | % | 151,606 | 8.3 | % | 142,543 | 9.3 | % | 109,771 | 8.4 | % | |||||||||||||||||||||||||
| Demand | - | * | - | * | 85 | * | 25 | * | 41 | * | ||||||||||||||||||||||||||||||
| Revolving Credit | 91 | * | 99 | * | 94 | * | 65 | * | 90 | * | ||||||||||||||||||||||||||||||
| Resort | 784 | * | 929 | * | 1,374 | 0.1 | % | 31,232 | 2.0 | % | 75,363 | 5.7 | % | |||||||||||||||||||||||||||
| Total loans | 2,357,812 | 100.0 | % | 2,135,035 | 100.0 | % | 1,816,308 | 100.0 | % | 1,534,021 | 100.0 | % | 1,310,157 | 100.0 | % | |||||||||||||||||||||||||
| Net deferred loan costs | 3,984 | 3,842 | 2,993 | 3,378 | 2,553 | |||||||||||||||||||||||||||||||||||
| Loans | 2,361,796 | 2,138,877 | 1,819,301 | 1,537,399 | 1,312,710 | |||||||||||||||||||||||||||||||||||
| Allowance for loan losses | (20,198 | ) | (18,960 | ) | (18,314 | ) | (17,229 | ) | (17,533 | ) | ||||||||||||||||||||||||||||||
| Loans, net | $ | 2,341,598 | $ | 2,119,917 | $ | 1,800,987 | $ | 1,520,170 | $ | 1,295,177 | ||||||||||||||||||||||||||||||
* Less than 0.1%
| (1) | Construction loans include commercial and residential construction loans and are reported net of undisbursed construction loans of $44.5 million as of December 31, 2015. |
Major loan customers: Our five largest lending relationships are with commercial borrowers with loans totaling $118.6 million or 5.0% of our total loan portfolio outstanding as of December 31, 2015. Loan commitments to these borrowers totaled $118.6 million for the same period. These relationships and commitments consist of the following:
| 1. | $26.3 million relationship consisting of commercial mortgages on five distinct properties located in Connecticut, extended to a well-known local developer for refinancing of a medical office building; construction of a single tenant office building now in its permanent phase which houses the corporate headquarters of a regional medical insurance company; financing for the purchase of a 78 unit apartment complex; construction of a medical office building which is now in its permanent phase; and funding to refinance a single family investment property. |
| 2. | $25.0 million direct purchase bond financing to a private college located in Pennsylvania for the construction of new dorms and a student commons building. |
| 3. | $24.6 million relationship consisting of commercial mortgages on two distinct properties extended to a well-known New England developer for the refinancing of construction debt associated with the redevelopment of an 82-unit apartment complex located in New Hampshire and refinancing of construction debt associated with the redevelopment of a 157-unit apartment complex located in Rhode Island. |
| 2 |
| 4. | $22.5 million direct purchase bond financing to a private college located in Connecticut for the refinancing of existing bond obligations. |
| 5. | $20.2 million relationship consisting of commercial mortgages on two distinct Connecticut properties, extended to a well-known local developer for the refinancing of 168 and 220 unit apartment buildings. |
All of the credit facilities extended to the five largest borrowers as of December 31, 2015 are current and performing in accordance with their respective terms.
Real Estate Loans:
Residential Real Estate Loans: One of our primary lending activities consists of the origination of one-to-four family residential real estate loans that are primarily secured by properties located in Hartford County and surrounding counties in Connecticut. Of the $849.7 million and $827.0 million of residential loans outstanding at December 31, 2015 and 2014, respectively, $407.3 million and $466.2 million are fixed-rate loans. Generally, residential real estate loans are originated in amounts up to 95.0% of the lesser of the appraised value or purchase price of the property, with private mortgage insurance required on loans with a loan-to-value ratio in excess of 80.0%. We usually do not make loans secured by single-family homes with loan-to-value ratios in excess of 95.0% (with the exception of Federal Housing Administration loans which allow for a 96.5% loan-to-value ratio). Fixed-rate mortgage loans generally are originated for terms of 7, 10, 15, 20, 25 and 30 years. All fixed-rate residential mortgage loans are underwritten pursuant to secondary market underwriting guidelines which include minimum FICO standards.
Based on the market environment for our residential mortgage originations we may sell our conforming 10, 15, 20 and 30 year fixed-rate residential mortgage loan production in the secondary market, while retaining the servicing rights. Loan servicing includes collecting and remitting loan payments, accounting for principal and interest, contacting delinquent mortgagors, supervising foreclosures and property dispositions in the event of unremedied defaults, making certain insurance and tax payments on behalf of the borrowers and generally administering the loans. We originated $132.9 million of fixed-rate one-to-four family residential loans for the year ended December 31, 2015, $97.7 million of which were sold in the secondary market and we originated $93.7 million of fixed-rate one-to-four family residential loans for the year ended December 31, 2014, $34.1 million of which were sold in the secondary market. The loans sold meet secondary market guidelines and are subject to warranty exposure. Such exposure is mitigated by our quality control procedures and the fact that we are selling newly originated loans instead of seasoned loans in the secondary market. As of December 31, 2015, we have not been requested or required to repurchase any sold loans due to inadequate underwriting or documentation deficiencies. We have not and do not intend to originate subprime or alternative A paper (alt A) loans.
We also offer adjustable-rate mortgage loans for one-to-four family properties, with an interest rate that adjusts annually based on the one-year Constant Maturity Treasury Bill Index, after a one, three, five, seven or ten - year initial fixed-rate period. Our adjustable rate mortgage loans generally provide for maximum rate adjustments of 200 basis points per adjustment, with a lifetime maximum adjustment up to 6.0%, regardless of the initial rate. Our adjustable rate mortgage loans amortize over terms of up to 30 years. We originated $25.3 million and $53.2 million adjustable rate one-to-four family residential loans for the years ended December 31, 2015 and 2014, respectively. For the years ended December 31, 2015 and 2014, we purchased $111.9 million and $134.2 in million adjustable rate mortgages, respectively.
Adjustable rate mortgage loans decrease the risks associated with changes in market interest rates by periodically repricing, but involve other risks because as interest rates increase, the underlying payments by the borrower increase, thus increasing the potential for default by the borrower. At the same time, the marketability of the underlying collateral may be adversely affected by higher interest rates. Upward adjustment of the contractual interest rate is also limited by the maximum periodic and lifetime interest rate adjustments permitted by our loan documents and, therefore, the effectiveness of adjustable rate mortgage loans may be limited during periods of rapidly rising interest rates. Of our one-to-four family residential real estate loans, $442.4 million and $360.8 million had adjustable rates of interest at December 31, 2015 and 2014, respectively. Declines in real estate values and or a slowdown in the housing market may make it more difficult for borrowers experiencing financial difficulty to sell their homes or refinance their debt due to their declining collateral values.
All residential mortgage loans that we originate include “due-on-sale” clauses, which give us the right to declare a loan immediately due and payable in the event that, among other things, the borrower sells or otherwise disposes of the real property. We also require homeowner’s insurance and, where circumstances warrant, flood insurance on properties securing real estate loans. Our largest residential mortgage loan had a principal balance of $4.1 million at December 31, 2015, which is performing in accordance with terms.
| 3 |
Commercial Real Estate Loans: We originate commercial investment real estate loans and loans on owner-occupied properties used for a variety of business purposes, including office buildings, multi-family dwellings, industrial and warehouse facilities and retail facilities. Commercial mortgage loans totaled $887.4 million and $765.1 million, or 37.7% and 35.8% of total loans, at December 31, 2015 and 2014, respectively. At December 31, 2015, our owner-occupied commercial mortgage loans constituted 22.3% of our commercial real estate portfolio and our investor-owned commercial mortgage real estate loans were 77.7% of the commercial real estate portfolio. The investor-owned portfolio is diversified among a number of property types as shown in the following table. Owner-occupied commercial real estate loans totaled $197.8 million and $172.9 million, or 22.3% and 22.6%, at December 31, 2015 and 2014, respectively. Our owner-occupied commercial real estate underwriting policies provide that typically such real estate loans may be made in amounts of up to 80.0% of the appraised value of the property. Our commercial real estate loans are generally made with terms of up to 20 years, amortization schedules generally up to 25 years and interest rates that are fixed for a period of time, generally set at a margin above the FHLBB Advance rates. Variable rate options are also available, generally tied to the prime rate as published in the Wall Street Journal, or for qualifying borrowers, tied to LIBOR plus a margin. Interest rate swaps are offered to qualified borrowers to effect a fixed-rate equivalent for the borrower and allows us to effectively hedge against interest rate risk on large, long-term loans. In reaching a credit decision on whether to make a commercial real estate loan, we consider gross revenues and the net operating income of the property, the borrower’s cash flow and credit history, and the appraised value of the underlying property. In addition, with respect to commercial real estate rental properties, we also consider the terms and conditions of the leases, the credit quality of the tenants and the borrower’s global cash flow. We typically require that the properties securing our commercial real estate loans have debt service coverage ratios (the ratio of earnings before interest, taxes, depreciation and amortization divided by interest expense and current maturities of long-term debt) of at least 1.20x. Environmental reports and current appraisals are required for commercial real estate loans as governed by our written environmental and appraisal policies. Generally, a commercial real estate loan made to a corporation, partnership or other business entity requires personal guarantees by the principals and owners of 20.0% or more of the entity, though, we do offer non-recourse financing to commercial real estate borrowers who exhibit strong credit metrics including, but not limited to, strong debt service coverage and low loan-to-value ratios.
A commercial real estate borrower’s financial information and various credit quality indicators are monitored on an ongoing basis by requiring the submission of periodic financial statement updates and annual tax returns and the periodic review of payment history. In addition, we typically conduct periodic face-to-face meetings with the borrower, as well as property site visits. These requirements also apply to guarantors of commercial real estate loans. Borrowers with loans secured by rental investment property are required to provide an annual report of income and expenses for such property, including a tenant rent roll and copies of leases, as applicable. The largest commercial real estate loan, excluding commercial construction, was $16.1 million at December 31, 2015 and is performing in accordance with terms.
Loans secured by commercial real estate generally involve larger principal amounts and a greater degree of risk than one-to-four family residential mortgage loans. Because payments on loans secured by commercial real estate are often dependent on the successful operation or management of the properties, repayment of such loans may be affected by adverse conditions in the real estate market, the economy or the tenant(s). Given our level of commercial real estate exposure, our commercial real estate portfolio risk management program enables us to evaluate the risk in our portfolio and to implement changes in our lending practices to minimize overall portfolio risk. As part of this program, the commercial real estate portfolio is subject to concentration limits, market analyses, stress testing, ongoing monitoring, and review and reporting of underwriting standards.
| 4 |
The following table presents the amounts and percentages of commercial real estate loans held by type as of December 31, 2015 and 2014.
| 2015 | 2014 | |||||||||||||||
| Amount | Percent | Amount | Percent | |||||||||||||
| Type of Commercial Real Estate Loans: | (Dollars in thousands) | |||||||||||||||
| Owner occupied | $ | 197,801 | 22.3 | % | $ | 172,942 | 22.6 | % | ||||||||
| Retail | 237,729 | 26.8 | % | 214,618 | 28.1 | % | ||||||||||
| Multi-family | 177,628 | 20.0 | % | 127,044 | 16.6 | % | ||||||||||
| Office | 143,180 | 16.1 | % | 126,685 | 16.6 | % | ||||||||||
| Other | 83,641 | 9.4 | % | 77,551 | 10.1 | % | ||||||||||
| Industrial | 24,653 | 2.8 | % | 24,394 | 3.2 | % | ||||||||||
| Hotel | 21,878 | 2.5 | % | 19,378 | 2.5 | % | ||||||||||
| Land | 921 | 0.1 | % | 2,454 | 0.3 | % | ||||||||||
| Total | $ | 887,431 | 100.0 | % | $ | 765,066 | 100.0 | % | ||||||||
Construction Loans: We offer construction loans, including commercial construction loans and real estate subdivision development loans, to developers, licensed contractors and builders for the construction and development of commercial real estate projects and residential properties. Construction loans outstanding, including commercial and residential, totaled $30.9 million and $57.4 million, or 1.3% and 2.7% of total loans outstanding at December 31, 2015 and 2014, respectively. At December 31, 2015, the unadvanced portion of these construction loans totaled $44.5 million, as compared to $41.6 million at December 31, 2014. Our underwriting policies provide that construction loans typically be made in amounts of up to 75.0% of the appraised value of the property. We extend loans to residential subdivision developers for the purpose of land acquisition, the development of infrastructure and the construction of homes. Advances are determined as a percentage of the cost or appraised value of the improvements, whichever is less, and each project is physically inspected prior to each advance either by a loan officer or an engineer approved by us. We typically limit the number of speculative units financed by a customer, with the majority of construction advances supported by purchase contracts.
We also originate construction loans to individuals and contractors for the construction and acquisition of personal residences. Residential construction loans outstanding totaled $4.9 million and $10.0 million at December 31, 2015 and 2014, respectively. The unadvanced portion of these construction loans totaled $4.6 million and $4.8 million at December 31, 2015 and 2014, respectively. Our residential construction mortgage loans generally provide for the payment of interest only during the construction phase, which is typically up to nine months, although our policy is to consider construction periods as long as 12 months. At the end of the construction phase, the construction loan converts to a long-term owner-occupied residential mortgage loan. Construction loans can be made with a maximum loan-to-value ratio of 80.0%. Before making a commitment to fund a residential construction loan, we require an appraisal of the property by an independent licensed appraiser. We also review and inspect each property before disbursement of funds during the term of the construction loan. Loan proceeds are disbursed after inspection based on the percentage of completion method. Construction loans to individuals are generally made on the same terms as our one-to-four family mortgage loans.
Construction financing is generally considered to involve a higher degree of credit risk than longer-term financing on improved real estate. Risk of loss on a construction loan depends largely upon the accuracy of the initial estimate of the value of the property at completion of construction compared to the actual cost (including interest) of construction and other assumptions. If the estimate of construction cost is too low, we may be required to advance funds beyond the amount originally committed in order to protect the value of the property. Additionally, if the estimate of value is too high, we may be confronted with a project, when completed, with a value that is insufficient to assure full payment. Construction lending contains a unique risk characteristic as loans are originated under market and economic conditions that may change between the time of origination and the completion and subsequent purchaser financing of the property. In addition, construction subdivision loans and commercial and residential construction loans to contractors and developers entail additional risks as compared to single-family residential mortgage lending to owner-occupants. These loans typically involve large loan balances concentrated in single borrowers or groups of related borrowers. A continued economic downturn could have an additional adverse impact on the value of the properties securing construction loans and on our borrowers’ ability to sell their units for the amounts necessary to complete their projects and repay their loans.
| 5 |
The following table presents the amounts and percentages of construction loans held by type as of December 31, 2015 and 2014.
| 2015 | 2014 | |||||||||||||||
| Amount | Percent | Amount | Percent | |||||||||||||
| Type of Construction Loans: | (Dollars in thousands) | |||||||||||||||
| Multi-family | $ | 10,484 | 33.9 | % | $ | 10,166 | 17.7 | % | ||||||||
| Retail | 5,436 | 17.6 | % | 11,420 | 19.9 | % | ||||||||||
| Residential | 4,893 | 15.8 | % | 9,966 | 17.4 | % | ||||||||||
| Commercial owner-occupied | 4,086 | 13.3 | % | 5,537 | 9.7 | % | ||||||||||
| Subdivision | 3,567 | 11.5 | % | 4,714 | 8.2 | % | ||||||||||
| Subdivision speculative | 1,475 | 4.8 | % | 2,143 | 3.7 | % | ||||||||||
| Other | 954 | 3.1 | % | 296 | 0.5 | % | ||||||||||
| Office | - | 0.0 | % | 13,129 | 22.9 | % | ||||||||||
| Total | $ | 30,895 | 100.0 | % | $ | 57,371 | 100.0 | % | ||||||||
The establishment of interest reserves for construction and development loans is an established banking practice, but the handling of such interest reserves varies widely within the industry. Many of our construction and development loans provide for the use of interest reserves, and based upon our knowledge of general industry practices, we believe that our practices related to such interest reserves are appropriate and adequate. When we underwrite construction and development loans, we consider the expected total project costs, including hard costs such as land, site work and construction costs and soft costs such as architectural and engineering fees, closing costs, leasing commissions and construction period interest. Based on the total project costs and other factors, we determine the required borrower cash equity contribution and the maximum amount we are willing to loan. In the vast majority of cases, we require that all of the borrower’s cash equity contribution be contributed prior to any material loan advances. This ensures that the borrower’s cash equity required to complete the project will in fact be available for such purposes. As a result of this practice, the borrower’s cash equity typically goes toward the purchase of the land and early stage hard costs and soft costs. This results in our funding the loan later as the project progresses, and accordingly we typically fund the majority of the construction period interest through loan advances. As of December 31, 2015, we are committed to advance construction period interest totaling approximately $602,000 on construction and development loans. The maximum committed balance of all construction and development loans which provide for the use of interest reserves at December 31, 2015 was approximately $45.8 million, of which $20.6 million was outstanding at December 31, 2015 and $25.2 million remained to be advanced.
The largest commercial construction loan was $13.4 million of which $6.1 million was outstanding at December 31, 2015, and is performing in accordance with terms.
Commercial Loans:
Our approach to commercial lending is centered in relationship banking. While our primary focus is to extend financing to meet the needs of creditworthy borrowers, we also endeavor to provide a comprehensive solution for all of a business’ banking needs including depository, cash management and investment needs. The commercial business loan portfolio is comprised of both middle market companies and small businesses located primarily in Connecticut and western Massachusetts. Market segments represented include manufacturers, distributors, service businesses, financial services, healthcare providers, not-for-profits, higher and secondary education institutions and professional service companies. Typically, our middle market lending group seeks relationships with companies that have borrowing needs in excess of $750,000, while our small business lending group supports companies with borrowing needs of $750,000 or less.
We had $409.6 million and $309.7 million in commercial loans at December 31, 2015 and 2014, respectively. Of the loans in our commercial loan portfolio, $18.7 million and $18.4 million were guaranteed by either the Small Business Administration, the Connecticut Development Authority or the United States Department of Agriculture at December 31, 2015 and 2014, respectively. Total commercial business loans amounted to 17.4% and 14.5% of total loans at December 31, 2015 and 2014, respectively.
Commercial business lending products generally include term loans, revolving lines of credit for working capital needs, equipment lines of credit to facilitate the purchase of equipment, and letters of credit. Commercial business loans are made with either adjustable or fixed-rates of interest. Variable rates are tied to either the prime rate, as published in The Wall Street Journal, or LIBOR, plus a margin. The interest rates of fixed-rate commercial business loans are typically set at a margin above the FHLBB Advance rates. Interest rate swaps are offered to qualified borrowers to effect a fixed-rate equivalent for the borrower and allows us to effectively hedge against interest rate risk on large, long-term loans.
| 6 |
When making commercial business loans, we consider the character and capabilities of the borrower’s management, our lending history with the borrower, the debt service capabilities of the borrower, the historical and projected cash flows of the business, the relative strength of the borrower’s balance sheet, the value and composition of the collateral, and the financial strength and commitment of the guarantors, if any. Commercial loans are generally secured by a variety of collateral, including accounts receivable, inventory and equipment, and supported by personal guarantees. Depending on the collateral used to secure the loans, commercial business loans are typically advanced at a discount to the value of the loan’s collateral. As of December 31, 2015 and 2014, unsecured commercial loans totaled $57.7 million and $8.2 million, respectively, or less than 3.0% of total loans outstanding. Generally, a commercial loan made to a corporation, partnership or other business entity requires personal guarantees by the principals and owners of 20.0% or more of the entity, though, we do offer non-recourse financing to commercial borrowers who exhibit strong credit metrics including but not limited to, strong debt service coverage and low loan-to-value ratios.
Commercial loans generally have greater credit risk than residential real estate loans. Unlike residential mortgage loans, which largely are made on the basis of the borrower’s ability to make repayment from his or her employment or other income, and which are secured by real property whose value tends to be more easily ascertainable, commercial business loans generally are made on the basis of the borrower’s ability to repay the loan from the cash flow of the borrower’s business. As a result, the availability of funds for the repayment of a commercial business loan depends substantially on the success of the business itself. Further, any collateral securing the loan may depreciate over time, be difficult to appraise and or fluctuate in value. We seek to minimize these risks through our underwriting standards.
In an effort to both attract more sophisticated borrowers, as well as to hedge our interest rate risk associated with long-term commercial loans, we offer interest rate swaps via our correspondent banking partners. Interest rate swaps are primarily used to exchange a floating rate payment stream into a fixed-rate payment stream. The variable rates on swaps will change as market interest rates change. We will enter into swap transactions solely to limit our interest rate risk and effectively “fix” the rate for appropriate customer borrowings. We do not engage in any speculative swap transactions. Generally, swap options are offered to “pass” rated borrowers requesting long-term commercial loans or commercial mortgages in amounts of at least $1.0 million. We have established a derivative policy which sets forth the parameters for such transactions (including underwriting guidelines, rate setting process, maximum maturity, approval and documentation requirements), as well as identifying internal controls for the management of risks related to these hedging activities (such as approval of counterparties, limits on counterparty credit risk, maximum loan amounts, and limits to single dealer counterparties). Our interest rate swap derivatives are primarily collateralized by cash. As of December 31, 2015, we have 66 mirrored swap transactions with a total current notional amount of $281.1 million. The fair value of the interest rate swap derivative asset and liability is $10.6 million and $10.7 million, respectively, at December 31, 2015.
Our small business customers typically generate annual revenues from their businesses of up to $2.5 million and have borrowing needs of up to $750,000. We deliver and promote the delivery of small business loan products to our existing and prospective customer base by leveraging our retail branch network, including our branch managers, supplemented by a team of dedicated business development officers. Our branch managers and business development officers are fully trained to assist small business owners through the entire loan process from application to closing. We offer a streamlined process for our customers by utilizing a credit scoring system as a key part of our underwriting process, along with a standardized loan documentation package. This results in our ability to deliver quick decision-making along with cost effective loan closings to our small business customers. As a designated Small Business Administration (“SBA”) preferred lender, we are also able to offer flexible financing terms to those borrowers who otherwise would not qualify under our traditional underwriting standards. The Small Business Administration program is a cornerstone of our small business loan program. Based on the SBA 2015 fiscal year, we were ranked 1st out of 76 small business lenders in CT as measured by number of loans, originating 66 loans totaling $5.5 million. Based on the SBA 2014, 2013 and 2012 fiscal years, we were ranked 2nd, 3rd and 1st, respectively, out of over 50 small business lenders in CT as measured by number of loans. We also were awarded the “Top Lender to Women Entrepreneurs” award for fiscal year 2015. As of December 31, 2015, our entire small business loan portfolio totaled $79.8 million or 3.4% of total loans, with an additional $18.9 million in unfunded loan commitments and an average loan size of approximately $92,000.
As of December 31, 2015, our largest commercial business loan relationship was fully advanced at $25.0 million, which was performing according to its terms. In addition to the commercial business loans discussed above, we had $3.6 million in letter of credit commitments as of December 31, 2015.
| 7 |
Home equity line of credit:
We also offer home equity loans and home equity lines of credit, both of which are secured by owner-occupied one-to-four family residences. Home equity loans and home equity lines of credit totaled $174.7 million and $169.8 million, or 7.4% and 8.0% of total loans at December 31, 2015 and 2014, respectively. At December 31, 2015, the unadvanced amount of home equity lines of credit totaled $205.0 million, as compared to $173.5 million at December 31, 2014.
The underwriting standards utilized for home equity loans and home equity lines of credit include a determination of the borrower’s credit history, an assessment of the borrower’s ability to meet existing obligations and future payments on the proposed loan and the value of the collateral securing the loan. Home equity loans are offered with fixed-rates of interest and with terms of up to 15 years. The loan-to-value ratio for our home equity loans and our lines of credit, including any first mortgage, is generally limited to no more than 80.0%. Our home equity lines of credit have a ten-year draw period which amortizes over a 20-year period and adjustable rates of interest which are indexed to the prime rate, as reported in The Wall Street Journal.
Interest rates on home equity lines of credit are generally limited to a maximum rate of 18.0% per annum.
Installment, Demand, Collateral, Revolving Credit and Resort Loans: We offer various types of consumer loans, including installment, demand, revolving credit and collateral loans, principally to customers residing in our primary market area with acceptable credit ratings. Our installment and collateral consumer loans generally consist of loans on new and used automobiles, loans collateralized by deposit accounts and unsecured personal loans. The resort portfolio consists of a direct receivable loan outside the Northeast which is amortizing to its contractual obligations. The Bank has exited the resort financing market with a residual portfolio remaining. Installment, demand, collateral, revolving credit and resort loans totaled $5.5 million and $6.1 million, or 0.2% and 0.3% of our total loan portfolio at December 31, 2015 and 2014, respectively. While the asset quality of these portfolios is currently good, there is increased risk associated with consumer loans during economic downturns as increased unemployment and inflationary costs may make it more difficult for some borrowers to repay their loans.
Origination, Purchasing and Servicing of Loans:
In order to reduce our exposure to rising interest rates, we sell fixed-rate conforming loans into the secondary market while retaining the servicing for the majority of these loans. Loan servicing includes collecting and remitting loan payments, accounting for principal and interest, contacting delinquent mortgagors, supervising foreclosures and property dispositions in the event of unremedied defaults, making certain insurance and tax payments on behalf of the borrowers and generally administering the loans.
We are an approved seller and servicer of the Federal National Mortgage Association, the Federal Home Loan Mortgage Corporation and the Federal Home Loan Bank. All adjustable rate mortgages are currently being held in our residential portfolio. We also originate Federal Housing Administration loans through our “Direct Endorsed” designation with the U.S. Department of Housing and Urban Development.
We were servicing residential real estate loans sold in the amount of $457.5 million and $335.2 million at December 31, 2015 and 2014, respectively. We anticipate our servicing assets will continue to grow as we expect to sell a portion of our fixed-rate conforming loan production into the secondary market.
We also purchase one-to-four family residential mortgage loans throughout the New England and New York/New Jersey markets, from approved Correspondents licensed with the respective State Departments of Banking. The approved Correspondents are not employed by us and sell their loans based on competitive pricing. The loans are underwritten by us to the same credit specifications as our internally originated loans. We do not, however, participate in the purchase of credit impaired loans. We expect to continue to purchase one-to-four family residential mortgage loans from approved Correspondents so long as pricing and purchase opportunities remain favorable.
From time to time we enter into participations with other regional lenders in commercial real estate and commercial business loan transactions. We participate in transactions (purchase a share of the loan commitment), as well as sell portions of transactions that we originate. As of December 31, 2015 and 2014, our loan portfolio included $151.0 million and $121.4 million, respectively, in loans in which we purchased a participation share, and $152.1 million and $126.6 million, respectively, in loans participated to other institutions.
| 8 |
Loan Portfolio Maturities and Yields:
The following table summarizes the scheduled maturities of our loan portfolio at December 31, 2015. Demand loans, loans having no stated repayment schedule or maturity are reported as being due in one year or less. Weighted average rates are computed based on the rate of the loan at December 31, 2015.
| Loans Maturing During the Years Ending December 31, | ||||||||||||||||||||||||||||||||
| 2016 | 2017 to 2020 | 2021 and beyond | Total | |||||||||||||||||||||||||||||
| Amount | Weighted Average Rate | Amount | Weighted Average Rate | Amount | Weighted Average Rate | Amount | Weighted Average Rate | |||||||||||||||||||||||||
| Real estate: | (Dollars in Thousands) | |||||||||||||||||||||||||||||||
| Residential | $ | 131 | 6.87 | % | $ | 17,810 | 3.22 | % | $ | 831,781 | 3.54 | % | $ | 849,722 | 3.53 | % | ||||||||||||||||
| Commercial | 30,836 | 3.31 | % | 102,573 | 3.03 | % | 754,022 | 3.68 | % | 887,431 | 3.59 | % | ||||||||||||||||||||
| Construction | 8,475 | 3.55 | % | 1,099 | 4.28 | % | 21,321 | 3.76 | % | 30,895 | 3.72 | % | ||||||||||||||||||||
| Installment | 71 | 7.04 | % | 695 | 6.62 | % | 2,204 | 5.26 | % | 2,970 | 5.62 | % | ||||||||||||||||||||
| Commercial | 72,271 | 3.50 | % | 116,823 | 3.49 | % | 220,456 | 3.13 | % | 409,550 | 3.30 | % | ||||||||||||||||||||
| Collateral | 745 | 2.55 | % | - | - | 923 | 2.49 | % | 1,668 | 2.52 | % | |||||||||||||||||||||
| Home equity line of credit | 2,996 | 3.14 | % | 30,749 | 3.10 | % | 140,956 | 2.64 | % | 174,701 | 2.73 | % | ||||||||||||||||||||
| Revolving Credit | 91 | 17.58 | % | - | - | - | - | 91 | 17.58 | % | ||||||||||||||||||||||
| Resort | - | - | 784 | 3.44 | % | - | - | 784 | 3.44 | % | ||||||||||||||||||||||
| Total | $ | 115,616 | 3.46 | % | $ | 270,533 | 3.26 | % | $ | 1,971,663 | 3.49 | % | $ | 2,357,812 | 3.46 | % | ||||||||||||||||
The following table sets forth the fixed-rate and adjustable rate loans at December 31, 2015 that are contractually due after December 31, 2016:
| Fixed | Adjustable | Total | ||||||||||
| Real estate: | (Dollars in Thousands) | |||||||||||
| Residential | $ | 407,170 | $ | 442,421 | $ | 849,591 | ||||||
| Commercial | 301,537 | 555,058 | 856,595 | |||||||||
| Construction | 7,480 | 14,940 | 22,420 | |||||||||
| Installment | 2,899 | - | 2,899 | |||||||||
| Commercial | 222,461 | 114,818 | 337,279 | |||||||||
| Collateral | 13 | 910 | 923 | |||||||||
| Home equity line of credit | 423 | 171,282 | 171,705 | |||||||||
| Revolving Credit | - | - | - | |||||||||
| Resort | - | 784 | 784 | |||||||||
| Total | $ | 941,983 | $ | 1,300,213 | $ | 2,242,196 | ||||||
Loan Approval Procedures and Authority:
Our lending activities follow written, non-discriminatory and regulatory compliant underwriting standards and loan origination procedures established by our board of directors and documented in our loan policy. The loan approval process is intended to assess the borrower’s ability to repay the loan, the viability of the loan, and the adequacy of the value of the collateral that will secure the loan, if applicable. To assess a business borrower’s ability to repay, we review and analyze, among other factors: the borrower’s historical, current, and projected financial performance; the borrower’s balance sheet and balance sheet trends; its capitalization; its ability to repay the proposed loan(s); the value and complexion of the assets offered as collateral; the ability of management to lead the borrower through the current and future economic cycles; and the financial strength and commitment of the personal or corporate guarantors, if any. To assess an individual borrower’s ability to repay, we review their employment and credit history and information on their historical and projected income and expenses, as well as the adequacy of the collateral.
Our policies and loan approval limits are established by our board of directors. Our board has delegated its authority to grant loans in varying amounts to the board of directors’ loan committee, which is currently comprised of all board members. The board loan committee is charged with general oversight of our credit extension functions and has designated the responsibility for the approval of loans, depending on risk rating and size (generally $5.0 million and under) to our management loan committee. In general, loan requests above $5.0 million are required to be approved by the board’s loan committee. Our management loan committee, in turn, has the right to delegate approval authority with respect to such loans to individual lenders as deemed appropriate.
| 9 |
Review of Credit Quality:
At the time of loan origination, a risk rating based on a nine point grading system is assigned to each commercial-related loan based on the loan officer’s and management’s assessment of the risk associated with each particular loan. This risk assessment is based on an in depth analysis of a variety of factors. More complex loans and larger commitments require that our internal Credit Risk Management Department further evaluate the risk rating of the individual loan or relationship, with our Credit Risk Management Department having final determination of the appropriate risk rating. These more complex loans and relationships receive ongoing periodic review to assess the appropriate risk rating on a post-closing basis with changes made to the risk rating as the borrower’s and economic conditions warrant. Our risk rating system is designed to be a dynamic system and we grade loans on a “real time” basis. Considerable emphasis is placed on risk rating accuracy, risk rating justification, and risk rating triggers. Our risk rating process is enhanced with the utilization of industry-based risk rating “cards.” The cards are utilized to promote risk rating accuracy and consistency on an institution-wide basis. Most loans are reviewed annually as part of a comprehensive portfolio review conducted by management and/or by our independent loan review firm. More frequent reviews of loans rated special mention, substandard and doubtful are conducted by our Credit Risk Management Department. We utilize an independent loan review consulting firm to affirm our rating accuracy and opine on the overall credit quality of our loan portfolio. The consulting firm conducts two loan reviews per year aiming at a 65.0% or higher commercial portfolio penetration. Summary findings of all loan reviews performed by the outside consulting firm are reported to our board of directors and senior management upon completion.
Our board of directors and senior management receive reporting throughout the year on credit trends in the commercial, residential and consumer portfolios (delinquencies, non-performing loans, risk rating migration, charge-off requests, etc.), as well as an update on any significant or developing troubled assets. We use risk management “dashboards” to assist in our ongoing portfolio monitoring and credit risk management reporting. The dashboards provide detailed analysis of portfolio and industry concentrations, as well as a variety of asset quality trends within industry and loan product types, and are presented to the board of directors on a monthly basis. This reporting system also performs various credit administration tracking functions, credit grade migration analysis and allows for an enhanced level of stress testing of the portfolios utilizing multiple variables.
In addition to the dashboards, on a periodic basis our board of directors and senior management receive reports on various “highly monitored” industries and portfolios, such as investment commercial real estate, “for-sale” real estate (i.e. subdivision and condominium lending) and home equity loans.
This comprehensive portfolio monitoring process is supplemented with several risk assessment tools including monitoring of delinquency levels, analysis of historical loss experience by loan portfolio segment, identification of portfolio concentrations by borrower and industry, and a review of economic conditions that might impact loan quality.
Non-performing and Problem Assets:
Our senior management places considerable emphasis on the early identification of problem assets, problem resolution and minimizing loss exposure. A loan is considered delinquent when the customer does not make their payments according to their contractual terms. Delinquencies are monitored daily and delinquency notices are mailed monthly to borrowers who have exceeded their payment grace period. In general, if a borrower fails to bring a loan current within 120 days from the original due date the matter may be referred to legal counsel and foreclosure or other collection proceedings may be initiated. We may consider a loan modification, forbearance or other loan restructuring in certain circumstances where a temporary loss of income is the primary cause of the delinquency, and if a reasonable plan is presented by the borrower. Commercial delinquencies are handled on a case by case basis, typically by our Special Assets Department. Appropriate problem resolution and working strategies are formulated based on the specific facts and circumstances.
Loans are placed on non-accrual status when they become 90 days or more delinquent. In certain cases, if a loan is less than 90 days delinquent but the borrower is experiencing financial difficulties, such loan may be placed on non-accrual status if we determine that collection of the loan in full is not probable. When loans are placed on non-accrual status, unpaid accrued interest is reversed and cash payments received are applied as a reduction to the loan principal.
Loans may be returned to accrual status when all principal and interest amounts contractually due (including arrearages) are reasonably assured of repayment within a reasonable period and there is a sustained period of repayment performance (generally a minimum of six months) by the borrower, in accordance with contractual terms involving payment of cash or cash equivalents. The interest on these loans is not recognized, until qualifying for return to accrual status. The interest on these loans is accounted for on the cash-basis or cost-recovery method, until qualifying for return to accrual status. If a residential real estate, commercial real estate, construction, installment, commercial, collateral, home equity line of credit, demand or revolving credit loan is on non-accrual status or is considered to be impaired, cash payments are applied first as a reduction of principal.
| 10 |
Classified Assets: Under our internal risk rating system, we currently classify loans and other assets considered to be of lesser quality as “substandard,” “doubtful” or “loss” assets. An asset is considered “substandard” if it is inadequately protected by either the current net worth or the paying capacity of the obligor or by the collateral pledged, if any. “Substandard” assets include those characterized by the distinct possibility that we will sustain some loss if the deficiencies are not corrected. Assets classified as “doubtful” have all of the weaknesses inherent in those classified “substandard,” with the added characteristic that the weaknesses make collection or liquidation in full, on the basis of currently existing facts, conditions, and values, highly questionable and improbable. Assets classified as “loss” are those considered uncollectible and of such little value that their continuance as assets without the establishment of a specific loss reserve is not warranted. In addition to the classifications discussed above, consistent with ASC 310-10-35, assets are classified as impaired when it is probable that we will be unable to collect all amounts due in accordance with the contractual terms of the loan agreement.
The loan portfolio is reviewed on a regular basis to determine whether any loans require risk classification or reclassification. Not all classified assets constitute non-performing assets. For example, at December 31, 2015, 93% of commercial real estate, construction real estate, commercial business and resort loans rated substandard were on accrual status and current as to payments. Our classified assets include loans identified as “substandard”, “doubtful” or “loss”. Substandard assets consisted of $33.0 million and $38.3 million of our total loan portfolio at December 31, 2015 and 2014, respectively. We had assets classified as “doubtful” or “loss” totaling $166,000 and $212,000 at December 31, 2015 and 2014, respectively.
On a quarterly basis, our loan policy requires that we evaluate for impairment all commercial real estate, construction and commercial loans that are classified as non-accrual, secured by real property in foreclosure or are otherwise likely to be impaired, residential and consumer non-accruing loans greater than $100,000 and all troubled debt restructurings. We have determined that $41.0 million and $43.5 million of impaired loans existed at December 31, 2015 and 2014, respectively. Based upon our analysis, $5.9 million and $14.3 million of impaired loans required an allowance of $534,000 and $752,000 to be established as of December 31, 2015 and 2014, respectively. At December 31, 2015 and 2014, $28.3 million and $37.2 million, respectively, were included on the classified loan list and were not considered impaired.
| 11 |
Loan Delinquencies: The following is a summary of loan delinquencies at recorded investment values at the dates indicated.
| Loans Delinquent For | ||||||||||||||||||||||||||||||||
| 30-59 Days | 60-89 Days | 90 Days and Over | Total | |||||||||||||||||||||||||||||
| Number | Amount | Number | Amount | Number | Amount | Number | Amount | |||||||||||||||||||||||||
| At December 31, 2015 | (Dollars in thousands) | |||||||||||||||||||||||||||||||
| Real estate: | ||||||||||||||||||||||||||||||||
| Residential | 18 | $ | 3,379 | 5 | $ | 863 | 15 | $ | 6,304 | 38 | $ | 10,546 | ||||||||||||||||||||
| Commercial | 2 | 318 | - | - | 1 | 994 | 3 | 1,312 | ||||||||||||||||||||||||
| Construction | - | - | - | - | 1 | 187 | 1 | 187 | ||||||||||||||||||||||||
| Installment | 3 | 38 | - | - | - | - | 3 | 38 | ||||||||||||||||||||||||
| Commercial | 4 | 153 | - | - | 2 | 1,752 | 6 | 1,905 | ||||||||||||||||||||||||
| Collateral | 7 | 68 | - | - | 1 | 10 | 8 | 78 | ||||||||||||||||||||||||
| Home equity line of credit | 3 | 280 | 2 | 360 | 2 | 210 | 7 | 850 | ||||||||||||||||||||||||
| Demand | 1 | 29 | - | - | - | - | 1 | 29 | ||||||||||||||||||||||||
| Revolving Credit | - | - | - | - | - | - | - | - | ||||||||||||||||||||||||
| Resort | - | - | - | - | - | - | - | - | ||||||||||||||||||||||||
| Total | 38 | $ | 4,265 | 7 | $ | 1,223 | 22 | $ | 9,457 | 67 | $ | 14,945 | ||||||||||||||||||||
| At December 31, 2014 | ||||||||||||||||||||||||||||||||
| Real estate: | ||||||||||||||||||||||||||||||||
| Residential | 16 | $ | 3,599 | 6 | $ | 1,263 | 16 | $ | 6,819 | 38 | $ | 11,681 | ||||||||||||||||||||
| Commercial | 2 | 348 | - | - | 3 | 1,979 | 5 | 2,327 | ||||||||||||||||||||||||
| Construction | - | - | - | - | 1 | 187 | 1 | 187 | ||||||||||||||||||||||||
| Installment | 3 | 69 | 2 | 82 | 2 | 33 | 7 | 184 | ||||||||||||||||||||||||
| Commercial | 1 | 40 | 1 | 4 | 7 | 550 | 9 | 594 | ||||||||||||||||||||||||
| Collateral | 9 | 99 | - | - | - | - | 9 | 99 | ||||||||||||||||||||||||
| Home equity line of credit | 3 | 202 | 1 | 349 | 5 | 389 | 9 | 940 | ||||||||||||||||||||||||
| Demand | 1 | 67 | - | - | - | - | 1 | 67 | ||||||||||||||||||||||||
| Revolving Credit | - | - | - | - | - | - | - | - | ||||||||||||||||||||||||
| Resort | - | - | - | - | - | - | - | - | ||||||||||||||||||||||||
| Total | 35 | $ | 4,424 | 10 | $ | 1,698 | 34 | $ | 9,957 | 79 | $ | 16,079 | ||||||||||||||||||||
| At December 31, 2013 | ||||||||||||||||||||||||||||||||
| Real estate: | ||||||||||||||||||||||||||||||||
| Residential | 9 | $ | 2,586 | 8 | $ | 1,600 | 20 | $ | 8,518 | 37 | $ | 12,704 | ||||||||||||||||||||
| Commercial | 1 | 231 | - | - | 1 | 827 | 2 | 1,058 | ||||||||||||||||||||||||
| Construction | - | - | - | - | 1 | 187 | 1 | 187 | ||||||||||||||||||||||||
| Installment | - | - | - | - | 2 | 47 | 2 | 47 | ||||||||||||||||||||||||
| Commercial | 1 | 5 | - | - | 6 | 584 | 7 | 589 | ||||||||||||||||||||||||
| Collateral | 2 | 9 | - | - | - | - | 2 | 9 | ||||||||||||||||||||||||
| Home equity line of credit | 1 | 283 | 1 | 183 | 5 | 441 | 7 | 907 | ||||||||||||||||||||||||
| Demand | 1 | 10 | - | - | - | - | 1 | 10 | ||||||||||||||||||||||||
| Revolving Credit | - | - | - | - | - | - | - | - | ||||||||||||||||||||||||
| Resort | - | - | - | - | - | - | - | - | ||||||||||||||||||||||||
| Total | 15 | $ | 3,124 | 9 | $ | 1,783 | 35 | $ | 10,604 | 59 | $ | 15,511 | ||||||||||||||||||||
| 12 |
Non-performing Assets: The table below sets forth the amounts and categories of our non-performing assets at the dates indicated. Once a loan is 90 days delinquent or either the borrower or the loan collateral experiences an event that makes full collectability of the loan improbable, the loan is placed on “non-accrual” status. Our policy requires at least six months of continuous payments in order for the loan to be removed from non-accrual status.
| At December 31, | ||||||||||||||||||||
| 2015 | 2014 | 2013 | 2012 | 2011 | ||||||||||||||||
| Non-performing loans: | (Dollars in thousands) | |||||||||||||||||||
| Real estate: | ||||||||||||||||||||
| Residential | $ | 9,773 | $ | 9,706 | $ | 10,599 | $ | 9,194 | $ | 9,224 | ||||||||||
| Commercial | 1,106 | 2,112 | 827 | 925 | 2,934 | |||||||||||||||
| Construction | 187 | 187 | 187 | 419 | 484 | |||||||||||||||
| Installment | 32 | 155 | 162 | 157 | 209 | |||||||||||||||
| Commercial | 3,232 | 2,268 | 2,285 | 2,351 | 956 | |||||||||||||||
| Collateral | 10 | - | - | - | - | |||||||||||||||
| Home equity line of credit | 573 | 1,040 | 740 | 711 | 1,669 | |||||||||||||||
| Demand | - | - | - | 25 | 25 | |||||||||||||||
| Revolving Credit | - | - | - | - | - | |||||||||||||||
| Resort | - | - | - | - | - | |||||||||||||||
| Total non-performing loans | 14,913 | 15,468 | 14,800 | 13,782 | 15,501 | |||||||||||||||
| Loans 90 days past due and still accruing | - | - | - | - | - | |||||||||||||||
| Other real estate owned | 279 | 400 | 393 | 549 | 302 | |||||||||||||||
| Total nonperforming assets | $ | 15,192 | $ | 15,868 | $ | 15,193 | $ | 14,331 | $ | 15,803 | ||||||||||
| Total non-performing loans to total loans | 0.63 | % | 0.72 | % | 0.81 | % | 0.90 | % | 1.18 | % | ||||||||||
| Total non-performing loans to total assets | 0.55 | % | 0.62 | % | 0.70 | % | 0.76 | % | 0.96 | % | ||||||||||
The amount of income that was contractually due but not recognized on non-accrual loans totaled $610,000 for the year ended December 31, 2015.
Troubled debt restructurings: The following table presents information on loans whose terms had been modified in a troubled debt restructuring:
| At December 31, | ||||||||||||||||||||
| 2015 | 2014 | 2013 | 2012 | 2011 | ||||||||||||||||
| (Dollars in thousands) | ||||||||||||||||||||
| Restructured loans on accrual status | $ | 16,952 | $ | 18,664 | $ | 15,790 | $ | 22,124 | $ | 23,515 | ||||||||||
| Restructured loans on non-accrual status | 7,258 | 7,581 | 7,578 | 7,550 | 7,809 | |||||||||||||||
| Total restructured loans | $ | 24,210 | $ | 26,245 | $ | 23,368 | $ | 29,674 | $ | 31,324 | ||||||||||
A loan is considered a troubled debt restructuring (“TDR”) when we, for economic or legal reasons related to the borrower’s financial difficulties, grant a concession to the borrower in modifying or renewing the loan that we would not otherwise consider. In connection with troubled debt restructurings, terms may be modified to fit the ability of the borrower to repay in line with their current financial status, which may include a reduction in the interest rate to market rate or below, a change in the term or amortization, or other modifications to the structure of the loan. A loan is placed on non-accrual status upon being restructured, even if it was not previously, unless the modified loan was current for the six months prior to its modification and we believe the loan is fully collectable in accordance with its new terms. Our policy to restore a restructured loan to performing status is dependent on the receipt of regular payments, generally for a period of six months and one calendar year-end. All troubled debt restructurings are classified as impaired loans and are reviewed for impairment by management on a quarterly basis and at calendar year-end reporting period per our policy.
At December 31, 2015, 100% of the accruing TDRs were performing in accordance with the restructured terms. At December 31, 2015 and 2014, the allowance for loan losses included specific reserves of $340,000 and $592,000 related to TDRs, respectively. For the years ended December 31, 2015 and 2014, the Bank had charge-offs totaling $296,000 and $1.3 million, respectively, related to portions of TDRs deemed to be uncollectible. The amount of additional funds committed to borrowers in TDR status was $272,000 and $206,000 at December 31, 2015 and 2014, respectively.
| 13 |
Potential Problem Loans: We perform a comprehensive internal analysis of our loan portfolio in order to identify and quantify loans with higher than normal risk. Loans having a higher risk profile are assigned a risk rating corresponding to the level of weakness identified in the loan. All special mention, substandard and doubtful loans are included on our “Watched Asset” report which is updated and reviewed quarterly by our Credit Risk Management Department. In addition, on a quarterly basis, loans rated special mention, substandard or doubtful are formally presented to and reviewed by management to assess the level of risk, ensure the risk ratings are appropriate, and ensure appropriate actions are being taken to minimize potential loss exposure. The review cycle is determined based on the risk rating and level of overall credit exposure. This quarterly review is performed by the Chief Risk Officer, Chief Lending Officer and members of the Credit Risk Management and Special Assets Departments. Loans identified as being “loss” are normally fully charged off. Loans risk rated substandard or more severe are generally transferred to the Special Assets Department, although it is not uncommon for commercial lenders to manage stable or improving substandard loans with significant oversight from the Special Assets Department. We do not use interest reserves to keep problem loans current. Interest reserves are only used for construction loans during the construction phase of the loan.
Allowance for Loan Losses
The allowance for loan losses is maintained at a level believed adequate by management to absorb potential losses inherent in the loan portfolio as of the statement of condition date. The allowance for loan losses consists of a formula allowance following FASB ASC 450 – “Contingencies” and FASB ASC 310 – “Receivables”. The allowance for loan losses is established as losses are estimated to have occurred through a provision for loan losses charged to earnings. Loan losses are charged against the allowance when management believes the uncollectibility of a loan balance is confirmed. Subsequent recoveries, if any, are credited to the allowance.
The allowance for loan losses is evaluated on a quarterly basis by management. This evaluation is inherently subjective as it requires estimates that are susceptible to significant revision as more information becomes available. The allowance consists of general, allocated and unallocated components, as further described below. All reserves are available to cover any losses regardless of how they are allocated.
General component:
The general component of the allowance for loan losses is based on historical loss experience adjusted for qualitative factors stratified by the following loan segments: residential real estate, commercial real estate, construction, installment, commercial, collateral, home equity line of credit, demand, revolving credit and resort. Construction loans include classes for commercial investment real estate construction, commercial owner occupied construction, residential development, residential subdivision construction and residential owner occupied construction loans. Management uses a rolling average of historical losses based on a time frame appropriate to capture relevant loss data for each loan segment. This historical loss factor is adjusted for the following qualitative factors: levels/trends in delinquencies and nonaccrual loans; trends in volume and terms of loans; effects of changes in risk selection and underwriting standards and other changes in lending policies, procedures and practices; experience/ability/depth of lending management and staff; and national and local economic trends and conditions. There were no material changes in the Company’s policies or methodology pertaining to the general component of the allowance for loan losses during the year ended December 31, 2015.
The qualitative factors are determined based on the various risk characteristics of each loan segment. Risk characteristics relevant to each portfolio segment are as follows:
Residential real estate – Residential real estate loans are generally originated in amounts up to 95.0% of the lesser of the appraised value or purchase price of the property, with private mortgage insurance required on loans with a loan-to-value ratio in excess of 80.0%. The Company does not grant subprime loans. All loans in this segment are collateralized by owner-occupied residential real estate and repayment is dependent on the credit quality of the individual borrower. Typically, all fixed-rate residential mortgage loans are underwritten pursuant to secondary market underwriting guidelines which include minimum FICO standards. The overall health of the economy, including unemployment rates and housing prices, will have an effect on the credit quality in this segment.
Commercial real estate – Loans in this segment are primarily income-producing properties throughout New England. The underlying cash flows generated by the properties may be adversely impacted by a downturn in the economy as evidenced by increased vacancy rates, which in turn, may have an effect on the credit quality in this segment. Management generally obtains rent rolls and other financial information, as appropriate on an annual basis and continually monitors the cash flows of these loans.
| 14 |
Construction loans – Loans in this segment include commercial construction loans, real estate subdivision development loans to developers, licensed contractors and builders for the construction and development of commercial real estate projects and residential properties. Construction lending contains a unique risk characteristic as loans are originated under market and economic conditions that may change between the time of origination and the completion and subsequent purchaser financing of the property. In addition, construction subdivision loans and commercial and residential construction loans to contractors and developers entail additional risks as compared to single-family residential mortgage lending to owner-occupants. These loans typically involve large loan balances concentrated in single borrowers or groups of related borrowers. Real estate subdivision development loans to developers, licensed contractors and builders are generally speculative real estate development loans for which payment is derived from sale of the property. Credit risk may be affected by cost overruns, time to sell at an adequate price, and market conditions. Construction financing is generally considered to involve a higher degree of credit risk than longer-term financing on improved, owner-occupied real estate. Residential construction credit quality may be impacted by the overall health of the economy, including unemployment rates and housing prices.
Commercial – Loans in this segment are made to businesses and are generally secured by assets of the business. Repayment is expected from the cash flows of the business. A weakened economy, and resultant decreased consumer spending, will have an effect on the credit quality in this segment.
Home equity line of credit – Loans in this segment include home equity loans and lines of credit underwritten with a loan-to-value ratio generally limited to no more than 80%, including any first mortgage. Our home equity lines of credit have ten-year terms and adjustable rates of interest which are indexed to the prime rate. The overall health of the economy, including unemployment rates and housing prices, may have an effect on the credit quality in this segment.
Installment, Collateral, Demand, Revolving Credit and Resort – Loans in these segments include loans principally to customers residing in our primary market area with acceptable credit ratings. Our installment and collateral consumer loans generally consist of loans on new and used automobiles, loans collateralized by deposit accounts and unsecured personal loans. The overall health of the economy, including unemployment rates and housing prices, may have an effect on the credit quality in this segment. Excluding collateral loans which are fully collateralized by a deposit account, repayment for loans in these segments is dependent on the credit quality of the individual borrower. The resort portfolio consists of a direct receivable loan outside the Northeast which is amortizing to its contractual obligations. The Company has exited the resort financing market with a residual portfolio remaining.
Allocated component:
The allocated component relates to loans that are classified as impaired. Impairment is measured on a loan by loan basis for commercial real estate, construction, commercial and resort loans by the present value of expected cash flows discounted at the effective interest rate; the fair value of the collateral, if applicable; or the observable market price for the loan. An allowance is established when the discounted cash flows (or collateral value) of the impaired loan is lower than the carrying value of that loan. The Company does not separately identify individual consumer and residential real estate loans for impairment disclosures, unless such loans are subject to a troubled debt restructuring agreement or they are nonaccrual loans with outstanding balances greater than $100,000.
A loan is considered impaired when, based on current information and events, it is probable that the Company will be unable to collect the scheduled payments of principal or interest when due according to the contractual terms of the loan agreement. Factors considered by management in determining impairment include payment status, collateral value, and the probability of collecting scheduled principal and interest payments when due. Loans that experience insignificant payment delays and payment shortfalls generally are not classified as impaired. Management determines the significance of payment delays and payment shortfalls on a case-by-case basis, taking into consideration all of the circumstances surrounding the loan and the borrower, including the length of the delay, the reasons for the delay, the borrower’s prior payment record, and the amount of the shortfall in relation to the principal and interest owed. Impairment is measured on a loan-by-loan basis for commercial and construction loans by the present value of expected future cash flows discounted at the loan’s effective interest rate, the loan’s obtainable market price or the fair value of the collateral if the loan is collateral dependent. Management updates the analysis quarterly. The assumptions used in appraisals are reviewed for appropriateness. Updated appraisals or valuations are obtained as needed or adjusted to reflect the estimated decline in the fair value based upon current market conditions for comparable properties.
The Company periodically may agree to modify the contractual terms of loans. When a loan is modified and a concession is made to a borrower experiencing financial difficulty, the modification is considered a troubled debt restructuring ("TDR"). All TDRs are classified as impaired.
| 15 |
Unallocated component:
An unallocated component is maintained, when needed, to cover uncertainties that could affect management’s estimate of probable losses. The unallocated component of the allowance reflects the margin of imprecision inherent in the underlying assumptions used in the methodologies for estimating allocated and general reserves in the portfolio. The Company’s Loan Policy allows management to utilize a high and low range of 0.0% to 5.0% of our total allowance for loan losses when establishing an unallocated allowance, when considered necessary. The unallocated allowance is used to provide for an unidentified loss that may exist in emerging problem loans that cannot be fully quantified or may be affected by conditions not fully understood as of the balance sheet date. There was no unallocated allowance at December 31, 2015 and 2014.
Based on the quantitative and qualitative assessment of the loan portfolio segments and in thorough consideration of the characteristics, risk and credit quality indicators, a detailed review of classified, non-performing and impaired loans, management believes that the allowance for loan losses properly estimated the inherent probable credit loss that exists in the loan portfolio as of the balance sheet date. This analysis process is both quantitative and qualitative as it requires management to make estimates that are susceptible to revisions as more information becomes available. Although we believe that we have established the allowance at levels to absorb probable losses, future additions may be necessary if economic or other conditions in the future differ from the current environment.
Schedule of Allowance for Loan Losses: The following table sets forth activity in the allowance for loan losses for the years indicated.
| For the Years Ended December 31, | ||||||||||||||||||||
| 2015 | 2014 | 2013 | 2012 | 2011 | ||||||||||||||||
| (Dollars in thousands) | ||||||||||||||||||||
| Balance at beginning of year | $ | 18,960 | $ | 18,314 | $ | 17,229 | $ | 17,533 | $ | 20,734 | ||||||||||
| Provision for loan losses | 2,440 | 2,588 | 1,530 | 1,380 | 4,090 | |||||||||||||||
| Charge-offs: | ||||||||||||||||||||
| Real estate: | ||||||||||||||||||||
| Residential | (295 | ) | (701 | ) | (430 | ) | (337 | ) | (411 | ) | ||||||||||
| Commercial | (213 | ) | (93 | ) | - | (454 | ) | (1,314 | ) | |||||||||||
| Construction | - | - | - | - | - | |||||||||||||||
| Installment | (39 | ) | (4 | ) | - | (9 | ) | (28 | ) | |||||||||||
| Commercial | (318 | ) | (1,066 | ) | (31 | ) | (33 | ) | (517 | ) | ||||||||||
| Collateral | - | - | - | - | - | |||||||||||||||
| Home equity line of credit | (238 | ) | (106 | ) | - | (1,019 | ) | (114 | ) | |||||||||||
| Demand | - | - | - | - | - | |||||||||||||||
| Revolving credit | (246 | ) | (133 | ) | (62 | ) | (61 | ) | (59 | ) | ||||||||||
| Resort | - | - | - | - | (4,880 | ) | ||||||||||||||
| Total charge-offs | (1,349 | ) | (2,103 | ) | (523 | ) | (1,913 | ) | (7,323 | ) | ||||||||||
| Recoveries: | ||||||||||||||||||||
| Real estate: | ||||||||||||||||||||
| Residential | 112 | 58 | 6 | 9 | - | |||||||||||||||
| Commercial | - | 1 | - | 4 | - | |||||||||||||||
| Construction | - | - | - | - | - | |||||||||||||||
| Installment | - | - | - | 7 | 2 | |||||||||||||||
| Commercial | 6 | 84 | 52 | 194 | 12 | |||||||||||||||
| Collateral | - | - | - | - | - | |||||||||||||||
| Home equity line of credit | - | - | - | - | - | |||||||||||||||
| Demand | - | - | - | - | 18 | |||||||||||||||
| Revolving credit | 29 | 18 | 20 | 15 | - | |||||||||||||||
| Resort | - | - | - | - | - | |||||||||||||||
| Total recoveries | 147 | 161 | 78 | 229 | 32 | |||||||||||||||
| Net charge-offs | (1,202 | ) | (1,942 | ) | (445 | ) | (1,684 | ) | (7,291 | ) | ||||||||||
| Allowance at end of year | $ | 20,198 | $ | 18,960 | $ | 18,314 | $ | 17,229 | $ | 17,533 | ||||||||||
| Ratios: | ||||||||||||||||||||
| Allowance for loan losses to non-performing | ||||||||||||||||||||
| loans at end of year | 135.44 | % | 122.58 | % | 123.74 | % | 125.01 | % | 113.11 | % | ||||||||||
| Allowance for loan losses to total loans | ||||||||||||||||||||
| outstanding at end of year | 0.86 | % | 0.89 | % | 1.01 | % | 1.12 | % | 1.34 | % | ||||||||||
| Net charge-offs to average loans outstanding | 0.05 | % | 0.10 | % | 0.03 | % | 0.12 | % | 0.61 | % | ||||||||||
| 16 |
It is our general policy to charge-off or partially charge-off any loan when it becomes evident that its collectability is highly unlikely, or our internal loan rating dictates a charge-off, either full or partial. We take a charge-off when it is determined that there is a confirmed loss. Our charge-off policy has remained consistent and has not undergone any material revisions.
In making a determination on whether collection of a loan is unlikely, a number of criteria are considered including, but not limited to: the borrower’s financial condition; the borrower’s historical, current, and pro-forma debt service ability; an updated collateral valuation and / or impairment test; and the borrower’s and /or guarantor’s willingness and demonstrated ability to continue to support the credit (inclusive of a global cash flow analysis, if warranted).
With respect to reserves, all impaired loans are reviewed to determine if a valuation should be established based on one of three measurement tests: (1) the present value of expected cash flows discounted at the effective interest rate; (2) the fair value of the collateral, if applicable; or (3) the observable market price for the loan. If we determine that an impairment amount exists, we will establish a valuation allowance (i.e. specific reserve) for the loan. A charge-off is promptly recorded when a current appraisal for a collateral dependent loan indicates a fair value in excess of its recorded investment and the excess is identified as uncollectable. Updated appraisals are obtained at least annually per guidelines stated in the Loan Policy and, if appropriate, adjusted to reflect the estimated decline in the fair value based upon current market conditions for comparable properties. All other loans, including individually evaluated loans determined not to be impaired, are included in a group of loans that is collectively evaluated for impairment. We categorize our loan portfolio into separate loan portfolio segment with similar risk characteristics. In estimating credit losses, we consider historical loss experience on each loan portfolio segment, adjusted for changes in trends, conditions, and other relevant factors that may affect repayment of the loans as of the evaluation date. Any partial charge-offs on our non-performing or impaired loans cause a reduction in our coverage ratio for our allowance for loan losses and other credit loss statistics.
As of December 31, 2015, we had impaired loans of $35.1 million with no valuation or partial charge-offs recorded. As described above, if a loan is determined to be impaired, we will evaluate the amount of reserves for such loans based on the present value of expected cash flows discounted at the effective interest rate, the fair value of the collateral, if applicable, or the observable market price for the loan. If we determine that an impairment amount exists, we will establish a valuation allowance for the loan. If no impairment amount exists based on these tests, then no allowance for loan loss is required on that loan. If an impairment is shown to exist, we establish an allowance for loan loss for the amount that the recorded investment or book value, in the loan exceeds the measure of the impaired loan. In general, any portion of the recorded investment in a collateral dependent loan in excess of the fair value can be identified as uncollectible and is, therefore, deemed a confirmed loss which is charged-off against our allowance for loan losses.
Allocation of Allowance for Loan Losses: The following table sets forth the allowance for loan losses allocated by loan portfolio segment, the percentage of allowance in each category to total allowance, and the percentage of loans in each portfolio segment to total loans at the dates indicated. The allowance for loan losses allocated to each category is not necessarily indicative of future losses in any particular category and does not restrict the use of the allowance to absorb losses in other categories.
| At December 31, | ||||||||||||||||||||||||
| 2015 | 2014 | |||||||||||||||||||||||
| Allowance for Loan Losses | % of Allowance for Loan Losses | % of Loans in Category to Total Loans | Allowance for Loan Losses | % of Allowance for Loan Losses | % of Loans in Category to Total Loans | |||||||||||||||||||
| (Dollars in thousands) | ||||||||||||||||||||||||
| Real estate: | ||||||||||||||||||||||||
| Residential | $ | 4,084 | 20.2 | % | 36.1 | % | $ | 4,382 | 23.1 | % | 38.7 | % | ||||||||||||
| Commercial | 10,255 | 50.8 | % | 37.6 | % | 8,949 | 47.3 | % | 35.8 | % | ||||||||||||||
| Construction | 231 | 1.1 | % | 1.3 | % | 478 | 2.5 | % | 2.7 | % | ||||||||||||||
| Installment | 39 | 0.2 | % | 0.1 | % | 41 | 0.2 | % | 0.2 | % | ||||||||||||||
| Commercial | 4,119 | 20.4 | % | 17.4 | % | 3,250 | 17.1 | % | 14.5 | % | ||||||||||||||
| Collateral | - | - | 0.1 | % | - | - | 0.1 | % | ||||||||||||||||
| Home equity line of credit | 1,470 | 7.3 | % | 7.4 | % | 1,859 | 9.8 | % | 8.0 | % | ||||||||||||||
| Demand | - | - | - | - | - | - | ||||||||||||||||||
| Revolving credit | - | - | - | - | - | - | ||||||||||||||||||
| Resort | - | - | - | 1 | * | * | ||||||||||||||||||
| Unallocated allowance | - | - | n/a | - | - | n/a | ||||||||||||||||||
| Total | $ | 20,198 | 100.0 | % | 100.0 | % | $ | 18,960 | 100.0 | % | 100.0 | % | ||||||||||||
| 17 |
| At December 31, | ||||||||||||||||||||||||||||||||||||
| 2013 | 2012 | 2011 | ||||||||||||||||||||||||||||||||||
| Allowance for Loan Losses | % of Allowance for Loan Losses | % of Loans in Category to Total Loans | Allowance for Loan Losses | % of Allowance for Loan Losses | % of Loans in Category to Total Loans | Allowance for Loan Losses | % of Allowance for Loan Losses | % of Loans in Category to Total Loans | ||||||||||||||||||||||||||||
| (Dollars in thousands) | ||||||||||||||||||||||||||||||||||||
| Real estate: | ||||||||||||||||||||||||||||||||||||
| Residential | $ | 3,647 | 19.9 | % | 38.2 | % | $ | 3,778 | 21.9 | % | 40.5 | % | $ | 2,874 | 16.4 | % | 38.4 | % | ||||||||||||||||||
| Commercial | 8,253 | 45.0 | % | 34.9 | % | 8,105 | 47.1 | % | 30.9 | % | 8,755 | 49.9 | % | 31.2 | % | |||||||||||||||||||||
| Construction | 1,152 | 6.3 | % | 4.3 | % | 760 | 4.4 | % | 4.2 | % | 590 | 3.4 | % | 3.5 | % | |||||||||||||||||||||
| Installment | 48 | 0.3 | % | 0.2 | % | 77 | 0.4 | % | 0.4 | % | 92 | 0.5 | % | 0.8 | % | |||||||||||||||||||||
| Commercial | 3,746 | 20.5 | % | 13.9 | % | 2,654 | 15.4 | % | 12.6 | % | 2,140 | 12.2 | % | 11.8 | % | |||||||||||||||||||||
| Collateral | - | 0.0 | % | 0.1 | % | - | - | 0.1 | % | - | - | 0.2 | % | |||||||||||||||||||||||
| Home equity line of credit | 1,465 | 8.0 | % | 8.3 | % | 1,377 | 8.0 | % | 9.3 | % | 1,295 | 7.4 | % | 8.4 | % | |||||||||||||||||||||
| Demand | - | - | - | - | - | - | - | - | - | |||||||||||||||||||||||||||
| Revolving credit | - | - | - | - | - | - | - | - | - | |||||||||||||||||||||||||||
| Resort | 3 | * | 0.1 | % | 456 | 2.7 | % | 2.0 | % | 1,787 | 10.2 | % | 5.7 | % | ||||||||||||||||||||||
| Unallocated allowance | - | - | n/a | 22 | 0.1 | % | n/a | - | - | n/a | ||||||||||||||||||||||||||
| Total | $ | 18,314 | 100.0 | % | 100.0 | % | $ | 17,229 | 100.0 | % | 100.0 | % | $ | 17,533 | 100.0 | % | 100.0 | % | ||||||||||||||||||
* Less than 0.1%
Investment Activities
Our Chief Financial Officer is responsible for implementing our investment policy. The investment policy is reviewed at least annually by management and our board of directors and any changes to the policy are subject to the approval of the board of directors. Authority to make investments under the approved investment policy guidelines is delegated by the board of directors to our Chairman, President and Chief Executive Officer, our Chief Financial Officer and limited purchasing by our Finance Officer. While general investment strategies are developed and authorized by our Chief Financial Officer, the execution of specific actions rests with both our Chairman, President and Chief Executive Officer and the Chief Financial Officer, who may act jointly or severally. The Chief Financial Officer is responsible for ensuring that the guidelines and requirements included in the investment policy are followed and that all securities are considered prudent for investment.
Our investment policy requires that all securities transactions be conducted in a safe and sound manner. Investment decisions must be based upon a thorough analysis of each security instrument to determine its credit quality and fit within our overall asset/liability management objectives, its effect on our risk-based capital and the overall prospects for yield and/or appreciation.
Our investment portfolio, excluding FHLBB stock, totaled $164.7 million and $204.2 million at December 31, 2015 and 2014, respectively, and consisted primarily of United States government securities, securities issued and guaranteed by Government Sponsored Enterprises (GSE’s) including debt and mortgage-backed securities, municipal and other bonds, mutual funds and equity securities, including preferred equity securities.
| 18 |
Our investment objectives are to provide and maintain liquidity, to establish an acceptable level of interest rate and credit risk, to provide an alternate source of low-risk investments when demand for loans is weak and to generate a favorable return. Our board of directors has the overall responsibility for the investment portfolio, including approval of our investment policy, which is reviewed and approved at least annually. Our board of directors reviews the status of our investment portfolio on a semi-annual basis.
Investment Securities Portfolio: The following table sets forth the carrying values of our available-for-sale and held-to-maturity securities portfolio at the dates indicated.
| At December 31, | ||||||||||||||||||||||||
| 2015 | 2014 | 2013 | ||||||||||||||||||||||
| (Dollars in thousands) | Amortized Cost | Fair Value | Amortized Cost | Fair Value | Amortized Cost | Fair Value | ||||||||||||||||||
| Available-for-sale | ||||||||||||||||||||||||
| Debt securities: | ||||||||||||||||||||||||
| U.S. Treasury obligations | $ | 38,782 | $ | 38,859 | $ | 123,739 | $ | 123,816 | $ | 126,000 | $ | 126,000 | ||||||||||||
| U.S. Government agency obligations | 82,002 | 81,805 | 49,013 | 49,109 | 7,006 | 6,922 | ||||||||||||||||||
| Government sponsored residential mortgage-backed securities | 4,958 | 5,153 | 6,624 | 6,907 | 9,199 | 9,616 | ||||||||||||||||||
| Corporate debt securities | 1,000 | 1,048 | 1,000 | 1,085 | 2,982 | 3,104 | ||||||||||||||||||
| Trust preferred debt securities | - | - | - | 1,557 | - | - | ||||||||||||||||||
| Preferred equity securities | 2,000 | 1,632 | 2,100 | 1,676 | 2,100 | 1,569 | ||||||||||||||||||
| Marketable equity securities | 108 | 160 | 108 | 170 | 108 | 148 | ||||||||||||||||||
| Mutual funds | 3,957 | 3,767 | 3,838 | 3,721 | 3,710 | 3,527 | ||||||||||||||||||
| Total securities available-for-sale | $ | 132,807 | $ | 132,424 | $ | 186,422 | $ | 188,041 | $ | 151,105 | $ | 150,886 | ||||||||||||
| Held-to-maturity | ||||||||||||||||||||||||
| U.S. Government agency obligations | $ | 24,000 | $ | 24,008 | $ | 7,000 | $ | 6,992 | $ | 5,000 | $ | 4,930 | ||||||||||||
| Government sponsored residential mortgage-backed securities | 8,246 | 8,349 | 9,224 | 9,424 | 4,983 | 4,956 | ||||||||||||||||||
| Trust preferred debt security | - | - | - | - | 3,000 | 3,000 | ||||||||||||||||||
| Total held-to-maturity Total securities held-to-maturity | $ | 32,246 | $ | 32,357 | $ | 16,224 | $ | 16,416 | $ | 12,983 | $ | 12,886 | ||||||||||||
During the years ended December 31, 2015, 2014 and 2013, we recorded no other-than-temporary impairment charges.
Consistent with our overall business and asset/liability management strategy, which focuses on sustaining adequate levels of core earnings, most securities purchased were classified available-for-sale at December 31, 2015 and 2014.
U.S. Treasury and U.S. Government Agency Obligations: At December 31, 2015 and 2014, our U.S. Treasury and U.S. Government agency obligations portfolio totaled $144.7 million and $179.9 million, respectively, of which $120.7 million and $172.9 million, respectively, were classified as available-for-sale. There were no structured notes or derivatives in the portfolio.
Government Sponsored Residential Mortgage-Backed Securities: We purchase mortgage-backed securities insured or guaranteed by U.S. Government agencies and government-sponsored enterprises, including Fannie Mae, Freddie Mac and Ginnie Mae. We do not own any “private label” mortgage backed securities. We invest in mortgage-backed securities to achieve a positive interest rate spread with minimal administrative expense and to lower our credit risk as a result of the guarantees provided by Fannie Mae, Freddie Mac and Ginnie Mae.
Government sponsored mortgage-backed securities are created by the pooling of mortgages and the issuance of a security with an interest rate which is less than the interest rate on the underlying mortgages. These mortgage-backed securities typically represent a participation interest in a pool of single-family or multi-family mortgages, although we focus our investments on mortgage-backed securities backed by one-to-four family mortgages. The issuers of such securities pool and resell the participation interests in the form of securities to investors such as us and guarantee the payment of principal and interest to investors. Government sponsored residential mortgage-backed securities generally yield less than the loans that underlie such securities because of the cost of payment guarantees, mortgage servicing and credit enhancements. However, these mortgage-backed securities are usually more liquid than individual mortgage loans and may be used to collateralize our borrowing obligations.
| 19 |
At December 31, 2015, the carrying value of Government sponsored residential mortgage-backed securities totaled $13.4 million or 0.5% of assets, and 0.5% of interest earning assets, $5.2 million of which were classified as available-for-sale and $8.2 million of which were classified as held-to-maturity, compared to the carrying value of mortgage-backed securities at December 31, 2014 which totaled $16.1 million or 0.6% of assets, and 0.7% of interest earning assets, $6.9 million of which were classified as available-for-sale and $9.2 million of which were classified as held-to-maturity. The available-for-sale mortgage-backed securities portfolio had a book yield of 3.23% at December 31, 2015, compared to a book yield of 3.28% at December 31, 2014 and the held-to-maturity mortgage-backed securities portfolio had a book yield of 2.50% at December 31, 2015 and 2014. The estimated fair value of our mortgage-backed securities at December 31, 2015 was $13.5 million, which is $298,000 more than the amortized cost and at December 31, 2014 $16.3 million, which was $483,000 more than the amortized cost. Investments in mortgage-backed securities involve a risk that actual prepayments may differ from estimated prepayments over the life of the security, which may require adjustments to the amortization of any premium or accretion of any discount relating to such instruments, thereby changing the net yield on such securities. There is also reinvestment risk associated with the cash flows from such securities. In addition, the market value of such securities may be adversely affected by changes in interest rates.
Our investment portfolio contained no Government sponsored residential mortgage-backed securities collateralized by “subprime” loans for the years ended December 31, 2015 and 2014. Although we do not have a direct exposure to subprime related assets, the value and related income of our mortgage-backed securities are sensitive to changes in economic conditions, including delinquencies and/or defaults on the underlying mortgages. Continuing shifts in the market’s perception of credit quality on securities backed by residential mortgage loans may result in increased volatility of market price and periods of illiquidity that can have a negative impact upon the valuation of certain securities held by us.
Corporate Debt Securities: At December 31, 2015 and 2014, the fair value of our corporate bond portfolio totaled $1.0 million and $1.1 million, respectively, all of which was classified as available-for-sale. The corporate bond portfolio was fixed rate earning a book yield of 5.39% and 5.38% at December 31, 2015 and 2014, respectively. Although corporate bonds may offer higher yields than U.S. Treasury or agency securities of comparable duration, corporate bonds also have a higher risk of default due to possible adverse changes in the credit-worthiness of the issuer. In order to mitigate this risk, our investment policy requires that corporate debt obligation purchases be rated “A” or better by a nationally recognized rating agency. A security that is subsequently downgraded below investment grade will require additional analysis of credit worthiness and a determination will be made to hold or dispose of the investment.
Marketable Equity Securities and Mutual Funds: We currently maintain a diversified equity securities and mutual funds portfolio. At December 31, 2015 and 2014, the fair value of our marketable equity securities portfolio totaled $160,000 and $170,000, respectively. Our marketable equity securities represented less than one percent of total assets at December 31, 2015 and 2014 and were classified as available-for-sale. At December 31, 2015 and 2014, the mutual funds portfolio totaled $3.8 million and $3.7 million, respectively. The industries represented by our common stock investments are diverse and include banking, insurance and financial services, integrated utilities and various industrial sectors. Our investment policy provides that the total equity portfolio cannot exceed 50% of the Tier I capital of Farmington Bank. Investments in equity securities and mutual funds involve risk as they are not insured or guaranteed investments and are affected by stock market fluctuations. Such investments are carried at their market value and can directly affect our net capital position.
Preferred Equity Securities: Our investments in preferred equity securities consist of 80,000 shares of Goldman Sachs preferred stock at December 31, 2015. The carrying value of our preferred equity securities totaled $1.6 million and $1.7 million at December 31, 2015 and 2014, respectively.
Trust Preferred Debt Securities: During 2015, we sold our trust preferred debt securities for a gain of $1.5 million. At December 31, 2014, the carrying value of our trust preferred debt securities totaled $1.6 million, which were classified as available-for-sale.
| 20 |
Portfolio Maturities and Yields: The composition and maturities of the investment securities portfolio at December 31, 2015 and 2014 are summarized in the following tables. Maturities are based on the final contractual payment dates, and do not reflect the impact of prepayments or early redemptions that may occur. State agency and municipal obligations as well as common and preferred stock yields have not been adjusted to a tax-equivalent basis. Certain mortgage-backed securities have interest rates that are adjustable and will reprice annually within the various maturity ranges. These repricing schedules are not reflected in the table below.
| December 31, 2015 | ||||||||||||||||||||||||||||||||||||||||
| One Year or Less | More than One Year through Five Years | More than Five Years through Ten Years | More than Ten Years | Total Securities | ||||||||||||||||||||||||||||||||||||
| Fair Value | Weighted- Average Yield | Fair Value | Weighted- Average Yield | Fair Value | Weighted- Average Yield | Fair Value | Weighted- Average Yield | Fair Value | Weighted- Average Yield | |||||||||||||||||||||||||||||||
| (Dollars in thousands) | ||||||||||||||||||||||||||||||||||||||||
| Available-for-Sale: | ||||||||||||||||||||||||||||||||||||||||
| U.S. Treasury obligations | $ | 21,996 | 0.09 | % | $ | 16,863 | 0.93 | % | $ | - | - | $ | - | - | $ | 38,859 | 0.46 | % | ||||||||||||||||||||||
| U.S. Government agency obligations | 31,998 | 0.32 | % | 49,807 | 1.26 | % | - | - | - | - | 81,805 | 0.89 | % | |||||||||||||||||||||||||||
| Government-sponsored residential mortgage-backed securities | 2 | 5.50 | % | 268 | 4.57 | % | - | - | 4,883 | 3.15 | % | 5,153 | 3.23 | % | ||||||||||||||||||||||||||
| Corporate debt securities | 517 | 5.36 | % | 531 | 5.41 | % | - | - | - | - | 1,048 | 5.39 | % | |||||||||||||||||||||||||||
| Total debt securities available-for-sale | $ | 54,513 | 0.28 | % | $ | 67,469 | 1.22 | % | $ | - | - | $ | 4,883 | 3.15 | % | $ | 126,865 | 0.89 | % | |||||||||||||||||||||
| Held-to-Maturity: | ||||||||||||||||||||||||||||||||||||||||
| U.S. Government agency obligations | $ | - | - | $ | 24,008 | 1.74 | % | $ | - | - | $ | - | - | $ | 24,008 | 1.74 | % | |||||||||||||||||||||||
| Government-sponsored residential mortgage-backed securities | - | - | - | - | - | - | 8,349 | 2.50 | % | 8,349 | 2.50 | % | ||||||||||||||||||||||||||||
| Total debt securities held-to-maturity | $ | - | - | $ | 24,008 | 1.74 | % | $ | - | - | $ | 8,349 | 2.50 | % | $ | 32,357 | 1.94 | % | ||||||||||||||||||||||
| December 31, 2014 | ||||||||||||||||||||||||||||||||||||||||
| One Year or Less | More than One Year through Five Years | More than Five Years through Ten Years | More than Ten Years | Total Securities | ||||||||||||||||||||||||||||||||||||
| Fair Value | Weighted- Average Yield | Fair Value | Weighted- Average Yield | Fair Value | Weighted- Average Yield | Fair Value | Weighted- Average Yield | Fair Value | Weighted- Average Yield | |||||||||||||||||||||||||||||||
| (Dollars in thousands) | ||||||||||||||||||||||||||||||||||||||||
| Available-for-Sale: | ||||||||||||||||||||||||||||||||||||||||
| U.S. Treasury obligations | $ | 107,008 | 0.08 | % | $ | 16,808 | 0.93 | % | $ | - | - | $ | - | - | $ | 123,816 | 0.20 | % | ||||||||||||||||||||||
| U.S. Government agency obligations | - | - | 49,109 | 1.00 | % | - | - | - | - | 49,109 | 1.00 | % | ||||||||||||||||||||||||||||
| Government-sponsored residential mortgage-backed securities | 51 | 4.00 | % | 527 | 4.63 | % | - | - | 6,329 | 3.16 | % | 6,907 | 3.28 | % | ||||||||||||||||||||||||||
| Corporate debt securities | - | - | 1,085 | 5.38 | % | - | - | - | - | 1,085 | 5.38 | % | ||||||||||||||||||||||||||||
| Trust preferred debt securities | - | - | - | - | - | - | 1,557 | 2.99 | % | 1,557 | 2.99 | % | ||||||||||||||||||||||||||||
| Total debt securities available-for-sale | $ | 107,059 | 0.09 | % | $ | 67,529 | 1.08 | % | $ | - | - | $ | 7,886 | 3.13 | % | $ | 182,474 | 0.59 | % | |||||||||||||||||||||
| Held-to-Maturity: | ||||||||||||||||||||||||||||||||||||||||
| U.S. Government agency obligations | $ | - | - | $ | 6,992 | 1.50 | % | $ | - | - | $ | - | - | $ | 6,992 | 1.50 | % | |||||||||||||||||||||||
| Government-sponsored residential mortgage-backed securities | - | - | - | - | - | - | 9,424 | 2.50 | % | 9,424 | 2.50 | % | ||||||||||||||||||||||||||||
| Total debt securities held-to-maturity | $ | - | - | $ | 6,992 | 1.50 | % | $ | - | - | $ | 9,424 | 2.50 | % | $ | 16,416 | 2.07 | % | ||||||||||||||||||||||
| 21 |
Sources of Funds
General: Deposits have traditionally been our primary source of funds for use in lending and investment activities. In addition to deposits, funds are derived from scheduled loan payments, loan prepayments, investment maturities, retained earnings and income on earning assets.
Deposits: A majority of our depositors are persons who work or reside in Hartford County, Connecticut and Hampden County, Massachusetts. We offer a selection of deposit instruments, including checking, savings, money market savings accounts, negotiable order of withdrawal (“NOW”) accounts and fixed-rate time deposits. Deposit account terms vary, with the principal differences being the minimum balance required, the amount of time the funds must remain on deposit and the interest rate. The Company has established a relationship to participate in a reciprocal deposit program with other financial institutions as a service to our customers. This program provides enhanced FDIC insurance to participating customers. The Company also has established a relationship for brokered deposits. There were brokered deposits totaling $44.3 million and $-0- at December 31, 2015 and 2014, respectively.
Interest rates paid, maturity terms, service fees and withdrawal penalties are established on a periodic basis. Deposit rates and terms are based primarily on current operating strategies, market rates, liquidity requirements, rates paid by competitors and growth goals. To attract and retain deposits, we rely upon brand marketing, personalized customer service, long-standing relationships and competitive interest rates.
The flow of deposits is influenced significantly by general economic conditions, changes in money market and other prevailing interest rates and competition. The variety of deposit accounts that we offer allows us to be competitive in obtaining funds and responding to changes in consumer demand. Based on historical experience, management believes our deposits are relatively stable. Expansion of the branch network, the commercial and government banking divisions, as well as deposit promotions and disintermediation from investment firms due to increasing uncertainty in the financial markets, has provided us with opportunities to attract new deposit relationships.
It is unclear whether the recent growth in deposits will reflect our historical, stable experience with deposit customers. The ability to attract and maintain money market accounts and time deposits, and the rates paid on these deposits, has been and will continue to be significantly affected by market conditions. At December 31, 2015, $440.8 million or 22.1% of our deposits were time deposits, of which $267.7 million will be maturing within one year or less. At December 31, 2014, $365.2 million or 21.1% of our deposits were time deposits, of which $239.6 million matured within one year or less.
Our government banking group provides deposit services to municipalities throughout Connecticut. Through the efforts of our government banking group, we attracted significant municipal deposits through existing and newly formed relationships. Municipal deposits as of December 31, 2015 and 2014 were $368.0 million or 18.5% and $300.3 million or 17.3% of our total deposits outstanding, respectively. These deposits can be more volatile than other deposits but provide significant liquidity generally at a lower or similar cost to wholesale funds. We limit the related contingent funding risk by limiting the amount of municipal deposits that can be accepted.
The following table displays a summary of our deposits by account type as of the dates indicated:
| At December 31, | ||||||||||||||||||||||||
| 2015 | 2014 | 2013 | ||||||||||||||||||||||
| Balance | Percent | Balance | Percent | Balance | Percent | |||||||||||||||||||
| (Dollars in thousands) | ||||||||||||||||||||||||
| Demand deposits | $ | 401,388 | 20.2 | % | $ | 330,524 | 19.1 | % | $ | 308,459 | 20.4 | % | ||||||||||||
| NOW accounts | 468,054 | 23.5 | % | 355,412 | 20.5 | % | 285,392 | 18.9 | % | |||||||||||||||
| Money markets | 460,737 | 23.1 | % | 470,991 | 27.2 | % | 387,225 | 25.6 | % | |||||||||||||||
| Savings accounts | 220,389 | 11.1 | % | 210,892 | 12.1 | % | 193,937 | 12.7 | % | |||||||||||||||
| Total non-time deposit accounts | 1,550,568 | 77.9 | % | 1,367,819 | 78.9 | % | 1,175,013 | 77.6 | % | |||||||||||||||
| Time deposits | 440,790 | 22.1 | % | 365,222 | 21.1 | % | 338,488 | 22.4 | % | |||||||||||||||
| Total deposits | $ | 1,991,358 | 100.0 | % | $ | 1,733,041 | 100.0 | % | $ | 1,513,501 | 100.0 | % | ||||||||||||
| 22 |
The following table displays the distribution of average deposit accounts by account type with the average rates paid at the dates indicated:
| At December 31, | ||||||||||||||||||||||||||||||||||||
| 2015 | 2014 | 2013 | ||||||||||||||||||||||||||||||||||
| Average Balance | Interest | Weighted Average Rate | Average Balance | Interest | Weighted Average Rate | Average Balance | Interest | Weighted Average Rate | ||||||||||||||||||||||||||||
| (Dollars in thousands) | ||||||||||||||||||||||||||||||||||||
| Noninterest-bearing deposit | $ | 357,156 | $ | - | - | $ | 315,177 | $ | - | - | $ | 266,217 | $ | - | - | |||||||||||||||||||||
| NOW accounts | 472,644 | 1,351 | 0.29 | % | 380,936 | 976 | 0.26 | % | 277,698 | 638 | 0.23 | % | ||||||||||||||||||||||||
| Money markets | 453,017 | 3,592 | 0.79 | % | 420,456 | 3,112 | 0.74 | % | 362,914 | 2,878 | 0.79 | % | ||||||||||||||||||||||||
| Savings accounts | 213,383 | 226 | 0.11 | % | 200,948 | 205 | 0.10 | % | 182,952 | 206 | 0.11 | % | ||||||||||||||||||||||||
| Time deposits | 407,071 | 4,203 | 1.03 | % | 338,590 | 3,076 | 0.91 | % | 353,677 | 3,460 | 0.98 | % | ||||||||||||||||||||||||
| Total interest-bearing deposit | 1,546,115 | $ | 9,372 | 0.61 | % | 1,340,930 | $ | 7,369 | 0.55 | % | 1,177,241 | $ | 7,182 | 0.61 | % | |||||||||||||||||||||
| Total deposits | $ | 1,903,271 | $ | 1,656,107 | $ | 1,443,458 | ||||||||||||||||||||||||||||||
The following table displays information concerning time deposits by interest rate ranges at the dates indicated:
| At December 31, 2015 | ||||||||||||||||||||||||||||||||
| Period to Maturity | Total at December 31, | |||||||||||||||||||||||||||||||
| Less Than One Year | One to Two Years | Two to Three Years | More than Three Years | Total | Percent of Total | 2014 | 2013 | |||||||||||||||||||||||||
| (Dollars in thousands) | ||||||||||||||||||||||||||||||||
| Interest Rate Range: | ||||||||||||||||||||||||||||||||
| 1.00% and below | $ | 169,885 | $ | 39,061 | $ | 4,212 | $ | 8,493 | $ | 221,651 | 50.3 | % | $ | 229,426 | $ | 220,040 | ||||||||||||||||
| 1.01% - 2.00% | 67,134 | 62,169 | 23,889 | 4,811 | 158,003 | 35.8 | % | 70,134 | 58,612 | |||||||||||||||||||||||
| 2.01% - 3.00% | 30,729 | 4,772 | 144 | 25,491 | 61,136 | 13.9 | % | 65,504 | 59,680 | |||||||||||||||||||||||
| 3.01% - 4.00% | - | - | - | - | - | - | 158 | 156 | ||||||||||||||||||||||||
| Total | $ | 267,748 | $ | 106,002 | $ | 28,245 | $ | 38,795 | $ | 440,790 | 100.0 | % | $ | 365,222 | $ | 338,488 | ||||||||||||||||
The following table sets forth time deposits by time remaining until maturity as of December 31, 2015.
| Maturity | ||||||||||||||||||||||||
| Three months or less | Over three to six months | Over six to twelve months | Over one year to three years | Over three Years | Total | |||||||||||||||||||
| (Dollars in thousands) | ||||||||||||||||||||||||
| Time deposits less than $100,000 | $ | 41,074 | $ | 39,223 | $ | 37,646 | $ | 82,533 | $ | 14,582 | $ | 215,058 | ||||||||||||
| Time deposits of $100,000 or more | 50,575 | 38,480 | 60,750 | 51,714 | 24,213 | 225,732 | ||||||||||||||||||
| $ | 91,649 | $ | 77,703 | $ | 98,396 | $ | 134,247 | $ | 38,795 | $ | 440,790 | |||||||||||||
As of December 31, 2014, the aggregate amount of outstanding time deposits in amounts greater than or equal to $100,000 was $175.1 million.
The following table sets forth the interest-bearing deposit activities for the periods indicated:
| Years Ended December 31, | ||||||||||||
| 2015 | 2014 | 2013 | ||||||||||
| (Dollars in thousands) | ||||||||||||
| Balance beginning of year | $ | 1,402,517 | $ | 1,205,042 | $ | 1,082,869 | ||||||
| Net increase in deposits before interest credited | 178,081 | 190,106 | 114,991 | |||||||||
| Interest credited | 9,372 | 7,369 | 7,182 | |||||||||
| Net increase in deposits | 187,453 | 197,475 | 122,173 | |||||||||
| Balance end of year | $ | 1,589,970 | $ | 1,402,517 | $ | 1,205,042 | ||||||
| 23 |
Borrowed Funds
At December 31, 2015 and 2014, we had an available line of credit with the FHLBB in the amount of $8.8 million and access to additional Federal Home Loan Bank advances of up to $407.8 million subject to collateral requirements of the FHLBB at December 31, 2015. The Company also had letters of credit of $63.0 million and 22.0 million at December 31, 2015 and 2014, respectively, subject to collateral requirements of the FHLBB. Internal policies limit borrowings to 25.0% of total assets, or $677.1 million and $621.3 million at December 31, 2015 and 2014, respectively.
We have a Master Repurchase Agreement borrowing facility with a broker. Borrowings under the Master Repurchase Agreement are secured by our investments in certain securities with a fair value totaling $11.3 million at December 31, 2015. Outstanding repurchase agreement borrowings totaled $10.5 million and $21.0 million at December 31, 2015 and 2014.
The Company has access to pre-approved unsecured lines of credit with financial institutions totaling $45.0 million and $20.0 million at December 31, 2015 and 2014, which were undrawn at December 31, 2015 and 2014. The Company has access to $3.5 million unsecured line of credit agreement with a well-capitalized bank which expires on August 31, 2016. The line was undrawn at December 31, 2015 and 2014. The Company maintains a cash balance of $512,500 with certain financial institutions to avoid fees associated with the lines.
Competition
We face competition within our market area both in making loans and attracting deposits. Our primary market area is central Connecticut and western Massachusetts which has a high concentration of financial institutions including large commercial banks, community banks, credit unions and mortgage companies. We recently opened two de novo branches in western Massachusetts and a loan production office in Branford, CT during the fourth quarter in 2015. We opened a loan production office in Fairfield, CT in February 2016 and anticipate opening two de novo branches in Connecticut in 2016. Some of our competitors offer products and services that we currently do not offer, such as trust services and private banking.
Based on the most recent data available from the Federal Deposit Insurance Corporation (“FDIC”) as of June 30, 2015, we possess a 5.32% deposit market share in Hartford County. Our market share rank is 5th out of 27 financial institutions.
Our competition for loans and deposits comes principally from commercial banks, savings institutions, mortgage banking firms and credit unions. We face additional competition for deposits from money market funds, brokerage firms, mutual funds and insurance companies. Our primary focus is to build and develop profitable customer relationships across all lines of business while continuing to support the communities within our service area.
Subsidiary Activities
Farmington Bank is currently the only subsidiary of FCB and is incorporated in Connecticut. Farmington Bank currently has the following subsidiaries all of which are incorporated in Connecticut: Farmington Savings Loan Servicing, Inc., Village Investments, Inc., Village Corp., Limited, 28 Main Street Corp., Village Management Corp. and Village Square Holdings, Inc.
Farmington Savings Loan Servicing, Inc.: Established in 1999, Farmington Savings Loan Servicing, Inc. operates as Farmington Bank’s “passive investment company” (“PIC”) which exempts it from Connecticut income tax under current law.
Village Investments, Inc.: Established in 1994, Village Investments, Inc. established to offer brokerage and investment advisory services through a contract with a registered broker-dealer. Village Investments Inc. is currently inactive.
Village Corp., Limited: Established in 1986, Village Corp., Limited was established to hold certain commercial real estate acquired through foreclosures, deeds in lieu of foreclosure, or other similar means. Village Corp. limited is currently inactive.
28 Main Street Corp.: Established in 1992, 28 Main Street Corp. was established to hold residential other real estate owned. 28 Main Street Corp. is currently inactive.
| 24 |
Village Management Corp: Established in 1992, Village Management Corp. was established to hold commercial other real estate owned. Village Management Corp. is currently inactive.
Village Square Holdings, Inc.: Established in 1992, held certain commercial real estate of Farmington Bank previously used as Farmington Bank’s operations center prior to our relocation to One Farm Glen Boulevard, Farmington, Connecticut. Village Square Holdings Inc. is currently inactive.
The activities of these subsidiaries have had an insignificant effect on our consolidated financial conditions and results of operations to date.
Employees
At December 31, 2015, we had 343 full-time equivalent employees, none of whom are represented by a collective bargaining unit. We believe our relationship with our employees is good.
Charitable Foundation
In connection with the Conversion and Reorganization in 2011, the Company established Farmington Bank Community Foundation, Inc., a non-profit charitable organization dedicated to helping the communities the Bank serves. The Foundation was funded with a contribution of 687,700 shares of the Company’s common stock, representing 4% of the outstanding shares sold in the offering.
Farmington Bank Community Foundation’s mission is to improve the economic viability and well-being of residents and the communities in which Farmington Bank operates. The Farmington Bank Community Foundation supports programs and organizations that impact the quality of life of the residents of the towns we serve. The Foundation’s areas of focus are Economic Empowerment, Community Investment and Health and Wellness. The Foundation’s emphasis is on programs and services that assist households most in need and make a lasting difference for the people and communities they serve.
SUPERVISION AND REGULATION
General
Farmington Bank, a Connecticut-chartered stock savings bank, is subject to extensive regulation by the Connecticut Department of Banking, as its chartering agency, and by the FDIC as its deposit insurer. Farmington Bank’s deposits are insured up to applicable limits by the FDIC through the Deposit Insurance Fund. Farmington Bank is required to file reports with, and is periodically examined by, the FDIC and the Connecticut Department of Banking concerning its activities and financial condition and must obtain regulatory approvals prior to entering into certain transactions, such as mergers with, or acquisitions of, other financial institutions and opening or closing branch offices. FCB, as a bank holding company is subject to regulation by and required to file reports with the Connecticut Department of Banking, the Federal Reserve Board and the Securities and Exchange Commission.
The following discussion of other laws and regulations material to our operations contains a summary of the current material provisions of such laws and regulations applicable to our operations. Any change in such regulations, whether by the Connecticut Department of Banking, the FDIC, the Federal Reserve Board or the Securities and Exchange Commission, could have a material adverse impact on us.
Dodd-Frank Wall Street Reform and Consumer Protection Act
On July 21, 2010, the President of the United States signed the Dodd-Frank Wall Street Reform and Consumer Protection Act (the “Dodd-Frank Act”). This law significantly changed the bank regulatory structure and affects the lending, deposit, investment, trading and operating activities of financial institutions and their holding companies. The Dodd-Frank Act requires various federal agencies to adopt a broad range of new rules and regulations, and to prepare numerous studies and reports for Congress. The federal agencies were given significant discretion in drafting the rules and regulations, and consequently, many of the details and much of the impacts of the Dodd-Frank Act may not be known for many months or years.
| 25 |
The Dodd-Frank Act created a new Consumer Financial Protection Bureau (“CFPB”) with broad powers to supervise and enforce consumer protection laws. The CFPB has broad rule-making authority for a wide range of consumer protection laws that apply to all banks and savings institutions, including the authority to prohibit “unfair, deceptive or abusive” acts and practices. The CFPB has examination and enforcement authority over all banks with more than $10 billion in assets. Farmington Bank, as a bank with $10 billion or less in assets, will continue to be examined for compliance with the consumer laws by our primary bank regulators. The Dodd-Frank Act also weakened the federal preemption rules that have been applicable for national banks and federal savings associations, and gives state attorney generals the ability to enforce federal consumer protection laws.
The Dodd-Frank Act establishes numerous restrictions and requirements that mortgage lenders must follow or satisfy before making a residential mortgage loan, including the verification of a mortgage loan applicant’s ability to repay a mortgage loan. The Dodd-Frank Act’s mortgage reform provisions also allow borrowers to assert violations of certain provisions of the Truth-in-Lending Act as a defense to foreclosure proceedings.
The Dodd-Frank Act requires minimum leverage (Tier 1) and risk based capital levels for bank and savings and loan holding companies that are no less than those applicable to banks, which will exclude certain instruments that previously have been eligible for inclusion by bank holding companies as Tier 1 capital, such as trust preferred securities.
A provision of the Dodd-Frank Act eliminated the federal prohibitions on paying interest on demand deposits, thus allowing businesses to have interest-bearing checking accounts. Depending on competitive responses, this significant change to existing law could have an adverse impact on our interest expense. The Dodd-Frank Act also broadened the base for FDIC deposit insurance assessments. Assessments are based on the average consolidated total assets less tangible equity capital of a financial institution, rather than deposits. The Dodd-Frank Act also permanently increased the maximum amount of deposit insurance for banks, savings institutions and credit unions to $250,000 per depositor. The legislation also increased the required minimum reserve ratio for the Deposit Insurance Fund, from 1.15% to 1.35% of insured deposits, and directed the FDIC to offset the effects of increased assessments on depository institutions with less than $10 billion in assets. The FDIC has issued regulations to implement these provisions of the Dodd-Frank Act. It has, in addition, established a higher reserve ratio of 2% as a long-term goal beyond what is required by statute. There is no implementation deadline for the 2% ratio.
Under the Dodd-Frank Act we are required to give shareholders a non-binding vote on executive compensation and so-called “golden parachute” payments. The Dodd-Frank Act also authorized the Securities and Exchange Commission to promulgate rules that would allow certain stockholders to nominate candidates for election to the FCB board of directors using our proxy materials. The legislation also directed the Federal Reserve Board to promulgate rules prohibiting excessive compensation paid to bank and bank holding company executives, regardless of whether the company is publicly traded or not.
The full scope and impact of the Dodd-Frank Act's provisions will continue to be determined over time as additional regulations are issued and examination practices are aligned with the new rules. We cannot predict the ultimate impact of the Dodd-Frank Act on First Connecticut Bancorp or Farmington Bank at this time, although it has increased our compliance and operating costs and may otherwise adversely affect our business, financial condition and/or results of operations. Nor can we predict the impact or substance of other future legislation or regulation.
Connecticut and FDIC Banking Laws and Supervision
Connecticut Banking Commissioner: The Connecticut Banking Commissioner regulates internal organization as well as the deposit, lending and investment activities of state chartered banks, including Farmington Bank. The approval of the Connecticut Banking Commissioner is required for, among other things, the establishment of branch offices and business combination transactions. The Commissioner conducts periodic examinations of Connecticut-chartered banks, as does the FDIC. The FDIC also regulates many of the areas regulated by the Connecticut Banking Commissioner, and federal law may limit some of the authority provided to Connecticut-chartered banks by Connecticut law.
Lending Activities: Connecticut banking laws grant banks broad lending authority. With certain limited exceptions, secured and unsecured loans of any one obligor under this statutory authority may not exceed 10.0% and 15.0%, respectively, of a bank’s equity capital and allowance for loan losses.
| 26 |
Dividends: Farmington Bank may pay cash dividends out of its net profits. Further, the total amount of all dividends declared by a bank in any year may not exceed the sum of a bank’s net profits for the year in question combined with its retained net profits from the preceding two years. Federal law also prevents an institution from paying dividends or making other capital distributions that, if by doing so, would cause it to become “undercapitalized.” The FDIC may limit a bank’s ability to pay dividends. No dividends may be paid to Farmington Bank’s sole stockholder, First Connecticut Bancorp, if such dividends would reduce stockholders’ equity below the amount of the liquidation account required by Connecticut regulations.
Powers: Connecticut law permits Connecticut banks to sell insurance and fixed and variable rate annuities if licensed to do so by the Connecticut Insurance Commissioner. With the prior approval of the Connecticut Banking Commissioner, Connecticut banks are also authorized to engage in a broad range of activities related to the business of banking, or that are financial in nature or that are permitted under the Bank Holding Company Act or the Home Owners’ Loan Act, both federal statutes, or the regulations promulgated as a result of these statutes. Connecticut banks are also authorized to engage in any activity permitted for a national bank or a federal savings association upon filing notice with the Connecticut Banking Commissioner unless the Banking Commissioner disapproves the activity.
Assessments: Connecticut banks are required to pay annual assessments to the Connecticut Banking Department to fund the Department’s operations. The general assessments are paid pro-rata based upon a bank’s asset size.
Enforcement: Under Connecticut law, the Connecticut Banking Commissioner has extensive enforcement authority over Connecticut banks and, under certain circumstances, affiliated parties, insiders, and agents. The Connecticut Banking Commissioner’s enforcement authority includes cease and desist orders, fines, receivership, conservatorship, removal of officers and directors, emergency closures, dissolution and liquidation.
Holding Company Regulation
General: As a bank holding company, FCB is subject to comprehensive regulation and regular examinations by the Federal Reserve Board. The Federal Reserve Board also has extensive enforcement authority over bank holding companies, including, among other things, the ability to assess civil money penalties, to issue cease and desist or removal orders and to require that a holding company divest subsidiaries (including its bank subsidiaries). In general, enforcement actions may be initiated for violations of law and regulations and unsafe or unsound practices.
Federal Reserve Board policy historically has required a bank holding company to serve as a source of strength for its subsidiary bank. The Dodd-Frank Act codified this policy as a statutory requirement. Pursuant to this requirement, the Federal Reserve Board may require, and has required in the past, a holding company to contribute additional capital to an undercapitalized subsidiary bank. As a bank holding company, FCB is required to obtain Federal Reserve Board approval before: (i) acquiring, directly or indirectly, ownership or control of any voting shares of another bank or bank holding company if, after such acquisition, it would own or control more than 5.0% of such shares (unless it already owns or controls the majority of such shares); (ii) acquiring all or substantially all of the assets of another bank or bank holding company; or (iii) merging or consolidating with another bank holding company. Under Connecticut banking law, no person may acquire beneficial ownership of more than 10.0% of any class of voting securities of a Connecticut-chartered bank, or any bank holding company of such a bank, without prior notification of, and lack of disapproval by, the Connecticut Banking Commissioner.
The Bank Holding Company Act also prohibits a bank holding company, with certain exceptions, from acquiring direct or indirect ownership or control of more than 5.0% of the voting shares of any company which is not a bank or bank holding company, or from engaging directly or indirectly in activities other than those of banking, managing or controlling banks, or providing services for its subsidiaries. The principal exceptions to these prohibitions involve certain non-bank activities which, by statute or by Federal Reserve Board regulation or order, have been identified as activities closely related to the business of banking or managing or controlling banks. The list of activities permitted by the Federal Reserve Board includes, among other things: (i) operating a savings institution, mortgage company, finance company, credit card company or factoring company; (ii) performing certain data processing operations; (iii) providing certain investment and financial advice; (iv) underwriting and acting as an insurance agent for certain types of credit-related insurance; (v) leasing property on a full-payout, non-operating basis; (vi) selling money orders, travelers’ checks and United States savings bonds; (vii) real estate and personal property appraising; (viii) providing tax planning and preparation services; (ix) financing and investing in certain community development activities; and (x) subject to certain limitations, providing securities brokerage services for customers.
As a public company with securities registered under the Securities Exchange Act of 1934, First Connecticut Bancorp also is subject to that statute and to the Sarbanes-Oxley Act.
| 27 |
Dividends: The Federal Reserve Board has issued a policy statement on the payment of cash dividends by bank holding companies, which expresses the Federal Reserve Board’s view that a bank holding company should pay cash dividends only to the extent that the holding company’s net income for the past year is sufficient to cover both the cash dividends and a rate of earnings retention that is consistent with the holding company’s capital needs, asset quality and overall financial condition. The Federal Reserve Board also indicated that it would be inappropriate for a company experiencing serious financial problems to borrow funds to pay dividends. Furthermore, under the prompt corrective action regulations adopted by the Federal Reserve Board, the Federal Reserve Board may prohibit a bank holding company from paying any dividends if the holding company’s bank subsidiary is classified as “undercapitalized.”
Pursuant to Connecticut banking regulations, no dividend may be paid to stockholders if such dividends would reduce our stockholders’ equity below the amount of the liquidation account established in connection with the conversion of the company from mutual to stock form. Farmington Bank may pay cash dividends only out of its net profits. For purposes of this restriction, “net profits” represents the remainder of all earnings from current operations. Further, the total amount of all dividends declared by Farmington Bank to FCB in any year may not, without express permission of the Connecticut Banking Commissioner, exceed the sum of Farmington Bank’s retained net profits for the past two fiscal years and its net profits of the year in which the dividend is paid. In addition, FCB is subject to Maryland law limitations. Maryland law generally limits dividends to an amount equal to the excess of our capital surplus over payments that would be owed upon dissolution to stockholders whose preferential rights upon dissolution are superior to those receiving the dividend, and to an amount that would not make us insolvent.
Redemption: Bank holding companies are required to give the Federal Reserve Board prior written notice of any purchase or redemption of its outstanding equity securities if the gross consideration for the purchase or redemption, when combined with the net consideration paid for all such purchases or redemptions during the preceding 12 months, is equal to 10.0% or more of the consolidated net worth of the bank holding company. The Federal Reserve Board may disapprove such a purchase or redemption if it determines that the proposal would constitute an unsafe or unsound practice or would violate any law, regulation, Federal Reserve Board order or any condition imposed by, or written agreement with, the Federal Reserve Board. This notification requirement does not apply to any company that meets the well capitalized standard for commercial banks, is “well managed” within the meaning of the Federal Reserve Board regulations and is not subject to any unresolved supervisory issues. However, in February 2009, the Federal Reserve Board issued SR 09-4 which, among other things, requires all bank holding companies to consult with the Federal Reserve board prior to redeeming stock without regard to the bank holding company’s capital status or regulations otherwise permitting redemptions without prior approval of the Federal Reserve Board.
Federal Regulations
Capital Requirements: Under FDIC regulations, federally insured state-chartered banks that are not members of the Federal Reserve System (“state non-member banks”), such as Farmington Bank, are required to comply with minimum leverage capital requirements. For an institution determined by the FDIC to not be anticipating or experiencing significant growth and to be, in general, a strong banking organization, rated composite 1 under the Uniform Financial Institutions Ranking System established by the Federal Financial Institutions Examination Council, the minimum capital leverage requirement is a ratio of Tier I capital to total assets of 3.0%. For all other institutions, the minimum leverage capital ratio is 4.0%. Tier I capital is the sum of common stockholders’ equity, non-cumulative perpetual preferred stock (including any related surplus) and minority investments in certain subsidiaries, less intangible assets (except for certain servicing assets and purchased credit card relationships) and certain other specified items.
The FDIC regulations require state non-member banks to maintain certain levels of regulatory capital in relation to regulatory risk-weighted assets. The ratio of regulatory capital to regulatory risk-weighted assets is referred to as a bank’s “risk-based capital ratio.” Risk-based capital ratios are determined by allocating assets and specified off-balance sheet items (including recourse obligations, direct credit substitutes and residual interests) to four risk-weighted categories ranging from 0.0% to 100.0%, with higher levels of capital being required for the categories perceived as representing greater risk. For example, under the FDIC’s risk-weighting system, cash and securities backed by the full faith and credit of the U.S. government are given a 0.0% risk weight, loans secured by one-to-four family residential properties generally have a 50.0% risk weight, and commercial loans have a risk weighting of 100.0%.
State non-member banks such as Farmington Bank must maintain a minimum ratio of total capital to risk-weighted assets of 8.0%, of which at least half must be Tier I capital. Total capital consists of Tier I capital plus Tier 2 or supplementary capital items, which include allowances for loan losses in an amount of up to 1.25% of risk-weighted assets, cumulative preferred stock and certain other capital instruments, and a portion of the net unrealized gain on equity securities. The includable amount of Tier 2 capital cannot exceed the amount of the institution’s Tier I capital. Banks that engage in specified levels of trading activities are subject to adjustments in their risk based capital calculation to ensure the maintenance of sufficient capital to support market risk.
| 28 |
The Federal Deposit Insurance Corporation Improvement Act required each federal banking agency to revise its risk-based capital standards for insured institutions to ensure that those standards take adequate account of interest-rate risk, concentration of credit risk, and the risk of nontraditional activities, as well as to reflect the actual performance and expected risk of loss on multi-family residential loans. The FDIC, along with the other federal banking agencies, has adopted a regulation providing that the agencies will take into account the exposure of a bank’s capital and economic value to changes in interest rate risk in assessing a bank’s capital adequacy. The FDIC also has authority to establish individual minimum capital requirements in appropriate cases upon determination that an institution’s capital level is, or is likely to become, inadequate in light of the particular circumstances.
In July 2013, the Federal Reserve Board promulgated a final rule and the FDIC promulgated an interim final rule implementing Basel III, providing for a strengthened set of capital requirements. These new requirements became effective on January 1, 2015 for us. In general, the new rules revise regulatory capital definitions and minimum ratios, redefine Tier I capital, create a new capital ratio (common equity Tier I risk-based capital ratio), require a capital conservation buffer, revise prompt corrective action thresholds to add a new ratio to these thresholds (discussed in more detail below) and revise risk weighting for certain asset categories and off-balance sheet exposures. Under the new regulations, (1) a new requirement to maintain a ratio of common equity Tier I capital to total risk-based assets of not less than 4.5% will be implemented, (2) the minimum Leverage Capital Ratio for all financial institutions will be at least 4%, (3) the minimum Tier I Risk-Based Capital Ratio increases from 4% to 6% and (4) the Total Risk-Based Capital Ratio maintains at 8%. In addition, the new regulations impose certain limitations on dividends, share buybacks, discretionary payments on Tier I instruments and discretionary bonuses to executive officers if the organization fails to maintain a capital conservation buffer of common equity Tier I capital in an amount greater than 2.5% of its total risk-weighted assets. The end result of the capital conservation buffer will be to increase the minimum common equity Tier I capital ratio to 7%, the minimum Tier I Risk-Based Capital Ratio to 8.5% and the minimum Total Risk-Based Capital Ratio to 10.5% for financial institutions seeking to avoid limitations on capital distributions and discretionary bonus payments to executive officers. The new regulations will be phased in over a period of time. The capital conservation buffer will be phased-in over a five year period with the full 2.5% requirement starting as of January 1, 2019.
Additionally, under the new regulations, the method for calculating the ratios has been revised to generally enhance risk sensitivity as well as provide alternatives to credit ratings for calculating risk-weighted assets. As of December 31, 2015, we currently comply with the BASEL III requirements on a fully phased-in basis.
As a bank holding company, FCB is subject to capital adequacy guidelines for bank holding companies similar to those of the FDIC for state-chartered banks.
Prompt Corrective Regulatory Action: Federal law requires, among other things, that federal bank regulatory authorities take “prompt corrective action” with respect to banks that do not meet minimum capital requirements. For these purposes, the law establishes five capital categories: well capitalized, adequately capitalized, undercapitalized, significantly undercapitalized, and critically undercapitalized.
The FDIC has adopted regulations to implement the prompt corrective action legislation. An institution is deemed to be “well capitalized” if it has a total risk-based capital ratio of 10.0% or greater, a Tier I risk-based capital ratio of 6.0% or greater and a leverage ratio of 5.0% or greater. An institution is “adequately capitalized” if it has a total risk-based capital ratio of 8.0% or greater, a Tier I risk-based capital ratio of 4.0% or greater, and generally a leverage ratio of 4.0% or greater. An institution is “undercapitalized” if it has a total risk-based capital ratio of less than 8.0%, a Tier I risk-based capital ratio of less than 4.0%, or generally a leverage ratio of less than 4.0%. An institution is deemed to be “significantly undercapitalized” if it has a total risk-based capital ratio of less than 6.0%, a Tier I risk-based capital ratio of less than 3.0%, or a leverage ratio of less than 3.0%. An institution is considered to be “critically undercapitalized” if it has a ratio of tangible equity (as defined in the regulations) to total assets that is equal to or less than 2.0%. As of December 31, 2015, Farmington Bank was a well-capitalized institution.
| 29 |
“Undercapitalized” banks must adhere to growth, capital distribution (including dividend) and other limitations and are required to submit a capital restoration plan. A bank’s compliance with such a plan is required to be guaranteed by any company that controls the undercapitalized institution in an amount equal to the lesser of 5.0% of the institution’s total assets when deemed undercapitalized or the amount necessary to achieve the status of adequately capitalized. If an “undercapitalized” bank fails to submit an acceptable plan, it is treated as if it is “significantly undercapitalized.” “Significantly undercapitalized” banks must comply with one or more of a number of additional restrictions, including but not limited to an order by the FDIC to sell sufficient voting stock to become adequately capitalized, requirements to reduce total assets, cease receipt of deposits from correspondent banks or dismiss directors or officers, and restrictions on interest rates paid on deposits, compensation of executive officers and capital distributions by the parent holding company. “Critically undercapitalized” institutions are subject to additional measures including, subject to a narrow exception, the appointment of a receiver or conservator within 270 days after it obtains such status.
Safety and Soundness Standards: The Federal Deposit Insurance Act (“FDIA”) requires the federal bank regulatory agencies to establish standards, by regulations or guidelines, designed to ensure the safety and soundness of insured financial institutions. The FDIA requires financial institutions to establish, among other things, internal controls, information systems and internal audit systems, risk management policies and procedures, credit underwriting standards, and other operational and managerial standards designed to meet the FDIA’s requirements. The federal banking agencies may, but are not required, to order an institution that is not meeting applicable safety and soundness standards to submit a plan to bring the institution into compliance with such standards. If an institution fails to submit an acceptable compliance plan or fails to implement its compliance plan, the agency must issue an order directing action to correct the deficiency.
Transactions with Affiliates: Under current federal law, transactions between depository institutions and their affiliates are governed by Sections 23A and 23B of the Federal Reserve Act (the “FRA”). In a holding company context, at a minimum, the parent holding company of a savings bank and any companies which are controlled by such parent holding company are affiliates of the savings bank. Generally, Section 23A limits the extent to which the savings bank or its subsidiaries may engage in “covered transactions” with any one affiliate to 10.0% of such savings bank’s capital stock and surplus, and contains an aggregate limit on all such transactions with all affiliates to 20.0% of capital stock and surplus. The term “covered transaction” includes, among other things, the making of loans or other extensions of credit to an affiliate and the purchase of assets from an affiliate. Section 23A also establishes specific collateral requirements for loans or extensions of credit to, or guarantees, acceptances on letters of credit issued on behalf of an affiliate. Section 23B requires that covered transactions and a broad list of other specified transactions be on terms substantially the same, or no less favorable, to the savings bank or its subsidiary as similar transactions with non-affiliates.
Loans to Insiders: Further, Section 22(h) of the FRA restricts an institution with respect to loans to directors, executive officers, and principal stockholders (“insiders”). Under Section 22(h), loans to insiders and their related interests may not exceed, together with all other outstanding loans to such persons and affiliated entities, the institution’s unimpaired capital and unimpaired surplus. Loans to insiders above specified amounts must receive the prior approval of the board of directors. Further, under Section 22(h), loans to directors, executive officers and principal stockholders must be made on terms substantially the same as offered in comparable transactions to other persons, except that such insiders may receive preferential loans made under a benefit or compensation program that is widely available to the bank’s employees and does not give preference to the insider over the employees. Section 22(g) of the FRA places additional limitations on loans to executive officers.
Enforcement: The FDIC has extensive enforcement authority over insured savings banks, including Farmington Bank. This enforcement authority includes, among other things, the ability to assess civil money penalties, issue cease and desist orders and remove directors and officers. In general, these enforcement actions may be initiated in response to violations of laws and regulations and unsafe or unsound practices.
The FDIC has authority under Federal law to appoint a conservator or receiver for an insured bank under limited circumstances. The FDIC is required, with certain exceptions, to appoint a receiver or conservator for an insured state non-member bank if that bank was “critically undercapitalized” on average during the calendar quarter beginning 270 days after the date on which the institution became “critically undercapitalized.” The FDIC may also appoint itself as conservator or receiver for an insured state non-member institution under specific circumstances on the basis of the institution’s financial condition or upon the occurrence of other events, including: (1) insolvency; (2) substantial dissipation of assets or earnings through violations of law or unsafe or unsound practices; (3) existence of an unsafe or unsound condition to transact business; and (4) insufficient capital, or the incurring of losses that will deplete substantially all of the institution’s capital with no reasonable prospect of replenishment without federal assistance.
| 30 |
Insurance of Deposit Accounts: The FDIC has adopted a risk-based insurance assessment system. The FDIC assigns an institution to one of three capital categories based on the institution’s financial condition consisting of (1) well capitalized, (2) adequately capitalized or (3) undercapitalized, and one of three supervisory subcategories within each capital group. The supervisory subgroup to which an institution is assigned is based on a supervisory evaluation provided to the FDIC by the institution’s primary federal regulator and information which the FDIC determines to be relevant to the institution’s financial condition and the risk posed to the Deposit Insurance Fund. An institution’s assessment rate depends on the capital category and supervisory category to which it is assigned. Effective April 1, 2011, the FDIC revised its assessment schedule so that it ranges from 2.5 basis points for the least risky institutions to 45 basis points for the riskiest. The rule changed the assessment base used for calculating deposit insurance assessments from deposits to average consolidated total assets less average tangible equity capital. Since the new base is larger than the previous base, the FDIC also lowered assessment rates so that the rule would not significantly alter the total amount of revenue collected from the industry. FDIC members are also required to assist in the repayment of bonds issued by the Financing Corporation (FICO) in the late 1980’s to recapitalize the Federal Savings and Loan Insurance Corporation.
The FDIC provides insurance up to $250,000 per depositor for each account ownership category. Additionally, the FDIC approved a plan for rebuilding the Deposit Insurance Fund after several bank failures in 2008. The FDIC plan aims to rebuild the Deposit Insurance Fund within five years; the first assessment increase was a uniform seven basis points effective January 2009. For the years ended December 31, 2015, 2014, and 2013, the Bank’s total FDIC assessments were $1.7 million, $1.4 million and $1.3 million, respectively.
The Dodd-Frank Act increased the minimum target Deposit Insurance Fund ratio from 1.15% of estimated insured deposits to 1.35% of estimated insured deposits. The FDIC must seek to achieve the 1.35% ratio by September 30, 2020. In setting the assessments necessary to achieve the 1.35% ratio, the FDIC is supposed to offset the effect of the increased ratio on insured institutions with assets of less than $10 billion. The Dodd-Frank Act eliminated the 1.5% maximum fund ratio, instead leaving it to the discretion of the FDIC. The FDIC has recently exercised that discretion by establishing a long range fund ratio of 2%.
The FDIC may terminate insurance of deposits if it finds that the institution is in an unsafe or unsound condition to continue operations, has engaged in unsafe or unsound practices, or has violated any applicable law, regulation, rule, order or condition imposed by the FDIC. We do not know of any practice, condition or violations that might lead to termination of deposit insurance.
Federal Reserve System: The Federal Reserve Board regulations require depository institutions to maintain non-interest-earning reserves against their transaction accounts (primarily NOW and regular checking accounts). The Federal Reserve Board regulations generally require that reserves be maintained against aggregate transaction accounts. We are in compliance with these requirements.
Federal Home Loan Bank System: Farmington Bank is a member of the FHLBB, which is one of the regional Federal Home Loan Banks composing the Federal Home Loan Bank System. Each Federal Home Loan Bank serves as a central credit facility primarily for its member institutions. Farmington Bank, as a member of the FHLBB, is required to acquire and hold shares of capital stock in the FHLBB. While the required percentages of stock ownership are subject to change by the FHLBB, we were in compliance with this requirement with an investment in FHLBB stock of $21.7 million and $19.8 million at December 31, 2015 and 2014, respectively. The FHLBB paid dividends totaling $522,000 and $208,000 for the years ended December 31, 2015 and 2014, respectively. There can be no assurance that the impact of recent or future legislation on the Federal Home Loan Banks also will not cause a decrease in the value of the FHLBB stock held by us.
Financial Modernization: The Gramm-Leach-Bliley Act permits greater affiliation among banks, securities firms, insurance companies, and other companies under a new type of financial services company known as a “financial holding company.” A financial holding company essentially is a bank holding company with significantly expanded powers. Financial holding companies are authorized by statute to engage in a number of financial activities previously impermissible for bank holding companies, including securities underwriting, dealing and market making; sponsoring mutual funds and investment companies; insurance underwriting and agency; and merchant banking activities. The act also permits the Federal Reserve Board and the Treasury Department to authorize additional activities for financial holding companies if they are “financial in nature” or “incidental” to financial activities. A bank holding company may become a financial holding company if each of its subsidiary banks is well capitalized, well managed, and has at least a “satisfactory” Community Reinvestment Act rating. A financial holding company must provide notice to the Federal Reserve Board within 30 days after commencing activities previously determined by statute or by the Federal Reserve Board and Department of the Treasury to be permissible. We are not currently a financial holding company and are not precluded from submitting a notice in the future should we wish to engage in activities only permitted to financial holding companies.
| 31 |
Miscellaneous Regulation
Sarbanes-Oxley Act of 2002: Following our public offering in June 2011, we are subject to the Sarbanes-Oxley Act of 2002 (the “Sarbanes-Oxley Act”), which implements a broad range of corporate governance and accounting measures for public companies designed to promote honesty and transparency in corporate America and better protect investors from corporate wrongdoing. In general, the Sarbanes-Oxley Act mandated important new corporate governance and financial reporting requirements intended to enhance the accuracy and transparency of public companies’ reported financial results. It established new responsibilities for corporate chief executive officers, chief financial officers and audit committees in the financial reporting process, and it created a new regulatory body to oversee auditors of public companies. It backed these requirements with new Securities and Exchange Commission enforcement tools, increased criminal penalties for federal mail, wire and securities fraud, and created new criminal penalties for document and record destruction in connection with federal investigations. It also increased the opportunity for more private litigation by lengthening the statute of limitations for securities fraud claims and providing new federal corporate whistleblower protection.
Section 402 of the Sarbanes-Oxley Act prohibits the extension of personal loans to directors and executive officers of issuers (as defined in the Sarbanes-Oxley Act). The prohibition, however, does not apply to loans advanced by an insured depository institution, such as those that are subject to the insider lending restrictions of Section 22(h) of the Federal Reserve Act.
The Sarbanes-Oxley Act also required that the various securities exchanges, including The Nasdaq Global Select Market, prohibit the listing of the stock of an issuer unless that issuer complies with various requirements relating to their committees and the independence of their directors that serve on those committees.
Community Reinvestment Act: Under the Community Reinvestment Act (“CRA”), as implemented by FDIC regulations, a bank has a continuing and affirmative obligation, consistent with its safe and sound operation, to help meet the credit needs of its entire community, including low and moderate income neighborhoods. The CRA does not establish specific lending requirements or programs for financial institutions nor does it limit an institution’s discretion to develop the types of products and services that it believes are best suited to its particular community. The CRA does require the FDIC, in connection with its examination of a bank, to assess the institution’s record of meeting the credit needs of its community and to take such record into account in its evaluation of certain applications by such institution, including applications to acquire branches and other financial institutions. The CRA requires the FDIC to provide a written evaluation of an institution’s CRA performance utilizing a four-tiered descriptive rating system. Farmington Bank’s latest FDIC CRA rating was “satisfactory.”
Connecticut has its own statutory counterpart to the CRA which is also applicable to Farmington Bank. The Connecticut version is generally similar to the CRA but utilizes a five-tiered descriptive rating system. Connecticut law requires the Connecticut Banking Commissioner to consider, but not be limited to, a bank’s record of performance under Connecticut law in considering any application by the bank to establish a branch or other deposit-taking facility, to relocate an office or to merge or consolidate with or acquire the assets and assume the liabilities of any other banking institution. Farmington Bank’s most recent rating under Connecticut law was “satisfactory.”
Consumer Protection and Fair Lending Regulations: We are subject to a variety of federal and Connecticut statutes and regulations that are intended to protect consumers and prohibit discrimination in the granting of credit. These statutes and regulations provide for a range of sanctions for non-compliance with their terms, including imposition of administrative fines and remedial orders, and referral to the Attorney General for prosecution of a civil action for actual and punitive damages and injunctive relief. Certain of these statutes authorize private individual and class action lawsuits and the award of actual, statutory and punitive damages and attorneys’ fees for certain types of violations.
The USA PATRIOT Act: On October 26, 2001, the USA PATRIOT Act (the “PATRIOT Act”) was enacted. The PATRIOT Act gives the federal government new powers to address terrorist threats through enhanced domestic security measures, expanded surveillance powers, increased information sharing and broadened anti-money laundering requirements. The PATRIOT Act also requires the federal banking regulators to take into consideration the effectiveness of controls designed to combat money-laundering activities in determining whether to approve a merger or other acquisition application of an FDIC-insured institution. As such, if FCB or Farmington Bank were to engage in a merger or other acquisition, the effectiveness of its anti-money-laundering controls would be considered as part of the application process. We have established policies, procedures and systems to comply with the applicable requirements of the law. The PATRIOT Act was reauthorized and modified with the enactment of the USA PATRIOT Improvement and Reauthorization Act of 2005.
| 32 |
Privacy Laws and Regulations: The federal Gramm-Leach-Bliley Act generally prohibits financial institutions, including Farmington Bank, from disclosing nonpublic personal financial information pertaining to consumer customers to third parties for certain purposes unless such customers have the opportunity to “opt out” of such disclosure and have not exercised this right. Connecticut law contains provisions that generally restrict the disclosure of customer financial records to third parties. The federal Fair Credit Reporting Act restricts information sharing among affiliates for marketing purposes.
Federal Securities Laws: The common stock of FCB is registered with the Securities and Exchange Commission under the Securities Exchange Act of 1934 and is subject to the information, proxy solicitation, insider trading restrictions and other requirements under the Securities Exchange Act of 1934.
Federal and State Taxation
Federal Taxation
General: We are subject to federal income taxation in the same general manner as other corporations, with some exceptions discussed below. The following discussion of federal taxation is intended only to summarize certain pertinent federal income tax matters and is not a comprehensive description of the tax rules applicable to us.
Method of Accounting: For Federal income tax purposes, we report income and expenses on the accrual method of accounting and use tax year ending December 31 for filing federal income tax returns.
Bad Debt Reserves: Prior to the Small Business Protection Act of 1996 (the “1996 Act”), Farmington Bank was permitted to establish a reserve for bad debts and to make annual additions to the reserve. These additions could, within specified formula limits, be deducted in arriving at our taxable income. As a result of the 1996 Act, Farmington Bank was required to use the specific charge-off method in computing its bad debt deduction beginning with its 1996 federal tax return. Savings institutions were required to recapture any excess reserves over those established as of December 31, 1987 (base year reserve). At December 31, 2015, Farmington Bank had no reserves subject to recapture in excess of its base year.
Taxable Distributions and Recapture: Prior to the 1996 Act, bad debt reserves created before January 1, 1988 were subject to recapture into taxable income if Farmington Bank failed to meet certain thrift asset and definitional tests. Federal legislation has eliminated these thrift-related recapture rules. At December 31, 2015, our total federal pre-1988 base year reserve was $3.4 million. However, under current law, pre-1988 base year reserves remain subject to recapture if Farmington Bank makes certain non-dividend distributions, repurchases any of its stock, pays dividends in excess of tax earnings and profits, or ceases to maintain a bank charter.
Alternative Minimum Tax: The Internal Revenue Code of 1986, as amended (the “Code”), imposes an alternative minimum tax (“AMT”) at a rate of 20.0% on a base of regular taxable income plus certain tax preferences which we refer to as “alternative minimum taxable income.” The AMT is payable to the extent such alternative minimum taxable income is in excess of an exemption amount and the AMT exceeds the regular income tax. Net operating losses can offset no more than 90.0% of alternative minimum taxable income. Certain AMT payments may be used as credits against regular tax liabilities in future years. We have not been subject to the AMT and have no such amounts available as credits for carryover.
Net Operating Loss Carryovers: A corporation may carry back net operating losses to the preceding two taxable years and forward to the succeeding 20 taxable years. At December 31, 2015, we had no net operating loss carryforwards for federal income tax purposes.
Charitable Contribution Carryforward: As part of the Plan of Conversion and Reorganization completed on June 29, 2011, the Company contributed shares of Company common stock to the Farmington Bank Community Foundation, Inc. This contribution resulted in a charitable contribution deduction for federal income tax purposes. Use of that charitable contribution deduction is limited under Federal tax law to 10% of federal taxable income without regard to charitable contributions, net operating losses, and dividend received deductions. Annually, a corporation is permitted to carry over to the five succeeding tax years, contributions that exceeded the 10% limitation, but also subject to the maximum annual limitation. As a result, approximately $4.3 million of charitable contribution carryforward remains at December 31, 2015 resulting in a deferred tax asset of approximately $1.5 million. The Company believes it is more likely than not that this carryforward will not be fully utilized before expiration in 2016. Therefore, a $771,000 valuation allowance has been recorded against this deferred tax asset. Some of this charitable contribution carryforward would likely expire unutilized if the Company does not generate sufficient taxable income over the next year. The Company monitors the need for a valuation allowance on a quarterly basis.
| 33 |
Corporate Dividends-Received Deduction: FCB may exclude from its income 100.0% of dividends received from Farmington Bank as a member of the same affiliated group of corporations. The corporate dividends received deduction is 80.0% in the case of dividends received from corporations with which a corporate recipient does not file a consolidated tax return, and corporations which own less than 20.0% of the stock of a corporation distributing a dividend may deduct only 70.0% of dividends received or accrued on their behalf.
State Taxation
Connecticut
We are subject to the Connecticut corporation business tax. The Connecticut corporation business tax is based on the federal taxable income before net operating loss and special deductions and makes certain modifications to federal taxable income to arrive at Connecticut taxable income. Connecticut taxable income is multiplied by the state tax rate (7.5% for the fiscal years ending December 31, 2015 and 2014) (plus an additional 20% surtax applies for tax years 2015 and 2014) to arrive at Connecticut income tax.
In 1998, the State of Connecticut enacted legislation permitting the formation of passive investment companies by financial institutions. This legislation exempts qualifying passive investment companies from the Connecticut corporation business tax and excludes dividends paid from a passive investment company from the taxable income of the parent financial institution. Farmington Bank established a passive investment company in 1999 and substantially eliminated the state income tax expense of Farmington Bank since the passive investment company’s organization through December 31, 2015.
We believe we are in compliance with the state passive investment company requirements and that no state taxes relating from Farmington Bank are due for the years ended December 31, 2013 through December 31, 2015; however, we have not been audited by the Department of Revenue Services for such periods. If the state were to determine that the passive investment company was not in compliance with statutory requirements, a material amount of taxes could be due. The State of Connecticut continues to be under pressure to find new sources of revenue, and therefore could enact legislation to eliminate the passive investment company exemption. If such legislation were enacted, we would be subject to additional state income taxes in Connecticut.
Farmington Bank and FCB are not currently under audit with respect to their state tax returns, and their state tax returns have not been audited for the past five years.
Massachusetts
We are subject to the Massachusetts income excise tax. The Massachusetts income excise tax is based on the federal taxable income before net operating loss and special deductions and makes certain modifications to federal taxable income to arrive at Massachusetts taxable income. Massachusetts apportioned taxable income is multiplied by the state tax rate (9.0% for the fiscal years ending December 31, 2015 and 2014).
Maryland
As a Maryland business corporation, First Connecticut Bancorp, Inc. is required to file an annual income tax return with the State of Maryland.
New York
We are subject to the New York corporate franchise tax. The New York corporate franchise tax is based on the federal taxable income before net operating loss and special deductions and makes certain modifications to federal taxable income to arrive at New York taxable income. New York apportioned taxable income is multiplied by the state tax rate (7.1% for the fiscal year ending December 31, 2015).
| 34 |
Item 1A. Risk Factors
A substantial portion of our loan portfolio consists of commercial real estate loans and commercial loans, which expose us to increased risks and could adversely impact our earnings.
Our executive management team has brought an increased focus to transitioning Farmington Bank’s balance sheet to be more like a commercial bank. At December 31, 2015 and 2014, our commercial loan portfolio totaled $1.3 billion and $1.1 billion, or 56.3% and 53.0%, respectively, of our total loan portfolio. These types of loans generally expose a lender to greater risk of non-payment and loss than one-to four-family residential mortgage loans because repayment of the loans often depends on the successful operation of the property and business of the borrowers and the collateral securing these loans may not be sold as easily as residential real estate. In addition, commercial real estate and commercial loans typically involve larger loan balances to single borrowers or groups of related borrowers compared to one-to four-family residential mortgage loans. Also, many of our commercial real estate and commercial loan borrowers have more than one loan outstanding with us. Consequently, an adverse development with respect to one loan or one credit relationship can expose us to a significantly greater risk of loss compared to an adverse development with respect to a one-to four-family residential mortgage loan.
Due to the slow economic recovery, the real estate market and local economy has not returned to pre-recession conditions. While the value of our real estate collateral securing loans has not been substantially impacted, further deterioration in the real estate market or a prolonged economic recovery could adversely affect the value of the properties securing the loans or revenues from borrowers’ businesses, thereby increasing the risk of non-performing loans. A continued deterioration in the economy and slow economic recovery may also have a negative effect on the ability of our commercial borrowers to make timely repayments of their loans, which could have an adverse impact on our earnings.
All of these factors could have a material adverse effect on our financial condition and results of operations.
Our loan portfolio possesses increased risk due to its rapid expansion and unseasoned nature.
From December 31, 2011 to December 31, 2015, our total loan portfolio increased by $1.0 billion or 80.0%. As a result of this rapid expansion, a significant portion of our portfolio is unseasoned. Our limited experience with these loans does not provide us with a significant payment history pattern with which to judge future collectability. As a result, it may be difficult to predict the future performance of this part of our loan portfolio. These loans may have delinquency or charge-off levels above our expectations, which could adversely affect our future performance.
Our lack of geographic diversification increases our risk profile.
Our operations are located principally in central Connecticut and western Massachusetts. As a result of this geographic concentration, our results depend largely upon economic and business conditions in these areas. Deterioration in economic and business conditions in our service areas could have a material adverse impact on the quality of our loan portfolio and the demand for our products and services, which in turn may have a material adverse effect on our results of operations. During the fourth quarter of 2015, we opened two de novo branches in western Massachusetts and a loan production office in Branford, CT. No assurance can be given as to when, if ever, our expansion into western Massachusetts will become profitable.
If our allowance for loan losses is not sufficient to cover actual loan losses, our earnings could decrease.
We make various assumptions and judgments about the collectability of our loan portfolio, including the creditworthiness of our borrowers and the value of the real estate and other assets serving as collateral for the repayment of many of our loans. Recent declines in real estate values have impacted the collateral values that secure our real estate loans. The impact of these declines on the original appraised values of secured collateral is difficult to estimate. In determining the amount of the allowance for loan losses, we review our loss and delinquency experience on different loan categories, and we evaluate existing economic conditions. If our assumptions are incorrect, our allowance for loan losses may not be sufficient to cover losses inherent in our loan portfolio, resulting in additions to our allowance, which would decrease our net income. Our loan loss allowance for the years ended December 31, 2015 and 2014 was $20.2 million and $19.0 million, respectively. Although we are currently unaware of any specific problems with our loan portfolio that would require any increase in our allowance at the present time, it may need to be increased further in the future due to our emphasis on loan growth and on increasing our portfolio of commercial business and commercial real estate loans.
| 35 |
In addition, banking regulators periodically review our allowance for loan losses and may require us to increase our provision for loan losses or recognize further loan charge-offs. Any increase in the allowance for loan losses or loan charge-offs as required by these regulatory authorities may have a material adverse effect on our results of operations and financial condition.
Future changes in interest rates may reduce our profits which could have a negative impact on the value of our stock.
Our ability to make a profit largely depends on our net interest income, which could be negatively affected by changes in interest rates. Net interest income is the difference between the interest income Farmington Bank earns on its interest-earning assets, such as loans and securities, and the interest expense Farmington Bank pays on its interest-bearing liabilities, such as deposits and borrowings. Increases in interest rates may decrease loan demand and make it more difficult for borrowers to repay adjustable rate loans. In addition, as market interest rates rise, we will have competitive pressures to increase the rates paid on deposits, which may result in a decrease in our net interest income.
In addition, changes in interest rates can affect the average life of loans and mortgage-backed and related securities. A reduction in interest rates results in increased prepayments of loans and mortgage-backed and related securities, as borrowers refinance their debt in order to reduce their borrowing costs. This creates reinvestment risk, which is the risk that we may not be able to reinvest prepayments at rates that are comparable to the rates earned on the prepaid loans or securities.
We opened new branches in 2015 and 2014, which may result in losses at those branches as they generate new deposit and loan portfolios, and negatively impact our earnings.
We opened new branch offices in West Springfield, MA and East Longmeadow, MA in the fourth quarter of 2015 and opened a branch office in Rocky Hill, CT in 2014. In addition, we opened a loan production office in Branford, CT during the fourth quarter in 2015. We opened a loan production office in Fairfield, CT in February 2016 and anticipate opening two new branch offices in Connecticut during 2016. Losses are expected in connection with these new branches for some time, as the expenses and costs of acquisition associated with them are largely fixed and are typically greater than the income earned at the outset as the branches build up their customer bases. No assurance can be given as to when, if ever, new branches will become profitable.
Strong competition within Farmington Bank’s market area may limit our growth and profitability.
Competition in the banking and financial services industry is intense. In addition, we recently expanded into western Massachusetts opening two de novo branches in the fourth quarter of 2015. In our market area, we compete with commercial banks, savings institutions, mortgage firms, credit unions, finance companies, mutual funds, insurance companies, and brokerage and investment banking firms operating locally and elsewhere. Many of these competitors have substantially greater resources and lending limits than we have and offer certain services that we do not or cannot provide. Our profitability depends upon our continued ability to compete successfully in our market area. The greater resources and deposit and loan products offered by our competitors may limit our ability to increase our interest-earning assets.
If our government banking deposits were lost within a short period of time, this could negatively impact our liquidity and earnings.
Our government banking group provides deposit services to municipalities throughout Connecticut. Our municipal deposits as of December 31, 2015 and 2014 were $368.0 million, or 18.5%, and $300.3 million, or 17.3%, of our total deposits outstanding, respectively. If a significant amount of these deposits were withdrawn within a short period of time, it could have a negative impact on our short term liquidity and have an adverse impact on our earnings.
The loss of our Chief Executive Officer could adversely impact our business.
Our future success and profitability are substantially dependent upon the vision, management and banking abilities of our Chief Executive Officer, who has substantial background and significant experience in banking and financial services, as well as personal contacts in central Connecticut and the region generally. The loss of our Chief Executive Officer may be disruptive to our business and could have a material adverse effect on our business, financial condition and results of operations.
| 36 |
The local and national economies remain uncertain. An economic downturn will adversely affect our business and financial results.
During the past year, general economic conditions continued to improve nationally as well as in our market area but there remains an economic uncertainty. Worsening of unemployment and housing conditions may adversely affect our business by materially decreasing our net interest income or materially increasing our loan losses. There can be no assurance that we will not be affected by the current economic conditions in a way we cannot currently predict or mitigate.
Passage of the Dodd-Frank Wall Street Reform and Consumer Protection Act has increased our operational and compliance costs.
On July 21, 2010, the President of the United States signed the Dodd-Frank Wall Street Reform and Consumer Protection Act (the “Dodd-Frank Act”). This law significantly changed the current bank regulatory structure and affected the lending, deposit, investment, trading and operating activities of financial institutions and their holding companies. The Dodd-Frank Act requires various federal agencies to adopt a broad range of new rules and regulations, and to prepare numerous studies and reports for Congress. The federal agencies were given significant discretion in drafting the rules and regulations, and consequently, many of the details and much of the impact of the Dodd-Frank Act may not be known for many months or years. Among other things, the Dodd-Frank Act created a new Consumer Financial Protection Bureau with broad powers to supervise and enforce consumer protection laws, weakens the federal preemption rules that have been applicable for national banks and federal savings associations, imposes certain capital requirements on financial institutions, eliminated the federal prohibitions on paying interest on demand deposits, broadened the base for FDIC deposit insurance assessments, required publicly traded companies to provide non-binding votes on executive compensation and so-called “golden parachute” payments, and directed the Federal Reserve Board to promulgate rules prohibiting excessive compensation paid to bank holding company executives. As a result, our revenue may be reduced due to fee income limitations and we may be required to maintain higher minimum capital ratios. It is difficult to predict at this time what specific impact the Dodd-Frank Act and the yet to be written implementing rules and regulations will have on community banks. However, at a minimum they have increased our operating and compliance costs and could increase our interest expense.
Higher Federal Deposit Insurance Corporation insurance premiums and special assessments will adversely affect our earnings.
We are generally unable to control the amount of premiums and special assessments that we are required to pay for FDIC insurance. If there are additional bank or financial institution failures we may be required to pay even higher FDIC premiums than the recently increased levels. Such increases and any future increases or required prepayments of FDIC insurance premiums may adversely impact our earnings.
We operate in a highly regulated environment and our business may be adversely affected by changes in laws and regulations.
We are subject to extensive regulation, supervision and examination by the Connecticut Banking Commissioner, as Farmington Bank’s chartering authority, by the FDIC, as insurer of deposits, and by the Federal Reserve Board, as the regulator of FCB. Such regulation and supervision govern the activities in which a financial institution and its holding company may engage and are intended primarily for the protection of the insurance fund and depositors. Regulatory authorities have extensive discretion in connection with their supervisory and enforcement activities, including the imposition of restrictions on the operation of an institution, the classification of assets by the institution and the adequacy of an institution’s allowance for loan losses. Any change in such regulation and oversight, whether in the form of regulatory policy, regulations, or legislation, may have a material impact on our operations.
We face various technological risks that could adversely affect our business.
We rely on communication and information systems to conduct business. Potential failures, interruptions or breaches in system security could result in disruptions or failures in our key systems, such as general ledger, deposit or loan systems. The risk of electronic fraudulent activity within the financial services industry, especially in the commercial banking sector due to cyber criminals targeting bank accounts and other customer information is on the rise. We have developed policies and procedures aimed at preventing and limiting the effect of failure, interruption or security breaches, including cyber attacks of information systems; however, there can be no assurance that these incidences will not occur, or if they do occur, that they will be appropriately addressed. The occurrence of any failures, interruptions or security breaches, including cyber attacks of our information systems could damage our reputation, result in the loss of business, subject us to increased regulatory scrutiny or subject us to civil litigation and possible financial liability, any of which could have an adverse effect on our results of operation and financial condition.
| 37 |
Third parties with whom we do business or that facilitate our business activities, including exchanges, clearing houses, financial intermediaries or vendors that provide services or security solutions for our operations, could also be sources of operational and information security risk to us, including from breakdowns or failures of their own systems or capacity constraints.
Although to date we have not experienced any material losses relating to cyber attacks or other information security breaches, there can be no assurance that we will not suffer such losses in the future. Our risk and exposure to these matters remains heightened and as a result the continued development and enhancement of our controls, processes and practices designed to protect our systems, computers, software, data and networks from attack, damage or unauthorized access remain a priority for us. As an additional layer of protection, we have purchased cyber and privacy liability insurance coverage which includes risks such as; privacy liability, unauthorized fund transfer liability, business interruption liability, social media liability and regulatory action liability. Additionally, we have purchased first party coverage for digital asset loss, network security, network extortion and data breach expenses (e.g. investigation, remediation, notification, etc.). As cyber threats continue to evolve, we may be required to expend significant additional resources to modify our protective measures or to investigate and remediate any information security vulnerabilities.
Item 1B. Unresolved Staff Comments
Not applicable
| 38 |
Item 2. Properties
We operate through our 23 full service branch offices, four limited services offices, three stand-alone ATM facilities and one loan production office. Various leases have renewal options up to an additional 30 years.
Our full service branch offices, limited service offices and loan production office are located as follows:
| Branch | Address | Owned or Leased | ||
| Avon West | 427 West Avon Road, Avon, CT 06001 | Lease (Expires 2019) | ||
| Avon 44 | 310 West Main Street, Avon, CT 06001 | Own | ||
| Berlin | 1191 Farmington Avenue, Berlin, CT 06037 | Lease (Expires 2020) | ||
| Bristol | 475 Broad Street, Bristol, CT 06010 | Own | ||
| Burlington | 253 Spielman Highway, Burlington, CT 06013 | Own | ||
| Main Street | 32 Main Street, Farmington, CT 06032 | Own | ||
| Gables (1) (3) | 20 Devonwood Drive, Farmington, CT 06032 | n/a | ||
| Village Gate (1) (3) | 88 Scott Swamp Road, Farmington, CT 06032 | n/a | ||
| Westwoods | 282 Scott Swamp Road, Farmington, CT 06032 | Own | ||
| Farm Glen (1)(2) | One Farm Glen Boulevard, Farmington, CT 06032 | Lease (Expires 2019) | ||
| Glastonbury | 669 Hebron Avenue, Glastonbury, CT 06033 | Own | ||
| New Britain | 73 Broad Street, New Britain, CT 06053 | Own | ||
| Plainville - Route 10 | 117 East Street, Plainville, CT 06062 | Lease (Expires 2020) | ||
| Plainville 372 | 129 New Britain Avenue, Plainville, CT 06062 | Lease (Expires 2025) | ||
| Southington | One Center Street, Southington, CT 06489 | Lease (Expires 2020) | ||
| Southington Drive-Thru (1) | 17 Center Place, Southington, CT 06489 | Lease (Expires 2019) | ||
| Unionville | 1845 Farmington Avenue, Unionville, CT 06085 | Own | ||
| West Hartford | 962 Farmington Avenue, West Hartford, CT 06110 | Lease (Expires 2019) | ||
| Elmwood | 176 Newington Road, West Hartford, CT 06110 | Lease (Expires 2026) | ||
| Wethersfield | 486 Silas Deane Highway, Wethersfield, CT 06129 | Own | ||
| Bloomfield | 782 Park Avenue, Bloomfield, CT 06002 | Lease (Expires 2022) | ||
| South Windsor | 350 Buckland Road, South Windsor, CT 06074 | Lease (Expires 2032) | ||
| Newington | 1095 Main Street, Newington, CT 06111 | Lease (Expires 2033) | ||
| East Hartford | 957 Main Street, East Hartford, CT 06108 | Lease (Expires 2033) | ||
| Rocky Hill | 366 Cromwell Avenue, Rocky Hill, CT 06067 | Lease (Expires 2033) | ||
| West Springfield | 85 Elm Street, West Springfield, MA 01089 | Lease (Expires 2022) | ||
| East Longmeadow | 61 North Main Street, East Longmeadow, MA 01028 | Lease (Expires 2035) | ||
| Branford (4) | 28 School Street, Branford, CT 06405 | Lease (month to month) | ||
(1) Limited Service Office
(2) Executive Office
(3) Bank provided space at no cost
(4) Loan production office
| 39 |
Item 3. Legal Proceedings
In the ordinary course of business, the Company and its subsidiary are routinely defendants in or parties to pending and threatened legal actions and proceedings. After reviewing pending and threatened actions with legal counsel, the Company believes that the outcome of such actions will not have a material adverse effect on the consolidated financial statements.
Item 4. Mine Safety Disclosures
None
PART II
Item 5. Market for Registrant’s Common Equity, Related Stockholder Matters and Issuer Purchases of Equity Securities
(A)
The shares of common stock of First Connecticut Bancorp, Inc. are quoted on the NASDAQ Global Select Market (“NASDAQ”) under the symbol “FBNK.” As of December 31, 2015, First Connecticut Bancorp had 1,837 stockholders of record (excluding the number of persons or entities holding stock in street name through various brokerage firms), and 15,881,663 shares outstanding.
Market Price and Dividends. The following table sets forth market price and dividend information for the common stock for the past two fiscal years.
| Quarter Ended | High | Low | Cash Dividend Declared | |||||||||
| December 31, 2015 | $ | 18.40 | $ | 15.26 | $ | 0.06 | ||||||
| September 30, 2015 | 17.28 | 15.25 | 0.06 | |||||||||
| June 30, 2015 | 16.24 | 14.54 | 0.05 | |||||||||
| March 31, 2015 | 16.44 | 14.43 | 0.05 | |||||||||
| December 31, 2014 | 16.75 | 14.23 | 0.05 | |||||||||
| September 30, 2014 | 16.60 | 14.47 | 0.05 | |||||||||
| June 30, 2014 | 16.49 | 14.64 | 0.04 | |||||||||
| March 31, 2014 | 16.50 | 15.09 | 0.03 | |||||||||
Payment of dividends on First Connecticut Bancorp’s common stock is subject to determination and declaration by the Board of Directors and depends on a number of factors, including capital requirements, legal, and regulatory limitations on the payment of dividends, the results of operations and financial condition, tax considerations and general economic conditions. No assurance can be given that dividends will be declared or, if declared, what the amount of dividends will be, or whether such dividends will continue. See Item 1 “Supervision and Regulations” for information relating to restrictions on dividends. Repurchases of the Company’s shares of common stock during the fourth quarter of the year ended December 31, 2015 are detailed in (C) below. There were no sales of unregistered securities during the quarter ended December 31, 2015.
Set forth below is a stock performance graph comparing the annual total return on our shares of common stock, commencing with the closing price on June 30, 2011, the date the Company went public, with (a) the cumulative total return on stocks included in the Russell 2000 Index, (b) the cumulative total return on stocks included in the SNL New England U.S. Bank Index and (c) the cumulative total return on stocks included in the SNL U.S. Thrift Index. Cumulative return assumes the reinvestment of dividends, and is expressed in dollars based on an assumed investment of $100.
There can be no assurance that our stock performance in the future will continue with the same or similar trend depicted in the graph below. We will not make or endorse any predictions as to future stock performance.
| 40 |
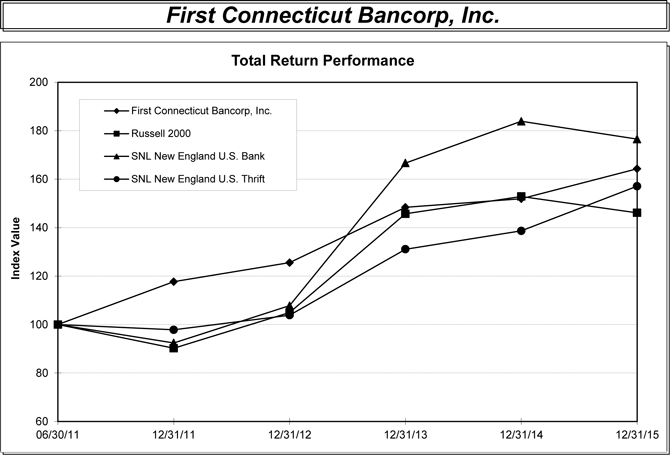
| Period Ending | ||||||||||||||||||||||||
| Index | 06/30/11 | 12/31/11 | 12/31/12 | 12/31/13 | 12/31/14 | 12/31/15 | ||||||||||||||||||
| First Connecticut Bancorp, Inc. | 100.00 | 117.70 | 125.54 | 148.38 | 151.89 | 164.27 | ||||||||||||||||||
| Russell 2000 | 100.00 | 90.23 | 104.98 | 145.73 | 152.86 | 146.12 | ||||||||||||||||||
| SNL New England U.S. Bank | 100.00 | 92.43 | 107.80 | 166.68 | 183.91 | 176.54 | ||||||||||||||||||
| SNL New England U.S. Thrift | 100.00 | 97.83 | 103.88 | 131.08 | 138.67 | 157.11 | ||||||||||||||||||
(B)
Not Applicable
(C)
During the quarter ending December 31, 2015, the Company made the following repurchases of its common stock:
| Period | (a) Total Number of Shares (or Units) Purchased | (b) Average Price Paid per Share (or Unit) | (c) Total Number of Shares (or Units) Purchased as Part of Publicly Announced Plans or Programs | (d) Maximum Number (or Approximate Dollar Value) of Shares (or Units) that May Yet Be Purchased Under the Plans or Programs | ||||||||||||
| October 1-31, 2015 | 15,000 | $ | 15.80 | 918,707 | 757,745 | |||||||||||
| November 1-30, 2015 | - | - | 918,707 | 757,745 | ||||||||||||
| December 1-31, 2015 | - | - | 918,707 | 757,745 | ||||||||||||
| 41 |
On July 21, 2013, the Company received regulatory approval to repurchase up to 1,676,452 shares, or 10% of its current outstanding common stock. Shares repurchased under that approval are shown above. Repurchased shares will be held as treasury stock and will be available for general corporate purposes.
Item 6. Selected Financial Data
The following financial condition data and operating data are derived from the audited consolidated financial statements of First Connecticut Bancorp, Inc. Additional information is provided in “Management’s Discussion and Analysis of Financial Condition and Results of Operations” and the Consolidated Financial Statements and related notes included as Item 7 and Item 8 of this report, respectively.
| At December 31, | ||||||||||||||||||||
| 2015 | 2014 | 2013 | 2012 | 2011 | ||||||||||||||||
| Selected Financial Condition Data: | (Dollars in thousands) | |||||||||||||||||||
| Total assets | $ | 2,708,546 | $ | 2,485,360 | $ | 2,110,028 | $ | 1,823,153 | $ | 1,618,129 | ||||||||||
| Cash and cash equivalents | 59,139 | 42,863 | 38,799 | 50,641 | 90,296 | |||||||||||||||
| Held to maturity securities | 32,246 | 16,224 | 12,983 | 3,006 | 3,216 | |||||||||||||||
| Available for sale securities | 132,424 | 188,041 | 150,886 | 138,241 | 135,003 | |||||||||||||||
| Federal Home Loan Bank of Boston stock | 21,729 | 19,785 | 13,136 | 8,939 | 7,449 | |||||||||||||||
| Loans receivable, net | 2,341,598 | 2,119,917 | 1,800,987 | 1,520,170 | 1,295,177 | |||||||||||||||
| Deposits | 1,991,358 | 1,733,041 | 1,513,501 | 1,330,455 | 1,176,682 | |||||||||||||||
| Federal Home Loan Bank advances | 377,600 | 401,700 | 259,000 | 128,000 | 63,000 | |||||||||||||||
| Total stockholders' equity | 245,721 | 234,563 | 232,209 | 241,795 | 252,499 | |||||||||||||||
| Allowance for loan losses | 20,198 | 18,960 | 18,314 | 17,229 | 17,533 | |||||||||||||||
| Non-accrual loans | 14,913 | 15,468 | 14,800 | 13,782 | 15,501 | |||||||||||||||
| At December 31, | ||||||||||||||||||||
| 2015 | 2014 | 2013 | 2012 | 2011 | ||||||||||||||||
| Selected Operating Data: | (Dollars in thousands) | |||||||||||||||||||
| Interest income | $ | 81,884 | $ | 72,774 | $ | 62,886 | $ | 62,860 | $ | 59,025 | ||||||||||
| Interest expense | 13,375 | 10,080 | 9,733 | 9,628 | 10,826 | |||||||||||||||
| Net Interest Income | 68,509 | 62,694 | 53,153 | 53,232 | 48,199 | |||||||||||||||
| Provision for loan losses | 2,440 | 2,588 | 1,530 | 1,380 | 4,090 | |||||||||||||||
| Net interest income after provision for loan losses | 66,069 | 60,106 | 51,623 | 51,852 | 44,109 | |||||||||||||||
| Noninterest income | 13,447 | 9,104 | 11,012 | 9,261 | 5,525 | |||||||||||||||
| Noninterest expense, excluding contribution to charitable foundation (**) | 61,210 | 57,048 | 57,762 | 56,106 | 49,573 | |||||||||||||||
| Contribution to charitable foundation (**) | - | - | - | - | 6,877 | |||||||||||||||
| Total noninterest expense | 61,210 | 57,048 | 57,762 | 56,106 | 56,450 | |||||||||||||||
| Income (loss) before income taxes | 18,306 | 12,162 | 4,873 | 5,007 | (6,816 | ) | ||||||||||||||
| Income tax expense (benefit) | 5,727 | 2,827 | 1,169 | 1,300 | (2,577 | ) | ||||||||||||||
| Net income (loss) | 12,579 | 9,335 | 3,704 | 3,707 | (4,239 | ) | ||||||||||||||
| (**) | In connection with the Conversion and Reorganization on June 29, 2011, the Company established Farmington Bank Community Foundation, Inc., a non-profit charitable organization, which was funded with a contribution of 687,000 shares of the Company's common stock. |
| 42 |
| At or For the Years Ended December 31, | ||||||||||||||||||||
| 2015 | 2014 | 2013 | 2012 | 2011 | ||||||||||||||||
| Selected Financial Ratios and Other Data: | ||||||||||||||||||||
| Performance Ratios: | (Dollars in thousands, except per share amounts) | |||||||||||||||||||
| Return on average assets | 0.48 | % | 0.41 | % | 0.19 | % | 0.22 | % | (0.27 | )% | ||||||||||
| Return on average equity | 5.20 | % | 3.98 | % | 1.57 | % | 1.49 | % | (2.35 | )% | ||||||||||
| Interest rate spread (1) | 2.66 | % | 2.80 | % | 2.80 | % | 3.16 | % | 3.05 | % | ||||||||||
| Net interest margin (2) | 2.81 | % | 2.94 | % | 2.97 | % | 3.35 | % | 3.23 | % | ||||||||||
| Non-interest expense to average assets | 2.34 | % | 2.51 | % | 3.04 | % | 3.29 | % | 3.58 | % | ||||||||||
| Efficiency Ratio (3) | 74.69 | % | 79.46 | % | 90.02 | % | 89.78 | % | 105.07 | % | ||||||||||
| Efficiency ratio, excluding foundation contribution | 74.69 | % | 79.46 | % | 90.02 | % | 89.78 | % | 92.27 | % | ||||||||||
| Average interest-earning assets to average interest-bearing liabilities | 126.94 | % | 127.56 | % | 131.34 | % | 132.07 | % | 125.24 | % | ||||||||||
| Asset Quality Ratios: | ||||||||||||||||||||
| Allowance for loan losses as a percent of total loans | 0.86 | % | 0.89 | % | 1.01 | % | 1.12 | % | 1.34 | % | ||||||||||
| Allowance for loan losses as a percent of non-performing loans | 135.44 | % | 122.58 | % | 123.74 | % | 125.01 | % | 113.11 | % | ||||||||||
| Net charge-offs to average loans | 0.05 | % | 0.10 | % | 0.03 | % | 0.12 | % | 0.61 | % | ||||||||||
| Non-performing loans as a percent of total loans | 0.63 | % | 0.72 | % | 0.81 | % | 0.90 | % | 1.18 | % | ||||||||||
| Non-performing loans as a percent of total assets | 0.55 | % | 0.62 | % | 0.70 | % | 0.76 | % | 0.96 | % | ||||||||||
| Per Share Related Data: | ||||||||||||||||||||
| Basic earnings per share (4) | $ | 0.84 | $ | 0.62 | $ | 0.24 | $ | 0.22 | $ | (0.29 | ) | |||||||||
| Diluted earnings per share (4) | $ | 0.83 | $ | 0.62 | $ | 0.24 | $ | 0.22 | $ | (0.29 | ) | |||||||||
| Dividends per share (5) | $ | 0.22 | $ | 0.17 | $ | 0.12 | $ | 0.12 | $ | 0.03 | ||||||||||
| Dividend payout ratio | 26.19 | % | 27.42 | % | 50.00 | % | 54.55 | % | (10.34 | )% | ||||||||||
| Capital Ratios: | ||||||||||||||||||||
| Equity to total assets at end of period | 9.07 | % | 9.44 | % | 11.01 | % | 13.26 | % | 15.60 | % | ||||||||||
| Average equity to average assets | 9.24 | % | 10.32 | % | 12.41 | % | 14.55 | % | 11.45 | % | ||||||||||
| Total Capital (to Risk Weighted Assets) | 12.88 | % | 13.73 | % | 15.50 | % | 18.80 | % | 22.41 | % | ||||||||||
| Tier I Capital (to Risk Weighted Assets) | 11.91 | % | 12.70 | % | 14.36 | % | 17.55 | % | 21.16 | % | ||||||||||
| Common Equity Tier I Capital (to Risk Weighted Assets) | 11.91 | % | n/a | n/a | n/a | n/a | ||||||||||||||
| Tier I Leverage Capital (to Average Assets) | 9.39 | % | 9.86 | % | 11.47 | % | 13.89 | % | 15.55 | % | ||||||||||
| Total capital to total average assets | 9.38 | % | 10.33 | % | 12.22 | % | 14.18 | % | 16.01 | % | ||||||||||
| Other Data: | ||||||||||||||||||||
| Number of full service offices | 23 | 22 | 21 | 19 | 17 | |||||||||||||||
| Number of limited service offices | 4 | 4 | 4 | 4 | 4 | |||||||||||||||
| (1) | Represents the difference between the weighted-average yield on average interest-earning assets and the weighted-average cost of the interest-bearing liabilities. |
| (2) | Represents net interest income as a percent of average interest-earning assets |
| (3) | Represents non-interest expense divided by the sum of net interest income and non-interest income |
| (4) | Net loss per share for the year ended December 31, 2011 reflects earnings for the period from June 29, 2011, the date the Company completed a Plan of Conversion and Reorganization to December 31, 2011. |
| (5) | Represents dividends per share divided by basic earnings per share. |
| 43 |
ITEM 7. Management’s Discussion and Analysis of Financial Condition and Results of Operations
Overview
In 2015, despite the challenging operating environment, we were able to accomplish another year of double digit organic loan and deposit growth. During the year, we repositioned and strengthened our balance sheet as we continue to manage through one of the lowest interest rate environments in history. The current interest rate climate, combined with increased regulatory and compliance costs related to the regulations implementing the provisions of the Dodd-Frank Wall Street Reform and Consumer Protection Act, has resulted in compressed net interest margins and earnings pressures. To counter these external factors, we continue to focus on efficiencies and process improvement which are embedded within our Company’s culture to become a high performing company. During the fourth quarter of 2015, we successfully opened branch offices in West Springfield, MA and East Longmeadow, MA as we expand into the western Massachusetts market. We also opened a loan production office in Branford, CT. Financial highlights for First Connecticut Bancorp for the year ended December 31, 2015 are as follows:
| · | Strong Regulatory Capital Ratios: Our total Risk Based Capital ratio at December 31, 2015 is 12.88%. The minimum ratio to remain Well Capitalized is 10.00%. Our Common Equity Tier I Capital is 11.91 at December 31, 2015. The minimum ratio to remain Well Capitalized is 6.50%. Our total Leverage Ratio or Tier I Capital to Average Assets Ratio at December 31, 2015 is 9.39%. The minimum ratio to remain Well Capitalized is 5.00%. |
| · | Strong Asset Growth: Total assets increased $223.2 million or 9.0% to $2.7 billion at December 31, 2015. |
| · | Strong Loan Growth: Total loans increased $222.9 million or 10.4% to $2.4 billion at December 31, 2015. |
| · | Commercial loan portfolio experienced very strong loan growth increasing $195.7 million or 17.3% to $1.3 billion at December 31, 2015. |
| · | Overall deposits increased $258.3 million or 14.9% to $2.0 billion at December 31, 2015. |
| · | Checking accounts grew by 12.8% or 5,786 net new accounts for the year ended December 31, 2015. |
| · | Noninterest expense to average assets was 2.34% for the year ended December 31, 2015 compared to 2.51% in the prior year. |
| · | Asset quality improved as loan delinquencies 30 days and greater decreased to 0.63% of total loans at December 31, 2015 compared to 0.75% at December 31, 2014. Non-accrual loans represented 0.63% of total loans compared to 0.72% of total loans at December 31, 2014. |
| · | The allowance for loan losses represented 0.86% of total loans at December 31, 2015 compared to 0.89% at December 31, 2014. |
| · | The Company paid a cash dividend of $0.22 per share for the year, an increase of $0.05 compared to the prior year. |
Business Strategy
Our business strategy is to operate as a well-capitalized and profitable community bank for businesses, individuals and local governments, with an ongoing commitment to provide quality customer service.
| · | Maintaining a strong capital position in excess of the well-capitalized standards set by our banking regulators to support our current operations and future growth. The FDIC’s requirement for a “well-capitalized” bank is a total risk-based capital ratio of 10.0% or greater. As of December 31, 2015 our total risk-based capital ratio was 12.88%. |
| · | Increasing our focus on commercial lending and continuing to expand commercial banking operations. We will continue to focus on commercial lending and the origination of commercial loans using prudent lending standards. We plan to continue to grow our commercial lending portfolio, while enhancing our complementary business products and services. |
| · | Continuing to focus on residential and consumer lending in conjunction with our secondary market residential lending program. We offer traditional residential and consumer lending products and plan to continue to build a strong residential and consumer lending program that supports our secondary market residential lending program. Under our expanding secondary market residential lending program, we may sell a portion of our fixed rate residential originations while retaining the loan servicing function and mitigating our interest rate risk. |
| 44 |
| · | Maintaining asset quality and prudent lending standards. We will continue to originate all loans utilizing prudent lending standards in an effort to maintain strong asset quality. While our delinquencies and charge-offs have decreased, we continue to diligently manage our collection function to minimize loan losses and non-performing assets. We will continue to employ sound risk management practices as we continue to expand our lending portfolio. |
| · | Expanding our existing products and services and developing new products and services to meet the changing needs of consumers and businesses in our market area. We will continue to evaluate our consumer and business customers’ needs to ensure that we continue to offer relevant, up-to-date products and services. |
| · | Continue expansion through de novo branching. We recently expanded into western Massachusetts opening two de novo branches in the fourth quarter of 2015 and plan to open two de novo branches in Connecticut in 2016. |
| · | Continuing to control non-interest expenses. As part of our strategic plan, we have implemented several programs designed to control costs. We monitor our expense ratios and plan to reduce our efficiency ratio by controlling expenses and increasing net interest income and noninterest income. We plan to continue to evaluate and improve the effectiveness of our business processes and our efficiency, utilizing information technology when possible. |
| · | Taking advantage of acquisition opportunities that are consistent with our strategic growth plans. We intend to continue to evaluate opportunities to acquire other financial institutions and financial service related businesses in our current market area or contiguous market areas that will enable us to enhance our existing products and services and develop new products and services. We have no specific plans, agreements or understandings with respect to any expansion or acquisition opportunities. |
Critical Accounting Policies
The accounting policies followed by us conform with the accounting principles generally accepted in the United States of America. Critical accounting policies are defined as those that are reflective of significant judgments and uncertainties, and could potentially result in materially different results under different assumptions and conditions. We believe that our most critical accounting policies, which involve the most complex subjective decisions or assessments, relate to allowance for loan losses, other-than-temporary impairment of investment securities, income taxes and pension and other post-retirement benefits. The following is a description of our critical accounting policies and an explanation of the methods and assumptions underlying their application.
Allowance for Loan Losses: The allowance for loan losses is maintained at a level believed adequate by management to absorb potential losses inherent in the loan portfolio as of the statement of condition date. The allowance for loan losses consists of a formula allowance following FASB ASC 450 – “Contingencies” and FASB ASC 310 – “Receivables”. The allowance for loan losses is established as losses are estimated to have occurred through a provision for loan losses charged to earnings. Loan losses are charged against the allowance when management believes the uncollectibility of a loan balance is confirmed. Subsequent recoveries, if any, are credited to the allowance.
The allowance for loan losses is evaluated on a quarterly basis by management. This evaluation is inherently subjective as it requires estimates that are susceptible to significant revision as more information becomes available. The allowance consists of general, allocated and unallocated components, as further described below. All reserves are available to cover any losses regardless of how they are allocated.
| 45 |
General component:
The general component of the allowance for loan losses is based on historical loss experience adjusted for qualitative factors stratified by the following loan segments: residential real estate, commercial real estate, construction, installment, commercial, collateral, home equity line of credit, demand, revolving credit and resort. Construction loans include classes for commercial investment real estate construction, commercial owner occupied construction, residential development, residential subdivision construction and residential owner occupied construction loans. Management uses a rolling average of historical losses based on a time frame appropriate to capture relevant loss data for each loan segment. This historical loss factor is adjusted for the following qualitative factors: levels/trends in delinquencies and nonaccrual loans; trends in volume and terms of loans; effects of changes in risk selection and underwriting standards and other changes in lending policies, procedures and practices; experience/ability/depth of lending management and staff; and national and local economic trends and conditions. There were no material changes in the Company’s policies or methodology pertaining to the general component of the allowance for loan losses during the year ended December 31, 2015.
The qualitative factors are determined based on the various risk characteristics of each loan segment. Risk characteristics relevant to each portfolio segment are as follows:
Residential real estate – Residential real estate loans are generally originated in amounts up to 95.0% of the lesser of the appraised value or purchase price of the property, with private mortgage insurance required on loans with a loan-to-value ratio in excess of 80.0%. The Company does not grant subprime loans. All loans in this segment are collateralized by owner-occupied residential real estate and repayment is dependent on the credit quality of the individual borrower. All residential mortgage loans are underwritten pursuant to secondary market underwriting guidelines which include minimum FICO standards. The overall health of the economy, including unemployment rates and housing prices, will have an effect on the credit quality in this segment.
Commercial real estate – Loans in this segment are primarily income-producing properties throughout the northeastern states. The underlying cash flows generated by the properties may be adversely impacted by a downturn in the economy as evidenced by increased vacancy rates, which in turn, may have an effect on the credit quality in this segment. Management generally obtains rent rolls and other financial information, as appropriate on an annual basis and continually monitors the cash flows of these loans.
Construction loans – Loans in this segment include commercial construction loans, real estate subdivision development loans to developers, licensed contractors and builders for the construction and development of commercial real estate projects and residential properties. Construction lending contains a unique risk characteristic as loans are originated under market and economic conditions that may change between the time of origination and the completion and subsequent purchaser financing of the property. In addition, construction subdivision loans and commercial and residential construction loans to contractors and developers entail additional risks as compared to single-family residential mortgage lending to owner-occupants. These loans typically involve large loan balances concentrated in single borrowers or groups of related borrowers. Real estate subdivision development loans to developers, licensed contractors and builders are generally speculative real estate development loans for which payment is derived from sale of the property. Credit risk may be affected by cost overruns, time to sell at an adequate price, and market conditions. Construction financing is generally considered to involve a higher degree of credit risk than longer-term financing on improved, owner-occupied real estate. Residential construction credit quality may be impacted by the overall health of the economy, including unemployment rates and housing prices.
Commercial – Loans in this segment are made to businesses and are generally secured by assets of the business. Repayment is expected from the cash flows of the business. A weakened economy, and resultant decreased consumer spending, will have an effect on the credit quality in this segment.
Home equity line of credit – Loans in this segment include home equity loans and lines of credit underwritten with a loan-to-value ratio generally limited to no more than 80%, including any first mortgage. Our home equity lines of credit have ten-year terms and adjustable rates of interest which are indexed to the prime rate. The overall health of the economy, including unemployment rates and housing prices, may have an effect on the credit quality in this segment.
Installment, Collateral, Demand, Revolving Credit and Resort – Loans in these segments include loans principally to customers residing in our primary market area with acceptable credit ratings. Our installment and collateral consumer loans generally consist of loans on new and used automobiles, loans collateralized by deposit accounts and unsecured personal loans. The overall health of the economy, including unemployment rates and housing prices, may have an effect on the credit quality in this segment. Excluding collateral loans which are fully collateralized by a deposit account, repayment for loans in these segments is dependent on the credit quality of the individual borrower. The resort portfolio consists of a direct receivable loan outside the Northeast which is amortizing to its contractual obligations. The Company has exited the resort financing market with a residual portfolio remaining.
| 46 |
Allocated component:
The allocated component relates to loans that are classified as impaired. Impairment is measured on a loan by loan basis for commercial real estate, construction, commercial and resort loans by the present value of expected cash flows discounted at the effective interest rate; the fair value of the collateral, if applicable; or the observable market price for the loan. An allowance is established when the discounted cash flows (or collateral value) of the impaired loan is lower than the carrying value of that loan. The Company does not separately identify individual consumer and residential real estate loans for impairment disclosures, unless such loans are subject to a troubled debt restructuring agreement or they are nonaccrual loans with outstanding balances greater than $100,000.
A loan is considered impaired when, based on current information and events, it is probable that the Company will be unable to collect the scheduled payments of principal or interest when due according to the contractual terms of the loan agreement. Factors considered by management in determining impairment include payment status, collateral value, and the probability of collecting scheduled principal and interest payments when due. Loans that experience insignificant payment delays and payment shortfalls generally are not classified as impaired. Management determines the significance of payment delays and payment shortfalls on a case-by-case basis, taking into consideration all of the circumstances surrounding the loan and the borrower, including the length of the delay, the reasons for the delay, the borrower’s prior payment record, and the amount of the shortfall in relation to the principal and interest owed. Impairment is measured on a loan-by-loan basis for commercial and construction loans by the present value of expected future cash flows discounted at the loan’s effective interest rate, the loan’s obtainable market price or the fair value of the collateral if the loan is collateral dependent. Management updates the analysis quarterly. The assumptions used in appraisals are reviewed for appropriateness. Updated appraisals or valuations are obtained as needed or adjusted to reflect the estimated decline in the fair value based upon current market conditions for comparable properties.
The Company periodically may agree to modify the contractual terms of loans. When a loan is modified and a concession is made to a borrower experiencing financial difficulty, the modification is considered a troubled debt restructuring ("TDR"). All TDRs are classified as impaired.
Unallocated component:
An unallocated component is maintained, when needed, to cover uncertainties that could affect management’s estimate of probable losses. The unallocated component of the allowance reflects the margin of imprecision inherent in the underlying assumptions used in the methodologies for estimating allocated and general reserves in the portfolio. The Company’s Loan Policy allows management to utilize a high and low range of 0.0% to 5.0% of our total allowance for loan losses when establishing an unallocated allowance, when considered necessary. The unallocated allowance is used to provide for an unidentified loss that may exist in emerging problem loans that cannot be fully quantified or may be affected by conditions not fully understood as of the balance sheet date. There was no unallocated allowance at December 31, 2015 and 2014.
Other-than-Temporary Impairment of Securities: In accordance with Financial Accounting Standards Board (“FASB”) Accounting Standards Codification (“FASB ASC”) 320-Debt and Equity Securities, a decline in market value of a debt security below amortized cost that is deemed other-than-temporary is charged to earnings for the credit related other-than-temporary impairment (“OTTI”) resulting in the establishment of a new cost basis for the security, while the non-credit related OTTI is recognized in other comprehensive income if there is no intent or requirement to sell the security. Management reviews the securities portfolio on a quarterly basis for the presence of OTTI. An assessment is made as to whether the decline in value results from company-specific events, industry developments, general economic conditions, credit losses on debt or other reasons. After the reasons for the decline are identified, further judgments are required as to whether those conditions are likely to reverse and, if so, whether that reversal is likely to result in a recovery of the fair value of the investment in the near term. If it is judged not to be near-term, a charge is taken which results in a new cost basis. Credit related OTTI for debt securities is recognized in earnings while non-credit related OTTI is recognized in other comprehensive income if there is no intent to sell or will not be required to sell the security. If an equity security is deemed other-than-temporarily impaired, the full impairment is considered to be credit-related and a charge to earnings would be recorded. Management believes the policy for evaluating securities for other-than-temporary impairment is critical because it involves significant judgments by management and could have a material impact on our net income.
| 47 |
Gains and losses on sales of securities are recognized at the time of sale on a specific identification basis. Marketable equity and debt securities are classified as either trading, available-for-sale, or held-to-maturity (applies only to debt securities). Management determines the appropriate classifications of securities at the time of purchase. At December 31, 2015 and 2014, we had no debt or equity securities classified as trading. Held-to-maturity securities are debt securities for which we have the ability and intent to hold until maturity. All other securities not included in held-to-maturity are classified as available-for-sale. Held-to-maturity securities are recorded at amortized cost, adjusted for the amortization or accretion of premiums or discounts. Available-for-sale securities are recorded at fair value. Unrealized gains and losses, net of the related tax effect, on available-for-sale securities are excluded from earnings and are reported in accumulated other comprehensive income, a separate component of equity, until realized.
Premiums and discounts on debt securities are amortized or accreted into interest income over the term of the securities using the level yield method.
Income Taxes: Deferred income taxes are provided for differences arising in the timing of income and expenses for financial reporting and for income tax purposes. Deferred income taxes and tax benefits are recognized for the future tax consequences attributable to differences between the financial statement carrying amounts of existing assets and liabilities and their respective tax basis. Deferred tax assets and liabilities are measured using enacted tax rates expected to apply to taxable income in the years in which those temporary differences are expected to be recovered or settled. The Company provides a deferred tax asset valuation allowance for the estimated future tax effects attributable to temporary differences and carryforwards when realization is determined not to be more likely than not.
FASB ASC 740-10 prescribes a recognition threshold that a tax position is required to meet before being recognized in the financial statements and provides guidance on derecognition, measurement, classification, interest and penalties, accounting in interim periods, disclosure and transition issues. Pursuant to FASB ASC 740-10, the Company examines its financial statements, its income tax provision and its federal and state income tax returns and analyzes its tax positions, including permanent and temporary differences, as well as the major components of income and expense to determine whether a tax benefit is more likely than not to be sustained upon examination by tax authorities. The Company recognizes interest and penalties arising from income tax settlements as part of its provision for income taxes.
As part of the Plan of Conversion and Reorganization completed on June 29, 2011, the Company contributed shares of Company common stock to the Farmington Bank Community Foundation, Inc. This contribution resulted in a charitable contribution deduction for federal income tax purposes. Use of that charitable contribution deduction is limited under Federal tax law to 10% of federal taxable income without regard to charitable contributions, net operating losses, and dividend received deductions. Annually, a corporation is permitted to carry over to the five succeeding tax years, contributions that exceeded the 10% limitation, but also subject to the maximum annual limitation. As a result, approximately $4.3 million of charitable contribution carryforward remains at December 31, 2015 resulting in a deferred tax asset of approximately $1.5 million. The Company believes it is more likely than not that this carryforward will not be fully utilized before expiration in 2016. Therefore, a valuation allowance has been recorded against this deferred tax asset. Some of this charitable contribution carryforward would likely expire unutilized if the Company does not generate sufficient taxable income over the next year. The Company monitors the need for a valuation allowance on a quarterly basis.
In December 1999, we created and have since maintained a “passive investment company” (“PIC”), as permitted by Connecticut law. At December 31, 2015 there were no material uncertain tax positions related to federal and state income tax matters. We are currently open to audit under the statute of limitations by the Internal Revenue Service and state taxing authorities for the years ended December 31, 2011 through 2014. If the state taxing authority were to determine that the PIC was not in compliance with statutory requirements, a material amount of taxes could be due.
As of December 31, 2015, management believes it is more likely than not that the deferred tax assets will be realized through future reversals of existing taxable temporary differences and future taxable income. At December 31, 2015, our net deferred tax asset was $15.4 million with a $771,000 valuation allowance.
Pension and Other Postretirement Benefits: The Company’s non-contributory defined-benefit pension plan and certain defined benefit postretirement plans were frozen as of February 28, 2013 and no additional benefits will accrue.
The Company has a non-contributory defined benefit pension plan that provides benefits for substantially all employees hired before January 1, 2007 who meet certain requirements as to age and length of service. The benefits are based on years of service and average compensation, as defined in the Plan Document. The Company’s funding practice is to meet the minimum funding standards established by the Employee Retirement Income Security Act of 1974.
| 48 |
In addition to providing pension benefits, we provide certain health care and life insurance benefits for retired employees. Participants or eligible employees hired before January 1, 1993 become eligible for the benefits if they retire after reaching age 62 with fifteen or more years of service. A fixed percent of annual costs are paid depending on length of service at retirement. The Company accrues for the estimated costs of these other post-retirement benefits through charges to expense during the years that employees render service. The Company makes contributions to cover the current benefits paid under this plan. The Company believes the policy for determining pension and other post-retirement benefit expenses is critical because judgments are required with respect to the appropriate discount rate, rate of return on assets and other items. The Company reviews and updates the assumptions annually. If the Company’s estimate of pension and post-retirement expense is too low it may experience higher expenses in the future, reducing its net income. If the Company’s estimate is too high, it may experience lower expenses in the future, increasing its net income.
| 49 |
Comparison of Financial Condition at December 31, 2015 and December 31, 2014
Our total assets increased $223.2 million or 9.0%, to $2.7 billion at December 31, 2015, from $2.5 billion at December 31, 2014, primarily due to an increase of $221.7 million in net loans.
Our investment portfolio totaled $164.7 million or 6.1% of total assets, and $204.3 million or 8.2% of total assets at December 31, 2015 and 2014, respectively. Available-for-sale investment securities totaled $132.4 million at December 31, 2015 compared to $188.0 million at December 31, 2014. Securities held-to-maturity increased $16.0 million to $32.2 million at December 31, 2015 from $16.2 million at December 31, 2014 as a result of purchasing U.S. Government agency obligations and U.S. Government sponsored residential mortgage-backed securities. The Company purchases short term U.S. Treasury and agency securities in order to meet municipal and repurchase agreement pledge requirements and to minimize interest rate risk during the sustained low interest rate environment.
Net loans increased $221.7 million or 10.5% at December 31, 2015 to $2.3 billion compared to December 31, 2014 primarily driven by increases in commercial loans, commercial real estate and residential real estate, which combined, increased $244.9 million, offset by a $26.5 million decrease in construction real estate. The allowance for loan losses increased $1.2 million or 6.5% to $20.2 million at December 31, 2015 from $19.0 million at December 31, 2014. At December 31, 2015, the allowance for loan losses represented 0.86% of total loans and 135.44% of non-performing loans, compared to 0.89% of total loans and 122.58% of non-performing loans as of December 31, 2014.
Total liabilities increased $212.0 million, or 9.4%, to $2.5 billion at December 31, 2015 compared to $2.3 billion at December 31, 2014, primarily due to increases in deposits. Deposits increased $258.3 million or 14.9% to $2.0 billion at December 31, 2015 which includes increases in interest-bearing deposits of $187.5 million and increases in non-interest bearing deposits of $70.9 million due to our continued efforts to obtain more individual, commercial and municipal account relationships. Federal Home Loan Bank of Boston advances decreased $24.1 million to $377.6 million at December 31, 2015 from $401.7 million at December 31, 2014 due to our increased deposits funding our organic loan and securities growth.
Stockholders’ equity increased $11.2 million to $245.7 million compared to December 31, 2014 primarily due to $12.6 million in net income and $3.1 million in share based compensation offset by the repurchase of 147,020 shares of common stock at an average price per share of $14.97 at a cost of $2.2 million and a $651,000 increase in other comprehensive loss. The Company paid cash dividends totaling $3.3 million or $0.22 per share during the year ended December 31, 2015. Repurchased shares are held as treasury stock and are available for general corporate purposes.
| 50 |
Net Interest Income Analysis: Average Balance Sheets, Interest and Yields/Costs
The following tables present the average balance sheets, average yields and costs and certain other information for the periods indicated therein on a fully tax-equivalent basis. All average balances are daily average balances. Non-accrual loans were included in the computation of average balances, but have been reflected in the table as loans carrying a zero percent yield. Loans held for sale average balance are included in loans average balance. The yields set forth below include the effect of net deferred costs and premiums that are amortized to interest income or expense.
| For The Years Ended December 31, | ||||||||||||||||||||||||||||||||||||
| 2015 | 2014 | 2013 | ||||||||||||||||||||||||||||||||||
| Average Balance | Interest and Dividends (1) | Yield/Cost | Average Balance | Interest and Dividends (1) | Yield/Cost | Average Balance | Interest and Dividends (1) | Yield/Cost | ||||||||||||||||||||||||||||
| (Dollars in thousands) | ||||||||||||||||||||||||||||||||||||
| Interest-earning assets: | ||||||||||||||||||||||||||||||||||||
| Loans | $ | 2,279,418 | $ | 81,177 | 3.56 | % | $ | 1,962,239 | $ | 71,967 | 3.67 | % | $ | 1,647,517 | $ | 62,136 | 3.77 | % | ||||||||||||||||||
| Securities | 188,004 | 1,832 | 0.97 | % | 181,317 | 1,429 | 0.79 | % | 129,977 | 927 | 0.71 | % | ||||||||||||||||||||||||
| Federal Home Loan Bank of Boston stock | 21,187 | 522 | 2.46 | % | 15,911 | 208 | 1.31 | % | 8,981 | 33 | 0.37 | % | ||||||||||||||||||||||||
| Federal funds and other earning assets | 11,947 | 26 | 0.22 | % | 4,947 | 15 | 0.30 | % | 8,398 | 15 | 0.18 | % | ||||||||||||||||||||||||
| Total interest-earning assets | 2,500,556 | 83,557 | 3.34 | % | 2,164,414 | 73,619 | 3.40 | % | 1,794,873 | 63,111 | 3.52 | % | ||||||||||||||||||||||||
| Noninterest-earning assets | 119,857 | 105,474 | 105,279 | |||||||||||||||||||||||||||||||||
| Total assets | $ | 2,620,413 | $ | 2,269,888 | $ | 1,900,152 | ||||||||||||||||||||||||||||||
| Interest-bearing liabilities: | ||||||||||||||||||||||||||||||||||||
| NOW accounts | $ | 472,644 | $ | 1,351 | 0.29 | % | $ | 380,936 | $ | 976 | 0.26 | % | $ | 277,698 | $ | 638 | 0.23 | % | ||||||||||||||||||
| Money market | 453,017 | 3,592 | 0.79 | % | 420,456 | 3,112 | 0.74 | % | 362,914 | 2,878 | 0.79 | % | ||||||||||||||||||||||||
| Savings accounts | 213,383 | 226 | 0.11 | % | 200,948 | 205 | 0.10 | % | 182,952 | 206 | 0.11 | % | ||||||||||||||||||||||||
| Certificates of deposit | 407,071 | 4,203 | 1.03 | % | 338,590 | 3,076 | 0.91 | % | 353,677 | 3,460 | 0.98 | % | ||||||||||||||||||||||||
| Total interest-bearing deposits | 1,546,115 | 9,372 | 0.61 | % | 1,340,930 | 7,369 | 0.55 | % | 1,177,241 | 7,182 | 0.61 | % | ||||||||||||||||||||||||
| Federal Home Loan Bank of Boston advances | 356,539 | 3,449 | 0.97 | % | 260,432 | 1,841 | 0.71 | % | 98,486 | 1,651 | 1.68 | % | ||||||||||||||||||||||||
| Repurchase agreement borrowings | 12,629 | 448 | 3.55 | % | 21,000 | 719 | 3.42 | % | 21,000 | 713 | 3.40 | % | ||||||||||||||||||||||||
| Repurchase liabilities | 54,600 | 106 | 0.19 | % | 60,082 | 151 | 0.25 | % | 56,891 | 187 | 0.33 | % | ||||||||||||||||||||||||
| Total interest-bearing liabilities | 1,969,883 | 13,375 | 0.68 | % | 1,682,444 | 10,080 | 0.60 | % | 1,353,618 | 9,733 | 0.72 | % | ||||||||||||||||||||||||
| Noninterest-bearing deposits | 357,156 | 315,177 | 266,217 | |||||||||||||||||||||||||||||||||
| Other noninterest-bearing liabilities | 51,312 | 37,909 | 44,532 | |||||||||||||||||||||||||||||||||
| Total liabilities | 2,378,351 | 2,035,530 | 1,664,367 | |||||||||||||||||||||||||||||||||
| Stockholders' equity | 242,062 | 234,358 | 235,785 | |||||||||||||||||||||||||||||||||
| Total liabilities and stockholders' equity | $ | 2,620,413 | $ | 2,269,888 | $ | 1,900,152 | ||||||||||||||||||||||||||||||
| Tax-equivalent net interest income | $ | 70,182 | $ | 63,539 | $ | 53,378 | ||||||||||||||||||||||||||||||
| Less: tax-equivalent adjustment | (1,673 | ) | (845 | ) | (225 | ) | ||||||||||||||||||||||||||||||
| Net interest income | $ | 68,509 | $ | 62,694 | $ | 53,153 | ||||||||||||||||||||||||||||||
| Net interest rate spread (2) | 2.66 | % | 2.80 | % | 2.80 | % | ||||||||||||||||||||||||||||||
| Net interest-earning assets (3) | $ | 530,673 | $ | 481,970 | $ | 441,255 | ||||||||||||||||||||||||||||||
| Net interest margin (4) | 2.81 | % | 2.94 | % | 2.97 | % | ||||||||||||||||||||||||||||||
| Average interest-earning assets to average interest-bearing liabilities | 126.94 | % | 128.65 | % | 132.60 | % | ||||||||||||||||||||||||||||||
(1) On a fully-tax equivalent basis.
(2) Net interest rate spread represents the difference between the yield on average interest-earning assets and the
cost of average interest-bearing liabilities.
(3) Net interest-earning assets represent total interest-earning assets less total interest-bearing liabilities.
(4) Net interest margin represents tax-equivalent net interest income divided by average total interest-earning assets.
| 51 |
Rate Volume Analysis
The following table sets forth the effects of changing rates and volumes on tax-equivalent net interest income for the periods indicated. The rate column shows the effects attributable to changes in rate (changes in rate multiplied by prior volume). The volume column shows the effects attributable to changes in volume (changes in volume multiplied by prior rate). The total column represents the sum of the volume and rate columns. For purposes of this table, changes attributable to both rate and volume that cannot be segregated have been allocated proportionately based on the changes due to rate and the changes due to volume.
| 2015 vs. 2014 | 2014 vs. 2013 | |||||||||||||||||||||||
| Increase (decrease) due to | Increase (decrease) due to | |||||||||||||||||||||||
| (Dollars in thousands) | Volume | Rate | Total | Volume | Rate | Total | ||||||||||||||||||
| Interest-earning assets: | ||||||||||||||||||||||||
| Loans | $ | 11,347 | $ | (2,137 | ) | $ | 9,210 | $ | 11,584 | $ | (1,753 | ) | $ | 9,831 | ||||||||||
| Securities | 54 | 349 | 403 | 397 | 105 | 502 | ||||||||||||||||||
| Federal Home Loan Bank of Boston stock | 86 | 228 | 314 | 41 | 134 | 175 | ||||||||||||||||||
| Federal funds and other earning assets | 16 | (5 | ) | 11 | (8 | ) | 8 | - | ||||||||||||||||
| Total interest-earning assets | 11,503 | (1,565 | ) | 9,938 | 12,014 | (1,506 | ) | 10,508 | ||||||||||||||||
| Interest-bearing liabilities: | ||||||||||||||||||||||||
| NOW accounts | 253 | 122 | 375 | 258 | 80 | 338 | ||||||||||||||||||
| Money market | 250 | 230 | 480 | 435 | (201 | ) | 234 | |||||||||||||||||
| Savings accounts | 13 | 8 | 21 | 19 | (20 | ) | (1 | ) | ||||||||||||||||
| Certificates of deposit | 673 | 454 | 1,127 | (144 | ) | (240 | ) | (384 | ) | |||||||||||||||
| Total interest-bearing deposits | 1,189 | 814 | 2,003 | 568 | (381 | ) | 187 | |||||||||||||||||
| Federal Home Loan Bank of Boston advances | 805 | 803 | 1,608 | 1,553 | (1,363 | ) | 190 | |||||||||||||||||
| Repurchase agreement borrowing | (296 | ) | 25 | (271 | ) | - | 6 | 6 | ||||||||||||||||
| Repurchase liabilities | (13 | ) | (32 | ) | (45 | ) | 10 | (46 | ) | (36 | ) | |||||||||||||
| Total interest-bearing liabilities | 1,685 | 1,610 | 3,295 | 2,131 | (1,784 | ) | 347 | |||||||||||||||||
| Increase (decrease) in net interest income | $ | 9,818 | $ | (3,175 | ) | $ | 6,643 | $ | 9,883 | $ | 278 | $ | 10,161 | |||||||||||
Summary of Operating Results for the Years Ended December 31, 2015 and 2014
The following discussion provides a summary and comparison of our operating results for the years ended December 31, 2015 and 2014:
| For the Year Ended December 31, | ||||||||||||||||
| 2015 | 2014 | $ Change | % Change | |||||||||||||
| (Dollars in thousands) | ||||||||||||||||
| Net interest income | $ | 68,509 | $ | 62,694 | $ | 5,815 | 9.3 | % | ||||||||
| Provision for loan losses | 2,440 | 2,588 | (148 | ) | (5.7 | ) | ||||||||||
| Noninterest income | 13,447 | 9,104 | 4,343 | 47.7 | ||||||||||||
| Noninterest expense | 61,210 | 57,048 | 4,162 | 7.3 | ||||||||||||
| Income before taxes | 18,306 | 12,162 | 6,144 | 50.5 | ||||||||||||
| Income tax expense | 5,727 | 2,827 | 2,900 | 102.6 | ||||||||||||
| Net income | $ | 12,579 | $ | 9,335 | $ | 3,244 | 34.8 | % | ||||||||
For the year ended December 31, 2015, net income increased $3.2 million compared to the year ended December 31, 2014. The increase in net income was driven by an increase in net interest income due to organic loan growth and an increase in noninterest income, offset by an increase in noninterest expense and an increase in income tax expense.
Comparison of Operating Results for the Years Ended December 31, 2015 and 2014
Our results of operations depend primarily on net interest income, which is the difference between the interest income on earning assets, such as loans and investments, and the interest expense incurred on interest-bearing liabilities, such as deposits and borrowings. We also generate noninterest income; including service charges on deposit accounts, gain on sale of securities, income from mortgage banking activities, bank-owned life insurance income, brokerage fees, insurance commissions and other miscellaneous fees. Our noninterest expense primarily consists of salary and employee benefits, occupancy expense, furniture and equipment expenses, FDIC assessments, marketing and other general and administrative expenses. Our results of operations are also affected by our provision for loan losses.
| 52 |
Net Interest Income: Net interest income is determined by the interest rate spread (i.e., the difference between the yields earned on interest-earning assets and the rates paid on interest-bearing liabilities) and the relative amounts of interest-earning assets and interest-bearing liabilities. Net interest income before the provision for loan losses was $68.5 million and $62.7 million for the years ended December 31, 2015 and December 31, 2014, respectively. Net interest income increased primarily due to a $317.2 million increase in the average loan balance offset by a $3.3 million increase in interest expense. The yield on average interest-earning assets decreased 6 basis points to 3.34% for the year ended 2015 from 3.40% for the year ended 2014. The decline was primarily due to an 11 basis point decrease in the yield on total average net loans to 3.56% due to a low interest rate environment. The cost of average interest-bearing liabilities increased 8 basis points to 0.68% for the year ended 2015. The increase was primarily due to money market and certificate of deposit promotions and a 26 basis point increase in the average cost of Federal Home Loan Bank of Boston borrowings. Net interest margin decreased to 2.81% for the year ended 2015 compared to 2.94% for the year ended 2014.
Interest expense increased $3.3 million to $13.4 million for the year ended 2015 compared to $10.1 million for the year ended 2014. The cost of interest-bearing liabilities increased 8 basis points to 68 basis points for the year ended 2015 compared to 60 basis points for the year ended 2014. The increase was primarily due to money market and certificate of deposit promotions and a 26 basis point increase in the average cost of Federal Home Loan Bank of Boston borrowings.
Provision for Loan Losses: The allowance for loan losses is maintained at a level management determines to be appropriate to absorb estimated credit losses that are both probable and reasonably estimable at the dates of the financial statements. Management evaluates the adequacy of the allowance for loan losses on a quarterly basis and charges any provision for loan losses needed to current operations. The assessment considers historical loss experience, historical and current delinquency statistics, the loan portfolio segment and the amount of loans in the loan portfolio, the financial strength of the borrowers, adverse situations that may affect the borrower’s ability to repay, estimated value of any underlying collateral, and prevailing economic conditions and other credit quality indicators.
Management recorded a provision for loan losses of $2.4 million and $2.6 million for the years ended December 31, 2015 and 2014, respectively. The provision recorded is based upon management’s analysis of the allowance for loan losses necessary to absorb the estimated credit losses in the loan portfolio for the period. Net charge-offs for the year ended 2015 were $1.2 million or 0.05% to average loans compared to $1.9 million or 0.10% to average loans for the year ended 2014.
At December 31, 2015, the allowance for loan losses represented 0.86% of total loans and 135.44% of non-accrual loans, compared to 0.89% of total loans and 122.58% of non-accrual loans at December 31, 2014.
Noninterest Income: Sources of noninterest income primarily include service charges on deposit accounts, gain on sale of securities, mortgage banking activities, bank-owned life insurance income, brokerage fees, insurance commissions and other miscellaneous fees.
The following table summarizes noninterest income for the years ended December 31, 2015 and 2014:
| For the Year Ended December 31, | ||||||||||||||||
| 2015 | 2014 | $ Change | % Change | |||||||||||||
| (Dollars in thousands) | ||||||||||||||||
| Fees for customer services | $ | 5,975 | $ | 5,488 | $ | 487 | 8.9 | % | ||||||||
| Gain on sales of investments | 1,523 | - | 1,523 | 100.0 | ||||||||||||
| Net gain on loans sold | 2,492 | 1,419 | 1,073 | 75.6 | ||||||||||||
| Brokerage and insurance fee income | 215 | 192 | 23 | 12.0 | ||||||||||||
| Bank owned life insurance income | 1,672 | 1,130 | 542 | 48.0 | ||||||||||||
| Other | 1,570 | 875 | 695 | 79.4 | ||||||||||||
| Total noninterest income | $ | 13,447 | $ | 9,104 | $ | 4,343 | 47.7 | % | ||||||||
| 53 |
Noninterest income increased $4.3 million to $13.4 million for the year ended 2015 compared to the year ended 2014. Fees for customer services increased $487,000 to $6.0 million for the year ended 2015 compared to the year ended 2014 driven by our growth in checking accounts and debit card fees. Gain on sale of investments was $1.5 million for the year ended 2015 due to the sale of trust preferred securities. There was no gain on sale of investments for the year ended 2014. Net gain on loans sold increased $1.1 million to $2.5 million for the year ended 2015 compared to the year ended 2014 as a result of an increase in volume of loans sold. Bank owned life insurance income increased $542,000 to $1.7 million for the year ended 2015 compared to the year ended 2014 primarily due to a $10.0 million purchase of bank owned life insurance and $379,000 in bank owned life insurance proceeds in 2015. Other income increased $695,000 to $1.6 million for the year ended 2015 compared to the year ended 2014 primarily due to a $709,000 increase in swap fee income.
Noninterest Expense: The following table summarizes noninterest expense for the years ended December 31, 2015 and 2014:
| For the Year Ended December 31, | ||||||||||||||||
| 2015 | 2014 | $ Change | % Change | |||||||||||||
| (Dollars in thousands) | ||||||||||||||||
| Salaries and employee benefits | $ | 36,855 | $ | 34,416 | $ | 2,439 | 7.1 | % | ||||||||
| Occupancy expense | 5,115 | 5,080 | 35 | 0.7 | ||||||||||||
| Furniture and equipment expense | 4,204 | 4,342 | (138 | ) | (3.2 | ) | ||||||||||
| FDIC assessment | 1,657 | 1,396 | 261 | 18.7 | ||||||||||||
| Marketing | 2,149 | 1,590 | 559 | 35.2 | ||||||||||||
| Other operating expenses | 11,230 | 10,224 | 1,006 | 9.8 | ||||||||||||
| Total noninterest expense | $ | 61,210 | $ | 57,048 | $ | 4,162 | 7.3 | % | ||||||||
Noninterest expense increased $4.2 million to $61.2 million for the year ended 2015 compared to $57.0 million for the year ended 2014. Salaries and employee benefits increased $2.4 million to $36.9 million for the year ended 2015 compared to the year ended 2014. The increase is primarily due to an increase in staff to support our compliance areas, our expansion into western Massachusetts and to maintain the Bank’s growth. Marketing increased $559,000 to $2.1 million for the year ended 2015 compared to the prior year primarily due to our expansion into western Massachusetts and an increase in premiums and giveaways to obtain new customers in the geographical areas we serve. Other operating expenses increased $1.0 million to $11.2 million for the year ended 2015 compared to the prior year primarily due to a $246,000 increase in service bureau fees and a general increase in office expenses to support the Bank’s growth.
Income Tax Expense: Income tax expense was $5.7 million for the year ended 2015 compared to $2.8 million for the year ended 2014. The increase in income tax expense for the year ended 2015 was primarily due to a $771,000 valuation allowance related to a deferred tax asset associated with the establishment of the Bank’s foundation in 2011 and a $6.1 million increase in income before taxes. The income tax expense for the year ended 2014 was also lower by $441,000 due to adjusting the tax rate on our deferred tax assets from 34% to 35%.
Summary of Operating Results for the Years Ended December 31, 2014 and 2013
The following discussion provides a summary and comparison of our operating results for the years ended December 31, 2014 and 2013:
| For the Year Ended December 31, | ||||||||||||||||
| 2014 | 2013 | $ Change | % Change | |||||||||||||
| (Dollars in thousands) | ||||||||||||||||
| Net interest income | $ | 62,694 | $ | 53,153 | $ | 9,541 | 18.0 | % | ||||||||
| Provision for loan losses | 2,588 | 1,530 | 1,058 | 69.2 | ||||||||||||
| Noninterest income | 9,104 | 11,012 | (1,908 | ) | (17.3 | ) | ||||||||||
| Noninterest expense | 57,048 | 57,762 | (714 | ) | (1.2 | ) | ||||||||||
| Income before taxes | 12,162 | 4,873 | 7,289 | 149.6 | ||||||||||||
| Income tax expense | 2,827 | 1,169 | 1,658 | 141.8 | ||||||||||||
| Net income | $ | 9,335 | $ | 3,704 | $ | 5,631 | 152.0 | % | ||||||||
For the year ended December 31, 2014, net income increased $5.6 million compared to the year ended December 31, 2013. The increase in net income was driven by an increase in net interest income due to organic loan growth, offset by a decrease in noninterest income and increases in the provision for loan losses and income tax expense.
| 54 |
Comparison of Operating Results for the Years Ended December 31, 2014 and 2013
Net Interest Income: Net interest income is determined by the interest rate spread (i.e., the difference between the yields earned on interest-earning assets and the rates paid on interest-bearing liabilities) and the relative amounts of interest-earning assets and interest-bearing liabilities. Net interest income before the provision for loan losses was $62.7 million and $53.2 million for the years ended December 31, 2014 and December 31, 2013, respectively. Net interest income increased primarily due to a $314.7 million increase in the average loan balance despite a 10 basis point decrease in the yield on loans and a $51.3 million increase in the average securities balance offset by a $328.8 million increase in the average interest-bearing liabilities balance. The yield on average interest-earning assets decreased 12 basis points to 3.40% for the year ended 2014 from 3.52% for the year ended 2013. The decline was primarily due to a 10 basis point decrease in the yield on total average net loans to 3.67%. The cost of average interest-bearing liabilities decreased 12 basis points to 0.60% for the year ended 2014. The decline was primarily due to a 7 basis point decrease in certificates of deposit and a 97 basis point decrease in Federal Home Loan Bank of Boston advance costs due to an increase in short-term rate advances. Net interest margin decreased to 2.94% for the year ended 2014 compared to 2.97% for the year ended 2013.
Interest expense increased $347,000 to $10.1 million for the year ended 2014 compared to $9.7 million for the year ended 2013. The average interest-bearing liabilities balance increased $328.8 million offset by lower certificate of deposit rates and an increase in FHLBB short-term advances which carry lower rates. Average interest-bearing deposits grew at a rate of 13.9%, while total for average balances of noninterest-bearing deposits grew at a rate of 18.4% for the year ended 2014 compared to the year ended 2013.
Provision for Loan Losses: The allowance for loan losses is maintained at a level management determines to be appropriate to absorb estimated credit losses that are both probable and reasonably estimable at the dates of the financial statements. Management evaluates the adequacy of the allowance for loan losses on a quarterly basis and charges any provision for loan losses needed to current operations. The assessment considers historical loss experience, historical and current delinquency statistics, the loan portfolio segment and the amount of loans in the loan portfolio, the financial strength of the borrowers, adverse situations that may affect the borrower’s ability to repay, estimated value of any underlying collateral, and prevailing economic conditions and other credit quality indicators.
Management recorded a provision for loan losses of $2.6 million and $1.5 million for the years ended December 31, 2014 and 2013, respectively. The provision recorded is based upon management’s analysis of the allowance for loan losses necessary to absorb the estimated credit losses in the loan portfolio for the period. Net charge-offs for the year ended 2014 were $1.9 million or 0.10% to average loans compared to $445,000 or 0.03% to average loans for the year ended 2013.
At December 31, 2014, the allowance for loan losses represented 0.89% of total loans and 122.58% of non-accrual loans, compared to 1.01% of total loans and 123.74% of non-accrual loans at December 31, 2013.
Noninterest Income: Sources of noninterest income primarily include service charges on deposit accounts, gain on sale of securities, mortgage banking activities, bank-owned life insurance income, brokerage fees, insurance commissions and other miscellaneous fees.
The following table summarizes noninterest income for the year ended December 31, 2014 and 2013:
| For the Year Ended December 31, | ||||||||||||||||
| 2014 | 2013 | $ Change | % Change | |||||||||||||
| (Dollars in thousands) | ||||||||||||||||
| Fees for customer services | $ | 5,488 | $ | 4,559 | $ | 929 | 20.4 | % | ||||||||
| Gain on sales of investments | - | 340 | (340 | ) | 100.0 | |||||||||||
| Net gain on loans sold | 1,419 | 4,825 | (3,406 | ) | (70.6 | ) | ||||||||||
| Brokerage and insurance fee income | 192 | 150 | 42 | 28.0 | ||||||||||||
| Bank owned life insurance income | 1,130 | 1,316 | (186 | ) | (14.1 | ) | ||||||||||
| Other | 875 | (178 | ) | 1,053 | (591.6 | ) | ||||||||||
| Total noninterest income | $ | 9,104 | $ | 11,012 | $ | (1,908 | ) | (17.3 | )% | |||||||
| 55 |
Noninterest income decreased $1.9 million to $9.1 million for the year ended 2014 compared to the year ended 2013 primarily due to decreases in net gain on loans sold and gain on sale of investments partially offset by increases in fees for customer services and other income. Fees for customer services increased $929,000 to $5.5 million for the year ended 2014 compared to the year ended 2013 driven by our growth in checking accounts and debit card fees. Gain on sales of investments decreased $340,000 as there were no sales of investments for the year ended 2014. Net gain on loans sold decreased $3.4 million to $1.4 million for the year ended 2014 compared to the year ended 2013 as a result of a decline in our secondary market residential sales activity. Other income increased $1.1 million to $875,000 for the year ended 2014 compared to the year ended 2013 primarily due to a $478,000 increase in swap fees and a $406,000 increase in mortgage banking derivative income.
Noninterest Expense: The following table summarizes noninterest expense for the years ended December 31, 2014 and 2013:
| For the Year Ended December 31, | ||||||||||||||||
| 2014 | 2013 | $ Change | % Change | |||||||||||||
| (Dollars in thousands) | ||||||||||||||||
| Salaries and employee benefits | $ | 34,416 | $ | 34,851 | $ | (435 | ) | (1.2 | )% | |||||||
| Occupancy expense | 5,080 | 4,722 | 358 | 7.6 | ||||||||||||
| Furniture and equipment expense | 4,342 | 4,079 | 263 | 6.4 | ||||||||||||
| FDIC assessment | 1,396 | 1,272 | 124 | 9.7 | ||||||||||||
| Marketing | 1,590 | 1,995 | (405 | ) | (20.3 | ) | ||||||||||
| Other operating expenses | 10,224 | 10,843 | (619 | ) | (5.7 | ) | ||||||||||
| Total noninterest expense | $ | 57,048 | $ | 57,762 | $ | (714 | ) | (1.2 | )% | |||||||
Noninterest expense decreased by $714,000 or 1.2% to $57.0 million during the year ended 2014 compared to $57.8 million for the year ended 2013. Salaries and employee benefits decreased $435,000 to $34.4 million for the year ended 2014 compared to the year ended 2013. Excluding $633,000 related to accelerated vesting of stock compensation for the year ended 2013, salaries and employee benefits increased $198,000 for the year ended 2014. Marketing expense decreased $405,000 or 20.3% compared to the year ended 2013 primarily due to general expense control initiatives.
Income Tax Expense: Income tax expense was $2.8 million for the year ended 2014 compared to $1.2 million for the year ended 2013. The increase in income tax expense for the year ended 2014 was due to a $7.3 million increase in income before taxes offset by adjusting the tax rate on our deferred tax assets from 34% to 35%. The Company’s taxable income, before and after the utilization of its charitable contribution carryforward deduction placed it in the 35% corporate tax bracket.
| 56 |
Management of Market and Interest Rate Risk
General: The majority of our assets and liabilities are monetary in nature. Consequently, our most significant form of market risk is interest rate risk. Our assets, consisting primarily of loans and available-for-sale investment securities, generally have longer contractual maturities than our liabilities, consisting primarily of deposits. As a result, a principal part of our business strategy is to manage interest rate risk and reduce the exposure of our net interest income to changes in market interest rates. Accordingly, our board of directors has established an asset/liability committee which is responsible for (i) evaluating the interest rate risk inherent in our assets and liabilities, (ii) determining the level of risk that is appropriate given our business strategy, operating environment, capital, liquidity and performance objectives and (iii) managing this risk consistent with the guidelines approved by our board of directors. Management monitors the level of interest rate risk on a regular basis and the asset/liability committee meets at least quarterly to review our asset/liability policies and interest rate risk position.
We have sought to manage our interest rate risk in order to minimize the exposure of our earnings and capital to changes in interest rates. During the low interest rate environment that has existed in recent years, we have implemented the following strategies to manage our interest rate risk: (i) emphasizing adjustable rate commercial and consumer loans, (ii) maintaining a short average life investment portfolio and (iii) periodically lengthening the term structure of our borrowings from the FHLBB. Additionally, we sell a portion of our fixed-rate residential mortgages to the secondary market. These measures should serve to reduce the volatility of our future net interest income in different interest rate environments.
Quantitative Analysis: An economic value of equity and an income simulation analysis are used to estimate our interest rate risk exposure at a particular point in time. We are most reliant on the income simulation method as it is a dynamic method in that it incorporates our forecasted balance sheet growth assumptions under the different interest rate scenarios tested. We utilize the income simulation method to analyze our interest rate sensitivity position and to manage the risk associated with interest rate movements. At least quarterly, our asset/liability committee reviews the potential effect that changes in interest rates could have on the repayment or repricing of rate sensitive assets and the funding requirements of rate sensitive liabilities. Our most recent simulation uses projected repricing of assets and liabilities on the basis of contractual maturities, anticipated repayments and scheduled rate adjustments. Prepayment rate assumptions can have a significant impact on interest income simulation results. Because of the large percentage of loans and mortgage-backed securities we hold, rising or falling interest rates may have a significant impact on the actual prepayment speeds of our mortgage related assets that may in turn effect our interest rate sensitivity position. When interest rates rise, prepayment speeds slow and the average expected life of our assets would tend to lengthen more than the expected average life of our liabilities and would therefore alter our existing interest rate risk position.
Our asset/liability policy currently limits projected changes in net interest income to a maximum variance of (4.0%, 8.0%, 10.0% and 12.0%) assuming a 100, 200, 300 or 400 basis point interest rate shock, respectively, as measured over a 12 month period when compared to the flat rate scenario.
The following table depicts the percentage increase and/or decrease in estimated net interest income over twelve months based on the scenarios run at each of the periods presented:
| Percentage Increase (Decrease) in Estimated Net Interest Income Over 12 Months | ||||||||
| At December 31, 2015 | At December 31, 2014 | |||||||
| 100 basis point decrease | (6.99 | ) % | (5.50 | ) % | ||||
| 100 basis point increase | 4.23 | % | 2.94 | % | ||||
| 200 basis point increase | 4.43 | % | 1.90 | % | ||||
| 300 basis point increase | 4.73 | % | (0.80 | ) % | ||||
| 400 basis point increase | 3.87 | % | (6.10 | ) % | ||||
| 57 |
Liquidity and Capital Resources:
We maintain liquid assets at levels we consider adequate to meet our liquidity needs. We adjust our liquidity levels to fund loan commitments, repay our borrowings, fund deposit outflows, fund operations and pay escrow obligations on items in our loan portfolio. We also adjust liquidity as appropriate to meet asset and liability management objectives.
Our primary sources of liquidity are deposits, principal repayment and prepayment of loans, the sale in the secondary market of loans held for sale, maturities and sales of investment securities and other short-term investments, periodic pay downs of mortgage-backed securities, and earnings and funds provided from operations. While scheduled principal repayments on loans are a relatively predictable source of funds, deposit flows and loan prepayments are greatly influenced by market interest rates, economic conditions and rates offered by our competitors. We set the interest rates on our deposits to maintain a desired level of total deposits. In addition, we invest excess funds in short-term interest-earning assets, which provide liquidity to meet lending requirements.
A portion of our liquidity consists of cash and cash equivalents, which are a product of our operating, investing and financing activities. At December 31, 2015, $59.1 million of our assets were invested in cash and cash equivalents compared to $42.9 million at December 31, 2014. Our primary sources of cash are principal repayments on loans, proceeds from the maturities of investment securities, increases in deposit accounts, proceeds from residential loan sales and advances from FHLBB.
For the years ended December 31, 2015 and 2014, loan originations and purchases, net of collected principal and loan sales, totaled $226.3 million and $344.8 million, respectively. Cash received from the sales and maturities of available-for-sale investment securities totaled $278.3 million and $306.6 million for the years ended December 31, 2015 and 2014, respectively. We purchased $223.1 million and $341.9 million of available-for-sale investment securities during the years ended December 31, 2015 and 2014, respectively.
Liquidity management is both a daily and longer-term function of business management. If we require funds beyond our ability to generate them internally, borrowing agreements exist with the FHLBB, which provides an additional source of funds. At December 31, 2015, we had $377.6 million in advances from the FHLBB and an additional available borrowing limit of $407.8 million, compared to $401.7 million in advances from the FHLBB and an additional available borrowing limit of $122.5 million at December 31, 2014, subject to collateral requirements of the FHLBB. The Company also had letters of credit of $63.0 million and $22.0 million at December 31, 2015 and 2014, respectively, subject to collateral requirements of the FHLBB. Internal policies limit borrowings to 25.0% of total assets, or $677.1 million and $621.3 million at December 31, 2015 and 2014, respectively. Other sources of funds include access to pre-approved unsecured lines of credit with financial institutions for $45.0 million, our $8.8 million secured line of credit with the FHLBB and our $3.5 million unsecured line of credit with a bank which were all undrawn at December 31, 2015. The Federal Reserve Bank’s discount window loan collateral program enables us to borrow up to $63.2 million on an overnight basis as of December 31, 2015. The funding arrangement was collateralized by $136.6 million in pledged commercial real estate loans as of December 31, 2015.
We had outstanding commitments to originate loans of $46.1 million and $33.7 million and unfunded commitments under construction loans, lines of credit and stand-by letters of credit of $441.2 million and $409.7 million at December 31, 2015 and 2014, respectively. At December 31, 2015 and 2014, time deposits scheduled to mature in less than one year totaled $267.7 million and $239.6 million, respectively. Based on prior experience, management believes that a significant portion of such deposits will remain with us, although there can be no assurance that this will be the case. In the event a significant portion of our deposits are not retained by us, we will have to utilize other funding sources, such as FHLBB advances, brokered deposits, our $45.0 million unsecured lines of credit with financial institutions, our $8.8 million secured line of credit with the FHLBB, our $3.5 million unsecured line of credit with a bank or our $63.2 million overnight borrowing arrangement with the Federal Reserve Bank in order to maintain our level of assets. Alternatively, we would reduce our level of liquid assets, such as our cash and cash equivalents in order to meet funding needs. In addition, the cost of such deposits may be significantly higher if market interest rates are higher or if there is an increased amount of competition for deposits in our market area at the time of renewal.
| 58 |
Contractual Obligations
The following tables present information indicating various obligations made by us as of December 31, 2015 and the respective maturity dates:
| Less Than One Year | One to Three Years | Three to Five Years | More than Five Years | Total | ||||||||||||||||
| (Dollars in thousands) | ||||||||||||||||||||
| FHLB Advances (1) | $ | 157,000 | $ | 85,000 | $ | 121,600 | $ | 14,000 | $ | 377,600 | ||||||||||
| Interest expense payable on FHLB Advances | 3,617 | 6,256 | 2,129 | 710 | 12,712 | |||||||||||||||
| Repurchase agreement borrowings | - | 10,500 | - | - | 10,500 | |||||||||||||||
| Operating leases (2) | 2,624 | 5,439 | 3,476 | 8,285 | 19,824 | |||||||||||||||
| Other liabilities (3) | 1,331 | 2,708 | 2,887 | 7,751 | 14,677 | |||||||||||||||
| Time deposits with stated maturity dates | 267,748 | 134,247 | 38,795 | - | 440,790 | |||||||||||||||
| Alternative investment unfunded commitment | 165 | 472 | - | - | 637 | |||||||||||||||
| Total | $ | 432,485 | $ | 244,622 | $ | 168,887 | $ | 30,746 | $ | 876,740 | ||||||||||
(1) Secured under a combination of a blanket security and specific loan agreements on qualifying assets, principally mortgage loans.
(2) Represents non-cancelable operating leases for offices and office equipment.
(3) Consists of estimated benefit payments over the next 10 years to retirees under unfunded nonqualified pension plans.
Other Commitments
The following tables present information indicating various other commitments made by us as of December 31, 2015 and the respective maturity dates:
| Less Than One Year | One to Three Years | Three to Five Years | More than Five Years | Total | ||||||||||||||||
| (Dollars in thousands) | ||||||||||||||||||||
| Approved loan commitments (1) | $ | 46,144 | $ | - | $ | - | $ | - | $ | 46,144 | ||||||||||
| Unadvanced portion of construction loans | 3,079 | 3,912 | - | 37,466 | 44,457 | |||||||||||||||
| Ununsed lines for home equity loans (2) | 2,946 | 13,617 | 23,776 | 164,644 | 204,983 | |||||||||||||||
| Unused revolving lines of credit | - | - | - | 365 | 365 | |||||||||||||||
| Unused commercial letters of credit | 2,363 | 1,145 | 50 | - | 3,558 | |||||||||||||||
| Unused commercial lines of credit | 93,001 | 39,320 | 9,780 | 45,718 | 187,819 | |||||||||||||||
| $ | 147,533 | $ | 57,994 | $ | 33,606 | $ | 248,193 | $ | 487,326 | |||||||||||
General: Commitments to extend credit are agreements to lend to a customer as long as there is no violation of any condition established in the contract and generally have fixed expiration dates or other termination clauses.
(1) Commitments for loans are extended to customers for up to 60 days after which they expire.
(2) Unused portions of home equity lines of credit are available to the borrower for up to 10 years.
Off-Balance Sheet Arrangements
We do not have any off-balance sheet arrangements, other than noted above, that have or are reasonably likely to have a current or future effect on our financial condition, changes in financial condition, revenues or expenses, results of operations, liquidity, capital expenditures or capital resources that is material to investors.
Impact of Inflation and Changing Prices
The consolidated financial statements and related notes of First Connecticut Bancorp have been prepared in accordance with U.S. GAAP. U.S. GAAP generally requires the measurement of financial position and operating results in terms of historical dollars without consideration for changes in the relative purchasing power of money over time due to inflation. The impact of inflation is reflected in the increased cost of our operations. Unlike industrial companies, our assets and liabilities are primarily monetary in nature, with relatively little investments in fixed assets or inventories. Inflation has an important impact on the growth of total assets and the resulting need to increase equity capital at higher than normal rates in order to maintain an appropriate equity to assets ratio. Management believes that the impact of inflation on financial results depends on our ability to react to changes in interest rates and, by such reaction, reduce the inflationary impact on performance. Management has attempted to structure the mix of financial instruments and manage interest rate sensitivity in order to minimize the potential adverse effects of inflation or other market forces on net interest income and, therefore, earnings and capital.
| 59 |
Cautionary Statement Regarding Forward-Looking Information
This report contains “forward-looking statements.” You can identify these forward-looking statements through our use of words such as “may,” “will,” “anticipate,” “assume,” “should,” “indicate,” “would,” “believe,” “contemplate,” “expect,” “estimate,” “continue,” “plan,” “project,” “could,” “intend,” “target” and other similar words and expressions of the future. These forward-looking statements include, but are not limited to:
| ● | statements of our goals, intentions and expectations; |
| ● | statements regarding our business plans, prospects, growth and operating strategies; |
| ● | statements regarding the asset quality of our loan and investment portfolios; and |
| ● | estimates of our risks and future costs and benefits. |
These forward-looking statements are based on current beliefs and expectations of our management and are inherently subject to significant business, economic and competitive uncertainties and contingencies, many of which are beyond our control. In addition, these forward-looking statements are subject to assumptions with respect to future business strategies and decisions that are subject to change.
The following factors, among others, could cause actual results to differ materially from the anticipated results or other expectations expressed in the forward-looking statements:
| ● | Local, regional and national business or economic conditions may differ from those expected. |
| ● | The effects of and changes in trade, monetary and fiscal policies and laws, including the U.S. Federal Reserve Board’s interest rate policies, may adversely affect our business. |
| ● | The ability to increase market share and control expenses may be more difficult than anticipated. |
| ● | Changes in laws and regulatory requirements (including those concerning taxes, banking, securities and insurance) may adversely affect us or our business. |
| ● | Changes in accounting policies and practices, as may be adopted by regulatory agencies, the Public Company Accounting Oversight Board or the Financial Accounting Standards Board, may affect expected financial reporting. |
| ● | Future changes in interest rates may reduce our profits which could have a negative impact on the value of our stock. |
| ● | We are subject to lending risk and could incur losses in our loan portfolio despite our underwriting practices. Changes in real estate values could also increase our lending risk. |
| ● | Changes in demand for loan products, financial products and deposit flow could impact our financial performance. |
| ● | Strong competition within our market area may limit our growth and profitability. |
| ● | We may not manage the risks involved in the foregoing as well as anticipated. |
| ● | If our allowance for loan losses is not sufficient to cover actual loan losses, our earnings could decrease. |
| 60 |
| ● | Our stock value may be negatively affected by federal regulations and articles of incorporation provisions restricting takeovers. |
| ● | Implementation of stock benefit plans will increase our costs, which will reduce our income. |
| ● | The Dodd-Frank Act has resulted in dramatic regulatory changes that affected the industry in general, and may impact our competitive position in ways that cannot be predicted at this time. |
| ● | The Emergency Economic Stabilization Act (“EESA”) of 2008 has and may continue to have a significant impact on the banking industry. |
| ● | Computer systems on which we depend could fail or experience a security breach, implementation of new technologies may not be successful; and our ability to anticipate and respond to technological changes can affect our ability to meet customer needs. |
Any forward-looking statements made by or on behalf of us in this annual report on Form 10-K speak only as of the date of this annual report on Form 10-K. We do not undertake to update forward-looking statements to reflect the impact of circumstances or events that arise after the date the forward-looking statement was made. The reader should, however, consult any further disclosures of a forward-looking nature we may make in future filings.
Item 7A. Quantitative and Qualitative Disclosures About Market Risk
For information regarding market risk, see “Item 7. Management’s Discussion and Analysis of Financial Conditions and Results of Operations – Management of Market and Interest Rate Risk.”
Item 8. Financial Statements and Supplementary Data
The following are included in this item:
| (A) | Report of Independent Registered Public Accounting Firm |
| (B) | Consolidated Statements of Financial Condition as of December 31, 2015 and 2014 |
| (C) | Consolidated Statements of Income for the years ended December 31, 2015, 2014 and 2013 |
| (D) | Consolidated Statements of Comprehensive Income for the years ended December 31, 2015, 2014 and 2013 |
| (E) | Consolidated Statements of Changes in Stockholders’ Equity for the years ended December 31, 2015, 2014 and 2013 |
| (F) | Consolidated Statements of Cash Flows for the years ended December 31, 2015, 2014 and 2013 |
| (G) | Notes to Consolidated Financial Statements |
The supplementary data required by this item (selected quarterly financial data) is provided in Note 22 of the Notes to Consolidated Financial Statements.
| 61 |
CONSOLIDATED FINANCIAL STATEMENTS
Table of Contents
| Page | |
| Report of Independent Registered Public Accounting Firm | 63 |
| Consolidated Financial Statements: | |
| Consolidated Statements of Financial Condition | 64 |
| Consolidated Statements of Income | 65 |
| Consolidated Statements of Comprehensive Income | 66 |
| Consolidated Statements of Changes in Stockholders’ Equity | 67 |
| Consolidated Statements of Cash Flows | 68 |
| Notes to Consolidated Financial Statements | 69 |
| 62 |
Report of Independent Registered Public Accounting Firm
To the Board of Directors and Stockholders of
First Connecticut Bancorp, Inc.
In our opinion, the accompanying consolidated statements of financial condition and the related consolidated statements of income, comprehensive income, changes in stockholders’ equity, and cash flows present fairly, in all material respects, the financial position of First Connecticut Bancorp, Inc. and its subsidiaries at December 31, 2015 and December 31, 2014, and the results of their operations and their cash flows for each of the three years in the period ended December 31, 2015 in conformity with accounting principles generally accepted in the United States of America. Also in our opinion, the Company maintained, in all material respects, effective internal control over financial reporting as of December 31, 2015, based on criteria established in Internal Control - Integrated Framework (2013) issued by the Committee of Sponsoring Organizations of the Treadway Commission (COSO). The Company's management is responsible for these financial statements, for maintaining effective internal control over financial reporting and for its assessment of the effectiveness of internal control over financial reporting, included in the accompanying Management's Annual Report on Internal Control over Financial Reporting. Our responsibility is to express opinions on these financial statements and on the Company's internal control over financial reporting based on our integrated audits. We conducted our audits in accordance with the standards of the Public Company Accounting Oversight Board (United States). Those standards require that we plan and perform the audits to obtain reasonable assurance about whether the financial statements are free of material misstatement and whether effective internal control over financial reporting was maintained in all material respects. Our audits of the financial statements included examining, on a test basis, evidence supporting the amounts and disclosures in the financial statements, assessing the accounting principles used and significant estimates made by management, and evaluating the overall financial statement presentation. Our audit of internal control over financial reporting included obtaining an understanding of internal control over financial reporting, assessing the risk that a material weakness exists, and testing and evaluating the design and operating effectiveness of internal control based on the assessed risk. Our audits also included performing such other procedures as we considered necessary in the circumstances. We believe that our audits provide a reasonable basis for our opinions.
A company’s internal control over financial reporting is a process designed to provide reasonable assurance regarding the reliability of financial reporting and the preparation of financial statements for external purposes in accordance with generally accepted accounting principles. A company’s internal control over financial reporting includes those policies and procedures that (i) pertain to the maintenance of records that, in reasonable detail, accurately and fairly reflect the transactions and dispositions of the assets of the company; (ii) provide reasonable assurance that transactions are recorded as necessary to permit preparation of financial statements in accordance with generally accepted accounting principles, and that receipts and expenditures of the company are being made only in accordance with authorizations of management and directors of the company; and (iii) provide reasonable assurance regarding prevention or timely detection of unauthorized acquisition, use, or disposition of the company’s assets that could have a material effect on the financial statements.
Because of its inherent limitations, internal control over financial reporting may not prevent or detect misstatements. Also, projections of any evaluation of effectiveness to future periods are subject to the risk that controls may become inadequate because of changes in conditions, or that the degree of compliance with the policies or procedures may deteriorate.
/s/PricewaterhouseCoopers LLP
Hartford, Connecticut
March 11, 2016
| 63 |
| First Connecticut Bancorp, Inc. |
| Consolidated Statements of Financial Condition |
| December 31, | ||||||||
| 2015 | 2014 | |||||||
| (Dollars in thousands, except share and per share data) | ||||||||
| Assets | ||||||||
| Cash and due from banks | $ | 45,732 | $ | 35,232 | ||||
| Interest bearing deposits with other institutions | 13,407 | 7,631 | ||||||
| Total cash and cash equivalents | 59,139 | 42,863 | ||||||
| Securities held-to-maturity, at amortized cost | 32,246 | 16,224 | ||||||
| Securities available-for-sale, at fair value | 132,424 | 188,041 | ||||||
| Loans held for sale | 9,637 | 2,417 | ||||||
| Loans (1) | 2,361,796 | 2,138,877 | ||||||
| Allowance for loan losses | (20,198 | ) | (18,960 | ) | ||||
| Loans, net | 2,341,598 | 2,119,917 | ||||||
| Premises and equipment, net | 18,565 | 18,873 | ||||||
| Federal Home Loan Bank of Boston stock, at cost | 21,729 | 19,785 | ||||||
| Accrued income receivable | 6,747 | 5,777 | ||||||
| Bank-owned life insurance | 50,618 | 39,686 | ||||||
| Deferred income taxes, net | 15,443 | 16,841 | ||||||
| Prepaid expenses and other assets | 20,400 | 14,936 | ||||||
| Total assets | $ | 2,708,546 | $ | 2,485,360 | ||||
| Liabilities and Stockholders' Equity | ||||||||
| Deposits | ||||||||
| Interest-bearing | $ | 1,589,970 | $ | 1,402,517 | ||||
| Noninterest-bearing | 401,388 | 330,524 | ||||||
| 1,991,358 | 1,733,041 | |||||||
| Federal Home Loan Bank of Boston advances | 377,600 | 401,700 | ||||||
| Repurchase agreement borrowings | 10,500 | 21,000 | ||||||
| Repurchase liabilities | 35,769 | 48,987 | ||||||
| Accrued expenses and other liabilities | 47,598 | 46,069 | ||||||
| Total liabilities | 2,462,825 | 2,250,797 | ||||||
| Stockholders' Equity | ||||||||
| Common stock, $0.01 par value, 30,000,000 shares authorized; 17,976,893 shares issued and 15,881,663 shares outstanding at December 31, 2015 and 18,006,129 shares issued and 16,026,319 shares outstanding at December 31, 2014 | 181 | 181 | ||||||
| Additional paid-in-capital | 181,997 | 178,772 | ||||||
| Unallocated common stock held by ESOP | (11,626 | ) | (12,681 | ) | ||||
| Treasury stock, at cost (2,095,230 shares at December 31, 2015 and 1,979,810 shares at December 31, 2014) | (30,602 | ) | (28,828 | ) | ||||
| Retained earnings | 112,933 | 103,630 | ||||||
| Accumulated other comprehensive loss | (7,162 | ) | (6,511 | ) | ||||
| Total stockholders' equity | 245,721 | 234,563 | ||||||
| Total liabilities and stockholders' equity | $ | 2,708,546 | $ | 2,485,360 | ||||
| (1) Loans include net deferred loan costs of $4.0 million and $3.8 million at December 31, 2015 and 2014, respectively. |
The accompanying notes are an integral part of these consolidated financial statements.
| 64 |
| First Connecticut Bancorp, Inc. |
| Consolidated Statements of Income |
| For the Year Ended December 31, | ||||||||||||
| 2015 | 2014 | 2013 | ||||||||||
| (Dollars in thousands, except share and per share data) | ||||||||||||
| Interest income | ||||||||||||
| Interest and fees on loans | ||||||||||||
| Mortgage | $ | 61,920 | $ | 56,963 | $ | 48,728 | ||||||
| Other | 17,584 | 14,159 | 13,183 | |||||||||
| Interest and dividends on investments | ||||||||||||
| United States Government and agency obligations | 1,534 | 949 | 478 | |||||||||
| Other bonds | 79 | 259 | 230 | |||||||||
| Corporate stocks | 741 | 429 | 252 | |||||||||
| Other interest income | 26 | 15 | 15 | |||||||||
| Total interest income | 81,884 | 72,774 | 62,886 | |||||||||
| Interest expense | ||||||||||||
| Deposits | 9,372 | 7,369 | 7,182 | |||||||||
| Federal Home Loan Bank of Boston advances | 3,449 | 1,841 | 1,651 | |||||||||
| Repurchase agreement borrowings | 448 | 719 | 713 | |||||||||
| Repurchase liabilities | 106 | 151 | 187 | |||||||||
| Total interest expense | 13,375 | 10,080 | 9,733 | |||||||||
| Net interest income | 68,509 | 62,694 | 53,153 | |||||||||
| Provision for loan losses | 2,440 | 2,588 | 1,530 | |||||||||
| Net interest income after provision for loan losses | 66,069 | 60,106 | 51,623 | |||||||||
| Noninterest income | ||||||||||||
| Fees for customer services | 5,975 | 5,488 | 4,559 | |||||||||
| Gain on sales of investments | 1,523 | - | 340 | |||||||||
| Net gain on loans sold | 2,492 | 1,419 | 4,825 | |||||||||
| Brokerage and insurance fee income | 215 | 192 | 150 | |||||||||
| Bank owned life insurance income | 1,672 | 1,130 | 1,316 | |||||||||
| Other | 1,570 | 875 | (178 | ) | ||||||||
| Total noninterest income | 13,447 | 9,104 | 11,012 | |||||||||
| Noninterest expense | ||||||||||||
| Salaries and employee benefits | 36,855 | 34,416 | 34,851 | |||||||||
| Occupancy expense | 5,115 | 5,080 | 4,722 | |||||||||
| Furniture and equipment expense | 4,204 | 4,342 | 4,079 | |||||||||
| FDIC assessment | 1,657 | 1,396 | 1,272 | |||||||||
| Marketing | 2,149 | 1,590 | 1,995 | |||||||||
| Other operating expenses | 11,230 | 10,224 | 10,843 | |||||||||
| Total noninterest expense | 61,210 | 57,048 | 57,762 | |||||||||
| Income before income taxes | 18,306 | 12,162 | 4,873 | |||||||||
| Income tax expense | 5,727 | 2,827 | 1,169 | |||||||||
| Net income | $ | 12,579 | $ | 9,335 | $ | 3,704 | ||||||
| Net earnings per share (See Note 3): | ||||||||||||
| Basic | $ | 0.84 | $ | 0.62 | $ | 0.24 | ||||||
| Diluted | 0.83 | 0.62 | 0.24 | |||||||||
| Dividends per share | 0.22 | 0.17 | 0.12 | |||||||||
The accompanying notes are an integral part of these consolidated financial statements.
| 65 |
| First Connecticut Bancorp, Inc. |
| Consolidated Statements of Comprehensive Income |
| For the Year Ended December 31, | ||||||||||||
| 2015 | 2014 | 2013 | ||||||||||
| (Dollars in thousands) | ||||||||||||
| Net income | $ | 12,579 | $ | 9,335 | $ | 3,704 | ||||||
| Other comprehensive (loss) income, before tax | ||||||||||||
| Unrealized (losses) gains on securities: | ||||||||||||
| Unrealized holding (losses) gains arising during the period | (3,525 | ) | 1,831 | (1,263 | ) | |||||||
| Less: reclassification adjustment for gains included in net income | 1,523 | - | 340 | |||||||||
| Net change in unrealized (losses) gains | (2,002 | ) | 1,831 | (923 | ) | |||||||
| Change related to pension and other postretirement benefit plans | 986 | (5,388 | ) | 3,783 | ||||||||
| Other comprehensive (loss) income, before tax | (1,016 | ) | (3,557 | ) | 2,860 | |||||||
| Income tax (benefit) expense | (365 | ) | (1,270 | ) | 972 | |||||||
| Other comprehensive (loss) income, net of tax | (651 | ) | (2,287 | ) | 1,888 | |||||||
| Comprehensive income | $ | 11,928 | $ | 7,048 | $ | 5,592 | ||||||
The accompanying notes are an integral part of these consolidated financial statements.
| 66 |
| First Connecticut Bancorp, Inc. |
| Consolidated Statement of Changes in Stockholders’ Equity |
| Unallocated | Accumulated | |||||||||||||||||||||||||||||||
| Common Stock | Additional | Common | Other | Total | ||||||||||||||||||||||||||||
| Shares | Paid in | Shares Held | Treasury | Retained | Comprehensive | Stockholders' | ||||||||||||||||||||||||||
| Outstanding | Amount | Capital | by ESOP | Stock | Earnings | Loss | Equity | |||||||||||||||||||||||||
| (Dollars in thousands, except share data) | ||||||||||||||||||||||||||||||||
| Balance at December 31, 2012 | 17,714,481 | $ | 181 | $ | 172,386 | $ | (14,806 | ) | $ | (4,860 | ) | $ | 95,006 | $ | (6,112 | ) | $ | 241,795 | ||||||||||||||
| ESOP shares released and committed to be released | - | - | 345 | 1,059 | - | - | - | 1,404 | ||||||||||||||||||||||||
| Cash dividend paid ($0.12 per common share) | - | - | - | - | - | (1,878 | ) | - | (1,878 | ) | ||||||||||||||||||||||
| Treasury stock acquired | (1,306,053 | ) | - | - | - | (18,910 | ) | - | - | (18,910 | ) | |||||||||||||||||||||
| Stock options exercised | 90,850 | - | (6 | ) | - | 1,185 | - | - | 1,179 | |||||||||||||||||||||||
| Cancellation of shares for tax withholding | (41,636 | ) | - | (570 | ) | - | (14 | ) | - | - | (584 | ) | ||||||||||||||||||||
| Tax benefits from stock-based compensation | - | - | 35 | - | - | - | - | 35 | ||||||||||||||||||||||||
| Share based compensation expense | - | - | 3,576 | - | - | - | - | 3,576 | ||||||||||||||||||||||||
| Net income | - | - | - | - | - | 3,704 | - | 3,704 | ||||||||||||||||||||||||
| Other comprehensive income | - | - | - | - | - | - | 1,888 | 1,888 | ||||||||||||||||||||||||
| Balance at December 31, 2013 | 16,457,642 | 181 | 175,766 | (13,747 | ) | (22,599 | ) | 96,832 | (4,224 | ) | 232,209 | |||||||||||||||||||||
| ESOP shares released and committed to be released | - | - | 414 | 1,066 | - | - | - | 1,480 | ||||||||||||||||||||||||
| Cash dividend paid ($0.17 per common share) | - | - | - | - | - | (2,537 | ) | - | (2,537 | ) | ||||||||||||||||||||||
| Treasury stock acquired | (404,217 | ) | - | - | - | (6,257 | ) | - | - | (6,257 | ) | |||||||||||||||||||||
| Stock options exercised | 2,100 | - | (1 | ) | - | 28 | - | - | 27 | |||||||||||||||||||||||
| Cancellation of shares for tax withholding | (29,206 | ) | - | (440 | ) | - | - | - | - | (440 | ) | |||||||||||||||||||||
| Tax benefits from stock-based compensation | - | - | 110 | - | - | - | - | 110 | ||||||||||||||||||||||||
| Share based compensation expense | - | - | 2,923 | - | - | - | - | 2,923 | ||||||||||||||||||||||||
| Net income | - | - | - | - | - | 9,335 | - | 9,335 | ||||||||||||||||||||||||
| Other comprehensive loss | - | - | - | - | - | - | (2,287 | ) | (2,287 | ) | ||||||||||||||||||||||
| Balance at December 31, 2014 | 16,026,319 | 181 | 178,772 | (12,681 | ) | (28,828 | ) | 103,630 | (6,511 | ) | 234,563 | |||||||||||||||||||||
| ESOP shares released and | ||||||||||||||||||||||||||||||||
| committed to be released | - | - | 467 | 1,055 | - | - | - | 1,522 | ||||||||||||||||||||||||
| Cash dividend paid ($0.22 per common share) | - | - | - | - | - | (3,276 | ) | - | (3,276 | ) | ||||||||||||||||||||||
| Treasury stock acquired | (147,020 | ) | - | - | - | (2,200 | ) | - | - | (2,200 | ) | |||||||||||||||||||||
| Stock options exercised | 31,600 | - | (14 | ) | - | 426 | - | - | 412 | |||||||||||||||||||||||
| Cancellation of shares for tax withholding | (29,236 | ) | - | (498 | ) | - | - | - | - | (498 | ) | |||||||||||||||||||||
| Tax benefits from stock-based compensation | - | - | 152 | - | - | - | - | 152 | ||||||||||||||||||||||||
| Share based compensation expense | - | - | 3,118 | - | - | - | - | 3,118 | ||||||||||||||||||||||||
| Net income | - | - | - | - | - | 12,579 | - | 12,579 | ||||||||||||||||||||||||
| Other comprehensive loss | - | - | - | - | - | - | (651 | ) | (651 | ) | ||||||||||||||||||||||
| Balance at December 31, 2015 | 15,881,663 | $ | 181 | $ | 181,997 | $ | (11,626 | ) | $ | (30,602 | ) | $ | 112,933 | $ | (7,162 | ) | $ | 245,721 | ||||||||||||||
The accompanying notes are an integral part of these consolidated financial statements.
| 67 |
| First Connecticut Bancorp, Inc. |
| Consolidated Statements of Cash Flows |
| For the Year Ended December 31, | ||||||||||||
| (Dollars in thousands) | 2015 | 2014 | 2013 | |||||||||
| Cash flows from operating activities | ||||||||||||
| Net income | $ | 12,579 | $ | 9,335 | $ | 3,704 | ||||||
| Adjustments to reconcile net income to net cash provided by operating activities: | ||||||||||||
| Provision for loan losses | 2,440 | 2,588 | 1,530 | |||||||||
| Provision for off-balance sheet commitments | 61 | 4 | 41 | |||||||||
| Depreciation and amortization | 2,640 | 3,100 | 3,079 | |||||||||
| Amortization of ESOP expense | 1,522 | 1,480 | 1,404 | |||||||||
| Share based compensation expense | 3,118 | 2,923 | 3,576 | |||||||||
| Gain on sale of investments | (1,523 | ) | - | (340 | ) | |||||||
| Loans originated for sale | (209,997 | ) | (57,069 | ) | (173,160 | ) | ||||||
| Proceeds from the sale of loans held for sale | 205,269 | 82,129 | 184,425 | |||||||||
| Loss on disposal of premises and equipment | 62 | 6 | 76 | |||||||||
| (Gain) loss on fair value adjustment for mortgage banking derivatives | (123 | ) | 33 | 441 | ||||||||
| Impairment losses on alternative investments | 144 | 52 | - | |||||||||
| Writedowns on foreclosed real estate | 50 | - | - | |||||||||
| (Gain) loss on sale of foreclosed real estate | (570 | ) | (81 | ) | 59 | |||||||
| Net gain on loans sold | (2,492 | ) | (1,419 | ) | (4,825 | ) | ||||||
| Accretion and amortization of investment security discounts and premiums, net | (65 | ) | (26 | ) | (51 | ) | ||||||
| Amortization and accretion of loan fees and discounts, net | (141 | ) | (850 | ) | 385 | |||||||
| Increase in accrued income receivable | (970 | ) | (860 | ) | (502 | ) | ||||||
| Deferred income tax | 1,763 | (687 | ) | (313 | ) | |||||||
| Increase in cash surrender value of bank-owned life insurance | (1,293 | ) | (1,130 | ) | (1,207 | ) | ||||||
| (Increase) decrease in prepaid expenses and other assets | (5,562 | ) | (3,919 | ) | 3,486 | |||||||
| Increase (decrease) in accrued expenses and other liabilities | 2,410 | 7,145 | (10,475 | ) | ||||||||
| Net cash provided by operating activities | 9,322 | 42,754 | 11,333 | |||||||||
| Cash flows from investing activities | ||||||||||||
| Maturities and calls of securities held-to-maturity | 24,978 | 8,759 | 4 | |||||||||
| Maturities, calls and principal payments of securities available-for-sale | 278,288 | 306,574 | 317,867 | |||||||||
| Purchases of securities held-to-maturity | (41,000 | ) | (12,000 | ) | (9,981 | ) | ||||||
| Purchases of securities available-for-sale | (223,085 | ) | (341,867 | ) | (331,043 | ) | ||||||
| Loan originations, net of principal repayments | (226,267 | ) | (344,757 | ) | (283,130 | ) | ||||||
| Purchases of Federal Home Loan Bank of Boston stock, net | (1,944 | ) | (6,649 | ) | (4,197 | ) | ||||||
| Purchase of bank-owned life insurance | (10,000 | ) | - | - | ||||||||
| Proceeds from sale of foreclosed real estate | 2,928 | 1,296 | 495 | |||||||||
| Proceeds from bank-owned life insurance | 361 | - | 100 | |||||||||
| Purchases of premises and equipment | (2,394 | ) | (1,360 | ) | (3,807 | ) | ||||||
| Net cash used in investing activities | (198,135 | ) | (390,004 | ) | (313,692 | ) | ||||||
| Cash flows from financing activities | ||||||||||||
| Net (payments on) proceeds from Federal Home Loan Bank of Boston advances | (24,100 | ) | 142,700 | 131,000 | ||||||||
| Decrease in repurchase agreement borrowings | (10,500 | ) | - | - | ||||||||
| Net increase in demand deposits, NOW accounts, savings accounts and money market accounts | 182,749 | 192,806 | 203,902 | |||||||||
| Net increase (decrease) in time deposits | 75,568 | 26,734 | (20,856 | ) | ||||||||
| Net decrease in repurchase liabilities | (13,218 | ) | (1,829 | ) | (3,371 | ) | ||||||
| Stock options exercised | 412 | 27 | 1,185 | |||||||||
| Excess tax benefit from stock-based compensation | 152 | 110 | 35 | |||||||||
| Cancellation of shares for tax withholding | (498 | ) | (440 | ) | (590 | ) | ||||||
| Repurchase of common stock | (2,200 | ) | (6,257 | ) | (18,910 | ) | ||||||
| Cash dividend paid | (3,276 | ) | (2,537 | ) | (1,878 | ) | ||||||
| Net cash provided by financing activities | 205,089 | 351,314 | 290,517 | |||||||||
| Net increase (decrease) in cash and cash equivalents | 16,276 | 4,064 | (11,842 | ) | ||||||||
| Cash and cash equivalents at beginning of period | 42,863 | 38,799 | 50,641 | |||||||||
| Cash and cash equivalents at end of period | $ | 59,139 | $ | 42,863 | $ | 38,799 | ||||||
| Supplemental disclosure of cash flow information | ||||||||||||
| Cash paid for interest | $ | 13,270 | $ | 9,977 | $ | 9,785 | ||||||
| Cash paid for income taxes | 4,944 | 1,502 | 4,300 | |||||||||
| Loans transferred to other real estate owned | 2,287 | 1,217 | 398 | |||||||||
The accompanying notes are an integral part of these consolidated financial statements.
| 68 |
| First Connecticut Bancorp, Inc. |
| Notes to Consolidated Financial Statements |
| 1. | Summary of Significant Accounting Policies |
Organization and Business
First Connecticut Bancorp, Inc. is a Maryland-chartered bank holding company that wholly owns its only subsidiary, Farmington Bank (collectively with its subsidiary, the “Company”). Farmington Bank's main office is located in Farmington, Connecticut. Farmington Bank is a full-service, community bank with 23 branch locations throughout central Connecticut and western Massachusetts, offering commercial and residential lending as well as wealth management services. Farmington Bank's primary source of income is interest accrued on loans to customers, which include small and middle market businesses and individuals residing primarily in Connecticut and western Massachusetts. However, the Bank will selectively lend to borrowers in other northeastern states.
Wholly-owned subsidiaries of Farmington Bank are Farmington Savings Loan Servicing, Inc., a passive investment company that was established to service and hold loans collateralized by real property; Village Investments, Inc.; the Village Corp., Limited, and Village Square Holdings, Inc.; 28 Main Street Corp., is a subsidiary that was formed to hold residential other real estate owned and Village Management Corp., is a subsidiary that was formed to hold commercial other real estate owned, are presently inactive.
On June 21, 2013, the Company received regulatory approval to repurchase up to 1,676,452 shares, or 10% of its current outstanding common stock. During the year ended December 31, 2015, the Company had repurchased 147,020 of these shares at a cost of $2.2 million. Repurchased shares are held as treasury stock and are available for general corporate purposes. The Company has 757,745 shares remaining available to be repurchased at December 31, 2015.
Basis of Financial Statement Presentation
The consolidated financial statements have been prepared in accordance with accounting principles generally accepted in the United States of America. In the opinion of management, all adjustments considered necessary for a fair presentation have been included. The consolidated financial statements include the accounts of First Connecticut Bancorp, Inc. and its wholly-owned subsidiary, Farmington Bank. All significant intercompany transactions and balances have been eliminated in consolidation.
In preparing the consolidated financial statements, management is required to make extensive use of estimates and assumptions that affect the reported amounts of assets and liabilities as of the date of the statement of condition and revenues and expenses for the period. Actual results could differ significantly from those estimates. Material estimates that are particularly susceptible to significant change in the near term relate to the determination of the allowance for loan losses, investment security other-than-temporary impairment judgments and investment security valuation.
Out of Period Adjustments
In the fourth quarter of 2014, the Company recorded a correction of an error to reflect the estimated fair value of two trust preferred debt securities which increased securities available-for-sale by $1.6 million, decreased deferred income taxes by $600,000 and increased comprehensive income by $1.0 million due to the unrealized gains on the securities, net of tax. The majority of the increase in estimated fair value relates to prior periods. After evaluating the quantitative and qualitative aspects of the adjustments, the Company concluded that its prior period financial statements were not materially misstated and, therefore, no restatement was required. There were no out-of-period adjustments for the year ended December 31, 2015.
| 69 |
| First Connecticut Bancorp, Inc. |
| Notes to Consolidated Financial Statements |
Cash and Cash Equivalents
The Company defines cash and cash equivalents for consolidated cash flow purposes as cash due from banks, federal funds sold and money market funds. Cash flows from loans and deposits are reported net. The balances of cash and due from banks, federal funds sold and money market funds, at times, may exceed federally insured limits. The Company has not experienced any losses from such concentrations.
Investment Securities
Marketable equity and debt securities are classified as either trading, available-for-sale, or held-to-maturity (applies only to debt securities). Management determines the appropriate classifications of securities at the time of purchase. At December 31, 2015 and 2014, the Company had no debt or equity securities classified as trading. Held-to-maturity securities are debt securities for which the Company has the ability and intent to hold until maturity. All other securities not included in held-to-maturity are classified as available-for-sale. Held-to-maturity securities are recorded at amortized cost, adjusted for the amortization or accretion of premiums or discounts. Premiums and discounts on debt securities are amortized or accreted into interest income over the term of the securities using the level yield method. Available-for-sale securities are recorded at fair value. Unrealized gains and losses, net of the related tax effect, on available-for-sale securities are excluded from earnings and are reported in accumulated other comprehensive income, a separate component of equity, until realized. Further information relating to the fair value of securities can be found within Note 4 of the Notes to Consolidated Financial Statements. In accordance with Financial Accounting Standards Board Accounting Standards Codification ("FASB ASC") 320- “Debt and Equity Securities”, a decline in market value of a debt security below amortized cost that is deemed other-than-temporary is charged to earnings for the credit related other-than-temporary impairment ("OTTI"), resulting in the establishment of a new cost basis for the security, while the non-credit related OTTI is recognized in other comprehensive income if there is no intent or requirement to sell the security. The securities portfolio is reviewed on a quarterly basis for the presence of other-than-temporary impairment. If an equity security is deemed other-than-temporarily impaired, the full impairment is considered to be credit-related and a charge to earnings would be recorded. Gains and losses on sales of securities are recognized at the time of sale on a specific identification basis.
Federal Home Loan Bank of Boston Stock
The Company, which is a member of the Federal Home Loan Bank system, is required to maintain an investment in capital stock of the Federal Home Loan Bank of Boston (“FHLBB”). Based on redemption provisions of the FHLBB, the stock has no quoted market value and is carried at cost. At its discretion, the FHLBB may declare dividends on the stock. The Bank reviews for impairment based on the ultimate recoverability of the cost basis in the FHLBB stock. As of December 31, 2015 and 2014, no impairment has been recognized.
Loans Held for Sale
Loans originated and intended for sale in the secondary market are carried at the lower of amortized cost or fair value, as determined by aggregate outstanding commitments from investors or current investor yield requirements. Net unrealized losses, if any, are recognized through a valuation allowance by charges to other noninterest income in the accompanying Consolidated Statements of Income. Gains or losses on sales of mortgage loans are recognized based on the difference between the selling price and the carrying value of the related mortgage loans sold on the trade date to net gain on loans sold in the accompanying Consolidated Statements of Income.
| 70 |
| First Connecticut Bancorp, Inc. |
| Notes to Consolidated Financial Statements |
Loans
The Company’s loan portfolio segments include residential real estate, commercial real estate, construction, installment, commercial, collateral, home equity lines of credit, demand, revolving credit and resort. Construction includes classes for commercial and residential construction.
Loans that management has the intent and ability to hold for the foreseeable future or until maturity or pay-off generally are reported at their outstanding unpaid principal balances adjusted for charge-offs, the allowance for loan losses, and any deferred fees or costs on originated loans. Interest income is accrued on the unpaid principal balance. Loan origination fees, net of certain direct origination costs, are deferred and recognized as an adjustment of the related loan yield using the interest method. When loans are prepaid, sold or participated out, the unamortized portion is recognized as income or expense at that time.
Interest on loans is accrued and recognized in interest income based on contractual rates applied to principal amounts outstanding. Accrual of interest is discontinued, and previously accrued income is reversed, when loan payments are more than 90 days past due or when, in the judgment of management, collectability of the loan or loan interest becomes uncertain. Loans may be returned to accrual status when all principal and interest amounts contractually due (including arrearages) are reasonably assured of repayment within a reasonable period and there is a sustained period of repayment performance (generally a minimum of six months) by the borrower, in accordance with contractual terms involving payment of cash or cash equivalents. The interest on these loans is accounted for on the cash-basis or cost-recovery method, until qualifying for return to accrual status. If a residential real estate, commercial real estate, construction, installment, commercial, collateral, home equity line of credit, demand, revolving credit and resort loan is on non-accrual status cash payments are applied towards the reduction of principal. If loans are considered impaired but accruing, cash payments are applied first to interest income and then as a reduction of principal as specified in the contractual agreement, unless the collection of the remaining principal amount due is considered doubtful.
The policy for determining past due or delinquency status for all loan portfolio segments is based on the number of days past due or the contractual terms of the loan. A loan is considered delinquent when the customer does not make their payments due according to their contractual terms. Generally, a loan can be demanded at any time if the loan is delinquent or if the borrower fails to meet any other agreed upon terms and conditions.
On a quarterly basis, our loan policy requires that we evaluate for impairment all commercial real estate, construction, commercial and resort loan segments that are classified as non-accrual, loans secured by real property in foreclosure or are otherwise likely to be impaired, non-accruing residential and installment loan segments greater than $100,000 and all troubled debt restructurings.
Nonperforming loans consist of non-accruing loans, non-accruing loans identified as trouble debt restructurings and loans past due more than 90 days and still accruing interest.
Allowance for Loan Losses
The allowance for loan losses is maintained at a level believed adequate by management to absorb potential losses inherent in the loan portfolio as of the statement of condition date. The allowance for loan losses consists of a formula allowance following FASB ASC 450 – “Contingencies” and FASB ASC 310 – “Receivables”. The allowance for loan losses is established as losses are estimated to have occurred through a provision for loan losses charged to earnings. Loan losses are charged against the allowance when management believes the uncollectibility of a loan balance is confirmed. Subsequent recoveries, if any, are credited to the allowance.
| 71 |
| First Connecticut Bancorp, Inc. |
| Notes to Consolidated Financial Statements |
The allowance for loan losses is evaluated on a quarterly basis by management. This evaluation is inherently subjective as it requires estimates that are susceptible to significant revision as more information becomes available. The allowance consists of general, allocated and unallocated components, as further described below. All reserves are available to cover any losses regardless of how they are allocated.
General component:
The general component of the allowance for loan losses is based on historical loss experience adjusted for qualitative factors stratified by the following loan segments: residential real estate, commercial real estate, construction, installment, commercial, collateral, home equity line of credit, demand, revolving credit and resort. Construction loans include classes for commercial investment real estate construction, commercial owner occupied construction, residential development, residential subdivision construction and residential owner occupied construction loans. Management uses a rolling average of historical losses based on a time frame appropriate to capture relevant loss data for each loan segment. This historical loss factor is adjusted for the following qualitative factors: levels/trends in delinquencies and nonaccrual loans; trends in volume and terms of loans; effects of changes in risk selection and underwriting standards and other changes in lending policies, procedures and practices; experience/ability/depth of lending management and staff; and national and local economic trends and conditions. There were no material changes in the Company’s policies or methodology pertaining to the general component of the allowance for loan losses during the year ended December 31, 2015.
The qualitative factors are determined based on the various risk characteristics of each loan segment. Risk characteristics relevant to each portfolio segment are as follows:
Residential real estate – Residential real estate loans are generally originated in amounts up to 95.0% of the lesser of the appraised value or purchase price of the property, with private mortgage insurance required on loans with a loan-to-value ratio in excess of 80.0%. The Company does not grant subprime loans. All loans in this segment are collateralized by owner-occupied residential real estate and repayment is dependent on the credit quality of the individual borrower. All residential mortgage loans are underwritten pursuant to secondary market underwriting guidelines which include minimum FICO standards. The overall health of the economy, including unemployment rates and housing prices, will have an effect on the credit quality in this segment.
Commercial real estate – Loans in this segment are primarily income-producing properties throughout the northeastern states. The underlying cash flows generated by the properties may be adversely impacted by a downturn in the economy as evidenced by increased vacancy rates, which in turn, may have an effect on the credit quality in this segment. Management generally obtains rent rolls and other financial information, as appropriate on an annual basis and continually monitors the cash flows of these loans.
Construction loans – Loans in this segment include commercial construction loans, real estate subdivision development loans to developers, licensed contractors and builders for the construction and development of commercial real estate projects and residential properties. Construction lending contains a unique risk characteristic as loans are originated under market and economic conditions that may change between the time of origination and the completion and subsequent purchaser financing of the property. In addition, construction subdivision loans and commercial and residential construction loans to contractors and developers entail additional risks as compared to single-family residential mortgage lending to owner-occupants. These loans typically involve large loan balances concentrated in single borrowers or groups of related borrowers. Real estate subdivision development loans to developers, licensed contractors and builders are generally speculative real estate development loans for which payment is derived from sale of the property. Credit risk may be affected by cost overruns, time to sell at an adequate price, and market conditions. Construction financing is generally considered to involve a higher degree of credit risk than longer-term financing on improved, owner-occupied real estate. Residential construction credit quality may be impacted by the overall health of the economy, including unemployment rates and housing prices.
| 72 |
| First Connecticut Bancorp, Inc. |
| Notes to Consolidated Financial Statements |
Commercial – Loans in this segment are made to businesses and are generally secured by assets of the business. Repayment is expected from the cash flows of the business. A weakened economy, and resultant decreased consumer spending, will have an effect on the credit quality in this segment.
Home equity line of credit – Loans in this segment include home equity loans and lines of credit underwritten with a loan-to-value ratio generally limited to no more than 80%, including any first mortgage. Our home equity lines of credit have ten-year terms and adjustable rates of interest which are indexed to the prime rate. The overall health of the economy, including unemployment rates and housing prices, may have an effect on the credit quality in this segment.
Installment, Collateral, Demand, Revolving Credit and Resort – Loans in these segments include loans principally to customers residing in our primary market area with acceptable credit ratings. Our installment and collateral consumer loans generally consist of loans on new and used automobiles, loans collateralized by deposit accounts and unsecured personal loans. The overall health of the economy, including unemployment rates and housing prices, may have an effect on the credit quality in this segment. Excluding collateral loans which are fully collateralized by a deposit account, repayment for loans in these segments is dependent on the credit quality of the individual borrower. The resort portfolio consists of a direct receivable loan outside the Northeast which is amortizing to its contractual obligations. The Company has exited the resort financing market with a residual portfolio remaining.
Allocated component:
The allocated component relates to loans that are classified as impaired. Impairment is measured on a loan by loan basis for commercial real estate, construction, commercial and resort loans by the present value of expected cash flows discounted at the effective interest rate; the fair value of the collateral, if applicable; or the observable market price for the loan. An allowance is established when the discounted cash flows (or collateral value) of the impaired loan is lower than the carrying value of that loan. The Company does not separately identify individual consumer and residential real estate loans for impairment disclosures, unless such loans are subject to a troubled debt restructuring agreement or they are nonaccrual loans with outstanding balances greater than $100,000.
A loan is considered impaired when, based on current information and events, it is probable that the Company will be unable to collect the scheduled payments of principal or interest when due according to the contractual terms of the loan agreement. Factors considered by management in determining impairment include payment status, collateral value, and the probability of collecting scheduled principal and interest payments when due. Loans that experience insignificant payment delays and payment shortfalls generally are not classified as impaired. Management determines the significance of payment delays and payment shortfalls on a case-by-case basis, taking into consideration all of the circumstances surrounding the loan and the borrower, including the length of the delay, the reasons for the delay, the borrower’s prior payment record, and the amount of the shortfall in relation to the principal and interest owed. Impairment is measured on a loan-by-loan basis for commercial and construction loans by the present value of expected future cash flows discounted at the loan’s effective interest rate, the loan’s obtainable market price or the fair value of the collateral if the loan is collateral dependent. Management updates the analysis quarterly. The assumptions used in appraisals are reviewed for appropriateness. Updated appraisals or valuations are obtained as needed or adjusted to reflect the estimated decline in the fair value based upon current market conditions for comparable properties.
The Company periodically may agree to modify the contractual terms of loans. When a loan is modified and a concession is made to a borrower experiencing financial difficulty, the modification is considered a troubled debt restructuring ("TDR"). All TDRs are classified as impaired.
| 73 |
| First Connecticut Bancorp, Inc. |
| Notes to Consolidated Financial Statements |
Unallocated component:
An unallocated component is maintained, when needed, to cover uncertainties that could affect management’s estimate of probable losses. The unallocated component of the allowance reflects the margin of imprecision inherent in the underlying assumptions used in the methodologies for estimating allocated and general reserves in the portfolio. The Company’s Loan Policy allows management to utilize a high and low range of 0.0% to 5.0% of our total allowance for loan losses when establishing an unallocated allowance, when considered necessary. The unallocated allowance is used to provide for an unidentified loss that may exist in emerging problem loans that cannot be fully quantified or may be affected by conditions not fully understood as of the balance sheet date. There was no unallocated allowance at December 31, 2015 and 2014.
Troubled Debt Restructuring
A loan is considered a troubled debt restructuring (“TDR”) when the Company, for economic or legal reasons related to the borrower’s financial difficulties, grants a concession to the borrower in modifying or renewing the loan the Company would not otherwise consider. In connection with troubled debt restructurings, terms may be modified to fit the ability of the borrower to repay in line with their current financial status, which may include a reduction in the interest rate to market rate or below, a change in the term or movement of past due amounts to the back-end of the loan or refinancing. A loan is placed on non-accrual status upon being restructured, even if it was not previously, unless the modified loan was current for the six months prior to its modification and we believe the loan is fully collectable in accordance with its new terms. The Company’s policy to restore a restructured loan to performing status is dependent on the receipt of regular payments, generally for a period of six months and one calendar year-end. All troubled debt restructurings are classified as impaired loans and are reviewed for impairment by management on a quarterly basis per Company policy.
Mortgage Servicing Rights
The Company capitalizes mortgage servicing rights for loans originated and then sold with servicing retained based on the fair market value on the origination date. Mortgage servicing rights are amortized in proportion to and over the period of estimated net servicing income and such amortization is included in the consolidated statements of income as a reduction of mortgage servicing fee income. Mortgage servicing rights are evaluated for impairment by comparing their aggregate carrying amount to their fair value. An independent appraisal of the fair value of the Company’s mortgage servicing rights is obtained quarterly and is used by management to evaluate the reasonableness of the fair value estimates. Management reviews the independent appraisal and performs procedures to determine appropriateness. Impairment is recognized as an adjustment to mortgage servicing rights and mortgage servicing income.
Foreclosed Real Estate
Real estate acquired through foreclosure comprises properties acquired in partial or total satisfaction of problem loans. The properties are acquired through foreclosure proceedings or acceptance of a deed in lieu of foreclosure. At the time these properties are foreclosed, the properties are initially recorded at the fair value at the date of foreclosure less estimated selling costs. Losses arising at the time of acquisition of such properties are charged against the allowance for loan losses. Subsequent loss provisions are charged to the foreclosed real estate valuation allowance and expenses incurred to maintain the properties are charged to noninterest expense. Properties are evaluated regularly to ensure the recorded amounts are supported by current fair values, and a charge to operations is recorded as necessary to reduce the carrying amount to fair value less estimated costs to dispose. Revenue and expense from the operation of other real estate owned and the provision to establish and adjust valuation allowances are included in noninterest expenses. Costs relating to the development and improvement of the property are capitalized, subject to the limit of fair value of the collateral. In the Consolidated Statements of Financial Condition, total prepaid expenses and other assets include foreclosed real estate of $279,000 and $400,000 as of December 31, 2015 and 2014, respectively, with no specific valuation allowance. The recorded investment of consumer mortgage loans secured by residential real estate properties for which formal foreclosure proceedings are in process according to local requirements of the applicable jurisdiction totaled $4.5 million at December 31, 2015.
| 74 |
| First Connecticut Bancorp, Inc. |
| Notes to Consolidated Financial Statements |
Bank Owned Life Insurance
Bank owned life insurance ("'BOLI") represents life insurance on certain employees who have consented to allow the Company to be the beneficiary of those policies. BOLI is recorded as an asset at cash surrender value. Increases in the cash value of the policies, as well as insurance proceeds received, are recorded in other non-interest income and are not subject to income tax.
Premises and Equipment
Land is carried at cost. Premises and equipment are stated at cost less accumulated depreciation and amortization. Depreciation is computed using the straight-line method over the estimated useful lives of the related assets, which range from three to ten years for furniture and equipment and five to forty years for premises. Leasehold improvements are amortized on a straight-line basis over the term of the respective leases, including renewal options, or the estimated useful lives of the improvements, whichever is shorter. Maintenance and repairs are charged to non-interest expense as incurred, while significant improvements are capitalized.
Derivative Financial Instruments
Interest rate swap derivatives not designated as hedges are offered to certain qualifying commercial customers and to manage the Company’s exposure to interest rate movements and do not meet the hedge accounting parameters under FASB ASC 815 “Derivatives and Hedging”. Derivative financial instruments are recognized as assets and liabilities on the consolidated balance sheet and measured at fair value. Changes in the fair value of derivatives not designated in hedging relationships are recognized directly in earnings.
Pension and Other Postretirement Benefit Plans
The Company’s non-contributory defined-benefit pension plan and certain defined benefit postretirement plans were frozen as of February 28, 2013 and no additional benefits will accrue.
The Company has a non-contributory defined benefit pension plan that provides benefits for substantially all employees hired before January 1, 2007 who meet certain requirements as to age and length of service. The benefits are based on years of service and average compensation, as defined in the Plan Document. The Company’s funding practice is to meet the minimum funding standards established by the Employee Retirement Income Security Act of 1974.
In addition to providing pension benefits, we provide certain health care and life insurance benefits for retired employees. Participants or eligible employees hired before January 1, 1993 become eligible for the benefits if they retire after reaching age 62 with fifteen or more years of service. A fixed percent of annual costs are paid depending on length of service at retirement. The Company accrues for the estimated costs of these other post-retirement benefits through charges to expense during the years that employees render service. The Company makes contributions to cover the current benefits paid under this plan. The Company believes the policy for determining pension and other post-retirement benefit expenses is critical because judgments are required with respect to the appropriate discount rate, rate of return on assets and other items. The Company reviews and updates the assumptions annually. If the Company’s estimate of pension and post-retirement expense is too low it may experience higher expenses in the future, reducing its net income. If the Company’s estimate is too high, it may experience lower expenses in the future, increasing its net income.
| 75 |
| First Connecticut Bancorp, Inc. |
| Notes to Consolidated Financial Statements |
Repurchase Liabilities
Repurchase agreements are accounted for as secured borrowings since the Company maintains effective control over the transferred securities and the transfer meets the other criteria for such accounting. Securities are sold to a counterparty with an agreement to repurchase the same or substantially the same security at a specified price and date. The Company has repurchase agreements with commercial or municipal customers that are offered as a commercial banking service. Customer repurchase agreements are for a term of one day and are backed by the purchasers’ interest in certain U.S. Treasury Bills or other U.S. Government securities. Obligations to repurchase securities sold are reflected as a liability in the Consolidated Statements of Financial Condition. The Company does not record transactions of repurchase agreements as sales. The securities underlying the repurchase agreements remain in the available-for-sale investment securities portfolio.
Transfers of Financial Assets
Transfers of an entire financial asset, a group of entire financial assets, or a participating interest in an entire financial asset are accounted for as sales when control over the assets has been surrendered. Control over transferred assets is deemed to be surrendered when (1) the assets have been isolated from the Company, (2) the transferee obtains the right to pledge or exchange the transferred assets, and (3) the Company does not maintain effective control over the transferred assets.
During the normal course of business, the Company may transfer a portion of a financial asset, for example, a participation loan or the government guaranteed portion of a loan. In order to be eligible for sales treatment, the transfer of the portion of the loan must meet the criteria of a participating interest. If it does not meet the criteria of a participating interest, the transfer must be accounted for as a secured borrowing. In order to meet the criteria for a participating interest, all cash flows from the loan must be divided proportionately, the rights of each loan holder must have the same priority, the loan holders must have no recourse to the transferor other than standard representations and warranties and no loan holder has the right to pledge or exchange the entire loan.
Fee Income
Fee income for customer services which are not deferred are recorded on an accrual basis when earned.
Advertising Costs
Advertising costs are expensed as incurred.
Income Taxes
Deferred income taxes are provided for differences arising in the timing of income and expenses for financial reporting and for income tax purposes. Deferred income taxes and tax benefits are recognized for the future tax consequences attributable to differences between the financial statement carrying amounts of existing assets and liabilities and their respective tax basis. Deferred tax assets and liabilities are measured using enacted tax rates expected to apply to taxable income in the years in which those temporary differences are expected to be recovered or settled. The Company provides a deferred tax asset valuation allowance for the estimated future tax effects attributable to temporary differences and carryforwards when realization is determined not to be more likely than not.
| 76 |
| First Connecticut Bancorp, Inc. |
| Notes to Consolidated Financial Statements |
FASB ASC 740-10 prescribes a recognition threshold that a tax position is required to meet before being recognized in the financial statements and provides guidance on derecognition, measurement, classification, interest and penalties, accounting in interim periods, disclosure and transition issues. Pursuant to FASB ASC 740-10, the Company examines its financial statements, its income tax provision and its federal and state income tax returns and analyzes its tax positions, including permanent and temporary differences, as well as the major components of income and expense to determine whether a tax benefit is more likely than not to be sustained upon examination by tax authorities. The Company recognizes interest and penalties arising from income tax settlements as part of its provision for income taxes.
Employee Stock Ownership Plan (“ESOP”)
The Company accounts for its ESOP in accordance with FASB ASC 718-40, “Compensation – Stock Compensation”. Under this guidance, unearned ESOP shares are not considered outstanding and are shown as a reduction of stockholders' equity as unearned compensation. The Company will recognize compensation cost equal to the fair value of the ESOP shares during the periods in which they are committed to be released. To the extent that the fair value of the Company's ESOP shares differs from the cost of such shares, this difference will be credited or debited to equity. The Company will receive a tax deduction equal to the cost of the shares released to the extent of the principal pay down on the loan by the ESOP. As the loan is internally leveraged, the loan receivable from the ESOP to the Company is not reported as an asset nor is the debt of the ESOP shown as a liability in the Company's consolidated financial statements.
Stock Incentive Plan
During August 2012, the Company implemented the First Connecticut Bancorp, Inc. 2012 Stock Incentive Plan to provide for issuance or granting of shares of common stock for stock options or restricted stock. The Company applies ASC 718, Compensation – “Stock Compensation”, and has recorded stock-based employee compensation cost using the fair value method. Management estimated the fair values of all option grants using the Black-Scholes option-pricing model. Management estimated the expected life of the options using the simplified method allowed under SAB No. 107. The risk-free rate was determined utilizing the treasury yield for the expected life of the option contract.
Earnings Per Share
Earnings per common share is computed under the two-class method. Basic earnings per common share is computed by dividing net earnings allocated to common stockholders by the weighted-average number of common shares outstanding during the applicable period, excluding outstanding participating securities. Non-vested restricted stock awards are participating securities as they have non-forfeitable rights to dividends or dividend equivalents. Diluted earnings per common share is computed using the weighted-average number of shares determined for the basic earnings per common share computation plus the dilutive effect of stock options for common stock using the treasury stock method. Unallocated common shares held by the ESOP are not included in the weighted-average number of common shares outstanding for purposes of calculating both basic and diluted earnings per common share. A reconciliation of the weighted-average shares used in calculating basic earnings per common share and the weighted-average common shares used in calculating diluted earnings per common share is provided in Note 3 - Earnings Per Share.
Segment Reporting
The Company’s only business segment is Community Banking. For the years ended December 31, 2015, 2014 and 2013, this segment represented all the revenues and income of the consolidated group and therefore is the only reported segment as defined by FASB ASC 820, “Segment Reporting”.
| 77 |
| First Connecticut Bancorp, Inc. |
| Notes to Consolidated Financial Statements |
Reclassifications
Amounts in prior period consolidated financial statements are reclassified whenever necessary to conform to the current year presentation.
Recent Accounting Pronouncements
In August 2014, the FASB issued ASU 2014-15, “Presentation of Financial Statements - Going Concern (Subtopic 205-40): Disclosure of Uncertainties about an Entity’s Ability to Continue as a Going Concern.” ASU 2014-15 provides guidance in accounting principles generally accepted in the United States of America about management’s responsibility to evaluate whether there is substantial doubt about an entity’s ability to continue as a going concern and to provide related footnote disclosures. ASU 2014-15 is effective for the annual period ending after December 15, 2016, and for annual periods and interim periods thereafter. Early application is permitted. The Company does not expect ASU 2014-15 to have a significant impact on its financial statements.
In November 2014, the FASB issued ASU 2014-16, “Derivatives and Hedging (Topic 815): Determining Whether the Host Contract in a Hybrid Financial Instrument Issued in the Form of a Share Is More Akin to Debt or to Equity” (a consensus of the FASB Emerging Issues Task Force). ASU 2014-16 clarifies how current U.S. GAAP should be interpreted in subjectively evaluating the economic characteristics and risks of a host contract in a hybrid financial instrument that is issued in the form of a share. Public business entities are required to implement ASU 2014-16 in fiscal years and interim periods within those fiscal years beginning after December 15, 2015. The Company does not expect ASU 2014-16 to have a significant impact on its financial statements.
In January 2015, the FASB issued ASU 2015-01, “Income Statement – Extraordinary and Unusual Items”, (Subtopic 225-20): Simplifying Income Statement Presentation by Eliminating the Concept of Extraordinary Items.” ASU 2015-01 eliminates from GAAP the concept of extraordinary items. ASU 2015-01 is effective for fiscal years, and interim periods within those fiscal years, beginning after December 15, 2015. A reporting entity may apply ASU 2015-01 prospectively. A reporting entity also may apply ASU 2015-01 retrospectively to all prior periods presented in the financial statements. Early adoption is permitted provided that the guidance is applied from the beginning of the fiscal year of adoption. The Company does not expect ASU 2015-01 to have a significant impact on its financial statements.
In February 2015, the FASB issued ASU No. 2015-02, “Amendments to the Consolidation Analysis.” This ASU affects reporting entities that are required to evaluate whether they should consolidate certain legal entities. Specifically, the amendments: (1) Modify the evaluation of whether limited partnerships and similar legal entities are variable interest entities (“VIEs”) or voting interest entities; (2) Eliminate the presumption that a general partner should consolidate a limited partnership; (3) Affect the consolidation analysis of reporting entities that are involved with VIEs, particularly those that have fee arrangements and related party relationships; and (4) Provide a scope exception from consolidation guidance for reporting entities with interests in legal entities that are required to comply with or operate in accordance with requirements that are similar to those in Rule 2a-7 of the Investment Company Act of 1940 for registered money market funds. ASU No. 2015-02 is effective for interim and annual reporting periods beginning after December 15, 2015. The Company does not expect ASU 2015-02 to have a significant impact on its financial statements.
In April 2015, the FASB issued ASU No. 2015-05, “Customer’s Accounting for Fees Paid in a Cloud Computing Arrangement.” This ASU provides guidance to customers about whether a cloud computing arrangement includes a software license. If a cloud computing arrangement includes a software license, the customer should account for the software license element of the arrangement consistent with the acquisition of other software licenses. If a cloud computing arrangement does not include a software license, the customer should account for the arrangement as a service contract. The new guidance does not change the accounting for a customer’s accounting for service contracts. ASU No. 2015-05 is effective for interim and annual reporting periods beginning after December 15, 2015. The Company does not expect ASU 2015-05 to have a significant impact on its financial statements.
| 78 |
| First Connecticut Bancorp, Inc. |
| Notes to Consolidated Financial Statements |
In May, 2015, the FASB issued ASU No. 2015-07, “Fair Value Measurement (Topic 820): Disclosures for Investments in Certain Entities That Calculate Net Asset Value per Share (or Its Equivalent)”. This ASU removes the requirement to categorize within the fair value hierarchy all investments for which fair value is measured using the net asset value (“NAV”) per share practical expedient. In addition, this ASU removes the requirement to make certain disclosures for all investments that are eligible to be measured at fair value using the net asset value per share practical expedient. ASU No. 2015-07 is effective for interim and annual reporting periods beginning after December 15, 2015 and which should be applied retrospectively to all periods presented. Earlier application is permitted. The Company does not expect ASU 2015-07 to have a significant impact on its financial statements.
In July 2015, the FASB issued ASU No. 2015-12 “Plan Accounting-Defined Benefit Pension Plans (Topic 960), Defined Contribution Pension Plans (Topic 962), Health and Welfare Benefit Plans (Topic 965)” - "(Part I) Fully Benefit-Responsive Investment Contracts, (Part II) Plan Investment Disclosures, (Part III) Measurement Date Practical Expedient (consensuses of the Emerging Issues Task Force)." This ASU has been issued to (I) designate contract value as the only required measure for fully benefit-responsive investment contracts; (II) simplify and make more effective the investment disclosure requirements under Topic 820 and Topics 960, 962, and 965 for employee benefit plans; and (III) provide a similar measurement date practical expedient for employee benefit plans. ASU No. 2015-07 is effective for interim and annual reporting periods beginning after December 15, 2015 and which should be applied retrospectively to all periods presented. The Company does not expect ASU 2015-12 to have a significant impact on its financial statements.
In August 2015, the FASB issued ASU No. 2015-14 "Revenue from Contracts with Customers (Topic 606)." In May 2014, the FASB issued Accounting Standards Update No. 2014-09, Revenue from Contracts with Customers (Topic 606), with an original effective date for annual reporting periods beginning after December 15, 2016. The core principle of the guidance is that an entity should recognize revenue to depict the transfer of promised goods or services to customers in an amount that reflects the consideration to which the entity expects to be entitled in exchange for those goods and services. ASU 2015-14 deferred the effective date of ASU 2014-09 to annual periods and interim periods within those annual periods beginning after December 15, 2017. The amendments can be applied retrospectively to each prior reporting period or retrospectively with the cumulative effect of initially applying this Update recognized at the date of initial application. Early application is not permitted. The Company is assessing the impact of ASU 2015-14 on its accounting and disclosures.
In January 2016, the FASB issued ASU 2016-01, "Financial Instruments—Overall (Topic 825-10): "Recognition and Measurement of Financial Assets and Financial Liabilities." ASU 2016-01 amends the guidance on the classification and measurement of financial instruments. Some of the amendments in ASU 2016-01 include the following: 1) requires equity investments (except those accounted for under the equity method of accounting or those that result in consolidation of the investee) to be measured at fair value with changes in fair value recognized in net income; 2) simplifies the impairment assessment of equity investments without readily determinable fair values by requiring a qualitative assessment to identify impairment; 3) requires public business entities to use the exit price notion when measuring the fair value of financial instruments for disclosure purposes; and 4) requires an entity to present separately in other comprehensive income the portion of the total change in the fair value of a liability resulting from a change in the instrument-specific credit risk when the entity has elected to measure the liability at fair value; among others. For public business entities, the amendments of ASU 2016-01 are effective for fiscal years beginning after December 15, 2017, including interim periods within those fiscal years. The Company is assessing the impact of ASU 2016-01 on its accounting and disclosures.
| 79 |
| First Connecticut Bancorp, Inc. |
| Notes to Consolidated Financial Statements |
In February 2016, the FASB issued ASU No. 2016-02 "Leases (Topic 842)." ASU 2016-02 supersedes Topic 840, Leases. This ASU is to increase transparency and comparability among organizations by recognizing lease assets and lease liabilities on the balance sheet and disclosing key information about leasing arrangements. Some of the provisions in ASU 2016-02 include the following: 1) requires lessees to recognize a right-of-use asset and a lease liability for virtually all of their leases (other than leases that meet the definition of a short-term lease), 2) requires lessor accounting to be updated to align with certain changes to the lessee model and the new revenue recognition standard, 3) an arrangement contains an embedded lease if property, plant, or equipment is explicitly or implicitly identified and its use is controlled by the customer, 4) in certain circumstances, the lessee is required to remeasure the lease payments, and 5) requires extensive quantitative and qualitative disclosures, including significant judgments made by management, will be required to provide greater insight into the extent of revenue and expense recognized and expected to be recognized from existing contracts. For public business entities, ASU 2016-02 is effective for fiscal years beginning after December 15, 2018, including interim periods within those fiscal years. The Company is assessing the impact of ASU 2016-02 on its accounting and disclosures.
| 2. | Restrictions on Cash and Due from Banks |
The Company is required to maintain a percentage of transaction account balances on deposit in non-interest-earning reserves with the Federal Reserve Bank, offset by the Company’s average vault cash. The Company also is required to maintain cash balances to collateralize the Company’s position with certain third parties. The Company had cash and liquid assets of approximately $17.7 million and $10.1 million to meet these requirements at December 31, 2015 and 2014, respectively.
| 3. | Earnings Per Share |
The following table sets forth the calculation of basic and diluted earnings per share:
| For the Years Ended December 31, | ||||||||||||
| 2015 | 2014 | 2013 | ||||||||||
| (Dollars in thousands, except per share data): | ||||||||||||
| Net income | $ | 12,579 | $ | 9,335 | $ | 3,704 | ||||||
| Less: Dividends to participating shares | (41 | ) | (55 | ) | (56 | ) | ||||||
| Income allocated to participating shares | (135 | ) | (161 | ) | (55 | ) | ||||||
| Net income allocated to common stockholders | $ | 12,403 | $ | 9,119 | $ | 3,593 | ||||||
| Weighted-average shares issued | 17,996,918 | 18,025,893 | 18,059,089 | |||||||||
| Less: Average unallocated ESOP shares | (1,005,011 | ) | (1,100,393 | ) | (1,195,730 | ) | ||||||
| Average treasury stock | (2,048,101 | ) | (1,886,168 | ) | (1,118,785 | ) | ||||||
| Average unvested restricted stock | (217,199 | ) | (357,185 | ) | (491,153 | ) | ||||||
| Weighted-average basic shares outstanding | 14,726,607 | 14,682,147 | 15,253,421 | |||||||||
| Plus: Average dilutive shares | 223,047 | 111,199 | 16,791 | |||||||||
| Weighted-average diluted shares outstanding | 14,949,654 | 14,793,346 | 15,270,212 | |||||||||
| Net earnings per share (1): | ||||||||||||
| Basic | $ | 0.84 | $ | 0.62 | $ | 0.24 | ||||||
| Diluted | $ | 0.83 | $ | 0.62 | $ | 0.24 | ||||||
(1) Certain per share amounts may not appear to reconcile due to rounding.
For the years ended December 31, 2015, 2014 and 2013, respectively, 78,500, 72,250 and 26,750 options were anti-dilutive and therefore excluded from the earnings per share calculation.
| 80 |
| First Connecticut Bancorp, Inc. |
| Notes to Consolidated Financial Statements |
| 4. | Investment Securities |
Investment securities are summarized as follows:
| December 31, 2015 | ||||||||||||||||||||||||||||
| Recognized in OCI | Not Recognized in OCI | |||||||||||||||||||||||||||
| Gross | Gross | Gross | Gross | |||||||||||||||||||||||||
| Amortized | Unrealized | Unrealized | Carrying | Unrealized | Unrealized | Fair | ||||||||||||||||||||||
| (Dollars in thousands) | Cost | Gains | Losses | Value | Gains | Losses | Value | |||||||||||||||||||||
| Available-for-sale | ||||||||||||||||||||||||||||
| Debt securities: | ||||||||||||||||||||||||||||
| U.S. Treasury obligations | $ | 38,782 | $ | 83 | $ | (6 | ) | $ | 38,859 | $ | - | $ | - | $ | 38,859 | |||||||||||||
| U.S. Government agency obligations | 82,002 | 43 | (240 | ) | 81,805 | - | - | 81,805 | ||||||||||||||||||||
| Government sponsored residential mortgage-backed securities | 4,958 | 195 | - | 5,153 | - | - | 5,153 | |||||||||||||||||||||
| Corporate debt securities | 1,000 | 48 | - | 1,048 | - | - | 1,048 | |||||||||||||||||||||
| Preferred equity securities | 2,000 | - | (368 | ) | 1,632 | - | - | 1,632 | ||||||||||||||||||||
| Marketable equity securities | 108 | 54 | (2 | ) | 160 | - | - | 160 | ||||||||||||||||||||
| Mutual funds | 3,957 | - | (190 | ) | 3,767 | - | - | 3,767 | ||||||||||||||||||||
| Total securities available-for-sale | $ | 132,807 | $ | 423 | $ | (806 | ) | $ | 132,424 | $ | - | $ | - | $ | 132,424 | |||||||||||||
| Held-to-maturity | ||||||||||||||||||||||||||||
| U.S. Government agency obligations | $ | 24,000 | $ | - | $ | - | $ | 24,000 | $ | 28 | $ | (20 | ) | 24,008 | ||||||||||||||
| Government sponsored residential mortgage-backed securities | 8,246 | - | - | 8,246 | 103 | - | 8,349 | |||||||||||||||||||||
| Total securities held-to-maturity | $ | 32,246 | $ | - | $ | - | $ | 32,246 | $ | 131 | $ | (20 | ) | $ | 32,357 | |||||||||||||
| December 31, 2014 | ||||||||||||||||||||||||||||
| Recognized in OCI | Not Recognized in OCI | |||||||||||||||||||||||||||
| Gross | Gross | Gross | Gross | |||||||||||||||||||||||||
| Amortized | Unrealized | Unrealized | Carrying | Unrealized | Unrealized | Fair | ||||||||||||||||||||||
| (Dollars in thousands) | Cost | Gains | Losses | Value | Gains | Losses | Value | |||||||||||||||||||||
| Available-for-sale | ||||||||||||||||||||||||||||
| Debt securities: | ||||||||||||||||||||||||||||
| U.S. Treasury obligations | $ | 123,739 | $ | 81 | $ | (4 | ) | $ | 123,816 | $ | - | $ | - | $ | 123,816 | |||||||||||||
| U.S. Government agency obligations | 49,013 | 110 | (14 | ) | 49,109 | - | - | 49,109 | ||||||||||||||||||||
| Government sponsored residential mortgage-backed securities | 6,624 | 283 | - | 6,907 | - | - | 6,907 | |||||||||||||||||||||
| Corporate debt securities | 1,000 | 85 | - | 1,085 | - | - | 1,085 | |||||||||||||||||||||
| Trust preferred debt securities | - | 1,557 | - | 1,557 | - | - | 1,557 | |||||||||||||||||||||
| Preferred equity securities | 2,100 | 2 | (426 | ) | 1,676 | - | - | 1,676 | ||||||||||||||||||||
| Marketable equity securities | 108 | 63 | (1 | ) | 170 | - | - | 170 | ||||||||||||||||||||
| Mutual funds | 3,838 | - | (117 | ) | 3,721 | - | - | 3,721 | ||||||||||||||||||||
| Total securities available-for-sale | $ | 186,422 | $ | 2,181 | $ | (562 | ) | $ | 188,041 | $ | - | $ | - | $ | 188,041 | |||||||||||||
| Held-to-maturity | ||||||||||||||||||||||||||||
| U.S. Government agency obligations | $ | 7,000 | $ | - | $ | - | $ | 7,000 | $ | - | $ | (8 | ) | $ | 6,992 | |||||||||||||
| Government sponsored residential mortgage-backed securities | 9,224 | - | - | 9,224 | 200 | - | 9,424 | |||||||||||||||||||||
| Total securities held-to-maturity | $ | 16,224 | $ | - | $ | - | $ | 16,224 | $ | 200 | $ | (8 | ) | $ | 16,416 | |||||||||||||
At December 31, 2015, the net unrealized loss on securities available for sale of $383,000, net of a tax benefit of $135,000 or $249,000, is included in accumulated other comprehensive income. At December 31, 2014, the net unrealized gain on securities available for sale of $1.6 million, net of a tax expense of $575,000 or $1.0 million, is included in accumulated other comprehensive income.
| 81 |
| First Connecticut Bancorp, Inc. |
| Notes to Consolidated Financial Statements |
The following tables summarize gross unrealized losses and fair value, aggregated by investment category and length of time the investments have been in a continuous unrealized loss position at December 31, 2015 and 2014:
| December 31, 2015 | ||||||||||||||||||||||||||||
| Less than 12 Months | 12 Months or More | Total | ||||||||||||||||||||||||||
| Gross | Gross | Gross | ||||||||||||||||||||||||||
| Number of | Fair | Unrealized | Fair | Unrealized | Fair | Unrealized | ||||||||||||||||||||||
| (Dollars in thousands) | Securities | Value | Loss | Value | Loss | Value | Loss | |||||||||||||||||||||
| Available-for-sale: | ||||||||||||||||||||||||||||
| U.S. Treasury obligations | 4 | $ | 19,935 | $ | (6 | ) | $ | - | $ | - | $ | 19,935 | $ | (6 | ) | |||||||||||||
| U.S. Government agency obligations | 7 | 56,762 | (240 | ) | - | - | 56,762 | (240 | ) | |||||||||||||||||||
| Preferred equity securities | 1 | - | - | 1,632 | (368 | ) | 1,632 | (368 | ) | |||||||||||||||||||
| Marketable equity securities | 1 | - | - | 5 | (2 | ) | 5 | (2 | ) | |||||||||||||||||||
| Mutual funds | 1 | - | - | 2,768 | (190 | ) | 2,768 | (190 | ) | |||||||||||||||||||
| 14 | $ | 76,697 | $ | (246 | ) | $ | 4,405 | $ | (560 | ) | $ | 81,102 | $ | (806 | ) | |||||||||||||
| Held-to-maturity | ||||||||||||||||||||||||||||
| U.S. Government agency obligations | 1 | 6,980 | (20 | ) | - | - | 6,980 | (20 | ) | |||||||||||||||||||
| 1 | 6,980 | (20 | ) | - | - | 6,980 | (20 | ) | ||||||||||||||||||||
| Total investment securities in an unrealized loss position | 15 | $ | 83,677 | $ | (266 | ) | $ | 4,405 | $ | (560 | ) | $ | 88,082 | $ | (826 | ) | ||||||||||||
| December 31, 2014 | ||||||||||||||||||||||||||||
| Less than 12 Months | 12 Months or More | Total | ||||||||||||||||||||||||||
| Gross | Gross | Gross | ||||||||||||||||||||||||||
| Number of | Fair | Unrealized | Fair | Unrealized | Fair | Unrealized | ||||||||||||||||||||||
| (Dollars in thousands) | Securities | Value | Loss | Value | Loss | Value | Loss | |||||||||||||||||||||
| Available-for-sale: | ||||||||||||||||||||||||||||
| U.S. Treasury obligations | 4 | $ | 43,919 | $ | (4 | ) | $ | - | $ | - | $ | 43,919 | $ | (4 | ) | |||||||||||||
| U.S. Government agency obligations | 2 | 16,989 | (14 | ) | - | - | 16,989 | (14 | ) | |||||||||||||||||||
| Preferred equity securities | 1 | - | - | 1,574 | (426 | ) | 1,574 | (426 | ) | |||||||||||||||||||
| Marketable equity securities | 1 | - | - | 5 | (1 | ) | 5 | (1 | ) | |||||||||||||||||||
| Mutual funds | 1 | - | - | 2,842 | (117 | ) | 2,842 | (117 | ) | |||||||||||||||||||
| 9 | $ | 60,908 | $ | (18 | ) | $ | 4,421 | $ | (544 | ) | $ | 65,329 | $ | (562 | ) | |||||||||||||
| Held-to-maturity | ||||||||||||||||||||||||||||
| U.S. Government agency obligations | 1 | 6,992 | (8 | ) | - | - | 6,992 | (8 | ) | |||||||||||||||||||
| Total investment securities in an unrealized loss position | 1 | 6,992 | (8 | ) | - | - | 6,992 | (8 | ) | |||||||||||||||||||
| 10 | $ | 67,900 | $ | (26 | ) | $ | 4,421 | $ | (544 | ) | $ | 72,321 | $ | (570 | ) | |||||||||||||
Management believes that no individual unrealized loss as of December 31, 2015 represents an other-than-temporary impairment (“OTTI”), based on its detailed review of the securities portfolio. The Company has no intent to sell nor is it more likely than not that the Company will be required to sell any of the securities in a loss position during the period of time necessary to recover the unrealized losses, which may be until maturity.
The following summarizes the conclusions from our OTTI evaluation for those security types that incurred significant gross unrealized losses greater than twelve months as of December 31, 2015:
Preferred equity securities - The unrealized loss on preferred equity securities in a loss position for 12 months or more relates to one preferred equity security. This investment is in a global financial institution. When estimating the recovery period for securities in an unrealized loss position, management utilizes analyst forecasts, earnings assumptions and other company-specific financial performance metrics. In addition, this assessment incorporates general market data, industry and sector cycles and related trends to determine a reasonable recovery period. Management evaluated the near-term prospects of the issuer in relation to the severity and duration of the impairment. Management concluded that the preferred equity security is not other-than-temporarily impaired at December 31, 2015.
| 82 |
| First Connecticut Bancorp, Inc. |
| Notes to Consolidated Financial Statements |
Mutual funds - The unrealized loss on mutual funds in a loss position for 12 months or more relates to one mutual fund. The fund invests primarily in high quality debt securities and other debt instruments supporting the affordable housing industry in areas of the United States designated by fund shareholders. When estimating the recovery period for securities in an unrealized loss position, management utilizes analyst forecasts, earnings assumptions and other fund-specific financial performance metrics. In addition, this assessment incorporates general market data, industry and sector cycles and related trends to determine a reasonable recovery period. Management evaluated the near-term prospects of the fund in relation to the severity and duration of the impairment. Management concluded that the mutual fund is not other-than-temporarily impaired at December 31, 2015.
The Company recorded no other-than-temporary impairment charges to the investment securities portfolios for the years ended December 31, 2015, 2014 and 2013.
There were gross realized gains on sales of securities available-for-sale totaling $1.5 million, $-0- and $340,000 for the years ended December 31, 2015, 2014 and 2013, respectively.
As of December 31, 2015 and 2014, U.S. Treasury, U.S. Government agency obligations and Government sponsored residential mortgage-backed securities with a fair value of $112.4 million and $127.4 million, respectively, were pledged as collateral for loan derivatives, public funds, repurchase liabilities and repurchase agreement borrowings.
The amortized cost and estimated fair value of debt securities at December 31, 2015 and 2014 by contractual maturity are shown below. Expected maturities may differ from contractual maturities because borrowers may have the right to call or repay obligations with or without call or repayment penalties:
| December 31, 2015 | ||||||||||||||||
| Available-for-Sale | Held-to-Maturity | |||||||||||||||
| Estimated | Estimated | |||||||||||||||
| Amortized | Fair | Amortized | Fair | |||||||||||||
| Cost | Value | Cost | Value | |||||||||||||
| (Dollars in thousands) | ||||||||||||||||
| Due in one year or less | $ | 54,499 | $ | 54,511 | $ | - | $ | - | ||||||||
| Due after one year through five years | 67,285 | 67,201 | 24,000 | 24,008 | ||||||||||||
| Due after five years through ten years | - | - | - | - | ||||||||||||
| Due after ten years | - | - | - | - | ||||||||||||
| Government sponsored residential mortgage-backed securities | 4,958 | 5,153 | 8,246 | 8,349 | ||||||||||||
| $ | 126,742 | $ | 126,865 | $ | 32,246 | $ | 32,357 | |||||||||
| December 31, 2014 | ||||||||||||||||
| Available-for-Sale | Held-to-Maturity | |||||||||||||||
| Estimated | Estimated | |||||||||||||||
| Amortized | Fair | Amortized | Fair | |||||||||||||
| Cost | Value | Cost | Value | |||||||||||||
| (Dollars in thousands) | ||||||||||||||||
| Due in one year or less | $ | 107,010 | $ | 107,008 | $ | - | $ | - | ||||||||
| Due after one year through five years | 59,920 | 60,099 | 7,000 | 6,992 | ||||||||||||
| Due after five years through ten years | 6,822 | 6,903 | - | - | ||||||||||||
| Due after ten years | - | 1,557 | - | - | ||||||||||||
| Government sponsored residential mortgage-backed securities | 6,624 | 6,907 | 9,224 | 9,424 | ||||||||||||
| $ | 180,376 | $ | 182,474 | $ | 16,224 | $ | 16,416 | |||||||||
| 83 |
| First Connecticut Bancorp, Inc. |
| Notes to Consolidated Financial Statements |
Federal Home Loan Bank of Boston (“FHLBB”) Stock
The Company, as a member of the FHLBB, owned $21.7 million and $19.8 million of FHLBB capital stock at December 31, 2015 and 2014, respectively, which is equal to its FHLBB capital stock requirement. The Company evaluated its FHLBB capital stock for potential other-than-temporary impairment at December 31, 2015. Capital adequacy, credit ratings, the value of the stock, overall financial condition of the FHLB system and FHLBB as well as current economic factors was analyzed in the impairment analysis. The Company concluded that its position in FHLBB capital stock is not other-than-temporarily impaired at December 31, 2015.
Alternative Investments
Alternative investments, which totaled $2.5 million and $2.7 million at December 31, 2015 and 2014, respectively, are included in other assets in the accompanying Consolidated Statements of Financial Condition. The Company’s alternative investments include investments in certain non-public funds, which include limited partnerships, an equity fund and membership stocks. These investments are held at cost and were evaluated for potential other-than-temporary impairment at December 31, 2015. The Company recognized a $144,000, $51,000 and $-0- other-than-temporary impairment charge on its limited partnerships for the years ended December 31, 2015, 2014 and 2013, respectively, included in other noninterest income in the accompanying Consolidated Statements of Income. The Company recognized profit distributions in its limited partnerships of $26,000, $75,000 and $91,000 for the years ended December 31, 2015, 2014 and 2013, respectively. See a further discussion of fair value in Note 18 - Fair Value Measurements. The Company has $637,000 in unfunded commitments remaining for its alternative investments as of December 31, 2015.
| 5. | Loans and Allowance for Loan Losses |
Loans consisted of the following:
| December 31, | December 31, | |||||||
| 2015 | 2014 | |||||||
| (Dollars in thousands) | ||||||||
| Real estate: | ||||||||
| Residential | $ | 849,722 | $ | 827,005 | ||||
| Commercial | 887,431 | 765,066 | ||||||
| Construction | 30,895 | 57,371 | ||||||
| Installment | 2,970 | 3,356 | ||||||
| Commercial | 409,550 | 309,708 | ||||||
| Collateral | 1,668 | 1,733 | ||||||
| Home equity line of credit | 174,701 | 169,768 | ||||||
| Revolving credit | 91 | 99 | ||||||
| Resort | 784 | 929 | ||||||
| Total loans | 2,357,812 | 2,135,035 | ||||||
| Net deferred loan costs | 3,984 | 3,842 | ||||||
| Loans | 2,361,796 | 2,138,877 | ||||||
| Allowance for loan losses | (20,198 | ) | (18,960 | ) | ||||
| Loans, net | $ | 2,341,598 | $ | 2,119,917 | ||||
| 84 |
| First Connecticut Bancorp, Inc. |
| Notes to Consolidated Financial Statements |
Changes in the allowance for loan losses by segments are as follows:
| For the Year Ended December 31, 2015 | ||||||||||||||||||||
| Balance at beginning of period | Charge-offs | Recoveries | Provision for (Reduction of) loan losses | Balance at end of period | ||||||||||||||||
| (Dollars in thousands) | ||||||||||||||||||||
| Real estate: | ||||||||||||||||||||
| Residential | $ | 4,382 | $ | (295 | ) | $ | 112 | $ | (115 | ) | $ | 4,084 | ||||||||
| Commercial | 8,949 | (213 | ) | - | 1,519 | 10,255 | ||||||||||||||
| Construction | 478 | - | - | (247 | ) | 231 | ||||||||||||||
| Installment | 41 | (39 | ) | - | 37 | 39 | ||||||||||||||
| Commercial | 3,250 | (318 | ) | 6 | 1,181 | 4,119 | ||||||||||||||
| Collateral | - | - | - | - | - | |||||||||||||||
| Home equity line of credit | 1,859 | (238 | ) | - | (151 | ) | 1,470 | |||||||||||||
| Revolving credit | - | (246 | ) | 29 | 217 | - | ||||||||||||||
| Resort | 1 | - | - | (1 | ) | - | ||||||||||||||
| $ | 18,960 | $ | (1,349 | ) | $ | 147 | $ | 2,440 | $ | 20,198 | ||||||||||
| For the Year Ended December 31, 2014 | ||||||||||||||||||||
| Balance at beginning of period | Charge-offs | Recoveries | Provision for (Reduction of) loan losses | Balance at end of period | ||||||||||||||||
| (Dollars in thousands) | ||||||||||||||||||||
| Real estate: | ||||||||||||||||||||
| Residential | $ | 3,647 | $ | (701 | ) | $ | 58 | $ | 1,378 | $ | 4,382 | |||||||||
| Commercial | 8,253 | (93 | ) | 1 | 788 | 8,949 | ||||||||||||||
| Construction | 1,152 | - | - | (674 | ) | 478 | ||||||||||||||
| Installment | 48 | (4 | ) | - | (3 | ) | 41 | |||||||||||||
| Commercial | 3,746 | (1,066 | ) | 84 | 486 | 3,250 | ||||||||||||||
| Collateral | - | - | - | - | - | |||||||||||||||
| Home equity line of credit | 1,465 | (106 | ) | - | 500 | 1,859 | ||||||||||||||
| Revolving credit | - | (133 | ) | 18 | 115 | - | ||||||||||||||
| Resort | 3 | - | - | (2 | ) | 1 | ||||||||||||||
| $ | 18,314 | $ | (2,103 | ) | $ | 161 | $ | 2,588 | $ | 18,960 | ||||||||||
| For the Year Ended December 31, 2013 | ||||||||||||||||||||
| Balance at beginning of year | Charge-offs | Recoveries | Provision for (Reduction of) loan losses | Balance at end of year | ||||||||||||||||
| (Dollars in thousands) | ||||||||||||||||||||
| Real estate: | ||||||||||||||||||||
| Residential | $ | 3,778 | $ | (430 | ) | $ | 6 | $ | 293 | $ | 3,647 | |||||||||
| Commercial | 8,105 | - | - | 148 | 8,253 | |||||||||||||||
| Construction | 760 | - | - | 392 | 1,152 | |||||||||||||||
| Installment | 77 | - | - | (29 | ) | 48 | ||||||||||||||
| Commercial | 2,654 | (31 | ) | 52 | 1,071 | 3,746 | ||||||||||||||
| Collateral | - | - | - | - | - | |||||||||||||||
| Home equity line of credit | 1,377 | - | - | 88 | 1,465 | |||||||||||||||
| Revolving credit | - | (62 | ) | 20 | 42 | - | ||||||||||||||
| Resort | 456 | - | - | (453 | ) | 3 | ||||||||||||||
| Unallocated | 22 | - | - | (22 | ) | - | ||||||||||||||
| $ | 17,229 | $ | (523 | ) | $ | 78 | $ | 1,530 | $ | 18,314 | ||||||||||
| 85 |
| First Connecticut Bancorp, Inc. |
| Notes to Consolidated Financial Statements |
The following table lists the allocation of the allowance by impairment methodology and by loan segment at December 31, 2015 and 2014:
| December 31, 2015 | December 31, 2014 | |||||||||||||||
| Reserve | Reserve | |||||||||||||||
| (Dollars in thousands) | Total | Allocation | Total | Allocation | ||||||||||||
| Loans individually evaluated for impairment: | ||||||||||||||||
| Real estate: | ||||||||||||||||
| Residential | $ | 12,377 | $ | 139 | $ | 11,791 | $ | 285 | ||||||||
| Commercial | 16,152 | 26 | 19,051 | 233 | ||||||||||||
| Construction | 4,719 | - | 4,719 | - | ||||||||||||
| Installment | 259 | 8 | 251 | 8 | ||||||||||||
| Commercial | 6,023 | 361 | 5,680 | 225 | ||||||||||||
| Collateral | - | - | - | - | ||||||||||||
| Home equity line of credit | 703 | - | 1,031 | - | ||||||||||||
| Revolving credit | - | - | - | - | ||||||||||||
| Resort | 784 | - | 929 | 1 | ||||||||||||
| 41,017 | 534 | 43,452 | 752 | |||||||||||||
| Loans collectively evaluated for impairment: | ||||||||||||||||
| Real estate: | ||||||||||||||||
| Residential | $ | 841,921 | $ | 3,945 | $ | 819,630 | $ | 4,097 | ||||||||
| Commercial | 870,757 | 10,229 | 745,501 | 8,716 | ||||||||||||
| Construction | 26,176 | 231 | 52,652 | 478 | ||||||||||||
| Installment | 2,695 | 31 | 3,093 | 33 | ||||||||||||
| Commercial | 403,473 | 3,758 | 303,980 | 3,025 | ||||||||||||
| Collateral | 1,668 | - | 1,733 | - | ||||||||||||
| Home equity line of credit | 173,998 | 1,470 | 168,737 | 1,859 | ||||||||||||
| Revolving credit | 91 | - | 99 | - | ||||||||||||
| Resort | - | - | - | - | ||||||||||||
| 2,320,779 | 19,664 | 2,095,425 | 18,208 | |||||||||||||
| Total | $ | 2,361,796 | $ | 20,198 | $ | 2,138,877 | $ | 18,960 | ||||||||
| 86 |
| First Connecticut Bancorp, Inc. |
| Notes to Consolidated Financial Statements |
The following is a summary of loan delinquencies at recorded investment values at December 31, 2015 and 2014:
| December 31, 2015 | ||||||||||||||||||||||||||||||||||||
| 30-59 Days | 60-89 Days | > 90 Days | Past Due 90 Days or More | |||||||||||||||||||||||||||||||||
| (Dollars in thousands) | Past Due | Past Due | Past Due | Total | and Still | |||||||||||||||||||||||||||||||
| Number | Amount | Number | Amount | Number | Amount | Number | Amount | Accruing | ||||||||||||||||||||||||||||
| Real estate: | ||||||||||||||||||||||||||||||||||||
| Residential | 18 | $ | 3,379 | 5 | $ | 863 | 15 | $ | 6,304 | 38 | $ | 10,546 | $ | - | ||||||||||||||||||||||
| Commercial | 2 | 318 | - | - | 1 | 994 | 3 | 1,312 | - | |||||||||||||||||||||||||||
| Construction | - | - | - | - | 1 | 187 | 1 | 187 | - | |||||||||||||||||||||||||||
| Installment | 3 | 38 | - | - | - | - | 3 | 38 | - | |||||||||||||||||||||||||||
| Commercial | 4 | 153 | - | - | 2 | 1,752 | 6 | 1,905 | - | |||||||||||||||||||||||||||
| Collateral | 7 | 68 | - | - | 1 | 10 | 8 | 78 | - | |||||||||||||||||||||||||||
| Home equity line of credit | 3 | 280 | 2 | 360 | 2 | 210 | 7 | 850 | - | |||||||||||||||||||||||||||
| Demand | 1 | 29 | - | - | - | - | 1 | 29 | - | |||||||||||||||||||||||||||
| Revolving credit | - | - | - | - | - | - | - | - | - | |||||||||||||||||||||||||||
| Resort | - | - | - | - | - | - | - | - | - | |||||||||||||||||||||||||||
| Total | 38 | $ | 4,265 | 7 | $ | 1,223 | 22 | $ | 9,457 | 67 | $ | 14,945 | $ | - | ||||||||||||||||||||||
| December 31, 2014 | ||||||||||||||||||||||||||||||||||||
| 30-59 Days | 60-89 Days | > 90 Days | Past Due 90 Days or More | |||||||||||||||||||||||||||||||||
| (Dollars in thousands) | Past Due | Past Due | Past Due | Total | and Still | |||||||||||||||||||||||||||||||
| Number | Amount | Number | Amount | Number | Amount | Number | Amount | Accruing | ||||||||||||||||||||||||||||
| Real estate: | ||||||||||||||||||||||||||||||||||||
| Residential | 16 | $ | 3,599 | 6 | $ | 1,263 | 16 | $ | 6,819 | 38 | $ | 11,681 | $ | - | ||||||||||||||||||||||
| Commercial | 2 | 348 | - | - | 3 | 1,979 | 5 | 2,327 | - | |||||||||||||||||||||||||||
| Construction | - | - | - | - | 1 | 187 | 1 | 187 | - | |||||||||||||||||||||||||||
| Installment | 3 | 69 | 2 | 82 | 2 | 33 | 7 | 184 | - | |||||||||||||||||||||||||||
| Commercial | 1 | 40 | 1 | 4 | 7 | 550 | 9 | 594 | - | |||||||||||||||||||||||||||
| Collateral | 9 | 99 | - | - | - | - | 9 | 99 | - | |||||||||||||||||||||||||||
| Home equity line of credit | 3 | 202 | 1 | 349 | 5 | 389 | 9 | 940 | - | |||||||||||||||||||||||||||
| Demand | 1 | 67 | - | - | - | - | 1 | 67 | - | |||||||||||||||||||||||||||
| Revolving credit | - | - | - | - | - | - | - | - | - | |||||||||||||||||||||||||||
| Resort | - | - | - | - | - | - | - | - | - | |||||||||||||||||||||||||||
| Total | 35 | $ | 4,424 | 10 | $ | 1,698 | 34 | $ | 9,957 | 79 | $ | 16,079 | $ | - | ||||||||||||||||||||||
| 87 |
| First Connecticut Bancorp, Inc. |
| Notes to Consolidated Financial Statements |
Nonperforming assets consist of non-accruing loans including non-accruing loans identified as troubled debt restructurings, loans past due more than 90 days and still accruing interest and other real estate owned. The following table lists nonperforming assets at:
| December 31, | December 31, | |||||||
| (Dollars in thousands) | 2015 | 2014 | ||||||
| Nonaccrual loans: | ||||||||
| Real estate: | ||||||||
| Residential | $ | 9,773 | $ | 9,706 | ||||
| Commercial | 1,106 | 2,112 | ||||||
| Construction | 187 | 187 | ||||||
| Installment | 32 | 155 | ||||||
| Commercial | 3,232 | 2,268 | ||||||
| Collateral | 10 | - | ||||||
| Home equity line of credit | 573 | 1,040 | ||||||
| Revolving credit | - | - | ||||||
| Resort | - | - | ||||||
| Total nonaccruing loans | 14,913 | 15,468 | ||||||
| Loans 90 days past due and still accruing | - | - | ||||||
| Other real estate owned | 279 | 400 | ||||||
| Total nonperforming assets | $ | 15,192 | $ | 15,868 | ||||
| 88 |
| First Connecticut Bancorp, Inc. |
| Notes to Consolidated Financial Statements |
The following is a summary of information pertaining to impaired loans at December 31, 2015 and 2014:
| December 31, 2015 | December 31, 2014 | |||||||||||||||||||||||
| Unpaid | Unpaid | |||||||||||||||||||||||
| Recorded | Principal | Related | Recorded | Principal | Related | |||||||||||||||||||
| (Dollars in thousands) | Investment | Balance | Allowance | Investment | Balance | Allowance | ||||||||||||||||||
| Impaired loans without a valuation allowance: | ||||||||||||||||||||||||
| Real estate: | ||||||||||||||||||||||||
| Residential | $ | 11,530 | $ | 12,878 | $ | - | $ | 5,862 | $ | 6,286 | $ | - | ||||||||||||
| Commercial | 13,233 | 13,303 | - | 13,804 | 13,828 | - | ||||||||||||||||||
| Construction | 4,719 | 4,965 | - | 4,719 | 4,965 | - | ||||||||||||||||||
| Installment | 202 | 202 | - | 220 | 232 | - | ||||||||||||||||||
| Commercial | 3,921 | 4,066 | - | 3,527 | 3,584 | - | ||||||||||||||||||
| Collateral | - | - | - | - | - | - | ||||||||||||||||||
| Home equity line of credit | 703 | 719 | - | 1,031 | 1,264 | - | ||||||||||||||||||
| Revolving credit | - | - | - | - | - | - | ||||||||||||||||||
| Resort | 784 | 784 | - | - | - | - | ||||||||||||||||||
| Total | 35,092 | 36,917 | - | 29,163 | 30,159 | - | ||||||||||||||||||
| Impaired loans with a valuation allowance: | ||||||||||||||||||||||||
| Real estate: | ||||||||||||||||||||||||
| Residential | 847 | 881 | 139 | 5,929 | 6,848 | 285 | ||||||||||||||||||
| Commercial | 2,919 | 2,919 | 26 | 5,247 | 5,523 | 233 | ||||||||||||||||||
| Construction | - | - | - | - | - | - | ||||||||||||||||||
| Installment | 57 | 72 | 8 | 31 | 31 | 8 | ||||||||||||||||||
| Commercial | 2,102 | 2,457 | 361 | 2,153 | 2,266 | 225 | ||||||||||||||||||
| Collateral | - | - | - | - | - | - | ||||||||||||||||||
| Home equity line of credit | - | - | - | - | - | - | ||||||||||||||||||
| Revolving credit | - | - | - | - | - | - | ||||||||||||||||||
| Resort | - | - | - | 929 | 929 | 1 | ||||||||||||||||||
| Total | 5,925 | 6,329 | 534 | 14,289 | 15,597 | 752 | ||||||||||||||||||
| Total impaired loans | $ | 41,017 | $ | 43,246 | $ | 534 | $ | 43,452 | $ | 45,756 | $ | 752 | ||||||||||||
| 89 |
| First Connecticut Bancorp, Inc. |
| Notes to Consolidated Financial Statements |
The following table summarizes average recorded investment and interest income recognized on impaired loans:
| For the Year Ended December 31, | ||||||||||||||||||||||||
| 2015 | 2014 | 2013 | ||||||||||||||||||||||
| Average | Interest | Average | Interest | Average | Interest | |||||||||||||||||||
| Recorded | Income | Recorded | Income | Recorded | Income | |||||||||||||||||||
| (Dollars in thousands) | Investment | Recognized | Investment | Recognized | Investment | Recognized | ||||||||||||||||||
| Impaired loans without a valuation allowance: | ||||||||||||||||||||||||
| Real estate: | ||||||||||||||||||||||||
| Residential | $ | 10,621 | $ | 112 | $ | 6,727 | $ | 88 | $ | 5,683 | $ | 28 | ||||||||||||
| Commercial | 13,674 | 575 | 15,159 | 705 | 10,695 | 814 | ||||||||||||||||||
| Construction | 4,719 | 138 | 1,320 | 138 | 237 | - | ||||||||||||||||||
| Installment | 238 | 14 | 198 | 13 | 52 | 13 | ||||||||||||||||||
| Commercial | 4,182 | 110 | 3,791 | 140 | 3,059 | 28 | ||||||||||||||||||
| Collateral | - | - | - | - | - | - | ||||||||||||||||||
| Home equity line of credit | 928 | 4 | 684 | 2 | 491 | - | ||||||||||||||||||
| Demand | - | - | - | - | - | - | ||||||||||||||||||
| Revolving credit | - | - | - | - | - | - | ||||||||||||||||||
| Resort | 827 | 26 | - | - | - | - | ||||||||||||||||||
| Total | 35,189 | 979 | 27,879 | 1,086 | 20,217 | 883 | ||||||||||||||||||
| Impaired loans with a valuation allowance: | ||||||||||||||||||||||||
| Real estate: | ||||||||||||||||||||||||
| Residential | 1,037 | 35 | 5,592 | 41 | 5,872 | 52 | ||||||||||||||||||
| Commercial | 3,504 | 158 | 4,765 | 137 | 8,594 | 147 | ||||||||||||||||||
| Construction | - | - | - | - | 198 | - | ||||||||||||||||||
| Installment | 35 | 1 | 29 | 1 | 27 | 1 | ||||||||||||||||||
| Commercial | 1,682 | 15 | 2,378 | 74 | 3,854 | 66 | ||||||||||||||||||
| Collateral | - | - | - | - | - | - | ||||||||||||||||||
| Home equity line of credit | - | - | - | - | - | - | ||||||||||||||||||
| Demand | - | - | - | - | - | - | ||||||||||||||||||
| Revolving credit | - | - | - | - | - | - | ||||||||||||||||||
| Resort | - | - | 1,035 | 35 | 995 | 47 | ||||||||||||||||||
| Total | 6,258 | 209 | 13,799 | 288 | 19,540 | 313 | ||||||||||||||||||
| Total impaired loans | $ | 41,447 | $ | 1,188 | $ | 41,678 | $ | 1,374 | $ | 39,757 | $ | 1,196 | ||||||||||||
There was no interest income recognized on a cash basis method of accounting for the years ended December 31, 2015, 2014 and 2013.
| 90 |
| First Connecticut Bancorp, Inc. |
| Notes to Consolidated Financial Statements |
The following tables present information on loans whose terms had been modified in a troubled debt restructuring at December 31, 2015 and 2014:
| December 31, 2015 | ||||||||||||||||||||||||
| TDRs on Accrual Status | TDRs on Nonaccrual Status | Total TDRs | ||||||||||||||||||||||
| (Dollars in thousands) | Number of Loans | Recorded Investment | Number of Loans | Recorded Investment | Number of Loans | Recorded Investment | ||||||||||||||||||
| Real estate: | ||||||||||||||||||||||||
| Residential | 14 | $ | 2,242 | 11 | $ | 5,557 | 25 | $ | 7,799 | |||||||||||||||
| Commercial | 4 | 6,664 | - | - | 4 | 6,664 | ||||||||||||||||||
| Construction | 1 | 4,532 | 1 | 187 | 2 | 4,719 | ||||||||||||||||||
| Installment | 4 | 227 | 2 | 32 | 6 | 259 | ||||||||||||||||||
| Commercial | 6 | 2,350 | 8 | 1,482 | 14 | 3,832 | ||||||||||||||||||
| Collateral | - | - | - | - | - | - | ||||||||||||||||||
| Home equity line of credit | 3 | 153 | - | - | 3 | 153 | ||||||||||||||||||
| Revolving credit | - | - | - | - | - | - | ||||||||||||||||||
| Resort | 1 | 784 | - | - | 1 | 784 | ||||||||||||||||||
| Total | 33 | $ | 16,952 | 22 | $ | 7,258 | 55 | $ | 24,210 | |||||||||||||||
| December 31, 2014 | ||||||||||||||||||||||||
| TDRs on Accrual Status | TDRs on Nonaccrual Status | Total TDRs | ||||||||||||||||||||||
| (Dollars in thousands) | Number of Loans | Recorded Investment | Number of Loans | Recorded Investment | Number of Loans | Recorded Investment | ||||||||||||||||||
| Real estate: | ||||||||||||||||||||||||
| Residential | 11 | $ | 1,849 | 10 | $ | 5,608 | 21 | $ | 7,457 | |||||||||||||||
| Commercial | 7 | 8,359 | - | - | 7 | 8,359 | ||||||||||||||||||
| Construction | 1 | 4,532 | 1 | 187 | 2 | 4,719 | ||||||||||||||||||
| Installment | 4 | 212 | 1 | 39 | 5 | 251 | ||||||||||||||||||
| Commercial | 8 | 2,783 | 5 | 1,621 | 13 | 4,404 | ||||||||||||||||||
| Collateral | - | - | - | - | - | - | ||||||||||||||||||
| Home equity line of credit | - | - | 2 | 126 | 2 | 126 | ||||||||||||||||||
| Revolving credit | - | - | - | - | - | - | ||||||||||||||||||
| Resort | 1 | 929 | - | - | 1 | 929 | ||||||||||||||||||
| Total | 32 | $ | 18,664 | 19 | $ | 7,581 | 51 | $ | 26,245 | |||||||||||||||
The recorded investment balance of TDRs approximated $24.2 million and $26.2 million at December 31, 2015 and 2014, respectively. At December 31, 2015 and 2014, the majority of the Company’s TDRs are on accrual status. TDRs on accrual status were $17.0 million and $18.7 million while TDRs on nonaccrual status were $7.3 million and $7.6 million at December 31, 2015 and 2014, respectively. At December 31, 2015, 100% of the accruing TDRs have been performing in accordance with the restructured terms. At December 31, 2015 and 2014, the allowance for loan losses included specific reserves of $340,000 and $592,000 related to TDRs, respectively. For the years ended December 31, 2015 and 2014, the Bank had charge-offs totaling $296,000 and $1.3 million, respectively, related to portions of TDRs deemed to be uncollectible. The Bank may provide additional funds to borrowers in TDR status. The amount of additional funds available to borrowers in TDR status was $272,000 and $206,000 at December 31, 2015 and 2014, respectively.
| 91 |
| First Connecticut Bancorp, Inc. |
| Notes to Consolidated Financial Statements |
The following tables include the recorded investment and number of modifications for modified loans. The Company reports the recorded investment in the loans prior to a modification and also the recorded investment in the loans after the loans were restructured for the years ended December 31, 2015, 2014 and 2013:
| For the Year Ended December 31, 2015 | ||||||||||||
| (Dollars in thousands) | Number of Modifications | Recorded Investment Prior to Modification | Recorded Investment After Modification (1) | |||||||||
| Troubled debt restructurings: | ||||||||||||
| Real estate | ||||||||||||
| Residential | 8 | $ | 1,549 | $ | 1,520 | |||||||
| Commercial | 1 | 493 | 483 | |||||||||
| Installment | 1 | 44 | 40 | |||||||||
| Commercial | 3 | 133 | 128 | |||||||||
| Home equity line of credit | 3 | 153 | 153 | |||||||||
| Total | 16 | $ | 2,372 | $ | 2,324 | |||||||
| For the Year Ended December 31, 2014 | ||||||||||||
| (Dollars in thousands) | Number of Modifications | Recorded Investment Prior to Modification | Recorded Investment After Modification (1) | |||||||||
| Troubled debt restructurings: | ||||||||||||
| Real estate: | ||||||||||||
| Residential | 10 | $ | 1,814 | $ | 1,744 | |||||||
| Construction | 1 | 4,532 | 4,532 | |||||||||
| Installment | 2 | 56 | 55 | |||||||||
| Commercial | 4 | 3,763 | 3,130 | |||||||||
| Total | 17 | $ | 10,165 | $ | 9,461 | |||||||
| For the Year Ended December 31, 2013 | ||||||||||||
| (Dollars in thousands) | Number of Modifications | Recorded Investment Prior to Modification | Recorded Investment After Modification (1) | |||||||||
| Troubled debt restructurings: | ||||||||||||
| Real estate: | ||||||||||||
| Residential | 7 | $ | 1,640 | $ | 1,617 | |||||||
| Commercial | 4 | 2,242 | 2,231 | |||||||||
| Construction | 1 | 187 | 187 | |||||||||
| Installment | 3 | 216 | 215 | |||||||||
| Commercial | 6 | 2,076 | 2,101 | |||||||||
| Home equity line of credit | 3 | 353 | 307 | |||||||||
| Total | 24 | $ | 6,714 | $ | 6,658 | |||||||
| (1) | The period end balances are inclusive of all partial paydowns and charge-offs since the modification date. TDRs fully paid off, charged-off or foreclosed upon by period end are not included. |
| 92 |
| First Connecticut Bancorp, Inc. |
| Notes to Consolidated Financial Statements |
The following tables provide TDR loans that were modified by means of extended maturity, below market adjusted interest rates, a combination of rate and maturity, or by other means including covenant modifications, forbearance and/or the concessions and borrowers discharged in bankruptcy for the years ended December 31, 2015, 2014 and 2013:
| For the Year Ended December 31, 2015 | ||||||||||||||||||||||||
| (Dollars in thousands) | Number of Modifications | Extended Maturity | Adjusted Interest Rates | Combination of Rate and Maturity | Other | Total | ||||||||||||||||||
| Real estate: | ||||||||||||||||||||||||
| Residential | 8 | $ | - | $ | - | $ | - | $ | 1,520 | $ | 1,520 | |||||||||||||
| Commercial | 1 | - | - | - | 483 | 483 | ||||||||||||||||||
| Installment | 1 | - | - | - | 40 | 40 | ||||||||||||||||||
| Commercial | 3 | - | - | 33 | 95 | 128 | ||||||||||||||||||
| Home equity line of credit | 3 | - | - | - | 153 | 153 | ||||||||||||||||||
| Total | 16 | $ | - | $ | - | $ | 33 | $ | 2,291 | $ | 2,324 | |||||||||||||
| For the Year Ended December 31, 2014 | ||||||||||||||||||||||||
| (Dollars in thousands) | Number of Modifications | Extended Maturity | Adjusted Interest Rates | Combination of Rate and Maturity | Other | Total | ||||||||||||||||||
| Real estate: | ||||||||||||||||||||||||
| Residential | 10 | $ | - | $ | - | $ | 224 | $ | 1,520 | $ | 1,744 | |||||||||||||
| Construction | 1 | 4,532 | - | - | - | 4,532 | ||||||||||||||||||
| Installment | 2 | 39 | - | - | 16 | 55 | ||||||||||||||||||
| Commercial | 4 | 2,009 | - | - | 1,121 | 3,130 | ||||||||||||||||||
| Total | 17 | $ | 6,580 | $ | - | $ | 224 | $ | 2,657 | $ | 9,461 | |||||||||||||
| For the Year Ended December 31, 2013 | ||||||||||||||||||||||||
| (Dollars in thousands) | Number of Modifications | Extended Maturity | Adjusted Interest Rates | Combination of Rate and Maturity | Other | Total | ||||||||||||||||||
| Real estate: | ||||||||||||||||||||||||
| Residential | 7 | $ | - | $ | - | $ | 225 | $ | 1,392 | $ | 1,617 | |||||||||||||
| Commercial | 4 | 2,095 | - | - | 136 | 2,231 | ||||||||||||||||||
| Construction | 1 | - | - | - | 187 | 187 | ||||||||||||||||||
| Installment | 3 | - | - | 34 | 181 | 215 | ||||||||||||||||||
| Commercial | 6 | 1,951 | - | - | 150 | 2,101 | ||||||||||||||||||
| Home equity line of credit | 3 | - | - | 14 | 293 | 307 | ||||||||||||||||||
| Total | 24 | $ | 4,046 | $ | - | $ | 273 | $ | 2,339 | $ | 6,658 | |||||||||||||
| 93 |
| First Connecticut Bancorp, Inc. |
| Notes to Consolidated Financial Statements |
A TDR is considered to be in re-default once it is more than 30 days past due following a modification. The following loans defaulted and had been modified as a TDR during the twelve month period preceding the default date during the years ended December 31, 2015, 2014 and 2013.
| For the Year Ended December 31, | ||||||||||||||||||||||||
| 2015 | 2014 | 2013 | ||||||||||||||||||||||
| (Dollars in thousands) | Number of Loans | Recorded Investment (1) | Number of Loans | Recorded Investment (1) | Number of Loans | Recorded Investment (1) | ||||||||||||||||||
| Real estate: | ||||||||||||||||||||||||
| Residential | 1 | $ | 314 | 2 | $ | 662 | - | $ | - | |||||||||||||||
| Commercial | - | - | - | - | 2 | 1,758 | ||||||||||||||||||
| Installment | 1 | 31 | - | - | - | - | ||||||||||||||||||
| Commercial | - | - | 2 | 69 | 2 | 100 | ||||||||||||||||||
| Home equity line of credit | - | - | - | - | 1 | 183 | ||||||||||||||||||
| Total | 2 | $ | 345 | 4 | $ | 731 | 5 | $ | 2,041 | |||||||||||||||
| (1) | The period end balances are inclusive of all partial paydowns and charge-offs since the modification date. TDRs fully paid off, charged-off or foreclosed upon by period end are not included. |
| 94 |
| First Connecticut Bancorp, Inc. |
| Notes to Consolidated Financial Statements |
Credit Quality Information
At the time of loan origination, a risk rating based on a nine point grading system is assigned to each commercial-related loan based on the loan officer’s and management’s assessment of the risk associated with each particular loan. This risk assessment is based on an in depth analysis of a variety of factors. More complex loans and larger commitments require the Company’s internal credit risk management department further evaluate the risk rating of the individual loan or relationship, with credit risk management having final determination of the appropriate risk rating. These more complex loans and relationships receive ongoing periodic review to assess the appropriate risk rating on a post-closing basis with changes made to the risk rating as the borrower’s and economic conditions warrant. The Company’s risk rating system is designed to be a dynamic system and we grade loans on a “real time” basis. The Company places considerable emphasis on risk rating accuracy, risk rating justification, and risk rating triggers. The Company’s risk rating process has been enhanced with its implementation of industry-based risk rating “cards.” The cards are used by the loan officers and promote risk rating accuracy and consistency on an institution-wide basis. Most loans are reviewed annually as part of a comprehensive portfolio review conducted by management and/or by an independent loan review firm. More frequent reviews of loans rated low pass, special mention, substandard and doubtful are conducted by the credit risk management department. The Company utilizes an independent loan review consulting firm to review its rating accuracy and the overall credit quality of its loan portfolio. The review is designed to provide an evaluation of the portfolio with respect to risk rating profile as well as with regard to the soundness of individual loan files. The individual loan reviews include an analysis of the creditworthiness of obligors, via appropriate key ratios and cash flow analysis and an assessment of collateral protection. The consulting firm conducts two loan reviews per year aiming at a 65.0% or higher commercial and industrial loans and commercial real estate portfolio penetration. Summary findings of all loan reviews performed by the outside consulting firm are reported to the board of directors and senior management of the Company upon completion.
The Company utilizes a point risk rating scale as follows:
Risk Rating Definitions
Residential and consumer loans are not rated unless they are 45 days or more delinquent, in which case, depending on past-due days, they will be rated 6, 7 or 8.
| Loans rated 1 – 5, 55: | Commercial loans in these categories are considered “pass” rated loans with low to average risk. | |
| Loans rated 6: | Residential, Consumer and Commercial loans in this category are considered “special mention.” These loans are starting to show signs of potential weakness and are being closely monitored by management. | |
| Loans rated 7: | Loans in this category are considered “substandard.” Generally, a loan is considered substandard if it is inadequately protected by the current net worth and paying capacity of the obligors and/or the collateral pledged. There is a distinct possibility that the Company will sustain some loss if the weakness is not corrected. | |
| Loans rated 8: | Loans in this category are considered “doubtful.” Loans classified as doubtful have all the weaknesses inherent in those classified substandard with the added characteristic that the weaknesses make collection or liquidation in full, on the basis of currently existing facts, highly questionable and improbable. | |
| Loans rated 9: | Loans in this category are considered uncollectible (“loss”) and of such little value that their continuance as loans is not warranted. |
| 95 |
| First Connecticut Bancorp, Inc. |
| Notes to Consolidated Financial Statements |
The following table presents the Company’s loans by risk rating at December 31, 2015 and 2014:
| December 31, 2015 | ||||||||||||||||||||
| (Dollars in thousands) | Pass | Special Mention | Substandard | Doubtful | Total | |||||||||||||||
| Real estate: | ||||||||||||||||||||
| Residential | $ | 838,314 | $ | 1,154 | $ | 10,254 | $ | - | $ | 849,722 | ||||||||||
| Commercial | 867,531 | 10,861 | 9,039 | - | 887,431 | |||||||||||||||
| Construction | 26,176 | - | 4,719 | - | 30,895 | |||||||||||||||
| Installment | 2,886 | 52 | 32 | - | 2,970 | |||||||||||||||
| Commercial | 390,719 | 10,354 | 8,311 | 166 | 409,550 | |||||||||||||||
| Collateral | 1,647 | - | 21 | - | 1,668 | |||||||||||||||
| Home equity line of credit | 173,879 | 229 | 593 | - | 174,701 | |||||||||||||||
| Revolving credit | 91 | - | - | - | 91 | |||||||||||||||
| Resort | 784 | - | - | - | 784 | |||||||||||||||
| Total Loans | $ | 2,302,027 | $ | 22,650 | $ | 32,969 | $ | 166 | $ | 2,357,812 | ||||||||||
| December 31, 2014 | ||||||||||||||||||||
| (Dollars in thousands) | Pass | Special Mention | Substandard | Doubtful | Total | |||||||||||||||
| Real estate: | ||||||||||||||||||||
| Residential | $ | 815,209 | $ | 488 | $ | 11,308 | $ | - | $ | 827,005 | ||||||||||
| Commercial | 741,278 | 12,550 | 11,238 | - | 765,066 | |||||||||||||||
| Construction | 51,947 | 705 | 4,719 | - | 57,371 | |||||||||||||||
| Installment | 3,113 | 41 | 202 | - | 3,356 | |||||||||||||||
| Commercial | 285,185 | 14,754 | 9,557 | 212 | 309,708 | |||||||||||||||
| Collateral | 1,733 | - | - | - | 1,733 | |||||||||||||||
| Home equity line of credit | 168,238 | 302 | 1,228 | - | 169,768 | |||||||||||||||
| Revolving credit | 99 | - | - | - | 99 | |||||||||||||||
| Resort | 929 | - | - | - | 929 | |||||||||||||||
| Total Loans | $ | 2,067,731 | $ | 28,840 | $ | 38,252 | $ | 212 | $ | 2,135,035 | ||||||||||
The Company places considerable emphasis on the early identification of problem assets, problem-resolution and minimizing loss exposure. Delinquency notices are mailed monthly to all delinquent borrowers, advising them of the amount of their delinquency. Residential and consumer lending borrowers are typically given 30 days to pay the delinquent payments or to contact us to make arrangements to bring the loan current over a longer period of time. Generally, if a residential or consumer lending borrower fails to bring the loan current within 90 days from the original due date or to make arrangements to cure the delinquency over a longer period of time, the matter is referred to legal counsel and foreclosure or other collection proceedings are initiated. The Company may consider forbearance or a loan restructuring in certain circumstances where a temporary loss of income is the primary cause of the delinquency, and if a reasonable plan is presented by the borrower to cure the delinquency in a reasonable period of time after his or her income resumes. Problem or delinquent borrowers in our commercial real estate, commercial business and resort portfolios are handled on a case-by-case basis, typically by our Special Assets Department. Appropriate problem-resolution and workout strategies are formulated based on the specific facts and circumstances.
| 96 |
| First Connecticut Bancorp, Inc. |
| Notes to Consolidated Financial Statements |
| 6. | Mortgage Servicing Rights |
The Company services residential real estate mortgage loans that it has sold without recourse to third parties. The carrying value of mortgage servicing rights was $4.4 million and $3.3 million at December 31, 2015 and 2014, respectively, and the balance is included in prepaid expenses and other assets in the accompanying Consolidated Statements of Financial Condition. The fair value of mortgage servicing rights approximated $5.0 million and $3.6 million at December 31, 2015 and 2014, respectively. Total loans sold with servicing rights retained were $165.5 million, $67.3 million and $158.5 million for the years ended December 31, 2015, 2014 and 2013, respectively. The net gain on loans sold totaled $2.5 million, $1.4 million and $4.8 million for the years ended December 31, 2015, 2014 and 2013, respectively, and is included in the accompanying Consolidated Statements of Income.
The principal balance of loans serviced for others, which are not included in the accompanying Consolidated Statements of Financial Condition, totaled $457.5 million, $335.2 million and $299.0 million at December 31, 2015, 2014 and 2013, respectively. Loan servicing fees for others totaling $932,000, $781,000 and $608,000 for the years ended December 31, 2015, 2014 and 2013, respectively, are included as a component of other noninterest income in the accompanying Consolidated Statements of Income.
| 7. | Premises and Equipment |
The following is a summary of the premises and equipment accounts:
| As of December 31, | ||||||||
| 2015 | 2014 | |||||||
| (Dollars in thousands) | ||||||||
| Land | $ | 1,326 | $ | 1,326 | ||||
| Premises and leasehold improvements | 19,314 | 18,767 | ||||||
| Furniture and equipment | 15,280 | 14,215 | ||||||
| Software | 4,846 | 4,605 | ||||||
| 40,766 | 38,913 | |||||||
| Less: accumulated depreciation and amortization | (22,201 | ) | (20,040 | ) | ||||
| $ | 18,565 | $ | 18,873 | |||||
For the years ended December 31, 2015, 2014 and 2013 depreciation and amortization expense was $2.6 million, $3.1 million and $3.1 million, respectively.
| 8. | Credit Arrangements |
The Company has access to a pre-approved line of credit with the Federal Home Loan Bank of Boston (“FHLBB”) for $8.8 million, which was undrawn at December 31, 2015 and 2014. The Company has access to pre-approved unsecured lines of credit with financial institutions totaling $45.0 million and $20.0 million, which were undrawn at December 31, 2015 and 2014, respectively. The Company has access to a $3.5 million unsecured line of credit agreement with a bank which expires on August 31, 2016. The line was undrawn at December 31, 2015 and 2014. The Company maintains a cash balance of $512,500 with certain financial institutions to avoid fees associated with the lines.
In accordance with an agreement with the FHLBB, the Company is required to maintain qualified collateral, as defined in the FHLBB Statement of Credit Policy, free and clear of liens, pledges and encumbrances, as collateral for the advances, if any, and the preapproved line of credit. The Company is in compliance with these collateral requirements.
| 97 |
| First Connecticut Bancorp, Inc. |
| Notes to Consolidated Financial Statements |
FHLBB advances totaled $377.6 million and $401.7 million at December 31, 2015 and 2014, respectively. Advances from the FHLBB are collateralized by first residential and commercial mortgages and home equity lines of credit with an estimated eligible collateral value of $1.3 billion and $812.8 million at December 31, 2015 and 2014, respectively. The Company had available borrowings of $407.8 million and $122.5 million at December 31, 2015 and 2014, respectively, subject to collateral requirements of the FHLBB. The Company also had letters of credit of $63.0 million and $22.0 million at December 31, 2015 and 2014, respectively, subject to collateral requirements of the FHLBB. The Company is required to acquire and hold shares of capital stock in the FHLBB in an amount at least equal to the sum of 0.35% of the aggregate principal amount of its unpaid residential mortgage loans and similar obligations at the beginning of each year, or up to 4.5% of its advances (borrowings) from the FHLBB. The carrying value of FHLBB stock approximates fair value based on the redemption provisions of the stock.
FHLBB advances and the weighted average interest rates at December 31, 2015 and 2014 consist of the following:
| December 31, | ||||||||||||||||
| 2015 | 2014 | |||||||||||||||
| Amount | Weighted Average Rate | Amount | Weighted Average Rate | |||||||||||||
| (Dollars in thousands) | ||||||||||||||||
| 2015 | $ | - | - | % | $ | 290,000 | 0.41 | % | ||||||||
| 2016 | 157,000 | 0.46 | - | - | ||||||||||||
| 2017 | 35,000 | 1.23 | 35,000 | 1.23 | ||||||||||||
| 2018 | 50,000 | 1.53 | 20,000 | 1.83 | ||||||||||||
| 2019 | 81,600 | 1.74 | 56,700 | 1.82 | ||||||||||||
| 2020 | 40,000 | 1.75 | - | - | ||||||||||||
| Thereafter | 14,000 | 1.90 | - | - | ||||||||||||
| $ | 377,600 | 1.14 | % | $ | 401,700 | 0.75 | % | |||||||||
The Company participates in the Federal Reserve Bank’s discount window loan collateral program that enables the Company to borrow up to $63.2 million and $71.0 million on an overnight basis at December 31, 2015 and 2014, respectively, and was undrawn as of December 31, 2015 and 2014. The funding arrangement was collateralized by $136.6 million and $141.6 million in pledged commercial real estate loans as of December 31, 2015 and 2014, respectively.
The Bank has a Master Repurchase Agreement borrowing facility with a broker. Borrowings under the Master Repurchase Agreement are secured by the Company’s investments in certain securities with a fair value of $11.3 million and $23.0 million at December 31, 2015 and 2014, respectively. Outstanding borrowings totaled $10.5 million and $21.0 million at December 31, 2015 and 2014, respectively.
Outstanding borrowings are as follows:
| (Dollars in thousands) | December 31, | |||||||||||||
| Advance Date | Interest Rate | Maturity Date | 2015 | 2014 | ||||||||||
| March 13, 2008 | 3.34 | % | 3/13/2018 | $ | 6,000 | $ | 6,000 | |||||||
| March 13, 2008 | 3.93 | % | 3/13/2018 | 4,500 | 4,500 | |||||||||
| March 13, 2008 | 3.16 | % | 3/13/2015 | - | 10,500 | |||||||||
| $ | 10,500 | $ | 21,000 | |||||||||||
| 98 |
| First Connecticut Bancorp, Inc. |
| Notes to Consolidated Financial Statements |
The Bank offers overnight repurchase liability agreements to commercial or municipal customers whose excess deposit account balances are swept daily into collateralized repurchase liability accounts. The overnight repurchase liability agreements do not contain master netting arrangements. The Bank had repurchase liabilities outstanding of $35.8 million and $49.0 million at December 31, 2015 and 2014, respectively. They are secured by the Company’s investment in specific issues of U.S. Treasury obligations, Government sponsored residential mortgage-backed securities and U.S. Government agency obligations with a market value of $40.4 million and $74.4 million as of December 31, 2015 and 2014, respectively.
| 9. | Deposits |
Deposit balances and weighted average interest rates at December 31, 2015 and 2014 are as follows:
| As of December 31, | ||||||||||||||||
| 2015 | 2014 | |||||||||||||||
| Amount | Rate | Amount | Rate | |||||||||||||
| (Dollars in thousands) | ||||||||||||||||
| Noninterest-bearing demand deposits | $ | 401,388 | $ | 330,524 | ||||||||||||
| Interest-bearing | ||||||||||||||||
| NOW accounts | 468,054 | 0.29 | % | 355,412 | 0.26 | % | ||||||||||
| Money market | 460,737 | 0.79 | % | 470,991 | 0.74 | % | ||||||||||
| Savings accounts | 220,389 | 0.11 | % | 210,892 | 0.10 | % | ||||||||||
| Time deposits | 440,790 | 1.03 | % | 365,222 | 0.91 | % | ||||||||||
| Total interest-bearing deposits | 1,589,970 | 0.61 | % | 1,402,517 | 0.55 | % | ||||||||||
| Total deposits | $ | 1,991,358 | $ | 1,733,041 | ||||||||||||
The Company has established a relationship to participate in a reciprocal deposit program with other financial institutions as a service to our customers. This program provides enhanced FDIC insurance to participating customers. The Company also has established a relationship for brokered deposits. There were brokered deposits totaling $44.3 million and $-0- at December 31, 2015 and 2014, respectively.
Time certificates of deposit in denominations of $250,000 or more approximated $89.6 million and $83.4 million at December 31, 2015 and 2014, respectively.
Contractual maturities of time deposits are as follows:
| As of December 31, | ||||||||
| 2015 | 2014 | |||||||
| (Dollars in thousands) | ||||||||
| Less than one year | $ | 267,748 | $ | 239,627 | ||||
| One to two years | 106,002 | 61,338 | ||||||
| Two to three years | 28,245 | 32,961 | ||||||
| Three to four years | 23,228 | 7,668 | ||||||
| Four to five years | 15,567 | 23,628 | ||||||
| $ | 440,790 | $ | 365,222 | |||||
| 99 |
| First Connecticut Bancorp, Inc. |
| Notes to Consolidated Financial Statements |
Interest expense on deposits are as follows:
| For the Year Ended December 31, | ||||||||||||
| 2015 | 2014 | 2013 | ||||||||||
| (Dollars in thousands) | ||||||||||||
| NOW accounts | $ | 1,351 | $ | 976 | $ | 638 | ||||||
| Money market | 3,592 | 3,112 | 2,878 | |||||||||
| Savings accounts | 226 | 205 | 206 | |||||||||
| Time deposits | 4,203 | 3,076 | 3,460 | |||||||||
| Total interest expense | $ | 9,372 | $ | 7,369 | $ | 7,182 | ||||||
| 10. | Pension and Other Postretirement Benefit Plans |
The Company maintains a non-contributory defined-benefit pension plan covering eligible employees hired prior to January 1, 2007.
The Company also maintains a supplemental retirement plan (“supplemental plan”) to provide benefits to certain employees whose calculated benefit under the qualified plan exceeds the Internal Revenue Service limitation.
The Company sponsors two defined benefit postretirement plans that cover eligible employees. One plan provides health (medical and dental) benefits, and the other provides life insurance benefits. The accounting for the health care plan anticipates no future cost-sharing changes. The Company does not advance fund its postretirement plans.
On December 27, 2012, the Company announced it would freeze the non-contributory defined-benefit pension plan and certain defined benefit postretirement plans as of February 28, 2013. All benefits under these plans were frozen as of that date and no additional benefits will accrue.
The measurement date for each plan is the Company’s year end.
The amounts related to the qualified plan and the supplemental plan is reflected in the tables that follow as “Pension Plans.” Both of these plans have projected and accumulated benefit obligations in excess of plan assets.
| 100 |
| First Connecticut Bancorp, Inc. |
| Notes to Consolidated Financial Statements |
The following table sets forth the change in benefit obligation, plan assets and the funded status of the pension plans and other postretirement benefits:
| Pension Plans | Other Postretirement Benefits | |||||||||||||||
| Year Ended December 31, | Year Ended December 31, | |||||||||||||||
| 2015 | 2014 | 2015 | 2014 | |||||||||||||
| (Dollars in thousands) | ||||||||||||||||
| Change in benefit obligation: | ||||||||||||||||
| Benefit obligation at beginning of year | $ | 26,923 | $ | 21,909 | $ | 3,224 | $ | 3,156 | ||||||||
| Service cost | - | - | 75 | 60 | ||||||||||||
| Interest cost | 1,036 | 1,022 | 127 | 146 | ||||||||||||
| Actuarial (gain) loss | (1,689 | ) | 5,009 | (442 | ) | (45 | ) | |||||||||
| Benefits paid | (1,095 | ) | (1,017 | ) | (85 | ) | (92 | ) | ||||||||
| Benefit obligation at end of year | 25,175 | 26,923 | 2,899 | 3,225 | ||||||||||||
| Change in plan assets: | ||||||||||||||||
| Fair value of plan assets at beginning of year | 19,271 | 17,896 | - | - | ||||||||||||
| Actual return on plan assets | (379 | ) | 666 | - | - | |||||||||||
| Employer contributions | 1,226 | 1,726 | 85 | 92 | ||||||||||||
| Benefits paid | (1,095 | ) | (1,017 | ) | (85 | ) | (92 | ) | ||||||||
| Fair value of plan assets at end of year | 19,023 | 19,271 | - | - | ||||||||||||
| Funded status recognized in the statements of condition | $ | (6,152 | ) | $ | (7,652 | ) | $ | (2,899 | ) | $ | (3,225 | ) | ||||
| Accumulated benefit obligation | $ | (25,175 | ) | $ | (26,923 | ) | ||||||||||
The following table presents the amounts recognized in accumulated other comprehensive income that have not yet been recognized as a component of net period benefit cost as of December 31, 2015 and 2014:
| Pension Plans | Other Postretirement Benefits | |||||||||||||||
| Year Ended December 31, | Year Ended December 31, | |||||||||||||||
| 2015 | 2014 | 2015 | 2014 | |||||||||||||
| (Dollars in thousands) | ||||||||||||||||
| Prior service cost | $ | - | $ | - | $ | 155 | $ | 189 | ||||||||
| Actuarial loss | (7,044 | ) | (7,419 | ) | (24 | ) | (326 | ) | ||||||||
| Unrecognized components of net periodic benefit cost in accumulated other comprehensive loss, net of tax | $ | (7,044 | ) | $ | (7,419 | ) | $ | 131 | $ | (137 | ) | |||||
| 101 |
| First Connecticut Bancorp, Inc. |
| Notes to Consolidated Financial Statements |
The following tables set forth the components of net periodic pension and benefit costs for the pension plans and other postretirement plans and other amounts recognized in accumulated other comprehensive loss for the retirement plans and post retirement plans for the years ended December 31, 2015, 2014, and 2013:
| Pension Plans | ||||||||||||
| Year Ended December 31, | ||||||||||||
| 2015 | 2014 | 2013 | ||||||||||
| (Dollars in thousands) | ||||||||||||
| Components of net periodic pension cost: | ||||||||||||
| Service cost | $ | - | $ | - | $ | - | ||||||
| Interest cost | 1,036 | 1,022 | 951 | |||||||||
| Expected return on plan assets | (1,448 | ) | (1,339 | ) | (1,135 | ) | ||||||
| Amortization of unrecognized prior service cost | - | - | - | |||||||||
| Recognized net actuarial loss | 709 | 306 | 573 | |||||||||
| Curtailment charge | - | - | - | |||||||||
| Net periodic pension cost | 297 | (11 | ) | 389 | ||||||||
| Change in Plan Assets and Benefit Obligations | ||||||||||||
| Recognized in Other Comprehensive Income: | ||||||||||||
| Net loss (gain) (1) | 138 | 5,683 | (2,907 | ) | ||||||||
| Amortization of net loss | (709 | ) | (306 | ) | (573 | ) | ||||||
| Amortization of prior service cost | - | - | - | |||||||||
| Curtailment charge | - | - | - | |||||||||
| Total recognized in other comprehensive income | (571 | ) | 5,377 | (3,480 | ) | |||||||
| Total recognized in net periodic pension cost and other comprehensive income | $ | (274 | ) | $ | 5,366 | $ | (3,091 | ) | ||||
| (1) | For the year ended December 31, 2014, the increase in loss was primarily due to the mortality tables being updated from IRS 2013 Combined Static Mortality to SOA RP-2014 Total Dataset Mortality with Scale MP-2014, which better reflected the overall mortality trend in private pension plans in the U.S. and a change in the discount rate. |
| Other Postretirement Benefits | ||||||||||||
| Year Ended December 31, | ||||||||||||
| 2015 | 2014 | 2013 | ||||||||||
| (Dollars in thousands) | ||||||||||||
| Components of net periodic pension cost: | ||||||||||||
| Service cost | $ | 75 | $ | 60 | $ | 101 | ||||||
| Interest cost | 127 | 146 | 128 | |||||||||
| Recognized net loss | 21 | 18 | 42 | |||||||||
| Amortization of unrecognized prior service cost | (50 | ) | (50 | ) | (50 | ) | ||||||
| Curtailment charge | - | - | - | |||||||||
| Net periodic pension cost | 173 | 174 | 221 | |||||||||
| Change in Plan Assets and Benefit Obligations | ||||||||||||
| Recognized in Other Comprehensive Income: | ||||||||||||
| Net gain | (442 | ) | (45 | ) | (310 | ) | ||||||
| Amortization of prior service cost | - | - | - | |||||||||
| Amortization of net loss | (21 | ) | (18 | ) | (42 | ) | ||||||
| Change in prior service costs | 50 | 50 | 50 | |||||||||
| Total recognized in other comprehensive income | (413 | ) | (13 | ) | (302 | ) | ||||||
| Total recognized in net periodic pension cost and other comprehensive income | $ | (240 | ) | $ | 161 | $ | (81 | ) | ||||
| 102 |
| First Connecticut Bancorp, Inc. |
| Notes to Consolidated Financial Statements |
The estimated amounts that will be amortized from accumulated other comprehensive income into net periodic benefit cost over the next fiscal year are as follows:
| (Dollars in thousands) | Pension Plans | Other Post Retirement Benefits | ||||||
| Prior service cost (credit) | $ | - | $ | (50 | ) | |||
| Actuarial loss | 671 | - | ||||||
Assumptions
The following table presents the significant actuarial assumptions used in preparing the required disclosures:
| Pension Benefits | Other Postretirement Benefits | |||||||||||||||
| December 31, | December 31, | |||||||||||||||
| 2015 | 2014 | 2015 | 2014 | |||||||||||||
| Weighted-average assumptions used to determine funding status: | ||||||||||||||||
| Discount rate (1) | 4.35 | % | 3.95 | % | 4.20 | % | 3.85 | % | ||||||||
| Rate of compensation increase * (2) | n/a | n/a | n/a | n/a | ||||||||||||
| Weighted-average assumptions used to determine net periodic pension costs: | ||||||||||||||||
| Discount rate | 3.95 | % | 4.85 | % | 3.85 | % | 4.75 | % | ||||||||
| Expected return on plan assets (2) | 6.00 | % | 7.50 | % | n/a | n/a | ||||||||||
| Rate of compensation increase * (2) | n/a | n/a | n/a | n/a | ||||||||||||
| (1) | Weighted average discount rate for the supplemental retirement plan was 3.80 % and 3.55% for the years ended December 31, 2015 and 2014, respectively. |
| (2) | Rates not applicable to the supplemental retirement plan. | |
| * | The compensation rate increase is not applicable after the Pension Plan freeze on February 28, 2013. |
Health Care Trend Assumptions
| At December 31, | ||||||||
| 2015 | 2014 | |||||||
| Health care cost trend rate assumed for next year | 9.50 | % | 9.50 | % | ||||
| Rate that the cost trend rate gradually declines to | 5.00 | % | 5.00 | % | ||||
| Year that the rate reaches the rate it is assumed to remain at | 2023 | 2023 | ||||||
| 103 |
| First Connecticut Bancorp, Inc. |
| Notes to Consolidated Financial Statements |
Assumed health care cost trend rates have a significant effect on the amounts reported for health care plans. A one-percentage point change in assumed health care cost trend rates would have the following effects:
| Effect of a Change in the Health Care Cost Trend Rates | ||||||||||||||||
| 2015 | 2014 | |||||||||||||||
| One Percentage Point Increase | One Percentage Point Decrease | One Percentage Point Increase | One Percentage Point Decrease | |||||||||||||
| (Dollars in thousands) | ||||||||||||||||
| Effect on total of service and interest components | $ | 11 | $ | (10 | ) | $ | 12 | $ | (10 | ) | ||||||
| Effect on postretirement benefit obligation | 233 | (198 | ) | 294 | (247 | ) | ||||||||||
Discount Rate
The plan’s projected benefit obligation cash flows were discounted to December 31, 2015 based on the spot rates from the “Above the Median” Citigroup Pension Discount Curve. The discount rate model produced a single weighted average discount rate of 4.35% that when used to discount the same plan benefit cash flows, resulted in the same aggregate present value.
Plan Assets
Fair value estimates are made as of a specific point in time based on the characteristics of the financial instruments and relevant market information. In accordance with FASB ASC 820, the fair value estimates are measured within the fair value hierarchy. The hierarchy gives the highest priority to unadjusted quoted prices in active markets for identical assets or liabilities (level 1 measurements) and the lowest priority to unobservable inputs (level 3 measurements).
Basis of Fair Value Measurement
Level 1 — Quoted prices (unadjusted) for identical assets or liabilities in active markets that the entity has the ability to access as of the measurement date.
Level 2 — Significant other observable inputs other than Level 1 prices such as quoted prices for similar assets or liabilities; quoted prices in markets that are not active; or other inputs that are observable or can be corroborated by observable market data.
Level 3 — Significant unobservable inputs that reflect a company’s own assumptions about the assumptions that market participants would use in pricing an asset or liability.
The following is a description of the valuation methodologies used for the pension plan assets measured at fair value, including the general classification of such instruments pursuant to the valuation hierarchy.
Mutual funds: Valued based on the number of shares held at year end at the fund closing price quoted in an active market.
Pooled Separate Accounts (PSA): Valued at its NAV as a practical expedient based on the market value of its underlying investments. If there is no readily available market, its value is the fair value of the underlying investments held in such PSA as determined by the custodian using generally accepted accounting practices and applicable law.
| 104 |
| First Connecticut Bancorp, Inc. |
| Notes to Consolidated Financial Statements |
The fair value of the Company’s pension plan assets at December 31, 2015 and 2014 by asset category are listed in the tables below:
| December 31, 2015 | ||||||||||||||||
| Investments at Fair Value | ||||||||||||||||
| (Dollars in thousands) | Level 1 | Level 2 | Level 3 | Total | ||||||||||||
| Mutual funds: | ||||||||||||||||
| Fixed income | $ | 6,659 | $ | - | $ | - | $ | 6,659 | ||||||||
| Equity | 5,522 | - | - | 5,522 | ||||||||||||
| Pooled separate accounts: | ||||||||||||||||
| Equity separate account | - | 6,136 | - | 6,136 | ||||||||||||
| Money market separate account | - | 3 | - | 3 | ||||||||||||
| High yield separate account | - | 703 | - | 703 | ||||||||||||
| $ | 12,181 | $ | 6,842 | $ | - | $ | 19,023 | |||||||||
| December 31, 2014 | ||||||||||||||||
| Investments at Fair Value | ||||||||||||||||
| (Dollars in thousands) | Level 1 | Level 2 | Level 3 | Total | ||||||||||||
| Mutual funds: | ||||||||||||||||
| Fixed income | $ | 6,680 | $ | - | $ | - | $ | 6,680 | ||||||||
| Equity | 5,307 | - | - | 5,307 | ||||||||||||
| Pooled separate accounts: | ||||||||||||||||
| Equity separate account | - | 5,926 | - | 5,926 | ||||||||||||
| Money market separate account | - | 619 | - | 619 | ||||||||||||
| High yield separate account | - | 739 | - | 739 | ||||||||||||
| $ | 11,987 | $ | 7,284 | $ | - | $ | 19,271 | |||||||||
Investment Strategy and Asset Allocations
Plan assets are to be managed within an ERISA framework so as to provide the greatest probability that the following long-term objectives for the qualified pension plan are met in a prudent manner. The Company recognizes that, for any given time period, the attainment of these objectives is in large part dictated by the returns available from the capital markets in which plan assets are invested.
The asset allocation of plan assets reflects the Company’s long-term return expectations and risk tolerance in meeting the financial objectives of the plan. Plan assets should be adequately diversified by asset class, sector and industry to reduce the downside risk to total plan results over short-term time periods, while providing opportunities for long-term appreciation. The Company’s Human Resource Committee reserves the right to rebalance the assets at any time it deems it to be prudent.
| 105 |
| First Connecticut Bancorp, Inc. |
| Notes to Consolidated Financial Statements |
The Company’s qualified defined benefit pension plan’s weighted-average asset allocations and the Plan’s long-term allocation structure by asset category are as follows:
| Actual Percentage of Fair Value | ||||||||||||
| At December 31, | Target | |||||||||||
| 2015 | 2014 | Allocation | ||||||||||
| High yield and money market funds | 4 | % | 7 | % | 5-15 | % | ||||||
| Equity funds | 61 | % | 58 | % | 30-70 | % | ||||||
| Fixed income funds | 35 | % | 35 | % | 30-70 | % | ||||||
| Total | 100 | % | 100 | % | ||||||||
Expected Contributions
The Company makes contributions to its funded qualified defined benefit plan as required by government regulation or as deemed appropriate by management after considering the fair value of plan assets, expected return on such assets and the present value of the benefit obligation of the plan. The Company does not expect to make a contribution to the qualified defined benefit plan for the year ended December 31, 2016. Since the supplemental plan and the postretirement benefit plans are unfunded, the expected employer contributions for the year ending December 31, 2016 is equal to the Company’s estimated future benefit payment liabilities less any participant contributions.
Expected Benefit Payments
The following is a summary of benefit payments expected to be paid by the non-contributory defined benefit pension plans (dollars in thousands):
| 2016 | $ | 1,181 | ||
| 2017 | 1,202 | |||
| 2018 | 1,197 | |||
| 2019 | 1,263 | |||
| 2020 | 1,302 | |||
| Years 2021 - 2025 | 6,947 | |||
| $ | 13,092 |
The following is a summary of benefit payments expected to be paid by the medical, dental and life insurance plan (dollars in thousands):
| 2016 | $ | 150 | ||
| 2017 | 156 | |||
| 2018 | 153 | |||
| 2019 | 159 | |||
| 2020 | 163 | |||
| Years 2021 - 2025 | 804 | |||
| $ | 1,585 |
401(k) Plan
Employees who have completed six months of service and have attained the age of 21 are eligible to participate in the Company’s defined contribution savings plan (“401(k) plan”). Eligible employees may contribute an unlimited amount (not to exceed IRS limits) of their compensation. The Company may make matching contributions of 100% of the participant’s deferral not to exceed 4% of the participant’s compensation. Contributions by the Company for the years ended December 31, 2015 and 2014 were $814,000 and $763,000, respectively. For the years ended December 31, 2015 and 2014, no discretionary employer contribution was made, which would range from 0% to 11% based on profits and determined by the Board of Directors and management.
| 106 |
| First Connecticut Bancorp, Inc. |
| Notes to Consolidated Financial Statements |
Supplemental Plans
The Company has entered into agreements with certain current and retired executives to provide supplemental retirement benefits. The present values of these future payments, not included in the previous table, are included in accrued expenses and other liabilities in the Statements of Financial Condition. As of December 31 2015 and 2014, the accrued supplemental retirement liability was $3.9 million and $3.3 million, respectively. For the years ended December 31, 2015, 2014 and 2013 net expense for these supplemental retirement benefits were $712,000, $703,000 and $720,000, respectively.
Employee Stock Ownership Plan
The Company established the ESOP to provide eligible employees the opportunity to own Company stock. The Company provided a loan to the Farmington Bank Employee Stock Ownership Plan Trust in the amount needed to purchase up to 1,430,416 shares of the Company’s common stock. The loan bears an interest rate equal to the Wall Street Journal Prime Rate plus one percentage point, adjusted annually, and provides for annual payments of interest and principal over the 15 year term of the loan. At December 31, 2015, the loan had an outstanding balance of $12.0 million and an interest rate of 4.25%. The Bank has committed to make contributions to the ESOP sufficient to support the debt service of the loan. The loan is secured by the unallocated shares purchased. The ESOP compensation expense was $1.5 million, $1.5 million and $1.4 million for the years ended December 31, 2015, 2014 and 2013, respectively.
Shares held by the ESOP include the following as of December 31, 2015:
| Allocated | 381,444 | |||
| Committed to be released | 95,361 | |||
| Unallocated | 953,611 | |||
| 1,430,416 |
The fair value of unallocated ESOP shares was $16.6 million at December 31, 2015.
| 107 |
| First Connecticut Bancorp, Inc. |
| Notes to Consolidated Financial Statements |
| 11. | Stock Incentive Plan |
In August 2012, the Company implemented the First Connecticut Bancorp, Inc. 2012 Stock Incentive Plan (the “Plan”). The Plan provides for a total of 2,503,228 shares of common stock for issuance upon the grant or exercise of awards. The Plan allows for the granting of 1,788,020 non-qualified stock options and 715,208 shares of restricted stock.
In accordance with generally accepted accounting principles for Share-Based Payments, the Company expenses the fair value of all share-based compensation grants over the requisite service periods. Stock options granted vested 20% immediately and will vest 20% at each annual anniversary of the grant date through 2016 and expire ten years after grant date. The Company recognizes compensation expense for the fair values of these awards, which vest on a straight-line basis over the requisite service period of the awards. Restricted shares granted vested 20% immediately and will vest 20% at each annual anniversary of the grant date through 2016. The product of the number of shares granted and the grant date market price of the Company’s common stock determines the fair value of restricted shares under the Company’s restricted stock plan. The Company recognizes compensation expense for the fair value of restricted shares on a straight-line basis over the requisite service period for the entire award.
The Company classifies share-based compensation for employees within “Salaries and employee benefits” and share-based payments for outside directors within “Other operating expenses” in the consolidated statement of operations. For the years ended December 31, 2015, 2014 and 2013, the Company recorded $3.1 million, $2.9 million and $3.6 million of share-based compensation expense, respectively, comprised of $1.3 million, $1.2 million and $1.4 million of stock option expense, respectively and $1.8 million, $1.7 million and $2.2 million of restricted stock expense, respectively. Expected future compensation expense relating to the 359,620 non-vested options outstanding at December 31, 2015, is $855,000 over the remaining weighted-average period of 1.15 years. Expected future compensation expense relating to the 126,290 non-vested restricted shares at December 31, 2015, is $1.0 million over the remaining weighted-average period of 0.68 years.
The fair value of the options awarded is estimated on the date of grant using the Black-Scholes option pricing model that uses the assumptions noted in the following table. Expected volatility is based on the Company’s historical volatility and the historical volatility of a peer group as the Company does not have reliably determined stock price for the period needed that is at least equal to its expected term and the Company’s recent historical volatility may not reflect future expectations. The peer group consisted of financial institutions located in New England and the Mid-Atlantic regions of the United States based on whose common stock is traded on a national securities exchange, asset size, tangible capital ratio and earnings factors. The expected term of options granted is derived from using the simplified method due to the Company not having sufficient historical share option experience upon which to estimate an expected term. The risk-free rate is based on the grant date for a traded zero-coupon U.S. Treasury bond with a term equal to the option’s expected term.
Weighted-average assumptions for the years ended December 31, 2015 and 2014:
| 2015 | 2014 | |||||||
| Weighted per share average fair value of options granted | $ | 3.33 | $ | 3.77 | ||||
| Weighted-average assumptions: | ||||||||
| Risk-free interest rate | 1.61 | % | 1.93 | % | ||||
| Expected volatility | 24.97 | % | 28.20 | % | ||||
| Expected dividend yield | 1.99 | % | 1.89 | % | ||||
| Weighted-average dividend yield | 1.50% - 2.35 | % | 1.09% - 2.51 | % | ||||
| Expected life of options granted | 6.0 years | 6.0 years | ||||||
| 108 |
| First Connecticut Bancorp, Inc. |
| Notes to Consolidated Financial Statements |
The following is a summary of the Company’s stock option activity and related information for its option grants for the year ended December 31, 2015.
| Number of Stock Options | Weighted-Average Exercise Price | Weighted-Average Remaining Contractual Term (in years) | Aggregate Intrinsic Value (in thousands) | |||||||||||||
| Outstanding at December 31, 2014 | 1,671,157 | $ | 13.04 | |||||||||||||
| Granted | 38,000 | 16.26 | ||||||||||||||
| Exercised | (31,600 | ) | 13.04 | |||||||||||||
| Forfeited | (20,200 | ) | 13.49 | |||||||||||||
| Expired | (1,200 | ) | 12.95 | |||||||||||||
| Outstanding at December 31, 2015 | 1,656,157 | $ | 13.11 | 6.48 | $ | 7,095 | ||||||||||
| Exercisable at December 31, 2015 | 1,296,537 | $ | 13.02 | 6.32 | $ | 5,689 | ||||||||||
The total intrinsic value of options exercised during the year ended December 31, 2015 was $81,000.
The following is a summary of the status of the Company’s restricted stock for the year ended December 31, 2015.
| Number of Restricted Stock | Weighted-Average Grant Date Fair Value | |||||||
| Unvested at December 31, 2014 | 266,884 | $ | 12.95 | |||||
| Granted | - | - | ||||||
| Vested | (140,594 | ) | 12.95 | |||||
| Forfeited | - | - | ||||||
| Unvested at December 31, 2015 | 126,290 | $ | 12.95 | |||||
| 109 |
| First Connecticut Bancorp, Inc. |
| Notes to Consolidated Financial Statements |
| 12. | Derivative Financial Instruments |
Non-Hedge Accounting Derivatives/Non-designated Hedges:
The Company does not use derivatives for trading or speculative purposes. Interest rate swap derivatives not designated as hedges are offered to certain qualifying commercial customers and to manage the Company’s exposure to interest rate movements but do not meet the strict hedge accounting under FASB ASC 815, “Derivatives and Hedging”. The interest rate swap agreements enable these customers to synthetically fix the interest rate on variable interest rate loans. The customers pay a variable rate and enter into a fixed rate swap agreement with the Company. The credit risk associated with the interest rate swap derivatives executed with these customers is essentially the same as that involved in extending loans and is subject to the Company’s normal credit policies. The Company obtains collateral, if needed, based upon its assessment of the customers’ credit quality. Generally, interest rate swap agreements are offered to “pass” rated customers requesting long-term commercial loans or commercial mortgages in amounts generally of at least $1.0 million. The interest rate swap agreement with our customers is cross-collateralized by the loan collateral. The interest rate swap agreements do not have any embedded interest rate caps or floors.
For every variable interest rate swap agreement entered into with a commercial customer, the Company simultaneously enters into a fixed rate interest rate swap agreement with a correspondent bank, agreeing to pay a fixed income stream and receive a variable interest rate swap. The Company is party to master netting agreements with its correspondent banks; however, the Company does not offset assets and liabilities for financial statement presentation purposes. The master netting agreements provide for a single net settlement of all swap agreements, as well as collateral, in the event of default on, or termination of, any one contract. Collateral generally in the form of cash is received or posted by the counterparty with the net liability position, in accordance with contract thresholds. As of December 31, 2015, the Company maintained a cash balance of $12.6 million with a correspondent bank to collateralize its position. As of December 31, 2015, the Company has an agreement with a correspondent bank to secure any outstanding receivable in excess of $10.0 million.
Credit-risk-related Contingent Features
The Company’s agreements with its derivative counterparties contain the following provisions:
| · | if the Company defaults on any of its indebtedness, including default where repayment of the indebtedness has not been accelerated by the lender, then the Company could also be declared in default on its derivative obligations; |
| · | if the Company fails to maintain its status as a well/adequately capitalized institution, then the counterparty could terminate the derivative positions, and the Company would be required to settle its obligations under the agreements; |
| · | if the Company fails to maintain a specified minimum leverage ratio, then the Company could be declared in default on its derivative obligations; and |
| · | if a specified event or condition occurs that materially changes the Company’s creditworthiness in an adverse manner, it may be required to fully collateralize its obligations under the derivative instrument. |
The Company is in compliance with the above provisions as of December 31, 2015.
| 110 |
| First Connecticut Bancorp, Inc. |
| Notes to Consolidated Financial Statements |
The Company has established a derivatives policy which sets forth the parameters for such transactions (including underwriting guidelines, rate setting process, maximum maturity, approval and documentation requirements), as well as identifies internal controls for the management of risks related to these hedging activities (such as approval of counterparties, limits on counterparty credit risk, maximum loan amounts, and limits to single dealer counterparties).
The interest rate swap derivatives executed with our customers and our counterparties, are marked to market and are included with prepaid expenses and other assets and accrued expenses and other liabilities on the consolidated Statements of Financial Condition at fair value. The Company had the following outstanding interest rate swaps that were not designated for hedge accounting:
| December 31, 2015 | December 31, 2014 | |||||||||||||||||||||||||
| (Dollars in thousands) | Consolidated Balance Sheet Location | # of Instruments | Notional Amount | Estimated Fair Values | # of Instruments | Notional Amount | Estimated Fair Values | |||||||||||||||||||
| Commercial loan customer interest rate swap position | Other Assets | 60 | $ | 257,693 | $ | 10,564 | 43 | $ | 174,884 | $ | 7,167 | |||||||||||||||
| Commercial loan customer interest rate swap position | Other Liabilities | 6 | 23,411 | (78 | ) | 8 | 27,988 | (431 | ) | |||||||||||||||||
| Counterparty interest rate swap position | Other Liabilities | 66 | 281,104 | (10,599 | ) | 51 | 202,872 | (6,821 | ) | |||||||||||||||||
The Company recorded the changes in the fair value of non-hedge accounting derivatives as a component of other noninterest income except for interest received and paid which is reported in interest income in the accompanying consolidated statements of income as follows:
| Years Ended December 31, | ||||||||||||||||||||||||||||||||||||
| 2015 | 2014 | 2013 | ||||||||||||||||||||||||||||||||||
| Interest Income
Recorded in Interest Income | MTM Gain (Loss) Recorded in Noninterest Income | Net Impact | Interest Income
Recorded in Interest Income | MTM Gain (Loss) Recorded in Noninterest Income | Net Impact | Interest Income
Recorded in Interest Income | MTM (Loss)
Gain Recorded in Noninterest Income | Net Impact | ||||||||||||||||||||||||||||
| (Dollars in thousands) | ||||||||||||||||||||||||||||||||||||
| Commercial loan customer interest rate swap position | $ | (5,301 | ) | $ | 3,397 | $ | (1,904 | ) | $ | (3,704 | ) | $ | 3,929 | $ | 225 | $ | 3,078 | $ | (4,990 | ) | $ | (1,912 | ) | |||||||||||||
| Counterparty interest rate swap position | 5,301 | (3,397 | ) | 1,904 | 3,704 | (3,929 | ) | (225 | ) | (3,078 | ) | 4,990 | 1,912 | |||||||||||||||||||||||
| Total | $ | - | $ | - | $ | - | $ | - | $ | - | $ | - | $ | - | $ | - | $ | - | ||||||||||||||||||
| 111 |
| First Connecticut Bancorp, Inc. |
| Notes to Consolidated Financial Statements |
Mortgage Banking Derivatives
Certain derivative instruments, primarily forward sales of mortgage loans and mortgage-backed securities (“MBS”) are utilized by the Company in its efforts to manage risk of loss associated with its mortgage loan commitments and mortgage loans held for sale. Prior to closing and funding certain single-family residential mortgage loans, an interest-rate lock commitment is generally extended to the borrower. During the period from commitment date to closing date, the Company is subject to the risk that market rates of interest may change. If market rates rise, investors generally will pay less to purchase such loans resulting in a reduction in the gain on sale of the loans or, possibly, a loss. In an effort to mitigate such risk, forward delivery sales commitments, under which the Company agrees to deliver whole mortgage loans to various investors or issue MBS, are established. At December 31, 2015, the notional amount of outstanding rate locks totaled approximately $16.3 million. The notional amount of outstanding commitments to sell residential mortgage loans totaled approximately $17.6 million, which included mandatory forward commitments totaling approximately $13.3 million at December 31 2015. The forward commitments establish the price to be received upon the sale of the related mortgage loan, thereby mitigating certain interest rate risk. There is, however, still certain execution risk specifically related to the Company’s ability to close and deliver to its investors the mortgage loans it has committed to sell.
| 13. | Offsetting of Financial Assets and Liabilities |
The following table presents the remaining contractual maturities of the Company’s repurchase agreement borrowings and repurchase liabilities as of December 31, 2015, disaggregated by the class of collateral pledged.
| December 31, 2015 | ||||||||||||||||
| Remaining Contractual Maturity of the Agreements | ||||||||||||||||
| (Dollars in thousands) | Overnight and Continuous | Up to One Year | One Year to Three Years | Total | ||||||||||||
| Repurchase agreement borrowings | ||||||||||||||||
| U.S. Government agency obligations | $ | - | $ | - | $ | 6,000 | $ | 6,000 | ||||||||
| Government sponsored residential mortgage-backed securities | - | - | 4,500 | 4,500 | ||||||||||||
| Total repurchase agreement borrowings | - | - | 10,500 | 10,500 | ||||||||||||
| Repurchase liabilities | ||||||||||||||||
| U.S. Government agency obligations | 35,769 | - | - | 35,769 | ||||||||||||
| Total repurchase liabilities | 35,769 | - | - | 35,769 | ||||||||||||
| Total | $ | 35,769 | $ | - | $ | 10,500 | $ | 46,269 | ||||||||
The right of setoff for a repurchase agreement resembles a secured borrowing, whereby the collateral pledged by the Company would be used to settle the fair value of the repurchase agreements should the Company be in default (e.g., fail to make an interest payment to the counterparty). The collateral is held by a third party financial institution in the Company's trustee account. The counterparty has the right to sell or repledge the investment securities if the Company defaults. The Company is required by the counterparty to maintain adequate collateral levels. In the event the collateral fair value falls below stipulated levels, the Company will pledge additional securities. The Company closely monitors collateral levels to ensure adequate levels are maintained, while mitigating the potential risk of over-collateralization in the event of counterparty default.
| 112 |
| First Connecticut Bancorp, Inc. |
| Notes to Consolidated Financial Statements |
The following table presents the potential effect of rights of setoff associated with the Company’s recognized financial assets and liabilities at December 31, 2015 and 2014:
| December 31, 2015 | ||||||||||||||||||||||||||||
| Gross Amounts Not Offset in the Statement of Financial Condition | ||||||||||||||||||||||||||||
| Gross Amount of Recognized Assets | Gross Amounts Offset in the Statement of Financial Condition | Net Amounts of Assets Presented in the Statement of Financial Condition | Financial Instruments | Securities Collateral Received | Cash Collateral Received | Net Amount | ||||||||||||||||||||||
| (Dollars in thousands) | ||||||||||||||||||||||||||||
| Interest rate swap derivatives | $ | 10,564 | $ | - | $ | 10,564 | $ | - | $ | - | $ | 10,564 | $ | - | ||||||||||||||
| Total | $ | 10,564 | $ | - | $ | 10,564 | $ | - | $ | - | $ | 10,564 | $ | - | ||||||||||||||
| December 31, 2015 | ||||||||||||||||||||||||||||
| Gross Amounts Not Offset in the Statement of Financial Condition | ||||||||||||||||||||||||||||
| Gross Amount of Recognized Liabilities | Gross Amounts Offset in the Statement of Financial Condition | Net Amounts of Liabilities Presented in the Statement of Financial Condition | Financial Instruments | Securities Collateral Pledged | Cash Collateral Pledged | Net Amount | ||||||||||||||||||||||
| (Dollars in thousands) | ||||||||||||||||||||||||||||
| Interest rate swap derivatives | $ | 10,677 | $ | - | $ | 10,677 | $ | - | $ | - | $ | 10,677 | $ | - | ||||||||||||||
| Repurchase agreement borrowings | 10,500 | - | 10,500 | - | 10,500 | - | - | |||||||||||||||||||||
| Total | $ | 21,177 | $ | - | $ | 21,177 | $ | - | $ | 10,500 | $ | 10,677 | $ | - | ||||||||||||||
| December 31, 2014 | ||||||||||||||||||||||||||||
| Gross Amounts Not Offset in the Statement of Financial Condition | ||||||||||||||||||||||||||||
| Gross Amount of Recognized Assets | Gross Amounts Offset in the Statement of Financial Condition | Net Amounts of Assets Presented in the Statement of Financial Condition | Financial Instruments | Securities Collateral Received | Cash Collateral Received | Net Amount | ||||||||||||||||||||||
| (Dollars in thousands) | ||||||||||||||||||||||||||||
| Interest rate swap derivatives | $ | 7,167 | $ | - | $ | 7,167 | $ | - | $ | - | $ | 6,750 | $ | 417 | ||||||||||||||
| Total | $ | 7,167 | $ | - | $ | 7,167 | $ | - | $ | - | $ | 6,750 | $ | 417 | ||||||||||||||
| December 31, 2014 | ||||||||||||||||||||||||||||
| Gross Amounts Not Offset in the Statement of Financial Condition | ||||||||||||||||||||||||||||
| Gross Amount of Recognized Liabilities | Gross Amounts Offset in the Statement of Financial Condition | Net Amounts of Liabilities Presented in the Statement of Financial Condition | Financial Instruments | Securities Collateral Pledged | Cash Collateral Pledged | Net Amount | ||||||||||||||||||||||
| (Dollars in thousands) | ||||||||||||||||||||||||||||
| Interest rate swap derivatives | $ | 7,252 | $ | - | $ | 7,252 | $ | - | $ | - | $ | 6,750 | $ | 502 | ||||||||||||||
| Repurchase agreement borrowings | 21,000 | - | 21,000 | - | 21,000 | - | - | |||||||||||||||||||||
| Total | $ | 28,252 | $ | - | $ | 28,252 | $ | - | $ | 21,000 | $ | 6,750 | $ | 502 | ||||||||||||||
| 113 |
| First Connecticut Bancorp, Inc. |
| Notes to Consolidated Financial Statements |
| 14. | Income Taxes |
The components of the income tax provision are as follows:
| For the Year Ended December 31, | ||||||||||||
| 2015 | 2014 | 2013 | ||||||||||
| (Dollars in thousands) | ||||||||||||
| Current provision | ||||||||||||
| Federal | $ | 3,864 | $ | 3,470 | $ | 1,480 | ||||||
| State | 100 | 44 | 2 | |||||||||
| 3,964 | 3,514 | 1,482 | ||||||||||
| Deferred provision (benefit) | ||||||||||||
| Federal | 1,780 | (555 | ) | (313 | ) | |||||||
| State | (17 | ) | (132 | ) | - | |||||||
| 1,763 | (687 | ) | (313 | ) | ||||||||
| Total provision for income taxes | $ | 5,727 | $ | 2,827 | $ | 1,169 | ||||||
The following is a reconciliation of the expected federal statutory tax to the income tax provision as reported in the statements of income:
| For the Year Ended December 31, | ||||||||||||
| 2015 | 2014 | 2013 | ||||||||||
| (Dollars in thousands) | ||||||||||||
| Income tax expense at statutory federal tax rate | $ | 6,407 | $ | 4,257 | $ | 1,657 | ||||||
| ESOP | 138 | 123 | 94 | |||||||||
| Death benefits | (133 | ) | - | (37 | ) | |||||||
| Dividends received deduction | (54 | ) | (54 | ) | (52 | ) | ||||||
| State income taxes | 54 | (57 | ) | 1 | ||||||||
| Other - net | 90 | 39 | 30 | |||||||||
| Changes in cash surrender value of life insurance | (453 | ) | (396 | ) | (410 | ) | ||||||
| Impact of tax rate changes | - | (537 | ) | - | ||||||||
| Valuation allowance | 764 | - | - | |||||||||
| Municipal income - net | (1,086 | ) | (548 | ) | (114 | ) | ||||||
| Income tax provision as reported | $ | 5,727 | $ | 2,827 | $ | 1,169 | ||||||
| 114 |
| First Connecticut Bancorp, Inc. |
| Notes to Consolidated Financial Statements |
The components of the Company’s net deferred tax assets are as follows:
| At December 31, | ||||||||
| 2015 | 2014 | |||||||
| (Dollars in thousands) | ||||||||
| Deferred tax assets | ||||||||
| Allowance for loan losses | $ | 7,130 | $ | 6,680 | ||||
| Minimum pension liability and postretirement benefits | 4,832 | 5,139 | ||||||
| Deferred compensation | 2,871 | 2,830 | ||||||
| Charitable contribution carryforward | 1,508 | 1,923 | ||||||
| Stock compensation | 1,933 | 1,542 | ||||||
| Accrued bonus | 1,487 | 1,366 | ||||||
| Other | 1,255 | 1,245 | ||||||
| Other than temporary impairment on securities available-for-sale | 17 | 1,026 | ||||||
| Allowance for off-balance sheet provision | 177 | 155 | ||||||
| Net unrealized loss on securities available-for-sale | 135 | - | ||||||
| Gross deferred tax assets | 21,345 | 21,906 | ||||||
| Valuation reserve | (771 | ) | - | |||||
| Net deferred tax assets | 20,574 | 21,906 | ||||||
| Deferred tax liabilities | ||||||||
| Net origination fees | 2,982 | 2,686 | ||||||
| Other | 1,561 | 1,187 | ||||||
| Fixed assets | 211 | 409 | ||||||
| Accrued pension | 249 | 127 | ||||||
| Bond discount accretion | 128 | 85 | ||||||
| Net unrealized gain on securities available-for-sale | - | 571 | ||||||
| Gross deferred tax liabilities | 5,131 | 5,065 | ||||||
| Net deferred tax assets | 15,443 | 16,841 | ||||||
The allocation of deferred tax expense (benefit) involving items charged to current year income and items charged directly to capital are as follows:
| At December 31, | ||||||||
| 2015 | 2014 | |||||||
| (Dollars in thousands) | ||||||||
| Deferred tax benefit allocated to capital | $ | (365 | ) | $ | (1,270 | ) | ||
| Deferred tax expense (benefit) allocated to income | 1,763 | (687 | ) | |||||
| Total change in deferred taxes | $ | 1,398 | $ | (1,957 | ) | |||
The Company will only recognize a deferred tax asset when, based upon available evidence, realization is more likely than not. At December 31, 2015, the Company recorded a $771,000 valuation allowance against the deferred tax assets. At December 31, 2014, there was no valuation allowance recorded against the deferred tax assets.
| 115 |
| First Connecticut Bancorp, Inc. |
| Notes to Consolidated Financial Statements |
As part of the Plan of Conversion and Reorganization completed on June 29, 2011, the Company contributed shares of Company common stock to the Farmington Bank Community Foundation, Inc. This contribution resulted in a charitable contribution deduction for federal income tax purposes. Use of that charitable contribution deduction is limited under Federal tax law to 10% of federal taxable income without regard to charitable contributions, net operating losses, and dividend received deductions. Annually, a corporation is permitted to carry over to the five succeeding tax years, contributions that exceeded the 10% limitation, but also subject to the maximum annual limitation. As a result, approximately $4.3 million of charitable contribution carryforward remains at December 31, 2015 resulting in a deferred tax asset of approximately $1.5 million. The Company believes it is more likely than not that this carryforward will not be fully utilized before expiration in 2016. Therefore, a $771,000 valuation allowance has been recorded against this deferred tax asset. Some of this charitable contribution carryforward would likely expire unutilized if the Company does not generate sufficient taxable income over the next year. The Company monitors the need for a valuation allowance on a quarterly basis.
During 1999, the Bank formed a subsidiary, Farmington Savings Loan Servicing Inc., which qualifies and operates as a Connecticut passive investment company pursuant to legislation enacted in May 1998. Income earned by a passive investment company is exempt from Connecticut corporation business tax. In addition, dividends paid by Farmington Savings Loan Servicing, Inc. to its parent, Farmington Bank are also exempt from corporation business tax. The Bank expects the passive investment company to earn sufficient income to eliminate Connecticut income taxes in future years. As such, no Connecticut related deferred tax assets or liabilities have been recorded.
The Company has not provided deferred taxes for the tax reserve for bad debts, of approximately $3.4 million, that arose in tax years beginning before 1987 because it is expected that the requirements of Internal Revenue Code Section 593 will be met in the foreseeable future.
There was no interest expense related to uncertain tax positions recognized in income tax for the years ended December 31, 2015, 2014 and 2013.
The Company had no uncertain tax positions as of December 31, 2015. The Company is currently open to audit under the statute of limitations by the Internal Revenue Service and state taxing authorities for the years ended December 31, 2012 through 2015.
| 15. | Lease Commitments |
The Company’s headquarters and certain of the Company’s branch offices are leased under non-cancelable operating leases, which expire at various dates through the year 2033. Various leases have renewal options of up to an additional thirty years. Payments on majority of the leases are subject to an escalating payment schedule.
The future minimum rental commitments as of December 31, 2015 for these leases are as follows:
| (Dollars in thousands) | ||||
| 2016 | $ | 2,624 | ||
| 2017 | 2,711 | |||
| 2018 | 2,728 | |||
| 2019 | 2,384 | |||
| 2020 | 1,092 | |||
| Thereafter | 8,285 | |||
| $ | 19,824 |
Total rental expense for all leases amounted to $3.1 million, $3.0 million and $2.8 million for the years ended December 31, 2015, 2014 and 2013, respectively.
| 116 |
| First Connecticut Bancorp, Inc. |
| Notes to Consolidated Financial Statements |
| 16. | Financial Instruments with Off-Balance Sheet Risk |
The Company is a party to financial instruments with off-balance sheet risk in the normal course of business to meet the financing needs of its customers. These financial instruments include commitments to extend credit and unused lines of credit. Those instruments involve, to varying degrees, elements of credit and interest rate risk in excess of the amount recognized in the consolidated statement of condition. The contract amounts of those instruments reflect the extent of involvement the Company has in particular classes of financial instruments.
The Company’s exposure to credit loss in the event of nonperformance by the other party to the financial instrument for commitments to extend credit is represented by the contractual amount of those instruments. The Company uses the same credit policies in making commitments and conditional obligations as it does for on-balance sheet instruments. Financial instruments whose contract amounts represent credit risk are as follows:
| December 31, | December 31, | |||||||
| 2015 | 2014 | |||||||
| (Dollars in thousands) | ||||||||
| Approved loan commitments | $ | 46,144 | $ | 33,737 | ||||
| Unadvanced portion of construction loans | 44,457 | 41,604 | ||||||
| Unused lines for home equity loans | 204,983 | 173,493 | ||||||
| Unused revolving lines of credit | 365 | 367 | ||||||
| Unused commercial letters of credit | 3,558 | 4,028 | ||||||
| Unused commercial lines of credit | 187,819 | 190,247 | ||||||
| $ | 487,326 | $ | 443,476 | |||||
Financial instruments with off-balance sheet risk had a valuation allowance of $501,000 and $440,000 as of December 31, 2015 and 2014, respectively.
Commitments to extend credit are agreements to lend to a customer as long as there is no violation of any condition established in the contract. Commitments generally have fixed expiration dates or other termination clauses and may require payment of a fee. Since many of the commitments are expected to expire without being drawn upon, the total commitment amounts do not necessarily represent future cash requirements. The Company evaluates each customer’s creditworthiness on a case-by-case basis. The amount of collateral obtained if deemed necessary by the Company upon extension of credit is based on management’s credit evaluation of the counterparty. Collateral held is primarily residential property and commercial assets.
At December 31, 2015 and 2014, the Company had no off-balance sheet special purpose entities and participated in no securitizations of assets.
| 17. | Significant Group Concentrations of Credit Risk |
The Company primarily grants commercial, residential and consumer loans to customers located within its primary market area in the state of Connecticut and western Massachusetts. The majority of the Company’s loan portfolio is comprised of commercial and residential mortgages. The Company has no negative amortization or option adjustable rate mortgage loans.
| 117 |
| First Connecticut Bancorp, Inc. |
| Notes to Consolidated Financial Statements |
| 18. | Fair Value Measurements |
Fair value estimates are made as of a specific point in time based on the characteristics of the financial instruments and relevant market information. In accordance with FASB ASC 820-10, the fair value estimates are measured within the fair value hierarchy. The hierarchy gives the highest priority to unadjusted quoted prices in active markets for identical assets or liabilities (Level 1 measurements) and the lowest priority to unobservable inputs (Level 3 measurements). The three levels of the fair value hierarchy under FASB ASC 820-10 are described as follows:
| · | Level 1 - Unadjusted quoted prices in active markets that are accessible at the measurement date for identical, unrestricted assets or liabilities; |
| · | Level 2 - Quoted prices in markets that are not active, or inputs that are observable either directly or indirectly, for substantially the full term of the asset or liability; |
| · | Level 3 - Prices or valuation techniques that require inputs that are both significant to the fair value measurement and unobservable (i.e., supported by little or no market activity). |
Categorization within the valuation hierarchy is based upon the lowest level of input that is significant to the fair value measurement. When available, quoted market prices are used. In other cases, fair values are based on estimates using present value or other valuation techniques. These techniques involve uncertainties and are significantly affected by the assumptions used and judgments made regarding risk characteristics of various financial instruments, discount rates, and estimates of future cash flows, future expected loss experience and other factors. Changes in assumptions could significantly affect these estimates. Derived fair value estimates cannot be substantiated by comparison to independent markets and, in certain cases, could not be realized in an immediate sale of the instrument.
Fair value estimates are based on existing financial instruments without attempting to estimate the value of anticipated future business and the value of assets and liabilities that are not financial instruments. Accordingly, the aggregate fair value amounts presented do not purport to represent the underlying market value of the Company. There were no transfers between levels during the years ended December 31, 2015 and 2014.
| 118 |
| First Connecticut Bancorp, Inc. |
| Notes to Consolidated Financial Statements |
Assets and Liabilities Measured at Fair Value on a Recurring Basis
The following is a description of the valuation methodologies used for instruments measured at fair value:
Securities Available-for-Sale: Investment securities available-for-sale are recorded at fair value on a recurring basis. Fair value measurement is based upon quoted prices, if available. If quoted prices are not available, fair values are measured using independent pricing models. Level 1 securities are those traded on active markets for identical securities including U.S. treasury obligations, preferred equity securities and marketable equity securities. Level 2 securities include U.S. treasury obligations, U.S. government agency obligations, government-sponsored residential mortgage-backed securities, corporate debt securities, trust preferred debt securities, and mutual funds. When a market is illiquid or there is a lack of transparency around the inputs to valuation, the respective securities are classified as level 3 and reliance is placed upon internally developed models and management judgment and evaluation for valuation. The Company had no Level 3 securities at December 31, 2015 and 2014.
The Company utilizes a third party, nationally-recognized pricing service (“pricing service”); subject to review by management, to estimate fair value measurements for the majority of its investment securities portfolio. The pricing service evaluates each asset class based on relevant market information considering observable data that may include dealer quotes, reported trades, market spreads, cash flows, the U.S. Treasury yield curve, the LIBOR swap yield curve, trade execution data, market prepayment speeds, credit information and the bond’s terms and conditions, among other things. The fair value prices on all investment securities are reviewed for reasonableness by management. Also, management assessed the valuation techniques used by the pricing service based on a review of their pricing methodology to ensure proper pricing and hierarchy classifications. Management employs procedures to monitor the pricing service’s assumptions and establishes processes to challenge the pricing service’s valuations that appear unusual or unexpected.
Interest Rate Swap Derivatives: The fair values of interest rate swap agreements are calculated using a discounted cash flow approach and utilize observable inputs such as the LIBOR swap curve, effective date, maturity date, notional amount, stated interest rate and are classified within Level 2 of the valuation hierarchy. Such derivatives are basic interest rate swaps that do not have any embedded interest rate caps and floors.
Forward loan sale commitments and derivative loan commitments: Forward loan sale commitments and derivative loan commitments are based on fair values of the underlying mortgage loans and the probability of such commitments being exercised. Significant management judgment and estimation is required in determining these fair value measurements therefore are classified within Level 3 of the valuation hierarchy. The Company recognized a gain (loss) of $123,000, ($33,000) and ($441,000) for the years ended December 31, 2015, 2014 and 2013, respectively, included in other noninterest income in the accompanying Consolidated Statements of Income.
| 119 |
| First Connecticut Bancorp, Inc. |
| Notes to Consolidated Financial Statements |
The following tables detail the financial instruments carried at fair value on a recurring basis as of December 31, 2015 and 2014 and indicates the fair value hierarchy of the valuation techniques utilized by the Company to determine the fair value:
| December 31, 2015 | ||||||||||||||||
| Quoted Prices in Active Markets for Identical Assets | Significant Observable Inputs | Significant Unobservable Inputs | ||||||||||||||
| (Dollars in thousands) | Total | (Level 1) | (Level 2) | (Level 3) | ||||||||||||
| Assets | ||||||||||||||||
| U.S. Treasury obligations | $ | 38,859 | $ | 21,996 | $ | 16,863 | $ | - | ||||||||
| U.S. Government agency obligations | 81,805 | - | 81,805 | - | ||||||||||||
| Government sponsored residential mortgage-backed securities | 5,153 | - | 5,153 | - | ||||||||||||
| Corporate debt securities | 1,048 | - | 1,048 | - | ||||||||||||
| Preferred equity securities | 1,632 | 1,632 | - | - | ||||||||||||
| Marketable equity securities | 160 | 160 | - | - | ||||||||||||
| Mutual funds | 3,767 | - | 3,767 | - | ||||||||||||
| Securities available-for-sale | 132,424 | 23,788 | 108,636 | - | ||||||||||||
| Interest rate swap derivative | 10,564 | - | 10,564 | - | ||||||||||||
| Derivative loan commitments | 207 | - | - | 207 | ||||||||||||
| Total | $ | 143,195 | $ | 23,788 | $ | 119,200 | $ | 207 | ||||||||
| Liabilities | ||||||||||||||||
| Interest rate swap derivative | $ | 10,677 | $ | - | $ | 10,677 | $ | - | ||||||||
| Forward loan sales commitments | 70 | - | - | 70 | ||||||||||||
| Total | $ | 10,747 | $ | - | $ | 10,677 | $ | 70 | ||||||||
| December 31, 2014 | ||||||||||||||||
| Quoted Prices in Active Markets for Identical Assets | Significant Observable Inputs | Significant Unobservable Inputs | ||||||||||||||
| (Dollars in thousands) | Total | (Level 1) | (Level 2) | (Level 3) | ||||||||||||
| Assets | ||||||||||||||||
| U.S. Treasury obligations | $ | 123,816 | $ | 123,816 | $ | - | $ | - | ||||||||
| U.S. Government agency obligations | 49,109 | 49,109 | - | - | ||||||||||||
| Government sponsored residential mortgage-backed securities | 6,907 | - | 6,907 | - | ||||||||||||
| Corporate debt securities | 1,085 | - | 1,085 | - | ||||||||||||
| Trust preferred debt securities | 1,557 | - | 1,557 | - | ||||||||||||
| Preferred equity securities | 1,676 | - | 1,676 | - | ||||||||||||
| Marketable equity securities | 170 | 170 | - | - | ||||||||||||
| Mutual funds | 3,721 | - | 3,721 | - | ||||||||||||
| Securities available-for-sale | 188,041 | 173,095 | 14,946 | - | ||||||||||||
| Interest rate swap derivative | 7,167 | - | 7,167 | - | ||||||||||||
| Derivative loan commitments | 40 | - | - | 40 | ||||||||||||
| Total | $ | 195,248 | $ | 173,095 | $ | 22,113 | $ | 40 | ||||||||
| Liabilities | ||||||||||||||||
| Interest rate swap derivative | $ | 7,252 | $ | - | $ | 7,252 | $ | - | ||||||||
| Forward loan sales commitments | 26 | - | - | 26 | ||||||||||||
| Total | $ | 7,278 | $ | - | $ | 7,252 | $ | 26 | ||||||||
| 120 |
| First Connecticut Bancorp, Inc. |
| Notes to Consolidated Financial Statements |
The following table presents additional information about assets measured at fair value for which the Company has utilized Level 3 inputs.
| Derivative and Forward Loan Sales Commitments, Net | ||||||||||||
| For the Year Ended December 31, | ||||||||||||
| 2015 | 2014 | 2013 | ||||||||||
| (Dollars in thousands) | ||||||||||||
| Balance, at beginning of year | $ | 14 | $ | 47 | $ | 488 | ||||||
| Total realized gain (loss): | ||||||||||||
| Included in earnings | 123 | (33 | ) | (441 | ) | |||||||
| Balance, at the end of year | $ | 137 | $ | 14 | $ | 47 | ||||||
The following tables present the valuation methodology and unobservable inputs for Level 3 assets measured at fair value on a recurring basis at December 31, 2015 and 2014:
| December 31, 2015 | ||||||||||||
| Significant | ||||||||||||
| (Dollars in thousands) | Fair Value | Valuation Methodology | Unobservable Inputs | Input | ||||||||
| Derivative and forward loan sales commitments, net | $ | 137 | Adjusted quoted prices in active markets | Embedded servicing value | 1.28 | % | ||||||
| December 31, 2014 | ||||||||||||
| Significant | ||||||||||||
| (Dollars in thousands) | Fair Value | Valuation Methodology | Unobservable Inputs | Input | ||||||||
| Derivative and forward loan sales commitments, net | $ | 14 | Adjusted quoted prices in active markets | Embedded servicing value | 1.07 | % | ||||||
The embedded servicing value represents the value assigned for mortgage servicing rights and based on management’s judgment. When the embedded servicing value increases or decreases there is a direct correlation with fair value.
Assets and Liabilities Measured at Fair Value on a Nonrecurring Basis
Certain assets and liabilities are measured at fair value on a non-recurring basis in accordance with generally accepted accounting principles. These include assets that are measured at the lower of cost or market that were recognized at fair value below cost at the end of the period as well as assets that are not measured at fair value on an ongoing basis but are subject to fair value adjustments in certain circumstances, such as when there is evidence of impairment.
The following table details the financial instruments carried at fair value on a nonrecurring basis at December 31, 2015 and 2014 and indicates the fair value hierarchy of the valuation techniques utilized by the Company to determine the fair value:
| December 31, 2015 | December 31, 2014 | |||||||||||||||||||||||
| Quoted Prices in | Significant | Significant | Quoted Prices in | Significant | Significant | |||||||||||||||||||
| Active Markets for | Observable | Unobservable | Active Markets for | Observable | Unobservable | |||||||||||||||||||
| Identical Assets | Inputs | Inputs | Identical Assets | Inputs | Inputs | |||||||||||||||||||
| (Level 1) | (Level 2) | (Level 3) | (Level 1) | (Level 2) | (Level 3) | |||||||||||||||||||
| (Dollars in thousands) | ||||||||||||||||||||||||
| Impaired loans | $ | - | $ | - | $ | 4,225 | $ | - | $ | - | $ | 1,647 | ||||||||||||
| Other real estate owned | - | - | 279 | - | - | - | ||||||||||||||||||
| 121 |
| First Connecticut Bancorp, Inc. |
| Notes to Consolidated Financial Statements |
The following is a description of the valuation methodologies used for instruments measured on a non-recurring basis:
Mortgage Servicing Rights: A mortgage servicing right asset represents the amount by which the present value of the estimated future net cash flows to be received from servicing loans are expected to more than adequately compensate the Company for performing the servicing. The fair value of servicing rights is estimated using a present value cash flow model. The most important assumptions used in the valuation model are the anticipated rate of the loan prepayments and discount rates. Adjustments are only recorded when the discounted cash flows derived from the valuation model are less than the carrying value of the asset. As such, measurement at fair value is on a nonrecurring basis. Although some assumptions in determining fair value are based on standards used by market participants, some are based on unobservable inputs and therefore are classified in Level 3 of the valuation hierarchy.
Loans Held for Sale: Loans held for sale are accounted for at the lower of cost or market and are considered to be recognized at fair value when recorded at below cost. The fair value of loans held for sale is based on quoted market prices of similar loans sold in conjunction with securitization transactions, adjusted as required for changes in loan characteristics.
Impaired Loans: Impaired loans for which repayment of the loan is expected to be provided solely by the value of the underlying collateral are considered collateral dependent and are valued based on the estimated fair value of such collateral using Level 3 inputs based on customized discounting criteria. As appraisals on impaired loans are not necessarily completed on the period end dates presented in the table above, the fair value information presented may not reflect the actual fair value as of December 31, 2015 and 2014.
Other Real Estate Owned: The Company classifies property acquired through foreclosure or acceptance of deed-in-lieu of foreclosure as other real estate owned in its financial statements. Upon foreclosure, the property securing the loan is written down to fair value less selling costs. The write down is based upon the difference between the appraised value and the book value. Appraisals are based on observable market data such as comparable sales within the real estate market, however assumptions made in determining comparability are unobservable and therefore these assets are classified as Level 3 within the valuation hierarchy. As appraisals on foreclosed real estate are not necessarily completed on the period end dates presented in the table above, the fair value information presented may not reflect the actual fair value as of December 31, 2015 and 2014.
The following tables present the valuation methodology and unobservable inputs for Level 3 assets measured at fair value on a non-recurring basis at December 31, 2015 and 2014:
| December 31, 2015 | ||||||||||||||||
| (Dollars in thousands) | Fair Value | Valuation Methodology | Significant Unobservable Inputs | Range of Inputs | Weighted Average Inputs | |||||||||||
| Impaired loans | $ | 4,225 | Appraisals | Discount for dated appraisal | 5% - 20% | 12.5 | % | |||||||||
| Discount for costs to sell | 8% - 15% | 11.5 | % | |||||||||||||
| Other real estate owned | $ | 279 | Appraisals | Discount for costs to sell | 8% - 15% | 11.5 | % | |||||||||
| Discount for condition | 10% - 30% | 20.0 | % | |||||||||||||
| December 31, 2014 | ||||||||||||||||
| (Dollars in thousands) | Fair Value | Valuation Methodology | Significant Unobservable Inputs | Range of Inputs | Weighted Average Inputs | |||||||||||
| Impaired loans | $ | 1,647 | Appraisals | Discount for dated appraisal | 0% - 20% | 10.0 | % | |||||||||
| Discount for costs to sell | 8% - 15% | 11.5 | % | |||||||||||||
| 122 |
| First Connecticut Bancorp, Inc. |
| Notes to Consolidated Financial Statements |
Disclosures about Fair Value of Financial Instruments
The following methods and assumptions were used by the Company in estimating its fair value disclosure for financial instruments:
Cash and cash equivalents: The carrying amounts reported in the statement of condition for cash and cash equivalents approximate those assets’ fair values.
Investment in Federal Home Loan Bank of Boston (“FHLBB”) stock: FHLBB stock does not have a readily determinable fair value and is assumed to have a fair value equal to its carrying value. Ownership of FHLBB stock is restricted to the FHLBB, and can only be purchased and redeemed at par value.
Alternative Investments: The Company accounts for its percentage ownership of alternative investment funds at cost, subject to impairment testing. These are non-public investments which include limited partnerships, an equity fund and membership stocks. These alternative investments totaled $2.5 million and $2.7 million at December 31, 2015 and 2014, respectively. The Company recognized a $144,000, $51,000 and $-0- other-than-temporary impairment charge on its limited partnerships for the years ended December 31, 2015, 2014 and 2013, respectively, included in other noninterest income in the accompanying Consolidated Statements of Income. The Company recognized profit distributions in its limited partnerships of $26,000, $75,000 and $91,000 for the years ended December 31, 2015, 2014 and 2013, respectively. See a further discussion of fair value in Note 16 - Fair Value Measurements. The Company has $637,000 in unfunded commitments remaining for its alternative investments as of December 31, 2015.
Loans: In general, discount rates used to calculate values for loan products were based on the Company’s pricing at the respective period end and included appropriate adjustments for expected credit losses. A higher discount rate was assumed with respect to estimated cash flows associated with nonaccrual loans. Projected loan cash flows were adjusted for estimated credit losses. However, such estimates made by the Company may not be indicative of assumptions and adjustments that a purchaser of the Company’s loans would seek.
Deposits: The fair values disclosed for demand deposits and savings accounts (e.g., interest and noninterest checking and passbook savings) are, by definition, equal to the amount payable on demand at the reporting date (i.e., their carrying amounts). The carrying amounts for variable-rate, fixed-term certificates of deposit approximate their fair values at the reporting date. Fair values for fixed-rate certificates of deposit are estimated using a discounted cash flow calculation that applies interest rates currently being offered on certificates to a schedule of aggregate expected monthly maturities of time deposits.
Borrowed funds: The fair values for borrowed funds, including FHLBB advances and repurchase borrowings, are estimated using discounted cash flow analysis based on the Company’s current incremental borrowing rate for similar types of agreements.
Repurchase liabilities: Repurchase liabilities represent a short-term customer sweep account product. Because of the short-term nature of these liabilities, the carrying amount approximates its fair value.
| 123 |
| First Connecticut Bancorp, Inc. |
| Notes to Consolidated Financial Statements |
The following presents the carrying amount, fair value, and placement in the fair value hierarchy of the Company’s financial instruments as of December 31, 2015 and 2014. For short-term financial assets such as cash and cash equivalents, the carrying amount is a reasonable estimate of fair value due to the relatively short time between the origination of the instrument and its expected realization.
| December 31, 2015 | December 31, 2014 | |||||||||||||||||
| Estimated | Estimated | |||||||||||||||||
| Fair Value | Carrying | Fair | Carrying | Fair | ||||||||||||||
| Hierarchy Level | Amount | Value | Amount | Value | ||||||||||||||
| (Dollars in thousands) | ||||||||||||||||||
| Financial assets | ||||||||||||||||||
| Securities held-to-maturity | Level 2 | $ | 32,246 | $ | 32,357 | $ | 16,224 | $ | 16,416 | |||||||||
| Securities available-for-sale | See previous table | 132,424 | 132,424 | 188,041 | 188,041 | |||||||||||||
| Loans | Level 3 | 2,361,796 | 2,336,293 | 2,135,035 | 2,130,994 | |||||||||||||
| Loans held-for-sale | Level 2 | 9,637 | 9,686 | 2,417 | 2,469 | |||||||||||||
| Mortgage servicing rights | Level 3 | 4,406 | 5,029 | 3,336 | 3,572 | |||||||||||||
| Federal Home Loan Bank of Boston stock | Level 2 | 21,729 | 21,729 | 19,785 | 19,785 | |||||||||||||
| Alternative investments | Level 3 | 2,508 | 2,409 | 2,694 | 2,695 | |||||||||||||
| Interest rate swap derivatives | Level 2 | 10,564 | 10,564 | 7,167 | 7,167 | |||||||||||||
| Derivative loan commitments | Level 3 | 207 | 207 | 40 | 40 | |||||||||||||
| Financial liabilities | ||||||||||||||||||
| Deposits other than time deposits | Level 1 | 1,550,568 | 1,550,568 | 1,367,819 | 1,367,819 | |||||||||||||
| Time deposits | Level 2 | 440,790 | 444,803 | 365,222 | 368,974 | |||||||||||||
| Federal Home Loan Bank of Boston advances | Level 2 | 377,600 | 376,626 | 401,700 | 400,226 | |||||||||||||
| Repurchase agreement borrowings | Level 2 | 10,500 | 10,539 | 21,000 | 21,669 | |||||||||||||
| Repurchase liabilities | Level 2 | 35,769 | 35,765 | 48,987 | 48,986 | |||||||||||||
| Interest rate swap derivatives | Level 2 | 10,677 | 10,677 | 7,252 | 7,252 | |||||||||||||
| Forward loan sales commitments | Level 3 | 70 | 70 | 26 | 26 | |||||||||||||
| 19. | Regulatory Matters |
The Company and the Bank are subject to various regulatory capital requirements administered by the federal banking agencies. Failure to meet minimum capital requirements can initiate certain mandatory and possibly additional discretionary actions by regulators that, if undertaken, could have a direct material effect on their financial statements.
Under capital adequacy guidelines and the regulatory framework for prompt corrective action, the Company and the Bank must meet specific capital guidelines that involve quantitative measures of their assets, liabilities and certain off-balance sheet items as calculated under regulatory accounting practices. The Company’s and the Bank’s capital amounts and classifications are also subject to quantitative judgments by the regulators about components, risk weightings and other factors.
In July 2013, the Federal Reserve published final rules for the adoption of the Basel III regulatory capital framework (the "Basel III Capital Rules"). The Basel III Capital Rules, among other things, (i) introduced a new capital measure called "Common Equity Tier 1", (ii) specify that Tier 1 capital consists of Common Equity Tier 1 and "Additional Tier 1 Capital" instruments meeting specified requirements, (iii) define Common Equity Tier 1 narrowly by requiring that most deductions/adjustments to regulatory capital measures be made to Common Equity Tier 1 and not to the other components of capital and (iv) expand the scope of the deductions/adjustments as compared to existing regulations and a higher minimum Tier I capital requirement. Additionally, institutions must maintain a capital conservation buffer of common equity Tier 1 capital in an amount greater than 2.5% of total risk-weighted assets to avoid being subject to limitations on capital distributions and discretionary bonus payments to executive officers. The Basel III Capital Rules became effective for the Company beginning on January 1, 2015 with certain transition provisions fully phased in through January 1, 2019.
| 124 |
| First Connecticut Bancorp, Inc. |
| Notes to Consolidated Financial Statements |
Quantitative measures established by regulation to ensure capital adequacy require the Company and the Bank to maintain minimum amounts and ratios (set forth in the table below) of total capital, Tier I capital and common equity Tier I capital (as defined in the regulations) to risk-weighted assets (as defined in the regulations) and of Tier I capital (as defined in the regulations) to average assets (as defined in the regulations).
Management believes, as of December 31, 2015 and December 31, 2014 that the Company and the Bank meet all capital adequacy requirements to which they are subject. The Federal Deposit Insurance Corporation categorizes the Company and the Bank as well capitalized under the regulatory framework for prompt corrective action as of December 31, 2015. To be categorized as well capitalized, the Company and the Bank must maintain minimum total risk-based, Tier I risk-based, common equity Tier I capital and Tier I leverage ratios as set forth in the table. There are no conditions or events since that notification that management believes have changed the institution’s category.
The following table provides information on the capital amounts and ratios for the Company and the Bank:
| Actual | Minimum Required for Capital Adequacy Purposes | To Be Well Capitalized Under Prompt Corrective Action | ||||||||||||||||||||||
| (Dollars in thousands) | Amount | Ratio | Amount | Ratio | Amount | Ratio | ||||||||||||||||||
| Farmington Bank: | ||||||||||||||||||||||||
| At December 31, 2015 | ||||||||||||||||||||||||
| Total Capital (to Risk Weighted Assets) | $ | 236,486 | 11.16 | % | $ | 169,524 | 8.00 | % | $ | 211,905 | 10.00 | % | ||||||||||||
| Tier I Capital (to Risk Weighted Assets) | 215,787 | 10.18 | 127,183 | 6.00 | 169,577 | 8.00 | ||||||||||||||||||
| Common Equity Tier I Capital (to Risk Weighted Assets) | 215,787 | 10.18 | 95,387 | 4.50 | 137,781 | 6.50 | ||||||||||||||||||
| Tier I Leverage Capital (to Average Assets) | 215,787 | 8.03 | 107,490 | 4.00 | 134,363 | 5.00 | ||||||||||||||||||
| At December 31, 2014 | ||||||||||||||||||||||||
| Total Capital (to Risk Weighted Assets) | $ | 220,616 | 11.65 | % | $ | 151,496 | 8.00 | % | $ | 189,370 | 10.00 | % | ||||||||||||
| Tier I Capital (to Risk Weighted Assets) | 201,216 | 10.63 | 75,716 | 4.00 | 113,574 | 6.00 | ||||||||||||||||||
| Tier I Leverage Capital (to Average Assets) | 201,216 | 8.25 | 97,559 | 4.00 | 121,949 | 5.00 | ||||||||||||||||||
| First Connecticut Bancorp, Inc.: | ||||||||||||||||||||||||
| At December 31, 2015 | ||||||||||||||||||||||||
| Total Capital (to Risk Weighted Assets) | $ | 273,255 | 12.88 | % | $ | 169,724 | 8.00 | % | $ | 212,155 | 10.00 | % | ||||||||||||
| Tier I Capital (to Risk Weighted Assets) | 252,556 | 11.91 | 127,232 | 6.00 | 169,643 | 8.00 | ||||||||||||||||||
| Common Equity Tier I Capital (to Risk Weighted Assets) | 252,556 | 11.91 | 95,424 | 4.50 | 137,835 | 6.50 | ||||||||||||||||||
| Tier I Leverage Capital (to Average Assets) | 252,556 | 9.39 | 107,585 | 4.00 | 134,481 | 5.00 | ||||||||||||||||||
| At December 31, 2014 | ||||||||||||||||||||||||
| Total Capital (to Risk Weighted Assets) | $ | 260,157 | 13.73 | % | $ | 151,585 | 8.00 | % | $ | 189,481 | 10.00 | % | ||||||||||||
| Tier I Capital (to Risk Weighted Assets) | 240,757 | 12.70 | 75,829 | 4.00 | 113,743 | 6.00 | ||||||||||||||||||
| Tier I Leverage Capital (to Average Assets) | 240,757 | 9.86 | 97,670 | 4.00 | 122,088 | 5.00 | ||||||||||||||||||
| 125 |
| First Connecticut Bancorp, Inc. |
| Notes to Consolidated Financial Statements |
| 20. | Other Comprehensive Income |
The following table presents the changes in accumulated other comprehensive loss, net of tax by component:
| Investment Securities Available-for-Sale | Employee Benefit Plans | Accumulated Other Comprehensive (Loss) Income | ||||||||||
| (Dollars in thousands) | ||||||||||||
| Balance at December 31, 2012 | $ | 465 | $ | (6,577 | ) | $ | (6,112 | ) | ||||
| Other comprehensive (loss) income during 2013 | (833 | ) | - | (833 | ) | |||||||
| Amount reclassified from accumulated other comprehensive loss, net of tax | 224 | 2,497 | 2,721 | |||||||||
| Net change | (609 | ) | 2,497 | 1,888 | ||||||||
| Balance at December 31, 2013 | (144 | ) | (4,080 | ) | (4,224 | ) | ||||||
| Other comprehensive income (loss) during 2014 | 1,190 | (3,477 | ) | (2,287 | ) | |||||||
| Balance at December 31, 2014 | 1,046 | (7,557 | ) | (6,511 | ) | |||||||
| Other comprehensive (loss) income during 2015 | (2,281 | ) | - | (2,281 | ) | |||||||
| Amount reclassified from accumulated other comprehensive loss, net of tax | 986 | 644 | 1,630 | |||||||||
| Balance at December 31, 2015 | $ | (249 | ) | $ | (6,913 | ) | $ | (7,162 | ) | |||
The following table presents a reconciliation of the changes in components of other comprehensive (loss) income for years indicated, including the amount of income tax expense allocated to each component of other comprehensive (loss) income:
| For the Year Ended December 31, 2015 | ||||||||||||
| Pre Tax Amount | Tax Benefit (Expense) | After Tax Amount | ||||||||||
| (Dollars in thousands) | ||||||||||||
| Unrealized losses on available-for-sale securities | $ | (3,525 | ) | $ | 1,244 | $ | (2,281 | ) | ||||
| Less: net security gains reclassified into other noninterest income | 1,523 | (537 | ) | 986 | ||||||||
| Net change in fair value of securities available-for-sale | (2,002 | ) | 707 | (1,295 | ) | |||||||
| Reclassification adjustment for prior service costs and net loss included in net periodic pension costs (1) | 986 | (342 | ) | 644 | ||||||||
| Total other comprehensive loss | $ | (1,016 | ) | $ | 365 | $ | (651 | ) | ||||
| For the Year Ended December 31, 2014 | ||||||||||||
| Pre Tax Amount | Tax Benefit (Expense) | After Tax Amount | ||||||||||
| (Dollars in thousands) | ||||||||||||
| Unrealized gains on available-for-sale securities | $ | 1,831 | $ | (641 | ) | $ | 1,190 | |||||
| Less: net security gains reclassified into other noninterest income | - | - | - | |||||||||
| Net change in fair value of securities available-for-sale | 1,831 | (641 | ) | 1,190 | ||||||||
| Reclassification adjustment for prior service costs and net loss included in net periodic pension costs (1) | (5,388 | ) | 1,911 | (3,477 | ) | |||||||
| Total other comprehensive loss | $ | (3,557 | ) | $ | 1,270 | $ | (2,287 | ) | ||||
| For the Year Ended December 31, 2013 | ||||||||||||
| Pre Tax Amount | Tax Benefit (Expense) | After Tax Amount | ||||||||||
| (Dollars in thousands) | ||||||||||||
| Unrealized losses on available-for-sale securities | $ | (1,263 | ) | $ | 430 | $ | (833 | ) | ||||
| Less: net security gains reclassified into other noninterest income | 340 | (116 | ) | 224 | ||||||||
| Net change in fair value of securities available-for-sale | (923 | ) | 314 | (609 | ) | |||||||
| Reclassification adjustment for prior service costs and net gain included in net periodic pension costs (1) | 3,783 | (1,286 | ) | 2,497 | ||||||||
| Total other comprehensive income | $ | 2,860 | $ | (972 | ) | $ | 1,888 | |||||
| (1) | Amounts are included in salaries and employee benefits in the Consolidated Statements of Income. |
| 126 |
| First Connecticut Bancorp, Inc. |
| Notes to Consolidated Financial Statements |
| 21. | Parent Company Statements |
The following represents the Parent Company’s Condensed Statements of Financial Condition as of December 31, 2015 and 2014, and Condensed Statements of Operations, Condensed Statements of Comprehensive Income and Condensed Cash Flows for the years ended December 31, 2015, 2014 and 2013:
Condensed Statements of Financial Condition
| At December 31, | ||||||||
| 2015 | 2014 | |||||||
| (Dollars in thousands) | ||||||||
| Assets | ||||||||
| Cash and cash equivalents | $ | 33,164 | $ | 27,875 | ||||
| Deferred income taxes | 929 | 2,068 | ||||||
| Due from Farmington Bank | 58 | 8,010 | ||||||
| Investment in Farmington Bank | 208,952 | 195,022 | ||||||
| Prepaid expenses and other assets | 2,669 | 1,644 | ||||||
| Total assets | $ | 245,772 | $ | 234,619 | ||||
| Liabilities | $ | 51 | $ | 56 | ||||
| Stockholders' equity | 245,721 | 234,563 | ||||||
| Total liabilities and stockholders’ equity | $ | 245,772 | $ | 234,619 | ||||
Condensed Statements of Operations
| For The Year Ended December 31, | ||||||||||||
| 2015 | 2014 | 2013 | ||||||||||
| (Dollars in thousands) | ||||||||||||
| Interest income | $ | 53 | $ | 79 | $ | 157 | ||||||
| Noninterest expense | (1,752 | ) | (1,683 | ) | (1,627 | ) | ||||||
| Income tax (expense) benefit | (303 | ) | 503 | 364 | ||||||||
| Loss before equity in undistributed earnings of Farmington Bank | (2,002 | ) | (1,101 | ) | (1,106 | ) | ||||||
| Equity in undistributed earnings of Farmington Bank | 14,581 | 10,436 | 4,810 | |||||||||
| Net income | $ | 12,579 | $ | 9,335 | $ | 3,704 | ||||||
Condensed Statements of Comprehensive Income
| For The Year Ended December 31, | ||||||||||||
| 2015 | 2014 | 2013 | ||||||||||
| (Dollars in thousands) | ||||||||||||
| Net income | $ | 12,579 | $ | 9,335 | $ | 3,704 | ||||||
| Other comprehensive (loss) income, before tax | ||||||||||||
| Unrealized (losses) gains on securities: | ||||||||||||
| Unrealized holding (losses) gains arising during the period | (3,525 | ) | 1,831 | (1,263 | ) | |||||||
| Less: reclassification adjustment for gains included in net income | 1,523 | - | 340 | |||||||||
| Net change in unrealized (losses) gains | (2,002 | ) | 1,831 | (923 | ) | |||||||
| Change related to pension and other postretirement benefit plans | 986 | (5,388 | ) | 3,783 | ||||||||
| Other comprehensive (loss) income, before tax | (1,016 | ) | (3,557 | ) | 2,860 | |||||||
| Income tax (benefit) expense | (365 | ) | (1,270 | ) | 972 | |||||||
| Other comprehensive (loss) income, net of tax | (651 | ) | (2,287 | ) | 1,888 | |||||||
| Comprehensive income | $ | 11,928 | $ | 7,048 | $ | 5,592 | ||||||
| 127 |
| First Connecticut Bancorp, Inc. |
| Notes to Consolidated Financial Statements |
Condensed Statements of Cash Flows
| For The Year Ended December 31, | ||||||||||||
| 2015 | 2014 | 2013 | ||||||||||
| (Dollars in thousands) | ||||||||||||
| Cash flows from operating activities: | ||||||||||||
| Net income | $ | 12,579 | $ | 9,335 | $ | 3,704 | ||||||
| Adjustments to reconcile net income to net cash provided by operating activities: | ||||||||||||
| Amortization of ESOP expense | 1,522 | 1,480 | 1,404 | |||||||||
| Share based compensation expense | 3,118 | 2,923 | 3,576 | |||||||||
| Equity in undistributed net income of Farmington Bank | (14,581 | ) | (10,436 | ) | (4,810 | ) | ||||||
| Deferred income tax | 1,139 | 253 | 286 | |||||||||
| Due from Farmington Bank | 7,952 | (1,892 | ) | (2,635 | ) | |||||||
| Increase in prepaid expenses and other assets | (1,025 | ) | (839 | ) | (778 | ) | ||||||
| Decrease in accrued expenses and other liabilities | (5 | ) | (3 | ) | (283 | ) | ||||||
| Net cash provided by operating activities | 10,699 | 821 | 464 | |||||||||
| Cash flows from financing activities: | ||||||||||||
| Cancelation of shares for tax withholding | (498 | ) | (440 | ) | (576 | ) | ||||||
| Repurchase of common stock | (2,200 | ) | (6,257 | ) | (18,910 | ) | ||||||
| Excess tax benefits from stock-based compensation | 152 | 110 | 35 | |||||||||
| Exercise of stock options | 412 | 27 | 1,171 | |||||||||
| Cash dividend paid | (3,276 | ) | (2,537 | ) | (1,878 | ) | ||||||
| Net cash used in financing activities | (5,410 | ) | (9,097 | ) | (20,158 | ) | ||||||
| Net increase (decrease) in cash and cash equivalents | 5,289 | (8,276 | ) | (19,694 | ) | |||||||
| Cash and cash equivalents at beginning of year | 27,875 | 36,151 | 55,845 | |||||||||
| Cash and cash equivalents at end of year | $ | 33,164 | $ | 27,875 | $ | 36,151 | ||||||
| 128 |
| First Connecticut Bancorp, Inc. |
| Notes to Consolidated Financial Statements |
| 22. | Selected Quarterly Consolidated Financial Information (Unaudited) |
The following is selected quarterly consolidated financial information for the years ended December 31, 2015 and 2014.
| Year Ended December 31, 2015 | ||||||||||||||||
| First | Second | Third | Fourth | |||||||||||||
| quarter | quarter | quarter | quarter | |||||||||||||
| (Dollars in thousands, except Per Share data) | ||||||||||||||||
| Interest income | $ | 19,532 | $ | 20,164 | $ | 21,094 | $ | 21,094 | ||||||||
| Interest expense | 3,157 | 3,065 | 3,422 | 3,731 | ||||||||||||
| Net interest income | 16,375 | 17,099 | 17,672 | 17,363 | ||||||||||||
| Provision for loan losses | 615 | 663 | 386 | 776 | ||||||||||||
| Net interest income after provision for loan losses | 15,760 | 16,436 | 17,286 | 16,587 | ||||||||||||
| Noninterest income | 2,664 | 4,074 | 3,241 | 3,468 | ||||||||||||
| Noninterest expense | 14,937 | 15,597 | 14,718 | 15,958 | ||||||||||||
| Income before income taxes | 3,487 | 4,913 | 5,809 | 4,097 | ||||||||||||
| Income tax expense | 976 | 1,441 | 1,594 | 1,716 | ||||||||||||
| Net income | $ | 2,511 | $ | 3,472 | $ | 4,215 | $ | 2,381 | ||||||||
| Net earnings per share: | ||||||||||||||||
| Basic | $ | 0.17 | $ | 0.23 | $ | 0.28 | $ | 0.16 | ||||||||
| Diluted | $ | 0.17 | $ | 0.23 | $ | 0.28 | $ | 0.16 | ||||||||
| Year Ended December 31, 2014 | ||||||||||||||||
| First | Second | Third | Fourth | |||||||||||||
| quarter | quarter | quarter | quarter | |||||||||||||
| (Dollars in thousands, except Per Share data) | ||||||||||||||||
| Interest income | $ | 16,980 | $ | 17,854 | $ | 18,528 | $ | 19,412 | ||||||||
| Interest expense | 2,230 | 2,290 | 2,543 | 3,017 | ||||||||||||
| Net interest income | 14,750 | 15,564 | 15,985 | 16,395 | ||||||||||||
| Provision for loan losses | 505 | 410 | 1,041 | 632 | ||||||||||||
| Net interest income after provision for loan losses | 14,245 | 15,154 | 14,944 | 15,763 | ||||||||||||
| Noninterest income | 1,762 | 2,066 | 2,778 | 2,498 | ||||||||||||
| Noninterest expense | 13,960 | 14,254 | 14,219 | 14,615 | ||||||||||||
| Income before income taxes | 2,047 | 2,966 | 3,503 | 3,646 | ||||||||||||
| Income tax expense | 555 | 776 | 997 | 499 | ||||||||||||
| Net income | $ | 1,492 | $ | 2,190 | $ | 2,506 | $ | 3,147 | ||||||||
| Net earnings per share: | ||||||||||||||||
| Basic | $ | 0.10 | $ | 0.15 | $ | 0.17 | $ | 0.21 | ||||||||
| Diluted | $ | 0.10 | $ | 0.14 | $ | 0.17 | $ | 0.21 | ||||||||
| 23. | Legal Actions |
The Company and its subsidiary are involved in various legal proceedings which have arisen in the normal course of business. The Company believes the resolution of these legal actions is not expected to have a material adverse effect on the Company’s consolidated financial statements.
| 129 |
Item 9. Changes in and Disagreements With Accountants on Accounting and Financial Disclosure
Not Applicable.
Item 9A. Controls and Procedures
Disclosure Controls and Procedures
The Company's management, including the Chief Executive Officer and Chief Financial Officer, conducted an evaluation of the effectiveness of the Company's disclosure controls and procedures (as defined in Rules 13a-15(e) and 15d-15(e) under the Securities Exchange Act of 1934, as amended (the "Exchange Act")) as of December 31, 2015. The Company's disclosure controls and procedures are designed to ensure that information required to be disclosed by the Company in the reports that it files or submits under the Exchange Act is recorded, processed, summarized, and reported within the time periods specified in the U.S. Securities and Exchange Commission's rules and forms, and that such information is accumulated and communicated to the Company's management, as appropriate, including the Company's Chief Executive Officer and Chief Financial Officer, to allow timely decisions regarding required disclosure. Based on this evaluation, the Chief Executive Officer and Chief Financial Officer concluded that the Company's disclosure controls and procedures were effective as of December 31, 2015.
Management's Annual Report on Internal Control over Financial Reporting
Management of the Company is responsible for establishing and maintaining effective internal control over financial reporting. Internal control over financial reporting is designed to provide reasonable assurance regarding the reliability of financial reporting and the preparation of financial statements for external purposes in accordance with generally accepted accounting principles.
Because of its inherent limitations, internal control over financial reporting may not prevent or detect misstatements. Also, projections of any evaluation of effectiveness to future periods are subject to the risk that controls may become inadequate because of changes in conditions, or that the degree of compliance with the policies and procedures may deteriorate.
Management assessed the effectiveness of the Company's internal control over financial reporting as of December 31, 2015. This assessment was based on criteria for effective internal control over financial reporting described in "Internal Control – Integrated Framework" issued by the Committee of Sponsoring Organizations of the Treadway Commission in 2013. Based on this assessment, the Chief Executive Officer and Chief Financial Officer assert that the Company maintained effective internal control over financial reporting as of December 31, 2015.
The effectiveness of the Company's internal control over financial reporting as of December 31, 2015 has been audited by PricewaterhouseCoopers LLP, the independent registered public accounting firm who also has audited the Company's consolidated financial statements included in this Annual Report on Form 10-K, as stated in their report which appears herein.
Changes in Internal Control over Financial Reporting
There were no changes in the Company's internal control over financial reporting (as defined in Rules 13a-15(f) and 15d-15(f) under the Exchange Act) that occurred during the quarter ended December 31, 2015 that have materially affected or are reasonably likely to materially affect the Company's internal control over financial reporting.
Item 9B. Other Information
There were no changes in or disagreements with accountants on accounting and financial disclosures as defined in Regulation S-K, Item 304.
| 130 |
Part III
Item 10. Directors, Executive Officers and Corporate Governance
The information required under this item will be provided in a future proxy statement or 10-K/A filing with the Securities and Exchange Commission no later than 120 days after the close of the fiscal year ended December 31, 2015.
Item 11. Executive Compensation
The information required under this item will be provided in a future proxy statement or 10-K/A filing with the Securities and Exchange Commission no later than 120 days after the close of the fiscal year ended December 31, 2015.
Item 12. Security Ownership of Certain Beneficial Owners and Management and Related Stockholder Matters
The information required under this item will be provided in a future proxy statement or 10-K/A filing with the Securities and Exchange Commission no later than 120 days after the close of the fiscal year ended December 31, 2015.
Item 13. Certain Relationships and Related Transactions, and Director Independence
The information required under this item will be provided in a future proxy statement or 10-K/A filing with the Securities and Exchange Commission no later than 120 days after the close of the fiscal year ended December 31, 2015.
Item 14. Principal Accounting Fees and Services
The information required under this item will be provided in a future proxy statement or 10-K/A filing with the Securities and Exchange Commission no later than 120 days after the close of the fiscal year ended December 31, 2015.
Part IV
Item 15. Exhibits and Financial Statement Schedules
| (1) | Financial Statements |
The financial statements filed in Item 8 of this Form 10-K are as follows:
| (A) | Report of Independent Registered Public Accounting Firm on Financial Statements |
| (B) | Consolidated Statements of Financial Condition as of December 31, 2015 and 2014 |
| (C) | Consolidated Statements of Income for the years ended December 31, 2015, 2014 and 2013 |
| (D) | Consolidated Statements of Comprehensive Income for the years ended December 31, 2015, 2014 and 2013 |
| (E) | Consolidated Statements of Changes in Stockholders’ Equity for the years ended December 31, 2015, 2014 and 2013 |
| (F) | Consolidated Statements of Cash Flows for the years ended December 31, 2015, 2014 and 2013 |
| (G) | Notes to Consolidated Financial Statements |
| 131 |
| (2) | Financial Statements Schedules |
All financial statement schedules have been omitted as the required information is inapplicable or has been included in the Notes to Consolidated Financial Statements.
| (3) | Exhibits |
| 3.1 | Amended and Restated Certificate of Incorporation of First Connecticut Bancorp, Inc. (filed as Exhibit 3.1 to the Registration Statement on the Form S-1 filed for the Company on January 28, 2011, as amended, and incorporated herein by reference). |
| 3.2.2 | Second Amended and Restated Bylaws of First Connecticut Bancorp, Inc. (filed as Exhibit 3.2.2 to the Form 8-K filed for the Company on February 23, 2016, and incorporated herein by reference). |
| 4.1 | Form of Common Stock Certificate of First Connecticut Bancorp, Inc. (filed as Exhibit 4.1 to the Registration Statement on the Form S-1 filed for the Company on January 28, 2011, as amended, and incorporated herein by reference). |
| 10.2 | Supplemental Executive Retirement Plan of Farmington Bank (filed as Exhibit 10.2 to the Registration Statement on the Form S-1 filed for the Company on January 28, 2011, as amended, and incorporated herein by reference). |
| 10.3 | Voluntary Deferred Compensation Plan for Directors and Key Employees (filed as Exhibit 10.3 to the Registration Statement on the Form S-1 filed for the Company on January 28, 2011, as amended, and incorporated herein by reference). |
| 10.4 | First Amendment to Voluntary Deferred Compensation Plan for Directors and Key Employees (filed as Exhibit 10.4 to the Registration Statement on the Form S-1 filed for the Company on January 28, 2011, as amended, and incorporated herein by reference). |
| 10.4.1 | Second Amendment to Voluntary Deferred Compensation Plan for Directors and Key Employees (filed as Exhibit 10.4.1 to the Form 10-K for the year ended December 31, 2012 filed on March 18, 2013, and incorporated herein by reference). |
| 10.5 | Voluntary Deferred Compensation Plan for Key Employees (filed as Exhibit 10.5 to the Registration Statement on the Form S-1 filed for the Company on January 28, 2011, as amended, and incorporated herein by reference). |
| 10.6 | Life Insurance Premium Reimbursement Agreement between Farmington Bank and John J. Patrick, Jr. (filed as Exhibit 10.6 to the Registration Statement on the Form S-1 filed for the Company on January 28, 2011, as amended, and incorporated herein by reference). |
| 10.7 | Life Insurance Premium Reimbursement Agreement between Farmington Bank and Gregory A. White (filed as Exhibit 10.7 to the Registration Statement on the Form S-1 filed for the Company on January 28, 2011, as amended, and incorporated herein by reference). |
| 10.8 | Farmington Savings Bank Defined Benefit Employees’ Pension Plan, as amended (filed as Exhibit 10.8 to the Registration Statement on the Form S-1 filed for the Company on January 28, 2011, as amended, and incorporated herein by reference). |
| 10.8.1 | Farmington Savings Bank Defined Benefit Employees’ Pension Plan, as amended (filed as Exhibit 10.8.1 to the Form 10-K for the year ended December 31, 2012 filed on March 18, 2013, and incorporated herein by reference). |
| 10.9 | Annual Incentive Compensation Plan (filed as Exhibit 10.9 to the Registration Statement on the Form S-1 filed for the Company on January 28, 2011, as amended, and incorporated herein by reference). |
| 10.9.1 | Amended Annual Incentive Compensation Plan (filed as Exhibit 10.9.1 to the Form 10-K for the year ended December 31, 2013 filed on March 17, 2014, and incorporated herein by reference) |
| 132 |
| 10.10 | Supplemental Retirement Plan Participation Agreement between John J. Patrick, Jr. and Farmington Bank (filed as Exhibit 10.10 to the Registration Statement on the Form S-1 filed for the Company on January 28, 2011, as amended, and incorporated herein by reference). |
| 10.11 | Supplemental Retirement Plan Participation Agreement between Michael T. Schweighoffer and Farmington Bank (filed as Exhibit 10.11 to the Registration Statement on the Form S-1 filed for the Company on January 28, 2011, as amended, and incorporated herein by reference). |
| 10.12 | Supplemental Retirement Plan Participation Agreement between Gregory A. White and Farmington Bank (filed as Exhibit 10.12 to the Registration Statement on the Form S-1 filed for the Company on January 28, 2011, as amended, and incorporated herein by reference). |
| 10.13 | Employment Agreement among First Connecticut Bancorp, Inc., Farmington Bank and John J. Patrick, Jr. (filed as Exhibit 10.1 Employment Agreement on Form 8-K for the Company on April 24, 2012 and incorporated herein by reference). |
| 10.13.1 | Employment Agreement First Amendment among First Connecticut Bancorp, Inc., Farmington Bank and John J. Patrick, Jr. (filed as Exhibit 10.13.1 to the current report on the Form 8-K filed for the Company on February 28, 2013, as amended, and incorporated herein by reference) (term currently extended to December 31, 2018). |
| 10.14 | Life Insurance Premium Reimbursement Agreement between Farmington Bank and Michael T. Schweighoffer (filed as Exhibit 10.14 to the Form 10-Q filed for the Company on May 15, 2012, and incorporated herein by reference). |
| 10.15 | First Connecticut Bancorp, Inc. 2012 Stock Incentive Plan (Incorporated by reference to Appendix A in the Definitive Proxy Statement on Form 14A filed on June 6, 2012 and amended on July 2, 2012 (File No. 001-35209-12890818 and 12960688). |
| 21.1 | Subsidiaries of First Connecticut Bancorp, Inc. and Farmington Bank (filed as Exhibit 21.1 to the Registration Statement on the Form S-1 filed for the Company on January 28, 2011, as amended, and incorporated herein by reference). |
| 31.1 | Certification pursuant to Section 302 of the Sarbanes-Oxley Act of 2002, signed by the Company’s Chief Executive Officer. |
| 31.2 | Certification pursuant to Section 302 of the Sarbanes-Oxley Act of 2002, signed by the Company’s Chief Financial Officer. |
| 32.1 | Written Statement pursuant to 18 U.S.C. § 1350, as created by section 906 of the Sarbanes-Oxley Act of 2002, signed by the Company’s Chief Executive Officer. |
| 32.2 | Written Statement pursuant to 18 U.S.C. § 1350, as created by section 906 of the Sarbanes-Oxley Act of 2002, signed by the Company’s Chief Financial Officer. |
| 101 | Interactive data files pursuant to Rule 405 of Regulation S-t: (i) the Consolidated Statements of Financial Condition, (ii) the Consolidated Statements of Income, (iii) the Consolidated Statement of Changes in Stockholders’ Equity, (iv) the Consolidated Statements of Cash Flows, and (iv) Notes to Unaudited Consolidated Financial Statements tagged as blocks of text and in detail.* |
| * | As provided in Rule 406T of Regulation S-T, this information is furnished and not filed for purposes of Sections 11 and 12 of the Securities Act of 1933 and Section 18 of the Securities Act of 1934. |
| 133 |
SIGNATURES
Pursuant to the requirements of Section 13 or 15(d) of the Securities Exchange Act of 1934, the Registrant has duly caused this report to be signed on its behalf by the undersigned, thereunto duly authorized.
| First Connecticut Bancorp, Inc. | |||
| By: | /s/ John J. Patrick, Jr. | ||
| John J. Patrick, Jr. | |||
| Date: March 11, 2016 | Chairman, President and Chief Executive Officer | ||
Pursuant to the requirements of the Securities Exchange of 1934, this report has been signed below by the following persons on behalf of the Registrant and in the capacities and on the dates indicated.
| Signatures | Title | Date | ||
| /s/ John J. Patrick Jr. | Chairman of the Board, President and Chief Executive Officer | March 11, 2016 | ||
| John J. Patrick, Jr. | (Principal Executive Officer) | |||
| /s/ Gregory A. White | Executive Vice President and Chief Financial Officer | March 11, 2016 | ||
| Gregory A. White | (Principal Financial Officer) | |||
| /s/ Ronald A. Bucchi | Director | March 11, 2016 | ||
| Ronald A. Bucchi | ||||
| /s/ John J. Carson | Director | March 11, 2016 | ||
| John J. Carson | ||||
| /s/ Kevin S. Ray | Director | March 11, 2016 | ||
| Kevin S. Ray | ||||
| /s/ Michael A. Ziebka | Director | March 11, 2016 | ||
| Michael A. Ziebka | ||||
| /s/ Patience P. McDowell | Director | March 11, 2016 | ||
| Patience P. McDowell | ||||
| /s/ James T. Healey, Jr. | Director | March 11, 2016 | ||
| James T. Healey, Jr. | ||||
| /s/ John A. Green | Director | March 11, 2016 | ||
| John A. Green |
| 134 |