Attached files
| file | filename |
|---|---|
| EX-31.1 - EXHIBIT 31.1 - Everyday Health, Inc. | t1600124_ex31-1.htm |
| EX-32.1 - EXHIBIT 32.1 - Everyday Health, Inc. | t1600124_ex32-1.htm |
| EX-31.2 - EXHIBIT 31.2 - Everyday Health, Inc. | t1600124_ex31-2.htm |
| EX-21.1 - EXHIBIT 21.1 - Everyday Health, Inc. | t1600124_ex21-1.htm |
| EX-32.2 - EXHIBIT 32.2 - Everyday Health, Inc. | t1600124_ex32-2.htm |
| EX-23.1 - EXHIBIT 23.1 - Everyday Health, Inc. | t1600124_ex23-1.htm |
| EX-10.11 - EXHIBIT 10.11 - Everyday Health, Inc. | t1600124_ex10-11.htm |
UNITED
STATES
SECURITIES AND EXCHANGE COMMISSION
Washington, D.C. 20549
FORM 10-K
(Mark One)
| x | ANNUAL REPORT PURSUANT TO SECTION 13 OR 15(d) OF THE SECURITIES EXCHANGE ACT OF 1934 |
For the fiscal year ended December 31, 2015
or
| ¨ | TRANSITION REPORT PURSUANT TO SECTION 13 OR 15(d) OF THE SECURITIES EXCHANGE ACT OF 1934 |
For the transition period from to
| Commission file number: 001-36371 |
Everyday
Health, Inc.
(Exact name of registrant as specified in its charter)
| Delaware
(State or other jurisdiction of incorporation or organization) |
80-0036062
(I.R.S. Employer Identification No.) | |
| 345
Hudson Street, 16th Floor New York, NY (Address of principal executive offices) |
10014 |
Registrant’s
telephone number, including area code: (646) 728-9500
Securities registered pursuant to Section 12(b) of the Act:
| Title of class | Name of each exchange on which registered | |
| Common Stock, $0.01 par value per share | New York Stock Exchange |
Securities
registered pursuant to Section 12(g) of the Act:
None
Indicate by check mark if the registrant is a well-known seasoned issuer, as defined in Rule 405 of the Securities Act. YES ¨ NO x
Indicate by check mark if the registrant is not required to file reports pursuant to Section 13 or Section 15(d) of the Act. YES ¨ NO x
Indicate by check mark whether the registrant (1) has filed all reports required to be filed by Section 13 or 15(d) of the Securities Exchange Act of 1934 during the preceding 12 months (or for such shorter period that the registrant was required to file such reports), and (2) has been subject to such filing requirements for the past 90 days. YES x NO ¨
Indicate by check mark whether the registrant has submitted electronically and posted on its corporate Web site, if any, every Interactive Data File required to be submitted and posted pursuant to Rule 405 of Regulation S-T during the preceding 12 months (or for such shorter period that the registrant was required to submit and post such files). YES x NO ¨
Indicate by check mark if disclosure of delinquent filers pursuant to Item 405 of Regulation S-K is not contained herein, and will not be contained, to the best of registrant’s knowledge, in definitive proxy or information statements incorporated by reference in Part III of this Form 10-K or any amendment to this Form 10-K. x
Indicate by check mark whether the registrant is a large accelerated filer, an accelerated filer, a non-accelerated filer, or a smaller reporting company. See the definitions of “large accelerated filer,” “accelerated filer” and “smaller reporting company” in Rule 12b-2 of the Exchange Act.
| Large accelerated filer ¨ | Accelerated filer x | |||
| Non-accelerated filer ¨ | (Do not check if smaller reporting company) | Smaller reporting company ¨ |
Indicate by check mark whether the registrant is a shell company (as defined in Rule 12b-2 of the Exchange Act). YES ¨ NO x
The aggregate market value of the voting and non-voting common equity held by non-affiliates of the registrant was approximately $296.1 million as of the last business day of the registrant’s most recently completed second fiscal quarter, based upon the closing price on the New York Stock Exchange reported for such date. Excludes an aggregate of 8,757,881 shares of the registrant’s common stock held as of such date by officers, directors and stockholders that the registrant has concluded are or were affiliates of the registrant. Exclusion of such shares should not be construed to indicate that the holder of any such shares possesses the power, direct or indirect, to direct or cause the direction of the management or policies of the registrant or that such person is controlled by or under common control with the registrant.
There were 32,866,363 shares of the registrant’s common stock issued and outstanding as of March 4, 2016.
DOCUMENTS INCORPORATED BY REFERENCE
Part III incorporates information by reference from the registrant’s definitive proxy statement to be filed with the Securities and Exchange Commission pursuant to Regulation 14A, not later than 120 days after the end of the fiscal year covered by this Annual Report on Form 10-K, in connection with the Registrant’s 2016 Annual Meeting of Stockholders.
EVERYDAY HEALTH, INC.
FORM 10-K
FOR THE YEAR ENDED DECEMBER 31, 2015
TABLE OF CONTENTS
Except as otherwise indicated herein or as the context otherwise requires, references in this Annual Report on Form 10-K to “Everyday Health,” “the company,” “we,” “us,” “our” and similar references refer to Everyday Health, Inc. and, where appropriate, our subsidiaries. This report contains registered marks, trademarks and trade names of other companies. All other trademarks, registered marks and trade names appearing in this report are the property of their respective holders.
2
This Annual Report on Form 10-K contains forward-looking statements within the meaning of Section 27A of the Securities Act of 1933 and Section 21E of the Securities Exchange Act of 1934. Forward-looking statements are based on our management’s beliefs and assumptions and on information currently available to our management. All statements other than statements of historical facts are “forward-looking statements” for purposes of these provisions, including those relating to future events or our future financial performance. In some cases, you can identify forward-looking statements by terminology such as “may,” “might,” “will,” “should,” “expect,” “plan,” “anticipate,” “project,” “believe,” “estimate,” “predict,” “potential,” “intend” or “continue,” the negative of terms like these or other comparable terminology, and other words or terms of similar meaning in connection with any discussion of future operating or financial performance. These statements are only predictions. All forward-looking statements included in this Annual Report on Form 10-K are based on information available to us on the date hereof, and we assume no obligation to update any such forward-looking statements. Any or all of our forward-looking statements in this document may turn out to be wrong. Actual events or results may differ materially. Our forward-looking statements can be affected by inaccurate assumptions we might make or by known or unknown risks, uncertainties and other factors. We discuss many of these risks, uncertainties and other factors in this Annual Report on Form 10-K in greater detail under the heading “Item 1A—Risk Factors.” We caution investors that our business and financial performance are subject to substantial risks and uncertainties.
Mission
Everyday Health empowers and inspires consumers and healthcare professionals to make better health and wellness decisions.
Overview
We operate a leading digital marketing and communications platform for healthcare marketers that want to engage with consumers and healthcare professionals. Our platform combines premier content from leading brands, a large and engaged audience, and extensive data and analytics expertise to provide (i) a highly personalized content experience for our users and (ii) an efficient marketing channel for our diverse set of customers. We currently reach more than 50 million consumers and more than 700,000 U.S. physicians, which is more than two-thirds of all active U.S. physicians and more than triple the physician reach we had two years ago. During 2015, our customers included five of the top ten global advertisers in 2014, as compiled by Advertising Age, 24 of the top 25 global pharmaceutical companies ranked by 2014 revenue, and more than 350 hospitals across 30 states, including six of the top ten largest health systems in the U.S.
The Internet and mobile devices have become indispensable for both consumers seeking to take a more active role in managing their health and healthcare professionals striving to provide better care for their patients.
Consumers use our digital content, interactive tools and 14 mobile applications to manage a broad array of health and wellness needs on a daily basis, including medical conditions, pregnancy, diet and fitness. Since our inception, more than 70 million consumers have registered with us online and voluntarily provided us with valuable data, including demographic information and health-related interests. We augment our user profiles by collecting behavioral data through engagement with our properties and appending data from third-party sources. Our proprietary technology utilizes the data we collect to provide a highly-personalized experience for our consumers, including customized content, to drive better health outcomes and to connect users looking for support.
We enable healthcare professionals to make better decisions for their patients by providing them with the news, tools and information needed to stay abreast of industry, legislative and regulatory developments in major medical specialties. We provide a highly-tailored content experience to each healthcare professional based on the individual’s specific medical practice and interests. We partner with prominent healthcare professionals to provide expert commentary and perspectives on important medical developments and distribute our content through partnerships with premier medical associations. We also offer physicians the ability to satisfy their continuing medical education, or CME, requirements for maintenance of licensure and maintenance of certification through engagement with our content.
We derive almost all of our revenues from the sale of digital marketing and communications solutions that engage consumers and healthcare professionals. We have developed strong relationships with marketers across a variety of health and wellness categories, including pharmaceuticals, over-the-counter products, food, retail and lifestyle, as well as hospital systems and health insurance companies. We specialize in providing highly-customized, data-driven solutions that can precisely target niche health audiences, and which are designed to be effective on a desktop or mobile device. Our solutions allow our customers to promote their products and services in a highly targeted and measurable manner, influence purchase decisions and drive better health compliance. Our innovative programs, which utilize sophisticated campaign analytics to measure and maximize a marketer’s return on investment, or ROI, have been instrumental in significantly growing our revenue among our largest customers. We believe our customers view our data-driven marketing solutions as both superior to traditional media channels, which lack interactivity and the ability to measure and optimize ROI in real time, and superior to other online media channels, which lack the data or technology to target the desired audience or measure the effectiveness of the campaign.
Industry Dynamics
The U.S. healthcare industry is undergoing a profound transformation whereby consumers will likely be more directly engaged in managing their health and making health-related purchase decisions. At the same time, digital technology is providing new avenues for consumers to manage their health, healthcare professionals to stay informed and treat patients, marketers to reach and influence consumers and healthcare professionals, and health payers and providers to improve care and lower cost.
3
Growth in Digital Marketing
Marketers increasingly view digital marketing as providing significant advantages over traditional marketing channels through improved reach and more precise targeting for their campaigns, as well as the ability to maximize ROI in a more measurable and data-driven manner. We believe the benefits of digital marketing will continue to change the way advertisers plan and buy media and cause them to shift more of their budgets away from traditional media. According to published reports, digital advertising is projected to grow from 22.3% of all U.S. media advertising spend in 2012 to 37.3% in 2018, at which time digital advertising is projected to become the largest individual advertising medium.
Health and wellness advertisers are likewise expected to increase their digital marketing spending. According to published reports, digital media spending by the U.S. healthcare and pharmaceutical industry will more than double between 2012 and 2018.
Rising Importance of the Health Consumer
The Internet has fundamentally altered the consumer health market, as more consumers use digital media as a convenient resource for obtaining critical information, making health and lifestyle decisions and using decision-support tools. During 2015, on average, approximately 199 million unique visitors accessed health-related websites per month in the U.S., according to comScore.
The widespread adoption of mobile devices is further accelerating the usage of the Internet and other digital services to manage a healthy lifestyle. Mobile devices make health-related information easy to access anytime and anywhere, and an increasing number of mobile applications and digitally-connected devices are allowing consumers to directly manage and monitor their health in unprecedented ways. For example, consumers are using mobile technology to track caloric intake and fitness performance, seek information about medical symptoms and conditions, communicate with healthcare professionals, and measure vital signs.
Significant changes in the delivery and reimbursement of healthcare are going to substantially increase the number of healthcare consumers and their level of personal investment in healthcare spending. According to the U.S. Department of Health and Human Services, more than eight million new consumers selected an insurance plan through the Affordable Care Act’s health insurance marketplace in the first enrollment period. In addition, consumers are being forced to bear more of their healthcare costs as a result of the changes caused by the Affordable Care Act as well as payers seeking to link healthcare coverage to personal behavioral and health characteristics. As a result, more consumers will be incentivized to take a greater interest in the price of healthcare, understanding their treatment options and improving their overall health.
Challenges for the Pharmaceutical Industry
The pharmaceutical industry is facing a number of key challenges that we believe will dramatically increase the need for these companies to interact with consumers and physicians more directly through digital channels.
The research and development pipelines of large global pharmaceutical companies have significantly changed over the past decade. The patent terms of many of the mass-market medicines, the so-called blockbuster drugs, have expired or will expire in the next few years. In response, pharmaceutical companies have shifted their focus from blockbuster drugs to developing and commercializing profitable specialty products for smaller patient populations generally defined by chronic illness. According to published reports, specialty drugs are forecasted to be 50% of all U.S. drug expenditures in 2018, an increase from 20% in 2009. We believe it is difficult to reach smaller, discrete patient populations through traditional advertising channels and, as a result, pharmaceutical companies will increasingly utilize digital channels to better target consumers and physicians.
Moreover, pharmaceutical companies are increasingly changing their traditional sales model and replacing in-person interactions with technology and interactive services that facilitate direct interaction with physicians and consumers. The number of sales representatives employed by pharmaceutical and medical device companies marketing to physicians has declined dramatically in recent years. At the same time, sales representatives are also finding it more difficult to spend meaningful time with physicians as an increasing number of physicians have requested sales representatives refrain from contacting them for marketing purposes.
Healthcare Trends Impacting Physicians and Payers
The changing healthcare landscape is presenting new and complex challenges for physicians. Physicians are seeking ways to address growing administrative complexities, increasing reimbursement pressures, time constraints and a constantly changing regulatory environment. Under developing payment models, physicians are increasingly incentivized to improve their patients’ healthcare outcomes as opposed to being reimbursed solely based on services provided. Physicians are also overburdened with information and challenged with keeping current on medical developments and news. As a result, physicians are increasingly utilizing digital and mobile solutions to meet these challenges, improve practice efficiencies and patient care and keep current on medical developments and news. For example, physicians need access to relevant and reliable clinical information at the point-of-care to help make informed decisions. We believe that physicians will increasingly rely on the Internet and digital technologies to stay better informed on medical developments, provide better care for their patients and more efficiently manage their medical practices.
The changes in the payment models for healthcare costs are forcing payers, providers and employers to significantly alter the way they manage their businesses. For example, payers seeking to recruit new consumers, better manage their health outcomes and drive down overall healthcare costs will need to market health insurance products directly to consumers through the recently introduced healthcare exchanges. These payers will need a better understanding of who the consumer is, what they want and what they can afford, which are challenges that these entities have not historically addressed. Likewise, providers will seek to develop long-term relationships with consumers in order to retain them and improve their long-term health. Lastly, employers will need to more directly engage their employees in managing their health in order to lower the employers’ long-term healthcare costs and improve productivity.
4
The Everyday Health Solution
Our digital platform has three core components:
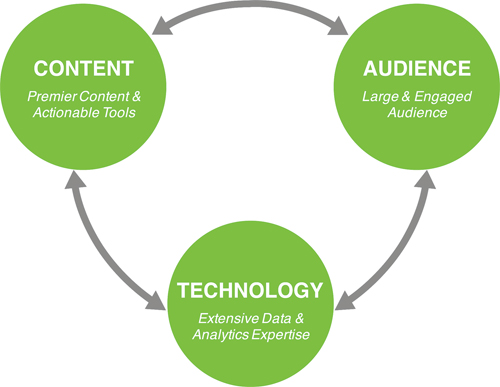
We attract a large and engaged audience of consumers and healthcare professionals to our premium health content across multiple channels, including the web, mobile devices, video and social media, and utilize our data and analytics expertise to deliver highly personalized user experiences. The combination of our audience, content and proprietary data assets also creates a unique health engagement platform that we monetize through effective marketing and engagement solutions that address the varied business needs of constituencies across the health and wellness landscape.
Solutions for Users
We believe that the depth, breadth and quality of our content, combined with our ability to provide a highly personalized digital experience, enables consumers to better manage their health and wellness needs and healthcare professionals to better serve their patients and manage their practices.
Premier Content and Tools
Our content is designed to provide consumers and healthcare professionals with access to the most trusted health and wellness content tailored to meet their daily needs. Our proprietary content is created by experienced health and medical writers, editors, videographers, designers and product specialists who create original articles and columns, videos, slideshows and interactive graphics for use across our properties. To supplement our original content, we partner with leading health experts, such as Dr. Sanjay Gupta, and medical associations, such as the American Heart Association, to provide users with access to trusted and reliable content across the health spectrum. We also partner with leading health brands, where we license the exclusive digital rights to their proprietary content and develop digital properties that we monetize either through subscriptions or advertising models.
Our consumer-focused properties include online content, interactive tools and applications designed to allow consumers to manage a broad array of health and wellness needs on a daily basis. Everyday Health, our flagship brand, is a broad-based health information portal that provides consumers with trusted and actionable health information intended to empower users to better manage their health and wellness. Expert commentary is an important component of the consumer experience on Everyday Health. For example, Dr. Sanjay Gupta, chief medical correspondent for CNN and contributor to “60 Minutes,” contributes real-life perspectives and advice on health and condition news aimed at consumers on www.EverydayHealth.com. Between 2013 and 2015, visits to Everyday Health have increased approximately 21% on a compounded annual basis.
We operate the digital properties for the What to Expect brand, the leading pregnancy and parenting media resource. Based on the best-selling pregnancy book, What to Expect When You’re Expecting, by author Heidi Murkoff, the What to Expect website and mobile applications contain content written by Ms. Murkoff on conception planning and pregnancy, as well as information on newborns and toddlers. We generated approximately three million registrations for our What to Expect properties in 2015, two million of which were pregnant women in the U.S., representing approximately half of the total number of U.S. births in 2015. More than 80% of What to Expect’s usage comes from mobile devices and the What to Expect mobile application is one of the top-ranked, customer-rated and downloaded applications on iOS (including iPhone, iPad and Apple Watch) and Android. Our licensing agreement for the digital rights to the What to Expect brand continues through 2024.
We also operate the Mayo Clinic Diet digital program, a subscription-based plan for weight loss, and ultimately better health, developed by the weight loss experts at Mayo Clinic. Based on the bestselling book by the same name, the Mayo Clinic Diet digital program provides a step-by-step program to jump-start quick weight loss, achieve a goal weight and maintain it for life.
As our growth strategy has evolved to focus primarily on proprietary content and providing marketing and communications solutions to our expanding customer base, we have placed less emphasis on operating consumer subscription properties. For example, our digital licensing agreement with South Beach Diet recently expired and our digital licensing agreement with Jillian Michaels will expire in the second quarter of 2016.
5
The table below outlines the key content offerings we provide consumers:
| Content Offering | Description | |
| Everyday Health/Healthy Living Content | Original daily and weekly content, which is medically reviewed where appropriate, that offers information, advice and inspiration for those seeking to live healthier lives or who face medical challenges. Content includes relevant, consumer-focused coverage of research published in peer-reviewed medical journals or presented at major medical conferences. | |
| Health Condition and Drug Encyclopedia | Wellness and prevention information and advice from leading fitness experts, as well as condition definitions, symptom lists, common treatments and drug information from healthcare authorities. | |
| Health News | Coverage of major public health, regulatory and consumer health stories designed to separate fact from fiction and offer actionable messages to health and condition audiences. | |
| Original Video | Health videos that focus on people living active, healthy lives, as well as those coping with chronic conditions. Programming that offers expert insight into emerging health trends and important research. | |
| Interactive Slideshows and Graphics | Original health content presented in high-impact graphical formats, including sequenced photo galleries where consumers may explore wellness trends, health conditions or medical news. | |
| Expert and Patient Perspective | Columns and Q&As by leading experts and patient advocates that provide explanation and perspective on condition and wellness topics, including heart disease, depression, psoriasis, multiple sclerosis and cancer, as well as nutrition, weight loss, fitness and longevity. | |
| Health Assessments | Quizzes and algorithmic-based intake exams designed to help users assess their risk of developing particular conditions, or the likelihood that they need to seek health care for particular symptoms. | |
| Community | Forums where consumers can share health goals and experiences. | |
| Healthy Recipes | Thousands of recipes across a variety of categories, including low fat, diabetes friendly, low carb, low calorie, low sodium and gluten free. |
For healthcare professionals, we provide premier digital content that enables healthcare professionals to stay abreast of clinical, industry, legislative and regulatory developments across all major medical specialties. Our flagship professional property, MedPage Today, includes a dedicated team of 30 journalists, including editors, reporters and videographers, and provides relevant clinical news based on research findings published in peer-reviewed medical journals as well as research reported at numerous medical conferences around the world. MedPage Today delivers breaking medical news in 34 medical specialties and major public policy developments at the state and federal levels seven days a week. MedPage Today coordinates with approximately 4,000 leading researchers and clinicians, as well as more than 300 academic medical centers, to aid in gathering in-depth information for articles. MedPage Today’s excellence has been recognized with awards from the American Society of Healthcare Business Editors, the National Institute for Healthcare Management, the eHealthcare Leadership Awards, the Medical Marketing and Media Awards, and the Web Health Awards. Additionally, MedPage Today was named as a finalist for the Jesse M. Neal Awards and the Gerald M. Loeb Award.
During 2015, more than 300 million customized e-newsletters and alerts were sent to our audience of more than 700,000 U.S. physicians. In 2015, we issued more than 380,000 certificates to users who earned CME credit by reading MedPage Today articles. We have designed our content offerings to be utilized by healthcare professionals at the point-of-care. Approximately 68% of the visits to MedPage Today occurred during the practice hours of 8 a.m. through 6 p.m.
The table below outlines the key content offerings we provide healthcare professionals:
| Content Offering | Description | |
| Breaking Medical News | Breaking medical news covering 34 specialties and major public policy developments at the state and federal levels seven days a week. Clinical content is reviewed and approved by a team of physicians under the direction of our chief medical reviewer. | |
| Conference Coverage | Relevant clinical news based on research reported at numerous medical conferences around the world, producing approximately 5,500 articles and 800 videos in 2015. | |
| Point-of-Care | Critical practice information at the point-of-care, including comprehensive reference information and regulatory alerts and announcements. | |
| Continuing Medical Education | Physicians and other healthcare professionals can receive CME credits to support their professional development at no cost through more than 3,000 CME-accredited news articles certified through Projects in Knowledge, as well as by participating in educational activities hosted by MedPage Today and our academic partners. | |
| Expert Commentary | Commentary and opinion pieces from leading physicians, government officials and policy experts, including Dr. Sanjay Gupta, Kevin Pho, MD, Tim Johnson, MD, and David Nash, MD. | |
| Interactive Tools | Healthcare professionals can gauge colleagues’ opinions by participating in a weekly survey linked to major news stories or evidence-based diagnostic quizzes. |
Personalized Experiences
Our sophisticated data and analytics technology and expertise allow us to personalize the content experience for our consumers and healthcare professionals. The data we gather from each incremental engagement with our properties by a user, whether or not registered, enhances our ability to personalize content we deliver to our users. We believe our data-driven approach to delivering a more personalized user experience is a key differentiator between us and our competitors.
6
Since our inception, more than 70 million consumers have registered with us and voluntarily provided us with valuable data, including demographic information and health-related interests. We have separately developed millions of anonymous health consumer profiles that have been used to personalize content for our unregistered consumers. We utilize this information, as well as proprietary predictive modeling, to provide consumers with highly-customized content and tailored programs linked to the individual’s health profile and to connect users looking for support or to engage others that are facing similar health issues. Providing personalized content and experiences across the health spectrum – whether it is for someone coping with a serious disease, managing a chronic condition or seeking to achieve their diet or fitness goals – leads to better health outcomes for consumers and creates a highly-engaged and loyal audience that will rely on our content and tools to manage future health concerns. In 2015, consumers spent over one million hours in our online patient education centers that focus on specific health conditions. During 2015, we also distributed over 200 million opt-in newsletters per month with content specifically tailored to the consumers’ individual health interests.
We also offer a variety of tools and applications that address specific consumer needs, including weight loss, exercise, pregnancy, diet and nutrition and managing medical conditions such as diabetes. For example, consumers can create personalized pregnancy calendars, calorie counters, meal plans and drug alerts. During 2015, approximately 1.7 million consumers utilized our various diet and fitness tools, including our My Calorie Counter property, which provides a suite of calorie and nutrition tools that provide consumers with the ability to easily track food and nutrient intake and calorie burn based on a large database of commonly consumed foods. During 2015, more than two million consumers used the What to Expect mobile application for a customized pregnancy calendar and management tool.
The table below outlines our key tools for consumers that provide customized programs or tailored advice:
| Content Offering | Description | |
| The Symptom Checker | Symptom triage tool featuring a board certified emergency room physician who through a series of recorded video segments questions users about their medical history and symptoms and provides care recommendations and action plans. | |
| The Pregnancy Tracker | Health tool that provides day-by-day and week-by-week information on fetal development and changes to the woman’s body as the pregnancy progresses. | |
| Due Date Calculator | Newly-pregnant women can calculate their expected due date based on the information provided. The tool directs users to personalized What to Expect content and services based on the due date. | |
| Tests and Screenings | This in-app tool empowers moms-to-be with a forward-looking view of key medical tests and screenings during pregnancy. This tool includes timely notifications and trusted, expert content about when each test occurs, what can be expected at each test appointment, and the importance of each test to her and her baby’s health. | |
| My Calorie Counter | www.My-Calorie-Counter.com and the related mobile application contain a suite of calorie and nutrition tools that provide consumers with the ability to easily track food and nutrient intake and calorie burn based on a large database of commonly consumed foods. | |
| BMI Calculator | The body mass index (BMI) is a quick and easy way for a user to see if his or her weight is within the normal or average range for his or her height. | |
| Diabetes in Check | This type-2 diabetes management mobile application features a wide range of tools, including diabetes coaching designed by a certified diabetes educator, trackers for blood glucose and medication, reminders, and tools for healthy eating, such as a food tracker with a barcode scanner and a recipe database. | |
| The Meal Planner | Health tool that produces healthy menu recommendations, including nutrient and calorie information, based on user food preferences and dietary restrictions. |
We also provide a highly-personalized experience for healthcare professionals. Healthcare professionals can select specific content areas they are interested in, whether focused on medical or surgical specialties or practice management issues. We offer in-depth content for 34 different medical specialties and numerous conferences around the world, including emails linked to specific practice areas and a healthcare professional’s prior engagement with our content. Healthcare professionals also have the opportunity to participate in market research focused on their area of expertise, earn CME credits and enable physicians to request online samples to be used in their medical practice. Furthermore, healthcare professionals may connect with colleagues in various formats, including peer-to-peer interviews and roundtables. As with our consumers, we believe that our focus on personalization has been critical in fostering a highly engaged audience of healthcare professionals.
Multi-Platform Approach
We design our health content for consumers and healthcare professionals to be accessible anytime and anywhere and to be distributed across multiple platforms, especially mobile. During 2015, our mobile traffic accounted for approximately 75% of our total traffic to operated properties. In addition, we currently offer 16 mobile applications, which have generated more than 21 million downloads.
We offer 14 consumer mobile applications that are available for use on the iPhone, iPad, Android and Android Tablet. Our consumer mobile applications provide a broad array of features, including customized exercise programs, tailored meal recommendations, video tutorials and tools to track daily performance against goals, which enable our consumers to manage their health and wellness needs throughout the day. In addition, we actively utilize video, online communities and social media channels to engage our consumers in new ways and to promote our content more broadly. Our vibrant digital communities are designed for users to engage directly with each other on specific health conditions or health journeys such as pregnancy. For example, during 2015, our users posted a message to our community forums on our What to Expect property every three seconds on average.
Healthcare professionals can also access our high-quality content through various platforms. Our MedPage Today mobile application, which is available for both Apple and Android platforms, includes breaking medical news, comprehensive reference information and regulatory alerts and announcements. We also distribute our content through partnerships with premier medical associations, including the American College of Cardiology, the American Society of Clinical Oncology, the American Association of Clinical Endocrinologists, the American Medical Students Association, and the American College of Rheumatology. We syndicate our content to numerous hospitals across the U.S. These affiliations and syndication arrangements have contributed to the significant growth in our audience and engagement with our content. MedPage Today’s reach among U.S. physicians has increased from approximately 600,000 in 2014 to more than 700,000 in 2015. Between 2013 and 2015, visits by healthcare professionals to MedPage Today increased approximately 17% on a compounded annual basis.
7
Solutions for Customers
We believe the combination of our premier content, large user base and data and technology expertise provides a unique platform for a wide range of health-focused entities to fulfill their key strategic marketing and communications needs by effectively engaging with their target audience. We have built deep relationships with many leading pharmaceutical, over-the-counter, retail, food and lifestyle marketers, as well as health payers and providers, that view us as a strategic and trusted partner for complex digital initiatives that target specific population sets with customized engagement solutions. For example, during 2015, our customers included five of the top ten global advertisers in 2014, as compiled by Advertising Age, and 24 of the top 25 global pharmaceutical companies ranked by 2014 revenue. We also service more than 350 hospitals across 30 states, including six of the top ten largest health systems in the U.S. Our customers are all focused on the following four elements when implementing their marketing and communications campaigns:
| · | identifying their target audience; |
| · | efficiently and effectively reaching this target audience; |
| · | engaging this target audience to achieve a specific marketing and/or communications objective; and |
| · | measuring the performance of their marketing and/or communications initiatives. |
Our premier content has generated a large and highly-engaged audience across the health spectrum. We have collected a large amount of data about our audience over the years from a variety of sources. Since inception, more than 70 million consumers have registered with us, voluntarily providing us with important demographic information and data relating to specific health interests and conditions. Our registration information is supplemented with data aggregated from millions of anonymous health consumer profiles we have built since our inception, data collected from our users’ interactions with one or more of our properties and with other websites through the use of cookies and similar tracking technologies, and data obtained from third-party sources.
This database of information about our audience has allowed us to create customized offerings that enable our customers to effectively target their desired audience through highly immersive interactive and multi-platform campaigns. Our solutions include, among others:
| · | traditional media solutions, such as banner advertisements and e-mail newsletters; |
| · | interactive brand sponsorships, which consist of sponsored custom-created marketing programs; |
| · | customer acquisition, or lead generation, campaigns designed to deliver qualified users through the registration process; and |
| · | a SaaS-based platform for hospital systems to engage with consumers and healthcare professionals. |
Given the size and scope of our content and audience assets, marketers have significant flexibility to undertake multiple marketing and communications strategies through a single platform directed at specific geographic areas or niche demographic groups, health interests, issues or user communities. For example, for a pharmaceutical customer with a multiple sclerosis drug, we have implemented a multi-faceted campaign to deliver highly-targeted and engaging messaging to their target audience. This campaign included, among other things: (i) utilizing interactive brand sponsorships promoting multiple sclerosis content across our properties; (ii) targeting the relevant audience across television and digital video assets; and (iii) using our database to target their desired audience beyond our properties and across the web.
In addition to offering a wide range of solutions for our diverse customer base, we also utilize a variety of revenue models with our customers, depending on the specific needs and profile of the customer. For example, we may price our services on (i) a fixed fee basis; (ii) a cost-per-impression (CPM) or cost-per-visitor (CPV) basis; (iii) the return-on-investment (ROI) we deliver from a specific campaign; or (iv) a SaaS licensing fee. An increasing number of our marketing programs provide for revenues to us based entirely upon the ROI we deliver for our customers, such as the increase in prescription activity for a pharmaceutical product.
Pharmaceutical companies represent our largest customer segment. Our acquisitions of DoctorDirectory in November 2014 and Cambridge BioMarketing in March 2015 have significantly expanded our revenue opportunity and the range of services we can provide to these pharmaceutical customers. The DoctorDirectory acquisition enhanced our ability to offer innovative multi-platform solutions that target healthcare professionals not being covered by a pharmaceutical sales representative, while the Cambridge BioMarketing acquisition enhanced our strategic launch and marketing solutions for pharmaceutical brands focused on orphan and rare diseases. As a result, we are now able to offer solutions to our pharmaceutical customers across their product portfolio, whether orphan, specialty or mass-market, and across the product lifecycle, whether pre-launch, during the patent exclusivity period or post-patent exclusivity.
An important area of focus for us is providing solutions for orphan and rare diseases. The orphan and rare disease market is estimated to grow from $90 billion in 2013 to $176 billion by 2020, accounting for approximately 19% of all branded-drug sales by 2020, up from approximately 9% in 2006. Approximately 47% of the new molecule drug approvals by the FDA in 2015 were for orphan or rare diseases. Through Cambridge BioMarketing, we are able to provide pharmaceutical brands focused on orphan and rare diseases with a compelling marketing solution from pre-launch to launch to post-launch. Our solution includes preparing the brand’s internal communications and global marketing tools, increasing market awareness of the disease and patient identification, advising the brand on critical launch issues, navigating the FDA approval process, launching the product on a global scale, and conducting post-launch audience outreach to patients and healthcare professionals to support continued brand growth.
Another important area of focus for us is leveraging our content, audience and data assets to provide solutions for health insurers and hospital systems that are increasingly seeking to engage directly with consumers and healthcare professionals with targeted marketing campaigns. By virtue of our acquisition of Tea Leaves in August 2015, our core offering for hospital facilities and systems is a SaaS-based marketing and analytics platform used to reach and engage both consumers and physicians. Our platform enables a hospital to better drive its growth strategy and generate profitable revenue by identifying high value customers and engaging in segmented and targeted marketing campaigns using proprietary and third-party data, such as payer distribution, medical history, health claims data, purchase history and behavioral data. Hospital systems can use our sophisticated software platform to recruit new patients and physicians, retain existing patients and physicians, influence where physicians refer their patients and control costs.
Our health insurance clients can leverage our platform to recruit consumers and better manage medical conditions and daily health across areas such as nutrition, stress, physical activity and weight loss. Our core offering for health payers is our Maternity Outcomes Management (MOM) program, which leverages our What to Expect property and connects pregnant women with their insurance carrier’s risk management programs earlier in their pregnancies, which allows payers to identify risk factors earlier and introduce meaningful interventions, if necessary, so as to ensure safer and healthier pregnancies. According to the Centers for Disease Control and Prevention, pregnancy complications represent a $26 billion annual cost burden to the U.S. healthcare system.
8
We supplement the information we collect about our audience by partnering with third parties to expand our reach and increase the diversity of our audience. For example, through our relationship with the Mayo Clinic, we manage and sell advertising opportunities on MayoClinic.org. Additionally, we utilize our data expertise, including our advertising buying platform, to enable marketers to efficiently reach our audience and their look-alikes on third-party websites, mobile devices, social channels and video outlets and more effectively optimize their marketing spend.
We believe a key differentiator of our business is our ability to use our extensive data assets to provide customers across our customer base with more significant and measurable ROI relative to offline and other digital channels. Our proprietary technology (i) optimizes the relevancy of marketing campaigns placed across our properties and outside of our properties to deliver marketing messages that users are most likely to engage with and (ii) tracks and measures the effectiveness of our customers’ marketing campaigns. For example, we are able to attribute revenue to specific marketing spend, gain visibility into the lifetime performance of users and ultimately assess and improve a campaign’s ROI. Our technology allows us to adjust the campaign in real-time to improve its efficacy. Furthermore, we provide our customers with detailed post-campaign reporting that allows them to measure and evaluate the effectiveness of their campaigns.
Many of our large marketing and engagement campaigns also include specific ROI goals which we are able to effectively measure due to our large opt-in registration database. By partnering with industry-leading data companies, such as IMS and Crossix, that anonymously match a user’s online campaign exposure to their offline purchase decisions, we can further provide a demonstrable and third-party verified ROI measurement that reflects sales impact. As noted above, we also conduct certain marketing campaigns that provide for revenues to us based entirely upon the ROI we deliver for our customers, such as the increase in prescription activity for a pharmaceutical product. For example, we created an ROI-based marketing campaign for a pharmaceutical customer seeking deeper connections with a limited number of high-value medical specialists who wrote the majority of the prescriptions for their rheumatoid arthritis drug. We utilized an integrated suite of promotional tactics, including online advertising, e-mail and direct mail marketing services, which resulted in an increase of approximately 9% in prescriptions from the targeted physicians as compared to a control test group, generating more than $31 million in incremental revenue since the campaign launched in 2014. Likewise, our platform for hospital clients can incorporate the hospital’s internal data, including medical and financial records, allowing us to effectively measure the specific ROI for marketing campaigns that we implement on the hospital’s behalf.
We sell our marketing and communications solutions primarily through our direct sales force. As a result of the growth in our business and the diversification of our solutions for customers, our sales personnel now specialize in selling distinct product sets. Specifically, we have dedicated sales personnel selling solutions that target consumers and a distinct sales group for solutions targeting healthcare professionals, as well as a third group selling our SaaS and media solutions targeting hospital systems and health insurance companies. Our sales representatives, consisting of more than 100 employees, are located in New York City, Asheville, North Carolina, Cambridge, Massachusetts, Chicago, Illinois and other areas throughout the U.S.
Technology
Our technology infrastructure provides for continuous availability of our content offerings and customer solutions. Currently, our websites are hosted on infrastructure located in a third-party data center located in Carlstadt, New Jersey with a back-up data center located in Scottsdale, Arizona. The infrastructure of our Tea Leaves software platform for hospital systems is currently located in Atlanta, Georgia and will be moved to Alpharetta, Georgia in 2016. Our operations are dependent in part on our ability, and the ability of our hosting providers, to maintain our computer and telecommunications systems in effective working order and to protect our systems against damage from fire, theft, natural disaster, power loss, telecommunications failure, hacker attacks, computer viruses and other events beyond our control. We back up our data using a combination of a secondary data center, electronic vaulting and tape storage to offsite storage facilities on a daily basis. We also operate intrusion detection systems and perform regular log reviews for malicious activity. We operate our database in a multi-node platform using a technology designed to support large data sets and transaction volumes. Our technology allows us to aggregate, store and process large amounts of data while maintaining high application availability and responsiveness.
Our systems are designed to have no single point of failure, other than the data center itself, and have redundancy at the network, power, firewall, load balancer, application server, database and storage levels. We maintain operational flexibility, which allows us to allocate resources to or from applications based on demand. We continually add and refine functionality for our properties, ensuring that each modification is carefully tested and deployed before being moved into production by following a strict change management process. We have access to bandwidth on demand and additional physical capacity in each of our data centers to react to increased volume on our websites. We monitor systems continuously using automated tools and services. Emergency response teams provide full time coverage to respond to any issues affecting user functionality or performance.
We employ several layers of security, including encryption, secure transmission protocols and strict access controls, to ensure privacy, integrity and availability of our data. We utilize additional levels of security for e-commerce transactions, specifically when credit-card processing is required, including background checks of relevant employees and regular third-party security scans.
The key components of our software have primarily been designed, developed and deployed by our internal technology group. However, we also license database management software, outsource video delivery for our properties and otherwise use external sources for technological purposes when appropriate. We select external technology partners according to stability, reputation, performance and proven service levels.
Competition
We face competition for consumers, healthcare professionals and customers from a variety of online and offline companies, government agencies and other organizations that provide content, tools and applications to consumers and healthcare professionals interested in health-related information. Our ability to compete successfully against these entities depends on many factors, including:
| · | the brand recognition of Everyday Health and our other properties; |
| · | the quality, timeliness and reliability of our offerings; |
| · | the effectiveness of our sales and marketing efforts; and |
| · | our ability to keep pace with technological advances and trends. |
We face competition from the following:
| · | websites, mobile applications and other products and services that provide online consumer health and wellness information, such as www.webmd.com, or information directed at healthcare professionals, such as www.medscape.com (owned by WebMD); |
| · | general interest consumer websites or search engines that offer specialized health sub-channels or functions, such as www.yahoo.com and www.google.com, and other high-traffic websites that include both health-related and non-health-related content and services, including social media websites, such as www.facebook.com; |
| · | non-profit and governmental websites that provide consumer health information, such as www.fda.gov, www.cdc.gov and www.health.nih.gov; |
| · | advertising agencies that market digital products and services directly to customers; |
9
| · | software solutions for hospital systems to engage with consumers and/or healthcare professionals, such as Advisory Board Company and eVariant; and |
| · | advertising technology companies that aggregate traffic from multiple online websites or directly target health-related consumers. |
We also face competition from a number of companies that provide consumer and professional health-oriented content through traditional offline media. These competitors include magazine and book publishers, medical content publishers and distributors of television and video programming.
Intellectual Property
We currently own approximately 60 registered trademarks around the world, including Everyday Health and MedPage Today. In addition, we own two U.S. patents. Our success depends upon our ability to protect our core technology and intellectual property. To accomplish this, we rely on a combination of intellectual property rights, including trade secrets, trademarks, copyrights and patents, as well as contractual restrictions. We enter into confidentiality and proprietary rights agreements with our employees, consultants and business partners, and we control access to and distribution of our proprietary information. In addition, we have registered various domain names, including www.EverydayHealth.com, www.MedPageToday.com and www.TeaLeavesHealth.com, which are critical to the operation of our business and our properties. However, not all of our intellectual property is protected by registered copyrights or other registered intellectual property or statutory rights. For example, some of our content is protected by user agreements that limit access to and use of such content.
In addition to the technology and intellectual property that we own, we also license key health-related content and tools from third parties that we distribute on the properties that we operate. We also license data, software and technology products that are important to our ability to manage and deliver content and market and sell our products and services.
Our ability to operate some of our properties is governed by licensing agreements with the owners of the offline brands and associated content, including Heidi Murkoff, author of the best-selling book What to Expect When You’re Expecting. These licensing agreements provide us with the exclusive rights, subject to limited exceptions, to use and market the brand and associated content online, as well as to determine the precise methods for monetizing the content online. In exchange for these rights, our partners receive specified royalties based on the revenues generated from our operation of the applicable website and related services, such as e-mail newsletters and product sales. We may also create new content in conjunction with these partners. However, pursuant to our agreements with these partners, we may not own the intellectual property rights to this new content or any related user-generated content.
Industry Standards and Government Regulation
This section describes the key laws, regulations and industry standards that affect our business. Some of the aspects described below, such as those surrounding consumer protection, affect us directly. Other aspects do not apply to us directly, but may have a significant effect on the way our partners and customers can operate.
Consumer Protection
Our business is subject to federal and state consumer protection laws that regulate unfair and deceptive practices. The laws that most directly affect our business are those related to the use and protection of consumer information and those related to advertising and marketing.
Privacy
Our collection, storage and sharing of information regarding consumers, including visitors to our properties, is governed by various U.S. federal and state laws, regulations and standards. Enforcement by regulators, including the Federal Trade Commission, or the FTC, requires us to provide consumers with notice, choice, security and access with respect to such information.
Behavioral Advertising
New laws and regulations may be adopted in the U.S. and internationally, or existing laws and regulations may be interpreted in new ways that would affect our business, particularly with regard to collection or use of data to target advertisements to consumers. A number of U.S. states have proposed bills that contain provisions that would regulate how companies can use cookies and other tracking technologies to collect and use information about individuals and their behaviors.
We participate in the Digital Advertising Alliance, or DAA, self-regulatory program under which we provide consumers with notice about our use of cookies and our collection and use of data in connection with the delivery of targeted advertising. In July 2015, the World Wide Web Consortium published tentative standards for developing a “Do Not Track” program to allow users to opt-out of having companies collect information about their online actions. In addition, the DAA and The National Telecommunication and Information Association have developed principles and guidelines for providing users disclosures regarding the use of consumer data on mobile platforms.
Consumers can currently opt out of the placement or use of our cookies for online targeted advertising purposes by either deleting or disabling cookies on their browsers, visiting websites that allow consumers to place an opt-out cookie on their browsers, or by downloading browser plug-ins and other tools that can be set to identify cookies and other tracking technologies and/or block the delivery of online advertisements on websites and applications. In addition, the default settings of consumer devices and software, including web browsers, may be set to prevent the placement of cookies unless the consumer actively elects to allow them.
10
Data Protection Regulation
Many states have passed laws regulating the actions that a business must take if it experiences a data breach. Compromised companies must promptly disclose breaches to customers. Congress has also contemplated similar federal legislation relating to data breaches and the Health Information for Economic and Clinical Health Act of 2009, or HITECH, requires breaches of certain unsecured, individually identifiable health information to be reported. In the past, the FTC has prosecuted some data breach cases as unfair and deceptive acts or practices under the Federal Trade Commission Act. We intend to continue to protect all consumer data and to comply with all applicable laws regarding the protection of customer data.
CAN-SPAM Act
The CAN-SPAM Act regulates commercial e-mails, provides a right on the part of the recipient to request the sender to stop sending messages, and establishes penalties for the sending of e-mail messages that are intended to deceive the recipient as to source or content. Recipients must be furnished with an electronic method of informing the sender of the recipient’s decision to not receive further commercial e-mails. We are applying the CAN-SPAM requirements to our e-mail communications, and believe that our practices comply with the requirements of the CAN-SPAM Act. In addition, actions could be brought against us under various state spam laws, which are not entirely preempted by CAN-SPAM.
COPPA
The Children’s Online Privacy Protection Act, or COPPA, applies to operators of commercial websites and online services, including mobile applications, directed to U.S. children under the age of 13 that collect personal information from children, and to operators of general audience websites with actual knowledge that they are collecting information from U.S. children under the age of 13. In April 2013, the FTC updated its COPPA regulations to specify that the law applies to using cookies for behavioral targeting, device IDs, location data, video and photos for children under 13. Our websites and mobile applications are not directed at children under the age of 13. We believe that we are in compliance with COPPA.
Marketing
The marketing of our services and some of the marketing services we provide to our customers are subject to federal and state consumer protection laws that regulate unfair and deceptive practices. For example, in October 2009, the FTC published Guides Concerning the Use of Endorsements and Testimonials in Advertising and the FTC provided further guidance on the use of endorsements in June 2015. The FTC has indicated that “material connections,” such as payments or free products, between advertisers and endorsers, such as celebrities and bloggers, must be disclosed. In addition, advertisements that feature a consumer and convey his or her experience with a product or service as typical when that is not the case are required to clearly disclose the results that consumers can generally expect to receive from the advertised product or service. In March 2013, the FTC released updated guidance for mobile and online advertisers, known as the Dot Com Disclosures, to explain how to make required disclosures clear and conspicuous in online and mobile advertising to avoid deception. In December 2015, the FTC issued an Enforcement Policy Statement on Deceptively Formatted Advertisement that addressed how disclosures should be made for certain native advertising and sponsored content.
Regulation of Contests and Sweepstakes
In order to promote our properties and advertisers, we conduct contests and sweepstakes. Many states have prize, gift or sweepstakes statutes that apply to these promotions. We strive to comply with all applicable laws and regulations when we run these promotions.
Healthcare-Related Regulation
Regulation of Drug and Medical Device Advertising and Promotion
Information on our properties that promotes the use of pharmaceutical products or medical devices is subject to U.S. Food and Drug Administration, or FDA, and FTC requirements, and information regarding other products and services is subject to FTC requirements. The Federal Food, Drug, and Cosmetic Act, or FDC Act, requires that prescription drugs, including biological products, be approved by the FDA prior to marketing. The FDA allows for exchange of scientific information prior to approval, provided it is non-promotional in nature and does not draw explicit or implied conclusions regarding the ultimate safety or effectiveness of the unapproved drug. Upon approval, prescription drugs may be promoted and advertised only for uses reviewed and approved by the FDA. In addition, the labeling and advertising can be neither false nor misleading, and must present all material information, including potential risks, in a clear, conspicuous and neutral manner. There are also requirements for specified information to be part of labeling and advertising. Labeling and advertising that violate these legal standards are subject to FDA enforcement action and the FDA may impose administrative, civil and criminal sanctions for violations of the FDC Act or FDA regulations. State attorneys general have similar investigative tools and sanctions available to them.
The FDA also regulates the safety, effectiveness, and labeling of over-the-counter, or OTC, drugs under the FDC Act either through specific product approvals or through regulations that define approved claims for specific categories of such products. The FTC regulates the advertising of OTC drugs under the section of the Federal Trade Commission Act that prohibits unfair or deceptive trade practices. The FDA and FTC regulatory framework requires that OTC drugs be labeled in accordance with FDA approvals or regulations and promoted in a manner that is truthful, adequately substantiated, and consistent with the labeled uses. OTC drugs that do not meet these requirements are subject to FDA or FTC enforcement action depending on the nature of the violation. In addition, state attorneys general may bring enforcement actions for alleged unfair or deceptive advertising.
11
Companies may now advertise prescription drugs to consumers in any medium, provided that they satisfy FDA requirements. However, legislators, physician groups and others have called for restrictions on advertising of prescription drugs to consumers and increased FDA enforcement. Congress and the FDA have shown interest in these issues, as well. In January 2014, the FDA issued draft guidance entitled Fulfilling Regulatory Requirements for Postmarketing Submissions of Interactive Promotional Media for Prescription Human and Animal Drugs and Biologics, which indicated pharmaceutical and medical device companies may be responsible for content on third-party websites over which the company has influence or control. Companies may also be responsible for content created by an employee or agent acting on the company’s behalf. The draft guidance counseled that companies should submit to the FDA listings for all websites for which the company is responsible or actively participates. In June 2014, the FDA released draft guidance entitled Correcting Independent Third-Party Misinformation About Prescription Drugs and Medical Devices, which outlined circumstances when companies may be responsible for correcting misinformation that was created or distributed by third parties. That same month, the FDA provided additional draft guidance entitled Internet/Social Media Platforms with Character Space Limitations—Presenting Risk and Benefit Information for Prescription Drugs and Medical Devices and Internet/Social Media Platforms, which stated promotions in social media channels must adhere to the same fair balance requirements applicable to traditional media.
Industry trade groups, such as the Pharmaceuticals Research and Manufacturers of America, or PhRMA, have implemented voluntary guidelines for DTC advertising in response to public concerns. The PhRMA Guiding Principles for Direct to Consumer Advertisement of Prescription Medicines address various aspects of DTC advertising, including: balancing presentation of benefits and risks; the timing of DTC campaigns, including allowing for a period for education of healthcare professionals prior to launching a branded DTC campaign; use of healthcare professionals and celebrities in DTC advertisements; and timing and placement of advertisements with adult-oriented content.
HIPAA Privacy Standards and Security Standards
The Privacy Standards and Security Standards under the Health Insurance Portability and Accountability Act of 1996, or HIPAA, establish a set of basic national privacy and security standards for the protection of certain individually identifiable health information by health plans, healthcare clearinghouses and healthcare providers, referred to as covered entities, and the business associates with whom such covered entities contract for services. HITECH makes certain of HIPAA’s privacy and security standards also directly applicable to covered entities’ business associates. As a result, business associates are now subject to significant civil and criminal penalties for failure to comply with applicable privacy and security rule requirements. HIPAA directly applies to covered entities such as Tea Leaves’ hospital clients. Since these clients disclose protected health information to Tea Leaves that it uses to provide certain services to them, Tea Leaves is a business associate of those clients. Moreover, HITECH creates a new requirement to report certain breaches of unsecured, individually identifiable health information and imposes penalties on entities that fail to do so. Additionally, certain states have adopted comparable privacy and security laws and regulations, some of which may be more stringent than HIPAA.
Licensed Professional Regulation
The practice of most healthcare professions requires licensing under applicable state law. In addition, the laws in some states prohibit business entities from practicing medicine. Similar state prohibitions may exist with respect to other licensed professions. We do not believe that we engage in the practice of medicine or any other licensed healthcare profession, and we have attempted to structure our websites, tools, partner relationships and other operations to avoid violating these state licensing and professional practice laws. We do not believe that we provide professional medical advice, diagnosis, treatment, or other advice that is tailored in such a way as to implicate state licensing or professional practice laws. We employ and contract with physicians, nutritionists and fitness instructors who provide only medical, nutrition and fitness information to consumers.
Anti-Kickback Laws
There are federal and state laws that govern patient referrals, physician financial relationships and inducements to healthcare providers and patients. The federal healthcare program’s anti-kickback law prohibits any person or entity from offering, paying, soliciting or receiving anything of value, directly or indirectly, for the referral of patients covered by Medicare, Medicaid and other federal healthcare programs. Many states also have similar anti-kickback laws that are not necessarily limited to items or services for which payment is made by a federal healthcare program. In 2002, the Office of the Inspector General of the U.S. Department of Health and Human Services, the federal government agency responsible for interpreting the federal anti-kickback law, issued an advisory opinion that concluded that the sale of advertising and sponsorships to healthcare providers and vendors by web-based information services implicates the federal anti-kickback law. However, the advisory opinion suggests that enforcement action will not result if the fees paid represent fair market value for the advertising or sponsorship arrangements, the fees do not vary based on the volume or value of business generated by the advertising, and the advertising and sponsorship relationships are clearly identified as such to users. We carefully review our practices to ensure that we comply with all applicable laws.
Employees
As of December 31, 2015, we had approximately 700 employees. None of our employees is represented by a labor union or is subject to a collective bargaining agreement. We have not experienced an employment-related work stoppage and consider relations with our employees to be good.
Information about Segment and Geographic Revenue
Information about segment and geographic revenue is set forth in Note 2 of the notes to the consolidated financial statements under Item 8 of this Annual Report on Form 10-K.
Corporate History
We were incorporated in Delaware in January 2002 as Agora Media Inc. We changed our name to Waterfront Media Inc. in January 2004. In January 2010, to better align our corporate identity with the Everyday Health brand, we changed our name to Everyday Health, Inc.
12
Our principal executive office is located at 345 Hudson Street, 16th Floor, New York, NY 10014, and our telephone number is (646) 728-9500.
We completed our initial public offering in March 2014 and our common stock is listed on the New York Stock Exchange under the symbol “EVDY.”
The names Everyday Health, MedPage Today, Tea Leaves Health, Cambridge BioMarketing and DoctorDirectory and our logos are trademarks, service marks or trade names owned by us. All other trademarks, service marks or trade names appearing in this Annual Report on Form 10-K are owned by their respective holders.
Available Information
Our website is located at www.EverydayHealth.com, and our investor relations website is located at http://ir.everydayhealth.com/. Copies of our Annual Reports on Form 10-K, Quarterly Reports on Form 10-Q, Current Reports on Form 8-K, and amendments to these reports filed or furnished pursuant to Section 13(a) or 15(d) of the Securities Exchange Act of 1934, as amended, or the Exchange Act, are available, free of charge, on our investor relations website as soon as reasonably practicable after we file such material electronically with or furnish it to the Securities and Exchange Commission, or the SEC. The SEC also maintains a website that contains our SEC filings. The address of the website is www.sec.gov. Further, a copy of this Annual Report on Form 10-K is located at the SEC’s Public Reference Room at 100 F Street, NE, Washington, D.C. 20549. Information on the operation of the Public Reference Room can be obtained by calling the SEC at 1-800-SEC-0330. The information on, or that can be accessed through, any Everyday Health property is not incorporated by reference into this Annual Report on Form 10-K and inclusion of the website addresses of our properties in this Annual Report on Form 10-K are inactive textual references only.
13
You should carefully consider the following risk factors, in addition to the other information contained in this Annual Report on Form 10-K and the information incorporated by reference herein. If any of the events described in the following risk factors occurs, our business, operating results and financial condition could be seriously harmed.
This Annual Report on Form 10-K also contains forward-looking statements that involve risks and uncertainties. Our actual results could differ materially from those anticipated in the forward-looking statements as a result of factors that are described below and elsewhere in this Annual Report on Form 10-K.
Risks Related to Our Business
We have incurred significant losses since our inception and expect to incur losses in the future.
We have accumulated significant losses since our inception. As of December 31, 2015, our accumulated deficit was $130.7 million. We expect to continue to incur significant operating expenses and, as a result, we will need to generate significant revenues to achieve or sustain profitability. We may not be able to achieve or sustain profitability on a quarterly or annual basis in the future.
If we are unable to provide content and services that attract users to Everyday Health properties on a consistent basis, our advertising and sponsorship revenues could be reduced.
Our users, including consumers and healthcare professionals, have numerous other online and offline sources of health and wellness related information and product offerings. Our ability to compete for user traffic depends upon our ability to provide compelling and trusted health and wellness content, tools, mobile applications and other services that meet the needs of a variety of types of users. Our ability to do so depends, in turn, on:
| · | our ability to develop innovative tools and mobile applications, as well as implement new and updated features and services for existing tools and applications; |
| · | our ability to hire and retain qualified authors, journalists and independent writers; |
| · | our ability to license quality content from third parties; and |
| · | our ability to monitor and respond to increases and decreases in user interest in specific topics. |
If users do not perceive our content, mobile applications and tools to be useful, reliable and trustworthy, we may not be able to attract or retain users or otherwise maintain or increase the frequency and duration of their visits to our properties. We cannot assure you that we will be able to continue to develop or acquire needed content, applications and tools at a reasonable cost or on a timely basis. The revenue opportunities generated from these efforts may fail to justify the amounts spent.
If we are unable to prove that our advertising and sponsorship solutions provide an attractive return on investment for our customers, our financial results could be harmed.
We derive a significant majority of our revenues from the sale of digital advertising and sponsorship solutions. Our ability to grow our advertising and sponsorship revenues will be dependent on our ability to demonstrate to marketers that their marketing campaigns with us provide a meaningful ROI relative to offline and other online opportunities. In fact, certain of our marketing campaigns are designed such that the revenues we receive are based entirely upon the ROI we deliver for our customers. We have invested significant resources in developing our research, analytics and campaign effectiveness capabilities and expect to continue to do so in the future. Our ability, however, to demonstrate the value of advertising and sponsorship on Everyday Health properties will depend, in part, on the sophistication of our analytics and measurement capabilities, the actions taken by our competitors to enhance their offerings, whether we meet the ROI expectations of our customers and a number of other factors. If we are unable to maintain sophisticated marketing and communications solutions that provide value to our customers or demonstrate our ability to provide value to our customers, our financial results will be harmed.
14
Our failure to attract and retain users in a cost-effective manner could compromise our ability to grow our revenues and become profitable.
Our continued success is highly dependent on our ability to attract and retain consumers and healthcare professionals in a cost-effective manner. In order to attract users to our properties, we must expend considerable amounts of money and resources for advertising and marketing. We use a diverse mix of marketing and advertising programs to promote our properties, and we have spent, and expect to continue to spend, significant amounts of money on these initiatives. Significant increases in the pricing of one or more of these initiatives will result in higher marketing costs. Our failure to attract and acquire new, and retain existing, users in a cost-effective manner would make it more difficult to maintain and grow our revenues and ultimately to achieve profitability.
Increasingly, individuals are using mobile devices to access online content, applications and services and, if we fail to capture a significant share of this growing market opportunity or fail to generate revenues from it, our business could be adversely affected.
The number of consumers and healthcare professionals who access online content, applications and services through smartphones, tablets and other mobile devices has increased dramatically in the past few years. Accordingly, the portion of our page views from mobile devices has increased rapidly and is expected to continue to increase in the foreseeable future. To compete in this area, we must develop content, applications and tools for mobile devices that:
| · | users find engaging; |
| · | work with a variety of mobile operating systems and networks; and |
| · | achieve a high level of market acceptance. |
If we fail to capture a significant share of this increasingly important portion of the market, it could adversely affect our business. As mobile technology continues to evolve, it is difficult to predict the problems we may encounter in developing and maintaining a robust mobile offering and we may need to devote additional resources to the creation, maintenance and support of our mobile offerings. Even if demand for our mobile applications continues to grow and we achieve a significant share of this market, we cannot assure you that we will be able to achieve significant revenues or profits from these efforts. If we are unable to successfully implement monetization strategies for our mobile offerings, our revenues and financial results may be negatively affected.
Our advertising and sponsorship revenues are frequently derived from short-term contracts that may not be renewed.
Many of our advertising and sponsorship contracts are short-term commitments and are subject to termination by the customer. Despite the short-term nature of these commitments, we typically expend significant resources over a lengthy sales cycle to obtain these contracts. Moreover, the time between the execution of a contract with the advertiser or sponsor for a program and the delivery of our services may be longer than expected, especially for larger contracts, and may be subject to delays over which we have little or no control. Our current customers may not fulfill their obligations under their existing contracts or continue to advertise with us beyond the terms of their existing contracts. If a significant number of our customers, or a few large customers, decide to reduce their expenditures with us or to discontinue advertising with us, we could experience a material decline in our revenues.
Our advertising and sponsorship revenues are subject to fluctuations due to a number of factors that are beyond our control, including the timing and amount of expenditures by our customers.
Advertising and sponsorship revenues comprise a significant majority of our revenues. Our advertising and sponsorship revenues accounted for approximately 90.1% and 90.3% of our total revenues for the years ended December 31, 2015 and 2014, respectively. Advertising spending in the markets in which we compete can fluctuate significantly as a result of a variety of factors, many of which are outside of our control. These factors include:
| · | variations in expenditures by advertisers due to budgetary constraints; |
| · | the cancellation, non-renewal or delay of campaigns; |
| · | advertisers’ internal review process; |
| · | the cyclical and discretionary nature of advertising spending; |
| · | the timing of FDA approvals of prescription drugs and medical devices; |
| · | regulatory changes affecting advertising and promotion of prescription drugs and medical devices; |
| · | seasonal factors relating to the prevalence of specific health conditions and other seasonal factors that affect the promotion of specific products; and |
| · | general economic conditions, including those specific to the Internet and media industries. |
Our quarterly revenues and operating results are subject to significant fluctuations, and these fluctuations may adversely affect the trading price of our common stock.
We have experienced, and expect to continue to experience, significant fluctuations in our quarterly revenues and operating results. Our quarterly revenues and operating results may fluctuate significantly due to a number of factors, many of which are outside of our control. These factors include:
| · | traffic levels to our properties; |
| · | our ability to introduce new and appealing content, applications and tools that will drive the growth of our user base; |
| · | the spending priorities and advertising budget cycles of specific advertisers; |
| · | the addition or loss of advertisers; |
| · | the addition of new websites, mobile applications and services by us or our competitors; |
| · | changes in our pricing policies or those of our competitors; and |
| · | costs relating to our ongoing efforts to improve our content and advertising-based service offerings. |
In addition, seasonal factors can also affect our operating results. For example, we have historically experienced an increase in advertising and sponsorship revenues in the fourth calendar quarter due primarily to the seasonal spend patterns of our customers.
15
As a result of these seasonal and quarterly fluctuations, we believe that comparisons of our quarterly results of operations are not necessarily meaningful and that these comparisons are not reliable as indicators of our future performance. In addition, these fluctuations could result in volatility in our operating results and may adversely affect our cash flows. As our business grows, these seasonal fluctuations may become more pronounced. Any seasonal or quarterly fluctuations that we report in the future may differ from the expectations of securities analysts and investors. This could cause the price of our common stock to decline.
Our inability to sustain or grow our advertising rates, or our inability to manage the pace of change in the advertising technology industry, could adversely affect our operating results.
The rates charged for advertising on the Internet, including in the health sector, have fluctuated over the past few years due to a variety of factors, including the growth in use of search engines, the increase in the use of automated or programmatic advertising buying, growth of the mobile advertising market, general economic conditions and competitive offerings. We have committed significant resources to delivering content and advertising-based services designed to appeal to our customers by engaging users in a more interactive and personalized manner and seeking to provide a higher return on our customers’ advertising expenditures. However, our customers may not perceive our content offerings and advertising-based services as sufficiently valuable to justify the payment of our rates. Moreover, given the inherent difficulties in delivering a rich advertisement on mobile channels, the increasing reliance of our customers on automated or programmatic advertising buying networks and the focus by advertisers on enforcing viewability requirements for their advertising impressions, we may encounter difficulties in obtaining the prices that we seek for our advertising solutions. If we are unable to maintain our historical, or grow to anticipated, pricing levels for advertising, we will experience difficulties in maintaining or growing our revenues. As the advertising industry develops new concepts and technology to deliver and price advertising inventory, we may also incur additional costs to keep pace with these changes and to implement more effective products and services.
A significant portion of the traffic to our properties is directed to us through algorithmic search results on Internet search engines and, if we are listed less prominently in search result listings, our business and operating results could be harmed.
A significant portion of the traffic to our properties is directed to us through the algorithmic search results on Internet search engines such as Google. Algorithms are used by search engines to determine search result listings, and the order of such listings, displayed in response to specific searches. Accordingly, we seek to design our properties to deliver that content and tools in ways that will cause them to rank well in algorithmic search engine results, which makes it more likely that search engine users will visit our properties. This is commonly referred to as search engine optimization, or SEO. However, there can be no assurance that our SEO efforts will succeed in improving the ranking of our content or, even if they do result in such improvement, that the improved ranking will result in increased numbers of users and page views for our properties. In addition, search engines frequently change the criteria that determine website rankings in their search results, and our SEO efforts will not be successful if we do not respond to those changes appropriately and on a timely basis. Search engine providers may also prioritize search results generated by certain types of queries, including health queries, based on criteria they select or may otherwise intermediate in the search results generated, which could, in some circumstances, reduce the ranking that would otherwise be provided to our properties and increase the ranking of other properties. If we are unable to respond effectively to changes made by search engine providers in their algorithms and other processes, a substantial decrease in traffic to our properties could occur, which could cause our revenues to decrease and have a material adverse effect on our results of operations.
Our properties may also become listed less prominently in unpaid search results for other reasons, such as search engine technical difficulties, search engine technical changes and changes we make to our properties. In addition, search engines have deemed the practices of some companies to be inconsistent with search engine guidelines and have decided not to list their websites in search result listings at all. If listed less prominently or not at all in search result listings for any reason, the traffic to our properties would likely decline, which could harm our operating results. If we decide to attempt to replace this traffic, we may be required to increase our marketing expenditures, which could also harm our operating results.
If we are unsuccessful in generating revenues from health payers and providers, we may not be able to achieve our growth and business objectives.
Historically, we principally focused on providing health and wellness content to consumers and healthcare professionals and providing marketing solutions to our customers, consisting principally of pharmaceutical, consumer-packaged-goods, retail and over-the-counter product companies. However, an important component of our growth strategy involves leveraging our core assets to pursue adjacent opportunities across the broader health and wellness sector. In 2014, we created a healthcare solutions division that would leverage our existing core assets to offer health payers and providers various marketing and other products and services. In 2015, we acquired Tea Leaves Health, LLC, or Tea Leaves, a provider of a SaaS-based marketing and analytics platform for hospital systems to identify and engage consumers and physicians. However, our experience in developing new products and services for hospital systems, health insurance companies and other new potential customers is limited. Therefore, we may not achieve our revenue forecasts for our healthcare solutions business or we may encounter unanticipated issues in growing this business. Likewise, we may need to make additional investments in product development and sales and marketing in order to effectively grow this business. If we are unable to successfully integrate the Tea Leaves acquisition or develop new offerings or we are unable to successfully market our offerings to these new potential customers, we may not be able to achieve our growth and business objectives.
Failure to maintain and enhance our brands could have a material adverse effect on our business.
We believe that our brand identity is critical to the success of our business and in maintaining our reputation as a trusted source of health and wellness information. We also believe that maintaining and enhancing our brands are vital to expanding our user base and growing our relationships with advertisers. We believe that the importance of brand recognition and user loyalty will only increase in light of increasing competition in our markets. Some of our existing and potential competitors, including search engines, media companies and other online content providers, have well established brands with greater recognition and market penetration. We have expended considerable resources on establishing and enhancing the Everyday Health brand, as well as the brands of our other properties, such as MedPage Today, Cambridge BioMarketing and Tea Leaves. We have developed policies and procedures that are intended to preserve and enhance these brands, including editorial procedures designed to control the quality of our content. We expect to continue to devote significant additional resources and efforts to enhance our brands. However, we may not be able to successfully maintain or enhance awareness of our brands, and events outside of our control may have a negative effect on our brands.
16
The decline in the popularity of our partners would adversely affect our ability to grow our business and revenues.
We depend on partnership arrangements under which we license content from third parties, including What to Expect. We believe that such content is an important element of our business and helps to differentiate us from our competitors. We have also entered into agreements with entities such as the Mayo Clinic to monetize their properties by selling advertising and sponsorships.
We rely on the popularity and credibility of these partners and they may not retain their current appeal or may become subject to negative publicity. The popularity and credibility of the properties associated with these partners also depend on the quality and acceptance of competing content released into the marketplace at or near the same time, the availability of alternative sources for the information, general economic conditions and other tangible and intangible factors, all of which are difficult to predict. User preferences change frequently, and it is a challenge to anticipate what offerings will be successful at a certain point in time. Any decline in the popularity of the content offerings, or any negative publicity, whether individually or with respect to the content offerings associated with the properties associated with these partners, may have an adverse impact on our business and revenues.
The significant decline in our premium subscription-based business could adversely affect our operating results.
Our premium services consist primarily of digital subscriptions sold to users who purchase access to one of our properties or to a specific interactive service or application, including www.Diet.MayoClinic.org. As our growth strategy has evolved to focus primarily on marketing and communications solutions rather than consumer subscription revenue, we have experienced a decline in our subscription revenues. In addition, our agreement regarding www.SouthBeachDiet.com recently expired and our agreement regarding www.JillianMichaels.com will expire in the second quarter of 2016. Therefore, we expect the decline in our total subscription revenues to continue. However, our subscription revenues may decline at a more rapid rate than anticipated, and our financial results could be negatively impacted.
Future acquisitions could disrupt our business and harm our financial condition and operating results.
Since our inception, we have acquired a number of complementary businesses, products and technologies. Most recently, in August 2015, we acquired Tea Leaves. We intend to continue to seek other complementary acquisitions in the future. Acquisitions and investments involve numerous risks, including:
| · | potential negative impact on our financial results because they may require us to incur charges and substantial debt or liabilities, may require us to amortize, write down or record impairment of amounts related to deferred compensation, goodwill and other intangible assets, or may cause adverse tax consequences, substantial depreciation or deferred compensation charges; |
| · | difficulty in assimilating the operations and personnel of acquired businesses and/or unexpected expenses in connection therewith; |
| · | potential disruption of our ongoing businesses and distraction of our management and the management of acquired companies; |
| · | potential loss of key personnel, customers or users from either our current business or an acquired company’s business; |
| · | unanticipated expenses relating to implementing or improving internal controls, procedures and policies appropriate for a public company of a business that prior to the acquisition lacked these controls, procedures and policies; |
| · | potential litigation resulting from our business combinations or acquisition activities; and |
| · | potential unknown liabilities associated with the acquired businesses. |
Our inability to integrate any future acquired business successfully or the failure to achieve any expected synergies could result in increased expenses and a reduction in expected revenues or revenue growth. In addition, we may not be able to identify or consummate any future acquisition on favorable terms, or at all. If we do pursue an acquisition, it is possible that we may not realize the anticipated benefits from the acquisition or that the financial markets or investors will negatively view the acquisition. As a result, our stock price could fluctuate or decline.
The costs associated with potential acquisitions or strategic partnerships could dilute your investment or adversely affect our results of operations.
In order to finance acquisitions, investments or strategic partnerships, we may use equity securities, debt, cash or a combination of the foregoing. Any issuance of equity securities or securities convertible into equity may result in substantial dilution to our existing stockholders, reduce the market price of our common stock or both. Any debt financing is likely to increase our interest expense and include financial and other covenants that could have an adverse impact on our business. In addition, an acquisition may involve non-recurring charges, including write-downs of significant amounts of intangible assets or goodwill. The related increases in expenses could adversely affect our results of operations. Any such acquisitions or strategic alliances may require us to obtain additional equity or debt financing, which may not be available on commercially acceptable terms, or at all. We do not intend to seek security holder approval for any such acquisition or security issuance unless required by applicable law, regulation or the terms of our existing securities.
Our growth could strain our personnel, technology and infrastructure resources. If we are unable to implement appropriate controls and procedures to manage our growth, we may not be able to successfully implement our business plan.
Our growth in our business and operations, including the integration of a number of acquisitions, has placed a significant strain on our management, administrative, technological, operational and financial infrastructure. Anticipated future growth, including growth related to the broadening of our content offerings and marketing services and our expansion into new product offerings, will continue to place similar strains on our management, technology and infrastructure. Our success will depend in part upon our ability to manage our growth. To manage the expected growth of our business and operations, we will need to continue to improve our operational, financial, technological and management controls and our reporting systems and procedures. The resulting additional capital investments will increase our costs, which will make it more difficult for us to offset any future revenue shortfalls by offsetting cost reductions in the short term.
We face significant competition in attracting both users and customers.
The markets for healthcare marketing and communications solutions are intensely competitive, continually evolving and, in some cases, subject to rapid change. Our properties face competition from numerous other companies, both in attracting users and in generating revenue from marketers. We compete for users and marketers with the following:
17
| · | websites, mobile applications and other products and services that provide online health and wellness information directed at consumers and/or healthcare professionals, including both commercial websites and non-profit and governmental websites; |
| · | general interest consumer websites or search engines that offer specialized health sub-channels or functions and other high-traffic websites that include both health-related and non-health-related content and services, including social media websites; |
| · | advertising agencies that market digital products and services directly to customers; |
| · | software solutions for hospital systems to engage with consumers and/or healthcare professionals; |
| · | advertising technology companies that aggregate traffic from multiple websites or directly target consumers; and |
| · | offline publications and information services. |
As we continue to diversify the breadth of our content offerings and marketing services, we expect our competitors to further expand as well. Our current and future competitors may offer new categories of content, products or services before we do, which may give them a competitive advantage when trying to attract consumers or advertisers. Moreover, both existing and potential users may perceive our competitors’ offerings to be superior to ours.
Many of our current and potential competitors have longer operating histories, larger customer bases, greater brand recognition and significantly greater financial, marketing and other resources than we do. As a result, we could lose market share to our competitors, and our revenues could decline.
We may not be able to attract, hire and retain qualified personnel in a cost-effective manner, which could impact the quality of our products and services and the effectiveness of our management, resulting in increased costs and lower revenues.
Our success depends on our ability to attract, hire and retain, at commercially reasonable rates, qualified editorial, sales and marketing, data sciences, customer support, technical, financial and accounting, legal and other managerial personnel. The competition for personnel in the industries in which we operate is intense and our personnel are often presented with compelling new opportunities. Our personnel may terminate their employment at any time for any reason, and in the recent past, a number of our talented personnel have terminated their employment with us to seek other opportunities. Loss of personnel may result in increased costs for replacement hiring and training. If we fail to attract and hire new personnel, or retain and motivate our current personnel, we may not be able to operate our businesses effectively, serve our users and customers properly or maintain the quality of our products and services.
Given the tenure and experience of our Chief Executive Officer, and his guiding role in developing our business and growth strategy since our inception, our growth may be inhibited, or our operations may be impaired, if we were to lose his services.
Our growth and success depends to a significant extent on our ability to retain Benjamin Wolin, our Chief Executive Officer, who co-founded our company and has led the growth and management of our business since its inception. The loss of the services of Mr. Wolin could result in our inability to manage our operations effectively and to implement our business strategy. This may cause our stock price to fluctuate or decline. Further, we cannot assure you that we would be able to successfully integrate a newly-hired chief executive officer with our existing management team.
There are a number of risks associated with expansion of our business internationally.
Although currently our international operations are not material, expansion into international markets remains a potential opportunity to grow our business. In addition to facing many of the same challenges we face domestically, there are additional risks and costs inherent in expanding our business in international markets. These include:
| · | strong local competitors that are better attuned to the local culture and preferences; |
| · | the need to adapt the content and advertising programs on our properties to meet local needs and to comply with local legal and regulatory requirements; |
| · | limitations on our activities in foreign countries; |
| · | more restrictive data protection regulation, which may vary by country; |
| · | difficulties in staffing and managing multinational operations; |
| · | foreign political and economic uncertainty; |
| · | currency exchange-rate fluctuations; and |
| · | potential adverse tax requirements. |
We have limited experience in managing international operations. As a result, we may face difficulties and unforeseen expenses in expanding our business internationally, and even if we attempt to do so, we may be unsuccessful.
Risks Related to Our Intellectual Property and Technology Platform
If our intellectual property and technologies are not adequately protected to prevent use or misappropriation by our competitors, the value of our brand and other intangible assets may be diminished, and our business may be adversely affected.
Our future success and competitive position depend in part on our ability to protect our proprietary technologies and intellectual property. We rely, and expect to continue to rely, on a combination of confidentiality and licensing agreements with our employees, consultants and third parties, along with trademark, copyright, patent and trade secret protection laws, to protect our proprietary technologies and intellectual property. These measures and agreements may not effectively prevent disclosure of confidential information, including trade secrets, and may not provide an adequate remedy in the event of unauthorized disclosure of confidential information. We could potentially lose future intellectual property protection if any unauthorized disclosure of such information occurs.
18
We rely on our trademarks, trade names and brand names to distinguish our products and services from the products and services of our competitors, and have registered or applied to register many of these trademarks. We cannot assure you that our trademark applications will be approved. Third parties may also oppose our trademark applications, or otherwise challenge our use of the trademarks. In the event that our trademarks are successfully challenged, we may be forced to rebrand our products and services, which could result in a loss of brand recognition, and could require us to devote resources to advertising and marketing new brands.
We also possess intellectual property rights in aspects of our content, technology and software products. However, we do not register copyrights in our content or software. Copyrights of U.S. origin must be registered before the copyright owner may bring an infringement suit in the U.S. If one of our unregistered copyrights of U.S. origin is infringed by a third party, we will need to register the copyright before we can file an infringement suit in the U.S., and our remedies in any such infringement suit may be limited. Typically, our content is primarily protected by user agreements that limit access to and use of our content. Compliance with use restrictions is difficult to monitor, and our copyright rights may be more difficult to enforce than other forms of intellectual property rights.
We have applied for patent protection in the U.S. relating to certain products, processes and services. We may also rely on unpatented proprietary technology. We cannot assure you that the steps we take will be adequate to protect our technologies and intellectual property, that our patent applications will lead to issued patents, that others will not develop or patent similar or superior technologies, products or services, that our patents and other intellectual property will not be challenged, invalidated or circumvented by others or that the patents that we own will be of sufficient scope or strength to provide us with any meaningful protection or commercial advantage.
The legal standards relating to the validity, enforceability and scope of protection of intellectual property rights in Internet-related industries are uncertain and still evolving. If the protection of our technologies and intellectual property is inadequate to prevent use or appropriation by third parties, the value of our brand and other intangible assets may diminish. In addition, third parties may knowingly or unknowingly infringe our patents, copyrights, trademarks and other intellectual property rights, and litigation may be necessary to protect and enforce our intellectual property rights. Any such litigation could be costly and divert management’s attention and resources away from our business. We also expect that the more successful we are, the more likely that competitors will claim that we infringe on their intellectual property or proprietary rights. Even if these claims do not result in liability to us, we could incur significant costs in investigating and defending against these claims.
Our ability to deliver personalized content, measure the performance of marketing campaigns and provide customer solutions depends on our ability to collect and use data, and any limitations on the collection and use of this data could significantly diminish the value of our solutions.
Our ability to deliver personalized content, measure and optimize the performance of marketing campaigns and deliver solutions to our customers depends on our ability to utilize the data we collect directly from our users, data we collect from user engagement with our properties, data we receive from our customers and data we obtain from third parties. Our users voluntarily provide us with demographic and other information when they register for one of our websites or mobile applications. We also employ cookies and other personal identifiers to personalize content and advertising. Cookies are small files placed on an Internet user’s computer that are used to collect information related to the user, such as the history of the user’s interactions with our properties or third-party websites. In order to deliver marketing and communications solutions to pharmaceutical companies, health insurers and hospital systems, we rely on data provided by our customers. We also purchase data from third-party sources to augment our user profiles and marketing databases so we are better able to personalize content, enhance our analytical capabilities and better target our marketing programs.
If changes in user sentiment regarding the sharing of information results in a significant number of visitors to our websites and applications refusing to provide us with demographic information or information about their specific health interests, our ability to personalize content for our users and provide targeted marketing solutions would be impaired. If our users choose to opt-out of having their data used for behavioral targeting, it would be more difficult for us to offer targeted marketing programs to our customers. In addition, a material increase in the number of users who either opt out of accepting cookies or who use browsers, devices or applications that limit the use of cookies or other tracking technologies could negatively impact our ability to collect valuable data and provide marketing solutions to our customers. Likewise, if new laws or regulations limit the ability of our customers to share data with us or if our customers are unwilling to provide us data, our ability to provide marketing solutions and to develop new products will be impaired.
We append data from third-party sources to augment our user profiles. If we are unable to acquire data from third-party sources for whatever reason, or if there is a marked increase in the cost of obtaining such data, our ability to personalize content and provide marketing solutions could be negatively impacted.
Our possession and use of personal information presents risks that could harm our business. Unauthorized disclosure or manipulation of such data, whether through breach of our network security or otherwise, could expose us to costly litigation and damage our reputation.
Our operations are dependent in part on our ability, and that of our hosting providers, to maintain our computer and telecommunications systems in effective working order and to protect our systems against damage from fire, theft, natural disaster, power loss, telecommunications failure, hacker attacks, computer viruses and other events beyond our control. Maintaining our network security is of critical importance because we use and store confidential user, employee, customer and other sensitive data, such as names, addresses, credit card numbers and other personal information, including health claims data and information about a user’s health interests.
We and our vendors use commercially available encryption technology when transmitting sensitive personal information over public networks. We also use security and business controls to limit access to, and use of, personal information. Third parties may be able to circumvent these security and business measures by developing and deploying viruses, worms and other malicious software programs that are designed to attack or infiltrate our systems and networks. In addition, employee error, malfeasance or other errors in the storage, use or transmission of personal information could result in a breach of registered user or employee privacy.
If third parties improperly obtain and use the personal information of our registered users or employees, we may be required to expend significant resources to resolve these problems. A major breach of our network security and systems could have serious negative consequences for our businesses, including:
| · | possible fines, penalties and damages; |
19
| · | customer and class action lawsuits; |
| · | reduced demand for our content offerings and marketing and communications solutions; |
| · | an unwillingness of customers to provide us their data; |
| · | an unwillingness of users to provide us with their credit card or payment information; |
| · | an unwillingness of registered users to provide us with personal information; |
| · | breach of our customer agreements; and |
| · | harm to our reputation and brand. |
Finally, privacy concerns in general may cause visitors to avoid online websites that collect information and may indirectly inhibit market acceptance of our products and services. In addition, if our privacy practices are deemed unacceptable by watchdog groups or privacy advocates, such groups may attempt to block access to our properties or disparage our reputation and business.
As a creator and a distributor of content over the Internet, we face potential liability for legal claims based on the nature and content of the materials that we create or distribute.
Users access health-related content through our properties, including information regarding particular medical conditions, diagnosis and treatment and possible adverse reactions or side effects from medications. If our content, or content we obtain from third parties, contains inaccuracies, it is possible that consumers who rely on that content or others may make claims against us with various causes of action. Although our properties contain terms and conditions, including disclaimers of liability, that are intended to reduce or eliminate our liability, third parties may claim that these online agreements are unenforceable. The law governing the validity and enforceability of online agreements is still evolving and subject to uncertainty. A finding by a court that these agreements are invalid and that we are subject to liability could harm our business and require us to make costly changes to our properties and related content policies.
Our editorial and other quality control procedures may not be sufficient to ensure that there are no errors or omissions in our content offerings or to prevent such errors and omissions in content that is controlled by our partners. Even if potential claims do not result in liability to us, investigating and defending against these claims could be expensive and time consuming and could divert management’s attention away from our operations.
If we become subject to these types of claims and are not successful in our defense, we may be forced to pay substantial damages. Our insurance may not adequately protect us against these claims. The filing of these claims may result in negative publicity and also damage our reputation as a high quality and trusted provider of health and wellness content and services.
Intellectual property claims against us could be costly and result in the loss of significant rights related to, among other things, our technology, properties and advertising and marketing activities.
From time to time, third parties may allege that we have violated their intellectual property rights. If we are forced to defend ourselves against intellectual property infringement claims, regardless of the merit or ultimate result of such claims, we may face costly litigation, diversion of technical and management personnel, limitations on our ability to use our current properties or inability to market or provide our content offerings or advertising-based services. As a result of any such dispute, we may have to:
| · | develop new non-infringing technology; |
| · | pay damages; |
| · | enter into royalty or licensing agreements; |
| · | cease providing certain content or advertising-based services; or |
| · | take other actions to resolve the claims. |
These actions, if required, may be costly, time-consuming or unavailable on terms acceptable to us, if at all. In addition, many of our partnering agreements require us to indemnify our partners for third-party intellectual property infringement claims, which could increase the cost to us of an adverse ruling in such an action.
Furthermore, we face potential suits and liability for negligence, copyright, patent or trademark infringement or other claims based on the nature of our content. These claims could potentially arise with respect to our technology and/or owned, licensed or user-provided content. Litigation to defend these claims could be costly, and any other liabilities we incur in connection with the claims could be significant.
In addition, we could be exposed to liability in connection with material posted to our properties and on social media websites by our employees and our users. Many of our properties offer consumers an opportunity to post comments and opinions and we may share such content on social media websites. Some of this user-provided content may infringe on third-party intellectual property rights or privacy rights or may otherwise be subject to challenge under copyright laws. Moreover, we could face claims for making such user-provided content available on our properties if users rely on such information to their detriment, particularly if the information relates to medical diagnosis and treatment. Such claims could divert management’s time and attention away from our business and result in significant costs to us, regardless of the merit of these claims.
If we cannot protect our domain names, our ability to successfully promote our brands will be impaired.
We currently own various web domain names, including www.EverydayHealth.com and www.MedPageToday.com, that are critical to the operation of our business. The acquisition and maintenance of domain names, or Internet addresses, is generally regulated by governmental agencies and domain name registrars. The regulation of domain names in the U.S. and in foreign countries is subject to change. Governing bodies may establish additional top-level domains, appoint additional domain name registrars or modify the requirements for holding domain names. As a result, we may be unable to acquire or maintain the relevant domain names needed to conduct business. We may be unable to prevent third parties from acquiring domain names that are similar to, infringe upon or otherwise decrease the value of our trademarks and other proprietary rights. This failure could impair our ability to increase market share and revenues.
20
Interruption or failure of our information technology and communications systems could impair our ability to effectively deliver our services, which could negatively impact our operating results.
Our business depends on the continuing operation of our technology infrastructure and systems. Any damage to or failure of our systems could result in interruptions in our ability to deliver offerings quickly and accurately and/or process visitors’ responses or customers’ queries. Interruptions in our service could disrupt our business, result in the disclosure or misuse of confidential or proprietary information, reduce our revenues and profits, and damage our reputation if people believe our systems are unreliable. Our systems and operations are vulnerable to damage or interruption from earthquakes, terrorist and/or cyber attacks, floods, fires, power loss, break-ins, security breaches, hardware or software failures, telecommunications failures, computer viruses or other attempts to harm our systems and similar events.
We rely on third-party vendors, including data centers and Internet bandwidth providers. Any disruption in the network access or co-location services provided by these third-party providers or any failure of these third-party providers to handle current or higher volumes of use could significantly harm our business. We may not maintain redundant systems or facilities for some of these services. In the event of a catastrophic event with respect to one or more of these systems or facilities, we may experience an extended period of system unavailability, which could negatively impact our relationship with our users and customers. In addition, system failures may result in loss of data, including customer data, user registration data, business intelligence data, content, and other data critical to the operation of our services, which could cause significant harm to our business and our reputation. Any financial or other difficulties our providers face may have negative effects on our business, the nature and extent of which we cannot predict.
An increase in the usage of our properties and solutions could strain the capacity of our technology infrastructure. Any capacity constraints we experience could lead to slower response times or system failures and adversely affect the availability of properties and the level of usage, which could result in the loss of customers or revenue or harm to our business and results of operations.
Any unscheduled interruption in our service would result in an immediate loss of revenue. Unscheduled interruptions in our software solutions could require us to provide credits and/or refunds to customers and result in the termination of customer contracts. Frequent or persistent system failures that result in the unavailability of any of our properties or slower response times could reduce the number of users accessing our properties, impair our delivery of advertisements and harm the perception of our properties as reliable, trustworthy and consistent sources of information. Our insurance policies provide only limited coverage for service interruptions and may not adequately compensate us for any losses that may occur due to any failures or interruptions in our systems.
Risks Related to Regulation of Our Industry
Laws and standards relating to privacy and data collection and use could impair our efforts to maintain and grow our audience and customer base, thereby decreasing our revenues.
We collect information from users who register to access certain content on our properties, from our customers and from third-party sources of data. Subject to the ability of our users to decline, we may use this information to provide our users content and advertising that may be of interest to them. We may also share information about registered users with our customers. Internet user privacy and the use of our users’ information to track online activities are issues that are subject to rigorous regulatory discussions and analysis both in the U.S. and abroad. We have privacy policies posted on our properties that we believe comply with laws applicable to us requiring notice about our information collection, use and disclosure practices. The U.S. federal and various state governments have adopted or proposed limitations on the collection, distribution and use of personal information of Internet users. Several foreign jurisdictions, including the European Union and Canada, have adopted legislation, including directives or regulations, that may limit our collection and use of information from Internet users in these jurisdictions. Enforcement by regulators, including the FTC, requires us to provide consumers with notice, choice, security and access with respect to such information. The standards are subject to interpretation by courts and other governmental authorities. We cannot assure you that the privacy policies and other statements we provide to users of our properties, or our practices with respect to these matters, will be found sufficient to protect us from liability or adverse publicity in this area.
Our software solutions depend on being able to receive data from our customers and third parties. A determination by a government agency, court or other governmental authority that any of our practices or the practices of our customers do not meet applicable standards or regulations, or the implementation of new standards or requirements, could result in liability and adversely affect our business. In addition, inquiries or proceedings involving foreign or U.S. data protection authorities may be expensive or time consuming, and their outcome is uncertain. Furthermore, we cannot assure you that our customers are currently in compliance, or will remain in compliance, with their own privacy policies, regulations governing consumer privacy or other applicable legal requirements.
In addition, growing public concern about privacy, data security and the collection, distribution and use of personal information has led to self-regulation of these practices by the Internet advertising and direct marketing industry. We participate in the DAA self-regulatory program under which we provide consumers with notice about our use of cookies and our collection and use of data in connection with the delivery of targeted advertising. Ensuring compliance with these industry standards could negatively impact our revenues or result in increased costs. Failure to comply with current or new industry standards could create liability for us, damage our reputation and result in a loss of users and customers.
We also may be subject to COPPA, which applies to operators of commercial websites and online services directed to U.S. children under the age of 13 that collect personal information from children, and to operators of general audience websites with actual knowledge that they are collecting information from U.S. children under the age of 13. Our properties are not directed at children under the age of 13, and our registration process utilizes age screening in order to prevent under-age registrations. We believe that we are in compliance with COPPA. COPPA, however, is subject to interpretation by courts and other governmental authorities. The failure to accurately anticipate the application, interpretation or legislative expansion of this law could create liability for us, result in adverse publicity and negatively affect our business.
21
Additionally, more burdensome laws or regulations, including consumer privacy and data security laws, could be enacted or applied to us or our customers. Such laws or regulations could impair our ability to collect user information that helps us to provide more targeted advertising to our users, thereby impairing our ability to maintain and grow our audience and maximize advertising and sponsorship revenues from our customers.
We face potential liability related to the privacy and security of health-related information we collect from, or on behalf of, our consumers and customers.
The privacy and security of information about the physical or mental health or condition of an individual is an area of significant focus in the U.S. because of heightened privacy concerns and the potential for significant consumer harm from the misuse of such sensitive data. We have procedures and technology in place intended to safeguard the information we receive from customers and users of our services from unauthorized access or use.
The Privacy Standards and Security Standards under HIPAA establish a set of basic national privacy and security standards for the protection of individually identifiable health information by health plans, healthcare clearinghouses and certain healthcare providers, referred to as covered entities, and the business associates with whom such covered entities contract for services. Notably, whereas HIPAA previously directly regulated only these covered entities, HITECH makes certain of HIPAA’s Privacy and Security Standards directly applicable to covered entities’ business associates. As a result, business associates are now subject to significant civil and criminal penalties for failure to comply with applicable Privacy and Security Standards. Moreover, HITECH creates a new requirement to report certain breaches of unsecured, individually identifiable health information and imposes penalties on entities that fail to do so. The 2013 final HITECH omnibus rule modifies the breach reporting standard in a manner that will likely make more data security incidents qualify as reportable breaches. Additionally, certain states have adopted comparable privacy and security laws and regulations, some of which may be more stringent than HIPAA.
HIPAA directly applies to covered entities such as Tea Leaves’ hospital clients. Since these clients disclose protected health information to Tea Leaves that it uses to provide certain services to them, Tea Leaves is a business associate of those clients. Certain of our other current or future products and services may involve the collection of individually identifiable health information for HIPAA covered entities. In addition, we may sign business associate agreements in connection with the provision of the products and services developed for other third parties.
Failure to comply with the requirements of HIPAA or HITECH or any of the applicable federal and state laws regarding patient privacy, identity theft prevention and detection, breach notification, and data security may subject us to penalties, including civil monetary penalties and, in some circumstances, criminal penalties or contractual liability under agreements with Tea Leaves’ hospital clients. Any failure or perception of failure of our products or services to meet HIPAA, HITECH and related regulatory requirements could expose us to risks of investigation, notification, litigation, penalty, or enforcement, could adversely affect demand for our products and services, and force us to expend significant capital and other resources to modify our products or services to address the privacy and security requirements of our clients and HIPAA and HITECH. In addition, we are unable to predict what changes to the HIPAA Privacy Standards and Security Standards might be made in the future or how those changes could affect our business. Any new legislation or regulation in the area of privacy and security of personal information, including personal health information, could also adversely affect our business operations.
Developments in the healthcare industry could adversely affect our business.
A significant portion of our advertising and sponsorship revenues is derived from the healthcare industry, including pharmaceutical, over-the-counter and consumer-packaged-goods companies, and could be affected by changes affecting healthcare spending. Likewise, our healthcare solutions business intends to further grow our product and service offerings to payers and providers. Industry changes affecting healthcare spending could impact the market for these offerings. General reductions in expenditures by healthcare industry participants could result from, among other things:
| · | government regulation or private initiatives that affect the manner in which healthcare industry participants interact with consumers and the general public; |
| · | consolidation of healthcare industry participants; |
| · | reductions in governmental funding for healthcare; and |
| · | adverse changes in business or economic conditions affecting pharmaceutical companies or other healthcare industry participants. |
Even if general expenditures by industry participants remain the same or increase, developments in the healthcare industry may result in reduced spending in some or all of the specific market segments that we serve now or in the future. For example, use of our content offerings and the sale of our products and services could be affected by:
| · | changes in the design and provision of health insurance plans; |
| · | a decrease in the number of new drugs or pharmaceutical products coming to market; and |
| · | decreases in marketing expenditures by pharmaceutical companies as a result of governmental regulation or private initiatives that discourage or prohibit advertising or sponsorship activities by pharmaceutical companies. |
In addition, our customers’ expectations regarding pending or potential industry developments may also affect their budgeting processes and spending plans with us.
The healthcare industry has changed significantly in recent years. The Patient Protection and Affordable Care Act, as amended by the Health Care and Education Reconciliation Act of 2010, or, collectively, PPACA, seeks to reduce healthcare costs and decrease the number of uninsured legal U.S. residents by, among other things, requiring individuals to carry, and certain employers to offer, health insurance or be subject to penalties. PPACA also imposes various new regulations on health insurers, enhances remedies against fraud and abuse and contains provisions that will affect the revenues and profits of pharmaceutical and medical device companies, including new taxes on certain sales of their products. In addition, other legislative changes have been proposed and adopted since PPACA was enacted. These new laws may result in additional reductions in Medicare and other healthcare funding, which could have a material adverse effect on our customers and accordingly, our financial operations.
We expect that significant changes to the healthcare industry will continue to occur. However, the timing and impact of developments in the healthcare industry are difficult to predict. We cannot assure you that the demand for our offerings will continue to exist at current levels or that we will have adequate technical, financial and marketing resources to react to changes in the healthcare industry.
22
Government regulation of healthcare creates risks and challenges with respect to our compliance efforts and our business strategies.
The healthcare industry is highly regulated and subject to changing political, legislative, regulatory and other influences. Existing and future laws and regulations affecting the healthcare industry could create unexpected liabilities for us, cause us to incur additional costs and restrict our operations. Many healthcare laws are complex, and their application may not be clear. Our failure to accurately anticipate the application of these laws and regulations, or other failure to comply with such laws and regulations, could create liability for us. Even in areas where we are not subject to healthcare regulation directly, we may become involved in governmental actions or investigations through our relationships with customers that are regulated, and participation in such actions or investigations, even if we are not a party and not the subject of an investigation, may cause us to incur significant expenses.
For example, there are federal and state laws that govern patient referrals, physician financial relationships and inducements to healthcare providers and patients. The federal healthcare programs’ anti-kickback law prohibits any person or entity from willingly offering, paying, soliciting or receiving anything of value, directly or indirectly, to induce or reward, or in return for either the referral of patients covered by Medicare, Medicaid and other federal healthcare programs or the leasing, purchasing, ordering or arranging for or recommending the lease, purchase or order of any item, good, facility or service covered by these programs. Many states also have similar anti-kickback laws that are not necessarily limited to items or services for which payment is made by a federal healthcare program. Our sale of advertising and sponsorships to healthcare providers implicates these laws. However, we review our practices to ensure that we comply with all applicable laws. The laws in this area are broad and we cannot determine precisely how the laws will be applied to our business practices. Any determination by a state or federal regulatory agency that any of our practices violate any of these laws could subject us to liability and require us to change or terminate some portions of our business.
Further, we derive revenues from the sale of advertising and promotion of prescription and over-the-counter drugs. If the FDA or the FTC finds that any of the information provided on our properties violates FDA or FTC regulations, they may take regulatory or judicial action against us and/or the advertiser of that information. State attorneys general may also take similar action based on their state’s consumer protection statutes. Any increase or change in regulation of advertising and promotion in the healthcare industry could make it more difficult for us to generate and grow our advertising and sponsorship revenues.
In addition, the practice of most healthcare professions requires licensing under applicable state law and state laws may further prohibit business entities from practicing medicine, which is referred to as the prohibition against the corporate practice of medicine. Similar state prohibitions may exist with respect to other licensed professions. We believe that we do not engage in the practice of medicine or any other licensed healthcare profession, or provide, through our properties, professional medical advice, diagnosis, treatment or other advice that is tailored in such a way as to implicate state licensing or professional practice laws. However, a state may determine that some portion of our business violates these laws and may seek to have us discontinue those portions or subject us to penalties or licensure requirements. Any determination that we are a healthcare provider and acted improperly as a healthcare provider may result in liability to us.
We believe that none of our existing online services and mobile applications is subject to regulation as a medical device under applicable FDA regulations. However, it is possible that products and services that we may offer in the future could subject us to such regulation or that current rules could change or be interpreted to apply to some of our existing online services or mobile applications. Complying with such regulations could be burdensome and costly and could delay our introduction or new services or applications.
Changes in regulations could hurt our business and financial results.
It is possible that new laws and regulations or new interpretations of existing laws and regulations in the U.S. and elsewhere will be adopted covering issues affecting our business, including:
| · | privacy, data security and use of personally identifiable information; |
| · | copyrights, trademarks and domain names; and |
| · | marketing practices, such as e-mail or direct marketing. |
Increased government regulation, or the application of existing laws to online activities, could:
| · | decrease the growth rate of the Internet; |
| · | negatively impact our ability to generate revenues; |
| · | increase our operating expenses; or |
| · | expose us to significant liabilities. |
Our business could be harmed if we are unable to correspond with existing and potential consumers by e-mail.
We use e-mail as a significant means of communicating with our existing and potential consumers and healthcare professionals. The laws and regulations governing the use of e-mail for marketing purposes continue to evolve, and the growth and development of the market for commerce over the Internet may lead to the adoption of additional legislation or changes to existing laws. Such laws may impose additional restrictions on our ability to send e-mail to our users or potential users.
Notably, the CAN-SPAM Act regulates commercial e-mails, provides a right on the part of the recipient to request the sender to stop sending messages, and establishes penalties for the sending of e-mail messages that are intended to deceive the recipient as to source or content. An action alleging our failure to comply with the CAN-SPAM Act and the adverse publicity associated with any such action could result in less user participation and lead to reduced revenues from advertisers. If we were found to be in violation of the CAN-SPAM Act, applicable state laws not preempted by the CAN-SPAM Act, or foreign laws regulating the distribution of e-mail, whether as a result of violations by our partners or if we were deemed to be directly subject to and in violation of these requirements, we could be exposed to damages or penalties.
23
In addition to legal restrictions on the use of e-mail, Internet service providers and others typically attempt to block the transmission of unsolicited e-mail, commonly known as spam. If an Internet service provider or software program identifies e-mail from us as spam, we could be placed on a restricted list that would block our e-mail to consumers or potential consumers who maintain e-mail accounts with these Internet service providers or who use these software programs.
Failure to provide online CME as part of our MedPage Today offering could adversely affect our professional business.
Physicians utilize www.MedPageToday.com to fulfill their continuing medical education, or CME, obligations. Our CME activities, which are conducted as part of our MedPage Today offering, are planned and implemented in accordance with the current Essential Areas and Elements and the Policies of the Accreditation Council for Continuing Medical Education, or ACCME, which oversees providers of CME credit, and other applicable accreditation standards. We currently rely on Projects In Knowledge as our ACCME-accredited provider in connection with our CME offering. ACCME’s standards for commercial support of CME are intended to assure, among other things, that CME activities of ACCME-accredited providers, such as Projects In Knowledge, are independent of “commercial interests,” which are defined as entities that produce, market, re-sell or distribute healthcare goods and services, excluding certain organizations. “Commercial interests,” and entities owned or controlled by “commercial interests,” are ineligible for accreditation by the ACCME.
CME activities may be subject to government oversight or regulation by Congress, the FDA, the U.S. Department of Health and Human Services, and state regulatory agencies. Educational activities, including CME, directed at physicians have been subject to increased governmental scrutiny to ensure that sponsors do not influence or control the content of the activities. In the event that these regulatory challenges inhibit our ability to provide CME, or if Projects In Knowledge, our ACCME-accredited partner, elects to terminate its relationship with us and we are unable to identify a suitable replacement partner, our ability to continue to attract physicians to www.MedPageToday.com may suffer.
Risks Related to Ownership of Our Common Stock
Our share price may be volatile, which could result in substantial losses for investors.
The market price of shares of our common stock may be subject to wide fluctuations. Since our initial public offering, or IPO, in March 2014, our common stock has traded at prices as high as $19.89 per share and as low as $3.71 per share. The market price of our common stock may continue to fluctuate in response to the many risk factors listed in this section and other factors beyond our control, including:
| · | actual or anticipated fluctuations in our key operating metrics, financial condition and operating results; |
| · | issuance of new or updated research or reports by securities analysts; |
| · | our announcement of actual results for a fiscal period that are higher or lower than projected or expected results, or our announcement of revenues or earnings guidance that is higher or lower than expected; |
| · | fluctuations in the valuation of companies perceived by investors to be comparable to us; |
| · | share price and volume fluctuations attributable to inconsistent trading volume levels of our shares; |
| · | sales or expected sales of additional common stock; |
| · | announcements from, or operating results of, our competitors; or |
| · | general economic and market conditions. |
Furthermore, the stock markets have experienced extreme price and volume fluctuations that have affected and continue to affect the market prices of equity securities of many companies. These fluctuations often have been unrelated or disproportionate to the operating performance of those companies. These broad market and industry fluctuations, as well as general economic, political and market conditions such as recessions, interest rate changes or international currency fluctuations, may cause our common stock price to decline. As a result, you may lose some or all of your investment in our common stock. In the past, companies that have experienced volatility in the market price of their stock have been subject to securities class action litigation. We may be the target of this type of litigation in the future. Securities litigation against us could result in substantial costs and divert our management’s attention from other business concerns.
If we fail to maintain proper and effective internal and disclosure controls, our ability to produce accurate financial statements and other disclosures on a timely basis could be impaired.
The Sarbanes-Oxley Act of 2002, or the Sarbanes-Oxley Act, requires, among other things, that we maintain effective disclosure controls and procedures and internal control over financial reporting. We must perform system and process evaluation and testing of our internal control over financial reporting to allow management to report on the effectiveness of our internal control over financial reporting in our Form 10-K for that year, as required by Section 404 of the Sarbanes-Oxley Act. For as long as we remain an “emerging growth company” under the Jumpstart Our Business Startups, or JOBS Act, we expect to avail ourselves of the exemption from the requirement that our independent registered public accounting firm attest to the effectiveness of our internal control over financial reporting.
Compliance with the Sarbanes-Oxley Act will require that we incur substantial additional professional fees and internal costs to expand our accounting and finance functions and that we expend significant management efforts. If we or our independent registered public accounting firm identifies deficiencies in our internal control over financial reporting that are deemed to be material weaknesses, or if we are unable to comply with the requirements of Section 404 in a timely manner or assert that our internal control over financial reporting is effective, the market price of our stock could decline and we could be subject to sanctions or investigations by the New York Stock Exchange, the SEC or other regulatory authorities.
24
As an “emerging growth company” under the JOBS Act we are permitted to, and intend to, rely on exemptions from certain disclosure requirements.
We are an “emerging growth company” and, for as long as we continue to be an “emerging growth company,” we may choose to take advantage of exemptions from various reporting requirements applicable to other public companies including, but not limited to, not being required to have our independent registered public accounting firm audit our internal control over financial reporting as required by Section 404 of the Sarbanes-Oxley Act, reduced disclosure obligations regarding executive compensation in our periodic reports and proxy statements, and not being required to hold a nonbinding advisory vote on executive compensation or obtain stockholder approval of “golden parachute” payments. We could be an “emerging growth company” for up to five years, although, if we have more than $1.0 billion in annual revenue, the market value of our common stock that is held by non-affiliates exceeds $700 million as of June 30 of any year, or we issue more than $1.0 billion of non-convertible debt over a three-year period before the end of that five-year period, we would cease to be an “emerging growth company” as of the December 31 following such occurrence. Investors may find our common stock less attractive if we choose to rely on these exemptions, in which case the price of our common stock may suffer or there may be a less active trading market for our common stock and our stock price may be more volatile.
Our reported financial results may be adversely affected by changes in accounting principles applicable to us.
Generally accepted accounting principles in the U.S. are subject to interpretation by the Financial Accounting Standards Board, the American Institute of Certified Public Accountants, the SEC and various bodies formed to promulgate and interpret appropriate accounting principles. A change in these principles or interpretations could have a significant effect on our reported financial results, and could affect the reporting of transactions completed before the announcement of a change. In addition, the SEC has announced a multi-year plan that could ultimately lead to the use of International Financial Reporting Standards by U.S. issuers in their SEC filings. Any such change could have a significant effect on our reported financial results.
Our ability to raise capital in the future may be limited.
Our business and operations may consume resources faster than we anticipate. In the future, we may need to raise additional funds through the issuance of new equity securities, debt or a combination of both. Additional financing may not be available on favorable terms, or at all. If adequate funds are not available on acceptable terms, we may be unable to fund our capital requirements. If we issue new debt securities, the debt holders would have rights senior to common stockholders to make claims on our assets, and the terms of any debt could restrict our operations, including our ability to pay dividends on our common stock. If we issue additional equity securities, existing stockholders will experience dilution, and the new equity securities could have rights senior to those of our common stock. Because our decision to issue securities in any future offering will depend on market conditions and other factors beyond our control, we cannot predict or estimate the amount, timing or nature of our future offerings. Thus, our stockholders bear the risk of our future securities offerings reducing the market price of our common stock and diluting their interest.
We have significant debt service obligations as a result of our outstanding long-term indebtedness.
As of December 31, 2015, we had $111.1 million of outstanding borrowings pursuant to our credit facility. Under the terms of this credit facility, as amended, we are required to make principal and interest payments on these borrowings through the maturity date of this facility in November 2019. As a result, we must use a significant portion of cash generated by our operations to satisfy our ongoing debt service obligations. Additionally, we will be required to repay, extend or refinance these borrowings when they become due, and there is no guarantee that we will be able to do so on reasonable terms or at all. If we are unable to meet our debt service obligations or to satisfy our obligations when they mature, our creditors could among other things, declare a default and accelerate the timing of payments and exercise their liens on substantially all of our assets, which would have a material adverse effect on our business, operating results and financial condition.
Covenants in our credit facility restrict our operational flexibility.
The agreement governing our credit facility contains usual and customary restrictive covenants relating to our management and the operation of our business, including the following:
| · | incurring additional indebtedness; |
| · | making certain investments; |
| · | disposing of assets; |
| · | paying dividends and making other distributions to our stockholders; |
| · | engaging in mergers and acquisitions; and |
| · | granting liens on our assets. |
Our credit facility also requires us to maintain specified financial ratios. Our ability to meet the financial covenants could be affected by events beyond our control. Failure to comply with any of the operational or financial covenants under our credit facility could result in a default, which could cause our lenders to accelerate the timing of payments and exercise their liens on substantially all of our assets, which would have a material adverse effect on our business, operating results and financial condition.
Provisions of our certificate of incorporation, bylaws and Delaware law could deter takeover attempts.
Various provisions in our certificate of incorporation and bylaws could delay, prevent or make more difficult a merger, tender offer, proxy contest or other attempt to acquire control of our company. Our stockholders might view any transaction of this type as being in their best interest since the transaction could result in a higher stock price than the then-current market price for our common stock. Among other things, our certificate of incorporation and bylaws:
25
| · | authorize our Board of Directors to issue shares of preferred stock and to determine the price and other terms of those shares, including preferences and voting rights, without stockholder approval, which could be used to significantly dilute the ownership of a hostile acquiror; |
| · | divide our Board of Directors into three classes so that only approximately one-third of the total number of directors is elected each year; |
| · | permit directors to be removed only for cause and then only by a two-thirds vote of our stockholders; |
| · | prohibit stockholders from calling a special meeting of stockholders; |
| · | prohibit action by written consent of our stockholders; and |
| · | specify advance notice requirements for stockholder proposals and director nominations. |
We are subject to the provisions of Section 203 of the Delaware General Corporation Law regulating corporate takeovers and which has an anti-takeover effect with respect to transactions not approved in advance by our Board of Directors, including discouraging takeover attempts that might result in a premium over the market price for shares of our common stock. A Delaware corporation may opt out of this provision by express provision in its original certificate of incorporation or by amendment to its certificate of incorporation or bylaws approved by its stockholders. However, we have not opted out of, and do not currently intend to opt out of, this provision.
Our amended and restated certificate of incorporation designates the Court of Chancery of the State of Delaware as the exclusive forum for certain litigation that may be initiated by our stockholders, which could limit our stockholders’ ability to obtain a favorable judicial forum for disputes with us.
Pursuant to our amended and restated certificate of incorporation, unless we consent in writing to the selection of an alternative forum, the Court of Chancery of the State of Delaware will be the sole and exclusive forum for (i) any derivative action or proceeding brought on our behalf, (ii) any action asserting a claim of breach of a fiduciary duty owed by any of our directors, officers or other employees to us or our stockholders, (iii) any action asserting a claim arising pursuant to any provision of the Delaware General Corporation Law, our amended and restated certificate of incorporation or our amended and restated bylaws, or (iv) any action asserting a claim governed by the internal affairs doctrine. Our amended and restated certificate of incorporation further provides that any person or entity purchasing or otherwise acquiring any interest in shares of our common stock is deemed to have notice of and consented to the foregoing provision. The forum selection clause in our amended and restated certificate of incorporation may limit our stockholders’ ability to obtain a favorable judicial forum for disputes with us.
Sales of substantial amounts of our common stock in the public markets, or the perception that they might occur, could reduce the price that our common stock might otherwise attain and may dilute your voting power and your ownership interest in us.
Sales of a substantial number of shares of our common stock in the public market, or the perception that a substantial number of shares could be sold, could reduce the market price of our common stock. As of March 4, 2016, we had approximately 32.9 million shares of our common stock outstanding. These shares are generally freely tradable, subject, in the case of sales by our affiliates, to the volume limitations and other provisions of Rule 144 under the Securities Act of 1933, as amended, or the Securities Act. In addition, shares of our common stock subject to outstanding awards under our equity plans and upon exercise of an outstanding warrant, will generally become eligible for sale in the public market in the future, subject to certain contractual limitations and/or applicable vesting conditions. Sales of common stock by existing stockholders in the public market, the availability of these shares for sale, our issuance of securities or the perception that any of these events might occur could materially and adversely affect the market price of our common stock. In addition, the sale of these securities could impair our ability to raise capital through the sale of additional stock.
In addition, in the future, we may issue additional shares of common stock or other equity or debt securities convertible into common stock in connection with a financing, acquisition, litigation settlement, employee arrangements or otherwise. Any such issuance could result in substantial dilution to our existing stockholders and could cause our stock price to decline.
If securities or industry analysts change their recommendations regarding our stock adversely or cease coverage of our company, our stock price and trading volume could decline.
The trading market for our common stock will be influenced by the research and reports that industry or securities analysts publish about us or our business. If one or more of the analysts who covers us downgrades our stock, our stock price would likely decline. If one or more of these analysts ceases coverage of our company or fails to regularly publish reports on us, we could lose visibility in the financial markets, which in turn could cause our stock price or trading volume to decline.
We do not currently intend to pay dividends on our common stock and, consequently, your ability to achieve a return on your investment will depend solely on appreciation in the price of our common stock.
We have never declared or paid any cash dividends on our common stock and do not intend to do so for the foreseeable future. We currently intend to invest our future earnings, if any, to fund our growth. In addition, the provisions of our credit facility prohibit us from paying cash dividends without first obtaining the consent of our lenders. Therefore, you are not likely to receive any dividends on your common stock for the foreseeable future, and the success of an investment in shares of our common stock will depend upon any future appreciation in their value. There is no guarantee that shares of our common stock will appreciate in value or even maintain the price at which you purchase your shares.
Item 1B. Unresolved Staff Comments.
None.
26
Our corporate headquarters are currently located in a facility encompassing approximately 85,000 square feet of office space in a building at 345 Hudson Street in New York, New York pursuant to a lease which extends through October 2023.
We also lease office space in Washington, DC; Asheville, North Carolina; Cambridge, Massachusetts; Roswell, Georgia; North Adams, Massachusetts; Chicago, Illinois; and Mumbai, India. We utilize a third-party data center hosting facility located in Carlstadt, New Jersey and a back-up data center located in Scottsdale, Arizona.
We believe that our current facilities are generally in good operating condition and are sufficient to meet our needs for the foreseeable future.
We are not currently subject to any material legal proceedings.
Item 4. Mine Safety Disclosures.
None.
27
Item 5. Market for Registrant’s Common Equity, Related Stockholder Matters and Issuer Purchases of Equity Securities.
Price Range of Our Common Stock
Our common stock has traded on the New York Stock Exchange under the symbol “EVDY” since our initial public offering in March 2014. As of March 4, 2016, there were 32,866,363 shares of our common stock outstanding, which were held by 78 holders of record of our common stock. Because many of our shares of common stock are held by brokers and other institutions on behalf of stockholders, we are unable to estimate the total number of stockholders represented by these record holders. As of March 4, 2016, the closing price of our common stock as reported on the New York Stock Exchange was $5.59 per share.
The following table sets forth, for the periods indicated, the reported high and low sales prices per share of our common stock as reported on the New York Stock Exchange:
| High | Low | |||||||
| 2014 | ||||||||
| First Quarter (beginning March 28, 2014) | $ | 14.75 | $ | 13.01 | ||||
| Second Quarter | 19.89 | 11.84 | ||||||
| Third Quarter | 19.24 | 12.70 | ||||||
| Fourth Quarter | 15.21 | 10.86 | ||||||
| 2015 | ||||||||
| First Quarter | $ | 14.93 | $ | 11.44 | ||||
| Second Quarter | 14.24 | 10.41 | ||||||
| Third Quarter | 13.12 | 8.30 | ||||||
| Fourth Quarter | 10.59 | 5.34 | ||||||
| 2016 | ||||||||
| First Quarter (through March 4, 2016) | $ | 6.18 | $ | 3.71 | ||||
Dividend Policy
We have never declared or paid any cash dividends on our capital stock, and we do not currently intend to pay any cash dividends on our common stock in the foreseeable future. We expect to retain future earnings, if any, to fund the development and growth of our business. In addition, our credit facility prohibits us from paying dividends on our common stock without first obtaining the consent of our lenders. Any future determination as to the declaration and payment of dividends, if any, will be at the discretion of our Board of Directors and will depend on then existing conditions, including our financial condition, operating results, contractual restrictions, capital requirements, business prospects and other factors our Board of Directors may deem relevant.
28
Stock Performance Graph
We show below the cumulative total return to our stockholders during the period from March 28, 2014 through December 31, 2015 in comparison to the cumulative return on the Russell 2000 Index and the Research Data Group (RDG) Internet Composite Index during that same period. The results assume that $100 was invested on March 28, 2014 in our common stock or March 31, 2014 in the indexes listed above, including reinvestment of dividends, if any.
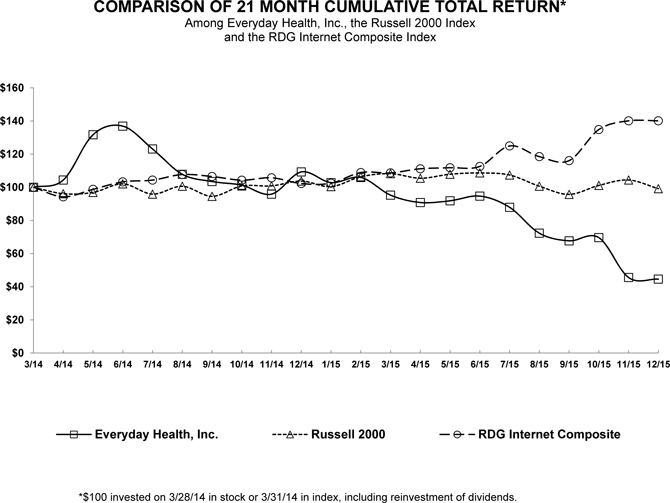
This information under “Stock Performance Graph” is not deemed filed with the SEC and is not to be incorporated by reference in any of our filings under the Securities Act or the Exchange Act, whether made before or after the date of this Annual Report on Form 10-K and irrespective of any general incorporation language in those filings.
Recent Sales of Unregistered Equity Securities
None.
Use of Proceeds
Not applicable.
29
Item 6. Selected Financial Data.
The following selected financial data should be read in conjunction with our consolidated financial statements and notes to our consolidated financial statements and “Management’s Discussion and Analysis of Financial Condition and Results of Operations” contained elsewhere in this Annual Report on Form 10-K. The selected Consolidated Statements of Operations data for the years ended December 31, 2015, 2014 and 2013 and Consolidated Balance Sheet data as of December 31, 2015 and 2014 have been derived from our audited financial statements appearing elsewhere in this Annual Report on Form 10-K. The selected Consolidated Statements of Operations data for the years ended December 31, 2012 and 2011 and the Consolidated Balance Sheet data as of December 31, 2013, 2012 and 2011 were derived from our audited consolidated financial statements, which are not included in this Annual Report on Form 10-K. Historical results are not necessarily indicative of future results.
30
| Year ended December 31, | ||||||||||||||||||||
| 2015 | 2014 | 2013 | 2012 | 2011 | ||||||||||||||||
| (in thousands, except share and per share data) | ||||||||||||||||||||
| Consolidated Statement of Operations Data: | ||||||||||||||||||||
| Revenues: | ||||||||||||||||||||
| Advertising and sponsorship revenues | $ | 209,093 | $ | 166,465 | $ | 134,893 | $ | 109,956 | $ | 96,191 | ||||||||||
| Premium services revenues | 22,898 | 17,860 | 20,957 | 23,536 | 29,582 | |||||||||||||||
| Video production fees | — | — | — | 5,000 | — | |||||||||||||||
| Total revenues | 231,991 | 184,325 | 155,850 | 138,492 | 125,773 | |||||||||||||||
| Operating expenses: | ||||||||||||||||||||
| Cost of revenues | 66,923 | 49,296 | 43,338 | 40,543 | 40,985 | |||||||||||||||
| Sales and marketing | 74,761 | 48,605 | 44,385 | 38,603 | 36,266 | |||||||||||||||
| Product development | 55,920 | 44,541 | 43,759 | 45,676 | 36,960 | |||||||||||||||
| General and administrative | 39,487 | 30,041 | 27,462 | 25,874 | 23,199 | |||||||||||||||
| Total operating expenses | 237,091 | 172,483 | 158,944 | 150,696 | 137,410 | |||||||||||||||
| Income (loss) from operations | (5,100 | ) | 11,842 | (3,094 | ) | (12,204 | ) | (11,637 | ) | |||||||||||
| Interest expense, net | (5,236 | ) | (3,711 | ) | (8,442 | ) | (4,898 | ) | (1,589 | ) | ||||||||||
| Other expense | — | (4,114 | ) | (359 | ) | (1,069 | ) | — | ||||||||||||
| Income (loss) from continuing operations before (provision) benefit for income taxes | (10,336 | ) | 4,017 | (11,895 | ) | (18,171 | ) | (13,226 | ) | |||||||||||
| (Provision) benefit for income taxes | (1,304 | ) | 8,666 | (1,102 | ) | (1,026 | ) | 615 | ||||||||||||
| Income (loss) from continuing operations | (11,640 | ) | 12,683 | (12,997 | ) | (19,197 | ) | (12,611 | ) | |||||||||||
| Loss from discontinued operations, net of tax | — | — | (5,239 | ) | (3,257 | ) | (2,590 | ) | ||||||||||||
| Net Income (loss) | $ | (11,640 | ) | $ | 12,683 | $ | (18,236 | ) | $ | (22,454 | ) | $ | (15,201 | ) | ||||||
| Basic net income (loss) attributable to common stockholders per common share: | ||||||||||||||||||||
| Net income (loss) attributable to common stockholders from continuing operations (1) | $ | (0.36 | ) | $ | 0.19 | $ | (2.55 | ) | $ | (4.01 | ) | $ | (2.74 | ) | ||||||
| Net loss attributable to common stockholders from discontinued operations, net of tax | $ | — | $ | — | $ | (1.03 | ) | $ | (0.68 | ) | $ | (0.56 | ) | |||||||
| Net income (loss) attributable to common stockholders (1) | $ | (0.36 | ) | $ | 0.19 | $ | (3.57 | ) | $ | (4.69 | ) | $ | (3.30 | ) | ||||||
| Diluted net income (loss) attributable to common stockholders per common share: | ||||||||||||||||||||
| Net income (loss) attributable to common stockholders from continuing operations (1) | $ | (0.36 | ) | $ | 0.17 | $ | (2.55 | ) | $ | (4.01 | ) | $ | (2.74 | ) | ||||||
| Net loss attributable to common stockholders from discontinued operations, net of tax | $ | — | $ | — | $ | (1.03 | ) | $ | (0.68 | ) | $ | (0.56 | ) | |||||||
| Net income (loss) attributable to common stockholders (1) | $ | (0.36 | ) | $ | 0.17 | $ | (3.57 | ) | $ | (4.69 | ) | $ | (3.30 | ) | ||||||
| Weighted-average common shares outstanding–basic and diluted: | ||||||||||||||||||||
| Basic | 31,977,246 | 24,259,395 | 5,103,351 | 4,791,474 | 4,607,675 | |||||||||||||||
| Diluted | 31,977,246 | 26,911,782 | 5,103,351 | 4,791,474 | 4,607,675 | |||||||||||||||
| (1) | For the year ended December 31, 2014, basic and diluted net income attributable to common stockholders per share includes an $8.1 million deemed dividend from the conversion of our Series G preferred stock on April 2, 2014. Refer to “Note 10—Common Stock and Preferred Stock” in the notes to the consolidated financial statements included in Part II, Item 8 of this Form 10-K. |
| As of December 31, | ||||||||||||||||
| 2015 | 2014 | 2013 | 2012 | 2011 | ||||||||||||
| (in thousands) | ||||||||||||||||
| Consolidated Balance Sheet Data: | ||||||||||||||||
| Cash and cash equivalents | $ | 30,097 | $ | 50,729 | $ | 16,242 | $ | 23,888 | $ | 27,238 | ||||||
| Working capital | 59,232 | 81,838 | 30,088 | 20,421 | 4,275 | |||||||||||
| Total assets | 369,598 | 312,835 | 192,149 | 195,464 | 181,507 | |||||||||||
| Deferred revenue | 8,655 | 6,740 | 6,808 | 6,018 | 11,297 | |||||||||||
| Redeemable convertible preferred stock | — | — | 158,766 | 158,766 | 158,766 | |||||||||||
| Long-term debt (including current portion) | 111,056 | 90,000 | 71,333 | 62,666 | 40,440 | |||||||||||
| Stockholders’ equity (deficit) | 180,269 | 173,286 | (89,969 | ) | (78,650 | ) | (64,126 | ) | ||||||||
31
Item 7. Management’s Discussion and Analysis of Financial Condition and Results of Operations.
Overview
We operate a leading digital marketing and communications platform for healthcare marketers seeking to engage and influence consumers and healthcare professionals. We combine premium health and wellness content with sophisticated proprietary data and analytics tools to enable healthcare marketers to communicate with our large audience of consumers and healthcare professionals. During 2015, our customers included five of the top ten global advertisers in 2014, as compiled by Advertising Age, 24 of the top 25 global pharmaceutical companies ranked by 2014 revenue, and more than 350 hospitals across 30 states, including six of the top ten largest health systems in the U.S.
We derive a significant majority of our revenues from the sale of digital advertising and sponsorship solutions that engage consumers and healthcare professionals across a variety of health categories. In recent years, we have significantly expanded our advertising and sponsorship market opportunity, diversified our customer base and increased the types of marketing solutions that we offer our customers. We specialize in providing highly-customized, data-driven solutions that can precisely target niche health audiences, and which are designed to be effective on a desktop or mobile device. We believe our customers view our data-driven digital marketing solutions as both superior to traditional media channels, which lack interactivity and the ability to measure and optimize return on investment, or ROI, in real time, and superior to other online media channels, which lack the data or technology to target the desired audience or measure the effectiveness of the campaign.
To a lesser extent, we generate revenues from the sale of our premium services, which consist primarily of (i) fees from hospitals for licensing our SaaS-based marketing and analytics platform and (ii) digital subscriptions sold to consumers for access to our consumer diet and fitness properties. In recent years, we have intentionally decreased our focus on generating revenues from consumer subscriptions and this trend will continue in 2016.
Prior to late 2010, our primary focus was on offering content and tools to consumers and selling marketing solutions targeting only health consumers. In late 2010, we made a strategic decision to expand our business into the market for providing content and marketing solutions targeting healthcare professionals through our acquisition of MedPage Holdings, Inc., or MPT. We believe that the entry into the healthcare professional market provided us with a significant revenue opportunity because pharmaceutical companies spend a larger percentage of their marketing budgets targeting healthcare professionals as compared to consumers.
In late 2014, we expanded further into the healthcare professional sector with the acquisition of DoctorDirectory.com, Inc., or DD, a provider of multi-channel marketing solutions for pharmaceutical brands seeking to influence healthcare professionals. The acquisition of DD helped deepen our penetration into the healthcare professional market by significantly increasing our physician audience and enhancing our sophisticated ROI-based marketing solutions that we offer advertisers seeking to engage with healthcare professionals.
In March 2015, we expanded our ability to service pharmaceutical companies through the acquisition of Cambridge BioMarketing Group, LLC, or Cambridge, a provider of strategic launch and marketing solutions for orphan and rare disease products. Following this acquisition, we believe that our platform can service our pharmaceutical partners across the entire spectrum of therapeutic areas, including orphan, specialty and mass market brands, as well as provide solutions throughout the entire lifecycle of pharmaceutical marketing, from the strategic phase of pre-launch, during the growth years and beyond the loss of patent exclusivity.
In 2014 and 2015, we made the strategic decision to leverage our existing assets to generate revenue from new customer bases across the broader healthcare landscape, particularly payers and providers. Specifically, the goal was to utilize our large, highly-engaged audience, premium content and tools, and advanced data and analytics capabilities to engage and influence consumers and healthcare professionals on behalf of entities such as health insurers and hospitals. In August 2015, we acquired Tea Leaves Health, LLC, or Tea Leaves, a provider of a SaaS-based marketing and analytics platform for hospital systems to identify and engage consumers and physicians. Tea Leaves generates revenues from multi-year contracts with recurring licensing fees, as well as related custom marketing programs that drive incremental advertising revenue. We believe there is a significant revenue opportunity in providing hospital systems with marketing solutions to target both consumers and physicians and to provide measurable ROI for their strategic planning and marketing efforts.
We expect our advertising and sponsorship revenues to increase in 2016. We expect our premium services revenue to decrease in 2016, as the increase in hospital SaaS revenue will be offset by the decline in consumer subscription revenues.
We also track our revenue performance across consumer, professional and payer/provider as customers may purchase a suite of Everyday Health solutions that incorporate licensing, media and other creative services. For example, with our hospital customers, we generate SaaS revenue from licensing our platform and advertising revenue from implementing marketing programs for the same hospitals. In 2015, our direct to consumer revenue was 63% of total revenue, our direct to professional revenue was 33% of total revenue and our revenue from payers and providers was 4% of total revenue. We expect our direct to professional revenue and revenue from payers and providers to increase as a percentage of our total revenues in 2016 and beyond.
Background Information
Key Trends Affecting Our Business
We believe that the following key trends drive our ability to continue to grow our business:
| · | Marketers are allocating an increasing proportion of their advertising budget to online advertising and are seeking solutions that better target their audience and maximize ROI. We believe that the ability to offer complex data-driven solutions that demonstrate ROI will be a key determinant in our success in attracting marketing dollars in the coming years. We also believe that the online percentage of the total health-related advertising market is still relatively small, and that this percentage will increase in the coming years. |
32
| · | The Internet and mobile devices have become indispensable for both consumers seeking to take a more active role in managing their diverse health and wellness needs and healthcare professionals striving to provide better care for their patients and manage their practices more efficiently. We believe that individuals will increasingly seek out digital content and solutions, and spend more time interacting with these digital channels, to educate themselves, directly manage and monitor their health and wellness, and make a wide array of other health-related purchase decisions, including purchasing health insurance. |
| · | The pharmaceutical industry is experiencing a major shift from large mass-market “blockbuster” drugs to niche or specialty medications that target discrete patient populations. At the same time, dramatically-reduced sales forces and other restrictions on interacting directly with physicians have made it more difficult for pharmaceutical companies to efficiently market their products and services. As a result, we believe the need for these companies to interact with consumers and physicians more directly through digital channels will increase significantly. |
| · | The evolving healthcare environment is forcing many health-related companies to face new challenges and adopt, in many cases for the first time, strategies targeting consumers and healthcare professionals. We believe our large and engaged audience, premium brands and rich database of user information afford us a significant opportunity to grow our revenues as these entities, including health insurance companies, pharmacy benefit management companies and health information technology vendors, seek new ways to drive down costs, acquire new customers and utilize technology to achieve better health outcomes. |
Revenues
Advertising and sponsorship revenues constitute a significant majority of our total revenues. We also generate revenues from premium services, which consist primarily of digital subscriptions sold to consumers and fees from hospitals for licensing our SaaS-based marketing and analytics platform.
Given the size and scope of our content and audience assets, we offer a variety of advertising and sponsorship solutions that engage consumers and healthcare professionals across a variety of health categories. Our diverse customer base for these marketing solutions consists primarily of pharmaceutical companies, manufacturers and retailers of over-the-counter products and consumer-packaged-goods, and, to a lesser extent, healthcare providers, such as hospital systems, and health insurers. Pharmaceutical companies represent our largest customer group. In addition to offering a wide range of marketing solutions, we also utilize a variety of revenue models depending on the specific needs and profile of the customer. For example, we may price our marketing solutions on (i) a fixed fee basis, (ii) a cost-per-impression (CPM) or cost-per-visitor (CPV) basis, or (iii) the ROI we deliver from a specific campaign. An increasing number of our marketing programs provide for revenues to us based primarily upon the ROI we deliver, such as the increase in prescription activity for a pharmaceutical product.
More specifically, our advertising and sponsorship solutions include, among others:
| · | display advertisements on our properties and in our free e-mail newsletters, which are primarily sold based on a cost-per-impression advertising model; |
| · | interactive brand sponsorships, which consist of our integrated database marketing programs and sponsorships on our properties, which typically include both components that are sold based on a cost-per-impression basis (in which we are paid based on the number of advertisements we display) and components that are sold based on a cost-per-visitor basis (in which we are paid for delivering a visitor to an advertiser’s website), and sometimes include a production fee; |
| · | customer acquisition marketing programs, which are sold based on the number of qualified potential customers that are provided to our advertisers; |
| · | programs that allow marketers the opportunity to target specific audiences outside of our properties using our audience data and analytics; |
| · | marketing programs that provide for revenues based upon the ROI we deliver for our customers, primarily pharmaceutical customers; and |
| · | marketing programs that are sold based on a time and materials basis. |
Although we typically do not distinguish between desktop and mobile channels in the structuring and pricing of our marketing campaigns, mobile channels have become increasingly important in fulfilling these campaigns as overall mobile traffic has increased. Revenues delivered via mobile channels increased 8.1% to $73.1 million in 2015 from $67.7 million in 2014.
Our premium services revenues include revenues generated from subscriptions sold to individuals who purchase access for a defined period of time to one or more of our properties. Our subscription services are designed to provide the consumer with the ability to access consumer health content from well-recognized sources, and to personalize or customize a specific health or wellness program. Over the last several years, we have intentionally focused more directly on increasing our advertising and sponsorship revenues and less on expanding our consumer subscription revenues. By virtue of our acquisition of Tea Leaves in August 2015, premium services revenues also include fees generated from the license of Tea Leaves’ SaaS-based marketing and analytics platform to hospital systems. These licensing agreements are typically multi-year contracts with recurring licensing fees. The related custom marketing programs that are sold to hospital customers that license our SaaS platform are allocated to advertising and sponsorship revenues.
33
The timing of our revenues is affected by certain seasonal factors. Our advertising and sponsorship revenues are traditionally the lowest in the first quarter of the year, due primarily to the seasonal spend patterns of our customers, and increases thereafter with the highest advertising and sponsorship revenues in the fourth quarter of the year. As a result of these trends, our gross margin tends to be lowest in the first quarter of each calendar year, typically increasing thereafter. We anticipate that, as our revenues increase, our gross profit will continue to increase while our period-over-period gross margin may not increase commensurately.
Cost of Revenues, Gross Profit and Gross Margin
The Everyday Health platform provides digital marketing and communications solutions that engage consumers and healthcare professionals across a variety of health categories. Cost of revenues consists primarily of the expenses associated with aggregating the total audience across the Everyday Health properties or delivering an audience to fulfill a marketing campaign. These costs include:
| · | media costs; |
| · | royalty payments to our partners; and |
| · | to a lesser extent, market research incentives, direct mail marketing and fulfillment costs, as well as costs associated with subscription fees for our premium services, ad serving and other expenses. |
Media costs consist primarily of fees paid to online publishers, Internet search companies and other media channels where we advertise our properties. These media activities are directly attributable to generating revenue, increasing the audience to the properties we operate, accumulating qualified leads, increasing the number of individuals subscribing to our premium services and growing our registered user base. Our partner royalties are generally based on the amount of revenues generated on the particular property. In some cases, we guarantee the partner a minimum annual payment.
We carefully monitor our gross profit and gross margin because they are key indicators of our financial performance and success in aggregating and monetizing our audience across the Everyday Health properties. Gross profit is defined as total revenues minus cost of revenues. Gross margin is defined as our gross profit as a percentage of our total revenues. While we focus on the growth of both gross profit and gross margin, we may make investments from time to time that will position us for growth at the expense of gross margin.
Since our operating decisions are based on aggregating and monetizing our audience as a whole, we believe that our aggregate gross profit is an important measure of our overall performance. Additionally, some of the other costs to operate our properties, such as product development expenses, website hosting and maintenance expenses, are included in operating expenses and not reflected in our cost of revenues. As a result, we also believe that our Adjusted EBITDA is an important metric for measuring our overall financial performance (for a detailed description of Adjusted EBITDA, see “Supplemental Financial Information” below).
Both our revenues and gross profit increased for the year ended December 31, 2015, compared to the prior year periods, as shown in the table below.
| Year ended December 31, | ||||||||||||
| 2015 | 2014 | 2013 | ||||||||||
| (dollars in thousands) | ||||||||||||
| Revenues | $ | 231,991 | $ | 184,325 | $ | 155,850 | ||||||
| Revenue growth | 25.9 | % | 18.3 | % | 12.5 | % | ||||||
| Cost of revenues | $ | 66,923 | $ | 49,296 | $ | 43,338 | ||||||
| Gross profit | $ | 165,068 | $ | 135,029 | $ | 112,512 | ||||||
| Gross profit growth | 22.2 | % | 20.0 | % | 14.9 | % | ||||||
| Gross margin | 71.2 | % | 73.3 | % | 72.2 | % | ||||||
We expect our gross profit to continue to improve in the near term as we continue to aggregate our audience more efficiently and enhance our monetization capabilities. While we expect our cost of revenues to continue to increase on an absolute basis in the foreseeable future, we do not believe that any such increases will negatively impact our gross profit or Adjusted EBITDA since we anticipate that the growth in our total revenues will continue to exceed the increase in our cost of revenues on a year-over-year basis.
Operating Expenses
Sales and Marketing. Sales and marketing expenses consist primarily of personnel-related costs, including commissions and non-cash stock compensation, for our sales and account management, research, marketing, data analytics and creative design personnel, as well as compensation expense related to acquisition earn-outs and retention bonuses, fees for third-party professional marketing and analytical services and depreciation and amortization expense pertaining to property and equipment. Our sales and marketing departments include data analytics personnel that analyze traffic and advertising ROI data to determine the effectiveness of advertising and marketing campaigns. We expect our sales and marketing expenses to increase as we increase the number of sales, sales support, marketing and analytical personnel.
34
Product Development. Product development expenses consist primarily of costs related to the products and services we provide to our audience, including the costs associated with the operation and maintenance of our website properties. These costs primarily consist of personnel-related expenses, including non-cash stock compensation, for our editorial, product management, technology and customer service personnel, and compensation expense related to acquisition earn-outs. Product development expenses also include fees paid to editorial and technology consultants; other technology costs incurred for maintenance to our technology platforms and infrastructure; depreciation and amortization expense pertaining to property and equipment and capitalized technology costs, including website and mobile development costs and acquired technology assets; and impairments of product development assets when such assets are no longer expected to provide future benefit. We expect our investment in product development to increase as we continue to increase our editorial, product development and technology resources, and as we enhance our product offerings by creating and licensing content, tools and applications, including new offerings for payers and providers.
General and Administrative. General and administrative expenses consist primarily of personnel-related expenses, including non-cash stock compensation, for our executive, finance, legal, human resources and other administrative personnel, as well as compensation expense related to acquisition earn-outs, accounting and legal professional fees and other general corporate expenses, including insurance, facilities expenses and depreciation and amortization expense pertaining to property and equipment and amortization of definite-lived intangible assets. We expect our general and administrative expenses, including accounting and legal-related expenses and insurance costs, to increase as we have transitioned to being a public company.
Interest Expense, Net
These amounts consist principally of interest expense, partially offset by interest income, as well as amortization expense related to deferred financing costs. Interest expense is primarily related to our credit facilities.
Other Expense
Other expense consists of certain non-operating expenses, primarily the write-off of unamortized deferred financing costs and prepayment fees incurred in connection with refinancing our credit facilities.
Income Taxes
We are subject to tax at the federal, state and local level in the U.S. and in one foreign jurisdiction. Earnings from our limited non-U.S. activities are subject to local country income tax and may also be subject to U.S. income tax.
As of December 31, 2015, we had approximately $104.0 million of U.S. federal and state net operating loss, or NOL, carryforwards available to offset future taxable income. The U.S. federal NOL carryforwards will expire from 2026 through 2033. The full utilization of these NOL carryforwards in the future will be dependent upon our ability to generate taxable income and could be limited due to ownership changes, as defined under the provisions of Section 382 of the Internal Revenue Code of 1986, as amended. Specifically, Section 382 contains rules that limit the ability of a company that undergoes an ownership change, which is generally any change in ownership of more than 50% of its stock over a three-year period, to use its previously-recognized NOL carryforwards and specified built-in losses in years after the ownership change. We completed an analysis in 2015 to determine the impact that past ownership changes may have on our ability to use our NOL carryforwards and have determined that, through 2015, there is no Section 382 limitation on our NOL carryforwards as there has not been a change in ownership of more than 50% over the three-year period through 2015. Our NOLs may also be limited under similar provisions of state law. The NOL carryforwards at December 31, 2015 include approximately $7.5 million in income tax deductions related to equity compensation, which will be reflected as a credit to additional paid-in-capital as these NOLs are utilized.
Loss From Discontinued Operations
In November 2013, we sold our Doctor Solutions business, which provided local online directories, search engine marketing and other marketing services to healthcare professionals. The sale represented a disposal of a component of an entity whose operations and cash flows were eliminated from our ongoing business after the sale. As such, the operating results of this business have been reported as discontinued operations in our consolidated statements of operations.
35
Results of Operations
The following table sets forth our consolidated statement of operations data for the periods presented. The period-to-period comparisons of the results are not necessarily indicative of our results for future periods.
| Year ended December 31, | ||||||||||||
| 2015 | 2014 | 2013 | ||||||||||
| (in thousands) | ||||||||||||
| Consolidated Statement of Operations Data: | ||||||||||||
| Revenues: | ||||||||||||
| Advertising and sponsorship revenues | $ | 209,093 | $ | 166,465 | $ | 134,893 | ||||||
| Premium services revenues | 22,898 | 17,860 | 20,957 | |||||||||
| Total revenues | 231,991 | 184,325 | 155,850 | |||||||||
| Operating expenses: | ||||||||||||
| Cost of revenues | 66,923 | 49,296 | 43,338 | |||||||||
| Sales and marketing | 74,761 | 48,605 | 44,385 | |||||||||
| Product development | 55,920 | 44,541 | 43,759 | |||||||||
| General and administrative | 39,487 | 30,041 | 27,462 | |||||||||
| Total operating expenses | 237,091 | 172,483 | 158,944 | |||||||||
| Income (loss) from operations | (5,100 | ) | 11,842 | (3,094 | ) | |||||||
| Interest expense, net | (5,236 | ) | (3,711 | ) | (8,442 | ) | ||||||
| Other expense | - | (4,114 | ) | (359 | ) | |||||||
| Income (loss) from continuing operations before (provision) benefit for income taxes | (10,336 | ) | 4,017 | (11,895 | ) | |||||||
| (Provision) benefit for income taxes | (1,304 | ) | 8,666 | (1,102 | ) | |||||||
| Income (loss) from continuing operations | (11,640 | ) | 12,683 | (12,997 | ) | |||||||
| Loss from discontinued operations, net of tax | - | - | (5,239 | ) | ||||||||
| Net Income (loss) | $ | (11,640 | ) | $ | 12,683 | $ | (18,236 | ) | ||||
Comparison of Years ended December 31, 2015 and 2014
Revenues
Our total revenues increased 25.9% to $232.0 million in 2015 from $184.3 million in 2014. The $47.7 million increase in total revenues consisted of a $42.6 million increase in advertising and sponsorship revenues and a $5.1 million increase in premium services revenues. No advertiser accounted for 10% or more of total revenues in 2015 or 2014.
Advertising and sponsorship revenues increased 25.6% to $209.1 million in 2015 from $166.5 million in 2014. The $42.6 million increase in advertising and sponsorship revenues was primarily driven by an increase in revenue from our pharmaceutical customers, including programs for orphan, rare and specialty diseases and ROI-based campaigns for mature brands. Our acquisitions of DD in the fourth quarter of 2014 and Cambridge in the first quarter of 2015 significantly enhanced the solutions we can offer to pharmaceutical customers.
Premium services revenues increased 28.2% to $22.9 million in 2015 from $17.9 million in 2014. The $5.1 million increase was primarily from an increase in revenue from our payer and provider customers, including the hospital revenue resulting from our acquisition of Tea Leaves in August 2015, and revenue earned in connection with the termination of a partner licensing agreement in the fourth quarter of 2015.
Costs and Expenses
Cost of Revenues. Cost of revenues increased 35.8% to $66.9 million in 2015 from $49.3 million in 2014. The $17.6 million increase in cost of revenues was primarily attributable to an increase in royalties to our website partners and media expenses, commensurate with the overall increase in advertising and sponsorship revenues during 2015 as compared to 2014. The increase in cost of revenues also reflects increased expenses for market research incentives, direct mail marketing and fulfillment expenses related primarily to the 2014 and 2015 acquisitions referenced above. Cost of revenues as a percentage of total revenues increased to 28.8% in 2015 from 26.7% in 2014.
Sales and Marketing. Sales and marketing expenses increased 53.8% to $74.8 million in 2015 from $48.6 million in 2014. This $26.2 million increase was attributable to several factors including: (i) higher cash and non-cash stock compensation expense for the increased staffing in our sales, sales development, sales operations and data analytics departments, which also includes the additional sales-related personnel acquired through the DD and Cambridge acquisitions in 2015; (ii) accrued earn-out and retention bonuses totaling $7.2 million related to the Cambridge, Tea Leaves and DD acquisitions and (iii) accrued executive transition charges and reduction in force severance charges, totaling $2.2 million, for the separation of certain of our executives during 2015. As a result of these factors, sales and marketing expenses as a percentage of total revenues increased to 32.2% in 2015, as compared to 26.4% in 2014.
36
Product Development. Product development expenses increased 25.5% to $55.9 million in 2015 from $44.5 million in 2014. This $11.4 million increase in product development expenses was primarily due to accrued earn-out expense totaling $4.1 million related to the acquisition of Tea Leaves in 2015 and a $1.4 million asset impairment charge recorded during the third quarter of 2015 related to certain software development projects which we decided not to move forward with, as well as $2.0 million increased depreciation expense on product development related assets, primarily from the DD acquisition. Product development expenses as a percentage of total revenues decreased to 24.1% in 2015, as compared to 24.2% in 2014.
General and Administrative. General and administrative expenses increased 31.4% to $39.5 million in 2015 from $30.0 million in 2014. This $9.5 million increase was attributable to several factors, including: (i) an increase in amortization expense of definite-lived intangible assets relating to the DD and Cambridge acquisitions; (ii) higher levels of non-cash stock compensation expense; (iii) accrued executive transition charges totaling $1.3 million for the separation of certain of our executives during 2015; and (iv) higher professional services fee expenses, which include additional expenses related to compliance with the Sarbanes-Oxley Act. General and administrative expenses as a percentage of total revenues increased to 17.0% in 2015, as compared to 16.3% in 2014.
Interest Expense, Net. Interest expense, net, increase 41.1% to $5.2 million in 2015, compared to $3.7 million in 2014. The $1.5 million increase in interest expense was primarily due to a net increase in the weighted-average outstanding borrowings under our credit facilities of approximately $52.8 million in 2015 as compared to 2014. This increase was primarily related to additional borrowings to fund the DD and Cambridge acquisitions, coupled with, to a lesser extent, a higher interest rate in 2015 as compared to 2014.
Other Expense. There were no charges reflected as other expense for the year ended December 31, 2015. Other expense in 2014 consisted primarily of the write-off of unamortized deferred financing costs totaling $2.8 million and prepayment penalties totaling $1.0 million related to the March 2014 credit facility refinancing.
(Provision) Benefit for Income Taxes. The (provision) benefit for income taxes was approximately $(1.3) million and $8.7 million during the years 2015 and 2014, respectively. The provision for income taxes in 2015 pertains primarily to deferred income taxes relating to basis differences in indefinite-lived intangible assets that cannot be offset by current year deferred tax assets since its reversal is considered indefinite in nature. Deferred income taxes increased in 2015 by $0.6 million in connection with our 2015 acquisitions, offset by a one-time tax benefit of $0.6 million related to the release of a valuation allowance from finalizing the purchase price valuation of the DD acquisition from 2014. For 2014, the deferred benefit for income taxes includes a one-time tax benefit of $10.0 million associated with the re-measurement of the valuation allowances against our deferred tax assets related to the DD acquisition, partially offset by a deferred tax charge relating to basis differences in indefinite-lived intangible assets as described above. The remaining provision in 2015 and 2014 pertains primarily to the current provision for federal minimum tax and state and local income taxes.
Comparison of Years ended December 31, 2014 and 2013
Revenues
Our total revenues increased 18.3% to $184.3 million in 2014 from $155.9 million in 2013. The $28.5 million increase in total revenues consisted of a $31.6 million increase in advertising and sponsorship revenues partially offset by a $3.1 million decrease in premium services revenues. No advertiser accounted for 10% or more of total revenues in 2014. In 2013, one advertiser accounted for approximately 12% of total revenues.
Advertising and sponsorship revenues increased 23.4% to $166.5 million in 2014 from $134.9 million in 2013. The $31.6 million increase in advertising and sponsorship revenues was driven by an increase in revenue per advertiser, as compared to 2013, due to expanded relationships with existing advertisers. The increase in advertising and sponsorship revenues was also attributable to an increase in the number of advertisers that marketed their products and services on Everyday Health properties, driven by a continued focus from our sales team on generating new customer relationships.
Premium services revenues decreased 14.8% to $17.9 million in 2014 from $21.0 million in 2013. The decrease was primarily attributable to a $4.1 million decrease in subscription fee revenues to $12.9 million in 2014 from $17.0 million in 2013. The decrease in subscription fee revenues was primarily due to a decrease in our average paid subscribers per month, which resulted from a general decline in the popularity of certain of our brands. This decrease was partially offset by subscription fee revenue from a new subscription brand launched in June 2014, and higher average revenue per paid subscriber per month.
Costs and Expenses
Cost of Revenues. Cost of revenues increased 13.7% to $49.3 million in 2014 from $43.3 million in 2013. The $6.0 million increase in cost of revenues was primarily attributable to an increase in royalties to our partners commensurate with the increase in advertising and sponsorship revenues. Cost of revenues as a percentage of total revenues decreased to 26.7% in 2014 from 27.8% in 2013.
Sales and Marketing. Sales and marketing expenses increased 9.5% to $48.6 million in 2014 from $44.4 million in 2013. This $4.2 million increase was primarily due to higher levels of compensation expense, including increased staffing and related cash and non-cash stock compensation expense for the sales development, sales operations and data analytics teams associated with generating and supporting increased advertising and sponsorship revenues in 2014 compared to 2013, partially offset by a $2.1 million decrease in acquisition earn-out expense in 2014 compared to 2013. Sales and marketing expenses as a percentage of total revenues decreased to 26.4% in 2014, as compared to 28.5% in 2013.
Product Development. Product development expenses increased 1.8% to $44.5 million in 2014 from $43.8 million in 2013. This $0.8 million increase in product development expenses was primarily due to increases in cash and non-cash stock compensation expense, partially offset by a $1.2 million impairment charge in 2013 pertaining to website content and tools which did not recur in 2014. Product development expenses as a percentage of total revenues decreased to 24.2% in 2014, as compared to 28.1% in 2013.
37
General and Administrative. General and administrative expenses increased 9.4% to $30.0 million in 2014 from $27.5 million in 2013. This $2.6 million increase was primarily due to increases in cash and non-cash stock compensation expense and professional service fee expenses, attributed in part to being public in 2014, partially offset by a $1.1 million decrease in amortization expense related to intangible assets. General and administrative expenses as a percentage of total revenues decreased to 16.3% in 2014, as compared to 17.6% in 2013.
Interest Expense, Net. Interest expense, net, decreased 56.0% to $3.7 million in 2014, compared to $8.4 million in 2013. The $4.7 million decrease in interest expense was primarily due to the refinancing of our credit facility in March 2014 at a lower interest rate in 2014 compared with 2013, and to a net decrease in the weighted-average outstanding borrowings under our credit facilities in 2014 as compared to 2013.
Other Expense. Other expense in 2014 consisted primarily of the write-off of unamortized deferred financing costs totaling $2.8 million and prepayment penalties totaling $1.0 million related to the March 2014 credit facility refinancing, compared with certain non-operating expense charges totaling $0.4 million in 2013.
(Provision) Benefit for Income Taxes. The (provision) benefit for income taxes was approximately $8.7 million and $(1.1) million during the years 2014 and 2013, respectively. For 2014, the benefit for income taxes includes a one-time tax benefit of $10.0 million associated with the re-measurement of the valuation allowances against our deferred tax assets related to the DD acquisition. The remaining provision in 2014 and 2013 pertains primarily to deferred income taxes related to basis differences in indefinite lived intangible assets that could not be offset by current year deferred tax assets, as well as the current provision for state income taxes.
Loss from Discontinued Operations
Loss from discontinued operations of $5.2 million in 2013 consists of a $1.3 million loss on sale and $3.9 million of operating losses attributable to the Doctor Solutions business, which was sold in November 2013.
Supplemental Financial Information
The following discussion provides information regarding Adjusted EBITDA, a performance measure that is not determined in accordance with U.S. generally accepted accounting principles, or GAAP, as well as information regarding certain non-cash operating expenses that are reflected in the Adjusted EBITDA calculation. We use Adjusted EBITDA in conjunction with GAAP operating performance measures as part of our overall assessment of our performance, for planning purposes, including the preparation of our annual operating budget, to evaluate the effectiveness of our business strategies and to communicate with our Board of Directors concerning our financial performance.
We define Adjusted EBITDA as net income (loss) plus: interest expense, net; income tax provision (benefit); depreciation and amortization expense; stock-based compensation expense; compensation expense related to acquisition earn-out and retention bonus arrangements; write-offs of unamortized deferred financing and other debt extinguishment costs; executive transition and reduction in force charges; contract settlement charges; asset impairment and other charges; preferred stock warrant mark-to-market adjustments and loss from discontinued operations We believe that Adjusted EBITDA is useful to investors and other users of our financial statements in evaluating our operating performance because it provides them with an additional tool to compare business performance across companies and across periods. Furthermore, we believe that:
| · | Adjusted EBITDA provides investors and other users of our financial information consistency and comparability with our past financial performance, helps indicate underlying trends in our business, facilitates period-to-period comparisons of operations and comparisons with our peer companies, many of which use similar non-GAAP financial measures to supplement their GAAP results; and |
| · | It is useful to exclude certain non-cash charges, such as depreciation and amortization and stock-based compensation and non-core operational charges, such as asset impairment and other charges and write-off of debt extinguishment costs, from Adjusted EBITDA because the amount of such expenses in any specific period may not be directly correlated to the underlying performance of our business operations and these expenses can vary significantly between periods. |
We do not place undue reliance on Adjusted EBITDA as our only measure of operating performance. Adjusted EBITDA should not be considered as a substitute for other measures of financial performance reported in accordance with GAAP. There are limitations to using non-GAAP financial measures, including that other companies may calculate these measures differently than we do, that they do not reflect our capital expenditures or future requirements for capital expenditures and that they do not reflect changes in, or cash requirements for, our working capital.
38
As Adjusted EBITDA is a non-GAAP measure, the following table presents a reconciliation of net income (loss) to Adjusted EBITDA.
| Year Ended December 31, | ||||||||||||
| 2015 | 2014 | 2013 | ||||||||||
| (in thousands) | ||||||||||||
| Net Income (Loss) | $ | (11,640 | ) | $ | 12,683 | $ | (18,236 | ) | ||||
| Add: | ||||||||||||
| Interest expense, net | 5,236 | 3,711 | 8,442 | |||||||||
| Income tax provision (benefit) | 1,304 | (8,666 | ) | 1,102 | ||||||||
| Depreciation and amortization expense | 20,408 | 14,943 | 15,450 | |||||||||
| Stock-based compensation expense | 10,936 | 9,100 | 2,969 | |||||||||
| Warrant mark-to-market adjustment | — | 252 | — | |||||||||
| Compensation expense related to acquisition earnout and retention bonuses | 11,968 | 135 | 2,211 | |||||||||
| Write-off of unamortized deferred financing costs | — | 3,861 | — | |||||||||
| Executive transition and reduction in force severance charges | 3,655 | — | 3,188 | |||||||||
| Contract settlement charge | 1,725 | — | — | |||||||||
| Asset impairment and other charges | 2,052 | — | 1,377 | |||||||||
| Loss from discontinued operations | — | — | 5,239 | |||||||||
| Adjusted EBITDA | $ | 45,644 | $ | 36,019 | $ | 21,742 | ||||||
The following table summarizes our depreciation and amortization and stock compensation expenses included in the Adjusted EBITDA reconciliation table above and details the breakdown of such expenses in the respective statements of operations line-items.
| Year Ended December 31, | ||||||||||||||||||||||||
| Depreciation / | Stock | |||||||||||||||||||||||
| amortization | compensation (1) | |||||||||||||||||||||||
| 2015 | 2014 | 2013 | 2015 | 2014 | 2013 | |||||||||||||||||||
| (in thousands) | ||||||||||||||||||||||||
| Sales and marketing | $ | 1,190 | $ | 1,279 | $ | 1,183 | $ | 4,074 | $ | 2,769 | $ | 602 | ||||||||||||
| Product development | 12,764 | 10,745 | 10,325 | 1,850 | 2,102 | 1,091 | ||||||||||||||||||
| General and administrative | 6,454 | 2,919 | 3,942 | 5,012 | 4,229 | 1,276 | ||||||||||||||||||
| Total expense | $ | 20,408 | $ | 14,943 | $ | 15,450 | $ | 10,936 | $ | 9,100 | $ | 2,969 | ||||||||||||
| (1) | Stock compensation expense includes charges related to the Company’s ESPP beginning in 2014. Refer to “Note 11-Stock-Based Compensation” in the notes to the consolidated financial statements included in Part II, Item 8 of this Form 10-K. |
Liquidity and Capital Resources
Working Capital
As of December 31, 2015, we had cash and cash equivalents of $30.1 million and working capital of $59.2 million.
Sources of Liquidity and Long-Term Debt
Our primary sources of cash have historically been proceeds from the issuance of convertible redeemable preferred stock, bank borrowings and our IPO. Since the beginning of 2003, we have issued convertible redeemable preferred stock for aggregate net proceeds of $82.0 million, which were converted to common stock upon the IPO on April 2, 2014. Our IPO resulted in net proceeds of $70.6 million after deducting underwriting discounts and commissions and other offering costs. As of December 31, 2015, we had $111.1 million of borrowings outstanding under our credit facility.
In March 2015, we refinanced our debt. Under this credit facility, or the Credit Facility, with Silicon Valley Bank and certain other lenders, we maintain a revolver, with a maximum borrowing limit of $82.3 million, and also have a term loan. As of December 31, 2015, there was $66.1 million outstanding on the term loan and $45.0 million outstanding on the revolver, with $37.3 million available to be drawn on the revolver. The repayment terms for any balance outstanding on the revolver provide for quarterly interest payments, with the principal being due in full in November 2019. The repayment terms for the term loan provide for quarterly interest and principal payments, with a maturity date of November 2019. The interest rate on the revolver and the term loan is equal to the London Inter-Bank Offered Rate, or LIBOR, plus a variable rate ranging from 2.75% to 4.0% depending on our consolidated leverage ratio, as defined in the Credit Facility agreement, and we are charged a commitment fee of 0.50% on the unused portion of the revolver. As of December 31, 2015, the interest rate on our Credit Facility was 4.33%. The Credit Facility contains certain financial and operational covenants with which we must comply, whether or not there are any borrowings outstanding. Such covenants include requirements to maintain a minimum consolidated fixed charge coverage ratio and a maximum consolidated leverage ratio, each as defined in the Credit Facility, as well as restrictions on certain types of dispositions, mergers and acquisitions, indebtedness, investments, liens and capital expenditures, issuance of capital stock and our ability to pay dividends and make other distributions. We were in compliance with the financial and operational covenants of the Credit Facility as of December 31, 2015. The Credit Facility is secured by a first priority security interest in substantially all of our existing and future assets.
39
On February 26, 2016, we entered into an amendment to the Credit Facility, which effected certain modifications to the financial covenants and terms set forth in the Credit Facility. In addition, on March 2, 2016, we drew $15.0 million under the revolver portion of the Credit Facility. As of March 2, 2016, there was $64.4 million outstanding on the term loan and $60.0 million outstanding on the revolver, with $22.3 million available to be drawn on the revolver.
Operating and Capital Expenditure Requirements
Our principal uses of cash historically have been to fund operating losses, finance business acquisitions and capital expenditures relating to purchases of property and equipment to support our infrastructure and capitalized product development costs. We currently expect that our existing cash and cash equivalents, together with anticipated cash flows from operations, will be sufficient to fund our anticipated cash needs for at least the next twelve months. Our liquidity could be negatively affected by a decrease in demand for our marketing solutions, including the impact of changes in advertiser spending behavior, and by other factors outside of our control, including general economic conditions, as well as the other risks to our business discussed under “Item 1A—Risk Factors.” Our cash requirements going forward may require us to raise additional funds through borrowing or the issuance of additional equity or equity-linked securities. Any increase in the amount of our borrowings will result in an increase in our interest expense. Future issuance of equity or equity-linked securities will result in dilution to the holders of our common stock. In addition, if the banking system or the financial markets are volatile, our ability to raise additional debt or equity capital could be adversely affected. Additional financing may not be available on commercially reasonable terms or at all.
Components of Liquidity and Capital Resources
| Year Ended December 31, | ||||||||||||
| 2015 | 2014 | 2013 | ||||||||||
| (in thousands) | ||||||||||||
| Net cash provided by operating activities | $ | 20,946 | $ | 20,040 | $ | 1,672 | ||||||
| Net cash used in investing activities | (63,210 | ) | (79,223 | ) | (17,507 | ) | ||||||
| Net cash provided by financing activities | 21,632 | 93,670 | 8,189 | |||||||||
| Net increase (decrease) in cash and cash equivalents | $ | (20,632 | ) | $ | 34,487 | $ | (7,646 | ) | ||||
Operating Activities
For the year ended December 31, 2015, net cash provided by operating activities was $20.9 million, consisting of a net (loss) of $(11.6) million, adjusted for non-cash expenses of $34.6 million, including depreciation and amortization, provision for doubtful accounts, non-cash stock-based compensation expense, asset impairment charge, amortization and write-off of deferred financing costs and provision for deferred income taxes. Additionally, changes in operating assets and liabilities used $2.1 million of cash, which was primarily due to an increase in accounts receivable of $17.5 million due to higher advertising and sponsorship revenues, offset by an increase in long-term liabilities of $7.8 million primarily related to acquisition earn-out accruals, an increase in accounts payable and accrued expenses of $5.4 million due to the timing of vendor payments, and an increase in deferred revenue of $1.2 million.
Net cash provided by operating activities was $0.9 million higher in the year ended December 31, 2015 compared to the year ended December 31, 2014, resulting primarily from an increase in non-cash expenses of $14.9 million and a decrease in cash used as a result of changes in operating assets and liabilities of $10.3 million, offset by an increase in net loss of $24.3 million. The increase in non-cash expenses of $14.9 million is driven by a $10.0 million increase in the deferred income tax provision due to a one-time, non-cash tax benefit related to the DD acquisition in 2014, a $5.5 million increase in depreciation and amortization, a $1.8 million increase in stock-based compensation expense and a $1.4 million increase in asset impairment charges, offset by a $3.8 million decrease in amortization and write-off of deferred financing costs. The decrease in cash used as a result of changes in operating assets and liabilities of $10.3 million is mainly due to increases in accounts payable and accrued expenses of $7.4 million and other long-term liabilities of $7.2 million primarily related to acquisition earn-out accruals, partially offset by a $5.1 million increase in accounts receivable.
For the year ended December 31, 2014, net cash provided by operating activities was $20.0 million, consisting of net income of $12.7 million, adjusted for non-cash expenses of $19.7 million, including depreciation and amortization, non-cash stock-based compensation expense, amortization and write- off of deferred financing costs, partially offset by a benefit for deferred income taxes. Additionally, changes in operating assets and liabilities used $12.3 million of cash, which was primarily due to an increase in accounts receivable due to higher advertising and sponsorship revenues and a decrease in accounts payable and accrued expenses due to the timing of vendor payments, partially offset by a decrease in prepaid expenses and other current assets.
Net cash provided by operating activities was $18.4 million higher in the year ended December 31, 2014 compared to the year ended December 31, 2013, resulting primarily from an increase in net income of $31.1 million, an increase in non-cash stock based compensation of $6.1 million, and a $4.2 million decrease in prepaid expenses and other current assets, partially offset by a $9.5 million decrease in accounts payable and accrued expenses due to the timing of vendor invoice payments and a $10.0 million decrease in the deferred income tax provision due to a one-time, non-cash tax benefit related to the DD acquisition for the year ended December 31, 2014 compared to the same period in 2013.
For the year ended December 31, 2013, net cash provided by operating activities was $1.7 million, consisting of cash provided by operating activities from continuing operations of $5.9 million offset by cash used in operating activities from discontinued operations of $4.2 million. Net cash provided by operating activities from continuing operations of $5.9 million consisted of a loss from continuing operations of $13.0 million, adjusted for non-cash expenses of $23.0 million, including depreciation and amortization and non-cash stock-based compensation expense. Additionally, changes in operating assets and liabilities used $4.1 million of cash, which was primarily due to increases in accounts receivable due to higher advertising and sponsorship revenues and in prepaid expenses and other current assets, partially offset by an increase in (i) accounts payable and accrued expenses due to the timing of vendor payments and (ii) deferred revenue related to certain marketing campaigns and premium services billed in advance of the services being provided. Net cash used in operating activities from discontinued operations of $4.2 million consisted of a loss from discontinued operations of $5.2 million adjusted for non-cash items, primarily the write-off of certain assets in connection with the sale.
40
Investing Activities
Our primary investing activities have historically consisted of additions to property and equipment, including computer hardware and software, internally-developed software, website development costs, and leasehold improvements. Additionally, our investing activities included payments made to acquire businesses.
We used $63.2 million of net cash in investing activities during the year ended December 31, 2015, consisting of $14.5 million of additions to property and equipment, $47.3 million for purchase price payments relating to the Cambridge and Tea Leaves acquisitions and $1.4 million for security deposits and other assets. Net cash used in investing activities was $16.0 million lower than in the year ended December 31, 2014, primarily due to lower purchase price payments in 2015 compared to 2014.
We used $79.2 million of net cash in investing activities during the year ended December 31, 2014, consisting of $14.8 million of additions to property and equipment and $65.0 million for purchase price payments relating to the DD acquisition. Net cash used in investing activities was $61.7 million higher than in the year ended December 31, 2013.
We used $17.5 million of net cash in investing activities during the year ended December 31, 2013, consisting of $10.7 million of additions to property and equipment, $6.7 million for payments relating to the EQAL acquisition, and $0.7 million in security deposits for additional office space. Net cash used in investing activities was $2.0 million higher than in the year ended December 31, 2012.
Financing Activities
Our financing activities have historically consisted of borrowings and repayments under our credit facilities, and related financing costs, and proceeds from the exercise of stock options. In addition to such activities, upon closing our IPO in April 2014, we received proceeds from our IPO, net of underwriting discounts and commissions and related offering costs.
We generated $21.6 million of net cash in financing activities during the year ended December 31, 2015, primarily from $15.0 million in net borrowings on the revolver portion of our credit facility, $6.1 million of borrowings on the term loan portion of the facility net of principal repayments and $2.6 million received upon the exercise of stock option awards, partially offset by capital lease obligations, financing costs and tax withholdings related to net share settlement of restricted stock units. Net cash provided by financing activities was $72.0 million lower than in the year ended December 31, 2014, primarily due to the $70.6 million net proceeds we received upon the closing of our IPO in 2014.
We generated $93.7 million of net cash in financing activities during the year ended December 31, 2014, primarily from $70.6 million received from the net proceeds upon the closing of our IPO, $7.9 million received upon the exercise of stock option awards and $18.7 million of additional net borrowings under our revolver and term loan credit facilities, partially offset by $2.9 million of related financing costs. Net cash provided by financing activities was $85.5 million higher than in the year ended December 31, 2013.
We generated $8.2 million of net cash in financing activities during the year ended December 31, 2013, primarily from $11.5 million of additional borrowings under our credit facility partially offset by $2.8 million of principal repayments under our term loan credit facility. Net cash provided by financing activities was $12.8 million lower than in the year ended December 31, 2012.
Contractual Obligations and Commitments
The following table summarizes our principal contractual obligations as of December 31, 2015:
| Payments due by period | ||||||||||||||||||||
| Total | Less
than 1 year | 1-3 years | 3-5 years | More
than 5 years | ||||||||||||||||
| (in thousands) | ||||||||||||||||||||
| Long-term debt obligations (1) | $ | 111,056 | $ | 6,775 | $ | 13,550 | $ | 90,731 | $ | — | ||||||||||
| Operating lease obligations | 31,985 | 5,078 | 8,323 | 7,218 | 11,366 | |||||||||||||||
| Minimum guarantees under royalty agreements (2) | 74,529 | 14,926 | 24,392 | 25,211 | 10,000 | |||||||||||||||
| Purchase obligations (3) | 39,029 | 20,019 | 18,042 | 969 | — | |||||||||||||||
| Total | $ | 256,599 | $ | 46,798 | $ | 64,307 | $ | 124,129 | $ | 21,366 | ||||||||||
| (1) | In addition to the principal repayments due under our Credit Facility shown above based on outstanding borrowings of $111.1 million as of December 31, 2015, interest payments of $4.8 million are due in less than 1 year, $8.6 million in 1-3 years and $4.3 million in 3-5 years when the Credit Facility matures in November 2019. For a description of our long-term debt obligations, see “Liquidity and Capital Resources - Sources of Liquidity and Long-Term Debt” above. | |
| (2) | Some of the minimum guaranteed payments are subject to reductions if specified performance metrics are not achieved by our partners with respect to our non-operated properties. | |
| (3) | Purchase obligations pertain primarily to fees for third-party content, technology and other services. |
41
Off-Balance Sheet Arrangements
We do not engage in transactions that generate relationships with unconsolidated entities or financial partnerships, such as entities often referred to as structured finance or special purpose entities, as part of our ongoing business. Accordingly, our operating results, financial condition and cash flows are not subject to off-balance sheet risks.
Critical Accounting Policies and Estimates
Our consolidated financial statements are prepared in accordance with GAAP. The preparation of these consolidated financial statements requires us to make estimates and assumptions that affect the reported amounts of assets, liabilities, revenues, costs and expenses, and related disclosures. These estimates and assumptions are often based on judgments that we believe to be reasonable under the circumstances at the time made, but all such estimates and assumptions are inherently uncertain and unpredictable. Actual results may differ from those estimates and assumptions and it is possible that other professionals, applying their own judgment to the same facts and circumstances, could develop and support alternative estimates and assumptions that would result in material changes to our operating results and financial condition. We evaluate our estimates and assumptions on an ongoing basis. Our estimates are based on historical experience and various other assumptions that we believe to be reasonable under the circumstances.
We believe the following reflects our critical accounting policies and our more significant judgments and estimates used in the preparation of our consolidated financial statements. For further information on all of our significant accounting policies, see Note 2 of our accompanying notes to consolidated financial statements included in Part II, Item 8, “Financial Statements and Supplementary Data” of this Annual Report on Form 10-K.
Revenue Recognition and Deferred Revenue
We generate revenues primarily through advertising and sponsorships, and premium services, including subscriptions and licensing fees.
We recognized revenue only when (i) persuasive evidence of an arrangement exists; (ii) the price is fixed or determinable; (iii) the service is performed; and (iv) collectability of the related fee is reasonably assured. While the majority of our revenue transactions are based on standard business terms and conditions, we also enter into non-standard sales agreements with advertisers that sometimes involve multiple elements.
We typically recognize advertising revenues in the period in which the advertisement is delivered. Our revenues from sponsorship services and marketing programs are recognized over the period in which we substantially satisfy our contractual obligations set forth in the relevant sponsorship agreements. When contractual arrangements contain multiple elements, revenue is allocated to each element based on its relative fair value determined using prices charged when elements are sold separately. In instances where individual deliverables are not sold separately, or when third-party evidence is not available, fair value is determined based on our best estimate of selling price. Advertising and sponsorship revenues accounted for 90.1%, 90.3% and 86.6% of total revenues for the years ended December 31, 2015, 2014 and 2013, respectively.
We recognize subscription revenues ratably over the relevant subscription periods, which for our SaaS-based marketing and analytics platform are typically over the multi-year contract term and for subscriptions sold to individuals are predominantly quarterly, after deducting refunds and charge-backs. For the SaaS-based marketing and analytics platform, customers are typically charged a fee to integrate the platform which is recognized over the contract term and a recurring license fee which is billed monthly. For subscriptions to individuals, we typically charge each subscriber’s credit card for the full price for their subscription at the commencement of the subscription period and at each subscription renewal date, unless the consumer cancels the subscription prior to the renewal date. When consumers sign up for free-trial subscriptions, we automatically charge their credit card for a subscription at the end of the free-trial period unless they cancel before the trial period ends. Once billed, the revenue is recognized on a straight line basis, over the subscription period. No revenue is recognized ratably over, or allocated to, the free-trial period.
We generally recognize licensing revenue over the life of the contract.
Deferred revenue consists primarily of (i) subscription fees that we have collected from consumers but for which revenue has not been recognized, and (ii) revenues from advertising and sponsorship services and licensing fees that we have billed in advance of when the revenue is to be earned.
Internal Software and Website Development Cost
We incur costs to develop software for internal use and for our website and mobile applications. In accordance with authoritative accounting guidance, we capitalize costs, consisting principally of payroll and related benefits, third-party consultants and related charges, incurred during the application development phase of a project as well as the costs of content developed for our properties by third-party consultants which is deemed to be reference material in nature and to provide a future economic benefit. Upon completion of a project, the capitalized costs are amortized using the straight-line method over their estimated useful lives, which is typically three years. We exercise judgment in determining the point at which various projects may be capitalized, in assessing the ongoing value of capitalized costs, and in determining the estimated useful lives over which the costs are amortized.
Software and website development costs that do not meet the criteria for capitalization are expensed as incurred and are included in product development expenses in the consolidated statements of operations.
Goodwill
Goodwill resulting from our acquisitions represents the excess cost over fair value of the identifiable net tangible and intangible assets of acquired businesses. The allocation of purchase price requires management to make significant estimates in determining the fair value of acquired assets and assumed liabilities, especially with respect to definite-lived intangible assets (discussed further below).
42
Goodwill is tested for impairment on an annual basis as of October 1, and whenever events or circumstances indicate that the carrying value of the asset may not be recoverable. Application of the impairment test requires judgment and results in impairment being recognized if the carrying value of the asset exceeds its fair value. We operate as one operating segment and one reporting unit.
We perform an initial qualitative analysis to evaluate whether any events and circumstances occurred or exist that provide evidence that it is more likely than not that the fair value of a reporting unit is less than its carrying amount. If it is not more likely than not that the fair value of the reporting unit is less than its carrying value, no further assessment of the reporting unit’s goodwill is necessary. If it is more likely than not that the fair value of the reporting unit is less than its carrying value, then the goodwill must be tested using a two-step quantitative process, and if the carrying value of a reporting unit’s goodwill exceeds its implied fair value, an impairment loss equal to the excess is recorded.
The evaluation of our goodwill annually on October 1 indicated that the carrying value of the asset was less than the fair value and, accordingly, there was no impairment loss recognized for the years ended December 31, 2015, 2014 and 2013.
Long-Lived Assets
Our long-lived assets, in addition to goodwill discussed above, consist of property and equipment and intangible assets with definite lives. These intangible assets resulted from our business acquisitions, and consist of trade names, customer relationships and agreements with certain of our website partners.
The amount assigned to our definite-lived intangible assets is a subjective analysis based on our estimates of the future benefit of these assets using acceptable valuation techniques. The estimated fair values assigned to our trade names and other definite-lived intangible assets are computed based on discounted cash flows using the Relief From Royalty Method and Excess Earnings Method, respectively, which applies various assumptions developed by management, including projected revenues, operating margins, attrition rates, royalty rates and discount rates.
Our property and equipment and definite-lived intangible assets are depreciated and amortized over their estimated useful lives, generally three to five years for property and equipment and three to ten years for definite-lived intangible assets, which are determined based on several factors, primarily the period of time the asset is expected to remain in service and provide benefit to us. We review these definite-lived assets for impairment whenever events or changes in circumstances indicate that the carrying value of the asset may not be recoverable. During the year ended December 31, 2015, an impairment charge of $1,416 was recorded related to certain software development projects included in property and equipment, which we decided not to move forward with. There were no indicators of impairment of these definite-lived assets during the year ended December 31, 2014. During the year ended December 31, 2013, we recorded impairment charges of $1.2 million related to certain website costs included in property and equipment.
Stock-Based Compensation
We account for stock-based compensation expense in accordance with the current authoritative accounting guidance, under which stock-based awards, including stock options and restricted stock units, are measured at fair value as of the grant date and recognized as compensation expense over the requisite service period (generally the vesting period), which we have elected to amortize using the graded attribution method.
We calculate the fair value of each restricted stock unit award based on our stock price on the date of grant. We use the Black-Scholes option pricing model to estimate the fair value of stock option and Employee Stock Purchase Plan (“ESPP”) awards. As there was no public market for our common stock prior to our IPO in March 2014, and therefore a lack of company-specific historical and implied volatility data, we have determined the share price volatility for awards granted based on an analysis of reported data for a peer group of companies that granted awards with substantially similar terms. The expected volatility of awards granted has been determined using an average of the historical realized volatility measures of this peer group of companies for a period of time commensurate with the expected term of the option. We intend to continue to consistently apply this process using the same or similar entities until a sufficient amount of historical information regarding the volatility of our own share price becomes available, or unless circumstances change such that the identified entities are no longer similar to us. In this latter case, more suitable entities whose share prices are publicly available would be utilized in the calculation.
The expected life of options granted has been determined utilizing the simplified method for determining the expected life for options qualifying for treatment due to the limited history we have with option exercise activity. The expected term for ESPP shares is based on the purchase period. The risk-free interest rate is based on a U.S. Treasury yield curve for periods equal to the expected term of the awards on the grant date. We have not paid, and do not anticipate paying, cash dividends on our shares of common stock, and the expected dividend yield is, therefore, assumed to be zero.
In addition, stock-based compensation expense is recorded net of estimated forfeitures. Forfeitures are estimated at the time of grant, based on our historical forfeiture experience, and revised, if necessary, in subsequent periods if actual forfeitures differ from those estimates.
The assumptions used in calculating the fair value of stock-based awards represent our best estimates. These estimates involve inherent uncertainties and the application of management judgment. The assumptions we used in the Black-Scholes pricing model are based on subjective future expectations combined with management judgment. If any of the assumptions used in this pricing model change significantly, stock-based compensation for future awards may differ materially from the awards granted previously. Additionally, the pricing model fair value of the awards is based upon the fair value of our underlying common stock.
43
Income Taxes
We are subject to income taxes in the United States and one foreign jurisdiction. Deferred tax assets and liabilities are recognized for future tax consequences attributable to differences between the tax and financial statement reporting basis of assets and liabilities, as well as for operating loss carry forwards. Deferred tax assets and liabilities are measured using enacted tax rates expected to apply to taxable income in the years in which those temporary differences are expected to be recovered or settled.
The components of the deferred tax assets and liabilities are individually classified as current and non-current based on their characteristics. We reduce the measurement of a deferred tax asset, if necessary, by a valuation allowance if it is more likely than not that we will not realize some or all of the deferred tax asset. As a result of our historical operating performance and the cumulative net losses incurred to date, we do not have sufficient objective evidence to support the recovery of the net deferred tax assets. Accordingly, we have established a valuation allowance against net deferred tax assets for financial reporting purposes because we believe it is more likely than not that these deferred tax assets will not be realized.
We account for uncertain tax positions by recognizing the financial statement effects of a tax position only when, based upon technical merits, it is “more-likely-than-not” that the position will be sustained upon examination. Potential interest and penalties associated with unrecognized tax positions are recognized in income tax expense.
Recently Issued and Adopted Accounting Pronouncements
In April 2014, the Financial Accounting Standards Board (“FASB”) issued amended guidance for reporting discontinued operations. Under the new guidance, only disposals that represent a strategic shift having a material impact on an entity’s operations and financial results shall be reported as discontinued operations, with expanded disclosures. This amendment will be effective for the first annual reporting period beginning after December 15, 2015. We do not expect the impact of the adoption of this guidance to be material to the consolidated financial statements.
In May 2014, the FASB issued amended guidance for revenue recognition. This amendment provides a comprehensive new revenue recognition model. The core principle of the guidance is to recognize revenue when promised goods or services are transferred to customers in an amount that reflects the consideration that is expected to be received for those goods or services. The amendment was originally to be effective for annual and interim periods beginning after December 15, 2016. In August 2015, the FASB approved a one year deferral of the effective date to December 15, 2017 and early adoption is permitted, but not before the original effective date of December 15, 2016. The standard permits the use of either the retrospective or cumulative effect transition method. We have not yet selected a transition method and are currently evaluating the effect that the new standard will have on the consolidated financial statements and related disclosures.
In June 2014, the FASB issued updated guidance on stock compensation accounting requiring that a performance target that affects vesting and could be achieved after the requisite service period should be treated as a performance condition. Current GAAP does not contain explicit guidance on how to account for such share-based payments. This updated guidance is effective for fiscal years beginning after December 15, 2015, and for interim periods within those fiscal years. Early adoption is permitted. We do not expect the impact of the adoption of this guidance to be material to the consolidated financial statements.
In April 2015, the FASB issued updated guidance on the presentation of debt issuance costs in financial statements. The new guidance requires an entity to present such costs in the balance sheet as a direct deduction from the related debt liability rather than as an asset. Amortization of the costs will continue to be reported as interest expense. This guidance will be effective for us beginning in the first quarter of 2016 on a retrospective basis for all periods presented, with early adoption optional. We do not expect the impact of the adoption of this guidance to be material to the consolidated financial statements.
In September 2015, the FASB issued updated guidance on business combinations accounting requiring the acquirer to recognize adjustments to provisional amounts that are identified during the measurement period in the reporting period in which the adjustment amounts are determined. Previously, such adjustments were required to be retrospectively recorded in prior period financial information. The amended guidance will be effective for fiscal years beginning after December 15, 2015, including interim periods within those fiscal years. The standard is to be applied prospectively, with early adoption permitted. We do not expect the impact of the adoption of this guidance to be material to the consolidated financial statements.
In November 2015, the FASB issued updated guidance on balance sheet classification of deferred taxes, requiring all deferred tax assets and liabilities, and any related valuation allowance, to be classified as non-current on the balance sheet. The classification change for all deferred taxes as non-current simplifies entities’ processes as it eliminates the need to separately identify the net current and net non-current deferred tax asset or liability in each jurisdiction and allocate valuation allowances. This guidance is effective for annual periods beginning after December 15, 2016, and interim periods within those annual periods, with earlier application permitted. We elected to early adopt this guidance on a retrospective basis effective December 31, 2014. As a result of the retrospective adoption, the Company reclassified $0.7 million from current deferred tax assets to noncurrent deferred tax liabilities in the 2014 balance sheet.
In February 2016, the FASB issued updated guidance on leases which, for operating leases, requires a lessee to recognize a right-of-use asset and a lease liability, initially measured at the present value of the lease payments, in its balance sheet. The standard also requires a lessee to recognize a single lease cost, calculated so that the cost of the lease is allocated over the lease term, on a generally straight-line basis. The guidance is effective for fiscal years beginning after December 15, 2018, including interim periods within those fiscal years, with earlier application permitted. We are currently evaluating the effects of the adoption and have not yet determined the impact the revised guidance will have on our consolidated financial statements and related disclosures.
44
Item 7A. Quantitative and Qualitative Disclosures About Market Risk.
We are exposed to market risk related to changes in interest rates, foreign currency exchange rates and inflation. We do not use derivative financial instruments for speculative, hedging or trading purposes, although in the future we may enter into interest rate or exchange rate hedging arrangements to manage the risks described below.
Interest Rate Risk. Our interest income is primarily generated from interest earned on highly liquid, short-term money market funds. Our exposure to market risks related to interest expense is limited to borrowings under our credit facility. Based on the $111.1 million of borrowings outstanding under our credit facility as of December 31, 2015 and the interest rates in effect at that date, our annual interest expense, including the 0.50% commitment fee on the unused portion of the revolver, would amount to $5.4 million. A hypothetical interest rate increase of 1% on our credit facility would increase annual interest expense by $1.1 million. We do not enter into interest rate swaps, caps or collars or other hedging instruments.
Foreign Currency Risk. Substantially all of our revenues and expenses are denominated in U.S. dollars and, therefore, our exposure to market risks related to fluctuations in foreign currency exchange rates is not material.
Inflation Risk. We do not believe that inflation has had a material effect on our business, financial condition or results of operations. Nonetheless, if our costs were to become subject to significant inflationary pressures, we may not be able to fully offset such higher costs through price increases. Our inability or failure to do so could harm our business, financial condition and results of operations.
45
Item 8. Financial Statements and Supplementary Data.
Everyday Health, Inc.
Index to Consolidated Financial Statements
46
Report of Independent Registered Public Accounting Firm
The Board of Directors and
Stockholders of Everyday Health, Inc.
We have audited the consolidated balance sheets of Everyday Health, Inc. (the Company) as of December 31, 2015 and 2014, and the related consolidated statements of operations, redeemable convertible preferred stock and stockholders’ equity (deficit), and cash flows for each of the three years in the period ended December 31, 2015. These financial statements are the responsibility of the Company’s management. Our responsibility is to express an opinion on these financial statements based on our audits.
We conducted our audits in accordance with the standards of the Public Company Accounting Oversight Board (United States). Those standards require that we plan and perform the audit to obtain reasonable assurance about whether the financial statements are free of material misstatement. We were not engaged to perform an audit of the Company’s internal control over financial reporting. Our audits included consideration of internal control over financial reporting as a basis for designing audit procedures that are appropriate in the circumstances, but not for the purpose of expressing an opinion on the effectiveness of the Company’s internal control over financial reporting. Accordingly, we express no such opinion. An audit also includes examining, on a test basis, evidence supporting the amounts and disclosures in the financial statements, assessing the accounting principles used and significant estimates made by management, and evaluating the overall financial statement presentation. We believe that our audits provide a reasonable basis for our opinion.
In our opinion, the financial statements referred to above present fairly, in all material respects, the consolidated financial position of Everyday Health, Inc. at December 31, 2015 and 2014, and the consolidated results of its operations and its cash flows for each of the three years in the period ended December 31, 2015, in conformity with U.S. generally accepted accounting principles.
| /s/ Ernst & Young LLP | ||
| New York, New York | ||
| March 11, 2016 |
47
Everyday Health, Inc.
Consolidated Balance Sheets
(in thousands, except share and per share data)
| December 31, | ||||||||
| 2015 | 2014 | |||||||
| Assets | ||||||||
| Current assets: | ||||||||
| Cash and cash equivalents | $ | 30,097 | $ | 50,729 | ||||
| Accounts receivable, net of allowance for doubtful accounts of $909 and $637 as of December 31, 2015 and 2014, respectively | 90,356 | 68,007 | ||||||
| Prepaid expenses and other current assets | 4,662 | 5,529 | ||||||
| Total current assets | 125,115 | 124,265 | ||||||
| Property and equipment, net | 28,565 | 25,502 | ||||||
| Goodwill | 165,271 | 127,115 | ||||||
| Intangible assets, net | 43,746 | 30,716 | ||||||
| Other assets | 6,901 | 5,237 | ||||||
| Total assets | $ | 369,598 | $ | 312,835 | ||||
| Liabilities and stockholders’ equity | ||||||||
| Current liabilities: | ||||||||
| Accounts payable and accrued expenses | $ | 38,563 | $ | 31,722 | ||||
| Deferred revenue | 8,655 | 6,740 | ||||||
| Current portion of long-term debt | 6,775 | 3,000 | ||||||
| Other current liabilities | 11,890 | 965 | ||||||
| Total current liabilities | 65,883 | 42,427 | ||||||
| Long-term debt | 104,281 | 87,000 | ||||||
| Deferred tax liabilities | 7,570 | 6,017 | ||||||
| Other long-term liabilities | 11,595 | 4,105 | ||||||
| Commitments and contingencies (Note 13) | ||||||||
| Stockholders’ equity: | ||||||||
| Preferred stock, $0.01 par value: 10,000,000 shares authorized at December 31, 2015 and 2014; no shares issued and outstanding at December 31, 2015 and 2014 | — | — | ||||||
| Common stock, $0.01 par value: 90,000,000 shares authorized at December 31, 2015 and 2014; 32,707,606 and 31,489,196 shares issued and outstanding at December 31, 2015 and 2014, respectively | 327 | 314 | ||||||
| Treasury stock | (55 | ) | (55 | ) | ||||
| Additional paid-in capital | 310,727 | 292,117 | ||||||
| Accumulated deficit | (130,730 | ) | (119,090 | ) | ||||
| Total stockholders’ equity | 180,269 | 173,286 | ||||||
| Total liabilities and stockholders’ equity | $ | 369,598 | $ | 312,835 | ||||
See accompanying notes to consolidated financial statements.
48
Everyday Health, Inc.
Consolidated Statements Of Operations
(in thousands, except share and per share data)
| Year ended December 31, | ||||||||||||
| 2015 | 2014 | 2013 | ||||||||||
| Revenues | ||||||||||||
| Advertising and sponsorship revenues | $ | 209,093 | $ | 166,465 | $ | 134,893 | ||||||
| Premium services revenues | 22,898 | 17,860 | 20,957 | |||||||||
| Total revenues | 231,991 | 184,325 | 155,850 | |||||||||
| Operating expenses: | ||||||||||||
| Cost of revenues | 66,923 | 49,296 | 43,338 | |||||||||
| Sales and marketing | 74,761 | 48,605 | 44,385 | |||||||||
| Product development | 55,920 | 44,541 | 43,759 | |||||||||
| General and administrative | 39,487 | 30,041 | 27,462 | |||||||||
| Total operating expenses | 237,091 | 172,483 | 158,944 | |||||||||
| Income (loss) from operations | (5,100 | ) | 11,842 | (3,094 | ) | |||||||
| Interest expense, net | (5,236 | ) | (3,711 | ) | (8,442 | ) | ||||||
| Other expense | — | (4,114 | ) | (359 | ) | |||||||
| Income (loss) from continuing operations before (provision) benefit for income taxes | (10,336 | ) | 4,017 | (11,895 | ) | |||||||
| (Provision) benefit for income taxes | (1,304 | ) | 8,666 | (1,102 | ) | |||||||
| Income (loss) from continuing operations | (11,640 | ) | 12,683 | (12,997 | ) | |||||||
| Loss from discontinued operations, net of tax | — | — | (5,239 | ) | ||||||||
| Net income (loss) | (11,640 | ) | 12,683 | (18,236 | ) | |||||||
| Series G preferred stock deemed dividend | — | (8,079 | ) | — | ||||||||
| Net income (loss) attributable to common stockholders | $ | (11,640 | ) | $ | 4,604 | $ | (18,236 | ) | ||||
| Basic net income (loss) attributable to common stockholders per common share: | ||||||||||||
| Net income (loss) attributable to common stockholders from continuing operations | $ | (0.36 | ) | $ | 0.19 | $ | (2.55 | ) | ||||
| Net loss attributable to common stockholders from discontinued operations, net of tax | — | — | (1.03 | ) | ||||||||
| Net income (loss) attributable to common stockholders | $ | (0.36 | ) | $ | 0.19 | $ | (3.57 | ) | ||||
| Diluted net income (loss) attributable to common stockholders per common share: | ||||||||||||
| Net income (loss) attributable to common stockholders from continuing operations | $ | (0.36 | ) | $ | 0.17 | $ | (2.55 | ) | ||||
| Net loss attributable to common stockholders from discontinued operations, net of tax | — | — | (1.03 | ) | ||||||||
| Net income (loss) attributable to common stockholders | $ | (0.36 | ) | $ | 0.17 | $ | (3.57 | ) | ||||
| Weighted-average common shares outstanding: | ||||||||||||
| Basic | 31,977,246 | 24,259,395 | 5,103,351 | |||||||||
| Diluted | 31,977,246 | 26,911,782 | 5,103,351 | |||||||||
See accompanying notes to consolidated financial statements.
49
Everyday Health, Inc.
Consolidated Statements Of Redeemable Convertible Preferred Stock
And Stockholders’ Equity (Deficit)
(in thousands, except share data)
| Redeemable convertible preferred stock | Common stock | Treasury stock | Additional paid in | Accumulated | Total stockholders’ | |||||||||||||||||||||||||||
| Shares | Amount | Shares | Amount | Amount | capital | deficit | equity (deficit) | |||||||||||||||||||||||||
| Balance at December 31, 2012 | 26,820,270 | $ | 158,766 | 4,860,855 | $ | 49 | $ | — | $ | 26,759 | $ | (105,458 | ) | $ | (78,650 | ) | ||||||||||||||||
| Exercise of stock options | — | — | 183,501 | 2 | — | 787 | — | 789 | ||||||||||||||||||||||||
| Warrant issued in connection with credit facility | — | — | — | — | — | 149 | — | 149 | ||||||||||||||||||||||||
| Issuance of common stock | — | — | 330,022 | 3 | — | 2,992 | — | 2,995 | ||||||||||||||||||||||||
| Purchase of treasury stock | — | — | (7,900 | ) | — | (55 | ) | — | — | (55 | ) | |||||||||||||||||||||
| Stock-based compensation expense related to employee stock options | — | — | — | — | — | 3,039 | — | 3,039 | ||||||||||||||||||||||||
| Net loss | — | — | — | — | — | — | (18,236 | ) | (18,236 | ) | ||||||||||||||||||||||
| Balance at December 31, 2013 | 26,820,270 | 158,766 | 5,366,478 | 54 | (55 | ) | 33,726 | (123,694 | ) | (89,969 | ) | |||||||||||||||||||||
| Exercise of stock options | — | — | 1,139,891 | 11 | — | 7,291 | — | 7,302 | ||||||||||||||||||||||||
| Issuance of common stock for acquired business | — | — | 65,710 | 1 | — | 918 | — | 919 | ||||||||||||||||||||||||
| Issuance of common stock in connection with employee stock purchase plan | — | — | 138,184 | 1 | — | 1,591 | — | 1,592 | ||||||||||||||||||||||||
| Stock-based compensation expense | — | — | — | — | — | 9,100 | — | 9,100 | ||||||||||||||||||||||||
| Warrant issued in connection with website partner agreement | — | — | — | — | — | 1,131 | — | 1,131 | ||||||||||||||||||||||||
| Issuance of common stock in connection with IPO, net of $8,848 issuance costs | — | — | 5,676,414 | 57 | — | 70,565 | — | 70,622 | ||||||||||||||||||||||||
| Conversion of preferred stock | (26,820,270 | ) | (158,766 | ) | 18,457,235 | 184 | — | 158,582 | — | 158,766 | ||||||||||||||||||||||
| Series G preferred stock deemed dividend | — | — | — | — | — | 8,079 | (8,079 | ) | — | |||||||||||||||||||||||
| Reclassification of liability warrants to equity warrants | — | — | — | — | — | 1,140 | — | 1,140 | ||||||||||||||||||||||||
| Exercise of warrants | — | — | 645,284 | 6 | — | (6 | ) | — | — | |||||||||||||||||||||||
| Net income | — | — | — | — | — | — | 12,683 | 12,683 | ||||||||||||||||||||||||
| Balance at December 31, 2014 | — | — | 31,489,196 | 314 | (55 | ) | 292,117 | (119,090 | ) | 173,286 | ||||||||||||||||||||||
| Exercise of stock options | — | — | 358,077 | 4 | — | 2,585 | — | 2,589 | ||||||||||||||||||||||||
| Common stock issued for settlement of restricted stock units, net of 100,690 shares withheld to satisfy income tax withholding obligations | — | — | 179,296 | 2 | — | (625 | ) | — | (623 | ) | ||||||||||||||||||||||
| Exercise of warrants | — | — | 99,881 | 1 | — | (1 | ) | — | — | |||||||||||||||||||||||
| Issuance of common stock in connection with employee stock purchase plan | — | — | 271,623 | 3 | — | 2,008 | — | 2,011 | ||||||||||||||||||||||||
| Net issuance of common stock in connection with acquisitions | — | 309,533 | 3 | — | 3,707 | — | 3,710 | |||||||||||||||||||||||||
| Stock-based compensation expense | — | — | — | — | — | 10,936 | — | 10,936 | ||||||||||||||||||||||||
| Net loss | — | — | — | — | — | — | (11,640 | ) | (11,640 | ) | ||||||||||||||||||||||
| Balance at December 31, 2015 | — | $ | — | 32,707,606 | $ | 327 | $ | (55 | ) | $ | 310,727 | $ | (130,730 | ) | $ | 180,269 | ||||||||||||||||
See accompanying notes to consolidated financial statements.
50
Everyday Health, Inc.
Consolidated Statements Of Cash Flows
(in thousands)
| Year Ended December 31, | ||||||||||||
| 2015 | 2014 | 2013 | ||||||||||
| Cash flows from operating activities | ||||||||||||
| Net income (loss) | $ | (11,640 | ) | $ | 12,683 | $ | (18,236 | ) | ||||
| Less loss from discontinued operations, net of tax | — | — | (5,239 | ) | ||||||||
| Income (loss) from continuing operations | (11,640 | ) | 12,683 | (12,997 | ) | |||||||
| Adjustments to reconcile income (loss) from continuing operations to net cash provided by operating activities: | ||||||||||||
| Depreciation and amortization | 20,408 | 14,943 | 15,450 | |||||||||
| Amortization of video and television costs | — | — | 632 | |||||||||
| Provision for doubtful accounts | 326 | 315 | 62 | |||||||||
| Stock-based compensation | 10,936 | 9,100 | 2,969 | |||||||||
| Amortization and write-off of deferred financing costs | 540 | 4,389 | 1,646 | |||||||||
| Asset impairment charge | 1,416 | — | 1,261 | |||||||||
| Provision (benefit) for deferred income taxes | 952 | (9,071 | ) | 962 | ||||||||
| Changes in operating assets and liabilities: | ||||||||||||
| Accounts receivable | (17,490 | ) | (12,437 | ) | (10,683 | ) | ||||||
| Prepaid expenses and other current assets | 982 | 1,489 | (2,725 | ) | ||||||||
| Additions to video and television costs | — | — | (453 | ) | ||||||||
| Accounts payable and accrued expenses | 5,420 | (1,942 | ) | 7,529 | ||||||||
| Deferred revenue | 1,183 | (68 | ) | 1,744 | ||||||||
| Other current liabilities | 154 | 58 | (426 | ) | ||||||||
| Other long-term liabilities | 7,759 | 581 | 951 | |||||||||
| Net cash provided by operating activities from continuing operations | 20,946 | 20,040 | 5,922 | |||||||||
| Net cash used in operating activities from discontinued operations | — | — | (4,250 | ) | ||||||||
| Net cash provided by operating activities | 20,946 | 20,040 | 1,672 | |||||||||
| Cash flows from investing activities | ||||||||||||
| Additions to property and equipment, net | (14,481 | ) | (14,754 | ) | (10,654 | ) | ||||||
| Proceeds from sale of business | — | 400 | 600 | |||||||||
| Payment for businesses purchased, net of cash acquired | (47,316 | ) | (65,000 | ) | (6,736 | ) | ||||||
| Payment of security deposits and other assets | (1,413 | ) | 131 | (717 | ) | |||||||
| Net cash used in investing activities | (63,210 | ) | (79,223 | ) | (17,507 | ) | ||||||
| Cash flows from financing activities | ||||||||||||
| Net proceeds from common stock issuance | — | 70,622 | — | |||||||||
| Proceeds from the exercise of stock options | 2,633 | 7,939 | 101 | |||||||||
| Repayments of principal under former revolver credit facility | — | (30,000 | ) | (850 | ) | |||||||
| Borrowings under former revolver credit facility | — | — | 7,350 | |||||||||
| Repayment of principal under former term loan facility | — | (41,333 | ) | (2,833 | ) | |||||||
| Borrowings under former term loan facility | — | — | 5,000 | |||||||||
| Borrowings under revolver credit facility | 25,000 | 62,300 | — | |||||||||
| Repayment of principal under revolver credit facility | (10,000 | ) | (32,300 | ) | — | |||||||
| Borrowings under term loan facility | 8,500 | 61,000 | — | |||||||||
| Repayment of principal under term loan facility | (2,444 | ) | (1,000 | ) | — | |||||||
| Principal payments on capital lease obligations | (642 | ) | (659 | ) | (456 | ) | ||||||
| Payments of credit facility financing costs | (792 | ) | (2,899 | ) | (68 | ) | ||||||
| Payment for purchase of treasury stock | — | — | (55 | ) | ||||||||
| Tax withholdings related to net share settlements of RSUs | (623 | ) | — | — | ||||||||
| Net cash provided by financing activities | 21,632 | 93,670 | 8,189 | |||||||||
| Net increase (decrease) in cash and cash equivalents | (20,632 | ) | 34,487 | (7,646 | ) | |||||||
| Cash and cash equivalents, beginning of year | 50,729 | 16,242 | 23,888 | |||||||||
| Cash and cash equivalents, end of year | $ | 30,097 | $ | 50,729 | $ | 16,242 | ||||||
See accompanying notes to consolidated financial statements.
51
Everyday Health, Inc.
Notes to Consolidated Financial Statements
(in thousands, except share and per share data)
1. Business
Everyday Health, Inc. (the “Company”) operates a leading marketing and communications platform for healthcare marketers seeking to engage and influence consumers and healthcare professionals. The Company was incorporated in the State of Delaware in January 2002 as Agora Media Inc., and changed its name to Waterfront Media Inc. in January 2004. In January 2010, the Company changed its name to Everyday Health, Inc. to better align its corporate identity with the Everyday Health brand.
2. Significant Accounting Policies
Principles of Consolidation
The accompanying consolidated financial statements include the accounts of the Company and its subsidiaries. The results of operations for companies acquired are included in the consolidated financial statements from the effective date of the acquisition. All significant intercompany accounts and transactions have been eliminated in consolidation.
Use of Estimates
The preparation of the consolidated financial statements in conformity with U.S. generally accepted accounting principles (“GAAP”) requires management to make estimates and assumptions that affect the reported amounts of assets and liabilities and the reported amounts of revenues and expenses during the reporting period. The Company bases its estimates on historical experience, current business factors and other available information. Actual results could differ from those estimates. On an ongoing basis, the Company evaluates its estimates and assumptions, including those related to revenue recognition and deferred revenue, allowance for doubtful accounts, internal software development costs and website development costs, valuation of long-lived assets, goodwill and other intangible assets, income taxes and stock-based compensation.
Reclassifications
Certain reclassifications have been made to the prior year financial statements to conform to the December 31, 2015 presentation.
Initial Public Offering
On April 2, 2014, the Company closed its initial public offering of common stock (“IPO”). The IPO, including the additional shares issued and sold on April 30, 2014 pursuant to the underwriters’ exercise of their over-allotment option, resulted in net proceeds of $70,622, after deducting underwriting discounts and commissions and offering costs borne by the Company totaling $8,848. As a result of the IPO, the Company issued and sold 5,676,414 shares of common stock at a public offering price of $14.00 per share, and all of the Company’s redeemable convertible preferred stock outstanding automatically converted into an aggregate of 18,457,235 shares of common stock, including 577,055 additional shares of common stock related to the Series G redeemable convertible preferred stock ratchet provision (refer to Note 10 for further discussion). In addition, certain selling stockholders exercised stock options and warrants for an aggregate of 339,053 shares of common stock, 149,839 shares of common stock were issued upon the automatic net exercise of a warrant, and outstanding warrants to purchase 222,977 shares of redeemable convertible preferred stock automatically converted into warrants to purchase an aggregate of 148,650 shares of common stock, which resulted in the reclassification of the preferred stock warrant liability of $1,140 to additional paid-in capital.
Cash and Cash Equivalents
The Company considers all highly liquid investments with original maturities of three months or less when purchased to be cash equivalents. Cash equivalents principally consist of the Company’s investment in U.S. Treasury securities and other money market funds. The fair value of these investment funds is based on quoted market prices, which are Level 1 inputs, pursuant to the fair value accounting standard, which establishes a framework for measuring fair value and requires disclosures about fair value measurements by establishing a hierarchy that prioritizes the inputs to valuation techniques used to measure fair value.
Property and Equipment
Property and equipment are stated at cost. Depreciation is computed using the straight-line method over the estimated useful lives of the assets, ranging from three to five years. Amortization of leasehold improvements is computed using the straight-line method over the shorter of the lease term or the estimated useful life of the improvement.
Operating Leases
The Company recognizes rent expense on a straight-line basis, including predetermined fixed escalations, over the initial lease term including reasonably assured renewal periods, net of lease incentives, from the time that the Company controls the leased property. Tenant improvement allowances are recognized as a reduction to rent expense on a straight-line basis over the lease term.
Internal Software Development Costs
The Company incurs costs to develop software for internal use. The Company expenses all costs that relate to the planning and post-implementation phases of development as product development expense. Costs incurred in the application development phase, consisting principally of payroll and related benefits, are capitalized. Upon completion, the capitalized costs are amortized using the straight-line method over their estimated useful lives, which is generally three years.
52
Everyday Health,
Inc.
Notes to Consolidated Financial Statements - Continued
(in thousands, except share and per share data)
Website Development Costs
The Company incurs costs to develop its websites, tools and applications. The Company expenses all costs that relate to the planning and post-implementation phases of website development as product development expense. Costs incurred in the development phase, consisting principally of third-party consultants and related charges, and the costs of content determined to provide a future economic benefit, are capitalized. Upon completion, the capitalized costs are amortized using the straight-line method over their estimated useful lives, which is generally three years.
Goodwill
Goodwill represents the excess cost over fair value of the identifiable net assets of acquired businesses.
Goodwill is tested for impairment on an annual basis as of October 1, and whenever events or circumstances indicate that the carrying value of the asset may not be recoverable.
An initial qualitative analysis is performed evaluating whether any events and circumstances occurred or exist that provide evidence that it is more likely than not that the fair value of a reporting unit is less than its carrying amount. If, based on this analysis, indicators deem it more likely than not that the fair value of the reporting unit is less than its carrying amount, then the two-step quantitative impairment test is performed; otherwise, no further step is required.
If and when needed to complete the two-step quantitative assessment, the fair value of goodwill is estimated using a combination of an income approach based on the present value of estimated future cash flows, and a market approach examining transactions in the marketplace involving the sale of stocks of similar publicly traded companies, or the sale of entire companies engaged in operations similar to those of the Company. As the Company has one operating segment and one reporting unit, the first step of the impairment test requires a comparison of the fair value of the reporting unit, or business enterprise value as a whole, to the carrying value of the Company’s invested capital. If the carrying amount exceeds the fair value, there is indication that an impairment may exist, and a second step must be performed. If the carrying amount is less than the fair value, no indication of impairment exists, and a second step is not performed.
The evaluation of the Company’s goodwill indicated that the carrying value of the asset was less than the fair value and, accordingly, there was no impairment loss recognized for the years ended December 31, 2015, 2014 and 2013.
Long-Lived Assets
The Company reviews long-lived assets, including property and equipment and intangible assets with definite lives, for impairment whenever events or changes in circumstances indicate that the carrying value of the asset may not be recoverable. The intangible assets with definite lives consist principally of trade names and customer relationships. Definite-lived intangible assets are amortized over their estimated useful lives, ranging from three to ten years, using the straight-line method which approximates the pattern in which economic benefits are consumed. In accordance with its policy, the Company reviews the estimated useful lives of its intangible assets and other long-lived assets on an ongoing basis. During the year ended December 31, 2015, an impairment charge of $1,416 was recorded related to certain software development projects which the Company decided not to move forward with. The $1,416 charge is included in product development expense in the accompanying consolidated statements of operations. There were no indicators of impairment of the Company’s long-lived assets during the year ended December 31, 2014. During the year ended December 31, 2013, the Company recorded an impairment charge of $1,190 related to the consolidation and reorganization of certain website content and tools. This $1,190 charge is included in product development expense in the accompanying consolidated statements of operations.
Revenue Recognition and Deferred Revenue
The Company generates its revenue from (i) advertising and sponsorships and (ii) premium services, including consumer subscriptions, SaaS-based licensing fees and other licensing fees. Advertising revenue is recognized in the period in which the advertisement is delivered. Revenue from sponsorships, which includes time and materials based creative services, is recognized over the period the Company substantially satisfies its contractual obligations as required under the respective sponsorship agreements. When contractual arrangements contain multiple elements, revenue is allocated to each element based on its relative fair value determined using prices charged when elements are sold separately. In instances where individual deliverables are not sold separately, or when third-party evidence is not available, fair value is determined based on management’s best estimate of selling price.
Subscriptions are generally paid in advance on a monthly, quarterly or annual basis. Subscription revenue, after deducting refunds and charge-backs, is recognized on a straight-line basis ratably over the subscription periods. SaaS and other licensing revenue is generally recognized on a straight-line basis ratably over the life of the contract.
Deferred revenue relates to: (i) subscription fees for which amounts have been collected but for which revenue has not been recognized, and (ii) advertising and sponsorship fees and licensing fees billed in advance of when the revenue is to be earned.
53
Everyday Health,
Inc.
Notes to Consolidated Financial Statements - Continued
(in thousands, except share and per share data)
Cost of Revenues
Cost of revenues consists principally of the expenses associated with aggregating the total audience across the Company’s websites, including (i) royalty expenses for licensing content for certain websites and for the portion of advertising revenue the Company pays to the owners of certain other websites, and (ii) media costs associated with audience aggregation activities. Cost of revenues also includes market research incentives, direct mail marketing and fulfillment costs, as well as out-of-pocket costs related to creative services and costs associated with subscription fees for our premium services, ad serving and other expenses.
Royalty expense amounted to $23,805, $20,937 and $18,673 for the years ended December 31, 2015, 2014 and 2013, respectively.
Media costs consist primarily of fees paid to online publishers, Internet search companies and other media channels for search engine and database marketing, and display and television advertising. These media activities are attributable to revenue-generating and audience aggregation events, designed to increase the audience to the websites the Company operates, increase the number of subscribers to premium services and grow the Company’s registered user base. Media costs totaled $32,198, $24,973 and $22,437 for the years ended December 31, 2015, 2014 and 2013, respectively.
Other Expense
There were no charges reflected as other expense for the years ended December 31, 2015 and 2013. In connection with the refinancing of its credit facilities in 2014, the Company wrote-off unamortized deferred financing costs totaling $2,845 and incurred prepayment fees of $1,016, which, together with the mark-to-market adjustment on certain preferred stock warrants of $253, is reflected as other expense in the accompanying consolidated statements of operations for the year ended December 31, 2014.
Income Taxes
The Company accounts for taxes under the asset and liability method. Under this method, deferred tax assets and liabilities are recognized for the future tax consequences attributable to differences between the tax and financial statement reporting basis of assets and liabilities.
Deferred tax assets and liabilities are measured using enacted tax rates expected to apply to taxable income in the years in which those temporary differences are expected to be recovered or settled. The Company reduces the measurement of a deferred tax asset, if necessary, by a valuation allowance if it is more likely than not that the Company will not realize some or all of the deferred tax asset. As a result of the Company’s historical operating performance and the cumulative net losses incurred to date, the Company does not have sufficient objective evidence to support the recovery of the net deferred tax assets. Accordingly, the Company has established a valuation allowance against net deferred tax assets for financial reporting purposes to the extent it is determined that such deferred tax assets are not more likely than not to be realized.
The Company accounts for uncertain tax positions by recognizing the financial statement effects of a tax position only when, based upon technical merits, it is “more likely than not” that the position will be sustained upon examination. Potential interest and penalties associated with unrecognized tax positions are recognized in income tax expense.
Comprehensive Income (Loss)
Other than the Series G preferred stock deemed dividend reflected in the accompanying statement of operations for the year end December 31, 2014 (see Note 10), the Company has no items of other comprehensive income (loss).
Fair Value of Financial Instruments
Due to their short-term maturities, the carrying amounts of the Company’s financial instruments, including cash and cash equivalents, accounts receivable, accounts payable and accrued expenses, approximate fair value. Cash equivalents principally consist of the Company’s investment in U.S. Treasury securities and other highly liquid money market funds. The fair value of these investment funds is based on quoted market prices, which are Level 1 inputs, pursuant to the fair value accounting standard, which establishes a framework for measuring fair value and requires disclosures about fair value measurements by establishing a hierarchy that prioritizes the inputs to valuation techniques used to measure fair value. The fair value of the Company’s debt approximates the recorded amounts as the interest rates on the credit facilities are based on market interest rates.
Stock-Based Compensation
The Company accounts for all share-based payments, including grants of employee stock options and restricted stock units, based on the fair value of the award measured at the grant date. The Company uses the Black-Scholes option pricing model to estimate the fair value of the stock option awards and stock purchase rights provided under the 2014 Employee Stock Purchase Plan, or ESPP. The fair value of restricted stock unit awards represents the closing price of the Company’s common stock on the date of grant. Stock-based compensation expense is recognized over the period during which the recipient provides services, generally the vesting period, net of estimated forfeitures.
54
Everyday Health,
Inc.
Notes to Consolidated Financial Statements - Continued
(in thousands, except share and per share data)
Business Concentrations, Accounts Receivable and Credit Risk
Financial instruments which potentially subject the Company to concentration of credit risk consist principally of cash and cash equivalents and accounts receivable.
Cash and cash equivalents includes U.S. Treasury securities and other money market funds.
Concentration of credit risk with respect to accounts receivable is limited due to the large number of customers comprising the Company’s customer base and the ongoing credit evaluation of its customers.
For the years ended December 31, 2015 and 2014, no advertising customer accounted for greater than 10% of total revenues. For the year ended December 31, 2013, one advertising customer accounted for 12% of total revenues. As of December 31, 2015 and 2014, no advertising customers accounted for greater than 10% of total accounts receivable. As many of the Company’s advertising customers work through the same advertising agencies, the Company also monitors the concentration of accounts receivable at the agency level. As of December 31, 2015 and 2014, no advertising agency accounted for greater than 10% of accounts receivable.
The Company’s net accounts receivable balance of $90,356 and $68,007 reflected in the accompanying balance sheets as of December 31, 2015 and 2014, respectively, include unbilled accounts receivable of $12,224 and $7,064 as of December 31, 2015 and 2014, respectively, which primarily represent revenue earned and accrued in the respective fiscal years, billed subsequent to year end.
An allowance for doubtful accounts is established with respect to accounts receivable that the Company has determined to be doubtful of collection, based upon factors surrounding the credit risk of customers, historical experience and other information.
The following table summarizes the activity of the allowance for doubtful accounts:
| Year Ended December 31, | ||||||||||||
| 2015 | 2014 | 2013 | ||||||||||
| Balance at beginning of year | $ | 637 | $ | 530 | $ | 651 | ||||||
| Bad debt provision | 326 | 384 | 251 | |||||||||
| Write-offs | (54 | ) | (277 | ) | (372 | ) | ||||||
| Balance at end of year | $ | 909 | $ | 637 | $ | 530 | ||||||
Business Combinations
The Company allocates the fair value of purchase consideration to the tangible assets acquired, liabilities assumed and intangible assets acquired based on their estimated fair values. The excess of the fair value of purchase consideration over the fair values of these identifiable assets and liabilities is recorded as goodwill. Such valuations require management to make significant estimates and assumptions, especially with respect to intangible assets. During the measurement period, which is up to one year from the acquisition date, the Company may record adjustments to the assets acquired and liabilities assumed, based on additional information impacting the assigned estimated fair values.
Segment Information
The Company and its subsidiaries are organized in a single operating segment, providing digital health marketing and communications solutions, and the Company also has one reportable segment. Substantially all of the Company’s revenues are derived from U.S. sources.
Net Income (Loss) Attributable to Common Stockholders per Common Share
Basic net income (loss) attributable to common stockholders per common share is computed by dividing net income (loss) attributable to common stockholders by the weighted-average number of shares of common stock outstanding for the period.
Diluted net income (loss) attributable to common stockholders per common share is computed by dividing net income (loss) attributable to common stockholders by the weighted-average number of shares of common stock outstanding for the period, adjusted to reflect potentially dilutive securities. Potentially dilutive securities consist of incremental shares issuable upon the assumed exercise of stock options, restricted stock units and warrants using the treasury stock method, convertible preferred shares using the “if converted” method, and employee withholdings to purchase common stock under the Company’s ESPP. Due to the net losses for the years ended December 31, 2015 and 2013, the aforementioned potentially dilutive securities were not included in the computation of diluted net loss per common share because the effect would have been anti-dilutive.
The basic and diluted net income (loss) attributable to common stockholders per common share is calculated as follows for the periods presented:
55
Everyday Health,
Inc.
Notes to Consolidated Financial Statements - Continued
(in thousands, except share and per share data)
| Year Ended December 31, | ||||||||||||
| 2015 | 2014 | 2013 | ||||||||||
| Numerator: | ||||||||||||
| Income (loss) from continuing operations | $ | (11,640 | ) | $ | 12,683 | $ | (12,997 | ) | ||||
| Loss from discontinued operations, net of tax | — | — | (5,239 | ) | ||||||||
| Net income (loss) | (11,640 | ) | 12,683 | (18,236 | ) | |||||||
| Series G preferred stock deemed dividend | — | (8,079 | ) | — | ||||||||
| Net income (loss) attributable to common stockholders | $ | (11,640 | ) | $ | 4,604 | $ | (18,236 | ) | ||||
| Denominator: | ||||||||||||
| Weighted-average number of common shares outstanding for basic net income (loss) attributable to common stockholders per common share | 31,977,246 | 24,259,395 | 5,103,351 | |||||||||
| Dilutive securities: | ||||||||||||
| Stock option awards | — | 2,235,059 | — | |||||||||
| Warrants to purchase common stock | — | 412,305 | — | |||||||||
| Employee stock purchase plan | — | 5,023 | — | |||||||||
| Total weighted-average diluted shares | 31,977,246 | 26,911,782 | 5,103,351 | |||||||||
| Basic net income (loss) attributable to common stockholders per common share: | ||||||||||||
| Income (loss) from continuing operations | $ | (0.36 | ) | $ | 0.19 | $ | (2.55 | ) | ||||
| Loss from discontinued operations, net of tax | — | — | (1.03 | ) | ||||||||
| Net income (loss) attributable to common stockholders | $ | (0.36 | ) | $ | 0.19 | $ | (3.57 | ) | ||||
| Diluted net income (loss) attributable to common stockholders per common share: | ||||||||||||
| Income (loss) from continuing operations | $ | (0.36 | ) | $ | 0.17 | $ | (2.55 | ) | ||||
| Loss from discontinued operations, net of tax | — | — | (1.03 | ) | ||||||||
| Net income (loss) attributable to common stockholders | $ | (0.36 | ) | $ | 0.17 | $ | (3.57 | ) | ||||
The following securities were outstanding for the periods presented below and have been excluded from the calculation of diluted net income (loss) attributable to common stockholders per common share because the effect is anti-dilutive:
| Year Ended December 31, | ||||||||||||
| 2015 | 2014 | 2013 | ||||||||||
| Warrants to purchase common stock | 76,659 | — | 583,247 | |||||||||
| Warrants to purchase redeemable convertible preferred stock | — | — | 148,650 | |||||||||
| Redeemable convertible preferred stock | — | — | 17,880,180 | |||||||||
| Stock option awards | 6,252,223 | 1,337,766 | 5,366,785 | |||||||||
| Unvested RSU awards | 453,349 | — | — | |||||||||
| Employee stock purchase plan | 100,722 | — | — | |||||||||
| Total weighted-average anti-dilutive securities | 6,882,953 | 1,337,766 | 23,978,862 | |||||||||
Foreign Currency
The financial statements and transactions of the Company’s foreign subsidiary are maintained in its local currency. The translation of foreign currencies into United States dollars is performed for balance sheet accounts using current exchange rates in effect at the balance sheet date, and for revenue and expense accounts using average exchange rates during the year. Foreign currency gains or losses are included in the consolidated statements of operations and were not material in any of the periods presented.
Recently Issued and Adopted Accounting Standards
In April 2014, the Financial Accounting Standards Board (“FASB”) issued amended guidance for reporting discontinued operations. Under the new guidance, only disposals that represent a strategic shift having a material impact on an entity’s operations and financial results shall be reported as discontinued operations, with expanded disclosures. This amendment will be effective for the first annual reporting period beginning after December 15, 2015. The Company does not expect the impact of the adoption of this guidance to be material to the consolidated financial statements.
In May 2014, the FASB issued guidance which provides a comprehensive new revenue recognition model. The core principle of the guidance is to recognize revenue when promised goods or services are transferred to customers in an amount that reflects the consideration that is expected to be received for those goods or services. The guidance was originally to be effective for annual and interim periods beginning after December 15, 2016. In August 2015, the FASB approved a one year deferral of the effective date to December 15, 2017 and early adoption is permitted, but not before the original effective date of December 15, 2016. The standard permits the use of either the retrospective or cumulative effect transition method. The Company has not yet selected a transition method and is currently evaluating the effect that the new standard will have on the consolidated financial statements and related disclosures.
56
Everyday Health,
Inc.
Notes to Consolidated Financial Statements - Continued
(in thousands, except share and per share data)
In June 2014, the FASB issued updated guidance on stock compensation accounting requiring that a performance target that affects vesting and could be achieved after the requisite service period should be treated as a performance condition. Current GAAP does not contain explicit guidance on how to account for such share-based payments. This updated guidance is effective for fiscal years beginning after December 15, 2015, and for interim periods within those fiscal years. Early adoption is permitted. The Company does not expect the impact of the adoption of this guidance to be material to the consolidated financial statements.
In April 2015, the FASB issued updated guidance on the presentation of debt issuance costs in financial statements. The new guidance requires an entity to present such costs in the balance sheet as a direct deduction from the related debt liability rather than as an asset. Amortization of the costs will continue to be reported as interest expense. This guidance will be effective for the Company beginning in the first quarter of 2016 on a retrospective basis for all periods presented, with early adoption optional. The Company does not expect the impact of the adoption of this guidance to be material to the consolidated financial statements.
In September 2015, the FASB issued updated guidance on business combinations accounting requiring the acquirer to recognize adjustments to provisional amounts that are identified during the measurement period in the reporting period in which the adjustment amounts are determined. Previously, such adjustments were required to be retrospectively recorded in prior period financial information. The amended guidance will be effective for fiscal years beginning after December 15, 2015, including interim periods within those fiscal years. The standard is to be applied prospectively, with early adoption permitted. The Company does not expect the impact of the adoption of this guidance to be material to the consolidated financial statements.
In November 2015, the FASB issued updated guidance on balance sheet classification of deferred taxes, requiring all deferred tax assets and liabilities, and any related valuation allowance, to be classified as non-current on the balance sheet. The classification change for all deferred taxes as non-current simplifies entities’ processes as it eliminates the need to separately identify the net current and net non-current deferred tax asset or liability in each jurisdiction and allocate valuation allowances. This guidance is effective for annual periods beginning after December 15, 2016, and interim periods within those annual periods, with earlier application permitted. The Company elected to early adopt this guidance on a retrospective basis effective December 31, 2014. As a result of the retrospective adoption, the Company reclassified $656 from current deferred tax assets to non-current deferred tax liabilities in the 2014 balance sheet. The adoption of this guidance had no impact on net income (loss).
In February 2016, the FASB issued updated guidance on leases which, for operating leases, requires a lessee to recognize a right-of-use asset and a lease liability, initially measured at the present value of the lease payments, in its balance sheet. The standard also requires a lessee to recognize a single lease cost, calculated so that the cost of the lease is allocated over the lease term, on a generally straight-line basis. The guidance is effective for fiscal years beginning after December 15, 2018, including interim periods within those fiscal years, with earlier application permitted. We are currently evaluating the effects of the adoption and have not yet determined the impact the revised guidance will have on our consolidated financial statements and related disclosures.
3. Acquisitions
Tea Leaves Health, LLC
In August 2015, the Company acquired 100% of the limited liability company membership interests of Tea Leaves Health, LLC (“Tea Leaves”), a provider of a SaaS-based marketing and analytics platform for hospital systems to identify and engage consumers and physicians. The purchase price was valued at $29,893, consisting of (i) $15,000 in cash paid at closing, (ii) 327,784 shares of the Company’s common stock valued at $3,893, issued at closing and held in escrow for potential post-closing working capital and/or indemnification claims, and (iii) $11,000 to be paid within six months of closing in cash, shares of the Company’s common stock or a combination of cash and shares of the Company’s common stock, in the Company’s sole discretion. The $11,000 deferred purchase price is included in other current liabilities in the accompanying balance sheet as of December 31, 2015 (see Note 17 for further discussion). As a result of a $184 working capital adjustment during the fourth quarter of 2015, the fair value of the total consideration amounts to $29,709. The working capital adjustment was settled via cancellation of 18,251 shares of the Company’s common shares held in escrow.
In addition to the purchase price, the former members of Tea Leaves are eligible to receive an additional $20,000 (50% in cash and 50% in shares of the Company’s common stock) based on the achievement of a specified Tea Leaves financial target as of December 31, 2016, as set forth in the Membership Interest Purchase Agreement between the Company, Tea Leaves and the other parties thereto. This earn-out payment is contingent upon the continued employment with the Company of certain former members of Tea Leaves through December 31, 2016, with the earn-out, if earned, to be paid in the first quarter of 2017. See Note 17 for certain amendments to the earn-out terms agreed to in February 2016. For the year ended December 31, 2015, the Company accrued $5,882 in compensation expense for this earn-out, which is reflected in other long-term liabilities in the accompanying balance sheet as of December 31, 2015. Of the $5,882 accrued earn-out, $1,177 is included in sales and marketing expense, $4,117 is included in product development expense and $588 is included in general and administrative expense in the accompanying consolidated statement of operations for the year ended December 31, 2015.
The acquisition was accounted for as a business combination and, accordingly, the purchase price was allocated to the tangible and intangible assets acquired and liabilities assumed based on the respective fair values. The results of operations of Tea Leaves, which are not material for the year ended December 31, 2015, have been included in the consolidated financial statements of the Company from August 6, 2015, the closing date of the acquisition. Pro forma consolidated results of operations giving effect to this acquisition would not vary materially from historical results.
57
Everyday Health,
Inc.
Notes to Consolidated Financial Statements - Continued
(in thousands, except share and per share data)
The following table summarizes the allocation of the assets acquired and liabilities assumed based on their fair values on the acquisition date. The fair values presented are subject to adjustment during a measurement period of up to one year from the acquisition date. The measurement period provides the Company with the ability to adjust the fair values of acquired assets for new information that is obtained about circumstances that existed as of the acquisition date.
| Cash and cash equivalents | $ | 296 | ||
| Accounts receivable | 778 | |||
| Other current assets | 19 | |||
| Property and equipment | 3,404 | |||
| Intangible assets | 3,410 | |||
| Goodwill | 23,330 | |||
| Deferred revenue | (535 | ) | ||
| Accounts payable and accrued expenses | (993 | ) | ||
| Total consideration paid | $ | 29,709 |
Goodwill recognized as a result of the Tea Leaves acquisition is primarily attributable to expected synergies from enabling the Company to offer an integrated suite of software and media solutions that will allow hospital systems to target both consumers and physicians. All of the goodwill is expected to be deductible for tax purposes.
Cambridge BioMarketing Group, LLC
In March 2015, the Company acquired 100% of the limited liability company membership interests of Cambridge BioMarketing Group, LLC (“Cambridge”), a provider of strategic launch and marketing solutions for orphan and rare disease products, for a total purchase price of $32,273, of which $24,273 was paid in cash at closing. The remaining $8,000 obligation at closing was comprised of convertible notes that could either convert into shares of the Company’s common stock or be paid in cash at the discretion of the Company. The Company paid the $8,000 obligation in cash in May 2015. As a result of $216 working capital and other purchase price adjustments, the fair value of the total consideration amounts to $32,057. In addition to the purchase price described above, the former members of Cambridge are eligible to receive up to an additional $5,000 in cash based on Cambridge’s achievement of certain revenue and Adjusted EBITDA targets for 2015. This earn-out payment is contingent upon the continued employment with the Company of certain former members of Cambridge at the time the earn-out payment is due to be paid in the first quarter of 2016. The Company records any such earn-out as compensation expense for the applicable period. During the year ended December 31, 2015, the Company accrued $4,913 in compensation expense for this earn-out, which is reflected in accounts payable and accrued expenses in the accompanying balance sheet as of December 31, 2015 and included in sales and marketing expense in the accompanying consolidated statements of operations.
The acquisition was accounted for as a business combination and, accordingly, the purchase price was allocated to the tangible and intangible assets acquired and liabilities assumed based on the respective fair values. The results of operations of Cambridge have been included in the consolidated financial statements of the Company from March 20, 2015, the closing date of the acquisition. The consolidated statement of operations for the year ended December 31, 2015 includes revenue of $20,736 and pre-tax income of $4,651 attributable to Cambridge. Additionally, for the year ended December 31, 2015, acquisition-related costs of $186 are included in general and administrative expenses in the accompanying consolidated statements of operations.
The following table summarizes the allocation of the assets acquired and liabilities assumed based on their fair values on the acquisition date. The fair values presented are subject to adjustment during a measurement period of up to one year from the acquisition date. The measurement period provides the Company with the ability to adjust the fair values of acquired assets for new information that is obtained about circumstances that existed as of the acquisition date.
| Accounts receivable | $ | 4,406 | ||
| Other current assets | 137 | |||
| Property and equipment | 783 | |||
| Goodwill | 15,360 | |||
| Intangible assets | 14,280 | |||
| Accounts payable and accrued expenses | (2,659 | ) | ||
| Deferred revenue | (197 | ) | ||
| Other current liabilities | (53 | ) | ||
| Total consideration paid | $ | 32,057 |
Goodwill recognized as a result of the Cambridge acquisition is primarily attributable to expected synergies from broadening the Company’s strategic marketing and communications solutions to pharmaceutical brands targeting orphan and rare diseases. All of the goodwill is expected to be deductible for tax purposes.
The following table presents the Company’s unaudited pro forma consolidated results for the years ended December 31, 2015 and 2014. The unaudited pro forma results include the historical consolidated statements of operations of the Company and Cambridge, giving effect to the Cambridge acquisition as if it had occurred on January 1, 2014.
| Unaudited Pro Forma Results Year Ended December 31, | ||||||||
| 2015 | 2014 | |||||||
| Revenues | $ | 238,858 | $ | 203,143 | ||||
| Net income (loss) | $ | (11,042 | ) | $ | 13,119 | |||
58
Everyday Health,
Inc.
Notes to Consolidated Financial Statements - Continued
(in thousands, except share and per share data)
The unaudited pro forma results give effect to pro forma events that are directly attributable to the assumed acquisitions, factually supportable, and expected to have a continuing impact on the combined results. The unaudited pro forma results include adjustments primarily related to amortization expense associated with acquired intangible assets, incremental interest expense related to additional borrowings on the Company’s Credit Facility used to fund the Cambridge acquisition and deferred tax expense from amortization of indefinite-lived intangible assets (see Note 12). The unaudited pro forma results are not necessarily indicative of or intended to represent the results that would have been achieved had the transaction been consummated as of the date indicated or that may be achieved in future periods. The actual results reported by the combined company in periods following the acquisition may differ significantly from those reflected in the pro forma results for a number of reasons, including cost saving synergies from operating efficiencies and the effect of the incremental costs incurred to integrate the two companies.
DoctorDirectory.com, Inc.
In November 2014, the Company acquired all of the outstanding equity of DoctorDirectory.com, Inc. (“DD”), which provided pharmaceutical companies with multi-channel interactive marketing services that target healthcare professionals, for a cash purchase price of $65,000. The DD acquisition enabled the Company to significantly increase the number of healthcare professionals it reaches, deepen and broaden its relationships with pharmaceutical companies, gain valuable expertise across sales, marketing and data and analytics, and introduce new products and services to healthcare professionals. Goodwill recognized from the DD acquisition is primarily attributable to these synergies. None of the goodwill is expected to be deductible for tax purposes. As of December 31, 2014, all purchase price obligations were settled other than $474 of working capital adjustments which were settled during 2015.
For the years ended December 31, 2015 and 2014, acquisition-related costs of $21 and $183 are included in general and administrative expenses in the accompanying consolidated statements of operations. The acquisition was accounted for as a business combination and, accordingly, the purchase price was allocated to the tangible and intangible assets acquired and liabilities assumed on the basis of their respective fair values. The results of operations of DD have been included in the consolidated financial statements of the Company from November 12, 2014, the closing date of the acquisition.
The following table summarizes the tangible and intangible assets acquired, the liabilities assumed and the consideration paid:.
| Accounts receivable | $ | 6,513 | ||
| Deferred tax asset | 81 | |||
| Other current assets | 232 | |||
| Property and equipment | 1,612 | |||
| Goodwill | 44,428 | |||
| Intangible assets | 24,970 | |||
| Accounts payable and accrued expenses | (1,659 | ) | ||
| Deferred tax liability | (10,703 | ) | ||
| Total consideration paid | $ | 65,474 |
The following table presents the Company’s unaudited pro forma consolidated results for the years ended December 31, 2014 and 2013. The unaudited pro forma results include the historical consolidated statements of operations of the Company and DD, giving effect to the DD acquisition, and related financing transactions, as if they had occurred at January 1, 2013.
| Unaudited Pro Forma Results Year Ended December 31, | ||||||||
| 2014 | 2013 | |||||||
| Revenues | $ | 201,335 | $ | 172,877 | ||||
| Net income (loss) | $ | 4,640 | $ | (12,425 | ) | |||
The unaudited pro forma results include: (i) amortization expense associated with acquired intangible and technology assets; (ii) incremental interest expense related to additional borrowings on the Company’s Credit Facility used to fund the DD acquisition, and amortization of related deferred financing costs (see Note 9); (iii) elimination of stock-based compensation expenses related to the pre-acquisition period; (iv) elimination of transaction costs incurred related to the acquisition; and (v) elimination of DD’s historical federal tax provision for the year ended December 31, 2013, as the combined entity would have a loss before provision for income taxes for the year. Additionally, the unaudited pro forma combined net income for the year ended December 31, 2014 includes a pro forma adjustment to eliminate a one-time benefit recorded to the provision for income taxes of $10,033 (see Note 12) which resulted from reducing the deferred tax valuation allowance related to acquired intangible and other assets. The benefit is excluded from the unaudited pro forma results as it will not have a continuing impact on the combined results.
The unaudited pro forma results give effect to pro forma events that are (1) directly attributable to the assumed acquisition, (2) factually supportable, and (3) with respect to the combined statements of operations, expected to have a continuing impact on the combined results. Additionally, the unaudited pro forma adjustments are not necessarily indicative of or intended to represent the results that would have been achieved had the transaction been consummated as of the date indicated or that may be achieved in the future. The actual results reported by the combined company in periods following the acquisition may differ significantly from those reflected in the pro forma results for a number of reasons, including cost saving synergies from operating efficiencies and the effect of the incremental costs incurred to integrate the two companies.
59
Everyday Health,
Inc.
Notes to Consolidated Financial Statements - Continued
(in thousands, except share and per share data)
EQAL, Inc.
In September 2012, the Company acquired all of the outstanding equity of EQAL, Inc. (“EQ”), which managed digital media properties for various brands and celebrities. The former stockholders and founders of EQ were eligible to receive up to $5,000 based on the Company’s achievement of certain revenue and operating income targets during 2013. The Company records any such earn-outs as compensation expense for the applicable periods. For the year ended December 31, 2013, the Company incurred $2,211 of such expense, which is included in sales and marketing expense in the accompanying consolidated statements of operations. The earn-out payment, which was payable in cash and shares of the Company’s common stock, was settled in full during the year ended December 31, 2014.
4. Discontinued Operations
In November 2013, the Board of Directors approved a plan to sell the Doctor Solutions business, which provided local online directories, search engine marketing and other marketing services to healthcare professionals. By the end of 2013, the Company identified a buyer and completed the sale, at a price of $1,000. The sale represented a disposal of a component of an entity whose operations and cash flows were eliminated from the Company’s ongoing business after the sale. As such, the operating results, along with the loss on sale, have been reported as discontinued operations in the consolidated statements of operations for the year ended December 31, 2013. As the sale was completed during 2013, there were no results from discontinued operations to report for the years ended December 31, 2015 and 2014. The loss from discontinued operations was comprised of the following:
| Year ended December 31, 2013 | ||||
| Revenues | $ | 7,116 | ||
| Loss from operations | (3,971 | ) | ||
| Loss on sale | (1,268 | ) | ||
| Loss from discontinued operations before tax | (5,239 | ) | ||
| Income tax (provision) benefit | — | |||
| Net loss from discontinued operations | $ | (5,239 | ) | |
No benefit for income taxes was provided as the Company recorded a full valuation allowance against the NOLs generated by the discontinued operations.
5. Prepaid Expenses and Other Current Assets
Prepaid expenses and other current assets consist of the following:
| December 31, | ||||||||
| 2015 | 2014 | |||||||
| Prepaid royalties | $ | 689 | $ | 1,225 | ||||
| Prepaid marketing | 838 | 422 | ||||||
| Other | 3,135 | 3,882 | ||||||
| Total | $ | 4,662 | $ | 5,529 | ||||
6. Property and Equipment
Property and equipment consist of the following:
| December 31, | ||||||||
| 2015 | 2014 | |||||||
| Computer equipment and purchased software | $ | 14,958 | $ | 12,402 | ||||
| Internally developed software | 43,469 | 37,226 | ||||||
| Acquired technology | 5,097 | 1,957 | ||||||
| Furniture, fixtures and office equipment | 3,761 | 2,978 | ||||||
| Leasehold improvements | 7,007 | 6,381 | ||||||
| Website development costs | 29,964 | 25,292 | ||||||
| 104,256 | 86,236 | |||||||
| Less accumulated depreciation and amortization | (75,691 | ) | (60,734 | ) | ||||
| Total | $ | 28,565 | $ | 25,502 | ||||
60
Everyday Health,
Inc.
Notes to Consolidated Financial Statements - Continued
(in thousands, except share and per share data)
During the years ended December 31, 2015, 2014 and 2013, the Company capitalized $7,774, $8,870 and $7,416, respectively, of internally developed software costs. Unamortized internally developed software was $12,228 and $13,078 as of December 31, 2015 and 2014, respectively. Amortization expense of internally developed software was $7,092, $6,583 and $5,198 for the years ended December 31, 2015, 2014 and 2013, respectively.
Depreciation and amortization expense related to property and equipment is classified as follows in the accompanying consolidated statements of operations:
| Year Ended December 31, | ||||||||||||
| 2015 | 2014 | 2013 | ||||||||||
| Sales and marketing | $ | 1,190 | $ | 1,286 | $ | 1,183 | ||||||
| Product development | 12,764 | 10,811 | 10,325 | |||||||||
| General and administrative | 324 | 327 | 350 | |||||||||
| Total depreciation and amortization | $ | 14,278 | $ | 12,424 | $ | 11,858 | ||||||
7. Goodwill and Other Intangible Assets
During the year ended December 31, 2015, goodwill of $38,690 and definite-lived intangible assets of $17,690 were recorded in connection with the Cambridge and Tea Leaves acquisitions (see Note 3). The value of the intangible assets acquired in connection with the Cambridge acquisition consists of customer relationships of $8,810 and trade names of $5,470, each of which has an estimated useful life of 10 years. The value of the intangible assets acquired in connection with the Tea Leaves acquisition consists of customer relationships of $2,510 and trade names of $900, which have estimated useful lives of 10 years and 3 years, respectively. Additionally, goodwill decreased by $534 and definite-lived intangible assets increased by $1,470 during the year ended December 31, 2015 from working capital adjustments and a revision to the preliminary fair value allocation of assets acquired and liabilities assumed related to the November 2014 DD acquisition (see Note 3 and discussion below).
During the year ended December 31, 2014, goodwill of $44,962 and definite-lived intangible assets of $23,500 were recorded in connection with the DD acquisition (see Note 3). Included in the goodwill is $10,033 recorded in connection with a deferred tax liability recognized upon acquisition, related to basis differences in acquired intangible assets (see Note 12).
Intangible assets consist of the following:
| December 31, 2015 | December 31, 2014 | |||||||||||||||||||||||||||||||
| Gross carrying amount | Accumulated amortization | Net | Weighted- average remaining useful life (a) | Gross carrying amount | Accumulated amortization | Net | Weighted- average remaining useful life (a) | |||||||||||||||||||||||||
| Customer relationships | $ | 40,090 | $ | (14,206 | ) | $ | 25,884 | 8.9 | $ | 27,300 | $ | (11,247 | ) | $ | 16,053 | 9.5 | ||||||||||||||||
| Trade names | 24,985 | (7,123 | ) | 17,862 | 6.4 | 18,615 | (4,370 | ) | 14,245 | 6.5 | ||||||||||||||||||||||
| Other intangibles | 3,900 | (3,900 | ) | - | 0.0 | 3,900 | (3,482 | ) | 418 | 0.7 | ||||||||||||||||||||||
| Total | $ | 68,975 | $ | (25,229 | ) | $ | 43,746 | $ | 49,815 | $ | (19,099 | ) | $ | 30,716 | ||||||||||||||||||
| (a) | The calculation of the weighted-average remaining useful life is based on weighting the net book value of each asset in its group, and applying the weight to its respective remaining amortization period. |
Amortization expense relating to the definite-lived intangible assets totaled $6,130, $2,519 and $3,592 for the years ended December 31, 2015, 2014 and 2013, respectively, and is included in general and administrative expense in the accompanying consolidated statements of operations.
Future amortization expense of the intangible assets is estimated to be as follows:
Year ending December 31:
| 2016 | $ | 6,071 | ||
| 2017 | 6,063 | |||
| 2018 | 5,755 | |||
| 2019 | 5,574 | |||
| 2020 | 5,552 | |||
| Thereafter | 14,731 | |||
| Total | $ | 43,746 |
61
Everyday Health,
Inc.
Notes to Consolidated Financial Statements - Continued
(in thousands, except share and per share data)
8. Accounts Payable and Accrued Expenses
Accounts payable and accrued expenses consist of the following:
| December 31, | ||||||||
| 2015 | 2014 | |||||||
| Accounts payable | $ | 12,638 | $ | 8,563 | ||||
| Accrued compensation | 4,676 | 8,260 | ||||||
| Accrued acquisition earn-outs | 6,338 | 1,425 | ||||||
| Accrued royalties | 6,184 | 5,991 | ||||||
| Accrued media and licensed content | 3,583 | 3,716 | ||||||
| Accrued interest | 1,275 | 408 | ||||||
| Accrued professional fees | 623 | 718 | ||||||
| Other accrued expenses | 3,246 | 2,641 | ||||||
| Total | $ | 38,563 | $ | 31,722 | ||||
9. Long-Term Debt
The Company entered into a credit facility agreement with a syndicated bank group in March 2014, which replaced its then-existing credit facility. The new credit facility consisted of a revolver (“Revolver”) with a maximum borrowing limit of $35,000 and a term loan (“Term Loan”) of $40,000. In November 2014, in connection with an acquisition, the credit facility was amended and restated to, among other things, (i) increase the maximum borrowing limit of the Revolver from $35,000 to $55,000; (ii) increase the Term Loan from $39,000 outstanding as of such date to $60,000; (iii) extend the maturity date of the Term Loan and the due date of principal on the Revolver from March 2019 to November 2019; and (iv) effect certain modifications to the covenants and terms set forth in the credit facility agreement. In March 2015, the amended and restated credit facility was further amended twice to, among other things, (i) consent to the acquisition of Cambridge, (ii) increase the Term Loan from $59,250 outstanding as of such date to $67,750; (iii) increase the maximum borrowing limit of the Revolver from $55,000 to $82,250; and (iv) effect certain modifications to the covenants and terms set forth in the credit facility agreement. All other materials terms of the credit facility, including the applicable maturity dates, remained unchanged by the March 2015 amendments. In August 2015, the Company entered into a third amendment to the amended and restated credit facility (as amended, the “Credit Facility”) to modify a certain defined term; however, all other material terms and conditions of the Credit Facility remained unchanged by the August 2015 amendment. See Note 17 for certain amendments to the Credit Facility completed in February 2016.
The repayment terms of the Revolver provide for quarterly interest payments, with the principal being due in full in November 2019. The repayment terms of the Term Loan provide for quarterly interest and principal payments, with a maturity date of November 2019. The interest rate on the Credit Facility is equal to the London Inter-Bank Offered Rate, or LIBOR, plus a variable rate ranging from 2.75% to 4.0% depending on the Company’s consolidated leverage ratio, as defined in the Credit Facility agreement, and there is a 0.50% commitment fee on the unused portion of the Revolver. As of December 31, 2015, the interest rate on the Credit Facility was 4.33%. As of December 31, 2015, there was $66,056 outstanding on the Term Loan and $45,000 outstanding on the Revolver, with $37,250 available to be drawn on the Revolver.
The Credit Facility contains certain financial and operational covenants, including requirements to maintain a minimum consolidated fixed charge coverage ratio and a maximum consolidated leverage ratio, each as defined in the Credit Facility agreement, as well as restrictions on certain types of dispositions, mergers and acquisitions, indebtedness, investments, liens and capital expenditures, issuance of capital stock and the Company’s ability to pay dividends. The Credit Facility is secured by a first priority security interest in substantially all of the Company’s existing and future assets. The Company was in compliance with the financial and operational covenants of the Credit Facility as of December 31, 2015 and 2014.
Maturities of debt outstanding as of December 31, 2015 are as follows:
| 2016 | $ | 6,775 | ||
| 2017 | 6,775 | |||
| 2018 | 6,775 | |||
| 2019 | 90,731 | |||
| Total | $ | 111,056 |
In connection with the credit facility financing in March 2014 discussed above, the Company repaid all outstanding borrowings under its former credit facilities, and such credit facilities were terminated. In March 2014, the Company wrote-off unamortized deferred financing costs of $2,845 and prepayment fees of $1,016 related to the former credit facilities, which is reflected in other expense in the accompanying consolidated statement of operations for the year ended December 31, 2014. As of December 31, 2014, the interest rate on the Credit Facility was 3.48%. As of December 31, 2014, there was $60,000 outstanding on the term loan and $30,000 outstanding on the revolver portion of the Credit Facility.
62
Everyday Health,
Inc.
Notes to Consolidated Financial Statements - Continued
(in thousands, except share and per share data)
Prior to the credit facility financing in March 2014, the Company maintained a former credit facility, which was entered into in September 2010 and was amended in 2011, 2012 and 2013. This former credit facility (as amended, the “Former Credit Facility”) consisted of a revolving facility and a term loan. Under the Former Credit Facility, the maximum amount that could be outstanding under the revolver was the lesser of $30,000 and 80% of eligible accounts receivable. The maximum amount that could be outstanding under the term loan was $8,500. The repayment terms of the revolver, as amended, provided for monthly interest payments, with the principal being due in September 2015. The repayment terms for the term loan, as amended, provided for monthly interest payments, with principal payments commencing in April 2011 and ending in December 2014.
In connection with the credit facilities that were in place prior to 2014, the Company issued to the lenders warrants to purchase a total of: (i) 592,501 shares of common stock at $0.015 per share, (ii) 112,959 shares of Series F redeemable convertible preferred stock at $7.61 per share, and (iii) 110,018 shares of Series C redeemable convertible preferred stock at $3.27 per share. Each of the above warrants were immediately exercisable and, accordingly, the Company calculated the fair value of the warrants using the Black-Scholes option pricing model and recorded deferred financing costs related to the issuances of the warrants in the respective periods. In April 2014, in connection with the closing of the Company’s IPO, the above warrants to purchase 222,977 shares of preferred stock were converted into warrants to purchase an aggregate of 148,650 shares of common stock. This conversion resulted in the warrant liability of $1,140 being reclassified to additional paid-in capital.
The Company incurred financing costs of $792, $2,899 and $68 during the years ended December 31, 2015, 2014 and 2013, respectively, which, along with the fair value of warrants, have been deferred and amortized using the effective interest rate method through the final maturities of the respective credit facilities. Deferred financing costs are recorded in other assets in the accompanying consolidated balance sheets. Amortization expense relating to the deferred financing costs was $540, $528 and $1,646 for the years ended December 31, 2015, 2014 and 2013, respectively, and is included in interest expense in the accompanying consolidated statements of operations.
10. Common Stock and Preferred Stock
As of December 31, 2015 and 2014, there were no shares of preferred stock issued and outstanding. The redeemable convertible preferred stock, Series A-G (collectively, the “Preferred Stock”), which was outstanding at the time of the Company’s IPO, fully converted to common stock in connection with the IPO (see Note 1). Such Preferred Stock had the following characteristics:
Conversion
Each share of Preferred Stock was convertible at the option of the holder, at any time, into such number of fully paid shares of the Company’s common stock equal to the applicable original issue price for such share of Preferred Stock divided by the applicable conversion price for such share of Preferred Stock then in effect. As of December 31, 2013, the original issue prices and the conversion prices for each series of Preferred Stock were as follows: $0.50 for Series A, $1.77 for Series B, $3.27 for Series C, $6.87 for Series D, $7.98 for Series E, $7.61 for Series F and $9.00 for Series G (prior to giving effect to a 1-for-1.5 reverse stock split of the Company’s common stock implemented on March 14, 2014 in connection with the IPO). The conversion prices for each series of Preferred Stock were subject to adjustment upon the occurrence of certain events, including stock dividends, stock splits, combinations or other similar recapitalizations, and issuance of capital stock at a price below the conversion price in effect for such series of redeemable convertible preferred stock. The conversion price for the Series G convertible preferred stock was also subject to further adjustment in the event of an IPO with a public offering price of less than $11.88 per share.
The Company recorded its Preferred Stock outside of permanent equity because the redemption feature was not solely within the control of the Company.
In March 2014, the Company’s Board of Directors and stockholders approved an amendment to the Company’s amended and restated certificate of incorporation effecting a 1-for-1.5 reverse stock split of the Company’s issued and outstanding shares of common stock. The par value of the common stock was not adjusted as a result of the reverse stock split. All issued and outstanding common stock and per share amounts contained in the Company’s consolidated financial statements and related notes thereto have been retroactively adjusted to reflect this reverse stock split for all periods presented. The reverse stock split was effected on March 14, 2014.
In April 2014, in connection with the closing of the Company’s IPO, the Company filed an amended and restated certificate of incorporation with the Secretary of State of the State of Delaware that amended and restated in its entirety the Company’s certificate of incorporation to, among other things, increase the total number of shares of the Company’s common stock that the Company is authorized to issue to 90,000,000, eliminate all references to the various series of preferred stock that were previously authorized (including certain protective measures held by the various series of preferred stock), and to authorize up to 10,000,000 shares of undesignated preferred stock that may be issued from time to time with terms to be set by the Company’s Board of Directors, which rights could be senior to those of the Company’s common stock.
In connection with the IPO, all of the Company’s redeemable convertible preferred stock converted into common shares. There was no redeemable convertible preferred stock outstanding at December 31, 2015 or 2014.
63
Everyday Health,
Inc.
Notes to Consolidated Financial Statements - Continued
(in thousands, except share and per share data)
Conversion of the Redeemable Convertible Preferred Stock
In connection with the March 14, 2014 1-for-1.5 reverse stock split, the conversion prices for each series of redeemable convertible preferred stock were subject to a 1-for-1.5 adjustment. As a result, upon the closing of the IPO, the 23,647,834 outstanding shares of Series A, Series B, Series C, Series D, Series E and Series F redeemable convertible preferred stock converted into a total of 15,765,223 shares of common stock. Based on this 1-for-1.5 adjustment, the conversion price for the IPO adjustment specific to the Series G shares increased from $11.88 per share to $17.82 per share. Based on the public offering price of $14.00 per share, the 3,172,436 outstanding shares of Series G convertible preferred stock converted into a total of 2,692,012 shares of common stock, including an additional 577,055 shares of common stock issued as a result of the specific Series G IPO adjustment feature or “ratchet provision.” The ratchet provision, which is treated as a deemed stock dividend for accounting purposes, was calculated as the difference between the number of shares of common stock each holder of Series G would receive upon the automatic conversion of the Series G shares and the number of shares contingently issuable just prior to the automatic conversion based on the initial conversion price multiplied by the IPO price of $14.00 per share, which represents the fair value of the common stock on the date of conversion. In April 2014, the Company recorded a one-time $8,079 non-cash preferred stock deemed dividend related to the issuance of additional common shares resulting from the ratchet provision. Such non-cash preferred stock deemed dividend results in a decrease to net income to arrive at net income attributable to common stockholders and, consequently, results in an adjustment to the Company’s computation of net income per share attributable to common stockholders.
Issuance of Common Stock Warrant
In March 2014, the Company issued to one of its website partners a warrant to purchase 100,000 shares of common stock at $0.015 per share, in connection with the website partner agreeing to extend the advertising representation agreement by two years. The warrant was immediately exercisable and, accordingly, the Company calculated the fair value of the warrant using the Black-Scholes option pricing model and recorded $1,131 of deferred costs related to the issuance during the year ended December 31, 2014, which is amortized to the Company’s operating results over the life of the agreement. This warrant was exercised during the year ended December 31, 2015.
Authorized Capital
As of December 31, 2015, the Company was authorized to issue 90,000,000 shares of its common stock and 10,000,000 shares of its preferred stock. As of December 31, 2015, the Company has reserved for issuance 422,478 shares under its 2014 Equity Incentive Plan and 405,084 shares for future issuance under the ESPP.
11. Stock-Based Compensation
The Company has granted non-statutory stock options to employees, directors and consultants of the Company pursuant to its 2003 Stock Option Plan, as amended (the “2003 Plan”), and 2014 Equity Incentive Plan (the “2014 Plan”), which became effective immediately upon the signing of the underwriting agreement related to the IPO in March 2014. Upon the effectiveness of the 2014 Plan, no additional equity awards have been or will be granted under the 2003 Plan. The 2014 Plan provides for the grant of stock options, restricted stock units, and other awards based on the Company’s common stock.
The aggregate number of shares of the Company’s common stock that may be issued pursuant to the 2014 Plan is the sum of (1) 200,000 shares, (2) the 388,781 shares reserved for issuance under the 2003 Plan at the time the 2014 Plan became effective, and (3) any shares subject to outstanding stock options that would otherwise have returned to the 2003 Plan (such as upon the expiration or termination of stock options prior to vesting). In addition, the number of shares of common stock reserved for issuance under the 2014 Plan will automatically increase on January 1 of each year from January 1, 2015 through January 1, 2024 by the lesser of (a) 4% of the total number of shares of the Company’s common stock outstanding on December 31 of the preceding calendar year and (b) a number of shares determined by the Board of Directors. As of December 31, 2015, 422,478 shares have been reserved for future issuance under the 2014 Plan.
Stock Options
Under the 2014 Plan, stock options are granted at prices not less than the estimated fair market value of the Company’s common stock on the date of grant. The options generally vest and become exercisable over four years from the date of grant and expire after ten years.
64
Everyday Health,
Inc.
Notes to Consolidated Financial Statements - Continued
(in thousands, except share and per share data)
The following table summarizes stock option activity for the years ended December 31, 2015, 2014 and 2013:
| Number of options | Weighted- average exercise price | Weighted- average remaining contractual life (years) | Aggregate intrinsic value | |||||||||||||
| Outstanding at December 31, 2012 | 5,271,707 | $ | 7.28 | 7.01 | $ | 10,556 | ||||||||||
| Granted | 901,476 | 9.41 | ||||||||||||||
| Exercised | (183,501 | ) | 4.31 | |||||||||||||
| Cancelled | (531,891 | ) | 7.67 | |||||||||||||
| Outstanding at December 31, 2013 | 5,457,791 | 7.61 | 6.54 | 20,396 | ||||||||||||
| Granted (1) | 1,945,851 | 14.67 | ||||||||||||||
| Exercised | (1,139,891 | ) | 6.41 | |||||||||||||
| Cancelled | (370,053 | ) | 10.52 | |||||||||||||
| Outstanding at December 31, 2014 | 5,893,698 | 9.94 | 6.48 | 29,249 | ||||||||||||
| Granted | 939,165 | 12.03 | ||||||||||||||
| Exercised | (358,077 | ) | 7.23 | |||||||||||||
| Cancelled | (482,841 | ) | 12.81 | |||||||||||||
| Outstanding at December 31, 2015 | 5,991,945 | 10.21 | 5.30 | 442 | ||||||||||||
| Exercisable at December 31, 2015 | 4,215,575 | 9.05 | 4.16 | 442 | ||||||||||||
| (1) | The Company granted 112,500 performance-based options in 2014 where such options vested and became exercisable over approximately nine months from the date of grant, dependent upon the Company meeting certain performance criteria. The performance criteria for these options were met at less than target, which resulted in the vesting of 90,555 of such 112,500 shares on December 31, 2014. The remaining 21,945 shares were cancelled on December 31, 2014. |
The total intrinsic value of the options exercised during the years ended December 31, 2015, 2014 and 2013 was $1,675, $8,080 and $1,146, respectively.
Proceeds from the exercise of options were $2,633, $7,939 and $101 for the years ended December 31, 2015, 2014 and 2013, respectively.
The weighted-average fair value per share at date of grant for options granted during the years ended December 31, 2015, 2014 and 2013 was $5.33, $7.53 and $4.80, respectively. The fair value of options granted is estimated on the date of grant using the Black-Scholes option pricing model and recognized in expense over the vesting period of the options using the graded attribution method.
The following table presents the weighted-average assumptions used to estimate the fair value of options granted in the years ended December 31, 2015, 2014 and 2013:
| 2015 | 2014 | 2013 | ||||||||||
| Volatility | 43.36 | % | 49.28 | % | 50.32 | % | ||||||
| Expected life (years) | 6.25 | 6.25 | 6.25 | |||||||||
| Risk-free interest rate | 1.73 | % | 1.92 | % | 1.54 | % | ||||||
| Dividend yield | — | — | — | |||||||||
The expected stock price volatilities are estimated based on historical realized volatilities of comparable publicly traded company stock prices over a period of time commensurate with the expected term of the option award. The expected life represents the period of time for which the options granted are expected to be outstanding. The Company used the simplified method for determining expected life for options qualifying for treatment due to the limited history the Company currently has with option exercise activity. The risk-free interest rate is based on the U.S. Treasury yield curve for periods equal to the expected term of the options on the grant date.
Total stock-based compensation expense related to stock options was $5,751, $7,920 and $3,039 (including $0, $0 and $70 from discontinued operations) for the years ended December 31, 2015, 2014 and 2013, respectively.
At December 31, 2015, there was approximately $3,804 of unrecognized compensation expense related to unvested stock options, which is expected to be recognized over a weighted-average period of 1.19 years. The total fair value of stock options vested during the years ended December 31, 2015, 2014 and 2013 was $6,123, $4,328 and $3,668, respectively.
65
Everyday Health,
Inc.
Notes to Consolidated Financial Statements - Continued
(in thousands, except share and per share data)
Restricted Stock Unit Awards
The Company’s restricted stock unit awards (“RSUs”) are agreements to issue shares of the Company’s common stock to employees in the future, upon the satisfaction of certain vesting conditions, which cause them to be subject to risk of forfeiture and restrict the awardholder’s ability to sell or otherwise transfer such RSUs until they vest. Generally, the Company’s RSU grants vest over three years from the grant date subject to continued employment on the applicable vesting dates. The following table summarizes the unvested RSU activity for the year ended December 31, 2015:
| Number of RSUs | Weighted Average Grant Date Fair Value | |||||||
| Outstanding at December 31, 2014 | — | $ | — | |||||
| Granted (1) | 882,001 | 10.80 | ||||||
| Vested | (279,986 | ) | 8.27 | |||||
| Cancelled | (53,175 | ) | 11.99 | |||||
| Outstanding at December 31, 2015 | 548,840 | $ | 11.97 | |||||
| (1) | RSUs granted during the year ended December 31, 2015 include the grant of 40,000 units of performance-based RSUs that are dependent upon the Company meeting certain performance criteria. The Company has adjusted stock-based compensation expense recognized to-date to reflect estimated performance related to these awards. |
The total grant-date fair value of RSUs vested during the year ended December 31, 2015 was $1,739. The fair value of RSUs granted is recognized in expense over the vesting period using the graded attribution method. Total stock-based compensation expense related to RSUs was $4,845 for the year ended December 31, 2015. As RSUs were issued for the first time in March 2015, there was no activity and no stock-based compensation expense related to RSUs in 2014 or 2013.
At December 31, 2015, there was approximately $3,244 of unrecognized compensation expense related to unvested RSUs, which is expected to be recognized over a weighted-average period of 1.16 years.
2014 Employee Stock Purchase Plan
The Company’s directors adopted, and the stockholders subsequently approved, the ESPP. The ESPP, which became effective immediately upon the signing of the underwriting agreement related to the IPO in March 2014, authorized the issuance of 500,000 shares of the Company’s common stock pursuant to purchase rights granted to employees. The number of shares of common stock reserved for issuance under the ESPP will automatically increase on January 1 of each calendar year from January 1, 2015 through January 1, 2024 by the least of (a) 1% of the total number of shares of common stock outstanding on December 31 of the preceding calendar year, (b) 400,000 shares and (c) a number determined by the Board of Directors that is less than (a) and (b). Unless otherwise determined by the Board of Directors, common stock will be purchased for participating employees at a price per share equal to the lower of (a) 85% of the fair market value of a share of the common stock on the first date of an offering, or (b) 85% of the fair market value of a share of the common stock on the date of purchase. Generally, all regular employees may participate in the ESPP and may contribute, through payroll deductions, up to 15% of their earnings toward the purchase of common stock under the ESPP. Under the terms of the ESPP, there are defined limitations as to the amount and value of common stock that can be purchased by each employee.
For the years ended December 31, 2015 and 2014, employees purchased an aggregate of 271,623 and 138,184 shares, respectively, under the ESPP at a weighted-average price of $7.40 per share and $11.52 per share, respectively. The Company recorded stock-based compensation expense related to the ESPP of $340 and $1,180 for the years ended December 31, 2015 and 2014, respectively. As the ESPP became effective in March 2014, there were no purchases or charges incurred under the ESPP during 2013.
As of December 31, 2015, 405,084 shares of common stock were reserved for future issuance under the ESPP.
12. Income Taxes
The (provision) benefit for income taxes from continuing operations consists of the following:
| 2015 | 2014 | 2013 | ||||||||||
| Federal | $ | (84 | ) | $ | (250 | ) | $ | — | ||||
| State | (225 | ) | (110 | ) | (95 | ) | ||||||
| Foreign | (43 | ) | (45 | ) | (45 | ) | ||||||
| Total current | (352 | ) | (405 | ) | (140 | ) | ||||||
| Federal | (741 | ) | 7,058 | (749 | ) | |||||||
| State | (211 | ) | 2,013 | (213 | ) | |||||||
| Total deferred | (952 | ) | 9,071 | (962 | ) | |||||||
| Total | $ | (1,304 | ) | $ | 8,666 | $ | (1,102 | ) | ||||
66
Everyday Health,
Inc.
Notes to Consolidated Financial Statements - Continued
(in thousands, except share and per share data)
The current income tax provision for the years ended December 31, 2015 and 2014 consisted of federal minimum tax and state, local and foreign income taxes, while the current income tax provision for the year ended December 31, 2013 consisted of state, local and foreign income taxes. For the year ended December 31, 2015, the deferred income tax expense includes a deferred tax charge relating to the basis differences in indefinite-lived intangible assets that cannot be offset by current year deferred tax assets since its reversal is considered indefinite in nature, partially offset by a one-time tax benefit of $601 related to the release of a valuation allowance from finalizing the purchase price valuation of a November 2014 acquisition. For the year ended December 31, 2014, the deferred income tax benefit includes a one-time tax benefit of $10,033 associated with the re-measurement of the valuation allowances against the Company’s deferred tax assets related to the DD acquisition, partially offset by a deferred tax charge relating to the basis differences in indefinite-lived intangible assets that cannot be offset by current year deferred tax assets since its reversal is considered indefinite in nature.
The significant components of the Company’s deferred tax assets (liabilities) were as follows:
| December 31, | ||||||||
| 2015 | 2014 | |||||||
| Deferred tax assets: | ||||||||
| Net operating loss carryforwards | $ | 39,478 | $ | 40,899 | ||||
| Allowance for doubtful accounts | 372 | 258 | ||||||
| Intangible and other assets | 1,912 | 1,595 | ||||||
| Deferred revenue | 158 | 190 | ||||||
| Stock-based compensation | 11,129 | 9,504 | ||||||
| Accrued expenses and other | 5,893 | 4,038 | ||||||
| AMT credit | 334 | 250 | ||||||
| Depreciation | 372 | 1,722 | ||||||
| Total deferred tax assets | 59,648 | 58,456 | ||||||
| Valuation allowance | (51,185 | ) | (46,577 | ) | ||||
| Net deferred tax assets | 8,463 | 11,879 | ||||||
| Deferred tax liabilities: | ||||||||
| Depreciation | — | (69 | ) | |||||
| Goodwill | (5,452 | ) | (6,028 | ) | ||||
| Intangible and other assets | (10,581 | ) | (11,799 | ) | ||||
| Total deferred tax liabilities | (16,033 | ) | (17,896 | ) | ||||
| Net deferred tax liabilities | $ | (7,570 | ) | $ | (6,017 | ) | ||
The Company has provided a valuation allowance against its net deferred tax assets to the extent that it has determined that its deferred tax assets are not “more likely than not” to be realized. In determining realizability, the Company considered various factors including historical profitability and reversing temporary differences, exclusive of indefinite-lived intangibles. The Company’s net deferred tax liabilities increased by $1,553 in 2015 due primarily to basis differences in indefinite-lived intangible assets that cannot be offset by current year deferred tax assets since its reversal is considered indefinite in nature.
At December 31, 2015, the Company had approximately $104,042 of U.S. federal and state net operating loss (“NOL”) carryforwards available to offset future taxable income. The U.S. federal NOL carryforwards will begin to expire from 2026 through 2033. The full utilization of these losses in the future is dependent upon the Company’s ability to generate taxable income and may also be limited due to ownership changes, as defined under the provisions of Section 382 of the Internal Revenue Code of 1986, as amended. The Company’s NOL carryforwards at December 31, 2015 include $7,517 of income tax deductions related to equity compensation that are greater than the compensation recognized for financial reporting, which will be reflected as a credit to additional paid-in-capital as these NOLs are utilized.
The difference between the tax provision computed at the statutory rate and the tax provision recorded by the Company primarily relates to the change in valuation allowance and state and foreign income taxes on its taxable income. A reconciliation between the statutory rate and the effective tax rate for the years ended December 31, 2015, 2014 and 2013 is as follows:
| Year Ended December 31, | ||||||||||||
| 2015 | 2014 | 2013 | ||||||||||
| (Provision) benefit at statutory rate | $ | 3,618 | $ | (1,406 | ) | $ | 4,163 | |||||
| Permanent items | (467 | ) | (885 | ) | (311 | ) | ||||||
| State taxes | (283 | ) | 1,228 | (210 | ) | |||||||
| Changes in valuation allowance | (4,172 | ) | 9,729 | (4,744 | ) | |||||||
| Total (provision) benefit | $ | (1,304 | ) | $ | 8,666 | $ | (1,102 | ) | ||||
The Company has adopted a policy that it will recognize both accrued interest and penalties related to unrecognized benefits in income tax expense, when and if recorded. No material amount of interest or penalties have been recognized since adoption. As of December 31, 2015, 2014 and 2013, there were no unrecognized tax benefits.
67
Everyday Health,
Inc.
Notes to Consolidated Financial Statements - Continued
(in thousands, except share and per share data)
The Company is subject to taxation in the U.S. and various state, local and foreign jurisdictions. In April 2015, an audit of the Company’s U.S. Federal tax returns for the years ended December 31, 2011 and 2012 was concluded, with no changes or assessments. As of December 31, 2015, none of the Company’s other tax returns have been examined by any income taxing authority. The Company is not subject to U.S. federal, state or non-U.S. income tax examinations by tax authorities for the years prior to 2013. However, to the extent U.S. federal and state NOL carryforwards are utilized, the use of NOLs could be subject to examination by the tax authorities. The Company believes that it has appropriate support for the income tax positions taken and to be taken on its tax returns and that its accruals for tax liabilities are adequate for all open years based on assessment of many factors, including past experience and interpretations of tax law. The Company regularly assesses the adequacy of its income tax contingencies in accordance with ASC 740. As a result, the Company may adjust its income tax contingency liabilities for the impact of new facts and developments, such as changes in interpretations of relevant tax law and assessments from taxing authorities.
13. Commitments and Contingencies
Operating Leases
The Company is a party to certain non-cancellable operating leases for office space. The future minimum lease commitments for these leases, which expire on various dates through 2023, net of related aggregate sublease rentals, are as follows as of December 31, 2015:
| 2016 | $ | 5,078 | ||
| 2017 | 4,685 | |||
| 2018 | 3,638 | |||
| 2019 | 3,529 | |||
| 2020 | 3,689 | |||
| Thereafter | 11,366 | |||
| Sublease rentals | (1,146 | ) | ||
| Net lease commitments | $ | 30,839 |
Rent expense was approximately $4,496, $3,625 and $3,377, net of sublease income of $922, $427 and $102, for the years ended December 31, 2015, 2014 and 2013, respectively.
Minimum Guaranteed Royalty Payments
The Company has entered into certain agreements with website partners, pursuant to which the Company is required to pay minimum guaranteed royalty payments over the term of the agreement, regardless of revenue generated by the Company. Future minimum guaranteed royalty payments as of December 31, 2015, are as follows:
| 2016 | $ | 14,926 | ||
| 2017 | 12,257 | |||
| 2018 | 12,135 | |||
| 2019 | 12,322 | |||
| 2020 | 12,889 | |||
| Thereafter | 10,000 | |||
| Total | $ | 74,529 |
Certain minimum guaranteed royalty payments with respect to these agreements are subject to reductions if specified performance metrics are not maintained by the other party.
Contingency
The Company is subject to certain claims that have arisen in the ordinary conduct of business. Based on the advice of counsel and an assessment of the nature and status of any potential claim, and taking into account any accruals the Company may have established for them, the Company currently believes that any liabilities ultimately resulting from such claims will not, individually or in the aggregate, have a material adverse effect on the Company’s consolidated financial position, results of operations or cash flows.
14. Benefit Plan
The Company sponsors a defined contribution 401(k) plan covering all eligible employees, which is subject to the provisions of the Employee Retirement Income Security Act of 1974. Participants of the plan may make annual contributions up to the applicable IRS limit. The Company matches contributions to the plan up to certain limits, including contributions related to acquisitions (see Note 3), for which the Company expensed $821, $487 and $409 during the years ended December 31, 2015, 2014 and 2013, respectively.
68
Everyday Health,
Inc.
Notes to Consolidated Financial Statements - Continued
(in thousands, except share and per share data)
15. Related-Party Transactions
During the year ended December 31, 2013, a consulting firm wholly-owned by one of the Company’s directors provided sales consulting services to the Company totaling $142.
16. Supplemental Disclosure of Cash Flow Information
Supplemental information related to the consolidated statements of cash flows is summarized below:
| Year Ended December 31, | ||||||||||||
| 2015 | 2014 | 2013 | ||||||||||
| Supplemental disclosure of cash flow information: | ||||||||||||
| Interest paid | $ | 3,850 | $ | 3,734 | $ | 6,173 | ||||||
| Income taxes paid | $ | 126 | $ | 341 | $ | 73 | ||||||
| Supplemental disclosure of non-cash investing and financing activities: | ||||||||||||
| Issuance of common stock for acquired business | $ | 3,677 | $ | 919 | $ | 2,921 | ||||||
| Warrants issued in connection with credit facilities | $ | — | $ | — | $ | 149 | ||||||
| Warrants issued in connection with website partner agreement | $ | — | $ | 1,131 | $ | — | ||||||
| Capital lease obligations incurred | $ | 90 | $ | 466 | $ | 879 | ||||||
| Due to sellers of acquired business | $ | 11,000 | $ | — | $ | — | ||||||
| Amounts due from stock option exercises | $ | — | $ | 43 | $ | 688 | ||||||
17. Subsequent Events
The following matters occurred after December 31, 2015 and prior to the filing of this Form 10-K:
Tea Leaves Purchase Agreement Amendment
On February 29, 2016, the Company entered into an amendment to the Membership Interest Purchase Agreement between the Company, Tea Leaves and the other parties thereto. This amendment effected certain modifications to the payment terms of the $11,000 deferred portion of the guaranteed consideration and the terms of the potential earn-out payment. With respect to the deferred portion of the guaranteed consideration initially scheduled to paid within six months of closing, the payment schedule was amended as follows: (i) $5,000 was payable, and paid, on February 5, 2016; (ii) $3,000 will be paid on or prior to June 30, 2016; and (iii) the remainder will be paid on or prior to September 30, 2016. In addition, the former members of Tea Leaves are entitled to receive $200 in interest on each of the aforementioned payment dates. If the Company elects to pay the full amount of the remaining payment to the former members on or prior to March 31, 2016, the Company shall pay $50 in lieu of the additional $400 that would have otherwise been due with the June 30, 2016 and September 30, 2016 payments.
With respect to the potential earn-out payment, the former members of Tea Leaves will receive $5,000 of the total $20,000 earn-out if the specific financial target is achieved at any time during 2016. The remaining $15,000 of the earn-out remains subject to achievement of the financial target as of December 31, 2016. This $5,000 payment, if earned, will be promptly paid in cash or 50% in cash and 50% in shares of the Company’s common stock, at the Company’s discretion, and is not subject to forfeiture. If the remaining $15,000 portion of the earn-out is achieved as of December 31, 2016, this payment shall be made in the first quarter of 2017 in a combination of cash and shares of the Company’s common stock such that the overall value of the full $20,000 payment is 50% in cash and 50% in shares of the Company’s common stock. Both of these payments are contingent upon the continued employment with the Company of certain former members of Tea Leaves through the respective dates of payment.
Credit Facility Amendment
On February 26, 2016, the Company entered into an amendment to the Credit Facility, which effected certain modifications to the financial covenants and terms set forth in the Credit Facility. In addition, on March 2, 2016, the Company drew $15,000 under the Revolver portion of the Credit Facility. As of March 2, 2016, there was $64,363 outstanding on the Term Loan and $60,000 outstanding on the Revolver, with $22,250 available to be drawn on the Revolver.
Other than the above matters, there were no other significant matters occurring after December 31, 2015 and prior to the filing of this Form 10-K.
69
Everyday Health,
Inc.
Notes to Consolidated Financial Statements - Continued
(in thousands, except share and per share data)
18. Quarterly Financial Data (unaudited)
The following tables summarize the quarterly financial data for the years ended December 31, 2015 and 2014:
| 2015 | ||||||||||||||||
| First quarter | Second quarter | Third quarter | Fourth quarter | |||||||||||||
| Revenues | ||||||||||||||||
| Advertising and sponsorship revenues | $ | 36,338 | $ | 50,225 | $ | 49,630 | $ | 72,900 | ||||||||
| Premium services revenues | 4,836 | 4,580 | 4,684 | 8,798 | ||||||||||||
| Total revenues | 41,174 | 54,805 | 54,314 | 81,698 | ||||||||||||
| Operating expenses: | ||||||||||||||||
| Cost of revenues | 14,076 | 13,926 | 15,637 | 23,284 | ||||||||||||
| Sales and marketing | 12,725 | 21,041 | 18,531 | 22,464 | ||||||||||||
| Product development | 12,602 | 12,187 | 14,163 | 16,968 | ||||||||||||
| General and administrative | 9,804 | 10,065 | 10,010 | 9,608 | ||||||||||||
| Total operating expenses | 49,207 | 57,219 | 58,341 | 72,324 | ||||||||||||
| Income (loss) from operations | (8,033 | ) | (2,414 | ) | (4,027 | ) | 9,374 | |||||||||
| Interest expense, net | (953 | ) | (1,426 | ) | (1,429 | ) | (1,428 | ) | ||||||||
| Other expense | — | — | — | — | ||||||||||||
| Income (loss) from operations before (provision) benefit for income taxes | (8,986 | ) | (3,840 | ) | (5,456 | ) | 7,946 | |||||||||
| (Provision) benefit for income taxes | 918 | 5,534 | (7,262 | ) | (494 | ) | ||||||||||
| Net income (loss) | $ | (8,068 | ) | $ | 1,694 | $ | (12,718 | ) | $ | 7,452 | ||||||
| Net income (loss) attributable to common stockholders per common share: | ||||||||||||||||
| Basic | $ | (0.26 | ) | $ | 0.05 | $ | (0.40 | ) | $ | 0.23 | ||||||
| Diluted | $ | (0.26 | ) | $ | 0.05 | $ | (0.40 | ) | $ | 0.23 | ||||||
| Weighted-average common shares outstanding: | ||||||||||||||||
| Basic | 31,525,559 | 31,755,107 | 32,138,214 | 32,482,159 | ||||||||||||
| Diluted | 31,525,559 | 33,373,407 | 32,138,214 | 32,904,143 | ||||||||||||
70
Everyday Health,
Inc.
Notes to Consolidated Financial Statements - Continued
(in thousands, except share and per share data)
| 2014 | ||||||||||||||||
| First quarter | Second quarter | Third quarter | Fourth quarter | |||||||||||||
| Revenues | ||||||||||||||||
| Advertising and sponsorship revenues | $ | 32,692 | $ | 36,882 | $ | 37,910 | $ | 58,981 | ||||||||
| Premium services revenues | 4,813 | 4,565 | 4,414 | 4,068 | ||||||||||||
| Total revenues | 37,505 | 41,447 | 42,324 | 63,049 | ||||||||||||
| Operating expenses: | ||||||||||||||||
| Cost of revenues | 11,421 | 10,961 | 11,006 | 15,908 | ||||||||||||
| Sales and marketing | 10,220 | 12,216 | 12,213 | 13,956 | ||||||||||||
| Product development | 10,762 | 10,805 | 10,886 | 12,088 | ||||||||||||
| General and administrative | 6,595 | 7,126 | 7,504 | 8,816 | ||||||||||||
| Total operating expenses | 38,998 | 41,108 | 41,609 | 50,768 | ||||||||||||
| Income (loss) from operations | (1,493 | ) | 339 | 715 | 12,281 | |||||||||||
| Interest expense, net | (1,863 | ) | (585 | ) | (500 | ) | (763 | ) | ||||||||
| Other expense | (4,114 | ) | — | — | — | |||||||||||
| Income (loss) from continuing operations before benefit (provision) for income taxes | (7,470 | ) | (246 | ) | 215 | 11,518 | ||||||||||
| Benefit (provision) for income taxes | (289 | ) | (349 | ) | (365 | ) | 9,669 | |||||||||
| Net income (loss) | (7,759 | ) | (595 | ) | (150 | ) | 21,187 | |||||||||
| Series G preferred stock deemed dividend | — | (8,079 | ) | — | — | |||||||||||
| Net income (loss) attributable to common stockholders | $ | (7,759 | ) | $ | (8,674 | ) | $ | (150 | ) | $ | 21,187 | |||||
| Net income (loss) attributable to common stockholders per common share: | ||||||||||||||||
| Basic | $ | (1.44 | ) | $ | (0.29 | ) | $ | (0.00 | ) | $ | 0.68 | |||||
| Diluted | $ | (1.44 | ) | $ | (0.29 | ) | $ | (0.00 | ) | $ | 0.64 | |||||
| Weighted-average common shares outstanding: | ||||||||||||||||
| Basic | 5,403,846 | 29,802,970 | 30,404,529 | 31,076,588 | ||||||||||||
| Diluted | 5,403,846 | 29,802,970 | 30,404,529 | 32,977,544 | ||||||||||||
71
Item 9. Changes in and Disagreements with Accountants on Accounting and Financial Disclosure.
None.
Item 9A. Controls and Procedures.
Evaluation of Disclosure Controls and Procedures
Our management, with the participation of our chief executive officer and our chief financial officer, evaluated the effectiveness of our disclosure controls and procedures as of December 31, 2015. The term “disclosure controls and procedures,” as defined in Rules 13a-15(e) and 15d-15(e) under the Exchange Act, means controls and other procedures of a company that are designed to ensure that information required to be disclosed by a company in the reports that it files or submits under the Exchange Act is recorded, processed, summarized and reported, within the time periods specified in the SEC’s rules and forms. Disclosure controls and procedures include, without limitation, controls and procedures designed to ensure that information required to be disclosed by a company in the reports that it files or submits under the Exchange Act is accumulated and communicated to the company’s management, including its principal executive and principal financial officers, as appropriate to allow timely decisions regarding required disclosure. Management recognizes that any controls and procedures, no matter how well designed and operated, can provide only reasonable assurance of achieving their objectives and management necessarily applies its judgment in evaluating the cost-benefit relationship of possible controls and procedures. Based on the evaluation of our disclosure controls and procedures as of December 31, 2015, our chief executive officer and chief financial officer concluded that, as of such date, our disclosure controls and procedures were effective at the reasonable assurance level.
Management’s Report on Internal Control over Financial Reporting
Our management is responsible for establishing and maintaining effective internal control over financial reporting, as defined in Rule 13a-15(f) under the Exchange Act. Our internal controls over financial reporting are designed to provide reasonable assurance to the company’s management and Board of Directors regarding the preparation and fair presentation of published financial statements in accordance with the U.S. GAAP, including those policies and procedures that (i) pertain to the maintenance of records that, in reasonable detail, accurately and fairly reflect the transactions and disposition of the assets of the company, (ii) provide reasonable assurance that transactions are recorded as necessary to permit preparation of financial statements in accordance with GAAP and that receipts and expenditures are being made only in accordance with authorizations of management and directors of the company, and (iii) provide reasonable assurance regarding prevention or timely detection of unauthorized acquisition, use or disposition of the company’s assets that could have a material effect on the financial statements.
Because of its inherent limitations, internal control over financial reporting may not prevent or detect misstatements. Therefore, even those systems determined to be effective can provide only reasonable assurance with respect to financial statement preparation and presentation.
Our chief executive officer and chief financial officer evaluated the effectiveness of the company’s internal control over financial reporting as of December 31, 2015 based on criteria established in Internal Control - Integrated Framework issued by the Committee of Sponsoring Organizations of the Treadway Commission, or the 2013 COSO Framework. The assessment included an evaluation of the design of the company’s internal control over financial reporting and testing of the operational effectiveness of those controls. Based on this assessment, we concluded that our internal control over financial reporting was effective as of December 31, 2015.
This annual report does not include an audit or attestation report from our registered public accounting firm regarding our internal control over financial reporting. Our management’s report was not subject to audit or attestation by our registered public accounting firm pursuant to rules of the SEC that permit us to provide only management’s report in this annual report for so long as we remain an “emerging growth company” under the Jumpstart Our Business Startups Act.
Changes in Internal Control over Financial Reporting
There was no change in our internal control over financial reporting identified in connection with the evaluation required by Rule 13a-15(d) and 15d-15(d) of the Exchange Act that occurred during the fourth quarter of 2015 that has materially affected, or is reasonably likely to materially affect, our internal control over financial reporting.
None.
72
The information required by Part III is omitted from this report because we will file a definitive proxy statement within 120 days after the end of our 2015 fiscal year pursuant to Regulation 14A for our 2016 Annual Meeting of Stockholders, or the 2016 Proxy Statement, and the information to be included in the 2016 Proxy Statement is incorporated herein by reference.
Item 10. Directors, Executive Officers and Corporate Governance.
(1) The information required by this Item concerning our executive officers and our directors and nominees for director, including information with respect to our audit committee and audit committee financial expert, may be found under the section entitled “Proposal No. 1—Election of Directors” appearing in the 2016 Proxy Statement. Such information is incorporated herein by reference.
(2) The information required by this Item concerning our code of ethics may be found under the section entitled “Proposal No. 1—Election of Directors—Code of Ethics” appearing in the 2016 Proxy Statement. Such information is incorporated herein by reference.
(3) The information required by this Item concerning compliance with Section 16(a) of the Securities Exchange Act of 1934 may be found in the section entitled “Section 16(a) Beneficial Ownership Reporting Compliance” appearing in the 2016 Proxy Statement. Such information is incorporated herein by reference.
Item 11. Executive Compensation.
The information required by this Item may be found under the sections entitled “Proposal No. 1—Election of Directors—Compensation Committee” and “Executive Compensation” appearing in the 2016 Proxy Statement. Such information is incorporated herein by reference.
Item 12. Security Ownership of Certain Beneficial Owners and Management and Related Stockholder Matters.
(1) The information required by this Item with respect to security ownership of certain beneficial owners and management may be found under the section entitled “Security Ownership of Certain Beneficial Owners and Management” appearing in the 2016 Proxy Statement. Such information is incorporated herein by reference.
(2) The information required by this Item with respect to securities authorized for issuance under our equity compensation plans may be found under the section entitled “Executive Compensation—Equity Compensation Plan Information” appearing in the 2016 Proxy Statement. Such information is incorporated herein by reference.
Item 13. Certain Relationships and Related Transactions, and Director Independence.
(1) The information required by this Item concerning related party transactions may be found under the section entitled “Transactions with Related Persons” appearing in the 2016 Proxy Statement. Such information is incorporated herein by reference.
(2) The information required by this Item concerning director independence may be found under the section entitled “Proposal No. 1—Election of Directors—Board of Directors and Corporate Governance” appearing in the 2016 Proxy Statement. Such information is incorporated herein by reference.
Item 14. Principal Accounting Fees and Services.
The information required by this Item may be found under the section entitled “Proposal No. 2—Ratification of the Selection of Independent Registered Public Accounting Firm” appearing in the 2016 Proxy Statement. Such information is incorporated herein by reference.
73
Item 15. Exhibits, Financial Statement Schedules.
| (a) | The following documents are filed as part of this report: |
| (1) | Consolidated Financial Statements and Report of Independent Registered Public Accounting Firm |
| (2) | Consolidated Financial Statement Schedules |
Financial Statement Schedules have been omitted because the information required to be set forth therein is not applicable or is shown in the financial statements or notes thereto.
| (3) | Exhibits are incorporated herein by reference or are filed with this report as indicated below (numbered in accordance with Item 601 of Regulation S-K). |
| (b) | Exhibits |
| Exhibit No. |
Description | Incorporated by Reference | Filed Herewith | |||||||||
| Form | File No. | Exhibit | Filing Date | |||||||||
| 2.1 | Membership Interest Purchase Agreement, dated as of March 20, 2015, by and among the Registrant, Cambridge BioMarketing Group, LLC, Maureen Franco, as the Sellers’ Representative, and the Sellers named therein. | 8-K | 001-36371 | 2.1 | March 25, 2015 | |||||||
| 2.2 | Membership Interest Purchase Agreement, dated as of August 6, 2015, by and among the Registrant, Tea Leaves Health, LLC, Reuben Kennedy, as the Sellers’ Representative, and the Sellers named therein. | 8-K | 001-36371 | 2.1 | August 11, 2015 | |||||||
| 3.1 | Amended and Restated Certificate of Incorporation of the Registrant, as currently in effect. | 8-K | 001-36371 | 3.1 | April 7, 2014 | |||||||
| 3.2 | Amended and Restated Bylaws of the Registrant, as currently in effect. | S-1 | 333-194097 | 3.4 | February 24, 2014 | |||||||
| 4.1 | Form of the Registrant Common Stock Certificate. | S-1 | 333-194097 | 4.1 | February 24, 2014 | |||||||
| 4.2 | Sixth Amended and Restated Stockholder Rights Agreement, by and between the Registrant and the investors listed on Schedule A thereto, key holders listed on Schedule B thereto and other holders listed on Schedule C thereto, dated as of November 10, 2010. | S-1 | 333-194097 | 4.2 | February 24, 2014 | |||||||
| 4.3 | Warrant to Purchase Shares of Series F Preferred Stock issued to Compass Horizon Funding Company LLC, dated October 8, 2009. | S-1 | 333-194097 | 4.5 | February 24, 2014 | |||||||
| 10.1 | Amended and Restated Credit Agreement, dated as of November 10, 2014, by and among the Registrant, Silicon Valley Bank, as Administrative Agent, certain of the Registrant’s wholly-owned subsidiaries and the other lenders party thereto. | 8-K | 001-36371 | 10.1 | November 12, 2014 | |||||||
| 10.1.1 | First Amendment to Amended and Restated Credit Agreement and Consent, dated as of March 19, 2015, by and among the Registrant, Silicon Valley Bank, as Administrative Agent, certain of the Registrant’s wholly-owned subsidiaries and the other lenders party thereto. | 10-Q | 001-36371 | 10.1 | May 12, 2015 | |||||||
| 10.1.2 | Second Amendment to Amended and Restated Credit Agreement, dated as of March 31, 2015, by and among the Registrant, Silicon Valley Bank, as Administrative Agent, certain of the Registrant’s wholly-owned subsidiaries and the other lenders party thereto. | 10-Q | 001-36371 | 10.2 | May 12, 2015 | |||||||
| 10.1.3 | Third Amendment to Amended and Restated Credit Agreement, dated as of August 21, 2015, by and among the Registrant, Silicon Valley Bank, as Administrative Agent, certain of the Registrant’s wholly-owned subsidiaries and the other lenders party thereto. | 10-Q | 001-36371 | 10.1 | November 12, 2015 | |||||||
| 10.2* | 2003 Stock Option Plan, as amended, and related documents. | S-1 | 333-194097 | 10.1 | February 24, 2014 | |||||||
| 10.2.1* | Amendment to 2003 Stock Option Plan, dated March 22, 2013. | S-1 | 333-194097 | 10.1.1 | February 24, 2014 | |||||||
| 10.2.2* | Amendment to 2003 Stock Option Plan, dated March 12, 2014. | S-1 | 333-194097 | 10.1.2 | February 24, 2014 | |||||||
74
| Exhibit No. |
Description | Incorporated by Reference | Filed Herewith | |||||||||
| Form | File No. | Exhibit | Filing Date | |||||||||
| 10.3* | 2014 Equity Incentive Plan and related documents. | S-1 | 333-194097 | 10.2 | February 24, 2014 | |||||||
| 10.4* | Everyday Health, Inc. 2014 Employee Stock Purchase Plan. | S-1 | 333-194097 | 10.14 | February 24, 2014 | |||||||
| 10.5 | Agreement of Lease, dated as of August 26, 2009. | S-1 | 333-194097 | 10.3 | February 24, 2014 | |||||||
| 10.5.1 | First Amendment to Lease, dated as of February 22, 2010. | S-1 | 333-194097 | 10.3.1 | February 24, 2014 | |||||||
| 10.5.2 | Second Amendment to Lease, dated as of May 1, 2010. | S-1 | 333-194097 | 10.3.2 | February 24, 2014 | |||||||
| 10.5.3 | Third Amendment to Lease, dated as of May 31, 2011. | S-1 | 333-194097 | 10.3.3 | February 24, 2014 | |||||||
| 10.5.4 | Fourth Amendment to Lease, dated as of April 1, 2012. | S-1 | 333-194097 | 10.3.4 | February 24, 2014 | |||||||
| 10.6* | Form of Indemnification Agreement to be entered into with each director of the Registrant. | S-1 | 333-194097 | 10.4 | February 24, 2014 | |||||||
| 10.7* | Employment Agreement between the Registrant and Benjamin Wolin, dated November 22, 2010. | S-1 | 333-194097 | 10.7 | February 24, 2014 | |||||||
| 10.8* | Employment Agreement between the Registrant and Brian Cooper, dated November 22, 2010. | S-1 | 333-194097 | 10.9 | February 24, 2014 | |||||||
| 10.9* | Offer Letter between the Registrant and Alan Shapiro, dated October 18, 2007. | S-1 | 333-194097 | 10.10 | February 24, 2014 | |||||||
| 10.10* | Letter Agreement between the Registrant and Michael du Toit, dated January 18, 2015. | 10-Q | 001-36371 | 10.3 | May 12, 2015 | |||||||
| 10.11* | Offer Letter between the Registrant and Miki Kapoor, dated July 30, 2014. | X | ||||||||||
| 21.1 | List of Subsidiaries. | X | ||||||||||
| 23.1 | Consent of Ernst & Young LLP, independent registered public accounting firm. | X | ||||||||||
| 31.1 | Certification of Chief Executive Officer pursuant to Section 302 of the Sarbanes Oxley Act of 2002. | X | ||||||||||
| 31.2 | Certification of Chief Financial Officer pursuant to Section 302 of the Sarbanes Oxley Act of 2002. | X | ||||||||||
| 32.1+ | Certification of Chief Executive Officer pursuant to 18 U.S.C. Section 1350, as adopted pursuant to Section 906 of the Sarbanes-Oxley Act of 2002. | X | ||||||||||
| 32.2+ | Certification of Chief Financial Officer pursuant to 18 U.S.C. Section 1350, as adopted pursuant to Section 906 of the Sarbanes-Oxley Act of 2002. | X | ||||||||||
| 101.INS | XBRL Instance Document. | X | ||||||||||
| 101.SCH | XBRL Taxonomy Extension Schema. | X | ||||||||||
| 101.CAL | XBRL Taxonomy Extension Calculation Linkbase. | X | ||||||||||
| 101.DEF | XBRL Taxonomy Extension Definition Linkbase. | X | ||||||||||
| 101.LAB | XBRL Taxonomy Extension Label Linkbase. | X | ||||||||||
101.PRE
|
XBRL Taxonomy Extension Presentation Linkbase. | X |
| * | Indicates a management contract or compensatory plan or arrangement. |
| + | These certifications are being furnished solely to accompany this quarterly report pursuant to 18 U.S.C. Section 1350, and are not being filed for purposes of Section 18 of the Securities Exchange Act of 1934 and are not to be incorporated by reference into any filing of the registrant, whether made before or after the date hereof, regardless of any general incorporation language in such filing. |
75
Pursuant to the requirements of Section 13 or 15(d) of the Securities Exchange Act of 1934, the registrant has duly caused this report to be signed on its behalf by the undersigned, thereunto duly authorized.
|
EVERYDAY HEALTH, INC. | ||||
| Date: March 11, 2016 | By: | /S/ BENJAMIN WOLIN | ||
| Benjamin Wolin Chief Executive Officer & Director (Principal Executive Officer) | ||||
| Date: March 11, 2016 | By: | /S/ BRIAN COOPER | ||
| Brian
Cooper Executive Vice President & Chief Financial Officer (Principal Financial and Accounting Officer) | ||||
Pursuant to the requirements of the Securities Exchange Act of 1934, this report has been signed below by the following persons on behalf of the registrant and in the capacities and on the dates indicated.
| Signature | Title | Date | ||
| /S/ BENJAMIN WOLIN | Chief Executive Officer & Director (Principal Executive Officer) | March 11, 2016 | ||
(Benjamin Wolin) |
||||
| /S/ BRIAN COOPER | Executive Vice President & Chief Financial Officer (Principal | March 11, 2016 | ||
(Brian Cooper) |
Financial and Accounting Officer) | |||
| /S/ DOUGLAS MCCORMICK | Director | March 11, 2016 | ||
(Douglas McCormick) |
||||
| /S/ DANA L. EVAN | Director | March 11, 2016 | ||
(Dana L. Evan) |
||||
| /S/ DAVID GOLDEN | Director | March 11, 2016 | ||
(David Golden) |
||||
| /S/ HABIB KAIROUZ | Director | March 11, 2016 | ||
(Habib Kairouz) |
||||
| /S/ Laizer Kornwasser | Director | March 11, 2016 | ||
| (Laizer Kornwasser) | ||||
| /S/ MYRTLE POTTER | Director | March 11, 2016 | ||
(Myrtle Potter) |
||||
| /S/ SHARON WIENBAR | Director | March 11, 2016 | ||
(Sharon Wienbar) |
||||
76