Attached files
| file | filename |
|---|---|
| EX-21.1 - SUBSIDIARIES OF THE REGISTRANT - Calamos Asset Management, Inc. /DE/ | clms-2015x12x31xex211.htm |
| EX-31.2 - SECTION 302 CERTIFICATION CFO - Calamos Asset Management, Inc. /DE/ | clms-2015x12x31xex312.htm |
| EX-3.(II) - THIRD AMENDED AND RESTATED BY-LAWS OF THE REGISTRANT - Calamos Asset Management, Inc. /DE/ | clms-2015x12x31xex3ii.htm |
| EX-23.1 - CONSENT OF INDEPENDENT REGISTERED PUBLIC ACCOUNTING FIRM - Calamos Asset Management, Inc. /DE/ | clms-2015x12x31xex231.htm |
| EX-32.2 - SECTION 906 CERTIFICATION CFO - Calamos Asset Management, Inc. /DE/ | clms-2015x12x31xex322.htm |
| EX-32.1 - SECTION 906 CERTIFICATION CEO - Calamos Asset Management, Inc. /DE/ | clms-2015x12x31xex321.htm |
| EX-31.1 - SECTION 302 CERTIFICATION CEO - Calamos Asset Management, Inc. /DE/ | clms-2015x12x31xex311.htm |
UNITED STATES
SECURITIES AND EXCHANGE COMMISSION
Washington, D.C. 20549
FORM 10-K
[X] ANNUAL REPORT PURSUANT TO SECTION 13 OR 15(d) OF THE SECURITIES EXCHANGE ACT OF 1934
For the fiscal year ended: December 31, 2015
or
[ ] TRANSITION REPORT PURSUANT TO SECTION 13 OR 15(d) OF THE SECURITIES EXCHANGE ACT OF 1934
Commission File Number: 000-51003
CALAMOS ASSET MANAGEMENT, INC.
(Exact name of Registrant as specified in its charter)
Delaware | 32-0122554 |
(State or other jurisdiction of incorporation or organization) | (I.R.S. Employer Identification No.) |
2020 Calamos Court, Naperville, Illinois | 60563 |
(Address of principal executive offices) | (Zip Code) |
Registrant’s telephone number, including area code: 630-245-7200
Securities registered pursuant to Section 12(b) of the Act:
Title of each class | Name of each exchange on which registered |
Class A Common Stock, $0.01 par value | The NASDAQ Stock Market LLC |
Securities registered pursuant to Section 12(g) of the Act: None
Indicate by check mark if the registrant is a well-known seasoned issuer, as defined in Rule 405 of the Securities Act. ¨ Yes ý No
Indicate by check mark if the registrant is not required to file reports pursuant to Section 13 or Section 15(d) of the Act. ¨ Yes ý No
Indicate by check mark whether the registrant (1) has filed all reports required to be filed by Section 13 or 15(d) of the Securities Exchange Act of 1934 during the preceding 12 months (or for such shorter period that the registrant was required to file such reports), and (2) has been subject to such filing requirements for the past 90 days. ý Yes ¨ No
Indicate by check mark whether the registrant has submitted electronically and posted on its corporate Web site, if any, every Interactive Data File required to be submitted and posted pursuant to Rule 405 of Regulation S-T during the preceding 12 months (or for such shorter period that the registrant was required to submit and post such files). ý Yes ¨ No
Indicate by check mark if disclosure of delinquent filers pursuant to Item 405 of Regulation S-K is not contained herein, and will not be contained, to the best of registrant’s knowledge, in definitive proxy or information statements incorporated by reference in Part III of this Form 10-K or any amendment to this Form 10-K. ¨
Indicate by check mark whether the registrant is a large accelerated filer, an accelerated filer, a non-accelerated filer, or a smaller reporting company. See the definitions of “large accelerated filer,” “accelerated filer” and “smaller reporting company” in Rule 12b-2 of the Exchange Act.
Large accelerated filer ¨ | Accelerated filer x |
Non-accelerated filer ¨ (do not check if smaller reporting company) | Smaller reporting company ¨ |
Indicate by check mark whether the registrant is a shell company (as defined in Rule 12b-2 of the Act). ¨ Yes ý No
The aggregate market value of common stock held by non-affiliates (assuming that all directors and executive officers are affiliates) on June 30, 2015, the last business day of the registrant’s most recently completed second fiscal quarter, was $216.9 million.
At February 26, 2016, there were 20,529,331 shares of Class A common stock and 100 shares of Class B common stock outstanding.
DOCUMENTS INCORPORATED BY REFERENCE
Part III - Portions of the definitive proxy statement for our Annual Meeting of Shareholders on or about June 7, 2016, as specifically described herein.
PART I
ITEM 1. BUSINESS
Unless the context otherwise requires, references to “we,” “us,” “our,” “our Company,” and “the Company” refer to Calamos Asset Management, Inc. (“CAM”), a Delaware corporation incorporated on July 23, 2004, and its consolidated subsidiaries, including Calamos Investments LLC (“Calamos Investments”), a Delaware limited liability company, and the operating company subsidiaries of Calamos Investments.
“Calamos Advisors” refers to Calamos Advisors LLC, a Delaware limited liability company, an investment advisor registered with the U.S. Securities and Exchange Commission (“SEC”) and wholly owned subsidiary of Calamos Investments. Calamos Advisors acts as an investment advisor in managing our separate accounts, open-end and closed-end funds, as well as an exchange traded fund ("ETF");
“Calamos Family Partners” refers to Calamos Family Partners, Inc., a Delaware corporation, and our predecessor holding company. Calamos Family Partners is a private firm owned by members of the Calamos family and owns all the outstanding shares of our Class B common stock;
“Calamos Global Funds” and “Offshore Funds” refer to Calamos Global Funds PLC, an Ireland-domiciled open-end umbrella company consisting of Undertakings for Collective Investment in Transferable Securities (“UCITS”), which are registered in the Republic of Ireland;
“Calamos Financial Services” refers to Calamos Financial Services LLC, a Delaware limited liability company and broker-dealer registered under the Securities Exchange Act of 1934, as amended, and a wholly owned subsidiary of Calamos Investments. Calamos Financial Services acts as the primary distributor of our family of open-end funds; and
“Calamos Interests” refers to Calamos Family Partners and John P. Calamos, Sr., our Chairman of the Board, Chief Executive Officer and Global Co-Chief Investment Officer. Mr. Calamos also holds the controlling interest in Calamos Family Partners.
The other wholly owned subsidiaries of Calamos Investments are Calamos Wealth Management LLC (“Calamos Wealth Management”), a Delaware limited liability company and registered investment advisor that provides wealth management services, including asset allocation and investment advisory services to high net worth individuals, family offices and private foundations, and Calamos Investments LLP, an indirect majority-owned subsidiary of Calamos Investments, a registered investment advisor with the Financial Conduct Authority (“FCA”) in the United Kingdom and distributor of the offshore funds and Company’s products globally.
Assets under management and other financial data presented in this report with respect to the open-end funds that we manage include the Calamos Growth and Income Portfolio, which is a portfolio of the Calamos Advisors Trust, a registered open-end investment company. However, references to the term “open-end funds” in this report do not otherwise include this portfolio. References to “funds” in this report refer to both open-end and closed-end funds, our actively managed exchange traded fund ("ETF"), as well as offshore funds. Assets under management do not include assets under advisement for which we provide model portfolio design and oversight.
2
Overview
Calamos Asset Management, Inc. is the sole manager of Calamos Investments LLC, which owns and manages our operating companies. For more than 35 years, we have provided investment advisory services to institutions and individuals, with $21.9 billion in assets under management as of December 31, 2015. Throughout our history, we have based our investment philosophy on the belief that the key to consistent, long-term success is achieving an optimal balance between achieving return and managing risk. We have consistently applied our investment philosophy and proprietary processes centered on risk management across a range of U.S., non U.S. and global investment strategies. The graphic below illustrates our organizational and ownership structure as of December 31, 2015:

(1) | Represents combined economic interest of Calamos Family Partners, Inc. and John P. Calamos, Sr. who is also a member of Calamos Investments LLC. |
(2) | Represents combined economic interest of all public stockholders, including John P. Calamos, Sr. and John P. Calamos, Jr.’s combined 20.25% ownership interest of Class A common stock. The calculation of ownership interest includes options and restricted stock units ("RSUs") that vest within 60 days, as well as CFP’s indirect ownership interest in Class A common stock purchased by Calamos Investments LLC, pursuant to the Company’s share repurchase plan. |
Our Company began as a boutique investment manager, with an emphasis on strategies that sought to maximize the potential of convertible securities to manage risk and build wealth. Today, we are a global asset management firm that offers strategies to fulfill a range of asset allocation goals through a multi-team investment platform. We are headquartered in the Chicago metropolitan area, with offices in London, New York and San Francisco.
Our evolution as a company has been a logical expansion of our core investment discipline and proprietary resources, which are built upon gaining a comprehensive understanding of a company and the relative attractiveness of the securities within its capital structure. The breadth and depth of this approach has provided the foundation for building specialized investment teams and diverse
3
investment strategies. All of our portfolios benefit from the research and insights of a collaborative investment culture and the accumulated knowledge we have amassed over the decades.
As more fully described under the caption "Investment Strategies" of Item 1. Business, our strategies include U.S. equity, global equity, convertible, alternative, fixed income, and multi-strategy (closed-end funds). We believe a disciplined adherence to our investment philosophy has enabled us to deliver strong risk-adjusted returns in many of our strategies over multiple market cycles.
We make our range of investment strategies and services available to clients, directly and through intermediaries, by offering investment products designed to suit their investment needs, such as open-end funds, closed-end funds, institutional accounts, managed accounts and an exchange traded fund. We plan to continue to introduce new investment strategies and supporting services that will provide the opportunity for attractive risk-adjusted returns.
We believe our long-term investment performance, broad range of investment strategies, diverse product offerings and emphasis on client service have allowed us to help our clients create wealth over full market cycles. Ours is a culture of innovation, global perspective, and clear alignment with our clients’ interests. Over the decades, we have consistently demonstrated strength in developing strategies that capitalize on the opportunities of the changing investment landscape.
While we continued to see a reduction in assets under management in 2015, the rate of net outflows has slowed considerably from prior years. Net outflows were primarily attributable to our U.S. equity and global equity strategies. Enhancement to the investment team leadership and structure took place in the latter half of 2015. As part of this evolution to a deeper and more specialized team and product platform, four senior members of the investment team were named Co-Chief Investment Officers ("Co-CIO"). Alongside John P. Calamos, Sr., they oversee the investment department and their respective strategies, including investment personnel. The four new Co-Chief Investment Officers are:
• | John Hillenbrand, CPA: Co-CIO, Head of Multi-Asset Strategies and Co-Head of Convertible Strategies; |
• | David Kalis, CFA: Co-CIO, Head of U.S. Growth Equity Strategies; |
• | Nick Niziolek, CFA: Co-CIO, Head of International and Global Strategies; and, |
• | Eli Pars, CFA: Co-CIO, Head of Alternative Strategies and Co-Head of Convertible Strategies. |
Separately, the firm appointed Robert Behan, CFA, as President. Mr. Behan is responsible for oversight of the firm's business execution, strategic growth initiatives, and corporate development. He also retained his title and role as Head of Global Distribution. The firm also appointed Dave Butler Executive Vice President and Head of Global Trading and Investment Risk Management.
We remain focused on delivering sustained investment performance for our clients across market cycles. In March of 2015, we completed the successful initial public offering ("IPO") of our sixth closed-end fund, the Calamos Dynamic Convertible & Income Fund ("CCD"). In addition, on September 30, 2015 the firm completed the acquisition of Phineus Partners LP ("Phineus"), a global long/short manager based in San Francisco. These new products continue to build our product breadth to meet the evolving needs of our clients, which we believe will help to attract new investors in the future.
Calamos' investment philosophy embraces a collaborative culture of "team of teams." The firm evaluates businesses by blending top-down insights with rigorous bottom-up fundamental research.
We provide additional information about Calamos Asset Management, Inc. in the Investor Relations section of our website at www.calamos.com/Investors. This information includes corporate governance documents, press releases, investor presentations, SEC filings and assets under management reports, among others. We encourage you to visit and review our website. The information on our website is not a part of this Annual Report on Form 10-K.
Business Strategy
Our business strategy is designed to ensure we maintain focus on our investment philosophy and enhance it, given current conditions in the economy and markets. We apply a disciplined, fundamental approach to investment research and portfolio management, which allows us to significantly leverage our investment talent.
Throughout the history of our firm, we have thoughtfully deployed our investment expertise to expand our investment platform and investment team resources in response to market opportunities and client needs. We have also dedicated resources to expanding our distribution and client servicing capabilities to retain existing clients and attract new clients globally.
Our goal is to continue to grow our business and diversify the assets we manage by investment strategy, product, service and type of client. To take advantage of market opportunities for attractive risk-adjusted returns, we have selectively created complementary investment products over the years and also have expanded our business through strategic acquisitions. Our execution of this
4
strategy reflects the emphasis on building our capabilities in ways that position our business for long-term expansion, enhance performance, and improve client responsiveness.
We are committed to making strategic enhancements to our investment platform and our investment team to better serve our clients. The number of investment professionals at the end of 2015 was 67, following an increase in the number of co-portfolio managers and sector heads in 2014. These enhancements to our investment platform and our investment team are part of the long-term strategy we began fulfilling in 2012 with the addition of specialized portfolio management teams for several strategies. This structure supports our strategic efforts by providing clients with the specialized expertise that the evolving global markets increasingly demand. Selectively expanding our capabilities by adding investment professionals ensures that we do not dilute the resources we dedicate to existing strategies.
We have been, and will continue to be, guided by the following principles:
Maintain Strong Investment Performance
Our strategy is to maintain our performance by consistently applying our investment philosophy and processes, while actively managing our strategies to maintain a balance of risk and reward over the full course of a market cycle and during changing market conditions. We seek to protect our clients’ assets through our management of both investment portfolios and investment strategy capacity. Accordingly, at times we have chosen to restrict inflows or close products to new investments if we believe it is in the best interest of our current clients to do so. Similarly, we may discontinue products if we do not believe satisfactory risk-adjusted returns can be achieved for our clients.
Focus on Clients, With an Emphasis on Serving Long-Term Investors
We believe that managing our clients’ assets is an honor and a responsibility. Client service is crucial to our ongoing success. In all our activities, our goal is to have our clients’ best interests in mind and to work diligently and professionally to exceed client expectations for performance and service. We strongly believe that the success of our Company is a by-product of our success in helping clients achieve their investment objectives. In particular, we seek to attract, develop and maintain long-term client relationships by providing excellent client service, including educating investors about our investment philosophy and processes. We take great care to ensure that the resources devoted to existing clients and strategies are not compromised by our growth and expansion efforts.
Selectively Expand Our Investment Strategies
Since the introduction of our first convertible strategy in 1977, we have strategically expanded our product offerings. Each expansion has leveraged our core competencies in investment research and portfolio management. We will continue to expand our investment strategies selectively in areas where we determine we can achieve attractive risk-adjusted returns over the long term. In 2015, we completed the successful IPO of our sixth closed-end fund, CCD and acquired the Phineus global long/short manager based in San Francisco. These additions follow the 2014 launches of the Calamos Focus Growth ETF, the Calamos Hedged Equity Income Fund, and the Calamos Global Convertible Fund. Through such ongoing strategic expansion efforts, we believe we can enhance our ability to increase assets under management and revenues.
Expand Our Client Base
We distribute the Calamos open-end funds and managed accounts primarily through financial intermediaries. We have developed an extensive network of third-party financial intermediaries, and our products are structured to meet their needs and those of their clients. Our sales professionals are located across the United States and in Europe, and they act in a consultative role to provide our clients with insight. We intend to continue to grow our intermediary business through relationships. We serve institutional clients through separate accounts, pooled accounts and our funds.We also manage six closed-end funds that trade on NASDAQ. We operate a wealth management division that serves high net worth individuals, family offices, endowments and other organizations. The development of these businesses is strategic to the Company and includes the continued delivery of a high level of client service and solid relative investment performance.
As part of our strategic initiatives, we remain focused on the institutional business through direct institutional sales, consultant relations, client relationship management and non-U.S. sales. These efforts have increased both our global business development capabilities as well as client service and retention, along with produced an increased brand awareness.
5
Capitalize on Our Recognized and Respected Brand
We believe that brand awareness is essential in expanding our client base and adding value. Our focus is to continue to highlight the uniqueness of our investment process, our investment strategies and global investment research, and to expand our position in the global markets.
Mr. Calamos, and our four Co-CIOs, and other members of our investment team are recognized internationally as investment experts, and often discuss their investment insights with respected industry media outlets including the Wall Street Journal, Barron's, IPE, Citywire, Ignites, FundFire, ETF Trends, CNBC, Bloomberg, and Fox Business, among others in 2015. John P. Calamos, Sr. has also written two books on investments in convertible securities.
We raise brand awareness through strategic sponsorships, including taking a leadership role at multiple industry and financial services conferences. The Company participated in numerous trade shows and other industry activities in 2015, including the Capital Link Closed-End Fund Forum in New York City, the Schwab Impact Conference in Boston, Massachusetts and the IPE Awards in Barcelona, Spain.
Investment Philosophy and Process
We believe that a successful investment philosophy must be consistent and long term in its focus. The firm's investment philosophy remains largely unchanged including the marriage of top-down and bottom-up thinking, comprehensive capital structure research, and a team-managed approach. Our investment philosophy is based on our views about the longer-term trends and economic conditions that affect financial markets. We assume there will always be unforeseen events that will continually test conventional wisdom. We believe we can achieve favorable investment results over extended periods of time based on our experience throughout many market cycles, our continued study of economics and financial markets, and our application of sound investment processes that can help manage the volatility and risk associated with financial markets.
The creation of wealth for our clients over the long term is not solely about producing returns, but about managing risk, which we define as the potential for loss and the variability of investment returns. We offer investment strategies that represent distinct balances, or profiles, of risk and reward. We believe that diversification is critical to managing risk and moderating the impact of volatile markets. Our objective is to maintain the consistency of each strategy’s risk and reward profile, whether managing a conservative or an aggressive strategy.
Our investment process combines our insights about economic conditions and broader investment themes with our fundamental analysis of individual securities. We use proprietary research and monitoring processes that leverage our years of experience and application, as well as long-standing principles and current academic research. Risk management is integrated fully throughout all aspects of our investment approach. Our process relies on qualitative research and also employ a variety of quantitative tools. While the markets may not always follow the same pattern every economic cycle, history provides a valuable context for evaluating the risks and opportunities of the current investment environment. Our investment decision makers have decades of experience managing through many market cycles.
Investment Management
A dedication to client service extends across our organization and guides the day-to-day decision making within our Company. Accordingly, our investment management team is guided, above all else, by the long-term interests of our clients. Our global investment platform has evolved from a single integrated team to multiple teams with a diverse range of expertise. The investment team includes 67 investment professionals as of December 31, 2015, organized into specialized teams. Having distinct teams ensures that investment professionals are able to concentrate on their core areas of responsibility to best serve our clients. This "team of teams" structure allows us to add investment talent and teams with other specializations, without compromising the interests of clients in other strategies.
The Investment Committee operates as a team and consists of our Global Co-CIO, John P. Calamos, Sr., who leads the Committee. The Committee includes Co-CIOs David Kalis, John Hillenbrand, Nick Niziolek and Eli Pars along with Dave Butler, Executive Vice President and Head of Global Trading and Investment Risk Management. Membership of the Investment Committee may be modified to ensure we adapt to dynamic economic, capital market and investment environments as well as incorporate diverse views into our investment process. Portfolio holdings are reviewed and trading activity is discussed on a regular basis by team members.
The Calamos Investment Committee performs the following functions:
• establishment of top-down global macroeconomic views;
6
• discussion of sector, thematic and geographic positioning across strategies;
• oversight of risk management across strategies;
• monitoring and evaluation of investment performance; as well as the
• evaluation and recommendation of enhancements to the investment process.
Our investment professionals are focused on portfolio management, research, trading, portfolio administration and developing analytical models. The investment organization is led by our Co-Chief Investment Officers. Our Co-Chief Investment Officers, Co-Portfolio Managers and Sector Heads are supported by and lead a team of investment professionals including Co-Portfolio Managers and Research Analysts whose valuable contributions create a synergy of expertise that can be applied across many different investment strategies.
As we thoughtfully seek to grow our assets and expand investment capabilities, we expect to continually evaluate and strategically deepen the investment resources we employ. Talent development across the firm is critical to fulfilling our mission and to delivering upon our strategic objectives.
Our organizational structure also supports an apprentice system which allows us to identify and cultivate talent. Members of our investment team participate in a career track system that helps institutionalize our investment process by immersing many analysts and other team members in our investment philosophy and process from early in their careers. Alternatively, those team members who join the firm later in their careers bring valuable expertise from some of the industry's most respected firms and are then fully integrated into our philosophy and process. Additionally, key members of the investment team participate in the long-term component of our incentive compensation plan. Through this plan, investment team members can share in the overall success of our Company.
Client Relationships
Our first institutional account mandate was initiated in 1981 for a pension fund account. In the late 1980s, we became one of the first participants in the broker-sponsored managed account business. In 2002, we launched the first of our six closed-end funds. As we have done in the past, we continue to strive to expand our presence in distribution channels that best deliver our strategies to long-term investors in order to grow our client base, assets under management and revenues. In recent years, we have placed greater emphasis on other channels for open-end funds and managed account products such as 401(k) platforms, broker consultants, broker-dealers, registered investment advisers, financial planners, family offices, private foundations and high net worth investors.
In 2015, as part of our ongoing efforts to expand our distribution opportunities and client base, we have maintained our focus on the institutional market and retirement platform opportunities, and worked to increase the number of intermediaries that distribute Calamos products globally. We have also increased efforts aimed at increasing our wealth management business.
Intermediary
In 2015, our intermediary business experienced net outflows, primarily related to performance challenges in certain of our U.S.-based funds. However, we continued to see interest in our alternative, emerging market strategies and convertible funds.
In the past year, we have also added resources to the Registered Investment Advisor ("RIA") segment of the intermediary market. RIAs represent an increasing importance, and to take advantage of the opportunity, we have placed a special focus on the channel with a dedicated sales team in addition to our core intermediary team.
Defined contribution plans continue to be a significant segment of the U.S. intermediary market and open-end fund sales. We view the defined contribution industry as a strong target market, given our focus on risk management and outperformance over full and multiple market cycles. Our efforts include focusing key resources and personnel on a targeted set of opportunities, including fee-based open-end fund platforms and separately managed accounts in the major wire houses. We continue to align the incentives of our sales teams to emphasize client service and client retention.
Client accounts held at our top ten financial intermediaries and invested in our domestic open-end funds and separate accounts represented 51% of our assets under management as of December 31, 2015.
Institutional
In 2015, the institutional channel experienced positive flows primarily from a large cash flow from one client. Overall, similar to our intermediary business, performance challenges in global equity and U.S. equity strategies slowed asset growth. In particular, we believe our suite of international, global and emerging market strategies are well-positioned for growth, given their long-term
7
investment performance and market demand. We have been encouraged by the interest shown by non-U.S. clients in our investment strategies and we intend to maintain a focus on non-U.S. opportunities.
Wealth Management
Calamos Wealth Management is a registered investment advisory firm servicing affluent families, family offices, foundations and small institutions. Calamos Wealth Management provides investment advisory and wealth planning services under the guidance of the Investment Committee and management team. Investment Advisory services include assessment of investment programs and goals, development of an investment policy statement, and the design of a strategic asset allocation. Clients' asset allocations are implemented through a combination of Calamos Advisors' offerings and solutions provided by carefully selected independent third party investment managers providing flexible, opportunistic and risk-managed portfolios for clients' global asset allocation needs. Calamos Wealth Management wealth planning professionals work with clients' legal and tax advisors to provide information and counsel to clients and their families on trust and estate, tax, and financial planning matters as they relate to the client’s personal goals and overall investment strategy. By integrating wealth planning and investment advisory services, Calamos Wealth Management seeks to help clients arrive at holistic solutions to meet their current needs and preserve and grow their wealth over generations.
Global
In 2007, we established Calamos Global Funds, an Ireland-domiciled UCITS platform. In 2009, we established an office in London, where we serve European intermediary and institutional channels. We continue to selectively enhance our family of investment fund offerings to non-U.S. investors, based on the needs of investors and opportunity for new business.
In 2015, we relocated and expanded our London office, adding investment team trading and portfolio management resources to the location. Our focus continues to be on building the brand globally in the intermediary and institutional business channels, including efforts to increase and seek investment mandates through large distributors, investment consultants and institutional clients, such as sovereign wealth funds, in Europe, Canada, Asia, Australia, and Latin America. We believe that our global strategies are positioned to capitalize on opportunities we see in select non-U.S. markets.
Investment Strategies
The following table describes our investment strategies and corresponding assets under management at December 31, 2015:
STRATEGY (in millions) | |||||
U.S. Equity | $ | 7,237 | Strategies that seek capital appreciation by investing primarily in the equities of U.S. companies of various market capitalizations we believe offer the best potential for growth. Strategies that invest in the equities of small, midsize and large U.S. companies we believe are undervalued according to certain financial measurements of their intrinsic values. | ||
Global Equity | 2,323 | Strategies that seek capital appreciation by investing primarily in the equities of global companies of various market capitalizations we believe offer the best potential for growth. | |||
Convertible | 1,962 | Strategies that invest primarily in convertible securities of U.S. and non-U.S. companies that are diversified across market sector and credit quality. | |||
Alternative | 3,837 | Strategies that invest in non-traditional strategies, including long/short, market neutral and convertible arbitrage, among others. | |||
Fixed Income | 203 | Strategies that invest in the U.S. investment-grade bond market, international and high yield securities, U.S. Government Agency obligations and repurchase agreements collateralized by U.S. Government Agency obligations. | |||
Multi-Strategy (Closed-end Funds) | 6,346 | Closed-end strategies, both U.S. and global, are enhanced fixed income, seeking total return through capital appreciation and current income by investing in a diversified portfolio of convertible securities and high yield corporate bonds. Other closed-end strategies, both U.S. and global, seek total return through a combination of capital appreciation and current income by investing primarily in a diversified portfolio of equities, convertible securities and high yield corporate bonds. | |||
Total | $ | 21,908 | |||
8
Investment Products
We market our investment strategies to our clients through a variety of products designed to suit their individual investment needs. We currently offer four types of investment products that fall into the categories of funds and separate accounts.
Funds
Funds include our open-end and closed-end funds, which are commingled investment vehicles registered under the Investment Company Act of 1940, as amended, (“Investment Company Act”) as well as our offshore funds. We include the offshore funds and the actively managed ETF in open-end funds for reporting purposes.
Open-End Funds
As of December 31, 2015, we had $12.2 billion in our open-end funds, representing approximately 56% of our assets under management. Open-end funds are continually offered and are not listed on an exchange. Open-end funds issue new shares for purchase and redeem shares from shareholders who sell. The share price for sales and redemptions of open-end funds is determined by each fund’s net asset value, which is calculated at the end of each business day.
We introduced our first open-end fund, the Calamos Convertible Fund, in 1985. We have since expanded our open-end fund products and services to invest in securities worldwide and to include U.S. equity, global equity, alternative and fixed income strategies that we believe offer attractive risk-adjusted return potential. In recent years, much of our expansion efforts have been focused on providing investors with enhanced access to global opportunities. We have introduced global and emerging market-oriented funds for U.S. investors. And as previously mentioned, in 2007, we established Calamos Global Funds, PLC, an Ireland-domiciled UCITS.
We believe that to serve the best interests of investors in our funds, it may be necessary to limit purchases in certain strategies, or even to close certain strategies as circumstances warrant. We evaluate these decisions on an ongoing basis, considering market conditions and our view of the macroeconomic environment, among other factors.
As of year-end 2015, we were the investment advisor to 20 open-end funds, which includes an ETF, and five offshore funds offered to customers primarily through financial intermediaries. We expect to continue to expand and develop the investment strategies offered in our open-end fund products as we see opportunities and seek to meet investor demand.
Calamos Advisors manages the strategies of each of the open-end funds with the goal of achieving higher returns than their respective benchmarks over the long term. Some of the funds also aim to achieve a reduced risk profile. To do so, our investment team focuses on maintaining each strategy’s distinct balance between risk and return throughout the full course of the market cycle.
9
Open-end Funds | |||||
(in millions) | Assets Under Management at December 31, 2015 | Year of Inception | |||
U.S.-Domiciled Funds | |||||
U.S. Equity | |||||
Growth Fund | $ | 2,407 | 1990 | ||
Growth and Income Fund | 2,518 | 1988 | |||
Focus Growth Fund | 59 | 2003 | |||
Focus Growth ETF | 27 | 2014 | |||
Discovery Growth Fund | 38 | 2010 | |||
Mid Cap Growth Fund | 15 | 2013 | |||
Opportunistic Value Fund | 61 | 2002 | |||
Dividend Growth Fund | 36 | 2013 | |||
Global Equity | |||||
Global Growth and Income Fund | 362 | 1996 | |||
International Growth Fund | 584 | 2005 | |||
Global Equity Fund | 161 | 2007 | |||
Evolving World Growth Fund | 434 | 2008 | |||
Emerging Market Equity Fund | 13 | 2013 | |||
Convertible | |||||
Convertible Fund | 943 | 1985 | |||
Global Convertible Fund | 77 | 2014 | |||
Alternative | |||||
Market Neutral Income Fund | 3,752 | 1990 | |||
Long/Short Fund | 74 | 2013 | |||
Hedged Equity Income Fund | 11 | 2014 | |||
Fixed Income | |||||
High Income Fund | 80 | 1999 | |||
Total Return Bond Fund | 89 | 2007 | |||
Offshore Funds | |||||
U.S. Equity | |||||
U.S. Growth Fund | 41 | 2007 | |||
Global Equity | |||||
Global Equity Fund | 70 | 2007 | |||
Global Convertible Opportunities Fund | 199 | 2007 | |||
Emerging Markets Fund | 109 | 2011 | |||
Fixed Income | |||||
Global High Yield Fund | 12 | 2012 | |||
Total | $ | 12,172 | |||
Closed-End Funds
As of December 31, 2015, we had $6.3 billion in our closed-end funds, representing approximately 29% of our assets under management. Closed-end funds typically sell a finite number of shares to investors through underwritten public offerings, unlike open-end funds, which continually offer new shares to investors. After the public offerings, investors buy and sell those shares to other investors through an exchange or broker-dealer market. Occasionally, second offerings are made with closed-end funds, in which they are sold at the market rate.
We introduced our first closed-end fund, Calamos Convertible Opportunities and Income Fund, in 2002. With this fund, we were among the first managers to combine different asset classes in a single closed-end offering, seeking to enhance returns and limit
10
risk. We have since expanded our closed-end fund products and currently act as the investment advisor to six closed-end funds, including the Calamos Dynamic Convertible and Income Fund launched in 2015.
Each of the Calamos closed-end funds employs leverage in its capital structure. With leverage, we seek to generate additional dividend potential for the common shareholders based on historical differences between short-term and long-term taxable interest rates. Leverage involves borrowing at shorter-term rates and investing the proceeds over a longer-term, which typically provides for higher returns. We continually assess our use of leverage because certain market conditions are not conducive to executing this strategy. We currently believe that leverage strategies are accretive to the common shareholders of our closed-end funds.
Calamos closed-end funds can be grouped into two broad categories: 1) Enhanced Fixed Income — portfolios positioned to pursue high current income from income and capital gains; and 2) Total Return — portfolios positioned to seek current income, with increased emphasis on capital appreciation. Funds in both groups seek to provide a competitive stream of monthly dividends and invest in a variety of asset classes.
Closed-end Funds | |||||
(in millions) | Assets Under Management at December 31, 2015 | Year of Inception | |||
Multi-Strategy (Closed-end Funds) | |||||
Enhanced Fixed Income | |||||
Convertible Opportunities and Income Fund | $ | 1,106 | 2002 | ||
Convertible and High Income Fund | 1,219 | 2003 | |||
Global Dynamic Income Fund | 717 | 2007 | |||
Total Return | |||||
Strategic Total Return Fund | 2,433 | 2004 | |||
Global Total Return Fund | 151 | 2005 | |||
Dynamic Convertible and Income Fund | 720 | 2015 | |||
Total | $ | 6,346 | |||
Separate Accounts
Separate accounts are individual portfolios of securities managed to meet clients’ unique needs and include institutional accounts and managed accounts.
Institutional Accounts
As of December 31, 2015, we had $2.3 billion in our institutional accounts, representing approximately 10% of our assets under management. Institutional accounts are separately managed accounts for certain investors, such as corporate pension funds, public funds, endowment funds and not-for-profit institutions, offered through consultants, broker-dealer intermediaries and directly by us. A qualified investment trust and two limited partnerships, that we manage, are also included in the institutional accounts designation. We have approximately 95 institutional accounts, from direct client as well as sub-advisory relationships.
Since initially offering convertible investment strategies to institutions, we have broadened our mandates to include a variety of investment strategies in other asset classes, such as equity and high yield, and we see considerable opportunity for our global and non-U.S. equity strategies.
In recent years, our business development team has targeted institutional consultants and plan sponsors, and focused on educating institutional prospects about our investment process and performance. Our institutional marketing efforts center on identifying potential new investors, developing relationships with institutional consultants and providing ongoing client service to existing institutional accounts. We focus on growing our institutional business through equity and fixed income mandates, managed under both domestic and global objectives.
11
Institutional Accounts* | |||
(in millions) | Assets Under Management at December 31, 2015 | ||
U.S. Equity | $ | 1,712 | |
Global Equity | 391 | ||
Convertible | 184 | ||
Fixed Income | 22 | ||
Total | $ | 2,309 | |
*Institutional accounts do not include assets serviced through our open-end or closed-end funds.
Managed Accounts
As of December 31, 2015, we had $1.1 billion in our managed accounts, representing approximately 5% of our assets under management. Our approximately 1,700 managed accounts are individual portfolios of securities offered primarily through 13 national and regional broker-dealer platforms. We first introduced managed accounts through a broker-dealer sponsored platform in 1989. Since initially offering convertible investment strategies to our managed account customers, we have broadened our mandates to include U.S. equity and global equity investment strategies.
Managed Accounts* | |||
(in millions) | Assets Under Management at December 31, 2015 | ||
U.S. Equity | $ | 323 | |
Convertible | 758 | ||
Total | $ | 1,081 | |
*Managed accounts do not include assets serviced through our open-end or closed-end funds.
Assets under management do not include assets under advisement of $609 million as of December 31, 2015 for which we provide model portfolio design and oversight.
Competitive Environment
We compete in all aspects of our business with a large number of investment management firms, commercial banks, broker-dealers and insurance companies. We compete principally on the basis of investment performance; quality of client service; brand recognition and business reputation; continuity of client relationships and assets under management; continuity of our selling arrangements with financial intermediaries; the range of products offered; the level of fees and commissions charged for services; the level of expenses paid to financial intermediaries for administration and distribution; and financial strength.
The following factors, among others, serve to increase our competitive risks: the financial strength and more comprehensive line of products and services provided by our competitors; consolidation within the investment management and broker-dealer industries, which is increasing the size and strength of certain competitors; relatively few barriers to entry, which may increase the number of competitors; and the recruitment of our investment professionals and other employees from us. These and other factors could reduce our earnings and revenues and may have a materially adverse effect on our business.
Technology and Intellectual Property
We consider technology to be a competitive advantage in our investment process. Our investment approach demands tailored outputs for all aspects of the investment process, including risk management, security analysis and trade processing. As a result, our use of in-house developed and third-party technology and software enables customization of systems across our Company. Our quantitative investment tools, including our proprietary Calamos Corporate System, continue to be enhanced by our research development team. Our internal investment-related systems are geared to the principles that guide our investment process, allowing for a more seamless integration of security analysis, trade processing, accounting and portfolio administration of our approximately 1,850 accounts at December 31, 2015. In other areas of our business, where competitive advantages do not exist, such as trade order processing and portfolio accounting, we look to leverage third-party applications or service providers for cost efficiency.
12
Trademarks, service marks and brand name recognition are important to our business. We have rights to the trade and service marks under which our products are offered in connection with financial analysis and consultation, financial portfolio management and financial investment. We have registered certain marks in the United States, France, Germany, Ireland, Switzerland and the United Kingdom, and will continue to do so as new marks are developed or acquired. We have taken, and will continue to take, action to protect our interest in these marks.
Regulatory Environment
Our domestic and global lines of business are subject to extensive regulation. In the United States and other countries in which we do business, we are subject to regulations and laws at both a federal and state level, including U.S. federal, state and local tax laws as well as similar foreign jurisdiction tax laws, which can have a significant effect on our business. In addition to more general laws, financial industry regulation both in the United States and various foreign jurisdictions in which we operate applies to our business, resulting in supervision by various regulatory bodies as well as self regulatory organizations (“SROs”). Though Calamos Asset Management, Inc. is not a registered or licensed entity under any of these laws, it is effectively subject to these laws through the regulation and supervision of its registered or licensed, wholly owned subsidiaries. While the substance of the laws may differ among jurisdictions, the primary intent of each is to protect investment advisory clients and shareholders of registered investment companies by imposing duties and limitations on those who advise, transact with, and represent them. The agencies and SROs that regulate our subsidiaries have broad administrative powers, including the power to restrict, or prohibit our subsidiaries from carrying on their respective businesses in the event that they fail to comply with certain laws and regulations. Possible sanctions that may be imposed for violation of these industry-specific laws (which are further discussed below) include the suspension or barring of individual employees, limitations on engaging in certain lines of business for specified periods of time, revocation of registrations or licenses, censures and fines. In addition, a regulatory proceeding, regardless whether it results in a sanction, can require substantial expenditures, can divert the attention of our management and employees and can have an adverse effect on our reputation or business. Regulators also have a variety of informal enforcement mechanisms available that could have a significant impact on our business.
U.S. Securities and Investment Advisory Regulation
In the United States, Calamos Advisors and Calamos Wealth Management are registered as investment advisors with the Securities and Exchange Commission (“SEC”). As SEC-registered investment advisors, they are subject to the requirements of the Investment Advisers Act of 1940, as amended ("Investment Advisers Act"), SEC regulations, and examination by the SEC’s staff. The Investment Advisers Act imposes substantive regulation on virtually all aspects of their business and their relationships with their clients. Requirements include fiduciary duties to clients, prohibitions on engaging in certain transactions with clients, maintaining an effective compliance program, compensation restrictions, proscribed solicitation arrangements, prohibition or required disclosure of conflicts of interest, advertising rules, and recordkeeping obligations, as well as certain other reporting and disclosure requirements. In addition, the Investment Advisers Act requires, and the investment advisory agreements of Calamos Advisors and Calamos Wealth Management require, that any assignment of such agreements must require the client’s prior consent. Calamos Advisors and Calamos Wealth Management are also required to make notice filings in the states in which they conduct business and must comply with certain provisions of the securities (or “blue sky”) laws of these states, most notably the anti-fraud provisions of these laws. The anti-fraud provisions of state securities laws may differ somewhat from the anti-fraud provisions of the Investment Advisers Act and could thus serve as a source of additional regulatory exposure.
CAM is not an investment company; however, the U.S.-based open-end and closed-end funds that Calamos Advisors manages are registered with the SEC under the Investment Company Act. The Investment Company Act imposes additional obligations, including detailed operational requirements for both the funds and their respective investment advisors. Moreover, an investment advisor’s contract with a registered fund may be terminated by the board of directors or shareholder of the fund on not more than 60 days’ notice, and is subject to annual renewal by the fund’s board of directors after an initial two-year term. The failure of Calamos Advisors and Calamos Wealth Management to comply with the requirements of the SEC or the registered funds advised by Calamos Advisors to be in compliance with the requirements of the SEC could have a material adverse effect on us.
We are also subject to the federal and state laws affecting corporate governance, including the Sarbanes-Oxley Act of 2002, the Dodd-Frank Wall Street Reform and Consumer Protection Act of 2010, and rules promulgated by the SEC. Further, CAM is subject to the rules of NASDAQ, including the corporate governance listing standards.
The Commodity Futures Trading Commission has adopted certain amendments to its rules that would limit the ability of a fund to use commodities, futures, swaps, and other derivatives without additional registration by the fund's investment advisor. If we were to increase the use of these products by our funds so as to require registration, we would be subject to additional regulatory requirements and costs associated with registration.
13
Calamos Financial Services is a broker-dealer registered with the SEC and a member of the Financial Industry Regulatory Authority (“FINRA”) and the Securities Investor Protection Corporation. As a registered broker-dealer and FINRA member, Calamos Financial Services is subject to the applicable requirements of the Securities Exchange Act of 1934, as amended (the “Exchange Act”), SEC regulations and FINRA regulations, as well as examination by the SEC’s and FINRA’s staff. The SEC’s and FINRA’s regulatory requirements cover all aspects of Calamos Financial Services' business, including sales practices, minimum net capital requirements, recordkeeping, compensation and disclosure, and the conduct of directors, officers and employees. Violation of applicable regulations can result in the revocation of broker-dealer licenses, the imposition of censure or fines and the suspension or expulsion of a firm, its officers or employees. Although, the federal securities laws prohibit states from imposing substantive requirements on broker-dealers that exceed those under federal law, states are not precluded from imposing registration requirements on broker-dealers that operate within their jurisdiction or from sanctioning these broker-dealers and their employees for engaging in misconduct.
Calamos Advisors and Calamos Wealth Management are subject to the Employee Retirement Income Security Act of 1974, as amended (“ERISA”), insofar as they act as "fiduciaries" with respect to benefit plan clients. ERISA and applicable provisions of the Internal Revenue Code of 1986, as amended, impose certain duties on persons who are fiduciaries under ERISA, prohibit certain transactions involving ERISA plan clients and provide for monetary penalties for violations of these prohibitions. The U.S. Department of Labor ("DOL"), which administers ERISA, has been increasingly active in proposing and adopting regulations affecting the asset management industry. Failure to comply with these requirements could have a material adverse effect on our business.
International Securities and Investment Advisory Regulation
Calamos Investments LLP is a registered investment advisor with the Financial Conduct Authority ("FCA") in the United Kingdom. The FCA’s rules govern Calamos Investment LLP’s capital resource requirements, senior management arrangements, business conduct, client interaction and internal controls. Similar to United States regulations, violations of these rules may result in a range of disciplinary actions against the firm. Calamos Investments LLP must also comply with various Directives of the European Union and rules thereunder including, but not limited to, the: Capital Requirements Directive; Markets in Financial Instruments Directive; Alternative Investment Fund Managers Directive; and European Market Infrastructure Regulation. These Directives and rules provide comprehensive regulation of public and private markets for securities and investment funds throughout the European Economic Area.
Calamos Advisors LLC provides limited scope investment services in certain provinces of Canada, operating under an international advisor exemption pursuant to National Instrument 31-103.
Foreign Corrupt Practices Act
The Foreign Corrupt Practices Act prohibits U.S. companies, citizens and residents from bribing or offering to bribe foreign officials for the purpose of retaining a business benefit or other improper advantage and also requires these companies to devise a system of internal controls to meet certain recordkeeping standards. Any violations of these requirements would negatively impact our business.
Privacy
Many aspects of our business are subject to comprehensive legal requirements by a multitude of different functional regulators concerning the use and protection of personal information, including client and employee information. This includes rules adopted pursuant to the Gramm-Leach-Bliley Act, the Fair and Accurate Credit Transactions Act, an ever increasing number of state laws, and EU data protection legislation as domestically implemented in the respective EU member states.
USA Patriot Act
The Uniting and Strengthening America by Providing Appropriate Tools Required to Intercept and Obstruct Terrorism Act, commonly referred to as the USA Patriot Act, was enacted in October 2001 in the wake of the September 11, 2001 terrorist attacks. The USA Patriot Act broadened existing anti-money laundering legislation and the extraterritorial jurisdiction of the United States substantially.
New Developments
Potential impacts of current or proposed legal or regulatory requirements include, without limitation, the following:
• | The Federal Reserve Board has adopted final regulations related to non-bank Systemically Important Financial Institutions (“SIFIs”), and other jurisdictions are contemplating similar regulation.While regulators have stated that they will not pursue designating large asset management firms or mutual funds as SIFIs at this time, the question |
14
may be revisited in the future. We do not believe that asset managers or mutual funds should be deemed SIFIs. Further, we do not believe SIFI designation was intended for traditional asset management businesses. If, however, any Calamos fund or Calamos affiliate is deemed a SIFI, increased regulatory oversight would apply, which may include enhanced capital, liquidity, leverage, stress testing, resolution planning, and risk management requirements.
• | There has been increased global regulatory focus on the manner in which intermediaries are paid for distribution of mutual funds. Changes to longstanding market practices related to fees or enhanced disclosure requirements may negatively impact sales of mutual funds by intermediaries, especially if such requirements are not applied to other investment products. |
• | In 2015, the DOL proposed a rule that would subject financial professionals that provide advice to retirement plan investors to a fiduciary duty, which could limit their ability to provide advice about funds for which they receive a fee from the fund or its affiliates. If adopted as proposed, this rule could affect our ability to compensate financial intermediaries who sell our funds to their retirement clients, which may have an adverse effect on our ability to grow the assets under management of our open-end and closed-end funds business. |
• | Global regulations on OTC derivatives are evolving, including new and proposed regulations under The Dodd-Frank Wall Street Reform and Consumer Protection Act and European Market Infrastructure Regulation relating to central clearing counterparties, trade reporting, and repositories. There remains uncertainty related to various requirements under these regulations and the exact manner in which they will impact current trading strategies for our clients. |
• | The revised Markets in Financial Instruments Directive (MiFID II Directive) and Regulation (MiFIR) (together “MiFID II”) will apply across the European Union (EU) and member states of the European Economic Area from January 3, 2017. Implementation of MiFID II will significantly impact both the structure and operation of EU financial markets. Some of the main changes introduced under MiFID II include applying enhanced disclosure requirements, further conduct of business requirements, enhancing governance requirements, broadening the scope of pre- and post-trade transparency, increasing transaction reporting requirements, changes to the regulation of trading venues, changes to the rules governing paying for investment research, and limiting certain distribution compensation practices. Compliance with MiFID II will increase our costs. |
Employees
As of December 31, 2015 and 2014, we had 348 and 363 full-time employees, respectively.
SEC Filings
Our SEC filings are available free of charge through the Investor Relations section on our website www.calamos.com/Investors. We encourage our readers to view our SEC filings as well as other important information, including corporate governance documents, press releases, investor presentations, assets under management reports and other documents, on our website. The information on our website is not a part of this Annual Report on Form 10-K.
ITEM 1A. RISK FACTORS
Risks Related to Our Industry
Our assets under management, which impact revenue, are subject to significant fluctuations.
Substantially all of our revenues are determined by the amount of our assets under management. Under our investment advisory contracts with our clients, the investment management fee we receive is typically based on the market value of assets under management. In addition, we receive asset-based distribution and/or service fees with respect to the open-end funds managed by Calamos Advisors pursuant to distribution plans adopted under provisions of Rule 12b-1 under the Investment Company Act. Rule 12b-1 fees typically are based on the market value of our assets under management. Accordingly, a general or prolonged decline in the prices of securities usually has caused our revenues and net income to decline due to (i) the value of our assets under management decreasing, and/or (ii) clients withdrawing funds in favor of investments they perceive to offer greater opportunity or lower risk. The securities markets have been and may continue to be highly volatile and securities prices may increase or decrease for many reasons beyond our control, including economic and political events and acts of terrorism in the United States and abroad. The continuation or worsening of these factors could lead to future declines in our assets under management. To the extent we receive fee revenue from assets under management attributable to financial leverage, any reduction in leverage used would adversely affect our assets under management, revenue and net income. Leverage could be reduced due to an adverse change in interest
15
rates, a decrease in the availability of credit on favorable terms or a determination to reduce or eliminate leverage on certain products if we determine the use of leverage is no longer in our clients’ best interests.
Changes in laws, regulations or governmental policies due to the state of the economy could limit the sources and amounts of our revenues, increase our costs of doing business, decrease our profitability, and materially and adversely affect our business.
Our business is subject to extensive domestic and international regulation which directly affects our cost of doing business. Industry regulations are designed to protect our clients and investors in our funds, as well as other third parties who deal with us, and to ensure the integrity of the financial markets. In recent years, governments and regulators have increased interest and oversight of the broad financial and investment management industry. The adoption and implementation of proposed rule changes, such as the DOL's proposal to expand the applicability of its fiduciary rule, other changes in laws, regulations or rules of self-regulatory organizations or in government policies, and unforeseen developments in litigation targeting the securities industry generally or us could limit the sources and amounts of our revenues, increase our costs of doing business, decrease our profitability, and materially and adversely affect our business. Further, our failure to comply with applicable laws or regulations could result in fines, censure, suspension or barring of personnel, or other sanctions, including revocation of our registration as an investment advisor or broker-dealer. In addition, allegations that we have failed to comply with applicable laws or regulations could harm our reputation, which could have a material adverse effect on our business.
The soundness of other financial services institutions could adversely affect our earnings.
Financial services institutions are interrelated as a result of trading, clearing, counterparty or other relationships. We and the investments we manage may have exposure to many different industries and counterparties, and we routinely execute transactions with counterparties in the financial services industry including: brokers and dealers, commercial banks, investment banks, mutual and hedge funds, and other institutions. Many of these transactions expose us or the accounts we manage to credit risk in the event of default of the counterparty.
The asset management business is intensely competitive.
We are subject to competition in all aspects of our business from asset management firms, mutual fund companies, commercial banks and thrift institutions, insurance companies, hedge funds, exchange-traded funds, brokerage and investment banking firms, and other financial institutions, including multinational firms and subsidiaries of diversified conglomerates.
Many of our competitors have substantially greater resources than we do and may offer a broader range of financial products and services across a larger number of markets. Some financial institutions operate in a more favorable regulatory environment and have proprietary products and distribution channels which may provide certain competitive advantages to them and their investment products. We compete primarily based on the investment performance of the investment portfolios offered as well as the scope and quality of investment advice and client service. We believe that competition within the investment management industry has and will continue to increase as a result of the state of the economy, and consolidation and acquisition activity. Some of our investment portfolios have sales or redemption fees, which means that investors may be more willing to invest assets in competing funds without such fees.
If current or potential customers decide to use one of our competitors, we could face a significant decline in market share, assets under management, revenues and net income. Although our cost structure is more variable, some of our expenses remain fixed, especially over shorter periods of time, and other expenses may not decrease in proportion to any decrease in revenues.
To the extent we are forced to compete on the basis of price, we may not be able to maintain our current fee structure.
The investment management industry has relatively low barriers to entry and to the extent we are forced to compete on the basis of price, we may not be able to maintain our current fee structure. In order to maintain our fee structure in a competitive environment, we must be able to continue to provide clients with investment returns and service that make investors willing to pay our fees. In addition, the board of trustees of the funds managed by Calamos Advisors must make certain findings as to the reasonableness of its fees. We cannot guarantee investment returns and services that will allow us to maintain our current fee structure. Fee reductions on existing or future business could have an adverse effect on our revenues and results of operations.
We derive a substantial portion of our revenues from contracts that may be terminated on short notice.
We derive a substantial portion of our revenues from investment management agreements with the funds that are generally terminable by the funds’ board of trustees or a vote of the majority of the funds’ outstanding voting securities on not more than 60 days’ written notice. After an initial term, each fund’s investment management agreement must be approved and renewed annually by the independent members of such fund’s board of trustees and, in certain cases, by its stockholders. These investment management agreements may be terminated or not renewed for any number of reasons, including investment performance, advisory fee rates and financial market performance. Further, we may not be able to replace terminated or non-renewed agreements on
16
favorable terms. The decrease in revenues that could result from any such termination could have a material adverse effect on our business.
Investors in the open-end funds can redeem their investments in these funds at any time without prior notice, which could adversely affect our earnings.
Open-end fund investors may redeem their investments in those funds at any time without prior notice. In a declining stock market, the pace of open-end fund redemptions could accelerate. As we have experienced in recent years with some of our domestic equity strategies, poor performance relative to other asset management firms tends to, and did, result in decreased purchases and increased redemptions of open-end funds. The redemption of investments in open-end funds managed by Calamos Advisors may adversely affect our revenues, which are substantially dependent upon the assets under management in our open-end funds.
Risks Related to Our Business
The loss of key personnel could have a material adverse effect on our business.
We are dependent on the efforts of our key personnel, including executives, portfolio managers, and corporate officers. These individuals are responsible for determining the strategic direction of our business, are integral to our brand and the positive business reputation we earned. Although we have employment arrangements for certain personnel that we believe are competitive, we cannot guarantee that they will continue to act in their positions with us. We do not carry “key man” insurance and the loss of the services of certain individuals may have a material adverse effect on our business.
Our ownership structure is not uniformly understood and this may cause investor confusion and missed business opportunities.
Our ownership structure is not uniformly understood within the financial community, including by current and potential investors and clients. Our market capitalization is often listed by reporting agents based only on outstanding common shares, which only reflects 22.2% of the ownership of our business and does not give consideration to the Calamos Interests ownership in Calamos Investments. As of December 31, 2015, the Calamos Interests owned approximately 77.8% of Calamos Investments as well as all of our Class B common stock. The total consolidated market capitalization of the business, therefore, is often significantly understated. Potential misperceptions by investors and potential clients, as well as financial firms publishing stock market indices and proxy advisory firms, each of which considers the market capitalization of companies in making investment decisions, determining the composition of stock market indices, and making voting recommendations, as applicable, as to the value of our business may result in a negative effect on our stock price.
The disparity in the voting rights among the classes of shares may have an adverse effect on the price of our Class A common stock.
Shares of our Class A common stock and Class B common stock entitle the respective holders to identical rights, except that each share of our Class A common stock entitles its holder to one vote on all matters to be voted on by stockholders generally while each share of Class B common stock entitles its holder to a greater number of votes. Our outstanding Class B common stock represents more than 97.4% of the combined voting power of all classes of our voting stock. The difference in voting rights could adversely affect the value of our Class A common stock to the extent that investors view, or any potential future purchaser of our Company views, the superior voting rights of the Class B common stock to be detrimental to the value of the Class A common stock.
Control by Calamos family members of a majority of the combined voting power of our common stock may have a negative effect on the price of the Class A common stock.
As of December 31, 2015, the Calamos Interests owned approximately 77.8% of Calamos Investments and all of our Class B common stock, representing more than 97.4% of the combined voting power of all classes of our voting stock. Pursuant to the terms of our second amended and restated certificate of incorporation, Calamos Family Partners, Inc. retains a majority of the combined voting power of our common stock until its ownership interest in Calamos Investments falls below 15%, at which time all outstanding shares of our Class B common stock automatically will convert into shares of our Class A common stock. Accordingly, as long as Calamos Family Partners, Inc. maintains the requisite ownership interests in Calamos Investments (including through ownership of our common stock), it will continue to have the ability to elect all of the members of our board of directors and thereby control our management and affairs, including determinations with respect to acquisitions, dispositions, borrowings, issuances of common stock or other securities, and the declaration and payment of dividends on our common stock. In addition, it will continue to be able to determine the outcome of all matters requiring stockholder approval on a combined class vote basis, and will continue to be able to cause or prevent a change of control of our Company or a change in the composition of our board of directors. The concentration of ownership could deprive Class A stockholders of an opportunity to receive a premium for their
17
common stock as part of a sale of our Company and might ultimately negatively affect the market price of our Class A common stock.
The number of shares of our Class A common stock issuable to the Calamos Interests upon an exchange of any or all of their interests in Calamos Investments is variable and is subject to the Board of Directors’ determination as to the value of our shares and assets, and the issuance of such shares in an exchange would have the effect of diluting the existing stockholders’ percentage ownership interest in the Company.
Under our Second Amended and Restated Certificate of Incorporation, the number of shares of our Class A common stock issuable to the Calamos Interests upon an exchange of any or all of their interests in Calamos Investments will be determined by reference to a fair value of our shares and assets, as determined by a majority of the independent directors of our Board. This Board valuation of our shares may be different from a value based on the closing price of our shares if, for example, it is determined that the closing share price does not fully reflect the value of the assets other than our interest in Calamos Investments (the "Other Assets"). Therefore, the number of shares of our Class A common stock issuable in such an exchange will involve subjective estimates and judgments based on prevailing facts and circumstances. The maximum number of Class A common stock that could be issued to the Calamos Interests upon exchange was approximately 71.9 million shares as of December 31, 2015, which was based on our outstanding share count and percentage ownership in Calamos Investments at year end. Specifically, the number of our outstanding shares was divided by our percentage ownership in Calamos Investments, and then the result was multiplied by Calamos Interests' percentage ownership in Calamos Investments. As a general matter if the closing price of our shares is deemed to fully reflect the value of our Other Assets, this would result in fewer shares issuable upon an exchange, and vice versa.
In the event of an exchange, the issuance of additional shares of our Class A common stock would have the effect of diluting the existing stockholders’ percentage ownership interest in CAM and their indirect interest in Other Assets. Provided, however, such dilution may be offset, in whole or in part, by an increase in existing stockholders’ indirect interest in Calamos Investments acquired by CAM in such an exchange.
Future investment performance of our investment strategies could adversely affect our assets under management and expose us to litigation, either of which may reduce earnings.
The relative performance of our investment strategies, and consequently our Morningstar and Lipper ratings, are critical in retaining existing clients as well as attracting new clients. The performance of our investment strategies can fluctuate for a number of reasons, including general market conditions and our investment decisions. If our strategies and ratings do not meet our clients’ and the market’s expectations, which was the case for some of our domestic equity strategies in recent years, we could, and did, suffer a decline in assets under management and therefore in our earnings. In contrast, when our strategies and ratings experience strong results relative to the market, benchmark indices, competitors' products, or other asset classes, clients’ allocations to our strategies may increase relative to their other investments and we could suffer withdrawals as our clients rebalance their investments to fit their asset allocation preferences.
While clients do not have legal recourse against us solely on the basis of poor investment results, if our investment strategies perform poorly, we are more likely to become subject to litigation brought by dissatisfied clients. Any such litigation could be expensive and time-consuming, and could divert management resources from the management of our business.
We depend on third-party distribution channels to market our investment products and access our client base.
The potential investor base for open-end funds and separate accounts is limited, and our ability to distribute open-end funds and access clients for separate accounts is highly dependent on access to the retail distribution systems and client bases of national and regional securities firms, banks, insurance companies, defined contribution plan administrators and other intermediaries, which generally offer competing internally and externally managed investment products. For open-end funds, such intermediaries are paid for their services to fund shareholders, in part, through Rule 12b-1 fees and/or upfront commission payments by us, for which we receive Rule 12b-1 payments in the future. Those future payments allow us to pay or help us recover payments to selling firms. Access to such distribution systems and client bases is substantially dependent upon our ability to charge Rule 12b-1 fees to our funds. In addition to the foregoing, we pay some intermediaries supplemental compensation payments for various purposes. Our institutional separate account business depends on referrals from consultants, financial planners and other professional advisors, as well as from our existing clients. We cannot assure that these channels and client bases will continue to be accessible to us. The inability to have such access could have a material adverse effect on our assets under management and ultimately our earnings.
As of December 31, 2015, a majority of our assets under management were attributable to accounts that we accessed through third-party intermediaries. These intermediaries generally may terminate their relationships with us on short notice and may selectively determine which of our investment products to sell or remove from their platforms. While we continue to diversify and add new distribution channels for open-end funds and managed accounts, and a significant portion of the growth in our assets under management in recent years has been accessed through intermediaries, there has been a consolidation of and elimination of some
18
financial service companies in recent years. In addition, the adoption and implementation of the DOL’s proposed expanded fiduciary rule could adversely affect our ability to enter new arrangements or maintain existing relationships with intermediaries. The loss of any of the distribution channels afforded by these intermediaries, and the inability to access clients through new distribution channels, could decrease our assets under management and adversely affect our results of operations and growth potential.
We derive a substantial portion of our revenues from a limited number of our products.
As of December 31, 2015, 17%, 11% and 11% of our assets under management were concentrated in three Calamos sponsored funds, (Calamos Market Neutral Fund, Calamos Growth and Income Fund, and Calamos Growth Fund, respectively), and 14%, 13% and 17% of our total revenues were attributable to those funds. As a result, our operating results are particularly exposed to the performance of those funds and our ability to minimize redemptions from and maintain assets under management in those funds. If a significant amount of investments are withdrawn from those funds for any reason, our revenues would decline and our operating results would be adversely affected. Further, given the size and prominence of those funds within our Company, any adverse performance of those funds may also indirectly affect the net sales and redemptions in our other products, which in turn may negatively affect our operating results.
We are dependent on Calamos Investments to distribute cash to us in amounts sufficient to pay our tax liabilities and other expenses.
Our ownership in Calamos Investments is our primary asset and we have limited independent means of generating revenues. Calamos Investments is treated as a partnership for U.S. federal income tax purposes and, as such, is not itself subject to U.S. federal income tax. Instead, its taxable income is allocated on a pro rata basis to its members. Accordingly, we incur income taxes on our proportionate share of any net taxable income of Calamos Investments, and also incur expenses related to our operations. As the sole manager, we caused and in the future intend to cause Calamos Investments to distribute cash to its members to the extent necessary to cover their tax liabilities, if any. If Calamos Investments is unable to provide funds for such taxes or for any other purpose, it could have a material adverse effect on our business, financial condition or results of operations.
We intend to pay regular dividends to our stockholders, but our ability to do so is subject to the discretion of our board of directors and may be limited by our holding company structure, financial condition, and any applicable laws.
To date, we have paid a cash dividend each quarter and intend to continue to pay dividends on a quarterly basis. However, in the past we have reduced our dividend due to the effect of market conditions on our business. Our board of directors has and in the future may, in its discretion, increase or decrease the level of dividends. Further, our board of directors has discretion to discontinue the payment of dividends entirely. The ability of Calamos Investments to make distributions is subject to its: operating results, cash requirements, financial condition, and compliance with covenants and financial ratios related to existing or future indebtedness, as well as any applicable laws. If, as a consequence of these various limitations and restrictions, we are unable to generate sufficient distributions from our business, we may need to reduce or eliminate the payment of dividends on our shares.
The inability for Calamos Investments to maintain compliance with its financial covenants could have a material adverse effect on our Company.
Calamos Investments currently has $46.0 million of aggregate principal amount of senior unsecured notes outstanding. Note purchase agreements between Calamos Investments and its note holders govern the terms of the unsecured notes. Under these agreements, Calamos Investments must maintain certain consolidated net worth, leverage and interest coverage ratios. The note purchase agreements also contain other covenants that, among other provisions, restrict the ability of Calamos Investments’ subsidiaries to incur debt and restrict the ability of Calamos Investments or its subsidiaries to make distributions, create liens and to merge or to consolidate, or sell or convey all or substantially all of Calamos Investments' assets. The inability of Calamos Investments to maintain compliance with any of its financial covenants could lead to an event of default and result in various remedies to the note holders including the acceleration of all the notes outstanding and the payment of a make whole amount. In such an event, our liquidity and results from operations would be materially and adversely impacted.
Significant changes in market conditions and the economy may require a modification to our business plan.
Our revenues are primarily driven by assets under management, and declines in the financial markets will directly and negatively affect our investment advisory fee revenues as well as our non-operating income and net income. As such, significant changes in market conditions and the economy may require a modification to our business plan. Modification to our business plan may include: the elimination of product offerings, programs or efforts; realignment of sales and marketing resources to adapt to changing market demand and the changing competitive landscape; and the implementation of expense control measures, inclusive of staff reductions, to streamline our infrastructure and reduce capital expenditures. Independent of market conditions, we also may modify our business plan, which may not be successful, affecting our revenues and net income.
19
A change of control of our Company would automatically terminate our investment management agreements with our clients, unless our separate account clients consent and, in the case of fund clients, the funds’ boards of trustees and shareholders voted to continue the agreements. A change of control could also prevent us for a two-year period from increasing the investment advisory fees we are able to charge our mutual fund clients.
Under the Investment Company Act, an investment management agreement with a fund must provide for its automatic termination in the event of its assignment. The fund’s board and shareholders must vote to continue the agreement following its assignment, the cost of which ordinarily would be borne by us.
Under the Investment Advisers Act, a client’s investment management agreement may not be “assigned” by the investment advisor without the client’s consent. An investment management agreement is considered under both acts to be assigned to another party when a controlling block of the advisor’s securities is transferred. In our case, an assignment of our investment management agreements may occur if, among other things, we sell or issue a certain number of additional common shares in the future. We cannot be certain that our clients will consent to assignments of our investment management agreements or approve new agreements with us if a change of control occurs. Under the Investment Company Act, if a fund’s investment advisor engages in a transaction that results in the assignment of its investment management agreement with the fund, the advisor may not impose an “unfair burden” on that fund as a result of the transaction for a two-year period after the transaction is completed. The term “unfair burden” has been interpreted to include certain increases in investment advisory fees. This restriction may discourage potential purchasers from acquiring a controlling interest in our Company.
We require specialized technology to operate our business and would be adversely affected if this technology became inoperative or obsolete.
Our business is dependent on highly specialized technology to support our business functions including: securities analysis, securities trading, portfolio management, customer service, accounting and internal financial processes and controls, and regulatory compliance and reporting.
All of our technology systems may be vulnerable to disability or failures due to cyber-attacks such as hacking or viruses, natural disasters, power failures, acts of war or terrorism, and other causes. Some of our software is licensed from and supported by outside vendors upon whom we rely to prevent operating system failure. A suspension or termination of these licenses or the related support, upgrades and maintenance could cause system delays or interruption. Also, our back office operations have been outsourced to third-party service providers who rely on technology systems as well. If these service providers or any of these systems fail, we would be unable to fulfill critical business functions, which could lead to a loss of customers and harm to our reputation. Technological breakdowns could also interfere with our ability to comply with financial reporting and other regulatory requirements, exposing us to disciplinary action and to liability to our customers.
In addition, our continued success depends on our ability to adopt new or adapt existing technologies to meet client, industry and regulatory demands. We might be required to make significant capital expenditures to maintain competitive technology. If we are unable to upgrade our technology in a timely fashion, we might lose customers and fail to maintain regulatory compliance, which could affect our results of operations and severely damage our reputation.
Our operational systems and networks are subject to evolving cybersecurity or other technological risks, which could result in the disclosure of confidential client information, loss of our proprietary information, damage to our reputation, additional costs to us, regulatory penalties and other adverse impacts.
Our business is reliant upon internal and third party technology systems and networks to process, transmit and store information, including sensitive client and proprietary information, and to conduct many of our business activities and transactions with our clients, advisors, vendors and other third parties. Maintaining the integrity of these systems and networks is critical to the success of our business operations, including the retention of our advisors and clients, and to the protection of our proprietary information and our clients’ personal information. To date, we have not experienced any material breaches of or interference with our systems and networks, however, we routinely encounter and address such threats. Our experiences with or preparation for cybersecurity and technology threats have included phishing scams, introductions of malware, attempts at electronic break-ins, and unauthorized payment requests. Any such breaches or interference that may occur in the future could have a material adverse impact on our business, financial condition or results of operations.
We are subject to international, federal and state regulations, and in some cases contractual obligations, that require us to establish and maintain policies and procedures designed to protect sensitive client, employee, contractor and vendor information. We have implemented and maintain security measures designed to protect against breaches of security and other interference with our systems and networks resulting from attacks by third parties, including hackers, and from employee or advisor error or malfeasance. We also require third-party vendors, who in the provision of services to us are provided with or process information pertaining to our business or our clients, to meet certain information security standards. Changes in our client base, the mix of assets under
20
management or administration and business model or technology platform changes, such as an evolution to accommodate mobile computing, virtual interface and multi-device functionality may also require corresponding changes in our systems, networks and data security measures. In addition, the increasing reliance on technology systems and networks and the occurrence and potential adverse impact of attacks on such systems and networks, both generally and in the financial services industry, have enhanced government and regulatory scrutiny of the measures taken by companies to protect against cyber-security threats. As these threats, and government and regulatory oversight of associated risks, continue to evolve, we may be required to expend additional resources to enhance or expand upon the security measures we currently maintain.
Despite the measures we have taken and may in the future take to address and mitigate cybersecurity and technology risks, we cannot assure that our systems and networks will not be subject to breaches or interference. Any such event may result in operational disruptions as well as unauthorized access to or the disclosure or loss of our proprietary information or our clients’ personal information, which in turn may result in legal claims, regulatory scrutiny and liability, reputational damage, the incurrence of costs to eliminate or mitigate further exposure, the loss of clients or advisors or other damage to our business. In addition, the trend toward broad consumer and general public notification of such incidents could exacerbate the harm to our business, financial condition or results of operations. Even if we successfully protect our technology infrastructure and the confidentiality of sensitive data, we may incur significant expenses in connection with our responses to any such attacks as well as the adoption and maintenance of appropriate security measures. We could also suffer harm to our business and reputation if attempted security breaches are broadly publicized. We cannot be certain that advances in criminal capabilities, discovery of new vulnerabilities, attempts to exploit vulnerabilities in our systems, data thefts, physical system or network break-ins or inappropriate access, or other developments will not compromise or breach the technology or other security measures protecting the networks and systems used in connection with our business.
Damage to our reputation could adversely affect our business.
We have developed our reputation through excellent client services, strong long-term risk-adjusted investment performance, comprehensive product offerings, superior distribution and a stalwart brand image. The Calamos name and brand are valuable assets and any damage to either could hamper our ability to attract and retain clients and employees, thereby having a material adverse effect on our revenues and net income. Risks to our reputation may include conflicts of interest, employee misconduct, litigation, regulatory issues and unsubstantiated accusations. Managing such matters may be expensive, time-consuming and difficult.
Improper disclosure of personal data could result in liability and harm our reputation.
We and our service providers store and process personal client information. Despite having implemented what we believe are appropriate security controls, training, and policies and procedures, these efforts may not prevent the improper disclosure of client information. Such disclosure could harm our reputation as well as subject us to liability, resulting in increased costs or loss of revenue.
Failure to comply with statutory and regulatory investment parameters, investment guidelines or instructions by our clients, and investment parameters established in our disclosure documents could result in damage awards which could adversely affect our business.
Our clients typically specify the investment guidelines or strategy, or provide instructions on the management of their portfolios that we are required to follow. We are required to invest fund assets in accordance with limitations under the Investment Company Act and applicable provisions of the Internal Revenue Code of 1986, as amended. We are also required to invest Calamos Global Fund assets in accordance with limitations under UCITS directives, various notices, guidance and policy statements adopted by the Republic of Ireland and the Irish Central Bank. Our failure to comply with these guidelines, limitations or instructions could result in losses to a client or an investor in a fund which, depending on the circumstances, could result in clients or fund investors: being made whole for such losses; seeking damages from us; or terminating their investment management agreements. Any of these events could harm our reputation and have a material adverse effect on our earnings.
Future sales of our Class A common stock in the public market could lower our stock price, and any additional capital raised by us through the sale of equity or convertible securities may dilute our stockholders’ ownership in us.
We may sell additional shares of Class A common stock in subsequent public offerings or issue convertible debt securities. The Calamos Interests own approximately 77.8% of Calamos Investments as of December 31, 2015, and can exchange all or portions of their ownership interests in Calamos Investments for shares of our Class A common stock. Subject to certain selling restrictions, the Calamos Interests could sell any or all of those shares in a registered public offering pursuant to a registration rights agreement. We cannot predict the size of future issuances of our Class A common stock or the effect, if any, on the market price of our Class A common stock. Sales or distributions of substantial amounts of our Class A common stock (including shares issued in connection
21
with an acquisition), or the perception that such sales could occur, may cause the market price of our Class A common stock to decline.
Our investment income may be negatively affected by fluctuation in our corporate investment portfolio resulting in a material adverse effect on our Company.
A substantial portion of our assets are invested in products which are subject to market risk. Fluctuations in investment income are expected to occur in the future but to a lesser magnitude when derivatives are used. Tangentially, our capital loss carryforwards resulting from losses generated from the sale of investment securities provide deferred tax assets, which are intangible assets with realization dependent on our ability to generate capital gains from securities owned within our corporate investment portfolio. If market conditions deteriorate and securities valuations are depressed for prolonged periods of time, the recoverability of these deferred tax assets may be adversely affected and become impaired.
Insurance coverage may be inadequate or not cover legal and regulatory proceedings.
In addition to civil litigation and arbitration, we are subject to regulatory inquiries and examinations which could result in substantial penalties and awards against us if the outcome is adverse. (See Part I, Item 3., Legal Proceedings, of this Annual Report on Form 10-K.) These types of proceedings have increased since the financial crisis of 2008 in the financial services industry and this trend of increased regulatory actions is expected to continue in the near future. We maintain insurance coverage in amounts and terms we believe appropriate for such matters although we cannot be certain that there will be adequate coverage, if at all; nor can we be certain that coverage will always be available. Finally, insurance premiums may rise for substantially the same coverage amounts and terms which will result in higher expenses and reduce our net income.
Expansion into international markets may increase operational, regulatory and other risks.
As we increase our international presence and expand our product offerings and international business activities, we face increased operational, regulatory, compliance, reputation and foreign exchange rate risks. The failure of our Company’s systems of internal
control to properly mitigate such additional risks, or of our operating infrastructure to support such international expansion, could result in operational failures and regulatory fines or sanctions.
Local regulatory environments may vary widely and place additional demands on our sales, legal and compliance personnel. Identifying and hiring well-qualified personnel and adopting policies, procedures and controls to address local or regional requirements require time and resources. Regulators in non-U.S. jurisdictions could also change their policies or laws in a manner that might restrict or otherwise impede our ability to offer our investment strategies in their respective markets. Any of these local requirements, activities or needs could increase the costs and expenses we incur in a specific jurisdiction without any corresponding increase in revenues and income from operating in the jurisdiction.
Our ability to operate our Company effectively could be impaired if we are unable to attract and retain qualified personnel.
Our investment management business depends on the expertise of our personnel and their ability to work together as an effective team. Our future success depends, to a substantial degree, on our ability to attract and retain qualified personnel. Competition for employees with the necessary qualifications is intense and we may not be successful in our efforts to recruit and retain the required personnel. We cannot guarantee that our compensation methods will allow us to recruit and retain the required personnel we need. We may be required to increase compensation, which would decrease our net income. In addition, loss of key investment management personnel any any resulting loss of clients may result in a decrease in our assets under management, as well as our revenues and profitability. The inability to recruit and retain qualified personnel could affect our ability to provide an acceptable level of service to our existing or future clients, which could have a material adverse effect on our business.
Catastrophic and unpredictable events could have a material adverse effect on our business.
A terrorist attack, war, power failure, cyber-attack, natural disaster, significant adverse climate change or other catastrophic or unpredictable event could adversely affect our future revenues, expenses and earnings by: interrupting our normal business operations; sustaining employee casualties, including loss of our key executives; requiring substantial expenditures and expenses to repair, replace and restore normal business operations; and reducing investor confidence.
We have a disaster recovery plan to address catastrophic and unpredictable events, but we cannot be assured that this plan will be sufficient in responding to or ameliorating the effects of all disaster scenarios. If our employees or vendors that we rely upon for support in a catastrophic event are unable to respond adequately or in a timely manner, we may lose clients resulting in a decrease in assets under management with a material adverse effect on revenues and net income.
22
Changes in tax laws and regulations as well as exposure to additional income tax liabilities could have a material adverse effect on our business.
We are subject to income taxes as well as non-income based taxes in both the United States and the United Kingdom. As such, we are subject to ongoing tax audits and the tax authorities may disagree with certain positions taken and assess additional taxes. We regularly evaluate the likely outcomes of these audits in order to determine the appropriateness of our tax provision and the related valuations of our deferred income tax assets. However, there can be no guarantee that we will accurately predict the outcomes of these audits which could have a material adverse impact on our net income, financial condition or liquidity. Changes in tax laws or tax rulings could materially impact our effective tax rate and the related valuations of our deferred income tax assets. Calamos Investments made an election under section 754 of the Internal Revenue Code of 1986, as amended (a “section 754 election”). As a result of the section 754 election, Calamos Investments increased our Company’s proportionate share of the tax basis of the assets of Calamos Investments to reflect the purchase price paid by our Company for its interest in Calamos Investments. The Internal Revenue Service completed its audit of Calamos Investments for its 2004 through 2006 tax years and 2008 through 2012 tax years. These audits and the respective tax years were closed with respect to the Company without an adjustment to the 754 election.
ITEM 1B. UNRESOLVED STAFF COMMENTS
None.
ITEM 2. PROPERTIES
Our principal executive offices are located at 2020 Calamos Court, Naperville, Illinois 60563, where we occupy approximately 153,000 square feet of space under lease agreements with subsidiaries of Calamos Property Holdings LLC, which is owned by Calamos Family Partners, Inc. Our New York office is at Rockefeller Center, 610 Fifth Avenue where we lease approximately 5,800 square feet of office space. We also lease approximately 4,000 square feet of office space in London at 62 Threadneedle Street.
ITEM 3. LEGAL PROCEEDINGS
Calamos Advisors has been named as a defendant in a complaint captioned Chill v. Calamos Advisors LLC, et al., which was filed in the United States District Court for the Southern District of New York on February 11, 2015 (the “Complaint”). The Complaint, which was filed by two shareholders of an open-end investment company advised by Calamos Advisors, also names as a defendant Calamos Financial Services (Calamos and Calamos Financial Services are referred to as the “Defendants”). The Complaint alleges that Calamos Advisors breached its fiduciary duty under Section 36(b) of the Investment Company Act with respect to its receipt of advisory fees paid by the open-end investment company, and that both Defendants breached fiduciary duties under Section 36(b) with respect to distribution and servicing fees paid by the open-end investment company. The Complaint requests relief (i) declaring that the Defendants violated Section 36(b) of the Investment Company Act, (ii) permanently enjoining the Defendants from further violating Section 36(b), (iii) awarding compensatory damages, including repayment of excessive investment advisory fees and distribution fees, (iv) rescinding such open-end investment company’s investment management agreement and distribution plan and (v) awarding reasonable costs from the Complaint. The Defendants believe that the Complaint is without merit, and intend to defend themselves vigorously against the allegations.
In the normal course of business, we are periodically involved in various legal proceedings and other regulatory matters. Currently, management does not believe that any such litigation or matters would have a material effect on our consolidated financial position or results of operations.
ITEM 4. MINE SAFETY DISCLOSURE
Not Applicable.
23
PART II
ITEM 5. MARKET FOR REGISTRANT’S COMMON EQUITY, RELATED STOCKHOLDER MATTERS AND ISSUER PURCHASES OF EQUITY SECURITIES
Our Class A common stock ($0.01 par value) trades on the NASDAQ Global Select Market under the symbol “CLMS”. There is no public market for our Class B common stock ($0.01 par value).
The high and low trade price information for Class A common stock and dividends per share for each class of common stock for 2015 and 2014 were:
Market Price Range | Cash Dividends per Share | ||||||||||||||||||||||
2015 | 2014 | 2015 | 2014 | ||||||||||||||||||||
High | Low | High | Low | ||||||||||||||||||||
First Quarter | $ | 13.70 | $ | 12.22 | $ | 13.69 | $ | 10.67 | $ | 0.15 | $ | 0.125 | |||||||||||
Second Quarter | $ | 13.61 | $ | 11.83 | $ | 13.63 | $ | 11.84 | $ | 0.15 | $ | 0.125 | |||||||||||
Third Quarter | $ | 12.66 | $ | 9.37 | $ | 13.90 | $ | 11.26 | $ | 0.15 | $ | 0.15 | |||||||||||
Fourth Quarter | $ | 10.18 | $ | 8.77 | $ | 14.44 | $ | 11.15 | $ | 0.15 | $ | 0.15 | |||||||||||
On February 26, 2016, there were approximately 61 holders of record of our outstanding Class A common stock and one holder of record of our outstanding Class B common stock. Shares of our Class A common stock are primarily held in “street name” through various brokers.
Calamos Asset Management, Inc. expects to declare and pay quarterly cash dividends during 2016. The Company paid a regular quarterly dividend of $0.15 per share on March 7, 2016 to shareholders of record on February 22, 2016.
Issuer Purchases of Equity Securities
On November 13, 2014, the Company announced a repurchase of up to an additional 3 million shares of the Company's outstanding Class A common stock primarily to continue to manage the dilution from share issuances under the Company's incentive compensation plan. Common stock purchased under the share repurchase program are by Calamos Investments and not directly for the individual, personal accounts of John P. Calamos, Sr. The following table summarizes information with respect to purchases made by or on behalf of the Company of shares of its common stock for the quarter ended December 31, 2015.
(a) Total Number of Shares Purchased | (b) Average Price Paid Per Share | (c) Total Number of Shares Purchased as Part of Publicly Announced Plans or Programs | (d) Maximum Number of Shares that May be Purchased Under the Plans or Programs | ||||||||||
November 1 - November 30, 2015 | 109,916 | $ | 9.19 | 109,916 | 1,834,559 | ||||||||
December 1 - December 31, 2015 | 243,721 | $ | 9.34 | 243,721 | 1,590,838 | ||||||||
Total | 353,637 | 353,637 | |||||||||||
24
The following graph compares the percentage change in cumulative shareholder return on our Company’s common stock with the Standard & Poor’s 500 Index and SNL Asset Manager Index since December 31, 2010 (assuming a $100 investment on December 31, 2010, and the reinvestment of any dividends).
Performance Graph
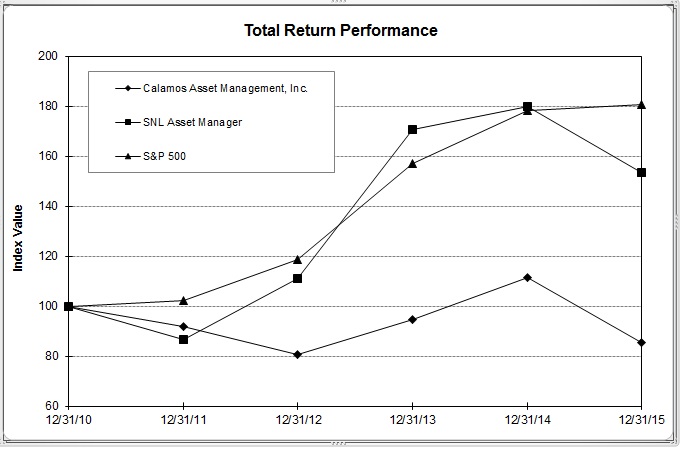
Period Ending | ||||||||||||||||||
Index | 12/31/10 | 12/31/11 | 12/31/12 | 12/31/13 | 12/31/14 | 12/31/15 | ||||||||||||
Calamos Asset Management, Inc. | 100.00 | 91.87 | 80.58 | 94.69 | 111.41 | 85.35 | ||||||||||||
SNL Asset Manager1 | 100.00 | 86.50 | 110.97 | 170.54 | 179.91 | 153.43 | ||||||||||||
S&P 500 | 100.00 | 102.11 | 118.45 | 156.82 | 178.28 | 180.75 | ||||||||||||
(1) | The SNL asset manager index is comprised of the securities of 44 publicly traded asset management companies. |
Other Information - Market Capitalization
Calamos Investments is owned (a) 22.2% by CAM, and (b) 77.8% by Calamos Interests. As of December 31, 2015, CAM holds two groups of assets: (1) CAM’s 22.2% ownership interest in Calamos Investments and (2) primarily cash and cash equivalents, investment securities, income tax receivables, net deferred tax assets, and a loan receivable from Calamos Investments. CAM presents the entire operations of Calamos Investments with its own in the consolidated financial statements. Calamos Interests’ 77.8% ownership in Calamos Investments is presented as a non-controlling interest in the consolidated financial statements. Prior to March 1, 2009, we added approximately 77 million shares to the Class A common shares outstanding to our fully diluted share count so that the total would reflect Calamos Interests’ ownership in Calamos Investments, which were convertible on a one-to-one basis into shares of Class A common stock. The resulting share count of approximately 97 million provided a reasonable proxy for the number of shares used in determining the market capitalization of the fully consolidated company.
During 2009, CAM’s certificate of incorporation was amended to provide that ownership in Calamos Investments is exchangeable into Class A shares of CAM on a fair value basis rather than a one-to-one basis, as previously structured. As a result, the reported
25
market capitalization of CAM only reflects CAM’s 22.2% interest in Calamos Investments, rather than the full value of Calamos Investments.
ITEM 6. SELECTED FINANCIAL DATA
The selected consolidated financial data presented below has been derived in part from, and should be read in conjunction with, Item 7., Management’s Discussion and Analysis of Financial Condition and Results of Operations and the audited consolidated financial statements in Item 8., Financial Statements and Supplemental Data included in this Form 10-K. Prior year data reflects certain reclassifications to conform to the current year presentation.
Year Ended December 31, | |||||||||||||||||||
(in thousands, except share data) | 2015 | 2014 | 2013 | 2012 | 2011 | ||||||||||||||
Income Statement Data: | |||||||||||||||||||
Revenues | |||||||||||||||||||
Investment management fees | $ | 186,826 | $ | 198,539 | $ | 212,398 | $ | 255,823 | $ | 266,553 | |||||||||
Distribution and underwriting fees | 41,583 | 49,764 | 54,068 | 67,816 | 82,539 | ||||||||||||||
Other | 2,471 | 2,659 | 2,664 | 3,037 | 3,229 | ||||||||||||||
Total revenues | 230,880 | 250,962 | 269,130 | 326,676 | 352,321 | ||||||||||||||
Operating expenses | |||||||||||||||||||
Employee compensation and benefits | 93,295 | 86,054 | 85,551 | 82,154 | 80,160 | ||||||||||||||
Distribution expenses | 40,845 | 48,432 | 53,082 | 65,027 | 75,510 | ||||||||||||||
Marketing and sales promotion | 26,189 | 16,128 | 15,728 | 19,503 | 17,107 | ||||||||||||||
General and administrative | 40,212 | 39,158 | 36,883 | 40,188 | 39,195 | ||||||||||||||
Total operating expenses | 200,541 | 189,772 | 191,244 | 206,872 | 211,972 | ||||||||||||||
Operating income | 30,339 | 61,190 | 77,886 | 119,804 | 140,349 | ||||||||||||||
Non-operating income (loss) | (6,618 | ) | 15,404 | 29,675 | 21,205 | 16,059 | |||||||||||||
Income before income tax provision | 23,721 | 76,594 | 107,561 | 141,009 | 156,408 | ||||||||||||||
Income tax provision | 2,320 | 5,787 | 6,262 | 12,568 | 18,497 | ||||||||||||||
Net income | 21,401 | 70,807 | 101,299 | 128,441 | 137,911 | ||||||||||||||
Net income attributable to non-controlling interest in Calamos Investments LLC | (16,100 | ) | (54,336 | ) | (80,169 | ) | (108,813 | ) | (122,501 | ) | |||||||||
Net (income) loss attributable to redeemable non- controlling interest in partnership investments | (1,974 | ) | (2,941 | ) | (2,502 | ) | (1,436 | ) | 460 | ||||||||||
Net income attributable to Calamos Asset Management, Inc. | $ | 3,327 | $ | 13,530 | $ | 18,628 | $ | 18,192 | $ | 15,870 | |||||||||
Earnings (loss) per share: | |||||||||||||||||||
Basic | $ | 0.19 | $ | 0.74 | $ | 0.94 | $ | 0.89 | $ | 0.79 | |||||||||
Diluted (1) | $ | 0.18 | $ | 0.71 | $ | 0.92 | $ | 0.88 | $ | 0.77 | |||||||||
Weighted average shares outstanding | |||||||||||||||||||
Basic | 17,518,033 | 18,275,246 | 19,903,507 | 20,334,299 | 20,103,758 | ||||||||||||||
Diluted (1) | 18,245,109 | 18,989,281 | 20,351,603 | 20,745,922 | 20,611,909 | ||||||||||||||
Cash dividends declared per share | $ | 0.60 | $ | 0.55 | $ | 0.50 | $ | 0.41 | $ | 0.38 | |||||||||
26
As of December 31, | |||||||||||||||||||
2015 | 2014 | 2013 | 2012 | 2011 | |||||||||||||||
Balance Sheet Data (in thousands): | |||||||||||||||||||
Cash and cash equivalents | $ | 104,717 | $ | 35,285 | $ | 39,078 | $ | 106,796 | $ | 102,166 | |||||||||
Investment securities | 257,057 | 339,959 | 472,241 | 349,404 | 318,496 | ||||||||||||||
Partnership investments | 112,640 | 143,723 | 46,425 | 67,313 | 33,183 | ||||||||||||||
Total assets | 561,462 | 607,156 | 658,244 | 639,086 | 581,985 | ||||||||||||||
Liabilities of partnership investments | 75 | 10,117 | 12,378 | 6,485 | 127 | ||||||||||||||
Long-term debt, including current portion | 45,955 | 45,955 | 92,115 | 92,115 | 92,115 | ||||||||||||||
Total liabilities | 105,068 | 109,070 | 159,762 | 157,237 | 154,191 | ||||||||||||||
Redeemable non-controlling interest in partnership investments | 77,835 | 76,167 | 7,551 | 20,412 | 12,034 | ||||||||||||||
Calamos Asset Management, Inc. stockholders’ equity | 193,730 | 204,937 | 208,056 | 197,643 | 186,592 | ||||||||||||||
Non-controlling interest in Calamos Investments LLC (Calamos Interests) | 184,829 | 216,982 | 282,875 | 263,794 | 229,168 | ||||||||||||||
Total equity | 378,559 | 421,919 | 490,931 | 461,437 | 415,760 | ||||||||||||||
Assets Under Management(2) (in millions): | |||||||||||||||||||
Funds | 18,518 | 21,001 | 22,394 | 23,329 | 25,045 | ||||||||||||||
Separate accounts | 3,390 | 2,505 | 4,149 | 6,326 | 7,732 | ||||||||||||||
Total assets under management(2) | $ | 21,908 | $ | 23,506 | $ | 26,543 | $ | 29,655 | $ | 32,777 | |||||||||
___________________________________
(1) | Diluted shares outstanding are calculated (a) assuming the Calamos Interests exchanged all of their membership units in Calamos Investments LLC for shares of Calamos Asset Management, Inc.’s Class A common stock on a one-for-one basis and (b) including the effect of outstanding restricted stock unit and options awards. In 2009, the ownership structure was de-unitized and the exchange, described above, is now based on a fair value approach which results in the same or fewer shares of Class A common stock being issued at the time of exchange. The effects of the exchange are anti-dilutive and are therefore excluded from the calculation of diluted weighted average shares outstanding for 2011 through 2015. |
(2) | Assets under management exclude assets under advisement for which we provide model portfolio design and oversight. |
ITEM 7. MANAGEMENT’S DISCUSSION AND ANALYSIS OF FINANCIAL CONDITION AND RESULTS OF OPERATIONS
We provide investment advisory services to institutions and individuals, managing $21.9 billion in client assets as of December 31, 2015 through a variety of investment products designed to suit their investment needs. Assets under management do not include assets under advisement of $609 million and $733 million as of December 31, 2015 and December 31, 2014, respectively, for which the Company provides model portfolio design and oversight.
27
Assets Under Management
Our operating results fluctuate primarily due to changes in the total value and composition of our assets under management and with our ability to manage variable expenses. The following table details our assets under management, based on the four investment product types we offer in the funds and separate account categories, as of December 31, 2015, 2014 and 2013.
(in millions) | 2015 | 2014 | 2013 | ||||||||
Funds | |||||||||||
Open-end funds | $ | 12,172 | $ | 14,790 | $ | 16,128 | |||||
Closed-end funds | 6,346 | 6,211 | 6,266 | ||||||||
Total funds | 18,518 | 21,001 | 22,394 | ||||||||
Separate Accounts | |||||||||||
Institutional accounts | 2,309 | 1,576 | 3,081 | ||||||||
Managed accounts | 1,081 | 929 | 1,068 | ||||||||
Total separate accounts | 3,390 | 2,505 | 4,149 | ||||||||
Total assets under management | $ | 21,908 | $ | 23,506 | $ | 26,543 | |||||
In order to increase our assets under management and expand our business, we must develop and market investment products and strategies that suit the investment needs of our target clients — investors seeking superior, risk-adjusted returns over the long-term. The value and composition of our assets under management and our ability to continue to attract and retain clients will depend on a variety of factors, including, among others:
• | sales and redemptions of shares of the open-end funds and other investment products; |
• | the amount of distributed and reinvested capital gains and income; |
• | fluctuations in the global financial markets and the valuations of securities that result in appreciation or depreciation of assets; |
• | the use of leverage within the closed-end funds; |
• | our ability to educate our target clients about our investment philosophy and provide them with best-in-class service; |
• | the relative investment performance and volatility of our investment products as compared to competing offerings and market indices; |
• | competitive conditions in the asset management and broader financial services sectors; |
• | investor sentiment and confidence; and |
• | our introduction of new investment strategies and products, and our decision to close and re-open strategies when deemed in the best interests of our clients. |
Investment Products
Funds
Funds include our open-end and closed-end funds, which are commingled investment vehicles registered under the Investment Company Act, our Dublin, Ireland-domiciled Calamos Global Funds, PLC, also referred to as offshore funds, as well as our ETF.
Open-End Funds. Open-end funds are continually offered and are not listed on an exchange, except the ETF. Open-end funds issue new shares for sale and redeem shares from shareholders who sell. The share price for sales and redemptions of open-end funds is determined by each fund’s net asset value, which is calculated at the end of each business day. Assets in open-end funds vary as a result of both market appreciation and depreciation and the level of new sales or redemptions of shares of a fund. Investment management fees, including performance-based fees, are our principal source of revenue from open-end funds and are primarily derived from assets under management. We offer several share classes in each open-end fund to provide investors with alternatives to pay for commissions, distribution and service fees.
Closed-End Funds. Closed-end funds typically sell a finite number of shares to investors through underwritten public offerings. After the public offerings, investors buy closed-end fund shares from, and sell those shares to, other investors through an exchange or broker-dealer market. All of the closed-end funds that we manage currently use leverage which increases their total assets. Assets in closed-end funds vary due to the amount of assets raised in underwritten public offerings, the amount of leverage utilized
28
and market appreciation or depreciation. Our revenues from closed-end funds are derived from the investment management fees on the assets that we manage. In addition, in a typical underwritten public offering, investors are charged a commission by the selling firms. We do not receive or pay commissions in connection with sales of closed-end fund shares, although we may pay asset-based distribution and service fees, as well as one-time distribution and service fees to underwriters for underwriting public offerings of closed-end funds.
Separate Accounts
Separate accounts include institutional accounts and managed accounts for high net worth investors. Flows into and out of such accounts, which we refer to as sales and redemptions, affect our level of assets under management. Assets under management from these accounts also vary as a result of market appreciation and depreciation. Our revenues from separate accounts are derived from investment management fees that we charge, including performance-based fees where applicable. Provided below is a brief differentiation of these accounts:
• | Institutional accounts are separately managed accounts for institutional investors, such as public and private pension funds, public funds, endowment funds and private investment funds. Institutional accounts also include sub-advised portfolios, such as registered investment companies, where we act as investment advisor but for which we have limited or no distribution responsibilities. Institutional accounts are typically offered directly by us through institutional consultants and through national and regional broker-dealers. |
• | Managed accounts are separately managed accounts for high net worth investors offered primarily through national and regional broker-dealers. |
Revenues
Investment Management Fees
Our revenues are substantially comprised of investment management fees earned under contracts with the funds and separate accounts managed by us and for which we provide model portfolio design and oversight. The distribution of assets under management among our investment products has an impact on our investment management fees, as some products carry different fees than others. Investment management fees may fluctuate based on a number of factors, including the following:
• | total value and composition of our assets under management; |
• | the amount of cash paid for capital gain and income distributions; |
• | market appreciation or depreciation; |
• | the use of leverage within our closed-end products; |
• | relative investment performance and volatility of our investment products and strategies compared to benchmarks and competitors; |
• | level of net sales and redemptions, which represent the sum of new client assets, additional funding from existing clients, withdrawals of assets from and termination of client accounts, and sales and redemptions of open-end fund shares; |
• | a determination by the independent trustees of the funds to terminate or significantly alter the funds’ investment management agreements with us; and |
• | increased competition. |
Investment management fees that we receive from funds for which we act as investment advisor are computed monthly on an average daily net asset value basis. Investment management fees that we earn on separate accounts for which we act as investment advisor and for which we provide model portfolio design and oversight are generally computed quarterly, either in advance or in arrears, based on the average assets under management or assets under management at the beginning or end of the quarterly period. We recognize the revenues derived from these fees over the period during which we render investment advisory services.
Distribution and Underwriting Fees
Our revenues also are comprised of distribution and underwriting fees. Distribution and underwriting fees include (1) asset-based distribution and/or service fees received pursuant to Rule 12b-1 plans, (2) front-end sales charges and (3) contingent deferred sales charges. Asset-based distribution and/or service fees received pursuant to Rule 12b-1 plans, discussed below, are a significant
29
component of distribution and underwriting fees. Distribution and underwriting fees may fluctuate based on a number of factors, including the following:
• | total value of our assets under management; |
• | total composition of our assets under management by share class; |
• | market appreciation or depreciation; and |
• | the level of sales and redemptions. |
Rule 12b-1 distribution and/or service fees are asset-based fees that the open-end funds pay us over time pursuant to distribution plans adopted under provisions of Rule 12b-1 of the Investment Company Act. These fees are typically calculated as a percentage of average daily net assets in specific share classes of the open-end funds. These fees fluctuate with both the level of average daily net assets and the relative mix of assets among share classes. Rule 12b-1 fees are generally offset by distribution and service expenses paid during the period, as well as the amortization of deferred sales commissions previously paid by us to third parties.
We earn front-end sales charges on the sale of Class A shares of open-end funds, which provide for a sales charge at the time of investment. We retain a portion of the applicable sales charge and record as underwriting revenue only the portion that we retain. We retain the entire sales charge earned on accounts where Calamos Financial Services acts as the broker-dealer. Sales charges are waived on sales to shareholders or intermediaries that exceed specified minimum dollar amounts and other specified conditions. Sales charges fluctuate with both the level of Class A share sales and the mix of Class A shares offered with and without a sales charge.
Other Revenues
Other revenues consist primarily of portfolio accounting fees, which are contractual payments calculated as a percentage of combined assets of the funds for financial accounting services, such as managing expenses and expense payment processing; monitoring the calculation of expense accrual amounts; calculating, tracking and reporting tax adjustments on all assets; and monitoring trustee deferred compensation plan accruals and valuations. The fees were calculated based on the average daily assets of the open-end funds and the average weekly managed assets of the closed-end funds.
Operating Expenses
Our operating expenses consist of employee compensation and benefits, distribution expenses, marketing and sales promotion expenses, and general and administrative expenses. These expenses fluctuate due to a number of factors, including but not limited to, the following:
• | variations in the level of total compensation expense due to, among other things, incentive compensation, changes in our employee count and mix and competitive factors; |
• | changes in distribution expense as a result of fluctuations in open-end fund sales and level of redemptions; |
• | market appreciation or depreciation of assets under management which will directly impact distribution expenses; |
• | the amount of Rule 12b-1 distribution and/or service fees that we receive, as well as our continued ability to receive those fees in the future, which would affect the amortization expenses associated with the receipt of these fees; |
• | changes in the level of our marketing and promotion expenses in response to market conditions, including our efforts to further penetrate and support new and existing distribution channels and clients; and |
• | expenses and capital costs, such as technology assets, professional services, depreciation, and research and development, incurred to maintain and enhance our administrative and operating services infrastructure. |
Employee Compensation and Benefits
Employee compensation and benefits expense includes salaries, incentive compensation and related benefits costs. Employee compensation and benefits are benchmarked against the competitive market landscape, including industry compensation standards. In order to attract and retain qualified personnel, we must maintain competitive employee compensation and benefits. In normal circumstances, we expect to experience a general rise in employee compensation and benefits expenses over the long term.
We use a fair value method in recording compensation expense for restricted stock units and stock options granted under our incentive stock plan. Under the fair value method, compensation expense is measured at the grant date based on the estimated fair
30
value of the award and is recognized as an expense over the vesting period. Fair value is determined on the date granted using the Black-Scholes option pricing model for the stock options and is determined by the market value of the underlying stock for restricted stock units.
Distribution Expenses
Distribution expenses include payments that we make to broker-dealers and other intermediaries for selling, underwriting, servicing and administering open-end funds. This expense is influenced by new open-end funds sales, levels of redemptions and market appreciation or depreciation of assets under management in these products. This expense is comprised of Rule 12b-1 distribution and/or service fee payments to the selling firms.
Other Operating Expenses
Other operating expenses include marketing and sales promotion expenses and general and administrative expenses. Marketing and sales promotion expenses generally vary based on the type and level of marketing, educational, sales or other programs in operation and include closed-end fund marketing costs and ongoing and one-time payments to broker-dealers. In addition, as the open-end funds that we manage grow in size, we become subject to supplemental compensation payments to third-party selling agents, which are a component of marketing and sales promotion expense. We expect supplemental compensation payments to fluctuate with changes in assets under management. In connection with closed-end funds, we make fee payments to certain underwriters for distribution, consulting and/or support services rendered during or after the offering period of each closed-end fund. These fees are based on contractual agreements with underwriting firms and may be paid over time based on the average daily net assets of such funds or at the close of the offering period based on the amount of assets raised during the offering.
General and administrative expenses primarily include occupancy-related costs, depreciation and professional and business services. These expenses generally fluctuate in relative proportion to the number of associates employed by us and the overall size and scale of our business operations.
Impact of Distribution and Underwriting Activities
In order to grow assets under management, we engage in distribution and underwriting activities, principally with respect to our family of open-end funds. When analyzing our business, we consider the result of these distribution activities on a net revenue basis as they are typically a result of a single open-end fund share purchase. Generally accepted accounting principles in the United States (GAAP) requires that we present these activities on a gross revenue basis, thus resulting in a reduction to our overall operating margin, as the margin on distribution activities is generally lower than the margins on the remainder of our business. While we do not adjust our margin for these activities on a net revenue basis, we believe the margin table below is useful to understanding the impact of distribution activities on our margin.
The following table summarizes the net distribution fee margin for the years ended December 31, 2015, 2014 and 2013:
(in thousands) | 2015 | 2014 | 2013 | ||||||||
Distribution and underwriting fees | $ | 41,583 | $ | 49,764 | $ | 54,068 | |||||
Distribution expenses | (40,845 | ) | (48,432 | ) | (53,082 | ) | |||||
Net distribution fees | $ | 738 | $ | 1,332 | $ | 986 | |||||
Net distribution fee margin | 2 | % | 3 | % | 2 | % | |||||
The net distribution fee margin varies by share class so the mix of sales and assets by share class affects the overall net distribution fee margin. The change in the net distribution fee margin is primarily due to the rate of the decline in revenue in all share classes and contingent deferred sales charge revenues, compared with the decline in distribution expenses and amortization of deferred sales commissions.
Class A shares represented $4.5 billion of our U.S. clients’ assets under management as of December 31, 2015. These shares provide for a front-end sales charge at the time of investment. For the year ended December 31, 2015, we received Class A share fees of $12.8 million. For the same period, we made Class A share payments to selling firms of $12.7 million. Class B shares represented $38.7 million of our U.S. clients’ assets under management as of December 31, 2015. For the year ended December 31, 2015, we received Class B share fees of $569,000. For the same period, we made Class B share payments to selling firms of $129,000. Class C shares represented $2.4 billion of our U.S. clients’ assets under management as of December 31, 2015. For the year ended December 31, 2015, we received Class C share fees of $27.0 million. For the same period, we made Class C share payments to selling firms of $25.4 million.
31
Non-operating Income
Non-operating income primarily represents net investment gains and losses from a portion of our investment portfolio and from the limited partnerships that we consolidate. Capital gain distributions, dividends, net interest income or expense, and other-than-temporary impairment charges on available-for-sale securities, if any, are also included in non-operating income.
Non-controlling Interest
Non-controlling Interest in Calamos Investments LLC
As sole manager of Calamos Investments, we consolidate the financial results of Calamos Investments with our own results. Outstanding shares of our Class A common stock represent 22.2% as of December 31, 2015, 2014, and 2013, of the ownership of Calamos Investments. We reflect Calamos Interests’ collective ownership in Calamos Investments of 77.8% as of December 31, 2015, 2014, and 2013, and as a non-controlling interest in our consolidated statements of financial condition, operations and changes in stockholders’ equity.
Non-controlling interest in Calamos Investments is derived by multiplying the historical equity of Calamos Investments by Calamos Interests' collective ownership direct percentage for the periods presented. Issuances and repurchases by CAM of our Class A common stock may result in changes to CAM's ownership percentage and to the non-controlling interests’ ownership percentage of Calamos Investments. The corresponding changes in ownership are reflected in the consolidated statements of changes in equity.
Income is allocated to non-controlling interests based on the average ownership interest during the period in which the income is earned. As a result, our income before income tax provision, excluding Calamos Interests' non-controlling interest, includes 22.2% for the years ended December 31, 2015, 2014, and 2013, of Calamos Investments’ net income. Income before income tax provision includes income on cash and cash equivalents and investment securities held solely by CAM during the same period. This investment income is not reduced by non-controlling interest; therefore, the resulting non-controlling interest as presented in the statement of operations differs slightly than their corresponding ownership percentage.
Redeemable Non-controlling Interest in Partnership Investments
Calamos Investments, through its wholly owned subsidiaries and affiliates, indirectly controls the operations of Calamos Global Opportunities Fund LP, for which it acquired a majority interest in the partnership during the second quarter of 2014. This partnership is consolidated into our consolidated financial statements for the years ended December 31, 2015 and 2014.
Calamos Advisors, a subsidiary of Calamos Investments, was the general partner and indirectly controlled the operations of Calamos Arista Strategic Fund LP, a U.S. feeder fund and Calamos Arista Strategic Fund Ltd, an offshore feeder fund both to Calamos Arista Strategic Master Fund LTD, a hedge fund in the Cayman Islands. This partnership was consolidated into our consolidated financial statements until it was liquidated on December 26, 2014. The partnership redemptions occurred in January 2015, therefore, the amount due to non-controlling interest related to this partnership investment is presented in liabilities of partnership investments in our consolidated statements of financial condition for the year ended December 31, 2014.
The combined interests of the partnerships, not owned by us, are presented as redeemable non-controlling interest in partnership investments in temporary equity in our consolidated financial statements for the periods those partnerships were consolidated.
Income Taxes
For the years ended December 31, 2015, 2014 and 2013, our effective tax rate was 40.6%, 29.3% and 25.0%, respectively. The December 31, 2015 effective tax rate includes the impact of a partial reversal in the deferred tax valuation allowance of $156,000 as a result of capital gains realized in 2014 as a provision to income tax return true-ups. The partial reversal of the deferred tax valuation allowance decreases our effective tax rate in 2015 by 2.8%. The December 31, 2014 effective tax rate included the impact of a decrease in the deferred tax valuation allowance of $2.0 million as a result of capital gains realized in 2014 from the corporate investment portfolio that was attributable to CAM. The partial reversal of the deferred tax valuation allowance decreased our effective tax rate in 2014 by 10.4%. As of December 31, 2015 and 2014, there was no valuation allowance. The December 31, 2013 effective tax rate included the impact of a net decrease in the deferred tax valuation allowance of $3.0 million as a result of capital gains realized in 2013 from the corporate investment portfolio that was attributable to CAM. The partial reversal of the deferred tax valuation allowance decreased our effective tax rate in 2013 by 12.2%. As of December 31, 2013, the balance in the valuation allowance totaled $2.1 million. The ultimate realization of this deferred tax asset is dependent upon the generation of sufficient capital gains prior to the expiration of capital loss carryforwards in 2017 and 2020.
32
Operating Results
Year Ended December 31, 2015 Compared with Year Ended December 31, 2014
Assets Under Management
Assets under management decreased by $1.6 billion, or 7%, to $21.9 billion at December 31, 2015 from $23.5 billion at December 31, 2014. Average assets under management decreased by $1.6 billion, or 6%, to $23.7 billion for the year ended December 31, 2015 from $25.3 billion for the year ended December 31, 2014. As of December 31, 2015, assets under management consisted of 85% funds, and 15% separate accounts. As of December 31, 2014, assets under management consisted of 89% funds and 11% separate accounts.
Change | |||||||||||||
(in millions) | 2015 | 2014 | Amount | Percent | |||||||||
Open-end Funds | |||||||||||||
Beginning assets under management | $ | 14,790 | $ | 16,128 | $ | (1,338 | ) | (8)% | |||||
Sales | 2,706 | 4,729 | (2,023 | ) | (43) | ||||||||
Redemptions | (5,305 | ) | (6,446 | ) | 1,141 | 18 | |||||||
Market appreciation (depreciation) | (19 | ) | 379 | (398 | ) | * | |||||||
Ending assets under management | 12,172 | 14,790 | (2,618 | ) | (18) | ||||||||
Average assets under management | 13,706 | 15,721 | (2,015 | ) | (13) | ||||||||
Closed-end Funds | |||||||||||||
Beginning assets under management | 6,211 | 6,266 | (55 | ) | (1) | ||||||||
Sales | 805 | 64 | 741 | * | |||||||||
Redemptions | (60 | ) | — | (60 | ) | * | |||||||
Market depreciation | (610 | ) | (119 | ) | (491 | ) | * | ||||||
Ending assets under management | 6,346 | 6,211 | 135 | 2 | |||||||||
Average assets under management | 6,650 | 6,332 | 318 | 5 | |||||||||
Institutional Accounts | |||||||||||||
Beginning assets under management | 1,576 | 3,081 | (1,505 | ) | (49) | ||||||||
Sales | 1,445 | 220 | 1,225 | * | |||||||||
Redemptions | (712 | ) | (1,869 | ) | 1,157 | 62 | |||||||
Market appreciation | — | 144 | (144 | ) | (100) | ||||||||
Ending assets under management | 2,309 | 1,576 | 733 | 47 | |||||||||
Average assets under management | 2,314 | 2,269 | 45 | 2 | |||||||||
Managed Accounts | |||||||||||||
Beginning assets under management | 929 | 1,068 | (139 | ) | (13) | ||||||||
Sales | 289 | 84 | 205 | * | |||||||||
Redemptions | (170 | ) | (280 | ) | 110 | 39 | |||||||
Market appreciation | 33 | 57 | (24 | ) | (42) | ||||||||
Ending assets under management | 1,081 | 929 | 152 | 16 | |||||||||
Average assets under management | 1,007 | 978 | 29 | 3 | |||||||||
Total Assets Under Management | |||||||||||||
Beginning assets under management | 23,506 | 26,543 | (3,037 | ) | (11) | ||||||||
Sales | 5,245 | 5,097 | 148 | 3 | |||||||||
Redemptions | (6,247 | ) | (8,595 | ) | 2,348 | 27 | |||||||
Market appreciation (depreciation) | (596 | ) | 461 | (1,057 | ) | * | |||||||
Ending assets under management | 21,908 | 23,506 | (1,598 | ) | (7) | ||||||||
Average assets under management | $ | 23,677 | $ | 25,300 | $ | (1,623 | ) | (6)% | |||||
________________
* Not meaningful
33
Fund sales in 2015 were primarily due to our alternative, multi-strategy (closed-end funds), U.S. equity, and global equity strategies(1), but were not sufficient to overcome the aggregate redemptions in our U.S. equity, alternative and global equity strategies. Net redemptions in our funds were $1.9 billion in 2015 and represent an unfavorable change of $201 million from redemptions of $1.7 billion in 2014. The decrease in market values negatively impacted our funds by $629 million during 2015 compared with market appreciation of $260 million during 2014.
Separate accounts, which represent managed accounts for both institutions and individuals, combined net sales were $852 million during 2015, compared with net redemptions of $1.8 billion in 2014. The increase during 2015 in our institutional accounts was due to net sales of $733 million that were partially offset by depreciation of $263,000. Institutional net sales were primarily from U.S. equity strategies and were $2.4 billion favorable to net redemptions of $1.6 billion in 2014. Institutional account appreciation was $144 million in 2014. Managed account net sales of $119 million represent a favorable change of $315 million from net sales of $196 million in 2014 and appreciation of $33 million in 2015 was a decrease of $24 million in appreciation in 2014.
(1) Prior period assets by strategy have been reclassified.
Financial Review
Revenues
Total revenues decreased by $20.1 million, or 8%, to $230.9 million for the year ended December 31, 2015 from $251.0 million for the prior year. The decrease was primarily due to lower investment management fees, and distribution and underwriting fees.
Change | ||||||||||||||
(in thousands) | 2015 | 2014 | Amount | Percent | ||||||||||
Investment management fees | $ | 186,826 | $ | 198,539 | $ | (11,713 | ) | (6 | )% | |||||
Distribution and underwriting fees | 41,583 | 49,764 | (8,181 | ) | (16 | )% | ||||||||
Other | 2,471 | 2,659 | (188 | ) | (7 | )% | ||||||||
Total revenues | $ | 230,880 | $ | 250,962 | $ | (20,082 | ) | (8 | )% | |||||
Investment management fees decreased by 6% for the year ended December 31, 2015, as our average assets under management decreased by $1.6 billion, or 6%, during the year. Investment management fees from open-end funds decreased by 12% to $105.4 million for the year ended December 31, 2015 from $120.3 million for the prior year, driven by a 13% decrease in average open-end fund assets. Investment management fees from our closed-end funds increased by 6% to $61.3 million for the year ended December 31, 2015 from $57.9 million for the prior year period, due to a 5% increase in average closed-end fund assets. Investment management fees from our separately managed accounts increased by 1% to $18.2 million for the year ended December 31, 2015 from $18.0 million in the prior year, due to a 2% increase in average separately managed accounts assets under management. Investment management fees that we earned as a percentage of average assets under management for the years ended December 31, 2015 and 2014 were 0.78%. Investment management fees from assets under advisement for which we provide model portfolio design and oversight were $2.0 million for the year ended December 31, 2015, compared with $2.3 million in the prior year. Investment management fees that we earned as a percentage of assets under advisement for the years ended December 31, 2015 and 2014 were 0.30%.
Distribution and underwriting fees decreased by 16%, or $8.2 million to $41.6 million for the year ended December 31, 2015. The decrease was primarily due to a shift in open-end fund assets from Class A, B and C shares to Class I shares. More open-end fund investors are choosing to compensate their financial advisors through fee-based models, increasing the demand for and a shift towards Class I shares. Because we do not collect distribution fees from Class I shares, our distribution revenue has decreased with this shift in assets. For 2015, average open-end fund assets decreased by 13% across most share classes compared with the prior year. The decrease in average open-end fund assets when compared with the prior year is largely due to net redemptions in our U.S. equity, alternative, and global equity strategies.
Other revenue principally reflects asset-based portfolio accounting fees. Other revenue was $2.5 million, compared with $2.7 million in the prior year. Portfolio accounting fees generally rise and fall with the changes in average fund assets that we manage.
Operating Expenses
Operating expenses increased by 6% to $200.5 million for the year ended December 31, 2015 from $189.8 million for the prior year. This change reflects increases in marketing and sales promotion expenses, employee compensation and benefits expenses and general and administrative expenses, partially offset by a decrease in distribution expenses.
34
Change | ||||||||||||||
(in thousands) | 2015 | 2014 | Amount | Percent | ||||||||||
Employee compensation and benefits | $ | 93,295 | $ | 86,054 | $ | 7,241 | 8 | % | ||||||
Distribution expenses | 40,845 | 48,432 | (7,587 | ) | (16 | )% | ||||||||
Marketing and sales promotion | 26,189 | 16,128 | 10,061 | 62 | % | |||||||||
General and administrative | 40,212 | 39,158 | 1,054 | 3 | % | |||||||||
Total operating expenses | $ | 200,541 | $ | 189,772 | $ | 10,769 | 6 | % | ||||||
Employee compensation and benefits expenses increased by $7.2 million, or 8%, for the year ended December 31, 2015. The increase in 2015 was primarily due to increases in base salaries and related benefits and incentive compensation expenses. The increase in base salaries and related benefits was primarily due to the impact of transition costs related to the departure of certain personnel. The increase in incentive compensation expense was primarily due to the launch of a new closed-end fund in the first quarter of 2015.
Distribution expenses decreased by $7.6 million, or 16% for the year ended December 31, 2015. The decrease was primarily due to a shift of average open-end fund assets to Class I shares which do not result in distribution expenses.
Marketing and sales promotion expenses increased by $10.1 million for the year ended December 31, 2015, the result of the launch of a new closed-end fund in the first quarter of 2015.
General and administrative expenses increased by $1.1 million for the year ended December 31, 2015. The increase in 2015 was primarily due to higher professional services expenses.
Non-Operating Activities, Net of Redeemable Non-controlling Interest in Partnership Investments
Non-operating income (loss), net of redeemable non-controlling interest in partnership investments decreased by $21.1 million to a loss of $8.6 million for the year ended December 31, 2015, compared with a gain of $12.5 million for the prior year.
(in thousands) | 2015 | 2014 | Change | ||||||||
Interest income | $ | 199 | $ | 160 | $ | 39 | |||||
Interest expense | (3,070 | ) | (4,669 | ) | 1,599 | ||||||
Net interest expense | (2,871 | ) | (4,509 | ) | 1,638 | ||||||
Investment income (loss) | (5,513 | ) | 17,585 | (23,098 | ) | ||||||
Dividend income | 1,589 | 1,987 | (398 | ) | |||||||
Miscellaneous other income | 177 | 341 | (164 | ) | |||||||
Investment and other income (loss) | (3,747 | ) | 19,913 | (23,660 | ) | ||||||
Non-operating income (loss), GAAP basis | (6,618 | ) | 15,404 | (22,022 | ) | ||||||
Net income attributable to redeemable non-controlling interest in partnership investments | (1,974 | ) | (2,941 | ) | 967 | ||||||
Non-operating income (loss), net of redeemable non-controlling interest in partnership investments, non-GAAP basis (1) | $ | (8,592 | ) | $ | 12,463 | $ | (21,055 | ) | |||
(1) | Non-operating income (loss), net of redeemable non-controlling interest in partnership investments is a non-GAAP financial measure. Management believes this measure provides comparability of this information among reporting periods and is an effective measure for reviewing the Company’s non-operating contribution to its results. |
Interest income increased by $39,000 to $199,000 for the year ended December 31, 2015 as a result of increases in our cash balances. Interest expense decreased by $1.6 million to $3.1 million for the year ended December 31, 2015 when compared with the prior year due to $46.2 million of senior notes outstanding repaid in the third quarter of 2014.
Investment loss was $5.5 million for the year ended December 31, 2015, compared with investment income of $17.6 million in the prior year. The decrease in investment income (loss) for the year ended December 31, 2015, was driven by other-than-temporary impairment charges of $12.9 million on certain available-for-sale securities with unrealized losses held in the investment portfolio, compared with $667,000 in 2014. Lower realized gains generated from tax harvesting activities and unrealized losses within the Company's investment portfolio also contributed to the decrease in investment income. Dividend income decreased by $398,000 to $1.6 million for the year ended December 31, 2015.
35
Net income attributable to redeemable non-controlling interest in partnership investments represents the portion of income or loss attributable to the other partners’ ownership interest in the partnership that we refer to as non-controlling interests.
The following table provides a summary of the losses that we generated from our corporate investment portfolio. This table combines the investment loss and dividend income as reported in our consolidated statement of operations with the change in fair value of our investment securities that are recorded in accumulated other comprehensive income, a component of equity, for the year ended December 31, 2015:
Year Ended December 31, 2015 | |||||||||||
(in thousands) | Non-Operating Loss, net | Change in Accumulated Other Comprehensive Income | Total | ||||||||
Funds and common stock | $ | (7,344 | ) | $ | 2,163 | $ | (5,181 | ) | |||
Partnership investments | 2,375 | — | 2,375 | ||||||||
Option contracts | (544 | ) | — | (544 | ) | ||||||
Investment income (loss) | (5,513 | ) | 2,163 | (3,350 | ) | ||||||
Dividend income | 1,589 | 1,589 | |||||||||
Redeemable non-controlling interest in partnership investments | (1,974 | ) | (1,974 | ) | |||||||
Investment portfolio results | $ | (5,898 | ) | $ | (3,735 | ) | |||||
Less: Non-controlling interest in Calamos Investments LLC | (2,459 | ) | |||||||||
Deferred income taxes | 110 | ||||||||||
Change in accumulated other comprehensive income | $ | (186 | ) | ||||||||
Our investment portfolio lost $3.7 million, or 1.2%, for the full year 2015. These results primarily reflect realized and unrealized losses from investment securities and realized and unrealized losses on option contracts to hedge market value fluctuations in the corporate investment portfolio offset by dividend income.
Income Tax Provision
For the years ended December 31, 2015 and 2014, our effective tax rate was 40.6% and 29.3%, respectively. The December 31, 2015 effective tax rate includes the impact of a partial reversal in the deferred tax valuation allowance of $156,000 as a result of capital gains realized in 2014 as a provision to income tax return true-ups. The partial reversal of the deferred tax valuation allowance decreases our effective tax rate in 2015 by 2.8%. The December 31, 2014 effective tax rate included the impact of a net decrease in the deferred tax valuation allowance of $2.0 million as a result of capital gains realized from the corporate investment portfolio that was attributable to CAM prior to the expiration of a portion of the capital loss carryforwards. The partial reversal of the deferred tax valuation allowance decreased our effective tax rate in 2014 by 10.4%. As of December 31, 2015 and 2014, there was no valuation allowance. The ultimate realization of this deferred tax asset is dependent upon the generation of sufficient capital gains prior to the expiration of capital loss carryforwards in 2017.
Net Income
For the years ended December 31, 2015 and 2014, net income attributable to CAM was $3.3 million and $13.5 million, respectively. For the same period non-GAAP net income attributable to CAM was $13.6 million and $16.0 million, respectively. See “Supplemental Non-GAAP Financial Measures” of the MD&A below for descriptions of non-GAAP financial measures and a reconciliation of non-GAAP financial measures to GAAP financial measures.
36
Operating Results
Year Ended December 31, 2014 Compared with Year Ended December 31, 2013
Assets Under Management
Assets under management decreased by $3.0 billion, or 11%, to $23.5 billion at December 31, 2014 from $26.5 billion at December 31, 2013. Average assets under management decreased by $2.1 billion, or 8%, to $25.3 billion for the year ended December 31, 2014 from $27.4 billion for the year ended December 31, 2013. As of December 31, 2014, assets under management consisted of 89% funds and 11% separate accounts. As of December 31, 2013, assets under management consisted of 84% funds and 16% separate accounts.
Change | |||||||||||||
(in millions) | 2014 | 2013 | Amount | Percent | |||||||||
Open-end Funds | |||||||||||||
Beginning assets under management | $ | 16,128 | $ | 17,829 | $ | (1,701 | ) | (10)% | |||||
Sales | 4,729 | 4,769 | (40 | ) | (1) | ||||||||
Redemptions | (6,446 | ) | (8,974 | ) | 2,528 | 28 | |||||||
Market appreciation | 379 | 2,504 | (2,125 | ) | (85) | ||||||||
Ending assets under management | 14,790 | 16,128 | (1,338 | ) | (8) | ||||||||
Average assets under management | 15,721 | 16,256 | (535 | ) | (3) | ||||||||
Closed-end Funds | |||||||||||||
Beginning assets under management | 6,266 | 5,500 | 766 | 14 | |||||||||
Sales | 64 | 308 | (244 | ) | (79) | ||||||||
Market appreciation (depreciation) | (119 | ) | 458 | (577 | ) | * | |||||||
Ending assets under management | 6,211 | 6,266 | (55 | ) | (1) | ||||||||
Average assets under management | 6,332 | 5,909 | 423 | 7 | |||||||||
Institutional Accounts | |||||||||||||
Beginning assets under management | 3,081 | 5,191 | (2,110 | ) | (41) | ||||||||
Sales | 220 | 290 | (70 | ) | (24) | ||||||||
Redemptions | (1,869 | ) | (3,105 | ) | 1,236 | 40 | |||||||
Market appreciation | 144 | 705 | (561 | ) | (80) | ||||||||
Ending assets under management | 1,576 | 3,081 | (1,505 | ) | (49) | ||||||||
Average assets under management | 2,269 | 4,145 | (1,876 | ) | (45) | ||||||||
Managed Accounts | |||||||||||||
Beginning assets under management | 1,068 | 1,135 | (67 | ) | (6) | ||||||||
Sales | 84 | 129 | (45 | ) | (35) | ||||||||
Redemptions | (280 | ) | (394 | ) | 114 | 29 | |||||||
Market appreciation | 57 | 198 | (141 | ) | (71) | ||||||||
Ending assets under management | 929 | 1,068 | (139 | ) | (13) | ||||||||
Average assets under management | 978 | 1,072 | (94 | ) | (9) | ||||||||
Total Assets Under Management | |||||||||||||
Beginning assets under management | 26,543 | 29,655 | (3,112 | ) | (10) | ||||||||
Sales | 5,097 | 5,496 | (399 | ) | (7) | ||||||||
Redemptions | (8,595 | ) | (12,473 | ) | 3,878 | 31 | |||||||
Market appreciation | 461 | 3,865 | (3,404 | ) | (88) | ||||||||
Ending assets under management | 23,506 | 26,543 | (3,037 | ) | (11) | ||||||||
Average assets under management | $ | 25,300 | $ | 27,382 | $ | (2,082 | ) | (8)% | |||||
________________
* Not meaningful
37
Fund sales in 2014 were primarily due to our alternative, U.S. equity, and global equity strategies(1) , but were not sufficient to overcome the aggregate redemptions in our U.S. equity, alternative, and global equity strategies. Net redemptions in our funds were $1.7 billion in 2014 and represent a favorable change of $2.2 billion from redemptions of $3.9 billion in 2013. The decrease in market values negatively impacted our funds by $260 million during 2014 compared with market appreciation of $3.0 billion during 2013.
Separate accounts, which represent managed accounts for both institutions and individuals, combined net redemptions were $1.8 billion during 2014, compared with net redemptions of $3.1 billion in 2013. The decrease during 2014 in our institutional accounts was due to net redemptions of $1.6 billion that were partially offset by appreciation of $144 million. Institutional net redemptions were primarily from global equity and U.S. equity strategies and were $1.2 billion favorable compared with $2.8 billion of net redemptions in 2013. Institutional account appreciation decreased from $705 million in 2013. Managed account net redemptions of $196 million represent a favorable change of $69 million from net redemptions of $265 million in 2013 and appreciation of $57 million in 2014 was a decrease of $141 million from 2013.
(1) Prior period assets by strategy have been reclassified.
Financial Review
Revenues
Total revenues decreased by $18.2 million, or 7%, to $251.0 million for the year ended December 31, 2014 from $269.1 million for the prior year. The decrease was primarily due to lower investment management fees, and distribution and underwriting fees.
Change | ||||||||||||||
(in thousands) | 2014 | 2013 | Amount | Percent | ||||||||||
Investment management fees | $ | 198,539 | $ | 212,398 | $ | (13,859 | ) | (7 | )% | |||||
Distribution and underwriting fees | 49,764 | 54,068 | (4,304 | ) | (8 | )% | ||||||||
Other | 2,659 | 2,664 | (5 | ) | — | % | ||||||||
Total revenues | $ | 250,962 | $ | 269,130 | $ | (18,168 | ) | (7 | )% | |||||
Investment management fees decreased by 7% for the year ended December 31, 2014, as our average assets under management decreased by $2.1 billion, or 8%, during the year. Investment management fees from open-end funds decreased by 5% to $120.3 million for the year ended December 31, 2014 from $126.1 million for the prior year, driven by a 3% decrease in average open-end fund assets. Investment management fees from our closed-end funds increased by 7% to $57.9 million for the year ended December 31, 2014 from $54.0 million for the prior year period, due to a 7% increase in average closed-end fund assets. Investment management fees from our separately managed accounts decreased by 39% to $18.0 million for the year ended December 31, 2014 from $29.7 million in the prior year, due to a 38% decrease in average separately managed accounts assets under management. Investment management fees that we earned as a percentage of average assets under management for the year ended December 31, 2014 were 0.78% compared with the 2013 rate of 0.77%. Investment management fees from assets under advisement for which we provide model portfolio design and oversight were $2.3 million for the year ended December 31, 2014, compared with $2.7 million in the prior year. Investment management fees that we earned as a percentage of assets under advisement for the years ended December 31, 2014 and 2013 were 0.30%.
Distribution and underwriting fees decreased by 8%, or $4.3 million to $49.8 million for the year ended December 31, 2014. The decrease was primarily due to a shift in open-end fund assets from Class A, B and C shares to Class I shares. More open-end fund investors are choosing to compensate their financial advisors through fee-based models, increasing the demand for and a shift towards Class I shares. Because we do not collect distribution fees from Class I shares, our distribution revenue has decreased with this shift in assets. For 2014, average open-end fund assets decreased by 3% across most share classes compared with the prior year. The decrease in average open-end fund assets when compared with the prior year is largely due to net redemptions in our U.S. equity and global equity strategies.
Other revenue principally reflects asset-based portfolio accounting fees. Other revenue was $2.7 million, consistent with the prior year. Portfolio accounting fees generally rise and fall with the changes in average fund assets that we manage.
Operating Expenses
Operating expenses decreased by 1% to $189.8 million for the year ended December 31, 2014 from $191.2 million for the prior year. This change reflects decreases in distribution expenses, partially offset by increases in general and administrative expenses, employee compensation and benefits expenses and marketing and sales promotion expenses.
38
Change | ||||||||||||||
(in thousands) | 2014 | 2013 | Amount | Percent | ||||||||||
Employee compensation and benefits | $ | 86,054 | $ | 85,551 | $ | 503 | 1 | % | ||||||
Distribution expenses | 48,432 | 53,082 | (4,650 | ) | (9 | )% | ||||||||
Marketing and sales promotion | 16,128 | 15,728 | 400 | 3 | % | |||||||||
General and administrative | 39,158 | 36,883 | 2,275 | 6 | % | |||||||||
Total operating expenses | $ | 189,772 | $ | 191,244 | $ | (1,472 | ) | (1 | )% | |||||
Employee compensation and benefits expenses increased by $503,000, or 1%, for the year ended December 31, 2014. The increase in 2014 was primarily due to increases in base salaries and related benefits, partially offset by the expense recorded in 2013 for the departure of a senior executive and a decrease in equity compensation expenses. Salary expenses increased in 2014 primarily due to increases in the number of associates we employ on our investment team. The decrease in equity compensation expenses in 2014 was primarily the result of the reversal of inception-to-date expense on terminated associates.
Distribution expenses decreased by $4.7 million, or 9% for the year ended December 31, 2014. The decrease was primarily due to a shift of average open-end fund assets to Class I shares which do not result in distribution expenses.
Marketing and sales promotion expenses decreased by $400,000 for the year ended December 31, 2014, primarily due to a fee rate increase for distribution intermediaries, partially offset by a decrease in waived fund expenses which limit the annual ordinary operating expenses of each fund.
General and administrative expenses decreased by $2.3 million for the year ended December 31, 2014. The increase in 2014 was primarily due to higher professional services, travel and entertainment and occupancy-related expenses.
Non-Operating Activities, Net of Redeemable Non-controlling Interest in Partnership Investments
Non-operating income, net of redeemable non-controlling interest in partnership investments decreased by $14.7 million to $12.5 million for the year ended December 31, 2014, compared with $27.2 million for the prior year. The decrease was primarily due to lower realized gains on our investment securities.
(in thousands) | 2014 | 2013 | Change | ||||||||
Interest income | $ | 160 | $ | 257 | $ | (97 | ) | ||||
Interest expense | (4,669 | ) | (6,021 | ) | 1,352 | ||||||
Net interest expense | (4,509 | ) | (5,764 | ) | 1,255 | ||||||
Investment income | 17,585 | 29,891 | (12,306 | ) | |||||||
Dividend income | 1,987 | 5,355 | (3,368 | ) | |||||||
Miscellaneous other income | 341 | 193 | 148 | ||||||||
Investment and other income | 19,913 | 35,439 | (15,526 | ) | |||||||
Non-operating income, GAAP basis | 15,404 | 29,675 | (14,271 | ) | |||||||
Net income attributable to redeemable non-controlling interest in partnership investments | (2,941 | ) | (2,502 | ) | (439 | ) | |||||
Non-operating income, net of redeemable non-controlling interest in partnership investments, non-GAAP basis (1) | $ | 12,463 | $ | 27,173 | $ | (14,710 | ) | ||||
(1) | Non-operating income, net of redeemable non-controlling interest in partnership investments is a non-GAAP financial measure. Management believes this measure provides comparability of this information among reporting periods and is an effective measure for reviewing the Company’s non-operating contribution to its results. |
Interest income decreased by $97,000 to $160,000 for the year ended December 31, 2014 as a result of decreases in our cash balances. Interest expense decreased by $1.4 million to $4.7 million for the year ended December 31, 2014 when compared with the prior year due to $46.2 million of senior notes outstanding repaid in the third quarter of 2014.
Investment income decreased by $12.3 million to $17.6 million for the year ended December 31, 2014. The decrease in investment income was driven by lower realized gains on the sale of investment securities and capital gain distributions generated as part of a tax harvesting strategy to better utilize tax loss carryforwards. These gains were offset with an other-than-temporary impairment charge of $667,000 thousand on certain available-for-sale securities with unrealized losses held in the investment portfolio. Dividend income decreased by $3.4 million to $2.0 million for the year ended December 31, 2014.
39
Net income attributable to redeemable non-controlling interest in partnership investments represents the portion of income or loss attributable to the other partners’ ownership interest in the partnership that we refer to as non-controlling interests.
The following table provides a summary of the returns that we generated from our corporate investment portfolio. This table combines the investment and dividend income as reported in our consolidated statement of operations with the change in fair value of our investment securities that are recorded in accumulated other comprehensive income, a component of equity, for the year ended December 31, 2014:
Year Ended December 31, 2014 | |||||||||||
(in thousands) | Non-Operating Income, net | Change in Accumulated Other Comprehensive Income (Loss) | Total | ||||||||
Funds and common stock | $ | 15,306 | $ | (8,839 | ) | $ | 6,467 | ||||
Partnership investments | 4,059 | — | 4,059 | ||||||||
Option contracts | (1,780 | ) | — | (1,780 | ) | ||||||
Investment income | 17,585 | (8,839 | ) | 8,746 | |||||||
Dividend income | 1,987 | 1,987 | |||||||||
Redeemable non-controlling interest in partnership investments | (2,941 | ) | (2,941 | ) | |||||||
Investment portfolio results | $ | 16,631 | $ | 7,792 | |||||||
Less: Non-controlling interest in Calamos Investments LLC | 6,353 | ||||||||||
Deferred income taxes | 920 | ||||||||||
Change in accumulated other comprehensive income | $ | (1,566 | ) | ||||||||
Our investment portfolio returned $7.8 million, or 2.1%, for the full year 2014. These results primarily reflect realized and unrealized gains, offset by reclassification adjustments for realized gains included in net income, from investment securities and realized losses on option contracts to hedge market value fluctuations in the corporate investment portfolio.
Income Tax Provision
For the years ended December 31, 2014 and 2013, our effective tax rate was 29.3% and 25.0%, respectively. The December 31, 2014 effective tax rate includes the impact of a decrease in the deferred tax valuation allowance of $2.0 million as a result of capital gains realized from the corporate investment portfolio that was attributable to CAM prior to the expiration of a portion of the capital loss carryforwards. A partial reversal of the deferred tax valuation allowance decreased our effective tax rate in 2014 by 10.4%. As of December 31, 2014, there was no valuation allowance. The ultimate realization of this deferred tax asset is dependent upon the generation of sufficient capital gains prior to the expiration of capital loss carryforwards in 2017. The December 31, 2013 effective tax rate included the impact of a net decrease in the deferred tax valuation allowance of $3.0 million as a result of capital gains realized from the corporate investments portfolio was attributable to CAM prior to the expiration of a portion of the capital loss carryforwards. The partial reversal of the deferred tax valuation allowance decreased our effective tax rate in 2013 by 12.2%. As of December 31, 2013, the balance in the valuation allowance totaled $2.1 million.
Net Income
For the years ended December 31, 2014 and 2013, net income attributable to CAM was $13.5 million and $18.6 million, respectively. For the same period non-GAAP net income attributable to CAM was $16.0 million and $18.8 million, respectively. See “Supplemental Non-GAAP Financial Measures” of the MD&A below for descriptions of non-GAAP financial measures and a reconciliation of non-GAAP financial measures to GAAP financial measures.
Supplemental Non-GAAP Financial Measures
We provide investors with certain adjusted, non-GAAP financial measures including non-GAAP operating income, non-GAAP operating margin, non-GAAP net income attributable to CAM and non-GAAP diluted earnings per share. These non-GAAP financial measures are provided to supplement the consolidated financial statements presented on a GAAP basis. These non-GAAP financial measures adjust GAAP financial measures to include the tax benefit from the amortization of deferred taxes on intangible assets, and to exclude the change in the deferred tax valuation allowance, closed-end fund launch expenses, net of taxes, and CAM’s non-operating income, net of taxes. We believe these adjustments are appropriate to enhance an overall understanding of our operating financial performance, as well as to facilitate comparisons with our historical earnings results. These adjustments to our GAAP results are made with the intent of providing investors a more complete understanding of our underlying earnings
40
results and trends and our marketplace performance. In addition, these non-GAAP financial measures are among the primary indicators management uses as a basis of managing our business.
The presentation of this additional information is not meant to be considered in isolation or as a substitute for the directly comparable financial measures prepared in accordance with GAAP. Investors should review the reconciliations of the non-GAAP financial measures to their most directly comparable GAAP financial measures as provided in the tables below:
2015 | 2014 | 2013 | |||||||||
(in thousands) | |||||||||||
GAAP operating income | $ | 30,339 | $ | 61,190 | $ | 77,886 | |||||
Adjustment: | |||||||||||
Closed-end fund launch expenses | 11,544 | — | — | ||||||||
Non-GAAP operating income | $ | 41,883 | $ | 61,190 | $ | 77,886 | |||||
Total revenues | $ | 230,880 | $ | 250,962 | $ | 269,130 | |||||
GAAP operating margin | 13.1 | % | 24.4 | % | 28.9 | % | |||||
Non-GAAP operating margin | 18.1 | % | 24.4 | % | 28.9 | % | |||||
2015 | 2014 | 2013 | |||||||||
(in thousands, except per share data) | |||||||||||
GAAP net income attributable to CAM | $ | 3,327 | $ | 13,530 | $ | 18,628 | |||||
Adjustments: | |||||||||||
Deferred tax amortization on intangible assets(1) | 7,916 | 7,916 | 7,916 | ||||||||
Decrease in deferred tax valuation allowance | — | (1,992 | ) | (3,026 | ) | ||||||
Closed-end fund launch expenses(2) | 1,615 | — | — | ||||||||
Non-operating income (loss), net of taxes | 714 | (3,494 | ) | (4,766 | ) | ||||||
Non-GAAP net income attributable to CAM | $ | 13,572 | $ | 15,960 | $ | 18,752 | |||||
Diluted - Weighted average shares outstanding | 18,245,109 | 18,989,281 | 20,351,603 | ||||||||
Diluted earnings per share | $ | 0.18 | $ | 0.71 | $ | 0.92 | |||||
Non-GAAP diluted earnings per share | $ | 0.74 | $ | 0.84 | $ | 0.92 | |||||
________________
(1) | For the year ended December 31, 2015, the deferred tax amortization on intangible assets, the realization of which is not reflected in our consolidated statements of operations, resulted in cash savings of approximately $3.8 million during the period and the creation of a federal net operating loss carryforward benefit of approximately $4.1 million which can be utilized in future years, to the extent of net income, to offset the Company's income taxes payable. See Note 17, Income Taxes, to the audited consolidated financial statements included in Item 8., Financial Statements and Supplemental Data included in this Form 10-K. |
(2) | Closed-end fund launch expenses are shown net of the non-controlling interest in Calamos Investments and income taxes. |
Non-GAAP operating income is calculated by adjusting for the closed-end fund launch expenses from GAAP operating income. Non-GAAP operating margin is calculated by dividing non-GAAP operating income by total revenues.
Non-GAAP net income attributable to CAM is calculated by adjusting the following items from GAAP net income attributable to CAM:
(i) | amortization of deferred taxes on intangible assets associated with the election under section 754 of the Internal Revenue Code of 1986, as amended (Section 754 election); |
(ii) | change in deferred tax valuation allowance; |
(iii) | closed-end fund launch expenses, net of taxes; and |
(iv) | non-operating income, net of taxes. |
41
Non-GAAP diluted earnings per share is calculated by dividing non-GAAP net income attributable to CAM by diluted weighted average shares outstanding.
The deferred tax assets from the Section 754 election allows for an annual reduction of approximately $8.0 million in current and future income taxes owed by us, to the extent that a tax payable exists. To the extent that the deferred tax asset exceeds net income, a federal net operating loss carryforward is created. The cash savings and any resulting net operating loss carryforward acrrue solely for the benefit of the shareholders of CAM’s common stock. We believe that adjusting this item from the calculation of the above non-GAAP items can be a useful measure in allowing investors to see our performance. The change in the allowance on the deferred tax asset is excluded from the above non-GAAP items as it may fluctuate in future periods affecting prior period comparisons. Closed-end fund launch expenses, net of taxes, are excluded because revenue associated with these expenses will not fully impact results until future periods. Non-operating income is excluded from the above non-GAAP items as it can distort comparisons between periods. As noted above, we believe that measures excluding these items are useful in analyzing operating trends and allows for more comparability between periods, which may be useful to investors.
We believe that non-GAAP operating income, non-GAAP operating margin, non-GAAP net income attributable to CAM and non-GAAP diluted earnings per share are useful measures of performance and may be useful to investors, because they provide measures of our core business activities adjusting for items that are non-cash and costs that may distort comparisons between periods. These measures are provided in addition to our operating income, operating margin, net income attributable to CAM and diluted earnings per share calculated under GAAP, but are not substitutes for those calculations.
Liquidity and Capital Resources
We manage our liquidity position to ensure adequate resources are available to fund ongoing operations of the business, provide seed capital for new funds, provide conservative levels of capital for the Company’s regulated subsidiaries, fund our stock repurchase program, and invest in other corporate strategic initiatives. Our principal sources of liquidity are cash flows from operating activities and our corporate investment portfolio, which is comprised of cash and cash equivalents, investment securities, derivatives and partnership investments. Investment securities are principally comprised of Company-sponsored funds. In addition, the individual securities held within our partnership investments are typically highly liquid. Borrowings by Calamos Investments have also been a source of liquidity.
Our working capital requirements historically have been met through cash generated by operations. We believe cash generated from operations and financing activities will be sufficient over the foreseeable future to meet our working capital requirements and liquidity needs with respect to the foregoing activities, as well as to support future growth.
The following table summarizes our principal sources of liquidity as of December 31, 2015 and 2014:
(in thousands) | December 31, 2015 | December 31, 2014 | |||||
Cash and cash equivalents | $ | 104,717 | $ | 35,285 | |||
Investment securities | 257,057 | 339,959 | |||||
Derivatives, net | (1,164 | ) | — | ||||
Partnership investments, net of liabilities and redeemable non-controlling interests | 34,730 | 57,439 | |||||
Total corporate investment portfolio | $ | 395,340 | $ | 432,683 | |||
We utilize a hedging strategy using exchange-traded equity option contracts as an economic hedge to reduce downside risk and price volatility of the total portfolio value. This strategy allows us the flexibility to continue to provide seed capital for the development of new products when necessary, while seeking to help reduce risk.
Calamos Investments is the borrower of our $46.0 million in long-term debt. We were in compliance with all financial covenants at December 31, 2015 and 2014.
On March 31, 2015, the initial public offering of a Calamos-sponsored closed-end fund was completed with underwriters of the closed-end fund subsequently exercising a portion of their over-allotment option, the closing of which over-allotment option occurred on May 13, 2015. As contemplated in the fund's prospectus, CAL, the fund's investment adviser has implemented a share purchase program pursuant to which CAL will, through a plan agent, purchase up to $20 million of common shares of the fund in the open market, subject to applicable federal securities laws as well as to a variety of market and discount conditions and a daily purchase limit. The purchase plan, which seeks to provide increased liquidity for the fund's common shares, commenced on July 7, 2015. CAL purchased $15.6 million of common shares of the fund under this program during the year ended December 31, 2015. The purchase program was completed on February 25, 2016 for a total cost of $20.0 million.
42
As of December 31, 2015, Calamos Investments had a $25.0 million short term, interest-bearing loan from CAM to fund new seed investments, continue our stock repurchase program, as well as to provide excess liquidity. Subsequent to December 31, 2015, the balance of the loan from CAM to Calamos Investments was $40.0 million.
The following is a summary of covenant compliance as of December 31, 2015 with the terms and covenants having the same meanings set forth under our amended note purchase agreements:
Covenants | December 31, 2015 | ||
EBITDA/interest expense - not less than 3.0 | 11.59 | ||
Debt/EBITDA - not more than 2.75 | 1.91 | ||
Investment coverage ratio - not less than 1.175 | 4.48 | ||
Net worth - not less than $160 million | $279.4 million | ||
The following table summarizes key data relating to our liquidity and capital resources:
(in thousands) | December 31, 2015 | December 31, 2014 | |||||
Statements of financial condition data: | |||||||
Cash and cash equivalents | $ | 104,717 | $ | 35,285 | |||
Receivables | 17,767 | 18,991 | |||||
Investment securities and derivatives, net | 255,893 | 339,959 | |||||
Partnership investments, net of liabilities and redeemable non-controlling interests | 34,730 | 57,439 | |||||
Deferred tax assets, net | 38,304 | 40,261 | |||||
Long-term debt, including current portion | 45,955 | 45,955 | |||||
The deferred tax assets above include an annual reduction of $7.9 million in future income taxes owed by us through 2019. This reduction results from our election under Section 754 of the Internal Revenue Code, whereby we stepped up the tax basis in certain intangible assets to their fair market value. These assets are amortized over fifteen years on CAM’s tax return. As a result, this cash savings will accrue solely for the benefit of the shareholders of our common stock.
Cash flows for the years ended December 31, 2015, 2014 and 2013 are shown below.
(in thousands) | 2015 | 2014 | 2013 | ||||||||
Cash flow data: | |||||||||||
Net cash provided by operating activities | $ | 42,124 | $ | 82,708 | $ | 104,668 | |||||
Net cash provided by (used in) investing activities | 96,306 | 92,645 | (80,992 | ) | |||||||
Net cash used in financing activities | (68,998 | ) | (179,146 | ) | (91,394 | ) | |||||
Net cash provided by operating activities was $42.1 million, $82.7 million and $104.7 million for the years ended December 31, 2015, 2014 and 2013, respectively. These net cash flows are primarily attributable to investment management and distribution and underwriting fees generated by core business activities, partially offset by staff, distribution, and other operating expenses.
Net cash provided by investing activities for the year ended December 31, 2015 was $96.3 million. The net cash provided by investing activities primarily represents net cash inflows as a result of proceeds from sales of investments of $56.9 million and the liquidation of our interest in Calamos Arista Strategic Fund LP, a consolidated partnership, totaling $23.1 million, partially offset by cash outflows of $15.6 million related to the purchase of common shares of a Calamos-sponsored closed-end fund. The remaining sales and repurchases of investment securities totaling $40.0 million were as a result of our tax harvesting strategy.
Net cash provided by investing activities for the year ended December 31, 2014 was $92.6 million. The net cash provided by investing activities primarily represented net cash inflows as a result of proceeds from sales of investments of $229.9 million partially offset by cash outflows of $127.6 million, comprised of $30.1 million of seed capital to help expand our product offering, $11.4 million related to our tax harvesting strategy and an investment of $30.0 million in Calamos Global Opportunities Fund LP, a consolidated partnership. The remaining sales and repurchases of investment securities totaling $83.2 million resulted in little change in cash used in investing activities. These sales and repurchases of investments were the result of realized gains on our investment securities as a result of our tax harvesting strategy.
43
Net cash used in investing activities for the year ended December 31, 2013 was $81.0 million. The net cash used in investing activities primarily represented net cash outflows as a result of additional investments in Company-sponsored funds of $121.0 million, comprised of $77.0 million of seed capital to help expand our product offering and $44.0 million related to our tax harvesting strategy. Net cash outflows also included $9.2 million of dividend reinvestments and $1.7 million on our derivatives, which were used as economic hedges against the equity price risk in our investment portfolio. These flows were partially offset by net cash inflows as a result of proceeds from sales of investments of $37.7 million and the liquidation of a portion of our interest in one of our partnership investments totaling $18.7 million. The remaining sales and purchases of investment securities totaling $491.5 million had no impact on cash used in investing activities. These sales and purchases were mainly the result of realized gains on our investment securities as a result of our tax harvesting strategy.
Net cash used in financing activities for the year ended December 31, 2015 was $69.0 million and largely represents pro rata equity and income tax distributions paid by Calamos Investments to our non-controlling interests of $43.3 million. Net cash used in financing activities was also due to Calamos Investments' repurchase of $15.2 million in Class A common stock as a result of our stock repurchase program, and cash dividends paid to common stockholders of $10.5 million.
Net cash used in financing activities for the year ended December 31, 2014 was $179.1 million and largely represented pro rata income tax and equity distributions paid by Calamos Investments to our non-controlling interests of $100.5 million. Net cash used in financing activities was also due to Calamos Investments' repayment of long-term debt of $46.2 million, repurchase of $22.5 million in Class A common stock as a result of our stock repurchase program, and cash dividends paid to common stockholders of $10.1 million.
Net cash used in financing activities for the year ended December 31, 2013 was $91.4 million and largely represented pro rata income tax and equity distributions paid by Calamos Investments to our non-controlling interests of $68.2 million. Net cash used in financing activities was also due to Calamos Investments' repurchase of $13.2 million in Class A common stock as a result of our stock repurchase program, and cash dividends paid to common stockholders of $10.0 million.
Distributions from Calamos Investments to CAM are eliminated upon consolidation and are not reflected in the net cash flows used in financing activities. The decrease in net cash used in financing activities principally reflects decreases in tax distributions driven by a decline in net income attributable to our non-controlling interests.
Contractual Obligations
The following table contains supplemental information regarding our total contractual cash obligations as of December 31, 2015:
Payments Due by Period | |||||||||||||||||||
(in thousands) | Total | Less than 1 Year | 1-3 Years | 3-5 Years | More than 5 Years | ||||||||||||||
Long-term debt obligations, including interest (1) | $ | 55,201 | $ | 3,032 | $ | 26,724 | $ | 25,445 | $ | — | |||||||||
Operating lease obligations (2) | 49,818 | 5,252 | 10,923 | 10,844 | 22,799 | ||||||||||||||
Other long-term obligations (3) | 2,581 | 919 | 1,436 | 226 | — | ||||||||||||||
Total | $ | 107,600 | $ | 9,203 | $ | 39,083 | $ | 36,515 | $ | 22,799 | |||||||||
________________
(1) | The Company’s senior unsecured notes, which aggregate to $46.0 million, consisting of $22.1 million of 6.52% notes due July 15, 2017, and $23.9 million of 6.67% notes due July 15, 2019. |
(2) | In accordance with GAAP, these obligations are not reflected in the accompanying consolidated statements of financial condition. |
(3) | Other long-term obligations represent commitments under the incentive compensation plan. These obligations are included in other current and non-current liabilities in the accompanying consolidated statements of financial condition. |
In the ordinary course of business, the Company enters into contracts or purchase obligations with third parties whereby the third parties provide services to or on behalf of the Company. Purchase obligations include executory contracts, which are either non-cancelable or cancelable with a penalty. As of December 31, 2015, the Company’s obligations primarily include standard service contracts for portfolio, market data and office related services. Purchase obligations are recorded in the Company’s financial statements when services are provided. Due to the uncertainty of timing and amounts that will ultimately be paid, the amounts have been excluded from the table above.
44
Critical Accounting Policies and Estimates
The preparation of our consolidated financial statements in accordance with GAAP requires management to make estimates and judgments that affect the reported amounts of assets, liabilities, revenues and expenses, and related disclosure of contingent assets and liabilities. We base our estimates on historical experience and on various other assumptions that are believed to be reasonable under current circumstances, the results of which form the basis for making judgments about the carrying value of assets and liabilities that are not readily available from other sources. We evaluate our estimates on an ongoing basis. Actual results may differ from these estimates under different assumptions or conditions.
Accounting policies are an integral part of our consolidated financial statements. A thorough understanding of these accounting policies is essential when reviewing our reported results of operations and our financial position. Management believes that the critical accounting policies and estimates discussed below involve additional management judgment due to the sensitivity of the methods and assumptions used.
Investment Securities
Investment securities that are available-for-sale are evaluated for other-than-temporary impairment on a quarterly basis when the cost of an investment exceeds its fair value. When evaluating these securities, we consider many factors, including the duration of the impairment, the severity of the impairment, subsequent changes in value, the Company's intent and ability to hold these securities for a period of time sufficient to allow for recovery of the market value, and the nature of the securities held. When an impairment of an equity security is determined to be other-than-temporary, the impairment is recognized in earnings.
While we believe that we have accurately estimated the amount of our other-than-temporary impairment on our available-for-sale securities, different assumptions may result in changes to the recorded amounts in our consolidated financial statements.
Compensation Plans
We have an incentive compensation plan that provides for grants of restricted stock unit awards (“RSUs”), and stock option awards for certain employees. RSUs are convertible on a one-for-one basis into shares of our common stock. We estimate the fair value of the stock options as of the grant date using the Black-Scholes option-pricing model, and recognize the cost of stock based compensation based on the grant-date fair value of the award. Further, we estimate the number of forfeited awards at the grant date. Actual forfeitures may vary from our assumptions, which will result in modifications to future expenses.
Income Tax Provision
Management judgment is required in developing our provision for income taxes, including the determination of deferred tax assets and liabilities and any valuation allowances that might be required against deferred tax assets. As of December 31, 2015, we have not recorded a valuation allowance on deferred tax assets.
Management determined that a valuation allowance was not required on our deferred tax assets related to our step-up in tax basis to fair market value for our intangible assets under our election made under Section 754 of the Internal Revenue Code of 1986, as amended. In the event that sufficient taxable income of the same character is not recognized in future years, a valuation allowance may be required. Because the determination of our annual income tax provision is subject to judgments and estimates, it is likely that the actual results will vary from those recorded in our financial statements. Hence, we recognize additions to and reductions in income tax expense during a reporting period that pertains to prior period provisions as our estimated liabilities are revised and our actual tax returns and tax audits are completed.
Recently Issued Accounting Pronouncements
We have reviewed all newly issued accounting pronouncements that are applicable to our business and to the preparation of our consolidated financial statements, including those not yet required to be adopted. Accounting guidance that will become effective in future years, with respect to the Company’s consolidated financial statements, is described below:
In February 2016, the Financial Accounting Standards Board ("FASB") issued an accounting update related to the accounting for leases. Under the new guidance, lessees will be required to recognize a right-of-use asset that represents the lessee's right to use, or control the use of, a specified asset for the lease term, and a lease liability, which is a lessee's obligation to make lease payments arising from a lease, measured on a discounted basis. This guidance is effective for annual and interim periods beginning after December 15, 2018. Early adoption is permitted. The Company is evaluating the effect of adopting this new accounting guidance on its results of operations, cash flows and financial position.
45
In January 2016, the FASB issued an accounting update that addresses certain aspects of recognition, measurement, presentation, and disclosure of financial instruments. The new guidance will require the change in fair value of equity instruments with readily determinable fair values to be recognized through the statements of operations. This guidance is effective for annual and interim periods beginning after December 15, 2017, and requires a cumulative-effect adjustment to the balance sheet as of the beginning of the fiscal year of adoption. Early adoption is not permitted. The Company is currently evaluating the full impact of the standard, however, upon adoption the change in the fair value of available-for-sale securities will be recognized in the consolidated statements of operations instead of accumulated other comprehensive income on the consolidated statements of financial position.
In February 2015, the FASB issued an accounting update amending the consolidation requirements under GAAP. This standard modifies existing consolidation guidance for reporting organizations that are required to evaluate whether they should consolidate certain legal entities. This guidance is effective for annual and interim periods beginning after December 15, 2015, and requires either a retrospective or a modified retrospective approach to adoption. Early adoption is permitted. The Company does not expect adoption will have a material impact on its results of operations, cash flows or financial position.
In May 2014, the FASB issued new guidance on revenue from contracts with customers. The new revenue recognition standard provides a five-step analysis of transactions to determine when and how revenue is recognized. The core principle of the guidance is that an entity should recognize revenue to depict the transfer of promised goods or services to customers in an amount that reflects the consideration to which the entity expects to be entitled in exchange for those goods or services. In July 2015, the FASB decided to defer the effective date of the new revenue guidance by one year to annual reporting periods beginning after December 15, 2017, with early adoption being permitted for annual periods beginning after December 15, 2016. The Company's effective date is January 1, 2018. The Company is evaluating the effect of adopting this new accounting guidance on its results of operations, cash flows and financial position.
Forward-Looking Statements
This report and other documents or statements made or filed by us contain certain forward-looking statements within the meaning of Section 27A of the Securities Act of 1933, as amended, and Section 21E of the Securities Exchange Act of 1934. These forward-looking statements may include, without limitation: statements regarding proposed new products; results of operations or liquidity; projections, predictions, expectations, estimates or forecasts of our business; financial and operating results and future economic performance; market capitalization; management’s goals and objectives; payment of dividends; and other similar expressions concerning matters that are not historical facts.
Forward-looking statements may sometimes be identified by words such as “anticipate,” “assume,” “believe,” “continue,” “could,” “estimate,” “expect,” “future,” “intend,” “may,” “opportunity,” “potential,” “predict,” “seek,” “should,” “trend,” “will,” “would,” and similar expressions.
Forward-looking statements are not a guarantee of future performance or results, or of the date of such performance or results, if achieved. Forward-looking statements are based on information available and known at the time those statements are made as well as management’s good faith belief as of that time with respect to future events, and are subject to risks and uncertainties that could cause actual performance or results to differ materially from those expressed in or suggested by the forward-looking statements, including risks not otherwise listed or described in this report.
Important factors that could cause such differences include, but are not limited to: changes in applicable laws or regulations; downward fee pressures and increased industry competition; risks inherent to the investment management business; the loss of revenues due to contract terminations and redemptions; unsatisfactory service levels by third party vendors; the inability to maintain compliance with financial covenants; the performance of our investment strategies and corporate investment portfolio; our ownership and organizational structure; general and prolonged declines in the prices of securities; realization of deferred income tax assets; significant changes in market conditions and the economy that require a modification to our business plan; catastrophic or unpredictable events, including cyber-attacks; the loss of key personnel; the unavailability, consolidation and elimination of third-party retail distribution channels; increased costs of and timing of payments related to distribution; failure to recruit and retain qualified personnel; a loss of assets, and thus revenues; fluctuation in the level of our expenses; fluctuation in foreign currency exchange rates with respect to our global operations and business; changes in accounting estimates; poor performance of our largest funds; damage to our reputation; and the extent and timing of any share repurchases.
Further, the value and composition of our assets under management are, and will continue to be, influenced by a variety of factors including, among other things: sales and redemptions of shares of the open-end funds and other investment products; fluctuation in both the underlying value and liquidity of the financial markets around the world that result in appreciation or depreciation of assets under management; open-end fund capital gain distributions; our ability to access capital markets; our introduction of new investment strategies, products and programs; our ability to educate our clients about our investment philosophy and provide them with best-in-class service; the relative investment performance of our products as compared to competing offerings and market
46
indices; competitive conditions in the mutual fund, asset management and broader financial services sectors; investor trends, sentiment and confidence; our decision to open or close products and strategies; and our ability to execute on our strategic plan to expand the business. Item 1A of this report discusses some of these and other important factors in detail under the caption “Risk Factors.”
Forward-looking statements speak only as of the date the statements are made. Readers should not place undue reliance on any forward-looking statements when deciding whether to buy, sell or hold our securities. We assume no obligation to update forward-looking statements to reflect actual results, changes in assumptions or changes in other factors affecting forward-looking information.
ITEM 7A. QUANTITATIVE AND QUALITATIVE DISCLOSURES ABOUT MARKET RISK
Securities Price Sensitivity
Our exposure to market risk is directly related to our role as investment advisors for the funds and separate accounts we manage. A significant majority of our operating revenue is derived from investment advisory, distribution and portfolio accounting agreements with the funds and separate accounts. Under these agreements, the fees we receive are typically based on the market value of our assets under management and our assets under advisement for which we provide model portfolio design and oversight. Accordingly, a decline in the prices of securities generally may cause our revenue and income to decline by causing the value of the assets we manage to decrease or by causing our clients to withdraw funds in favor of investments that they perceive as offering greater opportunity or lower risk.
In addition, a decline in the prices of securities may present market conditions that could preclude us from increasing our assets under management and prevent us from realizing higher fee revenue associated with such growth.
We are also subject to market risk, in the form of equity price risk, due to a decline in the prices of our investments in certain investment securities, derivatives contracts and partnership investments. We own investment securities primarily comprised of products we manage.
The following table provides a sensitivity analysis of changes in fair value of our investment securities, derivative contracts and partnership investments assuming a 10% increase or decrease in the individual price of each instrument as of December 31, 2015:
Carrying Value Assuming | |||||||||||
(in thousands) | Carrying Value | 10% Increase | 10% Decrease | ||||||||
Available-for-sale securities: | |||||||||||
Funds | $ | 249,554 | $ | 274,509 | $ | 224,599 | |||||
Common stock | 322 | 354 | 290 | ||||||||
Trading securities: | |||||||||||
Funds | 7,181 | 7,899 | 6,463 | ||||||||
Derivative contracts: | |||||||||||
Assets | 4,311 | 4,742 | 3,880 | ||||||||
Liabilities | (5,475 | ) | (6,023 | ) | (4,928 | ) | |||||
Partnership investments: | |||||||||||
Partnership investments, net | 34,730 | 38,203 | 31,257 | ||||||||
In order to reduce the volatility in fair value of the Calamos corporate investment portfolio, we may use exchange-traded option contracts as an economic hedge against price changes. These major equity market index exchange-traded option contracts are used specifically for hedging the equity price risk of a portfolio. The derivative assets and liabilities seen on our consolidated statements of financial condition are part of a single strategy to minimize the downside risk in the hedged portfolio, while allowing participation in a portion of an appreciating market. We do not enter into derivative instruments for speculative purposes.
As of December 31, 2015, we had derivative assets of $4.3 million and derivative liabilities of $5.5 million. A 10% adverse change in the option carrying value would result in a decrease in our derivative assets of $431,000 and an increase in our derivative liabilities of $548,000.
47
Interest Rate Sensitivity
As of December 31, 2015, we had an aggregate of $46.0 million of outstanding long-term debt, which consisted of senior unsecured notes of $22.1 million of 6.52% notes due July 15, 2017 and $23.9 million of 6.67% notes due July 15, 2019. As these notes have fixed interest rates, we do not have any direct exposure to market interest rate risk.
Other Market Risks
Due to the nature of our business, we believe that we do not face any material credit risk, inflation, interest rate or foreign currency rate risk.
48
ITEM 8. FINANCIAL STATEMENTS AND SUPPLEMENTARY DATA
Report of Independent Registered Public Accounting Firm | F-1 |
Report of Independent Registered Public Accounting Firm | F-2 |
Management’s Report on Internal Control Over Financial Reporting | F-3 |
Consolidated Statements of Financial Condition at December 31, 2015 and 2014 | F-4 |
Consolidated Statements of Operations for the years ended December 31, 2015, 2014 and 2013 | F-5 |
Consolidated Statements of Comprehensive Income for the years ended December 31, 2015, 2014 and 2013 | F-6 |
Consolidated Statements of Changes in Equity for the years ended December 31, 2015, 2014 and 2013 | F-7 |
Consolidated Statements of Cash Flows for the years ended December 31, 2015, 2014 and 2013 | F-9 |
Notes to Consolidated Financial Statements | F-10 |
49
Report of Independent Registered Public Accounting Firm
To the Board of Directors and Stockholders
Calamos Asset Management, Inc.
We have audited the accompanying consolidated statements of financial condition of Calamos Asset Management, Inc. and Subsidiaries (the Company) as of December 31, 2015 and 2014, and the related consolidated statements of operations, comprehensive income, changes in equity, and cash flows for each of the three years in the period ended December 31, 2015. These financial statements are the responsibility of the Company's management. Our responsibility is to express an opinion on these financial statements based on our audits.
We conducted our audits in accordance with the standards of the Public Company Accounting Oversight Board (United States). Those standards require that we plan and perform the audit to obtain reasonable assurance about whether the financial statements are free of material misstatement. An audit includes examining, on a test basis, evidence supporting the amounts and disclosures in the financial statements. An audit also includes assessing the accounting principles used and significant estimates made by management, as well as evaluating the overall financial statement presentation. We believe that our audits provide a reasonable basis for our opinion.
In our opinion, the consolidated financial statements referred to above present fairly, in all material respects, the financial position of Calamos Asset Management, Inc. and Subsidiaries as of December 31, 2015 and 2014, and the results of their operations and their cash flows for each of the three years in the period ended December 31, 2015, in conformity with U.S. generally accepted accounting principles.
We have also audited, in accordance with the standards of the Public Company Accounting Oversight Board (United States), Calamos Asset Management, Inc.’s and Subsidiaries’ internal control over financial reporting as of December 31, 2015, based on criteria established in Internal Control — Integrated Framework issued by the Committee of Sponsoring Organizations of the Treadway Commission in 2013, and our report dated March 11, 2016 expressed an unqualified opinion on the effectiveness of the Company’s internal control over financial reporting.
/s/ RSM US LLP
Chicago, Illinois
March 11, 2016
F-1
Report of Independent Registered Public Accounting Firm
To the Board of Directors and Stockholders
Calamos Asset Management, Inc.
We have audited Calamos Asset Management, Inc.'s and Subsidiaries’ (the Company) internal control over financial reporting as of December 31, 2015, based on criteria established in Internal Control — Integrated Framework issued by the Committee of Sponsoring Organizations of the Treadway Commission in 2013. The Company’s management is responsible for maintaining effective internal control over financial reporting and for its assessment of the effectiveness of internal control over financial reporting included in the accompanying Management’s Report on Internal Control over Financial Reporting. Our responsibility is to express an opinion on the Company's internal control over financial reporting based on our audit.
We conducted our audit in accordance with the standards of the Public Company Accounting Oversight Board (United States). Those standards require that we plan and perform the audit to obtain reasonable assurance about whether effective internal control over financial reporting was maintained in all material respects. Our audit included obtaining an understanding of internal control over financial reporting, assessing the risk that a material weakness exists, and testing and evaluating the design and operating effectiveness of internal control based on the assessed risk. Our audit also included performing such other procedures as we considered necessary in the circumstances. We believe that our audit provides a reasonable basis for our opinion.
A company's internal control over financial reporting is a process designed to provide reasonable assurance regarding the reliability of financial reporting and the preparation of financial statements for external purposes in accordance with generally accepted accounting principles. A company's internal control over financial reporting includes those policies and procedures that (a) pertain to the maintenance of records that, in reasonable detail, accurately and fairly reflect the transactions and dispositions of the assets of the company; (b) provide reasonable assurance that transactions are recorded as necessary to permit preparation of financial statements in accordance with generally accepted accounting principles, and that receipts and expenditures of the company are being made only in accordance with authorizations of management and directors of the company; and (c) provide reasonable assurance regarding prevention or timely detection of unauthorized acquisition, use, or disposition of the company's assets that could have a material effect on the financial statements.
Because of its inherent limitations, internal control over financial reporting may not prevent or detect misstatements. Also, projections of any evaluation of effectiveness to future periods are subject to the risk that controls may become inadequate because of changes in conditions, or that the degree of compliance with the policies or procedures may deteriorate.
In our opinion, Calamos Asset Management, Inc. and Subsidiaries maintained, in all material respects, effective internal control over financial reporting as of December 31, 2015, based on criteria established in Internal Control — Integrated Framework issued by the Committee of Sponsoring Organizations of the Treadway Commission in 2013.
We have also audited, in accordance with the standards of the Public Company Accounting Oversight Board (United States), the consolidated financial statements of Calamos Asset Management, Inc. and Subsidiaries as of and for the year ended December 31, 2015 and our report dated March 11, 2016 expressed an unqualified opinion.
/s/ RSM US LLP
Chicago, Illinois
March 11, 2016
F-2
MANAGEMENT’S REPORT ON INTERNAL CONTROL OVER FINANCIAL REPORTING
Management of Calamos Asset Management, Inc. and its subsidiaries (the “Company”) is responsible for establishing and maintaining adequate internal control over financial reporting, as defined in Rule 13a-15(f) and 15d-15(f) of the Securities Exchange Act of 1934, as amended. The Company’s internal control over financial reporting is a process designed to provide reasonable assurance regarding the reliability of financial reporting and the preparation of its consolidated financial statements for external purposes in accordance with U.S. generally accepted accounting principles.
Because of its inherent limitations, internal control over financial reporting may not prevent or detect misstatements. Also, projections of any evaluation of effectiveness to future periods are subject to the risk that controls may become inadequate because of changes in conditions, or that the degree of compliance with the policies or procedures may deteriorate.
Under the supervision and with the participation of the chief executive officer and the chief financial officer, management assessed the effectiveness of the Company’s internal control over financial reporting as of December 31, 2015 based on criteria established in Internal Control – Integrated Framework issued by the Committee of Sponsoring Organizations of the Treadway Commission in 2013. Based on this assessment, management concluded that the Company’s internal control over financial reporting was effective as of December 31, 2015.
The effectiveness of internal control over financial reporting as of December 31, 2015, has been audited by RSM US LLP, an independent registered public accounting firm, as stated in their report which is included herein.
/s/ John P. Calamos, Sr. | /s/ Nimish S. Bhatt | |
John P. Calamos, Sr. Chairman, Chief Executive Officer and Global Co-Chief Investment Officer | Nimish S. Bhatt Senior Vice President and Chief Financial Officer | |
March 11, 2016
F-3
CALAMOS ASSET MANAGEMENT, INC.
CONSOLIDATED STATEMENTS OF FINANCIAL CONDITION
(in thousands, except share data) | December 31, | ||||||
2015 | 2014 | ||||||
ASSETS | |||||||
Current assets: | |||||||
Cash and cash equivalents | $ | 104,717 | $ | 35,285 | |||
Receivables: | |||||||
Affiliates and affiliated funds | 13,891 | 16,024 | |||||
Customers | 3,876 | 2,967 | |||||
Investment securities | 257,057 | 339,959 | |||||
Derivative assets | 4,311 | — | |||||
Partnership investments | 112,640 | 143,723 | |||||
Prepaid expenses | 3,709 | 3,188 | |||||
Deferred tax assets, net | 8,294 | 9,194 | |||||
Other current assets | 631 | 2,508 | |||||
Total current assets | 509,126 | 552,848 | |||||
Non-current assets: | |||||||
Deferred tax assets, net | 30,010 | 31,067 | |||||
Goodwill and intangible assets, net | 7,301 | 6,380 | |||||
Property and equipment, net of accumulated depreciation and amortization ($60,713 at December 31, 2015 and $61,145 at December 31, 2014) | 13,308 | 14,246 | |||||
Other non-current assets | 1,717 | 2,615 | |||||
Total non-current assets | 52,336 | 54,308 | |||||
Total assets | $ | 561,462 | $ | 607,156 | |||
LIABILITIES AND EQUITY | |||||||
LIABILITIES | |||||||
Current liabilities: | |||||||
Distribution fees payable | $ | 7,641 | $ | 10,614 | |||
Accrued compensation and benefits | 28,583 | 24,476 | |||||
Interest payable | 1,390 | 1,386 | |||||
Derivative liabilities | 5,475 | — | |||||
Liabilities of partnership investments | 75 | 10,117 | |||||
Accrued expenses and other current liabilities | 5,118 | 6,009 | |||||
Total current liabilities | 48,282 | 52,602 | |||||
Non-current liabilities: | |||||||
Long-term debt | 45,955 | 45,955 | |||||
Deferred rent | 8,788 | 8,803 | |||||
Other non-current liabilities | 2,043 | 1,710 | |||||
Total non-current liabilities | 56,786 | 56,468 | |||||
Total liabilities | 105,068 | 109,070 | |||||
Redeemable non-controlling interest in partnership investments | 77,835 | 76,167 | |||||
EQUITY | |||||||
Class A common stock, $0.01 par value; authorized 600,000,000 shares; 25,326,522 shares issued and 16,917,360 shares outstanding at December 31, 2015; 24,990,781 shares issued and 17,920,722 shares outstanding at December 31, 2014 | 253 | 250 | |||||
Class B common stock, $0.01 par value; authorized 1,000 shares;100 shares issued and outstanding at December 31, 2015 and 2014 | — | — | |||||
Additional paid-in capital | 224,065 | 221,208 | |||||
Retained earnings | 81,881 | 89,311 | |||||
Accumulated other comprehensive income | 1,110 | 1,297 | |||||
Treasury stock; 8,409,162 shares at December 31, 2015 and 7,070,059 shares at December 31, 2014 | (113,579 | ) | (107,129 | ) | |||
Calamos Asset Management, Inc. stockholders’ equity | 193,730 | 204,937 | |||||
Non-controlling interest in Calamos Investments LLC (Calamos Interests) | 184,829 | 216,982 | |||||
Total equity | 378,559 | 421,919 | |||||
Total liabilities and equity | $ | 561,462 | $ | 607,156 | |||
See accompanying notes to consolidated financial statements.
F-4
CALAMOS ASSET MANAGEMENT, INC.
CONSOLIDATED STATEMENTS OF OPERATIONS
Year Ended December 31, | |||||||||||
(in thousands, except share data) | 2015 | 2014 | 2013 | ||||||||
REVENUES | |||||||||||
Investment management fees | $ | 186,826 | $ | 198,539 | $ | 212,398 | |||||
Distribution and underwriting fees | 41,583 | 49,764 | 54,068 | ||||||||
Other | 2,471 | 2,659 | 2,664 | ||||||||
Total revenues | 230,880 | 250,962 | 269,130 | ||||||||
EXPENSES | |||||||||||
Employee compensation and benefits | 93,295 | 86,054 | 85,551 | ||||||||
Distribution expenses | 40,845 | 48,432 | 53,082 | ||||||||
Marketing and sales promotion | 26,189 | 16,128 | 15,728 | ||||||||
General and administrative | 40,212 | 39,158 | 36,883 | ||||||||
Total operating expenses | 200,541 | 189,772 | 191,244 | ||||||||
Operating income | 30,339 | 61,190 | 77,886 | ||||||||
NON-OPERATING INCOME (LOSS) | |||||||||||
Net interest expense | (2,871 | ) | (4,509 | ) | (5,764 | ) | |||||
Investment and other income (loss) | (3,747 | ) | 19,913 | 35,439 | |||||||
Total non-operating income (loss) | (6,618 | ) | 15,404 | 29,675 | |||||||
Income before income taxes | 23,721 | 76,594 | 107,561 | ||||||||
Income tax provision | 2,320 | 5,787 | 6,262 | ||||||||
Net income | 21,401 | 70,807 | 101,299 | ||||||||
Net income attributable to non-controlling interest in Calamos Investments LLC (Calamos Interests) | (16,100 | ) | (54,336 | ) | (80,169 | ) | |||||
Net income attributable to redeemable non-controlling interest in partnership investments | (1,974 | ) | (2,941 | ) | (2,502 | ) | |||||
Net income attributable to Calamos Asset Management, Inc. | $ | 3,327 | $ | 13,530 | $ | 18,628 | |||||
Earnings per share: | |||||||||||
Basic | $ | 0.19 | $ | 0.74 | $ | 0.94 | |||||
Diluted | $ | 0.18 | $ | 0.71 | $ | 0.92 | |||||
Weighted average shares outstanding: | |||||||||||
Basic | 17,518,033 | 18,275,246 | 19,903,507 | ||||||||
Diluted | 18,245,109 | 18,989,281 | 20,351,603 | ||||||||
Cash dividends declared per share | $ | 0.60 | $ | 0.55 | $ | 0.50 | |||||
See accompanying notes to consolidated financial statements.
F-5
CALAMOS ASSET MANAGEMENT, INC.
CONSOLIDATED STATEMENTS OF COMPREHENSIVE INCOME
Year Ended December 31, | |||||||||||
(in thousands) | 2015 | 2014 | 2013 | ||||||||
Net income | $ | 21,401 | $ | 70,807 | $ | 101,299 | |||||
Other comprehensive income (loss), before income tax provision (benefit) | |||||||||||
Unrealized gains on available-for-sale securities: | |||||||||||
Unrealized gains | 4,817 | 3,173 | 39,630 | ||||||||
Reclassification adjustment for realized gains included in net income | (2,654 | ) | (12,012 | ) | (19,732 | ) | |||||
Other comprehensive income (loss), before income tax provision (benefit) | 2,163 | (8,839 | ) | 19,898 | |||||||
Income tax provision (benefit) related to other comprehensive income (loss) | (110 | ) | (920 | ) | 2,114 | ||||||
Other comprehensive income (loss), after income tax provision (benefit) | 2,273 | (7,919 | ) | 17,784 | |||||||
Comprehensive income | 23,674 | 62,888 | 119,083 | ||||||||
Comprehensive income attributable to non-controlling interest in Calamos Investments LLC (Calamos Interests) | (18,559 | ) | (47,964 | ) | (94,358 | ) | |||||
Comprehensive income attributable to redeemable non-controlling interest in partnership investments | (1,974 | ) | (2,941 | ) | (2,502 | ) | |||||
Comprehensive income attributable to Calamos Asset Management, Inc. | $ | 3,141 | $ | 11,983 | $ | 22,223 | |||||
See accompanying notes to consolidated financial statements.
F-6
CALAMOS ASSET MANAGEMENT, INC.
CONSOLIDATED STATEMENTS OF CHANGES IN EQUITY
Calamos Asset Management, Inc. Stockholders | |||||||||||||||||||||||||||||||
(in thousands) | Common Stock | Additional Paid-in Capital | Retained Earnings | Accumulated Other Comprehensive Income (Loss) | Treasury Stock | Non-controlling Interest in Calamos Investments LLC (Calamos Interests) | Total | Redeemable Non-controlling Interest in Partnership Investments | |||||||||||||||||||||||
Balance at December 31, 2012 | $ | 244 | $ | 215,637 | $ | 77,714 | $ | (737 | ) | $ | (95,215 | ) | $ | 263,794 | $ | 461,437 | $ | 20,412 | |||||||||||||
Net income | — | — | 18,628 | — | — | 80,169 | 98,797 | 2,502 | |||||||||||||||||||||||
Other comprehensive income | — | — | — | 3,595 | — | 14,189 | 17,784 | — | |||||||||||||||||||||||
Issuance of common stock (310,080 Class A common shares) | 3 | (3 | ) | — | — | — | — | — | — | ||||||||||||||||||||||
Repurchase of common stock by Calamos Investments LLC (1,220,330 Class A common shares) | — | — | — | — | (2,930 | ) | (10,266 | ) | (13,196 | ) | — | ||||||||||||||||||||
Impact of the redemption of common stock from Calamos Investments LLC by Calamos Asset Management, Inc. (165,524 Class A common shares) | — | 1,383 | — | — | (1,383 | ) | — | — | — | ||||||||||||||||||||||
Cumulative impact of changes in ownership of Calamos Investments LLC | — | 5 | — | 5 | — | (1,661 | ) | (1,651 | ) | — | |||||||||||||||||||||
Distributions to redeemable non-controlling interests in partnership investments | — | — | — | — | — | — | — | (15,363 | ) | ||||||||||||||||||||||
Compensation expense recognized under stock incentive plans | — | 1,558 | — | — | — | 5,467 | 7,025 | — | |||||||||||||||||||||||
Impact on non-controlling interests as a result of dividends paid to Calamos Investments LLC on repurchased common stock | — | (221 | ) | — | — | — | 221 | — | — | ||||||||||||||||||||||
Dividend equivalent accrued under stock incentive plans | — | — | (252 | ) | — | — | (870 | ) | (1,122 | ) | — | ||||||||||||||||||||
Equity and tax distributions to non-controlling interests | — | — | — | — | — | (68,168 | ) | (68,168 | ) | — | |||||||||||||||||||||
Dividends declared | — | — | (9,975 | ) | — | — | — | (9,975 | ) | — | |||||||||||||||||||||
Balance at December 31, 2013 | 247 | 218,359 | 86,115 | 2,863 | (99,528 | ) | 282,875 | 490,931 | 7,551 | ||||||||||||||||||||||
Net income | — | — | 13,530 | — | — | 54,336 | 67,866 | 2,941 | |||||||||||||||||||||||
Other comprehensive loss | — | — | — | (1,547 | ) | — | (6,372 | ) | (7,919 | ) | — | ||||||||||||||||||||
Issuance of common stock (294,686 Class A common shares) | 3 | (3 | ) | — | — | — | — | — | — | ||||||||||||||||||||||
Repurchase of common stock by Calamos Investments LLC (1,849,729 Class A common shares) | — | — | — | — | (4,990 | ) | (17,480 | ) | (22,470 | ) | — | ||||||||||||||||||||
Impact of the redemption of common stock from Calamos Investments LLC by Calamos Asset Management, Inc. (294,686 Class A common shares) | — | 2,611 | — | — | (2,611 | ) | — | — | — | ||||||||||||||||||||||
Cumulative impact of changes in ownership of Calamos Investments LLC | — | (297 | ) | — | (19 | ) | — | (1,139 | ) | (1,455 | ) | — | |||||||||||||||||||
Compensation expense recognized under stock incentive plans | — | 1,473 | — | — | — | 5,160 | 6,633 | — | |||||||||||||||||||||||
Impact on non-controlling interests as a result of dividends paid to Calamos Investments LLC on repurchased common stock | — | (935 | ) | — | — | — | 935 | — | — | ||||||||||||||||||||||
Dividend equivalent accrued under stock incentive plans | — | — | (244 | ) | — | — | (853 | ) | (1,097 | ) | — | ||||||||||||||||||||
Consolidation of Calamos Global Opportunities Fund LP | — | — | — | — | — | — | — | 73,387 | |||||||||||||||||||||||
Liquidation of Calamos Arista Strategic Fund LP | — | — | — | — | — | — | — | (7,719 | ) | ||||||||||||||||||||||
Net purchase of redeemable non-controlling interest in partnership investments | — | — | — | — | — | — | — | 7 | |||||||||||||||||||||||
Equity and tax distributions to non-controlling interests | — | — | — | — | — | (100,480 | ) | (100,480 | ) | — | |||||||||||||||||||||
Dividends declared | — | — | (10,090 | ) | — | — | — | (10,090 | ) | — | |||||||||||||||||||||
Balance at December 31, 2014 | $ | 250 | $ | 221,208 | $ | 89,311 | $ | 1,297 | $ | (107,129 | ) | $ | 216,982 | $ | 421,919 | $ | 76,167 | ||||||||||||||
See accompanying notes to consolidated financial statements.
CALAMOS ASSET MANAGEMENT, INC.
CONSOLIDATED STATEMENTS OF CHANGES IN EQUITY - (Continued)
Calamos Asset Management, Inc. Stockholders | |||||||||||||||||||||||||||||||
(in thousands) | Common Stock | Additional Paid-in Capital | Retained Earnings | Accumulated Other Comprehensive Income (Loss) | Treasury Stock | Non-controlling Interest in Calamos Investments LLC (Calamos Interests) | Total | Redeemable Non-controlling Interest in Partnership Investments | |||||||||||||||||||||||
Balance at December 31, 2014 | $ | 250 | $ | 221,208 | $ | 89,311 | $ | 1,297 | $ | (107,129 | ) | $ | 216,982 | $ | 421,919 | $ | 76,167 | ||||||||||||||
Net income | — | — | 3,327 | — | — | 16,100 | 19,427 | 1,974 | |||||||||||||||||||||||
Other comprehensive income (loss) | — | — | — | (186 | ) | — | 2,459 | 2,273 | — | ||||||||||||||||||||||
Issuance of common stock (335,741 Class A common shares) | 3 | (3 | ) | — | — | — | — | — | — | ||||||||||||||||||||||
Repurchase of common stock by Calamos Investments LLC (1,339,103 Class A common shares) | — | — | — | — | (3,386 | ) | (11,857 | ) | (15,243 | ) | — | ||||||||||||||||||||
Impact of the redemption of common stock from Calamos Investments LLC by Calamos Asset Management, Inc. (335,741 Class A common shares) | — | 3,064 | — | — | (3,064 | ) | — | — | — | ||||||||||||||||||||||
Cumulative impact of changes in ownership of Calamos Investments LLC | — | (217 | ) | — | (1 | ) | — | (1,071 | ) | (1,289 | ) | — | |||||||||||||||||||
Compensation expense recognized under stock incentive plans | — | 1,401 | — | — | — | 4,906 | 6,307 | — | |||||||||||||||||||||||
Impact on non-controlling interests as a result of dividends paid to Calamos Investments LLC on repurchased common stock | — | (1,388 | ) | — | — | — | 1,388 | — | — | ||||||||||||||||||||||
Dividend equivalent accrued under stock incentive plans | — | — | (223 | ) | — | — | (783 | ) | (1,006 | ) | — | ||||||||||||||||||||
Net redemption of redeemable non-controlling interest in partnership investments | — | — | — | — | — | — | — | (306 | ) | ||||||||||||||||||||||
Equity and tax distributions to non-controlling interests | — | — | — | — | — | (43,295 | ) | (43,295 | ) | — | |||||||||||||||||||||
Dividends declared | — | — | (10,534 | ) | — | — | — | (10,534 | ) | — | |||||||||||||||||||||
Balance at December 31, 2015 | $ | 253 | $ | 224,065 | $ | 81,881 | $ | 1,110 | $ | (113,579 | ) | $ | 184,829 | $ | 378,559 | $ | 77,835 | ||||||||||||||
See accompanying notes to consolidated financial statements.
F-7
CALAMOS ASSET MANAGEMENT, INC.
CONSOLIDATED STATEMENTS OF CASH FLOWS
Year Ended December 31, | |||||||||||
(in thousands) | 2015 | 2014 | 2013 | ||||||||
Cash and cash equivalents at beginning of period | $ | 35,285 | $ | 39,078 | $ | 106,796 | |||||
Cash flows provided by operating activities: | |||||||||||
Net income | 21,401 | 70,807 | 101,299 | ||||||||
Adjustments to reconcile net income to net cash provided by operating activities: | |||||||||||
Amortization of deferred sales commissions | 1,750 | 2,575 | 2,686 | ||||||||
Other depreciation and amortization | 4,064 | 4,428 | 4,577 | ||||||||
(Gain) loss on disposal of property and equipment | 89 | (111 | ) | 203 | |||||||
Amortization of deferred rent | (15 | ) | (210 | ) | (262 | ) | |||||
Change in unrealized (gains) losses on investment securities, derivative assets, derivative liabilities and partnership investments | (5,879 | ) | (1,836 | ) | 5,117 | ||||||
Net realized (gains) losses on sale of investment securities, derivative assets, derivative liabilities and partnership investments | 13,359 | (2,781 | ) | (17,701 | ) | ||||||
Change in deferred tax asset valuation allowance | — | (2,148 | ) | (4,952 | ) | ||||||
Deferred taxes, net | 2,141 | 9,601 | 11,351 | ||||||||
Stock based compensation | 6,307 | 6,633 | 7,025 | ||||||||
Employee taxes paid on vesting under stock incentive plans | (1,362 | ) | (1,500 | ) | (1,600 | ) | |||||
(Increase) decrease in assets: | |||||||||||
Receivables: | |||||||||||
Affiliates and affiliated funds, net | 2,133 | 282 | 1,450 | ||||||||
Customers | (909 | ) | 2,839 | 4,064 | |||||||
Other assets | 515 | (2,650 | ) | (4,420 | ) | ||||||
Increase (decrease) in liabilities: | |||||||||||
Distribution fees payable | (2,973 | ) | (41 | ) | (2,282 | ) | |||||
Accrued compensation and benefits | 3,562 | 1,949 | (1,426 | ) | |||||||
Accrued expenses and other liabilities | (2,059 | ) | (5,129 | ) | (461 | ) | |||||
Net cash provided by operating activities | 42,124 | 82,708 | 104,668 | ||||||||
Cash flows provided by (used in) investing activities: | |||||||||||
Net additions to property and equipment | (3,121 | ) | (1,531 | ) | (2,187 | ) | |||||
Purchases of investment securities | (35,068 | ) | (204,571 | ) | (621,760 | ) | |||||
Proceeds from sale of investment securities | 110,739 | 331,526 | 529,207 | ||||||||
Net purchases of derivatives | 620 | — | (1,720 | ) | |||||||
Contributions to partnership investments | (306 | ) | (35,005 | ) | (2,034 | ) | |||||
Distributions from partnership investments | 23,497 | 2,226 | 17,502 | ||||||||
Net cash paid for acquisition | (55 | ) | — | — | |||||||
Net cash provided by (used in) investing activities | 96,306 | 92,645 | (80,992 | ) | |||||||
Cash flows used in financing activities: | |||||||||||
Repayment of long-term debt | — | (46,160 | ) | — | |||||||
Deferred tax benefit (expense) on vesting under stock incentive plans | 74 | 54 | (55 | ) | |||||||
Repurchase of common stock by Calamos Investments LLC (1,339,103 at December 31, 2015, 1,849,729 at December 31, 2014, and 1,220,330 at December 31, 2013 Class A common shares) | (15,243 | ) | (22,470 | ) | (13,196 | ) | |||||
Equity distributions paid to non-controlling interests (Calamos Interests) | (27,228 | ) | (71,571 | ) | (28,010 | ) | |||||
Tax distributions paid to non-controlling interests (Calamos Interests) | (16,067 | ) | (28,909 | ) | (40,158 | ) | |||||
Cash dividends paid to common stockholders | (10,534 | ) | (10,090 | ) | (9,975 | ) | |||||
Net cash used in financing activities | (68,998 | ) | (179,146 | ) | (91,394 | ) | |||||
Net increase (decrease) in cash and cash equivalents | 69,432 | (3,793 | ) | (67,718 | ) | ||||||
Cash and cash equivalents at end of period | $ | 104,717 | $ | 35,285 | $ | 39,078 | |||||
Supplemental disclosure of cash flow information: | |||||||||||
Cash paid (refunded) for: | |||||||||||
Income taxes, net | $ | (1,929 | ) | $ | (1,484 | ) | $ | 1,507 | |||
Interest | $ | 3,032 | $ | 5,954 | $ | 5,954 | |||||
Non-cash activity: | |||||||||||
- During the second quarter of 2014, Calamos Investments, through its wholly owned subsidiaries and affiliates, acquired a majority interest in Calamos Global Opportunities Fund LP, which resulted in the consolidation of this partnership and an increase of $73.4 million in redeemable non-controlling interest in partnership investments. | |||||||||||
- On December 26, 2014, Calamos Arista Strategic Fund LP was liquidated and the redemptions were completed subsequent to December 31, 2014, therefore, the amount due to non-controlling interest of $7.7 million related to this partnership investment is presented in liabilities of partnership investments. | |||||||||||
See accompanying notes to consolidated financial statements.
F-8
CALAMOS ASSET MANAGEMENT, INC.
NOTES TO CONSOLIDATED FINANCIAL STATEMENTS
(1) Organization and Description of Business
Calamos Asset Management, Inc. (“CAM”) is a holding company and as of December 31, 2015 owned 22.2% of Calamos Investments LLC (“Calamos Investments”). CAM, together with Calamos Investments and Calamos Investments’ subsidiaries (the “Company”), operates the investment advisory and distribution services businesses reported within these consolidated financial statements. CAM operates and is the sole manager, and thus controls all of the business and affairs of Calamos Investments and, as a result of this control, consolidates the financial results of Calamos Investments with its own financial results. The remaining 77.8% ownership interest in Calamos Investments is held by Calamos Family Partners, Inc. (“CFP”), a Delaware corporation, and John P. Calamos, Sr. the Chairman, Chief Executive Officer and Global Co-Chief Investment Officer of CAM. CFP and John P. Calamos, Sr. (collectively “Calamos Interests”) ownership interest, in accordance with applicable rules, is reflected and referred to within these consolidated financial statements as “non-controlling interests in Calamos Investments LLC”.
The Company primarily provides investment advisory services to individuals and institutional investors through a series of investment products that include open-end and closed-end funds ("funds”), an exchange traded fund, separate accounts, offshore funds and partnerships. The subsidiaries through which the Company provides these services include: Calamos Advisors LLC (“CAL”), a Delaware limited liability company and registered investment advisor; Calamos Financial Services LLC (“CFS”), a Delaware limited liability company and registered broker-dealer; Calamos Wealth Management LLC, a Delaware limited liability company and registered investment advisor; and Calamos Investments LLP (formerly known as Calamos International LLP), a United Kingdom limited liability partnership, registered investment advisor with the Financial Conduct Authority in the United Kingdom, and a global distributor of the offshore funds and Company products.
(2)Summary of Significant Accounting Policies
Basis of Presentation
The consolidated financial statements are prepared in accordance with accounting principles generally accepted in the United States of America (“GAAP”), which require the use of estimates and assumptions that affect the reported amounts of assets, liabilities, revenues and expenses, and the disclosure of contingent assets and liabilities. Management believes the accounting estimates are appropriate and reasonably stated; however, due to the inherent uncertainties in making estimates, actual amounts could differ from these estimates.
Principles of Consolidation
The Company consolidates investments in which the Company’s ownership exceeds 50% or in which the Company operates and controls the business and affairs of the entity or is deemed to be the primary beneficiary. In order to make this determination, an analysis is performed to determine if the investment in an affiliate or partnership is a variable interest entity ("VIE"). The Company has evaluated its investments in affiliates and partnerships and has concluded that they are not VIEs. With respect to partnership investments, the limited partners have no control of the business and affairs of the partnership, no substantive ability to dissolve (liquidate) the partnership, or otherwise remove the general partner (CAL and Calamos Investments) without cause or have other substantive rights.
The consolidated financial statements include the financial statements of CAM, Calamos Investments, Calamos Investments’ wholly- and majority-owned subsidiaries, and the Company’s partnerships in which it owns a majority interest or in which it has operating control. The equity method of accounting is used for investments in which the Company has significant influence, but less than 50% ownership. Intercompany balances and transactions have been eliminated.
The Calamos Interests’ combined 77.8% interest in Calamos Investments at December 31, 2015 and 2014, is represented as a non-controlling interest in Calamos Investments LLC in the Company’s consolidated financial statements. Non-controlling interest in Calamos Investments is derived by multiplying the historical equity of Calamos Investments by the Calamos Interests’ aggregate ownership percentage for the periods presented. Issuances and repurchases of CAM’s common stock may result in changes to CAM’s ownership percentage and to the non-controlling interests’ ownership percentage of Calamos Investments with resulting changes reflected in the consolidated statements of changes in equity. Income is allocated based on the average ownership interest during the period in which the income is earned.
CAM owns certain assets to which common stockholders have exclusive economic rights. As of December 31, 2015, 2014 and 2013, these assets include cash, cash equivalents and investment securities of $77.3 million, $79.3 million and $78.3 million, net current and non-current deferred tax assets of $38.3 million, $40.3 million and $46.7 million, and net current income taxes receivable
F-9
CALAMOS ASSET MANAGEMENT, INC.
NOTES TO CONSOLIDATED FINANCIAL STATEMENTS – (Continued)
of $355,000, $2.4 million and $2.3 million, respectively, and a loan receivable from Calamos Investments of $25.0 million and $21.0 million, respectively, as of December 31, 2015, and 2014, that are reported together with Calamos Investments’ consolidated assets in the consolidated statements of financial condition. Additionally, net income before income taxes, of $23.7 million, $76.6 million and $107.6 million, respectively, for the years ended December 31, 2015, 2014 and 2013, each included $1.0 million, $3.6 million and $2.0 million, respectively, of income on cash and cash equivalents and investment securities held solely by CAM. These portions of CAM’s income and expense are not affected by non-controlling interests.
Calamos Investments, through its wholly-owned subsidiaries and affiliates, is indirectly the general partner and controls the operations of Calamos Global Opportunities Fund LP, for which it acquired a majority interest in the partnership during the second quarter of 2014. The results of this partnership are included in the Company's consolidated financial statements for the years ended December 31, 2015 and 2014. Calamos Investments, through a wholly-owned subsidiary, was indirectly the general partner and controlled the operations of Calamos Arista Strategic Fund LP, a U.S. feeder fund, and Calamos Arista Strategic Fund Ltd, an offshore feeder fund, both to Calamos Arista Strategic Master Fund LTD, a hedge fund in the Cayman Islands. As Calamos Investments was the general partner and controlled the operations of Calamos Arista Strategic Fund LP and Calamos Arista Strategic Fund Ltd, the results of these partnerships and the master fund were included in the Company’s consolidated financial results for the year ended December 31, 2014. Calamos Arista Strategic Fund LP was liquidated on December 26, 2014. The partnership redemptions were completed during the first quarter of 2015 for proceeds of $23.1 million. For the year ended December 31, 2014, the amount due to non-controlling interest of $7.7 million related to this partnership investment was presented in liabilities of partnership investments in our consolidated statements of financial condition. See Note 8, Partnership Investments, for more discussion regarding these funds.
For the periods the partnerships are consolidated, the assets and liabilities of the partnerships are presented as partnership investments and liabilities of partnership investments, respectively, in the consolidated statements of financial condition. The net income for these partnerships are included in investment and other income in the consolidated statements of operations, and the change in partnership investments is included in contributions to or distributions from partnership investments in the consolidated statements of cash flows. The underlying assets and liabilities that are being consolidated are described in Note 8, Partnership Investments. The combined interests of all of the consolidated partnerships not owned by the Company and that are redeemable at the option of the holder, are presented as redeemable non-controlling interest in partnership investments in the Company’s consolidated financial statements for the periods those partnerships were consolidated.
The Company holds non-controlling interests in certain other partnership investments that are included in partnership investments in the consolidated statements of financial condition. These other partnership investments are accounted for under the equity method.
Cash and Cash Equivalents
All highly liquid financial instruments with maturities of three months or less from date of purchase, consisting primarily of investments in insured money market accounts and money market funds are considered cash equivalents.
Receivables from Customers
Receivables from customers represent balances arising from contractual investment advisory services provided to separate account customers and are recorded on an accrual basis. Provisions for bad debt expense during the years ended December 31, 2015, 2014, and 2013 and allowance for doubtful accounts as of December 31, 2015 and 2014, were not material.
Investment Securities
The Company carries its investment securities at fair value. For a majority of the Company’s investments, fair values are determined based upon quoted prices in active markets. If quoted market prices are not available, the Company uses matrix, model or other similar pricing methods to determine fair value. Investment securities transactions are recorded on a trade-date basis.
Investment securities are classified as available-for-sale as the Company does not intend to trade these securities in the near term. Unrealized gains and losses on available-for-sale securities are excluded from earnings and are reported, net of income tax, as a separate component of equity until realized. Realized gains and losses from the sale of available-for-sale securities are determined on a specific identification basis and are included in investment and other income in the consolidated statements of operations.
Investment securities that are classified as trading securities are carried at fair value with all changes in the value of the securities going through current earnings. Therefore, both realized and unrealized gains and losses on these securities are included in investment and other income in the consolidated statements of operations.
On a quarterly basis, the Company conducts reviews to assess whether an other-than-temporary impairment exists on its available-for-sale investment securities. Other-than-temporary declines in value may exist when the fair value of an investment security has
F-10
CALAMOS ASSET MANAGEMENT, INC.
NOTES TO CONSOLIDATED FINANCIAL STATEMENTS – (Continued)
been below the carrying value for an extended period of time. If an other-than-temporary decline in value is determined to exist, the unrealized investment loss, net of tax is recognized in the consolidated statements of operations in the period in which the other-than-temporary decline in value occurs, as well as an accompanying permanent adjustment to accumulated other comprehensive income. See Note 6, Investment Securities for more discussion related to the other-than-temporary impairment charges recorded in 2015 and 2014.
Derivative Assets and Liabilities
From time to time, the Company enters into derivative contracts to mitigate the negative impact that changes in security prices may have on the investment portfolio. The Company does not measure effectiveness or meet the criteria for hedge accounting and therefore, records the changes in the fair value of these instruments in investment and other income in the consolidated statements of operations. The Company classifies derivatives as derivative assets and derivative liabilities in the consolidated statements of financial condition.
Goodwill and Intangible Assets, net
The Company’s goodwill represents the future economic benefits arising from Calamos Investments’ acquisitions of Black Capital LLC ("Black Capital") and Phineus Partners LLC ("Phineus"), that are not individually identified and separately recognized. Goodwill is assessed for impairment at the reporting unit level, Calamos Investments, at least annually, or whenever events or circumstances occur indicating that an impairment may have occurred. The goodwill impairment test is a two-step process. The first step requires the Company to estimate the fair value of its reporting unit and compare the fair value to the reporting unit’s carrying amount. If the fair value exceeds the carrying amount, the goodwill is not considered impaired. To the extent the reporting unit’s carrying amount exceeds its fair value, the reporting unit’s goodwill may be impaired and the second step of the impairment test must be performed. The second step involves assigning the reporting unit’s fair value to all of its recognized and unrecognized assets and liabilities as if the reporting unit had been acquired in a business combination in order to determine the implied fair value of the reporting unit’s goodwill. The implied fair value of the reporting unit’s goodwill is then compared to the carrying amount of goodwill to quantify an impairment loss, if any, which would equal the excess of the carrying amount of goodwill over the goodwill’s implied fair value. No impairment has been recorded for the years ended December 31, 2015, 2014 and 2013. See, Note 3, Acquisition for more discussion related to the acquisition of Phineus.
The Company's definite-lived intangible assets consist of separately-managed account relationships from the acquisition of Phineus that are amortized over three years. Intangible assets are reviewed for impairment whenever events or changes in circumstances indicate that the carrying amount of the asset may not be recoverable. No impairment has been recorded for the year ended December 31, 2015. See Note 4, Goodwill and Intangible Assets, Net for more discussion related to the acquired intangible assets.
Property and Equipment
Property and equipment are recorded at cost less accumulated depreciation and amortization. Depreciation and amortization is provided on a straight-line basis over the estimated useful lives of the assets, ranging from three to twenty years. Leasehold improvements are amortized over the shorter of their estimated useful lives or the remaining term of the lease, ranging from five to twenty years.
Property and equipment are reviewed for impairment when there is an indication that the carrying amount of an asset may not be recoverable. Carrying values are not recoverable when the undiscounted cash flows estimated to be generated by the assets are less than their carrying value. When an asset is determined to not be recoverable, the impairment loss is measured based on the excess, if any, of the carrying value of the asset over its respective fair value. Fair value is determined by discounted cash flows models, appraisals or other applicable methods.
Internally Developed Software
Certain internal and external development costs incurred in connection with developing or obtaining software for internal use are capitalized. These capitalized costs are included in property and equipment, net in the consolidated statements of financial condition and are amortized using the straight-line method over their estimated useful lives, ranging from three to five years. On an annual basis, the Company conducts reviews to assess the functionality and remaining useful lives of the capitalized software. Impairments of these assets, if any, are recognized in the consolidated statements of operations in the period in which the impairment occurs. For the year ended December 31, 2015, impairment for internally developed software was not material. No impairment for internally developed software was recorded for the year ended December 31, 2014. For the year ended December 31, 2013, the Company recorded impairment for its internally developed software totaling $199,000.
F-11
CALAMOS ASSET MANAGEMENT, INC.
NOTES TO CONSOLIDATED FINANCIAL STATEMENTS – (Continued)
Restricted Cash
The Company has a $430,000 security deposit that is restricted from the Company’s general corporate use and is being reported in other non-current assets in the consolidated statements of financial condition.
Treasury Stock
During the years ended December 31, 2015 and 2014, Calamos Investments repurchased 1,339,103 and 1,849,729, respectively, shares of Class A common stock, at an average purchase price of $11.38 and $12.15, respectively, and a total cost of $15.2 million and $22.5 million, respectively, under its share repurchase programs.
Calamos Investments completed a share repurchase program of 3 million shares of the Company's outstanding Class A common stock for a total cost of $34.8 million on June 13, 2014. The program was implemented primarily to manage the dilution from share issuances under the Company's incentive compensation plan. During the year ended December 31, 2014, Calamos Investments repurchased 1,779,670 shares of Class A common stock, at an average purchase price of $12.13 and a total cost of $21.6 million under this repurchase program. On November 13, 2014, the Company announced a repurchase of up to an additional 3 million shares of the Company's outstanding Class A common stock. During the year ended December 31, 2014, Calamos Investments repurchased 70,059 shares of Class A common stock, at an average purchase price of $12.54 and a total cost of $879,000 under this repurchase program.
As Calamos Investments is consolidated with CAM, the repurchased shares are reported as treasury shares. As such, CAM’s 22.2% ownership interest in these shares as of December 31, 2015 and 2014, totaling $3.4 million and $5.0 million, respectively, is reported in treasury stock, with Calamos Interests’ 77.8% ownership interest in these shares totaling $11.9 million and $17.5 million, respectively, reported in non-controlling interest in the consolidated statements of financial condition. The total shares repurchased are not included in the calculation of basic and diluted earnings per share in accordance with GAAP.
During 2015 and 2014, CAM redeemed 335,741 and 294,686, respectively, Class A common shares from Calamos Investments for a value of $3.9 million and $3.4 million, respectively, which represents the fair value of the shares on the date of redemption. As Calamos Investments is consolidated with CAM, the impact of the distribution reflecting the non-controlling interest is $3.1 million and $2.6 million, respectively.
For the years ended December 31, 2015 and 2014, dividends on shares held by Calamos Investments totaled $1.8 million and $1.2 million, respectively. The payment of these dividends increased Calamos Investments' equity resulting in a $1.4 million and $935,000, respectively, adjustment from additional paid in capital to non-controlling interest in Calamos Investments LLC, in the consolidated statement of changes in equity. This adjustment represents Calamos Interests' ownership interest in those dividend payments.
Compensation Plans
The Company has an incentive stock plan that provides for certain employees of the Company to receive stock based compensation in the form of restricted stock units (“RSUs”) and stock options. RSUs are convertible on a one-for-one basis into shares of the Company’s common stock. Stock option awards are based on shares of the Company’s common stock. The Company estimates the fair value of the options as of the grant date using the Black-Scholes option-pricing model. Stock based compensation expense is recognized based on the grant-date fair value of the award. The Company records compensation expense on a straight-line basis over the service period.
Revenue Recognition
The Company earns investment management fees by providing services pursuant to the terms of the underlying advisory contract. Fees are based on a contractual investment advisory fee applied to the assets in each portfolio. Any fees collected in advance are deferred and recognized over the period earned. Performance-based advisory fees from certain separate accounts are recognized annually upon completion of the contract year and based upon either (1) the difference between the investment returns on a client’s portfolio compared to a benchmark index or (2) the absolute percentage of gain in the client’s account. Performance-based advisory fees from the open-end funds are recognized monthly when earned and are based upon the differences between the investment returns of the respective fund compared to a benchmark index.
Distribution and underwriting fees consist primarily of Rule 12b-1 distribution and/or service fees from the open-end funds, contingent deferred sales charges on the redemption of open-end fund shares and sales charges earned on open-end funds. Distribution service fees are accrued monthly as services are performed and are based on the average daily assets of the open-end funds. Contingent deferred sales charges are recorded on a trade-date basis when earned, and sales charges are recorded on the settlement date.
F-12
CALAMOS ASSET MANAGEMENT, INC.
NOTES TO CONSOLIDATED FINANCIAL STATEMENTS – (Continued)
Net Interest Expense
Net interest expense represents interest expense incurred on debt net of interest income generated from cash and cash equivalents. Interest income is recognized when earned, and interest expense is recorded when incurred.
Investment and Other Income (Loss)
Investment and other income (loss) is primarily comprised of: realized gains (losses) from all investment securities and partnership investments; unrealized gains (losses) on trading securities and partnership investments; other-than-temporary impairment charges on available-for-sale securities, if any; realized and unrealized gains (losses) on derivatives; gains (losses) on foreign currency translation; and dividend income. Dividend income is recognized on the ex-dividend date.
Foreign Currency
Foreign currency balances are revalued into U.S. dollars, which is the functional currency of the Company, at prevailing exchange rates on the reporting date. Revenues earned and expenses incurred in foreign currency are revalued at average exchange rates during the reporting period. Gains and losses arising from the revaluation of account balances denominated in foreign currencies are recognized in investment and other income in the consolidated statements of operations.
Income Taxes
Deferred tax assets and liabilities are recognized for the future tax consequences attributable to the temporary differences between the financial statement carrying amount of existing assets and liabilities and their respective tax basis. Deferred tax assets and liabilities are measured using enacted tax rates expected to apply to taxable income in the years in which those temporary differences are expected to be recovered or settled. During 2014, the Company recorded a valuation allowance adjustment to reduce its deferred income tax assets to an amount that is more likely than not to be realized based on available evidence at the time estimates are made. Although valuation allowances may be established to reduce the amounts expected to be realized, there was no deferred tax asset valuation allowance at December 31, 2015 and 2014.
Future interest or penalties related to uncertain income tax positions are recognized in income tax provision when determined. The Company did not record any accrued interest or penalties related to uncertain tax positions through December 31, 2015.
Advertising Costs
Advertising costs are expensed as incurred and are included in marketing and sales promotion expenses in the consolidated statements of operations. For the years ended December 31, 2015, 2014 and 2013, advertising costs were $3.9 million, $3.8 million and $3.7 million, respectively.
Earnings Per Share
Basic earnings per share is computed by dividing net income attributable to CAM by the weighted average number of shares of Class A and Class B common stock outstanding during each year. Shares issued or repurchased during the year are weighted for the portion of the year that they were outstanding. Diluted earnings per share reflects the potential dilution that would occur if RSUs and stock options granted to participants of the Company incentive compensation plan were exercised and if the Calamos Interests exchanged all of their ownership interest in Calamos Investments and their Class B common stock for shares of Class A common stock. Diluted shares which result in anti-dilution are excluded from the diluted earnings per share calculation and are detailed in Note 18, Earnings Per Share.
(3) Acquisition
On September 30, 2015, Calamos Investments acquired Phineus, a long/short equity investment firm located in San Francisco, California for a total purchase price of $1.0 million. The acquisition enhances the Company’s product offerings and role as an innovator in the liquid alternatives space. The purchase price consisted of $55,000 cash paid to the selling shareholder with the remaining balance as contingent consideration payable annually over the next three years. This future obligation is reported at fair value in other current and non-current liabilities.
As part of the acquisition, the Company recognized $596,000 of definite-lived intangible assets related to separately-managed account relationships amortized over three years. The excess of the purchase price over the fair value of identifiable tangible and intangible assets acquired resulted in the recognition of $375,000 of goodwill. Acquisition-related expenses for professional services were expensed as incurred, and recorded in general and administrative expenses.
F-13
CALAMOS ASSET MANAGEMENT, INC.
NOTES TO CONSOLIDATED FINANCIAL STATEMENTS – (Continued)
(4) Goodwill and Intangible Assets, Net
The Company’s goodwill represents the future economic benefits arising from Calamos Investments’ acquisitions. The following table summarizes the changes in the carrying amount of goodwill as of December 31, 2015:
(in thousands) | Total | |||
Balance as of December 31, 2014 | $ | 6,380 | ||
Goodwill acquired during the period | 375 | |||
Balance as of December 31, 2015 | $ | 6,755 | ||
As part of the Phineus acquisition, the Company recognized $596,000 of definite-lived intangible assets related to separately-managed account relationships amortized over three years. For the year ended December 31, 2015, intangible assets, net of amortization expense of $50,000, was $546,000. Intangible asset amortization expense is included in general and administrative expenses in the consolidated statements of operations.
The following table summarizes the estimated amortization expense for 2016 through 2018:
(in thousands) | ||||
2016 | $ | 199 | ||
2017 | 198 | |||
2018 | 149 | |||
$ | 546 | |||
(5)Related-Party Transactions
CAL provides investment management and portfolio accounting services to the open-end funds and the closed-end funds. CFS acts as the sole distributor of the U.S. open-end funds. Calamos Investments LLP is the sole global distributor of the offshore funds. The Company earns management, distribution and portfolio accounting fees for these services that are accrued and settled monthly. The table below summarizes the total fees earned from affiliates identified above during the years ended December 31, 2015, 2014 and 2013:
(in thousands) | 2015 | 2014 | 2013 | ||||||||
Investment management fees from: | |||||||||||
Open-end funds | $ | 104,690 | $ | 119,898 | $ | 124,875 | |||||
Closed-end funds | 61,316 | 57,911 | 53,981 | ||||||||
Totals | $ | 166,006 | $ | 177,809 | $ | 178,856 | |||||
Distribution fees from open-end funds | $ | 41,006 | $ | 48,942 | $ | 53,143 | |||||
Portfolio accounting fees from: | |||||||||||
Open-end funds | $ | 1,529 | $ | 1,756 | $ | 1,810 | |||||
Closed-end funds | 766 | 727 | 679 | ||||||||
Totals | $ | 2,295 | $ | 2,483 | $ | 2,489 | |||||
In September 2012, CAL began providing investment management services to Calamos Arista Strategic Master Fund LTD, a hedge fund in the Cayman Islands. Calamos Arista Strategic Fund LP was a newly consolidated partnership and U.S. feeder fund to Calamos Arista Strategic Master Fund LTD. Management and incentive fees for those services were not material for the year ended December 31, 2015. For the years ended December 31, 2014 and 2013, management and incentive fees for those services were $58,000 and $85,000, respectively.
Calamos Investments is party to a lease with 1111 Warrenville Road LLC, a subsidiary of Calamos Property Holdings LLC (“CPH”). In January 2011, Calamos Investments and 1111 Warrenville Road LLC amended the lease in order to extend the term for two years with automatic one year renewals and to increase the base rent accordingly. Rent under the lease commenced in August 2005 and ended on December 31, 2015. For the years ended December 31, 2015, 2014 and 2013 annual base rent and operating expense payments were $765,000, $774,000 and $712,000, respectively.
Calamos Investments is party to a 20-year lease with 2020 Calamos Court LLC, a subsidiary of CPH, with respect to the corporate headquarters constructed for the Company’s occupancy. Rent under the lease commenced in April 2005 and will end on May 31,
F-14
CALAMOS ASSET MANAGEMENT, INC.
NOTES TO CONSOLIDATED FINANCIAL STATEMENTS – (Continued)
2025. For the years ended December 31, 2015, 2014 and 2013, annual base rent payments were $3.8 million, $3.7 million and $3.6 million, respectively. Annual base rent payments increase by 3% annually for the remaining term of the lease. Calamos Investments may not terminate the lease unless a casualty, condemnation or temporary government taking affects all or a substantial portion of the leased premises. 2020 Calamos Court LLC may only terminate the lease upon specified events of default, which are subject to applicable grace periods.
Calamos Investments is party to an agreement with Primacy Business Center LLC (“Primacy”), a subsidiary of CFP, where office space at the Company’s corporate headquarters is subleased to Primacy. The lease expires December 31, 2016, but automatically extends annually. Calamos Investments recognized sublease rental income of $275,000 for the year ended December 31, 2015, and $277,000 for each of the years ended December 31, 2014 and 2013, which is classified as other income and included in investment and other income in the consolidated statements of operations.
Calamos Investments is party to a 20-year lease with 2020 Calamos Court Annex LLC, a subsidiary of CPH, with respect to the cafeteria in the Company’s corporate headquarters. Rent under the lease commenced in December 2005 and will end on May 31, 2025. For the years ended December 31, 2015, 2014 and 2013, annual base rent and operating expense payments were $310,000, $321,000 and $300,000, respectively. Annual base rent payments increase by 3% annually for the remaining term of the lease.
Calamos Investments is party to an agreement with CF Restaurant Enterprises LLC (“CFRE”), a subsidiary of CFP, where CFRE provides food and beverage services to Calamos Investments. Calamos Investments guarantees minimum daily revenues and CFRE agrees that certain quantities and combinations of food and beverage will be available at a predetermined price. For the years ended December 31, 2015, 2014 and 2013, Calamos Investments incurred expenses of $959,000, $940,000 and $956,000, respectively.
Calamos Investments is party to a 7.5 year lease with CityGate Centre I LLC, a subsidiary of CPH, with respect to office space. Rent payments under the lease commenced in May 2008 and ended on April 30, 2015. For the years ended December 31, 2015, 2014 and 2013, annual base rent and operating expense payments were $343,000, $990,000 and $943,000, respectively. Annual base rent payments increased by 2.5% annually.
Calamos Investments headquarter campus is owned and operated by CPH and its subsidiaries (collectively, “CityGate Centre”) and is utilized by the Company to promote its business and brand awareness both in the local community and with its visiting strategic clients. CityGate Centre offers amenities such as hotel accommodations, restaurants and event planning services. For the years ended December 31, 2015, 2014 and 2013, Calamos Investments had expense payments of $662,000, $530,000 and $533,000, respectively, related to these services.
Dragon Leasing Corporation (“Dragon”) is an affiliated company controlled by a principal of the Company. CFP, CPH and Dragon have each entered into agreements with CAM, whereby the parties provide to each other certain services and resources, including furnishing office space and equipment, providing insurance coverage, overseeing the administration of their businesses and providing personnel to perform certain management and administrative services. These agreements have a term of one year and are renewable annually. The agreements are terminable on 30 days' notice by either party. In accordance with the terms of the agreements, the parties have agreed to pay each other an amount equal to the direct out-of-pocket expenses paid or incurred plus an allocation of indirect expenses, such as employee compensation and benefits.
The following table summarizes fees that have been recorded as expense allocations during the twelve months ended and the net receivable balance as of December 31, 2015, 2014 and 2013:
(in thousands) | 2015 | 2014 | 2013 | ||||||||
Expense allocated from the Company to CPH | $ | 507 | $ | 590 | $ | 556 | |||||
Expense allocated from the Company to CFP | 254 | 243 | 236 | ||||||||
Expense allocated from the Company to Dragon | 15 | 16 | 16 | ||||||||
Total expenses allocated from the Company to affiliates | 776 | 849 | 808 | ||||||||
Expense allocated from CPH and CFP to the Company | 638 | 173 | 151 | ||||||||
Net expense allocated from the Company to affiliates | $ | 138 | $ | 676 | $ | 657 | |||||
Net receivable for management services from CPH | $ | 35 | $ | 40 | $ | 43 | |||||
Net receivable (payable) for management services from CFP | $ | (7 | ) | $ | (11 | ) | $ | 9 | |||
Net receivable for management services from Dragon | $ | 1 | $ | 1 | $ | 1 | |||||
F-15
CALAMOS ASSET MANAGEMENT, INC.
NOTES TO CONSOLIDATED FINANCIAL STATEMENTS – (Continued)
As a result of the control exercised by CFP, none of our agreements with CFP and other companies controlled by them are deemed to be negotiated on “arm’s length” terms. However, while not mandated, to date, any such agreements since the Company's initial public offering have been approved in accordance with the Conflict of Interests Policy contained in the Company's Second Amended and Restated Certificate of Incorporation.
(6)Investment Securities
The following table provides a summary of investment securities as of December 31, 2015 and 2014:
(in thousands) | ||||||||||||||||
December 31, 2015 | Cost | Unrealized Gains | Unrealized Losses | Fair Value | ||||||||||||
Available-for-sale securities: | ||||||||||||||||
Funds | ||||||||||||||||
Global Equity | $ | 124,929 | $ | 6,606 | $ | (46 | ) | $ | 131,489 | |||||||
U.S. Equity | 62,839 | 2,914 | (44 | ) | 65,709 | |||||||||||
Fixed Income | 16,922 | 58 | (15 | ) | 16,965 | |||||||||||
Multi-Strategy | 16,150 | 208 | (133 | ) | 16,225 | |||||||||||
Alternative | 14,153 | 125 | (191 | ) | 14,087 | |||||||||||
Convertible | 5,093 | — | (14 | ) | 5,079 | |||||||||||
Total Funds | 240,086 | 9,911 | (443 | ) | 249,554 | |||||||||||
Common stock | 141 | 181 | — | 322 | ||||||||||||
Total available-for-sale securities | $ | 240,227 | $ | 10,092 | $ | (443 | ) | $ | 249,876 | |||||||
Trading securities: | ||||||||||||||||
Funds | ||||||||||||||||
U.S. Equity | $ | 5,194 | $ | — | $ | (478 | ) | $ | 4,716 | |||||||
Global Equity | 2,500 | — | (35 | ) | 2,465 | |||||||||||
Total trading securities | $ | 7,694 | $ | — | $ | (513 | ) | $ | 7,181 | |||||||
Total investment securities | $ | 257,057 | ||||||||||||||
(in thousands) | ||||||||||||||||
December 31, 2014 | Cost | Unrealized Gains | Unrealized Losses | Fair Value | ||||||||||||
Available-for-sale securities: | ||||||||||||||||
Funds | ||||||||||||||||
Global Equity | $ | 142,610 | $ | 5,275 | $ | (1,872 | ) | $ | 146,013 | |||||||
U.S. Equity | 74,505 | 3,480 | (581 | ) | 77,404 | |||||||||||
Fixed Income | 17,596 | 1 | (423 | ) | 17,174 | |||||||||||
Multi-Strategy | 1,494 | 198 | (9 | ) | 1,683 | |||||||||||
Alternative | 40,752 | 1,283 | (4 | ) | 42,031 | |||||||||||
Convertible | 10,163 | 15 | (1 | ) | 10,177 | |||||||||||
Total Funds | 287,120 | 10,252 | (2,890 | ) | 294,482 | |||||||||||
Common stock | 136 | 125 | — | 261 | ||||||||||||
Total available-for-sale securities | $ | 287,256 | $ | 10,377 | $ | (2,890 | ) | $ | 294,743 | |||||||
Trading securities: | ||||||||||||||||
Funds | ||||||||||||||||
U.S. Equity | $ | 52,147 | $ | 33 | $ | (6,964 | ) | $ | 45,216 | |||||||
Total investment securities | $ | 339,959 | ||||||||||||||
F-16
CALAMOS ASSET MANAGEMENT, INC.
NOTES TO CONSOLIDATED FINANCIAL STATEMENTS – (Continued)
The investment in Funds at December 31, 2015 and 2014, of $256.7 million and $339.7 million, respectively, were invested in affiliated funds and accounts that are separately managed.
The aggregate fair value of available-for-sale investment securities that were in an unrealized loss position at December 31, 2015 and 2014 was $12.5 million and $98.1 million, respectively. As of December 31, 2015 and 2014, the Company had no investment securities that had been in a continuous loss position for 12 months or longer.
The Company recorded other-than-temporary impairment charges of $12.9 million and $667,000, respectively, on certain available-for-sale securities with unrealized losses during 2015 and 2014. The other-than-temporary impairment charges were reported in non-operating income (loss), in the consolidated statements of operations.
As of December 31, 2015 and 2014, the Company believes that the remaining $443,000 and $2.9 million, respectively, in unrealized losses on certain available-for-sale securities are only temporary in nature, as these losses are a result of short-term declines in the net asset value of the funds. Further, the Company has the intent and ability to hold these securities for a period of time sufficient to allow for recovery of the market value. The Company also considered current market conditions and the nature of the securities held when determining the recoverability of those securities market value.
The following table provides a summary of changes in investment securities for the years ended December 31, 2015, 2014 and 2013:
(in thousands) | 2015 | 2014 | 2013 | ||||||||
Available-for-sale securities: | |||||||||||
Proceeds from sales | $ | 70,642 | $ | 293,662 | $ | 524,968 | |||||
Gross realized gains on sales | $ | 3,946 | $ | 11,024 | $ | 25,882 | |||||
Trading securities: | |||||||||||
Change in unrealized gains (losses) | $ | 6,418 | $ | 1,315 | $ | (8,813 | ) | ||||
The table below summarizes the tax provision (benefit) on unrealized gains (losses) and gains reclassified out of accumulated other comprehensive income (loss) on available-for-sale securities for the years ended December 31, 2015, 2014 and 2013:
2015 | 2014 | 2013 | |||||||||||||||||||||||||||||||||
(in thousands) | Before-Tax Amount | Tax Provision (Benefit) | After-Tax Amount | Before-Tax Amount | Tax Provision (Benefit) | After-Tax Amount | Before-Tax Amount | Tax Provision (Benefit) | After-Tax Amount | ||||||||||||||||||||||||||
Available-for-sale securities: | |||||||||||||||||||||||||||||||||||
Changes in unrealized gains | $ | 4,817 | $ | 395 | $ | 4,422 | $ | 3,173 | $ | 404 | $ | 2,769 | $ | 39,630 | $ | 3,793 | $ | 35,837 | |||||||||||||||||
Reclassification adjustment for realized gains included in income | (2,654 | ) | (505 | ) | (2,149 | ) | (12,012 | ) | (1,324 | ) | (10,688 | ) | (19,732 | ) | (1,679 | ) | (18,053 | ) | |||||||||||||||||
Other comprehensive income (loss) | $ | 2,163 | $ | (110 | ) | $ | 2,273 | $ | (8,839 | ) | $ | (920 | ) | $ | (7,919 | ) | $ | 19,898 | $ | 2,114 | $ | 17,784 | |||||||||||||
Reclassification of realized gains out of accumulated other comprehensive income (loss) are reported in non-operating income (loss), in investment and other income (loss), in the consolidated statement of operations. See Note 16, Non-Operating Income (Loss).
(7)Derivative Assets and Liabilities
The Company used exchange-traded option contracts as an economic hedge of price changes in its investment securities portfolio in order to reduce the volatility equity markets had on the fair value of the Company's corporate investment portfolio and that could result in realized or unrealized gains and losses. The Company's investment securities, totaling $257.1 million at December 31, 2015, consist primarily of positions in several Calamos equity and fixed income funds. The equity price risk in the investment portfolio was hedged using exchange-traded option contracts that correlate most closely with the change in value of the portfolio being hedged. The use of these option contracts was part of a hedge overlay strategy to minimize downside risk in the hedged
F-17
CALAMOS ASSET MANAGEMENT, INC.
NOTES TO CONSOLIDATED FINANCIAL STATEMENTS – (Continued)
portfolio. The Company may adjust its hedge position in response to movement and volatility in prices and changes in the composition of the hedged portfolio, but generally is not actively buying and selling contracts.
The Company has elected not to offset its derivative assets with its derivative liabilities even if a right of offset exists. When applicable, the fair value of option contracts is reported on a gross basis in derivative assets and derivative liabilities in the consolidated statements of financial condition. Net gains and losses on these contracts are reported in investment and other income (loss) in the consolidated statements of operations with net losses of $544,000, $1.8 million and $1.9 million for the years ended December 31, 2015, 2014 and 2013, respectively. The Company used these derivatives for risk management purposes but has not designated the contracts as hedges for accounting purposes. The Company had $4.3 million of derivative assets and $5.5 million of derivative liabilities outstanding as of December 31, 2015. The Company had no derivative instruments outstanding as of December 31, 2014.
(8)Partnership Investments
Presented below are the underlying assets and liabilities of the partnerships that the Company reports on a consolidated basis, as well as partnership investments that the Company accounts for under the equity method. These investments are presented as partnership investments and liabilities of partnership investments, respectively, in its consolidated statements of financial condition as of December 31, 2015 and 2014.
(in thousands) | 2015 | 2014 | |||||
Consolidated partnerships: | |||||||
Assets | |||||||
Securities owned | $ | 106,667 | $ | 103,079 | |||
Cash and cash equivalents | 5,356 | 39,205 | |||||
Other current assets | 500 | 1,188 | |||||
Exchange-traded option contracts | 87 | 201 | |||||
Total assets of consolidated partnerships | $ | 112,610 | $ | 143,673 | |||
Liabilities | |||||||
Payables for securities purchased | $ | — | $ | (2,256 | ) | ||
Due to non-controlling interest in partnership investments | — | (7,719 | ) | ||||
Accrued expenses and other current liabilities | (75 | ) | (142 | ) | |||
Total liabilities of consolidated partnerships | $ | (75 | ) | $ | (10,117 | ) | |
Equity method investment in partnerships | $ | 30 | $ | 50 | |||
Profits and losses are allocated to the general partner and limited partners in proportion to their ownership interests at the beginning of each month. Partners' admissions, additional contributions and withdrawals are permitted on a monthly basis.
During the second quarter of 2014, Calamos Investments, through its wholly owned subsidiaries and affiliates, acquired a majority interest in Calamos Global Opportunities Fund LP. This investment is presented as a consolidated partnership for the years ended December 31, 2015 and 2014, in the table above.
As of December 31, 2015 and 2014, the Company held non-controlling interests in another partnership and therefore, accounted for this investment using the equity method. This investment is presented as an equity method investment in partnerships in the table above.
Calamos Arista Strategic Fund LP was liquidated on December 26, 2014, and as of December 31, 2014, the net assets were $30.8 million. The partnership redemptions were completed subsequent to December 31, 2014.
F-18
CALAMOS ASSET MANAGEMENT, INC.
NOTES TO CONSOLIDATED FINANCIAL STATEMENTS – (Continued)
(9) | Fair Value Measurements |
The Company utilizes a three-tier fair value hierarchy which prioritizes the inputs used in measuring fair value as follows: Level 1 — observable inputs such as quoted prices for identical assets and liabilities in active markets; Level 2 — inputs, other than the quoted prices in active markets, that are observable either directly or indirectly (including quoted prices of similar securities, interest rates, credit risk, fair value adjustments to quoted foreign securities, etc.); and Level 3 — unobservable inputs in which there is little or no market data, and require the reporting entity to develop its own assumptions. For each period presented, the Company did not have any assets or liabilities measured at fair value using Level 3 measurements. Transfers between levels are measured at the end of the reporting period. The Company had no transfers between levels during the years ended December 31, 2015 and 2014.
Investments are presented in the consolidated financial statements at fair value in accordance with GAAP. Investments in open-end funds are stated at fair value based on end of day published net asset values of shares owned by the Company. The fair value of investments in open-end funds was $228.1 million and $312.8 million at the end of December 31, 2015 and 2014, respectively. There are no unfunded commitments related to these investments. These investments may be redeemed daily with a redemption notice period of up to seven days. Investments in securities traded on a national securities exchange are stated at the last reported sales price on the day of valuation. Other securities, including derivatives, traded in the over-the-counter market and listed securities for which no sale was reported on that date are stated at the last quoted bid price. However, short sales positions and call options written are reported at the last quoted asked price. Convertible bonds, fixed income securities and other securities for which quotations are not readily available are valued at fair value based on observable inputs such as market prices for similar instruments as validated by third party pricing agencies and the Company’s prime broker. Debt securities are valued based upon evaluated prices received from an independent pricing service or from a dealer or broker who makes markets in such securities. Pricing services utilize various observable market data and as such, debt securities are generally categorized as Level 2.
The following tables provide the hierarchy of inputs used to derive the fair value of the Company’s assets and liabilities measured at fair value on a recurring basis as of December 31, 2015 and 2014. Foreign currency contracts are carried in the Company's partnership investments and are presented on a net basis where the right of offset exists, and had no impact for either period presented.
F-19
CALAMOS ASSET MANAGEMENT, INC.
NOTES TO CONSOLIDATED FINANCIAL STATEMENTS – (Continued)
Fair Value Measurements Using | ||||||||||||
(in thousands) Description | December 31, 2015 | Quoted Prices in Active Markets for Identical Assets and Liabilities (Level 1) | Significant Other Observable Inputs (Level 2) | |||||||||
Cash and cash equivalents | ||||||||||||
Money market funds | $ | 25,240 | $ | 25,240 | $ | — | ||||||
Investment securities (Note 6) | ||||||||||||
Funds | ||||||||||||
Global Equity | 133,954 | 133,954 | — | |||||||||
U.S. Equity | 70,425 | 70,425 | — | |||||||||
Fixed Income | 16,965 | 12,097 | 4,868 | |||||||||
Multi-Strategy | 16,225 | 16,225 | — | |||||||||
Alternative | 14,087 | 14,087 | — | |||||||||
Convertible | 5,079 | 5,079 | — | |||||||||
Total Funds | 256,735 | 251,867 | 4,868 | |||||||||
Common stock | 322 | 322 | — | |||||||||
Total investment securities | 257,057 | 252,189 | 4,868 | |||||||||
Derivative assets (Note 7) | ||||||||||||
Exchange-traded option contracts | 4,311 | 4,311 | — | |||||||||
Securities and derivatives owned by partnership investments (Note 8) | ||||||||||||
Common stocks | 53,467 | 27,899 | 25,568 | |||||||||
Preferred stocks | 3,875 | 3,875 | — | |||||||||
Convertible bonds | 48,369 | — | 48,369 | |||||||||
Corporate bonds | 957 | — | 957 | |||||||||
Money market funds | 5,309 | 5,309 | — | |||||||||
Exchange-traded put option contracts | 87 | 87 | — | |||||||||
Total securities and derivatives owned by partnership investments | 112,064 | 37,170 | 74,894 | |||||||||
Derivative liabilities (Note 7) | ||||||||||||
Exchange-traded option contracts | (5,475 | ) | (5,475 | ) | — | |||||||
Total | $ | 393,197 | $ | 313,435 | $ | 79,762 | ||||||
F-20
CALAMOS ASSET MANAGEMENT, INC.
NOTES TO CONSOLIDATED FINANCIAL STATEMENTS – (Continued)
Fair Value Measurements Using | ||||||||||||
(in thousands) Description | December 31, 2014 | Quoted Prices in Active Markets for Identical Assets and Liabilities (Level 1) | Significant Other Observable Inputs (Level 2) | |||||||||
Cash and cash equivalents | ||||||||||||
Money market funds | $ | 1,209 | $ | 1,209 | — | |||||||
Investment securities (Note 6) | ||||||||||||
Funds | ||||||||||||
Global Equity | 146,013 | 146,013 | — | |||||||||
U.S. Equity | 124,744 | 124,744 | — | |||||||||
Fixed Income | 17,174 | 12,203 | 4,971 | |||||||||
Multi-Strategy | 1,683 | 1,683 | — | |||||||||
Alternative | 42,031 | 42,031 | — | |||||||||
Convertible | 11,021 | 11,021 | — | |||||||||
Total Funds | 342,666 | 337,695 | 4,971 | |||||||||
Common stock | 261 | 261 | — | |||||||||
Total investment securities | 342,927 | 337,956 | 4,971 | |||||||||
Securities and derivatives owned by partnership investments (Note 8) | ||||||||||||
Common stocks | 51,403 | 26,237 | 25,166 | |||||||||
Preferred stocks | 5,736 | 2,281 | 3,455 | |||||||||
Convertible bonds | 41,119 | — | 41,119 | |||||||||
Corporate bonds | 4,821 | — | 4,821 | |||||||||
Money market funds | 37,060 | 7,851 | 29,209 | |||||||||
Exchange-traded put option contracts | 201 | 201 | — | |||||||||
Total securities and derivatives owned by partnership investments | 140,340 | 36,570 | 103,770 | |||||||||
Securities sold but not yet purchased (Note 7) | ||||||||||||
Common stocks | (2,968 | ) | (2,968 | ) | — | |||||||
Total | $ | 481,508 | $ | 372,767 | $ | 108,741 | ||||||
The fair value of the Company’s long-term debt, which has a total carrying value of $46.0 million at December 31, 2015 and 2014, was $51.6 million and $54.2 million, respectively, calculated using discounted cash flows based on the Company's incremental borrowing rates and market inputs for similar bonds. The fair value of the debt is based on Level 2 inputs within the fair value hierarchy.
At September 30, 2015, the Company recorded contingent consideration associated with its purchase of Phineus. The fair value and carrying value of the contingent consideration was $998,000 at December 31, 2015, and is included in other current and non-current liabilities in the consolidated statements of financial condition. For the year ended December 31, 2015, the change in the fair value of the contingent consideration is not material, and is included in other income in the consolidated statements of operations. The fair value of the contingent consideration is based on Level 3 unobservable inputs within the fair value hierarchy as it is calculated using certain assumptions regarding business performance and probability of payment.
The fair value and carrying value of the Company’s payment obligation associated with a previous acquisition was $1.7 million at December 31, 2014, reported in other current liabilities in the consolidated statements of financial condition. This obligation was paid in the third quarter of 2015. The fair value of the payment obligation was based on Level 2 inputs within the fair value hierarchy as it was calculated using discounted cash flows based on the Company’s incremental borrowing rates and market inputs for similar bonds.
The carrying value of all other financial instruments approximates fair value due to the short maturities of these financial instruments.
F-21
CALAMOS ASSET MANAGEMENT, INC.
NOTES TO CONSOLIDATED FINANCIAL STATEMENTS – (Continued)
(10) | Property and Equipment |
As of December 31, 2015 and 2014, property and equipment and related accumulated depreciation were as follows:
(in thousands) | 2015 | 2014 | |||||
Property and equipment: | |||||||
Furniture, fixtures and equipment | $ | 25,829 | $ | 25,421 | |||
Leasehold improvements | 29,553 | 32,062 | |||||
Computer software | 18,639 | 17,908 | |||||
Total costs | 74,021 | 75,391 | |||||
Accumulated depreciation and amortization | (60,713 | ) | (61,145 | ) | |||
Property and equipment, net | $ | 13,308 | $ | 14,246 | |||
Computer software includes both internally developed software and software purchased.
(11)Loans Payable
The Company has access to margin loans for the settlement of exchange-traded option contracts, as well as an additional source of liquidity. The interest rate that can be charged on margin loans is 1.75% per annum, based on the brokerage firm’s lending rate. These loans are due on demand. The Company had no margin loan balances outstanding at December 31, 2015 and 2014.
(12) | Debt |
In July 2007, Calamos Investments completed a private debt offering of $375 million aggregate principal senior unsecured notes, with three series consisting of $197 million of 6.33% notes due July 15, 2014, $85 million of 6.52% notes due July 15, 2017 and $93 million of 6.67% notes due July 15, 2019. On July 15, 2014, Calamos Investments repaid at maturity $46.2 million of the senior notes outstanding. In December 2008, the Company paid down a portion of its outstanding long-term debt and re-negotiated its debt covenants. As of December 31, 2015 and 2014, the outstanding balance of the notes totaled $46.0 million.
The table below summarizes the debt balance at December 31, 2015 and 2014:
(in thousands) | 2015 | 2014 | |||||
Senior unsecured notes: | |||||||
6.52% notes due July 15, 2017 | $ | 22,100 | $ | 22,100 | |||
6.67% notes due July 15, 2019 | 23,855 | 23,855 | |||||
Total long-term debt | $ | 45,955 | $ | 45,955 | |||
The table below summarizes the aggregate contractual annual maturities for the total debt balance at December 31, 2015:
(in thousands) | Contractual Maturities | ||
2016 | $ | — | |
2017 | 22,100 | ||
2018 | — | ||
2019 | 23,855 | ||
2020 | — | ||
Thereafter | — | ||
Total long-term debt | $ | 45,955 | |
Under the amended note purchase agreements governing the terms of these notes, Calamos Investments must maintain certain consolidated net worth in addition to leverage, investment and interest coverage ratios. The amended note purchase agreements also contain other covenants that, among other things, restrict the ability of Calamos Investments’ subsidiaries to incur debt and restrict the ability of Calamos Investments or its subsidiaries to create liens and to merge or consolidate, or sell or convey all or substantially all of Calamos Investments’ assets and places certain limitations on distributions and redemptions of equity interests. As of December 31, 2015 and 2014, the Company was in compliance with all covenants.
The weighted average interest rate on the notes is 6.60% over the remaining life of the notes.
F-22
CALAMOS ASSET MANAGEMENT, INC.
NOTES TO CONSOLIDATED FINANCIAL STATEMENTS – (Continued)
(13)Common Stock
All shares of Class A common stock and Class B common stock are identical and entitle the holders to the same rights and privileges, including dividend rights and liquidity rights, unless otherwise required by law. However, the holders of Class B common stock possess super-voting rights which represents a 97.4% voting interest in the Company.
(14)Profit Sharing Plan
The Company contributes to a defined contribution profit sharing plan (the "PSP Plan") covering substantially all employees. Contributions to the PSP Plan are at the discretion of the Company and include discretionary profit sharing and matching components. For the years ended December 31, 2015, 2014 and 2013, the Company recorded expense for the contributions to the PSP Plan in the amounts of $3.6 million, $3.9 million and $2.5 million, respectively. This expense is included in employee compensation and benefits on the consolidated statements of operations.
(15)Stock Based Compensation
Certain employees of the Company receive stock based compensation comprised of RSUs and stock options under the Company’s incentive compensation plan, which is designed to retain key employees. A total of 10,000,000 shares of CAM’s common stock may be granted under the plan. Historically, RSUs have been settled with newly issued shares so that no cash was used by the Company to settle awards; however, the Company may also use treasury shares upon the exercise of stock options and upon conversion of RSUs.
RSUs entitle each recipient to receive a share of Class A common stock and a dividend equivalent to the actual dividends declared on CAM’s Class A common stock. RSUs are granted with no strike price and, therefore, the Company receives no proceeds when the RSUs vest. These awards, including accrued dividends, vest at the end of the restriction period, generally not to exceed six years after the grant date, and are expensed on a straight-line basis over this period. For the years ended December 31, 2015, 2014 and 2013, 782,474 RSUs, 897,082 RSUs and 838,663 RSUs with an estimated fair value of $9.7 million, $10.7 million and $8.9 million, respectively, were awarded to employees of the Company in accordance with the provisions of the plan. A summary of the RSU activity follows:
Number of Shares | Weighted Average Grant Date Fair Value | |||||
Outstanding at December 31, 2012 | 2,612,106 | $ | 12.26 | |||
Granted | 838,663 | 10.66 | ||||
Forfeited | (407,656 | ) | 12.14 | |||
Exercised upon vesting | (458,138 | ) | 14.96 | |||
Outstanding at December 31, 2013 | 2,584,975 | 11.58 | ||||
Granted | 897,082 | 11.89 | ||||
Forfeited | (501,194 | ) | 11.00 | |||
Exercised upon vesting | (413,298 | ) | 12.27 | |||
Outstanding at December 31, 2014 | 2,567,565 | 11.69 | ||||
Granted | 782,474 | 12.46 | ||||
Forfeited | (702,363 | ) | 11.71 | |||
Exercised upon vesting | (461,430 | ) | 11.46 | |||
Outstanding at December 31, 2015 | 2,186,246 | 12.01 | ||||
Converted during the year ended December 31: | ||||||
2013 | 310,080 | $ | 10.87 | |||
2014 | 294,686 | 12.23 | ||||
2015 | 335,741 | 11.79 | ||||
As of December 31, 2015, the Company had 2,186,246 RSUs outstanding with a weighted average remaining contractual life of 2.6 years and an aggregate intrinsic value of $21.2 million. The weighted average fair value of RSUs at the date of grant for the years ended December 31, 2015, 2014 and 2013 were $12.46, $11.89 and $10.66 per share, respectively. The aggregate intrinsic value and the fair value of RSUs that vested and were exercised during 2015, 2014 and 2013 was $5.3 million, $5.1 million and $5.0 million, respectively.
F-23
CALAMOS ASSET MANAGEMENT, INC.
NOTES TO CONSOLIDATED FINANCIAL STATEMENTS – (Continued)
For the years ended December 31, 2015, 2014 and 2013, 461,430 RSUs, 413,298 RSUs and 458,138 RSUs, respectively, were vested and exercised and, after 125,689 RSUs, 118,612 RSUs and 148,058 RSUs, respectively, were withheld for taxes, 335,741 RSUs, 294,686 RSUs and 310,080 RSUs, respectively, were converted, on a one-for-one basis, for shares of CAM’s Class A common stock. The total intrinsic value and the fair value of the converted shares were $4.0 million, $3.6 million and $3.4 million, respectively. The total tax benefit realized in connection with the exercise of the RSUs during 2015, 2014 and 2013 were $511,000, $471,000 and $443,000, respectively, as the Company receives tax benefits equal to the fair value of CAM’s common stock on the exercise date, less the amount attributable to the non-controlling interest.
Stock options entitle each recipient to purchase a share of Class A common stock in exchange for the stated exercise price upon vesting of each award. Under the plan, the exercise price of each option, which has a 10-year life, equals the market price of the Company’s stock on the date of grant. No awards were granted during the years ended December 31, 2015, 2014 and 2013.
Summarized information on the Company’s outstanding stock options at December 31, 2015 was as follows:
Options Outstanding | Options Exercisable | |||||||||||||||
Range of Exercise Prices | Number of Shares | Average Remaining Contractual Life | Weighted Average Option Price | Number of Shares | Weighted Average Option Price | |||||||||||
$17.80 | 136,330 | 0.9 | $ | 17.80 | 136,330 | $ | 17.80 | |||||||||
$18.00 - $29.11 | 756,330 | 1.8 | $ | 22.37 | 756,330 | $ | 22.37 | |||||||||
$35.43 | 255,825 | 0.1 | $ | 35.43 | 255,825 | $ | 35.43 | |||||||||
1,148,485 | 1.4 | $ | 24.73 | 1,148,485 | $ | 24.73 | ||||||||||
The outstanding options do not have an intrinsic value as the exercise price exceeded the market value.
A summary of the stock option activity was as follows:
Number of Shares | Weighted Average Exercise Price | |||||
Outstanding at December 31, 2012 | 2,195,414 | $ | 23.36 | |||
Forfeited/expired | (93,846 | ) | 21.94 | |||
Outstanding at December 31, 2013 | 2,101,568 | 23.42 | ||||
Forfeited/expired | (672,401 | ) | 19.49 | |||
Outstanding at December 31, 2014 | 1,429,167 | 25.27 | ||||
Forfeited/expired | (280,682 | ) | 27.80 | |||
Outstanding at December 31, 2015 | 1,148,485 | 24.73 | ||||
Exercisable at December 31: | ||||||
2013 | 1,910,292 | $ | 23.76 | |||
2014 | 1,429,167 | 25.27 | ||||
2015 | 1,148,485 | 24.73 | ||||
For the years ended December 31, 2015, 2014 and 2013, compensation expense recorded in connection with the RSUs and stock options was $6.3 million, $6.6 million and $7.0 million, respectively, of which $1.4 million, $1.5 million and $1.6 million, respectively, was credited as additional paid-in capital. For the years ended December 31, 2015, 2014 and 2013, the amount of deferred tax asset created was $518,000, $545,000 and $577,000, respectively. As of December 31, 2015, $12.3 million of total unrecognized compensation expense related to unvested stock option and RSU awards is expected to be recognized over a weighted average service period of 2.6 years.
F-24
CALAMOS ASSET MANAGEMENT, INC.
NOTES TO CONSOLIDATED FINANCIAL STATEMENTS – (Continued)
(16)Non-Operating Income (Loss)
Non-operating income (loss) was comprised of the following components for the years ended December 31, 2015, 2014 and 2013:
(in thousands) | 2015 | 2014 | 2013 | ||||||||
Interest income | $ | 199 | $ | 160 | $ | 257 | |||||
Interest expense | (3,070 | ) | (4,669 | ) | (6,021 | ) | |||||
Net interest expense | (2,871 | ) | (4,509 | ) | (5,764 | ) | |||||
Investment income (loss) | (5,513 | ) | 17,585 | 29,891 | |||||||
Dividend income | 1,589 | 1,987 | 5,355 | ||||||||
Miscellaneous other income | 177 | 341 | 193 | ||||||||
Investment and other income (loss) | (3,747 | ) | 19,913 | 35,439 | |||||||
Non-operating income (loss) | $ | (6,618 | ) | $ | 15,404 | $ | 29,675 | ||||
(17)Income Taxes
The income tax provision for the years ended December 31, 2015, 2014 and 2013 consists of the following:
(in thousands) | 2015 | 2014 | 2013 | ||||||||
Current: | |||||||||||
Federal | $ | (4,158 | ) | $ | (1,767 | ) | $ | (216 | ) | ||
State: | |||||||||||
CAM portion | (485 | ) | (92 | ) | 23 | ||||||
Calamos Interests portion | 42 | 178 | 56 | ||||||||
Foreign | 17 | 15 | — | ||||||||
Total current income tax benefit | (4,584 | ) | (1,666 | ) | (137 | ) | |||||
Deferred: | |||||||||||
Federal | 6,330 | 6,833 | 5,867 | ||||||||
State | 574 | 620 | 532 | ||||||||
Total deferred income tax provision | 6,904 | 7,453 | 6,399 | ||||||||
Total income tax provision | $ | 2,320 | $ | 5,787 | $ | 6,262 | |||||
Calamos Investments is subject to certain income-based state taxes; therefore, income tax provision reflects not only the portion attributed to CAM stockholders but also a portion of income tax provision attributable to non-controlling interests.
The Company files income tax returns in federal, state and foreign tax jurisdictions. The Company is subject to U.S. federal, state and local examinations by tax authorities for years 2012 – 2015.
F-25
CALAMOS ASSET MANAGEMENT, INC.
NOTES TO CONSOLIDATED FINANCIAL STATEMENTS – (Continued)
The following table reconciles the statutory federal income tax rate to the effective income tax rate for the years ended December 31, 2015, 2014 and 2013, respectively.
2015 | 2014 | 2013 | ||||||
Statutory U.S. federal income tax rate | 35.0 | % | 35.0 | % | 35.0 | % | ||
State income taxes, net of federal tax benefits | 2.1 | % | 2.0 | % | 2.0 | % | ||
Impact of expiring employee stock options | 4.6 | % | 2.4 | % | — | % | ||
Calamos Investments’ foreign and state income taxes | 1.0 | % | 1.1 | % | 0.3 | % | ||
Impact of deferred tax assets valuation allowance reversal | (2.8 | )% | (10.4 | )% | (12.2 | )% | ||
Other non-deductible items | 2.0 | % | 0.7 | % | 0.4 | % | ||
Impact on net deferred tax assets from change in statutory income tax rate | (0.5 | )% | (0.6 | )% | (0.3 | )% | ||
Effective income tax rate | 41.4 | % | 30.2 | % | 25.2 | % | ||
Calamos Interests state income taxes | (0.8 | )% | (0.9 | )% | (0.2 | )% | ||
CAM effective income tax rate | 40.6 | % | 29.3 | % | 25.0 | % | ||
Deferred income taxes reflect the expected future tax consequences of temporary differences between carrying amounts and tax bases of the Company’s assets and liabilities.
The significant components of deferred income taxes at December 31, 2015 and 2014 are as follows:
(in thousands) | 2015 | 2014 | |||||
Deferred tax assets: | |||||||
Intangible assets | $ | 26,545 | $ | 34,459 | |||
Federal capital loss carryforward | 1,942 | 169 | |||||
Federal net operating loss carryforward | 4,120 | — | |||||
State net operating loss carryforward | 624 | — | |||||
Differences between book basis and tax basis of investments | 3,202 | 4,165 | |||||
Stock-based compensation | 1,921 | 2,098 | |||||
Other | 1,208 | 698 | |||||
Total deferred tax assets | 39,562 | 41,589 | |||||
Deferred tax liabilities: | |||||||
Unrealized net holding gains on investments of available-for-sale securities | 793 | 902 | |||||
Deferred sales commission | 49 | 85 | |||||
Goodwill | 113 | 81 | |||||
Other | 303 | 260 | |||||
Total deferred tax liabilities | 1,258 | 1,328 | |||||
Net deferred tax assets | $ | 38,304 | $ | 40,261 | |||
Deferred tax assets and liabilities are reflected on the Company’s consolidated statements of financial condition as net deferred tax assets. The current and non-current portions of the net deferred tax asset were $8.3 million and $30.0 million, respectively, at December 31, 2015 and $9.2 million and $31.1 million, respectively, at December 31, 2014.
As of December 31, 2015, the Company’s net deferred income tax asset attributable to intangible assets was $26.5 million, which is being amortized and creating a tax benefit of $7.9 million per year over 15 years expiring during 2019. This deferred income tax asset was created as a result of the Company purchasing 20,000,000 membership units from CFP in 2004, whereby the Company made an election under Section 754 of the Internal Revenue Code to mark-to-market all qualified assets that it purchased, of which 17,000,000 membership units qualified for the stepped-up basis. Most of the assets receiving the stepped-up basis for tax purposes are in the form of intangible assets, such as management contracts, distribution contracts and intellectual property.
As of December 31, 2015, the Company’s federal capital loss carryforward was $5.2 million, of which $237,000 will expire in 2017 and $5.0 million will expire in 2020, if not used before the expiration dates. As of December 31, 2015, the Company did not have a valuation allowance on this deferred tax asset.
F-26
CALAMOS ASSET MANAGEMENT, INC.
NOTES TO CONSOLIDATED FINANCIAL STATEMENTS – (Continued)
As of December 31, 2015, the Company's federal net operating loss carryforward was $12.1 million, which will expire in 2035, if not used before the expiration date. As of December 31, 2015, the Company's total state net operating loss carryforward was $10.4 million, which will expire following each state's varying income tax statues and regulations.
As a result of Calamos Investments' acquisitions, the Company is amortizing goodwill in the amount of $7.4 million over 15 years, creating a deferred income tax liability.
As of December 31, 2015 and 2014, the Company had no material unrecognized tax benefits and it does not anticipate any unrecognized tax benefits arising in the next 12 months that would result in a material change to its financial position. A reconciliation is not provided, as the beginning and ending amounts of unrecognized benefits are zero with no interim additions, reductions or settlements.
(18)Earnings Per Share
The following table reflects the calculation of basic and diluted earnings per share:
(in thousands, except per share amounts) | 2015 | 2014 | 2013 | ||||||||
Earnings per share – basic: | |||||||||||
Earnings available to common shareholders | $ | 3,327 | $ | 13,530 | $ | 18,628 | |||||
Weighted average shares outstanding | 17,518 | 18,275 | 19,904 | ||||||||
Earnings per share – basic | $ | 0.19 | $ | 0.74 | $ | 0.94 | |||||
Earnings per share – diluted: | |||||||||||
Earnings available to common shareholders | $ | 3,327 | $ | 13,530 | $ | 18,628 | |||||
Weighted average shares outstanding | 17,518 | 18,275 | 19,904 | ||||||||
Dilutive impact of restricted stock units | 727 | 714 | 448 | ||||||||
Weighted average shares outstanding | 18,245 | 18,989 | 20,352 | ||||||||
Earnings per share – diluted | $ | 0.18 | $ | 0.71 | $ | 0.92 | |||||
When dilutive, diluted shares outstanding for 2015, 2014 and 2013 are calculated (a) assuming that Calamos Interests exchanged all of their ownership interest in Calamos Investments and their CAM Class B common stock for shares of CAM’s Class A common stock (the "Exchange") and (b) including the effect of outstanding dilutive equity incentive compensation awards. As of December 31, 2015, 2014 and 2013, the impact of the Exchange was anti-dilutive and, therefore, excluded from the calculation of diluted earnings per share.
The Company uses the treasury stock method to reflect the dilutive effect of unvested RSUs and unexercised stock options on diluted earnings per share. Under the treasury stock method, if the average market price of common stock increases above the option’s exercise price, the proceeds that would be assumed to be realized from the exercise of the option would be used to acquire outstanding shares of common stock. However, the awards may be anti-dilutive even when the market price of the underlying stock exceeds the option’s exercise price. This result is possible because compensation cost attributed to future services and not yet recognized is included as a component of the assumed proceeds upon exercise. The dilutive effect of such options and RSUs would increase the weighted average number of shares used in the calculation of diluted earnings per share.
The Company amended its certificate of incorporation requiring that the Exchange be based on a fair value approach (details of the amendment are set forth in the Company’s Schedule 14C filed with the Securities and Exchange Commission on January 12, 2009). The amendment results in the same or fewer shares of Class A common stock being issuable at the time of the Exchange.
The shares issuable upon the Exchange as presented are estimated solely on the formula as described in Schedule 14C that does not necessarily reflect all inputs used in a fair valuation. It is critical to note that this formula does not incorporate certain economic factors and as such, in the event of an actual Exchange, the majority of the Company’s independent directors may determine the fair market value of CAM’s net assets and its ownership in Calamos Investments. For example, premiums and/or discounts for control and marketability as well as a different discount rate for future cash flows may be applied. Therefore, the directors’ valuation may result in the actual number of shares being materially different from the shares presented. Further, based upon currently available information, the Company believes it is unlikely that any Exchange would transpire without a fair market valuation of CAM’s net assets and possibly an agreement by Calamos Interests to Exchange, based upon that fair market valuation.
F-27
CALAMOS ASSET MANAGEMENT, INC.
NOTES TO CONSOLIDATED FINANCIAL STATEMENTS – (Continued)
The following table shows the number of shares which were excluded from the computation of diluted earnings per share as they were anti-dilutive:
2015 | 2014 | 2013 | ||||||
Shares of Class A common stock issuable upon an Exchange of Calamos Interests’ ownership in Calamos Investments* | 11,537,504 | 27,916,544 | 34,594,896 | |||||
Restricted stock units | — | 174,523 | 558,473 | |||||
Stock options | 1,148,485 | 1,429,167 | 2,101,568 | |||||
Total | 12,685,989 | 29,520,234 | 37,254,937 | |||||
* Number of shares calculated with the value of Calamos Investments determined by using the closing price of our shares as of December 31, 2015 ($9.68), December 31, 2014 ($13.32) and December 31, 2013 ($11.84) as well as assuming said closing prices fully reflect all of CAM's assets; including the application of a 12% discount rate to certain deferred tax assets at each of December 31, 2015, 2014 and 2013. The value of Calamos Investments is then multiplied by Calamos Interests' percentage ownership in Calamos Investments, with the result divided by the applicable year-end closing price. See Note 2, Summary of Significant Accounting Policies - Principles of Consolidation, for a description of certain assets owned by CAM.
(19)Commitments and Contingencies
In the normal course of business, the Company enters into agreements that include indemnities in favor of third parties, such as engagement letters with advisors and consultants, distribution agreements and service agreements. In accordance with the Company’s by-laws, the Company has also agreed to indemnify its directors, officers, employees and agents in certain cases. Certain agreements do not contain any limits on the Company’s liability and, therefore, it is not possible to estimate the Company’s potential liability under these indemnities. In certain cases, the Company may have recourse against third parties with respect to these indemnities. Further, the Company maintains insurance policies that may provide coverage against certain claims under these indemnities.
In the normal course of business, the Company may be party to various legal proceedings from time to time. Management believes that a current complaint filed against CAL and CFS, alleging breaches of fiduciary duties with respect to the receipt of advisory, distribution and servicing fees paid by an open-end investment company advised by CAL, is without merit and CAL and CFS intend to defend themselves vigorously against the allegations. Currently, management believes that the ultimate resolution of this complaint will not materially affect the Company’s business, financial position or results of operations and that the likelihood of a material adverse impact is remote.
On March 31, 2015, the initial public offering of a Calamos-sponsored closed-end fund was completed with underwriters of the closed-end fund subsequently exercising a portion of their over-allotment option, the closing of which over-allotment option occurred on May 13, 2015. As contemplated in the fund's prospectus, CAL, the fund's investment adviser has implemented a share purchase program pursuant to which CAL will, through a plan agent, purchase up to $20 million of common shares of the fund in the open market, subject to applicable federal securities laws as well as to a variety of market and discount conditions and a daily purchase limit. The purchase plan, which seeks to provide increased liquidity for the fund's common shares, commenced on July 7, 2015. CAL purchased $15.6 million of common shares of the fund under this program during the year ended December 31, 2015. The purchase program was completed on February 25, 2016 for a total cost of $20.0 million.
The Company leases office space and computer equipment under long-term operating leases expiring at various dates through fiscal year 2025. Lease expenses were $5.5 million for the year ended December 31, 2015, and $5.6 million for each of the years ended December 31, 2014 and 2013. As of December 31, 2015, the Company’s aggregate future minimum payments for operating leases having initial or non-cancelable terms greater than one year are payable as follows:
F-28
CALAMOS ASSET MANAGEMENT, INC.
NOTES TO CONSOLIDATED FINANCIAL STATEMENTS – (Continued)
(in thousands) | Minimum Payments | ||
Year ended December 31: | |||
2016 | $ | 5,252 | |
2017 | 5,403 | ||
2018 | 5,520 | ||
2019 | 5,530 | ||
2020 | 5,314 | ||
Thereafter | 22,799 | ||
Total minimum lease payments | $ | 49,818 | |
(20)Regulatory and Net Capital Requirements
As a broker-dealer, CFS is subject to the Securities and Exchange Commission’s Uniform Net Capital Rule (Rule 15c3-1), which requires the maintenance of minimum net capital, as defined, and requires that the ratio of aggregate indebtedness to net capital (net capital ratio), as defined, shall not exceed 15 to 1. As of December 31, 2015 and 2014, the net capital, the excess of the required net capital and the net capital ratio were as follows:
(in thousands) | 2015 | 2014 | |||||
Net capital | $ | 5,433 | $ | 1,791 | |||
Excess of required net capital | $ | 4,636 | $ | 1,003 | |||
Net capital ratio | 2.20 : 1.0 | 6.60 : 1.0 | |||||
(21)Concentration Risk
For the years ended December 31, 2015, 2014 and 2013, the percentage of revenues derived from services provided to three Company-sponsored open-end funds, the Calamos Growth Fund, the Calamos Market Neutral Fund and the Calamos Growth and Income Fund were as follows:
2015 | 2014 | 2013 | ||||||
Calamos Growth Fund | 17 | % | 18 | % | 21 | % | ||
Calamos Market Neutral Fund | 14 | % | 14 | % | 10 | % | ||
Calamos Growth and Income Fund | 13 | % | 14 | % | 15 | % | ||
(22)Quarterly Financial Information (Unaudited)
As of or for the Quarter Ended | |||||||||||||||||||||||||||||||
2015 | 2014 | ||||||||||||||||||||||||||||||
Dec. 31 | Sept. 30 | June 30 | March 31 | Dec. 31 | Sept. 30 | June 30 | March 31 | ||||||||||||||||||||||||
(in millions) | |||||||||||||||||||||||||||||||
Assets under management* | $ | 21,908 | $ | 22,454 | $ | 24,432 | $ | 24,476 | $ | 23,506 | $ | 24,514 | $ | 25,755 | $ | 26,147 | |||||||||||||||
(in thousands, except share data) | |||||||||||||||||||||||||||||||
Total revenue | $ | 55,494 | $ | 57,618 | $ | 60,351 | $ | 57,417 | $ | 60,495 | $ | 63,532 | $ | 63,005 | $ | 63,930 | |||||||||||||||
Total operating expenses | 46,369 | 48,991 | 46,259 | 58,922 | 45,868 | 47,679 | 46,371 | 49,854 | |||||||||||||||||||||||
Operating income (loss) | $ | 9,125 | $ | 8,627 | $ | 14,092 | $ | (1,505 | ) | $ | 14,627 | $ | 15,853 | $ | 16,634 | $ | 14,076 | ||||||||||||||
Net income attributable to CAM | $ | 830 | $ | 363 | $ | 2,033 | $ | 101 | $ | 4,794 | $ | 3,369 | $ | 3,228 | $ | 2,139 | |||||||||||||||
Diluted earnings per share | $ | 0.05 | $ | 0.02 | $ | 0.11 | $ | 0.01 | $ | 0.25 | $ | 0.18 | $ | 0.17 | $ | 0.11 | |||||||||||||||
Diluted shares outstanding | 17,858,985 | 18,208,850 | 18,635,798 | 18,699,641 | 18,808,798 | 18,781,856 | 19,048,456 | 19,805,828 | |||||||||||||||||||||||
F-29
CALAMOS ASSET MANAGEMENT, INC.
NOTES TO CONSOLIDATED FINANCIAL STATEMENTS – (Continued)
*Assets under management do not include assets for which the Company provides model portfolio design and oversight.
(23)Recently Issued Accounting Pronouncements
We have reviewed all newly issued accounting pronouncements that are applicable to our business and to the preparation of our consolidated financial statements, including those not yet required to be adopted. Accounting guidance that will become effective in future years, with respect to the Company’s consolidated financial statements, is described below:
In February 2016, the Financial Accounting Standards Board ("FASB") issued an accounting update related to the accounting for leases. Under the new guidance, lessees will be required to recognize a right-of-use asset that represents the lessee's right to use, or control the use of, a specified asset for the lease term, and a lease liability, which is a lessee's obligation to make lease payments arising from a lease, measured on a discounted basis. This guidance is effective for annual and interim periods beginning after December 15, 2018. Early adoption is permitted. The Company is evaluating the effect of adopting this new accounting guidance on its results of operations, cash flows and financial position.
In January 2016, the FASB issued an accounting update that addresses certain aspects of recognition, measurement, presentation, and disclosure of financial instruments. The new guidance will require the change in fair value of equity instruments with readily determinable fair values to be recognized through the statements of operations. This guidance is effective for annual and interim periods beginning after December 15, 2017, and requires a cumulative-effect adjustment to the balance sheet as of the beginning of the fiscal year of adoption. Early adoption is not permitted. The Company is currently evaluating the full impact of the standard, however, upon adoption the change in the fair value of available-for-sale securities will be recognized in the consolidated statements of operations instead of accumulated other comprehensive income on the statements of financial position.
In February 2015, the FASB issued an accounting update amending the consolidation requirements under GAAP. This standard modifies existing consolidation guidance for reporting organizations that are required to evaluate whether they should consolidate certain legal entities. This guidance is effective for annual and interim periods beginning after December 15, 2015, and requires either a retrospective or a modified retrospective approach to adoption. Early adoption is permitted. The Company does not expect adoption will have a material impact on its results of operations, cash flows or financial position.
In May 2014, the FASB issued new guidance on revenue from contracts with customers. The new revenue recognition standard provides a five-step analysis of transactions to determine when and how revenue is recognized. The core principle of the guidance is that an entity should recognize revenue to depict the transfer of promised goods or services to customers in an amount that reflects the consideration to which the entity expects to be entitled in exchange for those goods or services. In July 2015, the FASB decided to defer the effective date of the new revenue guidance by one year to annual reporting periods beginning after December 15, 2017, with early adoption being permitted for annual periods beginning after December 15, 2016. The Company's effective date is January 1, 2018. The Company is evaluating the effect of adopting this new accounting guidance but does not expect adoption will have a material impact on its results of operations, cash flows or financial position.
(24)Subsequent Events
On March 3, 2016, the Board of Directors of CAM approved a distribution of $20.0 million from Calamos Investments to its members, payable in the first quarter of 2016, of which $4.4 million will be distributed to CAM, and $15.6 million will be distributed to the Calamos Interests. The distribution will be funded from cash on hand.
Subsequent to December 31, 2015, the balance of the loan from CAM to Calamos Investments was $40.0 million.
F-30
ITEM 9. CHANGES IN AND DISAGREEMENTS WITH ACCOUNTANTS ON ACCOUNTING AND FINANCIAL DISCLOSURE
None.
ITEM 9A. CONTROLS AND PROCEDURES
As of the end of the period covered by this Annual Report on Form 10-K, an evaluation was carried out under the supervision and with the participation of our management, including our chief executive officer and chief financial officer, of the effectiveness of the design and operation of our disclosure controls and procedures (as defined in Rule 13a-15(e) and 15d-15(e) under the Securities Exchange Act of 1934) (“the Exchange Act”). Based upon that evaluation, the chief executive officer and chief financial officer concluded that the design and operation of these disclosure controls and procedures were effective to ensure that information required to be disclosed by the Company in reports that it files or submits under the Exchange Act is recorded, processed, summarized and reported within the time periods specified in the Securities and Exchange Commission’s rules and forms.
No changes were made in our internal control over financial reporting during the Company’s fourth quarter that have materially affected, or are reasonably likely to materially affect, the Company’s internal control over financial reporting.
Management’s Report on Internal Control Over Financial Reporting and RSM US LLP’s Report of Independent Registered Public Accounting Firm are included in Item 8 of Part II, Financial Statements and Supplementary Data, of this Annual Report on Form 10-K.
ITEM 9B. OTHER INFORMATION
Our 2016 Annual Meeting of Stockholders will be held on or about June 7, 2016 at our main offices, 2020 Calamos Court, Naperville, Illinois 60563. The deadlines for director nominations and for stockholder proposals, whether or not for inclusion in our proxy statement submitted pursuant to Rule 14a-8 under the Exchange Act, remain unchanged from those stated in our definitive proxy statement for our 2015 Annual Meeting of Stockholders.
On March 9, 2016, the Board of Directors of Calamos Asset Management, Inc. approved an amendment to its Second Amended and Restated By-Laws (“By-Laws”), which became effective immediately. The amendment added Article XII to the By-Laws to select the Delaware Court of Chancery as the sole and exclusive forum for certain types of legal actions involving the Company, unless the Company consents in writing to an alternative forum. The foregoing description of the amendment to the By-Laws does not purport to be complete and is qualified in its entirety by reference to the complete copy of the Third Amended and Restated By-Laws, filed as Exhibit 3(ii) and incorporated by reference herein.
F-31
PART III
ITEM 10. DIRECTORS, EXECUTIVE OFFICERS AND CORPORATE GOVERNANCE
Executive Management | Directors |
John P. Calamos, Sr. Chairman, Chief Executive Officer and Global Co-Chief Investment Officer | John P. Calamos, Sr. Chairman, Chief Executive Officer and Global Co-Chief Investment Officer |
Robert Behan President, Head of Global Distribution | Thomas F. Eggers Former Chief Executive Officer The Dreyfus Corporation |
Nimish S. Bhatt Senior Vice President and Chief Financial Officer | Richard W. Gilbert Former Lead Director Principal Mutual Funds Former Chairman and Director Federal Home Loan Bank of Chicago |
Keith M. Schappert Business Consultant Former President and Chief Executive Officer Federated Investment Advisory Companies JP Morgan Investment Management | |
William N. Shiebler Former Chief Executive Officer of the Americas Deutsche Asset Management | |
Additional information regarding the directors,executive officers and corporate governance of the Company and compliance with Section 16(a) of the Securities Exchange Act of 1934 is incorporated herein by reference from our definitive proxy statement for our 2016 Annual Meeting of Stockholders (the “Proxy Statement”).
The Company has adopted a Code of Business Conduct and Ethics (the Code of Conduct) that applies to our principal executive officer, principal financial officer, principal accounting officer or controller, or persons performing similar functions. The Company posts its periodic filings as well as other important communications and documents on the Investor Relations section of our website at www.calamos.com/Investors. We encourage shareholders and investors to visit our website and review such filings, communications and documents. The Code of Conduct is posted on our website and is also available in print free of charge to any shareholder who requests a copy. Interested parties may address a written request for a printed copy of the Code of Conduct to: Secretary, Calamos Asset Management, Inc., 2020 Calamos Court, Naperville, IL 60563. We intend to satisfy the disclosure requirement regarding any amendment to, or a waiver of, a provision of the Code of Conduct by posting such information on our website.
ITEM 11. EXECUTIVE COMPENSATION
Information required for this Item is incorporated herein by reference to the registrant’s Proxy Statement.
F-32
ITEM 12. SECURITY OWNERSHIP OF CERTAIN BENEFICIAL OWNERS AND MANAGEMENT AND RELATED STOCKHOLDER MATTERS
Information required for this Item is incorporated herein by reference to the registrant’s Proxy Statement.
Equity Compensation Plan Information
The following table summarizes information as of December 31, 2015, relating to equity compensation plans of the Company pursuant to which shares of our Class A common stock are authorized for issuance:
Number of securities to be issued upon exercise of outstanding options, warrants and rights | Weighted average exercise price of outstanding options, warrants and rights | Number of securities remaining available for future issuance under equity compensation plans (excluding securities reflected in column (a)) | |||||||||
Plan Category | (a) | (b) | (c) | ||||||||
Equity compensation plans approved by security holders: | |||||||||||
Stock options | 1,148,485 | $ | 24.73 | N/A | (1) | ||||||
Restricted stock units | 2,186,246 | — | N/A | (1) | |||||||
Equity compensation plans not approved by security holders | — | — | — | ||||||||
Total | 3,334,731 | $ | 8.52 | 4,338,747 | (1) | ||||||
(1) | A combined total of 10,000,000 shares of Calamos Asset Management, Inc.’s Class A common stock may be issued under its incentive compensation plan. For the years ended December 31, 2015, 2014 and 2013, 335,741 shares, 294,686 shares and 310,080 shares, respectively, were converted. |
ITEM 13. CERTAIN RELATIONSHIPS AND RELATED TRANSACTIONS, AND DIRECTOR INDEPENDENCE
Information required for this Item is incorporated herein by reference to the registrant’s Proxy Statement.
ITEM 14. PRINCIPAL ACCOUNTANT FEES AND SERVICES
Information required for this Item is incorporated herein by reference to the registrant’s Proxy Statement.
F-33
PART IV
ITEM 15. EXHIBITS AND FINANCIAL STATEMENT SCHEDULES
(a) The following documents are filed as part of this report.
1. | Financial Statements: See Item 8 of Part II. |
2. | Financial Statement Schedules: None. |
3. | List of Exhibits: |
Exhibit Number | Description of Exhibit | ||
3(i) | Second Amended and Restated Certificate of Incorporation of the Registrant (incorporated by reference to Exhibit 3(i) to the Registrant’s Annual Report on Form 10-K filed with the Securities and Exchange Commission on March 13, 2009). | ||
3(ii) | Third Amended and Restated By-laws of the Registrant. | ||
4.1 | Stockholders’ Agreement among John P. Calamos, Sr., Nick P. Calamos and John P. Calamos, Jr., certain trusts controlled by them, Calamos Family Partners, Inc. and the Registrant (incorporated by reference to Exhibit 4.1 to the Registrant’s Quarterly Report on Form 10-Q filed with the Securities and Exchange Commission on December 3, 2004 File No. 000-51003). | ||
4.2 | Registration Rights Agreement between Calamos Family Partners, Inc., John P. Calamos, Sr. and the Registrant (incorporated by reference to Exhibit 4.2 to the Registrant’s Quarterly Report on Form 10-Q filed with the Securities and Exchange Commission on December 3, 2004 File No. 000-51003). | ||
4.3 | Note Purchase Agreement, dated as of July 13, 2007, by and among Calamos Investments LLC and various institutional investors (incorporated by reference to Exhibit 4.1 to the Registrant’s Current Report on Form 8-K filed with the Securities and Exchange Commission on July 18, 2007). | ||
4.4 | Waiver and First Amendment to 2007 Note Purchase Agreement, dated as of December 22, 2008, between Calamos Investments LLC and various institutional investors (incorporated by reference to Exhibit 4.5 to the Registrant’s Current Report on Form 8-K filed with the Securities and Exchange Commission on December 29, 2008). | ||
10.1 | Employment Agreement between the Registrant and John P. Calamos, Sr. (incorporated by reference to Exhibit 10.1 to the Registrant’s Quarterly Report on Form 10-Q filed with the Securities and Exchange Commission on December 3, 2004 File No. 000-51003). | ||
10.2 | Separation, Release and Noncompetition Agreement by and among the Registrant, Calamos Advisors LLC, Calamos Family Partners, Inc., Calamos Property Holdings LLC, John P. Calamos, Sr., John P. Calamos, Jr. and Nick P. Calamos (incorporated by reference to Exhibit 10.1 to the Registrant’s Current Report on Form 8-K filed with the Securities and Exchange Commission on December 4, 2013). | ||
10.3 | Employment Agreement between Calamos Advisors LLC and Gary D. Black (incorporated by reference to Exhibit 10.1 to the Registrant’s Current Report on Form 8-K filed with the Securities and Exchange Commission on November 6, 2012). | ||
10.4 | Amendment Number 1 to the Employment Agreement between Calamos Advisors LLC and Gary D. Black (incorporated by reference to Exhibit 10.4 to the Registrant's Report on Form 10-K filed with the Securities and Exchange Commission on March 13, 2015). | ||
10.5 | Transition Agreement, dated September 9, 2015, between Calamos Asset Management, Inc. and Gary D. Black (incorporated by reference to Exhibit 10.1 to the Registrant's Quarterly Report on Form 10-Q filed with the Securities and Exchange Commission on November 5, 2015). | ||
F-34
10.6 | Omnibus Amendment Relating to Code Section 409A (incorporated by reference to Exhibit 10.5 to the Registrant’s Annual Report on Form 10-K filed with the Securities and Exchange Commission on March 13, 2009). | ||
10.7 | Calamos Asset Management, Inc. Incentive Compensation Plan, as amended effective June 3, 2014 (incorporated by reference to Exhibit 10.1 to the Registrant’s Current Report on Form 8-K filed with the Securities and Exchange Commission on June 5, 2014). | ||
10.8 | Form of Equity Award Statement (incorporated by reference to Exhibit 10.7 to the Registrant's Annual Report on Form 10-K filed with the Securities and Exchange Commission on March 13, 2015). | ||
10.9 | Form of Non-Employee Equity Award Statement (incorporated by reference to Exhibit 10.8 to the Registrant's Annual Report on Form 10-K filed with the Securities and Exchange Commission on March 13, 2015). | ||
10.10 | Contribution Agreement between the Registrant and Calamos Investments LLC (incorporated by reference to Exhibit 10.9 to the Registrant’s Quarterly Report on Form 10-Q filed with the Securities and Exchange Commission on December 3, 2004 File No. 000-51003). | ||
10.11 | Tax Indemnity Agreement among the Registrant, Calamos Family Partners, Inc. and Calamos Investments LLC (incorporated by reference to Exhibit 10.10 to the Registrant’s Quarterly Report on Form 10-Q filed with the Securities and Exchange Commission on December 3, 2004 File No. 000-51003). | ||
10.12 | Fourth Amended and Restated Limited Liability Company Agreement of Calamos Investments LLC by and among Calamos Family Partners, Inc., John P. Calamos, Sr. and the Registrant (incorporated by reference to Exhibit 10.11 to the Registrant’s Annual Report on Form 10-K filed with the Securities and Exchange Commission on March 9, 2010). | ||
10.13 | Management Services and Resources Agreement by and among the Registrant, Calamos Family Partners, Inc. and Calamos Property Holdings LLC (incorporated by reference to Exhibit 10.1 to the Registrant’s Quarterly Report on Form 10-Q filed with the Securities and Exchange Commission on August 9, 2007). | ||
10.14 | Lease Agreement between 2020 Calamos Court LLC and Calamos Investments LLC (incorporated by reference to Exhibit 10 to the Registrant’s Quarterly Report on Form 10-Q filed with the Securities and Exchange Commission on November 10, 2005 File No. 000-51003). | ||
10.15 | Lease Agreement between CityGate Centre I LLC and Calamos Investments LLC (incorporated by reference to Exhibit 99.1 to the Registrant’s Current Report on Form 8-K filed with the Securities and Exchange Commission on November 20, 2007). | ||
21.1 | Subsidiaries of the Company. | ||
23.1 | Consent of Independent Registered Public Accounting Firm, RSM US LLP. | ||
31.1 | Certification of Principal Executive Officer pursuant to Rule 13a-14(a). | ||
31.2 | Certification of Principal Financial Officer pursuant to Rule 13a-14(a). | ||
32.1 | Certification of Principal Executive Officer pursuant to 18 U.S.C. Section 1350. | ||
32.2 | Certification of Principal Financial Officer pursuant to 18 U.S.C. Section 1350. | ||
101.INS | XBRL Instance Document | ||
F-35
101.SCH | XBRL Taxonomy Extension Schema Document | ||
101.CAL | XBRL Taxonomy Extension Calculation Linkbase Document | ||
101.LAB | XBRL Taxonomy Extension Label Linkbase Document | ||
101.PRE | XBRL Taxonomy Extension Presentation Linkbase Document | ||
101.DEF | XBRL Taxonomy Extension Definition Linkbase Document | ||
Upon written request by a stockholder to our Secretary at 2020 Calamos Court, Naperville, Illinois 60563, any exhibit shall be available at a reasonable charge (which will be limited to our reasonable expenses in furnishing such exhibits).
F-36
SIGNATURES
Pursuant to the requirements of Section 13 or 15(d) of the Securities Exchange Act of 1934, the registrant has duly caused this report to be signed on its behalf by the undersigned, thereunto duly authorized, on March 11, 2016
CALAMOS ASSET MANAGEMENT, INC.
By:/s/ Nimish S. Bhatt
Name: Nimish S. Bhatt
Title: Senior Vice President and
Chief Financial Officer
Pursuant to the requirements of the Securities Exchange Act of 1934, this report has been signed by the following persons in the capacities and on the dates indicated.
Signature | Title | Date | ||
/s/ John P. Calamos, Sr. John P. Calamos, Sr. | Chairman of the Board, Chief Executive Officer and Global Co-Chief Investment Officer (Principal Executive Officer) | March 11, 2016 | ||
/s/Nimish S. Bhatt Nimish S. Bhatt | Senior Vice President and Chief Financial Officer (Principal Financial Officer and Principal Accounting Officer) | March 11, 2016 | ||
/s/ Thomas F. Eggers Thomas F. Eggers | Director | March 11, 2016 | ||
/s/ Richard W. Gilbert Richard W. Gilbert | Director | March 11, 2016 | ||
/s/ Keith M. Schappert Keith M. Schappert | Director | March 11, 2016 | ||
/s/ William N. Shiebler William N. Shiebler | Director | March 11, 2016 | ||
F-37