Attached files
| file | filename |
|---|---|
| EX-31.2 - EX-31.2 - BOINGO WIRELESS, INC. | a2227653zex-31_2.htm |
| EX-32.2 - EX-32.2 - BOINGO WIRELESS, INC. | a2227653zex-32_2.htm |
| EX-32.1 - EX-32.1 - BOINGO WIRELESS, INC. | a2227653zex-32_1.htm |
| EX-31.1 - EX-31.1 - BOINGO WIRELESS, INC. | a2227653zex-31_1.htm |
| EX-23.1 - EX-23.1 - BOINGO WIRELESS, INC. | a2227653zex-23_1.htm |
| EX-21.1 - EX-21.1 - BOINGO WIRELESS, INC. | a2227653zex-21_1.htm |
Use these links to rapidly review the document
TABLE OF CONTENTS
TABLE OF CONTENTS 2
Item 15. Exhibits, Financial Statement Schedules
UNITED STATES
SECURITIES AND EXCHANGE COMMISSION
Washington, D.C. 20549
FORM 10-K
| (Mark One) | ||
ý |
ANNUAL REPORT PURSUANT TO SECTION 13 OR 15(d) OF THE SECURITIES EXCHANGE ACT OF 1934 |
|
For the fiscal year ended December 31, 2015 |
||
OR |
||
o |
TRANSITION REPORT PURSUANT TO SECTION 13 OR 15(d) OF THE SECURITIES EXCHANGE ACT OF 1934 |
|
Commission File Number: 001-35155
BOINGO WIRELESS, INC.
(Exact name of registrant as specified in its charter)
| DELAWARE (State of other jurisdiction of incorporation or organization) |
95-4856877 (I.R.S. Employer Identification Number) |
10960 Wilshire Blvd., 23rd Floor
Los Angeles, California 90024
(Address of principal executive offices, Zip Code)
(310) 586-5180
(Registrant's telephone number, including area code)
Securities registered pursuant to Section 12(b) of the Act:
| Common Stock, $0.0001 par value | The NASDAQ Stock Market LLC | |
|---|---|---|
| (Title of each class) | (Name of each exchange on which registered) |
Securities registered pursuant to Section 12(g) of the Act: None
Indicate by check mark if the registrant is a well-known seasoned issuer, as defined in Rule 405 of the Securities Act. Yes o No ý
Indicate by check mark if the registrant is not required to file reports pursuant to Section 13 or 15(d) of the Act. Yes o No ý
Indicate by check mark whether the registrant (1) has filed all reports required to be filed by Section 13 or 15(d) of the Securities Exchange Act of 1934 during the preceding 12 months (or for such shorter period that the registrant was required to file such reports); and (2) has been subject to such filing requirements for the past 90 days. Yes ý No o
Indicate by check mark whether the registrant has submitted electronically and posted on its corporate Web site, if any, every Interactive Data File required to be submitted and posted pursuant to Rule 405 of Regulation S-T (232.405 of this chapter) during the preceding 12 months (or for such shorter period that the registrant was required to submit and post such files). Yes ý No o
Indicate by check mark if disclosure of delinquent filers pursuant to Item 405 of Regulation S-K is not contained herein, and will not be contained, to the best of registrant's knowledge, in definitive proxy or information statements incorporated by reference in Part III of this Form 10-K or any amendment to this Form 10-K. o
Indicate by check mark whether the registrant is a large accelerated filer, an accelerated filer or a non-accelerated filer, or a smaller reporting company. See the definition of "large accelerated filer," "accelerated filer" and "smaller reporting Company" in Rule 12b-2 of the Exchange Act. (Check one):
| Large accelerated filer o | Accelerated filer ý | Non-accelerated filer o (Do not check if a smaller reporting company) |
Smaller reporting company o |
Indicate by check mark whether the registrant is a shell company (as defined in Rule 12b-2 of the Exchange Act). Yes o No ý
The aggregate market value of the Registrant's voting and non-voting common equity held by non-affiliates of the Registrant as of the last day of the Registrant's most recently completed second fiscal quarter was $298,970,014 based on the last reported sale price of $8.26 per share on the NASDAQ Global Market on June 30, 2015, the last trading day of the most recently completed second fiscal quarter.
As of March 1, 2016, 37,443,601 shares of Common Stock were outstanding.
DOCUMENTS INCORPORATED BY REFERENCE
Portions of the Company's definitive Proxy Statement for the Annual Meeting of Stockholders to be filed within 120 days of the Company's year ended December 31, 2015 are incorporated by reference into Part III of this Form 10-K where indicated.
BOINGO WIRELESS, INC.
ANNUAL REPORT ON FORM 10-K FOR
THE YEAR ENDED DECEMBER 31, 2015
1
Forward-Looking Statements
We have made forward-looking statements in this Annual Report on Form 10-K that are subject to risks and uncertainties. Forward-looking statements within the meaning of Section 27A of the Securities Act of 1933, as amended, and Section 21E of the Securities Exchange Act of 1934, as amended, are subject to the "safe harbor" created by those sections. The forward-looking statements in this report are based on our management's beliefs and assumptions and on information currently available to our management. In some cases, you can identify forward-looking statements by terms such as "anticipates," "aspires," "believes," "can," "continue," "could," "estimates," "expects," "intends," "may," "plans," "projects," "seeks," "should," "will" or "would" or the negative of these terms and similar expressions intended to identify forward-looking statements. These statements involve known and unknown risks, uncertainties and other factors, which may cause our actual results, performance, time frames or achievements to be materially different from any future results, performance, time frames or achievements expressed or implied by the forward-looking statements. We discuss many of these risks, uncertainties and other factors in this document in greater detail under the heading "Risk Factors." We believe it is important to communicate our expectations to our investors. However, there may be events in the future that we are not able to predict accurately or over which we have no control. The risks described in "Risk Factors" included in this report, as well as any other cautionary language in this report, provide examples of risks, uncertainties and events that may cause our actual results to differ materially from the expectations we describe in our forward-looking statements. Before you invest in our common stock, you should be aware that the occurrence of the events described in "Risk Factors" and elsewhere in this report could harm our business.
Given these risks, uncertainties and other factors, you should not place undue reliance on these forward-looking statements. Also, these forward-looking statements represent our estimates and assumptions only as of the date of this filing. You should read this document completely and with the understanding that our actual future results may be materially different from what we expect. We hereby qualify our forward-looking statements by these cautionary statements. Except as required by law, we assume no obligation to update these forward-looking statements publicly, or to update the reasons actual results could differ materially from those anticipated in these forward-looking statements, even if new information becomes available in the future.
Unless the context otherwise requires, we use the terms "Boingo," "company," "we," "us" and "our" in this Annual Report on Form 10-K to refer to Boingo Wireless, Inc. and, where appropriate, its subsidiaries.
Company Overview
Boingo helps the world stay connected.
We have established a global footprint of wireless networks that provide high-speed, high-bandwidth wireless connectivity to smartphones, tablets, laptops, wearables, the Internet of Things ("IoT"), and other wireless-enabled devices. Wireless infrastructure systems include low-powered radio access nodes that operate in licensed and unlicensed spectrum, with a range of 10 meters to 1 to 2 kilometers. These wireless networks include more than 1.5 million distributed antenna system ("DAS"), femto-cell, and Wi-Fi locations that reach more than one billion consumers annually. With the proliferation of wireless devices, and the growth of mobile data from high-bandwidth activities like streaming media, cloud-based applications, online gaming and mobile apps, we expect these wireless networks to play a significant role in helping meet the ever-increasing data demands of on-the-go connected consumers.
Our wireless networks include DAS, femto-cell, and Wi-Fi networks that we manage and operate ourselves, which we refer to as our "managed and operated" locations, as well as Wi-Fi networks
2
managed and operated by third-parties with whom we contract for access, which we refer to as our "roaming" networks. Our managed and operated locations are typically located in large venues with big audiences, such as airports, stadiums, arenas, military bases, universities, big box retailers, convention centers, and office buildings. We install wireless network infrastructure in these locations, which generally have exclusive multi-year agreements, and then monetize these networks in a number of ways. Our roaming networks comprise more than 1.5 million commercial Wi-Fi hotspots in 100 countries around the world. We also sell advertising on other Wi-Fi networks that are not part of our network on behalf of the network owner.
We generate revenue through wholesale offerings, retail and military sales, and advertising. We have direct customer relationships with users who have purchased our services, and we also provide wireless connectivity access solutions to enterprise customers, which include telecom operators, cable companies, technology companies, enterprise software and services companies, financial institutions, and communications service providers. Our wholesale solutions enable these companies to offer wireless connectivity access to their customers. Our software solution—which provides one-click access to our global footprint of hotspots—has been rebranded for wholesale partners, in addition to being marketed under the Boingo brand. In combination with our back-end system infrastructure, it creates a global roaming solution for operators, carriers, other service providers and other businesses.
We generate wholesale revenue from telecom operators that pay us build-out fees and recurring access fees so that their cellular customers may use our DAS or femto-cell networks at locations where we manage and operate the wireless network. DAS revenue accounts for approximately 33% of our revenue. In addition, our enterprise customers pay us usage-based Wi-Fi network access and software licensing fees to allow their customers' access to our footprint worldwide. Wholesale Wi-Fi revenue also includes financial institutions who provide Boingo as a value-added service for their customers. Wholesale Wi-Fi revenue accounts for approximately 16% of our revenue.
Retail revenue, which is driven by consumers who purchase one-time Wi-Fi access or a recurring monthly subscription plan, accounts for approximately 23% of our total revenue. As of December 31, 2015, our retail subscriber base was approximately 204,000, a decrease of approximately 20% over the prior year. Military revenue, which is driven by military personnel who purchase broadband and Internet Protocol television ("IPTV") services on military bases served by Boingo accounts for approximately 14% of our total revenue. As of December 31, 2015, we have grown our military subscriber base to approximately 57,000 from approximately 20,000 in the prior year period.
We also generate revenue from advertisers that seek to reach consumers via sponsored Wi-Fi access, promotional programs and online display advertising. Advertising and other revenue accounts for approximately 14% of our revenue.
Our advertising business is seasonal, with the highest percentage of advertising sales typically occurring in the fourth quarter of each year. Our customer agreements for certain DAS networks include both a fixed and variable fee structure with the highest percentage of sales typically occurring in the fourth quarter of each year and the lowest percentage of sales occurring in the first quarter of each year. We expect these trends to continue. Our other products have not experienced any significant seasonal impact.
We were incorporated in the State of Delaware in April 2001 under the name Project Mammoth, Inc. and changed our name to Boingo Wireless, Inc. in October 2001. Our principal executive offices are located in Los Angeles, California. Our website address is www.boingo.com. The information on, or that can be accessed through, our website is not part of this Annual Report on Form 10-K.
3
Industry Overview
Today, consumers own multiple connected devices—smartphones, laptops, tablets, wearables, etc. According to Cisco's Visual Networking Index ("CVNI"), by 2020, there will be 5.5 billion expected mobile users, representing 70% of the world's population. The adoption, growth and innovation of mobile devices are key catalysts for the acceleration of high-speed and high-bandwidth mobile Internet usage. The improved computing power, rich graphical user interfaces and Internet capabilities of these devices enable mobile users to engage in high-bandwidth activities like making video calls or streaming high definition movies, uploading photos and videos to social media sites, engaging in online gaming or streaming music apps—even live streaming and broadcasting video through apps like Periscope. In return, mobile data is growing unabated. According to CVNI, it is anticipated that global mobile data traffic will increase nearly eightfold between 2015 and 2020. Mobile video will have the highest growth rate of any mobile application accounting for approximately 75% of the world's mobile data traffic by 2020. Average global mobile network speeds are also expected to increase 3.2-fold from 2015 (2.0 Mbps) to 2020 (6.5 Mbps).
To cope with the significant increase in expected global mobile Internet data traffic, network operators are rapidly expanding their capacity and investing in technologies such as 4G cellular networks. However, these investments are only a short-term solution as they are not capable of meeting the long-term demand for data usage. To ease the strain of cellular networks by off-loading data, network operators have also been investing in Wi-Fi and cellular DAS and femto-cells that enhance spectrum coverage and density in large venues to increase overall capacity. In a recent market study, ABI Research forecasted the in-building wireless market to more than double in revenue by 2020, with the market anticipated to top $9 billion by 2020. Further, according to CVNI, by 2020, 38.1 exabytes of Wi-Fi offload traffic will be generated each month and voice over Wi-Fi ("VoWiFi") will account for 53% of all mobile IP voice traffic.
Wi-Fi provides higher speed and higher bandwidth per user in high density locations, and is simpler and less expensive to deploy than additional cellular network capacity. The benefits and consumer demand for Wi-Fi have led hardware manufacturers to include Wi-Fi as a standard feature on smart devices, laptops and tablets and the IoT. Wi-Fi has become the standard protocol for residential and office wireless networks and is increasingly prevalent in public venues, such as airports, hotels, big box retailers, coffee shops, convention centers, shopping malls, arenas, stadiums, campuses and office buildings.
Challenges Facing Our Industry
The mobile Internet is a complex and constantly evolving ecosystem comprised of over a billion mobile Internet-enabled devices from dozens of manufacturers, which are powered by many different operating systems. Devices use different network technologies and must be configured with the appropriate software to detect and optimize a connection to the mobile Internet. This complexity is amplified as new device models and operating systems are released, new categories of devices become Internet-enabled, and new network technologies emerge. The increasing number of mobile Internet-enabled devices in this ecosystem is causing an even more rapid increase in data consumption on capacity-strained networks.
Our Strategy
We believe we are the leading global provider of neutral-host commercial mobile Wi-Fi Internet solutions and indoor DAS services for carriers and venues. Key elements of our strategy to extend that lead are to:
- •
- Expand our footprint of managed and operated and aggregated networks. We intend to continue to grow our global network of managed and operated DAS, femto-cell, and Wi-Fi networks by
4
- •
- Leverage our neutral-host business model to accelerate wholesale roaming and carrier offload
partnerships. Our neutral-host model enables us to partner with venue operators because we allow their customers to access a venue's
network regardless of the customers' service provider. We also partner with telecom operators that are attracted to us because we do not compete for cellular subscribers. We intend to expand our
neutral-host managed and operated network by partnering with additional venues, network operators, telecom operators and technology companies.
- •
- Maximize advertising sell-through for our inventory of advertising-enabled
networks. We will seek to leverage our ad sales team to engage leading brands and media buying and advertising agencies acting on their
behalf to maximize sell-through of our advertising inventory. These networks represent high-traffic, high-demand locations with broad appeal. We also expect to enhance existing ad products and develop
new ones to provide appealing options to advertisers looking for innovative ways to engage potential customers.
- •
- Increase our brand awareness. We will continue to seek new ways to promote our brand through our managed and operated hotspots. We intend to enhance our brand through low-cost co-marketing arrangements with our partners and through periodic promotional and sponsorship activities and by continuing to leverage the reach of social media and public relations to interact with our customers.
pursuing new opportunities at large venues such as airports, arenas, stadiums, military bases, office buildings and universities. We also plan to enter into new roaming agreements with additional network and hotspot operators to maximize the reach of our aggregated network, which creates a more attractive offering for our retail and military customers and wholesale enterprise customers.
Services
Our solution makes it easy, convenient and cost effective for consumers to access the mobile Internet.
DAS or Femto-Cell. We offer our telecom operator partners access to our DAS or femto-cell infrastructure at certain of our managed and operated locations. We deploy our DAS or femto-cell infrastructure within airports and other large venues with big audiences that require additional signal strength to improve the quality of cellular services.
Wholesale—Wi-Fi. Our integrated hardware and software platform allows us to provide a range of enhanced services to network operators, device manufacturers, technology companies, enterprise software and services companies, venue operators and financial services companies.
- •
- Roaming and carrier offload services. We offer roaming
and carrier offload services across our entire network of more than 1.5 million hotspot locations to our partners who can then provide mobile Internet services to their customers at these
locations.
- •
- Turn-key solutions. We offer our venue partners the
ability to implement a turn-key Wi-Fi solution through a Wi-Fi network infrastructure that we install, manage and operate. Our turn-key solutions include a variety of service models that are supported
through a mix of retail, military, wholesale Wi-Fi and advertising revenue.
- •
- Comes With Boingo. We offer access to our entire network of more than 1.5 million hotspot locations to our enterprise customers who then offer them as an added-value customer benefit to their service.
5
Retail. We enable individuals to purchase Internet access at our managed and operated hotspots and select partner locations around the world. We offer a selection of recurring monthly subscriptions and single-use access plans. Our most common plans are the $9.95 monthly subscription and the single-use Boingo AsYouGo at $7.95 per day. Our single-use access plans provide unlimited access on a single device at a specific hotspot for a defined period of time, tolled from the time the user first logs on to the network. We will continue to launch other flexible plans to meet the evolving needs of our customers.
Military. We provide broadband and IPTV services for troops stationed on military bases. We offer a selection of recurring monthly subscriptions and shorter-term plans. We offer Standard Internet (5Mbps) and Blazing Internet (30 Mbps) services with plans available on hourly, daily, weekly, and monthly schedules, as well as IPTV services with plans available on a monthly schedule. Military personnel can add a movie tier and premium channels to enhance their IPTV service. We also offer discounted service options when both Internet and IPTV services are bundled in a combo package. These services are only available on certain military bases.
Advertising. Our platform provides a valuable opportunity for advertisers to reach consumers with sponsored Wi-Fi access, promotional programs and display advertising. We provide brands and advertisers the opportunity to sponsor wireless connectivity to individuals at locations where we manage and operate the Wi-Fi network and locations where we solely provide authorized access to a partner's Wi-Fi network through sponsored access and promotional programs. Our advertising solution is easily integrated into Wi-Fi networks not directly managed by Boingo, expanding the addressable market.
Our Network
Through our managed and operated hotspots and our strategic partnership arrangements, users have access to more than 1.5 million hotspots worldwide in venues such as airports, hotels, big box retailers, office buildings, convention centers, arenas, stadiums and quick service restaurants. We design, build, monitor and maintain the Wi-Fi network at our managed and operated hotspot locations primarily located in the United States, Europe and Asia. Our strategic partnership arrangements with 95 network operators allow us to extend our global network to 100 countries worldwide. In 2013, we acquired Electronic Media Systems, Inc. and Advanced Wireless Group, LLC and its network of 17 managed and operated networks (collectively, "AWG").
Boingo hotspot locations by region as of December 31, 2015 included:
Region
|
Airport | Café / Retail | Convention Center |
Hotel | Other(1) | Total | |||||||||||||
|---|---|---|---|---|---|---|---|---|---|---|---|---|---|---|---|---|---|---|---|
North America |
58 | 45,603 | 46 | 2,911 | 112,341 | 160,959 | |||||||||||||
Latin America |
85 | 5,369 | 4 | 268 | 7,070 | 12,796 | |||||||||||||
Europe, Middle East and Africa |
243 | 43,039 | 459 | 11,540 | 254,589 | 309,870 | |||||||||||||
Asia |
264 | 259,884 | 3,464 | 44,752 | 678,586 | 986,950 | |||||||||||||
| | | | | | | | | | | | | | | | | | | | |
Total |
650 | 353,895 | 3,973 | 59,471 | 1,052,586 | 1,470,575 | |||||||||||||
| | | | | | | | | | | | | | | | | | | | |
| | | | | | | | | | | | | | | | | | | | |
| | | | | | | | | | | | | | | | | | | | |
- (1)
- Includes schools and universities, offices, hospitals and public spaces.
Marketing and Business Development
Our marketing and business development efforts are designed to cost effectively attract and retain new retail and military customers, expand our footprint of Wi-Fi hotspots, DAS and advertising locations and identify business partners that could leverage our network to provide mobile Internet services to their customers. We focus on efficient customer acquisition through our online presence,
6
social media, public relations, influencer marketing, experiential and event marketing, market research, and other promotional activities.
We seek to maximize customer lifetime value by managing subscriber acquisition cost, extending customer life and determining appropriate pricing. We use information about subscriber behavior to help us retain customers and determine premium offerings. Our segmentation is focused at the product level, so that we provide the right product, plan and price for our retail and military customers. Our consumer plans are available for essentially all Wi-Fi enabled devices and are priced on a month-to-month or per-use basis.
We issue regular press releases announcing important partnerships and product developments and continually update our website with information about our network and services. We leverage our blog and social media accounts to further promote Boingo's product availability and applicability for travelers, military men and women, digital elite and consumers on-the-go.
Development
Our development efforts are focused primarily on supporting our networks and the businesses that run across these networks. These efforts include developing web applications for ease of connecting to our managed and operated locations and aggregate partner networks, integrating our software client with our wholesale partners, continuing to adapt our technology to new operating systems and platforms, continuing to develop an advertising system and business and operations support system for monetizing network service, continuing to develop an IPTV platform for delivering IPTV services to our military bases and optimizing our networks and backend systems for roaming and carrier offload. Our development model is based on Agile development practices so any deviations can be promptly corrected to improve reliability in our network or services and enhance customer satisfaction. For the years ended December 31, 2015, 2014 and 2013, development and technology expenses were $19.1 million, $14.9 million and $11.4 million, respectively.
Technology
Over the past 15 years, we have developed proprietary systems that include the Boingo software client and software development kit ("SDK"); authentication, authorization and tracking systems; mediation and billing systems; IPTV management and delivery platform; free user monetization media and advertising platform; and a real-time operational support and software configuration and messaging infrastructure.
Boingo Software Client and SDK
The Boingo software client and SDK are installed on Wi-Fi enabled devices such as smartphones, laptops and tablets to enable our customers and our partners customers to access our network. The key features of the Boingo software client include:
- •
- Simple user interface. The Boingo software client
provides individuals with an uncomplicated, user-friendly interface designed to streamline the Wi-Fi network connection process. The software finds hotspots and monitors the availability of Wi-Fi
hotspots in the Boingo network, presents a notification message of the hotspot identified and allows one-click user connections. In some devices, connection to a Boingo Wi-Fi hotspot occurs in the
background, providing the user with a seamless, notification-free connectivity experience.
- •
- Support for all major operating system platforms. The Boingo software client and SDK support the Android, iOS, Mac OS and Windows operating systems, which represents the majority of all devices connecting to our managed and operated venues.
7
- •
- Automatic updates. The Boingo software client
automatically receives identification information for new hotspot locations as they are added to the Boingo network, including any information needed to automatically identify and login to the
network. Location information, allowing a user to find Boingo hotspots from the client, is also automatically updated. On all but embedded platforms, software updates are also automatically offered to
a user when available.
- •
- Custom branding and flexible integration alternatives. We offer wholesale customers the ability to integrate the Boingo software client into their products and services as a SDK. Additionally, we offer wholesale customers the option to utilize a custom, rebranded reference design of the software client used in our retail customer offering.
Authentication, Authorization and Tracking System
Our proprietary authentication, authorization and tracking system enables the reliable, scalable and secure initiation and termination of user Wi-Fi sessions on our network. This system authenticates our network users across a wide variety of hotspots and network operators, through a normalized authentication protocol. Through the authorization process, custom business rules ensure user access based on specific service parameters such as location, type of device, service plan and account information. Our system also captures duration, data traffic, location, and type of device. We normalize and process this data from disparate providers for our use and for our wholesale partners. This system has been enhanced to include support for secure Next Generation Hotspot roaming, which leverages Passpoint-certified devices and network hardware to establish seamless secure connections for customers.
Mediation and Billing System
Our mediation and billing system records and analyzes individual usage sessions required to bill for Wi-Fi usage. Users are charged based on variables such as pricing plan, device type, location, time and amount of use. Our system consolidates usage session information, determines the user identity and applies the appropriate aggregation and flagging to ensure proper usage processing. Our system handles exceptions automatically. Exceptions that cannot be solved automatically are brought to the attention of the operations staff for rectification of any discrepancies. The billing system provides billing based on roaming relationship, user type, device type and account type. Our retail and military customer mediation and billing is handled by the same infrastructure used for wholesale customer and billing, resulting in efficiencies of scale and operation.
IPTV Management and Delivery Platform
Our IPTV system enables us to deliver content to our military subscribers. The Boingo digital rights management ("DRM") system allows for live linear commercial content to be delivered securely through our encrypted network links that connect our primary IPTV data center and the military bases. The IPTV central content management system allows for regional content delivery and multiple programming bundle offers. To enhance the viewing experience for mobile and tablet devices, the Boingo IPTV delivery system uses HTTP Live Streaming distribution protocol that will accommodate playing content at different network speeds by dynamically reducing content size.
Free User Monetization Media and Advertising Platform
The Boingo Media platform enables brand advertisers to reach a captive audience through high engagement Wi-Fi sponsorships in premium locations worldwide. It delivers engaging advertising experiences, and our partners can place their messaging in the right context to their target audience. It also allows a combination of branding with direct response in a single high-impact format. Frequent
8
travelers can be reached in a way they appreciate—by supporting free Wi-Fi access when they need it most.
Software Configuration and Messaging System
Our software configuration system provides real-time network configuration updates for 2,370 networks and 33 detection and login methodologies used by the Boingo software client to access our network. Our software configuration system automatically registers new network definitions and login methodologies to allow individuals to connect to our hotspot locations. All supported platforms use a single configuration, providing a high level of operational and test efficiency. Our messaging system enables real-time customer notification and system interaction at login, based on location, network, user, account type, device and usage. This approach enables us and our partners to deliver custom marketing or service messages.
Operations
We provide significant operational support for our managed and operated wireless infrastructure and the related technical systems in our network. For our managed and operated networks, we design, build, monitor and maintain the network. For roaming partners, we monitor network and related system uptime and report issues so that they can be quickly remedied. We have service level agreements with our roaming partners specifying minimum network uptime requirements and specified quality of service levels for different services that run across the wireless network infrastructure.
Our Wi-Fi deployments are based on the IEEE 802.11a, b, g, n and ac standards and operate in the 2.4 GHz and 5 GHz unlicensed spectrum bands. We design, build, and operate DAS and femto-cell networks that provide 2G, 3G, and 4G-LTE services across multiple licensed-frequency bands for all major telecom operators.
Customers
We generate revenue primarily from our retail and military customers and wholesale partners. Our retail and military customers either purchase month-to-month subscription plans that automatically renew, or single-use access to our network. We acquire our retail and military customers primarily from users passing through our managed and operated locations, where we generally have exclusive multi-year agreements. Some of our wholesale Wi-Fi customers license our software and pay usage-based network access fees to allow their customers access to our global Wi-Fi network and other wholesale Wi-Fi partners pay us to provide Wi-Fi services in their venue locations under a service provider arrangement. Our DAS customers are telecom operators who pay us one-time build-out fees and recurring access fees for our DAS network, enabling their cellular customers to access these networks. Our wholesale customer relationships are generally governed by multi-year contracts. We acquire our wholesale customers through our business development efforts. We also generate revenue from advertisers that seek to reach visitors seeking Wi-Fi access at our managed and operated network locations with online advertising, promotional and sponsored programs. For the years ended December 31, 2015 and 2014, entities affiliated with AT&T Inc. accounted for 17% and 15%, respectively, of total revenue. For the year ended December 31, 2013, two groups of entities affiliated with Verizon Communications, Inc. and AT&T Inc. each accounted for 14% of total revenue. The loss of these groups and the customers could have a material adverse impact on our consolidated statements of operations.
Key Business Metrics
In addition to monitoring traditional financial measures, we also monitor our operating performance using key performance indicators. In 2014, we updated our presentation of revenue
9
sources to differentiate our individual users based on the nature of the users—retail users who purchase Internet access at our managed and operated hotspots and select partner locations or military users who purchase Internet access or IPTV services for individual use on military bases. Accordingly, we have disaggregated our subscribers between our retail and military users. We have also removed monthly churn, which was defined as the number of subscribers who canceled their subscriptions in a given month, expressed as a percentage of the average subscribers in that month, as a key performance indicator as we no longer view monthly churn as a key business metric. Our key performance indicators follow:
| |
Year Ended December 31, | |||||||||
|---|---|---|---|---|---|---|---|---|---|---|
| |
2015 | 2014 | 2013 | |||||||
| |
(in thousands) |
|||||||||
Subscribers—retail |
204 | 254 | 308 | |||||||
Subscribers—military |
57 | 20 | 2 | |||||||
Connects |
105,335 | 81,413 | 50,830 | |||||||
DAS nodes |
10.9 | 8.4 | 6.3 | |||||||
Subscribers—retail and subscribers—military. This metric represents the number of paying customers who are on a month-to-month subscription plan at a given period end.
Connects. This metric shows how often individuals connect to our global Wi-Fi network in a given period. The connects include retail and wholesale customers in both customer pay locations and customer free locations where we are a paid service provider or receive sponsorship or promotional fees. We count each connect as a single connect regardless of how many times that individual accesses the network at a given venue during their 24 hour period. This measure is an indicator of paid activity throughout our network.
DAS nodes. This metric represents the number of active DAS nodes as of the end of the period. A DAS node is a single communications endpoint, typically an antenna, which transmits or receives radio frequency signals wirelessly. This measure is an indicator of the reach of our DAS network.
Retail and Military Customer Support Services
We provide support services to our retail and military customers 24 hours per day, 7 days per week, 365 days per year, by phone, chat or email. Our website also contains a comprehensive list of responses to frequently asked questions and a customer knowledge base, and we monitor and respond to social media communications regarding our services. We provide support services through our internal customer care department and we rely on a third-party provider for most of our standard customer support.
Competition
The market for mobile Internet services and solutions is fragmented and competitive. We believe the principal competitive factors in our industry include the following:
- •
- price;
- •
- ease of access and use;
- •
- quality of service;
- •
- geographic reach;
- •
- bundled service offerings;
- •
- venue exclusivity;
10
- •
- brand name recognition; and
- •
- flexible pricing plans.
We believe we face no material direct competitors to our service offerings. Indirect competitors include telecom operators, cable companies, self-managed venue networks and smaller wireless Internet service providers. Some of these competitors have substantially greater resources, larger customer bases, longer operating histories and greater name recognition than we have. Others offer bundled data services with primary service offerings that we do not offer such as landline and cellular telephone service, and cable or satellite television. Many of our indirect competitors are also partners from whom we receive revenue when their customers access our network. We believe that we compete favorably based on brand recognition, geographic coverage, network reliability, quality of service, ease of use, cost, and our neutral host business model.
Intellectual Property
Our ongoing success will depend in part upon our ability to protect our core technology and intellectual property. To accomplish this, we rely on a combination of intellectual property rights, including trade secrets, patents, copyrights and trademarks, as well as contractual restrictions.
We have four issued U.S. patents, two of which expire in 2022, and the others of which expire in 2030 and 2033. We have six patent applications pending in the United States. One of the pending U.S. patent applications is also pending in Europe. We have two issued Japanese patents and two issued Chinese patents, each of which has a maximum term that expires in 2027.
Our registered trademarks in the United States and the European Union include "Boingo", "Boingo Wi-Finder", and "Don't just go. Boingo.", and in the United States, "Boingo Broadband", "Cloud 9 Media", "Concourse Communications", and "AWG-WIFI". We own additional registrations and have filed other trademark applications in the United States and other countries.
In addition to the foregoing protections, we control access to, and use of, our proprietary software and other confidential information through the use of internal and external controls, including contractual protections with employees, contractors, customers and partners. Our software is protected by United States and international copyright laws.
Employees
As of December 31, 2015, we had 286 employees, including 76 in development and technology, 114 in operations, 61 in sales and marketing and 35 in general and administrative. All of our employees are full-time employees except for two part-time employees. None of our employees are represented by a labor union except for four international employees who are covered by a collective bargaining agreement. We have never experienced any employment related work stoppages and consider relations with our employees to be good. As of December 31, 2015, we also had arrangements with a third party call center provider that provided us with approximately 50 full-time equivalent contractors for retail and military customer support service and similar functions.
Financial Information about Segments and Geographic Areas
Reference to our segments and the geographic areas where we operate is contained in Note 2 to our accompanying consolidated financial statements included in Part II, Item 8 of this report.
Available Information
Our filings with the United States Securities and Exchange Commission or SEC, including this Annual Report on Form 10-K, quarterly reports on Form 10-Q, and current reports on Form 8-K are
11
available free of charge through the Investor Relations section of our website at http://www.boingo.com and are accessible as soon as reasonably practicable after being electronically filed with or furnished to the SEC. The information on, or that can be accessed through, our website is not part of this Annual Report on Form 10-K.
Copies of this report are also available free of charge from Boingo Corporate Investor Communications, 10960 Wilshire Boulevard, 23rd Floor, Los Angeles, California 90024. In addition, our Corporate Governance Guidelines, Code of Business Conduct and Ethics and written charters of the committees of the Board of Directors are accessible through the Corporate Governance tab in the Investor Relations section of our website and are available in print to any stockholder who requests a copy.
You may read and copy materials that we file with the SEC at the SEC's Public Reference facilities at 100 F Street, N.E., Room 1580, Washington, DC 20549. Information on the operation of the Public Reference facilities is available by calling the SEC at 1-800-SEC-0330. The SEC maintains a website that contains reports and other information we file, and proxy statements to be filed with the SEC. The address of the SEC's website is http://www.sec.gov.
Investing in our common stock involves a high degree of risk. You should consider carefully the risks and uncertainties described below, together with all of the other information in this report on Form 10-K, including our accompanying consolidated financial statements and the related notes, before deciding whether to purchase shares of our common stock. If any of the following risks actually occur, our business, financial condition, results of operations and prospects could be materially and adversely affected. The price of our common stock could decline and you could lose part or all of your investment.
Risks Related to Our Business
A significant portion of our revenue is dependent on our relationships with our venue and network partners, and if these relationships are impaired or terminated, or if our partners do not perform as expected, our business and results of operations could be materially and adversely affected.
We depend on our relationships with venue partners, particularly key airport venue partners and military bases, in order to manage and operate DAS, femto-cell, and Wi-Fi networks. These relationships generate a significant portion of our revenue and allow us to generate wholesale revenues and new retail and military customers. Our agreements with our venue partners, telecom operators, and wholesale customers are for defined periods and of varying durations. In order to maintain our relationships with venue partners, we may need to upgrade our networks, which would require significantly higher initial capital expenditures than we have historically incurred, and if we are unsuccessful, our relationships could be impaired. If our venue partners terminate or fail to renew these agreements, our ability to generate and retain wholesale, retail and military customers would be diminished, which might result in a significant disruption of our business and adversely affect our operating results. Further, any delays in our ability to complete the upgrade of our networks or build-out new networks can adversely affect our operating results.
We depend on our relationships with network partners to allow users to roam across networks that we do not manage or operate. A significant portion of our revenue depends on maintaining these relationships with network partners. Some network partners may compete with us for retail customers and may decide to terminate our partnerships and instead develop competing retail products and services. Our network partner agreements are for defined periods and of varying durations. If our network partners terminate these agreements, or fail to renew these agreements, our ability to retain retail customers could be diminished and our network reach could be reduced, which could result in a significant disruption of our business and adversely affect our operating results.
12
Our operating results may fluctuate unexpectedly, which makes them difficult to predict and may cause us to fail to meet the expectations of investors, adversely affecting our stock price.
We operate in a highly dynamic industry and our future quarterly operating results may fluctuate significantly. Our revenue and operating results may vary from quarter-to-quarter due to many factors, many of which are not within our control. As a result, comparing our operating results on a period-to-period basis may not be meaningful. Further, it is difficult to accurately forecast our revenue, margin and operating results, and if we fail to match our expected results or the results expected by financial analysts, the trading price of our common stock may be adversely affected.
Factors that contribute to fluctuations in our operating results from quarter-to-quarter include those described in this risk factor section including:
- •
- our gain or loss of a key venue partner, military partner, roaming partner or platform services partner;
- •
- the rate at which individuals adopt and continue to use our solutions;
- •
- the timing and success of new technology introductions by us or our competitors;
- •
- the growing prevalence of free Wi-Fi models and our ability to adapt and compete with free Wi-Fi;
- •
- the number of air travel passengers, particularly business travelers;
- •
- intellectual property disputes; and
- •
- general economic conditions in our domestic and foreign markets.
Due to these and other factors, quarter-to-quarter comparisons of our historical operating results should not be relied upon as accurate indicators of our future performance.
Our business depends upon demand for connected services that rely on wireless network infrastructure. Our ability to adapt to the speed of changes and anticipate market adoption of new technologies may adversely impact our business.
Our future success depends upon growing demand for wireless connected services. The demand for wireless connectivity may decrease or may grow more slowly than expected. Any such decrease in the demand or slowing rate of growth could have a material adverse effect on our business. The continued demand for wireless connectivity services depends on the continued proliferation of smartphones, tablets and other wireless connection enabled devices. We derive retail revenue from users who purchase subscriptions or single-use access. We may face challenges as we seek to increase the revenue generated from the usage on smartphones, tablets and other wireless connected devices.
A portion of our business depends on the continued integration of Wi-Fi as a standard feature in wireless connected devices. If Wi-Fi ceases to be a standard feature in wireless connected devices, or if the rate of integration of Wi-Fi on devices decreases or is slower than expected, the market for our services may be substantially diminished.
Competing technologies pose a risk to the continued use of Wi-Fi as a mobile wireless connectivity technology. The introduction and market acceptance of emerging wireless technologies such as 4G/LTE, 5G, LTE-U and Super Wi-Fi, could cause significant disruption to our Wi-Fi business, which may result in a loss of customers, users and revenue. If users find emerging wireless technologies to be sufficiently fast, convenient or cost effective, we may not be able to compete effectively, and our ability to attract or retain users will be impaired. Additionally, one or more of our partners may deploy emerging wireless technologies that could reduce the partner's need to work with us, and may result in significant loss of revenue and reduction of the Wi-Fi hotspots in our network.
13
We deliver value to our users by providing simple access to Wi-Fi hotspots, regardless of whether we manage and operate the hotspot, or the hotspot is operated by a partner. As a result, our business depends on our ability to anticipate and quickly adapt to changing technological standards and advances. If technological standards change and we fail to adapt accordingly, our business and revenue may be adversely affected. Furthermore, the proliferation of new mobile devices and operating platforms poses challenges for our research and development efforts. If we are unable to create simple solutions for a particular device or operating platform, we will be unable to effectively attract users of these devices or operating platforms and our business will be adversely affected.
The growth of free Wi-Fi networks may compete with our paid mobile Wi-Fi Internet solutions.
Many venues, including airports, coffee shops and hotels, offer free mobile Wi-Fi as an incentive or value-added benefit to their customers. Free Wi-Fi may reduce retail customer demand for our services, and put downward pressure on the prices we charge our retail customers. In addition, telecom operators may offer free mobile Wi-Fi as part of a home broadband or other service contract, which also may force down the prices we charge our retail customers. If we are unable to effectively offset this downward pressure on our prices by being a Wi-Fi service provider, or if we are unable to acquire and retain retail customers, we will have lower profit margins and our operating results and financial condition may be adversely impacted.
Negotiations with prospective wholesale partners can be lengthy and unpredictable, which may cause our operating results to vary.
Our negotiations with prospective partners to acquire Wi-Fi hotspots to operate or to acquire roaming rights on partners' networks, or for new partners to implement our solutions, can be lengthy, and in some cases can last over 12 months. Because of the lengthy negotiation cycle, the time required to reach a final agreement with a partner is unpredictable and may lead to variances in our operating results from quarter to quarter. Negotiations with prospective partners also require substantial time, effort and resources. We may ultimately fail in our negotiations, resulting in costs to our business without any associated benefits.
We may be unsuccessful in expanding into new venue types, which could harm the growth of our business, operating results and financial condition.
We are negotiating with existing and prospective partners to expand our managed and operated Wi-Fi network footprint in venue types where we historically have had only a limited presence. Expansion into these venue types, and in particular, shopping malls, stadiums, hospitals and quick service restaurants, may require significantly higher initial capital expenditures than we have historically incurred. In contrast to Wi-Fi network build-outs at venues such as airports, where telecom operators typically pay the substantial expense of laying cable or fiber, we may be required to incur the initial capital expense of access points and related hardware and cabling at tens of thousands of quick serve restaurant locations and hundreds of shopping malls, hospitals and stadium locations. We may not be able to execute on our strategy or there may not be returns on these investments in the near future or at all. As a result, our business, financial condition and results of operations could be materially and adversely affected.
We operate relatively new businesses in a rapidly evolving industry, so an investment in our company involves more risk than an investment in a more mature company in an established industry.
We derive nearly all of our revenue from mobile Internet services, which are new and highly dynamic businesses, which face significant challenges. You should consider our business and prospects in light of the risks, uncertainties and difficulties we will encounter as an emerging company in a new
14
and rapidly evolving market. We may not be able to address these risks, uncertainties and difficulties successfully, which could materially harm our business and operating results.
Worldwide economic conditions, and their impact on travel and consumer spending, may adversely affect our business, operating results and financial condition.
Global economic conditions have recently weakened and levels of travel and consumer spending have been particularly depressed. Our business is impacted by travel and consumer spending, because users seek to access the mobile Internet while they are on-the-go, and because spending on Internet access is often a consumer discretionary spending decision. Factors that tend to negatively impact levels of travel include high unemployment, high energy prices, low business and consumer confidence, the fear of terrorist attacks, war and other macroeconomic factors. Economic conditions that tend to negatively impact levels of discretionary consumer spending include high unemployment, high consumer debt, reductions in net worth, depressed real estate markets, increased taxation, high energy prices, high interest rates, low consumer confidence and other macroeconomic factors. If the global economic recovery is slower than expected, or if it weakens, our retail and military customer base, new retail and military customer acquisition and usage-based revenue could be materially harmed, and our results of operations would be adversely affected.
We may not maintain recent rates of revenue growth.
Although our revenue has increased substantially over the last few years, we may not be able to maintain historical rates of revenue growth. We believe that our continued growth will depend, among other factors, on successfully implementing our business strategies, including our ability to:
- •
- attract new users, convert users of our single-use services into subscribers and keep existing subscribers actively using our
services;
- •
- develop new sources of revenue from our users and partners;
- •
- react to changes in the way individuals access and use the mobile Internet;
- •
- expand into new markets;
- •
- increase the awareness of our brand;
- •
- retain our existing partners and attract new partners; and
- •
- provide our users with a superior experience, including customer support and payment experiences.
However, we cannot guarantee that we will successfully implement any of these business strategies.
The U.S. government may modify, curtail or terminate one or more of our contracts.
We have dedicated a significant amount of resources to building out broadband and IPTV networks for troops stationed on military bases pursuant to our contracts with the U.S. government. The investment of these resources will occur in advance of experiencing any direct benefit from them including generation of revenues and will make it difficult to determine if we are allocating our resources efficiently. As a result of these investments, we do not expect to be profitable in the near future. The U.S. government may modify, curtail or terminate its contracts with us, either at its convenience or for default based on performance. Any such modification, curtailment, or termination of one or more of our government contracts could have a material adverse effect on our earnings, cash flow and/or financial position.
15
System failures could harm our business.
Although we seek to reduce the possibility of disruptions or other outages, our business may be disrupted by problems with our technology and systems, such as an access point failure at one of our managed and operated wireless infrastructure networks, or a backhaul disruption. We have experienced system failures from time to time, and any interruption in the ability of users to access our solution could harm our business and reputation.
Our systems may be vulnerable to damage or interruption from telecommunications failures, computer denial-of-service attacks, power loss, computer viruses, earthquakes, floods, fires, terrorist attacks and similar events. Some of our systems are not fully redundant, and our disaster recovery planning is not sufficient for all eventualities. Our systems may also be damaged by break-ins, sabotage, and acts of vandalism. Despite any precautions we may take, the occurrence of a natural disaster or other unanticipated problems could result in lengthy interruptions in the availability of the Boingo solution. We do not carry business interruption insurance to compensate us for all losses that may result from service interruptions caused by system failures. If we are unable to resolve service interruptions quickly, our ability to acquire and retain customers will be impaired and our operating results and business could be adversely affected.
We may be unsuccessful in expanding our international operations, which could harm the growth of our business, operating results and financial condition.
Our ability to expand internationally involves various risks, including the need to invest significant resources in unfamiliar markets, and the possibility that there may not be returns on these investments in the near future or at all. In addition, we have incurred and expect to continue to incur expenses before we generate any material revenue in these new markets. Our expansion plans will require significant management attention and resources. We have limited experience in selling our solutions in international markets or in conforming to local cultures, standards or policies. We may not be able to compete successfully in these international markets. Our ability to expand will also be limited by the demand for mobile Internet in international markets. Different privacy, censorship and liability standards and regulations and different intellectual property laws in foreign countries may cause our business and operating results to suffer.
Any future international operations may fail to succeed due to risks inherent in foreign operations, including:
- •
- different technological solutions for mobile Internet than those used in North America;
- •
- varied, unfamiliar and unclear legal and regulatory restrictions;
- •
- unexpected changes in international regulatory requirements and tariffs;
- •
- legal, political, social or systemic restrictions on the ability of U.S. companies to do business in foreign countries;
- •
- currency fluctuations;
- •
- Foreign Corrupt Practices Act compliance and related risks;
- •
- difficulties in staffing and managing foreign operations;
- •
- difficulties in enforcing contracts and collecting accounts receivable, and longer payment cycles, especially in emerging markets;
- •
- reduced protection for intellectual property rights in some countries; and
- •
- potential adverse tax consequences.
16
Some of our business partners also have international operations and are subject to the risks described above. Even if we are able to successfully manage the risks of international operations, our business may be adversely affected if our business partners are not able to successfully manage these risks.
As a result of these obstacles, we may find it difficult or prohibitively expensive to expand internationally or we may be unsuccessful in our attempt to do so, which could harm our business, operating results and financial condition.
Our industry is competitive and if we do not compete successfully, we could lose market share, experience reduced revenue or suffer losses.
The market for commercial wireless infrastructure solutions is competitive and impacted by technological change, and we expect competition with our current and potential competitors to intensify in the future. In particular, some of our competitors have taken steps or may decide to more aggressively compete against us, particularly in the market for venue build-outs of Wi-Fi, DAS, and femto-cell solutions.
Our competitors, many of whom are also our partners, include a variety of telecom operators and network operators, including AT&T, T-Mobile, Cablevision, Comcast and local operators. These and other competitors have developed or may develop technologies that compete directly with our solutions. Many of our competitors are substantially larger than we are and have substantially longer operating histories. We may not be able to fund or invest in certain areas of our business to the same degree as our competitors. Many have substantially greater product development and marketing budgets and other financial and personnel resources than we do. Some also have greater name and brand recognition and a larger base of subscribers or users than we have. In addition, our competitors may provide services that we do not, such as cellular, local exchange and long distance services, voicemail and digital subscriber line. Users that desire these services may choose to also obtain mobile wireless connectivity services from a competitor that provides these additional services rather than from us.
Furthermore, we rely on several of our competitors as partners in roaming agreements. The roaming agreements provide that our retail customers and our wholesale partners' customers may use the Wi-Fi networks of our partners. One or more of our partners may deploy competing technologies that could reduce the partner's need to work with us under a roaming agreement. If our partners decide to terminate our roaming agreements, our network of Wi-Fi hotspots and cellular nodes (DAS or femto-cells) may be reduced, which may result in a significant disruption to our business.
Competition could increase our selling and marketing expenses and related customer acquisition costs. We may not have the financial resources, technical expertise or marketing and support capabilities to continue to compete successfully. A failure to respond to established and new competitors may adversely impact our business and operating results.
The regulation of Internet communications, products and services is currently uncertain, which poses risks for our business from changes in laws, regulations, and interpretation or enforcement of existing laws or regulations.
The current regulatory environment for Internet communications, products and services is uncertain. Many laws and regulations were adopted prior to the advent of the Internet and related technologies and often do not contemplate or address the specific issues associated with the Internet and related technologies. The scope of laws and regulations applicable to the Internet remains uncertain and is subject to statutory or interpretive change. We cannot be certain that we, our partners or our users are currently in compliance with regulatory or other legal requirements in the numerous countries in which our service is used. Our failure or the failure of our partners, users and others with
17
whom we transact business, or to whom we license the Boingo solution, to comply with existing or future regulatory or other legal requirements could materially adversely affect our business, financial condition and results of operations. Regulators may disagree with our interpretations of existing laws or regulations or the applicability of existing laws or regulations to our business, and existing laws, regulations and interpretations may change in unexpected ways.
We believe that the Boingo solution is on the forefront of wireless infrastructure connectivity, and therefore it may face greater regulatory scrutiny than other communications products and services. We cannot be certain what positions regulators may take regarding our compliance with, or lack of compliance with, current and future legal and regulatory requirements or what positions regulators may take regarding any past or future actions we have taken or may take in any jurisdiction. Regulators may determine that we are not in compliance with legal and regulatory requirements, and impose penalties, or we may need to make changes to the Boingo solution, which could be costly and difficult. Any of these events would adversely affect our operating results and business.
If we lose key personnel or are unable to attract and retain personnel on a cost effective basis, our business could be harmed.
Our performance is substantially dependent on the continued services and performance of our senior management and our highly qualified team of engineers, many of whom have numerous years of experience and specialized expertise in our business. If we are not successful in hiring and retaining highly qualified engineers, we may not be able to extend or maintain our engineering and technological expertise and our future product and service development efforts could be adversely affected. Additionally, the process of attracting and retaining suitable replacements for any executive officers or any of our highly qualified engineers we lose in the future would result in transition costs and would divert the attention of other members of our senior management from our existing operations. Additionally, such a loss could be negatively perceived in the capital markets. If we lose members of our senior management, this may significantly delay or prevent the achievement of our strategic objectives and adversely affect our operating results.
Our future success also depends on our ability to identify, attract, hire, train, retain and motivate highly skilled managerial, operations, business development and marketing personnel. We have in the past maintained a rigorous, highly selective and time-consuming hiring process. We believe that our approach to hiring has significantly contributed to our success to date. However, our highly selective hiring process has made it more difficult for us to hire a sufficient number of qualified employees, and, as we grow, our hiring process may prevent us from hiring the personnel we need in a timely manner. Moreover, the cost of living in the Los Angeles area, where our corporate headquarters is located, has been an impediment to attracting new employees in the past, and we expect that this will continue to impair our ability to attract and retain employees in the future. If we fail to attract, integrate and retain the necessary personnel, we may not be able to grow effectively and our business could suffer significantly.
Our failure to properly maintain our customers' confidential information and protect our network against security breaches, including cyber-security breaches, could harm our business and operating results.
Advances in computer capabilities, new discoveries in the field of cryptography or other cyber-security developments may result in a compromise or breach of the technology we use to protect user transaction data. Cyber-security risks such as malicious software and attempts to gain unauthorized access to data are rapidly evolving and could lead to disruptions in our network, unauthorized release of confidential or otherwise protected information or corruption of data. Any compromises of our security could damage our reputation and brand and expose us to possible liability such as litigation claims, which would substantially harm our business and operating results. We may need to expend significant resources to protect against security breaches or to address problems caused by breaches.
18
Many countries, such as European Union member countries as a result of the 2006 E.U. Data Retention Directive, are introducing, or have already introduced into local law some form of traffic and user data retention requirements, which are generally applicable to providers of electronic communications services. Retention periods and data types vary from country to country, and the various local data protection and other authorities may implement traffic and user retention requirements regarding certain data in different and potentially overlapping ways. Although the constitutionality of the 2006 E.U. Data Retention Directive has been questioned, we may be required to comply with data retention requirements in one or more jurisdictions, or we may be required to comply with these requirements in the future as a result of changes or modifications to the Boingo solution or changes or modifications to the technological infrastructure on which the Boingo solution is based. Failure to comply with these retention requirements may result in the imposition of costly penalties. Compliance with these retention requirements can be difficult and costly from a legal, operational and technical perspective and could harm our business and operational results.
We rely on our credit facility to fund a significant portion of our capital expenditures and other capital needs. If we are unable to achieve compliance with the credit facility covenants, or interest rates increase significantly, our business would be negatively impacted.
In November 2014, we entered into a Credit Agreement (the "Credit Agreement") and related agreements with Bank of America, N.A. acting as agent for lenders named therein. The Credit Agreement places restrictions on our ability to take certain actions and sets standards for minimum financial performance. In addition to maintaining compliance with the covenants set forth in the Credit Agreement, our ability to increase the amount available for borrowing under our revolving line of credit depends on our ability to meet certain financial targets. In February 2016, we increased the amount of our available revolving line of credit under the Credit Agreement from $46.5 million to $69.75 million. If we fail to comply with the terms and conditions of this Credit Agreement, then the line of credit may be withdrawn, we may be required to immediately repay any outstanding obligation, and the additional funds will not be available to us to fund our capital needs.
We rely on a third-party customer support service provider for the majority of our customer support calls. If this service provider experiences operational difficulties or disruptions, our business could be adversely affected.
We depend on a third-party customer support service provider to handle most of our routine retail and military customer support cases. While we maintain limited customer support operations in our Los Angeles headquarters, if our relationship with our customer support service provider terminates unexpectedly, or if our customer service provider experiences operational difficulties, we may not be able to respond to customer support calls in a timely manner and the quality of our customer service would be adversely affected. This could harm our reputation and brand image and make it difficult for us to attract and retain users. In addition, the loss of the customer support service provider would require us to identify and contract with alternative sources, which could prove time-consuming and expensive.
Material defects or errors in our software could harm our reputation, result in significant costs to us and impair our ability to sell the Boingo solution.
The software underlying the Boingo solution is inherently complex and may contain material defects or errors, particularly when the software is first introduced or when new versions or enhancements are released. We have from time to time found defects or errors in our software, and defects or errors in our existing software may be detected in the future. Any defects or errors that cause interruptions to the availability of our services could result in:
- •
- a reduction in sales or delay in market acceptance of the Boingo solution;
19
- •
- sales credits or refunds to our users and wholesale partners;
- •
- loss of existing users and difficulty in attracting new users;
- •
- diversion of development resources;
- •
- harm to our reputation and brand image; and
- •
- increased insurance costs.
The costs incurred in correcting any material defects or errors in our software may be substantial and could harm our operating results.
If we are not successful in developing our mobile application for new devices and platforms, or if those solutions are not widely adopted, our results of operations and business could be adversely affected.
As new mobile devices and platforms are developed, we may encounter problems in developing products for such new mobile devices and platforms, and we may need to devote significant resources to the creation, support, and maintenance of such products. In addition, if we experience difficulties integrating our mobile applications into mobile devices, or if we face increased costs to distribute our mobile applications, our future growth and our results of operations could suffer.
If we fail to maintain relationships with providers of mobile operating systems or mobile application download stores, our business could be adversely affected.
We rely on the integration of our software into mobile operating systems to allow mobile devices to connect to our network of Wi-Fi hotspots. If problems arise with our relationships with providers of mobile operating systems or mobile application download stores, such as the Apple App Store and Google Play, or if our mobile application receives unfavorable treatment compared to the promotion and placement of competing applications, such as the order of our products in the mobile application download stores, we may fail to attract or retain customers or partners, and our business could be adversely affected.
Our business depends on strong brands, and if we do not cost effectively develop, maintain and enhance our brand, our financial condition and operating results could be harmed.
We believe that the Boingo brand is a critical part of our business and that developing and maintaining awareness of our brand is important to achieving widespread acceptance of the Boingo solution, and is an important element in attracting and retaining customers and partners. We continue to seek new ways to promote our brand through our managed and operated hotspots. We intend to enhance our brand through low-cost co-marketing arrangements with our partners and through periodic promotional and sponsorship activities and by continuing to leverage the reach of social media to interact with our customers. In order to maintain strong relationships with our venue and network partners, we may have to reduce the visibility of the Boingo brand or make other decisions that do not promote and maintain the Boingo brand, such as our custom branding alternatives that we offer to wholesale clients. If we fail to promote and maintain the Boingo brand, or if we incur significant expenses to promote the brand and are still unsuccessful in maintaining a strong brand, our financial condition and operating results could be harmed.
Additionally, we believe that developing this brand in a cost effective manner is important in meeting our expected margins. Brand promotion activities may not result in increased revenue, and any increased revenue resulting from these promotion activities may not offset the expenses we incurred in building our brand. If we fail to cost effectively build and maintain our brand, we may fail to attract or retain customers or partners, and our financial condition and results of operations could be harmed.
20
Risks Related to Our Intellectual Property
Claims by others that we infringe their proprietary technology could harm our business.
In recent years there has been significant litigation involving intellectual property rights in many technology-based industries, including the wireless communications industry. While we have not been specifically targeted, companies similar to us have been subject to patent lawsuits. As we face increasing competition and gain an increasingly high profile, the possibility of intellectual property rights claims against us grows. We may be subject to third-party claims in the future. The costs of supporting these litigations and disputes are considerable, and there can be no assurance that a favorable outcome will be obtained. We may be required to settle these litigations and disputes on terms that are unfavorable to us, given the complex technical issues and inherent uncertainties in intellectual property litigation. Claims that the Boingo solution infringes third-party intellectual property rights, regardless of their merit or resolution, could also divert the efforts and attention of our management and technical personnel. The terms of any settlements or judgments may require us to:
- •
- cease distribution and back-end operation of the Boingo solution;
- •
- pay substantial damages for infringement;
- •
- expend significant resources to develop non-infringing solutions;
- •
- license technology from the third-party claiming infringement, which may not be available on commercially reasonable terms, or at all;
- •
- cross-license our technology to a competitor to resolve an infringement claim, which could weaken our ability to compete with that
competitor; or
- •
- pay substantial damages to our partners to discontinue their use of or to replace infringing solutions sold to them with non-infringing solutions.
Any of these unfavorable outcomes could have a material adverse effect on our business, financial condition and results of operations.
If we are unable to protect our intellectual property rights, our competitive position could be harmed, or we could be required to incur significant expenses to enforce our rights.
Our business depends on our ability to protect our proprietary technology. We rely on trade secret, patent, copyright and trademark laws and confidentiality agreements with employees and third parties, all of which offer only limited protection. We own four patents and have applications for six additional patents pending in the United States. Despite our efforts, the steps we have taken to protect our proprietary rights may not be adequate to prevent the use or misappropriation of our proprietary information or infringement of our intellectual property rights. Our ability to police the use, misappropriation or infringement of our intellectual property is uncertain, particularly in countries other than the United States. Further, we do not know whether any of our pending patent applications will result in the issuance of patents or whether the examination process will require us to narrow our claims. Even if patents are issued, they may be contested, circumvented, or invalidated in the future. Moreover, the rights granted under any issued patents may not provide us with complete proprietary protection or any competitive advantages, and, as with any technology, competitors may be able to develop similar or superior technologies on their own now or in the future. Protecting against the unauthorized use of our solutions, trademarks, and other proprietary rights is expensive, difficult and, in some cases, impossible. Litigation may be necessary in the future to enforce or defend our intellectual property rights, to protect our trade secrets, or to determine the validity and scope of the proprietary rights of others. Litigation could result in substantial costs and diversion of management resources, either of which could harm our business. Furthermore, many of our current and potential competitors have the ability to dedicate substantially greater resources to enforce their intellectual
21
property rights than we do. Accordingly, despite our efforts, if the protection of our proprietary rights is inadequate to prevent use or misappropriation by third parties, the value of our brand and other intangible assets may be diminished and competitors may be able to more effectively mimic our service and methods of operations. Any of these events would have a material adverse effect on our business, financial condition and results of operations.
Our use of open source software could limit our ability to commercialize the Boingo solution.
We have incorporated open source software into the Boingo solution. Although we closely monitor our use of open source software, we are subject to the terms of open source licenses that have not been interpreted by U.S. or foreign courts, and there is a risk that in the future these licenses could be construed in a manner that imposes unanticipated conditions or restrictions on our ability to commercialize the Boingo solution. In that event, we could be required to seek licenses from third parties or to re-engineer our software in order to continue offering the Boingo solution, or to discontinue operations, any of which could materially adversely affect our business.
We utilize unlicensed spectrum in certain of our offerings, which is subject to intense competition, low barriers of entry and slowdowns due to multiple users.
We presently utilize unlicensed spectrum to provide our Wi-Fi Internet solutions. Unlicensed or "free" spectrum is available to multiple users and may suffer bandwidth limitations, interference and slowdowns if the number of users exceeds traffic capacity. The availability of unlicensed spectrum is not unlimited and others do not need to obtain permits or licenses to utilize the same unlicensed spectrum that we currently, or may in the future, utilize. The inherent limitations of unlicensed spectrum could potentially threaten our ability to reliably deliver our services. Moreover, the prevalence of unlicensed spectrum creates low barriers to entry in our industry.
Risks Related to Ownership of Our Common Stock
The market price of our common stock may be volatile, which could result in substantial losses for investors.
Fluctuations in market price and volume are particularly common among securities of technology companies. As a result, you may be unable to sell your shares of common stock at or above the price you paid. The market price of our common stock may fluctuate significantly in response to the factors described in this risk factor section as well as the following factors, among others, many of which are beyond our control:
- •
- general market conditions;
- •
- domestic and international economic factors unrelated to our performance;
- •
- actual or anticipated fluctuations in our quarterly operating results;
- •
- changes in or failure to meet publicly disclosed expectations as to our future financial performance;
- •
- changes in securities analysts' estimates of our financial performance or lack of research and reports by industry analysts;
- •
- changes in market valuations or earnings of similar companies;
- •
- announcements by us or our competitors of significant products, contracts, acquisitions, or strategic partnerships;
22
- •
- developments or disputes concerning patents or proprietary rights, including increases or decreases in litigation expenses associated
with intellectual property lawsuits we may initiate, or in which we may be named as defendants;
- •
- termination of a relationship with a venue partner;
- •
- failure to complete significant sales;
- •
- any future sales of our common stock or other securities; and
- •
- additions or departures of key personnel.
If securities or industry analysts publish misleading or unfavorable research about our business, our stock price and trading volume could decline.
The trading market for our common stock depends in part on the research and reports that securities or industry analysts publish about us or our business. If one or more of these analysts downgrades our stock or publishes misleading or unfavorable research about our business, our stock price would likely decline. If one or more of these analysts ceases coverage of our company or fails to publish reports on us regularly, demand for our stock could decrease, which could cause our stock price or trading volume to decline. Announcements by analysts that may have a significant impact on the market price of our common stock may relate to:
- •
- our operating results or forecasts;
- •
- new issuances of equity, debt or convertible debt by us;
- •
- developments in our relationships with corporate customers;
- •
- announcements by our customers or competitors;
- •
- changes in regulatory policy or interpretation;
- •
- governmental investigations;
- •
- changes in the ratings of our stock by rating agencies or securities analysts;
- •
- our acquisitions of complementary businesses; or
- •
- our operational performance.
As a public company, we are subject to financial and other reporting and corporate governance requirements that may be difficult for us to satisfy, and may divert resources and management attention from operating our business.
We are required to file annual, quarterly and other reports with the SEC. We must prepare and timely file financial statements that comply with SEC reporting requirements. We are also subject to other reporting and corporate governance requirements, under the listing standards of the NASDAQ Stock Market, or NASDAQ, which imposes significant compliance obligations upon us. We are required, among other things, to:
- •
- prepare and file periodic reports, and distribute other stockholder communications, in compliance with the federal securities laws and
NASDAQ rules; and
- •
- evaluate and maintain our system of internal control over financial reporting, and report on management's assessment thereof, in compliance with rules and regulations of the SEC and the Public Company Accounting Oversight Board. Further, we are required to obtain an opinion on the effectiveness of our internal control over financial reporting as of December 31st each year from our independent registered public accounting firm.
23
If we fail to comply with the rules of Section 404 of the Sarbanes-Oxley Act of 2002 related to accounting controls and procedures, or, if we discover material weaknesses and deficiencies in our internal control and accounting procedures, we may be subject to sanctions by regulatory authorities and our stock price could decline.
Section 404 of the Sarbanes-Oxley Act (the "Act") requires that we evaluate and determine the effectiveness of our internal control over financial reporting and requires an attestation and report by our external auditing firm on our internal control over financial reporting. We believe our system and process evaluation and testing comply with the management certification and auditor attestation requirements of Section 404. We cannot be certain, however, that we will be able to satisfy the requirements in Section 404 in all future periods, especially as we grow our business. If we are not able to continue to meet the requirements of Section 404 in a timely manner or with adequate compliance, we may be subject to sanctions or investigation by regulatory authorities, such as the SEC or the NASDAQ Stock Market. Any such action could adversely affect our financial results or investors' confidence in us and could cause our stock price to fall. Moreover, if we are not able to comply with the requirements of Section 404 in a timely manner, or if we or our independent registered public accounting firm identifies deficiencies in our internal controls that are deemed to be material weaknesses, we may be required to incur significant additional financial and management resources to achieve compliance.
If we need additional capital in the future, it may not be available on favorable terms, or at all.
We may require additional capital from equity or debt financing in the future to fund our operations, or respond to competitive pressures or strategic opportunities. We may not be able to secure timely additional financing on favorable terms, or at all. The terms of additional financing may place limits on our financial and operating flexibility. If we raise additional funds through further issuances of equity, convertible debt securities or other securities convertible into equity, our existing stockholders could suffer significant dilution in their percentage ownership of our company, and any new securities we issue could have rights, preferences and privileges senior to those of holders of our common stock. If we are unable to obtain adequate financing or financing on terms satisfactory to us, if and when we require it, our ability to grow or support our business and to respond to business challenges and opportunities could be significantly limited.
The price of our common stock may continue to be volatile, which could lead to losses by investors and costly securities litigation, which could divert management's attention and adversely affect our results of operations.
The stock market in general and market prices for the securities of technology companies like ours in particular, have from time to time experienced volatility that often has been unrelated to the operating performance of the underlying companies. A certain degree of stock price volatility can also be attributed to being an emerging company in an evolving industry. These broad market and industry fluctuations may adversely affect the market price of our common stock, regardless of our operating performance. In several recent situations where the market price of a stock has been volatile, holders of that stock have instituted securities class action litigation against the company that issued the stock. If any of our stockholders were to bring a lawsuit against us, the defense and disposition of the lawsuit could be costly and divert the time and attention of our management and harm our operating results.
Investors may experience dilution of their ownership interests because of the future issuance of additional shares of our capital stock.
We are authorized to issue 100,000,000 shares of common stock and 5,000,000 shares of preferred stock. As of December 31, 2015, there were approximately 37,325,000 shares of our common stock issued and outstanding and no shares of preferred stock outstanding. In addition, as of December 31, 2015, we had approximately 1,819,000 unvested restricted stock units, approximately 3,175,000 exercisable stock options, and approximately 5,978,000 shares available for grant under the 2011 Plan.
24
In the future, we may issue additional authorized but previously unissued equity securities resulting in the dilution of the ownership interests of our present stockholders. We may also issue additional shares of our capital stock or other securities that are convertible into or exercisable for our capital stock in connection with hiring or retaining employees or for other business purposes, including future sales of our securities for capital raising purposes. The future issuance of any such additional shares of capital stock may create downward pressure on the trading price of our common stock.
Anti-takeover provisions in our charter documents and Delaware law could discourage, delay, or prevent a change in control of our company and may affect the trading price of our common stock.
We are a Delaware corporation and the anti-takeover provisions of the Delaware General Corporation Law may discourage, delay, or prevent a change in control by prohibiting us from engaging in a business combination with an interested stockholder for a period of three years after the person becomes an interested stockholder, even if a change of control would be beneficial to our existing stockholders. In addition, our amended and restated certificate of incorporation and amended and restated bylaws may discourage, delay, or prevent a change in our management or control over us that stockholders may consider favorable. Institutional shareholder representative groups, shareholder activists and others may disagree with our corporate governance provisions or other practices, such as those listed below. We generally will consider recommendations of institutional shareholder representative groups, but we will make decisions based on what our board and management believe to be in the best long term interests of our company and stockholders. These groups could make recommendations to our stockholders against our practices or our board members if they disagree with our positions. Our amended and restated certificate of incorporation and amended and restated bylaws include provisions that:
- •
- authorize the issuance of "blank check" preferred stock that could be issued by our board of directors to thwart a takeover attempt;
- •
- establish a classified board of directors, as a result of which the successors to the directors whose terms have expired will be
elected to serve from the time of election and qualification until the third annual meeting following their election;
- •
- require that directors only be removed from office for cause and only upon a majority stockholder vote;
- •
- provide that vacancies on the board of directors, including newly-created directorships, may be filled only by a majority vote of
directors then in office;
- •
- limit who may call special meetings of stockholders;
- •
- prohibit stockholder action by written consent, thereby requiring all actions to be taken at a meeting of the stockholders; and
- •
- require supermajority stockholder voting to effect certain amendments to our amended and restated certificate of incorporation and amended and restated bylaws.
We have incurred substantial losses in past and current years and may incur additional losses in the future.
As of December 31, 2015, our accumulated deficit was $85.2 million. We generated a net loss in 2015 and we are also currently investing in our future growth through expanding our network and buildouts, investing in our software, and consideration of future business acquisitions. As a result, we will incur higher depreciation and other operating expenses, as well as potential acquisition costs, that may negatively impact our ability to achieve profitability in future periods unless and until these growth efforts generate enough revenue to exceed their operating costs and cover our additional overhead
25
needed to scale our business for this anticipated growth. The current global financial condition may also impact our ability to achieve profitability if we cannot generate sufficient revenue to offset the increased costs. In addition, costs associated with the acquisition and integration of any acquired companies may also negatively impact our ability to achieve profitability. Finally, given the competitive and evolving nature of the industry in which we operate, we may not be able to achieve or increase profitability.
We do not intend to pay dividends on our common stock and, consequently, your ability to achieve a return on your investment will depend on appreciation in the price of our common stock.
We do not intend to declare and pay dividends on our capital stock for the foreseeable future. We currently intend to invest our future earnings, if any, to fund our growth. Therefore, you are not likely to receive any dividends on your common stock for the foreseeable future and the success of an investment in shares of our common stock will depend upon any future appreciation in their value.
Item 1B. Unresolved Staff Comments
None.
As of December 31, 2015, we leased approximately 52,000 square feet of space for our corporate headquarters in Los Angeles, CA. As of December 31, 2015, we also leased an approximately 16,000 additional square feet in aggregate office space in Brea, California; San Francisco, California; Oak Brook, Illinois; Lake Success, New York; New York, New York; McKinney, Texas; Seattle, Washington; Allentown, Pennsylvania; Sao Paolo, Brazil; and Dubai, United Arab Emirates. We believe that our office facilities will be adequate for the foreseeable future.
From time to time, we may be involved in or subject to claims, suits, investigations and proceedings arising out of the normal course of business. We are not currently a party to any litigation that we believe could have a material adverse effect on our business, financial position, results of operations or cash flows.
Item 4. Mine Safety Disclosures
Not applicable.
26
Item 5. Market for Registrant's Common Equity, Related Stockholder Matters and Issuer Purchases of Equity Securities
Market Information
Our common stock is traded on the NASDAQ Global Market under the symbol "WIFI." The following table sets forth the high and low sales prices of our common stock as reported by the NASDAQ Global Market for the periods indicated.
| |
2015 | ||||||
|---|---|---|---|---|---|---|---|
| |
High | Low | |||||
First quarter |
$ | 8.62 | $ | 6.80 | |||
Second quarter |
$ | 9.22 | $ | 7.43 | |||
Third quarter |
$ | 10.42 | $ | 7.07 | |||
Fourth quarter |
$ | 8.49 | $ | 5.89 | |||
| |
2014 | ||||||
|---|---|---|---|---|---|---|---|
| |
High | Low | |||||
First quarter |
$ | 7.03 | $ | 5.06 | |||
Second quarter |
$ | 7.43 | $ | 5.86 | |||
Third quarter |
$ | 7.70 | $ | 5.48 | |||
Fourth quarter |
$ | 8.14 | $ | 6.25 | |||
Registered Stockholders
As of March 1, 2016, there were 22 stockholders of record of our common stock. Stockholders of record do not include a substantially greater number of "street name" holders or beneficial holders of our common stock whose shares are held of record by banks, brokers and other financial institutions.
Dividends
We have never declared or paid cash dividends on our common stock, and currently do not anticipate paying cash dividends in the foreseeable future. Any future determination to pay dividends on our common stock, if permissible, will be at the discretion of our board of directors and will depend upon, among other factors, our financial condition, operating results, current and anticipated cash needs, plans for expansion and other factors that our board of directors may deem relevant.
Recent Sales of Unregistered Securities; Use of Proceeds from Sale of Registered Securities
We did not sell any equity securities not registered under the Securities Act during the year ended December 31, 2015.
Issuer Purchases of Equity Securities
On April 1, 2013, the Company approved a stock repurchase program to repurchase up to $10,000,000 of the Company's common stock in the open market, exclusive of any commissions, markups or expenses. The stock repurchased will be retired and will resume the status of authorized but unissued shares of common stock. The Company did not repurchase any of our common stock during the years ended December 31, 2015 and 2014. As of December 31, 2015, the remaining approved amount for repurchases was approximately $5,180,000.
27
Equity Compensation Plan Information
On April 17, 2015, the Company filed a registration statement on Form S-8 to register 1,631,737 shares representing additional shares authorized as of January 1, 2015 under the Evergreen Provision of the 2011 Equity Incentive Plan. On January 1, 2016, an additional 1,679,635 shares under the Evergreen Provision of the 2011 Equity Incentive Plan were authorized and the Company is filing a registration statement on Form S-8 to register these additional shares on or around the date hereof.
Performance Measurement Comparison
The following performance graph shows the total stockholder return of an investment of $100 in cash made on May 4, 2011 in each of (i) our common stock, (ii) a broad equity market index, the securities comprising the Nasdaq Composite Index, and (iii) issuers with similar market capitalizations, the securities comprising the Russell 2000 index.
The performance graph assumes that $100 was invested on May 4, 2011 in our common stock at the closing price of $12.10 and in each index, and that all dividends were reinvested. No dividends have been declared nor paid on our common stock. The comparisons in the graph below are required by the SEC and are not intended to forecast or be indicative of possible future performance of our common stock.
COMPARISON OF 56 MONTHS CUMULATIVE TOTAL RETURN*
Among Boingo Wireless, Inc., The NASDAQ Composite Index and The Russell 2000 Index**
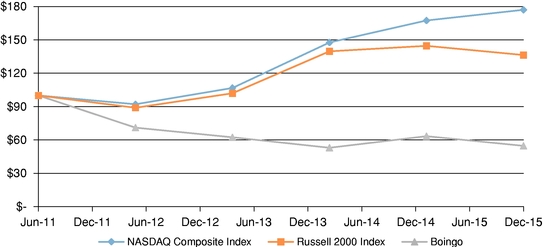
| |
05/04/11 | 12/31/11 | 12/31/12 | 12/31/13 | 12/31/14 | 12/31/15 | |||||||||||||
|---|---|---|---|---|---|---|---|---|---|---|---|---|---|---|---|---|---|---|---|
NASDAQ Composite Index |
$ | 100.00 | $ | 92.11 | $ | 106.76 | $ | 147.68 | $ | 167.46 | $ | 177.05 | |||||||
Russell 2000 Index |
$ | 100.00 | $ | 88.96 | $ | 101.98 | $ | 139.71 | $ | 144.64 | $ | 136.38 | |||||||
Boingo |
$ | 100.00 | $ | 71.07 | $ | 62.40 | $ | 52.98 | $ | 63.39 | $ | 54.71 | |||||||
- *
- The
material in this section is not "soliciting material" and is not deemed "filed" with the SEC. It is not to be incorporated by reference into any filing of
Boingo Wireless, Inc. made under the Securities Act of 1933, as amended, or the Exchange Act, whether made before or after the date hereof and irrespective of any general incorporation language
in any such filing, except to the extent we specifically incorporate this section by reference.
- **
- We chose the Russell 2000 index because it is comprised of issuers with similar market capitalizations. We do not believe that we can reasonably identify a peer group of issuers or an industry or line-of-business index.
28
In September 2015, we filed and the SEC declared effective a shelf registration statement on Form S-3, which permits us to offer up to $125.0 million of common stock, preferred stock, debt securities and warrants in one or more offerings and in any combination, including in units from time to time. In February 2016, we filed a post-effective amendment to terminate the shelf registration statement and remove from registration the securities registered pursuant to the shelf registration statement.
ITEM 6. SELECTED FINANCIAL DATA
The following selected consolidated financial data should be read in conjunction with "Management's Discussion and Analysis of Financial Condition and Results of Operations" in Part II, Item 7 and our accompanying consolidated financial statements in Part II, Item 8 of this report.
The consolidated statements of operations data set forth below for years 2015, 2014 and 2013 and the consolidated balance sheets data as of the end of years 2015 and 2014 are derived from, and qualified by reference to, the audited consolidated financial statements included in Item 8 of this report. The consolidated statements of operations data for years 2012 and 2011 and the consolidated balance sheets data as of the end of years 2013, 2012 and 2011 are derived from the audited financial statements previously filed with the SEC on Form 10-K. The results of businesses acquired in a business combination are included in the Company's consolidated financial statements from the date of the acquisition. Refer to Note 3 in our accompanying consolidated financial statements in Part II, Item 8 of this report for a discussion of our business combinations for 2013. On August 6, 2012, we acquired the assets of Cloud 9 Wireless, Inc. ("Cloud 9") for $3.5 million plus the assumption of certain liabilities. Cloud 9 provides Wi-Fi sponsorship and location-based advertising at airports, hotels, bars and restaurants, and recreational areas in the U.S. and Canada. Cloud 9 was consolidated into our results of operations starting August 6, 2012, the acquisition date. Cloud 9 has been integrated into our product offering; therefore, it is not practical to disclose actual and pro forma financial results for Cloud 9 since the acquisition. There were no business combinations for 2015, 2014 and 2011.
We early adopted Financial Accounting Standards Board ("FASB") Accounting Standards Update ("ASU") 2015-17, Balance Sheet Classification of Deferred Taxes, on a retrospective basis as of December 31, 2015. As a result, we reclassified $787,000 and $1,192,000 from current deferred tax assets to noncurrent deferred tax liabilities as of December 31, 2014 and 2013, respectively, as the deferred tax assets and liabilities were related to the same tax-paying jurisdictions. We also reclassified $1,204,000 and $2,366,000 from current deferred tax assets to noncurrent deferred tax assets as of December 31, 2012 and 2011, respectively.
Prior to August 4, 2015, we had a 70% ownership of Concourse Communications Detroit, LLC. On August 4, 2015, we purchased the remaining 30% ownership interest from the non-controlling interest owners for $1,150,000. We accounted for this transaction as an acquisition of the remaining interest of an entity that had already been majority-owned by the Company. The purchase resulted in a reduction to additional paid-in capital of $1,150,000, representing excess purchase price over the carrying amount of the non-controlling interests. Prior to this purchase, we had a controlling interest in this subsidiary, and therefore, this subsidiary had been and will continue to be consolidated with the Company's operations.
During the year ended December 31, 2014, we finalized our purchase price allocation for our acquisition of Electronic Media Systems, Inc. and all membership interests in its subsidiary, Advanced Wireless Group, LLC (collectively, "AWG"). The consolidated balance sheets data as of December 31, 2013 and the consolidated statement of operations for 2013 have been retrospectively adjusted to reflect the final purchase price allocation for the AWG acquisition including a $28,000 decrease in goodwill, a $147,000 increase in accrued expenses and other liabilities, and a $175,000 increase in income tax expenses and accumulated deficit.
29
The consolidated statement of operations for the year 2013 includes certain out-of-period adjustments that decreased net loss attributable to common stockholders by $217,000. The impact of these out-of-period adjustments are not considered material, individually and in the aggregate, to any of the current or prior annual periods.
| |
Year Ended December 31, | |||||||||||||||
|---|---|---|---|---|---|---|---|---|---|---|---|---|---|---|---|---|
| |
2015 | 2014 | 2013 | 2012 | 2011 | |||||||||||
| |
(in thousands, except per share amounts) |
|||||||||||||||
Consolidated Statements of Operations Data: |
||||||||||||||||
Revenue |
$ | 139,626 | $ | 119,297 | $ | 106,746 | $ | 102,506 | $ | 94,558 | ||||||
Costs and operating expenses: |
||||||||||||||||
Network access |
62,988 | 59,411 | 47,245 | 42,289 | 37,082 | |||||||||||
Network operations |
33,537 | 25,475 | 18,402 | 14,541 | 15,849 | |||||||||||
Development and technology |
19,147 | 14,879 | 11,432 | 10,772 | 9,433 | |||||||||||
Selling and marketing |
19,653 | 16,382 | 14,244 | 10,255 | 7,409 | |||||||||||
General and administrative |
22,356 | 17,460 | 15,067 | 12,700 | 11,953 | |||||||||||
Amortization of intangible assets |
3,576 | 3,716 | 2,250 | 1,103 | 1,655 | |||||||||||
| | | | | | | | | | | | | | | | | |
Total costs and operating expenses |
161,257 | 137,323 | 108,640 | 91,660 | 83,381 | |||||||||||
| | | | | | | | | | | | | | | | | |
(Loss) income from operations |
(21,631 | ) | (18,026 | ) | (1,894 | ) | 10,846 | 11,177 | ||||||||
Interest and other (expense) income, net |
(66 | ) | (41 | ) | 37 | 143 | (176 | ) | ||||||||
| | | | | | | | | | | | | | | | | |
(Loss) income before income taxes |
(21,697 | ) | (18,067 | ) | (1,857 | ) | 10,989 | 11,001 | ||||||||
Income tax expense |
481 | 700 | 1,461 | 2,965 | 4,064 | |||||||||||
| | | | | | | | | | | | | | | | | |
Net (loss) income |
(22,178 | ) | (18,767 | ) | (3,318 | ) | 8,024 | 6,937 | ||||||||
Net income attributable to non-controlling interests |
114 | 754 | 650 | 729 | 642 | |||||||||||
| | | | | | | | | | | | | | | | | |
Net (loss) income attributable to Boingo Wireless, Inc. |
(22,292 | ) | (19,521 | ) | (3,968 | ) | 7,295 | 6,295 | ||||||||
Accretion of convertible preferred stock |
— | — | — | — | (1,633 | ) | ||||||||||
| | | | | | | | | | | | | | | | | |
Net (loss) income attributable to common stockholders |
$ | (22,292 | ) | $ | (19,521 | ) | $ | (3,968 | ) | $ | 7,295 | $ | 4,662 | |||
| | | | | | | | | | | | | | | | | |
| | | | | | | | | | | | | | | | | |
| | | | | | | | | | | | | | | | | |
Net (loss) income per share attributable to common stockholders: |
||||||||||||||||
Basic |
$ | (0.60 | ) | $ | (0.55 | ) | $ | (0.11 | ) | $ | 0.21 | $ | 0.19 | |||
Diluted |
$ | (0.60 | ) | $ | (0.55 | ) | $ | (0.11 | ) | $ | 0.20 | $ | 0.17 | |||
Other Financial Data: |
||||||||||||||||
Operating cash flows |
$ | 98,575 | $ | 21,207 | $ | 20,671 | $ | 24,596 | $ | 29,529 | ||||||
Investing cash flows |
(101,502 | ) | (39,199 | ) | (40,403 | ) | (62,468 | ) | (7,335 | ) | ||||||
Financing cash flows |
8,843 | (480 | ) | (11,068 | ) | 2,077 | 46,018 | |||||||||
Adjusted EBITDA(1) |
29,636 | 20,300 | 23,802 | 30,642 | 28,556 | |||||||||||
| |
As of December 31, | |||||||||||||||
|---|---|---|---|---|---|---|---|---|---|---|---|---|---|---|---|---|
| |
2015 | 2014 | 2013 | 2012 | 2011 | |||||||||||
| |
(in thousands) |
|||||||||||||||
Consolidated Balance Sheets Data: |
||||||||||||||||
Cash and cash equivalents |
$ | 14,718 | $ | 8,849 | $ | 27,338 | $ | 58,138 | $ | 93,933 | ||||||
Marketable securities |
— | 1,614 | 32,962 | 41,558 | — | |||||||||||
Working capital |
(31,802 | ) | (14,489 | ) | 31,748 | 81,503 | 73,837 | |||||||||
Total assets |
341,012 | 218,615 | 214,323 | 202,532 | 188,920 | |||||||||||
Deferred revenue, net of current portion |
106,825 | 27,267 | 21,591 | 24,123 | 27,754 | |||||||||||
Long-term debt |
16,750 | 2,625 | — | — | — | |||||||||||
Long-term portion of capital leases |
2,217 | 381 | 473 | 136 | 197 | |||||||||||
Total liabilities |
228,977 | 91,185 | 73,890 | 58,033 | 59,841 | |||||||||||
Total stockholders' equity |
112,035 | 127,430 | 140,433 | 144,499 | 129,079 | |||||||||||
- (1)
- We define Adjusted EBITDA as net (loss) income attributable to common stockholders plus depreciation and amortization of property and equipment, accretion of convertible preferred stock, income tax expense, amortization of intangible assets, stock-based compensation expense, non-controlling interests and interest and other expense (income), net.
30
- •
- Adjusted EBITDA provides investors and other users of our financial information consistency and
comparability with our past financial performance, facilitates period-to-period comparisons of operations and facilitates comparisons with other companies, many of which use similar non-generally
accepted accounting principles in the United States ("GAAP") financial measures to supplement their GAAP results; and
- •
- it is useful to exclude non-cash charges, such as accretion of preferred stock, depreciation
and amortization of property and equipment, amortization of intangible assets and stock-based compensation, from Adjusted EBITDA because the amount of such expenses in any specific period may not
directly correlate to the underlying performance of our business operations, and these expenses can vary significantly between periods as a result of full amortization of previously acquired tangible
and intangible assets or the timing of new stock-based awards.
We use Adjusted EBITDA in conjunction with traditional GAAP measures as part of our overall assessment of our performance, for planning purposes, including the preparation of our annual operating budget and quarterly forecasts, to evaluate the effectiveness of our business strategies and to communicate with our board of directors concerning our financial performance.
We do not place undue reliance on Adjusted EBITDA as our only measure of operating performance. Adjusted EBITDA should not be considered as a substitute for other measures of financial performance reported in accordance with GAAP. There are limitations to using non-GAAP financial measures, including that other companies may calculate these measures differently than we do.
We compensate for the inherent limitations associated with using Adjusted EBITDA through disclosure of these limitations, presentation of our financial statements in accordance with GAAP and reconciliation of Adjusted EBITDA to the most directly comparable GAAP measure, net (loss) income attributable to common stockholders.
We believe that Adjusted EBITDA is useful to investors and other users of our financial statements in evaluating our operating performance because it provides them with an additional tool to compare business performance across companies and across periods. We believe that:
The following provides a reconciliation of net (loss) income attributable to common stockholders to Adjusted EBITDA:
| |
Year Ended December 31, | |||||||||||||||
|---|---|---|---|---|---|---|---|---|---|---|---|---|---|---|---|---|
| |
2015 | 2014 | 2013 | 2012 | 2011 | |||||||||||
| |
(in thousands) |
|||||||||||||||
Net (loss) income attributable to common stockholders |
$ | (22,292 | ) | $ | (19,521 | ) | $ | (3,968 | ) | $ | 7,295 | $ | 4,662 | |||
Depreciation and amortization of property and equipment |
38,293 | 27,446 | 18,940 | 15,958 | 12,301 | |||||||||||
Income tax expense |
481 | 700 | 1,461 | 2,965 | 4,064 | |||||||||||
Stock-based compensation expense |
9,398 | 7,164 | 4,506 | 2,735 | 3,423 | |||||||||||
Amortization of intangible assets |
3,576 | 3,716 | 2,250 | 1,103 | 1,655 | |||||||||||
Accretion of convertible preferred stock |
— | — | — | — | 1,633 | |||||||||||
Non-controlling interests |
114 | 754 | 650 | 729 | 642 | |||||||||||
Interest and other expense (income), net |
66 | 41 | (37 | ) | (143 | ) | 176 | |||||||||
| | | | | | | | | | | | | | | | | |
Adjusted EBITDA |
$ | 29,636 | $ | 20,300 | $ | 23,802 | $ | 30,642 | $ | 28,556 | ||||||
| | | | | | | | | | | | | | | | | |
| | | | | | | | | | | | | | | | | |
| | | | | | | | | | | | | | | | | |
31
ITEM 7. MANAGEMENT'S DISCUSSION AND ANALYSIS OF FINANCIAL CONDITION AND RESULTS OF OPERATIONS
The following discussion and analysis of our financial condition and results of operations should be read together with "Selected Consolidated Financial Data" and our audited consolidated financial statements and accompanying notes included elsewhere in this filing. This discussion contains forward-looking statements, based on current expectations and related to our plans, estimates, beliefs and anticipated future financial performance. These statements involve risks and uncertainties and our actual results may differ materially from those anticipated in these forward-looking statements as a result of many factors, including those set forth under "Risk Factors," "Forward-Looking Statements" and elsewhere in this filing.
Overview
We believe we are the leading global provider of commercial mobile Wi-Fi Internet solutions and indoor DAS services for carriers. Our software applications and solutions enable individuals to access our extensive global Wi-Fi networks that cover more than 1.5 million hotspots. We manage and operate an indoor DAS network, which contains 10,900 nodes. Our offerings provide compelling cost and performance advantages to our customers and partners.
We grew revenue from $119.3 million in 2014 to $139.6 million in 2015, an increase of 17.0%. We grew revenue from $106.7 million in 2013 to $119.3 million in 2014, an increase of 11.8%. We generated a net loss attributable to common stockholders of $22.3 million in 2015 compared to $19.5 million in 2014. Adjusted EBITDA increased from $20.3 million in 2014 to $29.6 million in 2015, an increase of 46.0%. For a discussion of Adjusted EBITDA and a reconciliation of net (loss) income attributable to common stockholders to Adjusted EBITDA, see footnote 1 to "Selected Financial Data" in Part II, Item 6.
The proliferation of smartphones, tablets, laptops, wearables, the internet of things ("IoT") and other Wi-Fi enabled devices—in conjunction with the increased consumption of high-bandwidth activities like streaming media, cloud-based applications, and online gaming and mobile apps—has created a demand for high-speed, high-bandwidth Internet access in public places both large and small. These data intensive activities are driving a global surge in mobile Internet data traffic that is expected to increase nearly eightfold between 2015 and 2020, according to Cisco's Visual Networking Index. We believe these trends present us with opportunities to generate significant growth in revenue and profitability.
Critical Accounting Policies and Estimates
The preparation of financial statements in conformity with accounting principles generally accepted in the United States of America ("GAAP") and rules and regulations of the United States Securities and Exchange Commission ("SEC") requires us to make estimates and assumptions that affect the reported amounts of assets and liabilities, as well as the disclosure of contingent assets and liabilities, at the date of the financial statements. Such estimates and assumptions also affect the reported amounts of revenues and expenses during the reporting period. Although we believe these estimates are reasonable, actual results could differ from these estimates. On a regular basis, we evaluate our assumptions, judgments and estimates. We also discuss our critical accounting policies and estimates with the Audit Committee of the Board of Directors.
We believe that the assumptions and estimates associated with revenue recognition, business combinations, goodwill, measuring recoverability of long-lived assets, stock-based compensation and income taxes have the greatest potential impact on our consolidated financial statements. Therefore, we believe the accounting policies discussed below are paramount to understanding our historical and future performance, as these policies relate to the more significant areas involving our management's judgments, assumptions and estimates.
32
Revenue Recognition
We generate revenue from several sources including: (i) retail and military customers under subscription plans for month-to-month network access that automatically renew, and retail and military single-use access from sales of hourly, daily or other single-use access plans, (ii) DAS customers that are telecom operators under long-term contracts for access to our DAS at our managed and operated locations, (iii) arrangements with wholesale Wi-Fi customers that provide software licensing, network access, and/or professional services fees, and (iv) display advertisements and sponsorships on our walled garden sign-in pages. Software licensed by our wholesale Wi-Fi platform services customers can only be used during the term of the service arrangements and has no utility to them upon termination of the service arrangement.
We recognize revenue when an arrangement exists, services have been rendered, fees are fixed or determinable, no significant obligations remain related to the earned fees and collection of the related receivable is reasonably assured. Revenue is presented net of any sales and value added taxes.
Subscription fees from retail and military customers are paid monthly in advance and revenue is deferred for the portions of monthly recurring subscription fees collected in advance. We provide refunds for our retail and military services on a case-by-case basis. These amounts are not significant and are recorded as contra-revenue in the period the refunds are made. Subscription fee revenue is recognized ratably over the subscription period. Revenue generated from retail and military single-use access is recognized when access is provided.
Revenue generated from access to our DAS networks consists of build-out fees and recurring access fees under certain long-term contracts with telecom operators. Build-out fees paid upfront are generally deferred and recognized ratably over the term of the estimated customer relationship period, once the build-out is complete. Periodically, we install and sell Wi-Fi and DAS networks to customers where we do not have service contracts or remaining obligations beyond the installation of those networks and we recognize build-out fees for such projects as revenue when the installation work is completed and the network has been accepted by the customer. Minimum monthly access fees for usage of the DAS networks are non-cancellable and generally escalate on an annual basis. These minimum monthly access fees are recognized ratably over the term of the telecom operator agreement. The initial term of our contracts with telecom operators generally range from five to twenty years and the agreements generally contain renewal clauses. Revenue from DAS network access fees in excess of the monthly minimums is recognized when earned.
Services provided to wholesale Wi-Fi partners generally contain several elements including: (i) a term license to use our software to access our Wi-Fi network, (ii) access fees for Wi-Fi network usage, and/or (iii) professional services for software integration and customization and to maintain the Wi-Fi service. The term license, monthly minimum network access fees and professional services are billed on a monthly basis based upon predetermined fixed rates. Once the term license for integration and customization are delivered, the fees from the arrangement are recognized ratably over the remaining term of the service arrangement. The initial term of the license agreements is generally between one to five years and the agreements generally contain renewal clauses. Revenue for Wi-Fi network access fees in excess of the monthly minimum amounts is recognized when earned. All elements within existing service arrangements are generally delivered and earned concurrently throughout the term of the respective service arrangement.
In instances where the minimum monthly Wi-Fi and DAS network access fees escalate over the term of the wholesale service arrangement, an unbilled receivable is recognized when performance is within our control and when we have reasonable assurance that the unbilled receivable balance will be collected.
33
We adopted the provisions of ASU 2009-13, Revenue Recognition (Topic 605)—Multiple-Deliverable Revenue Arrangements ("ASU 2009-13"), on a prospective basis on January 1, 2011. For multiple-deliverable arrangements entered into prior to January 1, 2011 that are accounted for under Financial Accounting Standards Board ("FASB") Accounting Standards Codification ("ASC") 605-25, Revenue Recognition—Multiple-Deliverable Revenue Arrangements, we defer recognition of revenue for the full arrangement and recognize all revenue ratably over the wholesale service period for Wi-Fi platform service arrangements and the term of the estimated customer relationship period for DAS arrangements, as we did not have evidence of fair value for the undelivered elements in the arrangement. For multiple-deliverable arrangements entered into or materially modified after January 1, 2011 that are accounted for under ASC 605-25, we evaluate whether or not separate units of accounting exist and then allocate the arrangement consideration to all units of accounting based on the relative selling price method using estimated selling prices if vendor specific objective evidence and third-party evidence is not available. We recognize the revenue associated with the separate units of accounting upon completion of such services or ratably over the wholesale service period for Wi-Fi platform service arrangements and the term of the estimated customer relationship period for DAS arrangements.
Advertising revenue is generated from advertisements on our managed and operated or partner networks. In determining whether an arrangement exists, we ensure that a binding arrangement is in place, such as a standard insertion order or a fully executed customer-specific agreement. Obligations pursuant to our advertising revenue arrangements typically include a minimum number of units or the satisfaction of certain performance criteria. Advertising and other revenue is recognized when the services are performed.
Business Combinations
We allocate the total purchase price of a business combination to the assets acquired and the liabilities assumed based on their estimated fair values at the acquisition date, with the excess purchase price recorded as goodwill. An income, market or cost valuation method may be utilized to estimate the fair value of the assets acquired or liabilities assumed in a business combination. The income valuation method represents the present value of future cash flows over the life of the asset using (i) discrete financial forecasts, which rely on management's estimates of revenue and operating expenses, (ii) long- term growth rates, (iii) an appropriate discount rate and (iv) an appropriate royalty rate, where applicable. The market valuation method uses prices paid for a reasonably similar asset by other purchasers in the market, with adjustments relating to any differences between the assets. The cost valuation method is based on the replacement cost of a comparable asset at prices at the time of the acquisition reduced for depreciation of the asset.
Goodwill
Goodwill represents the excess of purchase price over fair value of net assets acquired. Goodwill is not amortized but instead is tested annually for impairment, or more frequently when events or changes in circumstances indicate that fair value of the reporting unit has been reduced to less than its carrying value. We perform our impairment test annually as of December 31st. Entities have the option to first assess qualitative factors to determine whether it is more likely than not that the fair value of a reporting unit is less than its carrying amount as a basis for determining whether it is necessary to perform the two-step goodwill impairment test described in ASC 350, Intangibles—Goodwill and Other. If, after assessing qualitative factors, an entity determines it is not more likely than not that the fair value of a reporting unit is less than its carrying amount, then performing the two-step impairment test is unnecessary. If deemed necessary, a two-step test is used to identify the potential impairment and to measure the amount of goodwill impairment, if any. The first step is to compare the fair value of the reporting unit with its carrying amount, including goodwill. If the fair value of the reporting unit
34
exceeds its carrying amount, goodwill is considered not impaired; otherwise, there is an indication that goodwill may be impaired and the amount of the loss, if any, is measured by performing step two. Under step two, the impairment loss, if any, is measured by comparing the implied fair value of the reporting unit goodwill with the carrying amount of goodwill.
At December 31, 2015 and 2014, we tested our goodwill for impairment using a market based approach and no impairment was identified as the fair value of our sole reporting unit was substantially in excess of its carrying amount. To date, we have not recorded any goodwill impairment charges.
Measuring Recoverability of Long-Lived Assets
We perform an impairment review of long-lived assets held and used whenever events or changes in circumstances indicate that the carrying value may not be recoverable. Factors we consider important that could trigger an impairment review include, but are not limited to, significant under-performance relative to projected future operating results, significant changes in the manner of our use of the acquired assets or our overall business and/or product strategies and significant industry or economic trends. When we determine that the carrying value of a long-lived asset may not be recoverable based upon the existence of one or more of these indicators, we determine the recoverability by comparing the carrying amount of the asset to net future undiscounted cash flows that the asset is expected to generate or other indices of fair value. We would then recognize an impairment charge equal to the amount by which the carrying amount exceeds the fair market value of the asset.
Stock-based Compensation
Stock-based compensation consists of stock options and restricted stock units ("RSUs"), which are granted to employees and non-employees. We recognize compensation expense equal to the grant date fair value on a straight-line basis, net of estimated and actual forfeitures, over the employee requisite service period. We recognize stock-based compensation expense for performance-based RSUs when we believe that it is probable that the performance objectives will be met. The grant date fair value of our stock option awards is determined using the Black-Scholes option pricing model.
Income Taxes
Income taxes are provided based on the liability method, which results in income tax assets and liabilities arising from temporary differences. Temporary differences are differences between the tax basis of assets and liabilities and their reported amounts in the financial statements that will result in taxable or deductible amounts in future years. The liability method requires the effect of tax rate changes on current and accumulated deferred income taxes to be reflected in the period in which the rate change was enacted. The liability method also requires that deferred tax assets be reduced by a valuation allowance unless it is more likely than not that the assets will be realized.
We may recognize the tax benefit from uncertain tax positions only if it is at least more likely than not that the tax position will be sustained on examination by the taxing authorities, based on the technical merits of the position. The tax benefits recognized in the financial statements from such a position should be measured based on the largest benefit that has a greater than 50% likelihood of being realized upon settlement with the taxing authorities.
We establish valuation allowances when necessary to reduce deferred tax assets to the amounts expected to be realized. We evaluate the need for, and the adequacy of, valuation allowances based on the expected realization of our deferred tax assets. The factors used to assess the likelihood of realization include historical earnings, our latest forecast of taxable income and available tax planning strategies that could be implemented to realize the net deferred tax assets.
35
Our effective tax rates are primarily affected by changes in our valuation allowances, the amount of our taxable income or losses in the various taxing jurisdictions in which we operate, the amount of federal and state net operating losses and tax credits, the extent to which we can utilize these net operating loss carryforwards and tax credits and certain benefits related to stock option activity.
Recent Accounting Pronouncements
Information regarding recent accounting pronouncements is contained in Note 2 "Significant Accounting Policies" to the accompanying consolidated financial statements included in Part II, Item 8, which is incorporated herein by this reference.
Key Business Metrics
In addition to monitoring traditional financial measures, we also monitor our operating performance using key performance indicators. In 2014, we updated our presentation of revenue sources to differentiate our individual users based on the nature of the users—retail users who purchase Internet access at our managed and operated hotspots and select partner locations or military users who purchase Internet access or IPTV services for individual use on military bases. Accordingly, we have disaggregated our subscribers between our retail and military users. We have also removed monthly churn, which was defined as the number of subscribers who canceled their subscriptions in a given month, expressed as a percentage of the average subscribers in that month, as a key performance indicator as we no longer view monthly churn as a key business metric. Our key performance indicators follow:
| |
Year Ended December 31, | |||||||||
|---|---|---|---|---|---|---|---|---|---|---|
| |
2015 | 2014 | 2013 | |||||||
| |
(in thousands) |
|||||||||
Subscribers—retail |
204 | 254 | 308 | |||||||
Subscribers—military |
57 | 20 | 2 | |||||||
Connects |
105,335 | 81,413 | 50,830 | |||||||
DAS nodes |
10.9 | 8.4 | 6.3 | |||||||
Subscribers—retail and subscribers—military. This metric represents the number of paying customers who are on a month-to-month subscription plan at a given period end.
Connects. This metric shows how often individuals connect to our global Wi-Fi network in a given period. The connects include retail and wholesale customers in both customer pay locations and customer free locations where we are a paid service provider or receive sponsorship or promotion fees. We count each connect as a single connect regardless of how many times that individual accesses the network at a given venue during their 24 hour period. This measure is an indicator of paid activity throughout our network.
DAS nodes. This metric represents the number of active DAS nodes as of the end of the period. A DAS node is a single communications endpoint, typically an antenna, which transmits or receives radio frequency signals wirelessly. This measure is an indicator of the reach of our DAS network.
Key Components of our Results of Operations
Revenue
Our revenue consists of retail revenue, military revenue, DAS revenue, wholesale revenue, and advertising and other revenue. In 2014, we updated our presentation of revenue sources to provide increased visibility into the revenue streams that are the focus of our current and future operational and development efforts. Our retail revenue sources were previously differentiated based on our retail
36
plan types—subscription or single-use. We believe that it is more relevant to differentiate our individual users based on the nature of the users—retail users who purchase Internet access at our managed and operated hotspots and select partner locations or military users who purchase Internet access and/or IPTV services for individual use on military bases. We also previously combined our wholesale DAS and Wi-Fi revenues and we believe that it is better to disaggregate these wholesale product revenues going forward by DAS and Wi-Fi given the current development of these products.
Retail and military. We generate revenue from sales to retail and military individuals of month-to-month network access subscriptions that automatically renew, primarily through charge card transactions. We also generate revenue from sales of hourly, daily or other single-use access to retail and military individuals primarily through charge card transactions.
DAS. We generate revenue from telecom operator partners that pay us network build-out fees, inclusive of network upgrades, and access fees for our DAS networks.
Wholesale—Wi-Fi. We generate revenue from wholesale Wi-Fi partners that license our software and pay usage-based monthly network access fees to allow their customers to access our global Wi-Fi network. Usage-based network access fees may be measured in minutes, connects, megabytes or gigabytes, and in most cases are subject to minimum volume commitments. Other wholesale Wi-Fi partners pay us monthly fees to provide a Wi-Fi infrastructure that we install, manage and operate at their venues for their customers under a service provider arrangement.
Advertising and other. We generate revenue from advertisers that seek to reach visitors to our landing pages at our managed and operated network locations with online advertising, promotional and sponsored programs and at locations where we solely provide authorized access to a partner's Wi-Fi network through sponsored access and promotional programs. In addition, we receive revenue from partners in certain venues where we manage and operate the Wi-Fi network.
For the years ended December 31, 2015 and 2014, entities affiliated with AT&T Inc. accounted for 17% and 15%, respectively, of total revenue. For the year ended December 31, 2013, two groups of entities affiliated with Verizon Communications, Inc. and AT&T Inc. each accounted for 14% of total revenue. The loss of these groups and the customers could have a material adverse impact on our consolidated statements of operations.
Costs and Operating Expenses
We classify our costs and operating expenses as network access, network operations, development and technology, selling and marketing, general and administrative, and amortization of intangible assets. Network access costs consist primarily of payments to venues and network partners in our network. Other costs and operating expenses primarily consist of personnel costs, costs for contracted labor and development, marketing, legal, accounting and consulting services, and other professional service fees. Personnel costs include salaries, bonuses, stock-based compensation and employee benefits. Facilities costs are generally allocated based on headcount. Depreciation and amortization expenses associated with specifically identifiable property and equipment are allocated to the appropriate expense categories.
Network access. Network access costs consist of revenue share payments to venue owners where our managed and operated hotspots are located, usage-based fees to our roaming network partners for access to their networks, depreciation of equipment related to network build-out projects in our managed and operated locations, sale of equipment, and bandwidth and other Internet connectivity expenses in our managed and operated locations.
Network operations. Network operations expenses consist of costs for our customer service department and for our operations staff that designs, builds, monitors and maintains the network. Also
37
included are expenses for our customer service provider that handles customer care inquiries and expenses for network operations contractors, equipment depreciation and software and hardware maintenance fees.
Development and technology. Development and technology expenses consist of costs for our product development and engineering departments, developers and our information systems services staff, depreciation of our equipment and internal-use software, and software and hardware maintenance fees.
Selling and marketing. Selling and marketing expenses consist of costs for our business development and marketing employees and executives, travel and entertainment and marketing programs.
General and administrative. General and administrative expenses consist of costs for our executive, finance and accounting, legal and human resources personnel, as well as legal, accounting, tax and other professional service fees. Also included are other corporate expenses such as charge card processing fees and bad debt expense.
Amortization of intangible assets. Amortization of intangible assets consists primarily of acquired venue contracts, technology and non-compete agreements.
Interest and Other (Expense) Income, Net
Interest and other (expense) income, net, primarily consist of interest income and expense.
Income Tax Expense
In 2013, we established a full valuation allowance as a result of our assessment that it was more likely than not that certain federal and state deferred tax assets would not be realized and we have continued to maintain the full valuation allowance as of December 31, 2015 and 2014. In 2013, income tax expense included $2.4 million of tax expense related to increases in our valuation allowance. $1.9 million of the increase relates to additional valuation allowances that were established as a result of our assessment that it was more likely than not that certain federal and state deferred tax assets would not be realized.
Non-controlling Interests
Non-controlling interests are comprised of minority holdings by third parties in our subsidiaries Chicago Concourse Development Group, LLC ("CCDG") and Boingo Holding Participacoes Ltda. ("BHPL").
We are generally required to pay a portion of allocated net profits less capital expenditures of the preceding year to the non-controlling interest holders of CCDG. The limited liability company agreement for CCDG does not have a term. CCDG can be dissolved upon the unanimous agreement of the members, upon the sale of CCDG, upon declaration of bankruptcy, or upon the termination of the license agreement between CCDG and the City of Chicago.
We attributed profits and losses to the non-controlling interest in BHPL under the terms of the limited liability company agreement in proportion to their holdings. The limited liability company agreement with BHPL does not have a term. We, by resolution of the members, may distribute profits against retained earnings or profit reserves existing on the most recent annual balance sheet or may draw up financial statements and distribute profits in shorter periods. BHPL can be dissolved by resolution of the members and as otherwise provided for by law.
38
Prior to August 4, 2015, we also had a 70% ownership of Concourse Communications Detroit, LLC ("CCG Detroit"). On August 4, 2015, we purchased the remaining 30% ownership interest from the non-controlling interest owners for $1.2 million. We accounted for this transaction as an acquisition of the remaining interest of an entity that had already been majority-owned by the Company. The purchase resulted in a reduction to additional paid-in capital of $1.2 million representing excess purchase price over the carrying amount of the non-controlling interests. In prior years, we attributed profits and losses to the non-controlling interest in CCG Detroit under the terms of the limited liability company agreement. CCG Detroit had generated losses, which had reduced the non-controlling owners capital account to zero in 2009, resulting in an allocation to the controlling interest holder of all operating losses and deficits created by fixed distributions to the non-controlling interest holder. The fixed distributions were terminated during September 2013 concurrent with the termination of CCG Detroit's agreement with Detroit Metropolitan Wayne County Airport.
39
Results of Operations
The following tables set forth our results of operations for the specified periods.
| |
Year Ended December 31, | |||||||||
|---|---|---|---|---|---|---|---|---|---|---|
| |
2015 | 2014 | 2013 | |||||||
| |
(in thousands) |
|||||||||
Consolidated Statements of Operations Data: |
||||||||||
Revenue |
$ | 139,626 | $ | 119,297 | $ | 106,746 | ||||
Costs and operating expenses: |
||||||||||
Network access |
62,988 | 59,411 | 47,245 | |||||||
Network operations |
33,537 | 25,475 | 18,402 | |||||||
Development and technology |
19,147 | 14,879 | 11,432 | |||||||
Selling and marketing |
19,653 | 16,382 | 14,244 | |||||||
General and administrative |
22,356 | 17,460 | 15,067 | |||||||
Amortization of intangible assets |
3,576 | 3,716 | 2,250 | |||||||
| | | | | | | | | | | |
Total costs and operating expenses |
161,257 | 137,323 | 108,640 | |||||||
| | | | | | | | | | | |
Loss from operations |
(21,631 | ) | (18,026 | ) | (1,894 | ) | ||||
Interest and other (expense) income, net |
(66 | ) | (41 | ) | 37 | |||||
| | | | | | | | | | | |
Loss before income taxes |
(21,697 | ) | (18,067 | ) | (1,857 | ) | ||||
Income tax expense |
481 | 700 | 1,461 | |||||||
| | | | | | | | | | | |
Net loss |
(22,178 | ) | (18,767 | ) | (3,318 | ) | ||||
Net income attributable to non-controlling interests |
114 | 754 | 650 | |||||||
| | | | | | | | | | | |
Net loss attributable to common stockholders |
$ | (22,292 | ) | $ | (19,521 | ) | $ | (3,968 | ) | |
| | | | | | | | | | | |
| | | | | | | | | | | |
| | | | | | | | | | | |
Depreciation and amortization expense included in the above line items: |
||||||||||
Network access |
$ | 22,666 | $ | 18,074 | $ | 12,651 | ||||
Network operations |
9,058 | 5,662 | 4,091 | |||||||
Development and technology |
5,441 | 3,381 | 1,992 | |||||||
General and administrative |
1,128 | 329 | 206 | |||||||
| | | | | | | | | | | |
Total |
$ | 38,293 | $ | 27,446 | $ | 18,940 | ||||
| | | | | | | | | | | |
| | | | | | | | | | | |
| | | | | | | | | | | |
Stock-based compensation expense included in the above line items: |
||||||||||
Network operations |
$ | 1,504 | $ | 1,356 | $ | 888 | ||||
Development and technology |
731 | 600 | 380 | |||||||
Selling and marketing |
3,411 | 2,017 | 1,045 | |||||||
General and administrative |
3,752 | 3,191 | 2,193 | |||||||
| | | | | | | | | | | |
Total |
$ | 9,398 | $ | 7,164 | $ | 4,506 | ||||
| | | | | | | | | | | |
| | | | | | | | | | | |
| | | | | | | | | | | |
Depreciation and amortization expense
Depreciation expense increased $10.8 million, or 39.5%, in 2015, as compared to 2014, and depreciation expense increased $8.5 million, or 44.9%, in 2014, as compared to 2013, primarily due to increased depreciation and amortization expense from our increased fixed assets for our DAS build-out projects, Wi-Fi networks, and software development in those periods.
Stock-based compensation expense
Stock-based compensation expense increased $2.2 million, or 31.2%, in 2015, as compared to 2014, primarily due to additional stock-based compensation expenses for RSUs granted in those periods as
40
well as $1.0 million of additional stock-based compensation expense recognized in 2015 resulting from a change in the expected service period for one of our executives, who was terminated. Under the terms of the executive's employment agreement, the executive received 12 months of accelerated vesting credit on unvested stock-based awards. Stock-based compensation expense increased $2.7 million, or 59.0%, in 2014, as compared to 2013, primarily due to additional stock-based compensation expenses for RSUs granted in those periods. We have shifted our stock-based compensation from stock options to RSUs, which generally vest over a specified service period. We also issue performance-based RSUs to executive personnel. We recognize stock-based compensation expense for performance-based RSUs when we believe that it is probable that the performance objectives will be met.
The following table sets forth our results of operations for the specified periods as a percentage of our revenue for those periods.
| |
Year Ended December 31, | |||||||||
|---|---|---|---|---|---|---|---|---|---|---|
| |
2015 | 2014 | 2013 | |||||||
| |
(as a percentage of revenue) |
|||||||||
Consolidated Statements of Operations Data: |
||||||||||
Revenue |
100.0 | % | 100.0 | % | 100.0 | % | ||||
Costs and operating expenses: |
||||||||||
Network access |
45.1 | 49.8 | 44.3 | |||||||
Network operations |
24.0 | 21.4 | 17.2 | |||||||
Development and technology |
13.7 | 12.5 | 10.7 | |||||||
Selling and marketing |
14.1 | 13.7 | 13.3 | |||||||
General and administrative |
16.0 | 14.6 | 14.1 | |||||||
Amortization of intangible assets |
2.6 | 3.1 | 2.1 | |||||||
| | | | | | | | | | | |
Total costs and operating expenses |
115.5 | 115.1 | 101.8 | |||||||
| | | | | | | | | | | |
Loss from operations |
(15.5 | ) | (15.1 | ) | (1.8 | ) | ||||
Interest and other (expense) income, net |
0.0 | 0.0 | 0.0 | |||||||
| | | | | | | | | | | |
Loss before income taxes |
(15.5 | ) | (15.1 | ) | (1.7 | ) | ||||
Income tax expense |
0.3 | 0.6 | 1.4 | |||||||
| | | | | | | | | | | |
Net loss |
(15.9 | ) | (15.7 | ) | (3.1 | ) | ||||
Net income attributable to non-controlling interests |
0.1 | 0.6 | 0.6 | |||||||
| | | | | | | | | | | |
Net loss attributable to common stockholders |
(16.0 | )% | (16.4 | )% | (3.7 | )% | ||||
| | | | | | | | | | | |
| | | | | | | | | | | |
| | | | | | | | | | | |
41
Years ended December 31, 2015 and 2014
Revenue
| |
Year Ended December 31, | ||||||||||||
|---|---|---|---|---|---|---|---|---|---|---|---|---|---|
| |
2015 | 2014 | Change | % Change | |||||||||
| |
(in thousands, except percentages) |
||||||||||||
Revenue: |
|||||||||||||
DAS |
$ | 46,455 | $ | 38,259 | $ | 8,196 | 21.4 | ||||||
Retail |
31,763 | 40,336 | (8,573 | ) | (21.3 | ) | |||||||
Wholesale—Wi-Fi |
21,923 | 15,209 | 6,714 | 44.1 | |||||||||
Military |
19,898 | 4,486 | 15,412 | 343.6 | |||||||||
Advertising and other |
19,587 | 21,007 | (1,420 | ) | (6.8 | ) | |||||||
| | | | | | | | | | | | | | |
Total revenue |
$ | 139,626 | $ | 119,297 | $ | 20,329 | 17.0 | ||||||
| | | | | | | | | | | | | | |
| | | | | | | | | | | | | | |
| | | | | | | | | | | | | | |
Key business metrics: |
|||||||||||||
Subscribers—retail |
204 | 254 | (50 | ) | (19.7 | ) | |||||||
Subscribers—military |
57 | 20 | 37 | 185.0 | |||||||||
Connects |
105,335 | 81,413 | 23,922 | 29.4 | |||||||||
DAS nodes |
10.9 | 8.4 | 2.5 | 29.8 | |||||||||
DAS. DAS revenue increased $8.2 million, or 21.4%, in 2015, as compared to 2014, due to a $6.1 million increase from new build-out projects in our managed and operated locations, which includes a $1.0 million short-term build-out project that included the sale of equipment that was completed during 2015, and a $2.1 million increase in access fees from our telecom operators. The increase in access fees resulted primarily from the new build-out projects that were completed and $0.4 million of one-time fees that were paid for early termination rights.
Retail. Retail revenue decreased $8.6 million, or 21.3%, in 2015, as compared to 2014, primarily due to a $6.7 million decrease in retail subscriber revenue, which was driven primarily by the decrease in retail subscribers in 2015 compared to 2014. The remaining decrease was due to a $1.9 million decrease in retail single-use revenue.
Wholesale—Wi-Fi. Wholesale Wi-Fi revenue increased $6.7 million, or 44.1%, in 2015, as compared to 2014, primarily due to a $7.4 million increase in partner usage based fees, which was partially offset by a $0.7 million decrease in Wi-Fi build-out revenues related to a project that was completed in 2014.
Military. Military revenue increased $15.4 million, or 343.6%, in 2015, as compared to 2014 primarily due to the increase in subscribers resulting from our build-out of Wi-Fi networks at military bases.
Advertising and other. Advertising and other revenue decreased $1.4 million, or 6.8%, in 2015, as compared to 2014, primarily due to a $1.9 million decrease in advertising sales at our managed and operated locations, which was partially offset by a $0.5 million increase in revenues from other service agreements.
42
Costs and Operating Expenses
| |
Year Ended December 31, | ||||||||||||
|---|---|---|---|---|---|---|---|---|---|---|---|---|---|
| |
2015 | 2014 | Change | % Change | |||||||||
| |
(in thousands, except percentages) |
||||||||||||
Costs and operating expenses: |
|||||||||||||
Network access |
$ | 62,988 | $ | 59,411 | $ | 3,577 | 6.0 | ||||||
Network operations |
33,537 | 25,475 | 8,062 | 31.6 | |||||||||
Development and technology |
19,147 | 14,879 | 4,268 | 28.7 | |||||||||
Selling and marketing |
19,653 | 16,382 | 3,271 | 20.0 | |||||||||
General and administrative |
22,356 | 17,460 | 4,896 | 28.0 | |||||||||
Amortization of intangible assets |
3,576 | 3,716 | (140 | ) | (3.8 | ) | |||||||
| | | | | | | | | | | | | | |
Total costs and operating expenses |
$ | 161,257 | $ | 137,323 | $ | 23,934 | 17.4 | ||||||
| | | | | | | | | | | | | | |
| | | | | | | | | | | | | | |
| | | | | | | | | | | | | | |
Network access. Network access costs increased $3.6 million, or 6.0%, in 2015, as compared to 2014. The increase is primarily due to a $4.6 million increase in depreciation expense and a $3.6 million increase in bandwidth and other direct costs, which is inclusive of a $0.6 million increase in costs directly related to our short-term DAS and Wi-Fi build-out projects. The increases were partially offset by a $4.3 million decrease in revenue share paid to venues in our managed and operated locations, which included a one-time $1.9 million cost incurred in 2014 to terminate one of our venue contracts, and a $0.3 million decrease from customer usage at partner venues.
Network operations. Network operations expenses increased $8.1 million, or 31.6%, in 2015, as compared to 2014, due to a $3.4 million increase in depreciation expense, a $1.9 million increase in personnel related expenses primarily resulting from increased headcount, a $1.0 million increase in network maintenance and connectivity expenses, a $0.4 million increase in call center costs, a $0.3 million increase in hardware and software maintenance expenses, and a $1.1 million increase in other operating expenses.
Development and technology. Development and technology expenses increased $4.3 million, or 28.7%, in 2015, as compared to 2014, due primarily to a $2.1 million increase in depreciation expense, a $1.6 million increase in personnel related expenses primarily resulting from increased headcount, a $0.4 million increase in technology service expenses, and a $0.2 million increase in hardware and software maintenance and other operating expenses.
Selling and marketing. Selling and marketing expenses increased $3.3 million, or 20.0%, in 2015, as compared to 2014, due to a $1.2 million increase in personnel related expenses primarily resulting from increased headcount, $1.4 million one-time charge for salaries, benefits and stock-based compensation expense for one of our executives who was terminated, and a $0.7 million increase in other marketing related expenses.
General and administrative. General and administrative expenses increased $4.9 million, or 28.0%, in 2015, as compared to 2014, due to a $1.7 million increase in personnel related expenses resulting from increased headcount, a $0.8 million increase in depreciation expenses, a $0.5 million increase in business licenses, taxes, and insurance, a $0.5 million increase in consulting expenses, and a $1.4 million increase in rent and other general and administrative expenses.
Amortization of intangible assets. Amortization of intangible assets expense remained relatively consistent in 2015, as compared to 2014.
43
Interest and Other (Expense) Income, Net
Interest and other (expense) income, net, remained relatively consistent in 2015, as compared to 2014. In 2015, we incurred and capitalized $0.6 million of interest expense related to our Credit Facility.
Income Tax Expense
We had income tax expense of $0.5 million in 2015, as compared to $0.7 million in 2014. Our effective tax rate decreased to 2.2% for 2015, as compared to 3.9% in 2014.
Our future effective tax rate depends on various factors, such as our level of future taxable income, tax legislation and credits and the geographic compositions of our pre-tax income. We do not expect to incur any significant income taxes until such time that we reverse our valuation allowance against our federal and state deferred tax assets upon return to sustained profitability.
Non-controlling Interests
Non-controlling interests decreased $0.6 million in 2015, as compared to 2014 primarily as a result of decreased net income for a subsidiary resulting from the transition of the managed and operated venues of this subsidiary from an end-user paid to a tiered pricing model.
Net Loss Attributable to Common Stockholders
Our net loss for 2015 increased as compared to 2014 primarily as a result of the $23.9 million increase in costs and operating expenses, which was partially offset by the $20.3 million increase in revenues, the $0.6 million decrease in net income attributable to non-controlling interests, and the $0.2 million decrease in income tax expense. Our diluted net loss per share increased primarily as a result of the increase in our net loss.
Adjusted EBITDA
Adjusted EBITDA was $29.6 million in 2015, an increase of 46.0% from $20.3 million recorded in 2014. As a percentage of revenue, Adjusted EBITDA was 21.2% in 2015, up from 17.0% of revenue in 2014. The Adjusted EBITDA increase was due primarily to $10.7 million increase in depreciation and amortization expense and $2.2 million increase in stock-based compensation expense. The increases were partially offset by the $2.8 million increase in our net loss attributable to common stockholders, the $0.6 million decrease in non-controlling interests, and the $0.2 million decrease in income tax expense in 2015, as compared to 2014. We define Adjusted EBITDA as net (loss) income attributable to common stockholders plus depreciation and amortization of property and equipment, income tax expense, amortization of intangible assets, stock-based compensation expense, non-controlling interests and interest and other expense (income), net. For a discussion of Adjusted EBITDA and a reconciliation of net (loss) income attributable to common stockholders to Adjusted EBITDA, see footnote 1 to "Selected Financial Data" in Part II, Item 6.
44
Years ended December 31, 2014 and 2013
Revenue
| |
Year Ended December 31, | ||||||||||||
|---|---|---|---|---|---|---|---|---|---|---|---|---|---|
| |
2014 | 2013 | Change | % Change | |||||||||
| |
(in thousands, except percentages) |
||||||||||||
Revenue: |
|||||||||||||
Retail |
$ | 40,336 | $ | 43,194 | $ | (2,858 | ) | (6.6 | ) | ||||
DAS |
38,259 | 32,681 | 5,578 | 17.1 | |||||||||
Wholesale—Wi-Fi |
15,209 | 17,261 | (2,052 | ) | (11.9 | ) | |||||||
Military |
4,486 | 1,260 | 3,226 | 256.0 | |||||||||
Advertising and other |
21,007 | 12,350 | 8,657 | 70.1 | |||||||||
| | | | | | | | | | | | | | |
Total revenue |
$ | 119,297 | $ | 106,746 | $ | 12,551 | 11.8 | ||||||
| | | | | | | | | | | | | | |
| | | | | | | | | | | | | | |
| | | | | | | | | | | | | | |
Key business metrics: |
|||||||||||||
Subscribers—retail |
254 | 308 | (54 | ) | (17.5 | ) | |||||||
Subscribers—military |
20 | 2 | 18 | * | |||||||||
Connects |
81,413 | 50,830 | 30,583 | 60.2 | |||||||||
DAS nodes |
8.4 | 6.3 | 2.1 | 33.3 | |||||||||
- *
- Calculation of percentage change is not meaningful.
Retail. Retail revenue decreased $2.9 million, or 6.6%, in 2014, as compared to 2013, primarily due to a $2.3 million decrease in retail subscriber revenue, which was driven primarily by the decrease in retail subscribers. Our average revenue per retail subscriber remained essentially the same in 2014 as compared to 2013. The remaining decrease was attributable to a $0.6 million decrease in retail single-use revenue resulting from the transition of certain paid managed and operated locations to a tiered or free pricing model. Retail revenue for 2014 and 2013 includes $2.3 million and $0.4 million, respectively, of retail single-use revenue related to venues acquired from AWG in October 2013.
DAS. DAS revenue increased $5.6 million, or 17.1%, in 2014, as compared to 2013, due to a $3.3 million increase from new build-out projects in our managed and operated locations and a $2.3 million increase in access fees from our telecom operators resulting primarily from the new build-out projects that were completed.
Wholesale—Wi-Fi. Wholesale Wi-Fi revenue decreased $2.1 million, or 11.9%, in 2014, as compared to 2013, due to a $3.5 million decrease in partner usage based fees, which was partially offset by a $0.6 million increase in wholesale service provider revenues resulting from increased deployments and $0.7 million in revenue from a Wi-Fi build-out project that was completed in 2014.
Military. Military revenue increased $3.2 million, or 256.0%, in 2014, as compared to 2013 due to deployments of our Wi-Fi and IPTV networks at military bases during 2014.
Advertising and other. Advertising and other revenue increased $8.7 million, or 70.1%, in 2014, as compared to 2013, primarily due to a $9.3 million increase in the volume of advertising sales at our managed and operated locations. The increase was partially offset by a $0.6 million decrease in other revenues. Advertising revenue for 2014 and 2013 includes $8.2 million and $1.1 million, respectively, of advertising sales at the venues acquired from AWG in October 2013.
45
Costs and Operating Expenses
| |
Year Ended December 31, | ||||||||||||
|---|---|---|---|---|---|---|---|---|---|---|---|---|---|
| |
2014 | 2013 | Change | % Change | |||||||||
| |
(in thousands, except percentages) |
||||||||||||
Costs and operating expenses: |
|||||||||||||
Network access |
$ | 59,411 | $ | 47,245 | $ | 12,166 | 25.8 | ||||||
Network operations |
25,475 | 18,402 | 7,073 | 38.4 | |||||||||
Development and technology |
14,879 | 11,432 | 3,447 | 30.2 | |||||||||
Selling and marketing |
16,382 | 14,244 | 2,138 | 15.0 | |||||||||
General and administrative |
17,460 | 15,067 | 2,393 | 15.9 | |||||||||
Amortization of intangible assets |
3,716 | 2,250 | 1,466 | 65.2 | |||||||||
| | | | | | | | | | | | | | |
Total costs and operating expenses |
$ | 137,323 | $ | 108,640 | $ | 28,683 | 26.4 | ||||||
| | | | | | | | | | | | | | |
| | | | | | | | | | | | | | |
| | | | | | | | | | | | | | |
Network access. Network access costs increased $12.2 million, or 25.8%, in 2014, as compared to 2013. The increase is primarily attributed to a $9.2 million increase in revenue share paid to venues in our managed and operated locations, which includes a one-time $1.9 million cost to terminate one of our venue contracts, a $5.4 million increase in depreciation expense, and a $3.2 million increase in internet connectivity expenses. The increases were partially offset by a $3.1 million decrease from customer usage at partner venues and a $2.5 million decrease in other direct costs. Other direct costs for 2014 include $0.4 million of costs related to a Wi-Fi build out project.
Network operations. Network operations expenses increased $7.1 million, or 38.4%, in 2014, as compared to 2013, primarily due to a $3.9 million increase in personnel related expenses, inclusive of a $0.5 million increase in stock-based compensation expenses, primarily resulting from increased headcount, a $1.6 million increase in depreciation expense, a $0.6 million increase in network maintenance expenses, a $0.3 million increase in travel and entertainment expenses, a $0.3 million increase in hardware and software maintenance expenses, a $0.3 million increase in call center expenses, and a $0.1 million increase in rent and other expenses.
Development and technology. Development and technology expenses increased $3.4 million, or 30.2%, in 2014, as compared to 2013, primarily due to a $1.4 million increase in depreciation expense, a $0.7 million increase in hardware and software maintenance expenses, a $0.4 million impairment loss related to a change in the use of certain software developed for internal use, a $0.4 million increase in technology service expenses, and a $0.5 million increase in other operating expenses.
Selling and marketing. Selling and marketing expenses increased $2.1 million, or 15.0%, in 2014, as compared to 2013, primarily due to a $3.1 million increase in personnel related expenses, inclusive of a $1.0 million increase in stock-based compensation expenses, primarily resulting from increased headcount and higher sales commissions related to our increased advertising sales. The increase was partially offset by a $1.0 million decrease in marketing related expenses.
General and administrative. General and administrative expenses increased $2.4 million, or 15.9%, in 2014, as compared to 2013, due to a $1.8 million increase in personnel related expenses, inclusive of a $1.0 million increase in stock- based compensation expenses, a $0.3 million increase in consulting expenses, and a $0.3 million increase in rent and facilities expenses. General and administrative expenses includes a $0.5 million impairment loss related to a venue termination agreement that resulted in the abandonment of our Wi-Fi network assets and the release of the corresponding capital lease obligations associated with those assets. General and administrative expenses also includes a $0.8 million decrease in the fair value of our contingent consideration liabilities related to our acquisition of Endeka Group, Inc. ("Endeka") in February 2013.
46
Amortization of intangible assets. Amortization of intangible assets expense increased $1.5 million, or 65.2%, in 2014, as compared to 2013, due primarily to our acquisitions of Endeka and AWG in February 2013 and October 2013, respectively. For future years, amortization expense is expected to be $3.5 million for 2015, $3.5 million for 2016, $3.2 million for 2017, $2.4 million for 2018, $1.6 million for 2019 and $5.5 million thereafter.
Interest and Other (Expense) Income, Net
Interest and other (expense) income, net, decreased $0.1 million in 2014, as compared to 2013, primarily due to our lower cash and cash equivalents and marketable securities balances during 2014 as compared to 2013 and interest expense related to our new Credit Agreement, which we entered into on November 21, 2014.
Income Tax Expense
Income tax expense decreased $0.8 million, or 52.1%, in 2014, as compared to 2013. Our effective tax rate decreased to 3.9% for 2014 compared to 78.7% for 2013 due primarily to the valuation allowance we established at year end in 2013.
Non-controlling Interests
Non-controlling interests remained essentially unchanged in 2014, as compared to 2013.
Net Loss Attributable to Common Stockholders
Our net loss for 2014 increased as compared to 2013 primarily as a result of the $28.7 million increase in costs and operating expenses, which was partially offset by the $12.6 million increase in revenues and the $0.8 million decrease in income tax expense. Our diluted net loss per share increased primarily as a result of the increase in our net loss.
Adjusted EBITDA
Adjusted EBITDA was $20.3 million in 2014, a decrease of 14.7% from $23.8 million recorded in 2013. As a percentage of revenue, Adjusted EBITDA was 17.0% in 2014, down from 22.3% of revenue in 2013. The Adjusted EBITDA decrease was due primarily to the $15.6 million increase in our net loss attributable to common stockholders and the $0.8 million decrease in income tax expenses. The changes were offset by a $10.0 million increase in depreciation and amortization expense and a $2.7 million increase in stock-based compensation expense. We define Adjusted EBITDA as net (loss) income attributable to common stockholders plus depreciation and amortization of property and equipment, income tax expense, amortization of intangible assets, stock-based compensation expense, non-controlling interests and interest and other expense (income), net. For a discussion of Adjusted EBITDA and a reconciliation of net (loss) income attributable to common stockholders to Adjusted EBITDA, see footnote 1 to "Selected Financial Data" in Part II, Item 6.
Liquidity and Capital Resources
We have financed our operations primarily through cash provided by operating activities and borrowings under our credit facility. Our primary sources of liquidity as of December 31, 2015 consisted of $14.7 million of cash and cash equivalents and $31.5 million available for borrowing under our credit facility, $3.6 million of which is reserved for our outstanding Letter of Credit Authorization agreements.
Our principal uses of liquidity have been to fund our operations, working capital requirements, capital expenditures and acquisitions. We expect that these requirements will be our principal needs for
47
liquidity over the near term. Our capital expenditures in 2015 were $103.1 million, of which $57.8 million was reimbursed through revenue for DAS build-out projects from our telecom operators.
On November 21, 2014, we entered into a Credit Agreement (the "Credit Agreement") and related agreements with Bank of America, N.A. acting as agent for lenders named therein, including Bank of America, N.A. and Silicon Valley Bank (the "Lenders"), for a secured credit facility in the form of a revolving line of credit in the initial amount of up to $46.5 million, with an option to increase the available amount to $86.5 million upon the satisfaction of certain conditions (the "Revolving Line of Credit") and a term loan of $3.5 million (the "Term Loan" and together with the Revolving Line of Credit, the "Credit Facility"). Both the Term Loan and Revolving Line of Credit mature on November 21, 2018. Amounts borrowed under the Revolving Line of Credit and Term Loan will bear, at our election, a variable interest at LIBOR plus 2.5% - 3.5% or Lender's Prime Rate plus 1.5% - 2.5% per year and we will pay a fee of 0.375% - 0.5% per year on any unused portion of the Revolving Line of Credit. As of December 31, 2015, $2.6 million was outstanding under the Term Loan at a rate of 3.3% and $15.0 million was outstanding under the Revolving Line of Credit. The Term Loan requires quarterly payments of interest and principal, amortizing fully over the four-year-term such that it is repaid in full on the maturity date of November 21, 2018. For the year ended December 31, 2015, interest rates for our Credit Facility ranged from 2.67% to 3.33%. Repayment of amounts borrowed under the Credit Facility may be accelerated in the event that we are in violation of the representation, warranties and covenants made in the Credit Agreement, including certain financial covenants set forth therein, and under other specific default events including, but not limited to, non-payment or inability to pay debt, breach of cross default provisions, insolvency provisions, and change in control.
We are subject to customary covenants, including a minimum quarterly consolidated leverage ratio, a maximum quarterly consolidated fixed charge coverage ratio, and monthly liquidity minimums. We were in compliance with all such financial covenants as of December 31, 2015 and through the date of this report. We are subject to certain non-financial covenants, and we were also in compliance with all such non-financial covenants as of December 31, 2015 and through the date of this report. The Credit Facility provides us with significant additional flexibility and liquidity to pursue our strategic objectives for capital expenditures and acquisitions.
On September 11, 2015, we filed a shelf registration statement (the "Shelf Registration") on Form S-3 with the SEC that was declared effective by the SEC on September 17, 2015, which permits us to offer up to $125.0 million of common stock, preferred stock, debt securities and warrants in one or more offerings and in any combination, including in units from time to time. In February 2016, we filed a post-effective amendment to terminate the Shelf Registration and remove from registration the securities registered pursuant to the Shelf Registration. The Company's Board of Directors determined that having the Shelf Registration on file was no longer necessary due to the Company increasing the Revolving Line of Credit (see Note 19 to the accompanying consolidated financial statements included in Part II, Item 8 hereto).
We believe that our existing cash and cash equivalents, working capital, cash flow from operations and availability under the Credit Facility will be sufficient to fund our operations and planned capital expenditures for at least the next 12 months. There can be no assurance, however, that future industry-specific or other developments, general economic trends, or other matters will not adversely affect our operations or our ability to meet our future cash requirements. Our future capital requirements will depend on many factors including our rate of revenue growth, the timing and size of our managed and operated location expansion efforts, the timing and extent of spending to support product development efforts, the timing of introductions of new solutions and enhancements to existing solutions and the continuing market acceptance of our solutions. We expect our capital expenditures in 2016 will range from $35.0 million to $40.0 million, excluding capital expenditures for DAS build-out projects, which are reimbursed through revenue from our telecom operator customers. The majority of our 2016
48
capital expenditures will be used to build out residential broadband and IPTV networks for troops stationed on military bases pursuant to our contracts with the U.S. government and upgrading our Wi-Fi networks at our managed and operated venues. The investment of these resources will occur in advance of experiencing any direct benefit from them including generation of revenues. The U.S. government may modify, curtail or terminate its contracts with us, either at its convenience or for default based on performance. Any such modification, curtailment, or termination of one or more of our government contracts could have a material adverse effect on our earnings, cash flow and/or financial position. We may also enter into acquisitions of complementary businesses, applications or technologies, which could require us to seek additional equity or debt financing. Additional funds may not be available on terms favorable to us, or at all.
The following table sets forth cash flow data for the periods indicated therein:
| |
Year Ended December 31, | |||||||||
|---|---|---|---|---|---|---|---|---|---|---|
| |
2015 | 2014 | 2013 | |||||||
| |
(in thousands) |
|||||||||
Net cash provided by operating activities |
$ | 98,575 | $ | 21,207 | $ | 20,671 | ||||
Net cash used in investing activities |
(101,502 | ) | (39,199 | ) | (40,403 | ) | ||||
Net cash provided by (used in) financing activities |
8,843 | (480 | ) | (11,068 | ) | |||||
Net Cash Provided by Operating Activities
In 2015, we generated $98.6 million of net cash from operating activities, an increase of $77.4 million from 2014. The increase is primarily due to a $68.1 million change in our operating assets and liabilities, a $10.7 million increase in depreciation and amortization expenses, a $2.2 million increase in stock-based compensation expenses, and a $0.7 million change in fair value of our contingent consideration liabilities. The increases were partially offset by the $3.4 million increase in our net loss and the $0.7 million decrease in impairment losses.
In 2014, we generated $21.2 million of net cash from operating activities, an increase of $0.5 million from 2013. The increase was primarily due to a $16.6 million increase in accrued expenses and other liabilities and deferred revenue in 2014 compared to a $1.9 million decrease in 2013, a $10.0 million increase in depreciation and amortization expenses in 2014, a $2.7 million increase in stock-based compensation expenses in 2014, and a $1.0 million impairment loss in 2014. The increases were partially offset by a $15.4 million increase in our net loss including non-controlling interests from the prior year, a $9.0 million larger increase in accounts receivable in 2014 compared to 2013, a $1.9 million increase in prepaid expenses and other assets in 2014 compared to a $1.6 million decrease in 2013, a $2.0 million larger decrease in accounts payable in 2014 compared to 2013, a $1.1 million decrease in the change in deferred tax assets, and a $0.4 million increase in the change in fair value of contingent consideration.
In 2013, we generated $20.7 million of net cash from operating activities, a decrease of $3.9 million from 2012. The decrease was primarily due to an $11.0 million decrease in our net income including non-controlling interests from the prior year and a $1.9 million decrease in excess windfall tax benefits from stock option exercises. The decreases were partially offset by a $4.1 million increase in depreciation and amortization expenses in 2013, a $1.6 million decrease in prepaids and other assets in 2013 compared to a $0.3 million increase in prepaids and other assets in 2012, a $1.8 million increase in stock-based compensation expenses in 2013, and a $1.2 million smaller decrease in accrued expenses and other liabilities in 2013 compared to 2012.
49
Net Cash Used in Investing Activities
In 2015, we used $101.5 million in investing activities, an increase of $62.3 million from 2014. This increase is primarily due to a $32.2 million increase in purchases of property and equipment and a $29.7 million decrease in cash provided by net proceeds from sales of marketable securities.
In 2014, we used $39.2 million in investing activities, a decrease of $1.2 million from 2013. The decrease was primarily due to a $22.8 million increase in cash received from net sales of marketable securities in 2014 compared to 2013, a $19.3 million decrease in cash used in acquisitions in 2014 compared to 2013, and a $0.5 million decrease in restricted cash. The decreases were partially offset by a $41.4 million increase in purchases of property and equipment in 2014 compared to 2013.
In 2013, we used $40.4 million in investing activities, a decrease of $22.1 million from 2012. The decrease was primarily due to $8.6 million of cash received from net sales of marketable securities in 2013 compared to $41.6 million of cash used in net purchases of marketable securities in 2012. The decrease was offset by an $11.5 million increase in purchases of property and equipment in 2013 compared to 2012 and $19.5 million in net cash payments made for our acquisitions of Endeka and AWG in 2013 compared to the $3.2 million of cash payments made for our acquisition of Cloud 9 in 2012.
Net Cash Provided by Financing Activities
In 2015, we received $8.8 million of cash provided by financing activities compared to $0.5 million in cash used in financing activities in 2014. This change is primarily due to the $11.5 million increase in net proceeds from our Credit Facility, a $1.2 million decrease in acquisition related payments, a $0.6 million decrease in deferred financing costs, and a $0.2 million increase in proceeds from exercise of stock options. These changes were partially offset by $1.6 million of holdback consideration payments made to the previous AWG shareholders, $1.1 million in payments to acquire the remaining non-controlling interests in Concourse Communications Detroit, LLC from the non-controlling interest owners, a $0.6 million increase in cash used to pay federal, state, and local employment payroll taxes related to our RSUs that vested during the period, and $0.9 million in repayments made on our Term Loan during 2015.
In 2014, we used $0.5 million in financing activities, a decrease of $10.6 million from 2013. The decrease was primarily due to $10.9 million of cash used to repay notes payable and other financed liabilities that were assumed in our acquisition of Endeka and cash used to repurchase shares of our common stock in the open market in 2013 that did not recur in 2014, $2.8 million of proceeds received from our Credit Facility, net of deferred financing costs that were paid, and a $0.5 million increase in proceeds from the exercise of stock options in 2014 compared to 2013. The decreases were partially offset by a $1.9 million increase in cash used to pay minimum statutory taxes related to our time-based RSUs that vested during 2014, $1.3 million of cash used to pay continent liabilities and other acquisition related consideration during 2014, and a $0.4 million increase in cash paid for capital leases and notes payable.
In 2013, we used $11.1 million in financing activities compared to cash provided by financing activities of $2.1 million in 2012. The change was primarily due to $6.1 million of cash used to repay notes payable and other financed liabilities that were assumed in our acquisition of Endeka in 2013, the $4.8 million of cash used to repurchase and retire approximately 722,000 shares of our common stock in the open market under our stock repurchase program at an average price per share of $6.68 in 2013, and a $2.0 million decrease in proceeds from the exercise of stock options in 2013 compared to 2012.
50
Contractual Obligations and Commitments
The following table sets forth our contractual obligations and commitments as of December 31, 2015:
| |
Payments Due By Period | |||||||||||||||
|---|---|---|---|---|---|---|---|---|---|---|---|---|---|---|---|---|
| |
Total | Less than 1 Year |
2 - 3 Years | 4 - 5 Years | More than 5 Years |
|||||||||||
| |
(in thousands) |
|||||||||||||||
Venue revenue share minimums(1) |
$ | 43,148 | $ | 9,297 | $ | 13,921 | $ | 8,108 | $ | 11,822 | ||||||
Operating leases for office space(2) |
32,397 | 2,239 | 6,077 | 6,126 | 17,955 | |||||||||||
Open purchase commitments(3) |
12,338 | 12,338 | — | — | — | |||||||||||
Credit Facility(4) |
17,625 | 875 | 16,750 | — | — | |||||||||||
Capital leases for equipment and software(5) |
3,850 | 1,610 | 2,240 | — | — | |||||||||||
Unrecognized tax benefits(6) |
229 | 229 | — | — | — | |||||||||||
Notes payable(7) |
150 | 96 | 54 | — | — | |||||||||||
| | | | | | | | | | | | | | | | | |
Total |
$ | 109,737 | $ | 26,684 | $ | 39,042 | $ | 14,234 | $ | 29,777 | ||||||
| | | | | | | | | | | | | | | | | |
| | | | | | | | | | | | | | | | | |
| | | | | | | | | | | | | | | | | |
- (1)
- Payments
under exclusive long-term, non-cancellable contracts to provide wireless communications network access to venues such as airports. Expense is
recorded on a straight-line basis over the term of the lease.
- (2)
- Office
space under non-cancellable operating leases.
- (3)
- Open
purchase commitments are for the purchase of property and equipment, supplies and services. They are not recorded as liabilities on our consolidated
balance sheet as of December 31, 2015 as we have not received the related goods or services.
- (4)
- Long-term
debt associated with our Credit Agreement with Bank of America N.A. Payments are based on contractual terms and intended timing of repayments of
long-term debt.
- (5)
- Leased
equipment, primarily for data communication and database software, under non-cancellable capital leases.
- (6)
- The
unrecognized tax benefits are related to uncertain tax positions taken in our income tax return that would impact the effective tax rate or additional
paid-in capital, if recognized (refer to Note 12 to the accompanying consolidated financial statements included in Part II, Item 8).
- (7)
- Notes payable assumed in our acquisition of Endeka in 2013.
Off-Balance Sheet Arrangements
We do not have any off-balance sheet financing arrangements and we do not have any relationships with unconsolidated entities or financial partnerships, such as entities often referred to as structured finance or special purpose entities, which have been established for the purpose of facilitating off- balance sheet arrangements or other contractually narrow or limited purposes.
Transactions with Related Parties
Under our Audit Committee charter, our Audit Committee is responsible for reviewing and approving all related party transactions on a quarterly basis. In addition, our Board of Directors determines annually whether any related party relationships exist among the directors which would interfere with the judgment of individual directors in carrying out his responsibilities as director.
51
Inflation
Inflationary factors have not had a significant effect on our performance over the past several years. A significant increase in inflation may affect our future performance since we may not be able to recover the increases in our costs with similar increases in our prices.
Item 7A. Quantitative and Qualitative Disclosures About Market Risk
We are exposed to various market risks including: (i) interest rate risk and (ii) currency exchange rate risk. The risk of loss is assessed based on the likelihood of adverse changes in fair values, cash flows or future earnings.
Interest rate risk. Our Revolving Line of Credit and Term Loan bears, at the Company's election, interest at a variable interest rate of LIBOR plus 2.5% - 3.5% or Lender's Prime Rate plus 1.5% - 2.5% per year. The interest rate on the Term Loan resets at the end of each three month period. Our use of variable rate debt exposes us to interest rate risk. A 100 basis point increase in the LIBOR or Lender's Prime Rate as of December 31, 2015 would not have a material impact on net loss and cash flow.
Foreign currency exchange rate risk. We are exposed to foreign currency exchange rate risk inherent in conducting business globally in numerous currencies, of which the most significant to our operations for the year ended December 31, 2015 was the Brazilian Real. We are primarily exposed to foreign currency fluctuations related to the operations of our subsidiary in Brazil whose financial statements are not denominated in the U.S. Dollar. Our foreign operations are not material to our operations as a whole. As such, we currently do not enter into currency forward exchange or option contracts to hedge foreign currency exposures.
Item 8. Financial Statements and Supplementary Data
The information required by this Item is included in Part IV, Items 15(a)(1) and (2) of this Annual Report on Form 10-K.
Item 9. Changes in and Disagreements with Accountants on Accounting and Financial Disclosure
None.
Item 9A. Controls and Procedures
Disclosure Controls and Procedures
The Company maintains a system of disclosure controls and procedures that are designed to provide reasonable assurance that information required to be disclosed in the reports that the Company files or submits under the Securities Exchange Act of 1934, as amended, or the Exchange Act, is processed, recorded, summarized and reported within the time periods specified in the Securities and Exchange Commission's rules and forms. These disclosure controls and procedures include, among other processes, controls and procedures designed to ensure that information required to be disclosed in the reports that the Company files or submits under the Exchange Act is accumulated and communicated to management, including our Chief Executive Officer and Chief Financial Officer (our principal executive officer and principal financial officer, respectively), as appropriate, to allow for timely decisions regarding required disclosure.
The Company carried out an evaluation, under the supervision and with the participation of management, including our Chief Executive Officer and Chief Financial Officer, of the effectiveness of the design and operation of our disclosure controls and procedures as of December 31, 2015 pursuant to Exchange Act Rule 13a-15. Based upon that evaluation, the Company's Chief Executive Officer and
52
Chief Financial Officer have concluded that the Company's disclosure controls and procedures, as defined in Exchange Act Rule 13a-15(e) and 15d-15(e), were effective as of the end of the period covered by this Annual Report.
Management's Report on Internal Control over Financial Reporting
Management is responsible for establishing and maintaining adequate internal control over financial reporting at the Company. Our internal control over financial reporting is a process designed under the supervision of our Chief Executive Officer and Chief Financial Officer to provide reasonable assurance regarding the reliability of financial reporting and the preparation of the Company's financial statements for external reporting purposes in accordance with GAAP. A company's internal control over financial reporting includes those policies and procedures that:
- •
- pertain to the maintenance of records that, in reasonable detail, accurately and fairly reflect the transactions and dispositions of
the assets of the Company;
- •
- provide reasonable assurance that transactions are recorded as necessary to permit preparation of financial statements in accordance
with GAAP, and that receipts and expenditures of the Company are being made only in accordance with authorizations of management and the directors of the Company; and
- •
- provide reasonable assurance regarding prevention or timely detection of unauthorized acquisition, use or disposition of the Company's assets that could have a material effect on the financial statements.
Because of its inherent limitations, internal control over financial reporting may not prevent or detect misstatements. Also, projections of any evaluation of effectiveness to future periods are subject to the risk that controls may become inadequate because of changes in conditions, or that the degree of compliance with the policies or procedures may deteriorate.
Under the supervision and with the participation of management, including the certifying officers, the Company conducted an evaluation of the effectiveness of the Company's internal control over financial reporting as of December 31, 2015 based on the framework in Internal Control—Integrated Framework (2013) issued by the Committee of Sponsoring Organizations of the Treadway Commission (COSO). Management's assessment included an evaluation of the design of the Company's internal control over financial reporting and testing of the operational effectiveness of its internal control over financial reporting.
Based on this assessment, management determined that, as of December 31, 2015, the Company maintained effective internal control over financial reporting. The registered public accounting firm that audited the consolidated financial statements included in this Annual Report has also issued an audit report on the Company's internal control over financial reporting. The Report of Independent Registered Public Accounting Firm is filed with this Annual Report on Form 10-K in a separate section following Part IV, as shown on the index under Item 15 of this Annual Report.
Changes in Internal Control over Financial Reporting
There have been no changes in the Company's internal control over financial reporting (as defined by Exchange Act Rule 13a-15(f) and 15d-15(f)) that have materially affected, or are reasonably likely to materially affect, the Company's internal control over financial reporting during the quarter ended December 31, 2015.
None.
53
Item 10. Directors, Executive Officers and Corporate Governance
The information required by Item 10 will be included in the Company's definitive Proxy Statement under the caption "Directors, Executive Officers and Corporate Governance" and "Section 16(a) Beneficial Ownership Reporting Compliance," to be filed with the Commission within 120 days after the end of fiscal year 2015 pursuant to Regulation 14A, which information is incorporated herein by this reference.
Item 11. Executive Compensation
The Company maintains employee benefit plans and programs in which its executive officers are participants. Copies of certain of these plans and programs are set forth or incorporated by reference as Exhibits to this report. Information required by Item 11 will be included in the Company's definitive Proxy Statement under the captions "Director Compensation," "Executive Compensation," "Compensation Discussion and Analysis," and "Directors, Executive Officers and Corporate Governance," to be filed with the Commission within 120 days after the end of fiscal year 2015 pursuant to Regulation 14A, which information is incorporated herein by this reference.
Item 12. Security Ownership of Certain Beneficial Owners and Management and Related Stockholder Matters
The information required by Item 12 will be included in the Company's definitive Proxy Statement under the caption "Security Ownership of Certain Beneficial Owners and Management," to be filed with the Commission within 120 days after the end of fiscal year 2015 pursuant to Regulation 14A, which information is incorporated herein by this reference. The information required to be disclosed by Item 201(d) of Regulation S-K regarding our equity securities authorized for issuance under our equity incentive plans is incorporated herein by reference to the section entitled "Securities Authorized for Issuance under Equity Compensation Plans" in our definitive Proxy Statement for our Annual Meeting of Stockholders to be filed with the Commission within 120 days after the end of fiscal year 2015 pursuant to Regulation 14A.
Item 13. Certain Relationships and Related Transactions, and Director Independence
The information required by Item 13 of Form 10-K regarding transactions with related persons, promoters and certain control persons, if any, will be included in the Company's definitive Proxy Statement under the caption "Certain Relationships and Related Party Transactions" to be filed with the Commission within 120 days after the end of fiscal year 2015 pursuant to Regulation 14A, which information is incorporated herein by this reference. The information required by Item 13 of Form 10-K regarding director independence will be included in the Company's definitive Proxy Statement under the caption "Directors, Executive Officers and Corporate Governance—Corporate Governance and Board Matters—Independence of the Board of Directors," to be filed with the Commission within 120 days after the end of fiscal year 2015 pursuant to Regulation 14A, which information is incorporated herein by this reference.
Item 14. Principal Accounting Fees and Services
The information required by Item 14 will be included in the Company's definitive Proxy Statement under the caption "Independent Registered Public Accounting Firm" to be filed with the Commission within 120 days after the end of fiscal year 2015 pursuant to Regulation 14A, which information is incorporated herein by this reference.
54
(a) The following documents are filed as part of, or incorporated by reference into, this Annual Report on Form 10-K:
(1)(2) Financial Statements. The following consolidated financial statements of Boingo Wireless, Inc., and Report of Independent Registered Public Accounting Firm are included in a separate section of this Annual Report on Form 10-K beginning on page F-1. The Exhibits begin on page F-33.
55
INDEX TO CONSOLIDATED FINANCIAL STATEMENTS
All schedules are omitted because they are not applicable or the required information is shown in the Company's consolidated financial statements or the related notes thereto.
F-1
REPORT OF INDEPENDENT REGISTERED PUBLIC ACCOUNTING FIRM
To the Board of Directors and Stockholders of Boingo Wireless, Inc.
In our opinion, the accompanying consolidated balance sheets and the related consolidated statements of operations, comprehensive income (loss), stockholders' equity and cash flows present fairly, in all material respects, the financial position of Boingo Wireless, Inc. and its subsidiaries ("Company") at December 31, 2015 and 2014, and the results of their operations and their cash flows for each of the three years in the period ended December 31, 2015 in conformity with accounting principles generally accepted in the United States of America. Also in our opinion, the Company maintained, in all material respects, effective internal control over financial reporting as of December 31, 2015, based on criteria established in Internal Control—Integrated Framework (2013) issued by the Committee of Sponsoring Organizations of the Treadway Commission (COSO). The Company's management is responsible for these financial statements, for maintaining effective internal control over financial reporting and for its assessment of the effectiveness of internal control over financial reporting, included in Management's Report on Internal Control over Financial Reporting appearing under Item 9A. Our responsibility is to express opinions on these financial statements and on the Company's internal control over financial reporting based on our integrated audits. We conducted our audits in accordance with the standards of the Public Company Accounting Oversight Board (United States). Those standards require that we plan and perform the audits to obtain reasonable assurance about whether the financial statements are free of material misstatement and whether effective internal control over financial reporting was maintained in all material respects. Our audits of the financial statements included examining, on a test basis, evidence supporting the amounts and disclosures in the financial statements, assessing the accounting principles used and significant estimates made by management, and evaluating the overall financial statement presentation. Our audit of internal control over financial reporting included obtaining an understanding of internal control over financial reporting, assessing the risk that a material weakness exists, and testing and evaluating the design and operating effectiveness of internal control based on the assessed risk. Our audits also included performing such other procedures as we considered necessary in the circumstances. We believe that our audits provide a reasonable basis for our opinions.
A company's internal control over financial reporting is a process designed to provide reasonable assurance regarding the reliability of financial reporting and the preparation of financial statements for external purposes in accordance with generally accepted accounting principles. A company's internal control over financial reporting includes those policies and procedures that (i) pertain to the maintenance of records that, in reasonable detail, accurately and fairly reflect the transactions and dispositions of the assets of the company; (ii) provide reasonable assurance that transactions are recorded as necessary to permit preparation of financial statements in accordance with generally accepted accounting principles, and that receipts and expenditures of the company are being made only in accordance with authorizations of management and directors of the company; and (iii) provide reasonable assurance regarding prevention or timely detection of unauthorized acquisition, use, or disposition of the company's assets that could have a material effect on the financial statements.
Because of its inherent limitations, internal control over financial reporting may not prevent or detect misstatements. Also, projections of any evaluation of effectiveness to future periods are subject to the risk that controls may become inadequate because of changes in conditions, or that the degree of compliance with the policies or procedures may deteriorate.
/s/
PricewaterhouseCoopers LLP
Los Angeles, California
March 11, 2016
F-2
Boingo Wireless, Inc.
Consolidated Balance Sheets
(In thousands, except per share amounts)
| |
December 31, | ||||||
|---|---|---|---|---|---|---|---|
| |
2015 | 2014 | |||||
Assets |
|||||||
Current assets: |
|||||||
Cash and cash equivalents |
$ | 14,718 | $ | 8,849 | |||
Marketable securities |
— | 1,614 | |||||
Accounts receivable, net |
43,552 | 27,917 | |||||
Prepaid expenses and other current assets |
3,876 | 3,916 | |||||
| | | | | | | | |
Total current assets |
62,146 | 42,296 | |||||
Property and equipment, net |
214,500 | 111,772 | |||||
Goodwill |
42,403 | 42,403 | |||||
Intangible assets, net |
16,055 | 19,676 | |||||
Other assets |
5,908 | 2,468 | |||||
| | | | | | | | |
Total assets |
$ | 341,012 | $ | 218,615 | |||
| | | | | | | | |
| | | | | | | | |
| | | | | | | | |
Liabilities and stockholders' equity |
|||||||
Current liabilities: |
|||||||
Accounts payable |
$ | 29,376 | $ | 4,004 | |||
Accrued expenses and other liabilities |
36,328 | 26,109 | |||||
Deferred revenue |
25,759 | 25,488 | |||||
Current portion of long-term debt |
875 | 875 | |||||
Current portion of capital leases |
1,610 | 309 | |||||
| | | | | | | | |
Total current liabilities |
93,948 | 56,785 | |||||
Deferred revenue, net of current portion |
106,825 | 27,267 | |||||
Long-term debt |
16,750 | 2,625 | |||||
Long-term portion of capital leases |
2,217 | 381 | |||||
Deferred tax liabilities |
2,965 | 2,645 | |||||
Other liabilities |
6,272 | 1,482 | |||||
| | | | | | | | |
Total liabilities |
228,977 | 91,185 | |||||
Commitments and contingencies (Note 13) |
|||||||
Stockholders' equity: |
|||||||
Preferred stock, $0.0001 par value; 5,000 shares authorized; no shares issued and outstanding |
— | — | |||||
Common stock, $0.0001 par value; 100,000 shares authorized; 37,325 and 36,267 shares issued and outstanding for 2015 and 2014, respectively |
4 | 4 | |||||
Additional paid-in capital |
197,612 | 189,725 | |||||
Accumulated deficit |
(85,176 | ) | (62,884 | ) | |||
Accumulated other comprehensive loss |
(1,160 | ) | (443 | ) | |||
| | | | | | | | |
Total common stockholders' equity |
111,280 | 126,402 | |||||
Non-controlling interests |
755 | 1,028 | |||||
| | | | | | | | |
Total stockholders' equity |
112,035 | 127,430 | |||||
| | | | | | | | |
Total liabilities and stockholders' equity |
$ | 341,012 | $ | 218,615 | |||
| | | | | | | | |
| | | | | | | | |
| | | | | | | | |
The accompanying notes are an integral part of these consolidated financial statements.
F-3
Boingo Wireless, Inc.
Consolidated Statements of Operations
(In thousands, except per share amounts)
| |
For the Years Ended December 31, | |||||||||
|---|---|---|---|---|---|---|---|---|---|---|
| |
2015 | 2014 | 2013 | |||||||
Revenue |
$ | 139,626 | $ | 119,297 | $ | 106,746 | ||||
Costs and operating expenses: |
||||||||||
Network access |
62,988 | 59,411 | 47,245 | |||||||
Network operations |
33,537 | 25,475 | 18,402 | |||||||
Development and technology |
19,147 | 14,879 | 11,432 | |||||||
Selling and marketing |
19,653 | 16,382 | 14,244 | |||||||
General and administrative |
22,356 | 17,460 | 15,067 | |||||||
Amortization of intangible assets |
3,576 | 3,716 | 2,250 | |||||||
| | | | | | | | | | | |
Total costs and operating expenses |
161,257 | 137,323 | 108,640 | |||||||
| | | | | | | | | | | |
Loss from operations |
(21,631 | ) | (18,026 | ) | (1,894 | ) | ||||
Interest and other (expense) income, net |
(66 | ) | (41 | ) | 37 | |||||
| | | | | | | | | | | |
Loss before income taxes |
(21,697 | ) | (18,067 | ) | (1,857 | ) | ||||
Income tax expense |
481 | 700 | 1,461 | |||||||
| | | | | | | | | | | |
Net loss |
(22,178 | ) | (18,767 | ) | (3,318 | ) | ||||
Net income attributable to non-controlling interests |
114 | 754 | 650 | |||||||
| | | | | | | | | | | |
Net loss attributable to common stockholders |
$ | (22,292 | ) | $ | (19,521 | ) | $ | (3,968 | ) | |
| | | | | | | | | | | |
| | | | | | | | | | | |
| | | | | | | | | | | |
Net loss per share attributable to common stockholders: |
||||||||||
Basic |
$ | (0.60 | ) | $ | (0.55 | ) | $ | (0.11 | ) | |
Diluted |
$ | (0.60 | ) | $ | (0.55 | ) | $ | (0.11 | ) | |
Weighted average shares used in computing net loss per share attributable to common stockholders: |
||||||||||
Basic |
36,849 | 35,753 | 35,578 | |||||||
Diluted |
36,849 | 35,753 | 35,578 | |||||||
The accompanying notes are an integral part of these consolidated financial statements.
F-4
Boingo Wireless, Inc.
Consolidated Statements of Comprehensive Income (Loss)
(In thousands)
| |
For the Years Ended December 31, | |||||||||
|---|---|---|---|---|---|---|---|---|---|---|
| |
2015 | 2014 | 2013 | |||||||
Net loss |
$ | (22,178 | ) | $ | (18,767 | ) | $ | (3,318 | ) | |
Other comprehensive loss, net of tax: |
||||||||||
Foreign currency translation adjustments |
(604 | ) | (411 | ) | — | |||||
| | | | | | | | | | | |
Comprehensive loss |
(22,782 | ) | (19,178 | ) | (3,318 | ) | ||||
Comprehensive income attributable to non-controlling interest |
227 | 786 | 650 | |||||||
| | | | | | | | | | | |
Comprehensive loss attributable to common stockholders |
$ | (23,009 | ) | $ | (19,964 | ) | $ | (3,968 | ) | |
| | | | | | | | | | | |
| | | | | | | | | | | |
| | | | | | | | | | | |
The accompanying notes are an integral part of these consolidated financial statements.
F-5
Boingo Wireless, Inc.
Consolidated Statements of Stockholders' Equity
(In thousands)
| |
Common Stock Shares |
Common Stock Amount |
Additional Paid-in Capital |
Accumulated Deficit |
Accumulated Other Comprehensive Loss |
Non- controlling Interest |
Total Stockholder's Equity |
|||||||||||||||
|---|---|---|---|---|---|---|---|---|---|---|---|---|---|---|---|---|---|---|---|---|---|---|
Balance at December 31, 2012 |
35,483 | $ | 4 | $ | 178,219 | $ | (34,547 | ) | $ | — | $ | 823 | $ | 144,499 | ||||||||
Issuance of common stock under stock incentive plans |
465 | — | 599 | — | — | — | 599 | |||||||||||||||
Repurchase and retirement of common stock |
(722 | ) | — | — | (4,848 | ) | — | — | (4,848 | ) | ||||||||||||
Stock-based compensation expense |
— | — | 4,506 | — | — | — | 4,506 | |||||||||||||||
Deficient tax benefits from stock-based compensation |
— | — | (397 | ) | — | — | — | (397 | ) | |||||||||||||
Non-controlling interest distributions |
— | — | — | — | — | (608 | ) | (608 | ) | |||||||||||||
Net loss |
— | — | — | (3,968 | ) | — | 650 | (3,318 | ) | |||||||||||||
| | | | | | | | | | | | | | | | | | | | | | | |
Balance at December 31, 2013 |
35,226 | 4 | 182,927 | (43,363 | ) | — | 865 | 140,433 | ||||||||||||||
Issuance of common stock under stock incentive plans |
1,041 | — | 1,158 | — | — | — | 1,158 | |||||||||||||||
Shares withheld for taxes |
— | — | (1,922 | ) | — | — | — | (1,922 | ) | |||||||||||||
Stock-based compensation expense |
— | — | 7,562 | — | — | — | 7,562 | |||||||||||||||
Non-controlling interest distributions |
— | — | — | — | — | (623 | ) | (623 | ) | |||||||||||||
Net loss |
— | — | — | (19,521 | ) | — | 754 | (18,767 | ) | |||||||||||||
Other comprehensive loss |
— | — | — | — | (443 | ) | 32 | (411 | ) | |||||||||||||
| | | | | | | | | | | | | | | | | | | | | | | |
Balance at December 31, 2014 |
36,267 | 4 | 189,725 | (62,884 | ) | (443 | ) | 1,028 | 127,430 | |||||||||||||
Issuance of common stock under stock incentive plans |
1,058 | — | 1,373 | — | — | — | 1,373 | |||||||||||||||
Shares withheld for taxes |
— | — | (2,512 | ) | — | — | — | (2,512 | ) | |||||||||||||
Stock-based compensation expense |
— | — | 10,176 | — | — | — | 10,176 | |||||||||||||||
Purchase of non-controlling interest |
— | — | (1,150 | ) | — | — | — | (1,150 | ) | |||||||||||||
Non-controlling interest distributions |
— | — | — | — | — | (500 | ) | (500 | ) | |||||||||||||
Net loss |
— | — | — | (22,292 | ) | — | 114 | (22,178 | ) | |||||||||||||
Other comprehensive loss |
— | — | — | — | (717 | ) | 113 | (604 | ) | |||||||||||||
| | | | | | | | | | | | | | | | | | | | | | | |
Balance at December 31, 2015 |
37,325 | $ | 4 | $ | 197,612 | $ | (85,176 | ) | $ | (1,160 | ) | $ | 755 | $ | 112,035 | |||||||
| | | | | | | | | | | | | | | | | | | | | | | |
| | | | | | | | | | | | | | | | | | | | | | | |
| | | | | | | | | | | | | | | | | | | | | | | |
The accompanying notes are an integral part of these consolidated financial statements.
F-6
Boingo Wireless, Inc.
Consolidated Statements of Cash Flows
(In thousands)
| |
For the Years Ended December 31, |
|||||||||
|---|---|---|---|---|---|---|---|---|---|---|
| |
2015 | 2014 | 2013 | |||||||
Cash flows from operating activities |
||||||||||
Net loss |
$ | (22,178 | ) | $ | (18,767 | ) | $ | (3,318 | ) | |
Adjustments to reconcile net loss including non-controlling interests to net cash provided by operating activities: |
||||||||||
Depreciation and amortization of property and equipment |
38,293 | 27,446 | 18,940 | |||||||
Amortization of intangible assets |
3,576 | 3,716 | 2,250 | |||||||
Impairment loss |
242 | 959 | — | |||||||
Stock-based compensation |
9,398 | 7,164 | 4,506 | |||||||
Excess tax benefits from stock-based compensation |
— | — | (55 | ) | ||||||
Change in fair value of contingent consideration |
(114 | ) | (811 | ) | (367 | ) | ||||
Change in deferred income taxes |
320 | 468 | 1,615 | |||||||
Changes in operating assets and liabilities, net of effect of acquisition: |
||||||||||
Accounts receivable |
(15,746 | ) | (11,392 | ) | (2,403 | ) | ||||
Prepaid expenses and other assets |
(3,459 | ) | (1,935 | ) | 1,648 | |||||
Accounts payable |
3,845 | (2,252 | ) | (242 | ) | |||||
Accrued expenses and other liabilities |
4,569 | 4,739 | (1,307 | ) | ||||||
Deferred revenue |
79,829 | 11,872 | (596 | ) | ||||||
| | | | | | | | | | | |
Net cash provided by operating activities |
98,575 | 21,207 | 20,671 | |||||||
| | | | | | | | | | | |
Cash flows from investing activities |
||||||||||
Decrease in restricted cash |
— | 545 | — | |||||||
Purchases of marketable securities |
— | (27,163 | ) | (33,430 | ) | |||||
Proceeds from sales of marketable securities |
1,614 | 58,511 | 42,026 | |||||||
Purchases of property and equipment |
(103,116 | ) | (70,945 | ) | (29,500 | ) | ||||
Payments for business acquisitions, net of cash acquired |
— | (147 | ) | (19,459 | ) | |||||
Other |
— | — | (40 | ) | ||||||
| | | | | | | | | | | |
Net cash used in investing activities |
(101,502 | ) | (39,199 | ) | (40,403 | ) | ||||
| | | | | | | | | | | |
Cash flows from financing activities |
||||||||||
Proceeds from credit facility |
20,000 | 3,500 | — | |||||||
Principal payments on debt |
(5,875 | ) | — | — | ||||||
Debt issuance costs |
(62 | ) | (711 | ) | — | |||||
Proceeds from exercise of stock options |
1,373 | 1,158 | 614 | |||||||
Repurchase and retirement of common stock |
— | — | (4,848 | ) | ||||||
Excess tax benefits from stock-based compensation |
— | — | 55 | |||||||
Payments of capital leases and notes payable |
(814 | ) | (627 | ) | (187 | ) | ||||
Payments of acquired notes payable and financed liabilities |
— | — | (6,079 | ) | ||||||
Payment of holdback consideration |
(1,600 | ) | — | — | ||||||
Payment of other acquisition related consideration |
(17 | ) | (1,255 | ) | — | |||||
Payments of withholding tax on net issuance of restricted stock units |
(2,512 | ) | (1,922 | ) | (15 | ) | ||||
Payments to non-controlling interest |
(500 | ) | (623 | ) | (608 | ) | ||||
Purchase of non-controlling interests |
(1,150 | ) | — | — | ||||||
| | | | | | | | | | | |
Net cash provided by (used in) financing activities |
8,843 | (480 | ) | (11,068 | ) | |||||
Effect of exchange rates on cash. |
(47 | ) | (17 | ) | — | |||||
| | | | | | | | | | | |
Net decrease in cash and cash equivalents |
5,869 | (18,489 | ) | (30,800 | ) | |||||
Cash and cash equivalents at beginning of year |
8,849 | 27,338 | 58,138 | |||||||
| | | | | | | | | | | |
Cash and cash equivalents at end of year |
$ | 14,718 | $ | 8,849 | $ | 27,338 | ||||
| | | | | | | | | | | |
| | | | | | | | | | | |
| | | | | | | | | | | |
Supplemental disclosure of cash flow information |
||||||||||
Cash paid for interest |
$ | 347 | $ | 33 | $ | 32 | ||||
Cash paid (received) for taxes, net of refunds |
$ | 62 | $ | (53 | ) | $ | 96 | |||
Supplemental disclosure of non-cash investing and financing activities |
||||||||||
Property and equipment costs in accounts payable, accrued expenses and other liabilities |
$ | 45,417 | $ | 11,647 | $ | 10,283 | ||||
Acquisition of equipment under capital leases |
$ | 3,839 | $ | 361 | $ | — | ||||
Assets acquired in business acquisition |
$ | — | $ | — | $ | 39,794 | ||||
Liabilities assumed in business acquisition |
$ | — | $ | — | $ | 16,151 | ||||
The accompanying notes are an integral part of these consolidated financial statements.
F-7
Boingo Wireless, Inc.
Notes to the Consolidated Financial Statements
(In thousands, except shares and per share amounts)
1. The business
Boingo Wireless, Inc. and its subsidiaries (collectively "we, "us", "our" or "the Company") is a leading global provider of wireless connectivity solutions for smartphones, tablets, laptops, wearables, internet of things ("IoT") and other wireless-enabled consumer devices. Boingo Wireless, Inc. was incorporated in April 16, 2001 in the State of Delaware. We have a diverse monetization model that enables us to generate revenues from wholesale partnerships, retail sales, and advertising across these wireless networks. Wholesale offerings include Wi-Fi roaming, value-added services, private label Wi-Fi, location based services, and distributed antenna systems ("DAS") or femto-cells, which are cellular extension networks. Retail products include Wi-Fi subscriptions and day passes that provide access to more than 1.5 million commercial hotspots worldwide, and broadband and TV services for troops living in Army, Air Force and Marines bases. Advertising revenue is driven by Wi-Fi sponsorships at airports, hotels, cafes and restaurants, and public spaces. Our customers include some of the world's largest carriers, telecommunications service providers and global consumer brands, as well as Internet savvy consumers on the go and troops stationed at military bases.
2. Summary of significant accounting policies
Basis of presentation and consolidation
Our consolidated financial statements have been prepared in accordance with accounting principles generally accepted in the United States of America ("GAAP").
The accompanying consolidated financial statements include our accounts and the accounts of our majority owned subsidiaries. We consolidate our 70% ownership of Chicago Concourse Development Group, LLC and our 75% ownership of Boingo Holding Participacoes Ltda. in accordance with Financial Accounting Standards Board ("FASB") Accounting Standards Codification ("ASC") 810, Consolidation. Other parties' interests in consolidated entities are reported as non-controlling interests. All intercompany balances and transactions have been eliminated in consolidation.
Prior to August 4, 2015, we had a 70% ownership of Concourse Communications Detroit, LLC. On August 4, 2015, we purchased the remaining 30% ownership interest from the non-controlling interest owners for $1,150. We accounted for this transaction as an acquisition of the remaining interest of an entity that had already been majority-owned by the Company. The purchase resulted in a reduction to additional paid-in capital of $1,150 representing excess purchase price over the carrying amount of the non-controlling interests. Prior to this purchase, we had a controlling interest in this subsidiary, and therefore, this subsidiary had been and will continue to be consolidated with the Company's operations.
We early adopted FASB Accounting Standards Update, ("ASU") 2015-17, Balance Sheet Classification of Deferred Taxes, on a retrospective basis as of December 31, 2015. As a result of this adoption, the consolidated balance sheet as of December 31, 2014 has been revised to reflect reclassifications of $787 from current deferred tax assets to noncurrent deferred tax liabilities.
During the year ended December 31, 2013, the Company recorded certain out-of-period adjustments that decreased net loss attributable to common stockholders by $217. The impact of these out-of-period adjustments is not considered material, individually and in the aggregate, to any of the current or prior annual periods.
F-8
Boingo Wireless, Inc.
Notes to the Consolidated Financial Statements (Continued)
(In thousands, except shares and per share amounts)
2. Summary of significant accounting policies (Continued)
Use of estimates
The preparation of accompanying consolidated financial statements in conformity with GAAP requires us to make estimates and assumptions that affect the reported amounts of assets and liabilities and the disclosure of contingent assets and liabilities at the dates of the accompanying consolidated financial statements, and the reported amounts of revenue and expenses during the reporting period. Actual results could differ from those estimates. Assets and liabilities which are subject to significant judgment and the use of estimates include the allowance for doubtful accounts, recoverability of goodwill and long-lived assets, valuation allowances with respect to deferred tax assets, uncertain tax positions, useful lives associated with property and equipment, valuation and useful lives of intangible assets, valuation of contingent consideration, and the valuation and assumptions underlying stock-based compensation and other equity instruments. On an ongoing basis, we evaluate our estimates compared to historical experience and trends, which form the basis for making judgments about the carrying value of assets and liabilities.
Concentrations of credit risk
Financial instruments that potentially subject us to significant concentrations of credit risk consist primarily of cash and cash equivalents, marketable securities and accounts receivable. We maintain our cash and cash equivalents and marketable securities with institutions with high credit ratings. We extend credit based upon the evaluation of the customer's financial condition and generally collateral is not required. We maintain an allowance for doubtful accounts based upon expected collectability of accounts receivable. We primarily estimate our allowance for doubtful accounts based on a specific review of significant outstanding accounts receivable. For the years ended December 31, 2015 and 2014, one customer accounted for 17% and 15% of total revenue, respectively. For the year ended December 31, 2013, two customers each accounted for 14% of total revenue. At December 31, 2015, four customers accounted for 28%, 19%, 19% and 10% of the total accounts receivable, respectively. At December 31, 2014, two customers accounted for 30% and 17% of the total accounts receivable, respectively.
Cash and cash equivalents
Cash and cash equivalents include highly liquid investments that are readily convertible into known amounts of cash with original maturities of three months or less when acquired. At December 31, 2015 and 2014, cash equivalents consisted of money market funds.
Marketable securities
Our marketable securities consist of available-for-sale securities with original maturities exceeding three months. In accordance with FASB ASC 320, Investments—Debt and Equity Securities, we have classified securities, which have readily determinable fair values and are highly liquid, as short-term because such securities are expected to be realized within a one-year period. At December 31, 2015 and 2014, we had $0 and $1,614, respectively, in marketable securities.
Marketable securities are reported at fair value with the related unrealized gains and losses reported as other comprehensive income (loss) until realized or until a determination is made that an
F-9
Boingo Wireless, Inc.
Notes to the Consolidated Financial Statements (Continued)
(In thousands, except shares and per share amounts)
2. Summary of significant accounting policies (Continued)
other-than-temporary decline in market value has occurred. No significant unrealized gains and losses have been reported during the years presented. Factors considered by us in assessing whether an other-than-temporary impairment has occurred include the nature of the investment, whether the decline in fair value is attributable to specific adverse conditions affecting the investment, the financial condition of the investee, the severity and the duration of the impairment and whether we have the ability to hold the investment to maturity. When it is determined that an other-than-temporary impairment has occurred, the investment is written down to its market value at the end of the period in which it is determined that an other-than-temporary decline has occurred. The cost of marketable securities sold is based upon the specific identification method. Any realized gains or losses on the sale of investments are reflected as a component of interest and other (expense) income, net.
For the years ended December 31, 2015, 2014 and 2013, we had no significant realized or unrealized gains or losses from investments in marketable securities classified as available-for-sale. As of December 31, 2015 and 2014, we had no unrealized gains or losses in accumulated other comprehensive income (loss).
Fair value of financial instruments
Fair value is defined as the price that would be received from selling an asset, or paid to transfer a liability, in an orderly transaction between market participants at the measurement date. When determining the fair value measurements for assets and liabilities required or permitted to be recorded at fair value, we consider the principal or most advantageous market in which it would transact, and we consider assumptions that market participants would use when pricing the asset or liability.
The accounting guidance for fair value measurement also requires an entity to maximize the use of observable inputs and minimize the use of unobservable inputs when measuring fair value. The standard establishes a fair value hierarchy based on the level of independent, objective evidence surrounding the inputs used to measure fair value. A financial instrument's categorization within the fair value hierarchy is based upon the lowest level of input that is significant to the fair value measurement. The fair value hierarchy is as follows:
- •
- Level 1—Unadjusted quoted prices in active markets that are accessible at the measurement date for identical,
unrestricted assets or liabilities.
- •
- Level 2—Quoted prices for identical assets and liabilities in markets that are not active, quoted prices for
similar assets and liabilities in active markets or financial instruments for which significant inputs are observable, either directly or indirectly.
- •
- Level 3—Unobservable inputs that are supported by little or no market activity and that are significant to the fair value of the assets or liabilities.
The carrying amount reflected in the accompanying consolidated balance sheets for cash and cash equivalents, restricted cash, marketable securities, accounts receivable, prepaid expenses and other current assets, accounts payable, accrued expenses and other liabilities approximates fair value due to the short-term nature of these financial instruments.
F-10
Boingo Wireless, Inc.
Notes to the Consolidated Financial Statements (Continued)
(In thousands, except shares and per share amounts)
2. Summary of significant accounting policies (Continued)
Business combinations
The results of businesses acquired in a business combination are included in the Company's consolidated financial statements from the date of the acquisition. Purchase accounting results in assets and liabilities of an acquired business being recorded at their estimated fair values on the acquisition date. Any excess consideration over the fair value of assets acquired and liabilities assumed is recognized as goodwill.
The Company performs valuations of assets acquired and liabilities assumed from a business acquisition and will allocate the purchase price to its respective net tangible and intangible assets. Determining the fair value of assets acquired and liabilities assumed requires management to use significant judgment and estimates including the selection of valuation methodologies, estimates of future revenues and cash flows, discount rates, royalty rates and selection of comparable companies. The Company engages the assistance of valuation specialists in concluding on fair value measurements in connection with fair values of assets and liabilities assumed in a business combination.
Transaction costs associated with business combinations are expensed as incurred, and are included in general and administrative expenses in the consolidated statements of operations. There were no transaction costs for the years ended December 31, 2015 and 2014. Transaction cost for the year ended December 31, 2013 was $354.
Property and equipment
Property and equipment are generally stated at historical cost, less accumulated depreciation and amortization. The Company's cost basis includes property and equipment acquired in business combinations that were initially recorded at fair value as of the date of acquisition. Maintenance and repairs are charged to expense as incurred and the cost of additions and betterments that increase the useful lives of the assets are capitalized. Depreciation and amortization is computed over the estimated useful lives of the related asset type using the straight-line method.
The estimated useful lives for property and equipment are as follows:
Software |
2 to 5 years | |
Computer equipment |
2 to 5 years | |
Furniture, fixtures and office equipment |
3 to 5 years | |
Leasehold improvements |
The shorter of the estimated useful life or the remaining term of the agreements, generally ranging from 2 to 15 years |
Leasehold improvements are principally comprised of network equipment located at various managed and operated locations, primarily airports, under exclusive, long-term, non-cancelable contracts to provide wireless communication network access.
Equipment and software under capital lease
We lease certain data communications equipment, other equipment and software under capital lease agreements. The assets and liabilities under capital lease are recorded at the lesser of the present
F-11
Boingo Wireless, Inc.
Notes to the Consolidated Financial Statements (Continued)
(In thousands, except shares and per share amounts)
2. Summary of significant accounting policies (Continued)
value of aggregate future minimum lease payments, including estimated bargain purchase options, or the fair value of the asset under lease. Assets under capital lease are depreciated using the straight-line method over the estimated useful lives of the assets or the term of the lease agreements.
Software development costs
We capitalize costs associated with software developed or obtained for internal use when the preliminary project stage is completed and it is determined that the software will provide significantly enhanced capabilities and modifications. These capitalized costs are included in property and equipment and include external direct cost of services procured in developing or obtaining internal-use software and personnel and related expenses for employees who are directly associated with, and who devote time to internal-use software projects. Capitalization of these costs ceases once the project is substantially complete and the software is ready for its intended use. Once the software is ready for its intended use, the costs are amortized over the useful life of the software. Post-configuration training and maintenance costs are expensed as incurred.
Long-lived assets
Intangible assets consist of acquired venue contracts, technology, advertiser relationships, non-compete agreements and patents and trademarks. We record intangible assets at fair value as of the date of acquisition and amortize these finite-lived assets over the shorter of the contractual life or the estimated useful life on a straight-line basis. We estimate the useful lives of acquired intangible assets based on factors that include the planned use of each acquired intangible asset, the expected pattern of future cash flows to be derived from each acquired intangible asset and contractual periods specified in the related agreements. As such, we account for each of the venue contracts individually. We include amortization of acquired intangibles in amortization of intangible assets in the accompanying consolidated statements of operations.
We perform an impairment review of long-lived assets held and used whenever events or changes in circumstances indicate that the carrying value may not be recoverable. Factors we consider important that could trigger an impairment review include, but are not limited to: significant under-performance relative to projected future operating results, significant changes in the manner of our use of the acquired assets or our overall business and product strategies and significant industry or economic trends. When we determine that the carrying value of a long-lived asset may not be recoverable based upon the existence of one or more of these indicators, we determine the recoverability by comparing the carrying amount of the asset to net future undiscounted cash flows that the asset is expected to generate or other indices of fair value. We would then recognize an impairment charge equal to the amount by which the carrying amount exceeds the fair market value of the asset.
Goodwill
Goodwill represents the excess of the purchase price over the fair value of net assets acquired in connection with the acquisition of Concourse Communication Group, LLC in June 2006, Cloud 9 Wireless, Inc. in August 2012, Endeka Group, Inc. in February 2013, and Electronic Media Systems, Inc. and Advanced Wireless Group, LLC in October 2013.
F-12
Boingo Wireless, Inc.
Notes to the Consolidated Financial Statements (Continued)
(In thousands, except shares and per share amounts)
2. Summary of significant accounting policies (Continued)
We test goodwill for impairment in accordance with guidance provided by FASB ASC 350, Intangibles—Goodwill and Other ("ASC 350"). Goodwill is tested for impairment at least annually at the reporting unit level or whenever events or changes in circumstances indicate that goodwill might be impaired. Events or changes in circumstances which could trigger an impairment review include a significant adverse change in legal factors or in the business climate, an adverse action or assessment by a regulator, unanticipated competition, a loss of key personnel, significant changes in the manner of our use of the acquired assets or the strategy for our overall business, significant negative industry or economic trends, or significant underperformance relative to expected historical or projected future results of operations. We perform our impairment test annually as of December 31st.
Entities have the option to first assess qualitative factors to determine whether it is more likely than not that the fair value of a reporting unit is less than its carrying amount as a basis for determining whether it is necessary to perform the two-step goodwill impairment test described in FASB ASC 350. If, after assessing qualitative factors, an entity determines it is not more likely than not that the fair value of a reporting unit is less than its carrying amount, then performing the two-step impairment test is unnecessary. If deemed necessary, a two-step test is used to identify the potential impairment and to measure the amount of goodwill impairment, if any. The first step is to compare the fair value of the reporting unit with its carrying amount, including goodwill. If the fair value of the reporting unit exceeds its carrying amount, goodwill is considered not impaired; otherwise, there is an indication that goodwill may be impaired and the amount of the loss, if any, is measured by performing step two. Under step two, the impairment loss, if any, is measured by comparing the implied fair value of the reporting unit goodwill with the carrying amount of goodwill.
Currently, we have one reporting unit, one operating segment and one reportable segment. At December 31, 2015 and 2014, all of the goodwill was attributed to our reporting unit. We tested our goodwill for impairment using a market based approach and no impairment was identified as the fair value of our reporting unit was substantially in excess of its carrying amount. To date, we have not recorded any goodwill impairment charges.
Revenue recognition
We generate revenue from several sources including: (i) retail and military customers under subscription plans for month-to-month network access that automatically renew, and retail and military single-use access from sales of hourly, daily or other single-use access plans, (ii) DAS customers that are telecom operators under long-term contracts for access to our DAS at our managed and operated locations, (iii) arrangements with wholesale Wi-Fi customers that provide software licensing, network access, and/or professional services fees, and (iv) display advertisements and sponsorships on our walled garden sign-in pages. Software licensed by our wholesale platform services customers can only be used during the term of the service arrangements and has no utility to them upon termination of the service arrangement.
We recognize revenue when an arrangement exists, services have been rendered, fees are fixed or determinable, no significant obligations remain related to the earned fees and collection of the related receivable is reasonably assured. Revenue is presented net of any sales and value added taxes.
F-13
Boingo Wireless, Inc.
Notes to the Consolidated Financial Statements (Continued)
(In thousands, except shares and per share amounts)
2. Summary of significant accounting policies (Continued)
Subscription fees from retail and military customers are paid monthly in advance and revenue is deferred for the portions of monthly recurring subscription fees collected in advance. We provide refunds for our retail and military services on a case-by-case basis. These amounts are not significant and are recorded as contra-revenue in the period the refunds are made. Subscription fee revenue is recognized ratably over the subscription period. Revenue generated from retail and military single-use access is recognized when access is provided.
Revenue generated from access to our DAS networks consists of build-out fees and recurring access fees under certain long-term contracts with telecom operators. Build-out fees paid upfront are generally deferred and recognized ratably over the term of the estimated customer relationship period, once the build-out is complete. Periodically, we install and sell Wi-Fi and DAS networks to customers where we do not have service contracts or remaining obligations beyond the installation of those networks and we recognize build-out fees for such projects as revenue when the installation work is completed and the network has been accepted by the customer. Minimum monthly access fees for usage of the DAS networks are non-cancellable and generally escalate on an annual basis. These minimum monthly access fees are recognized ratably over the term of the telecom operator agreement. The initial term of our contracts with telecom operators generally range from five to twenty years and the agreements generally contain renewal clauses. Revenue from DAS network access fees in excess of the monthly minimums is recognized when earned.
Services provided to wholesale Wi-Fi partners generally contain several elements including: (i) a term license to use our software to access our Wi-Fi network, (ii) access fees for Wi-Fi network usage, and/or (iii) professional services for software integration and customization and to maintain the Wi-Fi service. The term license, monthly minimum network access fees and professional services are billed on a monthly basis based upon predetermined fixed rates. Once the term license for integration and customization are delivered, the fees from the arrangement are recognized ratably over the remaining term of the service arrangement. The initial term of the license agreements is generally between one to five years and the agreements generally contain renewal clauses. Revenue for Wi-Fi network access fees in excess of the monthly minimum amounts is recognized when earned. All elements within existing service arrangements are generally delivered and earned concurrently throughout the term of the respective service arrangement.
In instances where the minimum monthly Wi-Fi and DAS network access fees escalate over the term of the wholesale service arrangement, an unbilled receivable is recognized when performance is within our control and when we have reasonable assurance that the unbilled receivable balance will be collected.
We adopted the provisions of ASU 2009-13, Revenue Recognition (Topic 605)—Multiple-Deliverable Revenue Arrangements ("ASU 2009-13"), on a prospective basis on January 1, 2011. For multiple-deliverable arrangements entered into prior to January 1, 2011 that are accounted for under ASC 605-25, Revenue Recognition—Multiple-Deliverable Revenue Arrangements, we defer recognition of revenue for the full arrangement and recognize all revenue ratably over the wholesale service period for Wi-Fi platform service arrangements and the term of the estimated customer relationship period for DAS arrangements, as we do not have evidence of fair value for the undelivered elements in the arrangement. For multiple-deliverable arrangements entered into or materially modified after January 1, 2011 that are accounted for under ASC 605-25, we evaluate whether or not separate units of
F-14
Boingo Wireless, Inc.
Notes to the Consolidated Financial Statements (Continued)
(In thousands, except shares and per share amounts)
2. Summary of significant accounting policies (Continued)
accounting exist and then allocate the arrangement consideration to all units of accounting based on the relative selling price method using estimated selling prices if vendor specific objective evidence and third party evidence is not available. We recognize the revenue associated with the separate units of accounting upon completion of such services or ratably over the wholesale service period for Wi-Fi platform service arrangements and the term of the estimated customer relationship period for DAS arrangements.
Advertising revenue is generated from advertisements on our managed and operated or partner networks. In determining whether an arrangement exists, we ensure that a binding arrangement is in place, such as a standard insertion order or a fully executed customer-specific agreement. Obligations pursuant to our advertising revenue arrangements typically include a minimum number of units or the satisfaction of certain performance criteria. Advertising and other revenue is recognized when the services are performed.
Foreign currency translation
Our Brazilian subsidiary uses the Brazilian Real as its functional currency. Assets and liabilities of our Brazilian subsidiary are translated to U.S. dollars at period-end rates of exchange, and revenues and expenses are translated at average exchange rates prevailing for each month. The resulting translation adjustments are made directly to a separate component of other comprehensive loss, which is reflected in stockholders' equity in our consolidated balance sheets. As of December 31, 2015 and December 31, 2014, the Company had $(1,160) and $(443), respectively, of cumulative foreign currency translation adjustments, net of tax, which was $0 as of December 31, 2015 and December 31, 2014 due to the full valuation allowance established against our deferred tax assets, in accumulated other comprehensive loss.
Some of our subsidiaries also enter into transactions and have monetary assets and liabilities that are denominated in a currency other than the entities' respective functional currencies. Gains and losses from the revaluation of foreign currency transactions and monetary assets and liabilities are included in the consolidated statements of operations.
Network access
Network access costs consist primarily of revenue share payments to venue owners where our managed and operated hotspots are located, usage-based fees to our roaming network partners for access to their networks, depreciation of equipment related to network build-out projects in our managed and operated locations, and bandwidth and other Internet connectivity expenses in our managed and operated locations.
Advertising, marketing and promotion costs
Advertising production costs are expensed the first time the advertisement is run. No advertising production costs were capitalized for the years ended December 31, 2015, 2014 and 2013. All other costs of advertising, marketing and promotion are expensed as incurred. Advertising expenses charged to operations totaled $1,703, $1,350 and $2,302 for the years ended December 31, 2015, 2014 and 2013, respectively.
F-15
Boingo Wireless, Inc.
Notes to the Consolidated Financial Statements (Continued)
(In thousands, except shares and per share amounts)
2. Summary of significant accounting policies (Continued)
Stock-based compensation
Our stock-based compensation consists of stock options, and restricted stock units ("RSU") granted to employees and non-employees. We have shifted our stock-based compensation from stock options to RSUs and no stock options were granted in 2015.
We recognize stock-based compensation expense in accordance with guidance provided by FASB ASC 718, Compensation—Stock Compensation ("ASC 718"). We measure employee stock-based compensation cost at grant date, based on the estimated fair value of the award and recognize the cost on a straight-line basis, net of estimated forfeitures, over the employee requisite service period. We estimate the fair value of stock options using a Black-Scholes option pricing model. The model requires input of assumptions regarding expected term, expected volatility, dividend yield, and a risk- free interest rate. The weighted average assumptions that were used to calculate the grant date fair value of our employee stock option grants for the following periods are as follows:
| |
December 31, | ||||||
|---|---|---|---|---|---|---|---|
| |
2014 | 2013 | |||||
Expected term (years) |
6.25 | 6.25 | |||||
Expected volatility |
48.6 | % | 49.31 | % | |||
Risk-free interest rate |
1.8 | % | 1.34 | % | |||
Dividend yield |
0 | % | 0 | % | |||
The expected term of employee stock options represents the weighted-average period that the stock options are expected to remain outstanding. In estimating the expected term for options granted to employees, we applied the simplified method from the Security Exchange Commission ("SEC") Staff Accounting Bulletin ("SAB") Topic 14, Share-Based Payment ("SAB Topic 14"), where options are granted at-the-money. Where options were not granted at-the-money, the expected term of employee stock options represents the weighted-average period that the stock options are expected to remain outstanding and is calculated based upon actual historical exercise and post-vesting cancellations, adjusted for expected future exercise behavior.
We determined the fair value of common stock underlying the stock option awards by reference to third party sales of our common stock. We determined the expected volatility assumption using the frequency of daily historical prices of comparable public companies' common stock for a period equal to the expected term of the options in accordance with guidance in ASC 718 and SAB Topic 14. We will continue to monitor peer companies and other relevant factors, including our volatility after there is enough history, used to measure expected volatility for future stock option grants. The risk-free interest rate assumption is based upon observed interest rates on the United States government securities appropriate for the expected term of our employee stock options. The dividend yield assumption is based on our history and expectation of dividend payouts for which no cash dividends have been declared or paid on our common stock, and for which none are anticipated in the foreseeable future.
As stock-based compensation expense recognized in our accompanying consolidated statements of operations is based on awards ultimately expected to vest, the amount has been reduced for estimated forfeitures. ASC 718 requires forfeitures to be estimated at the time of grant and revised, if necessary,
F-16
Boingo Wireless, Inc.
Notes to the Consolidated Financial Statements (Continued)
(In thousands, except shares and per share amounts)
2. Summary of significant accounting policies (Continued)
in subsequent periods if actual forfeitures differ from those estimates. Forfeitures were estimated based on our historical experience and future expectations.
Compensation expense for non-employee stock-based awards is recognized in accordance with ASC 718 and FASB ASC 505, Equity. Stock option awards issued to non-employees are accounted for at fair value using the Black-Scholes option pricing model. Management believes that the fair value of the stock options is more reliably measured than the fair value of the services received. We record compensation expense based on the then-current fair value of the stock options at each financial reporting date. Compensation recorded during the service period is adjusted in subsequent periods for changes in the stock options' fair value until the earlier of the date at which the non-employee's performance is complete or a performance commitment is reached, which is generally when the stock award vests.
Income taxes
We account for income taxes in accordance with FASB ASC 740, Accounting for Income Taxes ("ASC 740"), which requires the recognition of deferred tax assets and liabilities for the future consequences of events that have been recognized in our accompanying consolidated financial statements or tax returns. The measurement of the deferred items is based on enacted tax laws. In the event the future consequences of differences between financial reporting bases and the tax bases of our assets and liabilities result in a deferred tax asset, ASC 740 requires an evaluation of the probability of being able to realize the future benefits indicated by such asset. A valuation allowance related to a deferred tax asset is recorded when it is more likely than not that some portion or the entire deferred tax asset will not be realized. As part of the process of preparing our accompanying consolidated financial statements, we are required to estimate our income taxes in each of the jurisdictions in which we operate. We also assess temporary differences resulting from differing treatment of items, such as deferred revenue, for tax and accounting differences. We record a valuation allowance to reduce the deferred tax assets to the amount of future tax benefit that is more likely than not to be realized. We have classified our deferred tax assets and liabilities as noncurrent on the consolidated balance sheet as of December 31, 2015 and 2014 as we have early adopted ASU 2015-17, Balance Sheet Classification of Deferred Taxes, on a retrospective basis.
ASC 740 prescribes a recognition threshold and measurement methodology to recognize and measure an income tax position taken, or expected to be taken, in a tax return. The evaluation of a tax position is based on a two-step approach. The first step requires an entity to evaluate whether the tax position would "more likely than not" be sustained upon examination by the appropriate taxing authority. The second step requires the tax position be measured at the largest amount of tax benefit that is greater than 50% likely of being realized upon ultimate settlement. In addition, previously recognized benefits from tax positions that no longer meet the new criteria would no longer be recognized. Changes in recognition or measurement are reflected in the period in which the change occurs.
Non-controlling interests
Non-controlling interests are comprised of minority holdings in Chicago Concourse Development Group, LLC ("CCDG") and Boingo Holding Participacoes Ltda ("BHPL").
F-17
Boingo Wireless, Inc.
Notes to the Consolidated Financial Statements (Continued)
(In thousands, except shares and per share amounts)
2. Summary of significant accounting policies (Continued)
Under the terms of the LLC agreement for CCDG, we are generally required to distribute annually to the CCDG non-controlling interest holders 30% of allocated net profits less capital expenditures of the preceding year. For the years ended December 31, 2015, 2014 and 2013, we made distributions of $500, $623 and $560, respectively, to non-controlling interest holders of CCDG.
Under the terms of the LLC agreement for BHPL, we attributed profits and losses to the non-controlling interest in BHPL in proportion to their holdings. For the years ended December 31, 2015, 2014 and 2013, we made no distributions to the non-controlling interest holder of BHPL.
Prior to August 4, 2015, we had a 70% ownership of Concourse Communications Detroit, LLC ("CCG Detroit"). On August 4, 2015, we purchased the remaining 30% ownership interest from the non-controlling interest owners for $1,150. We accounted for this transaction as an acquisition of the remaining interest of an entity that had already been majority-owned by the Company. The purchase resulted in a reduction to additional paid-in capital of $1,150 representing excess purchase price over the carrying amount of the non-controlling interests. Under the terms of the limited liability company ("LLC") agreement for CCG Detroit ("Detroit Operating Agreement") profits and losses were allocated to the controlling and non-controlling owners based on specified terms in the Detroit Operating Agreement, which reflected the relative risk and reward of each owner. The profit and loss allocation in the Detroit Operating Agreement specified that the non-controlling owners' allocated profits were limited to the fixed distribution amounts and losses were limited to the non-controlling owners capital account balance with losses in excess of their capital account being fully allocated to the controlling common unit holder. There was no specified term in the Detroit Operating Agreement, but the term of the annual fixed distribution obligation to the non-controlling owner was the same as the term of the venue agreement between CCG Detroit and Detroit Metropolitan Wayne County Airport—which had a seven year initial term with options to extend for an additional four years. We allocated profits and losses in CCG Detroit based on the attribution in the Detroit Operating Agreement. CCG Detroit had generated losses, which reduced the non-controlling owners capital account to zero in 2009 resulting in an allocation to the controlling interest holder all operating losses and deficits created by the annual fixed distributions to the non-controlling interest holder. The fixed distributions were terminated during September 2013 concurrent with the termination of CCG Detroit's agreement with Detroit Metropolitan Wayne County Airport. For the year ended December 31, 2013, we made distribution of $48 to non-controlling interest holders of CCG Detroit.
Net (loss) income per share attributable to common stockholders
Basic net (loss) income per share attributable to common stockholders is calculated by dividing (loss) income attributable to common stockholders by the weighted average number of shares of common stock outstanding during the period. Diluted net income per share attributable to common stockholders adjusts the basic weighted average number of shares of common stock outstanding for the potential dilution that could occur if stock options and RSUs were exercised or converted into common stock. Our common stockholders are not entitled to receive any dividends.
Segment and geographic information
We operate as one reportable segment; a service provider of wireless connectivity solutions across our managed and operated network and aggregated network for mobile devices such as laptops,
F-18
Boingo Wireless, Inc.
Notes to the Consolidated Financial Statements (Continued)
(In thousands, except shares and per share amounts)
2. Summary of significant accounting policies (Continued)
smartphones, tablets and other wireless-enabled consumer devices. This single segment is consistent with the internal organization structure and the manner in which operations are reviewed and managed by our Chief Executive Officer, the chief operating decision maker.
All significant long-lived tangible assets are held in the United States of America. We do not disclose sales by geographic area because to do so would be impracticable. In 2014, we updated our presentation of retail and wholesale revenue sources to provide increased visibility into the revenue streams that are the focus of our current and future operational and development efforts. Our retail revenue sources were previously differentiated based on our retail plan types—subscription or single-use. We believe that it is more relevant to differentiate our individual users based on the nature of the users—retail users who purchase Internet access at our managed and operated hotspots and select partner locations or military users who purchase Internet access or IPTV services for individual use on military bases. We also previously combined our wholesale DAS and Wi-Fi revenues and we believe that it is better to disaggregate these wholesale product revenues going forward by DAS and Wi-Fi given the current development of these products. The revenue sources are consistent with how our chief operating decision maker monitors and reviews our operations.
The following is a summary of our revenue by primary revenue source:
| |
Year Ended December 31, | |||||||||
|---|---|---|---|---|---|---|---|---|---|---|
| |
2015 | 2014 | 2013 | |||||||
Revenue: |
||||||||||
DAS |
$ | 46,455 | $ | 38,259 | $ | 32,681 | ||||
Retail |
31,763 | 40,336 | 43,194 | |||||||
Wholesale—Wi-Fi |
21,923 | 15,209 | 17,261 | |||||||
Military |
19,898 | 4,486 | 1,260 | |||||||
Advertising and other |
19,587 | 21,007 | 12,350 | |||||||
| | | | | | | | | | | |
Total revenue |
$ | 139,626 | $ | 119,297 | $ | 106,746 | ||||
| | | | | | | | | | | |
| | | | | | | | | | | |
| | | | | | | | | | | |
Recent accounting pronouncements
In February 2016, the FASB issued ASU 2016-02, Leases (Topic 842), which requires lessees to recognize assets and liabilities for all leases with lease terms of more than 12 months on the balance sheet. Under the new guidance, the recognition, measurement, and presentation of expenses and cash flows arising from a lease by a lessee will depend on its classification as a finance or operating lease. The standard is effective for interim and annual periods beginning after December 15, 2018. Early adoption is permitted for all entities on a modified retrospective basis, with elective reliefs. We are currently evaluating the expected impact of this new standard.
In November 2015, the FASB issued ASU 2015-17, Balance Sheet Classification of Deferred Taxes, which requires that all deferred tax assets and liabilities, along with any related valuation allowance, for each tax-paying jurisdiction within each tax-paying component be classified as noncurrent on the balance sheet. The standard is effective for interim and annual periods beginning after December 15, 2016. Early adoption is permitted for all entities on a retrospective or prospective basis. We early adopted the new standard on a retrospective basis as of December 31, 2015.
F-19
Boingo Wireless, Inc.
Notes to the Consolidated Financial Statements (Continued)
(In thousands, except shares and per share amounts)
2. Summary of significant accounting policies (Continued)
In September 2015, the FASB issued ASU 2015-16, Simplifying the Accounting for Measurement Period Adjustments, which eliminates the requirement to restate prior period financial statements for measurement period adjustments. The standard is effective for interim and annual periods beginning after December 15, 2015. The new standard must be applied prospectively to measurement period adjustments that occur after the effective date. We do not expect that this standard will have a material impact on our consolidated financial statements.
In April 2015, the FASB issued ASU 2015-05, Customer's Accounting for Fees Paid in a Cloud Computing Arrangement, which provides guidance to customers about whether a cloud computing arrangement includes a software license. If a cloud computing arrangement includes a software license, then the customer should account for the arrangement for the software license element of the arrangement consistent with the acquisition of other software licenses. If a cloud computing arrangement does not include a software license, the customer should account for the arrangement as a service contract. The standard is effective for annual periods beginning after December 15, 2015, and interim periods within those fiscal years. Early adoption is permitted for all entities. An entity may choose to adopt the new standard either retrospectively or prospectively. We do not expect that this standard will have a material impact on our consolidated financial statements.
In April 2015, the FASB issued ASU 2015-03, Simplifying the Presentation of Debt Issuance Costs, which requires entities to present debt issuance costs related to a note as a direct deduction from the face amount of that note, similar to the presentation of debt discounts. The costs will continue to be amortized to interest expense. In August 2015, the FASB issued ASU 2015-15, Interest—Imputation of Interest (Subtopic 835-30), which amends subtopic 835-30 to include that the SEC would not object to the deferral and presentation of debt issuance costs as an asset and subsequent amortization of the asset ratably over the term of the line-of-credit arrangement, regardless of whether there are any outstanding borrowings on the line-of-credit arrangement. The standard will be effective for fiscal years beginning after December 15, 2015, and interim periods within those fiscal years. Early adoption is permitted. An entity must adopt the new standard retrospectively for all prior periods presented in the financial statements. We do not expect that this standard will have a material impact on our consolidated financial statements. As of December 31, 2015 and 2014, we have classified debt issuance costs related to our revolving line of credit of $197 and $178, respectively, within prepaid expenses and other current assets, and $372 and $514, respectively, within other assets in the consolidated balance sheets.
In February 2015, the FASB issued ASU 2015-02, Consolidation—Amendments to the Consolidation Analysis, which amends the current consolidation guidance and ends the deferral granted to investment companies from applying the variable interest entity guidance. The standard will be effective for fiscal years beginning after December 15, 2015. Early adoption is permitted. We do not expect that this standard will have a material impact on our consolidated financial statements.
In August 2014, the FASB issued ASU 2014-15, Disclosure of Uncertainties about an Entity's Ability to Continue as a Going Concern, which explicitly requires management to assess an entity's ability to continue as a going concern in connection with each annual and interim period. Management will assess if there is substantial doubt about an entity's ability to continue as a going concern within one year of the date the financial statements are issued. Disclosures will be required if conditions give rise to substantial doubt. The standard will be effective for the first annual period ending after
F-20
Boingo Wireless, Inc.
Notes to the Consolidated Financial Statements (Continued)
(In thousands, except shares and per share amounts)
2. Summary of significant accounting policies (Continued)
December 15, 2016. Early adoption is permitted. We are currently evaluating the expected impact of this new standard.
In June 2014, the FASB issued ASU 2014-12, Accounting for Share-Based Payments When the Terms of an Award Provide That a Performance Target Could Be Achieved after the Requisite Service Period, which requires that a performance target that affects vesting and that could be achieved after the requisite service period be treated as a performance condition. As such, the performance target should not be reflected in estimating the grant-date fair value of the award. Compensation cost should be recognized in the period in which it becomes probable that the performance target will be achieved and should represent the compensation cost attributable to the period(s) for which the requisite service has already been rendered. If the performance target becomes probable of being achieved before the end of the requisite service period, the remaining unrecognized compensation cost should be recognized prospectively over the remaining requisite service period. The standard will be effective for fiscal years and interim periods within those fiscal years, beginning after December 15, 2015. Early adoption is permitted. An entity may choose to adopt the new standard either prospectively or retrospectively. This standard will not have any impact on our consolidated financial statements as we have not issued any share-based payments with performance targets that could be achieved after the requisite service period.
In May 2014, the FASB issued ASU 2014-09, Revenue From Contracts with Customers, which is intended to improve and converge the financial reporting requirements for revenue from contracts with customers between U.S. GAAP and International Accounting Standards. In accordance with this new standard, an entity would recognize revenue to depict the transfer of promised goods or services. The standard establishes a five-step model and related application guidance, which will replace most existing revenue recognition guidance in U.S. GAAP. The FASB has subsequently issued several proposals to clarify guidance to be applied. In August 2015, the FASB issued ASU 2015-14, Revenue From Contracts with Customers (Topic (606): Deferral of the Effective Date, to defer the effective date of the new revenue standard by one year. The standard will be effective for annual and interim periods in fiscal years beginning after December 15, 2017. The FASB also agreed to allow entities to choose to adopt the standard as of the original effective date. An entity may choose to adopt the new standard either retrospectively or through a cumulative effect adjustment as of the start of the first period for which it applies the new standard. We have not yet selected an effective date or a transition method and are currently evaluating the expected impact of this new standard, including proposed amendments, on our reporting of revenue contracts in our consolidated financial statements and related disclosures.
3. Acquisitions
Electronic Media Systems, Inc. and Advanced Wireless Group, LLC
On October 31, 2013, we acquired all outstanding stock of Electronic Media Systems, Inc. and all membership interests in its subsidiary, Advanced Wireless Group, LLC, not otherwise owned by Electronic Media Systems, Inc. such that we are now the beneficial owner of all membership interests of Advanced Wireless Group, LLC (collectively, "AWG"). AWG operated public Wi-Fi in seventeen U.S. airports including Los Angeles International, Charlotte/Douglas International, Miami International, Minneapolis-St. Paul International, Detroit Metropolitan Airport, and Boston's Logan
F-21
Boingo Wireless, Inc.
Notes to the Consolidated Financial Statements (Continued)
(In thousands, except shares and per share amounts)
3. Acquisitions (Continued)
International. We have included the operating results of AWG in our consolidated financial statements since the date of acquisition.
The acquisition has been accounted for under the acquisition method of accounting in accordance with FASB ASC 805, Business Combinations. As such, the assets acquired and liabilities assumed were recorded at their acquisition-date fair values. The total purchase price was $17,527, which includes cash paid at closing, net equity adjustments, holdback consideration to be paid and the fair value of additional contingent consideration that would be due and payable upon the successful extension of a specified airport Wi-Fi contract. On July 29, 2014, we paid $147 to the previous AWG shareholders as settlement for the net equity adjustments that were not finalized as of the acquisition date.
The fair value of the contingent consideration is based on Level 3 inputs, which are discussed in Note 9. Further changes in the fair value of the contingent consideration are recorded through operating (loss) income. On July 29, 2014, we paid the contingent consideration in the amount of $1,000 to the previous AWG shareholders. We allocated the excess of the purchase price over the fair value of assets acquired and liabilities assumed to goodwill, which is primarily not deductible for tax purposes. The goodwill arising from the AWG acquisition was attributable primarily to expected synergies and other benefits, including the acquired workforce, from combining AWG with us.
The contingent consideration was valued at the date of acquisition using a discount rate of 3.1%. The identifiable intangible assets were primarily valued using the excess earnings, relief from royalty, with-and-without and replacement cost methods using discount rates ranging from 12.0% to 14.0% and royalty rates of 0.5%.
During the year ended December 31, 2014, we finalized our purchase price allocation, which was preliminary as of December 31, 2013 due to estimated net equity adjustments and the filing of AWG's final short period 2013 tax returns, both of which impacted the final purchase price allocation. As these purchase accounting adjustments were finalized during the measurement period, we retrospectively adjusted the provisional amounts recognized at the acquisition date to reflect the new information obtained about facts and circumstances that existed as of the acquisition date that, if known, would have affected the measurement of the amounts recognized as of that date. As a result, goodwill decreased by $28, accrued expenses increased by $147, and accumulated deficit increased by $175 as of December 31, 2013. The increase in accumulated deficit was the result of the valuation allowance that was established by the Company against its deferred tax assets as of December 31, 2013. The final purchase price allocation resulted in a $175 decrease in deferred tax liabilities and goodwill; accordingly, the Company had to increase the valuation allowance for deferred tax assets by $175, resulting in additional deferred tax expense for the year ended December 31, 2013.
F-22
Boingo Wireless, Inc.
Notes to the Consolidated Financial Statements (Continued)
(In thousands, except shares and per share amounts)
3. Acquisitions (Continued)
The amortizable intangible assets were being amortized straight-line over their estimated useful lives. The following summarizes the final purchase price allocation:
| |
Estimated Fair Value |
Weighted Average Estimated Useful Life (years) |
|||||
|---|---|---|---|---|---|---|---|
Consideration: |
|||||||
Cash paid |
$ | 14,800 | |||||
Net equity adjustments |
147 | ||||||
Holdback consideration |
1,600 | ||||||
Contingent consideration |
980 | ||||||
| | | | | | | | |
Total consideration |
$ | 17,527 | |||||
| | | | | | | | |
| | | | | | | | |
| | | | | | | | |
Recognized amounts of identifiable assets acquired and liabilities assumed: |
|||||||
Cash |
$ | 215 | |||||
Restricted cash |
515 | ||||||
Accounts receivable |
988 | ||||||
Other current assets |
609 | ||||||
Property and equipment |
2,297 | ||||||
Accounts payable |
(563 | ) | |||||
Accrued expenses |
(515 | ) | |||||
Other current liabilities |
(134 | ) | |||||
Capital lease obligations |
(932 | ) | |||||
Other non-current liabilities |
(130 | ) | |||||
Deferred tax liabilities |
(3,386 | ) | |||||
| | | | | | | | |
Net tangible liabilities acquired |
(1,036 | ) | |||||
Existing contracts and relationships |
4,700 | 6.7 | |||||
Technology |
270 | 6.0 | |||||
Trademark and tradename |
120 | 3.0 | |||||
Non-compete agreement |
3,590 | 5.0 | |||||
Goodwill |
9,883 | ||||||
| | | | | | | | |
Total purchase price |
$ | 17,527 | |||||
| | | | | | | | |
| | | | | | | | |
| | | | | | | | |
During the year ended December 31, 2015, we paid the holdback consideration in the amount of $1,600 to the previous AWG shareholders.
Endeka Group, Inc.
On February 22, 2013, we acquired all outstanding stock of Endeka Group, Inc. ("Endeka"). Endeka is a provider of commercial wireless broadband and IPTV services at certain military bases, as well as Wi-Fi services to certain federal law enforcement training facilities. We acquired Endeka because Endeka's portfolio of venues and management team are natural additions to our managed
F-23
Boingo Wireless, Inc.
Notes to the Consolidated Financial Statements (Continued)
(In thousands, except shares and per share amounts)
3. Acquisitions (Continued)
network business. We have included the operating results of Endeka in our consolidated financial statements since the date of acquisition.
The acquisition has been accounted for under the acquisition method of accounting in accordance with FASB ASC 805. As such, the assets acquired and liabilities assumed are recorded at their acquisition-date fair values. The total purchase price was $6,498, which includes cash paid at closing, holdback consideration to be paid and the fair value of additional contingent consideration comprised of two components: (i) a payment ("Build Payment") if the amount of the capital expenditures incurred for the substantial completion of a specified build project is less than a target; and (ii) a payment ("Milestone Payment") based on revenue generated by certain contracts in fiscal year 2014. There is no maximum to the contingent consideration payments for the Milestone Payment. We will not make any payments associated with the Build Payment. The Milestone Payment in the amount of $17 was paid in March 2015.
The fair value of the contingent consideration is based on Level 3 inputs. Further changes in the fair value of the contingent consideration were recorded through operating (loss) income. We allocated the excess of the purchase price over the fair value of assets acquired and liabilities assumed to goodwill, which is not deductible for tax purposes. The goodwill arising from our acquisition of Endeka was attributable primarily to expected synergies and other benefits, including the acquired workforce.
The contingent consideration was valued at the date of acquisition using a discounted cash flow method with probability weighted cash flows and a discount rate of 50.5%. The identifiable intangible assets were primarily valued using the excess earnings, relief from royalty, and replacement cost methods using discount rates ranging from 40.0% to 50.0% and royalty rates ranging from 0.5% to 1.5%, where applicable.
F-24
Boingo Wireless, Inc.
Notes to the Consolidated Financial Statements (Continued)
(In thousands, except shares and per share amounts)
3. Acquisitions (Continued)
The amortizable intangible assets were being amortized straight-line over their estimated useful lives. The following summarizes the final purchase price allocation:
| |
Estimated Fair Value |
Estimated Useful Life (years) |
|||||
|---|---|---|---|---|---|---|---|
Consideration: |
|||||||
Cash paid |
$ | 4,894 | |||||
Holdback consideration |
275 | ||||||
Contingent consideration |
1,329 | ||||||
| | | | | | | | |
Total consideration |
$ | 6,498 | |||||
| | | | | | | | |
| | | | | | | | |
| | | | | | | | |
Recognized amounts of identifiable assets acquired and liabilities assumed: |
|||||||
Cash |
$ | 20 | |||||
Other current assets |
44 | ||||||
Property and equipment |
4,617 | ||||||
Other assets |
12 | ||||||
Accounts payable |
(992 | ) | |||||
Other current liabilities |
(211 | ) | |||||
Notes payable and financed liabilities |
(6,476 | ) | |||||
Deferred tax liabilities |
(2,637 | ) | |||||
| | | | | | | | |
Net tangible liabilities acquired |
(5,623 | ) | |||||
Existing contracts and relationships |
4,770 | 10.0 | |||||
Technology |
930 | 6.0 | |||||
Trademark and tradename |
300 | 10.0 | |||||
Non-compete agreement |
250 | 2.0 | |||||
Other intangibles |
95 | 10.0 | |||||
Goodwill |
5,776 | ||||||
| | | | | | | | |
Total purchase price |
$ | 6,498 | |||||
| | | | | | | | |
| | | | | | | | |
| | | | | | | | |
During the year ended December 31, 2014, we paid the holdback consideration in the amount of $275 to the previous Endeka shareholders.
Pro forma results (Unaudited)
The following table presents the unaudited pro forma results of the Company for the year ended December 31, 2013 as if the acquisitions of Endeka and AWG had occurred during the year ended December 31, 2012. These results were not intended to reflect the actual operations of the Company had the acquisition occurred during the year ended December 31, 2012. We did not record any incremental income taxes for pro forma net loss because we established a valuation allowance in 2013.
Revenue |
$ | 114,492 | ||
Net loss |
$ | (4,945 | ) |
F-25
Boingo Wireless, Inc.
Notes to the Consolidated Financial Statements (Continued)
(In thousands, except shares and per share amounts)
4. Cash and cash equivalents and marketable securities
Cash and cash equivalents, and marketable securities consisted of the following:
| |
December 31, | ||||||
|---|---|---|---|---|---|---|---|
| |
2015 | 2014 | |||||
Cash and cash equivalents: |
|||||||
Cash |
$ | 12,488 | $ | 3,247 | |||
Money market accounts |
2,230 | 5,602 | |||||
| | | | | | | | |
Total cash and cash equivalents |
$ | 14,718 | $ | 8,849 | |||
| | | | | | | | |
| | | | | | | | |
| | | | | | | | |
Short-term marketable securities: |
|||||||
Marketable securities |
$ | — | $ | 1,614 | |||
| | | | | | | | |
Total short-term marketable securities |
$ | — | $ | 1,614 | |||
| | | | | | | | |
| | | | | | | | |
| | | | | | | | |
All contractual maturities of marketable securities were less than one year at December 31, 2014. These consist primarily of corporate securities which include commercial paper and corporate debt instruments including notes issued by foreign or domestic corporations which pay in U.S. dollars and carry a rating of A or better.
For the years ended December 31, 2015, 2014 and 2013, interest income was $66, $114 and $181, respectively, which is included in interest and other (expense) income, net in the accompanying consolidated statements of operations.
5. Accounts receivables, net and other receivables
Accounts receivable, net of allowances for doubtful accounts and other receivables consisted of the following:
| |
December 31, | ||||||
|---|---|---|---|---|---|---|---|
| |
2015 | 2014 | |||||
Trade receivables, net of allowances |
$ | 41,736 | $ | 25,562 | |||
Unbilled access fees |
1,654 | 2,142 | |||||
Unbilled platform service arrangements |
162 | 213 | |||||
| | | | | | | | |
Accounts receivable, net |
$ | 43,552 | $ | 27,917 | |||
| | | | | | | | |
| | | | | | | | |
| | | | | | | | |
Unbilled access fees |
$ | 360 | $ | 115 | |||
Unbilled platform service arrangements |
3,472 | — | |||||
| | | | | | | | |
Non-current other receivables |
$ | 3,832 | $ | 115 | |||
| | | | | | | | |
| | | | | | | | |
| | | | | | | | |
Access fees are recorded under long-term contracts with our wholesale partners that are telecom operators for access to our DAS at our managed and operated locations. Platform service fees are recorded under long-term contracts with our wholesale partners. These access and platform service fees escalate on an annual basis from which we receive fixed contractual payments and recognize revenue ratably over the term of the contracts.
F-26
Boingo Wireless, Inc.
Notes to the Consolidated Financial Statements (Continued)
(In thousands, except shares and per share amounts)
5. Accounts receivables, net and other receivables (Continued)
Included in accounts receivables, net for the periods indicated was the allowance for doubtful accounts, which consisted of the following:
| |
Allowance for Doubtful Accounts |
|||
|---|---|---|---|---|
Balance, December 31, 2012 |
$ | 179 | ||
Additions charged to operations |
209 | |||
Deductions from reserves, net |
(43 | ) | ||
| | | | | |
Balance, December 31, 2013 |
345 | |||
Additions charged to operations |
191 | |||
Deductions from reserves, net |
(142 | ) | ||
| | | | | |
Balance, December 31, 2014 |
394 | |||
Additions charged to operations |
304 | |||
Deductions from reserves, net |
(93 | ) | ||
| | | | | |
Balance, December 31, 2015 |
$ | 605 | ||
| | | | | |
| | | | | |
| | | | | |
6. Accrued expenses and other liabilities
Accrued expenses and other liabilities consisted of the following:
| |
December 31, | ||||||
|---|---|---|---|---|---|---|---|
| |
2015 | 2014 | |||||
Salaries and wages |
$ | 3,074 | $ | 2,389 | |||
Revenue share |
4,560 | 5,683 | |||||
Accrued partner network |
969 | 1,105 | |||||
Accrued for construction in progress |
21,696 | 9,438 | |||||
Settlement liabilities |
— | 1,850 | |||||
Accrued professional fees |
651 | 1,241 | |||||
Accrued taxes |
916 | 327 | |||||
Deferred rent |
22 | 18 | |||||
Holdback liabilities |
— | 1,615 | |||||
Contingent consideration |
— | 131 | |||||
Other |
4,440 | 2,312 | |||||
| | | | | | | | |
Total accrued expenses and other liabilities |
$ | 36,328 | $ | 26,109 | |||
| | | | | | | | |
| | | | | | | | |
| | | | | | | | |
F-27
Boingo Wireless, Inc.
Notes to the Consolidated Financial Statements (Continued)
(In thousands, except shares and per share amounts)
7. Property and equipment
The following is a summary of property and equipment, at cost less accumulated depreciation and amortization:
| |
December 31, | ||||||
|---|---|---|---|---|---|---|---|
| |
2015 | 2014 | |||||
Leasehold improvements |
$ | 243,743 | $ | 152,627 | |||
Construction in progress |
57,692 | 20,104 | |||||
Software |
24,349 | 17,827 | |||||
Computer equipment |
10,366 | 7,909 | |||||
Furniture, fixtures and office equipment |
1,738 | 297 | |||||
| | | | | | | | |
Total property and equipment |
337,888 | 198,764 | |||||
Less: accumulated depreciation and amortization |
(123,388 | ) | (86,992 | ) | |||
| | | | | | | | |
Total property and equipment, net |
$ | 214,500 | $ | 111,772 | |||
| | | | | | | | |
| | | | | | | | |
| | | | | | | | |
Included in property and equipment at December 31, 2015 and 2014 was equipment acquired under capital leases totaling $5,080 and $1,209, respectively, and related accumulated depreciation and amortization of $932 and $300, respectively.
Depreciation and amortization expense, which includes depreciation and amortization for property and equipment under capital leases, is allocated as follows on the accompanying consolidated statements of operations:
| |
For the Years Ended December 31, |
|||||||||
|---|---|---|---|---|---|---|---|---|---|---|
| |
2015 | 2014 | 2013 | |||||||
Network access |
$ | 22,666 | $ | 18,074 | $ | 12,651 | ||||
Network operations |
9,058 | 5,662 | 4,091 | |||||||
Development and technology |
5,441 | 3,381 | 1,992 | |||||||
General and administrative |
1,128 | 329 | 206 | |||||||
| | | | | | | | | | | |
Total depreciation and amortization of property and equipment |
$ | 38,293 | $ | 27,446 | $ | 18,940 | ||||
| | | | | | | | | | | |
| | | | | | | | | | | |
| | | | | | | | | | | |
During the year ended December 31, 2015, the company recognized $215 of impairment losses primarily related to build-out projects that were abandoned.
During the year ended December 31, 2014, the Company recognized $406 of impairment losses related to a change in the use of certain software developed for internal use that indicated that the carrying value of those assets will not be recoverable, and $494 of net impairment losses related to a venue termination agreement that resulted in the abandonment of our Wi-Fi network assets and the release of the corresponding capital lease obligations associated with those assets. The impairment charges for internal use software and abandoned Wi-Fi network assets are included within development and technology expenses and general and administrative expenses, respectively, in the accompanying consolidated statements of operations.
F-28
Boingo Wireless, Inc.
Notes to the Consolidated Financial Statements (Continued)
(In thousands, except shares and per share amounts)
8. Intangible assets
The following table sets forth the changes in our intangible assets balance, for all periods presented:
| |
Intangible Assets |
|||
|---|---|---|---|---|
Balance, December 31, 2013 |
$ | 23,413 | ||
Amortization expense |
(3,682 | ) | ||
Impairment loss |
(55 | ) | ||
| | | | | |
Balance, December 31, 2014 |
19,676 | |||
Amortization expense |
(3,594 | ) | ||
Impairment loss |
(27 | ) | ||
| | | | | |
Balance, December 31, 2015 |
$ | 16,055 | ||
| | | | | |
| | | | | |
| | | | | |
During 2015, we recorded impairment losses for the termination of a contract and certain patent applications that we abandoned. During 2014, we recorded impairment losses for certain patent applications that we abandoned.
Intangible assets at December 31, 2015 consist of the following:
| |
Historical Cost |
Accumulated Amortization |
Net | |||||||
|---|---|---|---|---|---|---|---|---|---|---|
Venue contracts |
$ | 23,630 | $ | (11,104 | ) | $ | 12,526 | |||
Non-compete agreements |
3,590 | (1,556 | ) | 2,034 | ||||||
Technology |
2,310 | (1,295 | ) | 1,015 | ||||||
Advertiser relationships |
70 | (48 | ) | 22 | ||||||
Patents, trademarks and other |
1,034 | (576 | ) | 458 | ||||||
| | | | | | | | | | | |
|
$ | 30,634 | $ | (14,579 | ) | $ | 16,055 | |||
| | | | | | | | | | | |
| | | | | | | | | | | |
| | | | | | | | | | | |
Intangible assets at December 31, 2014 consist of the following:
| |
Historical Cost |
Accumulated Amortization |
Net | |||||||
|---|---|---|---|---|---|---|---|---|---|---|
Venue contracts |
$ | 36,356 | $ | (21,582 | ) | $ | 14,774 | |||
Non-compete agreements |
3,840 | (1,067 | ) | 2,773 | ||||||
Technology |
2,300 | (863 | ) | 1,437 | ||||||
Advertiser relationships |
70 | (34 | ) | 36 | ||||||
Patents, trademarks and other |
1,353 | (697 | ) | 656 | ||||||
| | | | | | | | | | | |
|
$ | 43,919 | $ | (24,243 | ) | $ | 19,676 | |||
| | | | | | | | | | | |
| | | | | | | | | | | |
| | | | | | | | | | | |
The decrease in our intangible assets cost and accumulated amortization balances from 2014 to 2015 related to the write-off of intangible assets that were impaired as well as intangible assets that have expired.
F-29
Boingo Wireless, Inc.
Notes to the Consolidated Financial Statements (Continued)
(In thousands, except shares and per share amounts)
8. Intangible assets (Continued)
Amortization expense for fiscal years 2016 through 2020 and thereafter is as follows:
Year
|
Amortization Expense |
|||
|---|---|---|---|---|
2016 |
$ | 3,451 | ||
2017 |
3,221 | |||
2018 |
2,372 | |||
2019 |
1,634 | |||
2020 |
1,556 | |||
Thereafter |
3,821 | |||
| | | | | |
|
$ | 16,055 | ||
| | | | | |
| | | | | |
| | | | | |
9. Fair value measurement
The following table sets forth our financial assets that are measured at fair value on a recurring basis:
At December 31, 2015
|
Level 1 | Level 2 | Level 3 | Total | |||||||||
|---|---|---|---|---|---|---|---|---|---|---|---|---|---|
Assets: |
|||||||||||||
Money market accounts |
$ | 2,230 | $ | — | $ | — | $ | 2,230 | |||||
| | | | | | | | | | | | | | |
Total assets |
$ | 2,230 | $ | — | $ | — | $ | 2,230 | |||||
| | | | | | | | | | | | | | |
| | | | | | | | | | | | | | |
| | | | | | | | | | | | | | |
At December 31, 2014
|
Level 1 | Level 2 | Level 3 | Total | |||||||||
|---|---|---|---|---|---|---|---|---|---|---|---|---|---|
Assets: |
|||||||||||||
Money market accounts |
$ | 5,602 | $ | — | $ | — | $ | 5,602 | |||||
Marketable securities |
— | 1,614 | — | 1,614 | |||||||||
| | | | | | | | | | | | | | |
Total assets |
$ | 5,602 | $ | 1,614 | $ | — | $ | 7,216 | |||||
| | | | | | | | | | | | | | |
| | | | | | | | | | | | | | |
| | | | | | | | | | | | | | |
Liabilities: |
|||||||||||||
Contingent consideration |
$ | — | $ | — | $ | 131 | $ | 131 | |||||
| | | | | | | | | | | | | | |
Total liabilities |
$ | — | $ | — | $ | 131 | $ | 131 | |||||
| | | | | | | | | | | | | | |
| | | | | | | | | | | | | | |
| | | | | | | | | | | | | | |
Our marketable securities utilize Level 2 inputs and consist primarily of corporate securities which include commercial paper and corporate debt instruments including notes issued by foreign or domestic corporations which pay in U.S. dollars and carry a rating of A or better. We have evaluated the various types of securities in our investment portfolio to determine an appropriate fair value hierarchy level based upon trading activity and the observability of market inputs. Due to variations in trading volumes and the lack of quoted market prices in active markets, our fixed maturities are classified as Level 2 securities. The fair value of our fixed maturity marketable securities is derived through the use of a third party pricing source using recent reported trades for identical or similar securities, making adjustments through the reporting date based upon available market observable data.
F-30
Boingo Wireless, Inc.
Notes to the Consolidated Financial Statements (Continued)
(In thousands, except shares and per share amounts)
9. Fair value measurement (Continued)
The Company used the income approach to value the contingent consideration. The contingent consideration used a discounted cash flow method with probability weighted cash flows for Endeka. The following table presents a reconciliation of the beginning and ending amounts related to the fair value of contingent consideration categorized as Level 3:
Beginning balance, January 1, 2014 |
$ | 1,942 | ||
Payment of contingent consideration |
(1,000 | ) | ||
Change in fair value |
(811 | ) | ||
| | | | | |
Balance, December 31, 2014 |
131 | |||
Payment of contingent consideration |
(17 | ) | ||
Change in fair value |
(114 | ) | ||
| | | | | |
Balance, December 31, 2015 |
$ | — | ||
| | | | | |
| | | | | |
| | | | | |
10. Stockholders' equity
At December 31, 2015 and 2014, we are authorized to issue up to 100,000,000 shares of common stock. We are required to reserve and keep available out of our authorized but unissued shares of common stock such number of shares sufficient to effect the exercise of all outstanding common stock warrants, plus shares granted and available for grant under our Amended and Restated 2001 Stock Incentive Plan (the "2001 Plan") and 2011 Equity Incentive Plan (the "2011 Plan").
The amount of such shares of common stock reserved for these purposes is as follows:
| |
December 31, 2015 |
December 31, 2014 |
|||||
|---|---|---|---|---|---|---|---|
| |
(in thousands) |
||||||
Outstanding stock options under the 2001 Plan |
1,220 | 1,525 | |||||
Outstanding stock options under the 2011 Plan |
2,528 | 2,816 | |||||
Outstanding RSUs under the 2011 Plan |
1,819 | 1,385 | |||||
Shares available for grant under the 2011 Plan |
5,978 | 4,492 | |||||
| | | | | | | | |
Total |
11,545 | 10,218 | |||||
| | | | | | | | |
| | | | | | | | |
| | | | | | | | |
11. Credit Facility
On November 21, 2014, we entered into a Credit Agreement (the "Credit Agreement") and related agreements with Bank of America, N.A. acting as agent for lenders named therein, including Bank of America, N.A. and Silicon Valley Bank (the "Lenders"), for a secured credit facility in the form of a revolving line of credit in the initial amount of up to $46,500, with an option to increase the available amount to $86,500 upon the satisfaction of certain conditions (the "Revolving Line of Credit") and a term loan of $3,500 (the "Term Loan" and together with the Revolving Line of Credit, the "Credit Facility"). We may use borrowings under the Credit Facility for general working capital and corporate purposes. In general, amounts borrowed under the Credit Facility are secured by a lien against all of our assets, with certain exclusions.
F-31
Boingo Wireless, Inc.
Notes to the Consolidated Financial Statements (Continued)
(In thousands, except shares and per share amounts)
11. Credit Facility (Continued)
As of December 31, 2015 and 2014, $15,000 and $0, respectively, was outstanding under the Revolving Line of Credit. Amounts outstanding under the Revolving Line of Credit are classified within long-term debt in our consolidated balance sheet as of December 31, 2015 as we do not expect to repay the outstanding debt in the next twelve-month period. The Revolving Line of Credit requires quarterly payments of interest and matures on November 21, 2018, but may be prepaid in whole or part at any time. Amounts borrowed under the Revolving Line of Credit and Term Loan will bear, at the Company's election, a variable interest at LIBOR plus 2.5% - 3.5% or Lender's Prime Rate plus 1.5% - 2.5% per year and we will pay a fee of 0.375% - 0.5% per year on any unused portion of the Revolving Line of Credit. As of December 31, 2015, $2,625 was outstanding under the Term Loan at a rate of 3.3%. The Term Loan requires quarterly payments of interest and principal, amortizing fully over the four-year-term such that it is repaid in full on the maturity date of November 21, 2018, but may be prepaid in whole or part at any time. Repayment of amounts borrowed under the Credit Facility may be accelerated in the event that we are in violation of the representations, warranties and covenants made in the Credit Agreement, including certain financial covenants set forth therein, and under other specified default events including, but not limited to, non-payment or inability to pay debt, breach of cross default provisions, insolvency provisions, and change of control.
Principal payments due under our Term Loan for fiscal years 2016 through 2018 is as follows:
Year
|
Principal Payments |
|||
|---|---|---|---|---|
2016 |
$ | 875 | ||
2017 |
875 | |||
2018 |
875 | |||
| | | | | |
|
$ | 2,625 | ||
| | | | | |
| | | | | |
| | | | | |
The Company is subject to customary financial and non-financial covenants, including a minimum quarterly consolidated leverage ratio, a maximum quarterly consolidated fixed charge coverage ratio, and monthly liquidity minimums. The Company was in compliance with all financial covenants as of December 31, 2015.
The Company incurred debt issuance costs of $711 in November 2014 and an additional $62 in August 2015. Debt issuance costs are amortized on a straight-line basis over the term of the Credit Facility. Amortization expense related to debt issuance costs are included in interest and other (expense) income in the accompanying consolidated statements of operations for the years ended December 31, 2015 and 2014. Amortization and interest expense capitalized amounted to $648 for the year ended December 31, 2015. Amortization and interest expense recorded amounted to $34 for the year ended December 31, 2014. Interest rates for our Credit Facility for the year ended December 31, 2015 ranged from 2.67% to 3.33%.
F-32
Boingo Wireless, Inc.
Notes to the Consolidated Financial Statements (Continued)
(In thousands, except shares and per share amounts)
11. Credit Facility (Continued)
Amortization expense for our debt issuance costs for fiscal years 2016 through 2018 is as follows:
Year
|
Amortization Expense |
|||
|---|---|---|---|---|
2016 |
$ | 197 | ||
2017 |
197 | |||
2018 |
174 | |||
| | | | | |
|
$ | 568 | ||
| | | | | |
| | | | | |
| | | | | |
As of December 31, 2015 and 2014, the carrying amount reflected in the accompanying consolidated balance sheets for the current portion of long-term debt and long-term debt approximates fair value (Level 2) based on the variable nature of the interest rates and lack of significant change in our credit risk.
12. Income taxes
The income tax expense (benefit) by jurisdiction consists of the following for the years ended December 31:
| |
2015 | 2014 | 2013 | |||||||
|---|---|---|---|---|---|---|---|---|---|---|
U.S. federal: |
||||||||||
Current |
$ | 27 | $ | 6 | $ | (402 | ) | |||
Deferred |
319 | 328 | 1,158 | |||||||
| | | | | | | | | | | |
Total U.S. federal |
$ | 346 | $ | 334 | $ | 756 | ||||
| | | | | | | | | | | |
| | | | | | | | | | | |
| | | | | | | | | | | |
U.S. state and local: |
||||||||||
Current |
$ | 134 | $ | 226 | $ | 248 | ||||
Deferred |
1 | 140 | 457 | |||||||
| | | | | | | | | | | |
Total U.S. state and local |
$ | 135 | $ | 366 | $ | 705 | ||||
| | | | | | | | | | | |
| | | | | | | | | | | |
| | | | | | | | | | | |
F-33
Boingo Wireless, Inc.
Notes to the Consolidated Financial Statements (Continued)
(In thousands, except shares and per share amounts)
12. Income taxes (Continued)
Income taxes differ from the amounts computed by applying the U.S. federal income tax rate to pretax income before income taxes as a result of the following for the years ended December 31:
| |
2015 | 2014 | 2013 | |||||||
|---|---|---|---|---|---|---|---|---|---|---|
Federal statutory rate |
34.0 | % | 34.0 | % | 34.0 | % | ||||
State and local |
4.1 | 4.6 | (5.7 | ) | ||||||
Foreign rate differential |
(0.5 | ) | (0.7 | ) | (3.2 | ) | ||||
Stock options |
(1.5 | ) | (0.5 | ) | (0.7 | ) | ||||
Non-controlling interests |
0.5 | 1.9 | 15.2 | |||||||
Valuation allowance |
(39.0 | ) | (45.1 | ) | (128.5 | ) | ||||
Transaction costs |
— | — | (6.7 | ) | ||||||
Purchase price adjustments |
— | — | 6.6 | |||||||
Revaluation of deferred tax assets |
— | — | 2.8 | |||||||
Uncertain tax positions |
(0.1 | ) | (0.1 | ) | (2.9 | ) | ||||
Return to provision |
— | 0.6 | 9.3 | |||||||
Other |
0.3 | 1.4 | 1.1 | |||||||
| | | | | | | | | | | |
Income taxes |
(2.2 | )% | (3.9 | )% | (78.7 | )% | ||||
| | | | | | | | | | | |
| | | | | | | | | | | |
| | | | | | | | | | | |
We have a foreign subsidiary in the United Kingdom, which has generated losses since inception resulting in a $1,528 deferred tax asset with a corresponding valuation allowance as of December 31, 2015. We also have a majority owned foreign subsidiary in Brazil, which has generated losses since inception resulting in a $476 deferred tax assets with a corresponding valuation allowance as of December 31, 2015. Foreign loss before income taxes was $1,381, $1,251, and $559 for 2015, 2014, and 2013, respectively.
F-34
Boingo Wireless, Inc.
Notes to the Consolidated Financial Statements (Continued)
(In thousands, except shares and per share amounts)
12. Income taxes (Continued)
Deferred income tax reflects the tax effects of temporary differences that gave rise to significant portions of our deferred tax assets and liabilities and consisted of the following for the years ended December 31, 2015 and 2014, respectively:
| |
2015 | 2014 | |||||
|---|---|---|---|---|---|---|---|
Deferred tax assets: |
|||||||
Net operating loss carryforwards |
$ | 16,895 | $ | 10,115 | |||
Outside basis differences for U.S. partnerships |
6,190 | 3,710 | |||||
Stock options |
3,882 | 3,348 | |||||
Deferred revenue |
376 | 648 | |||||
Deferred compensation |
301 | 144 | |||||
State taxes |
67 | 45 | |||||
Other |
1,312 | 1,341 | |||||
Valuation allowance |
(19,548 | ) | (12,470 | ) | |||
| | | | | | | | |
Net deferred tax assets |
9,475 | 6,881 | |||||
Deferred tax liabilities: |
|||||||
Intangible assets |
(6,268 | ) | (6,855 | ) | |||
Property and equipment |
(6,172 | ) | (2,671 | ) | |||
| | | | | | | | |
Net deferred tax liabilities |
(12,440 | ) | (9,526 | ) | |||
| | | | | | | | |
Net deferred taxes |
$ | (2,965 | ) | $ | (2,645 | ) | |
| | | | | | | | |
| | | | | | | | |
| | | | | | | | |
In assessing the realizability of deferred tax assets, we consider whether it is more likely than not that some portion or all of the deferred tax assets will not be realized. As of December 31, 2015 and 2014, we had federal net operating loss carryforwards of approximately $55,278 and $35,555, respectively, state net operating loss carryforwards of approximately $68,614 and $55,457, respectively, and foreign net operating loss carryforwards of $9,042 and $7,661, respectively. The federal net operating loss carryforwards will begin to expire in 2025, and our foreign net operating loss carryforwards have an indefinite life. Our state net operating loss carryforwards are principally related to California net operating losses and will begin to expire in 2016. Our ability to utilize certain of our net operating loss carryforwards may be limited in the event that a change in ownership, as defined in the Internal Revenue Code, occurs in the future.
F-35
Boingo Wireless, Inc.
Notes to the Consolidated Financial Statements (Continued)
(In thousands, except shares and per share amounts)
12. Income taxes (Continued)
The following table sets forth the changes in the valuation allowance, for all periods presented:
| |
Valuation Allowance |
|||
|---|---|---|---|---|
Balance, December 31, 2012 |
$ | 1,669 | ||
Additions charged to operations |
2,432 | |||
Decrease credited to operations |
— | |||
| | | | | |
Balance, December 31, 2013 |
4,101 | |||
Additions charged to operations |
8,369 | |||
Decrease credited to operations |
— | |||
| | | | | |
Balance, December 31, 2014 |
12,470 | |||
Additions charged to operations |
7,078 | |||
Decrease credited to operations |
— | |||
| | | | | |
Balance, December 31, 2015 |
$ | 19,548 | ||
| | | | | |
| | | | | |
| | | | | |
During the year ended December 31, 2013, we recorded a $2,432 increase in our valuation allowance on our federal deferred tax assets, primarily due to changes in our expectations regarding our ability to realize these deferred tax assets. This resulted from a determination that it was more likely than not that certain federal net deferred tax assets would not be realized. We won some significant new contracts for the build out of broadband and IPTV networks for troops stationed on military bases that require us to make investments and incur losses in advance of experiencing any direct benefit from them including generation of revenues.
In reaching the determination of the valuation allowance, we have evaluated all significant available positive and negative evidence including, but not limited to, our three year cumulative results, trends in our business, expected future results and the character, amount and expiration periods of our net deferred tax assets. The underlying assumptions we used in forecasting future income required significant judgment and took into account our recent performance.
During 2013 we realized excess windfall tax benefits of approximately $55 from stock option exercises. These benefits decreased income taxes payable and were recorded as an increase to additional paid-in capital in the accompanying consolidated balance sheets. In accordance with the reporting requirements under ASC 718, we did not include excess windfall tax benefits resulting from stock option exercises as components of our gross deferred tax assets and corresponding valuation allowance disclosures, as tax attributes related to those windfall tax benefits should not be recognized until they result in a reduction of taxes payable. The tax effected amount of gross unrealized net operating loss carryforwards excluded under ASC 718 was approximately $6,933 at December 31, 2015. When realized, those excess windfall tax benefits are credited to additional paid-in capital.
We recognized interest and penalties related to income tax matters in income taxes which were not material during the years ended December 31, 2015, 2014, and 2013.
We identify, evaluate and measure all uncertain tax positions taken or to be taken on tax returns and record liabilities for the amount of these positions that may not be sustained, or may only partially be sustained, upon examination by the relevant taxing authorities. Although we believe that our
F-36
Boingo Wireless, Inc.
Notes to the Consolidated Financial Statements (Continued)
(In thousands, except shares and per share amounts)
12. Income taxes (Continued)
estimates and judgments were reasonable, actual results may differ from these estimates. Some or all of these judgments are subject to review by the taxing authorities. As of December 31, 2015 and 2014, we had $363 and $459 in uncertain tax positions, respectively, $84 and $106, respectively, of which is a reduction to deferred tax assets, which is presented net of uncertain tax positions, in the accompanying consolidated balance sheets. We accrue interest and penalties related to unrecognized tax benefits as a component of income taxes. As of December 31, 2015 and 2014, we have accrued $50 and $67 for related interest, net of federal income tax benefits, and penalties recorded in income tax expense on our consolidated statements of operations, respectively. The amount of unrecognized tax benefits that, if recognized, would affect the effective tax rate at December 31, 2015 was $229.
A reconciliation of our unrecognized tax benefits, excluding interest and penalties, is as follows:
| |
Uncertain Tax Positions |
|||
|---|---|---|---|---|
Balance, December 31, 2013 |
$ | 392 | ||
Additions for current period tax positions |
— | |||
| | | | | |
Balance, December 31, 2014 |
392 | |||
Additions for current period tax positions |
— | |||
Effective settlement during the current period |
(79 | ) | ||
| | | | | |
Balance, December 31, 2015 |
$ | 313 | ||
| | | | | |
| | | | | |
| | | | | |
Our annual income taxes and the determination of the resulting deferred tax assets and liabilities involve a significant amount of judgment. Our judgments, assumptions and estimates relative to current income taxes take into account current tax laws, their interpretation of current tax laws and possible outcomes of current and future audits conducted by foreign and domestic tax authorities. We operate within federal, state and international taxing jurisdictions and are subject to audit in these jurisdictions. These audits can involve complex issues which may require an extended period of time to resolve. We are subject to taxation in the United States and in various states. Our tax years 2012 and forward are subject to examination by the IRS and our tax years 2011 and forward are subject to examination by material state jurisdictions. However, due to prior year loss carryovers, the IRS and state tax authorities may examine any tax years for which the carryovers are used to offset future taxable income.
13. Commitments and contingencies
Capital and operating leases
We lease space in managed and operated locations, primarily airports, under exclusive long-term, non-cancellable contracts to provide Wi-Fi connectivity and cellular phone access to our DAS network. Our leases generally contain initial terms that range up to twenty years. The agreements generally contain renewal clauses and may include escalation clauses. Minimum rent expense is recorded on a straight-line basis over the term of the lease. Rent expense related to our leases for the years ended December 31, 2015, 2014 and 2013 was $25,099, $29,434 and $20,234, respectively.
F-37
Boingo Wireless, Inc.
Notes to the Consolidated Financial Statements (Continued)
(In thousands, except shares and per share amounts)
13. Commitments and contingencies (Continued)
We lease equipment, primarily data communication equipment and database software under non-cancellable capital leases that will expire over the next three years. The leases are collateralized by the equipment under the lease. Interest expense associated with the capital leases for the years ended December 31, 2015, 2014 and 2013 was $58, $33 and $15, respectively. We also lease office space under non-cancellable operating leases and our long-term office leases may include escalation clauses, rent holidays, and/or leasehold improvement incentives. Rent expense for our leases of office facilities, which is recorded on a straight-line basis over the term of the lease, for the years ended December 31, 2015, 2014 and 2013 was $2,995, $1,621 and $1,227, respectively. Included in rent expense for the years ended December 31, 2015, 2014 and 2013 was sublease income of $13, $27 and $54, respectively.
Future minimum lease obligations under non-cancellable operating and capital leases at December 31, 2015 are as follows:
Years ended December 31,
|
Capital Leases |
Operating Leases and Venue Guarantees |
|||||
|---|---|---|---|---|---|---|---|
2016 |
$ | 1,610 | $ | 11,536 | |||
2017 |
1,686 | 10,431 | |||||
2018 |
554 | 9,567 | |||||
2019 |
— | 7,273 | |||||
2020 |
— | 6,961 | |||||
Thereafter |
— | 29,777 | |||||
| | | | | | | | |
Minimum lease payments |
3,850 | $ | 75,545 | ||||
| | | | | | | | |
| | | | | | | | |
| | | | | | | | |
Less: Amounts representing interest ranging from 2.4% to 7.7% |
(23 | ) | |||||
| | | | | | | | |
Minimum lease payments |
$ | 3,827 | |||||
| | | | | | | | |
| | | | | | | | |
| | | | | | | | |
Current portion |
$ | 1,610 | |||||
| | | | | | | | |
| | | | | | | | |
| | | | | | | | |
Non-current portion |
$ | 2,217 | |||||
| | | | | | | | |
| | | | | | | | |
| | | | | | | | |
Letters of credit
We have entered into Letter of Credit Authorization agreements (collectively, "Letters of Credit"), which are issued under our Credit Agreement. The Letters of Credit are irrevocable and serve as performance guarantees that will allow our customers to draw upon the available funds if we are in default. As of December 31, 2015, we have Letters of Credit totaling $3,643 that are scheduled to expire over the next eleven-month period. There have been no drafts drawn under these Letters of Credit as of December 31, 2015.
Legal proceedings
From time to time, we may be subject to claims, suits, investigations and proceedings arising out of the normal course of business. We are not currently a party to any litigation that we believe could have a material adverse effect on our business, financial position, results of operations or cash flows. Legal costs are expensed as incurred.
F-38
Boingo Wireless, Inc.
Notes to the Consolidated Financial Statements (Continued)
(In thousands, except shares and per share amounts)
13. Commitments and contingencies (Continued)
Indemnification
Indemnification provisions in our third-party service provider agreements provide that we will indemnify, hold harmless, and reimburse the indemnified parties on a case-by-case basis for losses suffered or incurred by the indemnified parties in connection with any claim by any third party as a result of our website, advertising, marketing, payment processing, collection or customer service activities. The maximum potential amount of future payments we could be required to make under these indemnification provisions is undeterminable. We have never paid a claim, nor have we been sued in connection with these indemnification provisions. At December 31, 2015 and 2014, we have not accrued a liability for these guarantees, because the likelihood of incurring a payment obligation in connection with these guarantees is not probable.
Employment contracts
As of December 31, 2015, we have entered into employment contracts with nine of our officers. These contracts generally provide for severance benefits, including salary continuation, if employment is terminated by us without cause or by the officer for good reason. In addition, in order to assure that they would continue to provide independent leadership consistent with our best interests in the event of an actual or threatened change in control, the contract also generally provides for certain protections in the event of such a change in control. These protections include the payment of certain severance benefits, including salary continuation, upon the termination of employment following a change in control.
Other matters
We have received a claim from one of our venue partners with respect to contractual terms on our revenue share payments. The claim asserts that we have underpaid revenue share payments and related interest by approximately $4,600. We believe this claim to be without merit and plan to defend against such claim. As of December 31, 2015, we have accrued for the probable and estimable losses that have been incurred. We are not currently a party to any other claims that we believe could have a material adverse effect on our business, financial position, results of operations or cash flows.
14. Stock repurchases
On April 1, 2013, the Company approved a stock repurchase program to repurchase up to $10,000 of the Company's common stock in the open market, exclusive of any commissions, markups or expenses. The stock repurchased will be retired and will resume the status of authorized but unissued shares of common stock. The Company did not repurchase any of our common stock during the year ended December 31, 2014 and 2015. During the year ended December 31, 2013, we repurchased and retired approximately 722,000 shares under this program for approximately $4,820, excluding commissions paid, at an average price per share of $6.68. As of December 31, 2015, the remaining approved amount for repurchases was approximately $5,180.
F-39
Boingo Wireless, Inc.
Notes to the Consolidated Financial Statements (Continued)
(In thousands, except shares and per share amounts)
15. Stock incentive plans
In March 2011, our board of directors approved the 2011 Plan. The 2011 Plan provides for the grant of incentive and non-statutory stock options, stock appreciation rights, restricted shares of our common stock, stock units, and performance cash awards. As of January 1st of each year, the number of shares of common stock reserved for issuance under the 2011 Plan shall automatically be increased by a number equal to the lesser of (a) 4.5% of the total number of shares of common stock then outstanding, (b) 3,000,000 shares of common stock or (c) as determined by our board of directors. As of December 31, 2015, 10,324,899 shares of common stock were reserved for issuance. As of December 31, 2015, options to purchase 5,229,486 shares of common stock and 3,896,251 RSUs have been granted under the 2011 Plan.
At the 2015 Annual Meeting of Stockholders held on June 12, 2015, our stockholders approved the following amendments to our 2011 Equity Incentive Plan: (a) termination of the automatic "evergreen" share reserve increase feature after January 2018, so that no additional automatic annual share increases will occur thereafter; (b) remove the discretion to re-price any stock award; (c) implement more conservative "share counting" provisions, so that the following shares will no longer be available for subsequent issuance: (i) shares applied to pay the exercise price of an option, (ii) shares not otherwise issued in connection with the stock settlement of stock appreciation rights, (iii) shares used to satisfy tax withholding obligations relating to any stock award, and (iv) shares reacquired by us using cash proceeds from the exercise of options; and (d) ensure that certain awards are intended to qualify as performance-based compensation under Section 162(m) of the Internal Revenue Code.
No further awards will be made under our Amended and Restated 2001 Stock Incentive Plan and it will be terminated. Options outstanding under the 2001 Plan will continue to be governed by their existing terms. As of December 31, 2015, options to purchase 1,220,562 shares of common stock were outstanding under the 2001 Plan.
The following table summarizes our stock-based compensation expense included in the consolidated statements of operations for 2015, 2014 and 2013:
| |
Years ended December 31, | |||||||||
|---|---|---|---|---|---|---|---|---|---|---|
| |
2015 | 2014 | 2013 | |||||||
Network operations |
$ | 1,504 | $ | 1,356 | $ | 888 | ||||
Development and technology |
731 | 600 | 380 | |||||||
Selling and marketing |
3,411 | 2,017 | 1,045 | |||||||
General and administrative |
3,752 | 3,191 | 2,193 | |||||||
| | | | | | | | | | | |
Total stock-based compensation expense |
$ | 9,398 | $ | 7,164 | $ | 4,506 | ||||
| | | | | | | | | | | |
| | | | | | | | | | | |
| | | | | | | | | | | |
For the year ended December 31, 2015 and 2014, we capitalized $778 and $398, respectively, of stock-based compensation expense.
Stock option awards
We grant stock option awards to both employees and non-employee directors. The grant date for these awards is the same as the measurement date. The stock option awards generally vest over a four year service period with 25% vesting when the individual completes 12 months of continuous service
F-40
Boingo Wireless, Inc.
Notes to the Consolidated Financial Statements (Continued)
(In thousands, except shares and per share amounts)
15. Stock incentive plans (Continued)
and the remaining 75% vesting monthly thereafter. These awards are valued as of the measurement date and the stock-based compensation expense, net of estimated and actual forfeitures, is recognized on a straight-line basis over the requisite service period. A summary of the activity for stock option awards for 2015 is presented below:
| |
Number of Options (000's) |
Weighted Average Exercise Price |
Weighted- Average Remaining Contract Life (years) |
Aggregate Intrinsic Value |
|||||||||
|---|---|---|---|---|---|---|---|---|---|---|---|---|---|
Outstanding at December 31, 2014 |
4,341 | $ | 6.60 | 5.8 | $ | 11,017 | |||||||
Exercised |
(440 | ) | $ | 3.12 | |||||||||
Canceled/forfeited |
(153 | ) | $ | 9.51 | |||||||||
| | | | | | | | | | | | | | |
Outstanding at December 31, 2015 |
3,748 | $ | 6.89 | 5.0 | $ | 6,611 | |||||||
| | | | | | | | | | | | | | |
| | | | | | | | | | | | | | |
| | | | | | | | | | | | | | |
Vested, exercisable and expected to vest at December 31, 2015 |
3,728 | $ | 6.89 | 5.0 | $ | 6,605 | |||||||
Exercisable at December 31, 2015 |
3,175 | $ | 6.73 | 4.6 | $ | 6,475 | |||||||
The aggregate intrinsic value in the table above represents the difference between the estimated fair value of our common stock at December 31, 2015 and the option exercise price, multiplied by the number of in-the-money options at December 31, 2015. The intrinsic value changes are based on the estimated fair value of our common stock.
Stock options to purchase approximately 440,000, 458,000 and 461,000 shares of our common stock were exercised during the years ended December 31, 2015, 2014 and 2013 for cash proceeds of $1,373, $1,158 and $614, respectively. The total intrinsic value of stock options exercised for the years ended December 31, 2015, 2014 and 2013 was $2,214, $2,027 and $2,662, respectively. We realized $55 of tax benefits for the deductions from stock option exercises during 2013.
The weighted average grant date fair value of options granted for the years ended December 31, 2014 and 2013 was $2.92 and $3.03, respectively.
At December 31, 2015, the total remaining stock-based compensation expense for unvested stock option awards is $1,564, which is expected to be recognized over a weighted average period of 1.2 years.
Restricted stock unit awards
We grant time-based restricted stock units ("RSU") to executive and non-executive personnel and non-employee directors. The time-based RSUs granted to executive and non-executive personnel generally vest over a two to three year period subject to continuous service on each vesting date. The time-based RSUs for our non-employee directors generally vest over a one year period for existing members and 25% per year over a four-year period for new members subject to continuous service on each vesting date.
F-41
Boingo Wireless, Inc.
Notes to the Consolidated Financial Statements (Continued)
(In thousands, except shares and per share amounts)
15. Stock incentive plans (Continued)
We grant performance-based RSUs to executive personnel. These awards vest subject to certain performance objectives based on the Company's annual revenue growth achieved during the specified performance period and certain long-term service conditions. The maximum number of RSUs that may vest is determined based on actual Company achievement with one-third of the performance-based RSUs vesting when the individual completes 12 months of continuous service and the balance vesting over a series of eight successive equal quarterly installments thereafter subject to continuous service on each vesting date. We recognize stock-based compensation expense for performance-based RSUs when we believe that it is probable that the performance objectives will be met. As of December 31, 2015, the performance condition for these performance-based RSUs has been met.
A summary of the RSU activity in 2015 is as follows:
| |
Number of Shares (000's) |
Weighted Average Grant Date Fair Value |
|||||
|---|---|---|---|---|---|---|---|
Non-vested at December 31, 2014 |
1,385 | $ | 6.09 | ||||
Granted |
1,472 | $ | 7.55 | ||||
Vested |
(949 | ) | $ | 7.69 | |||
Canceled/forfeited |
(89 | ) | $ | 7.14 | |||
| | | | | | | | |
Non-vested at December 31, 2015 |
1,819 | $ | 6.39 | ||||
| | | | | | | | |
| | | | | | | | |
| | | | | | | | |
During the year ended December 31, 2015, 949,254 shares of time-based RSUs vested. The Company issued 618,238 shares and the remaining shares were withheld to pay minimum statutory federal, state, and local employment payroll taxes on those vested awards.
At December 31, 2015, the total remaining stock-based compensation expense for unvested RSU awards is $9,510, which is expected to be recognized over a weighted average period of 1.95 years.
16. Employee benefit plan
We have a defined contribution savings plan in accordance with Section 401(k) of the Internal Revenue Code. This plan covers substantially all employees who meet the IRS requirements and allows participants to defer a portion of their annual compensation on a pre-tax basis. Company contributions to the plan may be made at the discretion of the board of directors. Employer contributions of $511, $393 and $330 were made to the plan by us in 2015, 2014 and 2013, respectively. In December 2015, we made a change to our Plan Administrator.
F-42
Boingo Wireless, Inc.
Notes to the Consolidated Financial Statements (Continued)
(In thousands, except shares and per share amounts)
17. Net loss per share attributable to common stockholders
The following table sets forth the computation of basic and diluted net loss per share attributable to common stockholders:
| |
Years ended December 31, | |||||||||
|---|---|---|---|---|---|---|---|---|---|---|
| |
2015 | 2014 | 2013 | |||||||
| |
(in thousands) |
|||||||||
Numerator: |
||||||||||
Net loss attributable to common stockholders, basic and diluted |
$ | (22,292 | ) | $ | (19,521 | ) | $ | (3,968 | ) | |
Denominator: |
||||||||||
Weighted average number of common stock, basic and diluted |
36,849 | 35,753 | 35,578 | |||||||
Net loss per share attributable to common stockholders: |
||||||||||
Basic and diluted |
$ | (0.60 | ) | $ | (0.55 | ) | $ | (0.11 | ) | |
For the years ended December 31, 2015, 2014 and 2013, we excluded all assumed exercises of stock options and the assumed issuance of common stock under RSUs from the computation of diluted net loss per share as the effect would be anti-dilutive due to the net loss for the period.
18. Quarterly financial data (unaudited)
Summarized unaudited quarterly financial data for fiscal years 2015 and 2014 are as follows:
| |
Quarter Ended | ||||||||||||
|---|---|---|---|---|---|---|---|---|---|---|---|---|---|
2015
|
March 31 | June 30 | September 30 | December 31 | |||||||||
Revenue |
$ | 29,392 | $ | 34,277 | $ | 37,186 | $ | 38,771 | |||||
Loss from operations |
$ | (7,603 | ) | $ | (5,765 | ) | $ | (4,759 | ) | $ | (3,504 | ) | |
Net loss attributable to common stockholders |
$ | (7,882 | ) | $ | (5,937 | ) | $ | (4,819 | ) | $ | (3,654 | ) | |
Basic and diluted loss per share |
$ | (0.22 | ) | $ | (0.16 | ) | $ | (0.13 | ) | $ | (0.10 | ) | |
| |
Quarter Ended | ||||||||||||
|---|---|---|---|---|---|---|---|---|---|---|---|---|---|
2014
|
March 31 | June 30 | September 30 | December 31 | |||||||||
Revenue |
$ | 26,452 | $ | 28,396 | $ | 30,822 | $ | 33,627 | |||||
Loss from operations |
$ | (5,173 | ) | $ | (3,352 | ) | $ | (3,487 | ) | $ | (6,014 | ) | |
Net loss attributable to common stockholders |
$ | (5,448 | ) | $ | (3,734 | ) | $ | (3,815 | ) | $ | (6,524 | ) | |
Basic and diluted loss per share |
$ | (0.15 | ) | $ | (0.10 | ) | $ | (0.11 | ) | $ | (0.18 | ) | |
Losses per share are computed separately for each quarter and the full year using the respective weighted average number of shares. Therefore, the sum of the quarterly losses per share amounts may not equal the annual amounts reported.
F-43
Boingo Wireless, Inc.
Notes to the Consolidated Financial Statements (Continued)
(In thousands, except shares and per share amounts)
19. Subsequent events
Credit Facility
In February 2016, we borrowed an additional $5,000 under the Revolving Line of Credit.
On February 23, 2016, we entered into a Lender Joinder Agreement (the "Joinder Agreement") to Credit Agreement, by and among Bank of America, N.A. acting as agent ("Agent") for the lenders named in the Credit Agreement (the "Lenders") and Citizens Bank, N.A. (the "New Lender"). The Joinder Agreement joins the New Lender as a Lender under the Credit Agreement, increases the Revolving Line of Credit by $23,250 from $46,500 to $69,750, stipulates that the New Lender will provide the additional $23,250 of the Revolving Line of Credit and effects certain other changes described therein. Additionally, pursuant to the Joinder Agreement and the Credit Agreement, the Company entered into a revolving note with the New Lender obligating the Company to pay interest and principal to the New Lender on the New Lender's portion of the Revolving Line of Credit.
There was no change to the interest rates under the Credit Agreement and the maturity date of the Revolving Line of Credit continues to be November 21, 2018, subject to prepayment.
Equity Incentive Plan
In February 2016, we granted approximately 975,000 time-based RSUs to certain executives that "cliff vest" upon continuous service through February 1, 2019 and approximately 975,000 performance-based RSUs (assuming at-target achievement) that vest upon the achievement of performance objectives through December 31, 2017 and continuous service through February 1, 2019.
Additionally, we granted approximately 192,000 time-based RSUs to the Company's other executive officers that vest quarterly over three years of continuous service and 192,000 performance-based RSUs (assuming at-target achievement) that vest upon the achievement of performance objectives through December 31, 2017. 662/3% of the performance-based RSUs will vest on a determination date not to exceed March 15, 2018, another 81/3% will vest on May 1, 2018, and an additional 81/3% will vest quarterly thereafter upon completion of continuous service.
We also granted approximately 539,000 time-based RSUs to non-executive personnel that will vest quarterly over three years of continuous service.
The grants were made pursuant to our 2011 Plan.
F-44
Item 15. Exhibits, Financial Statement Schedules
(a) The following documents are filed as part of, or incorporated by reference into, this Annual Report on Form 10-K:
(1)(2) Financial Statements. The following consolidated financial statements of Boingo Wireless, Inc., and Report of Independent Registered Public Accounting Firm are included in a separate section of this Annual Report on Form 10-K beginning on page F-2:
All financial statement schedules have been omitted because the required information is not applicable or not present in amounts sufficient to require submission of the schedule, or because the information required is included in our consolidated financial statements or the notes thereto.
(3) Exhibits. The exhibits listed under Item 15(b) hereof are filed with, or incorporated by reference into, this Annual Report on Form 10-K. Each management contract or compensatory plan or arrangement is identified separately in item 15(b) hereof.
F-45
(b) Exhibits.
The following exhibits are filed as part of, or incorporated by reference into, this Annual Report on Form 10-K:
| |
|
Incorporated by Reference | |
||||||||
|---|---|---|---|---|---|---|---|---|---|---|---|
| |
|
Filed Herewith |
|||||||||
| Exhibit No. | Description | Form | Date | Number | |||||||
| 3.2 | Amended and Restated Certificate of Incorporation. | S-1 | 03/21/2011 | 3.2 | |||||||
3.4 |
Amended and Restated Bylaws. |
8-K |
12/29/2015 |
3.1 |
|||||||
4.1 |
Amendment No. 1 to Amended and Restated Investor Rights Agreement, dated April 12, 2011. |
S-1 |
04/13/2011 |
4.1 |
|||||||
4.2 |
Amended and Restated Investor Rights Agreement among the Registrant and certain stockholders, dated June 27, 2006. |
S-1 |
01/14/2011 |
4.2 |
|||||||
10.1 |
Form of Indemnification Agreement to be entered into between the Registrant and each of its directors and officers. |
S-1 |
03/21/2011 |
10.1 |
|||||||
10.2 |
Amended and Restated 2001 Stock Incentive Plan.† |
S-1 |
01/14/2011 |
10.2 |
|||||||
10.3 |
Form of Amended and Restated 2001 Stock Plan Stock Option Agreement.† |
S-1 |
01/14/2011 |
10.3 |
|||||||
10.4 |
2011 Equity Incentive Plan and forms of agreements thereunder.† |
S-1 |
03/21/2011 |
10.4 |
|||||||
10.5 |
2011 Equity Incentive Plan Notice of Stock Unit Award (Performance Stock Units).† |
8-K |
03/07/2014 |
99.1 |
|||||||
10.5A |
Amended and Restated 2011 Equity Incentive Plan. |
10-Q |
08/10/2015 |
10.1 |
|||||||
10.6 |
Letter agreement between the Registrant and David Hagan, dated April 11, 2011.† |
S-1 |
04/13/2011 |
10.5 |
|||||||
10.7 |
2010 Management Incentive Compensation Plan.† |
S-1 |
01/14/2011 |
10.7 |
|||||||
10.8 |
Office Lease Agreement, dated April 2007, between CA-10960 Wilshire Limited Partnership and Registrant. |
S-1 |
01/14/2011 |
10.8 |
|||||||
10.9 |
Lease Amendment dated August 19, 2014 between CA-10960 Wilshire Limited Partnership and Registrant. |
10-Q |
11/10/2014 |
10.1 |
|||||||
10.10 |
License Agreement for Wireless Communications Access System, dated November 17, 2005, between City of Chicago and Chicago Concourse Development Group, LLC.^ |
S-1 |
04/29/2011 |
10.9 |
|||||||
10.10A |
Consent to Change in Ownership and Amendment of Agreement, dated June 22, 2006, between City of Chicago and Chicago Concourse Development Group, LLC. |
S-1 |
2/25/2011 |
10.9A |
|||||||
F-46
| |
|
Incorporated by Reference | |
||||||||
|---|---|---|---|---|---|---|---|---|---|---|---|
| |
|
Filed Herewith |
|||||||||
| Exhibit No. | Description | Form | Date | Number | |||||||
| 10.11 | Amendment Agreement, dated December 31, 2014 between the Registrant and the City of Chicago.^ | 10-K | 03/16/2015 | 10.11 | |||||||
10.12 |
Telecommunications Network Access Agreement, dated August 26, 1999, between The Port Authority of New York and New Jersey and New York Telecom Partners, LLC.^ |
S-1 |
04/29/2011 |
10.10 |
|||||||
10.13 |
Supplemental Agreement, dated March 28, 2001 between The Port Authority of New York and New Jersey and New York Telecom Partners, LLC.^ |
S-1 |
04/29/2011 |
10.10A |
|||||||
10.14 |
Supplemental Agreement, dated June 30, 2002 between the Port Authority of New York and New Jersey and New York Telecom Partners, LLC.^ |
10-Q |
11/10/2014 |
10.2 |
|||||||
10.15 |
Supplemental Agreement, dated November 30, 2006 between the Port Authority of New York and New Jersey and New York Telecom Partners, LLC.^ |
10-Q |
11/10/2014 |
10.3 |
|||||||
10.16 |
Letter, dated August 19, 2013, from New York Telecom Partners, LLC to The Port Authority of New York and New Jersey.# |
10-Q |
11/12/2013 |
10.17 |
|||||||
10.17 |
Supplemental Agreement, dated July 21, 2014 between the Port Authority of New York and New Jersey and New York Telecom Partners, LLC.^ |
10-Q |
11/10/2014 |
10.4 |
|||||||
10.18 |
Management Incentive Compensation Plan. |
S-1 |
03/21/2011 |
10.11 |
|||||||
10.19 |
Letter agreement between the Registrant and Peter Hovenier, dated April 1, 2013.† |
8-K |
04/02/2013 |
10.1 |
|||||||
10.20 |
Letter Agreement between the Registrant and Nick Hulse, dated May 1, 2013.† |
10-Q |
05/10/2013 |
10.16 |
|||||||
10.21 |
Letter agreement between the Registrant and Dawn Callahan, dated January 1, 2013.† |
10-K |
3/17/2014 |
10.15 |
|||||||
10.22 |
Letter agreement between the Registrant and Tom Tracey, dated September 23, 2011.† |
10-K |
3/17/2014 |
10.16 |
|||||||
10.23 |
Letter agreement between the Registrant and Derek Peterson, dated January 30, 2013.† |
10-K |
3/17/2014 |
10.17 |
|||||||
10.24 |
Credit agreement between the Registrant and Bank of America, N.A.^ |
10-K |
3/16/2015 |
10.24 |
|||||||
10.25 |
First Amendment to Credit Agreement. |
10-Q |
8/10/2015 |
10.2 |
|||||||
10.26 |
Form of Vesting Extension Agreement† |
8-K |
2/03/2016 |
99.1 |
|||||||
10.27 |
Notice of Restricted Stock Unit Award and Restricted Stock Unit Agreement (2016 Performance Stock Units) under 2011 Equity Incentive Plan.† |
8-K |
2/03/2016 |
99.2 |
|||||||
F-47
| |
|
Incorporated by Reference | |
||||||||
|---|---|---|---|---|---|---|---|---|---|---|---|
| |
|
Filed Herewith |
|||||||||
| Exhibit No. | Description | Form | Date | Number | |||||||
| 10.28 | Joinder Agreement dated as of February 23, 2016, by and among the Registrant, Bank of America, N.A., Silicon Valley Bank and Citizens Bank, N.A. | 8-K | 2/25/2016 | 10.1 | |||||||
21.1 |
List of subsidiaries. |
X |
|||||||||
23.1 |
Consent of PricewaterhouseCoopers LLP, Independent Registered Public Accounting Firm. |
X |
|||||||||
24.1 |
Power of Attorney (included in Signature Page) |
X |
|||||||||
31.1 |
Certification of Chief Executive Officer pursuant to Section 302 of the Sarbanes-Oxley Act. |
X |
|||||||||
31.2 |
Certification of Chief Financial Officer pursuant to Section 302 of the Sarbanes-Oxley Act. |
X |
|||||||||
32.1 |
Certification of Chief Executive Officer pursuant to Section 906 of the Sarbanes-Oxley Act.* |
X |
|||||||||
32.2 |
Certification of Chief Financial Officer pursuant to Section 906 of the Sarbanes-Oxley Act.* |
X |
|||||||||
101.INS |
XBRL Instance Document |
X |
|||||||||
101.SCH |
XBRL Taxonomy Extension Schema Document |
X |
|||||||||
101.CAL |
XBRL Taxonomy Extension Calculation Linkbase Document |
X |
|||||||||
101.DEF |
XBRL Taxonomy Extension Definition Linkbase Document |
X |
|||||||||
101.LAB |
XBRL Taxonomy Extension Label Linkbase Document |
X |
|||||||||
101.PRE |
XBRL Taxonomy Extension Presentation Linkbase Document |
X |
|||||||||
- *
- Furnished
herewith.
- ^
- Portions
of this exhibit (indicated by asterisks) have been omitted pursuant to an order granting confidential treatment. These portions have been submitted
separately to the Securities and Exchange Commission.
- #
- Portions
of this exhibit (indicated by asterisks) have been omitted pursuant to a request for confidential treatment. These portions have been submitted
separately to the Securities and Exchange Commission.
- †
- Indicates a management contract or compensatory plan.
F-48
Pursuant to the requirements of Section 13 or 15(d) of the Securities Exchange Act of 1934, the registrant has duly caused this report to be signed on its behalf by the undersigned, thereunto duly authorized, on the 11th day of March 2016.
|
BOINGO WIRELESS, INC. | |||
|
By: |
/s/ DAVID HAGAN |
||
KNOW ALL PERSONS BY THESE PRESENTS, that each person whose signature appears below constitutes and appoints David Hagan and Peter Hovenier, and each of them, as his true and lawful attorney-in-fact and agent, with full power of substitution and resubstitution, for him and in his name, place and stead, in any and all capacities, to sign any and all amendments to this Annual Report on Form 10-K, and to file the same, with all exhibits thereto, and other documents in connection therewith, with the Securities and Exchange Commission, granting unto said attorneys-in-fact and agents, and each of them, full power and authority to do and perform each and every act and thing requisite and necessary to be done in connection therewith, as fully to all intents and purposes as he might or could do in person, hereby ratifying and confirming all that said attorneys-in-fact and agents, or any of them, or their or his substitutes, may lawfully do or cause to be done by virtue thereof.
Pursuant to the requirements of the Securities Exchange Act of 1934, this report has been signed below by the following persons on behalf of the registrant and in the capacities and on the dates indicated.
| /s/ DAVID HAGAN David Hagan |
Chairman of the Board and Chief Executive Officer (Principal Executive Officer) | March 11, 2016 | ||
/s/ PETER HOVENIER Peter Hovenier |
Chief Financial Officer (Principal Financial Officer) |
March 11, 2016 |
||
/s/ CHARLES BOESENBERG Charles Boesenberg |
Director |
March 11, 2016 |
||
/s/ CHUCK DAVIS Chuck Davis |
Director |
March 11, 2016 |
||
/s/ MICHAEL FINLEY Michael Finley |
Director |
March 11, 2016 |
F-49
| /s/ TERRELL JONES Terrell Jones |
Director | March 11, 2016 | ||
/s/ LANCE ROSENZWEIG Lance Rosenzweig |
Director |
March 11, 2016 |
F-50