Attached files
| file | filename |
|---|---|
| EX-10.10 - EXHIBIT 10.10 - WireCo WorldGroup Inc. | exhibit1010_2015.htm |
| EX-32.1 - EXHIBIT 32.1 - WireCo WorldGroup Inc. | exhibit321_2015.htm |
| EX-31.2 - EXHIBIT 31.2 - WireCo WorldGroup Inc. | exhibit312_2015.htm |
| EX-21 - EXHIBIT 21 - WireCo WorldGroup Inc. | exhibit21_2015.htm |
| EX-32.2 - EXHIBIT 32.2 - WireCo WorldGroup Inc. | exhibit322_2015.htm |
| EX-31.1 - EXHIBIT 31.1 - WireCo WorldGroup Inc. | exhibit311_2015.htm |
UNITED STATES
SECURITIES AND EXCHANGE COMMISSION
Washington, D.C. 20549
Form 10-K | ||
x | ANNUAL REPORT PURSUANT TO SECTION 13 OR 15(d) OF THE SECURITIES EXCHANGE ACT OF 1934 |
For the fiscal year ended December 31, 2015
or
¨ | TRANSITION REPORT PURSUANT TO SECTION 13 OR 15(d) OF THE SECURITIES EXCHANGE ACT OF 1934 |
For the transition period from to
Commission file number 333-174896

WireCo WorldGroup Inc.
(Exact name of registrant as specified in its charter)
Delaware | 27-0061302 | |||
(State or other jurisdiction of incorporation or organization) | (I.R.S. Employer Identification No.) | |||
2400 West 75th Street Prairie Village, Kansas | 66208 | |||
(Address of registrant's executive offices) | (Zip Code) | |||
(816) 270-4700 | ||||
(Registrant's telephone number, including area code) | ||||
Securities registered pursuant to Section 12(b) of the Act: None
Securities registered pursuant to Section 12(g) of the Act: None
Indicate by check mark if the registrant is a well-known seasoned issuer (as defined in Rule 405 of the Securities Act). YES ¨ NO x
Indicate by check mark if the registrant is not required to file reports pursuant to Section 13 or Section 15(d) of the Act. YES x NO ¨
Indicate by check mark whether the registrant (1) has filed all reports required to be filed by Section 13 or 15(d) of the Securities Exchange Act of 1934 during the preceding 12 months (or for such shorter period that the registrant was required to file such reports), and (2) has been subject to such filing requirements for the past 90 days. YES ¨ NO x
NOTE: While the Registrant is a voluntary filer not subject to the filing requirements of Section 13 or 15(d) of the Securities Exchange Act of 1934 (the "Exchange Act"), the Registrant has filed all reports required to be filed by Section 13 or 15(d) of the Exchange Act during the preceding 12 months.
Indicate by check mark whether the registrant has submitted electronically and posted on its corporate website, if any, every Interactive Date File required to be submitted and posted pursuant to Rule 405 of Regulation S-T (§232.405 of this chapter) during the preceding 12 months (or for such shorter period that the registrant was required to submit and post such files). YES x NO ¨
Indicate by check mark if disclosure of delinquent filers pursuant to Item 405 of Regulation S-K is not contained herein, and will not be contained, to the best of registrant’s knowledge, in definitive proxy or information statements incorporated by reference in Part III of this Form 10-K or any amendment to this Form 10-K. x
Indicate by check mark whether the registrant is a large accelerated filer, an accelerated filer, a non-accelerated filer or a smaller reporting company. See the definitions of “large accelerated filer,” “accelerated filer” and “smaller reporting company” in Rule 12b-2 of the Exchange Act. (Check one):
Large accelerated filer | ¨ | Accelerated filer | ¨ | |||||
Non-accelerated filer | x | Smaller reporting company | ¨ | |||||
Indicate by check mark whether the registrant is a shell company (as defined in Exchange Act Rule 12b-2). YES ¨ NO x
There is no market for the Registrant’s equity, all of which is held by affiliates of WireCo WorldGroup (Cayman) Inc. (the “Company”). As of March 10, 2016, the Registrant had 100 shares of common stock outstanding.
DOCUMENTS INCORPORATED BY REFERENCE
None
WireCo WorldGroup Inc.
Annual Report
For the year ended December 31, 2015
TABLE OF CONTENTS
PART I | |
PART II | |
PART III | |
PART IV | |
1
Our Organization
The diagram below illustrates our current corporate structure at December 31, 2015, including WireCo WorldGroup Inc. (the "Registrant"), the issuer of the 9.50% Senior Notes due 2017, the guarantors and non-guarantors designated by the shaded boxes. WireCo WorldGroup (Cayman) Inc. ("WireCo" or the "Company") indirectly owns 100% of the voting common stock of the Registrant and all of the subsidiaries guaranteeing the 9.50% Senior Notes. For a list of our subsidiaries, refer to Exhibit 21. Percentages of sales or assets represent the respective portion of consolidated WireCo net sales for the year ended December 31, 2015, or assets at December 31, 2015.
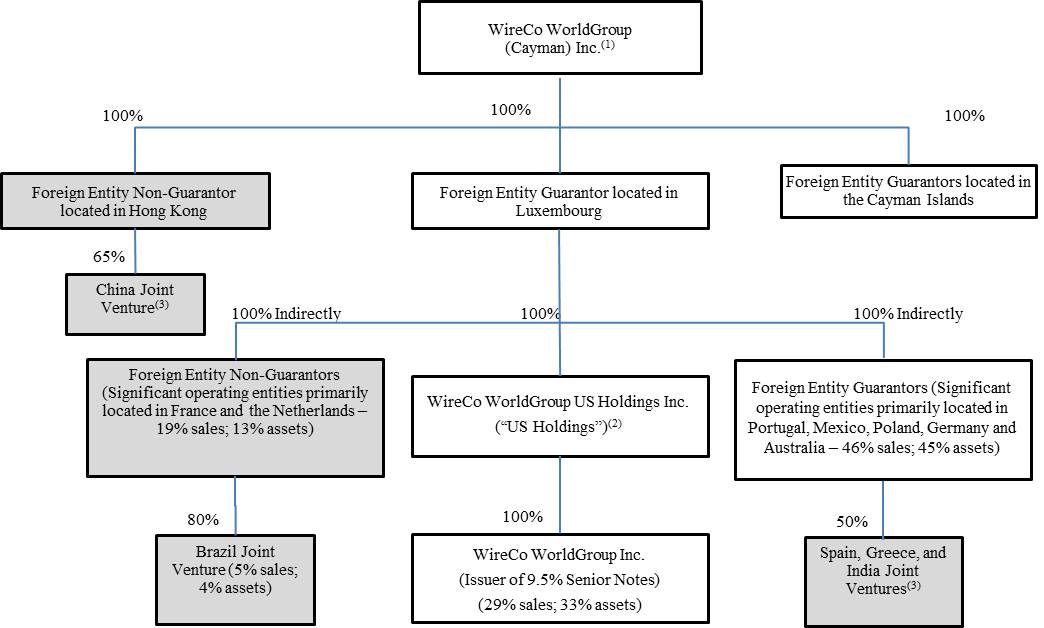
(1) | This entity is 82% beneficially owned by Paine & Partners Fund III, of which Paine & Partners, LLC ("Paine & Partners") is the manager. |
(2) | Certain current and former members of management beneficially own 3.3% of the non-voting common stock of U.S. Holdings, reflected as non-controlling interests. |
(3) | For subsidiaries in which the Company does not have a controlling interest, we account for our respective ownership interests as equity method investments. |
2
Cautionary Information Regarding Forward-Looking Statements
The Securities and Exchange Commission (“SEC”) encourages companies to disclose forward-looking information so that investors can better understand a company’s future prospects and make informed investment decisions. This report contains statements that relate to future events and expectations and, as such, constitute “forward-looking” statements within the meaning of the Private Securities Litigation Reform Act of 1995. Forward-looking statements include those containing such words as “anticipates,” “believes,” “continues,” “estimates,” “expects,” “forecasts,” “outlook,” “plans,” “projects,” “should,” “targets,” “will,” or the negative of those words or other comparable terminology. All statements that reflect WireCo's expectations, assumptions or projections about the future other than statements of historical fact are forward-looking statements, including, without limitation, forecasts concerning end-market growth or other trend projections, anticipated financial results or operating performance, and statements about WireCo's business plans and strategies.
Forward-looking statements are subject to a number of known and unknown risks, uncertainties and other factors and are not guarantees of future performance. Actual results, performance or outcomes may differ materially from those expressed in or implied by those forward-looking statements. A number of factors or combination of factors including, but not limited to, the factors identified below and those discussed in Item 1A, Risk Factors, of this annual report may cause WireCo’s actual results to differ materially from those projected in any forward-looking statements.
Readers are strongly encouraged to consider these factors and the following factors when evaluating any forward-looking statements concerning the Company:
• | the general economic conditions in markets and countries where we have operations; |
• | fluctuations in end market demand; |
• | foreign currency exchange rate fluctuations; |
• | risks associated with our non-U.S. operations; |
• | our ability to meet quality standards; |
• | our ability to protect our trade names; |
• | the competitive environment in which we operate; |
• | changes in the availability or cost of raw materials and energy; |
• | risks associated with our manufacturing activities; |
• | violations of laws and regulations; |
• | the impact of environmental issues and changes in environmental laws and regulations; |
• | our ability to successfully execute and integrate acquisitions; |
• | comparability of our specified scaled disclosure requirements applicable to emerging growth companies; |
• | labor disturbances, including any resulting from suspension or termination of our collective bargaining agreements; |
• | our significant indebtedness; |
• | covenant restrictions; |
• | the interests of our principal equity holder may not be aligned with the holders of our 9.5% Senior Notes; and |
• | credit-rating downgrades. |
Any forward-looking statements that WireCo makes in this annual report speak only as of the date of such statement and we disclaim any intention or obligation to update publicly any forward-looking statements, whether in response to new information, future events or otherwise, except as required by applicable law.
3
PART I
Item 1.Business
INTRODUCTION
Unless otherwise indicated, the financial information included in this annual report on Form 10-K are those of WireCo WorldGroup (Cayman) Inc., its wholly-owned subsidiaries, including WireCo WorldGroup Inc., and subsidiaries in which it has a controlling interest. In this report, unless the context otherwise requires, “WireCo,” the “Company,” “we,” “our” or “us” means WireCo WorldGroup (Cayman) Inc. and all subsidiaries consolidated for the purposes of its financial statements. WireCo WorldGroup (Cayman) Inc. is an exempted company incorporated under the laws of the Cayman Islands in 2008. WireCo WorldGroup Inc. (the "Registrant") was originally founded in 1931 as Wire Rope Corporation of America, Inc.
COMPANY OVERVIEW
We are a leading global manufacturer of both steel and synthetic rope, specialty wire and engineered products serving a diverse range of end markets, geographies and customers. We maintain a broad portfolio of critical products across the end markets we serve, including, but not limited to, industrial and infrastructure, oil and gas (both offshore and onshore), fishing, mining, maritime, structures, poultry and storage systems. We market our products under well-known brands including: Union™, CASAR®, Lankhorst Ropes®, Camesa®, Euronete™, Oliveira®, Phillystran®, Drumet®, Lankhorst Engineered Products™ and Lankhorst Mouldings™.
Our highly engineered, specialized ropes are "mission-critical" equipment components used in applications, such as heavy lifting, pulling, mooring, supporting and suspension. Our products' performance, quality and safety are of the utmost importance to our customers to limit exposure to costly unplanned operational disruptions and downtime. The consumable nature of our products and rigid replacement cycles result in a recurring revenue base over time.
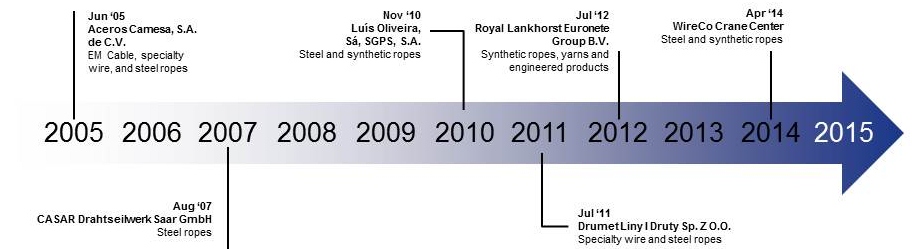
We operate 24 manufacturing facilities in 8 countries, which are supplemented by a global network of company-owned distribution facilities, consignment centers, distributor partnerships and sales offices. In addition, we have non-consolidated joint ventures with manufacturing activities in India, Spain, Norway, Greece and China. Our acquisitions have enhanced our leadership position by creating new growth opportunities, served to diversify and increase end market penetration and reduced our dependence on external wire suppliers. The timeline below highlights a few of the more significant acquisitions we have made over the past decade.
4
OUR STRENGTHS
• | Mission-Critical Products with Recurring Revenue. Due to the mission-critical nature of our products, customers choose our products based on quality, service and engineering support. Rigorous operating conditions require frequent replacement, generating a steady stream of recurring revenue. |
• | Highly Diversified Business Mix. Our revenue base is spread across a diverse mix of end-user markets, geographies, products and brands. We believe our overall business diversity helps to mitigate the impact of a downturn in any one product, end market or region. In 2015, no single end market represented more than 26% of our total sales. In addition, we are geographically diversified with approximately 71% of sales outside of the United States ("U.S.") during 2015. |
• | Leading Market Share. We believe we hold a top market position in each of the end markets in which we choose to participate. We attribute our leadership position to our engineering capabilities and technical expertise underpinned by a heritage of over 75 years of innovation, quality, industry experience and superior customer service. We are actively pursuing the high margin global marketplace, where quality and service is key for buying decisions. |
• | Track Record of Successful Acquisitions. We have been able to successfully execute several key acquisitions resulting in a market leading position and diversification among products, end markets and geographies. |
• | Consistent Margins Despite Volatile Raw Material Prices. We have pass-through pricing mechanisms for all products at the time of sale to reflect current commodity prices, which allows for stabilized margins during volatile commodity markets. |
• | Organic Innovation. We introduced, enhanced or improved 20 products during 2015. Driving this organic innovation is a team of over 70 research, design and development engineers involved in product conception, research, design, development, testing and full technical customer support. We employ some of the end markets' most creditable subject matter experts, currently serving or having served on committees such as the Wire Rope Technical Board, American Society of Mechanical Engineers B30.30 Committee, and in Europe, The Drahtseil-Vereinigung for the wire rope industry. In addition, our experienced manufacturing team of plant managers and engineers has extensive industry experience, allowing us to leverage a talented and knowledgeable workforce to deliver high-performance products to our customers. |
REPORTABLE SEGMENT
Our operations consist of one operating segment and one reportable segment. Refer to Note 14—“Segment and Geographic Area Information” to our consolidated financial statements included in Item 8, Financial Statements and Supplementary Data, of this annual report for additional information.
PRODUCTS
The table below summarizes each product's contribution as a percentage of our total consolidated sales during 2015, 2014 and 2013.
Product Sales as a Percentage of Total Consolidated Sales
2015 | 2014 | 2013 | ||||||
Rope | 73 | % | 73 | % | 74 | % | ||
Specialty Wire | 17 | % | 16 | % | 16 | % | ||
Engineered Products | 10 | % | 11 | % | 10 | % | ||
100 | % | 100 | % | 100 | % | |||
ROPE
Product Portfolio
We are a leading global producer with a broad product offering of steel rope, electromechanical cable ("EM Cable"), synthetic rope and synthetic yarns. These customized products are capable of withstanding extremely heavy loads and harsh operating environments with specific quality, durability, weight, functionality and performance capabilities. Given the intensity of rope usage in certain applications and their consumable nature, they are subject to strict inspection and removal criteria, necessitating frequent replacement. As a result, the aftermarket represents a significant portion of highly engineered rope sales.
5
Our products are mainly used for lifting equipment within the oil and gas, fishing, mining, maritime and industrial and infrastructure end markets.
We sell our products through a global sales force consisting of regional sales managers and application or end market specialists. To enhance our overall level of service to our customers, we have an extensive engineering and research and development organization that is actively involved in developing innovative products for our customers, leading technical training seminars surrounding our products and fieldwork with our customers to maximize product performance. We service our customers through a global network of owned distribution centers, consignment centers and distributor partnerships in order to provide fast delivery, short lead-times, consistent product supply and high quality customer service.
The below table summarizes each product's contribution as a percentage of our total consolidated sales during 2015, 2014 and 2013.
Rope Product Portfolio Sales as a Percentage of Total Consolidated Sales
2015 | 2014 | 2013 | ||||||
Steel Rope | 50 | % | 53 | % | 49 | % | ||
Steel EM Cable | 3 | % | 5 | % | 5 | % | ||
Total Steel | 53 | % | 58 | % | 54 | % | ||
Synthetic Rope | 17 | % | 12 | % | 16 | % | ||
Synthetic Yarns | 3 | % | 3 | % | 4 | % | ||
Total Synthetic | 20 | % | 15 | % | 20 | % | ||
Rope Total Sales | 73 | % | 73 | % | 74 | % | ||
Steel Rope consists of a group of high-carbon steel wire strands helically and symmetrically twisted and “closed” together around a central core. Steel rope can range from small specialty rope of 1/16th of an inch to large mining ropes of up to five inches in diameter. We produce both highly engineered specialty products and steel rope suitable for a variety of uses, such as drill lines, mining ropes, cranes, mooring lines, bridges and logging. Major applications of these highly engineered products involve mineral mining, oil and gas exploration, fishing, maritime, construction and heavy industry (e.g., cranes).
EM Cable is a highly engineered, customized electrical power and electrical signal transmission cable that is armored with high-carbon steel wire or special metal alloys, providing protection for the electrical conductors inside and various mechanical performance properties. Our EM Cable product is used in the oil and gas exploration industry and provides a link to the surface from underground instrumentation. The cable not only transmits data, but also acts as a strength member for the insertion and removal of the geophysical tools used for data-logging and perforating oil and gas wells. Over the past several years, advancements in drilling technology have opened up large shale gas reserves, creating a significant EM Cable opportunity in the shale oil and gas market.
Synthetic Ropes include high tenacity fiber ropes, strands, braids and strength members made from fibers such as Kevlar®, Dyneema®, Twaron®, Technora® (all registered trademarks are owned by their respective owners) and our own proprietary formulations. These products are unique in that they have the strength characteristics of steel rope but weigh significantly less. Synthetic ropes are primarily used in maritime, offshore oil and gas, fishing and other industries that require specific operating strength, buoyancy (when in high-modulus polyethylene), corrosion resistance or weight tolerance characteristics beyond wire rope. These include mooring lines, fishing ropes, fishing nets, life and winch lines, structural and support lines, boat rigging, power cables and broadcast tower guy cables. For certain applications, fiber ropes offer attractive physical characteristics compared to steel. Although fiber has comparative strength features, it is known to have greater flexibility and lighter weight, which allows submersion to approximately 10,000 meters, allowing far greater depth reach with virtually no increase in weight. Synthetic products have become crucial in the offshore oil and gas markets as greater drilling depths have made steel ropes impractical and obsolete due to the weight of the steel rope. We have pioneered the development of new products, which combine the use of steel wire ropes with high-strength synthetic components that improve the strength to weight ratio in the finished product.
Synthetic Yarn products, such as tapes, yarns and monofilaments, are used in a variety of end market applications including flexible intermediate bulk containers, horticulture, agriculture, cables, concrete reinforcement, synthetic grass, geotextiles, electrical fencing, antiballistics, luggage, sports products, industrial and infrastructure usage and synthetic ropes. We also manufacture synthetic yarns for use in the production of our own synthetic ropes.
6
End Markets
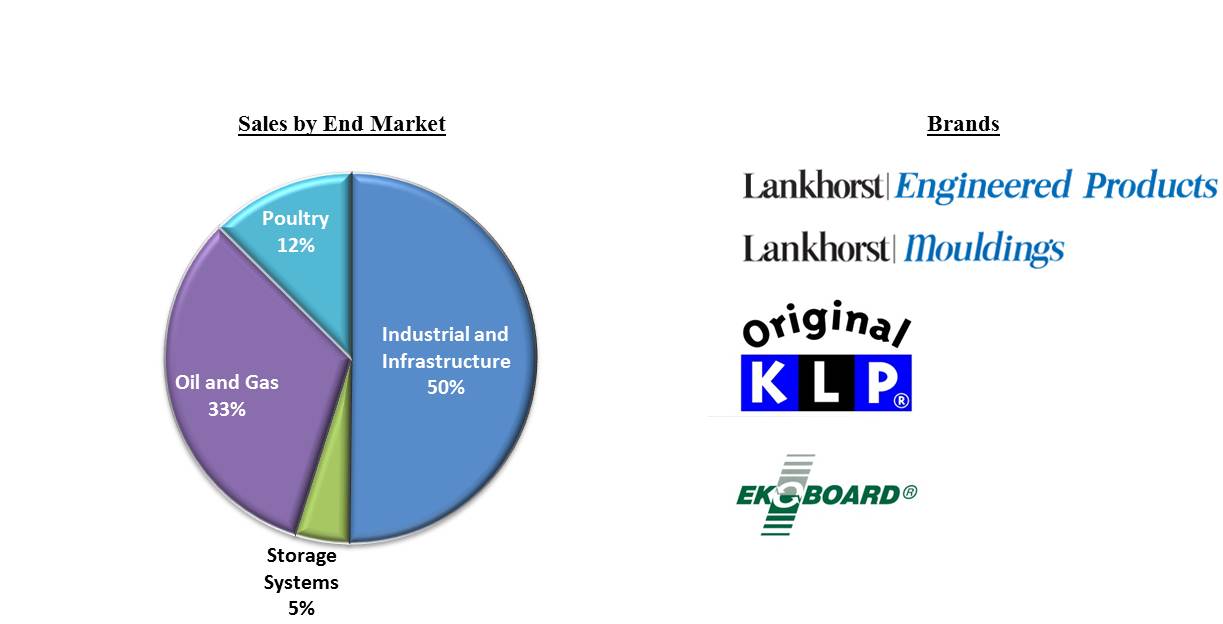
Our rope products provide solutions in a variety of end markets with attractive growth opportunities, focusing on premium high-margin business. A breakdown of our net sales for the year ended December 31, 2015 by end market, as well as our rope brands were as follows:
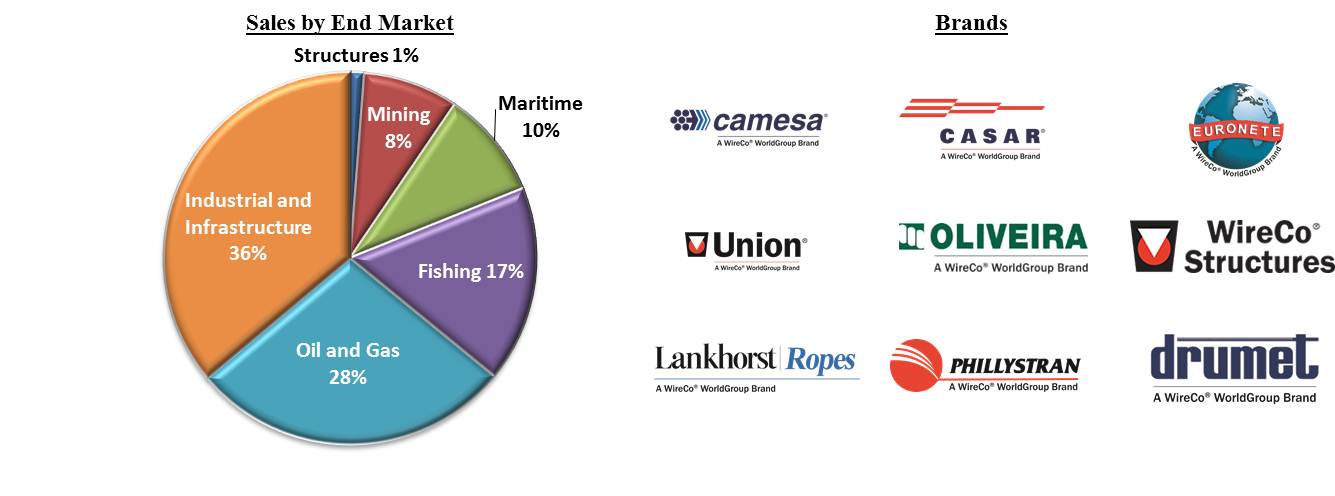
The following provides a detailed description regarding some uses of our products by end market:
Industrial and Infrastructure - This end market encompasses industrial and infrastructure applications that use steel rope in various industries, including construction, transportation, defense, automotive, agriculture and logging. Crane ropes sold within this end market consist of both Original Equipment Manufacturers ("OEMs") tied to new crane build annually and a much larger global market of end users of cranes in the aftermarket. Crane ropes are a consumable working component of cranes that require replacement every one to four years depending on cycle counts, working conditions and operator experience.
Oil and Gas - Steel and synthetic ropes are used throughout the oil and gas industry, providing solutions, from exploration all the way to production. We have a full suite of product offerings for onshore oil and gas (well servicing, tubing and sandlines, drill lines and mast raising lines), offshore above platform (drill lines, buoy pendants, tensioner ropes, riser ropes, cranes and cable lays) and solutions for offshore mooring systems below platform (deep water mooring, anchor lines, mooring systems, modulines and synthetic tethers). Onshore and offshore above platform ropes are mission critical and typically need to be replaced every 6 to 12 months depending on the application and operating environment.
Fishing - The fishing industry encompasses applications that use steel ropes, synthetic ropes and netting for fishing and other related uses. We are a leading global supplier of these products to the fishing industry, with worldwide distribution of our recognized Oliveira and Euronete brands. We believe we are the only company with a complete fishing gear range and the unique ability to produce netting, wire and synthetic ropes. Our products are consumable wire ropes and nets for fishing vessels and fish farms, which need to be replaced based on level of activity. Our research and development department is constantly working to build on our history of providing innovative and unique products to the markets that are at the front line of the industry.
Maritime - Steel and synthetic ropes are used for various maritime operating applications including mooring, tugging, lifting and anchoring. The maritime business is managed with ship owners directly or with affiliated companies, like ship yards and ship management companies with regular activity in vessels designed for bulk cargo, containers and tankers for shipping product globally, as well as working boats built for towing, dredging, drilling, offshore installations, holiday cruises and defense purposes. These types of ropes typically need to be replaced every 12 to 18 months depending on the application and operating environment.
Mining - Our steel rope products are primarily consumable working ropes for mining operations. We participate both in the underground and surface mining market for the extraction of coal, copper, iron ore and other minerals and ores. Due to the severe wear-and-tear that steel ropes endure in surface mining operations, they typically need to be replaced every two to four months depending on the application and operating environment.
Structures - Our steel and synthetic rope products are used in bridges, stadiums, towers and other cable supported structures.
7
SPECIALTY WIRE
Product Portfolio
Our specialty wire provides a competitive edge, fulfilling substantially all of our internal supply chain needs. The majority of our volume in wire is high-carbon steel wire for use in the production of our own steel ropes and EM Cable products. For our external customers, we offer a variety of selective products such as prestressed concrete ("PC") strand, PC wire, roping and automotive wire, tire bead, spring and duct, guy strand and staple band, which are manufactured for a wide variety of uses in a broad range of industries. Of our specialty wire production for the year ended December 31, 2015, we produced 43% for internal use and the remaining for our external customers. Our brands for specialty wire are as follows:
End Markets
Besides serving our internal needs, we serve niche markets in the infrastructure and industrial industries. Our primary infrastructure products are PC strand and PC wire. PC strand is used in highways, dams, silos, long extension bridges and industrial structures and is a reinforcing component for concrete. PC wire is used in residential construction in areas of Mexico as well as railroad ties in the U.S. and Mexico. Our specialty wire products are also commonly used as concrete reinforcement for infrastructure projects. For the industrial market, we serve a variety of applications including air conditioning, automotive, furniture and fencing applications. Guy strand is used in telecommunications and utilities and staple band is used to manufacture staples for various industries.
ENGINEERED PRODUCTS
Product Portfolio
Engineered products are highly engineered, plastic injected molded products and sheets including strakes for vibration suppression, piggyback blocks, coil and pipe storage and railway sleepers. Our products have a very low maintenance cost, long useful life, high impact resistance and perform in extreme temperature conditions. In many cases, these products are used as a substitute for steel, concrete or wood alternatives due to their unique engineered design, performance characteristics and price. Most products are custom designed by our dedicated team of research and development engineers to meet specific customer requirements. Since these applications are complementary with some of our wire and synthetic rope products, we can offer our customers a "complete solution." An example is our oil-platform mooring systems where we offer both the high strength synthetic ropes and the related buoyancy modules. Our sales and distribution of engineered products are done primarily in Europe. Together with our global network of dedicated distributors and agents, we are able to serve customers around the world.
End Markets
Engineered products are used in the following end markets: oil and gas, poultry, industrial and infrastructure and storage systems. Within oil and gas, we produce applications ranging from impact protection to buoyancy to anti-oscillation. Our poultry end market includes poultry manufacturing conveyor belts for eggs and manure that are tailored for the end application. The industrial and infrastructure end market produces manholes, poles, planks, decking sheet, furniture, bridges and railroad cross ties. Engineered products are used in pipe storage systems for worksite mobility and coil storage solutions, such as steel plants, service centers, automotive plants and transportation. A breakdown of our net sales for the year ended December 31, 2015 by end market, as well as our engineered products brands were as follows:
8
RAW MATERIALS
The main raw materials that we use to manufacture our rope products are high-carbon steel wire, polymers, such as polypropylene and polyethylene, and synthetic fibers, such as polyester and polyamide (nylon) and high tenacity synthetic fibers, such as Ultra High Molecular Weight Polyethylene. The main raw material that we use to manufacture wire is high-carbon steel rod. Our steel rope and wire products are made from steel rod that is primarily made from recycled steel scrap and iron ore and our synthetic ropes are primarily composed of new raw materials. Engineered products are made from new plastic materials (36%) and recycled plastic materials (64%). The recycled plastics are sourced from agricultural foils, bottle caps and industrial waste. All of our products have a variety of different coatings or ancillary materials required to complete finished products. Examples include zinc, grease, lubrication, master batch for coloring, polyurethane, fittings and hardware.
Due to the wide geographic dispersion of our production facilities, we use numerous suppliers for the raw materials needed in our operations. We are not significantly dependent on any one or a limited number of suppliers, especially considering we are vertically integrated and manufacture the majority of the wire, fibers and cores we use in our ropes. These raw materials are purchased at regular intervals, usually on a monthly or quarterly basis, depending on pricing and market conditions.
MANUFACTURING FOOTPRINT
We have a comprehensive global footprint, with both highly engineered value-added manufacturing and low cost production serving diverse end markets. Our rope products are produced on a diverse set of manufacturing assets and our engineered products have unique production capabilities, such as low and high pressure injection molding, flat-die extrusion and high production flexibility. Refer to Item 2, Properties, of this annual report for more information on our manufacturing footprint.
CUSTOMERS
We serve a broad customer base, both in terms of industries and geographic regions. Our rope and specialty wire customers include distributors, OEMs and end users of our products in the various industries we serve. Engineered products' customers include: engineering firms, contractors, multinational oil and gas energy companies, offshore pipelayers, steel manufacturers and railroads. Due to our diversified customer base, our top 10 customers only accounted for approximately 10% of our net sales in 2015, and our largest customer accounted for less than 2% of net sales in 2015.
BACKLOG
Our policy is to include only firm unfilled orders shippable within twelve months in backlog. The backlog of orders for the principal products manufactured and marketed was $73.3 million at December 31, 2015, relating primarily to offshore oil and gas contracts. The backlog of orders at December 31, 2014 was $156.6 million. We anticipate that most of the 2015 backlog of orders will be filled during fiscal year 2016.
9
COMPETITIVE CONDITIONS
We are subject to competitive conditions in most end markets. Our competitors include other global well-capitalized wire rope manufacturers, local and specialized wire manufacturers and niche markets with a wide variety of specialized producers of plastic solutions and large producers of steel, concrete and wood alternatives. In spite of this moderately competitive environment, we have established market leading positions in our various end markets under our distinguished brands and design capabilities. We generally compete on the basis of product performance, sales and technical service support and price.
INTELLECTUAL PROPERTY
We believe that our patents, brands, trademarks and other intellectual property provide us with a significant competitive advantage. We own numerous patents and patent applications worldwide. We regularly file patent applications and obtain issued patents resulting from our research and development activities. Although we use patented inventions throughout our product portfolio, our business is not substantially dependent on any single patent or group of patents. We have a significant number of trademarks registered around the world covering our company names and material brands. These trademarks include WireCo WorldGroup®, WireCo®, Union™, CASAR®, Lankhorst Ropes®, Camesa®, Euronete™, Oliveira®, WireCo® Structures, Phillystran®, Drumet®, Lankhorst Engineered Products™ and Lankhorst Mouldings™. In addition, we have trademarks registered in the U.S. and some foreign countries to protect our specific “marker strand” designs, which, consistent with market practice, designate our steel rope products as well as various brands. We have also trademarked our orange-colored plastic coating used to enhance the performance of our steel rope product lines.
RESEARCH AND DEVELOPMENT
We believe our focused agenda of research and development initiatives has enhanced our reputation as one of the leading product innovators in the industries that we serve. Demand for our products developed in previous years continues to increase as our customers recognize the added value to their respective business. In 2015, we introduced, enhanced or improved over 20 products to the diverse global industries that we serve. These new products have been included in our already extensive and highly engineered product portfolio. Our strategy is to continue to build on our history of innovation and technological expertise while bringing new, highly engineered products to market. Our investment in research and development was $4.8 million, $5.3 million and $4.0 million for the years ended December 31, 2015, 2014 and 2013, respectively.
REGULATION - Environmental Matters
Our business operations and facilities are subject to a number of laws and regulations, which govern the discharge of pollutants and hazardous substances into the air and water; the handling, storage, use and disposal of such materials; and remediation of contaminated sites. Operations at our facilities include transforming steel rods and wire into steel rope or cable, which can produce wastewater, spent acid and petroleum waste; and transforming polymers and synthetic fibers into fiber strand and fiber rope, which may be recycled or may produce polymer or synthetic fiber waste; and transforming lumber into wooden reels, which may produce waste that may be recycled or incinerated. We also store certain petroleum products and hazardous substances that we use in our operations. Due to the nature of these activities, our facilities are subject to routine inspection by regulators. Our regulators have not identified any material findings or situations that could have a material impact on our operations. Although we continually incur expenses and make capital expenditures related to environmental protection, we do not anticipate that future expenditures should materially impact our financial condition, results of operations or liquidity.
EMPLOYEES AND LABOR RELATIONS
At December 31, 2015, we employed approximately 3,800 employees worldwide, not including our non-consolidated joint ventures in India, Spain, Norway, Greece and China, of which approximately 700 were employed by the Registrant in the U.S. Approximately 34% of our employees were covered by collective bargaining agreements, of which none are subject to agreements that expire within one year of December 31, 2015. We believe we will be able to successfully negotiate all such contracts as they come due.
FINANCIAL INFORMATION ABOUT GEOGRAPHIC AREAS
We conduct a significant amount of our business and have a number of operating facilities in countries outside the United States. Refer to Note 14—“Segment and Geographic Area Information” to our consolidated financial statements included in Item 8, Financial Statements and Supplementary Data, of this annual report for financial information about our domestic and foreign operations.
10
AVAILABLE INFORMATION
We make available free of charge on our website, www.wirecoworldgroup.com, our current reports on Form 8-K, quarterly reports on Form 10-Q and annual reports on Form 10-K and amendments to those reports filed or furnished pursuant to Section 13(a) or 15(d) of the Securities Exchange Act of 1934 as soon as reasonably practicable after the Company electronically files such material with, or furnishes it to, the Securities and Exchange Commission ("SEC"). The SEC maintains an Internet website, www.sec.gov, which contains reports and other information issuers file electronically with the SEC. Interested parties may also read and copy any of our filings at the SEC’s Public Reference Room at 100 F Street N.E., Room 1580, Washington, DC 20549. Information on the operation of the Public Reference Room may be obtained by calling the SEC at 1-800-SEC-0330.
Item 1A.Risk Factors
Our business is subject to various risks, many of which are not exclusively within our control and may cause actual performance to differ materially from historical or projected future performance. The risks described below could materially and adversely affect our business, financial condition, results of operations or cash flows. These risks are not the only risks that we face and our business operations could also be affected by additional factors that are not presently known to us or that we currently consider to be immaterial to our operations. See “Cautionary Information Regarding Forward-Looking Statements” on page 3 of this annual report for cautionary statements regarding forward-looking statements.
Risks Relating to our Business
Worldwide economic conditions could negatively impact our business.
The general worldwide economic conditions continue to affect many industries, including industries in which we or our customers operate. These conditions have and could continue to negatively impact our business by adversely affecting, among other things, our: net sales; operating income; margins; cash flows; suppliers' and distributors' ability to perform and the availability and costs of materials; customers' orders; customers' ability to access credit; and customers' ability to pay amounts due to us. As a result of the weakening oil and gas end market during 2015, we reduced our factory work force in the United States, Mexico and Poland and implemented work force reductions in several administrative departments. We have been reducing our inventory in order to better match current demand. In addition, we are strategically supporting certain customers in the short-term with longer payment terms, which has resulted in an increase in days sales outstanding. If economic conditions continue to be unfavorable or worsen, the negative impact on our business could increase or continue for longer than we expect.
Some of our end markets are cyclical, which may cause us to experience fluctuations in net sales or operating results.
We have experienced, and expect to continue to experience, fluctuations in net sales and operating results due to business cycles. We sell our products principally to oil and gas (both offshore and onshore), industrial and infrastructure, fishing, mining, maritime, structures, poultry and storage systems markets. Although we serve a variety of markets to avoid a dependency on any one, a significant downturn in any one of these markets could cause a material reduction in our net sales that could be difficult to offset. In addition, decreased market demand typically results in excess manufacturing capacity among our competitors which, in turn, results in pricing pressure. As a consequence, a significant downturn in our markets can result in lower profit margins.
Our reported financial condition and results of operations are subject to exchange rate fluctuations, which will make it more difficult to predict our financial results.
Our reported financial condition and results of operations are reported in multiple currencies, which primarily include the euro, the Mexican peso and the Polish złoty and are then translated into U.S. dollars at the applicable exchange rate for inclusion in our consolidated financial statements. Appreciation of the U.S. dollar against the euro, the Mexican peso and the Polish złoty will have a negative impact on our reported net sales and operating income while depreciation of the U.S. dollar against such currencies will have a positive effect on reported net sales and operating income. Additionally, foreign currency exchange rate fluctuations related to intercompany loans denominated in U.S. dollars with subsidiaries whose functional currency is the euro, the Mexico peso and the Polish złoty impact the Foreign currency exchange gains (losses), net line item included in our consolidated statements of operations.
We may be subject to risks relating to our non-U.S. operations.
Many of our manufacturing operations and suppliers are located outside the United States. Our non-U.S. operations are subject to risks in addition to those facing our domestic operations, including: fluctuations in currency exchange rates; limitations on ownership and on repatriation of earnings; transportation delays and interruptions; political, social and economic instability and disruptions; government embargoes or trade restrictions; the imposition of duties and tariffs and other trade barriers; import and export controls; labor unrest and current and changing regulatory environments; the potential for nationalization of enterprises; difficulties in staffing and managing multi-national operations; limitations on our ability to enforce legal rights and remedies;
11
potentially adverse tax consequences; and difficulties in implementing restructuring actions on a timely basis. Given our global operations, the strengthening of the U.S. dollar has had a significant negative impact on our 2015 results, and we expect the changes in foreign currency exchange rates to continue to add volatility going forward. If we are unable to successfully manage the risks associated with expanding our global business or adequately manage operational fluctuations internationally, the risks could have a material adverse effect on our business, results of operations or financial condition.
If we do not maintain the quality of our products, our sales would be harmed and product liability claims could increase our costs.
Our products are used in applications by our customers where quality and performance are critical. If we are unable to maintain the high standards, including various quality certifications, expected by our customers, or our competitors are able to produce higher quality products, our sales may be harmed by the loss of existing customers and our ability to attract new customers. Also, we have potential exposure to product liability claims in the event that the use of any of our products results in personal injury or property damage, or a failure of our products causes a work stoppage, including situations resulting from misuse of our products. Any such claims may be significant. Therefore, product liability claims against us could have a negative reputational impact, particularly if the failure of a product is highly publicized. Furthermore, manufacturing defects may not be discovered for some time after new products are introduced. In the event that any of our products prove to be defective, among other things, we may be responsible for any related damages, and we may be required to recall or redesign such products. Any insurance we maintain may not continue to be available on terms acceptable to us or such coverage may not be adequate for liabilities actually incurred. Should this occur, we may also need to increase our investments in manufacturing processes, which could increase our expenses, reduce our margins and adversely affect our cash flows.
Our reputation and competitive position are dependent on our ability to protect our intellectual property rights.
We believe that our trade names are important to our success and competitive position. We cannot, however, guarantee that we will be able to secure protection for our intellectual property in the future or that such protection will be adequate for future operations. Furthermore, we face the risk of ineffective protection of intellectual property rights in jurisdictions where we source and distribute our products, some of which do not protect intellectual property rights to the same extent as the United States. If we are unsuccessful in challenging a party’s products on the basis of infringement of our intellectual property rights, continued sales of these products could adversely affect our sales, devalue our brands and result in a shift in consumer preference away from our products. We may face significant expenses and liability in connection with the protection of our intellectual property rights, and if we are unable to successfully protect our rights or resolve intellectual property conflicts with others, our business or financial condition could be adversely affected.
We face competition and competitive pressures, which could adversely affect our results of operations and financial condition.
We face competition on multiple fronts in our industry, including from large global firms and local specialized rope manufacturers. Other global firms may have more capital at their disposal, and may be able to produce their products at a lower cost due to their size and economies of scale. Our competitors who are based in other jurisdictions may have lower production costs because of lower labor costs, fewer regulatory standards, local access to raw materials, lower shipping costs or other factors. Local specialized firms may have an advantage due to their knowledge of the markets in which they operate. In addition, our competitors may be able to offer substitute products that customers could use as a replacement to our products.
We face volatility in the prices for, and availability of, raw materials and energy used in our business, which could adversely impact our competitive position and results of operations.
We rely heavily on certain raw materials (principally rod, polymers and synthetic fibers), and energy sources (principally electricity, natural gas and propane) in our manufacturing processes. As a result, our earnings are affected by changes in the costs and availability of these raw materials and energy. Unanticipated increases in the prices of such commodities could increase our costs, negatively impacting our business, results of operations and financial condition if we are unable to fully offset the effects of higher raw material or energy costs through price increases, productivity improvements or cost-reduction programs. Although we are not significantly dependent on any one or a limited number of suppliers, the loss of some of our significant raw material suppliers could cause shortages, which could have a material adverse effect on operations. The imposition of tariffs pursuant to trade laws and regulations in the jurisdictions in which our operations and suppliers are located can have an adverse impact on our business by placing tariffs and tariff-rate quotas on the import of certain raw materials and raising the prices of raw materials we require for our production. In addition, under certain tax laws, customs and taxing authorities may, from time to time, review the tariff classifications we use to import our raw materials and export our products.
We experience risks associated with manufacturing, which could adversely affect our business and results of operations.
A manufacturing disruption, such as equipment downtime, facility shutdown or casualty loss, could lead to production curtailment and could substantially impair our business. Interruptions in production capabilities would increase production costs and reduce our sales and earnings. In addition to lost revenue, long-term business interruption could result in the loss of
12
some customers. To the extent these events are not covered by insurance, we are unable to recover insurance proceeds to reimburse for losses or business interruption, or if we are insured but there are delays in the receipt of such reimbursements, our cash flows may be adversely impacted by events of this type.
We are subject to extensive governmental laws and regulations that can adversely affect the cost, manner or feasibility of doing business and could result in restrictions on our operations or civil or criminal liability.
We are required to comply with various governmental laws and regulations, including but not limited to environmental, occupational health and safety, tax, trade, import and export, anti-dumping, anti-bribery, anti-trust and reporting obligations of the Exchange Act. Failure to comply could lead to manufacturing shutdowns, product shortages, delays in product manufacturing, operating restrictions, withdrawal of required licenses and prohibitions against exporting or importing of products. In addition, civil and criminal penalties could result from regulatory violations. Such laws and regulations may become more stringent and result in necessary modifications to our current practices and facilities that could force us to incur additional costs that could materially affect us.
We are subject to significant environmental compliance obligations and potential environmental liabilities, which could increase our costs or cause us to change our operations.
As activities in certain of our facilities involve the handling, storage, use and disposal of hazardous substances, we may be subject to material liabilities arising from conditions caused by the release of these substances. Such liability can include the costs of investigation and clean-up, fines and penalties sought by environmental authorities and damages arising out of personal injury and contaminated property and other toxic tort claims, as well as claims for lost or impaired natural resources. Certain environmental laws impose strict liability, and under certain circumstances, joint and several liability on current and prior owners and operators of sites without regard to comparative fault. In addition, environmental requirements change frequently, and have tended to become more stringent over time. We cannot predict what environmental laws or regulations will be enacted or amended in the future, how existing or future laws or regulations will be interpreted or enforced or the amount of future expenditures that may be required to comply with such laws or regulations. Failure to maintain or comply with environmental permits, governmental approvals or other environmental requirements necessary to operate our business, exposure to any one of the possible environmental obligations and liabilities listed above, and the uncertainty that our indemnification rights will result in the recovery of any environmental losses that may arise, may subject us to significant obligations and liabilities that could have a material adverse effect on our business, financial condition and results of operations.
We may pursue and execute acquisitions, which could adversely affect our business.
We have made, and may in the future make, acquisitions of or significant investments in businesses with complementary products, services and/or technologies. We cannot provide assurance that we will be able to consummate any such transactions or that any future acquisitions will be consummated at acceptable prices and terms. Acquisitions involve numerous risks, including: unforeseen difficulties in integrating operations, technologies, services, accounting and personnel; the diversion of financial and management resources from existing operations; unforeseen difficulties related to entering geographic regions or target markets where we do not have prior experience; and the assumption of known and unknown liabilities and exposure to litigation. If we finance an acquisition with debt, it could result in higher leverage and interest costs. As a result, if we fail to evaluate and execute acquisitions properly, we might not achieve the anticipated benefits of these acquisitions, and we may incur costs in excess of what we anticipate.
An information technology system failure or breach of security may adversely affect our business.
We rely on our information technology ("IT") systems and infrastructure in order to achieve our business objectives and manage our operations. An IT system failure due to computer viruses, internal or external security breaches, power interruptions, hardware failures, fire, natural disasters, human error or other causes could disrupt our operations and prevent us from being able to operate our manufacturing facilities, process transactions with our customers and properly report those transactions in a timely manner. In addition, our efforts to avoid or mitigate the impact of cyber-based attacks and security breaches may not be successful in avoiding a material breach, which could result in unauthorized disclosure of confidential information or damage to our IT networks and systems. Any such events could cause us to lose customers or revenue and could require us to incur significant expense to eliminate these problems and address related security concerns.
We are an emerging growth company and our election to delay compliance with new or revised accounting standards and utilize scaled disclosure and governance requirements applicable to reporting companies may result in our financial statements not being comparable to those of other reporting companies.
We are an emerging growth company as defined in the Jumpstart Our Business Startups Act of 2012 (“JOBS Act”), and we are utilizing certain exemptions from various reporting requirements that are applicable to other reporting companies that are not emerging growth companies. An emerging growth company may also take advantage of some or all of the scaled disclosure provisions that are applicable to emerging growth companies, such as delayed compliance with new or revised accounting
13
pronouncements applicable to reporting companies until such pronouncements are made applicable to private companies and reduced disclosure about executive compensation arrangements. We are electing to take advantage of the extended transition period for complying with new or revised accounting standards until we (i) no longer qualify as an emerging growth company or (ii) affirmatively and irrevocably opt out of the extended transition period provided by the JOBS Act. As a result of this election, our financial statements may not be comparable to the financial statements of other reporting companies. Also, we are taking advantage of scaled disclosure provisions within Item 11, Executive Compensation, of this annual report provided by the JOBS Act to emerging growth companies. We cannot predict if investors will find our debt securities less attractive because we are relying on these exemptions. If some investors find our securities less attractive as a result, there may be a less active trading market for our securities and our trading price may be more volatile. We may utilize these reporting exemptions until we are no longer an emerging growth company. We will continue to be an emerging growth company until the earliest of: (i) the last day of the fiscal year during which we have total annual gross revenues of $1 billion or more or (ii) the date on which we have issued more than $1 billion in non-convertible debt securities during the previous three-year period.
Organized labor action could have a material adverse effect on our business.
Many of our operations are highly labor intensive. We have collective bargaining agreements with our employees at several plant locations and distribution centers. Approximately 34% of our work force is unionized. If our unionized employees were to engage in a strike, work stoppage or other slowdown at any of our plants, this could adversely affect our ability to produce our products. In addition, any significant increase in labor costs or the making of other significant concessions as a result of agreements with our unionized workforce could have a material adverse effect on our business, financial condition and results of operations.
Risks Relating to our Public Debt
Our substantial level of indebtedness could have a material adverse effect on our financial condition and prevent us from fulfilling our debt service obligations.
As of December 31, 2015, we had $829.8 million of total indebtedness at face value. Face value excludes adjustments for unamortized premium and discounts. In addition, subject to restrictions in the indenture governing the 9.50% Senior Notes (the “Indenture”) and restrictions in our current debt agreements, we may incur additional indebtedness. Our high level of indebtedness could have important consequences, including the following:
• | it may be more difficult for us to satisfy our obligations with respect to the 9.50% Senior Notes; |
• | our ability to obtain additional financing for working capital, capital expenditures, acquisitions or general corporate purposes may be impaired; |
• | we must use a substantial portion of our cash flow from operations to pay interest and principal on the 9.50% Senior Notes and other indebtedness, which will reduce the funds available to us for other purposes such as capital expenditures; |
• | we may be more vulnerable to economic downturns and adverse developments in our business; and |
• | there would be a material adverse effect on our business and financial condition if we were unable to service our indebtedness or obtain additional financing, as needed. |
Without a successful equity capital raise or refinance of our current long-term debt, or some combination thereof, we will not have sufficient liquidity to satisfy these obligations as they become due in 2017.
Covenants in our debt instruments may limit our ability to operate our business and any failure by us to comply with such covenants may accelerate our obligation to repay the underlying debt.
Certain debt instruments contain covenant restrictions that limit our ability to operate our business, including covenant restrictions that may prevent us from:
• | incurring additional debt or issuing guarantees; |
• | creating liens; |
• | entering into certain transactions with our affiliates; and |
• | consolidating, merging or transferring all or substantially all of our assets and the assets of our subsidiaries on a consolidated basis. |
The Revolving Loan Facility and the Term Loan due 2017 requires us to maintain specific leverage ratios, and the Indenture governing the 9.50% Senior Notes requires us to meet a specific fixed charge coverage ratio prior to incurring certain additional debt. Our ability to comply with these covenants is dependent on our future performance, which will be subject to many factors, some of which are beyond our control, including prevailing economic conditions. Our failure to comply with these obligations could prevent us from borrowing additional money and could result in our default. If a default occurs under any of
14
our senior indebtedness, the relevant lenders could elect to declare such indebtedness, together with accrued interest and other fees, to be immediately due and payable and to proceed against our assets that secure such senior indebtedness. Moreover, if the lenders under a facility or other agreement in default were to accelerate the indebtedness outstanding under that facility, it could result in a default under other indebtedness. If all or any part of our indebtedness were to be accelerated, we may not have or be able to obtain sufficient funds to repay it. In addition, we may incur other indebtedness in the future that may contain financial or other covenants that are more restrictive than those contained in the Indenture. As a result of these and certain other covenants, our ability to respond to changes in business and economic conditions and to obtain additional financing, if needed, may be significantly restricted, and we may be prevented from engaging in transactions that might otherwise be beneficial to us.
We are controlled by a principal equity holder who will be able to make important decisions about our business and capital structure.
A majority of our shares are held by Paine & Partners Fund III, an affiliate of Paine & Partners. As a result, Paine & Partners controls us and has the power to elect the members of our board of directors, appoint new management and approve any action requiring the approval of the holders of our stock, including approving acquisitions or sales of all or substantially all of our assets. Paine & Partners has the ability to control decisions affecting our capital structure, including the issuance of additional capital stock, the implementation of stock repurchase programs and the declaration of dividends. The interests of our principal equity holder may not be aligned with the holders of our 9.50% Senior Notes. Our principal equity holder may have an interest in pursuing acquisitions, divestitures, financings or other transactions that, in their judgment, could enhance their equity investment, even though such transactions might involve risks to the holders of our 9.50% Senior Notes.
Any lower-than-expected rating of our bank debt and debt securities could adversely affect our business.
Two rating agencies, Moody's and Standard & Poor's, rate our debt securities. If the rating agencies were to reduce their current ratings, then our ability to access certain financial markets may become limited, the perception of us in the view of our customers, suppliers and security holders may worsen and as a result, our business and financial condition may be adversely affected.
Item 1B.Unresolved Staff Comments
None.
Item 2.Properties
Our principal properties include our manufacturing facilities and our distribution centers. A depiction of our global manufacturing footprint, excluding our non-consolidated joint ventures in India, Spain, Norway, Greece and China, is below:
North America | South America | Europe | ||||||
 |  |  |  |  | ||||
United States (8) | Brazil (1) | France (2) | Germany (2) | Portugal (6) | ||||
 |  |  | ||||||
Mexico (2) | The Netherlands (2) | Poland (1) | ||||||
We have eight domestic manufacturing facilities in Missouri, Texas and Pennsylvania and sixteen international manufacturing facilities in Mexico, Germany, Portugal, Poland, the Netherlands, Brazil and France, excluding our five non-consolidated joint ventures. We have global capacity to annually produce approximately 307,000 metric tons of wire, 231,000 metric tons of rope, 35,000 metric tons of engineered products and 5,000 metric tons of recycled raw materials. Utilization of manufacturing capacity varies by manufacturing plant based upon the type of products assigned and the level of demand for those products.
The Company adequately uses its total production capacity. Utilization of manufacturing capacity varies by manufacturing plant based upon the type of products assigned and the level of demand for those products.
15
We have twenty stand-alone distribution facilities in the U.S., Portugal, the Netherlands, France, United Kingdom, Australia, Denmark, Slovakia and Czech Republic. In addition to these distribution facilities, we have warehouse space available at substantially all of our manufacturing facilities.
We own all but five of our manufacturing facilities and lease fourteen stand-alone distribution centers. Refer to Note 13—“Commitments and Contingencies” to our consolidated financial statements included in Item 8, Financial Statements and Supplementary Data, of this annual report for further information on the Company's lease commitments.
Most of our properties and other assets are subject to liens securing our various borrowings. Refer to Note 6—“Borrowings” to our consolidated financial statements included in Item 8, Financial Statements and Supplementary Data, of this annual report for further information on assets secured.
We believe our properties are in good condition, well maintained, adequately utilized and sufficient to support the anticipated operations of the business.
Item 3.Legal Proceedings
We are not a party to any material legal proceedings. From time to time, we are involved in routine litigation arising in the ordinary course of business, which is incidental to our operations. For further information required by this item, refer to Note 13—“Commitments and Contingencies” to our consolidated financial statements included in Item 8, Financial Statements and Supplementary Data, of this annual report.
Item 4.Mine Safety Disclosures
Not applicable.
PART II
Item 5.Market for Registrant’s Common Equity, Related Stockholder Matters and Issuer Purchases of Equity Securities
The Registrant's common equity consists of common stock that is privately held and there is no established public trading market. As of March 10, 2016, there was one stockholder of record. There are currently no significant restrictions on the ability of the Registrant to pay dividends to WireCo WorldGroup US Holdings Inc., its sole stockholder.
Item 6.Selected Financial Data
The selected financial data below should be read in conjunction with Item 7, Management’s Discussion and Analysis of Financial Condition and Results of Operations, and Item 8, Financial Statements and Supplementary Data, of this annual report. During the periods presented, we acquired businesses as set forth in the footnotes. The Company's consolidated financial statements include the results of operations of these acquired businesses from the date of acquisition and as such, period to period results of operations vary depending on these dates. Accordingly, this selected financial data is not necessarily comparable or indicative of our future financial results.
16
Years ended December 31, | ||||||||||||||||||||
2015 | 2014 | 2013 | 2012 (1) | 2011 (2) | ||||||||||||||||
(in thousands) | ||||||||||||||||||||
Statement of Operations Data: | ||||||||||||||||||||
Net sales | $ | 683,953 | $ | 856,760 | $ | 821,055 | $ | 742,689 | $ | 604,927 | ||||||||||
Gross profit | 161,439 | 208,245 | 198,749 | 163,755 | 158,573 | |||||||||||||||
Operating income | 37,984 | 70,954 | 51,418 | 45,195 | 57,009 | |||||||||||||||
Net loss | (35,508 | ) | (28,773 | ) | (27,004 | ) | (18,174 | ) | (50,707 | ) | ||||||||||
As of December 31, | ||||||||||||||||||||
2015 | 2014 | 2013 | 2012 (1) | 2011 (2) | ||||||||||||||||
Balance Sheet Data: | ||||||||||||||||||||
Working capital (3) | $ | 216,178 | $ | 279,545 | $ | 295,362 | $ | 320,888 | $ | 199,309 | ||||||||||
Total assets (3) | 980,447 | 1,121,274 | 1,185,669 | 1,245,011 | 882,696 | |||||||||||||||
Long-term debt, excluding current maturities | 820,208 | 854,042 | 862,492 | 893,217 | 565,044 | |||||||||||||||
Total stockholders’ equity (deficit) | (16,429 | ) | 44,263 | 96,233 | 112,012 | 129,536 | ||||||||||||||
Years ended December 31, | ||||||||||||||||||||
2015 | 2014 | 2013 | 2012 (1) | 2011 (2) | ||||||||||||||||
Statement of Cash Flows Data: | ||||||||||||||||||||
Cash flows provided by (used in): | ||||||||||||||||||||
Operating activities | $ | 43,046 | $ | 59,418 | $ | 55,151 | $ | 13,554 | $ | 10,653 | ||||||||||
Investing activities | (29,802 | ) | (27,494 | ) | (29,353 | ) | (210,232 | ) | (93,335 | ) | ||||||||||
Financing activities | (45,420 | ) | (4,865 | ) | (40,980 | ) | 214,599 | 56,956 | ||||||||||||
(1) | The 2012 financial information reflects the acquisition of Royal Lankhorst Euronete Group B.V. ("Lankhorst") on July 12, 2012. |
(2) | The 2011 financial information reflects the acquisition of Drumet Liny I Druty Sp Z O.O. ("Drumet") on July 18, 2011. |
(3) | During the fourth quarter of 2015, the Company adopted new accounting guidance regarding the presentation of deferred tax assets and liabilities as non-current in a classified balance sheet and applied it retrospectively. |
Item 7.Management's Discussion and Analysis of Financial Condition and Results of Operations
Unless the context otherwise requires, the use of the terms “WireCo,” the “Company,” “we,” “our” or “us” in the following refers to WireCo WorldGroup (Cayman) Inc., its wholly-owned subsidiaries, including WireCo WorldGroup Inc., and subsidiaries in which it has a controlling interest.
Management’s Discussion and Analysis (“MD&A”) provides a reader of our financial statements with a narrative from the perspective of our management on our consolidated results of operations, financial condition, liquidity and capital resources on a historical basis and certain other factors that have affected recent earnings, as well as those factors that may affect future earnings. Please see “Cautionary Information Regarding Forward-Looking Statements” for a discussion of the risks, uncertainties and assumptions relating to these statements. This MD&A is provided as a supplement to, and should be read in conjunction with the consolidated financial statements and accompanying notes included in Item 8, Financial Statements and Supplementary Data, of this annual report.
Non-GAAP Financial Measures
Our consolidated financial statements are prepared in accordance with U.S. generally accepted accounting principles (“GAAP”). This MD&A includes various financial measures that have not been calculated in accordance with GAAP, commonly referred to as “Non-GAAP Financial Measures”. These Non-GAAP Financial Measures include:
• | Adjusted EBITDA |
• | Credit Agreement EBITDA |
• | Adjusted Working Capital |
• | Net Debt |
• | Free Cash Flow |
17
We provide Adjusted EBITDA and Credit Agreement EBITDA as a means to enhance communication with security holders by providing additional information regarding our operating results. We use these Non-GAAP Financial Measures internally to evaluate our performance, allocate resources, calculate debt covenant ratios and for incentive compensation purposes. We believe that our presentation of these measures provides investors with greater transparency with respect to our results of operations, are required for debt covenant calculation purposes and are useful for peer and period-to-period comparisons of results considering our history of acquisitions.
We provide Adjusted Working Capital, Net Debt and Free Cash Flow as additional information regarding our liquidity. We believe that Adjusted Working Capital provides a meaningful measure of our efforts to manage inventory, our customer collections and vendor payments. We believe Net Debt is meaningful to investors because management assesses our leverage position after factoring in available cash and restricted cash that eventually could be used to repay outstanding debt. We believe that the Free Cash Flow measure is meaningful to investors because it represents the cash flow we have available to pay down debt and/or invest for future growth. It is important to note that Free Cash Flow does not represent the residual cash flow available for discretionary expenditures since other non-discretionary expenditures, such as mandatory debt service requirements, are not deducted from the measure.
These measures are not in accordance with, or an alternative to GAAP, and may be different from Non-GAAP Financial Measures used by other companies. These measures have important limitations as analytical tools and should not be considered in isolation, nor as a substitute for, or superior to, analysis of our results as reported under GAAP. We recommend that investors view these measures in conjunction with the GAAP measures included in this MD&A and have provided reconciliations of reported GAAP amounts to the Non-GAAP amounts.
BUSINESS OVERVIEW
We are a leading global manufacturer of both steel and synthetic rope, specialty wire and engineered products. Our products are used in a diverse range of industries including, but not limited to, industrial and infrastructure, oil and gas (both offshore and onshore), fishing, mining, maritime, structures, poultry and storage systems. Our global manufacturing footprint includes 24 manufacturing facilities in 8 countries.
EXECUTIVE SUMMARY
We provide steel and synthetic rope, specialty wire and engineered products across multiple customers and geographies which
results in a diversified revenue stream. The long-term sales growth and profitability of our product portfolio is dependent not
only on increased demand in the end markets which we serve and the overall economic environment, but also on our ability to
increase our existing market share and expand our presence geographically, continuously improve operational excellence,
identify, consummate and integrate strategic acquisitions and develop and market innovative new products.
For the year ended December 31, 2015, we reported sales of $684.0 million, a net loss of $35.5 million and Adjusted EBITDA of $106.4 million compared to sales of $856.8 million, a net loss of $28.8 million and Adjusted EBITDA of $151.0 million for the year ended December 31, 2014. Given our global operations, the strengthening of the U.S. dollar had a significant negative impact on our 2015 results. For the year ended December 31, 2015, approximately 68% of our sales were generated in currencies other than the U.S. dollar. During 2015, the euro, Polish złoty and Mexican peso all devalued between 19-20% compared to the year ended December 31, 2014. Given the translation of our international results into U.S. dollars, this devaluation unfavorably impacted our sales by $87.0 million and our Adjusted EBITDA by $15.5 million for the twelve months ended December 31, 2015. The foreign currency exchange impact on cash for the year ended December 31, 2015 is a decrease of $5.0 million. Conversely, while the appreciation of the U.S. dollar has an immediate negative impact on our earnings, there is potential for leveraging a weakening currency as a competitive sales advantage. Given our scale and ability to serve a global market, when our non-U.S. manufactured products are imported by customers in countries that have not experienced a currency devaluation, the prices of these produced goods have decreased.
As a result of the weakening oil and gas end market during 2015, we reduced our factory work force in the United States, Mexico and Poland and implemented workforce reductions in several administrative departments. In addition, we took other cost containment measures, such as certain procurement initiatives and other selling and administrative savings. The disciplined management of capital expenditures during 2015 has also contributed to our cost savings initiatives. During 2015, management achieved $18.3 million of savings resulting from operational initiatives.
During the year ended December 31, 2015, we reduced our inventory in order to better match current demand. As a result, we reduced inventory levels by $38.1 million at December 31, 2015 as compared to the December 31, 2014 balance. In addition, we are strategically supporting certain customers in the short-term with longer payment terms which has resulted in an increase in days sales outstanding. Despite short-term challenges in some of our end markets, we continue to believe that our targeted strategies, including acquisitions, geographic expansion, market share gains and new product development, will provide attractive long-term opportunities for sustainable growth. We remain focused on maintaining our financial strength by
18
adjusting our cost structure to reflect changes in demand levels and by proactively managing working capital and cash flow generation.
CONSOLIDATED RESULTS OF OPERATIONS
This section focuses on significant items that impacted our operating results during the years ended December 31, 2015, 2014 and 2013.
Our reported financial condition and results of operations have been translated to U.S. dollars from multiple currencies, which primarily include the euro, the Mexican peso and the Polish złoty. Our revenues and certain expenses are affected by fluctuations in the value of the U.S. dollar against these local currencies. When we refer to changes in foreign currency exchange rates, we are referring to the differences between the foreign currency exchange rates we use to translate our international operations’ results from local currencies into U.S. dollars for reporting purposes. The impacts of foreign currency exchange rate fluctuations are calculated as the difference between current period activity translated using the current period’s currency exchange rates and the comparable prior year period’s currency exchange rates. We use this method for all countries where the functional currency is not the U.S. dollar.
Year ended December 31, 2015 compared to the year ended December 31, 2014
The following table presents selected consolidated financial data for the years ended December 31, 2015 and 2014:
Years ended December 31, | Change | ||||||||||||||
2015 | 2014 | Dollars | Percent | ||||||||||||
(in thousands) | |||||||||||||||
Net sales | $ | 683,953 | $ | 856,760 | $ | (172,807 | ) | (20.2 | )% | ||||||
Gross profit | 161,439 | 208,245 | (46,806 | ) | (22.5 | )% | |||||||||
Other operating expenses | (123,455 | ) | (137,291 | ) | 13,836 | (10.1 | )% | ||||||||
Other expense, net | (73,370 | ) | (115,368 | ) | 41,998 | (36.4 | )% | ||||||||
Income tax benefit (expense) | (122 | ) | 15,641 | (15,763 | ) | NM | |||||||||
Net loss | $ | (35,508 | ) | $ | (28,773 | ) | $ | (6,735 | ) | NM | |||||
Gross profit as % of net sales | 23.6 | % | 24.3 | % | |||||||||||
Other operating expenses as % of net sales | 18.1 | % | 16.0 | % | |||||||||||
NM = Not Meaningful
Net sales
Our consolidated net sales decreased $172.8 million, or 20.2%, during the year ended December 31, 2015 compared to the same period in 2014. Contributing to the decrease was an $87.0 million decline due to foreign currency exchange rate fluctuations when comparing the average exchange rates for the twelve months ended December 31, 2015 to the average exchange rates for the twelve months ended December 31, 2014.
Excluding the impacts of foreign currency exchange rates, rope sales decreased by $76.7 million primarily due to decreased sales in the onshore oil and gas, mining and industrial and infrastructure end markets. Sales to our onshore oil and gas end market decreased $72.2 million primarily driven by a slowdown in domestic drilling activity evidenced by the decline in rig count. According to Baker Hughes, the average North American onshore rig count during the full fiscal year 2015 was 1,132 compared to 2,182 in 2014, a 48.1% decline, while finishing the year at 756 on December 31, 2015 compared to 2,035 at December 31, 2014. Sales to our mining end market decreased $6.4 million primarily driven by a decrease in tons mined in the United States. According to the National Mining Association, tons mined in the United States decreased by 10.5% during 2015 compared to year-end 2014. Sales to our industrial and infrastructure end market decreased $10.9 million primarily due to weakness with global OEM cranes and continuing softening economic conditions in China. However, offshore oil and gas project sales increased $13.2 million for the year ended December 31, 2015 compared to the same period last year. Rope sales represented 73% of our total consolidated net sales for the years ended December 31, 2015 and 2014.
Excluding the impacts of foreign currency exchange rates, specialty wire sales decreased $1.5 million for the year ended December 31, 2015 compared to the year ended December 31, 2014 primarily due to a slowdown in the fencing wire business in Poland. Specialty wire sales represented 17% of our total consolidated net sales for the year ended December 31, 2015 compared to 16% for the same period in 2014.
19
Excluding the impacts of foreign currency exchange rates, engineered products sales decreased $7.5 million for the year ended December 31, 2015 compared to the year ended December 31, 2014 primarily driven by lower sales within the mature oil and gas portfolio in 2015 and by higher end cap product sales in 2014 than in 2015, partially offset by buoyancy sales. End caps are highly engineered products produced for pipeline sealing applications. Engineered product sales represented 10% of our total consolidated net sales for the year ended December 31, 2015 compared to 11% for the same period in 2014.
Gross profit
Gross profit decreased $46.8 million for the year ended December 31, 2015 compared to 2014, and gross profit as a percentage of sales (“gross margin”) decreased from 24.3% for the year ended December 31, 2014 to 23.6% for the year ended December 31, 2015. The decline in gross profit was directly related to the decline in sales and the lower gross margin was due to product mix as well as price concessions in the industrial and oil and gas markets. Contraction in margins during 2015 was partially offset by management's operational initiatives in procurement, plants and selling, general and administrative ("SG&A"). We saw less volume declines in select specialty wire which generates lower margin than the products in the rope portfolio and conversely, saw greater volume declines in onshore oil and gas products which generate some of the Company's highest margins.
Other operating expenses
Years ended December 31, | Change | ||||||||||||||
2015 | 2014 | Dollars | Percent | ||||||||||||
(in thousands) | |||||||||||||||
Selling expenses | $ | (37,573 | ) | $ | (44,417 | ) | $ | 6,844 | (15.4 | )% | |||||
Administrative expenses | (76,937 | ) | (82,361 | ) | 5,424 | (6.6 | )% | ||||||||
Amortization expense | (8,945 | ) | (10,513 | ) | 1,568 | (14.9 | )% | ||||||||
Other operating expenses | $ | (123,455 | ) | $ | (137,291 | ) | $ | 13,836 | (10.1 | )% | |||||
Other operating expenses decreased $13.8 million, or 10.1%, for the year ended December 31, 2015 compared to the same period in 2014. Total other operating expenses increased as a percentage of net sales from 16.0% for the year ended December 31, 2014 to 18.1% for the year ended December 31, 2015.
Selling expenses decreased $6.8 million, or 15.4%, over the same period in 2014 primarily due to foreign currency exchange rate fluctuations, which accounted for $4.4 million of the change. We incurred $0.9 million less labor and related expenses during the year ended December 31, 2015 compared to the same period in 2014. We incurred $1.3 million less external distributor commissions during the year ended December 31, 2015 compared to the same period in 2014 due to the decline in net sales during the period.
Administrative expenses decreased $5.4 million, or 6.6%, during the year ended December 31, 2015 compared to the same period in 2014. Foreign currency exchange rate fluctuations accounted for $6.5 million of the decrease due to depreciation of the euro, Polish złoty and Mexican peso. Due to the decline in Adjusted EBITDA, incentive compensation was $1.8 million lower during the year ended December 31, 2015 compared to the same period in 2014. We incurred $1.5 million less advisory fees during the year ended December 31, 2015 compared to the same period in 2014 due to external fees incurred on Paine & Partners' behalf related to business process improvements in 2014. We incurred $1.1 million less third party consultant fees during 2015 compared to 2014 primarily due to cost management initiatives, which included the management of more projects with internal resources instead of with external consultants. Due to the corporate headquarters relocation, we incurred $0.9 million less lease expenses during the year ended December 31, 2015 compared to the same period in 2014. We incurred $0.7 million less acquisition costs and $0.5 million less start-up costs during the year ended December 31, 2015 compared to the same period in 2014 due to the purchase of certain assets from Endenburg B.V. in 2014. As a result of our workforce reductions during 2015, we incurred $0.5 million less personnel expenses during the year ended December 31, 2015 compared to the same period in 2014. Partially offsetting these decreases, reorganization and restructuring charges were $6.2 million higher during the year ended December 31, 2015 compared to the same period in 2014 due to workforce reductions and the corporate headquarters relocation. We also incurred $3.2 million in impairment charges during 2015 related to one of our brand names and certain patented technologies.
Amortization expense decreased $1.6 million, or 14.9%, over the same period in 2014 primarily due to the depreciation of the euro, Polish złoty and Mexican peso during the year ended December 31, 2015.
20
Other expense, net
Total other expense decreased by $42.0 million, or 36.4%, for the year ended December 31, 2015, compared to the same period in 2014. This decrease was primarily due to foreign currency exchange fluctuations. Significant components of the change in total other expense were as follows:
Years ended December 31, | Change | ||||||||||||||
2015 | 2014 | Dollars | Percent | ||||||||||||
(in thousands) | |||||||||||||||
Interest expense, net | $ | (70,586 | ) | $ | (78,477 | ) | $ | 7,891 | (10.1 | )% | |||||
Foreign currency exchange gains (losses), net | (1,939 | ) | (36,298 | ) | 34,359 | 94.7 | % | ||||||||
Loss on extinguishment of debt | — | (617 | ) | 617 | 100.0 | % | |||||||||
Other income (expense), net | (845 | ) | 24 | (869 | ) | 3,620.8 | % | ||||||||
Total other expense, net | $ | (73,370 | ) | $ | (115,368 | ) | $ | 41,998 | (36.4 | )% | |||||
Interest expense decreased $7.9 million for the year ended December 31, 2015 primarily due to our cross-currency swaps.
For the year ended December 31, 2015, foreign currency exchange losses were $1.9 million compared to foreign currency exchange losses of $36.3 million for the same period in 2014. At December 31, 2015 and 2014, we had intercompany loans that required remeasurement in the aggregate amounts of $368.5 million and $408.3 million, respectively. Foreign currency exchange losses for the year ended December 31, 2015 primarily related to the depreciation of the euro, Polish złoty and Mexican peso. The U.S. dollar to euro exchange rate at December 31, 2014 was $1.00 to €0.8237 compared to $1.00 to €0.9185 at December 31, 2015. The U.S. dollar to the Polish złoty exchange rate at December 31, 2014 was $1.00 to zł3.5196 compared to $1.00 to zł3.9165 at December 31, 2015. The U.S. dollar to the Mexican peso exchange rate at December 31, 2014 was $1.00 to $14.7348 compared to $1.00 to $17.3398 at December 31, 2015. These losses were partially offset by $31.2 million and $16.1 million unrealized gains in 2015 and 2014, respectively, on the fair value marked-to-market adjustments on the cross-currency swaps. The 2014 unrealized gain on the cross-currency swaps only partially offsets the unrealized losses because the swaps were entered into during late third quarter 2014.
Income tax benefit (expense)
For the year ended December 31, 2015, income tax expense was $0.1 million as compared to income tax benefit of $15.6 million for the year ended December 31, 2014. The resulting effective tax rate was an expense of 0.3% and a benefit of 35.2% for the year ended December 31, 2015 and 2014, respectively. The 2015 effective tax rate was primarily driven by a mix of earnings in various jurisdictions, releases of uncertain tax benefits as well as valuation allowances related to our U.S. deferred tax assets and certain foreign net operating losses.
Year ended December 31, 2014 compared to the year ended December 31, 2013
The following table presents selected consolidated financial data for the years ended December 31, 2014 and 2013:
Years ended December 31, | Change | ||||||||||||||
2014 | 2013 | Dollars | Percent | ||||||||||||
(in thousands) | |||||||||||||||
Net sales | $ | 856,760 | $ | 821,055 | $ | 35,705 | 4.3 | % | |||||||
Gross profit | 208,245 | 198,749 | 9,496 | 4.8 | % | ||||||||||
Other operating expenses | (137,291 | ) | (147,331 | ) | 10,040 | (6.8 | )% | ||||||||
Other expense, net | (115,368 | ) | (67,881 | ) | (47,487 | ) | 70.0 | % | |||||||
Income tax expense | 15,641 | (10,541 | ) | 26,182 | NM | ||||||||||
Net loss | $ | (28,773 | ) | $ | (27,004 | ) | $ | (1,769 | ) | NM | |||||
Gross profit as % of net sales | 24.3 | % | 24.2 | % | |||||||||||
Other operating expenses as % of net sales | 16.0 | % | 17.9 | % | |||||||||||
NM = Not Meaningful
21
Net sales
Our consolidated net sales increased $35.7 million, or 4.3%, for the year ended December 31, 2014 compared to the same period in 2013. Offsetting the increase was a $2.3 million decline due to foreign currency exchange rate fluctuations when comparing the average exchange rates for the twelve months ended December 31, 2014 to the average exchange rates for the twelve months ended December 31, 2013.
Excluding the impacts of foreign currency exchange rates, rope sales increased by $20.8 million which was driven primarily by increased sales in our oil and gas and fishing end markets. Sales of our offshore oil and gas products were up $10.7 million primarily due to new contracts in South America and Europe. Onshore oil and gas sales increased $6.9 million driven by an increase in drilling activity evidenced by a higher average rig count throughout the year relative to the average throughout 2013, despite ending the 2014 fiscal year at a lower rig count, a decline that is anticipated to continue into fiscal year 2015. According to Baker Hughes, the average North American onshore rig count during the full fiscal year 2014 was 2,182 compared to 2,056 in 2013, while finishing the year at 2,035 on December 31, 2014. Fishing sales increased $11.7 million primarily due to product innovation in our netting offerings, new customer activity across several markets globally, and lower gas prices for fishing vessels, which lowers operating costs, increases spending on fishing gear and results in improved fish prices. Maritime sales increased $2.8 million due to growth in new vessel build orders and new customers from the April 2014 Endenburg B.V acquisition, which had maritime, offshore and heavy lifting business activities. These increases were offset by declines of $2.2 million in the mining end market driven by low mineral prices, mine closures and cost reductions at the major mining companies, $6.6 million in the industrial and infrastructure end market as a result of continued macroeconomic weakness in Europe and Asia and $1.8 million in the structures end market due to fewer large bridge projects. Rope sales represented 73% of our total consolidated net sales for the year ended December 31, 2014 compared to 74% for the same period in 2013.
Excluding the impacts of foreign currency exchange rates, specialty wire sales increased $12.7 million for the year ended December 31, 2014 compared to the year ended December 31, 2013 primarily due to increased sales in Mexico. Specialty wire sales represented 16% of our total consolidated net sales for the years ended December 31, 2014 and 2013.
Excluding the impacts of foreign currency exchange rates, engineered products sales increased $4.5 million for the year ended December 31, 2014 compared to the year ended December 31, 2013 driven by an increase in offshore contracts and further product innovation. Engineered product sales represented 11% of our total consolidated net sales for the year ended December 31, 2014 compared to 10% for the same period in 2013.
Gross profit
Gross profit increased $9.5 million for the year ended December 31, 2014 compared to 2013, but gross profit as a percentage of sales (“gross margin”) stayed constant at 24.3%. Improved margin performance was partially offset by costs related to our Inventory Optimization Program. The effect of our Inventory Optimization Program on Cost of sales was $9.2 million in 2014 and $3.0 million in 2013. Excluding the effect of the Inventory Optimization Program, our gross margin would have been 25% in 2014 and 2013. We have seen continued improvement in our margins due to cost reduction initiatives that were partially offset by the margin generated by our product mix. We saw volume growth in select specialty wire and engineered products categories, which generate lower margin than the products in the rope portfolio.
Other operating expenses
Years ended December 31, | Change | ||||||||||||||
2014 | 2013 | Dollars | Percent | ||||||||||||
(in thousands) | |||||||||||||||
Selling expenses | $ | (44,417 | ) | $ | (41,661 | ) | $ | (2,756 | ) | 6.6 | % | ||||
Administrative expenses | (82,361 | ) | (88,598 | ) | 6,237 | (7.0 | )% | ||||||||
Amortization expense | (10,513 | ) | (17,072 | ) | 6,559 | (38.4 | )% | ||||||||
Other operating expenses | $ | (137,291 | ) | $ | (147,331 | ) | $ | 10,040 | (6.8 | )% | |||||
Other operating expenses decreased $10.0 million, or 6.8%, for the year ended December 31, 2014 compared to the same period in 2013. Total other operating expenses decreased as a percentage of net sales from 17.9% for the year ended December 31, 2013 to 16.0% for the year ended December 31, 2014 as a result of generating higher sales while maintaining a steady level of operating expenses.
Selling expenses increased $2.8 million, or 6.6%, over the same period in 2013 primarily due to the increase in commissions of $1.1 million directly related to sales volume and $1.8 million in payroll costs associated with reallocation of certain personnel
22
between administrative expenses and selling expenses primarily related to product development and purchasing. Foreign currency exchange rate fluctuations had no material impact on the change in selling expenses for the year ended December 31, 2014.
Administrative expenses decreased $6.2 million, or 7.0%, over the same period in 2013. Lower reorganization and restructuring charges of $7.3 million, consulting fees of $1.3 million, bank fees of $1.0 million, and foreign currency exchange rate fluctuations of $1.2 million were offset by higher compensation, impairment charges and $0.8 million more of advisory fees. Contributing to the decrease was $4.5 million in payroll costs associated with reallocation of certain personnel between administrative expenses, selling expenses and cost of sales primarily related to product development and purchasing. In 2013, we incurred more reorganization and restructuring charges associated with severance costs related to changes in personnel, including executive management positions. Consulting fees were lower in 2014 compared to 2013 primarily due to cost management initiatives, which included the management of more projects with internal resources and fewer matters requiring external professional services. Also, we incurred non-capitalizable bank fees in the second quarter of 2013 associated with the Second Amendment of the Credit Agreement. Incentive compensation, based on Adjusted EBITDA, was $5.0 million higher in 2014 compared to the same period in 2013 as Adjusted EBITDA increased. Share-based compensation was $1.8 million more in 2014 compared to the same period in 2013 due to grants of options and restricted stock awards in July of 2013. Non-cash impairment charges of $1.1 million were recorded in 2014 related to an office building that was abandoned and the write-off of certain intangible assets.
Amortization expense decreased $6.6 million, or 38.4% over the same period in 2013 primarily due to certain finite-lived intangible assets becoming fully amortized effective the first quarter of 2014 and $0.4 million more of amortization expense in prior year due to the acceleration of amortization associated with a finite-lived trade name that is no longer used.
Other expense, net
Other expense increased by $47.5 million, or 70.0%, for the year ended December 31, 2014, compared to the same period in 2013. Significant components of this change were as follows:
Years ended December 31, | Change | ||||||||||||||
2014 | 2013 | Dollars | Percent | ||||||||||||
(in thousands) | |||||||||||||||
Interest expense, net | $ | (78,477 | ) | $ | (80,830 | ) | $ | 2,353 | (2.9 | )% | |||||
Foreign currency exchange gains (losses) | (36,298 | ) | 13,584 | (49,882 | ) | 367.2 | % | ||||||||
Loss on extinguishment of debt | (617 | ) | — | (617 | ) | 100.0 | % | ||||||||
Other expense, net | 24 | (635 | ) | 659 | 103.8 | % | |||||||||
Other expense, net | $ | (115,368 | ) | $ | (67,881 | ) | $ | (47,487 | ) | 70.0 | % | ||||
Interest expense decreased $2.4 million for the year ended December 31, 2014 primarily due to a decrease in outstanding debt due to principal and excess cash payments, amending the Note Purchase Agreement to reduce the interest rate from 11.75% to 9.00% on the privately placed senior notes, and partial refinancing of debt carried at the highest interest rate of all the Company's debt prior to the amendment.
For the year ended December 31, 2014, foreign currency exchange losses were $36.3 million compared to foreign currency exchange gains of $13.6 million for the same period in 2013. These foreign currency exchange losses were primarily related to the remeasurement of intercompany loans denominated in U.S. dollars for subsidiaries who have a different functional currency. At December 31, 2014 and 2013, we had intercompany loans that required remeasurement in the aggregate amounts of $408.3 million and $473.1 million, respectively. The depreciation of the euro and the Polish złoty on our intercompany loans contributed to most of these unrealized foreign currency exchange losses. The revaluation of intercompany loans denominated in U.S. dollars for subsidiaries whose functional currency is the euro and the Polish złoty resulted in $38.1 million and $11.2 million, respectively, of the losses recognized. The U.S. dollar to euro exchange rate at December 31, 2013 was $1.00 to €0.7251 compared to $1.00 to €0.8237 at December 31, 2014. The U.S. dollar to the Polish złoty exchange rate at December 31, 2013 was $1.00 to zł3.0123 compared to $1.00 to zł3.5196 at December 31, 2014. These losses were partially offset by a $16.3 million unrealized gain on the fair value marked-to-market adjustment on the cross-currency swaps entered into during 2014. During 2013, the revaluation of intercompany loans denominated in U.S. dollars for subsidiaries whose functional currency is the euro resulted in $12.6 million of the gains recognized. The U.S. dollar to euro exchange rate at December 31, 2012 was $1.00 to €0.7579 compared to $1.00 to €0.7251 at December 31, 2013.
Loss on extinguishment of debt increased by $0.6 million for the year ended December 31, 2014 compared to the same period in 2013 due to the call premium and write-off of unamortized debt issuance costs in conjunction with the redemption of a portion of the 9.00% Senior Notes (formerly the 11.75% Senior Notes).
23
Income tax benefit (expense)
For the year ended December 31, 2014, income tax benefit was $15.6 million, a decrease in expense of $26.2 million, as compared to income tax expense of $10.5 million for the year ended December 31, 2013. The resulting effective tax rate was a benefit of 35.2% and an expense of 64.0% for the year ended December 31, 2014 and 2013, respectively. The 2014 effective tax rate was primarily driven by a mix of earnings in various jurisdictions, releases of uncertain tax benefits as well as valuation allowances related to our U.S. deferred tax assets and certain foreign net operating losses.
Adjusted EBITDA
Adjusted EBITDA is a Non-GAAP Financial Measure, defined in the indenture governing the 9.50% Senior Notes, as net income (loss) plus, without duplication: interest expense, income tax expense (benefit), depreciation and amortization, as further adjusted by (i) all fees and costs incurred in connection with any merger, consolidation, acquisition or offering of debt or equity securities, (ii) realized and unrealized gains (losses) resulting from foreign currency transactions, (iii) payments of advisory fees pursuant to the Management Fee Letter with Paine & Partners, LLC, (iv) all amounts deducted in arriving at net income (loss) in respect of severance packages payable in connection with the termination of any officer, director or employee, (v) business optimization expenses and other reorganization or restructuring charges, reserves or expenses (which, for the avoidance of doubt, will include, without limitation, the effect of inventory optimization programs, plant closures, facility consolidations, retention, system establishment costs, contract termination costs, future lease commitments and excess pension charges), (vi) other expenses, such as share-based compensation expense and income (loss) on our investments in joint ventures, and (vii) non-cash items, other than the accrual of revenue in the ordinary course of business. Management uses Adjusted EBITDA to compare our financial measures to those of our peers and for debt covenant calculations. See the section entitled "Non-GAAP Financial Measures" for further information on our Non-GAAP measures.
The following is a reconciliation of net loss to Adjusted EBITDA:
Years ended December 31, | ||||||||||||
2015 | 2014 | 2013 | ||||||||||
(in thousands) | ||||||||||||
Net loss (GAAP) | $ | (35,508 | ) | $ | (28,773 | ) | $ | (27,004 | ) | |||
Plus: | ||||||||||||
Interest expense, net | 70,586 | 78,477 | 80,830 | |||||||||
Income tax expense (benefit) | 122 | (15,641 | ) | 10,541 | ||||||||
Depreciation and amortization | 44,272 | 50,558 | 58,534 | |||||||||
Foreign currency exchange losses (gains), net | 1,939 | 36,298 | (13,584 | ) | ||||||||
Share-based compensation | 7,496 | 7,816 | 5,969 | |||||||||
Other expense (income), net | 845 | (24 | ) | 635 | ||||||||
Loss on extinguishment of debt | — | 617 | — | |||||||||
Acquisition costs (a) | — | 1,453 | 369 | |||||||||
Purchase accounting (inventory step-up and other) (b) | — | — | 2,191 | |||||||||
Advisory fees (c) | 3,907 | 5,397 | 4,551 | |||||||||
Reorganization and restructuring charges (d) | 8,676 | 2,234 | 9,548 | |||||||||
Non- cash impairment of assets | 3,238 | 1,144 | — | |||||||||
Effect of inventory optimization program (e) | — | 9,244 | 2,970 | |||||||||
Other adjustments | 838 | 2,209 | 3,643 | |||||||||
Adjusted EBITDA (Non-GAAP) | $ | 106,411 | $ | 151,009 | $ | 139,193 | ||||||
(a) | Acquisition costs, including costs directly attributable to acquisitions and certain start-up activities, are recorded in Administrative expenses in the consolidated statements of operations. |
(b) | The amortization of purchase accounting inventory step-up adjustments, as well as certain other purchase accounting adjustments, are recorded in Cost of sales in the consolidated statements of operations. |
(c) | Advisory fees consist of the management fee paid to Paine & Partners for administrative and other support services, reimbursement of travel and other out-of-pocket costs incurred on our behalf and external fees incurred on Paine & |
24
Partners' behalf related to business process improvements. Also, payments to certain members of the board of directors are included. Advisory fees are recorded in Administrative expenses in the consolidated statements of operations.
(d) | Reorganization and restructuring charges consist of severance costs related to headcount reductions, reorganizations and consultation fees for legal entity restructurings and synergies from acquisitions and fees associated with any replacement of key executives. Reorganization and restructuring charges are recorded in Administrative expenses in the consolidated statements of operations. |
(e) | As a result of the Inventory Optimization Program, we recorded a charge in Cost of Sales to adjust the inventory value to its net realizable value. |
Credit Agreement EBITDA
Credit Agreement EBITDA is a Non-GAAP Financial Measure, defined in the Credit Agreement as Consolidated Net Income, adjusted by adding thereto, (a) to the extent deducted in determining Consolidated Net Income, the sum of (i) Consolidated Interest Expense, (ii) provision for Taxes based on income of the Parent and its Subsidiaries, (iii) depreciation and amortization expense, (iv) Closing Date Transaction Expenses incurred in connection with the Closing Date Transactions, (v) Transaction Expenses of the type described in clause (a) of the definition thereof, provided that the amount of Transaction Expenses included pursuant to this clause (v) shall not exceed (a) with respect to Transaction Expenses paid to the Sponsor, 1.0% of the value of the applicable transaction and (b) with respect to Transaction Expenses paid to any other Person, such Transaction Expenses as are normal and customary, (vi) non-cash, stock-based compensation expense, (vii) non-recurring or unusual losses or expenses (including non-recurring or unusual losses on permitted sales or dispositions of assets and casualty events), (viii) all other non-cash charges that represent an accrual to the extent no cash is expected to be paid in the next twelve months (excluding any such non-cash item to the extent that it represents an accrual or reserve for potential cash items in any future period or amortization of a prepaid cash item that was paid in a prior period), (ix) Permitted Management Fees paid during such period, (x) non-cash, restricted stock award charges, (xi) unrealized non- cash losses resulting from foreign currency balance sheet adjustments required by GAAP, (xii) severance packages payable in connection with the termination of the ten highest paid officers, directors or employees of Parent or any of its Subsidiaries in an aggregate amount not to exceed $5,000,000 from the Closing Date until the date of determination and (xiii) non-cash minority interest expense; minus (b) to the extent included in determining Consolidated Net Income, the sum of (i) extraordinary, non-recurring or unusual gains (including extraordinary, non-recurring or unusual income or gains on permitted sales or dispositions of assets and casualty events), (ii) all other non-cash income to the extent no cash is expected to be received in the next twelve months (excluding any such non-cash item to the extent it represents the reversal of and accrual or reserve for potential cash item in any prior period), (iii) unrealized non-cash gains resulting from foreign currency balance sheet adjustments required by GAAP, and (iv) non-cash minority interest income.
We use this Non-GAAP Financial Measure to calculate debt covenant ratios, to the extent it differs from Adjusted EBITDA as described above. We believe that our presentation of this measure provides investors with greater transparency with respect to the inputs utilized to determine covenant compliance.
Years ended December 31, | ||||||||||||
2015 | 2014 | 2013 | ||||||||||
(in thousands) | ||||||||||||
Adjusted EBITDA (Non-GAAP) | $ | 106,411 | $ | 151,009 | $ | 139,193 | ||||||
Plus: | ||||||||||||
Additional reorganization and restructuring charges | 261 | 300 | — | |||||||||
Additional effect of Inventory Optimization Program | 470 | — | — | |||||||||
Production curtailment | 2,861 | — | — | |||||||||
Impact of nonrecurring resin procurement costs | 920 | — | — | |||||||||
Impact of nonrecurring and unusual items in Brazil | 3,745 | — | — | |||||||||
Pro forma SG&A expense savings | 7,997 | 4,700 | — | |||||||||
Pro forma facility consolidation | 4,693 | — | — | |||||||||
Additional other adjustments | 359 | 500 | — | |||||||||
Credit Agreement EBITDA (Non-GAAP) | $ | 127,717 | $ | 156,509 | $ | 139,193 | ||||||
25
LIQUIDITY AND CAPITAL RESOURCES
Overview
Our principal sources of liquidity consist of cash from operations and borrowings under our Revolving Loan Facility. Our
principal uses of cash are to fund working capital and capital expenditures, support operations and service our debt. Our
liquidity is influenced by many factors, including the amount and timing of cash collections from our customers and
fluctuations in the cost of our raw materials. Based on our current assessment of our operating plan, we believe that our cash
and cash equivalents balance, cash flow from operations and availability under our Revolving Loan Facility will be adequate to fund anticipated operating, capital and debt service requirements and other commitments over the next twelve months.
As discussed in Note 1—“Organization and Description of the Business” to our consolidated financial statements in Item 8, Financial Statements and Supplementary Data, of this annual report, our debt financing consists of secured credit facilities due in February 2017 and senior notes due in May 2017. We plan to either raise additional equity capital or refinance our current long-term debt, or some combination thereof, in order to satisfy these obligations before they become due.
Total available liquidity, defined as availability under our Revolving Loan Facility plus cash and cash equivalents, was $122.1 million at December 31, 2015 compared to $133.5 million at December 31, 2014. Availability under the Revolving Loan Facility is based upon the maximum borrowing capacity of $145.0 million, less outstanding borrowings, letters of credit and if applicable, further restricted by certain covenants in our credit agreements. On June 24, 2015, we entered into a third amendment (the “Amendment”) to the credit agreement dated as of July 12, 2012 (the "Credit Agreement"). The Amendment, among other things, amended the Credit Agreement to (i) update the Interest Coverage Ratio financial covenant for fiscal quarters ending June 30, 2015 and thereafter from a range of 1.75x to 2.00x to a fixed ratio covenant of 1.50x and (ii) reduce incremental capacity to the greater of (a) $75.0 million and (b) 2.25:1.00 Senior Secured Leverage from the greater of (a) $125.0 million and (b) 2.75:1.00 Senior Secured Leverage. We do not anticipate that the Amendment will have a material impact on our available liquidity.
We reinvest the earnings of substantially all of our subsidiaries in those respective operations. The foreign operating subsidiaries use cash generated from earnings to fund working capital, invest in capital expenditures and service interest and principal payments on intercompany debt. Our outstanding debt is issued by the U.S. operating subsidiary and there are intercompany loans within the Company's legal structure that are paid with earnings from the operating subsidiaries in foreign jurisdictions to provide liquidity in the U.S. for interest and principal payments on our outstanding debt. Of the consolidated cash and cash equivalents balance of $21.1 million at December 31, 2015, cash and cash equivalents held in foreign countries were $18.5 million, of which $3.2 million was in U.S. dollars. The cash balances in currencies other than the U.S. dollar are primarily in the euro and can be readily converted to U.S. dollars. It is our present intention to permanently reinvest
the undistributed earnings associated with our foreign subsidiaries, and our current plans do not require repatriation of these
earnings other than servicing intercompany loans.
Working Capital Management
Within our asset base, working capital management is our largest opportunity for cash generation. During these challenging market conditions, we continue to monitor working capital and our cash conversion cycle. Working Capital, which is all current assets minus all current liabilities, decreased from $279.5 million at December 31, 2014 to $216.2 million at December 31, 2015. Adjusted Working Capital, a Non-GAAP Financial Measure defined as accounts receivable plus inventories less accounts payable and customer advances, decreased $33.2 million from $263.5 million as of December 31, 2014 to $230.4 million as of December 31, 2015. The decrease in Working Capital and Adjusted Working Capital was primarily due to foreign currency exchange rate fluctuations. During this downturn in certain end markets, we are trying to manage inventory levels in line with the demand. Also, we saw declines in accounts receivable and accounts payable related to the reduced demand in certain key end markets of our business. Our days sales outstanding increased from 61 days at December 31, 2014 to 66 days at December 31, 2015 due to supporting customers in our challenging end markets with longer terms. Our days payable outstanding decreased from 56 days at December 31, 2014 to 54 days at December 31, 2015. Adjusted Working Capital as a percentage of annualized fourth quarter 2015 sales was 36.4% compared to 32.5% as a percentage of fourth quarter 2014 sales with a cash conversion cycle of 152 days and 136 days for the respective periods. We use Adjusted Working Capital to monitor our liquidity and believe that Adjusted Working Capital provides a meaningful measure of our efforts to manage inventory, our customer collections and vendor payments.
26
The following is a reconciliation of Adjusted Working Capital to working capital:
December 31, 2015 | December 31, 2014 | |||||||
(in thousands) | ||||||||
Accounts receivable | $ | 124,463 | $ | 143,068 | ||||
Inventories | 186,964 | 225,075 | ||||||
Accounts payable | (72,153 | ) | (98,914 | ) | ||||
Customer advances | (8,918 | ) | (5,716 | ) | ||||
Adjusted Working Capital (Non-GAAP) | $ | 230,356 | $ | 263,513 | ||||
Plus: All other current assets (1) | 33,494 | 75,041 | ||||||
Less: All other current liabilities (1) | (47,672 | ) | (59,009 | ) | ||||
Working capital (GAAP) (1) | $ | 216,178 | $ | 279,545 | ||||
(1) | During the fourth quarter of 2015, the Company adopted new accounting guidance regarding the presentation of deferred tax assets and liabilities as non-current in a classified balance sheet and applied it retrospectively. |
Cash Flow Information
The following table summarizes our cash flows from operating, investing and financing activities for the years ended December 31, 2015, 2014 and 2013, respectively.
Years ended December 31, | ||||||||||||
2015 | 2014 | 2013 | ||||||||||
(in thousands) | ||||||||||||
Cash flows provided by (used in) | ||||||||||||
Operating activities | $ | 43,046 | $ | 59,418 | $ | 55,151 | ||||||
Investing activities | (29,802 | ) | (27,494 | ) | (29,353 | ) | ||||||
Financing activities | (45,420 | ) | (4,865 | ) | (40,980 | ) | ||||||
Effect of exchange rates on cash and cash equivalents | (4,959 | ) | (3,851 | ) | 925 | |||||||
Net increase (decrease) in cash and cash equivalents | $ | (37,135 | ) | $ | 23,208 | $ | (14,257 | ) | ||||
Cash and cash equivalents, beginning of year | 58,195 | 34,987 | 49,244 | |||||||||
Cash and cash equivalents, end of year | $ | 21,060 | $ | 58,195 | $ | 34,987 | ||||||
Cash from Operating Activities
Years ended December 31, | ||||||||||||
2015 | 2014 | 2013 | ||||||||||
(in thousands) | ||||||||||||
Net loss | $ | (35,508 | ) | $ | (28,773 | ) | $ | (27,004 | ) | |||
Adjustments to reconcile net loss to net cash provided by operating activities | 55,085 | 88,126 | 61,698 | |||||||||
Changes in assets and liabilities | 23,469 | 65 | 20,457 | |||||||||
Net cash provided by operating activities | $ | 43,046 | $ | 59,418 | $ | 55,151 | ||||||
Cash flows from operating activities decreased during the year ended December 31, 2015 as compared to the same period in 2014 primarily due to less cash earnings related to business performance and foreign currency translation. Cash earnings is our net loss adjusted for non-cash items, such as depreciation and amortization among other reconciling items.
27
Cash from Investing Activities
Years ended December 31, | ||||||||||||
2015 | 2014 | 2013 | ||||||||||
(in thousands) | ||||||||||||
Capital expenditures | $ | (29,802 | ) | $ | (24,872 | ) | $ | (29,318 | ) | |||
Acquisition of business, net of cash acquired | — | (4,573 | ) | — | ||||||||
Other investing activities | — | 1,951 | (35 | ) | ||||||||
Net cash used in investing activities | $ | (29,802 | ) | $ | (27,494 | ) | $ | (29,353 | ) | |||
Cash flows from investing activities consist primarily of capital expenditures that are funded with cash from operations and draws on our Revolving Loan Facility when necessary. We will continue reinvesting in our business in 2016 to capitalize on our long-term growth opportunities. We expect capital expenditures to be between $20 million and $35 million for 2016. A significant portion of the anticipated capital expenditures in 2016 are not committed and represent discretionary capital investments that we plan to make as we believe they would generate an immediate return. During 2014, we purchased certain assets from Endenburg B.V. for approximately $4.6 million. We expect to continue seeking and completing strategic business acquisitions that are complementary to our business.
Cash from Financing Activities
Years ended December 31, | ||||||||||||
2015 | 2014 | 2013 | ||||||||||
(in thousands) | ||||||||||||
Principal payments on long-term debt | $ | (17,908 | ) | $ | (14,232 | ) | $ | (20,824 | ) | |||
Debt issuance costs paid | (1,067 | ) | — | (1,880 | ) | |||||||
Retirement of long-term debt | — | (26,946 | ) | — | ||||||||
Net borrowings (repayments) under revolving credit agreements | (26,445 | ) | 36,750 | (18,276 | ) | |||||||
Other financing activities | — | (437 | ) | — | ||||||||
Net cash used in financing activities | $ | (45,420 | ) | $ | (4,865 | ) | $ | (40,980 | ) | |||
Cash flows from financing activities result primarily from borrowings under our revolving credit agreements and payments on long-term debt. During 2015, we paid down our long-term debt $45.4 million. We plan to pay $8.9 million on our debt in 2016 related to principal payments and other required payments.
Long-term Debt
We have historically funded our growth, capital spending and acquisitions through a combination of operating cash flows and debt financing. Our debt financing at December 31, 2015 consisted primarily of long-term debt. For a detailed discussion of our borrowings, see Note 6—“Borrowings” to our consolidated financial statements in Item 8, Financial Statements and Supplementary Data, of this annual report.
Revolving Loan Facility and Term Loan due 2017 – On July 12, 2012, we entered into a credit agreement (“Credit Agreement”) with Goldman Sachs Bank USA and Deutsche Bank Securities Inc., as joint lead arrangers, and Fifth Third Bank, as the administrative and collateral agent, that provides for a $335.0 million senior secured term loan (“Term Loan due 2017”) and a $145.0 million senior secured revolving credit facility (“Revolving Loan Facility” and together with the Term Loan due 2017, the “Credit Facilities”), with sub-limits for letters of credit and swingline loans. The Term Loan due 2017 was issued at an original issue discount of 1.00% or $3.4 million. The Credit Facilities mature on February 15, 2017. The Term Loan due 2017 requires quarterly principal payments of approximately $0.8 million, which can be adjusted downward as a result of the annual excess cash flow payment, if applicable, as defined in the Credit Agreement. As of December 31, 2015 and 2014, the Company calculated an annual excess cash flow payment of $5.8 million and $13.9 million, respectively, which is classified in Current maturities of long-term debt in the consolidated balance sheets. A 2013 amendment to the Credit Agreement required proceeds from the Inventory Optimization Program be used to pay down the Term Loan due 2017 balance. We calculated a payment of $1.8 million from these proceeds at December 31, 2014, which is classified in Current maturities of long-term debt in the consolidated balance sheet.
On June 24, 2015, the Company entered into a third amendment (the “Amendment”) to the Credit Agreement. The Amendment, among other things, amended the Credit Agreement to (i) update the Interest Coverage Ratio financial covenant for fiscal quarters ending June 30, 2015 and thereafter from a range of 1.75x to 2.00x to a fixed ratio covenant of 1.50x and (ii) reduce incremental capacity to the greater of (a) $75,000 and (b) 2.25:1.00 Senior Secured Leverage from the greater of (a)
28
$125,000 and (b) 2.75:1.00 Senior Secured Leverage. During 2015, the Company paid $1,067 in debt issuance costs in connection with this Amendment that are being amortized to interest expense over the term of the debt instrument.
Borrowings under the Credit Facilities incur interest at a variable rate based upon the nature of the loan under the facility. Loans are designated as either (i) Alternate Base Rate (“ABR”) or (ii) Eurodollar loans. ABR loans incur interest at the higher of (x) the prime rate of Fifth Third Bank or (y) the federal funds rate plus 1/2 of 1.00% (the higher of (x) or (y) equals the “Base Rate”), plus a margin of 3.75%. Eurodollar loans incur interest at the applicable LIBOR, plus a margin of 4.75%. A Eurodollar loan is distinguished from an ABR loan in that a Eurodollar loan bears interest in reference to the applicable LIBOR. The Base Rate applicable to the Term Loan is subject to a 2.25% floor, and the LIBOR applicable to the Term Loan is subject to a 1.25% floor. In addition to paying interest on the outstanding principal balance under the Credit Agreement, we must pay a commitment fee to the lenders under the Revolving Loan Facility for unutilized commitments at a rate ranging from approximately 0.38% to 0.50%, based on our consolidated leverage. We must also pay customary arrangement fees, upfront fees, administration fees and letter of credit fees. Interest on ABR loans is payable on the last business day of each March, June, September and December, and interest on Eurodollar loans is payable on the last day of the applicable interest period for loans of three months or less and, for loans of more than three months, at the end of each three month period starting on the first day of the applicable interest period. The interest rate on the Term Loan due 2017 was 6.00%, 6.00% and 6.00% at December 31, 2015, 2014, and 2013, respectively. The weighted average interest rate on the Revolving Loan Facility was 5.38%, 5.38% and 4.95% at December 31, 2015, 2014, and 2013, respectively.
The Credit Agreement contains covenants that restrict the ability of the Company and guarantors to take certain actions,
including, among other things and subject to certain significant exceptions: incurring indebtedness, incurring liens, paying
dividends and making other distributions, limiting capital expenditures, engaging in mergers and acquisitions, selling property,
engaging in transactions with affiliates or amending organizational documents. The Credit Agreement requires us to comply with certain financial ratio maintenance covenants, including a maximum consolidated net leverage ratio and a minimum consolidated interest coverage ratio. The Credit Agreement also contains customary affirmative covenants and events of default. As of December 31, 2015, we were in compliance with all restrictive and financial covenants associated with our borrowings, and we expect to be in compliance with these covenants throughout 2016.
9.00% Senior Notes (formerly the 11.75% Senior Notes) – On July 12, 2012, we issued $82.5 million aggregate principal amount of unsecured 11.75% Senior Notes due May 15, 2017 in a private placement pursuant to a note purchase agreement (the “Note Purchase Agreement”). On July 16, 2014, we entered into an amendment to the Note Purchase Agreement that reduced the interest rate from 11.75% to 9.00% on these senior notes ("9.00% Senior Notes") and provided a waiver for the notice of redemption. On July 17, 2014, we redeemed $26.5 million of the $82.5 million aggregate principal amount of the 9.00% Senior Notes, using available cash and cash drawn under the Revolving Loan Facility.
9.50% Senior Notes – On May 19, 2010, we issued $275.0 million aggregate principal amount of unsecured 9.50% Senior Notes due May 15, 2017 ("9.50% Senior Notes") at an original issue discount of $6.8 million, or 97.53%, of their aggregate principal amount under the indenture governing the 9.50% Senior Notes (the “Indenture”). On June 10, 2011, we issued an additional $150.0 million aggregate principal amount of unsecured 9.50% Senior Notes at a premium of $6.2 million, or 104.75%, of their aggregate principal amount under the Indenture. Interest on the 9.50% Senior Notes is due semi-annually on May 15th and November 15th of each year. The effective interest rate on the aggregate principal amount of 9.50% Senior Notes, including debt issuance costs, is 10.39%. The 9.50% Senior Notes are redeemable at our option, in whole or in part, during the twelve-month period beginning on May 15, 2015 and thereafter at 100.00%. In the event of a change in control, we may repurchase the 9.50% Senior Notes at a price equal to 101.00% of the principal amount, plus accrued and unpaid interest.
Net Debt
At December 31, 2015, our total debt, including capital leases, was $831.4 million compared to Net Debt of $808.8 million, with the difference being cash currently and eventually available to pay down our outstanding debt. Net Debt is a Non-GAAP Financial Measure defined as consolidated total debt at face value plus capital lease obligations less cash and cash equivalents and restricted cash. Total debt decreased $45.2 million from December 31, 2014 due to repayments on our revolver, routine principal payments and passage of time with our capital lease contracts. Our Net Leverage ratio, Net Debt to the last twelve months of Adjusted EBITDA, increased to 6.34x at December 31, 2015, compared to 5.42x at December 31, 2014, due to the decline in Adjusted EBITDA. We believe Net Debt is meaningful to investors because management assesses our leverage position after factoring in available cash and restricted cash that eventually could be used to repay outstanding debt.
29
The following is a reconciliation of total debt to Net Debt:
December 31, 2015 | December 31, 2014 | |||||||
(in thousands) | ||||||||
Borrowings under Revolving Loan Facility | $ | 42,305 | $ | 68,750 | ||||
Term Loan due 2017 | 306,454 | 324,362 | ||||||
9.00% Senior Notes due 2017 | 56,000 | 56,000 | ||||||
9.50% Senior Notes due 2017 | 425,000 | 425,000 | ||||||
Other indebtedness | — | 157 | ||||||
Capital lease obligations | 1,619 | 2,328 | ||||||
Total debt at face value plus capital lease obligations (GAAP) | $ | 831,378 | $ | 876,597 | ||||
Less: Cash and cash equivalents | (21,060 | ) | (58,195 | ) | ||||
Less: Restricted cash | (1,522 | ) | (1,565 | ) | ||||
Net Debt (Non-GAAP) | $ | 808,796 | $ | 816,837 | ||||
As of December 31, 2015, we were in compliance with all restrictive and financial covenants associated with our borrowings. As defined in our respective credit agreements, the Senior Secured Net Leverage to Adjusted EBITDA ratio was 2.58x at December 31, 2015 compared to the maximum ratio of 3.25x. The maximum Senior Secured Net Leverage Ratio will step-down to 3.00x effective June 30, 2016. As defined in our respective credit agreements, the interest coverage ratio was 2.03x at December 31, 2015 compared to a required ratio of no less than 1.50x.
Free Cash Flow
We generated cash flow from operations of $43.0 million and $8.0 million in Free Cash Flow during the year ended December 31, 2015. Free Cash Flow, a Non-GAAP Financial Measure, is defined as cash flows from operating activities less capital expenditures, acquisitions and other investing activities and further adjusted by effect of exchange rates on cash and cash equivalents and other items. Our Free Cash Flow is lower than cash flow from operations primarily due to capital expenditures and changes in foreign currency rates.
We believe that the Free Cash Flow measure is meaningful to investors because it represents the cash flow we have available to pay down debt and/or invest for future growth. We use Free Cash Flow internally for incentive compensation purposes. It is important to note that Free Cash Flow does not represent the residual cash flow available for discretionary expenditures since other non-discretionary expenditures, such as mandatory debt service requirements, are not deducted from the measure. Free Cash Flow is also equivalent to the change in Net Debt.
The following is a reconciliation of net cash provided by operating activities to Free Cash Flow:
Years ended December 31, | ||||||||
2015 | 2014 | |||||||
(in thousands) | ||||||||
Net cash provided by operating activities (GAAP) | $ | 43,046 | $ | 59,418 | ||||
Less: capital expenditures | (29,802 | ) | (24,872 | ) | ||||
Less: acquisition of business and other investing activities | — | (2,622 | ) | |||||
Effect of exchange rates on cash and cash equivalents | (4,959 | ) | (3,851 | ) | ||||
Other items | (244 | ) | 410 | |||||
Free Cash Flow (Non-GAAP) | $ | 8,041 | $ | 28,483 | ||||
Contractual Obligations and Commitments
The following table provides information regarding our contractual obligations and commitments as of December 31, 2015. Amounts payable in a currency other than the U.S. dollar have been translated using the foreign currency exchange rates in effect as of year-end.
We believe we will be able to fund these obligations through cash generated from our operations, availability under our Revolving Loan Facility and refinancing or changes to our capital structure. Our ability to refinance or change our capital structure is dependent upon certain factors that are outside of management's control. There can be no assurance that we will be
30
successful at any such efforts, if it were necessary to do so in order to meet these obligations. Our contractual obligations will have an impact on our future liquidity.
Payments due by period | ||||||||||||||||||||||||||||
2016 | 2017 | 2018 | 2019 | 2020 | Thereafter | Total | ||||||||||||||||||||||
Obligations: | (in thousands) | |||||||||||||||||||||||||||
Long-term debt (1) | $ | 8,948 | $ | 820,811 | $ | — | $ | — | $ | — | $ | — | $ | 829,759 | ||||||||||||||
Interest on long-term debt (2) | 66,314 | 25,185 | — | — | — | — | 91,499 | |||||||||||||||||||||
Capital leases | 749 | 381 | 366 | 474 | 179 | — | 2,149 | |||||||||||||||||||||
Operating leases | 3,754 | 2,744 | 1,726 | 1,170 | 970 | 3,079 | 13,443 | |||||||||||||||||||||
Pension benefits | 184 | 189 | 191 | 209 | 192 | 1,104 | 2,069 | |||||||||||||||||||||
Total contractual obligations | $ | 79,949 | $ | 849,310 | $ | 2,283 | $ | 1,853 | $ | 1,341 | $ | 4,183 | $ | 938,919 | ||||||||||||||
(1) | The Revolving Loan Facility is classified as long-term and amounts drawn are denoted as due based on the contractual maturity date. |
(2) | Amounts include contractual interest payments using the interest rates as of December 31, 2015 applicable to our variable interest debt instruments and stated fixed rates for all other debt instruments. |
Income Taxes - Due to the uncertainty with respect to the timing of cash payments, the table above excludes unrecognized tax benefits. At December 31, 2015, unrecognized tax benefits of $6.8 million, including interest and penalties, were classified on our consolidated balance sheet in Other non-current liabilities and Non-current deferred income tax liabilities. We do not expect to make significant payments on these liabilities within the next year. For further information, refer to Note 11—“Income Taxes” to our consolidated financial statements in Item 8, Financial Statements and Supplementary Data, of this annual report.
Off-balance Sheet Arrangements
Our liquidity is not dependent on the use of off-balance sheet financing arrangements other than in connection with our operating leases. We also periodically maintain standby letters of credit for purchase of inventory, contract performance on certain sales contracts and other guarantees of our performance.
CRITICAL ACCOUNTING POLICIES
The judgments, assumptions and estimates used by management to prepare our U.S. GAAP consolidated financial statements are based on our historical experiences, current trends and understanding of current facts and circumstances. However, actual results could differ from our judgments, assumptions and estimates, and such differences could be material. Some of our accounting estimates are considered critical as they are both important to the portrayal of our financial condition and results, and require management to make significant, subjective and complex judgments. We believe the following accounting estimates are most critical to aid in fully understanding and evaluating our results. Note 2—“Summary of Significant Accounting Policies” to our consolidated financial statements in Item 8, Financial Statements and Supplementary Data, of this annual report expands upon the discussion of our Company's accounting policies.
Inventories Reserve—We write down our inventory for excess, slow moving and obsolescence to the net realizable value based upon assumptions about future demand and market conditions, such as potential uses, likelihood that overstocked inventory will be sold and the expected selling prices of the inventory. If actual market conditions are less favorable than those we project, additional write-downs may be required. As of December 31, 2015, the estimated reserve for excess, slow moving and obsolete inventory was $5.1 million or 2.7% of the gross inventory balance. During 2014, we recorded a charge of $9.2 million to adjust certain inventory to its net realizable value in connection with our Inventory Optimization Program.
Impairment of property, plant and equipment and finite-lived intangible assets—On a quarterly basis, we review our long-lived asset groups for indicators, such as, a significant decrease in the market price of an asset group, a significant adverse change in the manner in which we are using an asset group, or its physical condition. For purposes of this test, we group long-lived assets at the lowest level of identifiable cash flows, which we have determined to be our key manufacturing locations or combinations thereof. The recoverability of the carrying amount is tested by estimating the undiscounted future cash flows anticipated to be generated by the particular asset(s) being tested for impairment. The key assumptions in the discounted cash flow analysis are the discount rate and the projected cash flows. If our assumptions on discount rates and future cash flows change as a result of events or circumstances, and we believe these assets may have declined in value, we may record impairment charges, resulting in lower profits. During 2015, we concluded that the carrying amount of certain patented technologies exceeded their fair value, and we recognized impairment on these finite-lived intangible assets.
31
Impairment of goodwill and indefinite-lived intangible assets—During 2015, we performed step 1 of the two-step goodwill test for our one reporting unit as of October 1st. We used a discounted cash flow analysis utilizing Level 3 inputs, a guideline public company market approach, and a comparable transaction market approach to determine the fair value of our one reporting unit. Inputs considered for the 2015 goodwill impairment assessment included, but were not limited to: assumptions about future revenue and cost growth rates, discount rates and companies which we identified as peers. As a result of the 2015 assessment, we concluded that the fair value of our reporting unit exceeded the carrying amount by a significant margin.
During 2015, we performed a quantitative impairment assessment relative to our trade names. We used the relief from royalty method to determine the fair value of the brands. Quantitative factors considered for the 2015 brand name impairment assessment included, but were not limited to: revenue projections, growth rates, royalty rates, discount rates and tax rates. As a result of this assessment, it was determined that the fair value of these assets exceeded their carrying amounts. The results of the indefinite-lived intangible assets impairment test showed an excess of fair value to book value in total, but one of our brand names had a carrying amount which exceeded its fair value.
Valuation of intangibles associated with business combinations—We are required to estimate the fair value and useful lives of assets acquired and liabilities assumed, including intangible assets, in a business combination. Under the income approach valuation technique, we primarily use variations of the discounted cash flow method, such as the relief from royalty method and excess earnings method to value intangibles. Judgment used in the valuation of intangible assets can include the cash flows that an asset is expected to generate per management’s projections, royalty rates, growth rates, customer attrition rates, obsolescence curve rates, present value factors, tax shield benefit factors, the weighted average cost of capital and discount rates. We believe that the assumptions made are comparable to those that market participants would use in making estimates of fair value. Additionally, determining the expected life of an intangible asset requires management’s judgment and is based on the evaluation of various factors, including the competitive environment and customer history. We have determined our trade names to have indefinite lives because we plan to use these names into perpetuity. If actual results are not consistent with our estimates, we may be exposed to impairment charges.
Income taxes—We are required to estimate our income taxes in each of the jurisdictions in which we operate. The calculation of our income taxes involves the application of complex tax laws and regulations in a multitude of jurisdictions across our global operations. ASC 740 requires that a tax benefit from an uncertain tax position may be recognized when it is more likely than not that the position will be sustained upon examination, including resolutions of any related appeals or litigation processes, on the basis of technical merits. Our income tax returns are subject to review by various U.S. and foreign taxing authorities. The total amount of unrecognized tax benefits as of December 31, 2015 was $6.8 million, including accrued interest and penalties. If the unrecognized tax benefits were recognized in our consolidated financial statements, $6.8 million would affect income tax expense and our related effective tax rate. The ultimate outcome of tax matters may differ from our estimates and assumptions. Unfavorable settlement of any particular issue may result in increased income tax expense. Favorable resolution could result in reduced income tax expense.
The accounting estimate for valuation allowances against deferred tax assets is a critical accounting estimate because judgment is required in assessing the likely future utilization of our deferred tax assets. The Company considers all positive and negative evidences in making this assessment, including: (i) future reversals of existing taxable temporary differences, (ii) future taxable income exclusive of reversing temporary differences and carryforwards, (iii) taxable income in prior carryback years and (iv) tax planning strategies that would, if necessary, be implemented. In 2015, we concluded it was necessary to maintain a valuation allowance of $56.6 million on $78.9 million of deferred tax assets as we do not expect to realize the tax benefits primarily arising from interest deductions in the U.S. and losses in the U.S. and in various foreign entities.
RECENTLY ISSUED ACCOUNTING STANDARDS
Refer to Note 2—“Summary of Significant Accounting Policies” to our consolidated financial statements in Item 8, Financial Statements and Supplementary Data, of this annual report for a discussion of recently issued accounting standards.
Item 7A.Quantitative and Qualitative Disclosures About Market Risk
Market risk is the potential economic loss arising from adverse changes in market factors. Our exposure to financial market risks results primarily from fluctuations in commodity prices, interest rates and foreign currency exchange rates. We normally
do not use derivative financial instruments to hedge these exposures (except as described below), nor do we use derivatives for trading purposes.
Commodity Price Risk. In our manufacturing operations, we rely heavily on certain raw materials (principally rod, polymers and synthetic fibers) and energy sources (principally electricity, natural gas and propane). We are exposed to changes in the prices of these raw materials and energy sources due to, among other things, fluctuations in foreign and domestic production capacity, availability, consumption and foreign currency exchange rates. Our raw material and energy costs are unpredictable
32
and subject to a variety of factors outside our control. We monitor the cost of our raw materials and pass along price increases and decreases accordingly. We have not entered into any commodity contracts to manage the exposure on forecasted purchases of raw materials.
Interest Rate Risk. Our variable rate debt may be sensitive to fluctuations in interest rates. Variable-rate indebtedness totaled $348.8 million at December 31, 2015. Our Term Loan due 2017 and Revolving Loan Facility contain variable rate debt, which accrues interest based on target interest indexes (LIBOR and prime) subject to certain floors, plus an applicable spread as set forth in the Credit Agreement. In our present condition, a hypothetical 10% increase in LIBOR would not result in any additional interest expense on our Term Loan due 2017 balance as the current variable rate would still be below the 1.25% LIBOR floor. Also, a hypothetical 10% increase in the weighted average interest rate on our borrowings under the Revolving Loan Facility would not have a material impact on interest expense considering the outstanding amount at December 31, 2015. Actual changes in interest rates may differ from hypothetical changes.
Foreign Currency Exchange Rate Risk. Fluctuations in foreign currency exchange rates result in increases or decreases in our foreign currency exchange gains (losses). Our consolidated financial statements are prepared in U.S. dollars, but the assets and liabilities of certain of our foreign subsidiaries are denominated in foreign currencies, which create exposure to changes in foreign currency exchange rates. The activity in the Foreign currency exchange gains (losses), net line item included in our consolidated statements of operations, primarily results from foreign currency exchange rate fluctuations related to intercompany loans denominated in U.S. dollars with subsidiaries whose functional currency is the euro, Polish złoty and Mexican peso. At December 31, 2015, we had intercompany loans that required remeasurement in the aggregate amount of $368.5 million, of which $270.7 million were with a subsidiary whose functional currency is the euro. For the year ended December 31, 2015, we recognized unrealized foreign currency exchange losses of $27.8 million on these intercompany loans. The foreign currency exchange gains and losses recognized as a result of the remeasurement are unrealized until such time that the loans are paid. The unrealized foreign currency exchange gains (losses) due to a hypothetical 10% change in the exchange rates of the U.S. dollar to the euro, Polish złoty and Mexican peso are shown in the following table:
Year ended December 31, | ||||||
2015 | ||||||
(in thousands) | ||||||
+10% | -10% | |||||
Unrealized foreign currency exchange gains (losses) due to 10% rate movement: | ||||||
U.S. dollar to euro | $ | (73,297 | ) | $ | 9,638 | |
U.S. dollar to Polish złoty | (18,432 | ) | (1,125 | ) | ||
U.S. dollar to Mexican peso | (1,239 | ) | (779 | ) | ||
At times, we have partially hedged foreign currency exchange rate volatility through the use of derivative instruments. During
2014, we entered into cross-currency swaps with an aggregate notional value of $300.0 million, and during 2015, we entered into a cross-currency swap with a notional value of $125.0 million to hedge exposures to foreign currency exchange rate risk. Among other things, the table below includes the potential change in fair value of these instruments related to a hypothetical 10% change in the foreign currency exchange rates. Refer to Note 7—“Derivative Financial Instruments” to our consolidated financial statements included in Item 8, Financial Statements and Supplementary Data, of this annual report for further information on these cross-currency swap contracts.
Cross-currency swaps: | ||||
Fair value at December 31, 2014 | $ | 16,133 | ||
Unrealized gain for the twelve months ended December 31, 2015 | 31,178 | |||
Fair value at December 31, 2015 | 47,311 | |||
Change in fair value due to hypothetical 10% foreign currency exchange rate movement | 42,350 | |||
Notwithstanding our efforts to mitigate some foreign currency exchange rate risk, we do not hedge all of our foreign currency
exposures, and there can be no assurance that our mitigating activities related to the exposures that we hedge will adequately
protect us against risks associated with foreign currency fluctuations.
33
Item 8.Financial Statements and Supplementary Data
Index to Consolidated Financial Statements | Page |
34
Report of Independent Registered Public Accounting Firm
The Board of Directors
WireCo WorldGroup (Cayman) Inc.:
We have audited the accompanying consolidated balance sheets of WireCo WorldGroup (Cayman) Inc. and subsidiaries (the Company) as of December 31, 2015 and 2014, and the related consolidated statements of operations, comprehensive loss, stockholders’ equity (deficit), and cash flows for each of the years in the three-year period ended December 31, 2015. These consolidated financial statements are the responsibility of the Company’s management. Our responsibility is to express an opinion on these consolidated financial statements based on our audits.
We conducted our audits in accordance with the standards of the Public Company Accounting Oversight Board (United States). Those standards require that we plan and perform the audit to obtain reasonable assurance about whether the financial statements are free of material misstatement. An audit includes examining, on a test basis, evidence supporting the amounts and disclosures in the financial statements. An audit also includes assessing the accounting principles used and significant estimates made by management, as well as evaluating the overall financial statement presentation. We believe that our audits provide a reasonable basis for our opinion.
In our opinion, the consolidated financial statements referred to above present fairly, in all material respects, the financial position of WireCo WorldGroup (Cayman) Inc. and subsidiaries as of December 31, 2015 and 2014, and the results of their operations and their cash flows for each of the years in the three-year period ended December 31, 2015, in conformity with U.S. generally accepted accounting principles.
/s/ KPMG LLP
Kansas City, Missouri
March 10, 2016
35
WIRECO WORLDGROUP (CAYMAN) INC. AND SUBSIDIARIES
Consolidated Balance Sheets
(in thousands, except share and per share data)
December 31, 2015 | December 31, 2014 | ||||||
Assets | |||||||
Current assets: | |||||||
Cash and cash equivalents | $ | 21,060 | $ | 58,195 | |||
Restricted cash | 1,522 | 1,565 | |||||
Accounts receivable, net | 124,463 | 143,068 | |||||
Other receivables | 2,779 | 2,305 | |||||
Inventories, net | 186,964 | 225,075 | |||||
Prepaid expenses and other current assets | 8,133 | 12,976 | |||||
Total current assets | $ | 344,921 | $ | 443,184 | |||
Property, plant and equipment, net | 283,655 | 319,198 | |||||
Intangible assets, net | 102,765 | 125,578 | |||||
Goodwill | 181,738 | 188,925 | |||||
Deferred financing fees, net | 9,118 | 15,425 | |||||
Non-current deferred income tax assets | 1,459 | 1,413 | |||||
Derivative assets | 47,519 | 16,133 | |||||
Other non-current assets | 9,272 | 11,418 | |||||
Total assets | $ | 980,447 | $ | 1,121,274 | |||
Liabilities and Stockholders’ Equity | |||||||
Current maturities of long-term debt | $ | 8,948 | $ | 19,113 | |||
Interest payable | 6,159 | 6,322 | |||||
Accounts payable | 72,153 | 98,914 | |||||
Accrued compensation and benefits | 18,516 | 19,117 | |||||
Other current liabilities | 22,967 | 20,173 | |||||
Total current liabilities | $ | 128,743 | $ | 163,639 | |||
Long-term debt, excluding current maturities | 820,208 | 854,042 | |||||
Non-current deferred income tax liabilities | 34,214 | 43,469 | |||||
Other non-current liabilities | 13,711 | 15,861 | |||||
Total liabilities | $ | 996,876 | $ | 1,077,011 | |||
Commitments and contingencies | |||||||
Stockholders’ equity (deficit): | |||||||
Common stock, $0.01 par value. 3,000,000 shares authorized; 2,054,374 and 2,005,205 shares issued and outstanding, respectively, at December 31, 2015 and December 31, 2014 | $ | 21 | $ | 21 | |||
Additional paid-in capital | 240,379 | 232,883 | |||||
Accumulated other comprehensive loss | (80,694 | ) | (48,579 | ) | |||
Accumulated deficit | (164,263 | ) | (125,626 | ) | |||
Treasury stock, at cost; 49,169 shares at December 31, 2015 and 2014 | (14,465 | ) | (14,465 | ) | |||
Total stockholders’ equity (deficit) attributable to WireCo WorldGroup (Cayman) Inc. | $ | (19,022 | ) | $ | 44,234 | ||
Non-controlling interests | 2,593 | 29 | |||||
Total stockholders’ equity (deficit) | $ | (16,429 | ) | $ | 44,263 | ||
Total liabilities and stockholders’ equity | $ | 980,447 | $ | 1,121,274 | |||
The accompanying notes are an integral part of the consolidated financial statements.
36
WIRECO WORLDGROUP (CAYMAN) INC. AND SUBSIDIARIES
Consolidated Statements of Operations
(in thousands)
Years ended December 31, | ||||||||||||
2015 | 2014 | 2013 | ||||||||||
Net sales | $ | 683,953 | $ | 856,760 | $ | 821,055 | ||||||
Cost of sales | (522,514 | ) | (648,515 | ) | (622,306 | ) | ||||||
Gross profit | 161,439 | 208,245 | 198,749 | |||||||||
Other operating expenses: | ||||||||||||
Selling expenses | (37,573 | ) | (44,417 | ) | (41,661 | ) | ||||||
Administrative expenses | (76,937 | ) | (82,361 | ) | (88,598 | ) | ||||||
Amortization expense | (8,945 | ) | (10,513 | ) | (17,072 | ) | ||||||
Total other operating expenses | (123,455 | ) | (137,291 | ) | (147,331 | ) | ||||||
Operating income | 37,984 | 70,954 | 51,418 | |||||||||
Other income (expense): | ||||||||||||
Interest expense, net | (70,586 | ) | (78,477 | ) | (80,830 | ) | ||||||
Foreign currency exchange gains (losses), net | (1,939 | ) | (36,298 | ) | 13,584 | |||||||
Loss on extinguishment of debt | — | (617 | ) | — | ||||||||
Other income (expense), net | (845 | ) | 24 | (635 | ) | |||||||
Total other expense, net | (73,370 | ) | (115,368 | ) | (67,881 | ) | ||||||
Loss before income taxes | (35,386 | ) | (44,414 | ) | (16,463 | ) | ||||||
Income tax benefit (expense) | (122 | ) | 15,641 | (10,541 | ) | |||||||
Net loss | (35,508 | ) | (28,773 | ) | (27,004 | ) | ||||||
Less: Net income (loss) attributable to non-controlling interests | 3,129 | 2,044 | (545 | ) | ||||||||
Net loss attributable to WireCo WorldGroup (Cayman) Inc. | $ | (38,637 | ) | $ | (30,817 | ) | $ | (26,459 | ) | |||
The accompanying notes are an integral part of the consolidated financial statements.
37
WIRECO WORLDGROUP (CAYMAN) INC. AND SUBSIDIARIES
Consolidated Statements of Comprehensive Loss
(in thousands)
Years ended December 31, | ||||||||||||
2015 | 2014 | 2013 | ||||||||||
Net loss | $ | (35,508 | ) | $ | (28,773 | ) | $ | (27,004 | ) | |||
Other comprehensive income (loss): | ||||||||||||
Foreign currency translation gain (loss) | (32,954 | ) | (31,038 | ) | 5,838 | |||||||
Pension benefits | 274 | 64 | (582 | ) | ||||||||
Total other comprehensive income (loss) | $ | (32,680 | ) | $ | (30,974 | ) | $ | 5,256 | ||||
Comprehensive loss | (68,188 | ) | (59,747 | ) | (21,748 | ) | ||||||
Less: Comprehensive income (loss) attributable to non-controlling interests | 2,564 | 1,122 | (790 | ) | ||||||||
Comprehensive loss attributable to WireCo WorldGroup (Cayman) Inc. | $ | (70,752 | ) | $ | (60,869 | ) | $ | (20,958 | ) | |||
The accompanying notes are an integral part of the consolidated financial statements.
38
WIRECO WORLDGROUP (CAYMAN) INC. AND SUBSIDIARIES
Consolidated Statements of Stockholders' Equity (Deficit)
(in thousands)
Common stock | Additional paid-in capital | Accumulated other comprehensive income (loss) | Accumulated deficit | Treasury stock | WireCo WorldGroup (Cayman) Inc. stockholders' equity (deficit) | Non-controlling interests | Total stockholders' equity (deficit) | ||||||||||||||||||||||||
Balance, December 31, 2012 | $ | 21 | $ | 219,137 | $ | (24,028 | ) | $ | (68,350 | ) | $ | (14,465 | ) | $ | 112,315 | $ | (303 | ) | $ | 112,012 | |||||||||||
Share-based compensation | — | 5,969 | — | — | — | 5,969 | — | 5,969 | |||||||||||||||||||||||
Other comprehensive income (loss) | — | — | 5,501 | — | — | 5,501 | (245 | ) | 5,256 | ||||||||||||||||||||||
Net loss | — | — | — | (26,459 | ) | — | (26,459 | ) | (545 | ) | (27,004 | ) | |||||||||||||||||||
Balance, December 31, 2013 | $ | 21 | $ | 225,106 | $ | (18,527 | ) | $ | (94,809 | ) | $ | (14,465 | ) | $ | 97,326 | $ | (1,093 | ) | $ | 96,233 | |||||||||||
Exercise of stock options | — | 228 | — | — | — | 228 | — | 228 | |||||||||||||||||||||||
Share-based compensation | — | 7,816 | — | — | — | 7,816 | — | 7,816 | |||||||||||||||||||||||
Other comprehensive loss | — | — | (30,052 | ) | — | — | (30,052 | ) | (922 | ) | (30,974 | ) | |||||||||||||||||||
Net income (loss) | — | — | — | (30,817 | ) | — | (30,817 | ) | 2,044 | (28,773 | ) | ||||||||||||||||||||
Other | — | (267 | ) | — | — | — | (267 | ) | — | (267 | ) | ||||||||||||||||||||
Balance, December 31, 2014 | $ | 21 | $ | 232,883 | $ | (48,579 | ) | $ | (125,626 | ) | $ | (14,465 | ) | $ | 44,234 | $ | 29 | $ | 44,263 | ||||||||||||
Share-based compensation | — | 7,496 | — | — | — | 7,496 | — | 7,496 | |||||||||||||||||||||||
Other comprehensive loss | — | — | (32,115 | ) | — | — | (32,115 | ) | (565 | ) | (32,680 | ) | |||||||||||||||||||
Net income (loss) | — | — | — | (38,637 | ) | — | (38,637 | ) | 3,129 | (35,508 | ) | ||||||||||||||||||||
Balance, December 31, 2015 | $ | 21 | $ | 240,379 | $ | (80,694 | ) | $ | (164,263 | ) | $ | (14,465 | ) | $ | (19,022 | ) | $ | 2,593 | $ | (16,429 | ) | ||||||||||
The accompanying notes are an integral part of the consolidated financial statements.
39
WIRECO WORLDGROUP (CAYMAN) INC. AND SUBSIDIARIES
Consolidated Statements of Cash Flows
(in thousands)
Years ended December 31, | ||||||||||||
2015 | 2014 | 2013 | ||||||||||
Cash flows from operating activities: | ||||||||||||
Net loss | $ | (35,508 | ) | $ | (28,773 | ) | $ | (27,004 | ) | |||
Adjustments to reconcile net loss to net cash provided by operating activities: | ||||||||||||
Depreciation and amortization | 44,272 | 50,558 | 58,534 | |||||||||
Amortization of debt issuance costs, discounts and premium | 7,885 | 8,347 | 9,026 | |||||||||
Loss on extinguishment of debt | — | 617 | — | |||||||||
Shared-based compensation | 7,496 | 7,816 | 5,969 | |||||||||
Unrealized gain on derivative instruments | (31,178 | ) | (16,133 | ) | — | |||||||
Unrealized foreign currency exchange losses (gains), net | 27,848 | 51,392 | (13,764 | ) | ||||||||
Provision for deferred income taxes | (5,246 | ) | (13,286 | ) | (77 | ) | ||||||
Other adjustments | 4,008 | (1,185 | ) | 2,010 | ||||||||
Changes in assets and liabilities, net of business acquired and disposed: | ||||||||||||
Accounts receivable | 16,670 | (6,523 | ) | 8,320 | ||||||||
Inventories | 21,615 | (17,077 | ) | 24,987 | ||||||||
Prepaid expenses and other assets | 1,557 | 2,553 | (821 | ) | ||||||||
Interest payable | (143 | ) | (1,770 | ) | 143 | |||||||
Accounts payable | (17,508 | ) | 26,969 | (9,019 | ) | |||||||
Other accrued liabilities | 1,278 | (4,087 | ) | (3,153 | ) | |||||||
Net cash provided by operating activities | $ | 43,046 | $ | 59,418 | $ | 55,151 | ||||||
Cash flows from investing activities: | ||||||||||||
Capital expenditures | (29,802 | ) | (24,872 | ) | (29,318 | ) | ||||||
Acquisition of business, net of cash acquired | — | (4,573 | ) | — | ||||||||
Other investing activities | — | 1,951 | (35 | ) | ||||||||
Net cash used in investing activities | $ | (29,802 | ) | $ | (27,494 | ) | $ | (29,353 | ) | |||
Cash flows from financing activities: | ||||||||||||
Principal payments on long-term debt | (17,908 | ) | (14,232 | ) | (20,824 | ) | ||||||
Debt issuance costs paid | (1,067 | ) | — | (1,880 | ) | |||||||
Retirement of long-term debt | — | (26,946 | ) | — | ||||||||
Borrowings under current Revolving Loan Facility | 78,400 | 178,650 | 158,130 | |||||||||
Repayments under current Revolving Loan Facility | (104,845 | ) | (141,900 | ) | (176,406 | ) | ||||||
Other financing activities | — | (437 | ) | — | ||||||||
Net cash used in financing activities | $ | (45,420 | ) | $ | (4,865 | ) | $ | (40,980 | ) | |||
Effect of exchange rates on cash and cash equivalents | (4,959 | ) | (3,851 | ) | 925 | |||||||
Increase (decrease) in cash and cash equivalents | $ | (37,135 | ) | $ | 23,208 | $ | (14,257 | ) | ||||
Cash and cash equivalents, beginning of year | 58,195 | 34,987 | 49,244 | |||||||||
Cash and cash equivalents, end of year | $ | 21,060 | $ | 58,195 | $ | 34,987 | ||||||
Supplemental Disclosure of Cash Flow Information: | ||||||||||||
Cash paid for interest, net of interest capitalized | $ | 67,772 | $ | 69,762 | $ | 72,046 | ||||||
Cash paid for income taxes, net of refunds | 7,047 | 8,617 | 8,042 | |||||||||
The accompanying notes are an integral part of the consolidated financial statements.
40
WIRECO WORLDGROUP (CAYMAN) INC. AND SUBSIDIARIES
Notes to Consolidated Financial Statements
(in thousands, except share and per share data)
(1) Organization and Description of the Business
The financial information included in this annual report on Form 10-K are those of WireCo WorldGroup (Cayman) Inc., its wholly-owned subsidiaries, including WireCo WorldGroup Inc., and subsidiaries in which it has a controlling interest (collectively, the “Company”). WireCo WorldGroup (Cayman) Inc., an exempted company incorporated under the laws of the Cayman Islands, is a holding company. The Company is a global manufacturer of both steel and synthetic rope, specialty wire and engineered products serving a diverse range of end markets, including, but not limited to, industrial and infrastructure, oil and gas (both offshore and onshore), fishing, mining, maritime, structures, poultry and storage systems. The Company has manufacturing locations in North America, South America and Europe, and participates in joint ventures with locations in Europe and Asia.
(2) Summary of Significant Accounting Policies
(a)Principles of Consolidation
The consolidated financial statements include the accounts of the Company, including entities which are not wholly-owned, over which the Company has control. Non-controlling interests result from current and former management members owning 3.3% of the outstanding, non-voting shares of US Holdings and a 20.0% investment in Lankhorst Euronete - Indústria e Comércio Itda in Brazil, both indirect subsidiaries of the Company. Non-controlling interests are presented as a component of the consolidated statements of operations, comprehensive loss and stockholders' equity (deficit) for the periods presented. All intercompany transactions and balances have been eliminated in consolidation. The consolidated financial statements have been prepared in United States ("U.S.") dollars and in accordance with U.S. generally accepted accounting principles (“GAAP”).
(b)Management Estimates
The preparation of financial statements in conformity with U.S. GAAP requires management to make estimates and assumptions that affect reported amounts of certain assets, liabilities, revenue and expenses. Actual results could differ from those estimates.
(c)Comparability of Prior Year Financial Data
Certain reclassifications have been made to prior year amounts on the consolidated balance sheets to conform to the current year presentation.
(d)Cash, Cash Equivalents and Restricted Cash
Cash and all highly liquid investments with an original maturity of three months or less are classified as cash and cash equivalents. Cash balances are recorded net of book overdrafts when a bank right-of-offset exists. All other book overdrafts are recorded in accounts payable. The change in book overdrafts is reported as a component of cash flows from operating activities. Book overdrafts are checks issued, but not presented to banks in excess of cash balances.
The Company maintains restricted cash deposits to support performance guarantees issued to certain customers. These restricted cash deposits are included in a separate financial statement line item in the consolidated balance sheets.
(e)Accounts Receivable, net
Accounts receivable are recorded at the invoiced amount, net of an allowance for doubtful accounts. The allowance is based on the specific identification of receivables the Company considers at risk, and for all other receivables, management considers historical losses, current aging of receivables and existing economic conditions. Account balances are written off against the allowance when it becomes evident that collection will not occur.
41
WIRECO WORLDGROUP (CAYMAN) INC. AND SUBSIDIARIES
Notes to Consolidated Financial Statements (Continued)
(in thousands, except share and per share data)
Below is a rollforward of the allowance for doubtful accounts for the periods indicated:
Years ended December 31, | ||||||||||||
2015 | 2014 | 2013 | ||||||||||
Balance at beginning of year | $ | 2,223 | $ | 3,458 | $ | 3,119 | ||||||
Charged to operations | 682 | 786 | 395 | |||||||||
Deductions from allowance | (566 | ) | (1,737 | ) | (170 | ) | ||||||
Effect of foreign exchange rate changes | (159 | ) | (284 | ) | 114 | |||||||
Balance at end of year | $ | 2,180 | $ | 2,223 | $ | 3,458 | ||||||
(f)Inventories, net
Inventories are stated at the lower of cost or market, determined using the first-in, first-out (“FIFO”) method, net of allowance for excess, slow-moving and obsolete inventory. Inventory costs include raw materials, labor and allocated manufacturing overhead.
(g)Property, Plant and Equipment, net
Property, plant and equipment are stated at historical cost, less accumulated depreciation. Additions and improvements that extend the lives of assets or significantly increase capacity are capitalized, while expenditures for minor tools and equipment and repairs and maintenance are expensed as incurred. The Company capitalizes interest on qualified construction projects.
Depreciation is calculated on a straight-line basis over the estimated useful lives of the respective classes of assets as follows:
Asset category | Useful life | |||
Buildings and improvements | 10 | - | 40 years | |
Machinery and equipment | 5 | - | 20 years | |
Capitalized software | 2 | - | 7 years | |
Furniture, fixtures and office equipment | 2 | - | 5 years | |
Long-lived assets, such as property, plant and equipment, are reviewed for impairment whenever events or changes in business circumstances indicate that the carrying amount of an asset group may not be fully recoverable. For purposes of this test, long-lived assets are grouped at the lowest level of identifiable cash flows. Recoverability of an asset group considered to be held-and-used is determined by comparing the carrying amount of the asset group to the estimated undiscounted future net cash flows expected to be generated by the use of the asset. If the carrying amount exceeds its estimated undiscounted net cash flows, the asset group’s carrying amount is reduced to its estimated fair value.
(h)Intangible Assets and Goodwill
Intangible assets with finite lives, recognized in connection with business combinations, are amortized on a straight-line basis over the estimated useful lives of the respective classes of assets as follows:
Asset category | Useful life | |||
Customer relationships | 5 | - | 20 years | |
Patented and unpatented technology | 5 | - | 20 years | |
Other | 7 years | |||
Finite-lived intangible assets are evaluated for impairment in accordance with the Company’s policy for long-lived assets as discussed above for property, plant and equipment.
Indefinite-lived intangible assets and goodwill, recognized in connection with business combinations, are not amortized. The Company reviews the carrying amount of indefinite-lived intangible assets and goodwill annually on October 1st, or upon the occurrence of events or changes in circumstances that indicate that the carrying amount of the goodwill or intangible assets may not be recoverable. Qualitative factors may be assessed to determine whether it is "more likely than not" that the fair value of the intangible asset/reporting unit is less than its carrying amount. If an election is made not to perform the qualitative assessment or the qualitative assessment indicates it is "more likely than not" that the fair value of the intangible asset/reporting unit is less than the carrying amount, the Company is required to calculate the fair value of the intangible asset/reporting unit. For goodwill, if the fair value of the reporting unit is less than its carrying amount, an indication of impairment exists for the
42
WIRECO WORLDGROUP (CAYMAN) INC. AND SUBSIDIARIES
Notes to Consolidated Financial Statements (Continued)
(in thousands, except share and per share data)
reporting unit and the entity must perform step two of the goodwill impairment test. An impairment loss is recognized for any excess of the carrying amount over the implied fair value.
(i)Debt Issuance Costs
For revolving credit agreements, all costs are capitalized and amortized using the straight-line method over the term of the debt instrument as additional interest expense. All fees associated with the incurrence of other indebtedness are capitalized and amortized using the effective interest method over the term of the debt instrument. For non-substantial debt modifications to debt agreements other than revolving credit agreements, only fees paid directly to the lender are capitalized and amortized using the effective interest method over the term of the debt as additional interest expense. Third-party fees associated with non-substantial debt modifications (e.g. attorney fees) are expensed as incurred in either Administrative expenses or Loss on Extinguishment of Debt in the consolidated statements of operations, depending on the facts and circumstances. Original issuance discounts are recorded as a direct deduction from the face amount of the debt and amortized using the effective-interest method over the term of the debt instrument as additional interest expense. Premiums are recorded as an accretion to the face amount of the debt and amortized using the effective-interest method over the term as a reduction to interest expense.
(j)Derivative Financial Instruments
Derivative financial instruments are measured at fair value and recorded on the balance sheet as either assets or liabilities. The notional value is marked-to-market each reporting period based on various factors, but typically the current spot rate for most of the Company's contracts. For derivative financial instruments that do not qualify for hedge accounting, gains and losses associated with these changes in the fair value are recorded to earnings, as opposed to other comprehensive income/loss, in the period of change. None of the Company's current contracts qualify for hedge accounting.
(k)Fair Value of Financial Instruments
Fair value is the price that would be received to sell an asset or paid to transfer a liability in an orderly transaction between market participants at the measurement date (exit price). Inputs used to measure fair value are within a hierarchy consisting of three levels. Level 1 inputs represent unadjusted quoted prices in active markets for identical assets or liabilities. Level 2 inputs represent unadjusted quoted prices in active markets for similar assets or liabilities, or unadjusted quoted prices for identical or similar assets or liabilities in markets that are not active, or inputs other than quoted prices that are observable for the asset or liability. Level 3 inputs represent unobservable inputs for the asset or liability.
(l)Revenue Recognition
Revenues from the sale of inventories are recognized when the customer takes ownership and assumes the risk of loss, collection of the revenue is probable, persuasive evidence of an arrangement exists and the sales price is fixed and determinable. An allowance for sales returns is recorded as a reduction to revenue. The Company uses the percentage-of-completion method of accounting to recognize revenues and associated costs as work progresses for certain long-term synthetic rope manufacturing contracts. The Company measures the extent of progress towards completion based on the units produced.
Shipping and handling amounts charged to customers to deliver product are included in net sales and the associated shipping and handling costs are included in cost of sales. Sales taxes collected from customers and remitted to government authorities are recorded on a net basis and therefore are excluded from net sales in the consolidated statements of operations.
(m)Share-based Compensation
Share-based compensation expense is measured at the grant date based on the fair value of the award and recognized on a straight-line basis over the vesting period in which the awards are earned. The Company uses the Black-Scholes valuation method to determine the fair value of stock options. The Company's stock price as of the grant date is the fair value of the restricted stock. The incremental compensation cost related to an award modification, which is calculated as the difference in the fair value of the options immediately before and immediately after the modification using the Black-Scholes option pricing model, is recognized immediately. Share-based compensation expense previously recognized is reversed when the employee fails to provide the requisite service and forfeits awards. The Company adjusts the expense when actual forfeitures are different from the Company's estimates.
(n)Pension Obligations
The Company provides defined benefit pension plans to certain active and former employees. Determination of pension obligations is based on assumptions, such as discount rates and rate of increase in compensation levels, made by management in consultation with independent actuaries. Any translational asset/liability, prior service cost/credit or actuarial gain/loss is recognized in other comprehensive income (loss) and expensed in future periods using the corridor approach. As of December 31, 2015 and 2014, the fair value of pension plan assets was $0 and the fair value of projected benefit obligations in aggregate was $2,472 and $2,961, respectively. As a result, the Company's defined benefit pension plans were underfunded by
43
WIRECO WORLDGROUP (CAYMAN) INC. AND SUBSIDIARIES
Notes to Consolidated Financial Statements (Continued)
(in thousands, except share and per share data)
approximately $2,472 and $2,961 at December 31, 2015 and 2014, respectively, and were recorded as a net liability in the consolidated balance sheets.
(o)Income Taxes
Income taxes are accounted for under the asset and liability method. Deferred tax assets and liabilities are recognized for the future tax consequences attributable to temporary differences between the financial statement carrying amounts of assets and liabilities and their respective tax basis, and operating loss and tax credit carryforwards. Deferred tax assets and liabilities are measured using enacted tax rates expected to apply in the years in which those temporary differences are expected to be recovered or settled. Deferred taxes are determined separately for each tax-paying component within each tax jurisdiction based on provisions of enacted tax law. A valuation allowance is established or maintained when, based on currently available information and other factors, it is "more likely than not" that all or a portion of a deferred tax asset will not be realized. The Company considers all positive and negative evidences in making this assessment, including: (i) future reversals of existing taxable temporary differences, (ii) future taxable income exclusive of reversing temporary differences and carryforwards, (iii) taxable income in prior carryback years and (iv) tax planning strategies that would, if necessary, be implemented.
The Company recognizes benefit of a tax return position under the threshold that only if a position is "more likely than not" to be sustained solely based on technical merits. If the recognition threshold is met, the tax benefit is measured and recognized as the largest amount of tax benefit that, in our judgment, is greater than fifty percent likely to be realized. Changes in recognition or measurement are reflected in the period in which the change in judgment occurs. The Company records interest and penalties as a component of income tax expense.
(p)Research and Development Costs
Research and development costs are charged to Administrative expenses as incurred and totaled $4,781, $5,289 and $4,001 in 2015, 2014 and 2013, respectively.
(q)Foreign Currency Translation and Transactions
Assets and liabilities of subsidiaries whose functional currency is not the U.S. dollar were translated at the exchange rate in effect at the balance sheet date, and revenues and expenses were translated at average exchange rates for the period. Translation adjustments are included in other comprehensive income (loss).
Due to their short-term nature, gains and losses on the Company's intercompany loans are included in Foreign currency exchange gains (losses), net in the consolidated statements of operations along with all other gains and losses on foreign currency transactions.
(r)Accounting Standards Adopted During 2015
In November 2015, the Financial Accounting Standards Board ("FASB") issued Accounting Standards Update ("ASU") 2015-17, Balance Sheet Classification of Deferred Taxes, which requires entities with a classified balance sheet to present all deferred tax assets and liabilities as noncurrent. The standard is effective for reporting periods beginning after December 15, 2016; however, early adoption is permitted. The Company early adopted the new guidance in the fourth quarter of 2015 and applied it retrospectively. The adoption of this standard only affected presentation on the consolidated balance sheet; there was no impact on the Company's operating results.
(s)Recently Issued Accounting Standards
In May 2014, the FASB issued ASU 2014-09, Revenue from Contracts with Customers, which requires an entity to recognize the amount of revenue to which it expects to be entitled for the transfer of promised goods or services to customers. ASU 2014-09 will replace most existing revenue recognition guidance in U.S. GAAP. As a result of a deferral of the effective date enacted in July 2015, the new standard would be effective for public entities on January 1, 2018. ASU 2014-09 allows the use of either the retrospective or cumulative effect transition method. The Company is evaluating the effect of ASU 2014-09 and has not yet selected a transition method nor has it determined the effect of the standard on its ongoing financial reporting.
In August 2014, the FASB issued ASU 2014-15, Disclosure of Uncertainties about an Entity's Ability to Continue as a Going Concern, which requires management to evaluate whether there are conditions and events that raise substantial doubt about the entity's ability to continue as a going concern within one year after the financial statements are issued, and to provide the related footnote disclosures when applicable. This ASU is effective for reporting periods beginning after December 15, 2016, with early adoption permitted. The Company does not expect the adoption of this standard will have a material impact on its consolidated financial statements and disclosures.
In April 2015, the FASB issued ASU 2015-03, Interest - Imputation of Interest, to reduce complexity in accounting standards and make the presentation of debt issuance costs consistent with the presentation of debt discounts. This ASU requires debt
44
WIRECO WORLDGROUP (CAYMAN) INC. AND SUBSIDIARIES
Notes to Consolidated Financial Statements (Continued)
(in thousands, except share and per share data)
issuance costs to be presented in the balance sheet as a direct deduction from the carrying amount of the associated debt liability, rather than as an asset. ASU 2015-03 is limited to simplifying the presentation of debt issuance costs and there will be no effect on the income statement. This ASU requires retrospective adoption and is effective for the Company during the first quarter of 2016, with early adoption permitted. Upon adoption, the Company will present its remaining unamortized debt issuance costs as a direct deduction from the carrying amount of the related debt liability.
In July 2015, the FASB issued ASU 2015-11, Simplifying the Measurement of Inventory, which changes the measurement principle for inventory from the lower of cost or market to the lower of cost and net realizable value. This ASU requires prospective adoption and is effective for annual reporting periods beginning after December 15, 2016 and interim periods within those annual periods, with early adoption permitted. The Company does not expect the adoption of this standard will have a material impact on its consolidated financial statements.
In February 2016, the FASB issued ASU 2016-02, Leases, which aims to make leasing activities more transparent and comparable and requires substantially all leases be recognized by lessees on their balance sheet as a right-of-use asset and corresponding lease liability, including leases currently accounted for as operating leases. This ASU is effective for all interim and annual reporting periods beginning after December 15, 2018, with early adoption permitted. The Company is currently evaluating the impact that the adoption of ASU 2016-02 will have on our consolidated financial statements and related disclosures.
(3) Inventories, net
The major classes of inventories were as follows as of the dates indicated:
December 31, 2015 | December 31, 2014 | |||||||
Raw materials, net | $ | 64,826 | $ | 86,669 | ||||
Work in process, net | 9,535 | 10,487 | ||||||
Finished goods, net | 112,603 | 127,919 | ||||||
Inventories, net | $ | 186,964 | $ | 225,075 | ||||
During 2014, the Company adjusted certain inventory to its net realizable value in connection with the Company's Inventory Optimization Program. As a result, the Company recognized a charge of $9,244, which is included in Cost of sales in the consolidated statement of operations for the year ended December 31, 2014. The Inventory Optimization Program is designed to generate cash in the short-term instead of holding certain inventory for longer periods of time and to create efficiencies from a physical material movement perspective at the Company's manufacturing and distribution facilities. During 2014, the Company increased the breadth and depth of the Inventory Optimization Program, including initiating a plan to sell higher volumes of its slower moving inventory, which had historically sold at or above cost. This initiative resulted in sales below cost during 2014.
(4) Property, Plant and Equipment, net
The components of property, plant and equipment, net were as follows as of the dates indicated:
December 31, 2015 | December 31, 2014 | |||||||
Land | $ | 43,043 | $ | 48,306 | ||||
Buildings and improvements | 113,250 | 117,316 | ||||||
Machinery and equipment | 263,756 | 281,527 | ||||||
Capitalized software | 27,567 | 26,938 | ||||||
Furniture, fixtures and office equipment | 9,614 | 9,588 | ||||||
Construction in progress | 23,078 | 17,251 | ||||||
Property, plant and equipment | 480,308 | 500,926 | ||||||
Less: Accumulated depreciation | (196,653 | ) | (181,728 | ) | ||||
Property, plant and equipment, net | $ | 283,655 | $ | 319,198 | ||||
45
WIRECO WORLDGROUP (CAYMAN) INC. AND SUBSIDIARIES
Notes to Consolidated Financial Statements (Continued)
(in thousands, except share and per share data)
Depreciation expense was $35,327, $40,045 and $41,462 for the years ended December 31, 2015, 2014 and 2013, respectively. Depending on the nature and use of the asset, depreciation expense is recorded in Cost of sales, Selling expenses and Administrative expenses in the consolidated statements of operations.
(5) Intangible Assets and Goodwill
The components of finite-lived intangible assets were as follows as of the dates indicated:
December 31, 2015 | December 31, 2014 | ||||||||||||||||||||||
Gross carrying amount | Accumulated amortization | Net carrying amount | Gross carrying amount | Accumulated amortization | Net carrying amount | ||||||||||||||||||
Finite-lived Assets | |||||||||||||||||||||||
Customer relationships | $ | 117,459 | $ | (90,736 | ) | $ | 26,723 | $ | 124,856 | $ | (87,406 | ) | $ | 37,450 | |||||||||
Patented and unpatented technology | 17,395 | (10,271 | ) | 7,124 | 22,216 | (10,539 | ) | 11,677 | |||||||||||||||
Other | 6,214 | (6,214 | ) | — | 6,505 | (6,505 | ) | — | |||||||||||||||
Total finite-lived intangible assets | $ | 141,068 | $ | (107,221 | ) | $ | 33,847 | $ | 153,577 | $ | (104,450 | ) | $ | 49,127 | |||||||||
Amortization of intangible assets was $8,945, $10,513 and $17,072 for the years ended December 31, 2015, 2014 and 2013, respectively. Using the exchange rates in effect at year-end, estimated amortization of finite-lived intangible assets as of December 31, 2015 was as follows:
2016 | $ | 8,180 | ||
2017 | 6,677 | |||
2018 | 3,123 | |||
2019 | 2,886 | |||
2020 | 2,653 | |||
Thereafter | 10,328 | |||
Total | $ | 33,847 | ||
Intangible assets with indefinite lives are not amortized. The carrying amounts of trade names as of December 31, 2015 and 2014 were $68,918 and $76,451, respectively.
The changes in the carrying amount of goodwill were as follows as of the dates indicated:
December 31, 2013 | $ | 198,329 | |
Foreign currency translation | (9,404 | ) | |
December 31, 2014 | $ | 188,925 | |
Foreign currency translation | (7,187 | ) | |
December 31, 2015 | $ | 181,738 | |
46
WIRECO WORLDGROUP (CAYMAN) INC. AND SUBSIDIARIES
Notes to Consolidated Financial Statements (Continued)
(in thousands, except share and per share data)
(6) Borrowings
Long-term debt consisted of the following as of the dates indicated:
December 31, 2015 | December 31, 2014 | |||||||
Borrowings under the Revolving Loan Facility | $ | 42,305 | $ | 68,750 | ||||
Term Loan due 2017 | 306,454 | 324,362 | ||||||
9.00% Senior Notes due 2017 | 56,000 | 56,000 | ||||||
9.50% Senior Notes due 2017 | 425,000 | 425,000 | ||||||
Other indebtedness | — | 157 | ||||||
Total debt at face value | $ | 829,759 | $ | 874,269 | ||||
Less: Unamortized discount, net | (603 | ) | (1,114 | ) | ||||
Less: Current maturities of long-term debt | (8,948 | ) | (19,113 | ) | ||||
Total long-term debt | $ | 820,208 | $ | 854,042 | ||||
Certain subsidiaries jointly and severally and fully and unconditionally guarantee, subject to customary release provisions, substantially all of the outstanding long-term debt. As of December 31, 2015, the Company was in compliance with all restrictive and financial covenants associated with its borrowings. Certain of the Company's debt agreements contain cross default provisions whereby the default of any agreement will result in the default of all agreements.
Senior Secured Credit Facilities - Revolving Loan Facility and Term Loan due 2017
On July 12, 2012, the Company entered into a credit agreement (“Credit Agreement”) with Goldman Sachs Bank USA and Deutsche Bank Securities Inc., as joint lead arrangers, and Fifth Third Bank, as the administrative and collateral agent, that provides for a $335,000 senior secured term loan (“Term Loan due 2017”) and a $145,000 senior secured revolving credit facility (“Revolving Loan Facility” and together with the Term Loan due 2017, the “Credit Facilities”), with sub-limits for letters of credit and swingline loans. The Term Loan due 2017 was issued at an original issue discount of 1.00% or $3,350. The Credit Facilities mature on February 15, 2017. The Term Loan due 2017 requires quarterly principal payments of approximately $830, which can be adjusted downward as a result of the annual excess cash flow payment, if applicable, as defined in the Credit Agreement. As of December 31, 2015 and 2014, the Company calculated an annual excess cash flow payment of $5,781 and $13,948, respectively, which is classified in Current maturities of long-term debt in the consolidated balance sheets. A 2013 amendment to the Credit Agreement required proceeds from the Inventory Optimization Program be used to pay down the Term Loan due 2017 balance. The Company calculated a payment of $1,832 from these proceeds at December 31, 2014, which is classified in Current maturities of long-term debt in the consolidated balance sheet.
On June 24, 2015, the Company entered into a third amendment (the “Amendment”) to the Credit Agreement. The Amendment, among other things, amended the Credit Agreement to (i) update the Interest Coverage Ratio financial covenant for fiscal quarters ending June 30, 2015 and thereafter from a range of 1.75x to 2.00x to a fixed ratio covenant of 1.50x and (ii) reduce incremental capacity to the greater of (a) $75,000 and (b) 2.25:1.00 Senior Secured Leverage from the greater of (a) $125,000 and (b) 2.75:1.00 Senior Secured Leverage. During 2015, the Company paid $1,067 in debt issuance costs in connection with this Amendment that are being amortized to interest expense over the term of the debt instrument.
Borrowings under the Credit Facilities incur interest at a variable rate based upon the nature of the loan under the facility. Loans are designated as either (i) Alternate Base Rate (“ABR”) or (ii) Eurodollar loans. ABR loans incur interest at the higher of (x) the prime rate of Fifth Third Bank or (y) the federal funds rate plus 1/2 of 1.00% (the higher of (x) or (y) equals the “Base Rate”), plus a margin of 3.75%. Eurodollar loans incur interest at the applicable LIBOR, plus a margin of 4.75%. A Eurodollar loan is distinguished from an ABR loan in that a Eurodollar loan bears interest in reference to the applicable LIBOR. The Base Rate applicable to the Term Loan is subject to a 2.25% floor, and the LIBOR applicable to the Term Loan is subject to a 1.25% floor. In addition to paying interest on the outstanding principal balance under the Credit Agreement, the Company must pay a commitment fee to the lenders under the Revolving Loan Facility for unutilized commitments at a rate ranging from approximately 0.38% to 0.50%, based on the Company’s consolidated leverage. The Company must also pay customary arrangement fees, upfront fees, administration fees and letter of credit fees. Interest on ABR loans is payable on the last business day of each March, June, September and December, and interest on Eurodollar loans is payable on the last day of the applicable interest period for loans of three months or less and, for loans of more than three months, at the end of each three month period starting on the first day of the applicable interest period. The interest rate on the Term Loan due 2017 was 6.00%, 6.00% and 6.00% at December 31, 2015, 2014, and 2013, respectively. The weighted average interest rate on the Revolving Loan Facility was 5.38%, 5.38% and 4.95% at December 31, 2015, 2014, and 2013, respectively.
47
WIRECO WORLDGROUP (CAYMAN) INC. AND SUBSIDIARIES
Notes to Consolidated Financial Statements (Continued)
(in thousands, except share and per share data)
The Company’s availability under the Revolving Loan Facility was $101,032 at December 31, 2015. Availability is based upon the maximum borrowing capacity, less outstanding borrowings and letters of credit, and further restricted by certain covenants in the Company's financing agreements. Outstanding letters of credit were $1,663 at December 31, 2015. Cash flows under the Revolving Loan Facility are presented gross based on the terms of the arrangement.
The Credit Agreement contains covenants that restrict the ability of the Company and guarantors to take certain actions, including, but not limited to: incurring indebtedness, incurring liens, paying dividends and making other distributions, limiting capital expenditures, engaging in mergers and acquisitions, selling property, engaging in transactions with affiliates or amending organizational documents. The Credit Agreement also contains customary affirmative covenants and events of default and requires the Company to comply with certain financial ratio maintenance covenants. During 2013, the Company entered into an amendment that among other things, amended the Credit Agreement to (i) update the total net leverage ratio financial covenant to a senior secured net leverage ratio financial covenant and (ii) modify certain defined terms used in the calculation of the Company's financial covenants. The amendment set the senior secured net leverage ratio at 3.50x with proposed step-downs thereafter to 3.25x effective December 31, 2014 and 3.00x effective June 30, 2016. During 2013, the Company paid $1,880 in debt issuance costs in connection with this Amendment that are being amortized to interest expense over the term of the debt instrument. The Senior Secured Credit Facilities are secured by a first-priority lien on all assets of the Company's subsidiaries, except assets at the Company’s Portuguese, Dutch, French and Brazilian subsidiaries.
9.00% Senior Notes due 2017 (formerly the 11.75% Senior Notes)
On July 12, 2012, the Company issued $82,500 aggregate principal amount of unsecured 11.75% Senior Notes due May 15, 2017 in a private placement pursuant to a note purchase agreement (the “Note Purchase Agreement”). On July 16, 2014, the Company entered into an amendment to the Note Purchase Agreement that reduced the interest rate from 11.75% to 9.00% on these senior notes ("9.00% Senior Notes") and provided a waiver for the notice of redemption. On July 17, 2014, the Company redeemed $26,500 of the $82,500 aggregate principal amount of the 9.00% Senior Notes, using available cash and cash drawn under the Revolving Loan Facility.
The terms applicable to the 9.00% Senior Notes, including covenants and events of default, are substantially the same as those applicable to the Company’s existing publicly registered 9.50% Senior Notes, except these senior notes do not include registration rights, accrue interest at another rate and have different redemption values. The Company may redeem the 9.00% Senior Notes, in whole or in part, at 100%.
9.50% Senior Notes due 2017
On May 19, 2010, the Company issued $275,000 aggregate principal amount of unsecured 9.50% Senior Notes due May 15, 2017 ("9.50% Senior Notes") at an original issue discount of $6,795, or 97.53%, of their aggregate principal amount under the indenture governing the 9.50% Senior Notes (the “Indenture”). On June 10, 2011, the Company issued an additional $150,000 aggregate principal amount of unsecured 9.50% Senior Notes at a premium of $6,236, or 104.75%, of their aggregate principal amount under the Indenture. Interest on the 9.50% Senior Notes is due semi-annually on May 15th and November 15th of each year. The effective interest rate on the aggregate principal amount of 9.50% Senior Notes, including debt issuance costs, is 10.39%. The 9.50% Senior Notes are redeemable at the Company’s option, in whole or in part, beginning on May 15, 2015 and thereafter at 100%. Additionally, the holders of the 9.50% Senior Notes have the right to put the 9.50% Senior Notes to the Company at 101% of their principal amount plus accrued and unpaid interest in the event the Company has a change of control.
The Indenture contains various covenants including, but not limited to, limitations on: indebtedness, dividends and other capital distributions, sale of assets, transactions with affiliates, liens and issuances of preferred stock. The 9.50% Senior Notes are senior unsecured obligations that rank equally in right of payment with all of the Company's existing and future senior debt and the 9.50% Senior Notes are senior to the Company's existing and future subordinated debt. The 9.50% Senior Notes are
guaranteed, jointly and severally, on a senior unsecured basis by certain other Company subsidiaries.
Loss on Extinguishment of Debt
As a result of redeeming a portion of the 9.00% Senior Notes earlier than the stated maturity, the Company paid a call premium of approximately $400 and wrote-off $217 of unamortized debt issuance costs associated with the pro rata portion that was redeemed during 2014.
Concurrently with the issuance of the Term Loan due 2017 and 9.00% Senior Notes in 2012, the Company retired debt under its term loan with Deutsche Bank Trust Company America (“Term Loan due 2014”) and repaid indebtedness outstanding under all revolving credit agreements. Upon the retirement and termination of these credit facilities, the Company incurred a $2,358 loss
48
WIRECO WORLDGROUP (CAYMAN) INC. AND SUBSIDIARIES
Notes to Consolidated Financial Statements (Continued)
(in thousands, except share and per share data)
on extinguishment of debt for unamortized debt issuance costs during the year ended December 31, 2012. Cash flows under the revolving credit agreement with HSBC Bank USA, National Association, as amended ("Revolving Credit Agreement"), the CASAR Revolving Credit Agreement, and the revolving credit agreement with Deutsche Bank AG, London Branch and Goldman Sachs Bank USA (“Euro Facility”) were presented on a net basis based on the terms of the arrangements.
These costs were recorded in Loss on extinguishment of debt in the consolidated statements of operations for the years ended December 31, 2014 and 2013.
Interest expense, net
Components of interest expense were as follows for the periods indicated:
Years ended December 31, | ||||||||||||
2015 | 2014 | 2013 | ||||||||||
Interest on long-term debt and revolvers | $ | 62,908 | $ | 70,720 | $ | 73,420 | ||||||
Amortization of debt issuance costs, discounts and premium | 7,885 | 8,347 | 9,026 | |||||||||
Capitalized interest | (550 | ) | (980 | ) | (1,644 | ) | ||||||
Other | 343 | 390 | 28 | |||||||||
Interest expense, net | $ | 70,586 | $ | 78,477 | $ | 80,830 | ||||||
Future Principal Payments on Long-Term Debt
The aggregate minimum principal payments required on the Company’s long-term debt as of December 31, 2015 are as follows:
2016 | $ | 8,948 | |
2017 | 820,811 | ||
2018 | — | ||
2019 | — | ||
2020 | — | ||
Thereafter | — | ||
Total | $ | 829,759 | |
The Company currently has $348,759 of long-term debt which matures on February 15, 2017 and $481,000 of long-term debt which matures on May 15, 2017. The Company plans to either raise additional equity capital or refinance its current long-term debt, or some combination thereof, in order to satisfy these obligations before they become due.
(7) Derivative Financial Instruments
To minimize the exposure to foreign currency fluctuations, derivative contracts are entered into from time to time.
During September 2014, the Company entered into cross-currency swaps with three counterparties to economically hedge exposures to foreign currency exchange risk related to its global operations. The notional value of the cross-currency swaps is $300,000, at a weighted average foreign currency exchange rate of $1.00 to €0.7820, and matures in February 2017. In accordance with the cross-currency swap agreements, on a semi-annual basis, the Company pays interest on €234,597 at a weighted average fixed rate of 8.79% and receives interest on $300,000 based on a fixed rate of 9.50%, which is included in Interest expense, net within the consolidated statements of operations.
During June 2015, the Company entered into a cross-currency swap with a counterparty to economically hedge exposures to foreign currency exchange risk related to its global operations. The cross-currency swap notional value is $125,000, at a foreign currency exchange rate of $1.00 to €0.9125, and matures in February 2017. In accordance with the cross-currency swap agreement, on a quarterly basis, the Company pays interest on €114,062 at a fixed rate of 8.94% and receives interest on $125,000 based on a fixed rate of 9.50%, which is included in Interest expense, net within the consolidated statements of operations.
The Company incurred settlements with each of its counterparties during 2015, which resulted in a net reduction in Interest
49
WIRECO WORLDGROUP (CAYMAN) INC. AND SUBSIDIARIES
Notes to Consolidated Financial Statements (Continued)
(in thousands, except share and per share data)
expense, net of $6,159 for the twelve months ended December 31, 2015.
In March 2015, the Company entered into a foreign currency forward contract to mitigate the exchange rate risk associated with fluctuations of the U.S. dollar to euro on internal cash movements associated with its global operations. Pursuant to the contract, the Company received a notional value of $3,093 at a foreign currency exchange rate of $1.00 to €0.9700 on the settlement date of May 13, 2015. Upon cash settlement, the Company realized a $253 foreign currency exchange loss, which is included in Foreign currency exchange gains (losses) within the consolidated statements of operations.
The Company's derivative financial instruments do not qualify for hedge accounting treatment and accordingly, changes in fair value are recorded in Foreign currency exchange gains (losses) within the consolidated statements of operations. The Company recognized unrealized gains of $31,178 and $16,133 that were recorded in Foreign currency exchange gains (losses) in the consolidated statements of operations for the twelve months ended December 31, 2015 and 2014, respectively.
Refer to Note 8—“Fair Value Measurements” for additional information regarding the fair value of the Company’s derivative arrangements.
(8) Fair Value Measurements
The Company’s short-term financial instruments include cash and cash equivalents, accounts receivable and accounts payable. The carrying amounts reported on the consolidated balance sheets for these items approximate fair market value due to their relative short-term nature.
The table below sets forth by level, within the fair value hierarchy, the Company's financial instruments that are measured at fair value on a recurring basis:
December 31, 2015 | |||||||||||||
Level 1 | Level 2 | Level 3 | |||||||||||
Derivatives Designated | Balance Sheet Classification | ||||||||||||
Cross-currency swaps | Derivative assets | $ | — | $ | 47,519 | $ | — | ||||||
Cross-currency swap | Other non-current liabilities | $ | — | $ | 208 | $ | — | ||||||
December 31, 2014 | |||||||||||||
Level 1 | Level 2 | Level 3 | |||||||||||
Derivatives Designated | Balance Sheet Classification | ||||||||||||
Cross-currency swaps | Derivative assets | $ | — | $ | 16,133 | $ | — | ||||||
Cross-currency swap | Other non-current liabilities | $ | — | $ | — | $ | — | ||||||
The Company estimates the fair value of its foreign currency forward contracts using present value measurements based on the spot rate, forward option spreads and other relevant market conditions. Market interest rate and foreign currency exchange rate inputs are utilized in the discounted cash flow calculation considering the instrument’s term, notional amount, discount rate and credit risk. The Company does not offset fair value amounts for derivative instruments held with the same counterparty.
The carrying amounts and estimated fair values of the Company’s long-term debt at December 31, 2015 were as follows:
Carrying amount | Estimated fair value | |||||||
Revolving Loan Facility | $ | 42,305 | $ | 42,305 | ||||
Term Loan due 2017 | 305,595 | 295,728 | ||||||
9.00% Senior Notes due 2017 | 56,000 | 46,620 | ||||||
9.50% Senior Notes due 2017 | 425,256 | 352,750 | ||||||
As the Revolving Loan Facility is a revolving credit agreement, the carrying amount approximates fair value. The estimated fair value of the Term Loan due 2017 is based on rates currently available for obligations with similar terms and maturities (Level 2 inputs). The estimated fair value of the privately placed 9.00% Senior Notes is based on a model that incorporates
50
WIRECO WORLDGROUP (CAYMAN) INC. AND SUBSIDIARIES
Notes to Consolidated Financial Statements (Continued)
(in thousands, except share and per share data)
assumptions a market participant would use in pricing the liability (Level 3 inputs) and the estimated fair value of the 9.50% Senior Notes is based on current market rates in inactive markets (Level 2 inputs).
(9) Share-based Compensation
The Company maintains the 2008 Long Term Incentive Plan (the "Plan") pursuant to which the Company may grant up to 563,216 shares of common stock pursuant to non-qualified stock options and restricted stock to directors, officers and key employees. There were 33,479 options available for future grants under the Plan at December 31, 2015.
(a) | Service-based Stock Options |
Service-based stock option awards vest over a service period of up to three or five years (most five years) from date of grant, with 33.3% and 20.0%, respectively, vesting each year, and have a contractual term of ten years. The vesting of the stock options partially accelerate upon certain "liquidity events" as defined is the Option Award Agreement and certain terminations of employment in connection with such liquidity events.
The fair value of the 2015, 2014 and 2013 stock options were estimated on the respective grant date using a Black-Scholes option-pricing model. The assumptions used in the model are noted in the following table.
2015 | 2014 | 2013 | ||||
Expected volatility (1) | 35.51% | 44.56% - 45.36% | 45.47% - 45.81% | |||
Risk-free interest rate (2) | 1.80% | 1.99% - 2.24% | 1.70% - 1.86% | |||
Expected term of the option (years) (3) | 6.5 | 6.5 | 6.0 - 6.5 | |||
Expected dividend yield | —% | —% | —% | |||
Grant-date fair value | $75.43 | $129.37 - $138.42 | $116.30 - $120.72 | |||
(1) | Based on the average historical volatility of similar entities with publicly traded shares since the Company's shares are privately held. |
(2) | Based on the U.S. Treasury interest rate whose term is consistent with the expected term of the stock options. |
(3) | Based on the expected term considering vesting and contractual terms. |
Stock option activity during the periods indicated was as follows:
Options | Number of options | Weighted average exercise price | Weighted average remaining contractual term (years) | ||||||
Outstanding at December 31, 2014 | 513,491 | $ | 172.76 | ||||||
Granted | 10,000 | — | |||||||
Exercised | — | — | |||||||
Expired | — | — | |||||||
Forfeited | (13,700 | ) | 254.76 | ||||||
Other | — | — | |||||||
Outstanding at December 31, 2015 | 509,791 | $ | 170.99 | 3.9 | |||||
Vested and expected to vest as of December 31, 2015 | 509,791 | 170.99 | 3.9 | ||||||
Exercisable at December 31, 2015 | 417,958 | 150.78 | 3.1 | ||||||
The Company recorded share-based compensation expense of $6,613, $6,933 and $5,528 related to unvested options for the years ended December 31, 2015, 2014 and 2013, respectively, in Administrative expenses in the consolidated statements of operations. The share-based compensation expense recognized in 2013 included an incremental compensation cost of $2,635 associated with modified vested awards. The expected term of certain stock option awards were modified in accordance with various separation agreements executed in conjunction with the Company's organizational restructuring. The term was extended from 90 days post-separation to the remaining contractual life of the awards.
51
WIRECO WORLDGROUP (CAYMAN) INC. AND SUBSIDIARIES
Notes to Consolidated Financial Statements (Continued)
(in thousands, except share and per share data)
At December 31, 2015, total unrecognized share-based compensation cost related to the unvested portion of the Company's service-based stock options that remains to be expensed was $8,175, with the weighted average remaining years to vest of approximately 2.0 years.
(b) | Performance Conditions |
In conjunction with the CEO's employment agreement effective July 1, 2013, a special bonus may be awarded upon a change in control prior to the third anniversary of his hire date. The special bonus ranges from an amount equal to the product of 20,000 and the per share price associated with the closing ("Deal Share Price") (if the event occurs within the second year of his employment), and the product of 10,000 and the Deal Share Price (if the event occurs within the third year of his employment). The award is payable in the same proportion of cash and/or equity consideration received by the controlling shareholders of the Company in connection with the change in control. The Company will not begin accruing any share-based compensation cost until a change in control event occurs.
(c) Restricted Stock
In 2013, the Company granted 13,800 shares of restricted stock that cliff vest after a four-year service period. If a change in control occurs, all unvested shares of restricted stock will immediately vest. The fair value of the shares granted was $255.90 per share. The Company recorded $883 of share-based compensation expense related to unvested shares of restricted stock during both 2015 and 2014.
At December 31, 2015, total unrecognized share-based compensation cost related to the unvested portion of the Company's restricted stock that remains to be expensed was $1,324, with the weighted average remaining years to vest of approximately 1.5 years.
(10) Restructuring
As part of the Company's initiatives to manage costs in response to the challenges in certain end markets, the Company reduced its production and administrative workforce during 2015. Restructuring charges related to employee and certain executive termination and related benefits were recorded in Administrative expenses in the consolidated statement of operations. The accrual balance is included in Other current liabilities on the consolidated balance sheet.
A rollforward of the restructuring activities is set forth below:
Balance at December 31, 2013 | $ | 2,812 | |
Restructuring charges incurred in 2014 | — | ||
Payments made in 2014 | (2,677 | ) | |
Balance at December 31, 2014 | $ | 135 | |
Restructuring charges incurred in 2015 | 2,134 | ||
Payments made in 2015 | (1,151 | ) | |
Balance at December 31, 2015 | $ | 1,118 | |
52
WIRECO WORLDGROUP (CAYMAN) INC. AND SUBSIDIARIES
Notes to Consolidated Financial Statements (Continued)
(in thousands, except share and per share data)
(11) Income Taxes
The provision for income taxes is based on loss before income taxes as follows:
2015 | 2014 | 2013 | ||||||||||
U.S. operations | $ | (20,418 | ) | $ | 548 | $ | (47,166 | ) | ||||
Foreign operations | (14,968 | ) | (44,962 | ) | 30,703 | |||||||
Loss before income taxes | $ | (35,386 | ) | $ | (44,414 | ) | $ | (16,463 | ) | |||
For the years ended December 31, 2015, 2014 and 2013, the components of income tax benefit (expense) consisted of the following:
2015 | 2014 | 2013 | ||||||||||
Current: | ||||||||||||
U.S. federal | $ | (373 | ) | $ | 5,739 | $ | 194 | |||||
State and local | (299 | ) | (453 | ) | (231 | ) | ||||||
Foreign jurisdictions | (4,696 | ) | (2,931 | ) | (10,581 | ) | ||||||
Total current benefit (expense) | $ | (5,368 | ) | $ | 2,355 | $ | (10,618 | ) | ||||
Deferred: | ||||||||||||
U.S. federal | $ | 863 | $ | (7,070 | ) | $ | (271 | ) | ||||
State and local | 408 | 83 | 462 | |||||||||
Foreign jurisdictions | 3,975 | 20,273 | (114 | ) | ||||||||
Total deferred benefit | $ | 5,246 | $ | 13,286 | $ | 77 | ||||||
Income tax benefit (expense) | $ | (122 | ) | $ | 15,641 | $ | (10,541 | ) | ||||
Income taxes attributable to the loss before income taxes differed from the amounts computed by applying the U.S. federal income tax rate of 34% to pretax loss as a result of the following:
2015 | 2014 | 2013 | ||||||||||
Computed “expected” tax benefit | $ | 12,031 | $ | 15,101 | $ | 5,598 | ||||||
State income taxes, net | 42 | (215 | ) | 363 | ||||||||
Taxes on foreign operations | (3,911 | ) | 1,451 | (435 | ) | |||||||
Permanent differences | 1,317 | (1,402 | ) | 1,903 | ||||||||
Net decreases (increases) in uncertain tax positions | (783 | ) | 15,418 | (3,631 | ) | |||||||
Change in deferred tax asset valuation allowance | (7,444 | ) | (14,121 | ) | (13,334 | ) | ||||||
Foreign withholding taxes | (28 | ) | (879 | ) | (874 | ) | ||||||
Expiration of foreign tax credits | (954 | ) | — | — | ||||||||
Other, net | (392 | ) | 288 | (131 | ) | |||||||
Income tax benefit (expense) | $ | (122 | ) | $ | 15,641 | $ | (10,541 | ) | ||||
The taxes on foreign operations reflect the impact of the difference in the tax rates in the jurisdictions that the Company operates compared to the U.S. federal income tax rate, as well as foreign municipal and autonomous taxes. The permanent differences are primarily comprised of a variety of differences to compute taxable income in the domestic and various foreign tax jurisdictions.
53
WIRECO WORLDGROUP (CAYMAN) INC. AND SUBSIDIARIES
Notes to Consolidated Financial Statements (Continued)
(in thousands, except share and per share data)
The tax effects of temporary differences that give rise to significant portions of the deferred tax assets and deferred tax liabilities as of December 31, 2015 and 2014 are presented below:
December 31, 2015 | December 31, 2014 | |||||||
Deferred tax assets: | ||||||||
Disallowed interest carryforward | $ | 39,841 | $ | 35,878 | ||||
Domestic net operating loss carryforwards | 657 | 8,454 | ||||||
Foreign net operating loss carryforwards | 9,304 | 5,807 | ||||||
Foreign tax credits and alternative minimum tax carryforwards | 3,268 | 3,781 | ||||||
Foreign tax on net assets to be recovered | 1,897 | 2,411 | ||||||
Unrealized currency losses | 236 | — | ||||||
Inventories | 2,800 | 2,637 | ||||||
Share-based compensation | 12,000 | 9,567 | ||||||
Reserve on advances to non-consolidated affiliates | 3,954 | 3,952 | ||||||
Other deductible temporary differences | 4,919 | 6,983 | ||||||
Total gross deferred tax assets | $ | 78,876 | $ | 79,470 | ||||
Less: Valuation allowance | (56,596 | ) | (49,750 | ) | ||||
Net deferred tax assets | $ | 22,280 | $ | 29,720 | ||||
Deferred tax liabilities: | ||||||||
Property, plant and equipment | $ | (23,679 | ) | $ | (25,130 | ) | ||
Intangible assets | (28,777 | ) | (38,692 | ) | ||||
Unrealized foreign currency exchange gains | — | (5,607 | ) | |||||
Other taxable temporary differences | (2,579 | ) | (2,347 | ) | ||||
Total gross deferred tax liabilities | $ | (55,035 | ) | $ | (71,776 | ) | ||
Net deferred tax liabilities | $ | (32,755 | ) | $ | (42,056 | ) | ||
The Company recorded a valuation allowance of $56,596 and $49,750 at December 31, 2015 and 2014, respectively, against certain deferred tax assets primarily related to interest expense deduction limitations in the U.S. and net operating losses in the U.S. and various countries. Management believes that the recoverability of a portion of certain acquired and generated deferred tax assets is not "more likely than not" to be utilized because the realization of the deferred tax asset is mainly dependent on the availability of future taxable income in the U.S. and other countries, and the ability of the U.S. entities to utilize interest deductions given the Company's borrowing structure.
The Company adopted ASU 2015-17 retrospectively on January 1, 2016, which only impacted the presentation on the consolidated balance sheet and had no impact on the Company's operating results. Refer to Note 2—“Summary of Significant Accounting Policies” to the Company's consolidated financial statements for a brief description of this ASU.
At December 31, 2015 and 2014, the Company had domestic net operating loss carryforwards of $633 and $23,233, respectively. These domestic net operating loss carryforwards of $633 will begin expiring in 2033.
At December 31, 2015 and 2014, the Company had foreign net operating loss carryforwards of approximately $39,226 and $25,038, respectively. Of these foreign net operating loss carryforwards at December 31, 2015, $30,403 will begin expiring in 2016 through 2033 and the remaining can be carried forward indefinitely.
At December 31, 2015, the Company has not provided tax on cumulative undistributed earnings attributable to foreign subsidiaries because it is the Company’s intention to reinvest these earnings indefinitely. These earnings relate to ongoing operations and, at December 31, 2015, were approximately $185,091. If earnings were distributed, the Company would be subject to income taxes and withholding taxes payable to various governments. However, it is impractical to determine the deferred taxes due to the complexities associated with the hypothetical calculation.
The Company is required to inventory, evaluate and measure all uncertain tax positions taken or to be taken on tax returns, and to record liabilities for the amount of such positions that may not be sustained, or may only partially be sustained, upon examination by the relevant taxing authorities.
54
WIRECO WORLDGROUP (CAYMAN) INC. AND SUBSIDIARIES
Notes to Consolidated Financial Statements (Continued)
(in thousands, except share and per share data)
The following table summarizes the Company’s reconciliation of unrecognized tax benefits, excluding penalties and interest, for the years ended December 31, 2015, 2014 and 2013:
2015 | 2014 | 2013 | ||||||||||
Balance at beginning of period | $ | 6,374 | $ | 22,151 | $ | 19,108 | ||||||
Increases based on current year tax positions | — | — | 1,547 | |||||||||
Increases for prior years’ tax positions | 552 | 734 | 4,419 | |||||||||
Decreases for prior years’ tax positions | (874 | ) | (16,511 | ) | (2,923 | ) | ||||||
Balance at end of period | $ | 6,052 | $ | 6,374 | $ | 22,151 | ||||||
The net amount of unrecognized tax benefits at December 31, 2015, 2014 and 2013 that, if recognized, would favorably impact the Company's effective tax rate was $6,821, $7,294 and $19,460, respectively. Tax expense for 2015, 2014 and 2013 reflects accrued interest and penalties related to uncertain tax positions of $(151), $(954) and $(406), respectively. The total accrued interest and penalties included in the consolidated balance sheets at December 31, 2015 and 2014 was $769 and $921, respectively.
It is reasonably possible that the amount of gross unrecognized tax benefits could increase or decrease over the next 12 months; however, it is not possible to reasonably estimate the effect on unrecognized tax benefits at this time. The Company files tax returns in multiple jurisdictions and is subject to examination by taxing authorities where we file tax returns. The statute of limitations vary by country and the open tax years remain subject to examination. The federal, state and foreign statutes of limitations for assessment of tax liability generally lapse three to five years after the date the tax returns are filed. However, income tax attributes that are carried forward, such as net operating loss carryforwards, may be challenged and adjusted by taxing authorities at any time prior to the expiration of the statute of limitations for the tax year in which they are utilized.
(12) Related Party Transactions
Paine & Partners, LLC (“Paine & Partners”), which manages the funds that control the Company, has entered into a management agreement with the Company to provide administrative and other support services. The Company paid management fees of $3,112, $3,042 and $3,160 for the years ended December 31, 2015, 2014 and 2013, respectively. During 2015, 2014 and 2013, the Company reimbursed Paine & Partners $145, $207 and $569, respectively, for its related expenses, such as travel, consultation and other. All Paine & Partners' fees were recorded in Administrative expenses in the consolidated statements of operations.
During 2015 and 2014, the Company had product sales of $975 and $1,508, respectively, to its Spanish joint venture, Lankhorst Euronete Espana SA. Also the Company purchased product of $2,234, $4,695 and $5,685 for the years ended December 31, 2015, 2014 and 2013, respectively, from Eurorope Performance Rope Producers SA, its Greek joint venture. The Company accounts for its investments with these joint ventures using the equity method.
(13) Commitments and Contingencies
Commitments
The Company leases certain distribution centers, sales offices, machinery and equipment, and transportation equipment under non-cancellable capital and operating leases with varying expiration dates. Capital leases generally have 3 to 5 year terms, with one or more renewal options. Operating leases generally have 1 to 10 year terms, with one or more renewal options. Rent expense under operating leases was $6,740, $9,383 and $8,153 for the years ended December 31, 2015, 2014 and 2013, respectively.
55
WIRECO WORLDGROUP (CAYMAN) INC. AND SUBSIDIARIES
Notes to Consolidated Financial Statements (Continued)
(in thousands, except share and per share data)
Using the exchange rates in effect at year end, future minimum lease payments at December 31, 2015 were as follows:
Capital leases | Operating leases | |||||||
2016 | $ | 749 | $ | 3,754 | ||||
2017 | 381 | 2,744 | ||||||
2018 | 366 | 1,726 | ||||||
2019 | 474 | 1,170 | ||||||
2020 | 179 | 970 | ||||||
Thereafter | — | 3,079 | ||||||
Total | $ | 2,149 | $ | 13,443 | ||||
Less: Interest portion | (530 | ) | ||||||
Present value of future minimum lease payments | $ | 1,619 | ||||||
The amounts payable in relation to the capital leases are recorded in the consolidated balance sheets in Other accrued liabilities (current and non-current captions).
Contingencies
The Company is involved in various claims and legal actions arising in the ordinary course of business, which are incidental to its operations. The Company currently maintains insurance coverage for certain risks, such as product liability and workers’ compensation. In accordance with Accounting Standards Codification Topic 450, Contingencies, the Company establishes accruals for litigation matters when the Company believes it is probable that a loss has been incurred and the amount of the loss can be reasonably estimated. If the Company has not accrued an amount because the litigation does not meet the criteria for accrual as set forth above, the Company discloses the matter if a material loss is reasonably possible and the Company is able to estimate a range of possible losses. At December 31, 2015, no legal proceedings or other contingencies met the accrual or disclosure criteria.
(14) Segment and Geographic Area Information
The Company reports the manufacturing, marketing, selling and distribution of wire and synthetic ropes, specialty wire and engineered products as one operating and one reportable segment. The Company's chief operating decision maker is its Chief Executive Officer, who reviews financial information on a consolidated basis for purposes of making operating decisions and assessing financial performance. The Company's net sales by product line for the periods presented was as follows:
Years ended December 31, | |||||||||||||||||||||
2015 | 2014 | 2013 | |||||||||||||||||||
Product line net sales | ($) | (%) | ($) | (%) | ($) | (%) | |||||||||||||||
Rope | $ | 496,706 | 73 | % | $ | 626,670 | 73 | % | $ | 606,276 | 74 | % | |||||||||
Specialty wire | 119,015 | 17 | % | 139,596 | 16 | % | 128,923 | 16 | % | ||||||||||||
Engineered products | 68,232 | 10 | % | 90,494 | 11 | % | 85,856 | 10 | % | ||||||||||||
Total net sales | $ | 683,953 | 100 | % | $ | 856,760 | 100 | % | $ | 821,055 | 100 | % | |||||||||
56
WIRECO WORLDGROUP (CAYMAN) INC. AND SUBSIDIARIES
Notes to Consolidated Financial Statements (Continued)
(in thousands, except share and per share data)
Enterprise-wide Disclosures and Concentration of Business
Net sales by geographical area
Net sales by geographical area are based on the location of the facility producing the sales. No single customer accounted for more than 10% of net sales in 2015, 2014 or 2013.
Years ended December 31, | ||||||||||||||
Net sales | 2015 | 2014 | 2013 | |||||||||||
United States | $ | 199,255 | $ | 288,852 | $ | 286,849 | ||||||||
The Netherlands | 125,632 | 147,410 | 135,609 | |||||||||||
Portugal | 102,347 | 113,330 | 114,672 | |||||||||||
Mexico | 69,863 | 78,736 | 67,857 | |||||||||||
Poland | 69,363 | 82,004 | 78,913 | |||||||||||
Germany | 49,543 | 74,240 | 84,275 | |||||||||||
Other countries | 67,950 | 72,188 | 52,880 | |||||||||||
Total net sales | $ | 683,953 | $ | 856,760 | $ | 821,055 | ||||||||
Long-lived assets, net by geographical area
Long-lived assets, net consist of property, plant and equipment, net of depreciation. Long-lived assets, net by geographical area are based on the location of the Company's facilities.
As of December 31, | ||||||||||||||
Long-lived assets, net | 2015 | 2014 | 2013 | |||||||||||
Portugal | $ | 80,413 | $ | 93,826 | $ | 111,320 | ||||||||
United States | 51,837 | 54,306 | 59,090 | |||||||||||
Mexico | 45,234 | 56,050 | 65,648 | |||||||||||
Poland | 40,267 | 43,884 | 51,068 | |||||||||||
The Netherlands | 35,214 | 40,113 | 45,286 | |||||||||||
Germany | 20,239 | 22,979 | 26,682 | |||||||||||
Other countries | 10,451 | 8,040 | 7,244 | |||||||||||
Total long-lived assets, net | $ | 283,655 | $ | 319,198 | $ | 366,338 | ||||||||
(15) Condensed Consolidating Financial Statements
Guarantees of the 9.50% Senior Notes
The Company has registered 9.50% Senior Notes, which are unsecured obligations of WireCo WorldGroup Inc. These obligations are jointly and severally and fully and unconditionally guaranteed by WireCo WorldGroup (Cayman) Inc. Certain entities controlled by the Company (collectively referred to as the “Guarantor Subsidiaries”) also jointly and severally and fully and unconditionally guarantee these obligations, subject to customary release provisions. All voting shares for the entities presented in the “Guarantor Subsidiaries” column are 100% owned directly or indirectly by the Company. Certain subsidiaries with locations primarily located in the Netherlands, Brazil and France do not guarantee the debt (collectively referred to as the “Non-Guarantor Subsidiaries”). The following condensed consolidating financial statements are prepared with each entity’s investment in subsidiaries accounted for under the equity method. The adjustments eliminate investments in subsidiaries, related stockholders’ equity and other intercompany balances and transactions. There are currently no significant restrictions on the ability of WireCo WorldGroup Inc. or any guarantor to obtain funds from its subsidiaries by dividend or loan.
57
WIRECO WORLDGROUP (CAYMAN) INC. AND SUBSIDIARIES
Notes to Consolidated Financial Statements (Continued)
(in thousands, except share and per share data)
Condensed Consolidating Balance Sheets
December 31, 2015 | |||||||||||||||||||||||
WireCo WorldGroup (Cayman) Inc. (Parent) | WireCo WorldGroup Inc. (Issuer) | Guarantor Subsidiaries | Non-Guarantor Subsidiaries | Elimination Adjustments | Consolidated | ||||||||||||||||||
Assets | |||||||||||||||||||||||
Current assets: | |||||||||||||||||||||||
Cash and cash equivalents | $ | 21 | $ | 2,378 | $ | 10,906 | $ | 7,755 | $ | — | $ | 21,060 | |||||||||||
Restricted cash | — | — | 533 | 989 | — | 1,522 | |||||||||||||||||
Accounts receivable, net | — | 28,087 | 59,211 | 37,165 | — | 124,463 | |||||||||||||||||
Intercompany accounts receivable | 1,252 | 60,560 | 41,627 | 27,418 | (130,857 | ) | — | ||||||||||||||||
Other receivables | — | 11 | 2,191 | 577 | — | 2,779 | |||||||||||||||||
Inventories, net | — | 67,319 | 90,982 | 28,663 | — | 186,964 | |||||||||||||||||
Prepaid expenses and other current assets | — | 2,983 | 3,701 | 1,449 | — | 8,133 | |||||||||||||||||
Total current assets | $ | 1,273 | $ | 161,338 | $ | 209,151 | $ | 104,016 | $ | (130,857 | ) | $ | 344,921 | ||||||||||
Long-term intercompany notes receivable | — | 422,668 | 16,984 | 107,887 | (547,539 | ) | — | ||||||||||||||||
Property, plant and equipment, net | — | 51,833 | 190,285 | 41,537 | — | 283,655 | |||||||||||||||||
Intangible assets, net | — | 30,512 | 57,458 | 14,795 | — | 102,765 | |||||||||||||||||
Goodwill | — | 116,842 | 46,824 | 18,072 | — | 181,738 | |||||||||||||||||
Investments in subsidiaries | (59,270 | ) | — | 115,440 | 7,805 | (63,975 | ) | — | |||||||||||||||
Deferred financing fees, net | — | 9,118 | — | — | — | 9,118 | |||||||||||||||||
Non-current deferred income tax assets | — | 171 | 697 | 591 | — | 1,459 | |||||||||||||||||
Derivative assets | 40,284 | 7,235 | — | — | — | 47,519 | |||||||||||||||||
Other non-current assets | — | 199 | 9,065 | 8 | — | 9,272 | |||||||||||||||||
Total assets | $ | (17,713 | ) | $ | 799,916 | $ | 645,904 | $ | 294,711 | $ | (742,371 | ) | $ | 980,447 | |||||||||
Liabilities and Stockholders’ Equity | |||||||||||||||||||||||
Current liabilities: | |||||||||||||||||||||||
Current maturities of long-term debt | $ | — | $ | 8,948 | $ | — | $ | — | $ | — | $ | 8,948 | |||||||||||
Interest payable | — | 5,970 | 21 | 168 | — | 6,159 | |||||||||||||||||
Accounts payable | — | 17,808 | 39,351 | 14,994 | — | 72,153 | |||||||||||||||||
Intercompany accounts payable | 871 | 48,758 | 69,636 | 11,532 | (130,797 | ) | — | ||||||||||||||||
Accrued compensation and benefits | — | 6,039 | 9,670 | 2,807 | — | 18,516 | |||||||||||||||||
Other current liabilities | 230 | 6,054 | 14,687 | 1,996 | — | 22,967 | |||||||||||||||||
Total current liabilities | $ | 1,101 | $ | 93,577 | $ | 133,365 | $ | 31,497 | $ | (130,797 | ) | $ | 128,743 | ||||||||||
Long-term debt, excluding current maturities | — | 820,208 | — | — | — | 820,208 | |||||||||||||||||
Long-term intercompany notes payable | — | — | 520,684 | 26,831 | (547,515 | ) | — | ||||||||||||||||
58
WIRECO WORLDGROUP (CAYMAN) INC. AND SUBSIDIARIES
Notes to Consolidated Financial Statements (Continued)
(in thousands, except share and per share data)
Non-current deferred income tax liabilities | — | 9,295 | 17,918 | 7,001 | — | 34,214 | |||||||||||||||||
Other non-current liabilities | 208 | 714 | 11,371 | 1,418 | — | 13,711 | |||||||||||||||||
Total liabilities | $ | 1,309 | $ | 923,794 | $ | 683,338 | $ | 66,747 | $ | (678,312 | ) | $ | 996,876 | ||||||||||
Stockholders’ equity: | |||||||||||||||||||||||
Total stockholders’ equity attributable to WireCo WorldGroup (Cayman) Inc. | $ | (19,022 | ) | $ | (123,878 | ) | $ | (33,244 | ) | $ | 221,181 | $ | (64,059 | ) | $ | (19,022 | ) | ||||||
Non-controlling interests | — | — | (4,190 | ) | 6,783 | — | 2,593 | ||||||||||||||||
Total stockholders’ equity | $ | (19,022 | ) | $ | (123,878 | ) | $ | (37,434 | ) | $ | 227,964 | $ | (64,059 | ) | $ | (16,429 | ) | ||||||
Total liabilities and stockholders’ equity | $ | (17,713 | ) | $ | 799,916 | $ | 645,904 | $ | 294,711 | $ | (742,371 | ) | $ | 980,447 | |||||||||
59
WIRECO WORLDGROUP (CAYMAN) INC. AND SUBSIDIARIES
Notes to Consolidated Financial Statements (Continued)
(in thousands, except share and per share data)
December 31, 2014 | |||||||||||||||||||||||
WireCo WorldGroup (Cayman) Inc. (Parent) | WireCo WorldGroup Inc. (Issuer) | Guarantor Subsidiaries | Non-Guarantor Subsidiaries | Elimination Adjustments | Consolidated | ||||||||||||||||||
Assets | |||||||||||||||||||||||
Current assets: | |||||||||||||||||||||||
Cash and cash equivalents | $ | 24 | $ | 4,178 | $ | 35,792 | $ | 18,201 | $ | — | $ | 58,195 | |||||||||||
Restricted cash | — | — | 656 | 909 | — | 1,565 | |||||||||||||||||
Accounts receivable, net | — | 45,159 | 69,645 | 28,264 | — | 143,068 | |||||||||||||||||
Intercompany accounts receivable | 27,454 | 64,043 | 55,654 | 18,493 | (165,644 | ) | — | ||||||||||||||||
Other receivables | — | — | 1,914 | 391 | — | 2,305 | |||||||||||||||||
Inventories, net | — | 71,924 | 122,025 | 31,126 | — | 225,075 | |||||||||||||||||
Prepaid expenses and other current assets | — | 2,935 | 6,378 | 3,663 | — | 12,976 | |||||||||||||||||
Total current assets | $ | 27,478 | $ | 188,239 | $ | 292,064 | $ | 101,047 | $ | (165,644 | ) | $ | 443,184 | ||||||||||
Long-term intercompany notes receivable | — | 467,127 | 22,461 | 112,482 | (602,070 | ) | — | ||||||||||||||||
Property, plant and equipment, net | — | 54,302 | 220,675 | 44,221 | — | 319,198 | |||||||||||||||||
Intangible assets, net | — | 34,052 | 70,186 | 21,340 | — | 125,578 | |||||||||||||||||
Goodwill | — | 116,842 | 50,906 | 21,177 | — | 188,925 | |||||||||||||||||
Investment in subsidiaries | 25,057 | — | 129,522 | 7,659 | (162,238 | ) | — | ||||||||||||||||
Deferred financing fees, net | — | 15,425 | — | — | — | 15,425 | |||||||||||||||||
Non-current deferred income tax assets | — | — | 1,413 | — | — | 1,413 | |||||||||||||||||
Derivative assets | — | 16,133 | — | — | — | 16,133 | |||||||||||||||||
Other non-current assets | — | 207 | 11,202 | 9 | — | 11,418 | |||||||||||||||||
Total assets | $ | 52,535 | $ | 892,327 | $ | 798,429 | $ | 307,935 | $ | (929,952 | ) | $ | 1,121,274 | ||||||||||
Liabilities and Stockholders’ Equity | |||||||||||||||||||||||
Current liabilities: | |||||||||||||||||||||||
Current maturities of long-term debt | $ | — | $ | 19,098 | $ | 6 | $ | 9 | $ | — | $ | 19,113 | |||||||||||
Interest payable | — | 6,038 | 131 | 153 | — | 6,322 | |||||||||||||||||
Accounts payable | — | 23,830 | 62,158 | 12,926 | — | 98,914 | |||||||||||||||||
Intercompany accounts payable | 1,572 | 75,197 | 74,251 | 14,538 | (165,558 | ) | — | ||||||||||||||||
Accrued compensation and benefits | — | 5,009 | 10,558 | 3,550 | — | 19,117 | |||||||||||||||||
Other current liabilities | — | 2,927 | 12,940 | 4,306 | — | 20,173 | |||||||||||||||||
Total current liabilities | $ | 1,572 | $ | 132,099 | $ | 160,044 | $ | 35,482 | $ | (165,558 | ) | $ | 163,639 | ||||||||||
Long-term debt, excluding current maturities | — | 853,899 | 143 | — | — | 854,042 | |||||||||||||||||
Long-term intercompany notes payable | 6,700 | — | 564,740 | 30,610 | (602,050 | ) | — | ||||||||||||||||
Non-current deferred income tax liabilities | — | 10,565 | 23,783 | 9,121 | — | 43,469 | |||||||||||||||||
60
WIRECO WORLDGROUP (CAYMAN) INC. AND SUBSIDIARIES
Notes to Consolidated Financial Statements (Continued)
(in thousands, except share and per share data)
Other non-current liabilities | — | 414 | 13,825 | 1,622 | — | 15,861 | |||||||||||||||||
Total liabilities | $ | 8,272 | $ | 996,977 | $ | 762,535 | $ | 76,835 | $ | (767,608 | ) | $ | 1,077,011 | ||||||||||
Stockholders’ equity: | |||||||||||||||||||||||
Total stockholders’ equity attributable to WireCo WorldGroup (Cayman) Inc. | $ | 44,234 | $ | (104,650 | ) | $ | 39,399 | $ | 227,591 | $ | (162,340 | ) | $ | 44,234 | |||||||||
Non-controlling interests | 29 | — | (3,505 | ) | 3,509 | (4 | ) | 29 | |||||||||||||||
Total stockholders’ equity | $ | 44,263 | $ | (104,650 | ) | $ | 35,894 | $ | 231,100 | $ | (162,344 | ) | $ | 44,263 | |||||||||
Total liabilities and stockholders’ equity | $ | 52,535 | $ | 892,327 | $ | 798,429 | $ | 307,935 | $ | (929,952 | ) | $ | 1,121,274 | ||||||||||
61
WIRECO WORLDGROUP (CAYMAN) INC. AND SUBSIDIARIES
Notes to Consolidated Financial Statements (Continued)
(in thousands, except share and per share data)
Condensed Consolidating Statements of Operations and Comprehensive Income (Loss)
Year ended December 31, 2015 | |||||||||||||||||||||||
WireCo WorldGroup (Cayman) Inc. (Parent) | WireCo WorldGroup Inc. (Issuer) | Guarantor Subsidiaries | Non-Guarantor Subsidiaries | Elimination Adjustments | Consolidated | ||||||||||||||||||
Net sales | $ | — | $ | 200,748 | $ | 415,099 | $ | 157,219 | $ | (89,113 | ) | $ | 683,953 | ||||||||||
Cost of sales | — | (157,425 | ) | (329,941 | ) | (124,558 | ) | 89,410 | (522,514 | ) | |||||||||||||
Gross profit | — | 43,323 | 85,158 | 32,661 | 297 | 161,439 | |||||||||||||||||
Other operating expenses: | |||||||||||||||||||||||
Selling expenses | — | (11,047 | ) | (15,348 | ) | (11,178 | ) | — | (37,573 | ) | |||||||||||||
Administrative expenses | (995 | ) | (39,544 | ) | (27,088 | ) | (9,310 | ) | — | (76,937 | ) | ||||||||||||
Amortization expense | — | (3,063 | ) | (4,738 | ) | (1,144 | ) | — | (8,945 | ) | |||||||||||||
Total other operating expenses | (995 | ) | (53,654 | ) | (47,174 | ) | (21,632 | ) | — | (123,455 | ) | ||||||||||||
Operating income (loss) | (995 | ) | (10,331 | ) | 37,984 | 11,029 | 297 | 37,984 | |||||||||||||||
Other income (expense): | |||||||||||||||||||||||
Interest income (expense), net | 2,695 | (40,297 | ) | (38,196 | ) | 5,212 | — | (70,586 | ) | ||||||||||||||
Equity gains (losses) from subsidiaries | (55,043 | ) | — | (14,081 | ) | 146 | 68,978 | — | |||||||||||||||
Foreign currency exchange gains (losses), net | 456 | 30,879 | (49,851 | ) | 16,577 | — | (1,939 | ) | |||||||||||||||
Other income (expense), net | 14,250 | (15 | ) | (886 | ) | 57 | (14,251 | ) | (845 | ) | |||||||||||||
Total other income (expense), net | (37,642 | ) | (9,433 | ) | (103,014 | ) | 21,992 | 54,727 | (73,370 | ) | |||||||||||||
Income (loss) before income taxes | (38,637 | ) | (19,764 | ) | (65,030 | ) | 33,021 | 55,024 | (35,386 | ) | |||||||||||||
Income tax benefit (expense) | — | 697 | 3,943 | (4,762 | ) | — | (122 | ) | |||||||||||||||
Net income (loss) | (38,637 | ) | (19,067 | ) | (61,087 | ) | 28,259 | 55,024 | (35,508 | ) | |||||||||||||
Less: Net income (loss) attributable to non-controlling interests | — | — | (654 | ) | 3,783 | — | 3,129 | ||||||||||||||||
Net income (loss) attributable to WireCo WorldGroup (Cayman) Inc. | (38,637 | ) | (19,067 | ) | (60,433 | ) | 24,476 | 55,024 | (38,637 | ) | |||||||||||||
Comprehensive income (loss) | $ | (68,188 | ) | $ | (19,067 | ) | $ | (61,087 | ) | $ | 25,130 | $ | 55,024 | $ | (68,188 | ) | |||||||
62
WIRECO WORLDGROUP (CAYMAN) INC. AND SUBSIDIARIES
Notes to Consolidated Financial Statements (Continued)
(in thousands, except share and per share data)
Year ended December 31, 2014 | |||||||||||||||||||||||
WireCo WorldGroup (Cayman) Inc. (Parent) | WireCo WorldGroup Inc. (Issuer) | Guarantor Subsidiaries | Non-Guarantor Subsidiaries | Elimination Adjustments | Consolidated | ||||||||||||||||||
Net sales | $ | — | $ | 291,892 | $ | 514,067 | $ | 180,947 | $ | (130,146 | ) | $ | 856,760 | ||||||||||
Cost of sales | — | (233,310 | ) | (406,183 | ) | (140,064 | ) | 131,042 | (648,515 | ) | |||||||||||||
Gross profit | — | 58,582 | 107,884 | 40,883 | 896 | 208,245 | |||||||||||||||||
Other operating expenses: | |||||||||||||||||||||||
Selling expenses | — | (12,229 | ) | (19,921 | ) | (12,267 | ) | — | (44,417 | ) | |||||||||||||
Administrative expenses | (1,037 | ) | (41,980 | ) | (31,549 | ) | (7,795 | ) | — | (82,361 | ) | ||||||||||||
Amortization expense | — | (2,738 | ) | (6,473 | ) | (1,302 | ) | — | (10,513 | ) | |||||||||||||
Total other operating expenses | (1,037 | ) | (56,947 | ) | (57,943 | ) | (21,364 | ) | — | (137,291 | ) | ||||||||||||
Operating income (loss) | (1,037 | ) | 1,635 | 49,941 | 19,519 | 896 | 70,954 | ||||||||||||||||
Other income (expense): | |||||||||||||||||||||||
Interest income (expense), net | (410 | ) | (34,641 | ) | (49,432 | ) | 6,006 | — | (78,477 | ) | |||||||||||||
Equity gains (losses) from subsidiaries | (29,370 | ) | — | (6,063 | ) | 2,236 | 33,197 | — | |||||||||||||||
Foreign currency exchange gains (losses), net | — | 16,289 | (62,966 | ) | 10,379 | — | (36,298 | ) | |||||||||||||||
Loss on extinguishment of debt | — | (617 | ) | — | — | — | (617 | ) | |||||||||||||||
Other income (expense), net | — | 18,605 | (16,133 | ) | 87 | (2,535 | ) | 24 | |||||||||||||||
Other expense, net | (29,780 | ) | (364 | ) | (134,594 | ) | 18,708 | 30,662 | (115,368 | ) | |||||||||||||
Income (loss) before income taxes | (30,817 | ) | 1,271 | (84,653 | ) | 38,227 | 31,558 | (44,414 | ) | ||||||||||||||
Income tax benefit (expense) | — | (1,697 | ) | 23,141 | (5,803 | ) | — | 15,641 | |||||||||||||||
Net income (loss) | (30,817 | ) | (426 | ) | (61,512 | ) | 32,424 | 31,558 | (28,773 | ) | |||||||||||||
Less: Net income (loss) attributable to non-controlling interests | — | (14 | ) | (21 | ) | 2,079 | — | 2,044 | |||||||||||||||
Net income (loss) attributable to WireCo WorldGroup (Cayman) Inc. | (30,817 | ) | (412 | ) | (61,491 | ) | 30,345 | 31,558 | (30,817 | ) | |||||||||||||
Comprehensive income (loss) | $ | (59,747 | ) | $ | (426 | ) | $ | (61,512 | ) | $ | 29,074 | $ | 32,864 | $ | (59,747 | ) | |||||||
63
WIRECO WORLDGROUP (CAYMAN) INC. AND SUBSIDIARIES
Notes to Consolidated Financial Statements (Continued)
(in thousands, except share and per share data)
Year ended December 31, 2013 | |||||||||||||||||||||||
WireCo WorldGroup (Cayman) Inc. (Parent) | WireCo WorldGroup Inc. (Issuer) | Guarantor Subsidiaries | Non-Guarantor Subsidiaries | Elimination Adjustments | Consolidated | ||||||||||||||||||
Net sales | $ | — | $ | 290,366 | $ | 495,994 | $ | 150,249 | $ | (115,554 | ) | $ | 821,055 | ||||||||||
Cost of sales | — | (228,297 | ) | (390,852 | ) | (119,537 | ) | 116,380 | (622,306 | ) | |||||||||||||
Gross profit | — | 62,069 | 105,142 | 30,712 | 826 | 198,749 | |||||||||||||||||
Other operating expenses: | |||||||||||||||||||||||
Selling expenses | — | (13,011 | ) | (20,523 | ) | (8,127 | ) | — | (41,661 | ) | |||||||||||||
Administrative expenses | (1,943 | ) | (43,460 | ) | (35,071 | ) | (8,591 | ) | 467 | (88,598 | ) | ||||||||||||
Amortization expense | — | (5,728 | ) | (9,705 | ) | (1,639 | ) | — | (17,072 | ) | |||||||||||||
Total other operating expenses | (1,943 | ) | (62,199 | ) | (65,299 | ) | (18,357 | ) | 467 | (147,331 | ) | ||||||||||||
Operating income (loss) | (1,943 | ) | (130 | ) | 39,843 | 12,355 | 1,293 | 51,418 | |||||||||||||||
Other income (expense): | |||||||||||||||||||||||
Interest expense, net | (410 | ) | (44,228 | ) | (36,129 | ) | (63 | ) | — | (80,830 | ) | ||||||||||||
Equity losses from subsidiaries | (24,106 | ) | — | (40,859 | ) | — | 64,965 | — | |||||||||||||||
Foreign currency exchange gains (losses), net | — | (806 | ) | 16,053 | (1,663 | ) | — | 13,584 | |||||||||||||||
Other income (expense), net | — | (1,179 | ) | 1,851 | (840 | ) | (467 | ) | (635 | ) | |||||||||||||
Total other expense, net | (24,516 | ) | (46,213 | ) | (59,084 | ) | (2,566 | ) | 64,498 | (67,881 | ) | ||||||||||||
Income (loss) before income taxes | (26,459 | ) | (46,343 | ) | (19,241 | ) | 9,789 | 65,791 | (16,463 | ) | |||||||||||||
Income tax expense | — | (719 | ) | (7,745 | ) | (1,849 | ) | (228 | ) | (10,541 | ) | ||||||||||||
Net income (loss) | (26,459 | ) | (47,062 | ) | (26,986 | ) | 7,940 | 65,563 | (27,004 | ) | |||||||||||||
Less: Net income (loss) attributable to non-controlling interests | — | — | (1,575 | ) | 1,030 | — | (545 | ) | |||||||||||||||
Net income (loss) attributable to WireCo WorldGroup (Cayman) Inc. | (26,459 | ) | (47,062 | ) | (25,411 | ) | 6,910 | 65,563 | (26,459 | ) | |||||||||||||
Comprehensive income (loss) | $ | (21,748 | ) | $ | (47,062 | ) | $ | (21,730 | ) | $ | 24,574 | $ | 44,218 | $ | (21,748 | ) | |||||||
64
WIRECO WORLDGROUP (CAYMAN) INC. AND SUBSIDIARIES
Notes to Consolidated Financial Statements (Continued)
(in thousands, except share and per share data)
Condensed Consolidating Statements of Cash Flows
Year ended December 31, 2015 | |||||||||||||||||||||||
WireCo WorldGroup (Cayman) Inc. (Parent) | WireCo WorldGroup Inc. (Issuer) | Guarantor Subsidiaries | Non-Guarantor Subsidiaries | Elimination Adjustments | Consolidated | ||||||||||||||||||
Net cash provided by (used in) operating activities | $ | (4,694 | ) | $ | 5,533 | $ | 41,976 | $ | 231 | $ | — | $ | 43,046 | ||||||||||
Cash flows from investing activities: | |||||||||||||||||||||||
Capital expenditures | — | (7,045 | ) | (15,012 | ) | (7,745 | ) | — | (29,802 | ) | |||||||||||||
Intercompany dividends received | 14,250 | — | — | — | (14,250 | ) | — | ||||||||||||||||
Repayments from intercompany loans | — | 45,132 | 3,133 | 544 | (48,809 | ) | — | ||||||||||||||||
Investment in subsidiaries | (2,859 | ) | — | — | — | 2,859 | — | ||||||||||||||||
Net cash provided by (used in) investing activities | $ | 11,391 | $ | 38,087 | $ | (11,879 | ) | $ | (7,201 | ) | $ | (60,200 | ) | $ | (29,802 | ) | |||||||
Cash flows from financing activities: | |||||||||||||||||||||||
Principal payments on long-term debt | — | (17,908 | ) | — | — | — | (17,908 | ) | |||||||||||||||
Debt issuance costs paid | — | (1,067 | ) | — | — | — | (1,067 | ) | |||||||||||||||
Decreases in intercompany notes | (6,700 | ) | — | (40,036 | ) | (2,073 | ) | 48,809 | — | ||||||||||||||
Borrowings under current Revolving Loan Facility | — | 78,400 | — | — | — | 78,400 | |||||||||||||||||
Repayments under current Revolving Loan Facility | — | (104,845 | ) | — | — | — | (104,845 | ) | |||||||||||||||
Intercompany dividends paid | — | — | (14,250 | ) | — | 14,250 | — | ||||||||||||||||
Capital contributions received | — | — | 2,859 | — | (2,859 | ) | — | ||||||||||||||||
Net cash used in financing activities | $ | (6,700 | ) | $ | (45,420 | ) | $ | (51,427 | ) | $ | (2,073 | ) | $ | 60,200 | $ | (45,420 | ) | ||||||
Effect of exchange rates on cash and cash equivalents | — | — | (3,556 | ) | (1,403 | ) | — | (4,959 | ) | ||||||||||||||
Decrease in cash and cash equivalents | $ | (3 | ) | $ | (1,800 | ) | $ | (24,886 | ) | $ | (10,446 | ) | $ | — | $ | (37,135 | ) | ||||||
Cash and cash equivalents, beginning of year | 24 | 4,178 | 35,792 | 18,201 | — | 58,195 | |||||||||||||||||
Cash and cash equivalents, end of year | $ | 21 | $ | 2,378 | $ | 10,906 | $ | 7,755 | $ | — | $ | 21,060 | |||||||||||
65
WIRECO WORLDGROUP (CAYMAN) INC. AND SUBSIDIARIES
Notes to Consolidated Financial Statements (Continued)
(in thousands, except share and per share data)
Year ended December 31, 2014 | |||||||||||||||||||||||
WireCo WorldGroup (Cayman) Inc. (Parent) | WireCo WorldGroup Inc. (Issuer) | Guarantor Subsidiaries | Non-Guarantor Subsidiaries | Elimination Adjustments | Consolidated | ||||||||||||||||||
Net cash provided by operating activities | $ | (257 | ) | $ | (11,590 | ) | $ | 59,158 | $ | 12,107 | $ | — | $ | 59,418 | |||||||||
Cash flows from investing activities: | |||||||||||||||||||||||
Capital expenditures | — | (5,920 | ) | (12,377 | ) | (6,575 | ) | — | (24,872 | ) | |||||||||||||
Acquisition of business | — | — | — | (4,573 | ) | — | (4,573 | ) | |||||||||||||||
Repayments from intercompany loans | — | 15,722 | 3,112 | 819 | (19,653 | ) | — | ||||||||||||||||
Investment in subsidiaries | — | — | — | (4,573 | ) | 4,573 | — | ||||||||||||||||
Other investing activities | — | — | 1,951 | — | — | 1,951 | |||||||||||||||||
Net cash provided by (used in) investing activities | $ | — | $ | 9,802 | $ | (7,314 | ) | $ | (14,902 | ) | $ | (15,080 | ) | $ | (27,494 | ) | |||||||
Cash flows from financing activities: | |||||||||||||||||||||||
Principal payments on long-term debt | — | (6,450 | ) | (7,782 | ) | — | — | (14,232 | ) | ||||||||||||||
Retirement of long-term debt | — | (26,500 | ) | (446 | ) | — | — | (26,946 | ) | ||||||||||||||
Borrowings under current Revolving Loan Facility | — | 178,650 | — | — | — | 178,650 | |||||||||||||||||
Repayments under current Revolving Loan Facility | — | (141,900 | ) | — | — | — | (141,900 | ) | |||||||||||||||
Capital contributions received | — | — | — | 4,573 | (4,573 | ) | — | ||||||||||||||||
Repayments of intercompany loans | — | — | (17,191 | ) | (2,462 | ) | 19,653 | — | |||||||||||||||
Other financing activities | 228 | (398 | ) | (267 | ) | — | — | (437 | ) | ||||||||||||||
Net cash provided by (used in) financing activities | $ | 228 | $ | 3,402 | $ | (25,686 | ) | $ | 2,111 | $ | 15,080 | $ | (4,865 | ) | |||||||||
Effect of exchange rates on cash and cash equivalents | — | — | (2,164 | ) | (1,687 | ) | — | (3,851 | ) | ||||||||||||||
Increase (decrease) in cash and cash equivalents | $ | (29 | ) | $ | 1,614 | $ | 23,994 | $ | (2,371 | ) | $ | — | $ | 23,208 | |||||||||
Cash and cash equivalents, beginning of year | 53 | 2,564 | 11,798 | 20,572 | — | 34,987 | |||||||||||||||||
Cash and cash equivalents, end of year | $ | 24 | $ | 4,178 | $ | 35,792 | $ | 18,201 | $ | — | $ | 58,195 | |||||||||||
66
WIRECO WORLDGROUP (CAYMAN) INC. AND SUBSIDIARIES
Notes to Consolidated Financial Statements (Continued)
(in thousands, except share and per share data)
Year ended December 31, 2013 | |||||||||||||||||||||||
WireCo WorldGroup (Cayman) Inc. (Parent) | WireCo WorldGroup Inc. (Issuer) | Guarantor Subsidiaries | Non-Guarantor Subsidiaries | Elimination Adjustments | Consolidated | ||||||||||||||||||
Net cash provided by operating activities | $ | 19 | $ | 17,790 | $ | 37,062 | $ | 280 | $ | — | $ | 55,151 | |||||||||||
Cash flows from investing activities: | |||||||||||||||||||||||
Capital expenditures | — | (5,298 | ) | (23,658 | ) | (362 | ) | — | (29,318 | ) | |||||||||||||
Intercompany dividends received | 5,800 | — | — | — | (5,800 | ) | — | ||||||||||||||||
Investment in subsidiaries | (5,800 | ) | — | — | — | 5,800 | — | ||||||||||||||||
Other investing activities | — | — | (35 | ) | — | — | (35 | ) | |||||||||||||||
Net cash used in investing activities | $ | — | $ | (5,298 | ) | $ | (23,693 | ) | $ | (362 | ) | $ | — | $ | (29,353 | ) | |||||||
Cash flows from financing activities: | |||||||||||||||||||||||
Principal payments on long-term debt | — | (3,350 | ) | (17,474 | ) | — | — | (20,824 | ) | ||||||||||||||
Debt issuance costs paid | — | (1,880 | ) | — | — | — | (1,880 | ) | |||||||||||||||
Increases (decreases) in intercompany notes | — | 10,711 | (10,326 | ) | (385 | ) | — | — | |||||||||||||||
Borrowings under current Revolving Loan Facility | — | 158,130 | — | — | — | 158,130 | |||||||||||||||||
Repayments under current Revolving Loan Facility | — | (176,406 | ) | — | — | — | (176,406 | ) | |||||||||||||||
Intercompany dividends paid | — | — | (5,800 | ) | — | 5,800 | — | ||||||||||||||||
Capital contributions received | — | — | 5,800 | — | (5,800 | ) | — | ||||||||||||||||
Net cash used in financing activities | $ | — | $ | (12,795 | ) | $ | (27,800 | ) | $ | (385 | ) | $ | — | $ | (40,980 | ) | |||||||
Effect of exchange rates on cash and cash equivalents | — | — | (751 | ) | 1,676 | — | 925 | ||||||||||||||||
Increase (decrease) in cash and cash equivalents | $ | 19 | $ | (303 | ) | $ | (15,182 | ) | $ | 1,209 | $ | — | $ | (14,257 | ) | ||||||||
Cash and cash equivalents, beginning of year | 34 | 2,867 | 26,980 | 19,363 | — | 49,244 | |||||||||||||||||
Cash and cash equivalents, end of year | $ | 53 | $ | 2,564 | $ | 11,798 | $ | 20,572 | $ | — | $ | 34,987 | |||||||||||
67
WIRECO WORLDGROUP (CAYMAN) INC. AND SUBSIDIARIES
Notes to Consolidated Financial Statements (Continued)
(in thousands, except share and per share data)
(16) Selected Quarterly Financial Data (Unaudited)
The following tables show selected quarterly financial data for each quarter of 2015 and 2014:
2015 | Fourth Quarter | Third Quarter | Second Quarter | First Quarter | ||||
Net sales | $158,428 | $171,356 | $173,814 | $180,355 | ||||
Gross profit | 37,986 | 40,670 | 40,782 | 42,001 | ||||
Operating income | 4,734 | 10,394 | 10,910 | 11,946 | ||||
Net loss | (11,203) | (5,192) | (15,045) | (4,068) | ||||
2014 | Fourth Quarter | Third Quarter | Second Quarter | First Quarter | ||||
Net sales | $202,675 | $217,076 | $226,507 | $210,502 | ||||
Gross profit | 47,999 | 46,783 | 60,157 | 53,306 | ||||
Operating income | 15,063 | 12,179 | 24,944 | 18,768 | ||||
Net income (loss) | 8,559 | (35,192) | (2,097) | (43) | ||||
Item 9.Changes in and Disagreements with Accountants on Accounting and Financial Disclosure
None.
Item 9A.Controls and Procedures
Evaluation of Disclosure Controls and Procedures
The Company maintains disclosure controls and procedures (as defined in Rules 13a-15(e) and 15d - 15(e) under the Securities Exchange Act of 1934, as amended (the “Exchange Act”)) that are designed with the objective of providing reasonable assurance that information required to be disclosed in the Company's reports filed or submitted under the Exchange Act is recorded, processed, summarized and reported within the time periods specified in the SEC's rules and forms, and is accumulated and communicated to the Company's management, including its Chief Executive Officer ("CEO") and Chief Financial Officer ("CFO"), as appropriate to allow timely decisions regarding required disclosures. The Company's management, under the supervision and with the participation of its CEO and CFO, has evaluated the effectiveness of the Company's disclosure controls and procedures as of the end of the period covered by this annual report. Based upon that evaluation, the Company's CEO and CFO concluded that the design and operation of the Company's disclosure controls and procedures were effective as of December 31, 2015.
Management's Report on Internal Control Over Financial Reporting
The Company's management, under the supervision and with the participation of its CEO and CFO, is responsible for establishing and maintaining adequate internal control over financial reporting, as such term is defined in Exchange Act Rule 13a-15(f). Internal control over financial reporting refers to a process designed to provide reasonable assurance regarding the reliability of financial reporting and the preparation of financial statements for external purposes in accordance with U.S. GAAP. Because of its inherent limitations, internal control over financial reporting may not prevent or detect misstatements. Also, projections of any evaluation of the effectiveness to future periods are subject to the risk that the controls may become inadequate because of changes in conditions, or that the degree of compliance with the policies or procedures may deteriorate.
Management, including the Company's CEO and CFO, evaluated the effectiveness of the Company's internal control over financial reporting using the framework established in the 2013 Internal Control-Integrated Framework issued by the Committee of Sponsoring Organizations of the Treadway Commission ("COSO"). Based upon that evaluation, management has concluded that, as of December 31, 2015, the Company's internal control over financial reporting was effective.
68
Changes in Internal Control over Financial Reporting
There have been no changes in internal control over financial reporting during the Company's fourth quarter that have materially affected, or are reasonably likely to materially affect, the Company’s internal control over financial reporting.
Item 9B.Other Information
The following disclosure would have otherwise been filed on Form 8-K under the heading “Item 5.02 Departure of Directors or Certain Officers; Election of Directors; Appointment of Certain Officers; Compensatory Arrangements of Certain Officers.”
On March 10, 2016, Dr. Stephan Kessel resigned from his position as a member of the Board of Directors of WireCo WorldGroup Inc. (the “Company”). The resignation was not the result of any disagreement with the Company on any matter relating to the Company's operations, policies or practices.
PART III
Item 10.Directors, Executive Officers and Corporate Governance
Executive Officers
The following are the Registrant's executive officers as of March 10, 2016:
Christopher L. Ayers, 49, is the President and Chief Executive Officer, a position he has held since July 2013. Prior to that, Mr. Ayers served in various roles at Alcoa Inc., most recently serving as Executive Vice President - Global Primary Products, where he oversaw the aluminum and alumina businesses, a more than $10 billion division with 39 global facilities and more than 20,000 employees. He joined Alcoa Inc. in February 2010 as Vice President and Chief Operations Officer of Alcoa Cast, Forged and Extruded Products and was promoted to Chief Operations Officer of Global Primary Products in August 2010. Prior to joining Alcoa Inc., Mr. Ayers was President of the Forgings Division of Precision Castparts Corporation (“PCC”) and President of PCC's Wyman Gordon Forgings and Special Metals businesses. He has served as a director of WireCo WorldGroup Inc. since July 2013. Mr. Ayers currently serves as a director of Universal Stainless & Alloy Products, Inc. (USAP/NASDAQ), where he also serves as a member of the Audit, Governance and Compensation Committees.
Brian G. Block, 38, is the Senior Vice President and Chief Financial Officer, a position he has held since May 2013. He originally joined WireCo WorldGroup Inc. in July 2010 and served as Vice President and Senior Vice President of Strategic Analysis, where he was responsible for executing the Company's financing transactions and mergers and acquisitions. Prior to joining the Company, he was a director at Paine & Partners (previously Fox Paine & Company) for 8 years. During his tenure, Mr. Block was an active member of multiple boards and held a financial operating position at ACMI Corporation, a portfolio company of Fox Paine & Company, and he also served on the Board of Directors of the Company during 2009. Prior to working at Paine & Partners, Mr. Block was an associate at CIBC World Markets in the leveraged finance group.
José L. Gramaxo, 55, is the Senior Vice President and Chief Commercial Officer, a position he has held since April 2013. Mr. Gramaxo joined the Company in July 2012 as Senior Vice President of Global Synthetics after the acquisition of Lankhorst. Mr. Gramaxo was President and Chief Executive Officer of Lankhorst from 2004 to 2012 and was also the President of the Netting Committee of the European Federation of the Rope and Netting Manufacturers from 1998 to 2008.
Adrian J. Holt, 47, joined WireCo WorldGroup Inc. in January 2014 as Senior Vice President and Chief Human Resources Officer. Mr. Holt previously served as Vice President of Corporate Human Resource Services with BASF Corporation since 2009, where he oversaw a 55-member human resource team across the United States, Mexico and Canada. During his career with BASF, he managed the Human Resource function of the Agricultural Chemicals business from 2007 to 2009 and served as the Human Resource and Legal Director and Deputy Managing Director for BASF’s Northern European region from 2003 to 2007.
Board of Directors
Through control of a majority of the shares, Paine & Partners Fund III and its affiliates have the power to control us and our affairs and policies, including the election of our directors and the appointment of our management team. Two members of the WireCo WorldGroup Inc.'s Board of Directors are partners of Paine & Partners and one member is an operating director of Paine & Partners.
The following are the Registrant's Board of Directors as of March 10, 2016:
John “Jack” Anton, 73, has been an Operating Director at Paine & Partners since 2005. Mr. Anton brings over 40 years of experience leading organizations and acting as an investor in the worldwide food, consumer products and specialty ingredients
69
industries. Before joining the predecessor firm to Paine & Partners, he was a Senior Advisory Director with Fremont Partners, Chairman, Chief Executive Officer and co-owner of Ghirardelli Chocolate Company, and Chairman and co-owner of Carlin Foods. He is the current Chairman of the Board and has served as a director of WireCo WorldGroup Inc. since November 2010. Mr. Anton also serves as Chairman of the Board of Sunrise Growers, a private company. He served on the board and the Audit Committee of Con-Way, Inc. (CNW/NYSE) from 2005 to 2015. Mr. Anton's 36 years of experience in running businesses, as well as 12 years of managing portfolio companies, and his expertise in marketing, business development and cost management led the Board to conclude that Mr. Anton should serve as a director.
Troy W. Thacker, 43, is President and Chief Executive Officer of Total Safety U.S., Inc. Prior to joining Total Safety, Mr. Thacker was President and Chief Executive Officer of R360 Environmental Solutions, Inc. from July 2010 until May 2013 and a former founding partner of Paine & Partners. Mr. Thacker was employed at Paine & Partners from 2001 until July 2010. Prior to his career at Paine & Partners, he worked at various private equity investment firms, including Gryphon Investors, Inc. and SCF Partners, LTD. He has served as a director of WireCo WorldGroup Inc. since February 2007. Mr. Thacker's valuable financial and management experience, including serving as a chief executive officer, led the Board to conclude that Mr. Thacker should serve as a director.
W. Dexter Paine, III, 55, is a founding partner of Paine & Partners. In 1997, he co-founded the predecessor firm to Paine & Partners where he served as President from its inception until 2008. He has served as a director of WireCo WorldGroup Inc. since November 2010. Mr. Paine also currently serves as a member of the board of Scanbio Marine Group Holdings (Norway) AS, Spearhead International and Icicle Seafoods, Inc., all private companies, as Chairman of the Board of the U.S. Ski and Snowboard Association, a private organization, and as a Vice President and council member of the International Ski Federation (FIS). His previous directorships include: a former member of the international board of directors of Right to Play and past Chairman of the Board and Emeritus Trustee of Holderness School and the Nueva School, all private organizations. Mr. Paine's valuable executive leadership experience and thorough understanding of strategic planning, business development and international operations led the Board to conclude that Mr. Paine should serve as a director.
Franklin Myers, 63, has served as a Senior Advisor of Quantum Energy Partners, a private equity firm in the global energy industry, since February 2013. From 2009 to 2012, he was an Operating Advisor with Paine & Partners. Prior to joining Paine & Partners, Mr. Myers served as Senior Advisor to Cameron International Corporation, among other positions during his tenure, including as Senior Vice President and Chief Financial Officer, President of Cameron's compression business and Senior Vice President and General Counsel. In addition, Mr. Myers served as Senior Vice President and General Counsel of Baker Hughes Incorporated and was a partner at Fulbright & Jaworski. He has served as a director of WireCo WorldGroup Inc. since March 2011. Mr. Myers also currently serves as a director of Ion Geophysical Corporation (IO/NYSE), Comfort Systems USA, Inc. (FIX/NYSE), Forum Energy Technologies Inc. (FET/NYSE) and Holly Frontier Corporation (HFC/NYSE). Mr. Myers serves on the Audit Committee of Comfort Systems USA, Inc. (FIX/NYSE) and the Audit Committee of Forum Energy Technologies Inc. (FET/NYSE). Mr. Myers' expertise in the areas of corporate law, financial, accounting and auditing matters, including experience as a chief financial officer, led the Board to conclude that Mr. Myers should serve as a director.
Andrew M. Freeman, 43, has been a partner of Paine & Partners since 2010. He joined the predecessor firm to Paine & Partners in 2005 as a director. Prior to joining Paine & Partners, Mr. Freeman was employed at Fremont Partners where he solicited, evaluated, structured, negotiated and harvested investments in a wide variety of companies. He has served as a director of WireCo WorldGroup Inc. since May 2013. Mr. Freeman also currently serves as a director of Scanbio Marine Group AS, Capital Z Asset Management, LLC, Eurodrip S.A. and Specialty Waste Partners, Inc. (formerly known as R360 Environmental Solutions, Inc.), all private companies. Mr. Freeman's experience in senior operating positions in investment banking, venture capital and private equity led the Board to conclude that Mr. Freeman should serve as a director.
Christopher L. Ayers, 49, has been the President and Chief Executive Officer of WireCo WorldGroup Inc. since July 2013. Prior to that, Mr. Ayers served in various roles at Alcoa Inc., most recently serving as Executive Vice President - Global Primary Products, where he oversaw the aluminum and alumina businesses, a more than $10 billion division with 39 global facilities and more than 20,000 employees. He joined Alcoa Inc. in February 2010 as Vice President and Chief Operations Officer of Alcoa Cast, Forged and Extruded Products and was promoted to Chief Operations Officer of Global Primary Products in August 2010. Prior to joining Alcoa Inc., Mr. Ayers was President of the Forgings Division of Precision Castparts Corporation (“PCC”) and President of PCC's Wyman Gordon Forgings and Special Metals businesses. He has served as a director of WireCo WorldGroup Inc. since July 2013. Mr. Ayers currently serves as a director of Universal Stainless & Alloy Products, Inc. (USAP/NASDAQ), where he also serves as a member of the Audit, Governance and Compensation Committees. Mr. Ayers’ extensive knowledge of the industry and a detailed understanding of the Company’s operations led the Board to conclude that Mr. Ayers should serve as a director.
Committees
The WireCo WorldGroup (Cayman) Inc. Audit Committee and Compensation Committee serve as the Audit Committee and Compensation Committee for WireCo WorldGroup Inc. The duties and responsibilities of the Audit Committee include
70
recommending the appointment or termination of the engagement of our independent registered public accounting firm, overseeing the independent auditor relationship and reviewing significant accounting policies and controls. The members of the Audit Committee are Messrs. Myers (Chairman), Anton and Freeman. Mr. Myers serves as an “Audit Committee financial expert” and is independent under the rules of the New York Stock Exchange.
The duties and responsibilities of the Compensation Committee include overseeing the compensation of our directors, officers and other employees, along with our overall compensation policies, strategies, plans and programs. The members of our Compensation Committee are Messrs. Paine (Chairman) and Freeman.
We currently have no nominating committee or other board committee performing an equivalent function. Currently, W. Dexter Paine, III, a member of our board of directors, selects the Company’s nominations to the board of directors. There is no formal process or policy that governs the manner in which we identify potential candidates for the board of directors. The board of directors has not established a nominating committee primarily because the current composition and size of the board of directors permits candid and open discussion regarding potential new members of the board of directors.
Code of Business Conduct and Ethics
We have adopted a Code of Business Conduct and Ethics (the "Code") that applies to all of our directors, officers and employees, including our executive officers. A copy of the Code can be found on our website at www.wirecoworldgroup.com through the "Compliance Policies" page. We will post any amendments to the Code, or waivers of the Code (to the extent applicable to our principal executive officer, principal financial officer or principal accounting officer), on our website.
Item 11. Executive Compensation
Summary Compensation Table
The table below sets forth information regarding the compensation for our named executive officers during fiscal years 2015, 2014 and 2013.
Name and principal position | Year | Salary ($) | Bonus(1) ($) | Stock awards(2) ($) | Option awards(2) ($) | Non-equity incentive plan comp.(3) ($) | All other comp.(5) ($) | Total ($) | ||||||||||||||||||||||
Christopher L. Ayers, President and Chief Executive Officer | 2015 | $ | 1,030,313 | $ | 507,375 | $ | — | $ | — | $ | — | $ | 51,357 | $ | 1,589,045 | |||||||||||||||
2014 | $ | 1,025,000 | $ | 1,334,241 | $ | — | $ | — | $ | — | $ | 80,330 | $ | 2,439,571 | ||||||||||||||||
2013 | $ | 500,000 | $ | 750,000 | $ | 3,531,420 | $ | 11,630,000 | $ | — | $ | 20,182 | $ | 16,431,602 | ||||||||||||||||
José L. Gramaxo, Senior Vice President and Chief Commercial Officer (4) | 2015 | $ | 438,411 | $ | — | $ | — | $ | — | $ | 311,271 | $ | 123,493 | $ | 873,175 | |||||||||||||||
2014 | $ | 497,232 | $ | — | $ | — | $ | 1,375,000 | $ | 478,949 | $ | 158,275 | $ | 2,509,456 | ||||||||||||||||
2013 | $ | 453,667 | $ | — | $ | — | $ | — | $ | 236,009 | $ | 140,522 | $ | 830,198 | ||||||||||||||||
Brian G. Block, Senior Vice President and Chief Financial Officer | 2015 | $ | 434,000 | $ | — | $ | — | $ | — | $ | 313,110 | $ | 33,435 | $ | 780,545 | |||||||||||||||
2014 | $ | 413,332 | $ | — | $ | — | $ | 1,375,000 | $ | 361,618 | $ | 34,062 | $ | 2,184,012 | ||||||||||||||||
2013 | $ | 373,333 | $ | — | $ | — | $ | — | $ | 176,812 | $ | 18,536 | $ | 568,681 | ||||||||||||||||
(1) | See the Compensatory Arrangements section below. |
(2) | Represents the grant date fair value of restricted stock and/or option awards received during the respective period. A restricted stock share is valued at the market price of a share of stock on the date of grant. Refer to Note 9—“Share-based Compensation” to our consolidated financial statements included in Item 8, Financial Statements and Supplementary Data of this annual report for the relevant assumptions used to determine the valuation of our option awards. |
(3) | Represents bonuses earned under the Management EBITDA Bonus Plan in 2013 and 2014 and under the Employee Bonus Plan in 2015. |
71
(4) | Mr. Gramaxo receives his compensation in euros. Conversion to U.S. dollars was based on an average exchange rate during 2015 of €1.1099 to $1.00, during 2014 of €1.3288 to $1.00 and during 2013 of €1.3280 to $1.00. |
(5) | All Other Compensation includes: |
Year | Contributions under retirement plans(A) | Relocation benefits(B) | Personal use of Company auto | Total all other compensation | ||||||||||||||
Christopher L. Ayers | 2015 | $ | 13,250 | $ | 31,144 | $ | 6,963 | $ | 51,357 | |||||||||
2014 | $ | 13,000 | $ | 52,798 | $ | 14,532 | $ | 80,330 | ||||||||||
2013 | $ | — | $ | 20,182 | $ | — | $ | 20,182 | ||||||||||
José L. Gramaxo | 2015 | $ | 117,444 | $ | — | $ | 6,049 | $ | 123,493 | |||||||||
2014 | $ | 140,607 | $ | — | $ | 17,668 | $ | 158,275 | ||||||||||
2013 | $ | 140,522 | $ | — | $ | — | $ | 140,522 | ||||||||||
Brian G. Block | 2015 | $ | 13,250 | $ | — | $ | 20,185 | $ | 33,435 | |||||||||
2014 | $ | 13,000 | $ | — | $ | 21,062 | $ | 34,062 | ||||||||||
2013 | $ | 12,773 | $ | — | $ | 5,763 | $ | 18,536 | ||||||||||
(A) Contributions under retirement plans. Consists of matching contributions to the Company's 401(k) plan made by the Company on behalf of the U.S.-based named executive officers. Pursuant to his employment agreement, the Company contributes a fixed amount of €105,815 to an annuity for Mr. Gramaxo on an annual basis.
(B) Relocation benefits. The Company provided Mr. Ayers with a furnished apartment, including utility expenses and a leased automobile.
Compensatory Arrangements
The relative levels of base salary for our named executive officers are designed to reflect each executive officer’s scope of responsibility and accountability with the Company. Mr. Ayers and Mr. Gramaxo are covered by employment agreements, as described below.
Employment Agreements
On May 15, 2013, WireCo WorldGroup Inc. entered into an employment agreement with Christopher L. Ayers (the “Ayers Employment Agreement”) pursuant to which Mr. Ayers became the President and Chief Executive Officer of WireCo WorldGroup Inc. effective July 1, 2013 for a period of three years, with automatic annual renewals, at an initial annual base salary of $1,000,000 that is subject to annual review for increases by the Board. Under the CEO Bonus Plan, Mr. Ayers is eligible for an annual target bonus of $1,250,000 (or 125% of base salary) with the possibility of earning an annual bonus of up to $1,500,000 (or 150% of base salary), in each case upon the achievement of pre-established performance goals as established by the Company's Board of Directors or the Compensation Committee of the Company. For 2013, Mr. Ayers was entitled to a guaranteed minimum bonus of $750,000. Mr. Ayers is also entitled to a special bonus amount in the event a change in control occurs within three years of his commencement date, so long as he is employed as of the closing date of such transaction. Upon his commencement of employment, Mr. Ayers received (i) a grant of non-qualified stock options to purchase up to 100,000 shares of common stock of the Company at an exercise price of $255.90, per share vesting in equal parts on the first, second and third anniversaries of the effective date of the Ayers Employment Agreement, and (ii) a one-time grant of 13,800 shares of common stock of the Company (the “Restricted Stock”) subject to the restrictions and other terms in the Restricted Stock Agreement, vesting on July 1, 2017 provided that if he is terminated without “cause”, he terminates his employment for “good reason”, or if his employment agreement is not renewed, the Restricted Stock shall vest in proportion to Mr. Ayers’ service period measured from his employment commencement date. The Restricted Stock shall be fully vested upon a change in control. Additional benefits provided to Mr. Ayers pursuant to the Ayers Employment Agreement include participation in WireCo WorldGroup Inc.’s employee benefits programs made available to its senior executives, reimbursement for relocation expenses and a monthly housing allowance in connection with his relocation for a period of up to fifteen months from the commencement of his employment. For a discussion of payments to Mr. Ayers upon termination and termination restrictions, see "Payments to Named Executive Officers Upon Termination or Change in Control".
72
On May 28, 2004, José Gramaxo entered into an employment agreement (the “Gramaxo Employment Agreement”) with Royal Lankhorst Euronete Group B.V. (“Lankhorst”), which has an indefinite term but shall terminate by operation of law when Mr. Gramaxo, now 55, turns 65, unless either party gives earlier notice of its intention to terminate. The Gramaxo Employment Agreement provides for an initial annual base salary of €200,000 that is subject to annual review. Mr. Gramaxo also participates in the employee benefit plans made available to senior executives of Lankhorst generally. In addition to the compensation arrangement set forth in the Gramaxo Employment Agreement, Mr. Gramaxo also participates in the Company’s Employee Bonus Plan. For a discussion of payments to Mr. Gramaxo upon termination and termination restrictions, see "Payments to Named Executive Officers Upon Termination or Change in Control".
The foregoing summaries are qualified in their entirety by reference to the Ayers Employment Agreement and the Gramaxo Employment Agreement, which are incorporated herein by reference.
Employee Bonus Plan
The Company previously maintained an incentive plan called the Management EBITDA Bonus Plan ("EBITDA Bonus Plan") which was based solely on Adjusted EBITDA. On January 1, 2015, the EBITDA Bonus Plan was replaced by the Employee Bonus Plan (the "Plan"), which is based on Adjusted EBITDA and cash generation during each calendar year. For this Plan, Adjusted EBITDA is defined in the same context we use in our business to measure our performance. For the definition of Adjusted EBITDA, see the section titled “Adjusted EBITDA” included in Item 7, Management's Discussion and Analysis of Financial Condition and Results of Operations of this annual report. The Plan’s components consist of 70% EBITDA performance and 30% cash generation. For 2015, the 70% EBITDA bonus portion will be calculated and paid out, if earned, on a quarterly basis, and the 30% cash bonus portion will be calculated annually and paid out, if earned, in the first quarter of 2016. Effective January 1, 2016, both corporate EBITDA and cash generation targets will be calculated annually and paid out, if earned, in the first quarter of the following year. Also, effective January 1, 2016, the Plan was amended primarily to clarify that an employee must be employed through the payment date in order to receive a bonus payment. Generally, no bonuses are paid under the Employee Bonus Plan unless the Company achieves a threshold of 85% of the Adjusted EBITDA or cash generation targets as budgeted. In accordance with the terms of the Plan, the Compensation Committee determined that the EBITDA bonus portion for 2015 would be calculated and paid out on a semi-annual basis for employees other than executives, after the end of the second and fourth quarters, respectively. It was determined that the EBITDA bonus portion for 2015 would be calculated and paid out on an annual basis for executives after the fourth quarter.
CEO Bonus Plan
Mr. Ayers participates in the CEO Bonus Plan, as amended on May 15, 2013, rather than the Employee Bonus Plan. The CEO Bonus Plan calls for an initial annual bonus target of $1,250,000 (the “Target Bonus”), with the possibility of earning an annual bonus of up to $1,500,000 (or 150% of base salary) in the event of maximum performance, not considering further salary increases.
The criteria for the CEO Bonus Plan are as follows:
Criteria | Weight |
Achievement of the Company’s EBITDA target (the “Target EBITDA Metric”) | 50% |
Achievement of the Company’s cash flow target (the “Target FCF Metric”) | 25% |
Achievement of other performance metrics to be agreed upon by the CEO and the Board (the “Target Other Bonus Metric”) (1) | 25% |
(1) If no agreement is reached as to the Target Other Bonus Metric, the terms for such year shall consist of 67% of the Target Bonus based on the Target EBITDA Metric and 33% of the Target Bonus based on the Target FCF Metric.
73
The payout range for the Target Bonus components shall be as follows:
Achievement with respect to any metric | Payout |
<90% | 0 |
90% - 100% | 50% - 100% (1) |
101% - 110% | 102% - 120% (2) |
(1) For each 1% increase in performance achievement above 90%, the payout percentage shall increase by 5%, so that at 100% performance achievement of any metric, the payout shall be at 100% of the applicable target level.
(2) For every 1% increase in performance achievement above 100%, up to and including 110% performance achievement, the payout percentage shall increase by 2%, so that at 110% performance achievement, the payout percentage shall be at 120% of the applicable target level. The maximum annual bonus payout with respect to all performance metrics is capped at $1.5 million (or 150% of base salary) in the aggregate.
For 2015, Mr. Ayers earned a bonus of $507,375.
Long Term Incentive Plan
The 2008 Long Term Incentive Plan (the “LTIP”) authorizes various types of equity-based awards, including stock options, restricted stock, restricted stock units and other equity-based instruments of the Company. The LTIP authorizes the use of 563,216 shares of common stock of the Company, of which, 509,791 shares of common stock are subject to outstanding stock options. Vesting of service-based stock options is conditioned upon continued service, although partial or fully accelerated vesting may occur under limited circumstances in connection with certain termination or liquidity events. In general, the options vest ratably over five years of service from the date of grant, with one-fifth vesting each year.
All stock options granted have a 10-year contractual term and require that any exercise of vested options be completed no later than 90 days following a termination from service unless otherwise stated in a separation agreement. In the event of the optionee’s death, the installment of options scheduled to vest during the 12-month period immediately following death become fully vested. A liquidity event means a public offering or other sale by the investor; however, such sale by the investor will not be considered a liquidity event if the sale is prior to a public offering and the investor continues to beneficially own fifty percent or more of the (a) outstanding shares and (b) combined voting power of the then outstanding voting securities of the Company entitled to vote for the election of directors. Upon a liquidity event, total outstanding options will vest to the same percentage as the overall liquidated percentage of shares. Any remaining unvested options will continue to vest in equal installments on the vesting dates subsequent to the liquidity event. If an optionee is terminated without cause within a one-year period following the consummation of a liquidity event, all options become fully vested.
Payments to Named Executive Officers Upon Termination or Change in Control
Upon a termination of employment without "cause" or a resignation for "good reason" that is not in connection with a "change in control" (as each such term is defined in the Ayers Employment Agreement), Mr. Ayers shall be entitled to severance payments in an amount equal to his annual base salary and the average annual bonus paid to him during his prior two years of service, payable in equal monthly or semi-monthly installments over an 18-month period and conditioned on his execution of a general release. Under the terms of the Ayers Employment Agreement, Mr. Ayers is subject to various post-termination restrictions and obligations following his termination of employment for any reason. These include restrictions for eighteen months following the termination of his employment from engaging in any competitive activity or soliciting the customers and employees of WireCo WorldGroup Inc. and its affiliates. He is also subject to non-disparagement and confidentiality obligations.
Pursuant to his employment agreement, Mr. Gramaxo is entitled to payment equal to (i) two times Mr. Gramaxo’s annual gross base salary and (ii) the average annual bonus paid to Mr. Gramaxo based on the average total bonuses paid out in the three fiscal years immediately preceding a termination without "cause" or a resignation for "good reason" (as each such term is defined in the Gramaxo Employment Agreement). Mr. Gramaxo is also subject to non-compete covenants while he is employed by Lankhorst and for the 12-month period following termination of employment. He is also subject to confidentiality obligations.
Non-qualified Deferred Compensation Plans
We do not maintain any non-qualified deferred compensation plans.
74
Outstanding Equity Awards at Year End
The following tables provide information regarding outstanding options and restricted stock that have been granted, but not exercised or vested as of December 31, 2015:
Option Awards | ||||||||||
Name | Number of securities underlying unexercised options (#) exercisable | Number of securities underlying unexercised options (#) unexercisable | Option exercise price | Option expiration date | ||||||
Christopher L. Ayers | 66,667 | 33,333 | $ | 255.90 | 7/1/2023 | (1) | ||||
José L. Gramaxo | 2,000 | 8,000 | $ | 294.62 | 6/2/2024 | (2) | ||||
Brian G. Block | 5,000 | — | $ | 212.90 | 7/1/2020 | (3) | ||||
3,000 | — | 262.52 | 2/8/2021 | (4) | ||||||
2,857 | 1,905 | 294.18 | 9/28/2022 | (5) | ||||||
2,000 | 8,000 | 294.62 | 6/2/2024 | (2) | ||||||
(1) | Stock options with an expiration date of July 1, 2023 vest in one-third increments on July 1, 2014, July 1, 2015, and July 1, 2016. |
(2) | Stock options with an expiration date of June 2, 2024 vest in one-fifth increments on June 2, 2015, June 2, 2016, June 2, 2017, June 2, 2018, and June 2, 2019. |
(3) | Stock options with an expiration date of July 1, 2020 vest in one-fifth increments on July 1, 2011, July 1, 2012, July 1, 2013, July 1, 2014, and July 1, 2015. |
(4) | Stock options with an expiration date of February 8, 2021 vest in one-fifth increments on February 8, 2012, February 8, 2013, February 8, 2014, February 8, 2015, and February 8, 2016. |
(5) | Stock options with an expiration date of September 28, 2022 vest in one-fifth increments on September 28, 2013, September 28, 2014, September 28, 2015, September 28, 2016, and September 28, 2017. |
Stock Awards | |||||||
Name | Number of shares of stock that have not vested (#) | Market value of shares of stock that have not vested ($) (2) | |||||
Christopher L. Ayers | 13,800 | (1) | $ | 2,552,862 | |||
José L. Gramaxo | — | — | |||||
Brian G. Block | — | — | |||||
(1) | The restricted stock cliff vests after a four year service period ending on July 1, 2017. |
(2) | The value of the Company's common stock as of December 31, 2015 was $184.99. |
Non-employee Director Compensation
This section describes the compensation earned by our non-employee directors. In addition to the standard compensation of $150,000, the Chairman of the Board and each committee chair receives $25,000 annually. Christopher L. Ayers, our President and CEO, serves on the Board, but is not paid any additional compensation for his services.
75
The following table sets forth the compensation earned by our non-employee directors of WireCo WorldGroup Inc. in 2015:
Fees earned | Stock awards | Option awards | All other compensation | Total | |||||||||||||
Name | ($) | ($) | ($) | ($) | ($) | ||||||||||||
John J. Anton | $ | 175,000 | (1) | — | — | — | $ | 175,000 | |||||||||
Troy W. Thacker | 150,000 | (2) | — | — | — | 150,000 | |||||||||||
W. Dexter Paine, III | — | (3) | — | — | — | — | |||||||||||
Franklin Myers | 175,000 | (4) | — | — | — | 175,000 | |||||||||||
Stephan Kessel (5) | 150,000 | (2) | — | — | — | 150,000 | |||||||||||
Andrew M. Freeman | — | (3) | — | — | — | — | |||||||||||
(1) | Mr. Anton's compensation includes the standard compensation of $150,000 for general board service and $25,000 for his Chairman of the Board responsibilities. |
(2) | Compensation includes the standard compensation of $150,000 for general board service. |
(3) | As a partner of Paine & Partners, received no compensation for services. |
(4) | Mr. Myers' compensation includes the standard compensation of $150,000 for general board service and $25,000 for his Audit Committee Chairman responsibilities. |
(5) | Dr. Kessel served as a director from January 1, 2015 to March 10, 2016. |
Item 12. | Security Ownership of Certain Beneficial Owners and Management and Related Stockholder Matters |
WireCo WorldGroup (Cayman) Inc. ("WireCo") indirectly owns 100% of the voting common stock of WireCo WorldGroup US Holdings Inc. (“US Holdings”); WireCo WorldGroup Inc., the Registrant, is a wholly-owned subsidiary of US Holdings. The following table provides certain information about beneficial ownership of the voting common stock of the Registrant and WireCo as of March 10, 2016 by each person known to beneficially own more than 5% of its respective common stock, each director and named executive officer, and all directors and executive officers as a group. Non-voting shares of US Holdings can be exchanged for common stock of WireCo at an exchange ratio of 1 to 1 pursuant to the Stockholders' Agreement dated February 8, 2007. A person has beneficial ownership of shares if he or she has or shares voting or investment power over the shares, or the right to acquire that power within 60 days of March 10, 2016.
Name and address of beneficial owner | Shares of Registrant's voting common stock beneficially owned as of March 10, 2016 | Percentage of ownership of Registrant | Shares of WireCo voting common stock beneficially owned as of March 10, 2016 | Percentage of ownership of WireCo | ||||||||
US Holdings | 100 | 100 | % | — | — | % | ||||||
Paine & Partners Fund III (1) | — | — | 1,993,500 | 82 | % | |||||||
John J. Anton, Director (2) | — | — | 54,168 | 2 | % | |||||||
Troy W. Thacker, Director | — | — | — | — | % | |||||||
W. Dexter Paine, III, Director | — | — | — | — | % | |||||||
Franklin Myers, Director (3) | — | — | 6,000 | * | ||||||||
Andrew M. Freeman, Director | — | — | — | — | % | |||||||
Christopher L. Ayers, President, Chief Executive Officer and Director (4) | — | — | 80,467 | 3 | % | |||||||
José L. Gramaxo, Senior Vice President and Chief Commercial Officer (5) | — | — | 2,000 | * | ||||||||
Brian G. Block, Senior Vice President and Chief Financial Officer (6) | — | — | 12,857 | * | ||||||||
All directors and executive officers (9) as a group (7) | — | — | 159,492 | 7 | % | |||||||
*Denotes ownership interest that is less than 1%.
76
(1) | This fund consists of various Paine funds. The manager of the fund is Paine & Partners and the address for Paine & Partners is 461 Fifth Avenue, 17th Floor, New York, New York 10017. |
(2) | Includes beneficial ownership of 52,168 shares of WireCo common stock that may be acquired within 60 days of March 10, 2016 pursuant to stock options. |
(3) | Includes beneficial ownership of 3,000 shares of WireCo common stock that may be acquired within 60 days of March 10, 2016 pursuant to stock options. |
(4) | Includes beneficial ownership of 66,667 shares of WireCo common stock that may be acquired within 60 days of March 10, 2016 pursuant to stock options and 13,800 unvested shares of WireCo restricted common stock as to which he has voting power but no dispositive power. |
(5) | Includes beneficial ownership of 2,000 shares of WireCo common stock that may be acquired within 60 days of March 10, 2016 pursuant to stock options. |
(6) | Includes beneficial ownership of 12,857 shares of WireCo common stock that may be acquired within 60 days of March 10, 2016 pursuant to stock options. |
(7) | Includes beneficial ownership of 140,692 shares of WireCo common stock that may be acquired within 60 days of March 10, 2016 pursuant to stock options and 13,800 unvested shares of WireCo restricted common stock as to which an individual has voting power but no dispositive power. |
Equity Compensation Plan Information
The following table provides information as of December 31, 2015, about the common stock that may be issued upon the exercise of options, as well as shares remaining available for future issuance under the Company’s existing equity compensation plan.
Plan category | Number of securities to be issued upon exercise of outstanding options | Weighted- average exercise price of outstanding options | Number of securities remaining available for future issuance under equity compensation plans - excluding securities reflected in the first column | |||||||
Equity compensation plans: | ||||||||||
Approved by security holders | 509,791 | $ | 170.99 | 33,479 | ||||||
Not approved by security holders | — | — | — | |||||||
Total | 509,791 | $ | 170.99 | 33,479 | ||||||
Item 13. | Certain Relationships and Related Transactions and Director Independence |
Directors and Executives
Shareholder Agreements
In connection with our acquisition by Paine & Partners Fund III in 2007, Paine & Partners Fund III, certain of its affiliates, WRCA (Cyprus) Holdings Limited ("WRCA Cyprus"), US Holdings and certain current and former members of our management who invested in WireCo and US Holdings entered into a stockholders agreement on February 8, 2007 (the "Stockholders' Agreement"). The Stockholders' Agreement provides for, among other things, certain restrictions on the transferability of such person’s equity ownership in the Company and US Holdings, as well as tag-along rights, drag-along rights, piggyback registration rights and repurchase rights. In addition, the Stockholders' Agreement provides for exchange rights, whereby shareholders may at any time exchange their non-voting shares in US Holdings for shares in the Company. Also, the Stockholders' Agreement provides that at any time, if the board of directors of the Company determines it to be in the best interest of the Company, the Company may require the management shareholders of US Holdings to surrender to the Company any or all non-voting shares of US Holdings held by such shareholders, in return for the issuance to such shareholders of shares in the Company. In either case, the initial exchange ratio of 1 to 1 will be adjusted to reflect changes in the capital structure of US Holdings or the Company due to dividends, increases or reductions in the number of outstanding shares, or other similar events. In an exchange required by the Company, if there is U.S. federal income tax payable by holders as a result of the exchange, then the Company must provide a method to ensure such holders have sufficient liquidity to pay such tax.
Also in connection with the formation of WireCo, Paine & Partners Fund III, certain of its affiliates, WireCo, and certain members of our management who had invested in WRCA Cyprus and subsequently exchanged their shares for WireCo shares in connection with such formation, entered into a shareholders' agreement on December 29, 2008 (the "Shareholders'
77
Agreement"). The Shareholders' Agreement provides for, among other things, certain restrictions on the transferability of shares in WireCo, as well as certain tag-along rights, drag-along rights, piggyback registration rights and repurchase rights in certain circumstances. WRCA Cyprus was subsequently merged into the Company in 2011.
Transactions with Related Persons
Paine & Partners
In connection with our acquisition by Paine & Partners Fund III on February 8, 2007, we entered into a management agreement with Paine & Partners to provide certain financial and strategic consulting, advisory and other similar services. As compensation for these services, we agreed to pay Paine & Partners an annual fee equal to the greater of $1.5 million or 2% of the projected Adjusted EBITDA of the Company for that year, as well as to reimburse Paine & Partners for its related expenses. In addition, the management agreement requires us to pay fees to Paine & Partners for their services rendered in connection with merger, financing or similar transactions by the Company or their respective subsidiaries or affiliates. For detail of fees paid to Paine & Partners, refer to Note 12—“Related Party Transactions” to our consolidated financial statements included in Item 8, Financial Statements and Supplementary Data, of this annual report.
The Company also entered into an Indemnification Letter Agreement in February of 2007 with Paine & Partners Fund III, which provides that we will indemnify Paine & Partners Fund III or any of its members, employees, agents, affiliates or controlling persons (the “Indemnified Person”) against all liabilities, losses, damages or expenses incurred by such Indemnified Person in connection with the management agreement discussed above. Expenses incurred in defending any action or proceeding for which indemnification is required pursuant to the Indemnification Letter Agreement shall be reimbursed by the Company when incurred unless such liability, loss, damage or expense is ruled by a court of competent jurisdiction, which has become final and no longer subject to appeal or review, to have resulted primarily from such Indemnified Person’s bad faith or gross negligence. The foregoing summary is qualified in its entirety by reference to the Paine & Partners, LLC Management Agreement and form of Indemnification Letter Agreement, which is incorporated herein by reference.
Joint Venture Arrangements
For information on transactions between the Company and its joint ventures, refer to Note 12—“Related Party Transactions” to our consolidated financial statements included in Item 8, Financial Statements and Supplementary Data, of this annual report.
Other Ownership Interests
Related to his former relationship with Paine & Partners, Mr. Block, the Company’s Chief Financial Officer, maintains certain indirect financial interests in Paine & Partners Fund III, the fund that owns a majority of the Company. Neither the Registrant, nor any other Company subsidiaries, are parties to such arrangement and were not involved in the implementation of such arrangement.
Review, Approval or Ratification of Transactions with Related Persons
Policies and Procedures Regarding Related Party Transactions
The Board has adopted a written policy governing related party transactions. For purposes of this policy, a “Related Party Transaction” is any transaction, arrangement or relationship with a Related Party where the aggregate amount involved is expected to exceed $10,000 in any calendar year. “Related Party” includes (a) any person who is or was an executive officer, director or nominee for election as a director at any time during the last fiscal year; (b) any person or group who is a greater than 5% beneficial owner of the Company's voting securities; (c) any immediate family member of a person described in (a) or (b) of this sentence; or (d) any firm, corporation, or other entity which is owned or controlled by a person listed in (a), (b), or (c) above or an entity in which any such person is an executive officer or has a substantial ownership interest.
The related party policy requires the Board to review each Related Party Transaction and determine whether it will approve or ratify such transaction. In determining whether a Related Party Transaction will be approved or ratified, the Board should determine if the transaction is fair as to the Company and consider factors such as (a) the extent of the Related Party’s interest in the transaction; (b) the availability of other sources of comparable products or services; (c) whether the terms are competitive with terms generally available in similar transactions with persons that are not Related Parties; (d) the benefit to the Company; and (e) the aggregate value of the transaction.
Director Independence
We do not list any securities for trading on a national securities exchange. If we were a listed company, we would be subject to requirements that a majority of our Board be independent. For purposes of complying with the disclosure requirements of the
78
SEC, we have adopted the definition of independence used by the New York Stock Exchange. Under the New York Stock Exchange’s definition of independence, two of our directors, Franklin Myers and Troy Thacker, are independent.
Item 14. | Principal Accounting Fees and Services |
KPMG LLP (“KPMG”) served as our independent registered public accounting firm for fiscal years 2015 and 2014. The following table presents the aggregate fees billed and expected to be billed by KPMG for services rendered during such years.
Years ended December 31, | ||||||||
2015 | 2014 | |||||||
(in thousands) | ||||||||
Audit fees (1) | $ | 2,420 | $ | 2,153 | ||||
Audit-related fees (2) | 12 | 1,500 | ||||||
Tax fees (3) | 304 | 391 | ||||||
All other fees | — | — | ||||||
Total fees | $ | 2,736 | $ | 4,044 | ||||
(1) | Consists of fees for professional services rendered in connection with the audits of our annual consolidated financial statements, reviews of our consolidated financial statements included in quarterly reports, routine consultation on accounting and reporting matters and statutory audits required for our foreign subsidiaries. |
(2) | Consists of fees for services rendered in connection with due diligence services related to the Company's business combinations. |
(3) | Consists of fees for professional services rendered in connection with U.S. and foreign tax compliance, such as preparation of tax returns; tax planning, such as assistance with transfer pricing matters; and tax consultation, such as advice related to mergers and acquisitions and requests for rulings or technical advice from taxing authorities. |
The Audit Committee pre-approved all audit and non-audit services performed and related fees. The Audit Committee determined that the non-audit services rendered by KPMG in 2015 and 2014 were compatible with maintaining its independence as auditors of our consolidated financial statements. The Audit Committee has adopted policies and procedures concerning our independent registered public accounting firm, including the pre-approval of services to be provided and approval of related fees. The Audit Committee is responsible for the pre-approval of all audit, audit-related, tax and non-audit services; however, pre-approval authority may be delegated to one or more members of the Audit Committee (“designated member”). The designated member is required to report to the full Audit Committee each specific service pre-approved, together with copies of all supporting documentation.
PART IV
Item 15.Exhibits, Financial Statement Schedules
(1) Financial Statements
The consolidated financial statements and related notes, together with the report of KPMG LLP, appear in Part II Item 8, Financial Statements and Supplementary Data, of this annual report.
(2) | Financial Statement Schedules |
All schedules are omitted because they are not applicable or because the required information is included in the consolidated financial statements or notes thereto.
(3) | Exhibits |
A list of exhibits to this annual report is set forth in the Exhibit Index appearing elsewhere in this annual report and is incorporated herein by reference.
79
SIGNATURES
Pursuant to the requirements of Section 13 or 15(d) of the Securities Exchange Act of 1934, the Registrant has duly caused this report to be signed on its behalf by the undersigned thereunto duly authorized.
WireCo WorldGroup Inc. | |||||||
(Registrant) | |||||||
Dated: | March 10, 2016 | By: | /s/ Christopher L. Ayers | ||||
Christopher L. Ayers | |||||||
President and Chief Executive Officer | |||||||
Pursuant to the requirements of the Securities Exchange Act of 1934, this report has been signed below by the following persons on behalf of the Registrant and in the capacities and on the dates indicated.
/s/ Christopher L. Ayers | President and Chief Executive Officer and Director (Principal Executive Officer) | March 10, 2016 | ||
Christopher L. Ayers | ||||
/s/ Brian G. Block | Senior Vice President and Chief Financial Officer (Principal Financial Officer) | March 10, 2016 | ||
Brian G. Block | ||||
/s/ Keith Hyder | Vice President - Chief Accounting Officer (Principal Accounting Officer) | March 10, 2016 | ||
Keith Hyder | ||||
/s/ John J. Anton | Chairman of the Board | March 10, 2016 | ||
John J. Anton | ||||
/s/ Troy W. Thacker | Director | March 10, 2016 | ||
Troy W. Thacker | ||||
/s/ W. Dexter Paine, III | Director | March 10, 2016 | ||
W. Dexter Paine, III | ||||
/s/ Franklin Myers | Director | March 10, 2016 | ||
Franklin Myers | ||||
/s/ Andrew M. Freeman | Director | March 10, 2016 | ||
Andrew M. Freeman | ||||
80
Exhibit Index
Exhibit No. | Description of Exhibits Incorporated by Reference | ||
3.1 | WireCo WorldGroup Inc. Amended and Restated Certificate of Incorporation (incorporated by reference to Exhibit 3.2(a) to the Registrant’s Registration Statement on Form S-4 (File No. 333-174896), filed on June 15, 2011). | ||
3.2 | WireCo WorldGroup Inc. Amended and Restated Bylaws (as amended) (incorporated by reference to Exhibit 3.2(b) to the Registrant’s Registration Statement on Form S-4 (File No. 333-174896), filed on June 15, 2011). | ||
4.1(a) | Indenture dated May 19, 2010 between WireCo WorldGroup Inc., the Guarantors and U.S. Bank National Association, as trustee (incorporated by reference to Exhibit 4.1(a) to the Registrant’s Registration Statement on Form S-4 (File No. 333-174896), filed on June 15, 2011). | ||
4.1(b) | Supplemental Indenture dated December 14, 2010 between WireCo WorldGroup Inc., the Guarantors and U.S. Bank National Association, as trustee, adding Oliveira as a guarantor (incorporated by reference to Exhibit 4.1(b) to the Registrant’s Registration Statement on Form S-4 (File No. 333-174896), filed on June 15, 2011). | ||
4.1(c) | Guarantee dated May 19, 2010 between WireCo WorldGroup Inc. and the Guarantors (incorporated by reference to Exhibit 4.1(c) to the Registrant’s Registration Statement on Form S-4 (File No. 333-174896), filed on June 15, 2011). | ||
4.1(d) | Form of outstanding 9.5% Senior Notes due 2017 (outstanding notes) (incorporated by reference to Exhibit 4.1(d) to the Registrant’s Registration Statement on Form S-4 (File No. 333-174896), filed on June 15, 2011). | ||
4.1(e) | Form of registered 9.5% Senior Notes due 2017 (exchange notes) (incorporated by reference to Exhibit 4.1(e) to Amendment No. 1 to the Registrant’s Registration Statement on Form S-4/A (File No. 333-174896), filed on August 19, 2011). | ||
4.1(f) | Supplemental Indenture dated August 1, 2011 between WireCo WorldGroup Inc., Drumet Liny I Druty Sp Z O.O., Drumet Drahtseile GmbH, Drumet s.r.o., WireCo WorldGroup Poland Holdings Sp Z O.O., as new guarantors, and U.S. Bank National Association, as trustee (incorporated by reference to Exhibit 4.1(f) to Amendment No. 3 to the Registrant’s Registration Statement on Form S-4/A (File No. 333-174896), filed on December 9, 2011). | ||
4.1(g) | Supplemental Indenture dated October 31, 2011 between WireCo WorldGroup Inc., Drumet CZ, s.r.o. and U.S. Bank National Association, as trustee, adding the Czech Guarantor (incorporated by reference to Exhibit 4.1(f) to Amendment No. 4 to the Registrant’s Registration Statement on Form S-4/A (File No. 333-174896), filed on January 30, 2012). | ||
4.1(h) | Supplemental Indenture dated January 26, 2012 between WireCo WorldGroup Inc., WireCo WorldGroup Comercial, Unipessoal, Lda. and U.S. Bank National Association, as trustee, adding this Portuguese Guarantor (incorporated by reference to Exhibit 4.1(f) to Amendment No. 4 to the Registrant’s Registration Statement on Form S-4/A (File No. 333-174896), filed on January 30, 2012). | ||
4.1(i) | Supplemental Indenture dated January 30, 2012, between WireCo WorldGroup Inc., the Guarantors and U.S. Bank National Association, as trustee, amending the Indenture (incorporated by reference to Exhibit 4.1(f) to Amendment No. 4 to the Registrant’s Registration Statement on Form S-4/A (File No. 333-174896), filed on January 30, 2012). | ||
81
4.1(j) | Supplemental Indenture dated as of July 12, 2012, between WireCo WorldGroup Inc., WireCo Dutch Acquisition B.V., the new guarantor, and U.S. Bank National Association, as trustee, adding the Dutch subsidiary as a guarantor to the Indenture dated as of May 19, 2010 (incorporated by reference to Exhibit 10.8(a) to the Registrant’s quarterly report on Form 10-Q (File No. 333-174896), filed on November 14, 2012). | ||
4.1(k) | Supplemental Indenture dated as of September 7, 2012, between WireCo WorldGroup Inc., the Guarantors and U.S. Bank National Association, as trustee, adding the Mexican subsidiaries as guarantors to the Indenture dated May 19, 2010 (incorporated by reference to Exhibit 10.8(b) to the Registrant’s quarterly report on Form 10-Q (File No. 333-174896), filed on November 14, 2012). | ||
4.1(l) | Supplemental Indenture dated as of November 30, 2012, between WireCo WorldGroup Inc., Lankhorst Euronete Australia PTY LTD, as new guarantor, and U.S. Bank National Association, as trustee, adding the Australian subsidiary as a guarantor to the Indenture dated May 19, 2010 (incorporated by reference to Exhibit 4.1l to the Registrant’s annual report on Form 10-K (File No. 333-174896), filed on March 29, 2013). | ||
4.1(m) | Supplemental Indenture dated as of December 28, 2012, between WireCo WorldGroup Inc., Lankhorst Euronete Portugal, S.A., as new guarantor, and U.S. Bank National Association, as trustee, adding the Portuguese subsidiary as a guarantor to the Indenture dated May 19, 2010 (incorporated by reference to Exhibit 4.1(m) to the Registrant’s annual report on Form 10-K (File No. 333-174896), filed on March 29, 2013). | ||
4.1(n) | Supplemental Indenture dated as of February 8, 2013, between WireCo WorldGroup Inc., Lankhorst Touwfabrieken B.V. and Lankhorst Recycling Deutschland GmbH, as new guarantors, and U.S. Bank National Association, as trustee, adding the Dutch and German subsidiary as guarantors to the Indenture dated May 19, 2010 (incorporated by reference to Exhibit 4.1(n) to the Registrant’s annual report on Form 10-K (File No. 333-174896), filed on March 29, 2013). | ||
10.1* | Employment Agreement, dated May 15, 2013, between WireCo WorldGroup Inc. and Christopher L. Ayers, CEO (incorporated by reference to Exhibit 10.6 to the Registrant's quarterly report on Form 10-Q (File No. 333-174896) filed on August 13, 2013). | ||
10.2* | Employment Contract, dated May 28, 2004, between Royal Lankhorst Euronete Group B.V. and José Gramaxo, Chief Commercial Officer (incorporated by reference to Exhibit 10.6 to the Registrant's annual report on Form 10-K (File No. 333-174896) filed on March 10, 2014). | ||
10.3(a) | Shareholders Agreement among WireCo WorldGroup (Cayman) Inc. and certain investors dated December 29, 2008 (incorporated by reference to Exhibit 10.5 to the Registrant’s Registration Statement on Form S-4 (File No. 333-174896), filed on June 15, 2011). | ||
10.3(b) | Amended Schedule II to Shareholders Agreement among WireCo WorldGroup (Cayman) Inc. and certain investors dated December 29, 2008. Original agreement, filed as Exhibit 10.5 to the Registrant’s S-4 on June 15, 2011 (incorporated by reference to Exhibit 10.7(b) to the Registrant's annual report on Form 10-K (File No. 333-174896), filed on March 10, 2014). | ||
10.4(a) | Stockholders Agreement among WRCA U.S. Holdings Inc. and certain investors dated February 8, 2007 (incorporated by reference to Exhibit 10.7 to the Registrant’s Registration Statement on Form S-4 (File No. 333-174896), filed on June 15, 2011). | ||
10.4(b) | Amended Schedule II to Stockholders Agreement among WRCA U.S. Holdings Inc. and certain investors dated February 8, 2007. Original agreement, filed as Exhibit 10.7 to the Registrant’s S-4 on June 15, 2011 (incorporated by reference to Exhibit 10.8(b) to the Registrant's annual report on Form 10-K (File No. 333-174896), filed on March 10, 2014). | ||
10.5* | Management EBITDA Bonus Plan (incorporated by reference to Exhibit 10.8 to Amendment No. 2 to the Registrant’s Registration Statement on Form S-4 (File No. 333-174896), filed on November 18, 2011). | ||
82
10.6(a)* | WireCo WorldGroup (Cayman) Inc. 2008 Long Term Incentive Plan as adopted on December 29, 2008 and amended on November 9, 2011 (incorporated by reference to Exhibit 10.4(a) to the Registrant’s current report on Form 8-K (File No. 333-174896) filed on October 2, 2012). | ||
10.6(b)* | Form of Option Award Agreement - Time Vesting under the WireCo WorldGroup (Cayman) Inc. 2008 Long Term Incentive Plan (incorporated by reference to Exhibit 10.4(b) to the Registrant’s current report on Form 8-K (File No. 333-174896) filed on October 2, 2012). | ||
10.6(c)* | Form of Non-Qualified Stock Option Agreement - Performance Vesting under the WireCo WorldGroup (Cayman) Inc. 2008 Long Term Incentive Plan (incorporated by reference to Exhibit 10.8(c) to the Registrant’s annual report on Form 10-K (File No. 333-174896), filed on March 29, 2013). | ||
10.6(d)* | Form of Restricted Stock Agreement under the WireCo WorldGroup (Cayman) Inc. 2008 Long Term Incentive Plan (incorporated by reference to Exhibit 10.10 to the Registrant's quarterly report on Form 10-Q (File No. 333-174896) filed on August 13, 2013). | ||
10.7(a) | Credit Agreement dated July 12, 2012 (incorporated by reference to Exhibit 10.1 to the Registrant’s current report on Form 8-K (File No. 333-174896) filed on July 16, 2012). | ||
10.7(b) | The First Amendment to Credit Agreement dated as of August 9, 2012 between WireCo WorldGroup Inc. and WRCA (Luxembourg) Holdings S.À.R.L, borrowers, and Fifth Third Bank, as administrative and collateral agent, with reference to the Credit Agreement dated July 12, 2012 (incorporated by reference to Exhibit 10.10(a) to the Registrant’s quarterly report on Form 10-Q (File No. 333-174896), filed on November 14, 2012). | ||
10.7(c) | The Second Amendment to Credit Agreement dated as of July 1, 2013 between WireCo WorldGroup Inc. and WRCA (Luxembourg) Holdings S.À.R.L, borrowers, and Fifth Third Bank, as administrative and collateral agent, with reference to the Credit Agreement dated July 12, 2012 (incorporated by reference to Exhibit 10.1 to the Registrant’s current report on Form 8-K (File No. 333-174896), filed on July 3, 2013). | ||
10.7(d) | Supplement No. 1 dated as of September 7, 2012 between WireCo WorldGroup Inc. and WRCA (Luxembourg) Holdings S.À.R.L, borrowers, and Fifth Third Bank, as administrative and collateral agent, adding the Mexican subsidiaries as guarantors to the Credit Agreement dated July 12, 2012 (incorporated by reference to Exhibit 10.10(b) to the Registrant’s quarterly report on Form 10-Q (File No. 333-174896), filed on November 14, 2012). | ||
10.7(e) | Supplement No. 2 dated as of November 30, 2012 between WireCo WorldGroup Inc. and WRCA (Luxembourg) Holdings S.À.R.L, borrowers, and Fifth Third Bank, as administrative and collateral agent, adding Lankhorst Euronete Australia PTY LTD as a guarantor to the Credit Agreement dated July 12, 2012. (incorporated by reference to Exhibit 10.9(d) to the Registrant’s annual report on Form 10-K (File No. 333-174896), filed on March 29, 2013). | ||
10.7(f) | Supplement No. 3 dated as of December 28, 2012 between WireCo WorldGroup Inc. and WRCA (Luxembourg) Holdings S.À.R.L, borrowers, and Fifth Third Bank, as administrative and collateral agent, adding Lankhorst Euronete Portugal S.A. as a guarantor to the Credit Agreement dated July 12, 2012. (incorporated by reference to Exhibit 10.9(e) to the Registrant’s annual report on Form 10-K (File No. 333-174896), filed on March 29, 2013). | ||
10.7(g) | Supplement No. 4 dated as of February 8, 2013 between WireCo WorldGroup Inc. and WRCA (Luxembourg) Holdings S.À.R.L, borrowers, and Fifth Third Bank, as administrative and collateral agent, adding Lankhorst Touwfabrieken B.V. and Lankhorst Recycling Deutschland GmbH as guarantors to the Credit Agreement dated July 12, 2012 (incorporated by reference to Exhibit 10.9(f) to the Registrant’s annual report on Form 10-K (File No. 333-174896), filed on March 29, 2013). | ||
10.7(h) | The Third Amendment to Credit Agreement dated as of June 24, 2015 between WireCo WorldGroup Inc. and WRCA (Luxembourg) Holdings S.À.R.L, borrowers, and Fifth Third Bank, as administrative and collateral agent, with reference to the Credit Agreement dated July 12, 2012 (incorporated by reference to Exhibit 10.1 to the Registrant’s quarterly report on Form 10-Q (File No. 333-174896), filed on August 13, 2015). | ||
83
10.8(a) | Note Purchase Agreement dated July 12, 2012, related to the issuance of the privately placed senior notes due May 15, 2017 (incorporated by reference to Exhibit 10.2 to the Registrant’s current report on Form 8-K (File No. 333-174896), filed on July 16, 2012). | ||
10.8(b) | Amendment No. 1 to Note Purchase Agreement dated as of September 7, 2012, between WireCoWorldGroup Inc., the Mexican subsidiaries, as new guarantors, and the Purchasers, adding the Mexican subsidiaries as guarantors (incorporated by reference to Exhibit 10.9 to the Registrant’s quarterly report on Form 10-Q (File No. 333-174896), filed on November 14, 2012). | ||
10.8(c) | Amendment No. 2 to Note Purchase Agreement dated as of November 30, 2012, between WireCoWorldGroup Inc., Lankhorst Euronete Australia PTY LTD, as new guarantor, and the Purchasers, adding the Australian subsidiary as a guarantor (incorporated by reference to Exhibit 10.10(c) to the Registrant’s annual report on Form 10-K (File No. 333-174896), filed on March 29, 2013). | ||
10.8(d) | Amendment No. 3 to Note Purchase Agreement dated as of December 28, 2012, between WireCoWorldGroup Inc., Lankhorst Euronete Portugal, S.A., as new guarantor, and the Purchasers, adding the Portuguese subsidiary as a guarantor (incorporated by reference to Exhibit 10.10(d) to the Registrant’s annual report on Form 10-K (File No. 333-174896), filed on March 29, 2013). | ||
10.8(e) | Amendment No. 4 to Note Purchase Agreement dated as of February 8, 2013, between WireCo WorldGroup Inc., Lankhorst Touwfabrieken B.V. and Lankhorst Recycling Deutschland GmbH, as new guarantors, and the Purchasers, adding the Dutch and German subsidiaries as guarantors (incorporated by reference to Exhibit 10.10(e) to the Registrant’s annual report on Form 10-K (File No. 333-174896), filed on March 29, 2013). | ||
10.8(f) | Amendment No. 5 to Note Purchase Agreement, dated as of July 16, 2014, between WireCo WorldGroup Inc. and the Purchasers (incorporated by reference to Exhibit 10.1 to the Registrant’s quarterly report on Form 10-Q (File No. 333-174896), filed on August 7, 2014). | ||
10.9 | Paine & Partners, LLC Management Agreement and form of Indemnification Letter Agreement (incorporated by reference to Exhibit 10.16 to Amendment No. 1 to the Registrant’s Registration Statement on Form S-4 (File No. 333-174896), filed on August 19, 2011). | ||
Exhibit No. | Description of Exhibits Filed with this Report | ||
10.10* | Employee Bonus Plan, dated January 1, 2015, as amended and restated on January 1, 2016. | ||
21 | List of Subsidiaries | ||
31.1 | Principal Executive Officer Certification pursuant to Section 302 of the Sarbanes-Oxley Act of 2002 | ||
31.2 | Principal Financial Officer Certification pursuant to Section 302 of the Sarbanes-Oxley Act of 2002 | ||
32.1 | Principal Executive Officer Certification pursuant to Section 906 of the Sarbanes-Oxley Act of 2002 | ||
32.2 | Principal Financial Officer Certification pursuant to Section 906 of the Sarbanes-Oxley Act of 2002 | ||
101.INS | XBRL Instance Document | ||
101.SCH | XBRL Taxonomy Extension Schema Document | ||
84
101.CAL | XBRL Taxonomy Extension Calculation Linkbase Document | ||
101.LAB | XBRL Taxonomy Extension Labels Linkbase Document | ||
101.PRE | XBRL Taxonomy Extension Presentation Linkbase Document | ||
101.DEF | XBRL Taxonomy Extension Definition Linkbase Document | ||
* Management contract or compensatory plan or arrangement required to be filed as an exhibit to this form pursuant to Item 15(b) of this report.
85