Attached files
| file | filename |
|---|---|
| EX-31.1 - EX-31.1 - NL INDUSTRIES INC | nl-ex311_12.htm |
| EX-32.1 - EX-32.1 - NL INDUSTRIES INC | nl-ex321_6.htm |
| EX-23.2 - EX-23.2 - NL INDUSTRIES INC | nl-ex232_7.htm |
| EX-23.1 - EX-23.1 - NL INDUSTRIES INC | nl-ex231_9.htm |
| EX-31.2 - EX-31.2 - NL INDUSTRIES INC | nl-ex312_11.htm |
| EX-21.1 - EX-21.1 - NL INDUSTRIES INC | nl-ex211_10.htm |
| EX-10.35 - EX-10.35 - NL INDUSTRIES INC | nl-ex1035_345.htm |
| EX-10.29 - EX-10.29 - NL INDUSTRIES INC | nl-ex1029_344.htm |
UNITED STATES
SECURITIES AND EXCHANGE COMMISSION
Washington, D.C. 20549
FORM 10-K
|
x |
Annual Report Pursuant to Section 13 OR 15(d) of the Securities Exchange Act of 1934: |
For the fiscal year ended December 31, 2015
Commission file number 1-640
NL INDUSTRIES, INC.
(Exact name of Registrant as specified in its charter)
|
New Jersey |
|
13-5267260 |
|
(State or other jurisdiction of incorporation or organization) |
|
(IRS Employer Identification No.) |
|
5430 LBJ Freeway, Suite 1700 Dallas, Texas 75240-2697 (Address of principal executive offices) Registrant’s telephone number, including area code: (972) 233-1700 |
||
Securities registered pursuant to Section 12(b) of the Act:
|
Title of each class |
|
Name of each exchange on which registered |
|
Common stock |
|
New York Stock Exchange |
No securities are registered pursuant to Section 12(g) of the Act.
Indicate by check mark:
If the Registrant is a well-known seasoned issuer, as defined in Rule 405 of the Securities Act. Yes ¨ No x
If the Registrant is not required to file reports pursuant to Section 13 or Section 15(d) of the Act. Yes ¨ No x
Whether the Registrant (1) has filed all reports required to be filed by Section 13 or 15(d) of the Securities Exchange Act of 1934 during the preceding 12 months and (2) has been subject to such filing requirements for the past 90 days. Yes x No ¨
Whether the Registrant has submitted electronically and posted on its corporate Web site, if any, every Interactive Data File required to be submitted and posted pursuant to Rule 405 of Regulation S-T during the preceding 12 months (or for such shorter period that the registrant was required to submit and post such files). Yes x No ¨
If disclosure of delinquent filers pursuant to Item 405 of Regulation S-K is not contained herein, and will not be contained, to the best of Registrant’s knowledge, in definitive proxy or information statements incorporated by reference in Part III of this Form 10-K or any amendment to this Form 10-K. Yes x No ¨
Whether the Registrant is a large accelerated filer, an accelerated filer, a non-accelerated filer or a smaller reporting company (as defined in Rule 12b-2 of the Act).
Large accelerated filer ¨ Accelerated filer x Non-accelerated filer ¨ Smaller reporting company ¨
Whether the Registrant is a shell company (as defined in Rule 12b-2 of the Act). Yes ¨ No x
The aggregate market value of the 6.8 million shares of voting stock held by nonaffiliates of NL Industries, Inc. as of June 30, 2015 (the last business day of the Registrant’s most recently-completed second fiscal quarter) approximated $50.5 million.
As of February 29, 2016, 48,691,884 shares of the Registrant’s common stock were outstanding.
Documents incorporated by reference
The information required by Part III is incorporated by reference from the Registrant’s definitive proxy statement to be filed with the Commission pursuant to Regulation 14A not later than 120 days after the end of the fiscal year covered by this report.
|
ITEM 1. |
BUSINESS |
The Company
NL Industries, Inc. was organized as a New Jersey corporation in 1891. Our common stock trades on the New York Stock Exchange, or the NYSE, under the symbol NL. References to “NL Industries,” “NL,” the “Company,” the “Registrant,” “we,” “our,” “us” and similar terms mean NL Industries, Inc. and its subsidiaries and affiliate, unless the context otherwise requires.
Our principal executive offices are located at Three Lincoln Center, 5430 LBJ Freeway, Suite 1700, Dallas, TX 75240. Our telephone number is (972) 233-1700. We maintain a website at www.nl-ind.com.
Business summary
We are primarily a holding company. We operate in the component products industry through our majority-owned subsidiary, CompX International Inc. (NYSE MKT: CIX). We operate in the chemicals industry through our noncontrolling interest in Kronos Worldwide, Inc. CompX and Kronos (NYSE: KRO); each file periodic reports with the Securities and Exchange Commission (SEC).
Organization
At December 31, 2015, Valhi, Inc. (NYSE: VHI) held approximately 83% of our outstanding common stock and a wholly-owned subsidiary of Contran Corporation held an aggregate of 93% of Valhi’s outstanding common stock. As discussed in Note 1 to our Consolidated Financial Statements, Lisa K. Simmons and Serena Simmons Connelly may be deemed to control Contran, Valhi, and us.
Forward-looking statements
This Annual Report on Form 10-K contains forward-looking statements within the meaning of the Private Securities Litigation Reform Act of 1995, as amended. Statements in this Annual Report that are not historical facts are forward-looking in nature and represent management’s beliefs and assumptions based on currently available information. In some cases, you can identify forward-looking statements by the use of words such as “believes,” “intends,” “may,” “should,” “could,” “anticipates,” “expects” or comparable terminology, or by discussions of strategies or trends. Although we believe that the expectations reflected in such forward-looking statements are reasonable, we do not know if these expectations will be correct. Such statements by their nature involve substantial risks and uncertainties that could significantly impact expected results. Actual future results could differ materially from those predicted. The factors that could cause actual future results to differ materially from those described herein are the risks and uncertainties discussed in this Annual Report and those described from time to time in our other filings with the SEC include, but are not limited to, the following:
|
|
· |
Future supply and demand for our products |
|
|
· |
The extent of the dependence of certain of our businesses on certain market sectors |
|
|
· |
The cyclicality of our businesses (such as Kronos’ TiO2 operations) |
|
|
· |
Customer and producer inventory levels |
|
|
· |
Unexpected or earlier-than-expected industry capacity expansion (such as the TiO2 industry) |
|
|
· |
Changes in raw material and other operating costs (such as energy, ore, zinc and brass costs) and our ability to pass those costs on to our customers or offset them with reductions in other operating costs |
|
|
· |
Changes in the availability of raw material (such as ore) |
|
|
· |
General global economic and political conditions (such as changes in the level of gross domestic product in various regions of the world and the impact of such changes on demand for, among other things, TiO2 and component products) |
|
|
· |
Competitive products and substitute products |
|
|
· |
Price and product competition from low-cost manufacturing sources (such as China) |
- 2 -
|
|
· |
Potential consolidation of Kronos’ competitors |
|
|
· |
Potential consolidation of Kronos’ customers |
|
|
· |
The impact of pricing and production decisions |
|
|
· |
Competitive technology positions |
|
|
· |
Potential difficulties in integrating future acquisitions |
|
|
· |
Potential difficulties in upgrading or implementing new accounting and manufacturing software systems |
|
|
· |
The introduction of trade barriers |
|
|
· |
Possible disruption of Kronos’ or CompX’s business, or increases in our cost of doing business resulting from terrorist activities or global conflicts |
|
|
· |
The impact of current or future government regulations (including employee healthcare benefit related regulations) |
|
|
· |
Fluctuations in currency exchange rates (such as changes in the exchange rate between the U.S. dollar and each of the euro, the Norwegian krone and the Canadian dollar), or possible disruptions to our business resulting from potential instability resulting from uncertainties associated with the euro or other currencies |
|
|
· |
Operating interruptions (including, but not limited to, labor disputes, leaks, natural disasters, fires, explosions, unscheduled or unplanned downtime, transportation interruptions and cyber attacks) |
|
|
· |
Decisions to sell operating assets other than in the ordinary course of business |
|
|
· |
Kronos’ ability to renew or refinance credit facilities |
|
|
· |
Our ability to maintain sufficient liquidity |
|
|
· |
The timing and amounts of insurance recoveries |
|
|
· |
The extent to which our subsidiaries or affiliates were to become unable to pay us dividends |
|
|
· |
The ultimate outcome of income tax audits, tax settlement initiatives or other tax matters |
|
|
· |
Uncertainties associated with CompX’s development of new product features |
|
|
· |
Our ability to utilize income tax attributes or changes in income tax rates related to such attributes, the benefits of which may not have been recognized under the more-likely-than-not recognition criteria |
|
|
· |
Environmental matters (such as those requiring compliance with emission and discharge standards for existing and new facilities or new developments regarding environmental remediation at sites related to our former operations) |
|
|
· |
Government laws and regulations and possible changes therein (such as changes in government regulations which might impose various obligations on former manufacturers of lead pigment and lead-based paint, including us, with respect to asserted health concerns associated with the use of such products) |
|
|
· |
The ultimate resolution of pending litigation (such as our lead pigment and environmental matters) |
|
|
· |
Possible future litigation. |
Should one or more of these risks materialize or if the consequences of such a development worsen, or should the underlying assumptions prove incorrect, actual results could differ materially from those currently forecasted or expected. We disclaim any intention or obligation to update or revise any forward-looking statement whether as a result of changes in information, future events or otherwise.
- 3 -
Operations and equity investment
Information regarding our operations and the companies conducting such operations is set forth below. Geographic financial information is included in Note 2 to our Consolidated Financial Statements, which is incorporated herein by reference.
|
Component Products CompX International Inc. - 87% owned at December 31, 2015 |
CompX manufactures engineered components that are sold to a variety of industries including recreational transportation (including boats), postal, office and institutional furniture, cabinetry, tool storage, healthcare, gas stations and vending equipment. CompX has three production facilities in the United States.
|
|
Chemicals Kronos Worldwide, Inc. - 30% owned at December 31, 2015 |
Kronos is a leading global producer and marketer of value-added titanium dioxide pigments, or TiO2, a base industrial product used in imparting whiteness, brightness, opacity and durability to a diverse range of customer applications and end-use markets, including coatings, plastics, paper, inks, food, cosmetics and other industrial and consumer “quality-of-life” products. Kronos has production facilities in Europe and North America. Sales of TiO2 represented about 90% of Kronos’ net sales in 2015, with sales of other products that are complementary to Kronos’ TiO2 business comprising the remainder. |
COMPONENT PRODUCTS - COMPX INTERNATIONAL INC.
Industry overview - Through our majority-owned subsidiary, CompX, we manufacture engineered components that are sold to a variety of industries including recreational transportation (including boats), postal, office and institutional furniture, cabinetry, tool storage, healthcare, gas stations and vending equipment. We continuously seek to diversify into new markets and identify new applications and features for our products, which we believe provide a greater potential for higher rates of earnings growth as well as diversification of risk.
Manufacturing, operations and products - CompX’s Security Products business, with one manufacturing facility in South Carolina and one in Illinois shared with the Marine Components business, manufactures mechanical and electronic cabinet locks and other locking mechanisms used in a variety of applications including ignition systems, mailboxes, file cabinets, desk drawers, tool storage cabinets, vending and gaming machines, high security medical cabinetry, electronic circuit panels, storage compartments and gas station security. We believe that CompX is a North American market leader in the manufacture and sale of cabinet locks and other locking mechanisms. These products include:
|
|
● |
disc tumbler locks which provide moderate security and generally represent the lowest cost lock to produce; |
|
|
● |
pin tumbler locking mechanisms which are more costly to produce and are used in applications requiring higher levels of security, including KeSet® and System 64® (which each allow the user to change the keying on a single lock 64 times without removing the lock from its enclosure) TuBar® and Turbine™, and |
|
|
● |
our innovative CompX eLock® and Stealthlock® electrical locks which provide stand-alone or networked security and audit trail capability for drug storage and other valuables through the use of a proximity card, magnetic stripe or keypad credentials. |
A substantial portion of CompX’s Security Products sales consists of products with specialized adaptations to an individual customer’s specifications, some of which are listed above. CompX also has a standardized product line suitable for many customers which is offered through a North American distribution network to locksmith and smaller original equipment manufacturer distributors via its STOCK LOCKS® distribution program.
- 4 -
CompX’s Marine Components business, with a facility in Wisconsin and a facility shared with the Security Products business in Illinois, manufactures and distributes stainless steel exhaust components, gauges, throttle controls, trim tabs, hardware and accessories primarily for performance and ski/wakeboard boats. CompX’s specialty marine component products are high precision components designed to operate within tight tolerances in the highly demanding marine environment. These products include:
|
|
● |
original equipment and aftermarket stainless steel exhaust headers, exhaust pipes, mufflers and other exhaust components; |
|
|
● |
high performance gauges such as GPS speedometers and tachometers; |
|
|
● |
mechanical and electronic controls and throttles; |
|
|
● |
steering wheels and other billet aluminum accessories; and |
|
|
● |
dash panels, LED lighting, wire harnesses and other accessories. |
The following table sets forth the location, size and business operations for each of CompX’s operating facilities at December 31, 2015:
|
Facility Name |
|
Business Operations |
|
Location |
|
Size |
|
|
|
Owned Facilities: |
|
|
|
|
|
|
|
|
|
National (1) |
|
SP |
|
Mauldin, SC |
|
|
198,000 |
|
|
Grayslake(1) |
|
SP/MC |
|
Grayslake, IL |
|
|
133,000 |
|
|
Custom(2) |
|
MC |
|
Neenah, WI |
|
|
95,000 |
|
|
Leased Facilities: |
|
|
|
|
|
|
|
|
|
Distribution Center |
|
SP/MC |
|
Rancho Cucamonga, CA |
|
|
11,500 |
|
SP – Security Products business
MC – Marine Components business
|
(1) |
ISO-9001 registered facilities |
|
(2) |
ISO-9002 registered facility |
We believe all of CompX’s facilities are well maintained and satisfactory for their intended purposes.
Raw materials - The primary raw materials used in CompX’s manufacturing processes are:
|
|
● |
zinc and brass (used in the Security Products business for the manufacture of locking mechanisms); and |
|
|
● |
stainless steel (used primarily in the Marine Components business for the manufacture of exhaust headers and pipes), aluminum (used for the manufacture of throttles and trim tabs), and other components. |
These raw materials are purchased from several suppliers, are readily available from numerous sources and accounted for approximately 10% of our total cost of sales for 2015. Total material costs, including purchased components, represented approximately 48% of our cost of sales in 2015.
CompX occasionally enters into short-term commodity-related raw material supply arrangements to mitigate the impact of future increases in commodity-related raw material costs. These arrangements generally provide for stated unit prices based upon specified purchase volumes, which help us to stabilize our commodity related raw material costs to a certain extent. We periodically enter into such arrangements for zinc and brass. Following a general softening of commodity metal markets during 2015, we expect commodity-related raw material prices to remain relatively stable during 2016; however, these raw materials purchased on the spot market are sometimes subject to unanticipated and sudden price increases. We generally seek to mitigate the impact of fluctuations in these raw material costs on our margins through improvements in production efficiencies or other operating cost reductions. In the event we are unable to offset raw material cost increases with other cost reductions, it may be difficult to recover those cost increases through increased product selling prices or raw material surcharges
- 5 -
due to the competitive nature of the markets served by our products. Consequently, overall operating margins can be affected by commodity-related raw material cost pressures. Commodity market prices are cyclical, reflecting overall economic trends, specific developments in consuming industries and speculative investor activities.
Patents and trademarks - CompX holds a number of patents relating to component products, certain of which we believe to be important to CompX and its continuing business activity. Patents generally have a term of 20 years, and CompX’s patents have remaining terms ranging from less than 1 year to 17 years at December 31, 2015. CompX’s major trademarks and brand names in addition to CompX® include:
|
|
|
Marine Components |
||
|
CompX® Security Products™ |
|
Lockview® |
|
CompX Marine® |
|
National Cabinet Lock® |
|
System64® |
|
Custom Marine® |
|
Fort Lock® |
|
SlamCAM® |
|
Livorsi® Marine |
|
Timberline Lock® |
|
RegulatoR® |
|
Livorsi II® Marine |
|
Chicago Lock® |
|
CompXpress® |
|
CMI™ Industrial |
|
STOCK LOCKS® |
|
GEM® |
|
Custom Marine® Stainless Exhaust |
|
KeSet® |
|
|
|
The #1 Choice in Performance Boating® |
|
TuBar® |
|
|
|
Mega Rim® |
|
StealthLock® |
|
|
|
Race Rim® |
|
ACE® |
|
|
|
Vantage View® |
|
ACE® II |
|
|
|
GEN-X® |
|
CompX eLock® |
|
|
|
|
Sales, marketing and distribution - A majority of CompX’s component sales are sold directly to large OEM customers through our factory-based sales and marketing professionals supported by engineers working in concert with field salespeople and independent manufacturer’s representatives. We select manufacturer’s representatives based on special skills in certain markets or relationships with current or potential customers.
In addition to sales to large OEM customers, a substantial portion of CompX’s Security Products sales are made through distributors. We have a significant North American market share of cabinet lock security product sales as a result of the locksmith distribution channel. We support our locksmith distributor sales with a line of standardized products used by the largest businesses of the marketplace. These products are packaged and merchandised for easy availability and handling by distributors and end users.
In 2015, CompX’s ten largest customers, all Security Products customers, accounted for approximately 48% of our total sales. United States Postal Service and Harley Davidson accounted for approximately 13% and 12%, respectively, of total sales for the year ended December 31, 2015. Overall, our customer base is diverse and the loss of any single customer would not in itself have a material adverse effect on our operations.
Competition - The markets in which CompX participates are highly competitive. CompX competes primarily on the basis of product design, including space utilization and aesthetic factors, product quality and durability, price, on-time delivery, service and technical support. CompX focuses its efforts on the middle and high-end businesses of the market, where product design, quality, durability and service are valued by the customer. The Security Products business competes against a number of U.S. and non-U.S. manufacturers. The Marine Components business competes with small U.S. manufacturers and is minimally affected by non-U.S. competitors.
Regulatory and environmental matters - CompX’s operations are subject to federal, state and local environmental laws and regulations relating to the use, storage, handling, generation, transportation, treatment, emission, discharge, disposal, remediation of and exposure to hazardous and non-hazardous substances, materials and wastes (“Environmental Laws”). CompX’s operations are also subject to federal, state and local regulations relating to worker health and safety. We believe that CompX is in substantial compliance with all such laws and regulations. To date, the costs of maintaining compliance with such laws and regulations have not significantly impacted our results of operations. We currently do not anticipate any significant costs or expenses relating to such matters; however, it is possible future laws and regulations may require us to incur significant additional expenditures.
- 6 -
Employees - As of December 31, 2015, CompX employed 512 people, all in the United States. We believe our labor relations are good at all of our facilities.
CHEMICALS - KRONOS WORLDWIDE, INC.
Business overview - Kronos is a leading global producer and marketer of value-added titanium dioxide pigments, or TiO2, a base industrial product used in a wide range of applications. Kronos, along with its distributors and agents, sells and provides technical services for its products to approximately 4,000 customers in 100 countries with the majority of sales in Europe and North America. We believe that Kronos has developed considerable expertise and efficiency in the manufacture, sale, shipment and service of its products in domestic and international markets.
TiO2 is a white inorganic pigment used in a wide range of products for its exceptional durability and its ability to impart whiteness, brightness and opacity. TiO2 is a critical component of everyday applications, such as coatings, plastics and paper, as well as many specialty products such as inks, food and cosmetics. TiO2 is widely considered to be superior to alternative white pigments in large part due to its hiding power (or opacity), which is the ability to cover or mask other materials effectively and efficiently. TiO2 is designed, marketed and sold based on specific end-use applications.
TiO2 is the largest commercially used whitening pigment because it has a high refractive rating, giving it more hiding power than any other commercially produced white pigment. In addition, TiO2 has excellent resistance to interaction with other chemicals, good thermal stability and resistance to ultraviolet degradation. Although there are other white pigments on the market, Kronos believes that there are no effective substitutes for TiO2 because no other white pigment has the physical properties for achieving comparable opacity and brightness or can be incorporated in as cost-effective a manner. Pigment extenders such as kaolin clays, calcium carbonate and polymeric opacifiers are used together with TiO2 in a number of end-use markets. However, these products are not able to duplicate the opacity performance characteristics of TiO2 and Kronos believes that these products are unlikely to have a significant impact on the use of TiO2.
TiO2 is considered a “quality-of-life” product. Demand for TiO2 has generally been driven by worldwide gross domestic product and has generally increased with rising standards of living in various regions of the world. According to industry estimates, TiO2 consumption has grown at a compound annual growth rate of approximately 3.0% since 1990. Per capita consumption of TiO2 in Western Europe and the United States far exceeds that in other areas of the world, and these regions are expected to continue to be the largest consumers of TiO2 on a per capita basis. Kronos believes that Western Europe and North America currently account for approximately 20% and 18% of global TiO2 consumption, respectively. Markets for TiO2 are generally increasing in South America, Eastern Europe, the Asia Pacific region and China and Kronos believes these are significant markets where it expects continued growth as economies in these regions continue to develop and quality-of-life products, including TiO2, experience greater demand.
Products and end-use markets - Kronos, including its predecessors, has produced and marketed TiO2 in North America and Europe, its primary markets, for almost 100 years. We believe that Kronos is the largest producer of TiO2 in Europe with approximately one-half of its sales volumes attributable to markets in Europe. The table below shows Kronos’ market share for its significant markets, Europe and North America, for the last three years.
|
|
2013 |
|
2014 |
|
2015 |
||||||
|
Europe |
|
18 |
% |
|
|
18 |
% |
|
|
18 |
% |
|
North America |
|
18 |
% |
|
|
17 |
% |
|
|
15 |
% |
We believe that Kronos is the leading seller of TiO2 in several countries, including Germany, with an estimated 9% share of worldwide TiO2 sales volume in 2015. Overall, Kronos is one of the top five producers of TiO2 in the world.
- 7 -
Kronos offers its customers a broad portfolio of products that includes over 40 different TiO2 pigment grades under the Kronos® trademark, which provide a variety of performance properties to meet customers’ specific requirements. Kronos’ major customers include domestic and international paint, plastics, decorative laminate and paper manufacturers. Kronos ships TiO2 to customers in either a powder or slurry form via rail, truck and/or ocean carrier. Sales of its core TiO2 pigments represented approximately 90% of Kronos’ net sales in 2015. Kronos and its agents and distributors primarily sell its products in three major end-use markets: coatings, plastics and paper.
The following tables show Kronos’ approximate TiO2 sales volume by geographic region and end use for the year ended December 31, 2015:
|
Sales volumes percentages by geographic region |
|
Sales volumes percentages by end-use |
||||
|
Europe |
52 |
% |
|
Coatings |
55 |
% |
|
North America |
29 |
% |
|
Plastics |
31 |
% |
|
Asia Pacific |
8 |
% |
|
Other |
9 |
% |
|
Rest of World |
11 |
% |
|
Paper |
5 |
% |
Some of the principal applications for Kronos’ products include the following.
TiO2 for coatings - Kronos’ TiO2 is used to provide opacity, durability, tinting strength and brightness in industrial coatings, as well as coatings for commercial and residential interiors and exteriors, automobiles, aircraft, machines, appliances, traffic paint and other special purpose coatings. The amount of TiO2 used in coatings varies widely depending on the opacity, color and quality desired. In general, the higher the opacity requirement of the coating, the greater the TiO2 content.
TiO2 for plastics - Kronos produces TiO2 pigments that improve the optical and physical properties in plastics, including whiteness and opacity. TiO2 is used to provide opacity in items such as containers and packaging materials, and vinyl products such as windows, door profiles and siding. TiO2 also generally provides hiding power, neutral undertone, brightness and surface durability for housewares, appliances, toys, computer cases and food packages. TiO2’s high brightness along with its opacity is used in some engineering plastics to help mask their undesirable natural color. TiO2 is also used in masterbatch, which is a concentrate of TiO2 and other additives and is one of the largest uses for TiO2 in the plastics end-use market. In masterbatch, the TiO2 is dispersed at high concentrations into a plastic resin and is then used by manufacturers of plastic containers, bottles, packaging and agricultural films.
TiO2 for paper - Kronos’ TiO2 is used in the production of several types of paper, including laminate (decorative) paper, filled paper and coated paper to provide whiteness, brightness, opacity and color stability. Although Kronos sells its TiO2 to all segments of the paper end-use market, its primary focus is on the TiO2 grades used in paper laminates, where several layers of paper are laminated together using melamine resin under high temperature and pressure. The top layer of paper contains TiO2 and plastic resin and is the layer that is printed with decorative patterns. Paper laminates are used to replace materials such as wood and tile for such applications as counter tops, furniture and wallboard. TiO2 is beneficial in these applications because it assists in preventing the material from fading or changing color after prolonged exposure to sunlight and other weathering agents.
TiO2 for other applications - Kronos produces TiO2 to improve the opacity and hiding power of printing inks. TiO2 allows inks to achieve very high print quality while not interfering with the technical requirements of printing machinery, including low abrasion, high printing speed and high temperatures. Kronos’ TiO2 is also used in textile applications where TiO2 functions as an opacifying and delustering agent. In man-made fibers such as rayon and polyester, TiO2 corrects an otherwise undesirable glossy and translucent appearance. Without the presence of TiO2, these materials would be unsuitable for use in many textile applications.
Kronos produces high purity sulfate process anatase TiO2 used to provide opacity, whiteness and brightness in a variety of cosmetic and personal care products, such as skin cream, lipstick, eye shadow and toothpaste. Kronos’ TiO2 is also found in food products, such as candy and confectionaries and in pet foods where it is used to obtain uniformity of color and appearance. In pharmaceuticals, Kronos’ TiO2 is used commonly as a colorant in pill and
- 8 -
capsule coatings as well as in liquid medicines to provide uniformity of color and appearance. Kronos® purified anatase grades meet the applicable requirements of the CTFA (Cosmetics, Toiletries and Fragrances Association), USP and BP (United States Pharmacopoeia and British Pharmacopoeia) and the FDA (United States Food and Drug Administration).
Kronos’ TiO2 business is enhanced by the following three complementary businesses, which comprised approximately 10% of its net sales in 2015:
|
|
● |
Kronos owns and operates two ilmenite mines in Norway pursuant to a governmental concession with an unlimited term. Ilmenite is a raw material used directly as a feedstock by some sulfate-process TiO2 plants. We believe that Kronos has a significant competitive advantage because its mines supply the feedstock requirements for all of its European sulfate-process plants. Kronos also sells ilmenite ore to third-parties, some of whom are competitors, and Kronos sells an ilmenite-based specialty product to the oil and gas industry. The mines have estimated ilmenite reserves that are expected to last at least 50 years. |
|
|
● |
Kronos manufactures and sells iron-based chemicals, which are co-products and processed co-products of the sulfate and chloride process TiO2 pigment production. These co-product chemicals are marketed through Kronos’ Ecochem division and are primarily used as treatment and conditioning agents for industrial effluents and municipal wastewater as well as for the manufacture of iron pigments, cement and agricultural products. |
|
|
● |
Kronos manufactures and sells titanium oxychloride and titanyl sulfate, which are side-stream specialty products from the production of TiO2. Titanium oxychloride is used in specialty applications in the formulation of pearlescent pigments, production of electroceramic capacitors for cell phones and other electronic devices. Titanyl sulfate productions are used in pearlescent pigments, natural gas pipe and other specialty applications. |
Manufacturing, operations and properties - Kronos produces TiO2 in two crystalline forms: rutile and anatase. Rutile TiO2 is manufactured using both a chloride production process and a sulfate production process, whereas anatase TiO2 is only produced using a sulfate production process. Manufacturers of many end-use applications can use either form, especially during periods of tight supply for TiO2. The chloride process is the preferred form for use in coatings and plastics, the two largest end-use markets. Due to environmental factors and customer considerations, the proportion of TiO2 industry sales represented by chloride process pigments has increased relative to sulfate process pigments, and in 2015, chloride process production facilities represented approximately 49% of industry capacity. The sulfate process is preferred for use in selected paper products, ceramics, rubber tires, man-made fibers, food products and cosmetics. Once an intermediate TiO2 pigment has been produced by either the chloride or sulfate process, it is “finished” into products with specific performance characteristics for particular end-use applications through proprietary processes involving various chemical surface treatments and intensive micronizing (milling).
|
|
● |
Chloride process - The chloride process is a continuous process in which chlorine is used to extract rutile TiO2. The chloride process produces less waste than the sulfate process because much of the chlorine is recycled and feedstock bearing higher titanium content is used. The chloride process also has lower energy requirements and is less labor-intensive than the sulfate process, although the chloride process requires a higher-skilled labor force. The chloride process produces an intermediate base pigment with a wide range of properties. |
|
|
● |
Sulfate process - The sulfate process is a batch process in which sulfuric acid is used to extract the TiO2 from ilmenite or titanium slag. After separation from the impurities in the ore (mainly iron), the TiO2 is precipitated and calcined to form an intermediate base pigment ready for sale or can be upgraded through finishing treatment. |
Kronos produced 528,000 metric tons of TiO2 in 2015, up from the 511,000 metric tons produced in 2014. Kronos’ production amounts include its share of the output produced by its TiO2 manufacturing joint-venture discussed below in “TiO2 Manufacturing Joint Venture.” Kronos’ average production capacity utilization rates were approximately 86%, 92%, and 95% of capacity in 2013, 2014, and 2015 respectively. Kronos’s production
- 9 -
utilization rates in 2013 were impacted by the previously-reported lockout at its Canadian production facility that began in June 2013. Kronos operated its Canadian plant at approximately 15% of the plant’s capacity with non-union management employees during the lockout. Kronos’ production rates in 2014 were also impacted by such lockout, as restart of production at the facility did not begin until February 2014. Kronos’ production rates in 2014 and in the first quarter of 2015 were also impacted by the implementation of certain productivity-enhancing improvement projects at other facilities as well as necessary improvements to ensure continued compliance with its permit regulations which resulted in longer-than-normal maintenance shutdowns in some instances.
Kronos operates four TiO2 plants in Europe (one in each of Leverkusen, Germany; Nordenham, Germany; Langerbrugge, Belgium; and Fredrikstad, Norway). In North America, Kronos has a TiO2 plant in Varennes, Quebec, Canada and, through the manufacturing joint venture described below in “TiO2 Manufacturing Joint Venture,” a 50% interest in a TiO2 plant in Lake Charles, Louisiana.
Kronos’ production capacity in 2015 was 555,000 metric tons, approximately three-fourths of which was from the chloride production process.
The following table presents the division of Kronos’ expected 2016 manufacturing capacity by plant location and type of manufacturing process:
|
|
|
|
|
% of capacity by TiO2 |
||||||
|
Facility |
|
Description |
|
Chloride |
|
Sulfate |
||||
|
Leverkusen, Germany (1) |
|
TiO2 production, chloride and sulfate process, co-products |
|
|
39 |
% |
|
|
25 |
% |
|
Nordenham, Germany |
|
TiO2 production, sulfate process, co-products |
|
|
- |
|
|
|
39 |
|
|
Langerbrugge, Belgium |
|
TiO2 production, chloride process, co-products, titanium chemicals products |
|
|
21 |
|
|
|
- |
|
|
Fredrikstad, Norway (2) |
|
TiO2 production, sulfate process, co-products |
|
|
- |
|
|
|
23 |
|
|
Varennes, Canada |
|
TiO2 production, chloride and sulfate process, slurry facility, titanium chemicals products |
|
|
21 |
|
|
|
13 |
|
|
Lake Charles, LA, U.S. (3) |
|
TiO2 production, chloride process |
|
|
19 |
|
|
|
- |
|
|
Total |
|
|
|
|
100 |
% |
|
|
100 |
% |
|
(1) |
The Leverkusen facility is located within an extensive manufacturing complex owned by Bayer AG. Kronos owns the Leverkusen facility, which represents about one-third of its current TiO2 production capacity, but it leases the land under the facility from Bayer under a long-term agreement which expires in 2050. Lease payments are periodically negotiated with Bayer for periods of at least two years at a time. A majority-owned subsidiary of Bayer provides some raw materials, including chlorine, auxiliary and operating materials, utilities and services necessary to operate the Leverkusen facility under separate supplies and services agreements. |
|
(2) |
The Fredrikstad plant is located on public land and is leased until 2063. |
|
(3) |
Kronos operates the Lake Charles facility in a joint venture with Tioxide Americas, LLC (Tioxide), a subsidiary of Huntsman Corporation and the amount indicated in the table above represents the share of TiO2 produced by the joint venture to which Kronos is entitled. See “TiO2 Manufacturing Joint Venture.” |
Kronos owns the land underlying all of its principle production facilities unless otherwise indicated in the table above.
Kronos’ production capacity has increased by approximately 12% over the past ten years due to debottlenecking programs, with only moderate capital expenditures. We believe that Kronos’ annual attainable production capacity for 2016 is approximately 555,000 metric tons and we currently expect Kronos’ production capacity will be at near-capacity levels in 2016.
- 10 -
Kronos also operates two ilmenite mines in Norway pursuant to a governmental concession with an unlimited term. In addition, Kronos operates a rutile slurry manufacturing plant in Lake Charles, Louisiana, which converts dry pigment manufactured for Kronos at the Lake Charles TiO2 facility into a slurry form that is then shipped to customers.
Kronos has various corporate and administrative offices located in the U.S., Germany, Norway, Canada and Belgium and various sales offices located in the U.S., Canada, Belgium, France, the Netherlands and the United Kingdom.
TiO2 Manufacturing Joint Venture - Kronos and Tioxide each own a 50% interest in a manufacturing joint venture, Louisiana Pigment Company, L.P. or LPC. LPC owns and operates a chloride-process TiO2 facility located in Lake Charles, Louisiana. Kronos shares production from the plant equally with Huntsman pursuant to separate offtake agreements, unless Kronos and Huntsman otherwise agree (such as in 2015, when Kronos purchased approximately 52% of the production from the plant).
A supervisory committee directs the business and affairs of LPC, including production and output decisions. This committee is composed of four members, two of whom Kronos appoints and two of whom Huntsman appoints. Two general managers manage the operations of the joint venture acting under the direction of the supervisory committee. Kronos appoints one general manager and Huntsman appoints the other.
The joint venture is not consolidated in Kronos’ financial statements, because Kronos does not control it. Kronos accounts for its interest in the joint venture by the equity method. The joint venture operates on a break-even basis and therefore Kronos does not have any equity in earnings of the joint venture. Kronos is required to purchase one half of the TiO2 produced by the joint venture. Kronos shares all costs and capital expenditures equally with Huntsman with the exception of feedstock (purchased natural rutile ore or slag) and packaging costs for the pigment grades produced. Kronos’ share of net costs is reported as cost of sales as the TiO2 is sold.
Raw materials - The primary raw materials used in chloride process TiO2 are titanium-containing feedstock (purchased natural rutile ore or slag), chlorine and coke. Chlorine is available from a number of suppliers, while petroleum coke is available from a limited number of suppliers. Titanium-containing feedstock suitable for use in the chloride process is available from a limited but increasing number of suppliers principally in Australia, South Africa, Canada, India and the United States. Kronos purchases chloride process grade slag from Rio Tinto Iron and Titanium Limited under a long-term supply contract that expires at the end of 2018 subject to two-year renewal periods if both parties agree. Kronos also purchases upgraded slag from Rio Tinto Iron and Titanium Limited under a long-term supply contract that expires at the end of 2019. Kronos purchases natural rutile ore under contracts primarily from Iluka Resources, Limited and Sierra Rutile Limited, all of which expire in 2016. In the past Kronos has been, and expects to continue to be successful in obtaining short-term and long-term extensions to these and other existing supply contracts prior to their expiration. Kronos expects the raw materials purchased under these contracts, and contracts that it may enter into, will meet its chloride process feedstock requirements over the next several years.
The primary raw materials used in sulfate process TiO2 are titanium-containing feedstock, primarily ilmenite or purchased sulfate grade slag and sulfuric acid. Sulfuric acid is available from a number of suppliers. Titanium-containing feedstock suitable for use in the sulfate process is available from a limited number of suppliers principally in Norway, Canada, Australia, India and South Africa. As one of the few vertically-integrated producers of sulfate process TiO2, Kronos operates two rock ilmenite mines in Norway, which provided all of the feedstock for its European sulfate process TiO2 plants in 2015. Kronos expects ilmenite production from its mines to meet its European sulfate process feedstock requirements for the foreseeable future. For its Canadian sulfate process plant, Kronos purchases sulfate grade slag primarily from Rio Tinto Fer et Titane Inc., under a supply contract that renews annually, subject to termination upon twelve months written notice. Kronos expects the raw materials purchased under these contracts, and contracts that it may enter into, to meet its sulfate process feedstock requirements over the next several years.
Many of Kronos’ raw material contracts contain fixed quantities it is required to purchase, or specify a range of quantities within which Kronos is required to purchase. The pricing under these agreements is generally negotiated quarterly.
- 11 -
The following table summarizes Kronos’ raw materials purchased or mined in 2015.
|
Production process/raw material |
|
Raw materials |
|
|
|
(In thousands of metric tons) |
|
Chloride process plants: |
|
|
|
Purchased slag or rutile ore |
|
451 |
|
Sulfate process plants: |
|
|
|
Ilmenite ore mined and used internally |
|
323 |
|
Purchased slag |
|
10 |
Sales and marketing - Kronos’ marketing strategy is aimed at developing and maintaining strong customer relationships with new and existing accounts. Because TiO2 represents a significant raw material cost for Kronos’ customers, the purchasing decisions are often made by customers’ senior management. Kronos works to maintain close relationships with the key decision makers, through in-depth and frequent in-person meetings. Kronos endeavors to extend these commercial and technical relationships to multiple levels within its customers’ organization by using its direct sales force and technical service group to accomplish this objective. Kronos believes this has helped build customer loyalty to Kronos and strengthen its competitive position. Close cooperation and strong customer relationships enable Kronos to stay closely attuned to trends in its customers’ businesses. Where appropriate, Kronos works in conjunction with customers to solve formulation or application problems by modifying specific product properties or developing new pigment grades. Kronos also focuses its sales and marketing efforts on those geographic and end-use market businesses where Kronos believes it can realize higher selling prices. This focus includes continuously reviewing and optimizing customer and product portfolios.
Kronos’ marketing strategy is also aimed at working directly with customers to monitor the success of its products in their end-use applications, evaluate the need for improvements in product and process technology and identify opportunities to develop new product solutions for its customers. Kronos’ marketing staff closely coordinates with its sales force and technical specialists to ensure that the needs of its customers are met, and to help develop and commercialize new grades where appropriate.
Kronos sells a majority of its products through its direct sales force operating from six sales offices in Europe and one sales office in North America. Kronos also utilizes sales agents and distributors who are authorized to sell its products in specific geographic areas. In Europe, Kronos’ sales efforts are conducted primarily through its direct sales force and its sales agents. Kronos’ agents do not sell any TiO2 products other than Kronos® brand products. In North America, Kronos’ sales are made primarily through its direct sales force and supported by a network of distributors. In addition to its direct sales force and sales agents, many of Kronos’ sales agents also act as distributors to service its smaller customers in all regions. Kronos offers customer and technical service to the customers who purchase its products through distributors as well as to its larger customers serviced by its direct sales force.
Kronos sells to a diverse customer base with only one customer representing 10% or more of its sales in 2015 (Behr Process Corporation – 10%). Kronos’ largest ten customers accounted for approximately 34% of sales in 2015.
Neither Kronos’ business as a whole nor any of its principal product groups is seasonal to any significant extent. However, TiO2 sales are generally higher in the second and third quarters of the year, due in part to the increase in paint production in the spring to meet demand during the spring and summer painting seasons. With certain exceptions, Kronos has historically operated its production facilities at near full capacity rates throughout the entire year, which among other things helps to minimize its per-unit production costs. As a result, Kronos normally will build inventories during the first and fourth quarters of each year, in order to maximize product availability during the higher demand periods normally experienced in the second and third quarters.
Competition - The TiO2 industry is highly competitive. Kronos competes primarily on the basis of price, product quality, technical service and the availability of high performance pigment grades. Since TiO2 is not a traded commodity, its pricing is largely a product of negotiation between suppliers and their respective customers.
- 12 -
Although certain TiO2 grades are considered specialty pigments, the majority of Kronos’ grades and substantially all of its production are considered commodity pigments with price and availability being the most significant competitive factors along with quality and customer service. During 2015, Kronos had an estimated 9% share of worldwide TiO2 sales volume, and based on sales volumes, we believe that Kronos is the leading seller of TiO2 in several countries, including Germany.
Kronos’ principal competitors are The Chemours Company, or Chemours (which was spun-off from E.I. du Pont de Nemours & Co. into a separate publicly-traded company in 2015); Millennium Inorganic Chemicals, Inc. (a subsidiary of National Titanium Dioxide Company Ltd.), or Cristal; Huntsman Corporation; and Tronox Incorporated. The top five TiO2 producers (i.e. Kronos and its four principal competitors) account for approximately 56% of the world’s production capacity. Huntsman completed its purchase of the TiO2 business of Sachtleben Chemie GmbH in 2014, and has also announced its intent to exit the TiO2 business by December 31, 2016. In February 2015, Huntsman announced a plan to reduce its TiO2 capacity by approximately 100,000 metric tons at one of its European sulfate process facilities. In August 2015, Chemours announced plans to close its plant in Delaware and shut down a production line at its facility in Tennessee, reducing its overall capacity by approximately 150,000 metric tons.
The following chart shows Kronos’ estimate of worldwide production capacity in 2015:
|
Worldwide production capacity – 2015 |
|||
|
Chemours |
|
17 |
% |
|
Huntsman |
|
12 |
% |
|
Cristal |
|
12 |
% |
|
Kronos |
|
8 |
% |
|
Tronox |
|
7 |
% |
|
Other |
|
44 |
% |
Chemours has over one-half of total North American TiO2 production capacity and is Kronos’ principal North American competitor.
Over the past ten years, Kronos and its competitors have increased industry capacity through debottlenecking projects, which in part compensated for the shutdown of various TiO2 plants in France, the United States, the United Kingdom and China. Chemours has announced the scheduled production start-up of a 200,000 metric ton line at its plant in Mexico in mid-2016. Although overall industry demand is expected to be generally higher in 2016 as compared to 2015 as a result of improving worldwide economic conditions, Kronos does not expect any other significant efforts will be undertaken by it or its principal competitors to further increase capacity for the foreseeable future, other than through debottlenecking projects. If actual developments differ from its expectations, the TiO2 industry’s performance and that of Kronos could be unfavorably affected.
The TiO2 industry is characterized by high barriers to entry consisting of high capital costs, proprietary technology and significant lead times (typically three to five years in our experience) required to construct new facilities or to expand existing capacity. Kronos believes it is unlikely any new TiO2 plants will be constructed in Europe or North America in the foreseeable future.
Research and development - Kronos employs scientists, chemists, process engineers and technicians who are engaged in research and development, process technology and quality assurance activities in Leverkusen, Germany. These individuals have the responsibility for improving Kronos’ chloride and sulfate production processes, improving product quality and strengthening Kronos’ competitive position by developing new applications. Kronos’ expenditures for these activities were approximately $18 million in 2013, $19 million in 2014 and $16 million in 2015. Kronos expects to spend $14 million on research and development in 2016.
Kronos continually seeks to improve the quality of its grades and has been successful at developing new grades for existing and new applications to meet the needs of its customers and increase product life cycles. Since 2010, Kronos has added seven new grades for pigments and other applications.
- 13 -
Patents, trademarks, trade secrets and other intellectual property rights - Kronos has a comprehensive intellectual property protection strategy that includes obtaining, maintaining and enforcing its patents, primarily in the United States, Canada and Europe. Kronos also protects its trademark and trade secret rights and has entered into license agreements with third parties concerning various intellectual property matters. Kronos has also from time to time been involved in disputes over intellectual property.
Patents - Kronos has obtained patents and has numerous patent applications pending that cover its products and the technology used in the manufacture of its products. Kronos’ patent strategy is important to Kronos and its continuing business activities. In addition to maintaining its patent portfolio, Kronos seeks patent protection for its technical developments, principally in the United States, Canada and Europe. U.S. patents are generally in effect for 20 years from the date of filing. Kronos’ U.S. patent portfolio includes patents having remaining terms ranging from one year to 19 years.
Trademarks and trade secrets - Kronos’ trademarks, including Kronos®, are covered by issued and or pending registrations, including in Canada and the United States. Kronos protects the trademarks that it uses in connection with the products it manufactures and sells and has developed goodwill in connection with the long-term use of its trademarks. Kronos conducts research activities in secret and it protects the confidentiality of its trade secrets through reasonable measures, including confidentiality agreements and security procedures including data security. Kronos relies upon unpatented proprietary knowledge and continuing technological innovation and other trade secrets to develop and maintain its competitive position. Kronos’ proprietary chloride production process is an important part of its technology and its business could be harmed if Kronos fails to maintain confidentiality of its trade secrets used in this technology.
Employees - As of December 31, 2015, Kronos employed the following number of people:
|
Europe |
|
1,890 |
|
|
Canada |
|
345 |
|
|
United States (1) |
|
45 |
|
|
Total |
|
2,280 |
|
|
|
(1) |
Excludes employees of Kronos’ Louisiana joint venture. |
Certain employees at each of Kronos’ production facilities are organized by labor unions. In Europe, Kronos’ union employees are covered by master collective bargaining agreements for the chemical industry that are generally renewed annually. In Canada, Kronos’ union employees are covered by a collective bargaining agreement that expires in June 2018. At December 31, 2015, approximately 87% of Kronos’ worldwide workforce is organized under collective bargaining agreements. It is possible that there could be future work stoppages or other labor disruptions that could materially and adversely affect Kronos’ business, results of operations, financial position or liquidity.
Regulatory and environmental matters - Kronos’ operations and properties are governed by various environmental laws and regulations, which are complex, change frequently and have tended to become stricter over time. These environmental laws govern, among other things, the generation, storage, handling, use and transportation of hazardous materials; the emission and discharge of hazardous materials into the ground, air or water; and the health and safety of employees. Certain of Kronos’ operations are, or have been, engaged in the generation, storage, handling, manufacture or use of substances or compounds that may be considered toxic or hazardous within the meaning of applicable environmental laws and regulations. As with other companies engaged in similar businesses, certain of Kronos’ past and current operations and products have the potential to cause environmental or other damage. Kronos has implemented and continues to implement various policies and programs in an effort to minimize these risks. Kronos’ policy is to comply with applicable environmental laws and regulations at all of its facilities and to strive to improve environmental performance. It is possible that future developments, such as stricter requirements in environmental laws and enforcement policies, could adversely affect Kronos’ operations, including production, handling, use, storage, transportation, sale or disposal of hazardous or toxic substances or require Kronos to make capital and other expenditures to comply, and could adversely affect its consolidated financial position and results of operations or liquidity.
- 14 -
Kronos’ U.S. manufacturing operations are governed by federal, state and local environmental and worker health and safety laws and regulations. These include the Resource Conservation and Recovery Act, or RCRA, the Occupational Safety and Health Act, the Clean Air Act, the Clean Water Act, the Safe Drinking Water Act, the Toxic Substances Control Act and the Comprehensive Environmental Response, Compensation and Liability Act, as amended by the Superfund Amendments and Reauthorization Act, or CERCLA, as well as the state counterparts of these statutes. Some of these laws hold current or previous owners or operators of real property liable for the costs of cleaning up contamination, even if these owners or operators did not know of, and were not responsible for, such contamination. These laws also assess liability on any person who arranges for the disposal or treatment of hazardous substances, regardless of whether the affected site is owned or operated by such person. Although Kronos has not incurred and does not currently anticipate any material liabilities in connection with such environmental laws, it may be required to make expenditures for environmental remediation in the future.
While the laws regulating operations of industrial facilities in Europe vary from country to country, a common regulatory framework is provided by the European Union, or the EU. Germany and Belgium are members of the EU and follow its initiatives. Norway is not a member but generally patterns its environmental regulatory actions after the EU.
At Kronos’ sulfate plant facilities in Germany, it recycles spent sulfuric acid either through contracts with third parties or at its own facilities. In addition, at Kronos’ German locations it has a contract with a third party to treat certain sulfate-process effluents. At its Norwegian plant, Kronos ships spent acid to a third party location where it is used as a neutralization agent. These contracts may be terminated by either party after giving three or four years advance notice, depending on the contract.
From time to time, Kronos’ facilities may be subject to environmental regulatory enforcement under U.S. and non-U.S. statutes. Typically Kronos establishes compliance programs to resolve these matters. Occasionally, Kronos may pay penalties. To date such penalties have not involved amounts having a material adverse effect on Kronos’ consolidated financial position, results of operations or liquidity. We believe that all of Kronos’ facilities are in substantial compliance with applicable environmental laws.
Kronos’ capital expenditures related to ongoing environmental compliance, protection and improvement programs, including capital expenditures which are primarily focused on increased operating efficiency but also result in improved environmental protection such as lower emissions from its manufacturing facilities, were $6.9 million in 2015 and are currently expected to be approximately $9 million in 2016.
Other
In addition to our 87% ownership of CompX and our 30% ownership of Kronos at December 31, 2015, we also own 100% of EWI RE, Inc., an insurance brokerage and risk management services company. We also hold certain marketable securities and other investments. See Notes 5 and 15 to our Consolidated Financial Statements.
Regulatory and environmental matters - We discuss regulatory and environmental matters in the respective business sections contained elsewhere herein and in Item 3 - “Legal Proceedings.” In addition, the information included in Note 17 to our Consolidated Financial Statements under the captions “Lead pigment litigation” and “Environmental matters and litigation” is incorporated herein by reference.
Insurance - We maintain insurance for our businesses and operations, with customary levels of coverage, deductibles and limits. See also Item 3 – “Legal Proceedings – Insurance coverage claims” and Note 16 to our Consolidated Financial Statements.
Business strategy - We routinely compare our liquidity requirements and alternative uses of capital against the estimated future cash flows we expect to receive from our subsidiaries and affiliates. As a result of this process, we have in the past and may in the future seek to raise additional capital, incur debt, repurchase indebtedness in the market or otherwise modify our dividend policies, consider the sale of our interests in our subsidiaries, affiliates, business, marketable securities or other assets, or take a combination of these and other steps, to increase liquidity, reduce indebtedness and fund future activities. Such activities have in the past and may in the future involve related
- 15 -
companies. From time to time, we also evaluate the restructuring of ownership interests among our respective subsidiaries and related companies.
We and other entities that may be affiliated with Contran routinely evaluate acquisitions of interests in, or combinations with, companies, including related companies, perceived by management to be undervalued in the marketplace. These companies may or may not be engaged in businesses related to our current businesses. In some instances, we have actively managed the businesses acquired with a focus on maximizing return-on-investment through cost reductions, capital expenditures, improved operating efficiencies, selective marketing to address market niches, disposition of marginal operations, use of leverage and redeployment of capital to more productive assets. In other instances, we have disposed of the acquired interest in a company prior to gaining control. We intend to consider such activities in the future and may, in connection with such activities, consider issuing additional equity securities and increasing our indebtedness.
Available information - Our fiscal year ends December 31. We furnish our shareholders with annual reports containing audited financial statements. In addition, we file annual, quarterly and current reports, proxy and information statements and other information with the SEC. Our consolidated subsidiary (CompX) and our significant equity method investee (Kronos) also file annual, quarterly, and current reports, proxy and information statements and other information with the SEC. We also make our annual report on Form 10-K, quarterly reports on Form 10-Q, current reports on Form 8-K and amendments thereto available free of charge through our website at www.nl-ind.com as soon as reasonably practicable after they have been filed with the SEC. We also provide to anyone, without charge, copies of such documents upon written request. Such requests should be directed to the attention of the Corporate Secretary at our address on the cover page of this Form 10-K.
Additional information, including our Audit Committee charter, our Code of Business Conduct and Ethics and our Corporate Governance Guidelines can be found on our website. Information contained on our website is not part of this Annual Report.
The general public may read and copy any materials we file with the SEC at the SEC’s Public Reference Room at 100 F Street, NE, Washington, DC 20549. The public may obtain information about the operation of the Public Reference Room by calling the SEC at 1-800-SEC-0330. We are an electronic filer and the SEC maintains an internet website that contains reports, proxy and information statements and other information regarding issuers that file electronically with the SEC at www.sec.gov.
|
ITEM 1A. |
RISK FACTORS |
Listed below are certain risk factors associated with us and our businesses. See also certain risk factors discussed in Item 7 – “Management’s Discussion and Analysis of Financial Condition and Results of Operations – Critical Accounting Policies and Estimates.” In addition to the potential effect of these risk factors, any risk factor which could result in reduced earnings or operating losses, or reduced liquidity, could in turn adversely affect our ability to service our liabilities or pay dividends on our common stock or adversely affect the quoted market prices for our securities.
We could incur significant costs related to legal and environmental matters.
We formerly manufactured lead pigments for use in paint. We and others have been named as defendants in various legal proceedings seeking damages for personal injury, property damage and governmental expenditures allegedly caused by the use of lead-based paints. These lawsuits seek recovery under a variety of theories, including public and private nuisance, negligent product design, negligent failure to warn, strict liability, breach of warranty, conspiracy/concert of action, aiding and abetting, enterprise liability, market share or risk contribution liability, intentional tort, fraud and misrepresentation, violations of state consumer protection statutes, supplier negligence and similar claims. The plaintiffs in these actions generally seek to impose on the defendants responsibility for lead paint abatement and health concerns associated with the use of lead-based paints, including damages for personal injury, contribution and/or indemnification for medical expenses, medical monitoring expenses and costs for educational programs. As with all legal proceedings, the outcome is uncertain. Any liability we might incur in the future could be material. See also Item 3 - “Legal Proceedings - Lead pigment litigation.”
- 16 -
Certain properties and facilities used in our former operations are the subject of litigation, administrative proceedings or investigations arising under various environmental laws. These proceedings seek cleanup costs, personal injury or property damages and/or damages for injury to natural resources. Some of these proceedings involve claims for substantial amounts. Environmental obligations are difficult to assess and estimate for numerous reasons, and we may incur costs for environmental remediation in the future in excess of amounts currently estimated. Any liability we might incur in the future could be material. See also Item 3 - “Legal Proceedings - Environmental matters and litigation.”
Our assets consist primarily of investments in our operating subsidiaries and affiliates, and we are dependent upon distributions from our subsidiaries and affiliates.
The majority of our operating cash flows are generated by our operating subsidiaries and affiliates, and our ability to service liabilities and to pay dividends on our common stock (to the extent such dividends are declared by our board of directors) depends to a large extent upon the cash dividends or other distributions we receive from our subsidiaries and affiliates. Our subsidiaries and affiliates are separate and distinct legal entities and they have no obligation, contingent or otherwise, to pay such cash dividends or other distributions to us. In addition, the payment of dividends or other distributions from our subsidiaries and affiliates could be subject to restrictions on, or taxation of, dividends or repatriation of earnings under applicable law, monetary transfer restrictions, currency exchange regulations in jurisdictions in which our subsidiaries and affiliates operate or any other restrictions imposed by current or future agreements to which our subsidiaries and affiliates may be a party, including debt instruments. Events beyond our control, including changes in general business and economic conditions, could adversely impact the ability of our subsidiaries and affiliates to pay dividends or make other distributions to us. If our subsidiaries and affiliates were to become unable to make sufficient cash dividends or other distributions to us, our ability to service our liabilities and to pay dividends on our common stock (if declared) could be adversely affected.
In addition, a significant portion of our assets consist of ownership interests in our subsidiaries and affiliates. If we were required to liquidate any of such securities in order to generate funds to satisfy our liabilities, we may be required to sell such securities at a time or times at which we would not be able to realize what we believe to be the actual value of such assets.
We operate in mature and highly competitive markets, resulting in pricing pressure and the need to continuously reduce costs.
Many of the markets CompX serves are highly competitive, with a number of competitors offering similar products. CompX focuses efforts on the middle and high-end business of the market where we feel that we can compete due to the importance of product design, quality and durability to the customer. However, our ability to effectively compete is impacted by a number of factors. The occurrence of any of these factors could result in reduced earnings or operating losses.
|
|
● |
Competitors may be able to drive down prices for our products because their costs are lower than our costs, especially products sourced from Asia. |
|
|
● |
Competitors’ financial, technological and other resources may be greater than our resources, which may enable them to more effectively withstand changes in market conditions. |
|
|
● |
Competitors may be able to respond more quickly than we can to new or emerging technologies and changes in customer requirements. |
|
|
● |
Consolidation of our competitors or customers in any of the markets in which we compete may result in reduced demand for our products. |
|
|
● |
New competitors could emerge by modifying their existing production facilities to manufacture products that compete with our products. |
|
|
● |
We may not be able to sustain a cost structure that enables us to be competitive. |
|
|
● |
Customers may no longer value our product design, quality or durability over the lower cost products of our competitors. |
- 17 -
Our development of innovative features for our current component products is critical to sustaining and growing our sales.
Historically, CompX’s ability to provide value-added custom engineered component products that address requirements of technology and space utilization has been a key element of its success. CompX spends a significant amount of time and effort to refine, improve and adapt our existing products for new customers and applications. Since expenditures for these types of activities are not considered research and development expense under accounting principles generally accepted in the United States of America, the amount of our research and development expenditures, which is not significant, is not indicative of the overall effort involved in the development of new product features. The introduction of new product features requires the coordination of the design, manufacturing and marketing of the new product features with current and potential customers. The ability to coordinate these activities with current and potential customers may be affected by factors beyond CompX’s control. While we will continue to emphasize the introduction of innovative new product features that target customer-specific opportunities, we do not know if any new product features CompX introduces will achieve the same degree of success that it has achieved with its existing products. Introduction of new product features typically requires us to increase production volume on a timely basis while maintaining product quality. Manufacturers often encounter difficulties in increasing production volumes, including delays, quality control problems and shortages of qualified personnel or raw materials. As CompX attempts to introduce new product features in the future, we do not know if CompX will be able to increase production volume without encountering these or other problems, which might negatively impact our financial condition or results of operations.
Future acquisitions of CompX could subject us to a number of operational risks.
A key component of CompX’s strategy is to grow and diversify its business through targeted acquisitions. CompX’s ability to successfully execute this component of its strategy entails a number of risks, including:
|
|
● |
the identification of suitable growth opportunities; |
|
|
● |
an inaccurate assessment of acquired liabilities that were undisclosed or not properly disclosed; |
|
|
● |
the entry into markets in which we may have limited or no experience; |
|
|
● |
the diversion of management’s attention from our core businesses; |
|
|
● |
the potential loss of key employees or customers of the acquired businesses; |
|
|
● |
the potential of not identifying that acquired products infringe on the intellectual property rights of others; |
|
|
● |
difficulties in realizing projected efficiencies, synergies and cost savings; and |
|
|
● |
an increase in our indebtedness and a limitation in our ability to access additional capital when needed. |
Failure to protect our intellectual property rights or claims by others that we infringe their intellectual property rights could substantially harm our business.
CompX relies on patent, trademark and trade secret laws in the United States and similar laws in other countries to establish and maintain intellectual property rights in our technology and designs. Despite these measures, any of our intellectual property rights could be challenged, invalidated, circumvented or misappropriated. Others may independently discover our trade secrets and proprietary information, and in such cases we could not assert any trade secret rights against such parties. Further, we do not know if any of our pending trademark or patent applications will be approved. Costly and time-consuming litigation could be necessary to enforce and determine the scope of our intellectual property rights. In addition, the laws of certain countries do not protect intellectual property rights to the same extent as the laws of the United States. Therefore, in certain jurisdictions, we may be unable to protect our technology and designs adequately against unauthorized third party use, which could adversely affect our competitive position.
Third parties may claim that we or our customers are infringing upon their intellectual property rights. Even if we believe that such claims are without merit, they can be time-consuming and costly to defend and distract our management’s and technical staff’s attention and resources. Claims of intellectual property infringement also might require us to redesign affected technology, enter into costly settlement or license agreements or pay costly damage awards, or face a temporary or permanent injunction prohibiting us from marketing or selling certain of our
- 18 -
technology. If we cannot or do not license the infringed technology on reasonable pricing terms or at all, or substitute similar technology from another source, our business could be adversely impacted.
Global climate change legislation could negatively impact our financial results or limit our ability to operate our businesses.
CompX operates production facilities in the United States and Kronos operates production facilities in several countries in North America and Europe. We believe that all production facilities are in substantial compliance with applicable environmental laws. Legislation has been passed, or proposed legislation is being considered, to limit greenhouse gases through various means including emissions permits and/or energy taxes. In several production facilities, Kronos consumes large amounts of energy, primarily electricity and natural gas. To date the climate change legislation in effect has not had a material adverse effect on our financial results. However, if further greenhouse gas legislation were to be enacted in one or more countries, it could negatively impact our future results from operations through increased costs of production, particularly as it relates to our energy requirements or our need to obtain emissions permits. If such increased costs of production were to materialize, we may be unable to pass price increases onto our customers to compensate for increased production costs, which may decrease our liquidity, income from operations and results of operations.
Higher costs or limited availability of our raw materials may decrease our liquidity.
Certain of the raw materials used in CompX’s products are commodities that are subject to significant fluctuations in price in response to world-wide supply and demand as well as speculative investor activity. Zinc and brass are the principal raw materials used in the manufacture of security products. Stainless steel tubing is the major raw material used in the manufacture of marine exhaust systems. These raw materials are purchased from several suppliers and are generally readily available from numerous sources. CompX occasionally enters into short-term raw material supply arrangements to mitigate the impact of future increases in commodity-related raw material costs. Materials purchased outside of these arrangements are sometimes subject to unanticipated and sudden price increases. Should our vendors not be able to meet their contractual obligations or should we otherwise be unable to obtain necessary raw materials, we may incur higher costs for raw materials or may be required to reduce production levels, either of which may decrease our liquidity or negatively impact our financial condition or results of operations as we may be unable to offset the higher costs with increases in our selling prices or reductions in other operating costs.
For Kronos, the number of sources for and availability of certain raw materials is specific to the particular geographical region in which a facility is located. For example, titanium-containing feedstocks suitable for use in its TiO2 facilities are available from a limited number of suppliers around the world. Political and economic instability in the countries from which Kronos purchases raw material supplies could adversely affect their availability. If Kronos’ worldwide vendors were unable to meet their contractual obligations and it was unable to obtain necessary raw materials, Kronos could incur higher costs for raw materials or may be required to reduce production levels. Kronos experienced significantly higher ore costs in 2012 which carried over into 2013. Kronos has seen moderation in the purchase cost of third-party feedstock ore in 2013 and throughout 2014 and 2015, but such reductions did not begin to be significantly reflected in Kronos’ cost of sales until the third quarter of 2013. Kronos may also experience higher operating costs such as energy costs, which could affect its profitability. Kronos may not always be able to increase selling prices to offset the impact of any higher costs or reduced production levels, which could reduce its earnings and decrease its liquidity.
Kronos has long-term supply contracts that provide for its TiO2 feedstock requirements that currently expire through 2019. While Kronos believes it will be able to renew these contracts, there can be no assurance it will be successful in renewing these contracts or in obtaining long-term extensions to these contracts prior to expiration. Kronos’ current agreements (including those entered into through February 2016) require Kronos to purchase certain minimum quantities of feedstock with minimum purchase commitments aggregating approximately $865 million in years subsequent to December 31, 2015. In addition, Kronos has other long-term supply and service contracts that provide for various raw materials and services. These agreements require Kronos to purchase certain minimum quantities or services with minimum purchase commitments aggregating approximately $147 million at December 31, 2015. Kronos’ commitments under these contracts could adversely affect its financial results if it significantly reduced production and was unable to modify the contractual commitments.
- 19 -
Demand for, and prices of, certain of Kronos’ products are influenced by changing market conditions for its products, which may result in reduced earnings or in operating losses.
A significant portion of our net income is attributable to sales of TiO2 by Kronos. Approximately 90% of Kronos’ revenues are attributable to sales of TiO2. Pricing within the global TiO2 industry over the long term is cyclical, and changes in economic conditions, especially in Western industrialized nations, can significantly impact Kronos’ earnings and operating cash flows. Historically, the markets for many of Kronos’ products have experienced alternating periods of increasing and decreasing demand. Relative changes in the selling prices for Kronos’ products are one of the main factors that affect the level of its profitability. In periods of increasing demand, Kronos’ selling prices and profit margins generally will tend to increase, while in periods of decreasing demand Kronos’ selling prices and profit margins generally tend to decrease. In addition, pricing may affect customer inventory levels as customers may from time to time accelerate purchases of TiO2 in advance of anticipated price increases or defer purchases of TiO2 in advance of anticipated price decreases. Kronos’ ability to further increase capacity without additional investment in greenfield or brownfield capacity increases may be limited and as a result, Kronos’ profitability may become even more dependent upon the selling prices of its products.
The TiO2 industry is concentrated and highly competitive and Kronos faces price pressures in the markets in which it operates, which may result in reduced earnings or operating losses.
The global market in which Kronos operates is concentrated, with the top five TiO2 producers accounting for over 50% of the world’s production capacity and is highly competitive. Competition is based on a number of factors, such as price, product quality and service. Some of Kronos’ competitors may be able to drive down prices for its products if their costs are lower than Kronos’ costs. In addition, some of the competitors’ financial, technological and other resources may be greater than Kronos’ resources and such competitors may be better able to withstand changes in market conditions. Kronos’ competitors may be able to respond more quickly to new or emerging technologies and changes in customer requirements. Further, consolidation of competitors or customers may result in reduced demand for Kronos’ products or make it more difficult for Kronos to compete with competitors. The occurrence of any of these events could result in reduced earnings or operating losses.
Kronos’ leverage may impair our financial condition or limit our ability to operate our businesses.
As of December 31, 2015, Kronos had consolidated debt of approximately $341.0 million, which relates primarily to a term loan entered into in February 2014. Kronos’ level of debt could have important consequences to its stockholders (including us) and creditors, including:
|
|
● |
making it more difficult for Kronos to satisfy its obligations with respect to its liabilities; |
|
|
● |
increasing its vulnerability to adverse general economic and industry conditions; |
|
|
● |
requiring that a portion of Kronos’ cash flows from operations be used for the payment of interest on its debt, which reduces its ability to use cash flow to fund working capital, capital expenditures, dividends on its common stock, acquisitions or general corporate requirements; |
|
|
● |
limiting its ability to obtain additional financing to fund future working capital, capital expenditures, dividends on its common stock, acquisitions or general corporate requirements; |
|
|
● |
limiting its flexibility in planning for, or reacting to, changes in Kronos’ business and the industry in which it operates; and |
|
|
● |
placing it at a competitive disadvantage relative to other less leveraged competitors. |
In addition to Kronos’ indebtedness, at December 31, 2015, Kronos is party to various lease and other agreements (including feedstock ore purchase contracts and other long-term supply and service contracts as discussed above) pursuant to which, along with its indebtedness, Kronos is committed to pay approximately $453 million in 2016. Kronos’ ability to make payments on and refinance its debt and to fund planned capital expenditures depends on Kronos’ future ability to generate cash flow. To some extent, this is subject to general economic, financial, competitive, legislative, regulatory and other factors that are beyond our control. In addition, Kronos’ ability to borrow funds under its revolving credit facilities in the future will, in some instances, depend in part on its ability to maintain specified financial ratios and satisfy certain financial covenants contained in the applicable credit agreement.
- 20 -
Kronos’ business may not generate cash flows from operating activities sufficient to enable Kronos to pay its debts when they become due and to fund other liquidity needs. As a result, Kronos may need to refinance all or a portion of its debt before maturity. Kronos may not be able to refinance any of its debt in a timely manner on favorable terms, if at all in the current credit markets. Any inability to generate sufficient cash flows or to refinance Kronos’ debt on favorable terms could have a material adverse effect on its financial condition.
|
ITEM 1B. |
UNRESOLVED STAFF COMMENTS |
None
|
ITEM 2. |
PROPERTIES |
Our principal executive offices are located in an office building located at 5430 LBJ Freeway, Dallas, Texas, 75240-2697. The principal properties used in the operations of our subsidiaries and affiliates, including certain risks and uncertainties related thereto, are described in the applicable business sections of Item 1 – “Business.” We believe that our facilities are generally adequate and suitable for our respective uses.
|
ITEM 3. |
LEGAL PROCEEDINGS |
We are involved in various legal proceedings. In addition to information that is included below, we have included certain of the information called for by this Item in Note 17 to our Consolidated Financial Statements, and we are incorporating that information here by reference.
Lead pigment litigation
Our former operations included the manufacture of lead pigments for use in paint and lead-based paint. We, other former manufacturers of lead pigments for use in paint and lead-based paint (together, the “former pigment manufacturers”), and the Lead Industries Association (LIA), which discontinued business operations in 2002, have been named as defendants in various legal proceedings seeking damages for personal injury, property damage and governmental expenditures allegedly caused by the use of lead-based paints. Certain of these actions have been filed by or on behalf of states, counties, cities or their public housing authorities and school districts, and certain others have been asserted as class actions. These lawsuits seek recovery under a variety of theories, including public and private nuisance, negligent product design, negligent failure to warn, strict liability, breach of warranty, conspiracy/concert of action, aiding and abetting, enterprise liability, market share or risk contribution liability, intentional tort, fraud and misrepresentation, violations of state consumer protection statutes, supplier negligence and similar claims.
The plaintiffs in these actions generally seek to impose on the defendants responsibility for lead paint abatement and health concerns associated with the use of lead-based paints, including damages for personal injury, contribution and/or indemnification for medical expenses, medical monitoring expenses and costs for educational programs. To the extent the plaintiffs seek compensatory or punitive damages in these actions, such damages are generally unspecified. In some cases, the damages are unspecified pursuant to the requirements of applicable state law. A number of cases are inactive or have been dismissed or withdrawn. Most of the remaining cases are in various pre-trial stages. Some are on appeal following dismissal or summary judgment rulings or a trial verdict in favor of either the defendants or the plaintiffs.
We believe that these actions are without merit, and we intend to continue to deny all allegations of wrongdoing and liability and to defend against all actions vigorously. We do not believe it is probable that we have incurred any liability with respect to all of the lead pigment litigation cases to which we are a party, and liability to us that may result, if any, in this regard cannot be reasonably estimated, because:
|
|
· |
we have never settled any of the market share, intentional tort, fraud, nuisance, supplier negligence, breach of warranty, conspiracy, misrepresentation, aiding and abetting, enterprise liability, or statutory cases, |
- 21 -
|
|
· |
we have never ultimately been found liable with respect to any such litigation matters, including over 100 cases over a twenty-year period for which we were previously a party and for which we have been dismissed without any finding of liability. |
Accordingly, we have not accrued any amounts for any of the pending lead pigment and lead-based paint litigation cases filed by or on behalf of states, counties, cities or their public housing authorities and school districts, or those asserted as class actions. In addition, we have determined that liability to us which may result, if any, cannot be reasonably estimated because there is no prior history of a loss of this nature on which an estimate could be made and there is no substantive information available upon which an estimate could be based.
In one of these lead pigment cases, in April 2000 we were served with a complaint in County of Santa Clara v. Atlantic Richfield Company, et al, (Superior Court of the State of California, County of Santa Clara, Case No. 1-00-CV-788657) brought by a number of California government entities against the former pigment manufacturers, the LIA and certain paint manufacturers. The County of Santa Clara sought to recover compensatory damages for funds the plaintiffs had expended or would in the future expend for medical treatment, educational expenses, abatement or other costs due to exposure to, or potential exposure to, lead paint, disgorgement of profit, and punitive damages. In July 2003, the trial judge granted defendants’ motion to dismiss all remaining claims. Plaintiffs appealed and the intermediate appellate court reinstated public nuisance, negligence, strict liability, and fraud claims in March 2006. A fourth amended complaint was filed in March 2011 on behalf of The People of California by the County Attorneys of Alameda, Ventura, Solano, San Mateo, Los Angeles and Santa Clara, and the City Attorneys of San Francisco, San Diego and Oakland. That complaint alleged that the presence of lead paint created a public nuisance in each of the prosecuting jurisdictions and sought its abatement. In July and August 2013, the case was tried. In January 2014, the Judge issued a judgment finding us, The Sherwin Williams Company and ConAgra Grocery Products Company jointly and severally liable for the abatement of lead paint in pre-1980 homes, and ordered the defendants to pay an aggregate $1.15 billion to the people of the State of California to fund such abatement. In February 2014, we filed a motion for a new trial, and in March 2014 the court denied the motion. Subsequently in March 2014, we filed a notice of appeal with the Sixth District Court of Appeal for the State of California and the appeal is proceeding with the appellate court. NL believes that this judgment is inconsistent with California law and is unsupported by the evidence, and we will defend vigorously against all claims.
The Santa Clara case is unusual in that this is the second time that an adverse verdict in the lead pigment litigation has been entered against NL (the first adverse verdict against NL was ultimately overturned on appeal). We have concluded that the likelihood of a loss in this case has not reached a standard of “probable” as contemplated by ASC 450, given (i) the substantive, substantial and meritorious grounds on which the adverse verdict in the Santa Clara case will be appealed, (ii) the uniqueness of the Santa Clara verdict (i.e. no final, non-appealable verdicts have ever been rendered against us, or any of the other former lead pigment manufacturers, based on the public nuisance theory of liability or otherwise), and (iii) the rejection of the public nuisance theory of liability as it relates to lead pigment matters in many other jurisdictions (no jurisdiction in which a plaintiff has asserted a public nuisance theory of liability has ever successfully been upheld). In addition, liability that may result, if any, cannot be reasonably estimated, as NL continues to have no basis on which an estimate of liability could be made, as discussed above. However, as with any legal proceeding, there is no assurance that any appeal would be successful, and it is reasonably possible, based on the outcome of the appeals process, that NL may in the future incur some liability resulting in the recognition of a loss contingency accrual that could have a material adverse impact on our results of operations, financial position and liquidity.
In June 2000, a complaint was filed in Illinois state court, Lewis, et al. v. Lead Industries Association, et al (Circuit Court of Cook County, Illinois, County Department, Chancery Division, Case No. 00CH09800.) Plaintiffs seek to represent two classes, one consisting of minors between the ages of six months and six years who resided in housing in Illinois built before 1978, and another consisting of individuals between the ages of six and twenty years who lived in Illinois housing built before 1978 when they were between the ages of six months and six years and who had blood lead levels of 10 micrograms/deciliter or more. The complaint seeks damages jointly and severally from the former pigment manufacturers and the LIA to establish a medical screening fund for the first class to determine blood lead levels, a medical monitoring fund for the second class to detect the onset of latent diseases and a fund for a public education campaign. In April 2008, the trial court judge certified a class of children whose blood lead levels were screened venously between August 1995 and February 2008 and who had incurred expenses
- 22 -
associated with such screening. In March 2012, the trial court judge decertified the class. In June 2012, the trial court judge granted plaintiffs the right to appeal his decertification order, and in August 2012 the appellate court granted plaintiffs permission to appeal. In March 2013, the appellate court agreed with the trial court’s rationale regarding legislative requirements to screen children’s blood lead levels and remanded the case for further proceedings in the trial court. In July 2013, plaintiffs moved to vacate the decertification. In October 2013, the judge denied plaintiffs’ motion to vacate the decertification of the class. In March 2014, plaintiffs filed a new class certification motion. In April 2015, a class was certified consisting of parents or legal guardians of children who lived in certain “high risk” areas in Illinois between August 18, 1995 and February 19, 2008, and incurred an expense or liability for having their children’s blood lead levels tested.
In addition to the foregoing litigation, various legislation and administrative regulations have, from time to time, been proposed that seek to (a) impose various obligations on present and former manufacturers of lead pigment and lead-based paint with respect to asserted health concerns associated with the use of such products and (b) effectively overturn court decisions in which we and other pigment manufacturers have been successful. Examples of such proposed legislation include bills which would permit civil liability for damages on the basis of market share, rather than requiring plaintiffs to prove that the defendant’s product caused the alleged damage, and bills which would revive actions barred by the statute of limitations. While no legislation or regulations have been enacted to date that are expected to have a material adverse effect on our consolidated financial position, results of operations or liquidity, the imposition of market share liability or other legislation could have such an effect.
New cases may continue to be filed against us. We cannot assure you that we will not incur liability in the future in respect of any of the pending or possible litigation in view of the inherent uncertainties involved in court and jury rulings. In the future, if new information regarding such matters becomes available to us (such as a final, non-appealable adverse verdict against us or otherwise ultimately being found liable with respect to such matters), at that time we would consider such information in evaluating any remaining cases then-pending against us as to whether it might then have become probable we have incurred liability with respect to these matters, and whether such liability, if any, could have become reasonably estimable. The resolution of any of these cases could result in the recognition of a loss contingency accrual that could have a material adverse impact on our net income for the interim or annual period during which such liability is recognized and a material adverse impact on our consolidated financial condition and liquidity.
Environmental matters and litigation
Our operations are governed by various environmental laws and regulations. Certain of our businesses are and have been engaged in the handling, manufacture or use of substances or compounds that may be considered toxic or hazardous within the meaning of applicable environmental laws and regulations. As with other companies engaged in similar businesses, certain of our past and current operations and products have the potential to cause environmental or other damage. We have implemented and continue to implement various policies and programs in an effort to minimize these risks. Our policy is to maintain compliance with applicable environmental laws and regulations at all of our plants and to strive to improve environmental performance. From time to time, we may be subject to environmental regulatory enforcement under U.S. and non-U.S. statutes, the resolution of which typically involves the establishment of compliance programs. It is possible that future developments, such as stricter requirements of environmental laws and enforcement policies, could adversely affect our production, handling, use, storage, transportation, sale or disposal of such substances. We believe that all of our facilities are in substantial compliance with applicable environmental laws.
Certain properties and facilities used in our former operations, including divested primary and secondary lead smelters and former mining locations, are the subject of civil litigation, administrative proceedings or investigations arising under federal and state environmental laws and common law. Additionally, in connection with past operating practices, we are currently involved as a defendant, potentially responsible party (PRP) or both, pursuant to the Comprehensive Environmental Response, Compensation and Liability Act, as amended by the Superfund Amendments and Reauthorization Act (CERCLA), and similar state laws in various governmental and private actions associated with waste disposal sites, mining locations, and facilities that we or our predecessors, our subsidiaries or their predecessors currently or previously owned, operated or used, certain of which are on the United States Environmental Protection Agency’s (EPA) Superfund National Priorities List or similar state lists. These proceedings seek cleanup costs, damages for personal injury or property damage and/or damages for injury to
- 23 -
natural resources. Certain of these proceedings involve claims for substantial amounts. Although we may be jointly and severally liable for these costs, in most cases we are only one of a number of PRPs who may also be jointly and severally liable, and among whom costs may be shared or allocated. In addition, we are also a party to a number of personal injury lawsuits filed in various jurisdictions alleging claims related to environmental conditions alleged to have resulted from our operations.
Obligations associated with environmental remediation and related matters are difficult to assess and estimate for numerous reasons including the:
|
|
· |
complexity and differing interpretations of governmental regulations, |
|
|
· |
number of PRPs and their ability or willingness to fund such allocation of costs, |
|
|
· |
financial capabilities of the PRPs and the allocation of costs among them, |
|
|
· |
solvency of other PRPs, |
|
|
· |
multiplicity of possible solutions, |
|
|
· |
number of years of investigatory, remedial and monitoring activity required, |
|
|
· |
uncertainty over the extent, if any, to which our former operations might have contributed to the conditions allegedly giving rise to such personal injury, property damage, natural resource and related claims, and |
|
|
· |
number of years between former operations and notice of claims and lack of information and documents about the former operations. |
In addition, the imposition of more stringent standards or requirements under environmental laws or regulations, new developments or changes regarding site cleanup costs or the allocation of costs among PRPs, solvency of other PRPs, the results of future testing and analysis undertaken with respect to certain sites or a determination that we are potentially responsible for the release of hazardous substances at other sites, could cause our expenditures to exceed our current estimates. We cannot assure you that actual costs will not exceed accrued amounts or the upper end of the range for sites for which estimates have been made, and we cannot assure you that costs will not be incurred for sites where no estimates presently can be made. Further, additional environmental and related matters may arise in the future. If we were to incur any future liability, this could have a material adverse effect on our consolidated financial statements, results of operations and liquidity.
We record liabilities related to environmental remediation and related matters (including costs associated with damages for personal injury or property damage and/or damages for injury to natural resources) when estimated future expenditures are probable and reasonably estimable. We adjust such accruals as further information becomes available to us or as circumstances change. Unless the amounts and timing of such estimated future expenditures are fixed and reasonably determinable, we generally do not discount estimated future expenditures to their present value due to the uncertainty of the timing of the payout. We recognize recoveries of costs from other parties, if any, as assets when their receipt is deemed probable. At December 31, 2014 and 2015, we have not recognized any receivables for recoveries.
We do not know and cannot estimate the exact time frame over which we will make payments for our accrued environmental and related costs. The timing of payments depends upon a number of factors, including but not limited to the timing of the actual remediation process; which in turn depends on factors outside of our control. At each balance sheet date, we estimate the amount of our accrued environmental and related costs which we expect to pay within the next twelve months, and we classify this estimate as a current liability. We classify the remaining accrued environmental costs as a noncurrent liability.
On a quarterly basis, we evaluate the potential range of our liability for environmental remediation and related costs at sites where we have been named as a PRP or defendant, including sites for which our wholly-owned environmental management subsidiary, NL Environmental Management Services, Inc., (EMS), has contractually assumed our obligations. At December 31, 2015, we had accrued approximately $113 million related to approximately 42 sites associated with remediation and related matters that we believe are at the present time and/or in their current phase reasonably estimable. The upper end of the range of reasonably possible costs to us for remediation and related matters for which we believe it is possible to estimate costs is approximately $166 million, including the amount currently accrued.
- 24 -
We believe that it is not reasonably possible to estimate the range of costs for certain sites. At December 31, 2015, there were approximately 5 sites for which we are not currently able to reasonably estimate a range of costs. For these sites, generally the investigation is in the early stages, and we are unable to determine whether or not we actually had any association with the site, the nature of our responsibility, if any, for the contamination at the site and the extent of contamination at and cost to remediate the site. The timing and availability of information on these sites is dependent on events outside of our control, such as when the party alleging liability provides information to us. At certain of these previously inactive sites, we have received general and special notices of liability from the EPA and/or state agencies alleging that we, sometimes with other PRPs, are liable for past and future costs of remediating environmental contamination allegedly caused by former operations. These notifications may assert that we, along with any other alleged PRPs, are liable for past and/or future clean-up costs. As further information becomes available to us for any of these sites, which would allow us to estimate a range of costs, we would at that time adjust our accruals. Any such adjustment could result in the recognition of an accrual that would have a material effect on our consolidated financial statements, results of operations and liquidity.
In June 2006, we and several other PRPs received a Unilateral Administrative Order (UAO) from the EPA regarding a formerly-owned mine and milling facility located in Park Hills, Missouri. The Doe Run Company is the current owner of the site, which was purchased by a predecessor of Doe Run from us in approximately 1936. Doe Run is also named in the Order. In April 2008, the parties signed a definitive cost sharing agreement for sharing of the costs anticipated in connection with the order and in May 2008, the parties began work at the site as required by the UAO and in accordance with the cost sharing agreement. In the fourth quarter of 2010, NL reached its capped payment obligation under the cost sharing agreement with Doe Run. In the fourth quarter of 2013, Doe Run completed the remainder of the construction work. A Removal Action Report and Post-Removal Site Control plan is expected to be submitted to the EPA by Doe Run in 2016.
In June 2008, we received a Directive and Notice to Insurers from the New Jersey Department of Environmental Protection (NJDEP) regarding the Margaret’s Creek site in Old Bridge Township, New Jersey. NJDEP alleged that a waste hauler transported waste from one of our former facilities for disposal at the site in the early 1970s. NJDEP referred the site to the EPA, and in November 2009, the EPA added the site to the National Priorities List under the name “Raritan Bay Slag Site.” In 2012, EPA notified NL of its potential liability at this site. In May 2013, EPA issued its Record of Decision for the site. In June 2013, NL filed a contribution suit under CERCLA and the New Jersey Spill Act titled NL Industries, Inc. v. Old Bridge Township, et al. (United States District Court for the District of New Jersey, Civil Action No. 3:13-cv-03493-MAS-TJB) against the current owner, Old Bridge Township, and several federal and state entities NL alleges designed and operated the site and who have significant potential liability as compared to NL which is alleged to have been a potential source of material placed at the site by others. NL’s suit also names certain former NL customers of the former NL facility alleged to be the source of some of the materials. In January 2014, EPA issued a UAO to NL for clean-up of the site based on the EPA’s preferred remedy set forth in the Record of Decision. NL is in discussions with EPA about NL’s performance of a defined amount of the work at the site and is otherwise taking actions necessary to respond to the UAO. If these discussions and actions are unsuccessful, NL will defend vigorously against all claims while continuing to seek contribution from other PRPs.
In September 2008, we received a Special Notice letter from the EPA for liability associated with the Tar Creek Superfund site in Ottawa County, Oklahoma (Tar Creek) and a demand for related past and future costs. We responded with a good-faith offer to pay certain of the EPA’s past costs and to complete limited work in the areas in which we operated. In October 2008, we received a claim from the State of Oklahoma for past, future and relocation costs in connection with the site. In November 2015, the United States Department of Justice lodged with the federal court a fully-executed consent decree between the United States, the State of Oklahoma and NL that resolves the claims of the United States and the State of Oklahoma for past and future cleanup costs at Tar Creek. The consent decree will become effective after it has been reviewed and officially approved by the federal court.
In August 2009, we were served with a complaint in Raritan Baykeeper, Inc. d/b/a NY/NJ Baykeeper et al. v. NL Industries, Inc. et al. (United States District Court, District of New Jersey, Case No. 3:09-cv-04117). This is a citizen’s suit filed by two local environmental groups pursuant to the Resource Conservation and Recovery Act and the Clean Water Act against NL, current owners, developers and state and local government entities. The complaint alleges that hazardous substances were and continue to be discharged from our former Sayreville, New Jersey property into the sediments of the adjacent Raritan River. The former Sayreville site is currently being remediated by owner/developer parties under the oversight of the NJDEP. The plaintiffs seek a declaratory
- 25 -
judgment, injunctive relief, imposition of civil penalties and an award of costs. We have denied liability and will defend vigorously against all claims.
In June 2011, we were served in ASARCO LLC v. NL Industries, Inc., et al. (United States District Court, Western District of Missouri, Case No. 4:11-cv-00138-DGK). The plaintiff brought this CERCLA contribution action against several defendants to recover a portion of the amount it paid in settlement with the U.S. Government during its Chapter 11 bankruptcy in relation to the Tar Creek site, the Cherokee County Superfund Site in southeast Kansas, the Oronogo-Duenweg Lead Mining Belt Superfund Site in Jasper County, Missouri and the Newton County Mine Tailing Site in Newton County, Missouri. We have denied liability and will defend vigorously against all of the claims. In the second quarter of 2012, NL filed a motion to stay the case. In the first quarter of 2013, NL’s motion was granted and the court entered an indefinite stay. In the first quarter of 2015, Asarco was granted permission to seek an interlocutory appeal of that stay order. In March 2015, the Eighth Circuit Court of Appeals denied Asarco’s request for an interlocutory appeal of the stay order and the trial court’s indefinite stay remains in place.
In September 2011, we were served in ASARCO LLC v. NL Industries, Inc., et al. (United States District Court, Eastern District of Missouri, Case No. 4:11-cv-00864). The plaintiff brought this CERCLA contribution action against several defendants to recover a portion of the amount it paid in settlement with the U.S. Government during its Chapter 11 bankruptcy in relation to the Southeast Missouri Mining District. In May 2015, the trial court on its own motion entered an indefinite stay of the litigation. In June 2015, Asarco filed an appeal of the stay in the Eighth Circuit Court of Appeals. NL has moved to dismiss that appeal as improperly filed. In October 2015, the Eighth Circuit Court of Appeals granted NL’s motion to dismiss Asarco’s appeal and the trial court’s indefinite stay remains in place.
In July 2012, we were served in EPEC Polymers, Inc., v. NL Industries, Inc., (United States District Court for the District of New Jersey, Case 3:12-cv-03842-PGS-TJB). The plaintiff, a landowner of property located across the Raritan River from our former Sayreville, New Jersey operation, claims that contaminants from NL’s former Sayreville operation came to be located on its land. The complaint seeks compensatory and punitive damages and alleges, among other things, trespass, private nuisance, negligence, strict liability, and claims under CERCLA and the New Jersey Spill Act. We have denied liability and will defend vigorously against all of the claims.
In March 2013, NL received Special Notice from EPA for Operable Unit 1, residential area, at the Big River Mine Tailings Superfund Site in St. Francois County, Missouri. The site encompasses approximately eight former mine and mill areas, only one of which is associated with former NL operations, as well as adjacent residential areas. NL initiated a dialog with EPA regarding a potential settlement for this operable unit.
In September 2013, EPA issued to NL and 34 other PRPs general notice of potential liability and a demand for payment of past costs and performance of a Remedial Design for the Gowanus Canal Superfund Site in Brooklyn, New York. In March 2014, EPA issued a UAO to NL and approximately 27 other PRPs for performance of the Remedial Design at the site. EPA contends that NL is liable as the alleged successor to the Doehler Die Casting Company, and therefore responsible for any potential contamination at the Site resulting from Doehler’s ownership/operation of a warehouse and a die casting plant it owned 90 years ago. NL believes that it has no liability at the Site. NL is currently in discussions with EPA regarding a de minimis settlement and is otherwise taking actions necessary to respond to the UAO. If these discussions are unsuccessful, NL will continue to deny liability and will defend vigorously against all of the claims.
Other litigation
In addition to the matters described above, we and our affiliates are also involved in various other environmental, contractual, product liability, patent (or intellectual property), employment and other claims and disputes incidental to present and former businesses. In certain cases, we have insurance coverage for these items, although we do not expect additional material insurance coverage for environmental matters.
We currently believe that the disposition of all claims and disputes, individually or in the aggregate, should not have a material adverse effect on our consolidated financial position, results of operations or liquidity beyond the accruals already provided.
- 26 -
We are involved in certain legal proceedings with a number of our former insurance carriers regarding the nature and extent of the carriers’ obligations to us under insurance policies with respect to certain lead pigment and asbestos lawsuits. The issue of whether insurance coverage for defense costs or indemnity or both will be found to exist for our lead pigment and asbestos litigation depends upon a variety of factors and we cannot assure you that such insurance coverage will be available. In addition to information that is included below, we have included certain of the information called for by this Item in Note 17 to our Consolidated Financial Statements, and we are incorporating that information here by reference.
We have agreements with certain of our former insurance carriers pursuant to which the carriers reimburse us for a portion of our future lead pigment litigation defense costs, and one such carrier reimburses us for a portion of our future asbestos litigation defense costs. We are not able to determine how much we will ultimately recover from these carriers for defense costs incurred by us because of certain issues that arise regarding which defense costs qualify for reimbursement. While we continue to seek additional insurance recoveries, we do not know if we will be successful in obtaining reimbursement for either defense costs or indemnity. Accordingly, we recognize insurance recoveries in income only when receipt of the recovery is probable and we are able to reasonably estimate the amount of the recovery. See Note 16 to our Consolidated Financial Statements.
We have settled insurance coverage claims concerning environmental claims with certain of our principal former insurance carriers. We do not expect further material settlements relating to environmental remediation coverage.
|
ITEM 4. |
MINE SAFETY DISCLOSURES |
Not applicable
- 27 -
|
ITEM 5. |
MARKET FOR REGISTRANT’S COMMON EQUITY AND RELATED STOCKHOLDER MATTERS |
Our common stock is listed and traded on the New York Stock Exchange (NYSE: NL). As of February 29, 2016, there were approximately 2,400 holders of record of our common stock. The following table sets forth the high and low closing per share sales prices for our common stock for the periods indicated, according to Bloomberg, and cash dividends paid during such periods. On February 29, 2016 the closing price of our common stock was $2.53.
|
|
High |
|
Low |
|
Cash |
||||||
|
Year ended December 31, 2014 |
|
|
|
|
|
|
|
|
|
|
|
|
First Quarter |
$ |
11.76 |
|
|
$ |
10.19 |
|
|
|
- |
|
|
Second Quarter |
|
10.98 |
|
|
|
8.41 |
|
|
|
- |
|
|
Third Quarter |
|
10.37 |
|
|
|
7.20 |
|
|
|
- |
|
|
Fourth Quarter |
|
9.16 |
|
|
|
6.71 |
|
|
|
- |
|
|
Year ended December 31, 2015 |
|
|
|
|
|
|
|
|
|
|
|
|
First Quarter |
$ |
8.65 |
|
|
$ |
6.86 |
|
|
|
- |
|
|
Second Quarter |
|
8.11 |
|
|
|
6.96 |
|
|
|
- |
|
|
Third Quarter |
|
7.46 |
|
|
|
2.99 |
|
|
|
- |
|
|
Fourth Quarter |
|
4.03 |
|
|
|
2.70 |
|
|
|
- |
|
|
January 1, 2016 through February 29, 2016 |
|
3.04 |
|
|
|
1.93 |
|
|
|
- |
|
In February 2014, our Board of Directors deferred consideration of a first quarter 2014 cash dividend, and no dividend was paid in the first quarter. In May 2014, after considering our results of operations, financial conditions and cash requirements for our businesses, our Board of Directors suspended our regular quarterly dividend. The declaration and payment of future dividends, and the amount thereof, is discretionary and is dependent upon these and other factors deemed relevant by our Board of Directors. The amount and timing of past dividends is not necessarily indicative of the amount or timing of any future dividends which might be paid. There are currently no contractual restrictions on the amount of dividends which we may pay.
- 28 -
Set forth below is a table and line graph comparing the yearly change in our cumulative total stockholder return on our common stock against the cumulative total return of the S&P 500 Composite Stock Price Index and the S&P 500 Industrial Conglomerates Index for the period from December 31, 2010 through December 31, 2015. The graph shows the value at December 31 of each year assuming an original investment of $100 at December 31, 2010 and the reinvestment of dividends.
|
2010 |
|
2011 |
|
2012 |
|
2013 |
|
2014 |
|
2015 |
|
|
NL common stock |
$ 100 |
|
$ 120 |
|
$ 111 |
|
$ 113 |
|
$ 87 |
|
$ 31 |
|
S&P 500 Composite Stock Price Index |
100 |
|
102 |
|
118 |
|
157 |
|
178 |
|
181 |
|
S&P 500 Industrial Conglomerates Index |
100 |
|
101 |
|
121 |
|
170 |
|
172 |
|
202 |
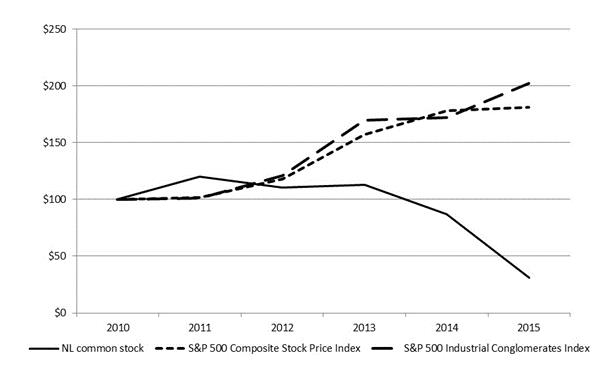
The information contained in the performance graph shall not be deemed “soliciting material” or “filed” with the SEC, or subject to the liabilities of Section 18 of the Securities Exchange Act, except to the extent we specifically request that the material be treated as soliciting material or specifically incorporate this performance graph by reference into a document filed under the Securities Act or the Securities Exchange Act.
Equity compensation plan information
We have an equity compensation plan, which was approved by our shareholders, pursuant to which an aggregate of 200,000 shares of our common stock can be awarded to members of our board of directors. At December 31, 2015, 177,000 shares are available for award under this plan. See Note 12 to our Consolidated Financial Statements.
- 29 -
The following selected financial data should be read in conjunction with our Consolidated Financial Statements and Item 7 - “Management’s Discussion and Analysis of Financial Condition and Results of Operations.”
|
|
Years ended December 31, |
|
|||||||||||||||||
|
|
2011 |
|
|
2012 |
|
|
2013 |
|
|
2014 |
|
|
2015 |
|
|||||
|
|
(In millions, except per share data) |
|
|||||||||||||||||
|
STATEMENTS OF OPERATIONS DATA: |
|
|
|
|
|
|
|
|
|
|
|
|
|
|
|
|
|
|
|
|
Net sales |
$ |
79.8 |
|
|
$ |
83.2 |
|
|
$ |
92.0 |
|
|
$ |
103.8 |
|
|
$ |
109.0 |
|
|
Income from component products operations |
$ |
6.4 |
|
|
$ |
5.4 |
|
|
$ |
9.3 |
|
|
$ |
13.6 |
|
|
$ |
14.0 |
|
|
Equity in earnings (losses) of Kronos |
$ |
97.6 |
|
|
$ |
66.4 |
|
|
$ |
(31.0 |
) |
|
$ |
30.2 |
|
|
$ |
(52.8 |
) |
|
Net income (loss) |
$ |
82.7 |
|
|
$ |
79.1 |
|
|
$ |
(54.5 |
) |
|
$ |
29.6 |
|
|
$ |
(22.7 |
) |
|
Net income (loss) attributable to NL stockholders: |
|
|
|
|
|
|
|
|
|
|
|
|
|
|
|
|
|
|
|
|
Continuing operations |
$ |
78.1 |
|
|
$ |
56.7 |
|
|
$ |
(55.3 |
) |
|
$ |
28.5 |
|
|
$ |
(23.9 |
) |
|
Discontinued operations (1) |
|
3.6 |
|
|
|
17.8 |
|
|
|
- |
|
|
|
- |
|
|
|
- |
|
|
Net income (loss) attributable to NL stockholders |
$ |
81.7 |
|
|
$ |
74.5 |
|
|
$ |
(55.3 |
) |
|
$ |
28.5 |
|
|
$ |
(23.9 |
) |
|
|
|
|
|
|
|
|
|
|
|
|
|
|
|
|
|
|
|
|
|
|
DILUTED EARNINGS PER SHARE DATA: |
|
|
|
|
|
|
|
|
|
|
|
|
|
|
|
|
|
|
|
|
Net income (loss) attributable to NL stockholders: |
|
|
|
|
|
|
|
|
|
|
|
|
|
|
|
|
|
|
|
|
Continuing operations |
$ |
1.61 |
|
|
$ |
1.16 |
|
|
$ |
(1.14 |
) |
|
$ |
.59 |
|
|
$ |
(.49 |
) |
|
Discontinued operations (1) |
|
.07 |
|
|
|
.37 |
|
|
|
- |
|
|
|
- |
|
|
|
- |
|
|
|
$ |
1.68 |
|
|
$ |
1.53 |
|
|
$ |
(1.14 |
) |
|
$ |
.59 |
|
|
$ |
(.49 |
) |
|
Cash dividends per share |
$ |
.50 |
|
|
$ |
.50 |
|
|
$ |
.50 |
|
|
$ |
- |
|
|
$ |
- |
|
|
Weighted average common shares outstanding |
|
48,658 |
|
|
|
48,667 |
|
|
|
48,672 |
|
|
|
48,679 |
|
|
|
48,688 |
|
|
|
|
|
|
|
|
|
|
|
|
|
|
|
|
|
|
|
|
|
|
|
BALANCE SHEET DATA (at year end): |
|
|
|
|
|
|
|
|
|
|
|
|
|
|
|
|
|
|
|
|
Total assets (2) |
$ |
754.0 |
|
|
$ |
676.5 |
|
|
$ |
682.0 |
|
|
$ |
496.2 |
|
|
$ |
349.3 |
|
|
Long-term debt, including current maturities |
|
37.3 |
|
|
|
18.5 |
|
|
|
- |
|
|
|
- |
|
|
|
- |
|
|
NL stockholders' equity |
|
415.0 |
|
|
|
374.8 |
|
|
|
355.4 |
|
|
|
237.0 |
|
|
|
150.0 |
|
|
Total equity |
|
426.0 |
|
|
|
388.1 |
|
|
|
369.0 |
|
|
|
251.5 |
|
|
|
165.3 |
|
|
|
|
|
|
|
|
|
|
|
|
|
|
|
|
|
|
|
|
|
|
|
STATEMENTS OF CASH FLOW DATA: |
|
|
|
|
|
|
|
|
|
|
|
|
|
|
|
|
|
|
|
|
Net cash provided by (used in): |
|
|
|
|
|
|
|
|
|
|
|
|
|
|
|
|
|
|
|
|
Operating activities |
$ |
48.2 |
|
|
$ |
18.0 |
|
|
$ |
14.9 |
|
|
$ |
23.6 |
|
|
$ |
28.1 |
|
|
Investing activities |
|
9.8 |
|
|
|
92.2 |
|
|
|
3.0 |
|
|
|
(3.3 |
) |
|
|
(3.9 |
) |
|
Financing activities |
|
(61.5 |
) |
|
|
(44.1 |
) |
|
|
(43.3 |
) |
|
|
(.3 |
) |
|
|
(.3 |
) |
|
(1) |
In 2012, we sold CompX’s Furniture Components operations for a net pre-tax gain of $23.7 million which is included in discontinued operations. |
|
(2) |
Prior period amounts have been reclassified to reflect the change in the balance sheet classification of deferred taxes adopted effective December 31, 2015. See Note 19 to the Consolidated Financial Statements. As a result, total assets decreased as compared to previously reported amounts by $7.2 million at December 31, 2011, $4.3 million at December 31, 2012, $3.8 million at December 31, 2013 and $4.6 million at December 31, 2014. |
- 30 -
RESULTS OF OPERATIONS
Business overview
We are primarily a holding company. We operate in the component products industry through our majority-owned subsidiary, CompX International Inc. We also own a noncontrolling interest in Kronos Worldwide, Inc. Both CompX (NYSE MKT: CIX) and Kronos (NYSE: KRO) file periodic reports with the SEC.
CompX is a leading manufacturer of engineered components utilized in a variety of applications and industries. Through its Security Products operations, CompX manufactures mechanical and electronic cabinet locks and other locking mechanisms used in recreational transportation, postal, office and institutional furniture, cabinetry, tool storage and healthcare applications. CompX also manufactures stainless steel exhaust systems, gauges, throttle controls, and trim tabs for the recreational marine and other industries through its Marine Components operations.
We account for our 30% non-controlling interest in Kronos by the equity method. Kronos is a leading global producer and marketer of value-added titanium dioxide pigments. TiO2 is used for a variety of manufacturing applications including coatings, plastics, paper and other industrial products.
Net income (loss) overview
Our net loss attributable to NL stockholders was $23.9 million, or $.49 per share, in 2015 compared to net income of $28.5 million, or $.59 per share, in 2014 and a net loss of $55.3 million, or $1.14 per share in 2013.
As more fully described below, the decrease in our earnings per share from 2014 to 2015 is primarily related to:
|
|
· |
equity in losses from Kronos in 2015 of $52.8 million compared to equity in earnings from Kronos in 2014 of $30.2 million, |
|
|
· |
lower insurance recoveries in 2015 of $6.7 million primarily related to an insurance recovery settlement for certain past lead pigment litigation defense costs we recognized in 2014, |
|
|
· |
lower environmental remediation and related costs of $2.1 million in 2015, |
|
|
· |
lower litigation fees and related costs of $2.2 million in 2015, and |
|
|
· |
a first quarter non-cash income tax benefit in 2015 related to a net reduction in our reserve for uncertain tax positions of $3.0 million. |
As more fully described below, the increase in our earnings per share from 2013 to 2014 is primarily due to:
|
|
· |
equity in earnings from Kronos in 2014 of $30.2 million compared to equity in losses from Kronos in 2013 of $31.0 million, |
|
|
· |
lower environmental remediation and related costs in 2014 of $62.4 million, |
|
|
· |
higher income from operations attributable to CompX in 2014 of $4.3 million, and |
|
|
· |
lower litigation and related costs in 2014 of $3.2 million. |
Our 2015 net loss attributable to NL stockholders includes:
|
|
· |
loss of $.65 per share, net of income taxes, included in our equity in losses of Kronos related to Kronos’ recognition of a deferred income tax asset valuation allowance related to its German and Belgian operations, |
|
|
· |
loss of $.07 per share, net of income taxes, included in our equity in losses of Kronos related to certain workforce reduction charges recognized by Kronos, |
|
|
· |
income of $.06 per share related to a net reduction of our reserve for uncertain tax positions, |
|
|
· |
income of $.05 per share, net of income taxes, related to insurance recoveries we recognized, and |
- 31 -
|
|
· |
loss of $.03 per share, net of income taxes, included in our equity in losses of Kronos related to Kronos’ recognition of an other-than-temporary impairment charge in a marketable equity security. |
Our 2014 net income attributable to NL stockholders includes:
|
|
· |
income of $.14 per share, net of income taxes, related to insurance recoveries we recognized, and |
|
|
· |
income of $.02 per share, net of income taxes, included in our equity in Kronos related to a net reduction of Kronos’ reserve for uncertain tax positions. |
Our 2013 net loss attributable to NL stockholders includes:
|
|
· |
income of $.13 per share, net of income taxes, related to insurance recoveries we recognized, |
|
|
· |
an aggregate charge of $.09 per share included in our equity in Kronos related to unabsorbed fixed production and other costs as a result of Kronos’ Canadian plant lockout, and costs associated with the terms of a new collective bargaining agreement reached with its Canadian workforce, |
|
|
· |
a charge of $.09 per share included in our equity in Kronos related to Kronos’ third quarter litigation settlement charge, and |
|
|
· |
an aggregate charge of $.02 per share included in our equity in Kronos related to Kronos’ voluntary prepayments of $390 million of its term loan consisting of the write-off of original issue discount costs and deferred financing costs associated with such prepayments. |
Outlook for 2016
We currently expect our net income attributable to NL stockholders in 2016 to be higher than 2015 primarily due to higher equity in earnings from Kronos and lower environmental and related costs in 2016, offset in part by lower income from operations attributable to CompX.
Critical accounting policies and estimates
The accompanying “Management’s Discussion and Analysis of Financial Condition and Results of Operations” is based upon our Consolidated Financial Statements, which have been prepared in accordance with accounting principles generally accepted in the United States of America (GAAP). The preparation of these financial statements requires us to make estimates and judgments that affect the reported amounts of assets and liabilities and disclosure of contingent assets and liabilities at the date of the financial statements and the reported amount of revenues and expenses during the reported period. On an ongoing basis, we evaluate our estimates, including those related to the recoverability of long-lived assets, pension and other postretirement benefit obligations and the underlying actuarial assumptions related thereto, the realization of deferred income tax assets and accruals for litigation, income tax and other contingencies. We base our estimates on historical experience and on various other assumptions we believe to be reasonable under the circumstances, the results of which form the basis for making judgments about the reported amounts of assets, liabilities, revenues and expenses. Actual results may differ significantly from previously-estimated amounts under different assumptions or conditions.
The following critical accounting policies affect our more significant judgments and estimates used in the preparation of our Consolidated Financial Statements:
- 32 -
|
|
investments could result in losses or our inability to recover the carrying value of the investments that may not be reflected in an investment’s current carrying value, thereby possibly requiring us to recognize an impairment charge in the future. At December 31, 2015, the $5.64 per share quoted market price of our investment in Kronos (our only equity method investee) exceeded its per share net carrying value by over 140%. |
|
|
· |
Long-lived assets - We assess property and equipment for impairment only when circumstances (as specified in ASC 360-10-35, Property, Plant, and Equipment) indicate an impairment may exist. Our determination is based upon, among other things, our estimates of the amount of future net cash flows to be generated by the long-lived asset (Level 3 inputs) and our estimates of the current fair value of the asset. Significant judgment is required in estimating such cash flows. Adverse changes in such estimates of future net cash flows or estimates of fair value could result in an inability to recover the carrying value of the long-lived asset, thereby possibly requiring an impairment charge to be recognized in the future. We do not assess our property and equipment for impairment unless certain impairment indicators specified in ASC Topic 360-10-35 are present. We did not evaluate any long-lived assets for impairment during 2015 because no such impairment indicators were present. |
|
|
· |
Goodwill - Our net goodwill totaled $27.2 million at December 31, 2015. We perform a goodwill impairment test annually in the third quarter of each year. Goodwill is also evaluated for impairment at other times whenever an event occurs or circumstances change that would more likely than not reduce the fair value of a reporting unit below its carrying value. All of our net goodwill at December 31, 2015 is related to CompX. Since 2013, we have used the qualitative assessment of ASC 350-20-35 for our annual impairment test and determined it was not necessary to perform the two-step quantitative goodwill impairment test. See Note 7 to our Consolidated Financial Statements. Considerable management judgment is necessary to evaluate the qualitative impact of events and circumstances on the fair value of a reporting unit. Events and circumstances considered in our impairment evaluations, such as historical profits and stability of the markets served, are consistent with factors utilized with our internal projections and operating plan. However, future events and circumstances could result in materially different findings which could result in the recognition of a material goodwill impairment. |
|
|
· |
Benefit plans - We maintain various defined benefit pension plans and postretirement benefits other than pensions (OPEB). The amounts recognized as defined benefit pension and OPEB expenses and the reported amounts of pension asset and accrued pension and OPEB costs are actuarially determined based on several assumptions, including discount rates, expected rates of returns on plan assets, expected health care trend rates and expected mortality. Variances from these actuarially assumed rates will result in increases or decreases, as applicable, in the recognized pension and OPEB obligations, pension and OPEB expenses and funding requirements. These assumptions are more fully described below under the heading “Assumptions on defined benefit pension plans and OPEB plans.” |
|
|
· |
Income taxes - We recognize deferred taxes for future tax effects of temporary differences between financial and income tax reporting. While we have considered future taxable income and ongoing prudent and feasible tax planning strategies in assessing the need for a valuation allowance, it is possible that in the future we may change our estimate of the amount of the deferred income tax assets that would more-likely-than-not be realized in the future resulting in an adjustment to the deferred income tax asset valuation allowance that would either increase or decrease, as applicable, reported net income in the period the change in estimate was made. We record a reserve for uncertain tax where we believe it is more-likely-than-not our position will not prevail with the applicable tax authorities. It is possible that in the future we may change our assessment regarding the probability that our tax positions will prevail that would require an adjustment to the amount of our reserve for uncertain tax positions that could either increase or decrease, as applicable, reported net income in the period the change in assessment was made. |
- 33 -
|
|
or decrease in the amount required to be accrued for such matters (and therefore a decrease or increase in reported net income in the period of such change). |
Income from operations of CompX and Kronos is impacted by certain significant judgments and estimates, as summarized below:
|
|
· |
Chemicals (Kronos) - allowance for doubtful accounts, impairment of equity method investments, long-lived assets, defined benefit pension and OPEB plans, loss accruals and income taxes, and |
|
|
· |
Component products (CompX) - impairment of goodwill and long-lived assets, loss accruals and income taxes. |
In addition, general corporate and other items are impacted by the significant judgments and estimates for impairment of marketable securities and equity method investments, defined benefit pension and OPEB plans, deferred income tax asset valuation allowances and loss accruals.
Income (loss) from operations
The following table shows the components of our income (loss) from operations.
|
|
Years ended December 31, |
|
|
% Change |
|
|
||||||||||||||
|
|
2013 |
|
|
2014 |
|
|
2015 |
|
|
2013-14 |
|
|
2014-15 |
|
|
|||||
|
|
(Dollars in millions) |
|
|
|
|
|
|
|
|
|
|
|||||||||
|
CompX |
$ |
9.3 |
|
|
$ |
13.6 |
|
|
$ |
14.0 |
|
|
|
46 |
|
% |
|
3 |
|
% |
|
Insurance recoveries |
|
9.4 |
|
|
|
10.4 |
|
|
|
3.7 |
|
|
|
10 |
|
|
|
(64 |
) |
|
|
Other income, net |
|
.1 |
|
|
|
.1 |
|
|
|
.1 |
|
|
|
- |
|
|
|
- |
|
|
|
Corporate expense |
|
(87.0 |
) |
|
|
(21.3 |
) |
|
|
(17.5 |
) |
|
|
(76 |
) |
|
|
(18 |
) |
|
|
Income (loss) from operations |
$ |
(68.2 |
) |
|
$ |
2.8 |
|
|
$ |
.3 |
|
|
|
104 |
|
% |
|
(89 |
) |
% |
The following table shows the components of our income (loss) before income taxes exclusive of our income (loss) from operations.
|
|
Years ended December 31, |
|
|
% Change |
|
|
||||||||||||||
|
|
2013 |
|
|
2014 |
|
|
2015 |
|
|
2013-14 |
|
|
2014-15 |
|
|
|||||
|
|
(Dollars in millions) |
|
|
|
|
|
|
|
|
|
|
|||||||||
|
Equity in earnings (losses) of Kronos |
$ |
(31.0 |
) |
|
$ |
30.2 |
|
|
$ |
(52.8 |
) |
|
|
197 |
|
% |
|
(275 |
) |
% |
|
Interest and dividend income |
|
2.9 |
|
|
|
1.6 |
|
|
|
1.2 |
|
|
|
(45 |
) |
|
|
(25 |
) |
|
|
Interest expense |
|
(.1 |
) |
|
|
- |
|
|
|
- |
|
|
|
(100 |
) |
|
|
- |
|
|
- 34 -
|
|
Years ended December 31, |
|
|
% Change |
|
|
||||||||||||||
|
|
2013 |
|
|
2014 |
|
|
2015 |
|
|
2013-14 |
|
|
2014-15 |
|
|
|||||
|
|
(Dollars in millions) |
|
|
|
|
|
|
|
|
|
|
|||||||||
|
Net sales |
$ |
92.0 |
|
|
$ |
103.8 |
|
|
$ |
109.0 |
|
|
|
13 |
|
% |
|
5 |
|
% |
|
Cost of sales |
|
64.4 |
|
|
|
71.6 |
|
|
|
75.6 |
|
|
|
11 |
|
|
|
6 |
|
|
|
Gross margin |
|
27.6 |
|
|
|
32.2 |
|
|
|
33.4 |
|
|
|
17 |
|
|
|
4 |
|
|
|
Operating costs and expenses |
|
18.3 |
|
|
|
18.6 |
|
|
|
19.4 |
|
|
|
2 |
|
|
|
4 |
|
|
|
Income from operations |
$ |
9.3 |
|
|
$ |
13.6 |
|
|
$ |
14.0 |
|
|
|
46 |
|
|
|
3 |
|
|
|
|
|
|
|
|
|
|
|
|
|
|
|
|
|
|
|
|
|
|
|
|
|
Percentage of net sales: |
|
|
|
|
|
|
|
|
|
|
|
|
|
|
|
|
|
|
|
|
|
Cost of sales |
|
70 |
|
% |
|
69 |
|
% |
|
69 |
|
% |
|
|
|
|
|
|
|
|
|
Gross margin |
|
30 |
|
|
|
31 |
|
|
|
31 |
|
|
|
|
|
|
|
|
|
|
|
Operating costs and expenses |
|
20 |
|
|
|
18 |
|
|
|
18 |
|
|
|
|
|
|
|
|
|
|
|
Income from operations |
|
10 |
|
|
|
13 |
|
|
|
13 |
|
|
|
|
|
|
|
|
|
|
Net sales - Net sales increased $5.2 million in 2015 led by strong demand within CompX’s Security Products business from existing government customers. Sales from CompX’s Marine Components business also contributed to the increase primarily through higher sales to the waterski/wakeboard boat market. Relative changes in selling prices did not have a material impact on net sales comparisons.
Net sales increased $11.8 million in 2014 principally due to strong demand within CompX’s Security Products business, including a new initiative for an existing government customer, increased market penetration in electronic locks and strong demand in transportation markets. Sales from CompX’s Marine Components business also contributed to the increase, reflecting greater penetration into non high-performance marine markets. Relative changes in selling prices did not have a material impact on net sales comparisons.
Cost of sales and gross margin - Cost of sales and gross margin both increased from 2014 to 2015 primarily due to increased sales volumes. As a percentage of sales, cost of sales and resulting gross margin for 2015 is comparable to 2014 as improved variable margins and manufacturing efficiencies attributable to CompX’s Marine Components business were substantially offset by slightly lower variable margins and increased fixed costs within CompX’s Security Products business.
Cost of sales and gross margin both increased from 2013 to 2014 primarily due to increased sales volumes. As a percentage of sales, cost of sales decreased 1% primarily due to improved coverage of fixed manufacturing costs over increased production volumes to meet higher demand for CompX’s products, partially offset by the impact of lower variable margins due to relative changes in customer and product mix within CompX’s Security Products business.
Operating costs and expenses - Operating costs and expenses consist primarily of sales and administrative related personnel costs, sales commissions and advertising expenses directly related to product sales and administrative costs relating to CompX’s business and corporate management activities, as well as gains and losses on plant, property and equipment. Operating costs and expenses increased slightly in 2015 primarily as a result of increased personnel costs for CompX’s Security Products business. Operating costs and expenses increased slightly in 2014 compared to 2013 primarily as a result of increased administrative personnel costs and increased depreciation for CompX’s Security Products business, partially offset by reduced corporate administrative personnel costs.
Income from operations - As a percentage of net sales, income from operations in 2015 was comparable to 2014, and increased by 3% in 2014 compared to 2013. The operating margins were primarily impacted by the factors impacting cost of sales, gross margin and operating costs discussed above.
- 35 -
General - CompX’s profitability primarily depends on our ability to utilize our production capacity effectively, which is affected by, among other things, the demand for our products and our ability to control our manufacturing costs, primarily comprised of labor costs and materials. The materials used in our products consist of purchased components and raw materials some of which are subject to fluctuations in the commodity markets such as zinc, brass and stainless steel. Total material costs represented approximately 48% of our cost of sales in 2015, with commodity-related raw materials accounting for approximately 10% of our cost of sales. With the exception of a moderate midyear 2014 increase in mined metals, including zinc, worldwide commodity raw material costs were mostly stable during 2013 and 2014. During 2015, markets for our primary commodity-related raw materials, including zinc, brass and stainless steel, have generally softened and are expected to remain soft well into 2016. CompX occasionally enters into short-term commodity-related raw material supply arrangements to mitigate the impact of future increases in commodity-related raw material costs. See Item 1 - “Business- Raw Materials.”
Results by reporting unit
The key performance indicator for CompX’s reporting units is the level of their income from operations (see discussion below).
|
|
Years ended December 31, |
|
|
% Change |
|
|
||||||||||||||
|
|
2013 |
|
|
2014 |
|
|
2015 |
|
|
2013-14 |
|
|
2014-15 |
|
|
|||||
|
|
(Dollars in millions) |
|
|
|
|
|
|
|
|
|
|
|||||||||
|
Net sales: |
|
|
|
|
|
|
|
|
|
|
|
|
|
|
|
|
|
|
|
|
|
Security Products |
$ |
81.5 |
|
|
$ |
91.4 |
|
|
$ |
95.6 |
|
|
|
12 |
|
% |
|
5 |
|
% |
|
Marine Components |
|
10.5 |
|
|
|
12.4 |
|
|
|
13.4 |
|
|
|
17 |
|
|
|
8 |
|
|
|
Total net sales |
$ |
92.0 |
|
|
$ |
103.8 |
|
|
$ |
109.0 |
|
|
|
13 |
|
|
|
5 |
|
|
|
|
|
|
|
|
|
|
|
|
|
|
|
|
|
|
|
|
|
|
|
|
|
Gross margin: |
|
|
|
|
|
|
|
|
|
|
|
|
|
|
|
|
|
|
|
|
|
Security Products |
$ |
25.8 |
|
|
$ |
29.5 |
|
|
$ |
29.9 |
|
|
|
15 |
|
|
|
1 |
|
|
|
Marine Components |
|
1.8 |
|
|
|
2.7 |
|
|
|
3.5 |
|
|
|
50 |
|
|
|
29 |
|
|
|
Total gross margin |
$ |
27.6 |
|
|
$ |
32.2 |
|
|
$ |
33.4 |
|
|
|
17 |
|
|
|
4 |
|
|
|
|
|
|
|
|
|
|
|
|
|
|
|
|
|
|
|
|
|
|
|
|
|
Income (loss) from operations: |
|
|
|
|
|
|
|
|
|
|
|
|
|
|
|
|
|
|
|
|
|
Security Products |
$ |
16.1 |
|
|
$ |
18.7 |
|
|
$ |
18.6 |
|
|
|
16 |
|
|
|
(1 |
) |
|
|
Marine Components |
|
(.1 |
) |
|
|
.7 |
|
|
|
1.4 |
|
|
|
576 |
|
|
|
103 |
|
|
|
Corporate operating expenses |
|
(6.7 |
) |
|
|
(5.8 |
) |
|
|
(6.0 |
) |
|
|
(12 |
) |
|
|
4 |
|
|
|
Total income from operations |
$ |
9.3 |
|
|
$ |
13.6 |
|
|
$ |
14.0 |
|
|
|
46 |
|
|
|
3 |
|
|
|
|
|
|
|
|
|
|
|
|
|
|
|
|
|
|
|
|
|
|
|
|
|
Income (loss) from operations margin: |
|
|
|
|
|
|
|
|
|
|
|
|
|
|
|
|
|
|
|
|
|
Security Products |
|
20 |
|
% |
|
20 |
|
% |
|
19 |
|
% |
|
|
|
|
|
|
|
|
|
Marine Components |
|
(1 |
) |
|
|
6 |
|
|
|
11 |
|
|
|
|
|
|
|
|
|
|
|
Total income from operations margin |
|
10 |
|
|
|
13 |
|
|
|
13 |
|
|
|
|
|
|
|
|
|
|
Security Products - Security Products net sales increased 5% to $95.6 million in 2015 compared to $91.4 million in 2014. The increase in sales is primarily due to an increase of approximately $3.0 million in sales to existing government customers. Gross margin for 2015 decreased compared to the same period in 2014 due to relative changes in customer and product mix driving lower variable margins, and increased fixed costs. Operating costs and expenses increased approximately $.5 million in 2015 compared to 2014 primarily as a result of increased personnel costs. Security Products income from operations as a percentage of net sales for 2015 decreased compared to 2014 primarily as a result of the factors impacting gross margin and operating costs and expenses discussed above.
Security Products net sales increased 12% to $91.4 million in 2014 compared to $81.5 million in 2013. The increase in sales is primarily due to an increase of approximately $5.0 million in sales of new products for an existing government customer, additional sales of $2.9 million into transportation markets on strong demand from
- 36 -
motorcycle and recreational vehicle OEM customers and a $1.7 million increase in electronic lock sales in 2014 due to increased market penetration and two significant project installations. Gross margin for 2014 is comparable to the same period in 2013 as improved coverage of fixed costs over increased production volumes were offset by lower variable margins. Additionally, operating costs and expenses for 2014 increased approximately $1.2 million, primarily as a result of increased administrative personnel and benefits costs of approximately $.5 million and increased depreciation of $.2 million. Security products income from operations as a percentage of net sales for 2014 is comparable to 2013 primarily as a result of the factors impacting gross margin and operating costs and expenses discussed above.
Marine Components - Marine Components net sales increased 8% in 2015 as compared to 2014. The increase in sales was primarily due to improved demand for products sold to the ski/wakeboard boat market, including the introduction of new product lines to that market. As a percentage of net sales, gross margin and the income from operations percentage each improved due to improved pricing, changes in customer and product mix, improved manufacturing efficiencies and increased leverage of fixed costs as a result of higher production volumes.
Marine Components net sales increased 17% in 2014 as compared to 2013. The increase was primarily the result of gains in market share for products sold to the ski/wakeboard boat market and other non high performance marine markets. As a percentage of net sales, gross margin and the income from operations percentage improved primarily due to variable margins related to product mix and increased leverage of fixed costs as a result of higher volumes.
Outlook - The robust demand for our products experienced in 2015 was supported by continued high demand from certain large existing customers, including those serving the government security applications and recreational transportation markets. In addition, 2015 sales included over $5 million in sales for a government security end-user which is not expected to recur in 2016. We also continue to experience the benefits of innovation and diversification in our product offerings to the recreational boat markets served by our Marine Components segment. We anticipate continued strong demand for our products in 2016, though we do not expect demand for government security applications to approach 2015 volumes. As in prior periods, we will continue to monitor general economic conditions and sales order rates and respond to fluctuations in customer demand through continuous evaluation of staffing levels and consistent execution of our lean manufacturing and cost improvement initiatives. Additionally, we continue to seek opportunities to gain market share in markets we currently serve, to expand into new markets and to develop new product features in order to mitigate the impact of changes in demand as well as broaden our sales base.
General corporate items, interest and dividend income, interest expense, provision for income taxes, noncontrolling interest and related party transactions
Insurance recoveries - We have agreements with certain insurance carriers pursuant to which the carriers reimburse us for a portion of our past lead pigment and asbestos litigation defense costs. Insurance recoveries include amounts we received from these insurance carriers. Substantially all of the $3.7 million of insurance recoveries we recognized in 2015 relate to a first quarter settlement we reached with one of our insurance carriers in which they agreed to reimburse us for a portion of our past litigation defense costs. Substantially all of the $10.4 million of insurance recoveries we recognized in 2014 relate to a settlement we reached with one of our insurance carriers in September 2014 in which they agreed to reimburse us for a portion of our past litigation defense costs.
The agreements with certain of our insurance carriers also include reimbursement for a portion of our future litigation defense costs. We are not able to determine how much we will ultimately recover from these carriers for defense costs incurred by us because of certain issues that arise regarding which defense costs qualify for reimbursement. Accordingly, these insurance recoveries are recognized when receipt is probable and the amount is determinable. Substantially all of the insurance recoveries recognized in 2013 relate to reimbursement of ongoing litigation defense costs. See Notes 16 and 17 to our Consolidated Financial Statements.
- 37 -
Corporate expense - Corporate expenses were $17.5 million in 2015, $3.8 million or 18% lower than in 2014 primarily due to lower environmental and related costs; and lower litigation and related costs. Included in corporate expenses are:
|
|
● |
litigation and related costs of $4.8 million in 2015 compared to $7.0 million in 2014 and |
|
|
● |
environmental and related costs of $4.4 million in 2015 compared to $6.5 million in 2014. |
Corporate expenses were $21.3 million in 2014, $65.7 million or 76% lower than in 2013 primarily due to lower environmental and related costs. Included in corporate expenses are:
|
|
● |
litigation and related costs of $7.0 million in 2014 compared to $10.2 million in 2013, and |
|
|
● |
environmental and related costs of $6.5 million in 2014 compared to $68.9 million in 2013. |
Overall, we currently expect that our net general corporate expenses in 2016 will be lower than in 2015 primarily due to lower expected environmental remediation and related costs.
The level of our litigation and related expenses varies from period to period depending upon, among other things, the number of cases in which we are currently involved, the nature of such cases and the current stage of such cases (e.g. discovery, pre-trial motions, trial or appeal, if applicable). See Note 17 to our Consolidated Financial Statements. If our current expectations regarding the number of cases in which we expect to be involved during 2016 or the nature of such cases were to change, our corporate expenses could be higher than we currently estimate.
Obligations for environmental remediation costs are difficult to assess and estimate and it is possible that actual costs for environmental remediation will exceed accrued amounts or that costs will be incurred in the future for sites in which we cannot currently estimate our liability. If these events were to occur in 2016, our corporate expenses would be higher than we currently estimate. In addition, we adjust our environmental accruals as further information becomes available to us or as circumstances change. Such further information or changed circumstances could result in an increase in our accrued environmental costs. See Note 17 to our Consolidated Financial Statements.
Interest and dividend income – Dividend income decreased $.4 million in 2015 compared to 2014 related to the reduction of Valhi’s quarterly dividend from $.05 per share to $.02 per share, effective with its second quarter 2014 dividend.
Dividend income decreased $1.3 million in 2014 compared to 2013 related to such reduction in Valhi’s quarterly dividend.
Interest expense - Substantially all of our interest expense in 2013 relates to certain of CompX’s indebtedness. CompX prepaid such indebtedness in July 2013, after which we have not had any outstanding indebtedness. We do not expect to have any outstanding indebtedness during 2016.
Income tax expense (benefit) - We recognized an income tax benefit of $41.9 million in 2013, income tax expense of $5.0 million in 2014 and an income tax benefit of $28.6 million in 2015. Our income tax benefit in 2015 includes a first quarter non-cash income tax benefit of $3.0 million related to the release of a portion of our reserve for uncertain tax positions due to the expiration of the applicable statute of limitations. In accordance with GAAP, we recognize deferred income taxes on our undistributed equity in earnings (losses) of Kronos. Because we and Kronos are part of the same U.S. federal income tax group, any dividends we receive from Kronos are nontaxable to us. Accordingly, we do not recognize and we are not required to pay income taxes on dividends from Kronos. Therefore, our effective income tax rate will generally be lower than the U.S. federal statutory income tax rate in periods during which we receive dividends from Kronos and recognize equity in earnings of Kronos (such as in 2014). Conversely, our effective income tax rate will generally be higher than the U.S. federal statutory income tax rate in periods during which we receive dividends from Kronos and recognize equity in losses of Kronos (such as in 2013 and 2015). We received aggregate dividends from Kronos of $21.1 million in each of 2013, 2014 and 2015.
- 38 -
Our effective tax rate attributable to our equity in earnings (losses) of Kronos, including the effect of non-taxable dividends we received from Kronos, was 58.9% in 2013, 10.5% in 2014 and 49.0% in 2015. Kronos has substantial net operating losses in Germany and Belgium, the benefit of which Kronos had previously recognized under the more-likely-than-not recognition criteria. In the second quarter of 2015, Kronos determined that such losses did not meet the more-likely-than-not recognition criteria, and as a result Kronos recognized a non-cash deferred income tax expense of $150.3 million in the second quarter of 2015 and an additional $8.7 million of expense in the second half of 2015 as a valuation allowance against Kronos’ net deferred income tax assets in such jurisdictions. Our equity in losses of Kronos in 2015 includes our equity in such non-cash deferred income tax expense recognized by Kronos.
See Note 13 to our Consolidated Financial Statements for more information about our 2015 income tax items, including a tabular reconciliation of our statutory tax expense (benefit) to our actual tax expense (benefit).
Noncontrolling interest - Noncontrolling interest in net income of CompX attributable to continuing operations is consistent in each of 2013, 2014 and 2015.
Related party transactions - We are a party to certain transactions with related parties. See Notes 1 and 15 to our Consolidated Financial Statements. It is our policy to engage in transactions with related parties on terms, in our opinion, no less favorable to us than we could obtain from unrelated parties.
- 39 -
Equity in earnings (losses) of Kronos Worldwide, Inc.
|
|
Years ended December 31, |
|
|
% Change |
|
|
||||||||||||||
|
|
2013 |
|
|
2014 |
|
|
2015 |
|
|
2013-14 |
|
|
2014-15 |
|
|
|||||
|
|
(Dollars in millions) |
|
|
|
|
|
|
|
|
|
|
|||||||||
|
Net sales |
$ |
1,732.4 |
|
|
$ |
1,651.9 |
|
|
$ |
1,348.8 |
|
|
|
(5 |
) |
% |
|
(18 |
) |
% |
|
Cost of sales |
|
1,620.2 |
|
|
|
1,302.2 |
|
|
|
1,156.5 |
|
|
|
(20 |
) |
% |
|
(11 |
) |
% |
|
Gross margin |
$ |
112.2 |
|
|
$ |
349.7 |
|
|
$ |
192.3 |
|
|
|
|
|
|
|
|
|
|
|
|
|
|
|
|
|
|
|
|
|
|
|
|
|
|
|
|
|
|
|
|
|
Income (loss) from operations |
$ |
(132.6 |
) |
|
$ |
149.7 |
|
|
$ |
(1.1 |
) |
|
|
213 |
|
% |
|
(101 |
) |
% |
|
Other, net |
|
(7.7 |
) |
|
|
1.0 |
|
|
|
(11.2 |
) |
|
|
|
|
|
|
|
|
|
|
Interest expense |
|
(19.6 |
) |
|
|
(17.0 |
) |
|
|
(18.5 |
) |
|
|
|
|
|
|
|
|
|
|
Income (loss) before income taxes |
|
(159.9 |
) |
|
|
133.7 |
|
|
|
(30.8 |
) |
|
|
|
|
|
|
|
|
|
|
Income tax expense (benefit) |
|
(57.9 |
) |
|
|
34.5 |
|
|
|
142.8 |
|
|
|
|
|
|
|
|
|
|
|
Net income (loss) |
$ |
(102.0 |
) |
|
$ |
99.2 |
|
|
$ |
(173.6 |
) |
|
|
|
|
|
|
|
|
|
|
|
|
|
|
|
|
|
|
|
|
|
|
|
|
|
|
|
|
|
|
|
|
Percentage of net sales: |
|
|
|
|
|
|
|
|
|
|
|
|
|
|
|
|
|
|
|
|
|
Cost of sales |
|
94 |
|
% |
|
79 |
|
% |
|
86 |
|
% |
|
|
|
|
|
|
|
|
|
Income (loss) from operations |
|
(8 |
) |
% |
|
9 |
|
% |
|
- |
|
% |
|
|
|
|
|
|
|
|
|
|
|
|
|
|
|
|
|
|
|
|
|
|
|
|
|
|
|
|
|
|
|
Equity in earnings (losses) of Kronos Worldwide, Inc. |
$ |
(31.0 |
) |
|
$ |
30.2 |
|
|
$ |
(52.8 |
) |
|
|
|
|
|
|
|
|
|
|
|
|
|
|
|
|
|
|
|
|
|
|
|
|
|
|
|
|
|
|
|
|
TiO2 operating statistics: |
|
|
|
|
|
|
|
|
|
|
|
|
|
|
|
|
|
|
|
|
|
Sales volumes* |
|
498 |
|
|
|
496 |
|
|
|
525 |
|
|
|
- |
|
% |
|
6 |
|
% |
|
Production volumes* |
|
474 |
|
|
|
511 |
|
|
|
528 |
|
|
|
8 |
|
% |
|
3 |
|
% |
|
|
|
|
|
|
|
|
|
|
|
|
|
|
|
|
|
|
|
|
|
|
|
Change in TiO2 net sales: |
|
|
|
|
|
|
|
|
|
|
|
|
|
|
|
|
|
|
|
|
|
TiO2 product pricing |
|
|
|
|
|
|
|
|
|
|
|
|
|
(6 |
) |
% |
|
(14 |
) |
% |
|
TiO2 sales volumes |
|
|
|
|
|
|
|
|
|
|
|
|
|
- |
|
% |
|
6 |
|
% |
|
TiO2 product mix |
|
|
|
|
|
|
|
|
|
|
|
|
|
- |
|
% |
|
(2 |
) |
% |
|
Changes in currency exchange rates |
|
|
|
|
|
|
|
|
|
|
|
|
|
1 |
|
% |
|
(8 |
) |
% |
|
Total |
|
|
|
|
|
|
|
|
|
|
|
|
|
(5 |
) |
% |
|
(18 |
) |
% |
|
|
|
|
|
|
|
|
|
|
|
|
|
|
|
|
|
|
|
|
|
|
|
* Thousands of metric tons |
|
|
|
|
|
|
|
|
|
|
|
|
|
|
|
|
|
|
|
|
Industry conditions and 2015 overview – Due to competitive pressures, Kronos’ average TiO2 selling prices decreased throughout 2014 and 2015. Kronos’ average selling prices at the end of 2015 were 17% lower than at the end of 2014, with lower prices in all major markets, most notably in North American and certain export markets. Kronos’ average selling prices in 2015 were also impacted by a higher percentage of sales to lower-priced export markets in 2015 compared to 2014. Kronos experienced higher sales volumes in European and export markets in 2015 as compared to 2014, partially offset by lower volumes in North American markets in 2015 as compared to 2014.
- 40 -
The following table shows Kronos’ capacity utilization rates during 2014 and 2015.
|
|
2014 |
|
|
2015 |
|
||
|
|
|
|
|
|
|
|
|
|
First Quarter |
90 |
% |
|
|
93 |
% |
|
|
Second Quarter |
97 |
% |
|
|
100 |
% |
|
|
Third Quarter |
96 |
% |
|
|
95 |
% |
|
|
Fourth Quarter |
86 |
% |
|
|
92 |
% |
|
|
Overall |
92 |
% |
|
|
95 |
% |
|
Kronos’ production capacity utilization rates in the first quarter of 2014 were impacted by a union labor lockout at its Canadian production facility that ended in December 2013, as restart of production at the facility did not begin until February 2014. Kronos’ production rates in the fourth quarter of 2014 and the first and fourth quarters of 2015 were impacted by the implementation of certain productivity-enhancing improvement projects at certain facilities, as well as necessary improvements to ensure continued compliance with its permit regulations, which resulted in longer-than-normal maintenance shutdowns in some instances.
Kronos continued to experience moderation in the cost of TiO2 feedstock ore procured from third parties in 2014 and 2015. Given the time lag between when third-party feedstock ore is procured and when the TiO2 product produced with such ore is sold and recognized in Kronos’ cost of sales, its cost of sales per metric ton of TiO2 sold declined throughout 2014 and 2015. Consequently, Kronos’ cost of sales per metric ton of TiO2 sold in 2015 was slightly lower than its cost of sales per metric ton of TiO2 sold in 2014 (excluding the effect of changes in currency exchange rates).
In the second quarter of 2015, Kronos initiated a restructuring plan designed to improve its long-term cost structure. A portion of such expected cost savings is planned to occur through workforce reductions. During the second, third and fourth quarters of 2015, Kronos implemented certain voluntary and involuntary workforce reductions at certain of its facilities impacting approximately 160 individuals. Kronos recognized an aggregate $21.7 million charge in 2015 (substantially all of which was recognized in the second quarter) for such workforce reductions it had implemented through December 31, 2015, $10.8 million of which is classified as part of cost of sales and $10.9 million of which is classified in selling, general and administrative expense. The charge associated with the workforce reductions implemented in the third and fourth quarters of 2015, which impacted approximately 50 individuals, was not material due to the applicable law affecting such individuals, which generally provides for a short notice period (if any) and the payment of a nominal amount of severance (if any).
Net sales - Kronos’ net sales decreased 18% or $303.1 million in 2015 compared to 2014, primarily due to the net effect of a 14% decrease in average TiO2 selling prices (which decreased net sales by approximately $231 million) and a 6% increase in sales volumes (which increased net sales by approximately $99 million). TiO2 selling prices will increase or decrease generally as a result of competitive market pressures, changes in the relative level of supply and demand as well as changes in raw material and other manufacturing costs.
Kronos’ sales volumes increased primarily due to higher sales in certain European and export markets, partially offset by lower sales in North American markets. Kronos estimates that changes in currency exchange rates decreased its net sales by approximately $138 million, or 8%, as compared to 2014.
Kronos net sales decreased 5% or $80.5 million in 2014 compared to 2013, primarily due a 6% decrease in average TiO2 selling prices (which decreased net sales by approximately $104 million). TiO2 selling prices will increase or decrease generally as a result of competitive market pressures, changes in the relative level of supply and demand as well as changes in raw material and other manufacturing costs.
Kronos’ sales volumes in 2014 remained relatively stable compared to 2013 as slightly higher sales in Europe were offset by lower sales in certain export markets. In addition, Kronos estimates the favorable effect of changes in currency exchange rates increased its net sales by approximately $12 million, or 1%, as compared to 2013.
- 41 -
Cost of sales - Kronos’ cost of sales decreased $145.7 million or 11% in 2015 compared to 2014 due to the net impact of lower raw materials and other production costs of approximately $26 million (primarily caused by the lower third-party feedstock ore costs, as discussed above), a 3% increase in TiO2 production volumes and currency fluctuations (primarily the euro). In addition, cost of sales in 2015 includes approximately $10.8 million of severance costs related to the workforce reduction plan discussed above.
Kronos’ cost of sales as a percentage of net sales increased to 86% in 2015 compared to 79% in 2014, as the unfavorable impact of lower average selling prices and the workforce reduction charge more than offset the favorable effects of lower raw material costs and efficiencies related to higher production volumes, as discussed above.
Kronos’ cost of sales decreased $318.0 million or 20% in 2014 compared to 2013 due to the net impact of lower raw materials and other production costs of approximately $250 million (primarily caused by the lower third-party feedstock ore costs, as discussed above), an 8% increase in TiO2 production volumes and currency fluctuations (primarily the euro). Kronos’ cost of sales as a percentage of net sales decreased to 79% in 2014 compared to 94% in 2013, primarily due to the net effects of lower raw material and other production costs and the lower average TiO2 selling prices discussed above. In addition, cost of sales in 2013 includes approximately $19 million of unabsorbed fixed production and other manufacturing costs associated with the lockout at the Canadian TiO2 production facility and approximately $9 million of one-time costs resulting from the terms of the new collective bargaining agreement for Kronos’ Canadian workforce, each of which were charged directly to cost of sales as discussed below.
Unionized employees in Kronos’ Canadian TiO2 production facility were covered by a collective bargaining agreement that expired June 15, 2013. The Canadian facility represents approximately 19% of Kronos’ worldwide TiO2 production capacity. The union employees represented by the Confederation des Syndicat National (CSN) rejected Kronos’ revised global offer, and Kronos declared a lockout of unionized employees upon the expiration of the existing contract. Effective the end of November 2013, a new collective bargaining agreement was reached with CSN and production at the facility resumed in February 2014. During the lockout Kronos operated its Canadian plant at approximately 15% of the plant’s capacity with non-union management employees. The reduction in Kronos’ TiO2 production volumes at its Canadian facility resulted in approximately $19 million of unabsorbed fixed production and other manufacturing costs that were charged directly to cost of sales. In addition, Kronos recognized approximately $9 million in expenses associated with reaching a new collective bargaining agreement, consisting of a net $7 million non-cash charge due to the curtailment of one of Kronos’ Canadian defined benefit pension plans and its Canadian other postretirement benefit plan and approximately $2 million of severance and other back-to-work expenses.
Other operating expense, net - Kronos’ other operating expense in 2013 includes a previously-reported third quarter litigation settlement charge of $35 million.
Gross margin and income (loss) from operations – Kronos income from operations decreased by $150.8 million, from income of $149.7 million in 2014 to a loss from operations of $1.1 million in 2015. Income (loss) from operations as a percentage of net sales decreased to (1)% in 2015 from 9% in 2014. This decrease was driven by the decline in gross margin, which decreased to 14% in 2015 compared to 21% in 2014, as well as the negative impact of the workforce reduction charge classified as part of other operating expense ($10.9 million). As discussed and quantified above, Kronos’ gross margin decreased primarily due to the net effect of lower selling prices, workforce reduction costs classified as part of cost of sales ($10.8 million), lower manufacturing costs (primarily raw materials), higher production volumes, and higher sales volumes. Kronos estimates that changes in currency exchange rates increased income from operations by approximately $40 million in 2015 as compared to 2014.
Kronos’ income from operations increased by $282.3 million from a loss of $132.6 million in 2013 to income of $149.7 million in 2014. Income (loss) from operations as a percentage of net sales increased to 9% in 2014 from (8)% in 2013. This increase was driven by the improvement in gross margin, which increased to 21% in 2014 compared to 6% in 2013 and by the 2013 litigation settlement charge as discussed above. As discussed and quantified above, Kronos’ gross margin increased primarily due to the net effect of lower manufacturing costs (primarily raw materials), lower selling prices, higher production volumes and 2013 costs associated with reaching a new Canadian collective bargaining agreement and related unabsorbed fixed costs charged directly to cost of sales. Additionally, changes in currency exchange rates have positively affected Kronos’ gross margin and income from
- 42 -
operations. Kronos estimates that changes in currency exchange rates increased income from operations by approximately $42 million in 2014 as compared to 2013.
As a percentage of net sales, selling, general and administrative expenses were relatively consistent at approximately 13%, 12%, and 11% for 2015, 2014, and 2013, respectively. As discussed above, the relative increase in 2015 is primarily due to the workforce reduction charge classified as part of selling, general and administrative ($10.9 million).
Other non-operating income (expense) – Kronos recognized a $12.0 million pre-tax impairment charge in the third quarter of 2015 due to other-than-temporary impairment on its investment in Valhi common stock held for sale.
Kronos’ interest expense increased $1.5 million from $17.0 million in 2014 to $18.5 million in 2015 primarily due to higher average debt levels mostly offset by lower average interest rates in 2015.
In 2013, Kronos recognized an aggregate $8.9 million pre-tax charge, consisting of the write-off of unamortized original issue discount costs and deferred financing costs related to the voluntary prepayment of its prior term loan by $290 million in the first quarter of 2013 and the remaining $100 million in the third quarter of 2013.
Kronos’ interest expense decreased $2.6 million from $19.6 million in 2013 to $17.0 million in 2014 primarily due to lower average interest rates on outstanding borrowings in 2014 partially offset by higher average debt levels.
Income tax provision - Kronos recognized income tax expense of $142.8 million in 2015 compared to income tax expense of $34.5 million in 2014. Kronos’ income tax expense in 2015 includes an aggregate non-cash deferred income tax expense of $159.0 million related to the recognition of a deferred income tax asset valuation allowance for its German and Belgian operations (mostly recognized in the second quarter). Kronos continues to believe it will ultimately realize the full benefit of its German and Belgian NOL carryforwards, in part because of their indefinite carryforward period. However, Kronos’ ability to reverse all or a portion of such valuation allowance in the future is dependent on the presence of sufficient positive evidence, such as the existence of cumulative profits in the most recent twelve consecutive quarters, and the ability to demonstrate future profitability for a sustainable period. Until such time as Kronos is able to reverse the valuation allowance in full, to the extent it generates additional losses in Germany or Belgium in the intervening periods, its effective income tax rate would be impacted by the existence of such valuation allowance, because such losses would effectively be recognized without any associated net income tax benefit, as such losses would result in a further increase in the deferred income tax asset valuation allowance. Alternatively, until such time as Kronos is able to reverse the valuation allowance in full, to the extent it generates income in Germany or Belgium in the intervening periods, its effective income tax rate would also be impacted by the existence of such valuation allowance, because such income would effectively be recognized without any associated net income tax expense, as we would reverse a portion of the valuation allowance to offset the income tax expense attributable to such income. In addition, any change in tax law related to the indefinite carryforward period of these NOLs could adversely impact Kronos’ ability to reverse the valuation allowance in full. Consistent with Kronos’ expectation regarding its consolidated results of operations in 2016 (as discussed below under the “Outlook” subsection), Kronos currently believes it is likely its German and Belgian operations will report improved operating results in 2016 as compared to 2015. However, Kronos currently does not expect that its German and Belgian operating results would improve to such an extent in 2016 that reversal of the valuation allowance in full would be supported by the presence of sufficient positive evidence.
In 2014, Kronos’ income tax expense was favorably impacted by an aggregate non-cash income tax benefit of $5.1 million related to a net reduction in its reserve for uncertain tax positions. Kronos’ earnings are subject to income tax in various U.S. and non-U.S. jurisdictions, and the income tax rates applicable to its pre-tax earnings (losses) of its non-U.S. operations are generally lower than the income tax rates applicable to its U.S. operations. Excluding the impact of the net reduction in Kronos’ reserve for uncertain tax positions in 2014, its effective tax rate in such period was lower than the U.S. federal statutory tax rate of 35% primarily due to its non-U.S. earnings. Kronos’ effective income tax rate in 2015, excluding the impact of the deferred income tax asset valuation allowance, was higher than the U.S. federal statutory tax rate of 35%, primarily due to a current U.S. income tax
- 43 -
benefit attributable to current year losses of one of its non-U.S. subsidiaries.
Kronos recognized income tax expense of $34.5 million in 2014 compared to an income tax benefit of $57.9 million in 2013. This difference is primarily due to Kronos’ increased earnings in 2014. In addition, Kronos’ income tax expense in 2014 was favorably impacted by an aggregate non-cash income tax benefit of $5.1 million related to a net reduction in its reserve for uncertain tax positions.
Effects of Currency Exchange Rates
Kronos has substantial operations and assets located outside the United States (primarily in Germany, Belgium, Norway and Canada). The majority of its sales from non-U.S. operations are denominated in currencies other than the U.S. dollar, principally the euro, other major European currencies and the Canadian dollar. A portion of its sales generated from its non-U.S. operations is denominated in the U.S. dollar (and consequently Kronos’ non-U.S. operations will generally hold U.S. dollars from time to time). Certain raw materials used worldwide, primarily titanium-containing feedstocks, are purchased in U.S. dollars, while labor and other production costs are purchased primarily in local currencies. Consequently, the translated U.S. dollar value of Kronos’ non-U.S. sales and operating results are subject to currency exchange rate fluctuations which may favorably or unfavorably impact reported earnings and may affect the comparability of period-to-period operating results. In addition to the impact of the translation of sales and expenses over time, Kronos’ non-U.S. operations also generate currency transaction gains and losses which primarily relate to the (i) difference between the currency exchange rates in effect when non-local currency sales or operating costs (primarily U.S. dollar denominated) are initially accrued and when such amounts are settled with the non-local currency, (ii) changes in currency exchange rates during time periods when Kronos’ non-U.S. operations are holding non-local currency (primarily U.S. dollars), and (iii) relative changes in the aggregate fair value of currency forward contracts held from time to time. Kronos periodically uses currency forward contracts to manage a portion of its currency exchange risk, and relative changes in the aggregate fair value of any currency forward contracts it holds from time to time serves in part to mitigate the currency transaction gains or losses Kronos would otherwise recognize from the first two items described above.
Overall, Kronos estimates that fluctuations in currency exchange rates had the following effects on its sales and income from operations for the periods indicated.
|
Impact of changes in currency exchange rates - 2015 vs. 2014 |
|||||||||||||||||||
|
|
Transaction gains/(losses) recognized |
|
Translation |
|
Total |
||||||||||||||
|
|
2014 |
|
2015 |
|
Change |
|
|
||||||||||||
|
|
(In millions) |
||||||||||||||||||
|
Impact on: |
|
|
|
|
|
|
|
|
|
|
|
|
|
|
|
|
|
|
|
|
Net sales |
$ |
- |
|
|
$ |
- |
|
|
$ |
- |
|
|
$ |
(138) |
|
|
$ |
(138) |
|
|
Income from operations |
|
4 |
|
|
|
- |
|
|
|
(4) |
|
|
|
44 |
|
|
|
40 |
|
|
Impact of changes in currency exchange rates - 2014 vs. 2013 |
|||||||||||||||||||
|
|
Transaction gains/(losses) recognized |
|
Translation |
|
Total |
||||||||||||||
|
|
2013 |
|
2014 |
|
Change |
|
|
||||||||||||
|
|
|
|
|
||||||||||||||||
|
|
(In millions) |
||||||||||||||||||
|
Impact on: |
|
|
|
|
|
|
|
|
|
|
|
|
|
|
|
|
|
|
|
|
Net sales |
$ |
- |
|
|
$ |
- |
|
|
$ |
- |
|
|
$ |
12 |
|
|
$ |
12 |
|
|
Income from operations |
|
(4 |
) |
|
|
4 |
|
|
|
8 |
|
|
|
34 |
|
|
|
42 |
|
- 44 -
During 2015 Kronos operated its production facilities at 95% of practical capacity compared to 92% in 2014. Kronos expects its production volumes to be higher in 2016 as compared to 2015, as its production rates in 2015 were impacted by the implementation of certain productivity-enhancing improvement projects at certain facilities, as well as necessary improvements to ensure continued compliance with its permit regulations, which resulted in longer-than-normal maintenance shutdowns in some instances. Assuming economic conditions do not deteriorate in the various regions of the world, Kronos expects its sales volumes to be higher in 2016 as compared to 2015. Kronos will continue to monitor current and anticipated near-term customer demand levels and align its production and inventories accordingly.
Kronos continued to experience moderation in the cost of TiO2 feedstock ore procured from third parties in 2014 and 2015. Given the time lag between when third-party feedstock ore is procured and when the TiO2 product produced with such ore is sold and recognized in Kronos’ cost of sales, its cost of sales per metric ton of TiO2 sold in 2015 was slightly lower than its cost of sales per metric ton of TiO2 sold in 2014 (excluding the effect of changes in currency exchange rates). Kronos expects its cost of sales per metric ton of TiO2 sold in 2016 will be lower than its per-metric ton cost in 2015, due in part to the favorable effect of the workforce reductions and other cost reduction initiatives it is undertaking as well as some modest improvement in the cost of feedstock ore.
Kronos started 2015 with selling prices 9% lower than the beginning of 2014, and prices declined by an additional 17% during 2015. Industry data indicates that overall TiO2 inventory held by producers has declined significantly during 2015. In addition, Kronos believes most customers hold very low inventories of TiO2 with many operating on a just-in-time basis. With the improvement in sales volumes experienced in 2015, Kronos continues to see evidence of strengthening demand for its TiO2 products in certain of its primary markets. Kronos and its major competitors announced a price increase in late 2015, which is expected to be implemented in the first quarter of 2016, or as contracts allow. The extent to which Kronos will be able to achieve any price increases in the near term will depend on market conditions.
Kronos initiated a restructuring plan in 2015 designed to improve its long-term cost structure. A portion of such expected cost savings is planned to occur through workforce reductions. During 2015, Kronos implemented certain voluntary and involuntary workforce reductions at certain of its facilities impacting approximately 160 individuals. As of December 31, 2015 Kronos has recognized an aggregate $21.7 million charge for such workforce reductions it had implemented through that date, $10.8 million of which is classified as part of cost of sales and $10.9 million of which is classified in selling, general and administrative expense. The workforce reductions Kronos have implemented through December 31, 2015 are not expected to negatively impact its ability to operate its production facilities at their practical capacity rates.
In addition to the workforce reductions implemented through December 31, 2015, Kronos is also in the process of implementing other cost reduction initiatives throughout the organization, including the implementation of continued process productivity improvements. The workforce reductions Kronos has implemented through December 31, 2015, combined with certain open positions that are not expected to be filled and cost savings expected to be realized from its other cost reduction initiatives it is undertaking, are expected to result in a payback of the aggregate workforce reduction charge accrued at December 31, 2015 within approximately one year, the benefit of which Kronos began to recognize in the second half of 2015.
Overall, Kronos expects income from operations in 2016 will be higher as compared to 2015 as a result of:
|
|
· |
the favorable effects of anticipated higher sales and production volumes in 2015, |
|
|
· |
the favorable effect of lower-cost feedstock ore, and |
|
|
· |
the expected cost savings from workforce reductions and other cost reduction initiatives throughout the organization. |
However, given, among other things, the level of Kronos’ average selling prices at the beginning of 2016, Kronos believes it is possible it would report a loss from operations in the first quarter of 2016.
- 45 -
Due to the constraints of high capital costs and extended lead time associated with adding significant new TiO2 production capacity, especially for premium grades of TiO2 products produced from the chloride process, Kronos believes increased and sustained profit margins will be necessary to financially justify major expansions of TiO2 production capacity required to meet expected future growth in demand. As a result of customer decisions over the last year and the resulting adverse effect on global TiO2 pricing, some industry projects to increase TiO2 production capacity have been cancelled or deferred indefinitely, and announcements have been made regarding the closure of certain facilities. Given the lead time required for production capacity expansions, a shortage of TiO2 products could occur if economic conditions improve and global demand levels for TiO2 increase sufficiently.
Kronos’ expectations for its future operating results are based upon a number of factors beyond its control, including worldwide growth of gross domestic product, competition in the marketplace, continued operation of competitors, unexpected or earlier-than-expected capacity additions or reductions and technological advances. If actual developments differ from Kronos’ expectations, its results of operations could be unfavorably affected.
Assumptions on defined benefit pension plans and OPEB plans
Defined benefit pension plans - We maintain various defined benefit pension plans in the U.S. and the U.K., and Kronos maintains various defined benefit pension plans in the U.S., Europe and Canada. See Note 14 to our Consolidated Financial Statements.
Under defined benefit pension plan accounting, defined benefit pension plan expense and prepaid and accrued pension costs are each recognized based on certain actuarial assumptions, principally the assumed discount rate, the assumed long-term rate of return on plan assets and the assumed increase in future compensation levels. We recognize the full funded status of our defined benefit pension plans as either an asset (for overfunded plans) or a liability (for underfunded plans) in our Consolidated Balance Sheet.
We recognized consolidated defined benefit pension plan income of $.6 million in 2013 and pension plan expense of $.1 million in 2014 and $.4 million in 2015. The funding requirements for these defined benefit pension plans are generally based upon applicable regulations (such as ERISA in the U.S.) and will generally differ from pension expense recognized under GAAP for financial reporting purposes. We made contributions to all of our plans of approximately $1.5 million in 2013, $1.6 million in 2014, and $.8 million in 2015.
The discount rates we use for determining defined benefit pension expense and the related pension obligations are based on current interest rates earned on long-term bonds that receive one of the two highest ratings given by recognized rating agencies in the applicable country where the defined benefit pension benefits are being paid. In addition, we receive third-party advice about appropriate discount rates, and these advisors may in some cases use their own market indices. We adjust these discount rates as of each December 31 valuation date to reflect then-current interest rates on such long-term bonds. We use these discount rates to determine the actuarial present value of the pension obligations as of December 31 of that year. We also use these discount rates to determine the interest component of defined benefit pension expense for the following year.
At December 31, 2015, our projected benefit obligations for defined benefit plans comprised $47.9 million related to U.S. plans and $9.2 million for the U.K. plan, which is associated with a former disposed business. We use different discount rate assumptions in determining our defined benefit pension plan obligations and expense for the plans we maintain in the United States and the U.K. as the interest rate environment differs from country to country.
- 46 -
We used the following discount rates for our defined benefit pension plans:
|
|
Discount rates used for: |
||||||||||
|
|
Obligations at |
|
Obligations at |
|
Obligations at |
||||||
|
United States |
|
4.5% |
|
|
|
3.8% |
|
|
|
4.1% |
|
|
United Kingdom |
|
4.5% |
|
|
|
3.5% |
|
|
|
3.8% |
|
The assumed long-term rate of return on plan assets represents the estimated average rate of earnings expected to be earned on the funds invested or to be invested from the plans’ assets provided to fund the benefit payments inherent in the projected benefit obligations. Unlike the discount rate, which is adjusted each year based on changes in current long-term interest rates, the assumed long-term rate of return on plan assets will not necessarily change based upon the actual short-term performance of the plan assets in any given year. Defined benefit pension expense each year is based upon the assumed long-term rate of return on plan assets for each plan, the actual fair value of the plan assets as of the beginning of the year and an estimate of the amount of contributions to and distributions from the plan during the year. Differences between the expected return on plan assets for a given year and the actual return are deferred and amortized over future periods based either upon the expected average remaining service life of the active plan participants (for plans for which benefits are still being earned by active employees) or the average remaining life expectancy of the inactive participants (for plans in which benefits are not still being earned by active employees).
At December 31, 2015, approximately 76% of the plan assets related to plan assets for our plans in the U.S., with the remainder related to the United Kingdom plan. We use different long-term rates of return on plan asset assumptions for our U.S. and U.K. defined benefit pension plan expense because the respective plan assets are invested in a different mix of investments and the long-term rates of return for different investments differ from country to country.
In determining the expected long-term rate of return on plan asset assumptions, we consider the long-term asset mix (e.g. equity vs. fixed income) for the assets for each of our plans and the expected long-term rates of return for such asset components. In addition, we receive third-party advice about appropriate long-term rates of return. The assets of our U.S. plan are invested in the Combined Master Retirement Trust (CMRT), a collective investment trust sponsored by Contran to permit the collective investment by certain master trusts which fund certain employee benefits sponsored by Contran and certain of its affiliates, including us. Such assumed asset mixes are discussed in Note 14 to our Consolidated Financial Statements.
Our pension plan weighted average asset allocations by asset category were as follows:
|
|
December 31, |
||||||
|
|
2014 |
|
2015 |
||||
|
Equity securities and limited partnerships |
|
66 |
% |
|
|
56 |
% |
|
Fixed income securities |
|
32 |
|
|
|
38 |
|
|
Other |
|
2 |
|
|
|
6 |
|
|
Total |
|
100 |
% |
|
|
100 |
% |
We regularly review our actual asset allocation for our U.K. plan, and will periodically rebalance the investments in the plan to more accurately reflect the targeted allocation. The CMRT trustee and investment committee do not maintain a specific target asset allocation in order to achieve their objectives, but instead they periodically change the asset mix of the CMRT based upon, among other things, advice they receive from third-party advisors and their expectations regarding potential returns for various investment alternatives and what asset mix will generate the greatest overall return.
- 47 -
Our assumed long-term rates of return on plan assets for 2013, 2014 and 2015 were as follows:
|
|
2013 |
|
2014 |
|
2015 |
||||||
|
United States |
|
10.0 |
% |
|
|
7.5 |
% |
|
|
7.5 |
% |
|
United Kingdom |
|
5.8 |
% |
|
|
6.0 |
% |
|
|
6.0 |
% |
We currently expect to use the same long-term rate of return on plan asset assumptions in 2016 as we used in 2015 for purposes of determining the 2016 defined benefit pension plan expense.
To the extent that a plan’s particular pension benefit formula calculates the pension benefit in whole or in part based upon future compensation levels, the projected benefit obligations and the pension expense would be based in part upon expected increases in future compensation levels. However, we have no active employees participating in our defined benefit pension plans. Such plans are closed to additional participants and assumptions regarding future compensation levels are not applicable for our plans.
In addition to the actuarial assumptions discussed above, because we maintain a defined benefit pension plan in the U.K., the amount of recognized defined benefit pension expense and the amount of net pension asset and net pension liability will vary based upon relative changes in currency exchange rates.
A reduction in the assumed discount rate generally results in an actuarial loss, as the actuarially-determined present value of estimated future benefit payments will increase. Conversely, an increase in the assumed discount rate generally results in an actuarial gain. In addition, an actual return on plan assets for a given year that is greater than the assumed return on plan assets results in an actuarial gain, while an actual return on plan assets that is less than the assumed return results in an actuarial loss. Other actual outcomes that differ from previous assumptions, such as individuals living longer or shorter than assumed in mortality tables, which are also used to determine the actuarially-determined present value of estimated future benefit payments, changes in such mortality tables themselves or plan amendments, will also result in actuarial losses or gains. These amounts are recognized in other comprehensive income. In addition, any actuarial gains generated in future periods would reduce the negative amortization effect included in earnings of any cumulative unrecognized actuarial losses, while any actuarial losses generated in future periods would reduce the favorable amortization effect included in earnings of any cumulative unrecognized actuarial gains.
During 2015, all of our defined benefit pension plans generated a combined net actuarial loss of approximately $2.4 million. This actuarial loss resulted primarily due to the actual 2015 return on plan assets being lower than the expected return, partially offset by the favorable impact of increases in discount rates from December 31, 2014 to December 31, 2015.
Based on the actuarial assumptions described above and our current expectation for what actual average currency exchange rates will be during 2016, we expect to recognize defined benefit pension expense of approximately $.9 million in 2016. In comparison, we expect to be required to contribute approximately $.7 million to such plans during 2016.
As noted above, defined benefit pension expense and the amounts recognized as accrued pension costs are based upon the actuarial assumptions discussed above. We believe that all of the actuarial assumptions used are reasonable and appropriate. However, if we had lowered the assumed discount rate by 25 basis points for all of our plans as of December 31, 2015, our aggregate projected benefit obligations would have increased by approximately $1.3 million at that date. Such a change would not materially impact our defined benefit pension expense for 2015. Similarly, if we lowered the assumed long-term rate of return on plan assets by 25 basis points for all of our plans, such a change would not materially impact our defined benefit pension expense for 2015.
OPEB plans - We provide certain health care and life insurance benefits for eligible retired employees in the U.S. Under other postretirement employee benefits (OPEB) accounting, OPEB expense and accrued OPEB costs are based on certain actuarial assumptions, principally the assumed discount rate and the assumed rate of increases in future health care costs. We recognize the full unfunded status of our OPEB plans as a liability. See
- 48 -
Note 14 to our Consolidated Financial Statements for a discussion of the consolidated OPEB cost we recognized during the last three years, the amount of our accrued OPEB costs and the associated actuarial assumptions utilized.
Based on such actuarial assumptions and amended benefit formula, we expect to recognize consolidated OPEB income of approximately $.6 million in 2016. In comparison, we expect to be required to make approximately $.5 million of contributions during 2016.
We believe that all of the actuarial assumptions used are reasonable and appropriate. If we had lowered the assumed discount rate by 25 basis points for all of our OPEB plans as of December 31, 2015, our aggregate projected benefit obligations would not materially impact our OPEB costs. Similarly, a one percent assumed change in health care trend rates would not materially impact our OPEB costs.
Non-U.S. Operations
Kronos - Kronos has substantial operations located outside the United States (principally Europe and Canada) for which the functional currency is not the U.S. dollar. As a result, the reported amount of our net investment in Kronos will fluctuate based upon changes in currency exchange rates. At December 31, 2015, Kronos had substantial net assets denominated in the euro, Canadian dollar and Norwegian krone.
LIQUIDITY AND CAPITAL RESOURCES
Consolidated cash flows
Operating activities
Trends in cash flows from operating activities, excluding the impact of deferred taxes and relative changes in assets and liabilities, are generally similar to trends in our income (loss) from operations.
Changes in working capital are primarily related to changes in receivables and inventories (as discussed below) and payables and accrued liabilities.
Net cash provided by operating activities was $28.1 million in 2015 compared to $23.6 million in 2014. The $4.5 million net increase in cash provided by operating activities includes the net effects of:
|
|
· |
lower amount of net cash used for relative changes in receivables (excluding insurance recoveries), inventories, payables and accrued liabilities in 2015 of $1.2 million, |
|
|
· |
lower cash paid for environmental remediation and related costs in 2015 of $8.9 million, and |
|
|
· |
lower cash received for insurance recoveries in 2015 of $8.0 million. |
Net cash provided by operating activities was $23.6 million in 2014 compared to $14.9 million in 2013. The $8.7 million net increase in cash provided by operating activities includes the net effects of:
|
|
· |
higher income from operations attributable to CompX of $4.3 million, |
|
|
· |
lower amount of net cash used for relative changes in receivables (excluding insurance recoveries), inventories, payables and accrued liabilities in 2014 of $4.4 million, primarily related to relatively higher accounts receivable and inventory balances in 2014 (as discussed below), |
|
|
· |
higher cash paid for environmental remediation and related costs in 2014 of $6.8 million, and |
|
|
· |
higher cash received for insurance recoveries in 2014 of $3.9 million. |
We do not have complete access to CompX’s cash flows in part because we do not own 100% of CompX. A detail of our consolidated cash flows from operating activities is presented in the table below. Intercompany dividends have been eliminated. The reference to NL Parent in the tables below is a reference to NL Industries, Inc., as the parent company of CompX and our other wholly-owned subsidiaries.
- 49 -
|
Years ended December 31, |
|||||||||||
|
|
2013 |
|
2014 |
|
2015 |
||||||
|
|
(In millions) |
||||||||||
|
Net cash provided by (used in) operating activities: |
|
|
|
|
|
|
|
|
|
|
|
|
CompX |
$ |
(4.1 |
) |
|
$ |
12.2 |
|
|
$ |
13.5 |
|
|
NL Parent and wholly-owned subsidiaries |
|
22.0 |
|
|
|
13.5 |
|
|
|
16.8 |
|
|
Eliminations |
|
(3.0 |
) |
|
|
(2.1 |
) |
|
|
(2.2 |
) |
|
Total |
$ |
14.9 |
|
|
$ |
23.6 |
|
|
$ |
28.1 |
|
Relative changes in working capital can have a significant effect on cash flows from operating activities. As shown below, our total average days sales outstanding decreased from December 31, 2014 to December 31, 2015 primarily as a result of the timing of sales and collections in the last month of 2015 compared to 2014. As shown below, our average number of days in inventory returned to more normal levels at December 31, 2015 following the intentional fourth quarter inventory build up at the end of 2014, in anticipation of elevated sales in early 2015. For comparative purposes, we have provided 2013 numbers below.
|
|
2013 |
|
|
2014 |
|
|
2015 |
|
|||
|
Days sales outstanding |
|
35 days |
|
|
|
32 days |
|
|
|
31 days |
|
|
Days in inventory |
|
76 days |
|
|
|
90 days |
|
|
|
76 days |
|
Investing activities
Net cash provided by investing activities totaled $3.0 million in 2013. Net cash used in investing activities totaled $3.3 million in 2014 and $3.9 million in 2015. Capital expenditures, substantially all of which relate to CompX, have primarily emphasized improving our manufacturing facilities and investing in manufacturing equipment, utilizing new technologies and increased automation of the manufacturing process, to provide for increased productivity and efficiency in order to meet expected customer demand and properly maintain our facilities and technology infrastructure. Capital expenditures were $3.5 million in 2013, $2.9 million in 2014 and $4.3 million in 2015. Capital expenditures of approximately $.8 million in 2013 and $.5 million in 2014 relate to the implementation of a new manufacturing and accounting system for CompX’s Security Products business and Marine Components business that was implemented in January 2014.
Other than capital expenditures, the significant items impacting investing activities for the noted periods are as follows:
During 2013:
|
|
· |
we collected $3.0 million in principal payments on a note receivable, |
|
|
· |
we received $1.6 million in net proceeds from the sale of assets held for sale, and |
|
|
· |
we reduced restricted cash by $2.0 million due to lower requirements for us to maintain such restricted cash balances in connection with our environmental remediation activities. |
Financing activities
Net cash used in financing activities totaled $43.3 million in 2013 and $.3 million in each of 2014 and 2015.
During 2013, we paid a regular quarterly dividend to stockholders of $.125 per share ($24.3 million in total). In February 2014, our Board of Directors deferred consideration of a first quarter 2014 cash dividend and no dividend was paid in the first quarter. In May 2014, after considering our results of operations, financial conditions and cash requirements for our businesses, our Board of Directors suspended our regular quarterly dividend. The declaration and payment of future dividends, and the amount thereof, is discretionary and is dependent upon these and other factors deemed relevant by our Board of Directors. The amount and timing of past dividends is not necessarily indicative of the amount or timing of any future dividends which might be paid. There are currently no contractual restrictions on the amount of dividends which we may pay. Distributions to noncontrolling interests consist of CompX dividends paid to shareholders other than us.
- 50 -
During 2013, CompX made $18.5 million repayments on its outstanding long-term debt, including the July 2013 prepayment of the remaining outstanding principal balance plus accrued interest without penalty.
Outstanding debt obligations
At December 31, 2015, NL and CompX did not have any outstanding debt obligations.
Kronos’ North American and European revolvers and its term loan contain a number of covenants and restrictions which, among other things, restrict its ability to incur additional debt, incur liens, pay dividends or merge or consolidate with, or sell or transfer substantially all of our assets to, another entity, and contains other provisions and restrictive covenants customary in lending transactions of this type. Certain of Kronos’ credit agreements contain provisions which could result in the acceleration of indebtedness prior to their stated maturity for reasons other than defaults for failure to comply with typical financial or payment covenants. For example, certain credit agreements allow the lender to accelerate the maturity of the indebtedness upon a change of control (as defined in the agreement) of the borrower. In addition, certain credit agreements could result in the acceleration of all or a portion of the indebtedness following a sale of assets outside the ordinary course of business. Kronos’ European revolving credit facility also requires the maintenance of certain financial ratios, and one of such requirements is based on the ratio of net debt to the last twelve months EBITDA of the borrowers. Kronos is in compliance with all of its debt covenants at December 31, 2015. Kronos believes that it will be able to continue to comply with the financial covenants contained in its credit facilities through their maturity.
Liquidity
Our primary source of liquidity on an ongoing basis is our cash flow from operating activities and credit facilities with affiliates and banks as further discussed below. We generally use these amounts to fund capital expenditures (substantially all of which relate to CompX), pay ongoing environmental remediation and litigation costs, and provide for the payment of dividends (if declared).
At December 31, 2015, we had aggregate cash, cash equivalents and restricted cash of $101.0 million, substantially all of which was held in the U.S. A detail (in millions) by entity is presented in the table below.
|
CompX |
$ |
52.3 |
|
|
NL Parent and wholly-owned subsidiaries |
|
48.7 |
|
|
Total |
$ |
101.0 |
|
In addition, at December 31, 2015 we owned 14.4 million shares of Valhi common stock with an aggregate market value of $19.3 million. See Note 5 to our Consolidated Financial Statements. We also owned 35.2 million shares of Kronos common stock at December 31, 2015 with an aggregate market value of $198.6 million. See Note 6 to our Consolidated Financial Statements.
We routinely compare our liquidity requirements and alternative uses of capital against the estimated future cash flows we expect to receive from our subsidiaries and affiliates. As a result of this process, we have in the past and may in the future seek to raise additional capital, incur debt, repurchase indebtedness in the market or otherwise, modify our dividend policies, consider the sale of our interests in our subsidiaries, affiliates, business, marketable securities or other assets, or take a combination of these and other steps, to increase liquidity, reduce indebtedness and fund future activities. Such activities have in the past and may in the future involve related companies.
We periodically evaluate acquisitions of interests in or combinations with companies (including related companies) perceived by management to be undervalued in the marketplace. These companies may or may not be engaged in businesses related to our current businesses. We intend to consider such acquisition activities in the future and, in connection with this activity, may consider issuing additional equity securities and increasing indebtedness. From time to time, we also evaluate the restructuring of ownership interests among our respective subsidiaries and related companies.
- 51 -
Based upon our expectations of our operating performance, and the anticipated demands on our cash resources we expect to have sufficient liquidity to meet our short-term obligations (defined as the twelve-month period ending December 31, 2016). If actual developments differ materially from our expectations, our liquidity could be adversely affected. In this regard, Valhi has agreed to loan us up to $40 million on a revolving basis. At December 31, 2015, we had no outstanding borrowings under this facility, and the full $40 million was available for future borrowing. The amount of any such outstanding loan Valhi would make to us is at Valhi’s discretion. We currently do not expect to be required to borrow any material amounts from Valhi during 2016 under this facility.
Capital expenditures
Capital expenditures for 2016 are estimated at approximately $4.4 million, substantially all of which relate to CompX. Capital spending for 2016 is expected to be funded through cash on hand and cash generated from operations.
Dividends
Because our operations are conducted primarily through subsidiaries and affiliates, our long-term ability to meet parent company-level corporate obligations is largely dependent on the receipt of dividends or other distributions from our subsidiaries and affiliates. A detail of annual dividends we expect to receive from our subsidiaries and affiliates in 2016, based on the number of shares of common stock of these affiliates we own as of December 31, 2015 and their current regular quarterly dividend rate, is presented in the table below.
|
|
Shares held at |
|
Quarterly |
|
Annual expected |
||||||
|
|
(In millions) |
|
|
|
|
(In millions) |
|||||
|
Kronos |
|
35.2 |
|
|
$ |
.15 |
|
|
$ |
21.1 |
|
|
CompX |
|
10.8 |
|
|
|
.05 |
|
|
|
2.2 |
|
|
Valhi |
|
14.4 |
|
|
|
.02 |
|
|
|
1.1 |
|
|
Total expected annual dividends |
|
|
|
|
|
|
|
|
$ |
24.4 |
|
Investments in our subsidiaries and affiliates and other acquisitions
We have in the past and may in the future, purchase the securities of our subsidiaries and affiliates or third-parties in market or privately-negotiated transactions. We base our purchase decisions on a variety of factors, including an analysis of the optimal use of our capital, taking into account the market value of the securities and the relative value of expected returns on alternative investments. In connection with these activities, we may consider issuing additional equity securities or increasing our indebtedness. We may also evaluate the restructuring of ownership interests of our businesses among our subsidiaries and related companies.
Summary of other contractual commitments
As more fully described in the notes to our Consolidated Financial Statements, we are party to various leases and other agreements which contractually and unconditionally commit us to pay certain amounts in the future. See Notes 17 to our Consolidated Financial Statements. The following table summarizes our contractual commitments as of December 31, 2015 by the type and date of payment.
|
|
|
Payment due date |
||||||||||||||||||
|
Contractual commitment |
|
2016 |
|
2017/2018 |
|
2019/2020 |
|
2021 |
|
Total |
||||||||||
|
|
|
(In millions) |
||||||||||||||||||
|
Operating leases |
|
$ |
.2 |
|
|
$ |
.3 |
|
|
$ |
.3 |
|
|
$ |
.8 |
|
|
$ |
1.6 |
|
|
Purchase obligations |
|
|
9.8 |
|
|
|
.1 |
|
|
|
- |
|
|
|
- |
|
|
|
9.9 |
|
|
Fixed asset acquisitions |
|
|
.4 |
|
|
|
- |
|
|
|
- |
|
|
|
- |
|
|
|
.4 |
|
|
|
|
$ |
10.4 |
|
|
$ |
.4 |
|
|
$ |
.3 |
|
|
$ |
.8 |
|
|
$ |
11.9 |
|
- 52 -
The amount shown for our commitments related to operating leases and fixed asset acquisitions are based upon the contractual payment amount and the contractual payment date for such commitments. The timing and amount shown for raw material and other purchase obligations, which consist of all open purchase orders and contractual obligations (primarily commitments to purchase raw materials) is also based on the contractual payment amount and the contractual payment date for such commitments. Fixed asset acquisitions include firm purchase commitments for capital projects.
The above table does not reflect any amounts that we might pay to fund our defined benefit pension and OPEB plans, as the timing and amount of any such future fundings are unknown and dependent on, among other things, the future performance of defined benefit pension plan assets, interest rate assumptions and actual future retiree medical costs. We expect to fund an aggregate of $1.2 million to our defined benefit pension and OPEB plans during 2016, as discussed in further detail above.
The above table also does not reflect any amounts that we might pay to settle any of our uncertain tax positions, as the timing and amount of any such future settlements are unknown and dependent on, among other things, the timing of tax audits. See Note 13 to our Consolidated Financial Statements.
Commitments and contingencies
We are subject to certain commitments and contingencies, as more fully described in Note 17 to our Consolidated Financial Statements or in Part I, Item 3 of this report. In addition to those legal proceedings described in Note 17 to our Consolidated Financial Statements, various legislation and administrative regulations have, from time to time, been proposed that seek to (i) impose various obligations on present and former manufacturers of lead pigment and lead-based paint (including us) with respect to asserted health concerns associated with the use of such products and (ii) effectively overturn court decisions in which we and other pigment manufacturers have been successful. Examples of such proposed legislation include bills which would permit civil liability for damages on the basis of market share, rather than requiring plaintiffs to prove that the defendant’s product caused the alleged damage and bills which would revive actions barred by the statute of limitations. While no legislation or regulations have been enacted to date that are expected to have a material adverse effect on our consolidated financial position, results of operations or liquidity, enactment of such legislation could have such an effect.
Off balance sheet financing arrangements
Other than operating lease commitments disclosed in Note 17 to our Consolidated Financial Statements, we are not party to any material off-balance sheet financing arrangements.
|
ITEM 7A. |
QUANTITATIVE AND QUALITATIVE DISCLOSURES ABOUT MARKET RISK |
General - We are exposed to market risk from changes in currency exchange rates, interest rates, raw materials and equity security prices.
Marketable security prices - We are exposed to market risk due to changes in prices of the marketable securities which we own. The fair value of our equity securities at December 31, 2014 and 2015 was $92.1 million and $19.3 million, respectively. The potential change in the aggregate fair value of these investments, assuming a 10% change in prices, would be $9.2 million and $1.9 million at December 31, 2014 and 2015, respectively.
Raw materials - CompX will occasionally enter into short-term raw material arrangements to mitigate the impact of future increases in raw material costs. Otherwise, we generally do not have long-term supply agreements for our raw material requirements because either we believe the risk of unavailability of those raw materials is low and we believe the price to be stable or because long-term supply agreements for those materials are generally not available. We do not engage in commodity hedging programs.
Other - The above discussion and sensitivity analysis presented above include forward-looking statements of market risk which assume hypothetical changes in market prices. Actual future market conditions will likely differ materially from such assumptions. Accordingly, such forward-looking statements should not be considered to
- 53 -
be projections of future events, gains or losses. Such forward-looking statements are subject to certain risks and uncertainties some of which are listed in “Business."
|
ITEM 8. |
FINANCIAL STATEMENTS AND SUPPLEMENTARY DATA |
The information called for by this Item is contained in a separate section of this Annual Report. See “Index of Financial Statements” (page F-1).
|
ITEM 9. |
CHANGES IN AND DISAGREEMENTS WITH ACCOUNTANTS ON ACCOUNTING AND FINANCIAL DISCLOSURE |
None
|
ITEM 9A. |
CONTROLS AND PROCEDURES |
Evaluation of disclosure controls and procedures
We maintain disclosure controls and procedures which, as defined in Exchange Act Rule 13a-15(e), means controls and other procedures that are designed to ensure that information required to be disclosed in the reports that we file or submit to the SEC under the Securities Exchange Act of 1934, as amended (the Act), is recorded, processed, summarized and reported, within the time periods specified in the SEC’s rules and forms. Disclosure controls and procedures include, without limitation, controls and procedures designed to ensure that information we are required to disclose in the reports we file or submit to the SEC under the Act is accumulated and communicated to our management, including our principal executive officer and our principal financial officer, or persons performing similar functions, as appropriate to allow timely decisions to be made regarding required disclosure. Each of Robert D. Graham, our Vice Chairman of the Board, President and Chief Executive Officer and Gregory M. Swalwell, our Executive Vice President and Chief Financial Officer, have evaluated the design and effectiveness of our disclosure controls and procedures as of December 31, 2015. Based upon their evaluation, these executive officers have concluded that our disclosure controls and procedures are effective as of the date of this evaluation.
Management’s report on internal control over financial reporting
Our management is responsible for establishing and maintaining adequate internal control over financial reporting which, as defined by Exchange Act Rule 13a-15(f) means a process designed by, or under the supervision of, our principal executive and principal financial officers, or persons performing similar functions, and effected by the board of directors, management and other personnel, to provide reasonable assurance regarding the reliability of financial reporting and the preparation of financial statements for external purposes in accordance with generally accepted accounting principles, and includes those policies and procedures that:
|
|
● |
pertain to the maintenance of records that in reasonable detail accurately and fairly reflect the transactions and dispositions of our assets, |
|
|
● |
provide reasonable assurance that transactions are recorded as necessary to permit preparation of financial statements in accordance with GAAP, and that receipts and expenditures are being made only in accordance with authorizations of management and directors and |
|
|
● |
provide reasonable assurance regarding prevention or timely detection of an unauthorized acquisition, use or disposition of assets that could have a material effect on our Consolidated Financial Statements. |
Our evaluation of the effectiveness of internal control over financial reporting is based upon the framework established in Internal Control – Integrated Framework issued by the Committee of Sponsoring Organizations of the Treadway Commission in 2013 (commonly referred to as the “2013 COSO” framework). Based on our evaluation under that framework, we have concluded that our internal control over financial reporting was effective as of December 31, 2015.
PricewaterhouseCoopers LLP, the independent registered public accounting firm that has audited our consolidated financial statements included in this Annual Report, has audited the effectiveness of our internal
- 54 -
control over financial reporting as of December 31, 2015, as stated in their report, which is included in the Annual Report on Form 10-K.
As permitted by the SEC, our assessment of internal control over financial reporting excludes (i) internal control over financial reporting of equity method investees and (ii) internal control over the preparation of any financial statement schedules which would be required by Article 12 of Regulation S-X. However, our assessment of internal control over financial reporting with respect to equity method investees did include controls over the recording of amounts related to our investment that are recorded in the consolidated financial statements, including controls over the selection of accounting methods for our investments, the recognition of equity method earnings and losses and the determination, valuation and recording of our investment account balances.
Changes in internal control over financial reporting
There have been no changes to our internal control over financial reporting during the quarter ended December 31, 2015 that has materially affected, or is reasonably likely to materially affect, our internal control over financial reporting.
Certifications
Our chief executive officer is required to annually file a certification with the New York Stock Exchange (NYSE), certifying our compliance with the corporate governance listing standards of the NYSE. During 2015, our chief executive officer filed such annual certification with the NYSE. The 2015 certification was unqualified.
Our chief executive officer and chief financial officer are also required to, among other things, quarterly file certifications with the SEC regarding the quality of our public disclosures, as required by Section 302 of the Sarbanes-Oxley Act of 2002. We have filed the certifications for the quarter ended December 31, 2015 as Exhibits 31.1 and 31.2 to this Annual Report on Form 10-K.
|
ITEM 9B. |
OTHER INFORMATION |
Not applicable
- 55 -
|
ITEM 10. |
DIRECTORS, EXECUTIVE OFFICERS AND CORPORATE GOVERNANCE |
The information required by this Item is incorporated by reference to our 2016 definitive proxy statement to be filed with the SEC pursuant to Regulation 14A within 120 days after the end of the fiscal year covered by this report.
|
ITEM 11. |
EXECUTIVE COMPENSATION |
The information required by this Item is incorporated by reference to our 2016 proxy statement.
|
ITEM 12. |
SECURITY OWNERSHIP OF CERTAIN BENEFICIAL OWNERS AND MANAGEMENT AND RELATED STOCKHOLDER MATTERS |
The information required by this Item is incorporated by reference to our 2016 proxy statement.
|
ITEM 13. |
CERTAIN RELATIONSHIPS AND RELATED TRANSACTIONS, AND DIRECTOR INDEPENDENCE |
The information required by this Item is incorporated by reference to our 2016 proxy statement. See also Note 15 to our Consolidated Financial Statements.
|
ITEM 14. |
PRINCIPAL ACCOUNTING FEES AND SERVICES |
The Information required by this Item is incorporated by reference to our 2016 proxy statement.
PART IV
|
ITEM 15. |
EXHIBITS AND FINANCIAL STATEMENT SCHEDULES |
(a) and (c) Financial Statements
The Registrant
The consolidated financial statements of the Registrant listed on the accompanying Index of Financial Statements (see page F-1) are filed as part of this Annual Report.
50%-or-less persons
The consolidated financial statements of Kronos (30%-owned at December 31, 2015) are incorporated by reference in Exhibit 99.1 of this Annual Report pursuant to Rule 3-09 of Regulation S-X. Management’s Report on Internal Control Over Financial Reporting of Kronos is not included as part of Exhibit 99.1. The Registrant is not required to provide any other consolidated financial statements pursuant to Rule 3-09 of Regulation S-X.
(b)Exhibits
We have included as exhibits the items listed in the Exhibit Index. We will furnish a copy of any of the exhibits listed below upon payment of $4.00 per exhibit to cover our cost to furnish the exhibits. Pursuant to Item 601(b)(4)(iii) of Regulation S-K, any instrument defining the rights of holders of long-term debt issues and other agreements related to indebtedness which do not exceed 10% of consolidated total assets as of December 31, 2015 will be furnished to the Commission upon request.
- 56 -
|
|
Exhibit Index |
|
|
|
3.1 |
|
Certificate of Amended and Restated Certificate of Incorporation dated May 22, 2008 - incorporated by reference to Exhibit 1 to the Registrant’s Proxy Statement on Schedule 14A (File No. 001-00640) for the annual meeting held on May 21, 2008. |
|
|
3.2 |
|
Amended and Restated Bylaws of NL Industries, Inc. as of May 23, 2008 - incorporated by reference to Exhibit 3.1 of the Registrant’s Current Report on Form 8-K (File No. 001-00640) filed with the U.S. Securities and Exchange Commission on May 23, 2008. |
|
|
10.1 |
|
Lease Contract dated June 21, 1952, between Farbenfabriken Bayer Aktiengesellschaft and Titangesellschaft mit beschrankter Haftung (German language version and English translation thereof) - incorporated by reference to Exhibit 10.14 to the Registrant’s Annual Report on Form 10-K (File No. 001-00640) for the year ended December 31, 1985. |
|
|
10.2 |
|
Formation Agreement dated as of October 18, 1993 among Tioxide Americas Inc., Kronos Louisiana, Inc. and Louisiana Pigment Company, L.P. - incorporated by reference to Exhibit 10.2 to the Registrant’s Quarterly Report on Form 10-Q (File No. 001-00640) for the quarter ended September 30, 1993. |
|
|
10.3 |
|
Joint Venture Agreement dated as of October 18, 1993 between Tioxide Americas Inc. and Kronos Louisiana, Inc. - incorporated by reference to Exhibit 10.3 to the Registrant’s Quarterly Report on Form 10-Q (File No. 001-00640) for the quarter ended September 30, 1993. |
|
|
10.4 |
|
Kronos Offtake Agreement dated as of October 18, 1993 between Kronos Louisiana, Inc. and Louisiana Pigment Company, L.P. - incorporated by reference to Exhibit 10.4 to the Registrant’s Quarterly Report on Form 10-Q (File No. 001-00640) for the quarter ended September 30, 1993. |
|
|
10.5 |
|
Amendment No. 1 to Kronos Offtake Agreement dated as of December 20, 1995 between Kronos Louisiana, Inc. and Louisiana Pigment Company, L.P. - incorporated by reference to Exhibit 10.22 to the Registrant’s Annual Report on Form 10-K (File No. 001-00640) for the year ended December 31, 1995. |
|
|
10.6 |
|
Tioxide Americas Offtake Agreement dated as of October 18, 1993 between Tioxide Americas Inc. and Louisiana Pigment Company, L.P. - incorporated by reference to Exhibit 10.5 to the Registrant’s Quarterly Report on Form 10-Q (File No. 001-00640) for the quarter ended September 30, 1993. |
|
|
10.7 |
|
Amendment No. 1 to Tioxide Americas Offtake Agreement dated as of December 20, 1995 between Tioxide Americas Inc. and Louisiana Pigment Company, L.P. - incorporated by reference to Exhibit 10.24 to the Registrant’s Annual Report on Form 10-K (File No. 001-00640) for the year ended December 31, 1995. |
|
|
10.8 |
|
Parents’ Undertaking dated as of October 18, 1993 between ICI American Holdings Inc. and Kronos Worldwide, Inc. (f/k/a Kronos, Inc.) - incorporated by reference to Exhibit 10.9 to the Registrant’s Quarterly Report on Form 10-Q (File No. 001-00640) for the quarter ended September 30, 1993. |
|
|
10.9 |
|
Allocation Agreement dated as of October 18, 1993 between Tioxide Americas Inc., ICI American Holdings, Inc., Kronos Worldwide, Inc. (f/k/a Kronos, Inc.). and Kronos Louisiana, Inc. - incorporated by reference to Exhibit 10.10 to the Registrant’s Quarterly Report on Form 10-Q (File No. 001-00640) for the quarter ended September 30, 1993. |
|
|
10.10 |
|
Form of Assignment and Assumption Agreement, dated as of January 1, 1999, between Kronos Inc. (formerly known as Kronos (USA), Inc.) and Kronos International, Inc. - incorporated by reference to Exhibit 10.9 to Kronos International, Inc.’s Registration Statement on Form S-4 (File No. 333-100047). |
|
|
10.11 |
|
Form of Cross License Agreement, effective as of January 1, 1999, between Kronos Inc. (formerly known as Kronos (USA), Inc.) and Kronos International, Inc. - incorporated by reference to Exhibit to Kronos International, Inc.’s Registration Statement on Form S-4 (File No. 333-100047). |
|
- 57 -
|
|
Exhibit Index |
|
|
|
10.12 |
|
Euro 80,000,000 Facility Agreement, dated June 25, 2002, among Kronos Titan GmbH & Co. OHG, Kronos Europe S.A./N.V., Kronos Titan A/S and Titania A/S, as borrowers, Kronos Titan GmbH & Co. OHG, Kronos Europe S.A./N.V. and Kronos Norge AS, as guarantors, Kronos Denmark ApS, as security provider, Deutsche Bank AG, as mandated lead arranger, Deutsche Bank Luxembourg S.A., as agent and security agent, and KBC Bank NV, as fronting bank, and the financial institutions listed in Schedule 1 thereto, as lenders - incorporated by reference to Exhibit 10.1 to the Quarterly Report on Form 10-Q of NL Industries, Inc. (File No. 001-00640) for the quarter ended June 30, 2002. |
|
|
10.13 |
|
First Amendment Agreement, dated September 3, 2004, Relating to a Facility Agreement dated June 25, 2002 among Kronos Titan GmbH, Kronos Europe S.A./N.V., Kronos Titan AS and Titania A/S, as borrowers, Kronos Titan GmbH, Kronos Europe S.A./N.V. and Kronos Norge AS, as guarantors, Kronos Denmark ApS, as security provider, with Deutsche Bank Luxembourg S.A., acting as agent - incorporated by reference to Exhibit 10.8 to the Registration Statement on Form S-1 of Kronos Worldwide, Inc. (File No. 333-119639). |
|
|
10.14 |
|
Second Amendment Agreement Relating to a Facility Agreement dated June 25, 2002 executed as of June 14, 2005 by and among Deutsche Bank AG, as mandated lead arranger, Deutsche Bank Luxembourg S.A. as agent, the participating lenders, Kronos Titan GmbH, Kronos Europe S.A./N.V, Kronos Titan AS, Kronos Norge AS, Titania AS and Kronos Denmark ApS - incorporated by reference to Exhibit 10.3 to the Annual report on Form 10-K (File No. 333-100047) of Kronos International, Inc. for the year ended December 31, 2009. |
|
|
10.15 |
|
Third Amendment Agreement Relating to a Facility Agreement dated June 25, 2002 executed as of May 26, 2008 by and among Deutsche Bank AG, as mandated lead arranger, Deutsche Bank Luxembourg S.A., as agent, the participating lenders, Kronos Titan GmbH, Kronos Europe S.A.,/N.V, Kronos Titan AS, Kronos Norge AS, Titania AS and Kronos Denmark ApS - incorporated by reference to Exhibit 10.4 to the Annual report on Form 10-K (File No. 333-100047) of Kronos International, Inc. for the year ended December 31, 2009. |
|
|
10.16 |
|
Fourth Amendment Agreement Relating to a Facility Agreement dated June 25, 2002 executed as of September 15, 2009 by and among Deutsche Bank AG, as mandated lead arranger, Deutsche Bank Luxembourg S.A., as agent, the participating lenders, Kronos Titan GmbH, Kronos Europe S.A./N.V., Kronos Titan AS, Kronos Norge AS, Titania AS and Kronos Denmark ApS - incorporated by reference to Exhibit 10.5 to the Annual report on Form 10-K (File No. 333-100047) of Kronos International, Inc. for the year ended December 31, 2009. |
|
|
10.17 |
|
Fifth Amendment Agreement Relating to a Facility Agreement dated June 25, 2002 executed as of October 28, 2010 by and among Deutsche Bank AG, as mandated lead arranger, Deutsche Bank Luxembourg S.A., as agent, the participating lenders, Kronos Titan GmbH, Kronos Europe S.A./N.V., Kronos Titan AS, Kronos Norge AS, Titania AS and Kronos Denmark ApS - incorporated by reference to Exhibit 10.1 to the Current Report on Form 8-K of Kronos International, Inc. dated October 28, 2010 (File No. 333-100047). |
|
|
10.18 |
|
Sixth Amendment Agreement Relating to a Facility Agreement dated June 25, 2002 executed as of September 27, 2012 by and among Deutsche Bank AG, as mandated lead arranger, Deutsche Bank Luxembourg S.A., as agent, the participating lenders, Kronos Titan GmbH, Kronos Europe S.A./N.V, Kronos Titan AS, Titania AS, Kronos Norge AS, and Kronos Denmark ApS - incorporated by reference to Exhibit 10.1 to the Kronos Worldwide, Inc. Current Report on Form 8-K (File No. 001-31763) filed with the U.S. Securities and Exchange Commission on October 3, 2012. |
|
|
10.19 |
|
Restated and Amended Agreement by and between Richards Bay Titanium (Proprietary) Limited (acting through its sales agent Rio Tinto Iron & Titanium Limited) and Kronos (US), Inc. effective January 1, 2016 - incorporated by reference to Exhibit 10.26 to the Annual Report on Form 10-K of Kronos Worldwide, Inc. (File No. 001-31763) for the year ended December 31, 2015. |
|
- 58 -
|
|
Exhibit Index |
|
|
|
10.20 |
|
Eighth Amended and Restated Unsecured Revolving Promissory Note dated December 31, 2015 in the original principal amount of $100.0 million executed by Valhi, Inc. and payable to the order of Kronos Worldwide, Inc. - incorporated by reference to Exhibit 10.25 to the Annual Report on Form 10-K of Kronos Worldwide, Inc. (File No. 001-31763) for the year ended December 31, 2015. |
|
|
10.21 |
|
Credit Agreement, dated June 13, 2012, by and among Kronos Worldwide, Inc. and Wells Fargo Bank, National Association - incorporated by reference to Exhibit 10.1 to the Kronos Worldwide, Inc. Current Report on Form 8-K (File No. 001-31763) dated June 13, 2012 and filed on June 18, 2012. |
|
|
10.22 |
|
Credit Agreement, dated February 18, 2014, by and among Kronos Worldwide, Inc. and Deutsche Bank AG New York Branch - incorporated by reference to Exhibit 10.1 to the Current Report on Form 8-K (File No. 001-31763) of Kronos Worldwide, Inc. dated February 18, 2014 and filed on February 18, 2014. |
|
|
10.23 |
|
First Amendment to Credit Agreement dated May 21, 2015 among the registrant, Deutsche Bank AG New York Branch, as Administrative Agent, and the lenders a party thereto – incorporated by reference to Exhibit 10.1 to the Current Report on Form 8-K dated May 21, 2015 filed by Kronos Worldwide, Inc. (File No. 1-31763) on May 21, 2015. |
|
|
10.24 |
|
Guaranty and Security Agreement, dated February 18, 2014, among Kronos Worldwide, Inc., Kronos Louisiana, Inc., Kronos (US), Inc., Kronos International, Inc. and Deutsche Bank AG New York Branch - incorporated by reference to Exhibit 10.2 to the Current Report on Form 8-K (File No. 001-31763) of Kronos Worldwide, Inc. dated February 18, 2014 and filed on February 18, 2014. |
|
|
10.25 |
|
Intercreditor Agreement dated as of February 18, 2014, by and between Wells Fargo Capital Finance and Deutsche Bank AG New York Branch, and acknowledged by Kronos Worldwide, Inc., Kronos Louisiana, Inc. and Kronos (US), Inc. - incorporated by reference to Exhibit 10.3 to the Current Report on Form 8-K (File No. 001-31763) of Kronos Worldwide, Inc. dated February 18, 2014 and filed on February 18, 2014. |
|
|
10.26 * |
|
Kronos Worldwide, Inc. 2012 Director Stock Plan - incorporated by reference to Exhibit 4.4 of Kronos Worldwide, Inc. Registration statement on Form S-8 (File No. 333-113425). Filed on May 31, 2012. |
|
|
10.27 * |
|
CompX International Inc. 2012 Director Stock Plan - incorporated by reference to Exhibit 10.2 of CompX International Inc.’s Annual Report on Form 10-K (File No. 001-00640) for the year ended December 31, 2012. |
|
|
10.28 * |
|
NL Industries, Inc. 2012 Director Stock Plan - incorporated by reference to Exhibit 4.4 of Registrant’s statement on Form S-8 (File No. 001-00640) Filed on May 31, 2012. |
|
|
10.29 ** |
|
First Amended and Restated Agreement Regarding Shared Insurance among CompX International Inc., Contran Corporation, Keystone Consolidated Industries, Inc., Kronos Worldwide, Inc., NL Industries, Inc. and Valhi, Inc. dated October 15, 2015. |
|
|
10.30 |
|
Intercorporate Services Agreement by and between Contran Corporation and Kronos Worldwide, Inc. - incorporated by reference to Exhibit 10.1 to the Kronos Worldwide, Inc. Quarterly Report on Form 10-Q (File No. 001-31763) for the quarter ended March 31, 2004. |
|
|
10.31 |
|
Intercorporate Services Agreement between CompX International Inc. and Contran Corporation effective as of January 1, 2004 - incorporated by reference to Exhibit 10.2 to the CompX International Inc. Annual Report on Form 10-K (File No. 1-13905) for the year ended December 31, 2003. |
|
|
10.32 |
|
Intercorporate Services Agreement by and between Contran Corporation and NL Industries, Inc. effective as of January 1, 2004 - incorporated by reference to Exhibit 10.1 to the NL Industries, Inc. Quarterly Report on Form 10-Q (File No. 001-00640) for the quarter ended March 31, 2004. |
|
- 59 -
|
|
Exhibit Index |
|
|
|
10.33 |
|
Amended and Restated Tax Agreement between Valhi, Inc. and Kronos Worldwide, Inc. - incorporated by reference to Exhibit 10.1 to the Annual Report on Form 10-K of Kronos Worldwide, Inc. (File No. 001-31763) for the year ended December 31, 2012. |
|
|
10.34 |
|
Amended and Restated Tax Agreement among NL Industries, Inc., Valhi, Inc. and Contran Corporation effective December 1, 2012 incorporated by reference to Exhibit 10.40 to the annual Report on Form 10-K (File No. 001-00640) of the Registrant for the year ended December 31, 2012. |
|
|
10.35 ** |
|
Sixth Amended and Restated Unsecured Revolving Demand Promissory Note dated December 31, 2015 in the original principal amount of $40.0 million executed by NL Industries, Inc. and payable to the order of Valhi, Inc. |
|
|
21.1 ** |
|
Subsidiaries of the Registrant. |
|
|
23.1 ** |
|
Consent of PricewaterhouseCoopers LLP with respect to NL’s consolidated financial statements. |
|
|
23.2 ** |
|
Consent of PricewaterhouseCoopers LLP with respect to Kronos’ consolidated financial statements. |
|
|
31.1 ** |
|
Certification |
|
|
31.2 ** |
|
Certification |
|
|
32.1 ** |
|
Certification |
|
|
99.1 |
|
Consolidated financial statements of Kronos Worldwide, Inc. - incorporated by reference to Kronos’ Annual Report on Form 10-K (File No. 1-31763) for the year ended December 31, 2015. |
|
|
101.INS ** |
|
XBRL Instance Document |
|
|
101.SCH ** |
|
XBRL Taxonomy Extension Schema |
|
|
101.CAL ** |
|
XBRL Taxonomy Extension Calculation Linkbase |
|
|
101.DEF ** |
|
XBRL Taxonomy Extension Definition Linkbase |
|
|
101.LAB ** |
|
XBRL Taxonomy Extension Label Linkbase |
|
|
101.PRE ** |
|
XBRL Taxonomy Extension Presentation Linkbase |
|
|
|
|
* |
Management contract, compensatory plan or arrangement. |
|
** |
Filed herewith |
- 60 -
Pursuant to the requirements of Section 13 or 15(d) of the Securities Exchange Act of 1934, the Registrant has duly caused this report to be signed on its behalf by the undersigned, thereunto duly authorized.
|
NL Industries, Inc. (Registrant) |
|
|
By: |
/s/ Robert D. Graham |
|
|
Robert D. Graham, March 10, 2016 |
|
|
(Vice Chairman, President and Chief Executive Officer) |
Pursuant to the requirements of the Securities Exchange Act of 1934, this report has been signed below by the following persons on behalf of the Registrant and in the capacities and on the dates indicated:
|
/s/ Steven L. Watson |
|
/s/ Robert D. Graham |
|
Steven L. Watson, March 10, 2016 |
|
Robert D. Graham, March 10, 2016 |
|
(Chairman of the Board) |
|
(Vice Chairman, President and Chief Executive Officer) |
|
/s/ Thomas P. Stafford |
|
/s/ C. H. Moore, Jr. |
|
Thomas P. Stafford, March 10, 2016 |
|
C. H. Moore, Jr., March 10, 2016 |
|
(Director) |
|
(Director) |
|
/s/ Loretta J. Feehan |
|
/s/ Terry N. Worrell |
|
Loretta J. Feehan, March 10, 2016 |
|
Terry N. Worrell, March 10, 2016 |
|
(Director) |
|
(Director) |
|
/s/ Tim C. Hafer |
|
/s/ Gregory M. Swalwell |
|
Tim C. Hafer, March 10, 2016 |
|
Gregory M. Swalwell, March 10, 2016 |
|
(Vice President and Controller, Principal Accounting Officer) |
|
(Executive Vice President and |
- 61 -
Annual Report on Form 10-K
Items 8, 15(a) and 15(c)
Index of Financial Statements
All financial statement schedules have been omitted either because they are not applicable or required, or the information that would be required to be included is disclosed in the Notes to the Consolidated Financial Statements.
F-1
REPORT OF INDEPENDENT REGISTERED PUBLIC ACCOUNTING FIRM
To the Stockholders and Board of Directors of NL Industries, Inc.:
In our opinion, the accompanying consolidated balance sheets and the related consolidated statements of operations, of comprehensive income (loss), of stockholders’ equity and of cash flows present fairly, in all material respects, the financial position of NL Industries, Inc. and its subsidiaries at December 31, 2014 and 2015, and the results of their operations and their cash flows for each of the three years in the period ended December 31, 2015 in conformity with accounting principles generally accepted in the United States of America. Also in our opinion, the Company maintained, in all material respects, effective internal control over financial reporting as of December 31, 2015, based on criteria established in Internal Control - Integrated Framework (2013) issued by the Committee of Sponsoring Organizations of the Treadway Commission (COSO). The Company’s management is responsible for these financial statements, for maintaining effective internal control over financial reporting and for its assessment of the effectiveness of internal control over financial reporting, included in Management’s Report on Internal Control over Financial Reporting appearing under Item 9A. Our responsibility is to express opinions on these financial statements and on the Company’s internal control over financial reporting based on our integrated audits. We conducted our audits in accordance with the standards of the Public Company Accounting Oversight Board (United States). Those standards require that we plan and perform the audits to obtain reasonable assurance about whether the financial statements are free of material misstatement and whether effective internal control over financial reporting was maintained in all material respects. Our audits of the financial statements included examining, on a test basis, evidence supporting the amounts and disclosures in the financial statements, assessing the accounting principles used and significant estimates made by management, and evaluating the overall financial statement presentation. Our audit of internal control over financial reporting included obtaining an understanding of internal control over financial reporting, assessing the risk that a material weakness exists, and testing and evaluating the design and operating effectiveness of internal control based on the assessed risk. Our audits also included performing such other procedures as we considered necessary in the circumstances. We believe that our audits provide a reasonable basis for our opinions.
As discussed in Note 19 to the consolidated financial statements, the Company changed the classification and presentation of deferred income taxes in 2015.
A company’s internal control over financial reporting is a process designed to provide reasonable assurance regarding the reliability of financial reporting and the preparation of financial statements for external purposes in accordance with generally accepted accounting principles. A company’s internal control over financial reporting includes those policies and procedures that (i) pertain to the maintenance of records that, in reasonable detail, accurately and fairly reflect the transactions and dispositions of the assets of the company; (ii) provide reasonable assurance that transactions are recorded as necessary to permit preparation of financial statements in accordance with generally accepted accounting principles, and that receipts and expenditures of the company are being made only in accordance with authorizations of management and directors of the company; and (iii) provide reasonable assurance regarding prevention or timely detection of unauthorized acquisition, use, or disposition of the company’s assets that could have a material effect on the financial statements.
Because of its inherent limitations, internal control over financial reporting may not prevent or detect misstatements. Also, projections of any evaluation of effectiveness to future periods are subject to the risk that controls may become inadequate because of changes in conditions, or that the degree of compliance with the policies or procedures may deteriorate.
/s/ PricewaterhouseCoopers LLP
Dallas, Texas
March 10, 2016
F-2
NL INDUSTRIES, INC. AND SUBSIDIARIES
(In thousands, except per share data)
|
|
December 31, |
|
|||||
|
|
2014 |
|
|
2015 |
|
||
|
ASSETS |
|
|
|
|
|
|
|
|
Current assets: |
|
|
|
|
|
|
|
|
Cash and cash equivalents |
$ |
72,560 |
|
|
$ |
96,462 |
|
|
Restricted cash and cash equivalents |
|
3,995 |
|
|
|
3,246 |
|
|
Accounts and other receivables, net |
|
9,256 |
|
|
|
8,977 |
|
|
Inventories, net |
|
16,863 |
|
|
|
15,098 |
|
|
Prepaid expenses and other |
|
792 |
|
|
|
981 |
|
|
|
|
|
|
|
|
|
|
|
Total current assets |
|
103,466 |
|
|
|
124,764 |
|
|
|
|
|
|
|
|
|
|
|
Other assets: |
|
|
|
|
|
|
|
|
Marketable securities |
|
92,131 |
|
|
|
19,260 |
|
|
Investment in Kronos Worldwide, Inc. |
|
237,719 |
|
|
|
140,695 |
|
|
Goodwill |
|
27,156 |
|
|
|
27,156 |
|
|
Other assets, net |
|
2,143 |
|
|
|
3,331 |
|
|
Deferred income taxes |
|
20 |
|
|
|
11 |
|
|
|
|
|
|
|
|
|
|
|
Total other assets |
|
359,169 |
|
|
|
190,453 |
|
|
|
|
|
|
|
|
|
|
|
Property and equipment: |
|
|
|
|
|
|
|
|
Land |
|
5,138 |
|
|
|
5,138 |
|
|
Buildings |
|
21,176 |
|
|
|
21,502 |
|
|
Equipment |
|
62,264 |
|
|
|
64,051 |
|
|
Construction in progress |
|
909 |
|
|
|
1,567 |
|
|
|
|
|
|
|
|
|
|
|
|
|
89,487 |
|
|
|
92,258 |
|
|
Less accumulated depreciation |
|
55,931 |
|
|
|
58,152 |
|
|
|
|
|
|
|
|
|
|
|
Net property and equipment |
|
33,556 |
|
|
|
34,106 |
|
|
|
|
|
|
|
|
|
|
|
Total assets |
$ |
496,191 |
|
|
$ |
349,323 |
|
F-3
NL INDUSTRIES, INC. AND SUBSIDIARIES
CONSOLIDATED BALANCE SHEETS (CONTINUED)
(In thousands, except per share data)
|
|
December 31, |
|
|||||
|
|
2014 |
|
|
2015 |
|
||
|
LIABILITIES AND STOCKHOLDERS' EQUITY |
|
|
|
|
|
|
|
|
Current liabilities: |
|
|
|
|
|
|
|
|
Accounts payable |
$ |
6,115 |
|
|
$ |
4,557 |
|
|
Accrued and other current liabilities |
|
10,862 |
|
|
|
10,558 |
|
|
Accrued environmental remediation and related costs |
|
6,984 |
|
|
|
8,668 |
|
|
Payable to affiliates |
|
659 |
|
|
|
220 |
|
|
Income taxes |
|
7 |
|
|
|
5 |
|
|
|
|
|
|
|
|
|
|
|
Total current liabilities |
|
24,627 |
|
|
|
24,008 |
|
|
|
|
|
|
|
|
|
|
|
Noncurrent liabilities: |
|
|
|
|
|
|
|
|
Accrued pension cost |
|
12,242 |
|
|
|
14,155 |
|
|
Accrued postretirement benefits (OPEB) costs |
|
3,341 |
|
|
|
2,773 |
|
|
Accrued environmental remediation and related costs |
|
103,031 |
|
|
|
104,465 |
|
|
Deferred income taxes |
|
83,158 |
|
|
|
25,035 |
|
|
Other |
|
18,342 |
|
|
|
13,636 |
|
|
|
|
|
|
|
|
|
|
|
Total noncurrent liabilities |
|
220,114 |
|
|
|
160,064 |
|
|
|
|
|
|
|
|
|
|
|
Equity: |
|
|
|
|
|
|
|
|
NL stockholders' equity: |
|
|
|
|
|
|
|
|
Preferred stock, no par value; 5,000 shares authorized; none issued |
|
- |
|
|
|
- |
|
|
Common stock, $.125 par value; 150,000 shares authorized; 48,674 and 48,692 shares issued and outstanding |
|
6,085 |
|
|
|
6,086 |
|
|
Additional paid-in capital |
|
300,388 |
|
|
|
300,543 |
|
|
Retained earnings |
|
112,588 |
|
|
|
88,679 |
|
|
Accumulated other comprehensive loss |
|
(182,039 |
) |
|
|
(245,358 |
) |
|
|
|
|
|
|
|
|
|
|
Total NL stockholders' equity |
|
237,022 |
|
|
|
149,950 |
|
|
|
|
|
|
|
|
|
|
|
Noncontrolling interest in subsidiary |
|
14,428 |
|
|
|
15,301 |
|
|
|
|
|
|
|
|
|
|
|
Total equity |
|
251,450 |
|
|
|
165,251 |
|
|
|
|
|
|
|
|
|
|
|
Total liabilities and equity |
$ |
496,191 |
|
|
$ |
349,323 |
|
Commitments and contingencies (Notes 13 and 17)
See accompanying notes to consolidated financial statements.
F-4
NL INDUSTRIES, INC. AND SUBSIDIARIES
CONSOLIDATED STATEMENTS OF OPERATIONS
(In thousands, except per share data)
|
|
Years ended December 31, |
|
|||||||||
|
|
2013 |
|
|
2014 |
|
|
2015 |
|
|||
|
|
|
|
|
|
|
|
|
|
|
|
|
|
Net sales |
$ |
92,045 |
|
|
$ |
103,846 |
|
|
$ |
108,994 |
|
|
Cost of sales |
|
64,471 |
|
|
|
71,598 |
|
|
|
75,593 |
|
|
|
|
|
|
|
|
|
|
|
|
|
|
|
Gross margin |
|
27,574 |
|
|
|
32,248 |
|
|
|
33,401 |
|
|
|
|
|
|
|
|
|
|
|
|
|
|
|
Selling, general and administrative expense |
|
18,246 |
|
|
|
18,641 |
|
|
|
19,430 |
|
|
Other operating income (expense): |
|
|
|
|
|
|
|
|
|
|
|
|
Insurance recoveries |
|
9,427 |
|
|
|
10,368 |
|
|
|
3,657 |
|
|
Other income, net |
|
29 |
|
|
|
186 |
|
|
|
120 |
|
|
Corporate expense |
|
(87,042 |
) |
|
|
(21,323 |
) |
|
|
(17,480 |
) |
|
|
|
|
|
|
|
|
|
|
|
|
|
|
Income (loss) from operations |
|
(68,258 |
) |
|
|
2,838 |
|
|
|
268 |
|
|
|
|
|
|
|
|
|
|
|
|
|
|
|
Equity in earnings (losses) of Kronos Worldwide, Inc. |
|
(31,007 |
) |
|
|
30,161 |
|
|
|
(52,770 |
) |
|
Other income (expense): |
|
|
|
|
|
|
|
|
|
|
|
|
Securities transactions, net |
|
11 |
|
|
|
16 |
|
|
|
3 |
|
|
Interest and dividends |
|
2,927 |
|
|
|
1,618 |
|
|
|
1,172 |
|
|
Interest expense |
|
(127 |
) |
|
|
- |
|
|
|
- |
|
|
|
|
|
|
|
|
|
|
|
|
|
|
|
Income (loss) before taxes |
|
(96,454 |
) |
|
|
34,633 |
|
|
|
(51,327 |
) |
|
|
|
|
|
|
|
|
|
|
|
|
|
|
Income tax expense (benefit) |
|
(41,911 |
) |
|
|
5,003 |
|
|
|
(28,611 |
) |
|
|
|
|
|
|
|
|
|
|
|
|
|
|
Net income (loss) |
|
(54,543 |
) |
|
|
29,630 |
|
|
|
(22,716 |
) |
|
Noncontrolling interest in net income of subsidiary |
|
790 |
|
|
|
1,131 |
|
|
|
1,193 |
|
|
|
|
|
|
|
|
|
|
|
|
|
|
|
Net income (loss) attributable to NL stockholders |
$ |
(55,333 |
) |
|
$ |
28,499 |
|
|
$ |
(23,909 |
) |
|
|
|
|
|
|
|
|
|
|
|
|
|
|
Amounts attributable to NL stockholders: |
|
|
|
|
|
|
|
|
|
|
|
|
|
|
|
|
|
|
|
|
|
|
|
|
|
Basic and diluted net income (loss) per share |
$ |
(1.14 |
) |
|
$ |
.59 |
|
|
$ |
(.49 |
) |
|
|
|
|
|
|
|
|
|
|
|
|
|
|
Cash dividends per share |
$ |
.50 |
|
|
$ |
- |
|
|
$ |
- |
|
|
|
|
|
|
|
|
|
|
|
|
|
|
|
Weighted average shares used in the calculation of net income (loss) per share |
|
48,672 |
|
|
|
48,679 |
|
|
|
48,688 |
|
See accompanying notes to consolidated financial statements.
F-5
NL INDUSTRIES, INC. AND SUBSIDIARIES
CONSOLIDATED STATEMENTS OF COMPREHENSIVE INCOME (LOSS)
(In thousands)
|
|
|
|
|
|
|
|
|
|
|
|
|
|
|
Years ended December 31, |
|
|||||||||
|
|
2013 |
|
|
2014 |
|
|
2015 |
|
|||
|
|
|
|
|
|
|
|
|
|
|
|
|
|
Net income (loss) |
$ |
(54,543 |
) |
|
$ |
29,630 |
|
|
$ |
(22,716 |
) |
|
|
|
|
|
|
|
|
|
|
|
|
|
|
Other comprehensive income (loss), net of tax: |
|
|
|
|
|
|
|
|
|
|
|
|
Marketable securities |
|
48,750 |
|
|
|
(107,057 |
) |
|
|
(46,917 |
) |
|
Currency translation |
|
1,349 |
|
|
|
(20,357 |
) |
|
|
(18,211 |
) |
|
Interest rate swap |
|
- |
|
|
|
- |
|
|
|
(445 |
) |
|
Defined benefit pension plans |
|
9,758 |
|
|
|
(18,616 |
) |
|
|
2,548 |
|
|
Other postretirement benefit plans |
|
380 |
|
|
|
(993 |
) |
|
|
(294 |
) |
|
|
|
|
|
|
|
|
|
|
|
|
|
|
Total other comprehensive income (loss), net |
|
60,237 |
|
|
|
(147,023 |
) |
|
|
(63,319 |
) |
|
|
|
|
|
|
|
|
|
|
|
|
|
|
Comprehensive income (loss) |
|
5,694 |
|
|
|
(117,393 |
) |
|
|
(86,035 |
) |
|
Comprehensive income attributable to noncontrolling interest |
|
790 |
|
|
|
1,131 |
|
|
|
1,193 |
|
|
|
|
|
|
|
|
|
|
|
|
|
|
|
Comprehensive income (loss) attributable to NL stockholders |
$ |
4,904 |
|
|
$ |
(118,524 |
) |
|
$ |
(87,228 |
) |
See accompanying notes to consolidated financial statements.
F-6
NL INDUSTRIES, INC. AND SUBSIDIARIES
CONSOLIDATED STATEMENTS OF STOCKHOLDERS’ EQUITY
Years ended December 31, 2013, 2014 and 2015
(In thousands, except per share data)
|
|
|
|
|
|
|
|
|
|
|
|
|
|
Accumulated |
|
|
|
|
|
|
|
|
|
|
|
|
|
|
|
|
Additional |
|
|
|
|
|
|
other |
|
|
Noncontrolling |
|
|
|
|
|
|||
|
|
Common |
|
|
paid-in |
|
|
Retained |
|
|
comprehensive |
|
|
interest in |
|
|
Total |
|
||||||
|
|
stock |
|
|
capital |
|
|
earnings |
|
|
loss |
|
|
subsidiary |
|
|
equity |
|
||||||
|
|
|
|
|||||||||||||||||||||
|
Balance at December 31, 2012 |
$ |
6,083 |
|
|
$ |
300,227 |
|
|
$ |
163,758 |
|
|
$ |
(95,253 |
) |
|
$ |
13,268 |
|
|
$ |
388,083 |
|
|
|
|
|
|
|
|
|
|
|
|
|
|
|
|
|
|
|
|
|
|
|
|
|
|
|
Net income (loss) |
|
- |
|
|
|
- |
|
|
|
(55,333 |
) |
|
|
- |
|
|
|
790 |
|
|
|
(54,543 |
) |
|
Other comprehensive income, net of tax |
|
- |
|
|
|
- |
|
|
|
- |
|
|
|
60,237 |
|
|
|
- |
|
|
|
60,237 |
|
|
Issuance of NL common stock |
|
1 |
|
|
|
58 |
|
|
|
- |
|
|
|
- |
|
|
|
- |
|
|
|
59 |
|
|
Cash dividends - $.50 per share |
|
- |
|
|
|
- |
|
|
|
(24,336 |
) |
|
|
- |
|
|
|
(451 |
) |
|
|
(24,787 |
) |
|
Other, net |
|
- |
|
|
|
(62 |
) |
|
|
- |
|
|
|
- |
|
|
|
8 |
|
|
|
(54 |
) |
|
|
|
|
|
|
|
|
|
|
|
|
|
|
|
|
|
|
|
|
|
|
|
|
|
|
Balance at December 31, 2013 |
|
6,084 |
|
|
|
300,223 |
|
|
|
84,089 |
|
|
|
(35,016 |
) |
|
|
13,615 |
|
|
|
368,995 |
|
|
|
|
|
|
|
|
|
|
|
|
|
|
|
|
|
|
|
|
|
|
|
|
|
|
|
Net income |
|
- |
|
|
|
- |
|
|
|
28,499 |
|
|
|
- |
|
|
|
1,131 |
|
|
|
29,630 |
|
|
Other comprehensive loss, net of tax |
|
- |
|
|
|
- |
|
|
|
- |
|
|
|
(147,023 |
) |
|
|
- |
|
|
|
(147,023 |
) |
|
Issuance of NL common stock |
|
1 |
|
|
|
76 |
|
|
|
- |
|
|
|
- |
|
|
|
- |
|
|
|
77 |
|
|
Cash dividends |
|
- |
|
|
|
- |
|
|
|
- |
|
|
|
- |
|
|
|
(328 |
) |
|
|
(328 |
) |
|
Other, net |
|
- |
|
|
|
89 |
|
|
|
- |
|
|
|
- |
|
|
|
10 |
|
|
|
99 |
|
|
|
|
|
|
|
|
|
|
|
|
|
|
|
|
|
|
|
|
|
|
|
|
|
|
|
Balance at December 31, 2014 |
|
6,085 |
|
|
|
300,388 |
|
|
|
112,588 |
|
|
|
(182,039 |
) |
|
|
14,428 |
|
|
|
251,450 |
|
|
|
|
|
|
|
|
|
|
|
|
|
|
|
|
|
|
|
|
|
|
|
|
|
|
|
Net income (loss) |
|
- |
|
|
|
- |
|
|
|
(23,909 |
) |
|
|
- |
|
|
|
1,193 |
|
|
|
(22,716 |
) |
|
Other comprehensive loss, net of tax |
|
- |
|
|
|
- |
|
|
|
- |
|
|
|
(63,319 |
) |
|
|
- |
|
|
|
(63,319 |
) |
|
Issuance of NL common stock |
|
1 |
|
|
|
65 |
|
|
|
- |
|
|
|
- |
|
|
|
- |
|
|
|
66 |
|
|
Cash dividends |
|
- |
|
|
|
- |
|
|
|
- |
|
|
|
- |
|
|
|
(330 |
) |
|
|
(330 |
) |
|
Other, net |
|
- |
|
|
|
90 |
|
|
|
- |
|
|
|
- |
|
|
|
10 |
|
|
|
100 |
|
|
|
|
|
|
|
|
|
|
|
|
|
|
|
|
|
|
|
|
|
|
|
|
|
|
|
Balance at December 31, 2015 |
$ |
6,086 |
|
|
$ |
300,543 |
|
|
$ |
88,679 |
|
|
$ |
(245,358 |
) |
|
$ |
15,301 |
|
|
$ |
165,251 |
|
|
|
|
|
|
|
|
|
|
|
|
|
|
|
|
|
|
|
|
|
|
|
|
|
|
See accompanying notes to consolidated financial statements.
F-7
NL INDUSTRIES, INC. AND SUBSIDIARIES
CONSOLIDATED STATEMENTS OF CASH FLOWS
(In thousands)
|
|
Years ended December 31, |
|
|||||||||
|
|
2013 |
|
|
2014 |
|
|
2015 |
|
|||
|
|
|
|
|
|
|
|
|
|
|
|
|
|
Cash flows from operating activities: |
|
|
|
|
|
|
|
|
|
|
|
|
Net income (loss) |
$ |
(54,543 |
) |
|
$ |
29,630 |
|
|
$ |
(22,716 |
) |
|
Depreciation and amortization |
|
3,335 |
|
|
|
3,601 |
|
|
|
3,609 |
|
|
Deferred income taxes |
|
(41,891 |
) |
|
|
4,167 |
|
|
|
(24,030 |
) |
|
Provision for inventory reserves |
|
228 |
|
|
|
24 |
|
|
|
233 |
|
|
Cash funding of benefit plans in excess of net benefit plan expense |
|
(1,224 |
) |
|
|
(2,557 |
) |
|
|
(1,349 |
) |
|
Equity in losses (earnings) of Kronos Worldwide, Inc. |
|
31,007 |
|
|
|
(30,161 |
) |
|
|
52,770 |
|
|
Dividends received from Kronos Worldwide, Inc. |
|
21,132 |
|
|
|
21,132 |
|
|
|
21,132 |
|
|
Securities transactions, net |
|
(11 |
) |
|
|
(16 |
) |
|
|
(3 |
) |
|
Other, net |
|
81 |
|
|
|
210 |
|
|
|
191 |
|
|
Change in assets and liabilities: |
|
|
|
|
|
|
|
|
|
|
|
|
Accounts and other receivables, net |
|
(1,461 |
) |
|
|
1,220 |
|
|
|
246 |
|
|
Inventories, net |
|
(2,240 |
) |
|
|
(3,652 |
) |
|
|
1,532 |
|
|
Prepaid expenses and other |
|
166 |
|
|
|
18 |
|
|
|
(189 |
) |
|
Accounts payable and accrued liabilities |
|
(3,347 |
) |
|
|
2,855 |
|
|
|
(1,245 |
) |
|
Income taxes |
|
- |
|
|
|
5 |
|
|
|
(2 |
) |
|
Accounts with affiliates |
|
(369 |
) |
|
|
726 |
|
|
|
(439 |
) |
|
Accrued environmental remediation and related costs |
|
65,630 |
|
|
|
(3,621 |
) |
|
|
3,118 |
|
|
Other noncurrent assets and liabilities, net |
|
(1,588 |
) |
|
|
(29 |
) |
|
|
(4,746 |
) |
|
|
|
|
|
|
|
|
|
|
|
|
|
|
Net cash provided by operating activities |
|
14,905 |
|
|
|
23,552 |
|
|
|
28,112 |
|
|
|
|
|
|
|
|
|
|
|
|
|
|
|
Cash flows from investing activities: |
|
|
|
|
|
|
|
|
|
|
|
|
Capital expenditures |
|
(3,541 |
) |
|
|
(2,858 |
) |
|
|
(4,304 |
) |
|
Collection of promissory note receivable |
|
3,034 |
|
|
|
- |
|
|
|
- |
|
|
Change in restricted cash equivalents, net |
|
2,018 |
|
|
|
(384 |
) |
|
|
420 |
|
|
Net proceeds from the disposal of: |
|
|
|
|
|
|
|
|
|
|
|
|
Assets held for sale |
|
1,559 |
|
|
|
- |
|
|
|
- |
|
|
Marketable securities |
|
272 |
|
|
|
660 |
|
|
|
255 |
|
|
Purchase of marketable securities |
|
(261 |
) |
|
|
(643 |
) |
|
|
(251 |
) |
|
Other |
|
(97 |
) |
|
|
(48 |
) |
|
|
- |
|
|
|
|
|
|
|
|
|
|
|
|
|
|
|
Net cash provided by (used in) investing activities |
|
2,984 |
|
|
|
(3,273 |
) |
|
|
(3,880 |
) |
|
|
|
|
|
|
|
|
|
|
|
|
|
F-8
NL INDUSTRIES, INC. AND SUBSIDIARIES
CONSOLIDATED STATEMENTS OF CASH FLOWS (CONTINUED)
(In thousands)
|
|
Years ended December 31, |
|
|||||||||
|
|
2013 |
|
|
2014 |
|
|
2015 |
|
|||
|
|
|
|
|
|
|
|
|
|
|
|
|
|
Cash flows from financing activities: |
|
|
|
|
|
|
|
|
|
|
|
|
Cash dividends paid |
|
(24,336 |
) |
|
|
- |
|
|
|
- |
|
|
Distributions to noncontrolling interests in subsidiary |
|
(451 |
) |
|
|
(328 |
) |
|
|
(330 |
) |
|
Indebtedness - repayments |
|
(18,480 |
) |
|
|
- |
|
|
|
- |
|
|
|
|
|
|
|
|
|
|
|
|
|
|
|
Net cash used in financing activities |
|
(43,267 |
) |
|
|
(328 |
) |
|
|
(330 |
) |
|
|
|
|
|
|
|
|
|
|
|
|
|
|
Cash and cash equivalents - net change from: |
|
|
|
|
|
|
|
|
|
|
|
|
Operating, investing and financing activities |
|
(25,378 |
) |
|
|
19,951 |
|
|
|
23,902 |
|
|
|
|
|
|
|
|
|
|
|
|
|
|
|
Balance at beginning of year |
|
(77,987 |
) |
|
|
52,609 |
|
|
|
72,560 |
|
|
|
|
|
|
|
|
|
|
|
|
|
|
|
Balance at end of year |
$ |
52,609 |
|
|
$ |
72,560 |
|
|
$ |
96,462 |
|
|
|
|
|
|
|
|
|
|
|
|
|
|
|
Supplemental disclosures: |
|
|
|
|
|
|
|
|
|
|
|
|
Cash paid for: |
|
|
|
|
|
|
|
|
|
|
|
|
Interest |
$ |
222 |
|
|
$ |
- |
|
|
$ |
- |
|
|
Income taxes, net |
|
302 |
|
|
|
193 |
|
|
|
611 |
|
See accompanying notes to consolidated financial statements.
F-9
NL INDUSTRIES, INC. AND SUBSIDIARIES
NOTES TO CONSOLIDATED FINANCIAL STATEMENTS
December 31, 2015
Note 1 - Summary of significant accounting policies:
Nature of our business - NL Industries, Inc. (NYSE: NL) is primarily a holding company. We operate in the component products industry through our majority-owned subsidiary, CompX International Inc. (NYSE MKT: CIX). We operate in the chemicals industry through our noncontrolling interest in Kronos Worldwide, Inc. (NYSE: KRO).
Organization - At December 31, 2015, Valhi, Inc. (NYSE: VHI) held approximately 83% of our outstanding common stock and a wholly-owned subsidiary of Contran Corporation held approximately 93% of Valhi’s outstanding common stock. All of Contran’s outstanding voting stock is held by a family trust established for the benefit of Lisa K. Simmons and Serena Simmons Connelly and their children for which Ms. Simmons and Ms. Connelly are co-trustees, or is held directly by Ms. Simmons and Ms. Connelly or entities related to them. Consequently, Ms. Simmons and Ms. Connelly may be deemed to control Contran, Valhi and us.
Unless otherwise indicated, references in this report to “we,” “us” or “our” refer to NL Industries, Inc. and its subsidiaries and affiliate, Kronos, taken as a whole.
Management’s estimates - In preparing our financial statements in conformity with accounting principles generally accepted in the United States of America (GAAP), we are required to make estimates and assumptions that affect the reported amounts of our assets and liabilities and disclosures of contingent assets and liabilities at each balance sheet date and the reported amounts of our revenues and expenses during each reporting period. Actual results may differ significantly from previously-estimated amounts under different assumptions or conditions.
Principles of consolidation - Our consolidated financial statements include the financial position, results of operations and cash flows of NL and our wholly-owned and majority-owned subsidiaries, including CompX. We account for the 13% of CompX stock we do not own as a noncontrolling interest. We eliminate all material intercompany accounts and balances. Changes in ownership of our wholly-owned and majority-owned subsidiaries are accounted for as equity transactions with no gain or loss recognized on the transaction unless there is a change in control.
Currency translation - The financial statements of Kronos’ non-U.S. subsidiaries are translated to U.S. dollars. The functional currency of Kronos’ non-U.S. subsidiaries is generally the local currency of their country. Accordingly, Kronos translates the assets and liabilities at year-end rates of exchange, while they translate their revenues and expenses at average exchange rates prevailing during the year. We accumulate the resulting translation adjustments in stockholders’ equity as part of accumulated other comprehensive income, net of related deferred income taxes. Kronos recognizes currency transaction gains and losses in income which is reflected as part of our equity in earnings (losses) of Kronos.
Cash and cash equivalents - We classify bank time deposits and government and commercial notes and bills with original maturities of three months or less as cash equivalents.
Restricted cash equivalents - We classify cash equivalents that have been segregated or are otherwise limited in use as restricted. To the extent the restricted amount relates to a recognized liability, we classify such restricted amount as either a current or noncurrent asset to correspond with the classification of the liability. To the extent the restricted amount does not relate to a recognized liability, we classify restricted cash as a current asset. See Note 8.
F-10
Marketable securities and securities transactions - We carry marketable securities at fair value. Accounting Standard Codification (ASC) Topic 820, Fair Value Measurements and Disclosures, establishes a consistent framework for measuring fair value and, with certain exceptions, this framework is generally applied to all financial statement items required to be measured at fair value. The standard requires fair value measurements to be classified and disclosed in one of the following three categories:
|
|
● |
Level 1 - Unadjusted quoted prices in active markets that are accessible at the measurement date for identical, unrestricted assets or liabilities; |
|
|
● |
Level 2 - Quoted prices in markets that are not active, or inputs which are observable, either directly or indirectly, for substantially the full term of the assets or liability; and |
|
|
● |
Level 3 - Prices or valuation techniques that require inputs that are both significant to the fair value measurement and unobservable. |
We classify all of our marketable securities as available-for-sale and unrealized gains or losses on these securities are recognized through other comprehensive income, net of related deferred income taxes. We base realized gains and losses upon the specific identification of securities sold. See Note 5.
Accounts receivable - We provide an allowance for doubtful accounts for known and estimated potential losses arising from sales to customers based on a periodic review of these accounts.
Inventories and cost of sales - We state inventories at the lower of cost or market, net of allowance for obsolete and slow-moving inventories. We generally base inventory costs for all inventory categories on an average cost that approximates the first-in, first-out method. Inventories include the costs for raw materials, the cost to manufacture the raw materials into finished goods and overhead. Depending on the inventory’s stage of completion, our manufacturing costs can include the costs of packing and finishing, utilities, maintenance and depreciation, shipping and handling, and salaries and benefits associated with our manufacturing process. We allocate fixed manufacturing overhead costs based on normal production capacity. Unallocated overhead costs resulting from periods with abnormally low production levels are charged to expense as incurred. As inventory is sold to third parties, we recognize the cost of sales in the same period that the sale occurs. We periodically review our inventory for estimated obsolescence or instances when inventory is no longer marketable for its intended use and we record any write-down equal to the difference between the cost of inventory and its estimated net realizable value based on assumptions about alternative uses, market conditions and other factors.
Investment in Kronos Worldwide, Inc. - We account for our 30% non-controlling interest in Kronos by the equity method. See Note 6.
Goodwill - Goodwill represents the excess of cost over fair value of individual net assets acquired in business combinations. Goodwill is not subject to periodic amortization. We evaluate goodwill for impairment, annually, or when circumstances indicate the carrying value may not be recoverable. We adopted ASC 350-20-35 in the third quarter of 2013 which allows an entity to first assess qualitative factors to determine whether it is necessary to perform the two-step quantitative goodwill impairment test. An entity is not required to calculate the fair value of a reporting unit unless the entity determines, based on a qualitative assessment considering the totality of relevant events and circumstances, that it is more likely than not that its fair value of the reporting unit is less than its carrying amount. See Note 7.
Property and equipment; depreciation expense - We state property and equipment, including purchased computer software for internal use, at cost. We compute depreciation of property and equipment for financial reporting purposes principally by the straight-line method over the estimated useful lives of 15 to 40 years for buildings and 3 to 20 years for equipment and software. We use accelerated depreciation methods for income tax purposes, as permitted. Depreciation expense was $3.3 million in 2013, $3.6 million in 2014, and $3.6 million in 2015. Upon sale or retirement of an asset, the related cost and accumulated depreciation are removed from the accounts and any gain or loss is recognized in income currently. Expenditures for maintenance, repairs and minor renewals are expensed; expenditures for major improvements are capitalized.
F-11
We perform impairment tests when events or changes in circumstances indicate the carrying value may not be recoverable. We consider all relevant factors. We perform impairment tests by comparing the estimated future undiscounted cash flows associated with the asset to the asset’s net carrying value to determine whether impairment exists.
Employee benefit plans - Accounting and funding policies for our retirement and post-retirement benefits other than pensions (OPEB) plans are described in Note 14.
Income taxes - We, Valhi and our qualifying subsidiaries are members of Contran’s consolidated U.S. federal income tax group (the Contran Tax Group) and we and certain of our qualifying subsidiaries also file consolidated unitary state income tax returns with Contran in qualifying U.S. jurisdictions. As a member of the Contran Tax Group, we are jointly and severally liable for the federal income tax liability of Contran and the other companies included in the Contran Tax Group for all periods in which we are included in the Contran Tax Group. See Note 17. As a member of the Contran Tax Group, we are party to a tax sharing agreement with Valhi and Contran which provides that we compute our provision for income taxes on a separate-company basis using the tax elections made by Contran. Pursuant to our tax sharing agreement, we make payments to or receive payments from Valhi in amounts that we would have paid to or received from the U.S. Internal Revenue Service or the applicable state tax authority had we not been a member of the Contran Tax Group. We received net income tax refunds from Valhi of $.1 million in 2014, and we made net payments to Valhi for income taxes of $.3 million in 2013 and $.6 in 2015.
We recognize deferred income tax assets and liabilities for the expected future tax consequences of temporary differences between the income tax and financial reporting carrying amounts of our assets and liabilities, including investments in our subsidiaries and affiliates who are not members of the Contran Tax Group and undistributed earnings of non-U.S. subsidiaries which are not permanently reinvested. In addition, we recognize deferred income taxes with respect to the excess of the financial reporting carrying amount over the income tax basis of our direct investment in Kronos common stock because the exemption under GAAP to avoid recognition of such deferred income taxes is not available to us. Deferred income tax assets and liabilities for each tax-paying jurisdiction in which we operate are netted and presented as either a noncurrent deferred income tax asset or liability as applicable. We periodically evaluate our deferred tax assets in the various taxing jurisdictions in which we operate and adjust any related valuation allowance based on the estimate of the amount of such deferred tax assets which we believe do not meet the more-likely-than-not recognition criteria.
We record a reserve for uncertain tax positions for tax positions where we believe it is more-likely-than-not our position will not prevail with the applicable tax authorities. The amount of the benefit associated with our uncertain tax positions that we recognize is limited to the largest amount for which we believe the likelihood of realization is greater than 50%. We accrue penalties and interest on the difference between tax positions taken on our tax returns and the amount of benefit recognized for financial reporting purposes. We classify our reserves for uncertain tax positions in a separate current or noncurrent liability, depending on the nature of the tax position. See Note 13.
Environmental remediation costs - We record liabilities related to environmental remediation obligations when estimated future expenditures are probable and reasonably estimable. We adjust these accruals as further information becomes available to us or as circumstances change. We generally do not discount estimated future expenditures to present value. We recognize any recoveries of remediation costs from other parties when we deem their receipt probable. We expense any environmental remediation related legal costs as incurred. At December 31, 2014 and 2015, we had not recognized any receivables for recoveries. See Note 17.
Net sales - We record sales when products are shipped and title and other risks and rewards of ownership have passed to the customer. Amounts charged to customers for shipping and handling costs are not material. We state sales net of price, early payment and distributor discounts and volume rebates. We report taxes assessed by a governmental authority that we collect from our customers that is both imposed on and concurrent with our revenue producing activities (such as sales and use taxes) on a net basis (meaning we do not recognize these taxes in either our revenues or in our costs and expenses).
F-12
Selling, general and administrative expenses; advertising costs; research and development costs - Selling, general and administrative expenses include costs related to marketing, sales, distribution, research and development, and administrative functions such as accounting, treasury and finance, as well as costs for salaries and benefits, travel and entertainment, promotional materials and professional fees. We expense advertising costs and research and development costs as incurred. Advertising costs were not significant in any year presented.
Corporate expenses - Corporate expenses include environmental, legal and other costs attributable to formerly-owned business units.
Earnings per share – Basic and diluted earnings per share of common stock is based upon the weighted average number of our common shares actually outstanding during each period.
Note 2 - Geographic information:
We operate in the security products industry and marine components industry through our majority ownership of CompX. CompX manufactures and sells security products including locking mechanisms and other security products for sale to the transportation, postal, office and institutional furniture, cabinetry, tool storage, healthcare and other industries with a facility in South Carolina and a facility shared with Marine Components in Illinois. CompX also manufactures and distributes stainless steel exhaust systems, gauges and throttle controls primarily for recreational boats.
For geographic information, the point of origin (place of manufacture) for all net sales is the U.S., the point of destination for net sales is based on the location of the customer.
|
|
Years ended December 31, |
|
|||||||||
|
|
2013 |
|
|
2014 |
|
|
2015 |
|
|||
|
|
(In thousands) |
|
|||||||||
|
Net sales - point of destination: |
|
|
|
|
|
|
|
|
|
|
|
|
United States |
$ |
87,307 |
|
|
$ |
98,994 |
|
|
$ |
103,737 |
|
|
Canada |
|
2,195 |
|
|
|
1,927 |
|
|
|
2,352 |
|
|
Other |
|
2,543 |
|
|
|
2,925 |
|
|
|
2,905 |
|
|
|
|
|
|
|
|
|
|
|
|
|
|
|
Total |
$ |
92,045 |
|
|
$ |
103,846 |
|
|
$ |
108,994 |
|
All of our net property and equipment is located in the United States at December 31, 2014 and 2015.
Note 3 - Accounts and other receivables, net:
|
|
December 31, |
|
|||||
|
|
2014 |
|
|
2015 |
|
||
|
|
(In thousands) |
|
|||||
|
Trade receivables - CompX |
$ |
8,825 |
|
|
$ |
8,847 |
|
|
Accrued insurance recoveries |
|
346 |
|
|
|
138 |
|
|
Other receivables |
|
163 |
|
|
|
79 |
|
|
Allowance for doubtful accounts |
|
(78 |
) |
|
|
(87 |
) |
|
|
|
|
|
|
|
|
|
|
Total |
$ |
9,256 |
|
|
$ |
8,977 |
|
Accrued insurance recoveries are discussed in Note 17.
F-13
|
|
December 31, |
|
|||||
|
|
2014 |
|
|
2015 |
|
||
|
|
(In thousands) |
|
|||||
|
Raw materials |
$ |
3,393 |
|
|
$ |
2,807 |
|
|
Work in process |
|
10,271 |
|
|
|
9,346 |
|
|
Finished products |
|
3,199 |
|
|
|
2,945 |
|
|
|
|
|
|
|
|
|
|
|
Total |
$ |
16,863 |
|
|
$ |
15,098 |
|
Note 5 - Marketable securities:
|
|
Fair value |
|
|
|
|
|
|
|
|
|
|
|
|
|
|
measurement |
|
Market |
|
|
Cost |
|
|
Unrealized |
|
|||
|
|
level |
|
value |
|
|
basis |
|
|
gain (loss) |
|
|||
|
|
|
|
(In thousands) |
|
|||||||||
|
December 31, 2014 |
|
|
|
|
|
|
|
|
|
|
|
|
|
|
Noncurrent assets |
|
|
|
|
|
|
|
|
|
|
|
|
|
|
Valhi common stock |
1 |
|
$ |
92,131 |
|
|
$ |
24,347 |
|
|
$ |
67,784 |
|
|
|
|
|
|
|
|
|
|
|
|
|
|
|
|
|
December 31, 2015 |
|
|
|
|
|
|
|
|
|
|
|
|
|
|
Noncurrent assets |
|
|
|
|
|
|
|
|
|
|
|
|
|
|
Valhi common stock |
1 |
|
$ |
19,260 |
|
|
$ |
24,347 |
|
|
$ |
(5,087 |
) |
At December 31, 2014 and 2015, we held approximately 14.4 million shares of our immediate parent company, Valhi. See Note 1. We account for our investment in Valhi common stock as available-for-sale marketable equity securities and any unrealized gains or losses on the securities are recognized through other comprehensive income, net of deferred income taxes. Our shares of Valhi common stock are carried at fair value based on quoted market prices, representing a Level 1 input within the fair value hierarchy. At December 31, 2014 and 2015, the quoted market prices of Valhi common stock were $6.41 and $1.34 per share, respectively.
With respect to our investment in Valhi stock, our cost basis had exceeded its market value since December 7, 2015, but we consider such decline in market price to be temporary at December 31, 2015. We considered all available evidence in reaching this conclusion, including our ability and intent to hold this investment for a reasonable period of time sufficient for the recovery of fair value, as evidenced by the amount of liquidity we currently have with cash on hand. We will continue to monitor the quoted market price for this investment. In this regard, as of February 29, 2016, the aggregate quoted market price for our shares of Valhi common stock was $5.7 million less than our aggregate cost basis. If we conclude in the future that a decline in value of this security was other than temporary, we would recognize impairment through an income statement charge at that time. Such income statement impairment charge would be offset in other comprehensive income by the reversal of the previously recognized unrealized losses to the extent they were previously recognized in accumulated other comprehensive income.
The Valhi common stock we own is subject to the restrictions on resale pursuant to certain provisions of the SEC Rule 144. In addition, as a majority-owned subsidiary of Valhi we cannot vote our shares of Valhi common stock under Delaware General Corporation Law, but we do receive dividends from Valhi on these shares, when declared and paid.
Note 6 - Investment in Kronos Worldwide, Inc.:
At December 31, 2014 and 2015, we owned approximately 35.2 million shares of Kronos common stock. The per share quoted market price of Kronos at December 31, 2014 and 2015 was $13.02 and $5.64 per share, respectively, or an aggregate market value of $458.6 million and $198.6 million, respectively.
F-14
The change in the carrying value of our investment in Kronos during the past three years is summarized below:
|
|
Years ended December 31, |
|
|||||||||
|
|
2013 |
|
|
2014 |
|
|
2015 |
|
|||
|
|
(In millions) |
|
|||||||||
|
Balance at the beginning of the year |
$ |
323.1 |
|
|
$ |
284.5 |
|
|
$ |
237.7 |
|
|
Equity in earnings (losses) of Kronos |
|
(31.0 |
) |
|
|
30.2 |
|
|
|
(52.8 |
) |
|
Dividends received from Kronos |
|
(21.1 |
) |
|
|
(21.1 |
) |
|
|
(21.1 |
) |
|
Equity in Kronos' other comprehensive income (loss): |
|
|
|
|
|
|
|
|
|
|
|
|
Marketable securities |
|
2.0 |
|
|
|
(4.2 |
) |
|
|
.7 |
|
|
Currency translation |
|
2.0 |
|
|
|
(31.3 |
) |
|
|
(28.0 |
) |
|
Interest rate swap |
|
- |
|
|
|
- |
|
|
|
(.7 |
) |
|
Defined benefit pension plans |
|
8.5 |
|
|
|
(20.1 |
) |
|
|
4.9 |
|
|
Other postretirement benefit plans |
|
1.2 |
|
|
|
(.3 |
) |
|
|
- |
|
|
Other |
|
(.2 |
) |
|
|
- |
|
|
|
- |
|
|
|
|
|
|
|
|
|
|
|
|
|
|
|
Balance at the end of the year |
$ |
284.5 |
|
|
$ |
237.7 |
|
|
$ |
140.7 |
|
Selected financial information of Kronos is summarized below:
|
|
December 31, |
|
|||||
|
|
2014 |
|
|
2015 |
|
||
|
|
(In millions) |
|
|||||
|
Current assets |
$ |
879.9 |
|
|
$ |
710.8 |
|
|
Property and equipment, net |
|
479.7 |
|
|
|
429.5 |
|
|
Investment in TiO2 joint venture |
|
89.0 |
|
|
|
82.9 |
|
|
Other noncurrent assets |
|
184.5 |
|
|
|
19.5 |
|
|
|
|
|
|
|
|
|
|
|
Total assets |
$ |
1,633.1 |
|
|
$ |
1,242.7 |
|
|
|
|
|
|
|
|
|
|
|
Current liabilities |
$ |
234.2 |
|
|
$ |
201.7 |
|
|
Long-term debt |
|
339.7 |
|
|
|
337.2 |
|
|
Accrued pension and postretirement benefits |
|
245.2 |
|
|
|
209.4 |
|
|
Other noncurrent liabilities |
|
32.9 |
|
|
|
32.5 |
|
|
Stockholders' equity |
|
781.1 |
|
|
|
461.9 |
|
|
|
|
|
|
|
|
|
|
|
Total liabilities and stockholders' equity |
$ |
1,633.1 |
|
|
$ |
1,242.7 |
|
|
|
Years ended December 31, |
|
|||||||||
|
|
2013 |
|
|
2014 |
|
|
2015 |
|
|||
|
|
(In millions) |
|
|||||||||
|
Net sales |
$ |
1,732.4 |
|
|
$ |
1,651.9 |
|
|
$ |
1,348.8 |
|
|
Cost of sales |
|
1,620.2 |
|
|
|
1,302.2 |
|
|
|
1,156.5 |
|
|
Income (loss) from operations |
|
(132.6 |
) |
|
|
149.7 |
|
|
|
(1.1 |
) |
|
Income tax expense (benefit) |
|
(57.9 |
) |
|
|
34.5 |
|
|
|
142.8 |
|
|
Net income (loss) |
|
(102.0 |
) |
|
|
99.2 |
|
|
|
(173.6 |
) |
F-15
Substantially all of our goodwill is related to our component products operations and was generated from CompX’s acquisitions of certain business units. There have been no changes in the carrying amount of our goodwill during the past three years.
We have assigned goodwill related to the component products operations to two reporting units (as that term is defined in ASC Topic 350-20-20 Goodwill): one consisting of CompX’s security products operations and one consisting of CompX’s marine component operations. We test for goodwill impairment at the reporting unit level. In accordance with ASC 350-20-35, we test for goodwill impairment during the third quarter of each year or when circumstances arise that indicate an impairment might be present. In 2013 we adopted the guidance in ASU No. 2011-08 for testing goodwill for impairment by assessing qualitative factors to determine whether it is necessary to perform the two-step quantitative goodwill impairment test. Based on our qualitative assessment, a quantitative assessment was not required for 2013, 2014 or 2015.
In 2013, 2014 and 2015, goodwill for all applicable reporting units was tested for impairment only in the third quarter of each year in connection with our annual testing. No impairment was indicated as part of such annual review of goodwill. Prior to 2013, all of the goodwill related to CompX’s marine components operations (which aggregated $10.1 million) was impaired, and all of the goodwill related to our wholly-owned subsidiary EWI Re, Inc., (EWI) an insurance brokerage and risk management services company (which aggregated $6.4 million) was impaired. Our gross goodwill at December 31, 2015 was $43.7 million.
Note 8 - Other assets:
|
|
December 31, |
|
|||||
|
|
2014 |
|
|
2015 |
|
||
|
|
(In thousands) |
|
|||||
|
Restricted cash |
$ |
1,420 |
|
|
$ |
1,273 |
|
|
Pension asset |
|
- |
|
|
|
1,303 |
|
|
Other |
|
723 |
|
|
|
755 |
|
|
|
|
|
|
|
|
|
|
|
Total |
$ |
2,143 |
|
|
$ |
3,331 |
|
Note 9 - Accrued and other current liabilities:
|
|
December 31, |
|
|||||
|
|
2014 |
|
|
2015 |
|
||
|
|
(In thousands) |
|
|||||
|
Employee benefits |
$ |
8,278 |
|
|
$ |
8,438 |
|
|
Professional fees and settlements |
|
951 |
|
|
|
698 |
|
|
Other |
|
1,633 |
|
|
|
1,422 |
|
|
|
|
|
|
|
|
|
|
|
Total |
$ |
10,862 |
|
|
$ |
10,558 |
|
F-16
Note 10 - Other noncurrent liabilities:
|
|
December 31, |
|
|||||
|
|
2014 |
|
|
2015 |
|
||
|
|
(In thousands) |
|
|||||
|
Reserve for uncertain tax positions |
$ |
16,832 |
|
|
$ |
12,186 |
|
|
Insurance claims and expenses |
|
589 |
|
|
|
663 |
|
|
Other |
|
921 |
|
|
|
787 |
|
|
|
|
|
|
|
|
|
|
|
Total |
$ |
18,342 |
|
|
$ |
13,636 |
|
Our reserve for uncertain tax positions is discussed in Note 13.
Note 11 - Long-term debt:
We have a revolving promissory note with Valhi that, as amended, allows us to borrow up to $40 million. Our borrowings from Valhi under this revolving note are unsecured bear interest at prime rate plus 2.75% with all principal due on demand, but in any event no earlier than March 31, 2017 and no later than December 31, 2017. The amount of the outstanding borrowings at any time is solely at the discretion of Valhi. We had no outstanding borrowings under this revolving promissory note at December 31, 2014 and 2015. See Note 15.
Note 12 - Stockholders’ equity:
Long-term incentive compensation plan – We have a long-term incentive plan that provides for the award of stock to our board of directors, and up to a maximum of 200,000 shares can be awarded. We awarded 5,000 shares under this plan in 2013 and 9,000 shares in each of 2014 and 2015. At December 31, 2015, 177,000 shares were available for future grants under this plan.
Long-term incentive compensation plan of subsidiaries and affiliates - CompX and Kronos each have a share based incentive compensation plan pursuant to which an aggregate of up to 200,000 shares of their common stock can be awarded to members of their board of directors. At December 31, 2015, Kronos had 177,000 shares available for award and CompX had 181,000 shares available for award.
Dividends - In February 2014, our Board of Directors deferred consideration of a first quarter 2014 cash dividend, and no dividend was paid in the first quarter of that year. In May 2014, after considering our results of operations, financial conditions and cash requirements for our businesses, our Board of Directors suspended our regular quarterly dividend. The declaration and payment of future dividends, and the amount thereof, is discretionary and is dependent upon these and other factors deemed relevant by our Board of Directors.
F-17
Accumulated other comprehensive income (loss) - Changes in accumulated other comprehensive income (loss) attributable to NL stockholders, including amounts resulting from our investment in Kronos Worldwide (see Note 6), are presented in the table below.
|
|
Years ended December 31, |
|
|||||||||
|
|
2013 |
|
|
2014 |
|
|
2015 |
|
|||
|
|
(In thousands) |
|
|||||||||
|
Accumulated other comprehensive income (loss), net of tax: |
|
|
|
|
|
|
|
|
|
|
|
|
Marketable securities: |
|
|
|
|
|
|
|
|
|
|
|
|
Balance at beginning of year |
$ |
105,419 |
|
|
$ |
154,169 |
|
|
$ |
47,112 |
|
|
Other comprehensive income (loss): |
|
|
|
|
|
|
|
|
|
|
|
|
Unrealized gain (loss) arising during the year |
|
48,514 |
|
|
|
(107,057 |
) |
|
|
(48,647 |
) |
|
Less reclassification adjustment for amounts included |
|
|
|
|
|
|
|
|
|
|
|
|
in realized loss |
|
236 |
|
|
|
- |
|
|
|
1,730 |
|
|
|
|
|
|
|
|
|
|
|
|
|
|
|
Balance at end of year |
$ |
154,169 |
|
|
$ |
47,112 |
|
|
$ |
195 |
|
|
|
|
|
|
|
|
|
|
|
|
|
|
|
Currency translation: |
|
|
|
|
|
|
|
|
|
|
|
|
Balance at beginning of year |
$ |
(135,165 |
) |
|
$ |
(133,816 |
) |
|
$ |
(154,173 |
) |
|
Other comprehensive income (loss): |
|
|
|
|
|
|
|
|
|
|
|
|
Arising during the year |
|
1,349 |
|
|
|
(20,357 |
) |
|
|
(18,211 |
) |
|
|
|
|
|
|
|
|
|
|
|
|
|
|
Balance at end of year |
$ |
(133,816 |
) |
|
$ |
(154,173 |
) |
|
$ |
(172,384 |
) |
|
|
|
|
|
|
|
|
|
|
|
|
|
|
Interest rate swap: |
|
|
|
|
|
|
|
|
|
|
|
|
Balance at beginning of year |
$ |
- |
|
|
$ |
- |
|
|
$ |
- |
|
|
Other comprehensive income (loss) |
|
- |
|
|
|
- |
|
|
|
(445 |
) |
|
|
|
|
|
|
|
|
|
|
|
|
|
|
Balance at end of year |
$ |
- |
|
|
$ |
- |
|
|
$ |
(445 |
) |
|
|
|
|
|
|
|
|
|
|
|
|
|
|
Defined benefit pension plans: |
|
|
|
|
|
|
|
|
|
|
|
|
Balance at beginning of year |
$ |
(66,402 |
) |
|
$ |
(56,644 |
) |
|
$ |
(75,260 |
) |
|
Other comprehensive income (loss): |
|
|
|
|
|
|
|
|
|
|
|
|
Amortization of prior service cost and net losses |
|
|
|
|
|
|
|
|
|
|
|
|
included in net periodic pension cost |
|
2,776 |
|
|
|
2,107 |
|
|
|
2,884 |
|
|
Net actuarial gain (loss) arising during the year |
|
5,952 |
|
|
|
(20,723 |
) |
|
|
(336 |
) |
|
Plan curtailment |
|
1,030 |
|
|
|
- |
|
|
|
- |
|
|
|
|
|
|
|
|
|
|
|
|
|
|
|
Balance at end of year |
$ |
(56,644 |
) |
|
$ |
(75,260 |
) |
|
$ |
(72,712 |
) |
|
|
|
|
|
|
|
|
|
|
|
|
|
|
OPEB plans: |
|
|
|
|
|
|
|
|
|
|
|
|
Balance at beginning of year |
$ |
895 |
|
|
$ |
1,275 |
|
|
$ |
282 |
|
|
Other comprehensive income (loss): |
|
|
|
|
|
|
|
|
|
|
|
|
Amortization of prior service credit and net losses |
|
|
|
|
|
|
|
|
|
|
|
|
included in net periodic OPEB cost |
|
(663 |
) |
|
|
(626 |
) |
|
|
(547 |
) |
|
Net actuarial gain (loss) arising during year |
|
395 |
|
|
|
(367 |
) |
|
|
253 |
|
|
Plan amendment |
|
648 |
|
|
|
- |
|
|
|
- |
|
|
|
|
|
|
|
|
|
|
|
|
|
|
|
Balance at end of year |
$ |
1,275 |
|
|
$ |
282 |
|
|
$ |
(12 |
) |
|
|
|
|
|
|
|
|
|
|
|
|
|
|
Total accumulated other comprehensive income (loss), net of tax: |
|
|
|
|
|
|
|
|
|
|
|
|
Balance at beginning of year |
$ |
(95,253 |
) |
|
$ |
(35,016 |
) |
|
$ |
(182,039 |
) |
|
Other comprehensive income (loss) |
|
60,237 |
|
|
|
(147,023 |
) |
|
|
(63,319 |
) |
|
|
|
|
|
|
|
|
|
|
|
|
|
|
Balance at end of year |
$ |
(35,016 |
) |
|
$ |
(182,039 |
) |
|
$ |
(245,358 |
) |
See Note 14 for amounts related to our defined benefit pension plans and OPEB plans.
F-18
The provision for income taxes and the difference between such provision for income taxes, the amount that would be expected using the U.S. federal statutory income tax rate of 35% and the comprehensive provision for income taxes are presented below.
|
|
Years ended December 31, |
|
|||||||||
|
|
2013 |
|
|
2014 |
|
|
2015 |
|
|||
|
|
(In millions) |
|
|||||||||
|
Expected tax expense (benefit), at U.S. federal statutory income tax rate of 35% |
$ |
(33.8 |
) |
|
$ |
12.1 |
|
|
$ |
(18.0 |
) |
|
Rate differences on equity in earnings (losses) of Kronos |
|
(7.4 |
) |
|
|
(7.4 |
) |
|
|
(7.4 |
) |
|
Adjustment to the reserve for uncertain tax positions, net |
|
- |
|
|
|
- |
|
|
|
(3.0 |
) |
|
U.S. state income taxes and other, net |
|
(.7 |
) |
|
|
.3 |
|
|
|
(.2 |
) |
|
|
|
|
|
|
|
|
|
|
|
|
|
|
Income tax expense (benefit) |
$ |
(41.9 |
) |
|
$ |
5.0 |
|
|
$ |
(28.6 |
) |
|
|
|
|
|
|
|
|
|
|
|
|
|
|
Components of income tax expense (benefit): |
|
|
|
|
|
|
|
|
|
|
|
|
Currently payable (receivable): |
$ |
- |
|
|
$ |
.8 |
|
|
$ |
.1 |
|
|
Deferred income taxes (benefit) |
|
(41.9 |
) |
|
|
4.2 |
|
|
|
(28.7 |
) |
|
|
|
|
|
|
|
|
|
|
|
|
|
|
Income tax expense (benefit) |
$ |
(41.9 |
) |
|
$ |
5.0 |
|
|
$ |
(28.6 |
) |
|
|
|
|
|
|
|
|
|
|
|
|
|
|
Comprehensive provision for income taxes (benefit) allocable to: |
|
|
|
|
|
|
|
|
|
|
|
|
Income (loss) from continuing operations |
$ |
(41.9 |
) |
|
$ |
5.0 |
|
|
$ |
(28.6 |
) |
|
Other comprehensive income (loss): |
|
|
|
|
|
|
|
|
|
|
|
|
Marketable securities |
|
26.2 |
|
|
|
(57.6 |
) |
|
|
(25.3 |
) |
|
Currency translation |
|
.7 |
|
|
|
(11.0 |
) |
|
|
(9.8 |
) |
|
Interest rate swap |
|
- |
|
|
|
- |
|
|
|
(.2 |
) |
|
Pension plans |
|
5.3 |
|
|
|
(10.0 |
) |
|
|
1.4 |
|
|
OPEB plans |
|
.2 |
|
|
|
(.5 |
) |
|
|
(.2 |
) |
|
|
|
|
|
|
|
|
|
|
|
|
|
|
Total |
$ |
(9.5 |
) |
|
$ |
(74.1 |
) |
|
$ |
(62.7 |
) |
F-19
The components of the net deferred tax liability at December 31, 2014 and 2015 are summarized in the following table.
|
|
Years ended December 31, |
|
|||||||||||||
|
|
2014 |
|
|
2015 |
|
||||||||||
|
|
Assets |
|
|
Liabilities |
|
|
Assets |
|
|
Liabilities |
|
||||
|
|
(In millions) |
|
|||||||||||||
|
Tax effect of temporary differences related to: |
|
|
|
|
|
|
|
|
|
|
|
|
|
|
|
|
Inventories |
$ |
.8 |
|
|
$ |
- |
|
|
$ |
.5 |
|
|
$ |
- |
|
|
Marketable securities |
|
- |
|
|
|
(31.9 |
) |
|
|
- |
|
|
|
(6.4 |
) |
|
Property and equipment |
|
- |
|
|
|
(4.6 |
) |
|
|
- |
|
|
|
(4.5 |
) |
|
Accrued OPEB costs |
|
1.4 |
|
|
|
- |
|
|
|
1.1 |
|
|
|
- |
|
|
Accrued pension costs |
|
4.4 |
|
|
|
- |
|
|
|
4.6 |
|
|
|
- |
|
|
Accrued employee benefits |
|
1.9 |
|
|
|
- |
|
|
|
2.0 |
|
|
|
- |
|
|
Accrued environmental liabilities |
|
38.8 |
|
|
|
- |
|
|
|
39.9 |
|
|
|
- |
|
|
Goodwill |
|
- |
|
|
|
(2.6 |
) |
|
|
- |
|
|
|
(2.6 |
) |
|
Other accrued liabilities and deductible differences |
|
.8 |
|
|
|
- |
|
|
|
.4 |
|
|
|
- |
|
|
Other taxable differences |
|
- |
|
|
|
(4.2 |
) |
|
|
- |
|
|
|
(4.3 |
) |
|
Investment in Kronos Worldwide, Inc. |
|
- |
|
|
|
(90.1 |
) |
|
|
- |
|
|
|
(56.2 |
) |
|
Tax loss and tax credit carryforwards |
|
2.2 |
|
|
|
- |
|
|
|
.5 |
|
|
|
- |
|
|
Adjusted gross deferred tax assets (liabilities) |
|
50.3 |
|
|
|
(133.4 |
) |
|
|
49.0 |
|
|
|
(74.0 |
) |
|
Netting of items by tax jurisdiction |
|
(50.3 |
) |
|
|
50.3 |
|
|
|
(49.0 |
) |
|
|
49.0 |
|
|
|
|
|
|
|
|
|
|
|
|
|
|
|
|
|
|
|
Net noncurrent deferred tax asset (liability) |
$ |
- |
|
|
$ |
(83.1 |
) |
|
$ |
- |
|
|
$ |
(25.0 |
) |
In accordance with GAAP, we recognize deferred income taxes on our undistributed equity in earnings (losses) of Kronos. Because we and Kronos are part of the same U.S. federal income tax group, any dividends we receive from Kronos are nontaxable to us. Accordingly, we do not recognize and we are not required to pay income taxes on dividends from Kronos. We received aggregate dividends from Kronos of $21.1 million in each of 2013, 2014 and 2015. See Note 6. The amounts shown in the above table of our income tax rate reconciliation for rate differences on equity in earnings (losses) of Kronos represents the benefit associated with such non-taxability of the dividends we receive from Kronos, as it relates to the amount of deferred income taxes we recognize on our undistributed equity in earnings (losses) of Kronos.
Kronos has substantial net operating losses in Germany and Belgium, the benefit of which Kronos had previously recognized under the more-likely-than-not recognition criteria. In the second quarter of 2015, Kronos determined that such losses did not meet the more-likely-than-not recognition criteria, and as a result Kronos recognized a non-cash deferred income tax expense of $150.3 million in the second quarter of 2015 as a valuation allowance against Kronos’ net deferred income tax assets in such jurisdictions. Kronos recognized an additional $8.7 million non-cash deferred income tax asset valuation allowance during the second half of 2015 due to losses recognized by its German and Belgian operations during such period. The rate difference related to our equity in losses of Kronos in 2015 includes our equity in such non-cash deferred income tax expenses recognized by Kronos.
Tax authorities are examining certain of our U.S. and non-U.S. tax returns, including those of Kronos and tax authorities have or may propose tax deficiencies, including penalties and interest. We cannot guarantee that these tax matters will be resolved in our favor due to the inherent uncertainties involved in settlement initiatives and court and tax proceedings. We believe that we have adequate accruals for additional taxes and related interest expense which could ultimately result from tax examinations. We believe the ultimate disposition of tax examinations should not have a material adverse effect on our consolidated financial position, results of operations or liquidity.
F-20
In 2011 and 2012, Kronos received notices of re-assessment from the Canadian federal and provincial tax authorities related to the years 2002 through 2004. Kronos objected to the re-assessments and believed the position was without merit. In the second quarter of 2014, the Appeals Division of the Canadian Revenue Authority ruled in Kronos’ favor and reversed in their entirety such notices of reassessment. As a result, Kronos recognized a non-cash income tax benefit of $3.0 million related to the release of a portion of its reserve for uncertain tax positions in the second quarter of 2014 related to the completion of this Canadian income tax audit. Also during the second quarter of 2014, Kronos recognized a non-cash income tax benefit of $3.1 million related to the release of a portion of its reserve for uncertain tax positions in conjunction with the completion of an audit of its U.S. income tax return for 2009.
The following table shows the changes in the amount of our uncertain tax positions (exclusive of the effect of interest and penalties) during 2013, 2014 and 2015:
|
|
December 31, |
|
|||||||||
|
|
2013 |
|
|
2014 |
|
|
2015 |
|
|||
|
|
(In millions) |
|
|||||||||
|
Unrecognized liabilities: |
|
|
|
|
|
|
|
|
|
|
|
|
Balance at the beginning of the period |
$ |
16.8 |
|
|
$ |
16.8 |
|
|
$ |
16.8 |
|
|
Lapse of applicable statute of limitations |
|
- |
|
|
|
- |
|
|
|
(4.6 |
) |
|
|
|
|
|
|
|
|
|
|
|
|
|
|
Balance at the end of the period |
$ |
16.8 |
|
|
$ |
16.8 |
|
|
$ |
12.2 |
|
In the first quarter of 2015, we recognized a non-cash income tax benefit of $3.0 million related to the release of a portion of our reserve for uncertain tax positions due to the expiration of the applicable statute of limitations. We currently estimate that our unrecognized tax benefits will not change materially during the next twelve months. If our uncertain tax positions were recognized, a benefit of $15.2 million would affect our effective income tax rate in each of 2013 and 2014, and a benefit of $12.2 million would affect our rate in 2015. We accrue interest and penalties on our uncertain tax positions as a component of our provision for income taxes. The amount of interest and penalties we accrued during 2013, 2014 and 2015 was not material.
We file income tax returns in various U.S. federal, state and local jurisdictions. Our U.S. income tax returns prior to 2012 are generally considered closed to examination by applicable tax authorities.
Note 14 - Employee benefit plans:
Defined contribution plans - We maintain various defined contribution pension plans. Company contributions are based on matching or other formulas. Defined contribution plan expense approximated $2.1 million in 2013, $2.4 million in 2014 and $2.5 million in 2015.
Accounting for defined benefit pension and postretirement benefits other than pension (OPEB) plans - We recognize all changes in the funded status of these plans through other income. Any future changes will be recognized either in net income, to the extent they are reflected in periodic benefit cost, or through other comprehensive income.
Defined benefit plans - We maintain a defined benefit pension plan in the U.S. We also maintain a plan in the United Kingdom related to a former disposed business unit in the U.K. The benefits under our defined benefit plans are based upon years of service and employee compensation. The plans are closed to new participants and no additional benefits accrue to existing plan participants. Our funding policy is to contribute annually the minimum amount required under ERISA (or equivalent non-U.S.) regulations plus additional amounts as we deem appropriate.
F-21
We expect to contribute approximately $.7 million to all of our defined benefit pension plans during 2016. Benefit payments to all plan participants out of plan assets are expected to be the equivalent of:
|
Years ending December 31, |
|
Amount |
|
|
|
|
|
(In thousands) |
|
|
|
2016 |
|
$ |
3,652 |
|
|
2017 |
|
|
3,713 |
|
|
2018 |
|
|
3,760 |
|
|
2019 |
|
|
3,773 |
|
|
2020 |
|
|
3,819 |
|
|
Next 5 years |
|
|
19,192 |
|
The funded status of our defined benefit pension plans is presented in the table below.
|
|
|
December 31, |
|
|||||
|
|
|
2014 |
|
|
2015 |
|
||
|
|
|
(In thousands) |
|
|||||
|
Change in projected benefit obligations (PBO): |
|
|
|
|
|
|
|
|
|
Benefit obligations at beginning of the year |
|
$ |
54,658 |
|
|
$ |
61,225 |
|
|
Interest cost |
|
|
2,538 |
|
|
|
2,376 |
|
|
Participant contributions |
|
|
9 |
|
|
|
8 |
|
|
Actuarial losses (gains) |
|
|
8,585 |
|
|
|
(2,579 |
) |
|
Change in currency exchange rates |
|
|
(669 |
) |
|
|
(471 |
) |
|
Benefits paid |
|
|
(3,896 |
) |
|
|
(3,473 |
) |
|
Benefit obligations at end of the year |
|
|
61,225 |
|
|
|
57,086 |
|
|
|
|
|
|
|
|
|
|
|
|
Change in plan assets: |
|
|
|
|
|
|
|
|
|
Fair value of plan assets at beginning of the year |
|
|
49,402 |
|
|
|
48,816 |
|
|
Actual return on plan assets |
|
|
2,404 |
|
|
|
(1,572 |
) |
|
Employer contributions |
|
|
1,553 |
|
|
|
800 |
|
|
Participant contributions |
|
|
9 |
|
|
|
8 |
|
|
Change in currency exchange rates |
|
|
(656 |
) |
|
|
(512 |
) |
|
Benefits paid |
|
|
(3,896 |
) |
|
|
(3,473 |
) |
|
Fair value of plan assets at end of year |
|
|
48,816 |
|
|
|
44,067 |
|
|
Funded status |
|
$ |
(12,409 |
) |
|
$ |
(13,019 |
) |
|
|
|
|
|
|
|
|
|
|
|
Amounts recognized in the balance sheet: |
|
|
|
|
|
|
|
|
|
Noncurrent pension asset |
|
$ |
- |
|
|
$ |
1,303 |
|
|
Accrued pension costs: |
|
|
|
|
|
|
|
|
|
Current |
|
|
(167 |
) |
|
|
(167 |
) |
|
Noncurrent |
|
|
(12,242 |
) |
|
|
(14,155 |
) |
|
Total |
|
$ |
(12,409 |
) |
|
$ |
(13,019 |
) |
|
|
|
|
|
|
|
|
|
|
|
Accumulated other comprehensive loss - actuarial losses, net |
|
$ |
33,135 |
|
|
$ |
34,139 |
|
|
Total |
|
$ |
20,726 |
|
|
$ |
21,120 |
|
|
Accumulated benefit obligations (ABO) |
|
$ |
61,225 |
|
|
$ |
57,086 |
|
The amounts shown in the table above for actuarial losses (gains) at December 31, 2014 and 2015 have not been recognized as components of our periodic defined benefit pension cost as of those dates. These amounts will be recognized as components of our periodic defined benefit cost in future years. These amounts, net of deferred
F-22
income taxes, are recognized in our accumulated other comprehensive income (loss) at December 31, 2014 and 2015. We expect that $1.5 million of the unrecognized actuarial losses will be recognized as a component of our periodic defined benefit pension cost in 2016.
The table below details the changes in other comprehensive income during 2013, 2014 and 2015.
|
|
|
Years ended December 31, |
|
|||||||||
|
|
|
2013 |
|
|
2014 |
|
|
2015 |
|
|||
|
|
|
(In thousands) |
|
|||||||||
|
Changes in plan assets and benefit obligations recognized in other comprehensive income (loss): |
|
|
|
|
|
|
|
|
|
|
|
|
|
Net actuarial gain (loss) arising during the year |
|
$ |
5,305 |
|
|
$ |
(9,519 |
) |
|
$ |
(2,373 |
) |
|
Amortization of unrecognized net actuarial loss |
|
|
1,238 |
|
|
|
934 |
|
|
|
1,340 |
|
|
|
|
|
|
|
|
|
|
|
|
|
|
|
|
Total |
|
$ |
6,543 |
|
|
$ |
(8,585 |
) |
|
$ |
(1,033 |
) |
The components of our net periodic defined benefit pension cost are presented in the table below. The amount shown below for the amortization of unrecognized actuarial losses in 2013, 2014 and 2015, net of deferred income taxes, was recognized as a component of our accumulated other comprehensive income (loss) at December 31, 2012, 2013 and 2014, respectively.
|
|
|
Years ended December 31, |
|
|||||||||
|
|
|
2013 |
|
|
2014 |
|
|
2015 |
|
|||
|
|
|
(In thousands) |
|
|||||||||
|
Net periodic pension cost: |
|
|
|
|
|
|
|
|
|
|
|
|
|
Interest cost on PBO |
|
$ |
2,161 |
|
|
$ |
2,538 |
|
|
$ |
2,376 |
|
|
Expected return on plan assets |
|
|
(3,975 |
) |
|
|
(3,409 |
) |
|
|
(3,353 |
) |
|
Recognized actuarial losses |
|
|
1,238 |
|
|
|
934 |
|
|
|
1,340 |
|
|
|
|
|
|
|
|
|
|
|
|
|
|
|
|
Total |
|
$ |
(576 |
) |
|
$ |
63 |
|
|
$ |
363 |
|
Certain information concerning our defined benefit pension plans is presented in the table below.
|
|
|
December 31, |
|
|||||
|
|
|
2014 |
|
|
2015 |
|
||
|
|
|
(In thousands) |
|
|||||
|
PBO at end of the year |
|
|
|
|
|
|
|
|
|
U.S. plan |
|
$ |
50,351 |
|
|
$ |
47,895 |
|
|
U.K. plan |
|
|
10,874 |
|
|
|
9,191 |
|
|
|
|
|
|
|
|
|
|
|
|
Total |
|
$ |
61,225 |
|
|
$ |
57,086 |
|
|
Fair value of plan assets at end of the year |
|
|
|
|
|
|
|
|
|
U.S. plan |
|
$ |
38,131 |
|
|
$ |
33,573 |
|
|
U.K. plan |
|
|
10,685 |
|
|
|
10,494 |
|
|
|
|
|
|
|
|
|
|
|
|
Total |
|
$ |
48,816 |
|
|
$ |
44,067 |
|
|
Plans for which the ABO exceeds plan assets: |
|
|
|
|
|
|
|
|
|
PBO |
|
$ |
61,225 |
|
|
$ |
47,895 |
|
|
ABO |
|
|
61,225 |
|
|
|
47,895 |
|
|
Fair value of plan assets |
|
|
48,816 |
|
|
|
33,573 |
|
F-23
The weighted-average discount rate assumptions used in determining the actuarial present value of our benefit obligations as of December 31, 2014 and 2015 are 3.8% and 4.0%, respectively. Such weighted-average rates were determined using the projected benefit obligations at each date. Since our plans are closed to new participants and no new additional benefits accrue to existing plan participants, assumptions regarding future compensation levels are not applicable. Consequently, the accumulated benefit obligations for all of our defined benefit pension plans were equal to the projected benefit obligations at December 31, 2014 and 2015.
The weighted-average rate assumptions used in determining the net periodic pension cost for 2013, 2014 and 2015 are presented in the table below. Such weighted-average discount rates were determined using the projected benefit obligations as of the beginning of each year and the weighted-average long-term return on plan assets was determined using the fair value of plan assets as of the beginning of each year.
|
|
|
Years ended December 31, |
|
|||||||||
|
Rate |
|
2013 |
|
|
2014 |
|
|
2015 |
|
|||
|
Discount rate |
|
|
3.7% |
|
|
|
4.5% |
|
|
|
3.8% |
|
|
Long-term return on plan assets |
|
|
9.2% |
|
|
|
7.2% |
|
|
|
7.2% |
|
Variances from actuarially assumed rates will result in increases or decreases in accumulated pension obligations, pension expense and funding requirements in future periods.
At December 31, 2014 and 2015, all of the assets attributable to our U.S. plan were invested in the Combined Master Retirement Trust (CMRT), a collective investment trust sponsored by Contran to permit the collective investment by certain master trusts that fund certain employee benefits plans sponsored by Contran and certain of its affiliates. As previously discussed, prior to his death in December 2013, Mr. Harold Simmons was the sole trustee of the CMRT, and he along with the CMRT’s investment committee, of which Mr. Simmons was a member, actively managed the investments of the CMRT. The CMRT’s long-term investment objective was to provide a rate of return exceeding a composite of broad market equity and fixed income indices (including the S&P 500 and certain Russell indices) while utilizing both third-party investment managers as well as investments directed by Mr. Simmons (prior to his death). During the history of the CMRT from its inception in 1988 through December 31, 2013, the average annual rate of return was 14%. For the year ended December 31, 2013, the assumed long-term rate of return for plan assets invested in the CMRT was 10%. In determining the appropriateness of the long-term rate of return assumption, we primarily relied on the historical rates of return achieved by the CMRT, although we considered other factors as well including, among other things, the investment objectives of the CMRT’s managers and their expectation that such historical returns would in the future continue to be achieved over the long-term.
Following the death of Mr. Simmons in December 2013, the Contran board of directors in January 2014 appointed a financial institution as the new directed trustee of the CMRT, and the Contran board appointed five individuals (all executive officers of Contran) as the new investment committee of the CMRT. During 2014, the new investment committee began a process of reallocating to current and/or new investment managers or various mutual funds and comingled funds the portion of the CMRT assets that had previously been under direct and active management by Mr. Simmons. The reallocation process would be done prudently over a period of time, given the diverse asset composition of this portion of the portfolio and was substantially complete at December 31, 2015. Concurrent with this change in investment strategy in which there is no longer a portion of the CMRT’s assets under direct and active management by Mr. Simmons, and considering the long-term asset mix of the assets of the CMRT and the expected long-term rates of return for such asset components as well as advice from Contran’s actuaries, beginning in 2014 the assumed long-term rate of return for plan assets invested in the CMRT was reduced to 7.5%.
The CMRT unit value is determined semi-monthly, and the plans have the ability to redeem all or any portion of their investment in the CMRT at any time based on the most recent semi-monthly valuation. However, the plans do not have the right to individual assets held by the CMRT and the CMRT has the sole discretion in determining how to meet any redemption request. For purposes of our plan asset disclosure, we consider the investment in the CMRT as a Level 2 input because (i) the CMRT value is established semi-monthly and the plans have the right to redeem their investment in the CMRT, in part or in whole, at any time based on the most recent value and (ii) observable inputs from Level 1 or Level 2 were used to value approximately 80% and 81% of the
F-24
assets of the CMRT at December 31, 2014 and 2015, respectively, as noted below. The aggregate fair value of all of the CMRT assets, including funds of Contran and its other affiliates that also invest in the CMRT, and supplemental asset mix details of the CMRT are as follows:
|
|
|
December 31, |
|
|||||
|
|
|
2014 |
|
|
2015 |
|
||
|
|
|
(In millions) |
|
|||||
|
CMRT asset value |
|
$ |
715.5 |
|
|
$ |
648.8 |
|
|
CMRT fair value input: |
|
|
|
|
|
|
|
|
|
Level 1 |
|
|
67 |
% |
|
|
54 |
% |
|
Level 2 |
|
|
13 |
|
|
|
27 |
|
|
Level 3 |
|
|
20 |
|
|
|
19 |
|
|
|
|
|
|
|
|
|
|
|
|
|
|
|
100 |
% |
|
|
100 |
% |
|
CMRT asset mix: |
|
|
|
|
|
|
|
|
|
Domestic equities, principally publicly traded |
|
|
48 |
% |
|
|
29 |
% |
|
International equities, principally publicly traded |
|
|
11 |
|
|
|
22 |
|
|
Fixed income securities, principally publicly traded |
|
|
32 |
|
|
|
38 |
|
|
Privately managed limited partnerships |
|
|
7 |
|
|
|
5 |
|
|
Hedge funds |
|
|
- |
|
|
|
5 |
|
|
Other, primarily cash |
|
|
2 |
|
|
|
1 |
|
|
|
|
|
|
|
|
|
|
|
|
|
|
|
100 |
% |
|
|
100 |
% |
The composition of our December 31, 2014 and 2015 pension plan assets by fair value level is shown in the table below.
|
|
|
Fair Value Measurements |
|
|||||||||
|
|
|
Total |
|
|
Quoted Prices in Active Markets (Level 1) |
|
|
Significant Other Observable Inputs (Level 2) |
|
|||
|
|
|
(In thousands) |
|
|||||||||
|
December 31, 2014: |
|
|
|
|
|
|
|
|
|
|
|
|
|
CMRT |
|
$ |
38,131 |
|
|
$ |
- |
|
|
$ |
38,131 |
|
|
Other |
|
|
10,685 |
|
|
|
10,685 |
|
|
|
- |
|
|
|
|
|
|
|
|
|
|
|
|
|
|
|
|
Total |
|
$ |
48,816 |
|
|
$ |
10,685 |
|
|
$ |
38,131 |
|
|
|
|
|
|
|
|
|
|
|
|
|
|
|
|
December 31, 2015: |
|
|
|
|
|
|
|
|
|
|
|
|
|
CMRT |
|
$ |
33,573 |
|
|
$ |
- |
|
|
$ |
33,573 |
|
|
Other |
|
|
10,494 |
|
|
|
10,494 |
|
|
|
- |
|
|
|
|
|
|
|
|
|
|
|
|
|
|
|
|
Total |
|
$ |
44,067 |
|
|
$ |
10,494 |
|
|
$ |
33,573 |
|
F-25
Postretirement benefits other than pensions - We provide certain health care and life insurance benefits for eligible retired employees. These plans are closed to new participants, and no additional benefits accrue to existing plan participants. The majority of all retirees are required to contribute a portion of the cost of their benefits and certain current and future retirees are eligible for reduced health care benefits at age 65. We have no OPEB plan assets, rather, we fund postretirement benefits as they are incurred, net of any contributions by the retiree. At December 31, 2015, we currently expect to contribute approximately $.5 million to all OPEB plans during 2016. Contribution to our OPEB plans to cover benefit payments expected to be paid to OPEB plan participants are summarized in the table below:
|
Years ending December 31, |
|
Amount |
|
|
|
|
|
(In thousands) |
|
|
|
2016 |
|
$ |
465 |
|
|
2017 |
|
|
425 |
|
|
2018 |
|
|
386 |
|
|
2019 |
|
|
347 |
|
|
2020 |
|
|
311 |
|
|
Next 5 years |
|
|
1,076 |
|
The funded status of our OPEB plans is presented in the table below.
|
|
|
December 31, |
|
|||||
|
|
|
2014 |
|
|
2015 |
|
||
|
|
|
(In thousands) |
|
|||||
|
Change in accumulated OPEB obligations: |
|
|
|
|
|
|
|
|
|
Obligations at beginning of the year |
|
$ |
3,864 |
|
|
$ |
3,882 |
|
|
Interest cost |
|
|
114 |
|
|
|
108 |
|
|
Actuarial (gain) loss |
|
|
385 |
|
|
|
(336 |
) |
|
Net benefits paid |
|
|
(481 |
) |
|
|
(416 |
) |
|
Obligations at end of the year |
|
|
3,882 |
|
|
|
3,238 |
|
|
Fair value of plan assets |
|
|
- |
|
|
|
- |
|
|
Funded status |
|
$ |
(3,882 |
) |
|
$ |
(3,238 |
) |
|
|
|
|
|
|
|
|
|
|
|
Accrued OPEB costs recognized in the balance sheet: |
|
|
|
|
|
|
|
|
|
Current |
|
$ |
(541 |
) |
|
$ |
(465 |
) |
|
Noncurrent |
|
|
(3,341 |
) |
|
|
(2,773 |
) |
|
Total |
|
$ |
(3,882 |
) |
|
$ |
(3,238 |
) |
|
Accumulated other comprehensive income (loss): |
|
|
|
|
|
|
|
|
|
Net actuarial losses |
|
$ |
1,025 |
|
|
$ |
790 |
|
|
Prior service credit |
|
|
(1,162 |
) |
|
|
(541 |
) |
|
Total |
|
$ |
(137 |
) |
|
$ |
249 |
|
The amounts shown in the table above for unrecognized actuarial losses and prior service credit at December 31, 2014 and 2015 have not been recognized as components of our periodic OPEB cost as of those dates. These amounts will be recognized as components of our periodic OPEB cost in future years. These amounts, net of deferred income taxes, are now recognized in our accumulated other comprehensive income at December 31, 2014 and 2015. We expect to recognize approximately $.5 million of the prior service credit and approximately $.2 million of actuarial gains as a component of our periodic OPEB cost in 2016.
F-26
The table below details the changes in other comprehensive income during 2013, 2014 and 2015.
|
|
|
Years ended December 31, |
|
|||||||||
|
|
|
2013 |
|
|
2014 |
|
|
2015 |
|
|||
|
|
|
(In thousands) |
|
|||||||||
|
Changes in benefit obligations recognized in other comprehensive income (loss): |
|
|
|
|
|
|
|
|
|
|
|
|
|
Net actuarial gain (loss) arising during the year |
|
$ |
240 |
|
|
$ |
(385 |
) |
|
$ |
336 |
|
|
Amortization of unrecognized: |
|
|
|
|
|
|
|
|
|
|
|
|
|
Actuarial gain |
|
|
(146 |
) |
|
|
(176 |
) |
|
|
(101 |
) |
|
Prior service credit |
|
|
(688 |
) |
|
|
(644 |
) |
|
|
(621 |
) |
|
|
|
|
|
|
|
|
|
|
|
|
|
|
|
Total |
|
$ |
(594 |
) |
|
$ |
(1,205 |
) |
|
$ |
(386 |
) |
The components of our periodic OPEB cost are presented in the table below. The amounts shown below for the amortization of unrecognized actuarial gains and prior service credit in 2013, 2014 and 2015, net of deferred income taxes, were recognized as components of our accumulated other comprehensive income at December 31, 2012, 2013 and 2014 respectively.
|
|
|
Years ended December 31, |
|
|||||||||
|
|
|
2013 |
|
|
2014 |
|
|
2015 |
|
|||
|
|
|
(In thousands) |
|
|||||||||
|
Net periodic OPEB cost (income): |
|
|
|
|
|
|
|
|
|
|
|
|
|
Interest cost |
|
$ |
105 |
|
|
$ |
114 |
|
|
$ |
108 |
|
|
Amortization of actuarial gain |
|
|
(146 |
) |
|
|
(176 |
) |
|
|
(101 |
) |
|
Amortization of prior service credit |
|
|
(688 |
) |
|
|
(644 |
) |
|
|
(621 |
) |
|
|
|
|
|
|
|
|
|
|
|
|
|
|
|
Total |
|
$ |
(729 |
) |
|
$ |
(706 |
) |
|
$ |
(614 |
) |
A summary of our key actuarial assumptions used to determine the net benefit obligation as of December 31, 2014 and 2015 follows:
|
|
|
2014 |
|
|
2015 |
|
||
|
Health care inflation: |
|
|
|
|
|
|
|
|
|
Initial rate |
|
|
7.0 |
% |
|
|
7.0 |
% |
|
Ultimate rate |
|
|
5.0 |
% |
|
|
5.0 |
% |
|
Year of ultimate rate achievement |
|
|
2021 |
|
|
|
2021 |
|
|
Discount rate |
|
|
3.0 |
% |
|
|
3.2 |
% |
The assumed health care cost trend rates have an effect on the amount we report for health care plans. A one-percent change in assumed health care cost trend rates would not have a material effect on the net periodic OPEB cost for 2015 or on the accumulated OPEB obligation at December 31, 2015.
The weighted-average discount rate used in determining the net periodic OPEB cost for 2015 was 3.0% (the rate was 3.2% in 2014 and 2.5% in 2013). The weighted-average rate was determined using the projected benefit obligation as of the beginning of each year.
Variances from actuarially-assumed rates will result in additional increases or decreases in accumulated OPEB obligations, net periodic OPEB cost and funding requirements in future periods.
F-27
Note 15 - Related party transactions:
We may be deemed to be controlled by Ms. Lisa Simmons and Ms. Connelly. See Note 1. Corporations that may be deemed to be controlled by or affiliated with such individuals sometimes engage in (a) intercorporate transactions such as guarantees, management and expense sharing arrangements, shared fee arrangements, joint ventures, partnerships, loans, options, advances of funds on open account, and sales, leases and exchanges of assets, including securities issued by both related and unrelated parties and (b) common investment and acquisition strategies, business combinations, reorganizations, recapitalizations, securities repurchases, and purchases and sales (and other acquisitions and dispositions) of subsidiaries, divisions or other business units, which transactions have involved both related and unrelated parties and have included transactions which resulted in the acquisition by one related party of a publicly-held noncontrolling interest in another related party. While no transactions of the type described above are planned or proposed with respect to us other than as set forth in these financial statements, we continuously consider, review and evaluate, and understand that Contran and related entities consider, review and evaluate such transactions. Depending upon the business, tax and other objectives then relevant, it is possible that we might be a party to one or more such transactions in the future.
Current payables to affiliates are summarized in the table below:
|
|
December 31, |
|
|||||
|
|
2014 |
|
|
2015 |
|
||
|
|
(In thousands) |
|
|||||
|
Current payables to affiliates: |
|
|
|
|
|
|
|
|
Income taxes payable to Valhi |
$ |
583 |
|
|
$ |
40 |
|
|
Other - trade items |
|
76 |
|
|
|
180 |
|
|
Total |
$ |
659 |
|
|
$ |
220 |
|
From time to time, we may have loans and advances outstanding between us and various related parties, pursuant to term and demand notes. We generally enter into these loans and advances for cash management purposes. When we loan funds to related parties, we are generally able to earn a higher rate of return on the loan than the lender would earn if the funds were invested in other instruments and when we borrow from related parties, we are generally able to pay a lower rate of interest than we would pay if we borrowed from unrelated parties. While certain of such loans may be of a lesser credit quality than cash equivalent instruments otherwise available to us, we believe that we have evaluated the credit risks involved and reflected those credit risks in the terms of the applicable loans. In this regard, prior to 2013, we entered into a promissory note with Valhi, whereby, as subsequently amended, we may borrow up to $40 million. During 2013, 2014 and 2015 we had no borrowings under this note. See Note 11.
Under the terms of various intercorporate services agreements (ISAs) we enter into with Contran, employees of Contran will provide certain management, tax planning, financial and administrative services to the company on a fee basis. Such charges are based upon estimates of the time devoted by the Contran employees to our affairs and the compensation and other expenses associated with those persons. Because of the large number of companies affiliated with Contran, we believe we benefit from cost savings and economies of scale gained by not having certain management, financial and administrative staffs duplicated at each entity, thus allowing certain Contran employees to provide services to multiple companies but only be compensated by Contran. The net ISA fees charged to us by Contran, (including amounts attributable to Kronos for all periods), approved by the independent members of the applicable board of directors, aggregated approximately $24.1 million in 2013, $21.9 million in 2014 and $23.3 million in 2015. This agreement is renewed annually, and we expect to pay approximately $24.5 million under the ISA during 2016.
Contran and certain of its subsidiaries and affiliates, including us, purchase certain of their insurance policies as a group, with the costs of the jointly-owned policies being apportioned among the participating companies. Tall Pines Insurance Company and EWI RE, Inc. provide for or broker certain insurance policies for Contran and certain of its subsidiaries and affiliates, including us. Tall Pines purchases reinsurance from third-party insurance carriers with an A.M. Best Company rating of generally at least A- (excellent) for substantially all of the risks it underwrites. Tall Pines is a subsidiary of Valhi and EWI is a subsidiary of Valhi and us. Consistent with
F-28
insurance industry practices, Tall Pines and EWI receive commissions from insurance and reinsurance underwriters and/or assess fees for the policies that they provide or broker. The aggregate premiums paid to Tall Pines and EWI by us (including amounts attributable to Kronos for all periods, including its Louisiana Pigment Company joint venture), were $12.7 million in 2013, $12.0 million in 2014 and $12.2 million in 2015. These amounts principally represent payments for insurance premiums, which include premiums or fees paid to Tall Pines or fees paid to EWI. These amounts also include payments to insurers or reinsurers through EWI for the reimbursement of claims within our applicable deductible or retention ranges that such insurers or reinsurers paid to third parties on our behalf, as well as amounts for claims and risk management services and various other third-party fees and expenses incurred by the program. We expect these relationships with Tall Pines and EWI will continue in 2016.
With respect to certain of such jointly-owned policies, it is possible that unusually large losses incurred by one or more insured party during a given policy period could leave the other participating companies without adequate coverage under that policy for the balance of the policy period. As a result, Contran and certain of its subsidiaries and affiliates, including us, have entered into a loss sharing agreement under which any uninsured loss is shared by those entities who have submitted claims under the relevant policy. We believe the benefits in the form of reduced premiums and broader coverage associated with the group coverage for such policies justifies the risk associated with the potential for any uninsured loss.
Contran and certain of its subsidiaries, including us, participate in a combined information technology data recovery program that Contran provides from a data recovery center that it established. Pursuant to the program, Contran and certain of its subsidiaries, including us, as a group share information technology data recovery services. The program apportions its costs among the participating companies. The aggregate amount we paid to Contran for such services (including amounts attributable to Kronos for all periods) was $110,000 in 2013, $145,000 in 2014 and $180,000 in 2015. We expect that this relationship with Contran will continue in 2016.
Note 16 - Other operating income (expense):
We have agreements with certain insurance carriers pursuant to which the carriers reimburse us for a portion of our past lead pigment and asbestos litigation defense costs. Insurance recoveries include amounts we received from these insurance carriers. The majority of the $3.7 million of insurance recoveries we recognized in 2015 relate to a settlement we reached with one of our insurance carriers in the first quarter of 2015 in which they agreed to reimburse us for a portion of our past litigation defense costs. The majority of the $10.4 million of insurance recoveries we recognized in 2014 relate to a settlement we reached with another one of our insurance carriers in September 2014 in which they agreed to reimburse us for a portion of our past litigation defense costs.
The agreements with certain of our insurance carriers also include reimbursement for a portion of our future litigation defense costs. We are not able to determine how much we will ultimately recover from these carriers for defense costs incurred by us because of certain issues that arise regarding which defense costs qualify for reimbursement. Accordingly, these insurance recoveries are recognized when the receipt is probable and the amount is determinable. Substantially all of the insurance recoveries received in 2013 are reimbursement for ongoing litigation defense costs. See Note 17.
Note 17 - Commitments and contingencies:
Lead pigment litigation
Our former operations included the manufacture of lead pigments for use in paint and lead-based paint. We, other former manufacturers of lead pigments for use in paint and lead-based paint (together, the “former pigment manufacturers”), and the Lead Industries Association (LIA), which discontinued business operations in 2002, have been named as defendants in various legal proceedings seeking damages for personal injury, property damage and governmental expenditures allegedly caused by the use of lead-based paints. Certain of these actions have been filed by or on behalf of states, counties, cities or their public housing authorities and school districts, and certain others have been asserted as class actions. These lawsuits seek recovery under a variety of theories, including public and private nuisance, negligent product design, negligent failure to warn, strict liability, breach of warranty, conspiracy/concert of action, aiding and abetting, enterprise liability, market share or risk contribution
F-29
liability, intentional tort, fraud and misrepresentation, violations of state consumer protection statutes, supplier negligence and similar claims.
The plaintiffs in these actions generally seek to impose on the defendants responsibility for lead paint abatement and health concerns associated with the use of lead-based paints, including damages for personal injury, contribution and/or indemnification for medical expenses, medical monitoring expenses and costs for educational programs. To the extent the plaintiffs seek compensatory or punitive damages in these actions, such damages are generally unspecified. In some cases, the damages are unspecified pursuant to the requirements of applicable state law. A number of cases are inactive or have been dismissed or withdrawn. Most of the remaining cases are in various pre-trial stages. Some are on appeal following dismissal or summary judgment rulings or a trial verdict in favor of either the defendants or the plaintiffs.
We believe that these actions are without merit, and we intend to continue to deny all allegations of wrongdoing and liability and to defend against all actions vigorously. We do not believe it is probable that we have incurred any liability with respect to all of the lead pigment litigation cases to which we are a party, and liability to us that may result, if any, in this regard cannot be reasonably estimated, because:
|
|
● |
we have never settled any of the market share, intentional tort, fraud, nuisance, supplier negligence, breach of warranty, conspiracy, misrepresentation, aiding and abetting, enterprise liability, or statutory cases, |
|
|
● |
no final, non-appealable adverse verdicts have ever been entered against us, and |
|
|
● |
we have never ultimately been found liable with respect to any such litigation matters, including over 100 cases over a twenty-year period for which we were previously a party and for which we have been dismissed without any finding of liability. |
Accordingly, we have not accrued any amounts for any of the pending lead pigment and lead-based paint litigation cases filed by or on behalf of states, counties, cities or their public housing authorities and school districts, or those asserted as class actions. In addition, we have determined that liability to us which may result, if any, cannot be reasonably estimated because there is no prior history of a loss of this nature on which an estimate could be made and there is no substantive information available upon which an estimate could be based.
In one of these lead pigment cases, in April 2000 we were served with a complaint in County of Santa Clara v. Atlantic Richfield Company, et al. (Superior Court of the State of California, County of Santa Clara, Case No. 1-00-CV-788657) brought by a number of California government entities against the former pigment manufacturers, the LIA and certain paint manufacturers. The County of Santa Clara sought to recover compensatory damages for funds the plaintiffs have expended or would in the future expend for medical treatment, educational expenses, abatement or other costs due to exposure to, or potential exposure to, lead paint, disgorgement of profit, and punitive damages. In July 2003, the trial judge granted defendants’ motion to dismiss all remaining claims. Plaintiffs appealed and the intermediate appellate court reinstated public nuisance, negligence, strict liability, and fraud claims in March 2006. A fourth amended complaint was filed in March 2011 on behalf of The People of California by the County Attorneys of Alameda, Ventura, Solano, San Mateo, Los Angeles and Santa Clara, and the City Attorneys of San Francisco, San Diego and Oakland. That complaint alleged that the presence of lead paint created a public nuisance in each of the prosecuting attorney jurisdictions and sought its abatement. In July and August 2013, the case was tried. In January 2014, the Judge issued a judgment finding us, The Sherwin Williams Company and ConAgra Grocery Products Company jointly and severally liable for the abatement of lead paint in pre-1980 homes, and ordered the defendants to pay an aggregate $1.15 billion to the people of the State of California to fund such abatement. In February 2014, we filed a motion for a new trial, and in March 2014 the court denied the motion. Subsequently in March 2014, we filed a notice of appeal with the Sixth District Court of Appeal for the State of California and the appeal is proceeding with the appellate court. NL believes that this judgment is inconsistent with California law and is unsupported by the evidence, and we will defend vigorously against all claims.
F-30
The Santa Clara case is unusual in that this is the second time that an adverse verdict in the lead pigment litigation has been entered against NL (the first adverse verdict against NL was ultimately overturned on appeal). We have concluded that the likelihood of a loss in this case has not reached a standard of “probable” as contemplated by ASC 450, given (i) the substantive, substantial and meritorious grounds on which the adverse verdict in the Santa Clara case will be appealed, (ii) the uniqueness of the Santa Clara verdict (i.e. no final, non-appealable verdicts have ever been rendered against us, or any of the other former lead pigment manufacturers, based on the public nuisance theory of liability or otherwise), and (iii) the rejection of the public nuisance theory of liability as it relates to lead pigment matters in many other jurisdictions (no jurisdiction in which a plaintiff has asserted a public nuisance theory of liability has ever successfully been upheld). In addition, liability that may result, if any, cannot be reasonably estimated, as NL continues to have no basis on which an estimate of liability could be made, as discussed above. However, as with any legal proceeding, there is no assurance that any appeal would be successful, and it is reasonably possible, based on the outcome of the appeals process, that NL may in the future incur some liability resulting in the recognition of a loss contingency accrual that could have a material adverse impact on our results of operations, financial position and liquidity.
New cases may continue to be filed against us. We cannot assure you that we will not incur liability in the future in respect of any of the pending or possible litigation in view of the inherent uncertainties involved in court and jury rulings. In the future, if new information regarding such matters becomes available to us (such as a final, non-appealable adverse verdict against us or otherwise ultimately being found liable with respect to such matters), at that time we would consider such information in evaluating any remaining cases then-pending against us as to whether it might then have become probable we have incurred liability with respect to these matters, and whether such liability, if any, could have become reasonably estimable. The resolution of any of these cases could result in the recognition of a loss contingency accrual that could have a material adverse impact on our net income for the interim or annual period during which such liability is recognized and a material adverse impact on our consolidated financial condition and liquidity.
Environmental matters and litigation
Our operations are governed by various environmental laws and regulations. Certain of our businesses are and have been engaged in the handling, manufacture or use of substances or compounds that may be considered toxic or hazardous within the meaning of applicable environmental laws and regulations. As with other companies engaged in similar businesses, certain of our past and current operations and products have the potential to cause environmental or other damage. We have implemented and continue to implement various policies and programs in an effort to minimize these risks. Our policy is to maintain compliance with applicable environmental laws and regulations at all of our plants and to strive to improve environmental performance. From time to time, we may be subject to environmental regulatory enforcement under U.S. and non-U.S. statutes, the resolution of which typically involves the establishment of compliance programs. It is possible that future developments, such as stricter requirements of environmental laws and enforcement policies, could adversely affect our production, handling, use, storage, transportation, sale or disposal of such substances. We believe that all of our facilities are in substantial compliance with applicable environmental laws.
Certain properties and facilities used in our former operations, including divested primary and secondary lead smelters and former mining locations, are the subject of civil litigation, administrative proceedings or investigations arising under federal and state environmental laws and common law. Additionally, in connection with past operating practices, we are currently involved as a defendant, potentially responsible party (PRP) or both, pursuant to the Comprehensive Environmental Response, Compensation and Liability Act, as amended by the Superfund Amendments and Reauthorization Act (CERCLA), and similar state laws in various governmental and private actions associated with waste disposal sites, mining locations, and facilities that we or our predecessors, our subsidiaries or their predecessors currently or previously owned, operated or used, certain of which are on the United States Environmental Protection Agency’s (EPA) Superfund National Priorities List or similar state lists. These proceedings seek cleanup costs, damages for personal injury or property damage and/or damages for injury to natural resources. Certain of these proceedings involve claims for substantial amounts. Although we may be jointly and severally liable for these costs, in most cases we are only one of a number of PRPs who may also be jointly and severally liable, and among whom costs may be shared or allocated. In addition, we are occasionally named as a party in a number of personal injury lawsuits filed in various jurisdictions alleging claims related to environmental conditions alleged to have resulted from our operations.
F-31
Obligations associated with environmental remediation and related matters are difficult to assess and estimate for numerous reasons including the:
|
|
● |
complexity and differing interpretations of governmental regulations, |
|
|
● |
number of PRPs and their ability or willingness to fund such allocation of costs, |
|
|
● |
financial capabilities of the PRPs and the allocation of costs among them, |
|
|
● |
solvency of other PRPs, |
|
|
● |
multiplicity of possible solutions, |
|
|
● |
number of years of investigatory, remedial and monitoring activity required, |
|
|
● |
uncertainty over the extent, if any, to which our former operations might have contributed to the conditions allegedly giving rise to such personal injury, property damage, natural resource and related claims and |
|
|
● |
number of years between former operations and notice of claims and lack of information and documents about the former operations. |
In addition, the imposition of more stringent standards or requirements under environmental laws or regulations, new developments or changes regarding site cleanup costs or the allocation of costs among PRPs, solvency of other PRPs, the results of future testing and analysis undertaken with respect to certain sites or a determination that we are potentially responsible for the release of hazardous substances at other sites, could cause our expenditures to exceed our current estimates. We cannot assure you that actual costs will not exceed accrued amounts or the upper end of the range for sites for which estimates have been made, and we cannot assure you that costs will not be incurred for sites where no estimates presently can be made. Further, additional environmental and related matters may arise in the future. If we were to incur any future liability, this could have a material adverse effect on our consolidated financial statements, results of operations and liquidity.
We record liabilities related to environmental remediation and related matters (including costs associated with damages for personal injury or property damage and/or damages for injury to natural resources) when estimated future expenditures are probable and reasonably estimable. We adjust such accruals as further information becomes available to us or as circumstances change. Unless the amounts and timing of such estimated future expenditures are fixed and reasonably determinable, we generally do not discount estimated future expenditures to their present value due to the uncertainty of the timing of the payout. We recognize recoveries of costs from other parties, if any, as assets when their receipt is deemed probable. At December 31, 2014 and 2015, we have not recognized any receivables for recoveries.
We do not know and cannot estimate the exact time frame over which we will make payments for our accrued environmental and related costs. The timing of payments depends upon a number of factors, including but not limited to the timing of the actual remediation process; which in turn depends on factors outside of our control. At each balance sheet date, we estimate the amount of our accrued environmental and related costs which we expect to pay within the next twelve months, and we classify this estimate as a current liability. We classify the remaining accrued environmental costs as a noncurrent liability.
F-32
The table below presents a summary of the activity in our accrued environmental costs during the past three years. The amount charged to expense is included in corporate expense on our Consolidated Statements of Operations.
|
|
Years ended December 31, |
|
|||||||||
|
|
2013 |
|
|
2014 |
|
|
2015 |
|
|||
|
|
(In thousands) |
|
|||||||||
|
Balance at the beginning of the year |
$ |
48,006 |
|
|
$ |
113,636 |
|
|
$ |
110,015 |
|
|
Additions charged to expense, net |
|
68,929 |
|
|
|
6,485 |
|
|
|
4,370 |
|
|
Payments, net |
|
(3,299 |
) |
|
|
(10,106 |
) |
|
|
(1,252 |
) |
|
|
|
|
|
|
|
|
|
|
|
|
|
|
Balance at the end of the year |
$ |
113,636 |
|
|
$ |
110,015 |
|
|
$ |
113,133 |
|
|
|
|
|
|
|
|
|
|
|
|
|
|
|
Amounts recognized in the balance sheet: |
|
|
|
|
|
|
|
|
|
|
|
|
Current liability |
$ |
4,859 |
|
|
$ |
6,984 |
|
|
$ |
8,668 |
|
|
Noncurrent liability |
|
108,777 |
|
|
|
103,031 |
|
|
|
104,465 |
|
|
|
|
|
|
|
|
|
|
|
|
|
|
|
Balance at the end of the year |
$ |
113,636 |
|
|
$ |
110,015 |
|
|
$ |
113,133 |
|
Of the $10.1 million payments in 2014, $2.9 million relates to certain payments which were previously discounted to their present value because the timing and amounts of such payments were fixed and determinable. Such payments were discounted to present value using a 3.0% discount rate using the interest method for years 2011 through 2016. The amount of such discount charged to expense in any individual year was not material. Those payments aggregated $6.0 million on an undiscounted basis. We paid $2.0 million prior to 2013, $1.0 million in 2013 and $2.9 million (including a $1.9 million prepayment in full) in 2014.
On a quarterly basis, we evaluate the potential range of our liability for environmental remediation and related costs at sites where we have been named as a PRP or defendant, including sites for which our wholly-owned environmental management subsidiary, NL Environmental Management Services, Inc., (EMS), has contractually assumed our obligations. At December 31, 2015, we had accrued approximately $113 million related to approximately 42 sites associated with remediation and related matters that we believe are at the present time and/or in their current phase reasonably estimable. The upper end of the range of reasonably possible costs to us for remediation and related matters for which we believe it is possible to estimate costs is approximately $166 million, including the amount currently accrued. These accruals have not been discounted to present value.
We believe that it is not possible to estimate the range of costs for certain sites. At December 31, 2015, there were approximately 5 sites for which we are not currently able to estimate a range of costs. For these sites, generally the investigation is in the early stages, and we are unable to determine whether or not we actually had any association with the site, the nature of our responsibility, for the contamination at the site, if any, and the extent of contamination at and cost to remediate the site. The timing and availability of information on these sites is dependent on events outside of our control, such as when the party alleging liability provides information to us. At certain of these previously inactive sites, we have received general and special notices of liability from the EPA and/or state agencies alleging that we, sometimes with other PRPs, are liable for past and future costs of remediating environmental contamination allegedly caused by former operations. These notifications may assert that we, along with any other alleged PRPs, are liable for past and/or future clean-up costs. As further information becomes available to us for any of these sites which would allow us to estimate a range of costs, we would at that time adjust our accruals. Any such adjustment could result in the recognition of an accrual that would have a material effect on our consolidated financial statements, results of operations and liquidity.
Insurance coverage claims
We are involved in certain legal proceedings with a number of our former insurance carriers regarding the nature and extent of the carriers’ obligations to us under insurance policies with respect to certain lead pigment and asbestos lawsuits. The issue of whether insurance coverage for defense costs or indemnity or both will be found to
F-33
exist for our lead pigment and asbestos litigation depends upon a variety of factors and we cannot assure you that such insurance coverage will be available.
We have agreements with three former insurance carriers pursuant to which the carriers reimburse us for a portion of our future lead pigment litigation defense costs, and one such carrier reimburses us for a portion of our future asbestos litigation defense costs. We are not able to determine how much we will ultimately recover from these carriers for defense costs incurred by us because of certain issues that arise regarding which defense costs qualify for reimbursement. While we continue to seek additional insurance recoveries, we do not know if we will be successful in obtaining reimbursement for either defense costs or indemnity. Accordingly, we recognize insurance recoveries in income only when receipt of the recovery is probable and we are able to reasonably estimate the amount of the recovery.
In January 2014, we were served with a complaint in Certain Underwriters at Lloyds, London, et al v. NL Industries, Inc. (Supreme Court of the State of New York, County of New York, Index No. 14/650103). The plaintiff, a former insurance carrier of ours, is seeking a declaratory judgment of its obligations to us under insurance policies issued to us by the plaintiff with respect to certain lead pigment lawsuits. The case is now proceeding in the trial court. We believe the action is without merit and intend to defend NL’s rights in this action vigorously.
In February 2014, we were served with a complaint in Zurich American Insurance Company, as successor-in-interest to Zurich Insurance Company, U.S. Branch vs. NL Industries, Inc., and The People of the State of California, acting by and through county Counsels of Santa Clara, Alameda, Los Angeles, Monterey, San Mateo, Solano and Ventura Counties and the city Attorneys of Oakland, San Diego, and San Francisco, et al (Superior Court of California, County of Santa Clara, Case No.: 1-14-CV-259924). In January 2015, an Order of Deposit Under CCP § 572 was entered by the trial court.
Other litigation
We have been named as a defendant in various lawsuits in several jurisdictions, alleging personal injuries as a result of occupational exposure primarily to products manufactured by our former operations containing asbestos, silica and/or mixed dust. In addition, some plaintiffs allege exposure to asbestos from working in various facilities previously owned and/or operated by us. There are 102 of these types of cases pending, involving a total of approximately 588 plaintiffs. In addition, the claims of approximately 8,692 plaintiffs have been administratively dismissed or placed on the inactive docket in Ohio state courts. We do not expect these claims will be re-opened unless the plaintiffs meet the courts’ medical criteria for asbestos-related claims. We have not accrued any amounts for this litigation because of the uncertainty of liability and inability to reasonably estimate the liability, if any. To date, we have not been adjudicated liable in any of these matters.
Based on information available to us, including:
|
|
● |
facts concerning historical operations, |
|
|
● |
the rate of new claims, |
|
|
● |
the number of claims from which we have been dismissed, and |
|
|
● |
our prior experience in the defense of these matters, |
we believe that the range of reasonably possible outcomes of these matters will be consistent with our historical costs (which are not material). Furthermore, we do not expect any reasonably possible outcome would involve amounts material to our consolidated financial position, results of operations or liquidity. We have sought and will continue to vigorously seek, dismissal and/or a finding of no liability from each claim. In addition, from time to time, we have received notices regarding asbestos or silica claims purporting to be brought against former subsidiaries, including notices provided to insurers with which we have entered into settlements extinguishing certain insurance policies. These insurers may seek indemnification from us.
In addition to the litigation described above, we and our affiliates are also involved in various other environmental, contractual, product liability, patent (or intellectual property), employment and other claims and
F-34
disputes incidental to present and former businesses. In certain cases, we have insurance coverage for these items, although we do not expect additional material insurance coverage for environmental matters.
We currently believe the disposition of all of these various other claims and disputes, individually and in the aggregate, should not have a material adverse effect on our consolidated financial position, results of operations or liquidity beyond the accruals already provided.
Concentrations of credit risk
Component products are sold primarily in North America to original equipment manufacturers. The ten largest customers related to our operations accounted for approximately 42% in 2013, 47% in 2014 and 48% in 2015. United States Postal Service, a customer of CompX’s Security Products business accounted for 13% of total sales in 2014 and 2015. Harley Davidson, also a customer of CompX’s Security Products business, accounted for approximately 12% of total sales in each of 2013, 2014 and 2015.
Other
Rent expense principally for CompX operating facilities and equipment was not significant in 2013, 2014 or 2015 and at December 31, 2015, future minimum rentals under noncancellable operating leases are also not significant.
Income taxes
We and Valhi are a party to a tax sharing agreement providing for the allocation of tax liabilities and tax payments as described in Note 1. Under applicable law, we, as well as every other member of the Contran Tax Group, are each jointly and severally liable for the aggregate federal income tax liability of Contran and the other companies included in the Contran Tax Group for all periods in which we are included in the Contran Tax Group. Valhi has agreed, however, to indemnify us for any liability for income taxes of the Contran Tax Group in excess of our tax liability computed in accordance with the tax sharing agreement.
Note 18 - Financial instruments:
The following table summarizes the valuation of our marketable securities on a fair value basis as of December 31, 2014 and 2015:
|
|
Fair value measurements |
|
|||||||||||||
|
|
Total |
|
|
Quoted prices in active markets (Level 1) |
|
|
Significant other observable inputs (Level 2) |
|
|
Significant unobservable inputs (Level 3) |
|
||||
|
|
(In thousands) |
|
|||||||||||||
|
December 31, 2014 |
|
|
|
|
|
|
|
|
|
|
|
|
|
|
|
|
Marketable securities |
$ |
92,131 |
|
|
$ |
92,131 |
|
|
$ |
- |
|
|
$ |
- |
|
|
December 31, 2015 |
|
|
|
|
|
|
|
|
|
|
|
|
|
|
|
|
Marketable securities |
$ |
19,260 |
|
|
$ |
19,260 |
|
|
$ |
- |
|
|
$ |
- |
|
F-35
The following table presents the financial instruments that are not carried at fair value but which require fair value disclosure as December 31, 2014 and 2015:
|
|
December 31, 2014 |
|
|
December 31, 2015 |
|
||||||||||
|
|
Carrying |
|
|
Fair |
|
|
Carrying |
|
|
Fair |
|
||||
|
|
Amount |
|
|
Value |
|
|
Amount |
|
|
Value |
|
||||
|
|
(In thousands) |
|
|||||||||||||
|
Cash, cash equivalents and restricted cash |
$ |
77,975 |
|
|
$ |
77,975 |
|
|
$ |
100,981 |
|
|
$ |
100,981 |
|
|
Noncontrolling interest in CompX common stock |
|
14,428 |
|
|
|
19,936 |
|
|
|
15,301 |
|
|
|
18,878 |
|
The fair value of our noncontrolling interest in CompX stockholders’ equity is based upon its quoted market price at each balance sheet date, which represents Level 1 inputs. Due to their near-term maturities, the carrying amounts of accounts receivable and accounts payable are considered equivalent to fair value.
Note 19 – Recent accounting pronouncements:
Adopted
In November 2015, the FASB issued ASU 2015-17, Income Taxes (Topic 740): Balance Sheet Classification of Deferred Taxes, which eliminates the requirement to separate deferred income tax assets and liabilities into current and noncurrent amounts. Under the ASU all deferred income tax assets and liabilities will be classified as noncurrent. The current requirement that deferred income tax assets and liabilities of a tax-paying component of an entity be offset and presented as a single amount is not affected by the amendments in this ASU. This amendment is effective for us beginning in the first quarter of 2017; however early adoption is permitted. In addition, prospective or retrospective application is permitted. We have elected to adopt this ASU retrospectively beginning with this Annual Report and accordingly we have presented all deferred income tax assets and liabilities as noncurrent in our Consolidated Balance Sheets and related Footnotes. At December 31, 2014, we had previously recognized a current deferred income tax asset of $4.6 million and a noncurrent deferred income tax liability of $87.7 million. As a result of the retrospective application of this ASU, we no longer have a current deferred income tax asset recognized at December 31, 2014, and the noncurrent deferred income tax liability we now have recognized at December 31, 2014 is $83.1 million.
Pending Adoption
In May 2014, the Financial Accounting Standards Board (FASB) issued Accounting Standards Update (ASU) No. 2014-09, Revenue from Contracts with Customers (Topic 606). This standard replaces existing revenue recognition guidance, which in many cases was tailored for specific industries, with a uniform accounting standard applicable to all industries and transactions. The new standard, as amended, is currently effective for us beginning with the first quarter of 2018. Entities may elect to adopt ASU No. 2014-09 retrospectively for all periods for all contracts and transactions which occurred during the period (with a few exceptions for practical expediency) or retrospectively with a cumulative effect recognized as of the date of adoption. ASU No. 2014-09 is a fundamental rewriting of existing GAAP with respect to revenue recognition, and we are still evaluating the effect the Standard will have on our Consolidated Financial Statements. We currently expect to adopt the standard in the first quarter of 2018. In addition, we have not yet determined the method we will use to adopt the Standard.
In January 2016, the FASB issued ASU 2016-01, Financial Instruments-Overall (Subtopic 825-10): Recognition and Measurement of Financial Assets and Financial Liabilities, which addresses certain aspects related to the recognition, measurement, presentation and disclosure of financial instruments. The ASU requires equity investments (except for those accounted for under the equity method of accounting or those that result in the consolidation of the investee) to generally be measured at fair value with changes in fair value recognized in net income. The amendment also requires a number of other changes, including among others: simplifying the impairment assessment for equity instruments without readily determinable fair values; eliminating the requirement for public business entities to disclose method and assumptions used to determine fair value for financial instruments measured at amortized cost; requiring an exit price notion when measuring the fair value of financial instruments for disclosure purposes; and requiring separate presentation of financial assets and liabilities by measurement category and form of asset. The changes indicated above will be effective for us beginning in the first
F-36
quarter of 2018, with prospective application required, and early adoption is not permitted. The most significant aspect of adopting this ASU will be the requirement to recognize changes in fair value of our available-for-sale marketable equity securities in net income (currently changes in fair value of such securities are recognized in other comprehensive income).
Note 20 - Quarterly results of operations (unaudited):
|
|
|
Quarter ended |
|
|||||||||||||
|
|
|
March 31 |
|
|
June 30 |
|
|
Sept. 30 |
|
|
Dec. 31 |
|
||||
|
|
|
(In millions, except per share data) |
|
|||||||||||||
|
Year ended December 31, 2014 |
|
|
|
|
|
|
|
|
|
|
|
|
|
|
|
|
|
Net sales |
|
$ |
25.8 |
|
|
$ |
26.8 |
|
|
$ |
26.5 |
|
|
$ |
24.7 |
|
|
Gross margin |
|
|
7.7 |
|
|
|
8.6 |
|
|
|
8.2 |
|
|
|
7.7 |
|
|
Net income |
|
|
4.1 |
|
|
|
5.8 |
|
|
|
14.1 |
|
|
|
5.6 |
|
|
Net income attributable to NL stockholders |
|
|
3.7 |
|
|
|
5.5 |
|
|
|
13.9 |
|
|
|
5.4 |
|
|
Income per common share attributable to NL stockholders |
|
$ |
.08 |
|
|
$ |
.11 |
|
|
$ |
.29 |
|
|
$ |
.11 |
|
|
|
|
|
|
|
|
|
|
|
|
|
|
|
|
|
|
|
|
Year ended December 31, 2015 |
|
|
|
|
|
|
|
|
|
|
|
|
|
|
|
|
|
Net sales |
|
$ |
27.9 |
|
|
$ |
28.9 |
|
|
$ |
26.5 |
|
|
$ |
25.7 |
|
|
Gross margin |
|
|
8.6 |
|
|
|
9.1 |
|
|
|
8.1 |
|
|
|
7.6 |
|
|
Net income (loss) |
|
|
10.3 |
|
|
|
(28.8 |
) |
|
|
1.2 |
|
|
|
(5.4 |
) |
|
Net income (loss) attributable to NL stockholders |
|
|
10.0 |
|
|
|
(29.2 |
) |
|
|
.9 |
|
|
|
(5.6 |
) |
|
Income (loss) per common share attributable to NL stockholders |
|
$ |
.21 |
|
|
$ |
(.60 |
) |
|
$ |
.02 |
|
|
$ |
(.11 |
) |
We recognized the following amounts during 2014:
|
|
· |
aggregate pre-tax income of $10.4 million ($.8 million, $.4 million, $8.8 million, and $.4 million in the first, second, third, and fourth quarter, respectively) related to insurance recoveries, see Note 17, |
|
|
· |
income of $.02 per share, net of income taxes, included in our equity in Kronos related to a net reduction of Kronos’ reserve for uncertain tax positions recognized in the second quarter of 2014. |
We recognized the following amounts during 2015:
|
|
· |
aggregate pre-tax income of $3.7 million ($3.1 million, $.3 million, $.1 million, and $.2 million in the first, second, third, and fourth quarter, respectively) related to insurance recoveries, see Note 17, |
|
|
· |
a first quarter non-cash income tax benefit in 2015 related to a net reduction in our reserve for uncertain tax positions of $3.0 million, see Note 13, |
|
|
· |
loss of $.65 per share, net of income taxes, included in our equity in losses of Kronos related to Kronos’ recognition of a deferred income tax asset valuation allowance related to its German and Belgian operations primarily in the second quarter, |
|
|
· |
loss of $.07 per share, net of income taxes, primarily in the second quarter included in our equity in losses of Kronos related to certain workforce reduction charges recognized by Kronos, |
|
|
· |
loss of $.03 per share, net of income taxes, in the third quarter included in our equity in losses of Kronos related to Kronos’ recognition of an other-than-temporary impairment charge in a marketable equity security. |
The sum of the quarterly per share amounts may not equal the annual per share amounts due to relative changes in the weighted average number of shares used in the per share computations.
F-37