Attached files
| file | filename |
|---|---|
| EX-21.1 - LISTING OF SUBSIDIARIES - ERICKSON INC. | eac-20151231xexx211.htm |
| EX-32.1 - CERTIFICATIONS OF CHIEF EXECUTIVE OFFICER AND CHIEF FINANCIAL OFFICER - ERICKSON INC. | eac-20151231xexx321.htm |
| EX-23.1 - CONSENT OF INDEPENDENT REGISTERED PUBLIC ACCOUNTING FIRM GRANT THORNTON LLP - ERICKSON INC. | eac-20151231xexx231.htm |
| EX-31.2 - CERTIFICATION OF CHIEF FINANCIAL OFFICER - ERICKSON INC. | eac-20151231xexx312.htm |
| EX-31.1 - CERTIFICATION OF CHIEF EXECUTIVE OFFICER - ERICKSON INC. | eac-20151231xexx311.htm |
UNITED STATES
SECURITIES AND EXCHANGE COMMISSION
Washington, D.C. 20549
_________________________
FORM 10-K
_________________________
(Mark One) | |
x | ANNUAL REPORT PURSUANT TO SECTION 13 OR 15(d) OF THE SECURITIES EXCHANGE ACT OF 1934 |
For the Fiscal Year Ended December 31, 2015 | |
OR | |
¨ | TRANSITION REPORT PURSUANT TO SECTION 13 OR 15(d) OF THE SECURITIES EXCHANGE ACT OF 1934 |
For the transition period from __________ to __________. | |
Commission File Number 001-35482
_________________________

ERICKSON INCORPORATED
(Exact name of registrant as specified in its charter)
_________________________
Delaware | 93-1307561 | |
(State or other jurisdiction of incorporation or organization) | (I.R.S. Employer Identification No.) | |
5550 SW Macadam Avenue, Suite 200, Portland, Oregon | 97239 | |
(Address of principal executive offices) | (Zip Code) | |
(503) 505-5800
(Registrant’s telephone number, including area code)
Securities registered pursuant to Section 12(b) of the Act:
Title of each class | Name of each exchange on which registered | |
Common Stock, $0.0001 par value | The NASDAQ Stock Market LLC | |
Securities registered pursuant to Section 12(g) of the Act: N/A
(Title of each class)
_________________________
Indicate by check mark if the registrant is a well-known seasoned issuer, as defined in Rule 405 of the Securities Act. Yes o No ý
Indicate by check mark if the registrant is not required to file reports pursuant to Section 13 or Section 15(d) of the Act. Yes o No ý
Indicate by check mark whether the registrant (1) has filed all reports required to be filed by Section 13 or 15(d) of the Securities Exchange Act of 1934 during the preceding 12 months (or for such shorter period that the registrant was required to file such reports), and (2) has been subject to such filing requirements for the past 90 days. Yes ý No ¨
Indicate by check mark whether the registrant has submitted electronically and posted on its corporate Web site, if any, every Interactive Data File required to be submitted and posted pursuant to Rule 405 of Regulation S-T (§232.405 of this chapter) during the preceding 12 months (or for such shorter period that the registrant was required to submit and post such files). Yes ý No ¨
Indicate by check mark if disclosure of delinquent filers pursuant to Item 405 of Regulation S-K ((§229.405 of this chapter) is not contained herein, and will not be contained, to the best of registrant’s knowledge, in definitive proxy or information statements incorporated by reference in Part III of this Form 10-K or any amendment to this Form 10-K. o
1
Indicate by check mark whether the registrant is a large accelerated filer, an accelerated filer, a non-accelerated filer, or a smaller reporting company. See the definitions of “large accelerated filer,” “accelerated filer” and “smaller reporting company” in Rule 12b-2 of the Exchange Act.
Large accelerated filer | ¨ | Accelerated filer | ¨ | ||||
Non-accelerated filer | ý (Do not check if a smaller reporting company) | Smaller reporting company | ¨ | ||||
Indicate by check mark whether the registrant is a shell company (as defined in Rule 12b-2 of the Exchange Act). Yes ¨ No ý
As of June 30, 2015, the aggregate market value of voting common stock held by non-affiliates of the Registrant was approximately $27,050,053. For purposes of this calculation, executive officers, directors and entities deemed controlled by a director are considered affiliates.
On March 4, 2016, 13,895,421 shares of common stock, par value $0.0001, were outstanding.
DOCUMENTS INCORPORATED BY REFERENCE:
The registrant has incorporated by reference into Part III, Items 10 through 14, of this Annual Report on Form 10-K, portions of its definitive proxy statement to be filed pursuant to Regulation 14A for the Annual Meeting of Shareholders scheduled to be held on June 8, 2016.
2
ERICKSON INCORPORATED
FORM 10-K
FOR THE YEAR ENDED DECEMBER 31, 2015
TABLE OF CONTENTS
Item 1. | ||
Item 1A. | ||
Item 1B. | ||
Item 2. | ||
Item 3. | ||
Item 4. | ||
Item 5. | ||
Item 6. | ||
Item 7. | ||
Item 7A. | ||
Item 8. | ||
Item 9. | ||
Item 9A. | ||
Item 9B. | ||
Item 10. | ||
Item 11. | ||
Item 12. | ||
Item 13. | ||
Item 14. | ||
Item 15. | ||
3
DEFINITIONS
The abbreviations or acronyms defined below are used throughout this Form 10-K:
Abbreviation or Acronym | Definition | |
Air Amazonia | Air Amazonia Serviços Aeronauticos Ltda. | |
ANAC | Agência Nacional de Aviação Civil | |
CARB | Commercial Airlift Review Board | |
CPH | Cost per hour | |
DER | Designated Engineering Representatives | |
DoD | United States Department of Defense | |
DOJ | United States Department of Justice | |
DOT | United States Department of Transportation | |
EAR | Export Administration Regulations | |
EHI | Erickson Helicopters, Inc. (formerly “Evergreen Helicopters, Inc.”) | |
FAA | Federal Aviation Administration | |
FCPA | Foreign Corrupt Practices Act | |
FSC | Forest Stewardship Council | |
HRT | HRT Participacoes em Petroleo S.A. | |
ITAR | International Traffic in Arms Regulations | |
LCLA | Low cost/low altitude | |
MRO | Maintenance, repair and overhaul | |
OFAC | United States Department of the Treasury’s Office of Foreign Assets Control | |
OSHA | Occupational Safety and Health Administration | |
RII | Required Inspection Item | |
RTS | Return to Service | |
SEC | United Stated Securities and Exchange Commission | |
SHARP | Occupational Safety and Health Administration’s Safety and Health Achievement Recognition Program | |
STC’d | Supplemental Type Certificated | |
STOL | Short takeoff and landing | |
4
PART I
ITEM 1. | BUSINESS. |
Certain statements contained in this Item 1 may constitute forward-looking statements within the meaning of the Private Securities Litigation Reform Act of 1995. These statements involve a number of risks, uncertainties and other factors that could cause actual results to differ materially from those reflected in any forward-looking statements, as discussed more fully in Part I, “Item 1A. Risk Factors.”
General
Established in 1971, Erickson Incorporated is a global provider of aviation services to both commercial and governmental entities in 21 countries on six continents. We own and operate a diverse fleet of aircraft and provide a broad range of aerial services, including critical supply and logistics for deployed military forces, humanitarian relief, firefighting, timber harvesting, infrastructure construction, and crewing. We also maintain a vertically-integrated manufacturing capability for the Aircrane and related components, and maintenance, repair, and overhaul services for the Aircrane and other aircraft. We operate as three distinct segments consisting of Commercial Aviation Services, Global Defense and Security, and Manufacturing and Maintenance, Repair and Overhaul (“MRO”), with revenues and costs related to its business activities maintained and analyzed based on the type of customer served and services provided.
In May 2013, we acquired Evergreen Helicopters, Inc. for $298 million, which contributed a fleet of 65 aircraft of varying rotary-wing and fixed-wing types providing aerial services primarily for the United States (“U.S.”) Military in support of overseas operations. And, in September 2013, we acquired Air Amazonia Serviços Aeronauticos Ltda. (“Air Amazonia”) and certain related assets for $26 million, which contributed a fleet of six aircraft and repair station certification in Brazil.
As of December 31, 2015, we had 819 employees, of which approximately 364 are located in Oregon, primarily at our Southern Oregon facilities and Portland headquarters. We employ approximately 367 pilots and deployment personnel, including pilots and maintenance personnel, on-site globally where our aircraft are deployed. In the U.S., none of our employees are represented by a labor union. In Italy, 2 pilots are covered by statutory employment protections. And, in Brazil, all of our 20 employees are covered by statutory employment protections under Brazilian labor law.
We are a corporation organized under the laws of the State of Delaware in 2000. We are headquartered at 5550 SW Macadam Avenue, Suite 200, Portland Oregon, and our phone number is (503) 505-5800. We file annual, quarterly and current reports, proxy statements and other information with the U.S. Securities and Exchange Commission (the “SEC”). Our Annual Reports on Form 10-K, Quarterly Reports on Form 10-Q, Current Reports on Form 8-K, and amendments to those reports filed or furnished pursuant to Section 13(a) or 15(d) of the Securities Exchange Act of 1934 are available and may be assessed free of charge through the Investors section of the Company’s website at http://ericksoninc.com as soon as reasonable practicable after the reports are electronically filed with, or furnished to, the SEC. It is not intended that the Company’s website and the information contained therein or connected thereto be incorporated into this Annual Report of Form 10-K. Information may also be obtained vis the SEC website at sec.gov.
Aircraft Fleet and Aviation Services
We operate a diverse fleet of light, medium, and heavy rotor-wing and fixed-wing aircraft, including the world’s largest fleet of Aircranes. In providing aerial solutions to our customers, we typically lease our aviation services for specific missions, with customers generally paying for the aircraft, maintenance, and crewing services, and in many cases, fuel to operate the aircraft. Our crews consist of two to four pilots per aircraft who are capable of flying daily missions of up to 24 hours. Missions are generally highly specialized and require pilots, mechanics, technicians, and support crews with extensive experience in aviation operations and in specific mission training.
The Aircrane is a versatile and powerful heavy-lift helicopter that we manufacture in-house. With two models, the S-64E and S-64F, and a lift capacity of up to 25,000 pounds, the Aircrane is the only commercial aircraft built specifically as a flying crane, without a fuselage for internal loads. The Aircrane is unique in that it is a commercial heavy-lift helicopter with a rear load-facing cockpit, combining an unobstructed view and complete aircraft control for precision lift and load placement capabilities. In certain circumstances, our in-house engineers have designed custom modifications to the Aircrane to meet certain industry-specific needs, like our “heli-harvester” hydraulic logging grapple, a 2,650-gallon water tank and snorkel for aerial firefighting, an anti-rotation device and hoist for construction, and composite main rotor blades designed to improve performance. We own the Type and Production Certificates for the Aircrane, granting us exclusive design, manufacturing and
5
related rights for the aircraft and original equipment manufacturer (“OEM”) components, and the Type Certificate for the engine type used in the Aircrane.
Periodically, our aircraft are removed from service and undergo heavy maintenance activities, including inspections and repairs of the airframe and related parts as required. The actual time between heavy maintenance depends on many factors, including hours of operation, calendar time and nature of use. Heavy maintenance can require several months to complete, during which time the aircraft is unavailable for aerial services. As a result of maintenance, aircraft are out-of-service from time-to-time. Throughout the course of any given year, the composition of our fleet may change to meet the needs of our business. As needed, we may remove aircraft from service for maintenance or to sell, or add aircraft to the fleet either through our own manufacturing facility or through a purchase or lease.
Our fleet includes the heavy-lift rotor wing Aircrane, as well as medium-/light-lift rotor wing and fixed wing aircraft as follows:
As of December 31, | ||||||||
2015 | 2014 | 2013 | ||||||
Summary of owned and leased aircraft: | ||||||||
Owned | 47 | 54 | 56 | |||||
Leased | 27 | 32 | 34 | |||||
Total aircraft in fleet, including aircraft held for sale | 74 | 86 | 90 | |||||
Type and model of aircraft in fleet: | ||||||||
Rotor wing: | ||||||||
Heavy lift | 20 | 20 | 20 | |||||
Medium lift | 36 | 41 | 41 | |||||
Light lift | 11 | 13 | 16 | |||||
Fixed wing | 7 | 12 | 13 | |||||
Total aircraft in fleet, including aircraft held for sale | 74 | 86 | 90 | |||||
Less: | ||||||||
Aircraft held for sale | 15 | — | — | |||||
Total aircraft in fleet | 59 | 86 | 90 | |||||
Aircraft deployed outside of North America | 33 | 41 | 50 | |||||
Although the global deployment of the Company’s aircraft and crews helps limit the effects of seasonality, historically the demand for the Company’s services are generally reduced in winter or monsoon seasons, January through April, with peak season from June through October.
During the years ended December 31, 2015, 2014 and 2013, we had two customers, Fluor Government Group and the U.S. Forest Service, each representing 13% to 18% of our revenues, with no other customer representing more than 10%. Additionally, during the year ended December 31, 2015, 36% of our revenues was generated in the U.S., compared with 30% in 2014 and 34% in 2013.
Financial information for each of our reportable segments, Commercial Aviation Services, Global Defense and Security, and Manufacturing and MRO, is included in the notes to our consolidated financial statements included in Item. 8—“Financial Statements and Supplementary Data.”
Commercial Aviation Services. Our Commercial Aviation Services revenue is primarily derived from contract arrangements with customers on a global basis, including North America, Europe, Australia, and South America, who use our services for the following:
• | Firefighting. Our aerial firefighting services are provided to customers including federal, state, local and international government and commercial entities. Under our typical firefighting contracts, aircraft are deployed to locations prone to seasonal fires, where they remain on standby throughout the fire season. Because of the inverse timing of fire seasons in the Northern and Southern Hemispheres, we are able to provide firefighting services on year-round basis by moving aircraft from one hemisphere to another. |
6
• | Timber Harvesting. Our aerial timber harvesting services are primarily provided to commercial entities, whereby timber is vertically lifted and transported with our proprietary hydraulic grapple, minimizing the need for road development and large support crews on the ground. Aerial timber harvesting is often used to harvest high-value timber to be used in high-grade products such as furniture and flooring. It can also be a strategy for reaching timber located in challenging terrain, where building access roads is cost-prohibitive or logistically impossible. |
• | Infrastructure Construction. Our aerial infrastructure construction services are provided to commercial entities within the construction, energy transmission, and energy generation industries, and also include international governments. Heavy-lift helicopters, such as the Aircrane, are used in a variety of infrastructure construction projects such as transmission and utility grid construction, wind turbine construction, and HVAC unit placement, allowing utilities and construction services firms to install infrastructure in remote or hard-to-access locations. |
• | Oil and Gas. Our aerial oil and gas services are provided to commercial entities in the exploration of such resources, as well as their production process. We provide passenger and cargo transport in austere and remote locations with difficult operating challenges, including the transport of drilling supplies and production rig equipment with surveyors and geologists deep into the jungle or carrying personnel and supplies to remote drill platforms. |
We provide such services pursuant to a variety of contractual arrangements, including: (i) a daily standby fee for the contract period with an additional rate for hours flown; (ii) exclusive use contracts whereby we are obligated to provide, and our customer is obligated to take and pay for, the use of our services which is charged on a per-day basis for availability and on a per-hour basis for actual aircraft use; (iii) call when needed contracts whereby we may elect to provide services if such customer requests and we only charge for actual aircraft use; and (iv) an hourly rate structure or on a per cubic meter of timber delivered basis. Contract terms can range from a single lift to several years in duration.
This market is fragmented with competition coming primarily from smaller regional operators and we generally compete on capability of the aircraft, price, safety record, and accident prevention and training. Such aviation services to commercial entities is highly competitive and requires specialized and unique aircraft capable of performing precision and heavy load lifts and a highly skilled workforce to deliver such services.
During the years ended December 31, 2015, 2014 and 2013, approximately 58%, 62% and 59%, respectively, of our Commercial Aviation Services revenues were derived from operations outside of the U.S.
Global Defense and Security. Our Global Defense and Security revenue is primarily derived from contract arrangements with domestic and foreign governmental entities who use our services for the transport of personnel and cargo, as well as maintenance, logistics and training all in connection with their defense and security programs. The majority of such services are performed outside of the U.S. in hostile areas.
We have the capability of deploying aircraft to support external load operations, passenger and cargo transportation, combination loads, low cost/low altitude (“LCLA”) airdrops, short takeoff and landing (“STOL”), the transportation of persons by air to a place where they can receive medical care (“MEDEVAC”), and the evacuation of casualties by air (“CASEVAC”). Our aircraft can be equipped with Supplemental Type Certificated (“STC’d”) Night Vision Goggles, Ballistic Protection, and roller systems.
We generally charge a daily standby fee for the contract period with an additional rate for hours flown, with some contracts including a minimum number of hours to be flown before the hourly rate is charged. Contract terms range from 2 months to 5 years, with the majority being multi-year arrangements.
In order to transport any DoD passengers or cargo in a civilian aircraft, the operator must undergo a set of audits to become certified, with follow-up inspections thereafter. To compete, companies must have a variety of operational specifications approved by both the FAA and CARB, resulting in a significant barrier to entry into the market.
During the years ended December 31, 2015, 2014 and 2013, approximately 97%, 99% and 97%, respectively, of our Global Defense and Security revenues were derived from either prime or sub contracts for the DoD, with approximately 93%, 88%, and 91%, respectively, related to operations outside of the U.S.
Manufacturing and MRO. Our Manufacturing and MRO revenue is primarily derived from customers who own or operate Aircranes, or the military version CH-54s, and other legacy aircraft platforms, which generally consist of older aircraft no longer in production by the original equipment manufacturer such as the Bell 214 helicopter. It includes the sale of aircraft
7
components and MRO services for these helicopters globally. Such revenue also includes revenue from the sale of any aircraft.
We have extensive capabilities in new parts production of airframes, aircraft systems, and avionics components for a wide variety of rotary aircraft. Our manufacturing operations can fabricate hard-to-locate parts, or even reverse engineer and reproduce parts that may no longer be available from traditional sources. We manufacture new aircraft components on a contract basis for key original equipment manufacturers of helicopters, as well as provide a wide array of MRO services to helicopter operators globally. These services include the disassembly, cleaning, inspection, repair, and reassembly of airframes, engines, components, and accessories, as well as the testing of complete engines and components to FAA standards, as well as reciprocating international agencies. We provide these services out of our AS9100-certified facilities in Southern Oregon, which we complement with field support. We are able to remanufacture an Aircrane to new specifications in approximately 8 to 12 months, depending on specifications and complexity.
To provide Manufacturing and MRO services, as well as to support the maintenance and repair services of our aircraft fleet, we carry a significant amount of aircraft support parts, many of which are no longer in production. Many of these items are parts that have been removed from aircraft, refurbished according to manufacturers and FAA specifications, and returned to aircraft support parts for use on our aircraft fleet or for sale to other helicopter owners or operators.
The majority of our contracts for manufacturing and MRO services are fixed priced, based on specifications of services to be provided or parts to be delivered. In addition, we offer “Cost per Hour” (“CPH”) contracts, in which we provide a full suite of parts and services (e.g., replacement parts, spare parts replenishment, scheduled and unscheduled engine maintenance) for a customer’s Aircrane at a fixed hourly rate. We also offer similar operations and services on engines and other components for owners of other aircraft platforms.
This market is fragmented with competition coming primarily from smaller regional entities. We generally compete on capability of the MRO facilities and personnel, as well as price. The providing of such MRO services is highly competitive and requires requisite facilities, access to aircraft supply parts, or the ability to manufacture in-house, and a highly skilled workforce to deliver such services.
During the years ended December 31, 2015, 2014 and 2013, Manufacturing and MRO revenues were $31.5 million, $15.3 million and $12.7 million, respectively, and represented 11% of revenues in 2015, compared with 4% in 2014 and 2013. We sold seven aircraft totaling $7.5 million in 2015, with four aircraft sold in 2014 totaling $2.8 million and none in 2013.
Backlog. Backlog represents the amount of revenue that we expect to derive from signed contracts, including oral contracts that have been subsequently memorialized in writing, or customer extension options. Our backlog consists of contracts with a duration of six months or more. For contracts that include both a daily and an hourly rate component, only the daily component of revenue is included in backlog and an estimate of the expected hourly revenue is not included. For contracts that include a guaranteed number of hours, the value of the guaranteed hours is included in backlog. For CPH contracts, which depend on hours flown by our customers, we calculate the contribution to backlog based on contracted minimum hours. When a binding aircraft sale contract has been signed with a customer, the purchase price of the aircraft not included in current revenues is included in backlog. When we sign a contract giving a potential purchaser an option to purchase an aircraft which only becomes binding on a non-refundable payment of a material option fee, we do not include the purchase price of the aircraft in backlog until the non-refundable payment has been made and the contract is a binding purchase contract.
As of February 16, 2016, our backlog was $228.4 million, of which $114.2 million was attributable to signed contracts and $114.2 million was attributable to anticipated exercises of customer extension options. We had total backlog of $325.4 million, of which $159.7 million was attributable to signed contracts and $165.7 million was attributable to anticipated exercises of customer extension options as of December 31, 2014. A material portion of our contracts are subject to a cancellation notice period of 90 days or less.
Research and Development. We dedicate resources to improving our aircraft’s performance and developing new applications and products. During 2015, 2014 and 2013, we incurred $2.7 million, $3.8 million and $4.0 million, respectively on research and development activities. We have recently completed fabrication of composite main rotor blades, of which testing is expected to begin in the second quarter of 2016, and commercial production by the fourth quarter of 2016. We plan to extend such research and development efforts to other legacy aircraft models.
Intellectual Property. Our core technologies are protected through a combination of intellectual property rights, including ownership of S-64 Type and Production Certificates, trade secrets, patents, copyrights, and trademarks, as well as through contractual restrictions. We enter into confidentiality and inventions assignment agreements with our designers, engineers, consultants, and business partners, and we control access to and distribution of our proprietary information.
8
Regulation
All aspects of our business are heavily regulated under federal, state, local, and foreign laws and regulations. These laws and regulations may require us to maintain and comply with a wide variety of certificates, permits, licenses, noise abatement standards, and other requirements. These regulatory agencies have the authority to modify, amend, suspend, or revoke the certificates, permits, and licenses granted to us for failure to comply with provisions of law or applicable regulations, and may impose civil or criminal penalties for violations of applicable rules and regulations.
FAA and Comparable Agencies. We operate under Federal Aviation Administration (“FAA”) Part 135, U.S. Air Carrier, Part 133, Rotorcraft External-Load Operations, and Part 144, Repair Stations. Our aerial operations, aircraft manufacturing, and MRO activities are subject to complex aviation and transportation laws and regulations under which the U.S. Department of Transportation (“DOT”), principally through the FAA, exercises regulatory authority over certificate holders and persons that operate, manufacture, or repair aircraft. We are also subject to comparable regulation in several foreign countries with respect to our operations in those countries.
The FAA and comparable foreign agencies have jurisdiction over many aspects of our business, including:
• | The issuance of type certificates for the Aircrane and Aircrane engines; |
• | Approval of major modifications to the Aircrane or its systems; |
• | Approval of Aircrane accessories used in our operations, such as our sea snorkel and our anti-rotation device and hoist; |
• | Promulgation and enforcement of rules governing the operation of aircraft generally and in connection with specific missions; |
• | Promulgation and enforcement of rules governing the manufacture and repair of aircraft, aircraft systems, and aircraft components; and |
• | Promulgation and enforcement of rules governing the qualification, training, and currency of pilots, flight crew, and repair and maintenance personnel. |
The FAA and comparable foreign authorities actively monitor compliance with these rules and conduct regular inspections and audits of our operations and facilities. A serious violation of any of these rules could result in the imposition of fines or penalties, the revocation of our type certificate or the suspension or revocation of our operating licenses. The aviation regulation agencies in various jurisdictions sometimes work in concert to avoid duplication of regulatory effort, but each agency has authority to impose and enforce its own regulations and conduct its own inspections with respect to operations within its jurisdiction.
U.S. federal laws require that at least 75% of the voting securities of a domestic air carrier be owned or controlled by citizens of the U.S., and that its president and at least two-thirds of its directors and managing officers be U.S. citizens. Our CEO and at least two-thirds of our directors and managing officers are U.S. citizens, and our certificate of incorporation and bylaws restrict voting of shares of our capital stock by non-U.S. citizens. Our bylaws provide that no shares of our capital stock may be voted by or at the direction of non-U.S. citizens unless such shares are registered on a separate stock record, which we refer to as the foreign stock record. Our bylaws further provide that the voting rights of the shares registered on the foreign stock record in the name of each foreign stockholder will be proportionally reduced so that the voting rights of the amount so registered are reduced if the amount registered would exceed the foreign ownership restrictions imposed by federal law.
The Commercial Airlift Review Board (“CARB”) regulates civilian air carriers transporting passengers for the U.S. Department of Defense (“DoD”), which includes the U.S. Army, U.S. Navy, Air Force, Marines, and Special Operations units. CARB authorization allows the DoD to utilize approved civilian air carriers to provide mission-critical support service. We hold CARB authorization to operate both rotor and fixed wing aircraft for the DoD.
Environmental Regulations. We are subject to stringent federal, state, local, and foreign environmental laws and regulations concerning, among other things, water discharges, air emissions, hazardous material and waste management, and environmental cleanup.
Other Regulations. Our operations in non-U.S. jurisdictions are subject to local governmental regulations that may limit foreign ownership of aviation companies. Because of these local regulations, we conduct some of our operations through entities in which local citizens own a majority interest and we hold a minority interest, or through local agents. We retain independent representatives in specific countries on a commission basis, and our independent representatives operate under
9
contracts in which they pledge to act in full compliance with the Foreign Corrupt Practices Act (“FCPA”) and other applicable legislation.
Our operations are subject to U.S. export control laws and regulations that regulate the import, export, and re-export of products, technologies, and services. This includes economic sanctions and anti-boycott laws that together serve to protect and promote national security, economic stability, and human rights. We also comply with applicable trade control laws of the countries in which we operate.
Our operations are also subject to the oversight of the Occupational Safety and Health Administration (“OSHA”) concerning employee safety and health matters.
ITEM 1A. RISK FACTORS.
Our business is subject to numerous risks and uncertainties. You should carefully consider the following risk factors and all other information contained in this annual report on Form 10-K and the reports we file with the SEC from time to time. Any of these risks could harm our business, results of operations, financial condition and prospects. In addition, risks and uncertainties not currently known to us or that we currently deem to be immaterial also may materially adversely affect our business, results of operations, financial condition and prospects.
Risks Relating to our Indebtedness
Our substantial indebtedness and significant debt service obligations could adversely affect our financial condition and impair our ability to grow and operate our business.
We have a substantial amount of debt and have significant debt service obligations. As of December 31, 2015, the principal amount of our total indebtedness was approximately $479.1 million, and secured by liens on substantially all of our existing and future assets.
The existence and terms of our indebtedness could adversely affect our financial condition by:
• | making it more difficult for us to satisfy our obligations with respect to our indebtedness; |
• | increasing our vulnerability to generally adverse economic and industry conditions; |
• | limiting our ability to fund future working capital, capital expenditures, research and development and other general corporate requirements; |
• | requiring us to dedicate a substantial portion of our cash flow from operations to service payments on our debt; |
• | limiting our flexibility to react to changes in our business and the industry in which we operate; |
• | placing us at a competitive disadvantage to any of our competitors that have less debt; |
• | limiting our ability to borrow additional funds; and |
• | requiring us to comply with financial and other restrictive covenants. |
Our failure to comply with the covenants contained in our credit facility could result in an event of default, which could materially and adversely affect our operating results and our financial condition.
Our ability to draw down borrowings under our credit facility depends in part on our compliance with financial covenants contained in the facility. An inability to draw down on our credit facility could have a material adverse effect on our ability to make capital expenditures, on our results of operations and on our liquidity. Further, failure to maintain the financial ratios required under our credit facility would constitute an event of default, allowing the lenders under our credit facility to declare the entire balance of any and all sums payable under the credit facility immediately due and payable. If a payment default or acceleration were to occur under our credit facility, holders of our $355 million principal amount of 8.25% Second Priority Senior Secured Promissory Notes due 2020 (“2020 Senior Notes”) would be permitted to accelerate the maturity of the 2020 Senior Notes.
We may not be able to generate sufficient cash to service all of our indebtedness and may be forced to take other actions to satisfy our obligations under our indebtedness, which may not be successful.
Our ability to meet our debt service obligations and seek any potential refinancing of our indebtedness depends upon our ability to generate sufficient cash from our operations, financings or asset sales, which are subject to general economic conditions, industry cycles, seasonality and other factors, some of which may be beyond our control. If our cash flows and capital
10
resources are insufficient to fund our debt service obligations, we could face substantial liquidity problems and may have to undertake alternative financing plans, such as refinancing or restructuring our indebtedness, selling our assets, reducing or delaying capital investments or seeking to raise additional capital. Our ability to restructure or refinance our indebtedness will depend on the conditions of the capital markets and our financial condition at such time. Any refinancing of our indebtedness could be at higher interest rates and may require us to comply with more onerous covenants, which could further restrict our business operations. The terms of existing or future debt instruments may also restrict us from adopting some of these alternatives. If we cannot make scheduled payments on our debt, we will be in default under our credit facilities and the lenders under our 2020 Senior Notes and credit facility could declare all outstanding principal and interest to be due and payable and we could be forced into bankruptcy or liquidation.
Our ability to obtain adequate financing or raise capital in the future may be limited.
We depend, in part, upon borrowings under our credit facilities to fund our operations and contractual commitments. If we were called upon to fund all outstanding commitments, we may not have sufficient funds to do so. A number of factors could cause us to incur increased borrowing costs and to have greater difficulty accessing public and private markets for debt. These factors include general economic conditions, disruptions or declines in the global capital markets, and our financial performance, outlook, or credit ratings. Additionally, our suppliers may require us to pay cash in advance or obtain letters of credit as a condition to selling us their products and services. If we cannot access financing when needed, and on acceptable terms, we may be unable to continue to fund our capital requirements or contractual commitments, which would have an adverse effect on our business, financial condition and results of operations.
Risks Relating to our Business
The aviation services business is highly competitive.
Each of our segments faces significant competition. We compete for most of our work with other helicopter operators and, for some operations, with fixed-wing operators and ground-based alternatives. Many of our contracts are awarded after competitive bidding, and competition for those contracts is generally intense. We have several major competitors and numerous small competitors operating in our aerial services markets. Our competitors may at times undercut our prices or could develop the capability to manufacture products or provide services similar to products that we manufacture or services that we provide. We may not be able to compete successfully against our current or future competitors and the competitive pressures we face may result in reduced revenues and market share. If we are unable to adjust our costs relative to our pricing, our profitability will suffer. In addition, some of our competitors may have greater financial and other resources than we do, and may therefore be able to react to market conditions and compete more effectively than we do.
We depend on a small number of large customers for a significant portion of our revenues.
We derive a significant amount of our revenue from a small number of major customers. Several of our largest customers are governmental agencies or entities that may be subject to budget or other financial constraints. In light of the ongoing European financial crisis, there are heightened risks associated with our future revenue attributable to services provided in the region, including Greece and Italy. Revenue derived from our firefighting contracts under which we are paid for hours flown is influenced by outside factors, such as seasonality and weather conditions, that may negatively impact our future revenue. Similarly, in light of anticipated troop withdrawals in Afghanistan, there is a heightened risk of a decline in our future revenue attributable to contracts in the region. Should we lose one of our major customers for any reason, we may be unable to identify new opportunities sufficient to avoid a reduction in revenues and our business and financial condition could suffer.
A significant portion of our Global Defense and Security revenue is derived from providing airlift services in Afghanistan.
Our Global Defense and Security business derives a significant portion of its revenue from providing airlift services in Afghanistan for the DoD. The U.S. government has been reducing military activities in Afghanistan and began calendar year 2015 with approximately 10,000 military personnel in Afghanistan. The U.S. government announced plans to reduce the number of troops in Afghanistan by approximately half before the end of calendar year 2016. Our Global Defense and Security revenue will likely continue to experience declines as troop reductions occur in Afghanistan. In addition, as a result of the already reduced level of flight activity in the Afghanistan region, we have seen increased pressure from our competitors in connection with new DoD contracts in other regions of the world where we operate, which we believe may negatively impact our pricing with respect to some of the new DoD contracts on which we bid.
11
Our operations involve significant risks, which may result in hazards that may not be covered by our insurance or may increase the cost of our insurance.
The operation of aircraft inherently involves a high degree of risk. Hazards such as aircraft accidents, mechanical failures, collisions, fire, and adverse weather may result in loss of life, serious injury to employees and other persons, damage to property, losses of equipment and revenues, revocation of necessary governmental approvals and suspension or reduction of operations. Our insurance and indemnification arrangements may not cover all potential losses and are subject to deductibles, retentions, coverage limits, and coverage exceptions and, as a result, severe casualty losses or the expropriation or confiscation of significant assets could materially and adversely affect our financial condition or results of operations.
If we fail to maintain our safety record, our ability to attract new customers and maintain our existing customers would be harmed.
A favorable safety record is one of the primary factors a customer reviews in selecting an aviation provider. If we fail to maintain our safety and reliability record, our ability to attract new customers and maintain our current customers will be materially and adversely affected. In addition, safety violations could lead to increased regulatory scrutiny; increase our insurance rates and expense, which is a significant operating cost; or increase the difficulty of maintaining our existing insurance coverage in the future, which would adversely affect our operations.
Factors beyond our control, including weather and seasonal fluctuations, may reduce aircraft flight hours, which would affect our revenues and operations.
A significant portion of our operating revenue is dependent on actual flight hours, and a substantial portion of our direct costs are fixed. Flight hours could be negatively impacted by factors beyond our control and fluctuate depending on cyclical weather-related and seasonal limitations, which would affect our revenues and operations. In addition, generally our aircraft are not currently equipped to fly at night, reinforcing the seasonality of our business with more activity in the Northern Hemisphere during the summer months and less activity during the winter months. Poor visibility, high winds, and heavy precipitation can restrict the operation of helicopters and significantly reduce our flight hours. Reduced flight hours can have a material adverse effect on our business, financial condition, results of operations, and cash flows.
Some of our arrangements with customers are short-term, ad hoc, or “call when needed” and may not be renewed.
We generate a portion of our revenues from arrangements with customers with terms of less than six months, ad hoc arrangements, and “call when needed” contracts. There is a risk that customers may not continue to seek the same level of services from us as they have in the past or that they will not renew these arrangements or terminate them at short notice. Under “call when needed” contracts, we pre-negotiate rates for providing services that customers may request that we perform (but which we are not typically obligated to perform) depending on their needs. The rates we charge for these contingent services are higher than the rates under stand-by arrangements, and we attempt to schedule our aircraft to maximize our revenue from these types of contracts. The ultimate value we derive from such contracts is subject to factors beyond our control, such as the severity and duration of fire seasons. In the past, several of our larger contracts have not been renewed for reasons unrelated to our performance, such as the financial condition of our customers or their decision to internalize the services we provided to them. If we are unable to retain or replace customers experiencing similar circumstances, our business and financial condition could suffer.
Foreign, domestic, federal, state and local government spending and mission priorities may change in a manner that materially and adversely affects our future revenues and limits our growth prospects.
Our business depends upon continued government expenditures on programs that we support. These expenditures have not remained constant over time. Current foreign and domestic government spending levels on programs that we support may not be sustainable as a result of changes in government leadership, policies, or priorities. These or other factors could cause government agencies and departments to reduce their purchases under contracts, exercise their right to terminate contracts, or not exercise options to renew contracts, any of which could cause us to lose revenue. A significant decline in overall government spending or a shift in expenditures away from agencies or programs that we support could cause a material decline in our revenues and harm our financial results.
We depend on a small number of manufacturers for some of our aircraft components.
We rely on more than 200 supplier business units or locations for significant or critical components. A small number of manufacturers make some of the key components for our aircraft, and in some instances there is only a single manufacturer,
12
although other manufacturers could be used if necessary for all of our components. If these manufacturers experience production delays, or if the cost of components increases, our operations could suffer. If a manufacturer ceases production of a required component, we could incur significant costs in purchasing the right to manufacture those components or in developing and certifying a suitable replacement, and in manufacturing those components.
Our failure to develop new technologies, and to adequately protect our intellectual property rights, could adversely affect our operations.
Our ability to grow depends in part on our development of new products or applications. Competitors may develop similar applications for their aircraft, which would increase our competition in providing aerial services. Not all of our products and applications have been, or may be, patented or otherwise legally protected. We rely upon intellectual property law, trade secret protection, and confidentiality and license agreements with our employees, clients, consultants, partners, and others to protect our new and existing intellectual property rights. If we are not able to adequately protect the inventions and intellectual property we have developed, in the U.S. and in foreign countries, or if any of our trade secrets, know-how, or other technologies were to be disclosed to or independently developed by a competitor, our business, financial condition, and results of operations could be materially adversely affected.
We are exposed to risks associated with operating internationally.
We purchase products from and supply products to businesses located outside of the U.S. We also have significant operations outside the U.S. A number of risks inherent in international operations could have a material adverse effect on our business, including:
• | currency fluctuations, which can reduce our revenues for transactions denominated in non-U.S. currency or make our services relatively more expensive if denominated in U.S. currency; |
• | difficulties in staffing and managing multi-national operations; |
• | civil disturbances, government or financial instability, nationalization and expropriation of private assets, and the imposition of taxes or other charges by government authorities; |
• | significant receivables from international customers; |
• | risks associated with transporting our aircraft, including risks associated with piracy and adverse weather; |
• | limitations on our ability to enforce legal rights and remedies; |
• | uncertainties regarding required approvals or legal structures necessary to operate aircraft or provide our products and services in a given jurisdiction; |
• | changes in regulatory structures or trade policies; |
• | tariff and tax regulations including permanent establishment determinations by foreign governments; |
• | compliance with all applicable export control laws and regulations of the U.S. and other countries; |
• | difficulties in obtaining export and import licenses; and |
• | the risk of government-financed competition. |
While we have adopted and will continue to adopt measures to reduce the potential impact of losses resulting from the risks of doing business internationally, we may not be successful and any measures we take may not be adequate or the regions in which we operate may not continue to be stable enough to allow us to operate profitably or at all.
We are subject to significant government regulation and may need to incur significant expenses to comply with new or more stringent governmental regulation.
The aerial services business is heavily regulated by the FAA in the U.S. and equivalent regulatory agencies in other countries. The FAA regulates the general operation of our aircraft, the process by which our aircraft are maintained, the components and systems that are installed in our aircraft, the qualification of our flight crews and maintenance personnel, and the specialized operations that we undertake. Our aircraft manufacturing and MRO operations are also subject to regulation by the FAA and other governmental authorities. The FAA regulates the design and manufacture of aircraft and aircraft systems and components. It also sets and enforces standards for the repair of aircraft, systems, and components and for the qualification of personnel performing these functions. Our operations in other countries are similarly regulated under equivalent local laws and regulations, which could change at any time. New and more stringent governmental regulations may be adopted in the future that, if enacted, may have an adverse impact on us. If any of our material licenses, certificates, authorizations, or approvals were revoked or suspended by the FAA or equivalent regulatory agencies in other countries, our results of operations and financial condition may be adversely affected.
13
Environmental regulation and legal proceedings could lead to significant costs and liability.
We are subject to a variety of laws and regulations, including environmental and health and safety regulations. Because our operations are inherently hazardous, compliance with these regulations is challenging and requires constant attention and focus. We are subject to federal, state, and foreign environmental laws and regulations concerning, among other things, water discharges, air emissions, hazardous material and waste management, and environmental cleanup. Environmental laws and regulations continue to evolve, and we may become subject to increasingly stringent environmental standards in the future, particularly under air quality and water quality laws and standards related to climate change issues, such as reporting greenhouse gas emissions. Our failure to comply with these regulations could subject us to fines and other penalties administered by the agencies responsible for environmental and safety compliance.
If we fail to comply with government procurement laws and regulations, we could lose business and be liable for various penalties or sanctions.
Some of our services are sold under U.S. or foreign government contracts or subcontracts, which typically require a competitive bid process. Government contracts generally are terminable at any time for the convenience of the government. From time to time, we are also subject to government inquiries and investigations of our business practices due to our participation in government programs. Violation of applicable government rules and regulations could result in civil liability, the cancellation or suspension of existing contracts, or the ineligibility for future contracts or subcontracts funded in whole or in part with federal funds, any of which could have a material adverse effect on our business, financial condition, results of operations, and cash flows.
Not being classified as a small business may adversely affect our ability to compete for some government contracts.
The North American Industry Classification Systems (“NAICS”) maintains industry and product specific codes that are utilized by the U.S. Small Business Administration as a basis for its size standards applicable to Federal government procurements. Businesses that meet the small business size standard for the relevant NAICS code are able to bid on small business set-aside contracts. Several of our contracts provide for differentiating factors in their award process which include small business status, performance records, safety records, and other factors. Several of these factors have been instrumental in us winning new work and continuing contracts. We do not currently qualify as a small business and it is possible that we may not be classified as a small business in the future. Not being classified as a small business may adversely impact our eligibility for special small business programs and limit our ability to partner with other business entities that seek to team with small business entities as may be required under a specific contract.
Product liability and product warranty risks could adversely affect our operating results.
We manufacture, repair, and overhaul complex aircraft and critical parts for aircraft. Failure of our aircraft or parts could give rise to substantial product liability and other damage claims. We maintain insurance to address this risk, but our insurance coverage may not be adequate for some claims and there is no guarantee that insurance will continue to be available on terms acceptable to us, if at all. Additionally, aircraft and parts we manufacture for sale are subject to strict contractually established specifications using complex manufacturing processes. If we fail to meet the contractual requirements for a part, we may be subject to warranty costs to repair or replace the part itself and additional costs related to the investigation and inspection of non-complying parts. These costs are generally not insured.
Fuel shortages or fluctuations in the price of fuel could adversely affect our operations.
Our aerial operations depend on the use of jet fuel. Fuel costs have historically been subject to wide price fluctuations, and fuel availability is subject to shortage and is affected by demand for heating oil, gasoline, and other petroleum products. Fuel shortages and increases in the price of fuel, or decreases in the price of fuel when we have entered into hedging agreements, could adversely affect our operations.
We rely on information technology, and if we are unable to protect against service interruptions, data corruption, cyber-based attacks or network security breaches, our operations could be disrupted and our business could be negatively affected.
We rely on information technology networks and systems to process, transmit and store electronic and financial information; to coordinate our business across our global operation bases; and to communicate within our company and with customers, suppliers, partners and other third-parties. These information technology systems may be susceptible to damage, disruptions or shutdowns, hardware or software failures, power outages, computer viruses, cyber attacks, telecommunication failures, user errors or catastrophic events. If our information technology systems suffer severe damage, disruption or shutdown, and our
14
business continuity plans do not effectively resolve the issues in a timely manner, our operations could be disrupted and our business could be negatively affected. In addition, cyber attacks could lead to potential unauthorized access and disclosure of confidential information, and data loss and corruption.
Our business in countries with a history of corruption and transactions with foreign governments increases the compliance risks associated with our international activities.
Our international operations could expose us to trade and economic sanctions or other restrictions imposed by the U.S. or other governments or organizations. The U.S. Department of Justice and other federal agencies and authorities have a broad range of civil and criminal penalties at their disposal to impose against corporations and individuals for violations of trading sanctions laws, the FCPA, and other federal statutes. Under trading sanctions laws, the government may seek to impose modifications to business practices, including cessation of business activities in sanctioned countries, and modifications to compliance programs, which may increase compliance costs, and could subject us to fines, penalties and other sanctions.
Our failure to attract and retain qualified personnel could adversely affect us.
Our pilots and maintenance and manufacturing personnel are highly trained and qualified. Our ability to attract and retain qualified pilots, mechanics, and other highly trained personnel will be an important factor in determining our future success. Our aircraft, and the aerial services we provide, require pilots with high levels of flight experience. The market for these experienced and highly trained personnel is extremely competitive. Some of our pilots and mechanics are members of the U.S. military reserves and could be called to active duty. If significant numbers of such persons were called to active duty, it would reduce the supply of such workers, possibly curtailing our operations and likely increasing our labor costs. Because of our small size relative to many of our competitors, we may be unable to attract qualified personnel as easily as our competitors.
We have a significant stockholder whose interests may not coincide with other stockholders.
Entities affiliated with ZM Equity Partners, LLC owns a majority of our outstanding common stock, and one of our directors is a managing director of Centre Lane Partners, LLC, an affiliate of ZM Equity Partners, LLC. These stockholders could exert significant influence over all matters requiring stockholder approval, including the election of directors and the approval of significant corporate transactions. In addition, this concentration of ownership could delay or prevent a change in control of our company or make some transactions more difficult or impossible without the support of these stockholders. The interests of these stockholders may not always coincide with our interests as a company or the interests of other stockholders.
ITEM 1B. | UNRESOLVED STAFF COMMENTS. |
None.
ITEM 2. | PROPERTIES. |
Our headquarters are located in Portland, Oregon. We own or lease 340,758 square feet of building space (including offices, MRO facilities, warehouses, hangars and other operations facilities) primarily in Oregon and Alaska. We also lease 303,617 square feet of building space in various international locations, including in Canada, Brazil and Italy. Of the total owned or leased building space, 427,575 square feet is leased space. Additionally, we own a total of 48 acres of land in Oregon.
We believe our existing facilities, which are used by all operating segments, are in good operating condition and are suitable for the conduct of our business. We may improve, replace or reduce facilities as considered appropriate to meet the needs of our operations.
15
ITEM 3. | LEGAL PROCEEDINGS. |
Arizona Environmental Matter
In August 2012, EHI received a request for information from the State of Arizona and has been served various petitions regarding the Broadway-Pantano Site in Tucson, Arizona, which is comprised of two landfills at which the State of Arizona has been conducting soil and groundwater investigations and cleanups. According to these documents, the State has identified approximately 101 parties that are potentially responsible for the contamination. It is possible that the State or other liable parties may assert that EHI is liable for the alleged contamination at the site.
World Fuel Claim
In December 2013, World Fuel, a former fuel supplier of EIA and Evergreen Airlines (‘‘EA’’), filed suit in the Circuit Court of Yamhill County, Oregon against EIA, EA and other named parties claiming approximately $9.0 million of accounts payable due and owing to World Fuel for fuel purchases made by EIA and EA. EHI was a named party in the lawsuit since it was alleged that EHI signed a joint and several guaranty of payment in favor of World Fuel in 2012. In April 2014, we filed an answer, which included certain counterclaims against World Fuel and certain cross claims against Mr. Delford Smith. Although we are unable to predict the final outcome of the proceeding, we believe the allegations lack merit and intend to vigorously defend against them.
Stockholder Action
In August 2013, a stockholder class and derivative action was filed in the Court of Chancery for the State of Delaware against the Company, members of our board of directors, EAC Acquisition Corp., and entities affiliated with ZM Equity Partners, LLC and certain of their affiliates. The plaintiff asserted claims for breach of fiduciary duty and unjust enrichment in connection with the EHI acquisition and requested an award of unspecified monetary damages, disgorgement and restitution, certain other equitable relief, and an award of plaintiff’s costs and disbursements, including legal fees. Although we are unable to predict the final outcome of the proceeding, we believe the allegations lack merit and intend to vigorously defend against them.
ITEM 4. | MINE SAFETY DISCLOSURES. |
Not applicable.
16
PART II
ITEM 5. | MARKET FOR REGISTRANT’S COMMON EQUITY, RELATED STOCKHOLDER MATTERS AND ISSUER PURCHASES OF EQUITY SECURITIES. |
Our common stock began trading on the NASDAQ under the symbol “EAC” following our initial public offering in April 2012. Before then, there was no public market for our common stock. As of March 4, 2016, there were 10 holders of record of our common stock. A substantially greater number of holders of our stock are “street name” or beneficial holders, whose shares are held of record by banks, brokers, and other financial institutions. The following table sets forth, for the periods indicated, the highest and lowest sales prices of our common stock as reported on the NASDAQ:
High | Low | |||||||
2015 | ||||||||
Fourth Quarter | $ | 3.56 | $ | 1.84 | ||||
Third Quarter | 4.49 | 3.04 | ||||||
Second Quarter | 5.35 | 3.30 | ||||||
First Quarter | 8.75 | 4.22 | ||||||
2014 | ||||||||
Fourth Quarter | $ | 15.25 | $ | 7.88 | ||||
Third Quarter | 19.25 | 11.32 | ||||||
Second Quarter | 19.49 | 14.27 | ||||||
First Quarter | 21.94 | 18.02 | ||||||
We have never declared or paid, and do not anticipate declaring or paying, any cash dividends on our common stock. Instead, we currently anticipate that we will retain all of our future earnings, if any, to fund the operation and expansion of our business and to use as working capital and for other general corporate purposes. Any future determination as to the declaration and payment of dividends, if any, will be at the discretion of our board of directors and will depend on then-existing conditions, including our financial condition, operating results, contractual restrictions, capital requirements, business prospects, and other factors our board of directors may deem relevant. Our existing credit facility limits our ability to declare and pay dividends.
Equity Compensation Plan Information
The following table provides information as of December 31, 2015 regarding shares of common stock that may be issued under our amended and restated 2012 Long-Term Incentive Plan (“2012 Plan”) and our CEO Plan and Stock Option Agreement:
Plan Category | Number of securities to be issued upon exercise of outstanding options, warrants and rights | Weighted-average exercise price of outstanding options, warrants and rights | Number of securities remaining available for future issuance under equity compensation plans (1) | |||||||
Equity compensation plans approved by security holders | 165,000 | $ | 6.05 | 978,375 | ||||||
Equity compensation plans not approved by security holders | N/A | N/A | N/A | |||||||
Total | 165,000 | $ | 6.05 | 978,375 | ||||||
(1) | To the extent that any outstanding award under the 2012 Plan is canceled, expired, forfeited, surrendered, settled in cash, or otherwise terminated without delivery of shares to the participant, the shares retained by or returned to us will be available for future awards under the 2012 Plan. |
17
Stock Performance Graph
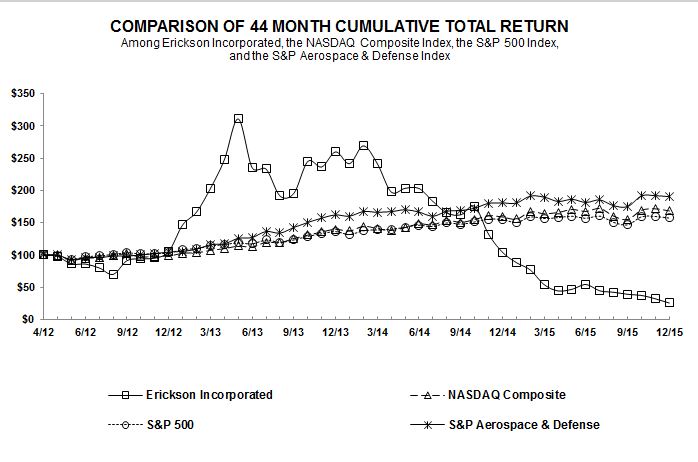
The following graph compares the cumulative total return on our common stock from April 10, 2012 (the date of our initial public offering) to December 31, 2015, with the cumulative total returns of the NASDAQ Composite Index, S&P 500 Index and S&P Aerospace and Defense Index from March 31, 2012 to December 31, 2015. The comparison assumes $100 was invested in shares of our common stock on April 10, 2012. The historical stock price performance shown on this graph is not necessarily indicative of future performance.
18
ITEM 6. | SELECTED FINANCIAL DATA. |
The following consolidated selected financial and other data should be read in conjunction with Item 7.—“Management’s Discussion and Analysis of Financial Condition and Results of Operations” and Item 8.—“Financial Statements and Supplementary Data.”
As of December 31, | |||||||||||||||||||
2015 | 2014 | 2013 (1) | 2012 | 2011 | |||||||||||||||
(In thousands) | |||||||||||||||||||
Consolidated Balance Sheet Data: | |||||||||||||||||||
Cash and cash equivalents | $ | 2,129 | $ | 5,097 | $ | 1,881 | $ | 1,468 | $ | 268 | |||||||||
Aircraft, net, aircraft support parts and property, plant and equipment, net | 351,294 | 386,449 | 363,257 | 214,389 | 185,916 | ||||||||||||||
Total assets(2) | 601,653 | 693,220 | 710,435 | 248,024 | 224,783 | ||||||||||||||
Credit facility | 96,165 | 87,062 | 65,410 | 21,861 | 50,257 | ||||||||||||||
Total long-term debt(3) | 372,987 | 362,797 | 360,343 | 75,424 | 78,787 | ||||||||||||||
Working capital(4) | 8,562 | 17,840 | 3,357 | (73,125 | ) | (2,042 | ) | ||||||||||||
Total Erickson Incorporated shareholders’ equity (deficit) | 88,570 | 180,287 | 192,017 | 104,352 | (10,023 | ) | |||||||||||||
Years Ended December 31, | |||||||||||||||||||
2015 | 2014 | 2013 (1) | 2012 | 2011 | |||||||||||||||
(In thousands, except per share amounts) | |||||||||||||||||||
Consolidated Statement of Operations Data: | |||||||||||||||||||
Revenues, net | $ | 297,520 | $ | 346,609 | $ | 318,221 | $ | 180,824 | $ | 152,769 | |||||||||
Gross margin(5) | 15.9 | % | 23.3 | % | 29.6 | % | 33.1 | % | 28.4 | % | |||||||||
Operating income (loss) | $ | (54,799 | ) | $ | 22,330 | $ | 46,992 | $ | 33,433 | $ | 16,599 | ||||||||
Net income (loss)(6) | (86,632 | ) | (10,231 | ) | 9,866 | 15,636 | 16,260 | ||||||||||||
Net income (loss) attributable to Erickson Incorporated(6) | (86,713 | ) | (10,292 | ) | 9,657 | 15,230 | 15,870 | ||||||||||||
Net income (loss) attributable to Erickson Incorporated common shareholders(6) | (86,713 | ) | (10,292 | ) | 9,657 | 12,435 | 6,719 | ||||||||||||
Earnings (loss) per share—basic | (6.27 | ) | (0.75 | ) | 0.86 | 1.78 | 6,718.57 | ||||||||||||
Earnings (loss) per share—diluted | (6.27 | ) | (0.75 | ) | 0.82 | 1.78 | 6,718.57 | ||||||||||||
Consolidated Statement of Cash Flow Data: | |||||||||||||||||||
Net cash provided by (used in): | |||||||||||||||||||
Operating activities | $ | 21,168 | $ | 13,984 | $ | (24,792 | ) | $ | 28,158 | $ | (20,723 | ) | |||||||
Investing activities | (20,944 | ) | (30,120 | ) | (282,935 | ) | (21,492 | ) | (13,083 | ) | |||||||||
Financing activities | 1,331 | 21,494 | 307,888 | (5,446 | ) | 32,759 | |||||||||||||
Effect of foreign currency exchange rates on cash and cash equivalents | (4,523 | ) | (2,142 | ) | 252 | (20 | ) | (613 | ) | ||||||||||
Other Financial Data: | |||||||||||||||||||
EBITDA(7) | $ | (9,389 | ) | $ | 58,412 | $ | 76,347 | $ | 55,268 | $ | 45,283 | ||||||||
Adjusted EBITDA(7) | 58,703 | 83,753 | 90,881 | 56,913 | 42,083 | ||||||||||||||
Adjusted EBITDAR(7) | 75,700 | 103,951 | 104,886 | 56,913 | 42,083 | ||||||||||||||
(1) | Includes the financial information for EHI from May 2, 2013 forward and Air Amazonia from September 3, 2013 forward, the dates of acquisition. |
(2) | To conform with the 2015 presentation, debt issuance costs of $11.4 million in 2014 and $13.5 million in 2013 were reclassified from other noncurrent assets to credit facility and long-term debt, with $0.6 million in 2012 and $1.5 million in 2011 reclassified to credit facility. In addition, deferred tax assets of $0.9 million in 2014, $3.4 million in 2013, $8.2 million in 2012 and $7.6 million in 2011 were reclassified to deferred tax liabilities. |
19
(3) | To conform with the 2015 presentation, amounts outstanding under the credit facility are presented separately from long-term debt and debt issuance costs were reclassified from other noncurrent assets to long-term debt. |
(4) | To conform with the 2015 presentation, current deferred tax assets of $1.2 million in 2014, $3.7 million in 2013, $8.2 million in 2012, and $7.6 million in 2011 were reclassified to noncurrent deferred taxes. As of December 31, 2012, $71.2 million of debt outstanding under our credit facility is classified as a current liability due to the credit facility’s maturity date. |
(5) | To conform with the 2015 presentation, external commissions expense was reclassified from sales and marketing expense to cost of revenues as follows: $2.3 million in 2014; $1.9 million in 2013; $1.6 million in 2012; and $2.0 million in 2011. Accordingly, gross margin presented for such years do not agree with percents previously reported in our Annual Report on Form 10-K for the year ended December 31, 2014, which was filed with the SEC on March 10, 2015. |
(6) | For 2015, reflects impairment charges $49.8 million related to goodwill and $15.2 million related to other assets. For 2014, reflects impairment charge of $21.3 million related to goodwill. For 2013, reflects a $3.4 million loss on the sale of a note receivable from Evergreen International Aviation, Inc., the former parent of Evergreen Helicopters, Inc., which we acquired in May 2013. For 2011, reflects the reversal of $2.7 million of interest expense and an income tax benefit of $9.5 million related to the settlement of a tax matter. |
(7) | For the definition of such non-GAAP measurement, see “Non-GAAP Financial Measurements” in Item 7. Management’s Discussion and Analysis of Financial Condition and Results of Operations, as well as an explanation as to why such measurement is important to us and a reconciliation to net income (loss) attributable to Erickson Incorporated as reported on our consolidated statements of operations. |
20
ITEM 7. | MANAGEMENT’S DISCUSSION AND ANALYSIS OF FINANCIAL CONDITION AND RESULTS OF OPERATIONS. |
The following Management’s Discussion and Analysis of Financial Condition and Results of Operations (“MD&A”) is intended to help the reader understand our business and operations. The following discussion and analysis should be read in conjunction with Item 6.—“Selected Financial Data and Item 8.—“Financial Statements and Supplementary Data.” Certain statements contained in this discussion may constitute forward-looking statements within the meaning of the Private Securities Litigation Reform Act of 1995. These statements involve a number of risks, uncertainties and other factors that could cause actual results to differ materially from those reflected in any forward-looking statements, as discussed more fully in Part I, “Item 1A. Risk Factors.”
OVERVIEW OF THE BUSINESS
Erickson Incorporated is a vertically integrated aerial services company engaged in the manufacture, maintenance and repair and the operation of aircraft in the U.S. and internationally. We generate revenues and cash flows from providing aerial and specialized manufacturing and maintenance services to commercial and governmental entities worldwide. Our vertically-integrated manufacturing capability provides unique manufacturing and MRO services for the Aircrane and other legacy aircraft platforms, related components, and aftermarket support.
The year ended December 31, 2015 was a challenging one for us, with a net loss of $86.7 million compared with a net loss of $10.3 million in 2014. The $76.4 million increase in our net loss was largely driven by a $28.6 million increase in the goodwill impairment charge recognized related to our Global Defense and Security segment, with $49.8 million recognized in 2015 and $21.3 million recognized in 2014, and the $15.2 million other asset impairment charge recognized in 2015 related to aircraft available for sale, of which we had none in 2014.
In addition, gross profit from our Global Defense and Security segment declined 72.4% primarily resulting from the reduction in scope of DoD activity in Afghanistan and the end of existing contracts in the Philippines and other locations, and our Commercial Aviation Services segment declined 32.6% primarily resulting from lower oil and gas services in Brazil coupled with lower firefighting services and timber harvesting activities. Partially offsetting these declines, was a 76.5% increase in our Manufacturing and MRO gross profit, as we had higher aircraft and related asset sales and we added a new legacy platform program, the Bell 214, which began in early 2015.
To provide aerial services to our customers, the aircraft we utilize are either owned or leased. Aircraft are subject to varying levels of required scheduled maintenance and inspections, which can be based on flight hours or lapse of time. As a result of planned or unplanned maintenance, aircraft are out-of-service from time-to-time. Throughout the course of any given year, we may remove aircraft from service for maintenance or to sell, or add aircraft to the fleet either through our own manufacturing facility or through a purchase or lease. Our aircraft utilization, which is calculated as the number of days on contract as a percentage of total available days, was as follows:
Years Ended December 31, | ||||||||
2015 | 2014 | 2013 | ||||||
Rotor Wing: | ||||||||
Heavy lift | 62.8 | % | 62.7 | % | 66.5 | % | ||
Medium and light lift | 24.1 | 45.5 | 46.0 | |||||
Fixed Wing | 24.3 | 33.0 | 50.0 | |||||
21
RESULTS OF OPERATIONS
The following table provides financial information to be considered in conjunction with management’s discussion and analysis of results of operations. Our consolidated statement of operations, and percentage of revenues, for the years presented are as follows (dollars in thousands):
Years Ended December 31, | ||||||||||||||||||||
2015 | 2014 | 2013 | ||||||||||||||||||
Revenues: | ||||||||||||||||||||
Commercial Aviation Services | $ | 160,885 | 54.1 | % | $ | 177,261 | 51.1 | % | $ | 179,955 | 56.6 | % | ||||||||
Global Defense and Security | 105,158 | 35.3 | 154,057 | 44.5 | 125,558 | 39.4 | ||||||||||||||
Manufacturing and MRO | 31,477 | 10.6 | 15,291 | 4.4 | 12,708 | 4.0 | ||||||||||||||
Total revenues | 297,520 | 100.0 | 346,609 | 100.0 | 318,221 | 100.0 | ||||||||||||||
Cost of revenues: | ||||||||||||||||||||
Commercial Aviation Services(1) | 129,018 | 80.2 | 129,978 | 73.3 | 122,991 | 68.3 | ||||||||||||||
Global Defense and Security(1) | 97,035 | 92.3 | 124,574 | 80.9 | 92,360 | 73.6 | ||||||||||||||
Manufacturing and MRO(1) | 24,192 | 76.9 | 11,163 | 73.0 | 8,680 | 68.3 | ||||||||||||||
Total cost of revenues | 250,245 | 84.1 | 265,715 | 76.7 | 224,031 | 70.4 | ||||||||||||||
Gross profit: | ||||||||||||||||||||
Commercial Aviation Services(1) | 31,867 | 19.8 | 47,283 | 26.7 | 56,964 | 31.7 | ||||||||||||||
Global Defense and Security(1) | 8,123 | 7.7 | 29,483 | 19.1 | 33,198 | 26.4 | ||||||||||||||
Manufacturing and MRO(1) | 7,285 | 23.1 | 4,128 | 27.0 | 4,028 | 31.7 | ||||||||||||||
Total gross profit | 47,275 | 15.9 | 80,894 | 23.3 | 94,190 | 29.6 | ||||||||||||||
Operating expenses: | ||||||||||||||||||||
General and administrative | 28,891 | 9.7 | 26,606 | 7.7 | 37,674 | 11.8 | ||||||||||||||
Research and development | 2,675 | 0.9 | 3,782 | 1.1 | 4,000 | 1.3 | ||||||||||||||
Selling and marketing | 5,449 | 1.8 | 6,904 | 2.0 | 5,524 | 1.7 | ||||||||||||||
Impairment of goodwill | 49,823 | 16.8 | 21,272 | 6.1 | — | — | ||||||||||||||
Impairment of other assets | 15,236 | 5.1 | — | — | — | — | ||||||||||||||
Total operating expenses | 102,074 | 34.3 | 58,564 | 16.9 | 47,198 | 14.8 | ||||||||||||||
Operating income (loss) | (54,799 | ) | (18.4 | ) | 22,330 | 6.4 | 46,992 | 14.8 | ||||||||||||
Interest expense, net | (37,073 | ) | (12.5 | ) | (35,800 | ) | (10.3 | ) | (25,175 | ) | (7.9 | ) | ||||||||
Other income (expense), net | 517 | 0.2 | (1,193 | ) | (0.3 | ) | (5,831 | ) | (1.9 | ) | ||||||||||
Net income (loss) before income taxes and noncontrolling interests | (91,355 | ) | (30.7 | ) | (14,663 | ) | (4.2 | ) | 15,986 | 5.0 | ||||||||||
Income tax expense (benefit) | (4,723 | ) | (1.6 | ) | (4,432 | ) | (1.3 | ) | 6,120 | 1.9 | ||||||||||
Net income (loss) | (86,632 | ) | (29.1 | ) | (10,231 | ) | (2.9 | ) | 9,866 | 3.1 | ||||||||||
Less: net income attributable to noncontrolling interests | (81 | ) | — | (61 | ) | — | (209 | ) | (0.1 | ) | ||||||||||
Net income (loss) attributable to Erickson Incorporated | $ | (86,713 | ) | (29.1 | ) | $ | (10,292 | ) | (2.9 | ) | $ | 9,657 | 3.0 | |||||||
(1) | Percentages presented are of respective segment revenues. |
22
2015 Compared to 2014
Revenues, net decreased $49.1 million, or 14.2%, to $297.5 million for 2015 from $346.6 million for 2014.
Commercial Aviation Services revenues decreased $16.4 million, or 9.2%, to $160.9 million in 2015 from $177.3 million in 2014. Such decrease was primarily due to a decline in oil and gas services in Brazil, coupled with lower firefighting activity in Europe, and a decrease in timber harvesting revenues caused by the weakness of the Canadian dollar.
Global Defense and Security revenues decreased $48.9 million, or 31.7%, to $105.2 million in 2015 from $154.1 million in 2014. Such decrease was primarily due to a reduction in scope of DoD activity in Afghanistan and the end of existing contracts in the Philippines and other locations.
Manufacturing and MRO revenues increased $16.2 million, or 105.9%, to $31.5 million in 2015 from $15.3 million in 2014. The increase was primarily due to an increase in aircraft and related asset sales, combined with higher revenue due to the addition of a new legacy platform program, the Bell 214, which began in early 2015. In 2015, we sold seven aircraft totaling $7.5 million, compared with 2014, in which we sold four aircraft totaling $2.8 million.
Cost of revenues decreased $15.5 million, or 5.8%, to $250.2 million for 2015 from $265.7 million for 2014. Aviation services costs are primarily comprised of salaries and benefit costs of our pilots and field mechanics, depreciation and amortization related to the aircraft, aircraft lease costs, insurance and other similar costs.
Commercial Aviation Services costs of revenues were $129.0 million, or 80.2% of revenues for the segment for 2015, compared with $130.0 million, or 73.3% of revenues for the segment for 2014. The increase as a percent of revenues was primarily due to the high operating leverage of the commercial business as aircraft leases, field maintenance, pilots, and depreciation are fixed costs.
Global Defense and Security costs of revenues were $97.0 million, or 92.3% of revenues for the segment for 2015, compared with $124.6 million, or 80.9% of revenues for the segment for 2014. The increase as a percent of revenues was primarily due to the end of contracts and associated variable costs.
Manufacturing and MRO costs of revenues are primarily comprised of variable costs, such as labor and parts, related to the manufacture and MRO services provided for aircraft, as well as the cost, including any deferred overhaul amount, of aircraft and support parts sold. For 2015, these costs were $24.2 million, or 76.9% of revenues for the segment, compared to $11.2 million, or 73.0% of revenues for the segment for 2014. The increase as a percent of revenue was primarily due to higher aircraft sales.
General and administrative expense consists primarily of wages, benefits, and travel costs for general and administrative employees and fees paid to contractors and consultants in executive, finance, accounting, information technology, human resources, and legal roles, including employees in our foreign subsidiaries involved in these activities. These expenses increased $2.3 million, or 8.6%, to $28.9 million for 2015 from $26.6 million for 2014, which was largely due to the charge to expense of a doubtful non-current account receivable balance from a Greece customer in the net amount of $4.3 million. Partially offsetting the increase were reductions in headcount and cost savings initiatives enacted company wide.
Research and development expense consists primarily of wages, benefits, and travel costs for our engineering employees and fees paid to contractors and consultants, as well as expenses for materials needed to support research and development efforts and expenses associated with the development of composite main rotor blades for commercial use in the Aircrane and the CH-54. Such expenses decreased $1.1 million, or 29.3%, to $2.7 million for 2015 from $3.8 million for 2014, which was largely due to lower costs associated with the development of composite main rotor blades and reductions in headcount.
Selling and marketing expense consists primarily of compensation, benefits, and travel costs for sales and marketing employees and fees paid to contractors and consultants, as well as bad debt expense and expenses for trade shows, customers demonstrations, and public relations and other promotional and marketing efforts. Such expenses decreased $1.5 million, or 21.1%, to $5.4 million for 2015 from $6.9 million for 2014. Such decrease was due to reductions in headcount and cost savings initiatives enacted company wide.
Impairment of goodwill was $49.8 million for 2015 and $21.3 million for 2014, which resulted from goodwill impairment analyses performed during each year, which resulted in the recognition of impairment charges related to our Global Defense and Security segment.
23
Impairment of other assets was $15.2 million for 2015 resulted from the write down of the carrying value of certain aircraft to their estimated fair value less the costs to sell, which was done in connection with the reclassification of these aircraft to held for sale.
Interest expense, net increased $1.3 million, or 3.6%, to $37.1 million for 2015 from $35.8 million for 2014. Such increase was due to an increase in our average outstanding borrowings.
Other income, net was $0.5 million for 2015 compared with other expense, net of $1.2 million for 2014, which consisted of the following (in thousands):
Years Ended December 31, | |||||||||||
2015 | 2014 | Change | |||||||||
Other income (expense), net: | |||||||||||
Amortization of debt issuance costs | $ | (2,660 | ) | $ | (2,433 | ) | $ | (227 | ) | ||
Unrealized foreign currency exchange losses, net | (467 | ) | (387 | ) | (80 | ) | |||||
Realized foreign currency exchange gains (losses), net | 941 | (42 | ) | 983 | |||||||
Gains on early extinguishment of debt | 806 | — | 806 | ||||||||
Gains on disposal of equipment | 156 | 358 | (202 | ) | |||||||
Gain on involuntary conversion | — | 308 | (308 | ) | |||||||
Miscellaneous income, net | 1,741 | 1,003 | 738 | ||||||||
Other income (expense), net | $ | 517 | $ | (1,193 | ) | $ | 1,710 | ||||
The change was driven by the reversal of penalties associated with the reduction in uncertain tax positions, which is included in miscellaneous income, net, in 2015, combined with realized foreign currency exchange gains and gains on the early extinguishment of debt in 2015. Such increase to other income were partially offset by decreases related to higher amortization of debt issuance costs and unrealized foreign currency exchange losses in 2015 when compared with 2014, and lower gains related to the disposal of equipment and on an involuntary conversion.
Income tax benefit increased to $4.7 million for 2015 from $4.4 million for 2014. The benefit in 2015 was primarily due to a decrease in unrecognized tax benefits partially offset by foreign taxes. A valuation allowance was established in 2015 related to the Company’s U.S. and Brazilian deferred tax assets. The benefit in 2014 was primarily due to losses from operations including a goodwill impairment charge recorded in the second quarter of 2014.
2014 Compared to 2013
Revenues increased $28.4 million, or 8.9%, to $346.6 million in 2014 from $318.2 million in 2013 as a result of the following:
Commercial Aviation Services revenues decreased $2.7 million, or 1.5%, to $177.3 million in 2014 from $180.0 million in 2013. Such decrease was primarily driven by lower timber harvesting revenues resulting from lower revenues in Malaysia where we ended our logging operations in the second quarter of 2014 and lower revenues in Canada due to weather and lack of customer demand, combined with lower infrastructure construction revenues in North America due to weather and project delays. Partially offsetting these decreases was higher infrastructure construction revenues in South American from the oil and gas industries.
Global Defense and Security revenues increased $28.5 million, or 22.7%, to $154.1 million in 2014 from $125.6 million in 2013. Such increase was primarily due to higher defense and security revenues resulting from the acquisition of EHI on May 2, 2013, which was partially offset by a decrease related to lower DoD activity in Afghanistan and the loss of contract renewals in Central Africa.
Manufacturing and MRO revenues increased $2.6 million, or 20.3%, to $15.3 million in 2014 from $12.7 million in 2013 and was largely driven by the sale of four aircraft in 2014, of which we had none in 2013.
Cost of revenues increased $41.7 million, or 18.6%, to $265.7 million for 2014 from $224.0 million for 2013.
Commercial Aviation Services costs of revenues were $130.0 million, or 73.3% of revenues for the segment in 2014, compared with $123.0 million, or 68.3% of revenues for the segment for 2013. The increase as a percent of revenues was
24
primarily due to higher costs related to aircraft leases, field maintenance, pilots, and depreciation, partially offset by lower insurance and plant costs.
Global Defense and Security costs of revenues were $124.6 million, or 80.9% of revenues for the segment in 2014, compared with $92.4 million, or 73.6% of revenues for the segment for 2013. The increase as a percent of revenue was primarily due to higher costs related to aircraft leases, field maintenance, pilots, depreciation, and the addition of EHI, partially offset by lower insurance and plant costs.
Manufacturing and MRO costs of revenues were $11.2 million, or 73.0% of revenues for the segment in 2014, compared with $8.7 million, or 68.3% of revenues for the segment for 2013. The increase as a percent of revenue was primarily due to aircraft sales.
General and administrative expense decreased $11.1 million, or 29.4%, to $26.6 million for 2014 compared with $37.7 million for 2013. Such decrease was primarily due to lower acquisition and integration costs associated with the purchases of EHI and Air Amazonia in 2013 and lower incentive compensation expense in 2014.
Selling and marketing expense increased $1.4 million, or 25.0%, to $6.9 million for 2014 compared with $5.5 million for 2013. Such increase was primarily due to the addition of EHI and Air Amazonia, which we acquired in May 2013 and September 2013, respectively.
Impairment of goodwill of $21.3 million for 2014 resulted from our annual goodwill impairment analysis performed in the second quarter of 2014, which resulted in the recognition of an impairment charge against the carrying amount of goodwill related to our Global Defense and Security segment.
Interest expense, net increased $10.6 million, or 42.2%, to $35.8 million for 2014 compared with $25.2 million for 2013. Such increase was due to an increase in our average long-term debt balance outstanding, plus borrowings under our credit facility. The average long-term debt balance outstanding, plus amounts under the credit facility, was $450.2 million for 2014 compared with $268.6 million for 2013, a 67.7% increase, which was primarily driven by the issuance of $355 million of notes in May 2013 to fund the acquisition of Evergreen Helicopters, Inc.
Other expense, net decreased $4.6 million and consisted of the following (in thousands):
Years Ended December 31, | |||||||||||
2014 | 2013 | Change | |||||||||
Other income (expense), net: | |||||||||||
Amortization of debt issuance costs | $ | (2,433 | ) | $ | (2,067 | ) | $ | (366 | ) | ||
Unrealized foreign currency exchange gains (losses), net | (387 | ) | 309 | (696 | ) | ||||||
Gains on disposal of equipment | 358 | 1 | 357 | ||||||||
Gain on involuntary conversion | 308 | — | 308 | ||||||||
Realized foreign currency exchange losses, net | (42 | ) | (172 | ) | 130 | ||||||
Loss on early extinguishment of debt | — | (215 | ) | 215 | |||||||
Miscellaneous income (expense), net | 1,003 | (3,687 | ) | 4,690 | |||||||
Total other expense, net | $ | (1,193 | ) | $ | (5,831 | ) | $ | 4,638 | |||
The decrease in other expense, net was primarily due to the sale of a note receivable in 2013 which resulted in a loss of $3.4 million.
Income tax benefit was $4.4 million for 2014 compared with expense of $6.1 million for 2013. Such change was primarily due to the net loss for 2014 compared with net income for 2013, which was driven by a goodwill impairment charge recorded in the second quarter of 2014.
25
LIQUIDITY AND CAPITAL RESOURCES
Our primary sources of liquidity are borrowings available under our revolving credit facility, expected cash flows from operations, and current balances of cash and cash equivalents. Our primary cash needs are debt service payments, capital expenditures and funding working capital requirements. Cash and cash equivalents in excess of our needs are held in interest bearing accounts with financial institutions.
We have a concentration of large customers, several of which are U.S. and foreign government agencies or entities, and our cash flows depend on being able to collect our receivables from them. If, in the future, we cannot generate sufficient cash from operations to comply with our debt service obligations, we will need to refinance such debt obligations, obtain additional financing, or sell assets. We believe that our cash from operations and borrowings available to us under our revolving credit facility will be adequate to meet our liquidity needs, capital expenditure requirements and debt service payments for at least the next 12 months.
In addition, we may need to fund our debt service obligations or capital expenditures through the issuance of debt or equity securities or other external financing sources to the extent we are unable to fund such debt service obligations or capital expenditures out of our cash from operations.
As part of our business strategy, we may acquire businesses or specific assets or engage in other strategic transactions.
However, our cash from operations and borrowings available under our existing credit facility may not be sufficient to fund any acquisitions or strategic transactions we choose to make. As a result, in the event we engage in any acquisitions or strategic transactions we may need to seek additional funds through the issuance of additional equity or debt securities or other sources of financing.
Liquidity
The following summarizes our statement of cash flows for the periods presented (in thousands):
Years Ended December 31, | |||||||||||
2015 | 2014 | 2013 | |||||||||
Cash and cash equivalents at beginning of year | $ | 5,097 | $ | 1,881 | $ | 1,468 | |||||
Net cash provided by (used in): | |||||||||||
Operating activities | 21,168 | 13,984 | (24,792 | ) | |||||||
Investing activities | (20,944 | ) | (30,120 | ) | (282,935 | ) | |||||
Financing activities | 1,331 | 21,494 | 307,888 | ||||||||
Effect of foreign currency exchange rates on cash and cash equivalents | (4,523 | ) | (2,142 | ) | 252 | ||||||
Net change in cash and cash equivalents | (2,968 | ) | 3,216 | 413 | |||||||
Cash and cash equivalents at end of year | $ | 2,129 | $ | 5,097 | $ | 1,881 | |||||
2015 Compared to 2014
Cash flows from operating activities—Cash flows from operating activities are generally determined by the amount and timing of cash received from customers and payments made to vendors, as well as the nature and amount of non-cash items in our statement of operations, including i) depreciation and amortization, ii) goodwill and other intangible assets impairment charges and iii) non-cash income and expenses and gains and losses included in net income during a given period. The $7.2 million increase in net cash provided by operating activities in 2015 compared with 2014 was driven by an increase resulting from the net change in operating assets and liabilities, partially offset by a decrease resulting from a higher net loss in 2015 compared with 2014, including non-cash reconciling items.
During 2014, decreases in accrued payroll and related taxes and deferred maintenance on aircraft, which are included in accrued and other current liabilities, combined with an increase in aircraft support parts, net, contributed to the increase in cash provided by operating activities from our operating assets and liabilities for 2015 when compared with 2014. A decrease in accounts receivable during 2014, which was largely due to a 21% decline in revenues during the fourth quarter of 2014 compared with the fourth quarter of 2013, had the effect to decrease cash provided by operating activities for 2015 when compared with 2014.
26
Cash flows from investing activities—Such activities consist primarily of investments made in our aircraft fleet, other capital expenditures and acquisitions of businesses, as well as the financing transactions related to our aircraft fleet. The $9.2 million decrease in cash used in investing activities in 2015 compared with 2014 was primarily due to a $30.7 million decrease in aircraft and routine capital expenditures, which was partially offset by a $19.6 million decrease in proceeds from sale-leaseback transactions. During 2015, we received $5.1 million in proceeds from a sale-leaseback transaction, compared with $24.7 million in 2014.
Cash flows from financing activities—Such activities provide supplemental cash for both day-to-day operations and capital requirements as needed. During 2015, cash used in such activities primarily consisted of $6.9 million of long-term debt and capital lease payments, partially offset by $8.7 million net credit facility borrowings. During 2014, cash provided by financing activities primarily consisted of net credit facility borrowings of $21.3 million.
Effect of foreign currency exchange rates on cash and cash equivalents—This represents the effect that foreign currency exchange rates relative to the US dollar have on our cash and cash equivalents resulting from our foreign currency transactions. The currencies which influence the effect on our cash and cash equivalents consist of Canadian dollars (C$), Euros (€) and Brazilian Real (R$). For 2015, foreign currency exchange rates had a $4.5 million unfavorable impact on our cash and cash equivalents, compared with $2.1 million in 2014.
2014 Compared to 2013
Cash flows from operating activities—The $38.8 million increase in net cash provided by operating activities in 2014 compared with 2013 was driven by the net change of operating assets and liabilities (working capital items), which had the effect to increase cash provided by operations by $56.2 million for 2014 when compared with 2013. A decrease in accounts receivable during 2014, which was largely due to a 21% decline in revenues during the fourth quarter of 2014 compared with the fourth quarter of 2013, compared with an increase in accounts receivable during 2013, which was largely due to the acquisition of EHI and Air Amazonia in May 2013, had the effect to increase cash by $40.7 million for 2014 when compared with 2013. Additionally, smaller increases in aircraft support parts, net and smaller decreases in accounts payable balance contributed to the increase in cash provided by operating activities for 2014 when compared with 2013, while decreases in 2014 of accrued payroll and related taxes and deferred maintenance on aircraft, which are included in accrued and other current liabilities, partially offset such increases.
The increase in cash provided by operating activities from operating assets and liabilities was partially offset by a decrease resulting from a net loss incurred in 2014 compared with net income in 2013.
Cash flows from investing activities—The $252.8 million decrease in net cash used in investing activities in 2014 compared with 2013 was primarily due to the use of $226.9 million of cash in 2013 for the EHI and Air Amazonia acquisitions, combined with proceeds received of $24.7 million in 2014 for the sale-leaseback of an aircraft.
Cash flows from financing activities—During 2014, net cash provided by financing activities primarily consisted of net credit facility borrowings of $21.3 million. During 2013, net cash provided by financings activities primarily consisted of $400.0 million of proceeds from the issuance of long-term debt, partially offset by of $3.8 million net credit facility payments, $72.6 million of long-term debt principal payments, and $15.0 million for debt issuance costs.
Effect of foreign currency exchange rates on cash and cash equivalents—For 2014, foreign currency exchange rates had a $2.1 million unfavorable impact on our cash and cash equivalents, compared with a $0.3 million favorable impact on cash and cash equivalents in 2013.
Description of Indebtedness
The following summary of certain provisions of the instruments evidencing our material indebtedness does not purport to be complete and is subject to, and qualified in its entirety by reference to, all of the provisions of the corresponding agreements, including the definitions of certain terms therein that are not otherwise defined in this Form 10-K.
Credit Facility
We have a $140.0 million Credit Facility with a group of financial institutions, of which we had borrowings outstanding thereunder in the amount of $98.0 million as of December 31, 2015, and presented net of debt issuance costs of $1.8 million in our consolidated balance sheet.
27
The Credit Facility is primarily used for general corporate purposes and expires May 2, 2018. The interest rate is 225-450 basis points over the London Interbank Offered Rate or prime base rate depending on the Company’s senior leverage ratio at the time of borrowing and was 5.02% during 2015.
We and each of our current and future, direct and indirect, material subsidiaries guarantee the indebtedness under the Credit Facility on a senior-secured first-lien basis. The Credit Facility includes mandatory prepayment requirements for the certain types of transactions, including, but not limited to, requiring prepayment from proceeds that the Company receives as a result of certain asset sales, subject to re-investment provisions on terms to be determined, and proceeds from extraordinary receipts.
The Credit Facility contains certain covenants including, among other items, the following:
• | Fixed Charge Coverage Ratio—This covenant is only triggered when the available borrowing capacity under the Credit Facility is less than 12.5% of the maximum revolver amount of $140.0 million, or approximately $17.5 million. The Credit Facility contains a provision that the Company maintain a minimum fixed charge coverage ratio of 1.10:1.00. Such minimum fixed charge coverage ratio once triggered stays in effect until the later of: (i) the last day of the second full calendar quarter and (ii) the last day of the calendar quarter after the trigger date in which available borrowing capacity for 30 consecutive days is greater than or equal to 12.5% of the maximum revolver amount. The fixed charge coverage ratio has multiple inputs, including, but not limited to: (i) EBITDA and capital expenditures for the trailing 12-month period to (ii) fixed charges of interest expense, scheduled principal payments, and income taxes for the trailing 12-month period. As of December 31, 2015, the Company had not triggered such fixed charge coverage ratio. |
• | Growth Capital Expenditures—The Credit Facility contains a provision that limits the Company’s annual Growth Capital Expenditures, as defined in the agreement, to $10.0 million for 2015, $20.0 million for 2016 and $25.0 million for 2017 and beyond, subject to carry-over provisions for 2016 and beyond. |
We were in compliance with the financial covenants as of December 31, 2015.
As of December 31, 2015, we had $1.6 million of outstanding standby letters of credit under the Credit Facility, with a maximum borrowing availability of $22.9 million as of December 31, 2015.
Long-term Debt
As of December 31, 2015, we have $355.0 million of 2020 Senior Notes, which bear interest at 8.25% per annum, are second priority senior secured obligations, and are due in 2020. The 2020 Senior Notes are guaranteed by certain of our existing and future domestic subsidiaries and secured by second-position liens, subject to certain exceptions and permitted liens, on substantially all of our existing and future assets that secure our Credit Facility.
The indenture under which the 2020 Senior Notes were issued limits our ability and the ability of our restricted subsidiaries to, among other things: (i) pay dividends or distributions, repurchase equity, prepay subordinated debt or make certain investments; (ii) incur additional debt or issue certain disqualified stock and preferred stock; (iii) incur liens on assets; (iv) merge or consolidate with another company or sell all or substantially all assets; (v) enter into transactions with affiliates; and (vi) allow to exist certain restrictions on the ability of the guarantors to pay dividends or make other payments to us.
28
NON-GAAP FINANCIAL MEASURES
Non-GAAP financial measures are supplemental measures of performance that are not required by or presented in accordance with generally accepted accounting principles in the U.S. (“U.S. GAAP”). To monitor our business, we use three non-GAAP financial measures as follows: (i) earnings before interest, taxes, depreciation and amortization (“EBITDA”); (ii) Adjusted EBITDA; and (iii) Adjusted EBITDAR. Such supplemental measures are not measurements of our financial performance under U.S. GAAP and should not be considered as alternatives to revenue, net income (loss), cash flow, or any other performance measure derived in accordance with U.S. GAAP.
These three non-GAAP financial measures are defined by us as follows:
EBITDA—Consists of net income (loss) attributable to Erickson Incorporated and adjusted for interest expense, net, income tax expense (benefit), depreciation and amortization, and amortization of debt issuance costs.
Adjusted EBITDA—Consists of our EBITDA, previously defined, and adjusted for non-cash items including, but not limited to, goodwill and other asset impairment losses, unrealized foreign currency exchange gains or losses, and stock-based compensation and certain other costs including, but not limited to, acquisition and integration-related costs and restructuring costs.
Adjusted EBITDAR—Consists of our Adjusted EBITDA, previously defined, and adjusted for aircraft lease expense.
Our presentation of EBITDA, Adjusted EBITDA, and Adjusted EBITDAR may not be comparable to similarly titled measures of other companies. We believe that our adjustments to arrive at EBITDA are common industry practice amongst our peers and we believe this provides us with a more comparable measure for managing our business. We also believe that it is frequently used by securities analysts, investors, and other interested parties in the evaluation of companies in our industry. Adjusted EBITDA is primarily used to monitor compliance with certain financial covenants under our credit facility agreement. We use Adjusted EBITDAR as we believe this provides us with a more comparable measure for managing our business.
A reconciliation of net income (loss) attributable to Erickson Incorporated as reported on our consolidated statements of operations to EBITDA, Adjusted EBITDA, and Adjusted EBITDAR is as follows (in thousands):
Years Ended December 31, | |||||||||||||||||||
2015 | 2014 | 2013 | 2012 | 2011 | |||||||||||||||
Net income (loss) attributable to Erickson Incorporated | $ | (86,713 | ) | $ | (10,292 | ) | $ | 9,657 | $ | 15,230 | $ | 15,870 | |||||||
Interest expense, net | 37,073 | 35,800 | 25,175 | 6,990 | 9,150 | ||||||||||||||
Tax expense (benefit) | (4,723 | ) | (4,432 | ) | 6,120 | 10,213 | (4,926 | ) | |||||||||||
Depreciation and amortization | 42,314 | 34,903 | 33,328 | 21,661 | 24,314 | ||||||||||||||
Amortization of debt issuance costs | 2,660 | 2,433 | 2,067 | 1,174 | 875 | ||||||||||||||
EBITDA | (9,389 | ) | 58,412 | 76,347 | 55,268 | 45,283 | |||||||||||||
Impairment of goodwill | 49,823 | 21,272 | — | — | — | ||||||||||||||
Impairment of other assets | 15,236 | — | — | — | — | ||||||||||||||
Restructuring costs | 2,545 | 1,482 | — | — | — | ||||||||||||||
Unrealized foreign currency exchange (gains) losses, net | 467 | 387 | (309 | ) | 322 | (1,819 | ) | ||||||||||||
Stock-based compensation | 294 | 861 | 792 | 2,118 | — | ||||||||||||||
(Gain) loss on early extinguishment of debt | (806 | ) | — | 215 | — | — | |||||||||||||
Acquisition and integration related expenses | 195 | 1,687 | 10,383 | — | — | ||||||||||||||
Loss on sale of note receivable acquired in the purchase of Evergreen Helicopters, Inc. | — | — | 3,441 | — | — | ||||||||||||||
Other non-cash items | 338 | (348 | ) | 12 | (795 | ) | (1,381 | ) | |||||||||||
Adjusted EBITDA | 58,703 | 83,753 | 90,881 | 56,913 | 42,083 | ||||||||||||||
Aircraft lease expense | 16,997 | 20,198 | 14,005 | — | — | ||||||||||||||
Adjusted EBITDAR | $ | 75,700 | $ | 103,951 | $ | 104,886 | $ | 56,913 | $ | 42,083 | |||||||||
29
CONTRACTUAL OBLIGATIONS
The following table sets forth our contractual obligations as of December 31, 2015 (in thousands):
Payment Due by Period | |||||||||||||||||||
Total | Less than 1 Year | 1-3 Years | 3-5 Years | More than 5 Years | |||||||||||||||
Credit facility | $ | 97,997 | $ | — | $ | 97,997 | $ | — | $ | — | |||||||||
Long-term debt | 381,149 | 8,681 | 11,599 | 356,808 | 4,061 | ||||||||||||||
Interest on credit facility and long-term debt (1) | 145,093 | 35,171 | 66,387 | 42,086 | 1,449 | ||||||||||||||
Operating leases | 60,588 | 18,710 | 28,863 | 8,889 | 4,126 | ||||||||||||||
Total | $ | 684,827 | $ | 62,562 | $ | 204,846 | $ | 407,783 | $ | 9,636 | |||||||||
(1) | Future interest on long-term debt is calculated based on the assumption that all debt remains outstanding until maturity. For debt instruments with variable rates, interest is calculated for all future periods using the rates in effect as of December 31, 2015. |
OFF-BALANCE SHEET ARRANGEMENTS
We are not a party to any off-balance sheet arrangements that have, or are reasonably likely to have, a current or future material effect on our financial condition, changes in financial condition, revenues or expenses, results of operations, liquidity, capital expenditures or capital resources.
CRITICAL ACCOUNTING POLICIES AND ESTIMATES
Our discussion and analysis of our financial condition and results of operations are based upon our consolidated financial statements, which have been prepared in accordance with U.S. GAAP. In many cases, the accounting treatment of a particular transaction is specifically dictated by U.S. GAAP, and in other circumstances U.S. GAAP requires us to make estimates and judgments that affect amounts reported in our consolidated financial statements. We have made our best estimates of certain amounts contained in our consolidated financial statements. We base our estimates on historical experience, professional advice, and various other sources that we believe are reasonable under the circumstances. However, application of our accounting policies involves the exercise of judgment and use of assumptions, and, as a result, actual results could differ materially from these estimates. Management believes that the estimates, assumptions, and judgments involved in the accounting policies described below have the most significant impact on our consolidated financial statements.
We cannot predict what future laws and regulations might be passed that could have a material effect on our results of operations. We assess the impact of significant changes in laws and regulations on a regular basis and update the assumptions and estimates used to prepare our consolidated financial statements when we deem it necessary.
Revenue Recognition
We enter into short-term and medium-term service contracts with our customers, which generally range from one day to one year. Occasionally, we enter into multi-year contracts, with extension options for additional years. Revenue is recognized for contracts as the services are rendered and include leasing of the aircraft, pilot and field maintenance support and related services. We charge daily rates, hourly rates and production rates (logging volume transported) depending upon the type of service rendered. Mobilization fees, which represent recovery of costs incurred to deploy an aircraft to a customer, are recognized as the mobilization occurs. Revenues from timber harvesting operations in Canada and the U.S. are earned based on the number of flight hours or the timber volume and quality delivered to customers, depending on the customer contract.
Sales contracts for Aircranes include multiple deliverables, such as warranty, spare parts, training and crew provisioning arrangements. We allocate consideration associated with the arrangement based on the relative selling prices of the various elements. Selling prices are based on vendor-specific objective evidence (“VSOE”); if VSOE is not available, third party evidence of selling prices is used. In circumstances where neither VSOE nor third party evidence is available, we use estimated selling prices as the basis for allocating consideration.
For sales of other aircraft, revenue is recognized when title passes to the customer in accordance with the contract.
30
For manufacturing and maintenance, repair and overhaul (“MRO”) services that involve significant production, modification or customization, we use the percentage of completion method of accounting. In circumstances where the criteria for using the percentage of completion method of accounting are not met, revenue is recognized as each unit is completed, delivered, and accepted by the customer and the rights of ownership are transferred. When total cost estimates exceed revenues, we accrue the estimated losses immediately.
Revenue recognized represents the price negotiated with the customer, adjusted by any discounts. The amount reported as cost of sales is determined by specific identification of costs to remanufacture each Aircrane, plus a proportion of deferred program costs from specific modifications to the Aircrane ordered by the customer.
Our MRO facilities enter into contracts that require maintenance, repair, overhaul and/or assembly of various major components and other aircraft parts. In all such instances, revenues and costs are deferred until repairs are completed and the customer accepts the final product. For sales of spare parts, revenue and cost of sales are recorded once the parts are shipped to the customer in accordance with the contract or purchase order, ownership and risk of loss have passed to the customer, collectability is reasonably assured and the price is fixed and determinable. In instances where title does not pass to the customer upon shipment, we recognize revenue and cost of sales upon delivery or customer acceptance, depending on the terms of the sales agreement. CPH contracts are accounted for on a long-term contract basis; revenues are recognized based upon negotiated hourly rates and applicable flight hours earned, and profitability of the contract is based upon estimated costs over the life of the contract.
Accounts Receivable
Accounts receivable is comprised of billed amounts for which revenue has been earned and recognized. The allowance for doubtful accounts, an estimate of the amount of accounts receivable outstanding which we believe may be uncollectable, is determined quarterly, principally based on the aging of receivables. We review the current trends and aged receivables periodically and adjust the estimated bad debt expense to accrue for doubtful accounts as needed. An account is written off when deemed uncollectable, although collection efforts may continue.
Aircraft Support Parts, net
Aircraft support parts, net consist of aircraft parts and work-in-process which are valued at the lower of cost or market utilizing the first-in first-out method. Costs capitalized for aircraft support parts include materials, labor, and operating overhead. Work-in-process consists of remanufactured aircraft in various stages of production and in-process aircraft support parts. All aircraft require daily routine repairs and maintenance based on inspections. Such maintenance costs are expensed as incurred. Periodically, aircraft are removed from service and undergo heavy maintenance activities, including inspections and repairs of the airframe and related parts as required; depending on the nature of the costs, they are either capitalized or expensed as incurred. Upon completion of an aircraft remanufacture, based on the demand for our services, we may transfer an aircraft into our fleet.
A significant amount of our aircraft support parts have been purchased over multiple years for which there is no liquid market. Therefore, there is no guarantee that we will be able to purchase new parts at the carrying values currently reflected on our consolidated balance sheets.
Aircraft parts are categorized as serviceable, which indicates that they are in a condition suitable for installing on an aircraft, or repairable, which indicates that additional overhaul or repair work needs to be performed in order for the part to be certified as serviceable. Because we support various legacy airframes, we experience long lead times and are required to carry large quantities of spare parts in order to ensure availability for servicing such airframes. We record an excess and obsolete reserve for parts when our quantity on hand exceeds our forecasted needs or when parts have either not been utilized for a period of seven years or have been deemed obsolete or beyond economical repair by our engineering department. Accordingly, changes in forecasted demand, revised cost estimates or design changes for a part can affect estimates associated with our provision for excess and obsolete aircraft support parts, and it can vary significantly as a result.
Income Taxes
We recognize deferred tax assets and liabilities for the expected future tax consequences of events that have been included in the consolidated financial statements or tax returns in accordance with applicable accounting guidance for accounting for income taxes, using currently enacted tax rates in effect for the year in which the differences are expected to reverse. We record a valuation allowance when necessary to reduce deferred tax assets to the amount expected to be realized. We are subject to income taxes in the U.S., state, and several foreign jurisdictions. Significant judgment is required in determining our worldwide
31
provision for income taxes and recording the related assets and liabilities. In the ordinary course of business, there are transactions and calculations where the ultimate tax determination is uncertain.
A liability for uncertain tax positions has been established for taxes that may become payable in future years as a result of audits by tax authorities. These tax reserves are reviewed as circumstances warrant and adjusted as events occur that affect our potential liability for additional taxes, such as conclusion of tax audits, identification of new issues, changes in federal, state, or foreign laws, or interpretations of the law.
Goodwill and Other Intangible Assets
Goodwill and other intangible assets result from our acquisition of existing businesses. Goodwill is not amortized, however, certain definite-lived identifiable intangible assets, such as customer relationships, are amortized over their estimated useful lives. We review goodwill and other intangible assets for impairment annually and whenever events or changes in circumstances indicate that the related carrying amounts may not be recoverable.
Impairment and Depreciation of Long-Lived Assets
We record impairment losses on long-lived assets used in operations when indicators of impairment are present and the undiscounted cash flows estimated to be generated by those assets are less than the assets’ carrying amount. In such cases, the amount of the impairment is determined based on the relative fair values of the impaired assets. Significant judgments and estimates used by management when evaluating long-lived assets for impairment cover, among other things, the following:
• | program product volumes and remaining production life for parts produced on the assets being reviewed; |
• | product pricing over the remaining life of the parts, including an estimate of future customer price reductions which may be negotiated; |
• | product cost information, including an assessment of the success of our cost reduction activities; and |
• | assessments of future alternative applications of specific long-lived assets based on awarded programs. |
In addition, we follow our established accounting policy for estimating useful lives of long-lived assets. This policy is based upon significant judgments and estimates as well as historical experience. Actual future experience with those assets may indicate different useful lives resulting in a significant impact on depreciation expense.
ITEM 7A. | QUANTITATIVE AND QUALITATIVE DISCLOSURES ABOUT MARKET RISK. |
We are exposed to market risk in the normal course of our business operations resulting from fluctuations in interest and foreign currency exchange rates, as well as the cost of aircraft fuel. We have established policies and procedures to govern our management of market risks.
Interest Rate Risk
Our exposure to market risk from adverse changes in interest rates is primarily associated with our revolving credit facility as our long-term debt instruments have fixed interest rates. Market risks associated with our credit facility include the potential reductions in fair value and negative impacts to future earnings from an increase in interest rates. Under our credit facility, the applicable interest rate on our borrowings is 225—450 basis points over LIBOR/Prime base rate depending on our senior leverage ratio. We estimate that a hypothetical 10% change in the interest rates experienced on amounts outstanding under our credit facility would have impacted interest expense for the year ended December 31, 2015 by approximately $0.5 million.
Foreign Currency Exchange Rate Risk
A significant portion of our revenues are denominated in a currency other than the U.S. dollar and include the Canadian dollar (C$), Euros (€), Brazilian Real (R$), Australian dollar (A$) and Turkish Lira (₤). As a result, we are subject to exposures that arise from foreign currency movements between the date the foreign currency transactions are recorded and the date they are settled. Our exposure to foreign currency movements is somewhat mitigated through naturally offsetting asset and liability currency positions. We periodically enter into foreign currency hedging transactions to mitigate the risk of foreign currency movements and minimize the impact of exchange rate fluctuations on our profits. A hypothetical 10% change in the value of the foreign currencies in which our business is denominated relative to the U.S. dollar for the year ended December 31, 2015 would have resulted in a change in exposure for such transactions of $0.1 million.
32
Aircraft Fuel
Our results of operations are affected by changes in the price and availability of aircraft fuel. For the year ended December 31, 2015, a 10% change in the average price per gallon of fuel would have impacted our cost of revenues by approximately $0.2 million. Many of our contracts allow for recovery of all or part of any fuel cost change through pricing adjustments. We do not currently purchase fuel under long-term contracts or enter into futures or swap contracts. We are not exposed to other material commodity price risks except with respect to the purchase of aircraft fuel.
ITEM 8. | FINANCIAL STATEMENTS AND SUPPLEMENTARY DATA. |
The following report and financial statements are included in this Item 8:
33
REPORT OF INDEPENDENT REGISTERED PUBLIC ACCOUNTING FIRM
Board of Directors and Shareholders
Erickson Incorporated
We have audited the accompanying consolidated balance sheets of Erickson Incorporated (a Delaware corporation) and subsidiaries (the “Company”) as of December 31, 2015 and 2014, and the related consolidated statements of operations, comprehensive income (loss), equity, and cash flows for each of the three years in the period ended December 31, 2015. These financial statements are the responsibility of the Company’s management. Our responsibility is to express an opinion on these financial statements based on our audits.
We conducted our audits in accordance with the standards of the Public Company Accounting Oversight Board (United States). Those standards require that we plan and perform the audit to obtain reasonable assurance about whether the financial statements are free of material misstatement. We were not engaged to perform an audit of the Company’s internal control over financial reporting. Our audits included consideration of internal control over financial reporting as a basis for designing audit procedures that are appropriate in the circumstances, but not for the purpose of expressing an opinion on the effectiveness of the Company’s internal control over financial reporting. Accordingly, we express no such opinion. An audit also includes examining, on a test basis, evidence supporting the amounts and disclosures in the financial statements, assessing the accounting principles used and significant estimates made by management, as well as evaluating the overall financial statement presentation. We believe that our audits provide a reasonable basis for our opinion.
In our opinion, the consolidated financial statements referred to above present fairly, in all material respects, the financial position of Erickson Incorporated and subsidiaries as of December 31, 2015 and 2014, and the results of their operations and their cash flows for each of the three years in the period ended December 31, 2015 in conformity with accounting principles generally accepted in the United States of America.
As discussed in Note 2 to the consolidated financial statements, the Company adopted new accounting guidance in 2015 and 2014, related to the presentation of deferred income taxes and debt issuance costs.
/s/ GRANT THORNTON LLP
Portland, Oregon
March 10, 2016
34
ERICKSON INCORPORATED AND SUBSIDIARIES
CONSOLIDATED BALANCE SHEETS
(In thousands, except share and per share data)
As of December 31, | |||||||
2015 | 2014 | ||||||
ASSETS | |||||||
Current assets: | |||||||
Cash and cash equivalents | $ | 2,129 | $ | 5,097 | |||
Restricted cash | 373 | 567 | |||||
Accounts receivable, net | 40,520 | 44,350 | |||||
Prepaid expenses and other current assets | 5,233 | 9,457 | |||||
Total current assets | 48,255 | 59,471 | |||||
Aircraft, net | 186,132 | 225,395 | |||||
Aircraft support parts, net | 139,609 | 137,593 | |||||
Aircraft held for sale | 12,348 | — | |||||
Property, plant and equipment, net | 25,553 | 23,461 | |||||
Other assets | 10,261 | 12,006 | |||||
Other intangible assets, net | 15,787 | 20,053 | |||||
Goodwill, net | 163,708 | 215,241 | |||||
Total assets | $ | 601,653 | $ | 693,220 | |||
LIABILITIES AND EQUITY | |||||||
Current liabilities: | |||||||
Accounts payable | $ | 13,660 | $ | 19,844 | |||
Current portion of long-term debt | 8,205 | 2,438 | |||||
Accrued expenses and other current liabilities | 17,828 | 19,349 | |||||
Total current liabilities | 39,693 | 41,631 | |||||
Credit facility | 96,165 | 87,062 | |||||
Long-term debt, less current portion | 364,782 | 360,359 | |||||
Other liabilities | 11,720 | 23,155 | |||||
Total liabilities | 512,360 | 512,207 | |||||
Equity: | |||||||
Erickson Incorporated shareholders’ equity: | |||||||
Common stock; $0.0001 par value; 110,000,000 shares authorized; 13,895,421 and 13,823,818 issued and outstanding as of December 31, 2015 and 2014, respectively | 1 | 1 | |||||
Additional paid-in capital | 181,259 | 181,018 | |||||
Retained earnings (accumulated deficit) | (84,901 | ) | 1,812 | ||||
Accumulated other comprehensive loss, net of tax | (7,789 | ) | (2,544 | ) | |||
Total Erickson Incorporated shareholders’ equity | 88,570 | 180,287 | |||||
Noncontrolling interests’ equity | 723 | 726 | |||||
Total equity | 89,293 | 181,013 | |||||
Total liabilities and equity | $ | 601,653 | $ | 693,220 | |||
The accompanying notes are an integral part of these consolidated financial statements.
35
ERICKSON INCORPORATED AND SUBSIDIARIES
CONSOLIDATED STATEMENTS OF OPERATIONS
(In thousands, except share and per share data)
Years Ended December 31, | |||||||||||
2015 | 2014 | 2013 | |||||||||
Revenues, net | $ | 297,520 | $ | 346,609 | $ | 318,221 | |||||
Cost of revenues | 250,245 | 265,715 | 224,031 | ||||||||
Gross profit | 47,275 | 80,894 | 94,190 | ||||||||
Operating expenses: | |||||||||||
General and administrative | 28,891 | 26,606 | 37,674 | ||||||||
Research and development | 2,675 | 3,782 | 4,000 | ||||||||
Selling and marketing | 5,449 | 6,904 | 5,524 | ||||||||
Impairment of goodwill | 49,823 | 21,272 | — | ||||||||
Impairment of other assets | 15,236 | — | — | ||||||||
Total operating expenses | 102,074 | 58,564 | 47,198 | ||||||||
Operating income (loss) | (54,799 | ) | 22,330 | 46,992 | |||||||
Interest expense, net | (37,073 | ) | (35,800 | ) | (25,175 | ) | |||||
Other income (expense), net | 517 | (1,193 | ) | (5,831 | ) | ||||||
Net income (loss) before income taxes and noncontrolling interests | (91,355 | ) | (14,663 | ) | 15,986 | ||||||
Income tax expense (benefit) | (4,723 | ) | (4,432 | ) | 6,120 | ||||||
Net income (loss) | (86,632 | ) | (10,231 | ) | 9,866 | ||||||
Less: Net income related to noncontrolling interests | (81 | ) | (61 | ) | (209 | ) | |||||
Net income (loss) attributable to Erickson Incorporated | $ | (86,713 | ) | $ | (10,292 | ) | $ | 9,657 | |||
Earnings (loss) per share: | |||||||||||
Basic | $ | (6.27 | ) | $ | (0.75 | ) | $ | 0.86 | |||
Diluted | $ | (6.27 | ) | $ | (0.75 | ) | $ | 0.82 | |||
Weighted average shares outstanding: | |||||||||||
Basic | 13,833,552 | 13,800,494 | 11,221,005 | ||||||||
Diluted | 13,833,552 | 13,800,494 | 11,834,506 | ||||||||
The accompanying notes are an integral part of these consolidated financial statements.
36
ERICKSON INCORPORATED AND SUBSIDIARIES
CONSOLIDATED STATEMENTS OF COMPREHENSIVE INCOME (LOSS)
(In thousands)
Years Ended December 31, | |||||||||||
2015 | 2014 | 2013 | |||||||||
Net income (loss) | $ | (86,632 | ) | $ | (10,231 | ) | $ | 9,866 | |||
Other comprehensive loss—Foreign currency translation adjustment | (5,329 | ) | (2,658 | ) | (107 | ) | |||||
Comprehensive income (loss) | (91,961 | ) | (12,889 | ) | 9,759 | ||||||
Less: Comprehensive (income) loss attributable to noncontrolling interests | 3 | 95 | (215 | ) | |||||||
Comprehensive income (loss) attributable to Erickson Incorporated | $ | (91,958 | ) | $ | (12,794 | ) | $ | 9,544 | |||
The accompanying notes are an integral part of these consolidated financial statements.
37
ERICKSON INCORPORATED AND SUBSIDIARIES
CONSOLIDATED STATEMENTS OF EQUITY
(In thousands, except share amounts)
Erickson Incorporated Shareholders’ Equity | |||||||||||||||||||||||||||||||||||||
Preferred Stock | Common Stock | Additional Paid-in Capital | Retained Earnings (Accumulated Deficit) | Accumulated Other Comprehensive Income (Loss) | Total | Non- controlling Interests | Total Equity | ||||||||||||||||||||||||||||||
Shares | Amount | Shares | Amount | ||||||||||||||||||||||||||||||||||
Balance at December 31, 2012 | — | $ | — | 9,726,785 | $ | 1 | $ | 101,833 | $ | 2,447 | $ | 71 | $ | 104,352 | $ | 1,016 | $ | 105,368 | |||||||||||||||||||
Issuance of Series A preferred stock | 4,008,439 | 78,044 | — | — | — | — | — | — | — | — | |||||||||||||||||||||||||||
Noncontrolling interest dividend | — | — | — | — | — | — | — | — | (341 | ) | (341 | ) | |||||||||||||||||||||||||
Issuance of shares upon vesting of restricted stock units | — | — | 87,634 | — | — | — | — | — | — | — | |||||||||||||||||||||||||||
Stock-based compensation | — | — | — | — | 792 | — | — | 792 | — | 792 | |||||||||||||||||||||||||||
Conversion of Series A preferred stock to common stock | (4,008,439 | ) | (78,044 | ) | 4,008,439 | — | 78,044 | — | — | 78,044 | — | 78,044 | |||||||||||||||||||||||||
Shares withheld for payment of taxes | — | — | (34,944 | ) | — | (715 | ) | — | — | (715 | ) | — | (715 | ) | |||||||||||||||||||||||
Net income | — | — | — | — | — | 9,657 | — | 9,657 | 209 | 9,866 | |||||||||||||||||||||||||||
Other comprehensive income (loss) | — | — | — | — | — | — | (113 | ) | (113 | ) | 6 | (107 | ) | ||||||||||||||||||||||||
Balance at December 31, 2013 | — | $ | — | 13,787,914 | $ | 1 | $ | 179,954 | $ | 12,104 | $ | (42 | ) | $ | 192,017 | $ | 890 | $ | 192,907 | ||||||||||||||||||
Issuance of shares upon vesting of restricted stock units | — | — | 50,695 | — | — | — | — | — | — | — | |||||||||||||||||||||||||||
Noncontrolling interest dividend | — | — | — | — | — | — | — | — | (69 | ) | (69 | ) | |||||||||||||||||||||||||
Stock-based compensation | — | — | — | — | 861 | — | — | 861 | — | 861 | |||||||||||||||||||||||||||
Shares withheld for payment of taxes | — | — | (14,791 | ) | — | (211 | ) | — | — | (211 | ) | — | (211 | ) | |||||||||||||||||||||||
Proceeds from shareholder, net | — | — | — | — | 414 | — | — | 414 | — | 414 | |||||||||||||||||||||||||||
Net income (loss) | — | — | — | — | — | (10,292 | ) | — | (10,292 | ) | 61 | (10,231 | ) | ||||||||||||||||||||||||
Other comprehensive loss | — | — | — | — | — | — | (2,502 | ) | (2,502 | ) | (156 | ) | (2,658 | ) | |||||||||||||||||||||||
Balance at December 31, 2014 | — | $ | — | 13,823,818 | $ | 1 | $ | 181,018 | $ | 1,812 | $ | (2,544 | ) | $ | 180,287 | $ | 726 | $ | 181,013 | ||||||||||||||||||
Issuance of shares upon vesting of restricted stock units | — | — | 85,036 | — | — | — | — | — | — | — | |||||||||||||||||||||||||||
Stock-based compensation | — | — | — | — | 294 | — | — | 294 | — | 294 | |||||||||||||||||||||||||||
Shares withheld for payment of taxes | — | — | (13,433 | ) | — | (53 | ) | — | — | (53 | ) | — | (53 | ) | |||||||||||||||||||||||
Net income (loss) | — | — | — | — | — | (86,713 | ) | — | (86,713 | ) | 81 | (86,632 | ) | ||||||||||||||||||||||||
Other comprehensive loss | — | — | — | — | — | — | (5,245 | ) | (5,245 | ) | (84 | ) | (5,329 | ) | |||||||||||||||||||||||
Balance at December 31, 2015 | — | $ | — | 13,895,421 | $ | 1 | $ | 181,259 | $ | (84,901 | ) | $ | (7,789 | ) | $ | 88,570 | $ | 723 | $ | 89,293 | |||||||||||||||||
The accompanying notes are an integral part of these consolidated financial statements.
38
ERICKSON INCORPORATED AND SUBSIDIARIES
CONSOLIDATED STATEMENTS OF CASH FLOWS
(In thousands)
Years Ended December 31, | |||||||||||
2015 | 2014 | 2013 | |||||||||
Cash flows from operating activities: | |||||||||||
Net income (loss) | $ | (86,632 | ) | $ | (10,231 | ) | $ | 9,866 | |||
Adjustments to reconcile net income (loss) to net cash provided by (used in) operating activities: | |||||||||||
Depreciation and amortization | 42,314 | 34,903 | 33,328 | ||||||||
Impairment of goodwill | 49,823 | 21,272 | — | ||||||||
Impairment of other assets | 15,236 | — | — | ||||||||
Deferred income taxes | (2,943 | ) | (7,790 | ) | 5,214 | ||||||
Amortization of debt issuance costs | 2,660 | 2,433 | 2,067 | ||||||||
Non-cash interest expense | 886 | 324 | 1,877 | ||||||||
Stock-based compensation | 294 | 861 | 792 | ||||||||
Other non-cash (income) expense, net | 3,855 | (2,535 | ) | 3,515 | |||||||
Changes in operating assets and liabilities: | |||||||||||
Accounts receivable | 3,003 | 19,719 | (20,991 | ) | |||||||
Prepaid expenses and other current assets | 4,003 | (5,110 | ) | 1,342 | |||||||
Aircraft support parts, net | 3,384 | (17,240 | ) | (32,001 | ) | ||||||
Aircraft held for sale | 2,400 | — | — | ||||||||
Other assets | (278 | ) | 5,602 | (3,131 | ) | ||||||
Accounts payable | (5,707 | ) | (8,856 | ) | (19,502 | ) | |||||
Accrued expenses and other current liabilities | 1,151 | (20,023 | ) | (6,654 | ) | ||||||
Other liabilities | (12,281 | ) | 655 | (514 | ) | ||||||
Net cash provided by (used in) operating activities | 21,168 | 13,984 | (24,792 | ) | |||||||
Cash flows from investing activities: | |||||||||||
Acquisition of businesses, net of cash acquired | — | — | (226,868 | ) | |||||||
Purchases of aircraft and property, plant and equipment | (26,126 | ) | (56,807 | ) | (56,104 | ) | |||||
Proceeds from sale-leaseback transactions | 5,078 | 24,660 | — | ||||||||
Restricted cash | 104 | 2,222 | 958 | ||||||||
Purchase of intangible assets | — | — | (2,205 | ) | |||||||
(Increase) decrease in other assets | — | (126 | ) | 1,625 | |||||||
Dividends paid to non-controlling interest | — | (69 | ) | (341 | ) | ||||||
Net cash used in investing activities | (20,944 | ) | (30,120 | ) | (282,935 | ) | |||||
Cash flows from financing activities: | |||||||||||
Proceeds from shareholders, net | — | 414 | — | ||||||||
Credit facility payments | (180,231 | ) | (206,686 | ) | (250,215 | ) | |||||
Credit facility borrowings | 188,890 | 227,939 | 246,377 | ||||||||
Long-term debt issuances | — | — | 400,000 | ||||||||
Long-term debt principal payments, including capital lease payments | (6,895 | ) | — | (72,572 | ) | ||||||
Other long-term (payments) borrowings | (156 | ) | 409 | — | |||||||
Debt issuance costs | (224 | ) | (371 | ) | (14,986 | ) | |||||
Shares withheld for payment of taxes | (53 | ) | (211 | ) | (716 | ) | |||||
Net cash provided by (used in) financing activities | 1,331 | 21,494 | 307,888 | ||||||||
Effect of foreign currency exchange rates on cash and cash equivalents | (4,523 | ) | (2,142 | ) | 252 | ||||||
Net change in cash and cash equivalents | (2,968 | ) | 3,216 | 413 | |||||||
Cash and cash equivalents at beginning of year | 5,097 | 1,881 | 1,468 | ||||||||
Cash and cash equivalents at end of year | $ | 2,129 | $ | 5,097 | $ | 1,881 | |||||
Supplemental disclosure of cash flow information: | |||||||||||
Cash paid for interest | $ | 35,982 | $ | 35,693 | $ | 27,818 | |||||
Cash paid for income taxes | 1,923 | 3,925 | 1,477 | ||||||||
Supplemental disclosure of non-cash investing and financing activities: | |||||||||||
Note payable incurred for purchase of aircraft support parts | 10,000 | — | — | ||||||||
39
ERICKSON INCORPORATED AND SUBSIDIARIES
NOTES TO CONSOLIDATED FINANCIAL STATEMENTS
NOTE 1—BASIS OF PRESENTATION
Nature of Business
Erickson Incorporated (“EI”) and its subsidiaries and affiliated companies (collectively referred to as “Erickson” or “the Company”) is a global provider of aviation services. We own, operate, maintain and manufacture utility aircraft to transport and place people and cargo around the world for commercial and governmental entities, with three distinct reportable segments consisting of Commercial Aviation Services, Global Defense and Security, and Manufacturing and Maintenance, Repair and Overhaul (“MRO”). Through our Commercial Aviation Services and Global Defense and Security segments, we provide aerial services that include critical supply and logistics for firefighting, timber harvesting, infrastructure construction, deployed military forces, humanitarian relief, and crewing. Through our Manufacturing and MRO segment, we provide manufacturing and maintenance, repair and overhaul services for certain aircraft, as well as aircraft sales.
As of December 31, 2015, the Company has a diverse fleet of 74 aircraft consisting of: 20 heavy lift helicopters, known as “Aircranes”; 47 rotor-wing aircraft; and 7 fixed-wing aircraft. The Company’s fleet includes 15 aircraft held for sale and operations that span the globe with a presence on six continents and 33 aircraft deployed outside of North America as of December 31, 2015.
As a global provider of aviation services, a significant portion of our revenues are generated outside of the United States of America (“U.S.”) and represented 63.6%, 70.2% and 65.8% of revenues for the years ended December 31, 2015, 2014 and 2013, respectively.
Although the global deployment of the Company’s aircraft and crews helps limit the effects of seasonality, the demand for the Company’s services are generally reduced in winter or monsoon seasons, January through April, with peak season from June through October.
Principles of Consolidation
The consolidated financial statements of the Company include the accounts of all majority-owned subsidiaries and variable interest entities in which it has determined the Company is the primary beneficiary as follows:
• | EAC Acquisition Corporation (“EAC Acq.”) |
• | Erickson Helicopters, Inc. (“EHI”) and its subsidiaries |
• | CAC Development Ltd. (“Canada”) |
• | Canadian Air-Crane Ltd. (“CAC”) |
• | Erickson Air-Crane Malaysia Sdn. Bhd. (“EACM”) |
• | European Air-Crane S.p.A. (“EuAC”) |
• | Air Amazonia Serviços Aeronáuticos Ltda. (“Air Amazonia”) |
• | Erickson Aviation Peru S.A.C. (“Peru”) |
• | Erickson Aviation Turkey Yönetim Hizmetleri Limited Şirketi (“EAT”) |
EuAC owns a 60% equity interest in Societa Italiania de Manutenzioni Aeroautiche S.p.A. (“SIMA”), which is an aircraft maintenance organization located in Lucca, Italy.
For entities that are determined to meet the definition of a VIE and where the Company has determined it is the primary beneficiary, the VIE is consolidated and a noncontrolling interest is recognized for any third party interest. This has resulted in the Company consolidating entities in which it has less than a 50% equity interest. For further information, see Note 21.
Intercompany accounts and transactions between the companies are eliminated upon consolidation.
Reclassifications
To conform with the 2015 presentation, the Company reclassified: (i) income tax receivable of $0.7 million with prepaid expenses and other current assets; (ii) income tax payable of $0.3 million with accrued and other current liabilities; and (iii) uncertain tax positions of $6.3 million and deferred tax liabilities of $3.7 million with other liabilities in the Company’s consolidated balance sheet as of December 31, 2014. In addition, deferred overhauls, net of $86.8 million and construction-in-
40
progress of $10.4 million was reclassified from property, plant and equipment, net to aircraft, net on the consolidated balance sheet as of December 31, 2014, and for the years ended December 31, 2014 and 2013, external sales commissions of $2.3 million and $1.9 million, respectively, was reclassified from sales and marketing expense to cost of revenues and bad debt expense of $0.1 million and $0.3 million, respectively, was reclassified from sales and marketing expense to general and administrative expense in the consolidated statements of operations.
To conform with the balance sheet reclassifications discussed above, the Company reclassified the change in income tax receivable of $0.4 million and $0.9 million with the change in prepaid expenses and other current assets in the operating activities section of the statements of cash flow for the years ended December 31, 2014 and 2013, respectively, as well as the change in income tax payable of $0.6 million and $0.3 million, respectively, with the change in accrued expenses and other current liabilities.
As a result of the adoption of the provisions of Accounting Standards Update (“ASU”) 2015-03, Interest—Imputation of Interest (Subtopic 835-30) (“ASU 2015-03”) on December 31, 2015, we reclassified $11.4 million of debt issuance costs from other noncurrent assets to credit facility in the amount of $2.3 million and long-term debt in the amount of $9.1 million, including $1.7 million related to the current portion of long-term debt, in our consolidated balance sheet as of December 31, 2014. For additional information, see Recent Accounting Pronouncements in Note 2.
As a result of the adoption of the provisions of ASU 2015-17, Balance Sheet Classification of Deferred Taxes (“ASU 2015-17”) on January 1, 2015, we reclassified current deferred tax asset of $1.2 million and liability of $0.9 million to a noncurrent deferred tax asset of $0.3 million, with a nominal amount to the noncurrent deferred tax liability in our consolidated balance sheet as of December 31, 2014. For additional information concerning the provisions of ASU 2015-17, see Recent Accounting Pronouncements in Note 2.
Use of Estimates
The preparation of financial statements in conformity with accounting principles generally accepted in the U.S. (GAAP) requires management to make assumptions and estimates that affect the reported amounts of assets and liabilities, and disclosure of gain or loss contingencies, as of the date of the financial statements and the reported amounts of revenues and expenses during the reporting period. Significant estimates for which changes in the near term are considered reasonably possible, and that may have a material impact on the consolidated financial statements, are: (a) excess and obsolete aircraft support parts reserves, (b) allowance for doubtful accounts, (c) income tax assets and liabilities, and (d) estimates and assumptions made in determining the carrying values of goodwill and other intangible assets. Management of the Company base their estimates on historical experience and other relevant assumptions. Actual results could differ materially from those estimates.
Foreign Currency Translation and Transactions
The financial statements of the Company’s subsidiaries CAC, EuAC, Air Amazonia and EAT, are measured in their functional currencies of the Canadian dollar (C$), Euros (€), Brazilian Real (R$), and Turkish Lira (₤), respectively, and then are translated into U.S. dollars. Generally, balance sheet accounts are translated using the current exchange rate at each balance sheet date. Results of operations are translated using the average exchange rate each month. Translation gains or losses resulting from the changes in the exchange rates from month to month are recorded in other comprehensive income. The financial statements of the Company’s subsidiaries EHI, EACM, and EAP are prepared using the U.S. dollar as their functional currency, with any foreign currency gain or loss resulting from the re-measurement of transactions denominated in foreign currencies included in other income (expense), net in our consolidated statements of operations.
NOTE 2—SUMMARY OF SIGNIFICANT ACCOUNTING POLICIES
Cash and Cash Equivalents
The Company classifies cash on deposit in banks and cash invested in money market accounts maturing in less than three months from the original date of purchase as cash and cash equivalents. The Company’s subsidiaries generally maintain cash account balances sufficient to meet their short-term working capital requirements and periodically remit funds to the parent company to pay intercompany lease, maintenance and other charges. Substantially all of the Company’s cash is concentrated in a few financial institutions. At times, deposits in these institutions exceed the federally insured limits. The Company has not experienced any losses in such accounts and believes that it is not exposed to any significant risk on these balances.
As of December 31, 2015 and 2014, cash held in accounts in foreign institutions totaled $2.4 million and $5.4 million, of which
41
$0.4 million and $0.6 million, respectively, was restricted cash.
Restricted Cash
Restricted cash serves as collateral for performance bonds required as a part of certain operating and sales contracts and is maintained at financial institutions.
Accounts Receivable, Net
Accounts receivable are recorded at invoiced amount and do not bear interest when recorded or accrued interest when past due. We maintain an allowance for doubtful accounts for estimated losses resulting from the inability of our customers to make required payments. We estimate the overall collectability of accounts receivables on an ongoing basis and write off account balances after reasonable collection efforts have been made and collection is deemed questionable or not probable. The Company specifically analyzes its accounts receivable and historical bad debt experience, customer concentrations, customer credit-worthiness and changes in its customer payment terms when evaluating the adequacy of the allowance for doubtful accounts. Charges increasing the allowance for doubtful accounts are classified in selling and marketing expenses in the consolidated statement of operations.
Aircraft Support Parts, Net
Aircraft support parts, net consist of aircraft parts for the Aircrane and other legacy aircraft platforms and work-in-process which are valued at the lower of cost or market utilizing the first-in first-out method. Costs capitalized for aircraft support parts include materials, labor, and operating overhead. Work-in-process consists of aircraft parts in various stages of production.
Abnormal amounts of idle facility expense, freight, handling costs, and scrap are recorded as current-period expenses. Production overhead rates are based on the planned capacity of the production facilities and overhead costs are allocated to production based on actual direct labor hours.
Aircraft parts are categorized as serviceable, which indicates that they are in a condition suitable for installing on an aircraft, or repairable, which indicates that additional overhaul or repair work needs to be performed in order for the part to be certified as serviceable. Since the Company supports various legacy airframes, it experiences long lead times and is required to carry large quantities of spare parts in order to ensure availability for servicing such aircraft. The Company records an excess and obsolete reserve for parts when its quantity on hand exceeds its forecasted need for the part or when parts have either not been utilized for a period of seven years or have been deemed obsolete or beyond economical repair by the Company’s engineering department. Accordingly, changes in forecasted demand, revised cost estimates or design changes for a part can affect estimates associated with the Company’s provision for excess and obsolete aircraft support parts, and it can vary significantly as a result.
The Company operates within the aviation industry where certain vendors constitute the sole source for FAA-approved parts. The loss of certain suppliers could cause a material business disruption to the Company.
Aircraft support parts, net are classified as a noncurrent asset in the consolidated balance sheets because they are primarily used to maintain and overhaul the Aircrane and other legacy aircraft, which are long-term assets. Aircraft support parts which are used in operations are recorded as a component of cost of revenues in the accompanying consolidated statements of operations.
Aircraft, Net and Property, Plant, and Equipment, Net
All aircraft require daily routine repairs and maintenance based on inspections. Such maintenance costs are expensed as incurred. Periodically, aircraft are removed from service and undergo heavy maintenance activities including inspections and repairs of the airframe and related parts as required; depending on the nature of the costs, they are either capitalized or expensed as incurred. Upon completion of an aircraft remanufacture, based on the demand for our services, the Company may transfer an aircraft into its fleet.
Aircraft and property, plant, and equipment are recorded at cost. Depreciation is provided over the estimated useful lives of the assets as follows: aircraft, 15 years; buildings, 20 years; and vehicles and equipment three to five years.
The cost of maintenance and repairs is charged to expense as incurred. Repairs and maintenance expense was $20.1 million, $22.9 million and $20.0 million for the years ended December 31, 2015, 2014, and 2013, respectively.
Expenditures that increase the value or productive capacity of assets are capitalized. Upon retirement or other disposition of
42
property, plant and equipment, the cost and related accumulated depreciation are removed from the accounts and any gain or loss is included in operations. Leasehold improvements are amortized over the shorter of the estimated useful life of the asset or the life of the lease.
Overhauls on certain significant components are capitalized, then amortized based on estimated flight hours between overhauls based on established life limits.
Goodwill and Other Intangible Assets
Goodwill and other intangible assets result from our acquisition of existing businesses. Goodwill is not amortized, however, certain definite-lived identifiable intangible assets, such as customer relationships, are amortized over their estimated useful lives. The Company reviews goodwill and other intangible assets for impairment annually and whenever events or changes in circumstances indicate the carrying amount may not be recoverable. Conditions that would trigger an impairment assessment, include, but are not limited to, a significant adverse change in legal factors or in the business climate that could affect the value of an asset or an adverse action.
Such reviews assess the fair value of the assets based upon our estimates of the future cash flows we expect the assets to generate within the boundaries of the applicable reporting units of the Company.
Impairment of Long-Lived Assets
The Company records impairment losses on long-lived assets used in operations when indicators of impairment are present and the undiscounted cash flows estimated to be generated by those assets are less than the assets’ carrying amount. In such cases, the amount of the impairment is determined based on the relative fair values of the impaired assets. We have not recorded any impairments for long-lived assets used in operations during the years ended December 31, 2015, 2014 or 2013. However, we did record impairment charges on certain aircraft no longer used in operations in connection with their reclassification to ‘aircraft held for sale’ during the year ended December 31, 2015. Further additional information, see Note 6.
Debt Issuance Costs
Debt issuance costs consist of expenditures associated with obtaining debt financing, principally legal and bank commitment fees. Such costs are deferred and amortized over the term of the related credit agreements using a method that approximates the effective interest method. Debt issuance costs are included in the consolidated balance sheets as a direct deduction from the carrying amount of that debt liability, amounts outstanding under the credit facility and long-term debt. See Notes 11 and 12.
Revenue Recognition
The Company enters into short-term and medium-term service contracts with its customers, which generally range from one day to one year. Occasionally, the Company enters into multi-year contracts, with extension options for additional years. Revenue is recognized for contracts as the services are rendered and include leasing of the aircraft, pilot and field maintenance support and related services. The Company charges daily rates and hourly rates depending upon the type of service rendered. Mobilization fees, which represent recovery of costs incurred to deploy an aircraft to a customer, are recognized as the related mobilization occurs. Revenues from timber harvesting operations are earned based on the number of flight hours or the timber volume and quality delivered to customers, depending on the customer contract.
Sales contracts for Aircranes include multiple deliverables, such as warranty, spare parts, training and crew provisioning arrangements. The Company allocates consideration associated with the arrangement based on the relative selling prices of the various elements. Selling prices are based on vendor-specific objective evidence (“VSOE”); if VSOE is not available, third party evidence of selling prices is used. In circumstances where neither VSOE nor third party evidence is available, the Company uses estimated selling prices as the basis for allocating consideration.
For sales of other aircraft, revenue is recognized when the title passes to the customer in accordance with the contract.
For manufacturing and MRO services that involve significant production, modification or customization, the Company uses the percentage of completion method of accounting. In circumstances where the criteria for using the percentage of completion method of accounting are not met, revenue is recognized as each unit is completed, delivered, and accepted by the customer and the rights of ownership are transferred. When total cost estimates exceed revenues, the Company accrues the estimated losses immediately.
43
Revenue recognized represents the price negotiated with the customer, adjusted by any discounts. Revenue is recognized net of any taxes remitted to governmental authorities on the customer’s behalf. The amount reported as cost of sales is determined by specific identification of costs to remanufacture each Aircrane, plus a proportion of deferred program costs from specific modifications to the Aircrane ordered by the customer.
The Company’s MRO facilities enter into contracts that require maintenance, repair, overhaul and/or assembly of various major components and other aircraft parts. In all such instances, revenues and costs are deferred until repairs are completed and the customer accepts the final product. For sales of spare parts, revenue and cost of sales are recorded once the parts are shipped to the customer in accordance with the contract or purchase order, ownership and risk of loss have passed to the customer, collectability is reasonably assured and the price is fixed and determinable. In instances where title does not pass to the customer upon shipment, the Company recognizes revenue and cost of sales upon delivery or customer acceptance, depending on the terms of the sales agreement. Cost per hour (“CPH”) contracts are accounted for on a long-term contract basis; revenues are recognized based upon negotiated hourly rates and applicable flight hours earned, and profitability of the contract is based upon estimated costs over the life of the contract.
Stock-Based Compensation
The measurement and recognition of compensation expense for all stock-based payment awards is based on the estimated fair value of the awards. The fair value of the portion of the award that is ultimately expected to vest is recognized as expense over the requisite vesting period. The Company attributes the value of the stock-based compensation to expense on a straight-line basis.
Income Taxes
The Company is subject to income taxes in the U.S., state, and several foreign jurisdictions. In the ordinary course of business, there are transactions and calculations where the ultimate tax determination is uncertain. Significant judgment is required in determining the Company’s worldwide provision for income taxes and recording the related assets and liabilities.
Income taxes are accounted for under the asset and liability method, which requires the recognition of deferred tax assets and liabilities for the expected future tax consequences of temporary differences between financial statement carrying amounts and tax bases of assets and liabilities. Deferred tax assets and liabilities are measured using enacted tax rates expected to apply to taxable income in the years in which those temporary differences are expected to be recovered or settled. The effect on deferred tax assets and liabilities of a change in tax rates is recognized in income in the current and future periods that included the enactment date. The Company records a valuation allowance when necessary to reduce deferred tax assets to the “more likely than not” amount expected to be realized in future tax returns.
Unrecognized tax benefits represent management’s expected treatment of a tax position taken in a filed tax return, or planned to be taken in a future tax return, that has not been reflected in measuring income tax expense for financial reporting purposes. Until such positions are no longer considered uncertain, the Company would not recognize the tax benefits resulting from such positions and would report the tax effect as a liability in its consolidated balance sheet.
The Company classifies any interest and penalties related to uncertain tax positions in other income (expense), net in the consolidated statements of operations.
Fair Value Measurements
Fair value is defined as the price that would be received from selling an asset or paid to transfer a liability in an orderly transaction between market participants at the measurement date.
Fair value measurements are classified and disclosed in one of the following three categories:
• | Level 1: Observable inputs that reflect unadjusted quoted prices for identical assets or liabilities traded in active markets. |
• | Level 2: Valuations based on other than quoted prices in active markets for identical assets and liabilities, quoted prices for identical or similar assets or liabilities in inactive markets, or other inputs that are observable or can be corroborated by observable market data for substantially the full term of the assets or liabilities. |
• | Level 3: Valuations based on inputs that are generally unobservable and typically reflect management’s estimates of assumptions that market participants would use in pricing the asset or liability. |
44
Company’s cash and cash equivalents, accounts receivable, accounts payable and accrued liabilities are carried at cost, which approximates fair value due to their short-term maturities. The carrying value of bank borrowings under the credit facility approximate fair value due to the variable rate nature of the indebtedness.
Long-term debt is recorded at amortized cost in EI’s consolidated balance sheets. The fair value of the Company’s 8.25% senior secured notes is classified as a Level 1 fair value measurement and is estimated based on the quoted market prices for such instruments. The fair value of all other long-term notes is classified as Level 3 fair value measurement and is estimated based on the terms of the individual loans and the Company’s creditworthiness. These significant unobservable inputs to the Level 3 fair value measurement include the interest rate and the length of the loan. The estimated fair value of the Company’s other long-term notes, excluding the 8.25% senior secured notes, approximates their carrying value.
As of December 31, 2015, the carrying amount of the Company’s long-term debt was $373.0 million and its estimated aggregate fair value was $256.9 million, consisting of $231.5 million and $25.4 million classified as Level 1 and Level 3, respectively, in the fair value hierarchy. As of December 31, 2014, the carrying amount of the Company’s long-term debt was $362.8 million and its estimated aggregate fair value was $342.6 million, consisting of $325.7 million and $16.9 million classified as Level 1 and Level 3, respectively, in the fair value hierarchy.
The Level 3 assets measured at fair value on a nonrecurring basis consists of goodwill.
Derivative Instruments and Hedging Activities
The Company is subject to exposures that arise from foreign currency movements between the date the foreign currency transactions are recorded and the date they are settled. The Company’s exposure to foreign currency movements is partially mitigated through naturally offsetting asset and liability currency positions. However, from time to time the Company enters into foreign currency forward contracts, the purpose of which is to mitigate the impact of future currency fluctuations related to anticipated cash receipts from expected future revenue that is denominated in a currency other than the U.S. dollar.
A significant percentage of the Company’s revenues are denominated in a currency other than the U.S. dollar, whereas a substantial portion of its costs are incurred in U.S. dollars. The Company uses hedging strategies to manage and minimize the impact of exchange rate fluctuations on its profits.
All derivative instruments are recognized in our consolidated financial statements and measured at fair value regardless of the purpose or intent of holding them. The Company uses derivative instruments to principally manage cash flow risks from revenue which is expected to be recognized from executed contracts for the future delivery of goods or services. Revenues from such customer contracts are recorded in U.S. dollars at the contract rate and the impact of the foreign currency forward contract is recognized in gross margin and operating income at the time of revenue recognition. At the end of each reporting period, the value of each outstanding foreign currency forward contract is marked to market in the balance sheet on the basis of the then prevailing forward exchange rate. The change in the valuation of the foreign currency forward portfolio is recorded in other income (expense), net in the consolidated statements of operations, with any outstanding balances of foreign currency forward contracts in asset positions included in prepaid expenses and other current assets if maturing within one year, or other assets if maturing beyond one year within the consolidated balance sheets and those foreign currency forward contracts in liability positions are included in accrued and other current liabilities if maturing within one year, or other liabilities if maturing beyond one year within the consolidated balance sheets. Revenues which are not hedged are translated into U.S. dollars at the average exchange rate during the month the services are rendered. All changes in fair value of the Company’s foreign currency forward contracts have been recorded in the consolidated statement of operations because they do not meet the requirements for deferral accounting. The Company does not enter into foreign currency forward contracts for trading or speculative purposes.
Environmental Remediation
The Company is subject to federal and state requirements for protection of the environment, including those for discharge of hazardous materials and remediation of contaminated sites. The Company periodically assesses, based on environmental studies, expert analyses and legal reviews, the Company’s contingencies, obligations and commitments for remediation of contaminated sites, including assessments of ranges and probabilities of recoveries from other responsible parties who have and have not agreed to a settlement and of recoveries from insurance carriers. The Company immediately accrues and charges to current expense identified exposures related to environmental remediation sites based on its best estimate within a range of potential exposure for investigation, cleanup and monitoring costs to be incurred.
45
Research and Development Costs
Research and development activities consist of, among other activities, the ongoing development and testing of composite main rotor blades. Such costs predominately consist of internal labor costs and engineering tooling design costs, which are charged to expense when incurred.
Accumulated Other Comprehensive Loss
Accumulated other comprehensive loss (“AOCL”) is presented as a component of equity in the consolidated balance sheets and consists of the cumulative amount of the Company’s foreign currency translation adjustments, net of tax. Other comprehensive loss is presented in the consolidated statements of comprehensive income (loss) and consists of the effects on the consolidated financial statements of translating the financial statements of the Company’s international subsidiaries.
Segment Reporting
The Company reports segment information based on the “management” approach. The management approach designates the internal reporting used by management for making decisions and assessing performance as the source of the Company’s reportable segments.
Recent Accounting Pronouncements
In May 2014, the Financial Accounting Standards Board (“FASB”) issued ASU 2014-9, Revenue from Contracts with Customers (Topic 606) (“ASU 2014-09”), which creates a new Topic 606 and supersedes the revenue requirements in Topic 605, Revenue Recognition, and most industry-specific guidance throughout the Industry Topics of the Codification. ASU 2014-09 provides a five-step analysis of transactions to determine when and how revenue is recognized that consists of: i) identify the contract with the customer; ii) identify the performance obligations in the contract; iii) determine the transaction price; iv) allocate the transaction price to the performance obligations, and v) recognize revenue when or as each performance obligation is satisfied. Companies can transition to the requirements of this ASU either retrospectively or as a cumulative-effect adjustment as of the date of adoption, which was originally January 1, 2017 for the Company. Early adoption is not permitted. In August 2015, ASU 2015-14, Revenue from Contracts with Customers (Topic 606) was issued which defers by one year the effective date of ASU 2014-09. The effective date for the Company is January 1, 2018 for the adoption of the requirements of ASU 2014-09. The Company has not yet determined the effect of the adoption of ASU 2014-09 will have on its consolidated financial position, consolidated results of operations, and consolidated statement of cash flows.
In August 2014, the FASB issued ASU 2014-15, Presentation of Financial Statements—Going Concern (Subtopic 205-40): Disclosure of Uncertainties about an Entity’s Ability to Continue as a Going Concern (“ASU 2014-15”), which defines management’s responsibility to evaluate whether there is substantial doubt about an organization’s ability to continue as a going concern. ASU 2014-15 requires an entity’s management to evaluate for each annual and interim reporting period whether their are conditions or events, considered in the aggregate, that raise substantial doubt about an entity’s ability to continue as a going concern within one year after the date that the financial statements are issued. Management’s evaluation should be based on relevant conditions and events that are known and reasonable knowable at the date that the financial statements are issued. If conditions or events raise substantial doubt about an entity’s ability to continue as a going concern, and substantial doubt is not alleviated after consideration of management’s plans, an entity should include a statement in the notes indicating that there is substantial doubt about the entity’s ability to continue as a going concern within one year after the date that the financial statements are issued. The provisions of ASU 2014-15 are effective for annual periods ending after December 15, 2016, and for annual and interim periods thereafter. Early adoption is permitted. The Company will adopt the provisions of ASU 2014-15 as of December 31, 2016, which is not expected to have an impact on its consolidated financial position, consolidated results of operations, and consolidated cash flows.
In April 2015, the FASB issued ASU 2015-03, Interest—Imputation of Interest (Subtopic 835-30), which requires that debt issuance costs related to a recognized debt liability be presented in the balance sheet as a direct deduction from the carrying amount of that debt liability, consistent with debt discounts. The provisions of ASU 2015-03 are effective for fiscal years beginning after December 15, 2015, or January 1, 2016 for the Company, and interim periods within those fiscal years. Early adoption is permitted for financial statements that have not been previously issued. The provisions should be applied on a retrospective basis. Upon transition, an entity is required to comply with the applicable disclosures for a change in an accounting principle, which includes: i) the nature of and reason for the change in accounting principle; ii) the transition method; iii) a description of the prior-period information that has been retrospectively adjusted; and iv) the effect of the change on the financial statement line items. On December 31, 2015, as permitted by ASU 2015-03, the Company adopted early the provisions of ASU 2015-03, which did not have an impact on its consolidated results of operation and consolidated statements
46
of cash flows. For the impact to the Company’s consolidated balance sheet, see Reclassifications in Note 1. Basis of Presentation.
In July 2015, the FASB issued ASU 2015-11, Inventory (Topic 330), Simplifying the Measurement of Inventory (“ASU 2015-11”), which changes the measurement principle for inventory from the lower of cost or market to lower of cost and net realizable value. Net realizable value is defined as the “estimated selling prices in the ordinary course of business, less reasonable predictable costs of completion, disposal and transportation.” ASU 2015-11 eliminates the guidance that entities consider replacement cost or net realizable value less an approximately normal profit margin in the subsequent measurement of inventory when cost is determined on a first-in, first-out or average cost basis. The provisions of ASU 2015-11 are effective for public entities with fiscal years beginning after December 15, 2016, or January 1, 2017 for the Company, and interim periods within those fiscal years. Early adoption is permitted. The Company is in the process of evaluating the impact the adoption of ASU 2015-11 will have on its consolidated financial position, consolidated results of operations, and consolidated cash flows.
In November 2015, the FASB issued ASU 2015-17, Balance Sheet Classification of Deferred Taxes, which requires that all deferred tax assets and liabilities, along with any related valuation allowance, be classified as noncurrent on the balance sheet. The provisions of ASU 2015-17 are effective for fiscal years beginning after December 15, 2016, or January 1, 2016 for the Company, and interim periods within those fiscal years. Early adoption is permitted as of the beginning of an interim or annual reporting period. As permitted by ASU 2015-17, the Company adopted early the provisions of ASU 2015-17 effective as of January 1, 2015, which did not have an impact on its consolidated results of operation and consolidated statements of cash flows. For the impact to the Company’s consolidated balance sheet, see Reclassifications in Note 1. Basis of Presentation.
In February 2016, the FASB issued ASU 2016-02, Leases (Topic 842) (“ASU 2016-02”), which is intended to improve financial reporting about leasing transactions. ASU 2016-02 will require organizations that lease assets, lessees, to recognize on the balance sheet the assets and liabilities for the rights and obligations created by those leases. A lessee will be required to recognize assets and liabilities for leases with lease terms of more than 12 months. The provisions of ASU 2016-02 are effective for public companies for fiscal years, and interim periods within those fiscal years, beginning after December 15, 2018, or January 1, 2019 for the Company. Early adoption is permitted. The Company has not yet determined the effect of the adoption of ASU 2016-02 will have on its consolidated financial position, consolidated results of operations, and consolidated statement of cash flows.
NOTE 3—ACCOUNTS RECEIVABLE AND ALLOWANCE FOR DOUBTFUL ACCOUNTS
Accounts receivable consisted of the following (in thousands):
As of December 31, | |||||||
2015 | 2014 | ||||||
Trade accounts receivable | $ | 35,039 | $ | 42,296 | |||
Other receivables | 4,244 | 2,793 | |||||
Costs in excess of billings | 1,704 | — | |||||
40,987 | 45,089 | ||||||
Less: allowance for doubtful accounts | (467 | ) | (739 | ) | |||
$ | 40,520 | $ | 44,350 | ||||
As of December 31, 2015, the Company has one uncompleted contract with costs incurred of $1.9 million and estimated earnings of $0.6 million during the year then ended. Revenues and costs related to such project are included in the Company’s Manufacturing and MRO segment in the accompanying statement of operations. Billings-to-date pursuant to the contract totaled $0.8 million, resulting in $1.7 million of costs and estimated earnings in excess billings as of December 31, 2015.
47
Customers representing 10% or more of the total trade accounts receivable were as follows:
As of December 31, | |||||
2015 | 2014 | ||||
Customer A | 14.0 | % | 14.4 | % | |
Customer B | 11.9 | 11.8 | |||
Customer C | 11.2 | — | |||
37.1 | % | 26.2 | % | ||
Activity in the allowance for doubtful accounts was as follows (in thousands):
Years Ended December 31, | |||||||||||
2015 | 2014 | 2013 | |||||||||
Allowance for doubtful accounts at beginning of year | $ | 739 | $ | 991 | $ | 460 | |||||
Provisions | 317 | 137 | 634 | ||||||||
Amounts written-off, net of recoveries | (589 | ) | (389 | ) | (103 | ) | |||||
Allowance for doubtful accounts at end of year | $ | 467 | $ | 739 | $ | 991 | |||||
During the years ended December 31, 2015 and 2013, the Company had bad debt expense of $5.1 million and $0.7 million, respectively, with bad debt recoveries of $0.2 million during the year ended December 31, 2014. During the fourth quarter of 2015, the Company deemed the collection of a non-current account receivable to be doubtful, which was classified in other assets in the consolidated balance sheet at December 31, 2014. Accordingly, the Company charged to expense the doubtful non-current account receivable balance in the amount of $4.8 million, which is included in bad debt expense for the year ended December 31, 2015.
NOTE 4—PREPAID EXPENSES AND OTHER CURRENT ASSETS
Prepaid expenses and other current assets consisted of the following (in thousands):
As of December 31, | |||||||
2015 | 2014 | ||||||
Prepaid expenses, excluding insurance | $ | 1,767 | $ | 3,928 | |||
Prepaid insurance | 1,042 | 1,507 | |||||
Income tax receivable | 396 | 677 | |||||
Deposits | 406 | 2,220 | |||||
Other current assets | 1,622 | 1,125 | |||||
$ | 5,233 | $ | 9,457 | ||||
48
NOTE 5—AIRCRAFT SUPPORT PARTS, NET
Aircraft support parts, net consisted of the following (in thousands):
As of December 31, | |||||||
2015 | 2014 | ||||||
Aircraft parts | $ | 134,410 | $ | 124,629 | |||
Work-in-process | 10,405 | 18,604 | |||||
144,815 | 143,233 | ||||||
Less: excess and obsolete reserve | (5,206 | ) | (5,640 | ) | |||
$ | 139,609 | $ | 137,593 | ||||
Activity for the excess and obsolete reserve was as follows (in thousands):
Years Ended December 31, | |||||||||||
2015 | 2014 | 2013 | |||||||||
Balance at beginning of year | $ | (5,640 | ) | $ | (6,000 | ) | $ | (6,060 | ) | ||
Increase in reserves | (830 | ) | (117 | ) | (585 | ) | |||||
Amounts written off | 1,264 | 477 | 645 | ||||||||
Balance at end of year | $ | (5,206 | ) | $ | (5,640 | ) | $ | (6,000 | ) | ||
NOTE 6—AIRCRAFT HELD FOR SALE
We classify certain aircraft as held for sale at the time management commits to a plan to sell the aircraft, changes to the planned sale are not likely, the aircraft is actively marketed and available for immediate sale, and the sale is expected to be completed with one year. Pursuant to management’s review of its fleet operations strategy, nine aircraft were reclassified to ‘aircraft held for sale’ during the first quarter of 2015 and eight aircraft were reclassified during the fourth quarter of 2015, at which times such assets are no longer being depreciated or amortized. Aircraft may be classified as held for sale for more than one year as we continue to actively market the aircraft at reasonable prices.
As of December 31, 2015, we have fifteen aircraft held for sale. The activity in aircraft held for sale during the year was as follows (in thousands):
Aircraft held for sale, January 1, 2015 | $ | — | |
Aircraft classified as held for sale | 29,976 | ||
Book value of two aircraft sold | (2,400 | ) | |
Impairment charge on aircraft held for sale | (14,859 | ) | |
Fluctuations due to foreign currency translation adjustments | (369 | ) | |
Aircraft held for sale, December 31, 2015 | $ | 12,348 | |
In connection with the classification of these aircraft as held for sale, the Company recorded impairment charges totaling $14.9 million to write down the carrying value of the aircraft to their estimated fair value less the costs to sell. These charges are included in impairment of other assets in the consolidated statement of operations for the year ended December 31, 2015. The fair value of aircraft held for sale is considered a level 2 measurement in the fair value hierarchy as the measurement is based on the recent sales and listed prices in the active markets for similar aircraft.
49
NOTE 7—AIRCRAFT, NET AND PROPERTY, PLANT AND EQUIPMENT, NET
Aircraft, net and property, plant and equipment, net consisted of the following (in thousands):
As of December 31, | |||||||
2015 | 2014 | ||||||
Aircraft: | |||||||
Aircraft | $ | 132,530 | $ | 162,246 | |||
Aircraft under capital lease | 3,866 | — | |||||
Construction-in-progress | 10,056 | 10,406 | |||||
146,452 | 172,652 | ||||||
Less: accumulated depreciation and amortization (1) | (41,401 | ) | (34,025 | ) | |||
Add: deferred overhauls, net | 81,081 | 86,768 | |||||
Aircraft, net | $ | 186,132 | $ | 225,395 | |||
Property, plant and equipment: | |||||||
Land and land improvements | $ | 308 | $ | 308 | |||
Buildings | 5,219 | 7,926 | |||||
Vehicles and equipment | 34,115 | 29,500 | |||||
Assets under capital lease—hangar and vehicles | 5,440 | — | |||||
Construction-in-progress | 4,323 | 5,520 | |||||
49,405 | 43,254 | ||||||
Less: accumulated depreciation and amortization (2) | (23,852 | ) | (19,793 | ) | |||
Property, plant and equipment, net | $ | 25,553 | $ | 23,461 | |||
(1) | Includes accumulated amortization of $0.9 million related to aircraft under capital leases as of December 31, 2015. |
(2) | Includes accumulated amortization of $0.2 million related to assets under capital leases as of December 31, 2015. |
During the years ended December 31, 2015 and 2014, the Company completed the following, among other, transactions:
• | During the third quarter of 2015, the Company completed the sale-leaseback of its hangar facility located at the Medford international airport in Oregon for total consideration of $5.1 million. The sale-leaseback transaction qualified as a capital lease, with the gain of $0.9 million deferred and recognized ratably over the lease term through July 2029 as a reduction to rent expense. |
• | During the first quarter of 2015, the Company exchanged four Bell 212 helicopters for two Sikorsky S-76C+ helicopters. An independent appraisal confirmed that the fair values of the two aircraft received approximated the book values of the four aircraft transferred, accordingly, zero gain or loss was realized on the transaction. The aircraft exchanged were included in aircraft, net with their major components included in deferred overhauls, net. Similarly, the aircraft received and their major components were recorded in aircraft, net and deferred overhauls, net, respectively. |
• | During the second quarter of 2014, the Company completed the sale-leaseback of an S-64 Aircrane for total consideration of $24.7 million. The sale-leaseback transaction qualified as an operating lease, with the gain on the sale of $12.3 million deferred and recognized ratably over the lease term through June 2021 as a reduction to rent expense. |
During the years ended December 31, 2015, 2014, and 2013, depreciation expense was $18.6 million, $17.8 million, and $13.4 million, respectively, and amortization expense, which relates to assets under capital lease and deferred overhauls, was $20.2 million, $14.7 million, and $18.1 million, respectively.
50
NOTE 8—OTHER INTANGIBLE ASSETS, NET
Other intangible assets, net consisted of the following (dollars in thousands):
Useful Life (in years) | As of December 31, | ||||||||||
Reportable Segment | 2015 | 2014 | |||||||||
Customer relationships | Global Defense and Security | 9 | $ | 19,300 | $ | 19,300 | |||||
Customer relationships | Commercial Aviation Services | 2 | 2,500 | 2,500 | |||||||
Type Certificate for engines used in Aircranes | Manufacturing and MRO | Indefinite | 2,205 | 2,205 | |||||||
24,005 | 24,005 | ||||||||||
Less: accumulated amortization | (8,218 | ) | (3,952 | ) | |||||||
$ | 15,787 | $ | 20,053 | ||||||||
During 2015, based on changes in our Brazil operations, we changed the estimated useful life of the customer relationship intangible asset related to our Commercial Aviation Services segment from nine years to two years, resulting in an increase in amortization expense of $1.0 million for the year ended December 31, 2015, or $0.05 per share. As of December 31, 2015, such intangible asset is fully amortized.
Amortization expense for other intangible assets was $3.5 million for the year ended December 31, 2015, and $2.4 million and $1.8 million for 2014 and 2013, respectively, which was included in cost of revenues on the consolidated statements of operations. As of December 31, 2015, future estimated amortization expense for other intangible assets is as follows (in thousands):
Year Ending December 31: | |||
2016 | $ | 2,144 | |
2017 | 2,144 | ||
2018 | 2,144 | ||
2019 | 2,144 | ||
2020 | 2,144 | ||
Thereafter | 2,862 | ||
$ | 13,582 | ||
NOTE 9—GOODWILL, NET
The Company’s goodwill originated with the acquisitions of Evergreen Helicopters, Inc. in May 2013 and Air Amazonia in September 2013 and allocated to our three reportable segments based on their underlying net assets. As discussed in Note 13, we changed how we manage our business effective January 1, 2015, resulting in different reportable segments. Accordingly, the reportable segment information presented in this note for 2014 and 2013 has been conformed with the 2015 presentation.
51
Goodwill, net consisted of the following (in thousands):
Global Defense and Security | Commercial Aviation Services | Manufacturing and MRO | Total | ||||||||||||
Balances as of December 31, 2013: | |||||||||||||||
Goodwill, gross | $ | 207,128 | $ | 22,308 | $ | 5,542 | $ | 234,978 | |||||||
Accumulated impairment loss | — | — | — | — | |||||||||||
Goodwill, net | 207,128 | 22,308 | 5,542 | 234,978 | |||||||||||
Activity during 2014: | |||||||||||||||
Impairment loss | (21,272 | ) | — | — | (21,272 | ) | |||||||||
Purchase accounting adjustments | — | 1,928 | — | 1,928 | |||||||||||
Fluctuations due to foreign currency translation adjustments | — | (393 | ) | — | (393 | ) | |||||||||
Balances as of December 31, 2014: | |||||||||||||||
Goodwill, gross | 207,128 | 23,843 | 5,542 | 236,513 | |||||||||||
Accumulated impairment loss | (21,272 | ) | — | — | (21,272 | ) | |||||||||
Goodwill, net | 185,856 | 23,843 | 5,542 | 215,241 | |||||||||||
Activity during 2015: | |||||||||||||||
Impairment loss | (49,823 | ) | — | — | (49,823 | ) | |||||||||
Fluctuations due to foreign currency translation adjustments | — | (1,710 | ) | — | (1,710 | ) | |||||||||
Balances as of December 31, 2015: | |||||||||||||||
Goodwill, gross | 207,128 | 22,133 | 5,542 | 234,803 | |||||||||||
Accumulated impairment losses | (71,095 | ) | — | — | (71,095 | ) | |||||||||
Goodwill, net | $ | 136,033 | $ | 22,133 | $ | 5,542 | $ | 163,708 | |||||||
The Company conducts its annual test for goodwill impairment in the second quarter, and between annual tests when relevant events and circumstances occur. The goodwill impairment test first assesses qualitative factors to determine whether the existence of events or circumstances leads to a determination that it is more likely than not that the fair value of a reporting unit is less than its carrying amount. If the qualitative assessment results in the conclusion that the fair value of the reporting unit is less than the carrying value, the Company performs the first step of a two-step impairment test by calculating the fair value of the reporting unit and comparing that with the carrying value of the reporting unit. If the carrying value of the reporting unit exceeds its fair value, then the Company performs the second step of the goodwill impairment test, which is to measure the amount of any impairment loss. When the Company is required to perform the first step of the impairment test, it compares the reporting unit carrying value to its fair value using the income approach. The income approach estimates fair value by discounting the future cash flows expected to be generated by the reporting unit to its present value. The Company believes this is the most reliable indicator of fair value and is consistent with the approach a market place participant would use. The estimation of fair value utilizing the above approach includes numerous uncertainties which require significant judgment when making assumptions of the cost of capital, expected growth rates, selection of discount rates, as well as assumptions regarding general economic and business conditions, among other factors.
On January 1, 2015 the Company re-aligned its reporting unit structure which resulted in a reallocation of its goodwill to the new reporting units using the relative fair value approach. In the first quarter of 2015, due to the change in the reporting unit structure, the Company performed a goodwill impairment test on its Global Defense and Security reporting unit. The test resulted in an impairment charge of $49.8 million being recorded against the carrying amount of its goodwill which is included in the Company’s consolidated statements of operations for the first quarter of 2015.
Subsequent to the Company's re-organization into three operating reportable segments, the Company elected the second quarter of each fiscal year as the annual testing date for each reporting unit. During the second quarter of 2015, the Company performed the annual goodwill impairment test for the Global Defense and Security, Commercial Aviation Services, and Manufacturing & MRO reporting units. The Company assessed qualitative factors to determine whether it is more likely than not that the fair value of the reporting units are less than its carrying amount. As a result of this qualitative assessment, the Company determined it was not necessary to perform step one of the goodwill impairment tests.
52
In the fourth quarter of 2015, due to industry and market conditions, and the sustained decrease in the Company’s share price, the Company again assessed various qualitative factors and determined that a goodwill impairment test was warranted for all three of its reporting units. The Company performed the first step of the impairment test by calculating the fair value of each reporting unit and comparing that with the carrying value of each reporting unit. The fair value of each reporting unit exceeded their carrying values, and as a result, no goodwill impairment charges were recorded for any of the reporting units in the fourth quarter of 2015.
NOTE 10—ACCRUED AND OTHER CURRENT LIABILITIES
Accrued and other current liabilities consisted of the following (in thousands):
As of December 31, | |||||||
2015 | 2014 | ||||||
Accrued interest payable | $ | 5,859 | $ | 5,542 | |||
Accrued employee compensation and benefits and related taxes | 5,613 | 6,069 | |||||
Deferred gain on sale-leaseback | 1,817 | 1,760 | |||||
Deferred revenue | 630 | 795 | |||||
Foreign currency forward contract | 175 | — | |||||
Income taxes payable | 95 | 315 | |||||
Accrued commissions | 172 | 1,301 | |||||
Other | 3,467 | 3,567 | |||||
$ | 17,828 | $ | 19,349 | ||||
As of December 31, 2015, the Company was a party to six foreign currency forward contracts which will settle at various dates through May 2016, with none as of December 31, 2014. The fair value of foreign currency forward contract is considered a level 2 measurement in the fair value hierarchy as the measurement is based on observable rates or measurements to determine fair value and include rates, spreads, amounts and value dates for such contract.
Prior to 2015, the Company had entered into CPH contracts under which the Company provided components and expendable supplies for a customer’s aircraft at a fixed cost per flight hour. The Company estimated the total covered maintenance costs for the aircraft over the coverage period based on historical trends, with any accrued amount estimated on a per flight hour basis and recorded as the hours are flown on the aircraft. As of December 31, 2014, CPH contracts with such provisions have expired and the Company has not entered into any new CPH contracts with such terms. A summary of the CPH reserves is as follows (in thousands):
Years Ended December 31, | |||||||
2014 | 2013 | ||||||
CPH reserve at beginning of year | $ | 511 | $ | 3,569 | |||
Increases to reserve | — | 747 | |||||
Warranty provided or expired | (511 | ) | (3,805 | ) | |||
CPH reserve at end of year | $ | — | $ | 511 | |||
53
NOTE 11—CREDIT FACILITY
We have a $140.0 million revolving credit facility (“Credit Facility”) with a group of financial institutions, which consists of the following in our consolidated balance sheets (in thousands):
As of December 31, | |||||||
2015 | 2014 | ||||||
Borrowings outstanding under Credit Facility | $ | 97,997 | $ | 89,339 | |||
Less: deferred debt issuance costs | (1,832 | ) | (2,277 | ) | |||
$ | 96,165 | $ | 87,062 | ||||
The Credit Facility is primarily used for general corporate purposes and expires May 2, 2018. The interest rate is 225-450 basis points over the London Interbank Offered Rate or prime base rate depending on the Company’s senior leverage ratio at the time of borrowing and was 5.02% and 5.09% during the years ended December 31, 2015 and 2014, respectively, with a weighted average of 4.95% as of December 31, 2015.
The Company and each of the Company’s current and future, direct and indirect, material subsidiaries guarantee the indebtedness under the Credit Facility on a senior-secured first-lien basis. The Credit Facility includes mandatory prepayment requirements for certain types of transactions, including, but not limited to, requiring prepayment from proceeds that the Company receives as a result of certain asset sales, subject to re-investment provisions on terms to be determined, and proceeds from extraordinary receipts.
The Credit Facility contains certain covenants including, among other items, the following:
• | Fixed Charge Coverage Ratio—This covenant is only triggered when the available borrowing capacity under the Credit Facility is less than 12.5% of the maximum revolver amount of $140.0 million, or approximately $17.5 million. The Credit Facility contains a provision that the Company maintain a minimum fixed charge coverage ratio of 1.10:1.00 . Such minimum fixed charge coverage ratio once triggered stays in effect until the later of: (i) the last day of the second full calendar quarter and (ii) the last day of the calendar quarter after the trigger date in which available borrowing capacity for 30 consecutive days is greater than or equal to 12.5% of the maximum revolver amount. The fixed charge coverage ratio has multiple inputs, including, but not limited to: (i) EBITDA and capital expenditures for the trailing 12-month period to (ii) fixed charges of interest expense, scheduled principal payments, and income taxes for the trailing 12-month period. As of December 31, 2015, such fixed charge coverage ratio had not been triggered. |
• | Growth Capital Expenditures—The Credit Facility contains a provision that limits the Company’s annual Growth Capital Expenditures, as defined in the agreement, to $10.0 million for 2015, $20.0 million for 2016 and $25.0 million for 2017 and beyond, subject to carry-over provisions for 2016 and beyond. |
The Company was in compliance with the financial covenants as of December 31, 2015.
The Company classifies borrowings under the Credit Facility as long-term on its consolidated balance sheets as the Credit Facility terminates in May 2018 and we do not intend to repay the balance outstanding thereunder in full within the next twelve months. As of December 31, 2015 the Company had $1.6 million of outstanding standby letters of credit under the Credit Facility, with a maximum borrowing availability of $22.9 million as of December 31, 2015.
Estimated future amortization of debt issuance costs is: $0.8 million for 2016 and 2017; and $0.3 million for 2018.
54
NOTE 12—LONG-TERM DEBT
Long-term debt consists of the following (in thousands):
As of December 31, | |||||||
2015 | 2014 | ||||||
Senior notes payable, 8.25% interest rate, interest payable quarterly, due May 2020 | $ | 355,000 | $ | 355,000 | |||
Subordinated notes payable, 6.00% interest rate, principal of $1 million plus interest payable quarterly, due November 2020 | 11,478 | 17,500 | |||||
Capital lease obligations, 6.6% weighted average interest rate, principal and interest of $47 thousand payable monthly, expire at various dates through August 2030 | 8,417 | — | |||||
Other notes payable | 6,254 | 409 | |||||
Total long-term debt before unamortized debt discounts and deferred debt issuance costs | 381,149 | 372,909 | |||||
Unamortized debt discounts | (770 | ) | (1,014 | ) | |||
Deferred debt issuance costs | (7,392 | ) | (9,098 | ) | |||
Total long-term debt | 372,987 | 362,797 | |||||
Less: current portion of long-term debt | (8,205 | ) | (2,438 | ) | |||
Long-term debt, less current portion | $ | 364,782 | $ | 360,359 | |||
Senior notes payable—These senior notes payable are 8.25% Second Priority Senior Secured Notes due May 1, 2020 which are registered under the Securities Act of 1933 (“2020 Senior Notes”).
The indenture under which the 2020 Senior Notes were issued, among other things, limits the Company’s ability and the ability of its restricted subsidiaries to: (i) pay dividends or distributions, repurchase equity, prepay subordinated debt or make certain investments; (ii) incur additional debt or issue certain disqualified stock and preferred stock; (iii) incur liens on assets; (iv) merge or consolidate with another company or sell all or substantially all assets; (v) enter into transactions with affiliates; and (vi) allow to exist certain restrictions on the ability of the guarantors to pay dividends or make other payments to the Company.
The 2020 Senior Notes are secured by second-position liens, subject to certain exceptions and permitted liens, on substantially all of the Company and the guarantors’ existing and future assets that secure the Company’s Credit Facility and are guaranteed by certain of the Company’s existing and future domestic subsidiaries.
Subordinated notes payable—Upon any event of default, as defined by the subordinated note agreement, the interest rate increases to 8.0% per annum until the event of default is cured. Any principal balance outstanding, plus any accrued interest thereon becomes due and payable upon (i) any refinancing of the 2020 Senior Notes or the Credit Facility or (ii) a change of control. While any principal balance is outstanding, including any accrued interest thereon, the Company and its subsidiaries may not declare or pay any dividend, make any payment on account of, or take certain other actions in respect of any of the Company or its subsidiaries’ equity interests, subject to certain exceptions.
Capital lease obligations—Certain of the Company’s property and equipment are leased pursuant to capital leases, including two aircraft and its hangar facility located at the Medford international airport in Oregon. Interest rates range from 6.57% to 15.42%.
Other notes payable—The majority of other notes payable consists of a note payable obtained in the first quarter of 2015 in exchange for aircraft support parts. This note has no stated interest rate, requires semi-annual principal payments of $2 million plus interest through March 1, 2017.
55
As of December 31, 2015, the future minimum principal payments on long-term debt, as well as the estimated future amortization of debt discounts and debt issuance costs are as follows (in thousands):
Payments | Unamortized Debt Discount | Debt Issuance Costs | |||||||||
Year Ending December 31: | |||||||||||
2016 | $ | 8,681 | $ | (476 | ) | $ | (1,706 | ) | |||
2017 | 6,773 | (193 | ) | (1,706 | ) | ||||||
2018 | 4,826 | (89 | ) | (1,706 | ) | ||||||
2019 | 1,539 | (12 | ) | (1,706 | ) | ||||||
2020 | 355,269 | — | (568 | ) | |||||||
Thereafter | 4,061 | — | — | ||||||||
$ | 381,149 | $ | (770 | ) | $ | (7,392 | ) | ||||
NOTE 13—REPORTABLE SEGMENTS
The Company deploys its fleet of aircraft to maximize fleet utilization. When making fleet resource allocation decisions, the Company’s chief operating decision maker (“CODM”) primarily considers aircraft type required, route economics, and the financial impact of the resource allocation decision on an individual customer basis. Because the fleet and related resources are used interchangeably between reportable operating segments, the Company does not generate for the CODM’s use an allocation of fleet and fleet support assets including aircraft, net, aircraft support parts, net, and property, plant, and equipment, net, across the reportable operating segments.
The Company’s CODM, management team and board of directors evaluate the performance of the Company’s operating segments based on revenues and gross profit. Gross profit for each segment includes net sales to third parties and related cost of sales directly attributable to the segment. The Company includes intercompany transfers between segments for management reporting purposes.
In March 2015, a new President and Chief Executive Officer was appointed to the Company by the Board of Directors. As a result, the new chief operating decision maker (“CDOM”) reorganized the reportable segments, effective January 1, 2015, based on a combination of factors consisting of the type of customer and type of services provided. Such reportable segments consist of the following:
Commercial Aviation Services segment revenues is derived from firefighting, timber harvesting, infrastructure construction, oil and gas services, and other commercial services.
Global Defense and Security segment revenues is derived primarily from contracts with the U.S. Department of Defense, international governments. other government organizations, and third parties that contract with such governmental agencies and organizations, who use its services for defense and security, and transportation and other government-related activities.
Manufacturing and MRO segment revenues is derived from manufacturing and maintenance, repair and overhaul services for certain aircraft, as well as aircraft sales.
Prior to January 1, 2015, the Company’s reportable segments were the Government segment, which consisted of firefighting, defense and security, and transportation and other services contracted with government customers, and the Commercial segment, which consisted of logging and construction services contracted with commercial customers. The reportable segment information presented in this note for 2014 and 2013 has been restated as applicable to conform with the 2015 presentation.
Information about the Company’s revenues and gross profit by its three reportable segments, as well as a reconciliation of the Company’s reportable segment gross profit to operating income (loss) is as follows (in thousands):
56
Years Ended December 31, | |||||||||||
2015 | 2014 | 2013 | |||||||||
Revenues: | |||||||||||
Commercial Aviation Services | $ | 160,885 | $ | 177,261 | $ | 179,955 | |||||
Global Defense and Security | 105,158 | 154,057 | 125,558 | ||||||||
Manufacturing and MRO | 31,477 | 15,291 | 12,708 | ||||||||
Total revenues | $ | 297,520 | $ | 346,609 | $ | 318,221 | |||||
Gross profit: | |||||||||||
Commercial Aviation Services | $ | 31,867 | $ | 47,283 | $ | 56,964 | |||||
Global Defense and Security | 8,123 | 29,483 | 33,198 | ||||||||
Manufacturing and MRO | 7,285 | 4,128 | 4,028 | ||||||||
Total gross profit | 47,275 | 80,894 | 94,190 | ||||||||
Less: operating expenses | 102,074 | 58,564 | 47,198 | ||||||||
Operating income (loss) | $ | (54,799 | ) | $ | 22,330 | $ | 46,992 | ||||
Concentration of Revenues
Customers that accounted for at least 10% of the Company’s net revenues were as follows:
Years Ended December 31, | ||||||||||
Segment | 2015 | 2014 | 2013 | |||||||
Customer D | Global Defense and Security | 17.6 | % | 17.4 | % | 14.8 | % | |||
Customer E | Commercial Aviation Services | 15.8 | 13.0 | 14.7 | ||||||
33.4 | % | 30.4 | % | 29.5 | % | |||||
Revenues by Geographic Location (in thousands):
Revenues are attributed to geographic area based on the country where the services were performed, with Manufacturing and MRO segment revenues attributed to a geographic area based on the country in which the customer is located and were as follows:
Years Ended December 31, | |||||||||||
2015 | 2014 | 2013 | |||||||||
Revenues: | |||||||||||
North America | $ | 132,420 | $ | 131,690 | $ | 136,100 | |||||
Middle East | 57,468 | 77,760 | 67,315 | ||||||||
Europe | 34,863 | 26,924 | 24,096 | ||||||||
Africa | 28,390 | 26,459 | 20,598 | ||||||||
Asia | 17,154 | 26,036 | 25,410 | ||||||||
South America | 14,380 | 43,458 | 24,809 | ||||||||
Australia | 12,845 | 14,282 | 19,893 | ||||||||
Total revenues | $ | 297,520 | $ | 346,609 | $ | 318,221 | |||||
57
Assets by Reportable Segment (in thousands):
As of December 31, | |||||||
2015 | 2014 | ||||||
Assets: | |||||||
Commercial Aviation Services | $ | 41,857 | $ | 56,456 | |||
Global Defense and Security | 173,882 | 232,775 | |||||
Manufacturing and MRO | 25,623 | 16,207 | |||||
Corporate(1) | 3,917 | 1,332 | |||||
Aircraft held for sale | 12,348 | — | |||||
Fixed assets(2) | 344,026 | 386,450 | |||||
Total assets | $ | 601,653 | $ | 693,220 | |||
(1) | Comprised primarily of cash, prepaid expenses and other current assets, and deferred tax assets. Amount presented for 2014 has been restated for the reclassification of debt issuance costs of $11.4 million from other noncurrent assets to credit facility and long-term debt and noncurrent deferred tax liability of $0.9 million from other liabilities to noncurrent deferred tax asset on the Company’s consolidated balance sheet. |
(2) | Comprised of the aircraft fleet and fleet support assets including: aircraft, net; certain aircraft support parts, net; and property, plant, and equipment, net, which are primarily used to support the aircraft fleet, with minimal amounts allocated to the corporate function. |
The Company deploys aircraft worldwide to provide aviation services around the globe, and at any given date, aircraft can be in transit from one location to another. Accordingly, due to the nature of our operations it is impractical to provide assets by geographic location.
NOTE 14—INCOME TAXES
The components of income (loss) before noncontrolling interest and income taxes are as follows (in thousands):
Years Ended December 31, | |||||||||||
2015 | 2014 | 2013 | |||||||||
Domestic | $ | (87,526 | ) | $ | (21,533 | ) | $ | 13,200 | |||
Foreign | (3,829 | ) | 6,870 | 2,786 | |||||||
Income (loss) before noncontrolling interest and income taxes | $ | (91,355 | ) | $ | (14,663 | ) | $ | 15,986 | |||
Income tax expense (benefit) consisted of the following (in thousands):
Years Ended December 31, | |||||||||||
2015 | 2014 | 2013 | |||||||||
Current income tax expense (benefit): | |||||||||||
U.S. federal | $ | — | $ | — | $ | 125 | |||||
State and local | 25 | 10 | 50 | ||||||||
Foreign | (3,278 | ) | 3,684 | 2,107 | |||||||
(3,253 | ) | 3,694 | 2,282 | ||||||||
Deferred income tax expense (benefit): | |||||||||||
U.S. federal | $ | (1,438 | ) | $ | (8,115 | ) | $ | 4,168 | |||
State and local | (524 | ) | (555 | ) | (185 | ) | |||||
Foreign | 492 | 544 | (145 | ) | |||||||
(1,470 | ) | (8,126 | ) | 3,838 | |||||||
Income tax expense (benefit) | $ | (4,723 | ) | $ | (4,432 | ) | $ | 6,120 | |||
58
A reconciliation of tax at the U.S. statutory rate to total income tax expense (benefit) is as follows (in thousands):
Years Ended December 31, | |||||||||||
2015 | 2014 | 2013 | |||||||||
Tax at U.S. federal statutory tax rate of 35% | $ | (31,975 | ) | $ | (5,132 | ) | $ | 5,595 | |||
State taxes, net of federal benefit | (1,275 | ) | (316 | ) | 258 | ||||||
Tax credits | 3,714 | (2,800 | ) | (1,755 | ) | ||||||
Change in tax contingency items | (4,521 | ) | 42 | 72 | |||||||
Foreign withholding taxes | 1,530 | 1,722 | 1,442 | ||||||||
Nondeductible expenses | 837 | 800 | 537 | ||||||||
Deemed dividends and unremitted earnings | (140 | ) | 789 | — | |||||||
Valuation allowance | 28,102 | 691 | 2,067 | ||||||||
Foreign tax rate differences - current year earnings | (93 | ) | (327 | ) | (485 | ) | |||||
Release of penalties related to uncertain tax positions | (788 | ) | 269 | 268 | |||||||
Foreign tax attribute adjustment | — | — | (1,450 | ) | |||||||
Other, net | (114 | ) | (170 | ) | (429 | ) | |||||
Income tax expense (benefit) | $ | (4,723 | ) | $ | (4,432 | ) | $ | 6,120 | |||
Deferred income tax balances reflect the net tax effects of temporary differences between the carrying amounts of assets and liabilities and their tax bases and are stated at enacted tax rates expected to be in effect when taxes are paid or recovered. Significant components of the Company’s deferred tax assets and liabilities and balance sheet classifications are as follows (in thousands):
As of December 31, | |||||||
2015 | 2014 | ||||||
Deferred tax assets: | |||||||
Net operating loss carryforwards | $ | 19,832 | $ | 17,862 | |||
Goodwill and identified intangibles | 13,454 | 857 | |||||
Foreign tax credits | 8,717 | 11,793 | |||||
Deferred revenue from sale leaseback | 3,527 | 4,169 | |||||
Aircraft support parts reserve | 1,899 | 2,057 | |||||
Allowance for doubtful accounts | 1,822 | 91 | |||||
Accrued liabilities and other reserves | 1,412 | 2,136 | |||||
Research and other credits | 913 | 763 | |||||
Accrued benefits | 482 | 699 | |||||
Investment impairment | 59 | — | |||||
Total deferred tax assets | 52,117 | 40,427 | |||||
Valuation allowance | (30,631 | ) | (2,758 | ) | |||
Net deferred tax assets | 21,486 | 37,669 | |||||
Deferred tax liabilities: | |||||||
Tax-over-book depreciation and amortization | (21,612 | ) | (40,464 | ) | |||
Prepaid expenses and deferred costs | (615 | ) | (562 | ) | |||
Total deferred tax liabilities | (22,227 | ) | (41,026 | ) | |||
Deferred tax liability, net | $ | (741 | ) | $ | (3,357 | ) | |
Classification of net deferred taxes: | |||||||
Noncurrent deferred tax asset (1) | $ | 229 | $ | 304 | |||
Noncurrent deferred tax liability (2) | (970 | ) | (3,661 | ) | |||
$ | (741 | ) | $ | (3,357 | ) | ||
(1) | Included in other assets on the consolidated balance sheets. |
59
(2) | Included in other liabilities on the consolidated balance sheets. |
The Company’s valuation allowance increased for the year ended December 31, 2015 by $27.8 million primarily due to a valuation allowance provided against substantially all of the U.S. and Brazil net deferred tax assets.
The Company recognizes deferred tax assets if realization of such assets is more-likely-than-not. In order to make this determination the Company evaluates factors for each jurisdiction including, but not limited to, the ability to generate future taxable income from reversing taxable temporary differences and forecasts of financial and taxable income or loss by jurisdiction. On the basis of its evaluation and recurring historical losses, the Company determined in 2015 that its U.S. deferred tax assets were not more likely than not to be realized and that a full valuation allowance against net U.S. deferred tax assets was appropriate.
The Company believes, based on factors including, but not limited to, the ability to generate future taxable income from reversing taxable temporary differences and forecasts of financial and taxable income or loss by jurisdiction, that as of December 31, 2015, for foreign jurisdictions it is more-likely-than-not that the Company will realize all of its deferred tax assets, including its net operating loss carry forwards and tax credits, with the exception of those related to Malaysia and Brazil where the Company has recorded a full valuation allowance against its net operating loss carryforwards.
As of December 31, 2015, the Company’s net operating loss and tax credit carryforwards are as follows (dollars in thousands):
Amount | Expiration | ||||
Federal: | |||||
Net operating loss carryforwards | $ | 45,277 | 2031 - 2035 | ||
Foreign tax credits | 7,985 | 2018 - 2025 | |||
Research and experimentation credits | 759 | 2029 -2035 | |||
State: | |||||
Net operating loss carryforwards | 15,026 | 2016 - 2035 | |||
Tax credits | 211 | 2016 - 2020 | |||
The Company’s utilization of net operating loss carryforwards and credits may be subject to annual limitations due to ownership change provisions of Internal Revenue Code Sections 382 and 383.
The Company has provided for the U.S. tax effect of both actual and deemed repatriation on the undistributed earnings of its foreign subsidiaries. For the year ended December 31, 2015, income tax expense includes a $0.1 million offsetting benefit for the deferred tax liabilities of future repatriations of unremitted earnings from all foreign subsidiaries. For the year ended December 31, 2014, income tax expense included $0.8 million resulting from primarily from the deemed repatriation of undistributed earnings.
A reconciliation of the beginning and ending amount of unrecognized tax benefits is as follows (in thousands):
Years Ended December 31, | |||||||||||
2015 | 2014 | 2013 | |||||||||
Unrecognized tax benefits beginning of year | $ | 6,338 | $ | 5,740 | $ | 5,964 | |||||
Gross increases - tax positions in prior periods | 261 | 99 | 71 | ||||||||
Gross decreases - tax positions in prior periods | (4,816 | ) | — | (295 | ) | ||||||
Gross increases - current period | 212 | 507 | — | ||||||||
Currency adjustments | (1,008 | ) | (8 | ) | — | ||||||
Unrecognized tax benefits end of year | $ | 987 | $ | 6,338 | $ | 5,740 | |||||
Unrecognized tax benefits as of December 31, 2015 reflect potential liabilities associated with tax audits and tax positions taken. Payment of tax related to unrecognized tax benefits of both prior and current periods that would result in a foreign tax credit in the U.S. have been included in the Company’s deferred tax assets. Unrecognized tax benefits for years ended December 31, 2014 and 2013 included $5.7 million for potential income taxes due to Greece. The reserve for Greek income taxes declined by $0.9 million due to the lower value of the Euro versus the U.S. dollar. The Company released the remainder
60
of the $4.8 million reserve as a result of the conclusion of the Greek audit, pursuant to which no additional income taxes were assessed.
During the year ended December 31, 2015, the Company recognized pre-tax income of $2.3 million primarily due to the reversal of penalties associated with the reduction in uncertain tax positions. During the year ended December 31, 2014, the Company recognized penalties related to unrecognized tax benefits of $0.8 million. During the year ended December 31, 2015, the Company recognized interest related to unrecognized tax benefits of $0.1 million. As of December 31, 2015 and 2014, the Company had accrued interest and penalties, related to unrecognized tax benefits, of $0.3 million and $2.5 million, respectively.
The Company is subject to income taxes in the U.S. and several foreign jurisdictions. Depending on the jurisdiction, the Company is generally no longer subject to examination by tax authorities for tax years prior to 2011. The following is a summary of audit examinations of taxing authorities:
• | The U.S. Internal Revenue Service has completed an income tax examination of the Company’s 2012 and 2013 tax years, resulting in no adjustments impacting the Company’s consolidated financial position, results of operations or cash flows. |
• | The Italian tax authorities have examined our fiscal years 2008 to 2010. All assessments issued by the taxing authorities have been appealed. |
• | The Malaysian taxing authorities have examined our fiscal years 2008 through 2011 and have proposed adjustments relating to certain withholding tax liabilities, which the Company has appealed. |
• | The Peru taxing authorities have examined our fiscal year 2014 and have proposed an adjustment related to income recognition with the Company has appealed within statutory time period allowed. |
NOTE 15—EMPLOYEE BENEFIT PLANS
The Company maintains the Erickson Incorporated 401(k) Profit Sharing Plan for substantially all full-time U.S. employees. Under the plan, participating U.S. employees may defer up to 100% of their pretax salary, subject to the annual IRS limitation. The Company may make a discretionary matching contribution, determined annually, equal to a uniform percentage or dollar amount per Plan participant. For the years ended December 31, 2015, 2014 and 2013, the Company contributed $1.1 million, $1.0 million and $0.3 million, respectively.
Canadian Air-Crane Ltd. maintains a Group Registered Retirement Savings Plan for salaried employees in Canada. Under this plan, participating Canadian employees may defer up to 18% of their pretax salary, subject to an annual maximum amount. The Company may contribute up to 2.5% of an employee’s compensation. The Company contributed $0.1 million under this plan for each of the years ended December 31, 2015, 2014 and 2013.
NOTE 16—COMMITMENTS AND CONTINGENCIES
The Company is subject to the various legal proceedings and claims discussed below as well as certain other legal proceedings and claims that have not been fully resolved and that have arisen in the ordinary course of business. We record liabilities for losses from legal proceedings when we determine that it is probable that the outcome in a legal proceeding will be unfavorable and the amount of loss can be reasonably estimated. The Company cannot reasonably estimate the potential loss for certain legal proceedings due to the uncertain nature of such disputes. Although the outcome of the legal proceedings in which we are involved cannot be predicted with certainty, management believes that the resolution of these matters will not have a material adverse effect on our consolidated financial statements.
Legal Matters
Arizona Environmental Matter
In August 2012, EHI received a request for information from the State of Arizona and has been served various petitions regarding the Broadway-Pantano Site in Tucson, Arizona, which is comprised of two landfills at which the State of Arizona has been conducting soil and groundwater investigations and cleanups. According to these documents, the State has identified approximately 101 parties that are potentially responsible for the contamination. It is possible that the State or other liable parties may assert that EHI is liable for the alleged contamination at the site.
61
World Fuel Claim
In December 2013, World Fuel, a former fuel supplier of Evergreen International Aviation (‘‘EIA’’) and Evergreen Airlines (‘‘EA’’), filed suit in the Circuit Court of Yamhill County, Oregon against EIA, EA and other named parties claiming approximately $9.0 million of accounts payable due and owing to World Fuel for fuel purchases made by EIA and EA. Evergreen Helicopters, Inc. (Erickson’s wholly-owned subsidiary, ‘‘EHI’’) was a named party in the lawsuit since it was alleged that EHI signed a joint and several guaranty of payment in favor of World Fuel in 2012. In April 2014, the Company filed an answer, which included certain counterclaims against World Fuel and certain cross claims against Mr. Delford Smith. Although the Company is unable to predict the final outcome the proceeding, the Company believes the allegations lack merit and intend to vigorously defend against them.
Stockholder Action
In August 2013, a stockholder class and derivative action was filed in the Court of Chancery for the State of Delaware against the Company, members of our board of directors, EAC Acquisition Corp., and entities associated with ZM Equity Partners, LLC and certain of their affiliates. The plaintiff asserted claims for breach of fiduciary duty and unjust enrichment ing connection with the EHI acquisition and requested an award of unspecified monetary damages, disgorgement and restitution, certain other equitable relief, and an award of plaintiff’s costs and disbursements, including legal fees. Although we are unable to predict the final outcome of the proceeding, we believe the allegations lack merit and intend to vigorously defend against them.
Operating Leases
The Company owns substantially all of its property, periodically leases certain premises on a short term basis, and leases a minor amount of its facilities and certain other property under non-cancelable operating lease agreements that expire on various dates through August of 2064. Certain leases have renewal options. Facilities rent expense was $1.9 million, $2.3 million and $1.8 million for the years ended December 31, 2015, 2014 and 2013, respectively.
The Company has certain operating leases for aircraft that expire on various dates through December 2019. Aircraft rent expense was $17.0 million, $20.2 million and $14.0 million during the years ended December 31, 2015, 2014 and 2013, respectively.
As of December 31, 2015, future minimum lease payments are as follows (in thousands):
Year Ending December 31: | |||
2016 | $ | 18,710 | |
2017 | 14,871 | ||
2018 | 13,992 | ||
2019 | 5,605 | ||
2020 | 3,284 | ||
Thereafter | 4,126 | ||
$ | 60,588 | ||
Royalty Agreement
The Company has a license agreement whereby the Company is obligated to pay a royalty based on the net sales of certain aircraft support parts. During the year ended December 31, 2015, royalty expense was $0.1 million, which is classified as cost of revenues on the consolidated statement of operations.
NOTE 17—STOCK-BASED COMPENSATION
Pursuant to the Company’s 2012 Long-Term Incentive Plan, as amended and restated in November 2015 (“Plan”), we may grant a variety of equity-based awards, including restricted stock units (“RSUs”) with time-based vesting conditions to non-employee directors, officers and certain key employees. Service requirements generally must be met for equity-based awards to
62
vest. Through December 31, 2015, the Company has only issued RSUs under the Plan, the fair value of which is determined based on the quoted closing price of the Company’s common stock on the date of grant.
The RSUs activity was as follows:
Units | Weighted-Average Grant Date Fair Value | |||||
Outstanding as of December 31, 2012 | 158,557 | $ | 7.73 | |||
Granted | 45,914 | 21.43 | ||||
Vested | (88,610 | ) | 10.68 | |||
Forfeited | (24,643 | ) | 7.75 | |||
Outstanding as of December 31, 2013 | 91,218 | 11.75 | ||||
Granted | 35,752 | 16.68 | ||||
Vested | (50,695 | ) | 12.81 | |||
Forfeited | (20,672 | ) | 12.74 | |||
Outstanding as of December 31, 2014 | 55,603 | 13.59 | ||||
Granted | 48,323 | 3.44 | ||||
Vested | (85,036 | ) | 7.70 | |||
Forfeited | (18,890 | ) | 14.15 | |||
Outstanding as of December 31, 2015 | — | — | ||||
A total of 1,417,649 shares of common stock may be issued under the Plan, of which 978,375 shares remain available for issuance as of December 31, 2015.
On July 2, 2015, the Company’s stockholders approved and adopted the CEO Plan and Stock Option Agreement (“the Agreement”). The Agreement provides the Company’s CEO the option to purchase 165,000 shares of common stock. On July 29, 2015, such option was granted for a weighted average exercise price of $6.05 per share (“CEO Stock Option Award”), which becomes exercisable at a rate of 20% on March 2, 2016, and 5% on the last day of each quarter thereafter beginning June 30, 2016 for a total of sixteen additional increments. The weighted average fair value of the CEO Stock Option Award was $2.15 per share using the Black-Scholes model and the following assumptions: risk free interest rate of 1.05%; expected dividend yield of 0%; expected life of 10 years; and volatility of 61.8%. As of December 31, 2015, no options were vested or exercisable.
Recognized stock-based compensation expense was included in the Company’s consolidated statements of operations as follows (in thousands):
Years Ended December 31, | |||||||||||
2015 | 2014 | 2013 | |||||||||
Cost of revenues | $ | 14 | $ | 69 | $ | 70 | |||||
Operating expenses | 280 | 792 | 722 | ||||||||
Total stock-based compensation expense | $ | 294 | $ | 861 | $ | 792 | |||||
As of December 31, 2015, unrecognized stock-based compensation expense related to any outstanding restricted stock units and the CEO’s stock option award is expected to be recognized over a weighted average period of 1.9 years, as follows (in thousands):
Year Ending December 31: | |||
2016 | $ | 83 | |
2017 | 70 | ||
2018 | 67 | ||
2019 | 63 | ||
2020 | 16 | ||
Total unrecognized stock-based compensation expense | $ | 299 | |
63
NOTE 18—EARNINGS (LOSS) PER SHARE
Basic earnings (loss) per share is computed using the weighted average number of common shares outstanding during the year. Diluted earnings (loss) per share is computed using the weighted average number of common shares outstanding and the effect of dilutive potential common shares outstanding during the year. Potential common shares consist of stock-based awards and, for 2013, Series A preferred stock.
Net income (loss) attributable to Erickson Incorporated common shareholders is the same for both the basic and diluted earnings (loss) per share computations. The reconciliations of the denominators of the basic and diluted earnings (loss) per share computations are as follows:
Years Ended December 31, | ||||||||
2015 | 2014 | 2013 | ||||||
Weighted average common shares outstanding—basic | 13,833,552 | 13,800,494 | 11,221,005 | |||||
Dilutive effect of stock-based awards | — | — | 53,419 | |||||
Dilutive effect of Series A preferred stock | — | — | 560,082 | |||||
Weighted average common shares outstanding—diluted | 13,833,552 | 13,800,494 | 11,834,506 | |||||
Due to the Company’s net loss position for the years ended December 31, 2015 and 2014, shares of 165,000 and 18,169, respectively, related to stock-based awards were excluded from the computation of diluted loss per common share as their effect would have been anti-dilutive. For the year ended December 31, 2013, the computation of diluted earnings per common share excluded 16,458 shares due to their anti-dilutive effect.
NOTE 19—RELATED PARTY TRANSACTIONS
ZM EAC LLC beneficially owns approximately 33.6% of the Company’s outstanding capital stock. Q&U Investments LLC is the managing member of entities that beneficially own approximately 20.9% of the Company outstanding capital stock. Quinn Morgan, the managing member of ZM EAC and Q&U Investments, is a member of the Company’s Board of Directors.
Related Party Transactions with ZM EAC and Q&U Investments
• | The Company reimbursed entities affiliated with ZM EAC and Q&U Investments for litigation related expenses and other costs in the aggregate amounts of $0.2 million and $0.5 million during the years ended December 31, 2014 and 2013, respectively, which is included in general and administrative expense on our consolidated statements of operations. |
• | The Company received $0.4 million from short-swing profit disgorgement remitted by entities affiliated with ZM EAC and Q&U Investments during the year ended December 31, 2014, which is included as an increase to additional paid-in capital in the consolidated statement of equity and as a financing activity in the consolidated statement of cash flows. |
• | The Company paid $2.5 million to an entity affiliated with ZM EAC and Q&U Investments for consulting and due diligence services during the year ended December 31, 2013, which is included in general and administrative expense on our consolidated statement of operations. |
• | The Company paid an aggregate amount of $26.7 million in principal and interest to ZM EAC LLC and entities affiliated with Q&U Investments in connection with the prepayment of outstanding subordinated notes during the year ended December 31, 2013, with respect to which the Company recognized interest expense of $0.7 million and which is included in interest expense on the consolidated statement of operations. |
• | The Company paid $1.3 million to an entity affiliated with ZM EAC and Q&U Investments to retire multiple subordinated notes, which the entity acquired for the same amount during the year ended December 31, 2015. The notes had an outstanding principal amount of $2.2 million and a gain of $0.8 million on the early extinguishment of debt was included in other income, net on the consolidated statement of operations. Other than the payment of the purchase price, the Company did not pay or reimburse the entity any additional amounts related to the transactions. |
64
• | The Company issued 1,984,680 shares of its Mandatorily Convertible Cumulative Participating Preferred Stock, Series A to entities affiliated with ZM EAC and Q&U Investments in connection with the Company’s acquisition of Evergreen Helicopters, Inc. during the year ended December 31, 2013. |
Other Related Party Transactions
The Company has indemnification agreements with certain of its current and former officers and directors that may require it, among other things, to indemnify these current or former officers and directors against certain liabilities that may arise by reason of their status or service as directors or officers and to advance their expenses incurred as a result of any proceeding against them as to which they could be indemnified.
NOTE 20—VARIABLE INTEREST ENTITIES
We have determined that as of December 31, 2015, the Company is the primary beneficiary of two variable interest entities (“VIEs”), EuAC and Costa Do Sol Taxi Aero Corporation (“Costa Do Sol”). An entity is generally considered a VIE that is subject to consolidation if the total equity investment at risk is not sufficient for the entity to finance its activities without additional subordinated financial support; or as a group, the holders of the equity investment at risk lack any one of the following characteristics: (a) the power, through voting rights or similar rights, to direct the activities that most significantly impact the entity’s economic performance; (b) the obligation to absorb expected losses of the entity; or (c) the right to receive the expected residual returns of the entity.
• | EuAC. This entity is 49% owned by EI; 49% owned by Grupo Inaer (“Inaer”); and 2% owned by Fiduciaria Centro Nord (“FCN”). EI provided FCN with the financial means to purchase and transfer the shares of EuAC, in exchange for the patrimonial and administrative rights derived from the shares. These rights include the right to decide whether and how to vote in shareholders’ meetings and the right to decide whether, when and to whom the shares should be transferred and endorsed. |
• | Costa Do Sol. Air Amazonia, the Company’s Brazilian subsidiary, entered into a purchase agreement in 2014 to acquire 100% of the preferred, non-voting, stock and 20% of the common, voting, stock of Costa Do Sol Taxi Aero Corporation (“Costa Do Sol”) and an employee of Air Amazonia, a Brazilian national, entered into a purchase agreement at the same time to acquire 80% of the common, voting, stock of Costa Do Sol. In connection with the purchase agreements, the selling shareholders of Costa Do Sol executed a power-of-attorney authorizing Air Amazonia to transact business on behalf of Costa, at which time, Air Amazonia began to manage the operations of Costa Do Sol. Although the purchase transaction is pending approval by the National Civil Aviation Agency of Brazil, Air Amazonia has the authority to operate and transact business on behalf of Cost Do Sol through the power-of-attorney. |
Determining whether EI is the primary beneficiary of a VIE is complex, subjective and requires the use of judgments and assumptions. Significant judgments and assumptions made by the Company in determining that it is the primary beneficiary of EuAC and Costa Do Sol include the following: i) the Company has the experience to own and operate aviation services-type entities and has the ability to make decisions and has control over the VIEs’ most significant activities, ii) the Company bears the exposure to the expected losses of the VIE if they occur; and iii) the Company the right to receive the expected residual returns of the entity if they occur. As such, as of December 31, 2015, the Company’s consolidated balance sheet includes EuAC and Costa Do Sol assets of $3.1 million and liabilities of $1.3 million, and EuAC and Costa Do Sol assets of $4.2 million and liabilities of $2.1 million as of December 31, 2014.
65
NOTE 21—CONSOLIDATING FINANCIAL INFORMATION
Certain of the Company’s subsidiaries have guaranteed its obligations under the $355.0 million outstanding principal amount of 8.25% notes due 2020. The following presents the condensed consolidating financial information for:
• | Erickson Incorporated (the ‘‘Parent Company’’), the issuer of the guaranteed obligations; |
• | Guarantor subsidiaries, on a combined basis, as specified in the indenture related to the Company’s obligations under the 2020 Senior Notes; |
• | Non-guarantor subsidiaries, on a combined basis, which consist of the Company’s primarily foreign subsidiaries; |
• | Consolidating entries and eliminations represent adjustments to (a) eliminate intercompany transactions between or among the Parent Company, the guarantor subsidiaries and the non-guarantor subsidiaries, (b) eliminate the Parent Company investments in subsidiaries, and (c) record consolidating entries; and |
• | Erickson Incorporated and subsidiaries on a consolidated basis. |
Each guarantor subsidiary was 100% owned by the Parent Company as of the date of each condensed consolidating balance sheet presented. The 2020 Senior Notes are fully and unconditionally guaranteed on a joint and several basis by each guarantor subsidiary. Each entity in the consolidating financial information follows the same accounting policies as described in the consolidated financial statements, except for the use by the Parent Company and guarantor subsidiaries of the equity method of accounting to reflect ownership interests in subsidiaries which are eliminated upon consolidation. Changes in intercompany receivables and payables related to operations, such as intercompany sales or service charges, are included in cash flows from operating activities. Amounts presented in the following tables are in thousands.
66
Condensed Consolidating Balance Sheet December 31, 2015 | |||||||||||||||||||
Parent Company | Guarantor Subsidiaries | Non-Guarantor Subsidiaries | Consolidating Entries and Eliminations | Consolidated | |||||||||||||||
Assets | |||||||||||||||||||
Current assets: | |||||||||||||||||||
Cash and cash equivalents | $ | 13 | $ | 71 | $ | 2,045 | $ | — | $ | 2,129 | |||||||||
Restricted cash | — | — | 373 | — | 373 | ||||||||||||||
Accounts receivable, net | 18,053 | 15,887 | 6,542 | 38 | 40,520 | ||||||||||||||
Prepaid expenses and other current assets | 3,637 | 1,028 | 568 | — | 5,233 | ||||||||||||||
Total current assets | 21,703 | 16,986 | 9,528 | 38 | 48,255 | ||||||||||||||
Aircraft, net | 125,095 | 60,501 | 536 | — | 186,132 | ||||||||||||||
Aircraft support parts, net | 111,735 | 27,631 | 288 | (45 | ) | 139,609 | |||||||||||||
Aircraft held for sale | 5,880 | 5,316 | 1,152 | — | 12,348 | ||||||||||||||
Property, plant and equipment, net | 20,367 | 4,606 | 580 | — | 25,553 | ||||||||||||||
Other assets | 311,798 | 8,309 | 624 | (310,470 | ) | 10,261 | |||||||||||||
Other intangible assets, net | 2,205 | 13,582 | — | — | 15,787 | ||||||||||||||
Goodwill, net | — | 160,533 | 3,937 | (762 | ) | 163,708 | |||||||||||||
Total assets | $ | 598,783 | $ | 297,464 | $ | 16,645 | $ | (311,239 | ) | $ | 601,653 | ||||||||
Liabilities and equity (deficit) | |||||||||||||||||||
Current liabilities: | |||||||||||||||||||
Accounts payable | $ | 6,165 | $ | 6,270 | $ | 1,225 | $ | — | $ | 13,660 | |||||||||
Current portion of long-term debt | 7,292 | 913 | — | — | 8,205 | ||||||||||||||
Accrued expenses and other current liabilities | 15,524 | 1,588 | 716 | — | 17,828 | ||||||||||||||
Total current liabilities | 28,981 | 8,771 | 1,941 | — | 39,693 | ||||||||||||||
Credit facility | 96,165 | — | — | — | 96,165 | ||||||||||||||
Long-term debt, less current portion | 362,585 | 2,197 | — | — | 364,782 | ||||||||||||||
Other liabilities | (30,830 | ) | 26,046 | 16,504 | — | 11,720 | |||||||||||||
Total liabilities | 456,901 | 37,014 | 18,445 | — | 512,360 | ||||||||||||||
Equity (deficit): | |||||||||||||||||||
Erickson Incorporated shareholders’ equity (deficit): | |||||||||||||||||||
Common stock | 1 | — | 7,052 | (7,052 | ) | 1 | |||||||||||||
Additional paid-in capital | 181,259 | 297,994 | 33 | (298,027 | ) | 181,259 | |||||||||||||
Accumulated deficit | (34,322 | ) | (37,544 | ) | (7,545 | ) | (5,490 | ) | (84,901 | ) | |||||||||
Accumulated other comprehensive loss | (5,056 | ) | — | (1,974 | ) | (759 | ) | (7,789 | ) | ||||||||||
Total shareholders’ equity (deficit) attributable to Erickson Incorporated | 141,882 | 260,450 | (2,434 | ) | (311,328 | ) | 88,570 | ||||||||||||
Noncontrolling interests | — | — | 634 | 89 | 723 | ||||||||||||||
Total equity (deficit) | 141,882 | 260,450 | (1,800 | ) | (311,239 | ) | 89,293 | ||||||||||||
Total liabilities and equity (deficit) | $ | 598,783 | $ | 297,464 | $ | 16,645 | $ | (311,239 | ) | $ | 601,653 | ||||||||
67
Condensed Consolidating Balance Sheet December 31, 2014 | |||||||||||||||||||
Parent Company | Guarantor Subsidiaries | Non-Guarantor Subsidiaries | Consolidating Entries and Eliminations | Consolidated | |||||||||||||||
Assets | |||||||||||||||||||
Current assets: | |||||||||||||||||||
Cash and cash equivalents | $ | 7 | $ | 274 | $ | 4,816 | $ | — | $ | 5,097 | |||||||||
Restricted cash | 136 | — | 431 | — | 567 | ||||||||||||||
Accounts receivable, net | 13,117 | 26,199 | 4,990 | 44 | 44,350 | ||||||||||||||
Prepaid expenses and other current assets | 7,036 | 1,171 | 1,228 | 22 | 9,457 | ||||||||||||||
Total current assets | 20,296 | 27,644 | 11,465 | 66 | 59,471 | ||||||||||||||
Aircraft, net | 134,594 | 86,674 | 4,127 | — | 225,395 | ||||||||||||||
Aircraft support parts, net | 106,721 | 30,482 | 435 | (45 | ) | 137,593 | |||||||||||||
Property, plant and equipment, net | 18,937 | 3,493 | 1,031 | — | 23,461 | ||||||||||||||
Other assets | 312,261 | 4,337 | 501 | (305,093 | ) | 12,006 | |||||||||||||
Other intangible assets, net | 2,205 | 15,726 | 2,122 | — | 20,053 | ||||||||||||||
Goodwill, net | — | 210,356 | 5,647 | (762 | ) | 215,241 | |||||||||||||
Total assets | $ | 595,014 | $ | 378,712 | $ | 25,328 | $ | (305,834 | ) | $ | 693,220 | ||||||||
Liabilities and equity (deficit) | |||||||||||||||||||
Current liabilities: | |||||||||||||||||||
Accounts payable | $ | 6,021 | $ | 11,465 | $ | 2,358 | $ | — | $ | 19,844 | |||||||||
Current portion of long-term debt | 2,438 | — | — | — | 2,438 | ||||||||||||||
Accrued expenses and other current liabilities | (54,974 | ) | 49,166 | 25,135 | 22 | 19,349 | |||||||||||||
Total current liabilities | (46,515 | ) | 60,631 | 27,493 | 22 | 41,631 | |||||||||||||
Credit facility | 87,062 | — | — | — | 87,062 | ||||||||||||||
Long-term debt, less current portion | 360,359 | — | — | — | 360,359 | ||||||||||||||
Other liabilities | 23,742 | 708 | (1,295 | ) | — | 23,155 | |||||||||||||
Total liabilities | 424,648 | 61,339 | 26,198 | 22 | 512,207 | ||||||||||||||
Equity (deficit): | |||||||||||||||||||
Erickson Incorporated shareholders’ equity (deficit): | |||||||||||||||||||
Common stock | 1 | — | 1,675 | (1,675 | ) | 1 | |||||||||||||
Additional paid-in capital | 181,018 | 297,994 | 33 | (298,027 | ) | 181,018 | |||||||||||||
Retained earnings (accumulated deficit) | (8,993 | ) | 19,379 | (3,171 | ) | (5,403 | ) | 1,812 | |||||||||||
Accumulated other comprehensive loss | (1,660 | ) | — | (41 | ) | (843 | ) | (2,544 | ) | ||||||||||
Total shareholders’ equity (deficit) attributable to Erickson Incorporated | 170,366 | 317,373 | (1,504 | ) | (305,948 | ) | 180,287 | ||||||||||||
Noncontrolling interests | — | — | 634 | 92 | 726 | ||||||||||||||
Total equity (deficit) | 170,366 | 317,373 | (870 | ) | (305,856 | ) | 181,013 | ||||||||||||
Total liabilities and equity (deficit) | $ | 595,014 | $ | 378,712 | $ | 25,328 | $ | (305,834 | ) | $ | 693,220 | ||||||||
68
Condensed Consolidating Statement of Operations Year Ended December 31, 2015 | |||||||||||||||||||
Parent Company | Guarantor Subsidiaries | Non-Guarantor Subsidiaries | Consolidating Entries and Eliminations | Consolidated | |||||||||||||||
Revenues, net | $ | 156,772 | $ | 124,503 | $ | 48,326 | $ | (32,081 | ) | $ | 297,520 | ||||||||
Cost of revenues | 109,062 | 124,345 | 48,623 | (31,785 | ) | 250,245 | |||||||||||||
Gross profit (loss) | 47,710 | 158 | (297 | ) | (296 | ) | 47,275 | ||||||||||||
Operating expenses: | |||||||||||||||||||
General and administrative | 25,244 | 1,104 | 2,543 | — | 28,891 | ||||||||||||||
Research and development | 2,673 | 2 | — | — | 2,675 | ||||||||||||||
Selling and marketing | 5,595 | 19 | 131 | (296 | ) | 5,449 | |||||||||||||
Impairment of goodwill | — | 49,823 | — | — | 49,823 | ||||||||||||||
Impairment of other assets | 7,858 | 5,939 | 1,439 | — | 15,236 | ||||||||||||||
Total operating expenses | 41,370 | 56,887 | 4,113 | (296 | ) | 102,074 | |||||||||||||
Operating income (loss) | 6,340 | (56,729 | ) | (4,410 | ) | — | (54,799 | ) | |||||||||||
Interest expense, net | (36,402 | ) | (387 | ) | (284 | ) | — | (37,073 | ) | ||||||||||
Other income (expense), net | (342 | ) | 193 | 672 | (6 | ) | 517 | ||||||||||||
Net loss before income taxes and noncontrolling interests | (30,404 | ) | (56,923 | ) | (4,022 | ) | (6 | ) | (91,355 | ) | |||||||||
Income tax expense (benefit) | (5,075 | ) | — | 352 | — | (4,723 | ) | ||||||||||||
Net loss | (25,329 | ) | (56,923 | ) | (4,374 | ) | (6 | ) | (86,632 | ) | |||||||||
Less: net income attributable to noncontrolling interests | — | — | — | (81 | ) | (81 | ) | ||||||||||||
Net loss attributable to Erickson Incorporated | $ | (25,329 | ) | $ | (56,923 | ) | $ | (4,374 | ) | $ | (87 | ) | $ | (86,713 | ) | ||||
Condensed Consolidating Statement of Operations Year Ended December 31, 2014 | |||||||||||||||||||
Parent Company | Guarantor Subsidiaries | Non-Guarantor Subsidiaries | Consolidating Entries and Eliminations | Consolidated | |||||||||||||||
Revenues net | $ | 151,502 | $ | 163,094 | $ | 55,663 | $ | (23,650 | ) | $ | 346,609 | ||||||||
Cost of revenues | 96,815 | 145,054 | 47,328 | (23,482 | ) | 265,715 | |||||||||||||
Gross profit | 54,687 | 18,040 | 8,335 | (168 | ) | 80,894 | |||||||||||||
Operating expenses: | |||||||||||||||||||
General and administrative | 22,280 | 910 | 3,416 | — | 26,606 | ||||||||||||||
Research and development | 3,782 | — | — | — | 3,782 | ||||||||||||||
Selling and marketing | 6,048 | 595 | 429 | (168 | ) | 6,904 | |||||||||||||
Impairment of goodwill | — | 21,272 | — | — | 21,272 | ||||||||||||||
Total operating expenses | 32,110 | 22,777 | 3,845 | (168 | ) | 58,564 | |||||||||||||
Operating income (loss) | 22,577 | (4,737 | ) | 4,490 | — | 22,330 | |||||||||||||
Interest income (expense), net | (35,210 | ) | 20 | (610 | ) | — | (35,800 | ) | |||||||||||
Other income (expense), net | (3,600 | ) | 2,286 | 229 | (108 | ) | (1,193 | ) | |||||||||||
Net income (loss) before income taxes and noncontrolling interests | (16,233 | ) | (2,431 | ) | 4,109 | (108 | ) | (14,663 | ) | ||||||||||
Income tax expense (benefit) | (6,433 | ) | — | 2,001 | — | (4,432 | ) | ||||||||||||
Net income (loss) | (9,800 | ) | (2,431 | ) | 2,108 | (108 | ) | (10,231 | ) | ||||||||||
Less: net income attributable to noncontrolling interests | — | — | — | (61 | ) | (61 | ) | ||||||||||||
Net income (loss) attributable to Erickson Incorporated | $ | (9,800 | ) | $ | (2,431 | ) | $ | 2,108 | $ | (169 | ) | $ | (10,292 | ) | |||||
69
Condensed Consolidating Statement of Operations Year Ended December 31, 2013 | |||||||||||||||||||
Parent Company | Guarantor Subsidiaries | Non-Guarantor Subsidiaries | Consolidating Entries and Eliminations | Consolidated | |||||||||||||||
Revenues, net | $ | 161,500 | $ | 128,109 | $ | 52,852 | $ | (24,240 | ) | $ | 318,221 | ||||||||
Cost of revenues | 100,270 | 100,429 | 47,543 | (24,211 | ) | 224,031 | |||||||||||||
Gross profit | 61,230 | 27,680 | 5,309 | (29 | ) | 94,190 | |||||||||||||
Operating expenses: | |||||||||||||||||||
General and administrative | 27,775 | 5,116 | 4,844 | (61 | ) | 37,674 | |||||||||||||
Research and development | 4,000 | — | — | — | 4,000 | ||||||||||||||
Selling and marketing | 4,577 | 775 | 123 | 49 | 5,524 | ||||||||||||||
Total operating expenses | 36,352 | 5,891 | 4,967 | (12 | ) | 47,198 | |||||||||||||
Operating income | 24,878 | 21,789 | 342 | (17 | ) | 46,992 | |||||||||||||
Interest income (expense), net | (25,103 | ) | 1 | (73 | ) | — | (25,175 | ) | |||||||||||
Other income (expense), net | (5,515 | ) | 16 | 33 | (365 | ) | (5,831 | ) | |||||||||||
Net income (loss) before income taxes and noncontrolling interest | (5,740 | ) | 21,806 | 302 | (382 | ) | 15,986 | ||||||||||||
Income tax expense (benefit) | 5,311 | (5 | ) | 814 | — | 6,120 | |||||||||||||
Net income (loss) | (11,051 | ) | 21,811 | (512 | ) | (382 | ) | 9,866 | |||||||||||
Less: net income attributable to noncontrolling interests | — | — | — | (209 | ) | (209 | ) | ||||||||||||
Net income (loss) attributable to Erickson Incorporated | $ | (11,051 | ) | $ | 21,811 | $ | (512 | ) | $ | (591 | ) | $ | 9,657 | ||||||
70
Condensed Consolidating Statement of Cash Flows Year Ended December 31, 2015 | |||||||||||||||||||
Parent Company | Guarantor Subsidiaries | Non-Guarantor Subsidiaries | Consolidating Entries and Eliminations | Consolidated | |||||||||||||||
Cash flows from operating activities: | |||||||||||||||||||
Net loss | $ | (25,329 | ) | $ | (56,923 | ) | $ | (4,374 | ) | $ | (6 | ) | $ | (86,632 | ) | ||||
Adjustments to reconcile net loss to net cash provided by (used in) operating activities: | |||||||||||||||||||
Depreciation and amortization | 23,391 | 17,326 | 1,597 | — | 42,314 | ||||||||||||||
Impairment of goodwill | — | 49,823 | — | — | 49,823 | ||||||||||||||
Impairment of other assets | 7,858 | 5,939 | 1,439 | 15,236 | |||||||||||||||
Deferred income taxes | (3,116 | ) | — | 173 | — | (2,943 | ) | ||||||||||||
Amortization of debt issuance costs | 2,660 | — | — | — | 2,660 | ||||||||||||||
Non-cash interest expense | 886 | — | — | — | 886 | ||||||||||||||
Stock-based compensation | 294 | — | — | — | 294 | ||||||||||||||
Other non-cash (income) expense, net | 3,915 | (31 | ) | (29 | ) | 3,855 | |||||||||||||
Changes in operating assets and liabilities: | |||||||||||||||||||
Accounts receivable | (4,938 | ) | 10,311 | (2,376 | ) | 6 | 3,003 | ||||||||||||
Prepaid expenses and other current assets | 3,006 | 143 | 832 | 22 | 4,003 | ||||||||||||||
Aircraft support parts, net | 1,301 | 2,148 | (65 | ) | — | 3,384 | |||||||||||||
Aircraft held for sale | 2,000 | 400 | — | — | 2,400 | ||||||||||||||
Other assets | 962 | (1,122 | ) | (117 | ) | (1 | ) | (278 | ) | ||||||||||
Accounts payable | 145 | (5,196 | ) | (656 | ) | — | (5,707 | ) | |||||||||||
Accrued expenses and other current liabilities | 11,827 | (12,629 | ) | 1,973 | (20 | ) | 1,151 | ||||||||||||
Other liabilities | (12,030 | ) | (250 | ) | — | (1 | ) | (12,281 | ) | ||||||||||
Net cash provided by (used in) operating activities | 12,832 | 9,939 | (1,603 | ) | — | 21,168 | |||||||||||||
Cash flows from investing activities: | |||||||||||||||||||
Purchases of aircraft and property, plant and equipment | (16,733 | ) | (9,387 | ) | (6 | ) | — | (26,126 | ) | ||||||||||
Proceeds from sale-leaseback of aircraft | 5,078 | — | — | — | 5,078 | ||||||||||||||
Restricted cash | 136 | — | (32 | ) | — | 104 | |||||||||||||
Net cash used in investing activities | (11,519 | ) | (9,387 | ) | (38 | ) | — | (20,944 | ) | ||||||||||
Cash flows from financing activities: | |||||||||||||||||||
Credit facility borrowings | 188,890 | — | — | — | 188,890 | ||||||||||||||
Credit facility payments | (180,231 | ) | — | — | — | (180,231 | ) | ||||||||||||
Long-term debt principal payments, including capital lease payments | (6,140 | ) | (755 | ) | — | — | (6,895 | ) | |||||||||||
Other long-term borrowings | (156 | ) | — | — | — | (156 | ) | ||||||||||||
Debt issuance costs | (224 | ) | — | — | — | (224 | ) | ||||||||||||
Shares withheld for payment of taxes | (53 | ) | — | — | — | (53 | ) | ||||||||||||
Net cash provided by (used in) financing activities | 2,086 | (755 | ) | — | — | 1,331 | |||||||||||||
Effect of foreign currency exchange rates on cash and cash equivalents | (3,393 | ) | — | (1,130 | ) | — | (4,523 | ) | |||||||||||
Net change in cash and cash equivalents | 6 | (203 | ) | (2,771 | ) | — | (2,968 | ) | |||||||||||
Cash and cash equivalents at beginning of year | 7 | 274 | 4,816 | — | 5,097 | ||||||||||||||
Cash and cash equivalents at end of year | $ | 13 | $ | 71 | $ | 2,045 | $ | — | $ | 2,129 | |||||||||
71
Condensed Consolidating Statement of Cash Flows Year Ended December 31, 2014 | |||||||||||||||||||
Parent Company | Guarantor Subsidiaries | Non-Guarantor Subsidiaries | Consolidating Entries and Eliminations | Consolidated | |||||||||||||||
Cash flows from operating activities: | |||||||||||||||||||
Net income (loss) | $ | (9,800 | ) | $ | (2,431 | ) | $ | 2,108 | $ | (108 | ) | $ | (10,231 | ) | |||||
Adjustments to reconcile net income (loss) to net cash provided by (used in) operating activities: | |||||||||||||||||||
Depreciation and amortization | 23,366 | 10,769 | 768 | — | 34,903 | ||||||||||||||
Impairment of goodwill | — | 21,272 | — | — | 21,272 | ||||||||||||||
Deferred income taxes | (8,224 | ) | — | 434 | — | (7,790 | ) | ||||||||||||
Amortization of debt issuance costs | 2,433 | — | — | — | 2,433 | ||||||||||||||
Non-cash interest expense | 324 | — | — | — | 324 | ||||||||||||||
Stock-based compensation | 861 | — | — | — | 861 | ||||||||||||||
Other non-cash income, net | (121 | ) | (2,209 | ) | (205 | ) | — | (2,535 | ) | ||||||||||
Changes in operating assets and liabilities: | |||||||||||||||||||
Accounts receivable | 4,173 | 14,361 | 1,143 | 42 | 19,719 | ||||||||||||||
Prepaid expenses and other current assets | (4,838 | ) | (591 | ) | 341 | (22 | ) | (5,110 | ) | ||||||||||
Aircraft support parts, net | (17,900 | ) | 1,177 | (517 | ) | — | (17,240 | ) | |||||||||||
Other assets | 1,741 | 3,620 | 241 | — | 5,602 | ||||||||||||||
Accounts payable | (2,161 | ) | (6,422 | ) | (273 | ) | — | (8,856 | ) | ||||||||||
Accrued expenses and other current liabilities | (4,809 | ) | (14,760 | ) | (475 | ) | 21 | (20,023 | ) | ||||||||||
Other liabilities | (54 | ) | 709 | — | — | 655 | |||||||||||||
Net cash provided by (used in) operating activities | (15,009 | ) | 25,495 | 3,565 | (67 | ) | 13,984 | ||||||||||||
Cash flows from investing activities: | |||||||||||||||||||
Purchases of aircraft and property, plant and equipment | (30,110 | ) | (25,574 | ) | (1,123 | ) | — | (56,807 | ) | ||||||||||
Proceeds from sale-leaseback of aircraft | 24,660 | — | — | — | 24,660 | ||||||||||||||
Restricted cash | 13 | 365 | 1,844 | — | 2,222 | ||||||||||||||
Increase in other assets | — | — | (126 | ) | — | (126 | ) | ||||||||||||
Dividends paid to noncontrolling interest | — | — | (136 | ) | 67 | (69 | ) | ||||||||||||
Net cash provided by (used in) investing activities | (5,437 | ) | (25,209 | ) | 459 | 67 | (30,120 | ) | |||||||||||
Cash flows from financing activities: | |||||||||||||||||||
Proceeds from shareholders, net | 414 | — | — | — | 414 | ||||||||||||||
Credit facility payments | (206,686 | ) | — | — | — | (206,686 | ) | ||||||||||||
Credit facility borrowings | 227,939 | — | — | — | 227,939 | ||||||||||||||
Other long-term borrowings | 409 | — | — | — | 409 | ||||||||||||||
Debt issuance costs | (371 | ) | — | — | — | (371 | ) | ||||||||||||
Shares withheld for payment of taxes | (211 | ) | — | — | — | (211 | ) | ||||||||||||
Net cash provided by financing activities | 21,494 | — | — | — | 21,494 | ||||||||||||||
Effect of foreign currency exchange rates on cash and cash equivalents | (1,617 | ) | — | (525 | ) | — | (2,142 | ) | |||||||||||
Net change in cash and cash equivalents | (569 | ) | 286 | 3,499 | — | 3,216 | |||||||||||||
Cash and cash equivalents at beginning of year | 576 | (12 | ) | 1,317 | — | 1,881 | |||||||||||||
Cash and cash equivalents at end of year | $ | 7 | $ | 274 | $ | 4,816 | $ | — | $ | 5,097 | |||||||||
72
Condensed Consolidating Statement of Cash Flows Year Ended December 31, 2013 | |||||||||||||||||||
Parent Company | Guarantor Subsidiaries | Non-Guarantor Subsidiaries | Consolidating Entries and Eliminations | Consolidated | |||||||||||||||
Cash flows from operating activities: | |||||||||||||||||||
Net income (loss) | $ | (11,051 | ) | $ | 21,811 | $ | (512 | ) | $ | (382 | ) | $ | 9,866 | ||||||
Adjustments to reconcile net income (loss) to net cash provided by (used in) operating activities: | |||||||||||||||||||
Depreciation and amortization | 25,535 | 7,400 | 393 | — | 33,328 | ||||||||||||||
Deferred income taxes | 4,543 | — | 554 | 117 | 5,214 | ||||||||||||||
Amortization of debt issuance costs | 2,067 | — | — | — | 2,067 | ||||||||||||||
Non-cash interest expense | 1,877 | — | — | — | 1,877 | ||||||||||||||
Stock-based compensation | 792 | — | — | — | 792 | ||||||||||||||
Other non-cash (income) expense, net | 3,491 | (23 | ) | 47 | — | 3,515 | |||||||||||||
Changes in operating assets and liabilities: | |||||||||||||||||||
Accounts receivable | (5,866 | ) | (15,440 | ) | 298 | 17 | (20,991 | ) | |||||||||||
Prepaid expenses and other current assets | (444 | ) | 1,454 | 332 | — | 1,342 | |||||||||||||
Aircraft support parts, net | (12,354 | ) | (19,692 | ) | — | 45 | (32,001 | ) | |||||||||||
Other assets | (1,114 | ) | (2,124 | ) | 107 | — | (3,131 | ) | |||||||||||
Accounts payable | 1,304 | (21,376 | ) | 570 | — | (19,502 | ) | ||||||||||||
Accrued expenses and other current liabilities | (45,424 | ) | 43,153 | (1,267 | ) | (3,116 | ) | (6,654 | ) | ||||||||||
Other liabilities | (514 | ) | — | — | — | (514 | ) | ||||||||||||
Net cash provided by (used in) operating activities | (37,158 | ) | 15,163 | 522 | (3,319 | ) | (24,792 | ) | |||||||||||
Cash flows from investing activities: | |||||||||||||||||||
Acquisition of businesses, net of cash acquired | (235,029 | ) | 5,139 | 22 | 3,000 | (226,868 | ) | ||||||||||||
Purchases of aircraft and property, plant and equipment | (35,530 | ) | (19,950 | ) | (624 | ) | — | (56,104 | ) | ||||||||||
Restricted cash | 992 | (364 | ) | 330 | — | 958 | |||||||||||||
Purchase of intangible asset | (2,205 | ) | — | — | — | (2,205 | ) | ||||||||||||
Increase in other assets | 1,660 | — | (35 | ) | — | 1,625 | |||||||||||||
Dividends paid to noncontrolling interest | — | — | (651 | ) | 310 | (341 | ) | ||||||||||||
Net cash used in investing activities | (270,112 | ) | (15,175 | ) | (958 | ) | 3,310 | (282,935 | ) | ||||||||||
Cash flows from financing activities: | |||||||||||||||||||
Credit facility payments | (250,215 | ) | — | — | — | (250,215 | ) | ||||||||||||
Credit facility borrowings | 246,377 | — | — | — | 246,377 | ||||||||||||||
Long-term debt issuances | 400,000 | — | — | — | 400,000 | ||||||||||||||
Long-term debt principal payments | (72,572 | ) | — | — | — | (72,572 | ) | ||||||||||||
Debt issuance costs | (14,986 | ) | — | — | — | (14,986 | ) | ||||||||||||
Shares withheld for payment of taxes | (716 | ) | — | — | — | (716 | ) | ||||||||||||
Net cash provided by financing activities | 307,888 | — | — | — | 307,888 | ||||||||||||||
Effect of foreign currency exchange rates on cash and cash equivalents | (83 | ) | — | 326 | 9 | 252 | |||||||||||||
Net change in cash and cash equivalents | 535 | (12 | ) | (110 | ) | — | 413 | ||||||||||||
Cash and cash equivalents at beginning of year | 41 | — | 1,427 | — | 1,468 | ||||||||||||||
Cash and cash equivalents at end of year | $ | 576 | $ | (12 | ) | $ | 1,317 | $ | — | $ | 1,881 | ||||||||
73
QUARTERLY FINANCIAL DATA
(Unaudited)
Quarter Ended | |||||||||||||||
March 31 | June 30 | September 30 | December 31 | ||||||||||||
(In thousands, except per share amounts) | |||||||||||||||
2015 | |||||||||||||||
Revenues, net | $ | 66,162 | $ | 69,319 | $ | 101,133 | $ | 60,906 | |||||||
Gross profit | 1,374 | 7,732 | 33,044 | 5,125 | |||||||||||
Net income (loss) (1) | (75,083 | ) | (10,239 | ) | 15,351 | (16,661 | ) | ||||||||
Net income (loss) attributable to Erickson Incorporated (1) | (74,970 | ) | (10,121 | ) | 15,074 | (16,696 | ) | ||||||||
Earnings (loss) per share—basic and diluted (1) | $ | (5.42 | ) | $ | (0.73 | ) | $ | 1.09 | $ | (1.21 | ) | ||||
2014 | |||||||||||||||
Revenues, net | $ | 74,184 | $ | 80,885 | $ | 118,338 | $ | 73,202 | |||||||
Gross profit (2) | 7,526 | 13,384 | 47,496 | 12,488 | |||||||||||
Net income (loss) (3) | (7,525 | ) | (17,162 | ) | 16,941 | (2,485 | ) | ||||||||
Net income (loss) attributable to Erickson Incorporated (3) | (7,594 | ) | (17,109 | ) | 16,862 | (2,451 | ) | ||||||||
Earnings (loss) per share—basic and diluted (3) | $ | (0.55 | ) | $ | (1.24 | ) | $ | 1.22 | $ | (0.18 | ) | ||||
(1) | The quarter ended March 31 includes a goodwill impairment charge of $49.8 million and other asset impairment charge of $7.1 million, and the quarter ended December 31 includes an other asset impairment charge of $8.1 million. |
(2) | In 2015, we reclassified certain sales commissions from sales and marketing expense to cost of revenues. To conform with the 2015 presentation, the amounts presented differ from the amounts previously reported in our Annual Report on Form 10-K for the year ended December 31, 2014. |
(3) The quarter ended June 30 includes a goodwill impairment charge of $21.3 million.
ITEM 9. | CHANGES IN AND DISAGREEMENTS WITH ACCOUNTANTS ON ACCOUNTING AND FINANCIAL DISCLOSURE. |
None.
ITEM 9A. | CONTROLS AND PROCEDURES. |
Conclusion Regarding the Effectiveness of Disclosure Controls and Procedures
We maintain disclosure controls and procedures that are designed with the objective of providing reasonable assurance that information required to be disclosed in the reports we file or submit under the Securities Exchange Act of 1934 (the “Exchange Act”), as amended, is recorded, processed, summarized and reported within the time periods specified in the SEC’s rules and forms, and that such information is accumulated and communicated to our management, including our Chief Executive Officer and Chief Financial Officer, as appropriate, to allow timely decisions regarding required disclosure. In designing and evaluating our disclosure controls and procedures, our management recognizes that any controls and procedures, no matter how well designed and operated, can provide only reasonable assurance of achieving the desired control objectives, and our management is required to apply their judgment in evaluating the cost-benefit relationship of possible controls and procedures.
Our management, under the supervision and with the participation of our principal executive officer and principal financial officer, has evaluated of our disclosure controls and procedures as such term is defined under Rule 13a-15(e) promulgated under the Exchange Act. Based on that evaluation, our principal executive officer and principal financial officer concluded that our disclosure controls and procedures were effective as of the end of the period covered by this annual report on Form 10-K.
74
Changes in Internal Control Over Financial Reporting
There were no changes in our internal control over financial reporting during the fourth quarter of the fiscal year ended December 31, 2015, that have materially affected, or are reasonably likely to materially affect, our internal control over financial reporting.
Management’s Report on Internal Controls Over Financial Reporting
Our management is responsible for establishing and maintaining adequate internal control over financial reporting (as defined in Rule 13a-15(f) under the Exchange Act). Management, with the participation of the Chief Executive Officer and Chief Financial Officer, conducted an assessment of the effectiveness of our internal control over financial reporting based on the criteria set forth in Internal Control - Integrated Framework issued by the Committee of Sponsoring Organizations of the Treadway Commission (COSO), under the 1992 framework. Based on the assessment, management has concluded that its internal control over financial reporting was effective as of December 31, 2015 to provide reasonable assurance regarding the reliability of financial reporting and the preparation of financial statements in accordance with U.S. GAAP.
This annual report on Form 10-K does not include an attestation report of our independent registered public accounting firm. Our independent registered public accounting firm will not be required to formally attest to the effectiveness of our internal control over financial reporting until we are no longer either a “non-accelerated filer” as defined in Rule 126-2 of the Exchange Act or an “emerging growth company” as defined in the Jumpstart Our Business Startups Act of 2012 (the “JOBS Act”).
ITEM 9B. | OTHER INFORMATION. |
None.
PART III
ITEM 10. | DIRECTORS, EXECUTIVE OFFICERS AND CORPORATE GOVERNANCE. |
We hereby incorporate by reference the information under the captions “Election of Directors,” “Section 16(a) Beneficial Ownership Reporting Compliance,” “Executive Officers,” “Corporate Governance,” and “Code of Ethics” in our definitive Proxy Statement to be filed pursuant to Regulation 14A with the SEC in connection with the Annual Meeting of Shareholders scheduled to be held on June 8, 2016.
ITEM 11. | EXECUTIVE COMPENSATION. |
We hereby incorporate by reference the information under the captions “Executive Compensation” and “Compensation Committee Report” in our definitive Proxy Statement to be filed pursuant to Regulation 14A with the SEC in connection with the Annual Meeting of Shareholders scheduled to be held on June 8, 2016.
ITEM 12. | SECURITY OWNERSHIP OF CERTAIN BENEFICIAL OWNERS AND MANAGEMENT AND RELATED STOCKHOLDER MATTERS. |
We hereby incorporate by reference the information under the captions “Security Ownership of Certain Beneficial Owners and Management” and “Equity Compensation Plan Information” in our definitive Proxy Statement to be filed pursuant to Regulation 14A with the SEC in connection with the Annual Meeting of Shareholders scheduled to be held on June 8, 2016.
ITEM 13. | CERTAIN RELATIONSHIPS AND RELATED PERSON TRANSACTIONS, AND DIRECTOR INDEPENDENCE. |
We hereby incorporate by reference the information under the captions “Certain Relationships and Related Party Transactions” and “Independence of Directors” in our definitive Proxy Statement to be filed pursuant to Regulation 14A with the SEC in connection with the Annual Meeting of Shareholders scheduled to be held on June 8, 2016.
ITEM 14. | PRINCIPAL ACCOUNTING FEES AND SERVICES. |
We hereby incorporate by reference the information under the caption “Selection of Independent Public Accounting Firm” in our definitive Proxy Statement to be filed pursuant to Regulation 14A with the SEC in connection with the Annual Meeting of Shareholders scheduled to be held on June 8, 2016.
75
PART IV
ITEM 15. EXHIBITS, FINANCIAL STATEMENT SCHEDULES
(a) Financial Statements and Schedules
The financial statements are set forth under Item 8 of this Annual Report on Form 10-K. Financial statement schedules have been omitted since they are either not required, not applicable, or the information is otherwise included.
(b) Exhibit Listing
Incorporated by Reference | ||||||||||||
Exhibit No. | Exhibit Title | Filed Herewith | Form | Exhibit/Appendix No. | File No. | Filing Date | ||||||
3.1 | Third Amended and Restated Certificate of Incorporation | 8-K | 3.1 | 001-35482 | 2/26/2014 | |||||||
3.2 | Third Amended and Restated Bylaws | 8-K | 3.2 | 001-35482 | 2/26/2014 | |||||||
4.1 | Amended and Restated Registration Rights Agreement, dated April 21, 2010 | S-1 | 4.1 | 333-166752 | 5/12/2010 | |||||||
4.2 | Indenture related to the 8.25% Second Priority Senior Secured Notes due 2020 | 8-K | 4.1 | 001-35482 | 5/8/2013 | |||||||
4.3 | Registration Rights Agreement, dated May 2, 2013 | 8-K | 4.2 | 001-35482 | 5/8/2013 | |||||||
4.4 | Certificate of Designation | 8-K | 4.3 | 001-35482 | 5/8/2013 | |||||||
10.1 | Form of Indemnification Agreement by and between Erickson and certain directors, officers and employees | S-1 | 10.1 | 333-166752 | 5/21/2010 | |||||||
10.2* | Erickson Incorporated 2012 Long-Term Incentive Plan (as amended and restated) | 14C | A | 001-35482 | 11/27/2015 | |||||||
10.3* | Form of Restricted Stock Unit Agreement | S-1/A | 10.21(a) | 333-166752 | 3/21/2012 | |||||||
10.4 | Exclusive Use Helicopter Services Large Fire Support Agreement with the U.S. Forest Service, dated December 16, 2011 | S-1/A | 10.15 | 333-166752 | 3/6/2012 | |||||||
10.5 | Contract No. 4600002272 with North Atlantic Trade Organization Maintenance and Supply Agency, dated May 23, 2012 | 8-K | 10.1 | 001-35482 | 5/29/2012 | |||||||
10.6 | Credit Agreement among Wells Fargo Bank, National Association, Keybank National Association, Bank of the West, Bank of America, N.A., and Union Bank, N.A., dated June 24, 2010 | S-1/A | 10.17 | 333-166752 | 10/5/2012 | |||||||
10.7 | First Amendment to Credit Agreement among Wells Fargo Bank, National Association, Keybank National Association, Bank of the West, Bank of America, N.A., and Union Bank, N.A., dated November 15, 2010 | S-1/A | 10.17(a) | 333-166752 | 12/5/2011 | |||||||
10.8 | Second Amendment to Credit Agreement among Wells Fargo Bank, National Association, Keybank National Association, Bank of the West, Bank of America, N.A., and Union Bank, N.A., dated December 31, 2010 | S-1/A | 10.17(b) | 333-166752 | 12/5/2011 | |||||||
10.9 | Third Amendment to Credit Agreement among Wells Fargo Bank, National Association, Keybank National Association, Bank of the West, Bank of America, N.A., and Union Bank, N.A., dated May 19, 2011 | S-1/A | 10.17(c) | 333-166752 | 12/5/2011 | |||||||
10.10 | Fourth Amendment to Credit Agreement among Wells Fargo Bank, National Association, Keybank National Association, Bank of the West, Bank of America, N.A., and Union Bank, N.A., dated June 30, 2011 | S-1/A | 10.17(d) | 333-166752 | 12/5/2011 | |||||||
10.11 | Credit Agreement among Erickson Air-Crane Incorporated, Evergreen Helicopters, Inc., Wells Fargo Bank, National Association, and other lender parties thereto, dated May 2, 2013 | 8-K | 10.1 | 001-35482 | 5/8/2013 | |||||||
10.12 | Guaranty and Security Agreement among the persons listed on the signature pages thereof and Wells Fargo Bank, National Association, dated May 2, 2013 | 8-K | 10.2 | 001-35482 | 5/8/2013 | |||||||
76
Incorporated by Reference | ||||||||||||
Exhibit No. | Exhibit Title | Filed Herewith | Form | Exhibit/Appendix No. | File No. | Filing Date | ||||||
10.13 | Aircraft and Engine Security Agreement among Erickson Air-Crane Incorporated and Wells Fargo Bank, National Association, dated May 2, 2013 | 8-K | 10.3 | 001-35482 | 5/8/2013 | |||||||
10.14 | Intercreditor Agreement between Wells Fargo Bank, National Association, and Wilmington Trust, National Association, dated May 2, 2013 | 10-Q | 10.1 | 001-35482 | 8/6/2015 | |||||||
10.15 | Patent Security Agreement among the Grantors listed on the signature pages thereof and Wells Fargo Bank, National Association, dated May 2, 2013 | 8-K | 10.5 | 001-35482 | 5/8/2013 | |||||||
10.16 | Trademark Security Agreement among the Grantors listed on the signature pages thereof and Wells Fargo Bank, National Association, dated May 2, 2013 | 8-K | 10.6 | 001-35482 | 5/8/2013 | |||||||
10.17 | Security Agreement among the Persons listed on the signature pages thereof and Wilmington Trust, National Association, dated May 2, 2013 | 8-K | 10.7 | 001-35482 | 5/8/2013 | |||||||
10.18 | Aircraft and Engine Security Agreement among the Persons listed on the signature pages thereof and Wilmington Trust, National Association, dated May 2, 2013 | 8-K | 10.8 | 001-35482 | 5/8/2013 | |||||||
10.19 | Joinder No. 1 to Guaranty and Security Agreement and Intercompany Subordination Agreement between Evergreen Unmanned Systems, Inc. and Wells Fargo, dated as of June 14, 2013 | 8-K | 10.2 | 001-35482 | 6/18/2013 | |||||||
10.20 | Line of Credit Deed of Trust, Assignment of Rents and Leases, Security Agreement and Fixture Filing with the Trustee and Wells Fargo | 8-K | 10.3 | 001-35482 | 6/18/2013 | |||||||
10.21 | Line of Credit Deed of Trust, Assignment of Rents and Leases, Security Agreement and Fixture Filing with the Trustee and Wilmington Trust | 8-K | 10.4 | 001-35482 | 6/18/2013 | |||||||
10.22 | Amendment Number One, dated June 14, 2013, to Credit Agreement among the Lenders, Wells Fargo Bank, National Association, Erickson Incorporated and Evergreen Helicopters, Inc. | 8-K | 10.1 | 001-35482 | 6/18/2013 | |||||||
10.23 | Amendment Number Two, dated July 22, 2013, to Credit Agreement among the Lenders, Wells Fargo Bank, National Association, Erickson Incorporated and Erickson Helicopters, Inc. | 10-Q | 10.3 | 001-35482 | 8/6/2015 | |||||||
10.24 | Amendment Number Three, dated August 27, 2013, to Credit Agreement among the Lenders, Wells Fargo Bank, National Association, Erickson Incorporated and Erickson Helicopters, Inc. | 10-Q | 10.3 | 001-35482 | 8/6/2015 | |||||||
10.25 | Amendment Number Four, dated October 24, 2013, to Credit Agreement among the Lenders, Wells Fargo Bank, National Association, Erickson Incorporated and Erickson Helicopters, Inc. | 10-Q | 10.4 | 001-35482 | 8/6/2015 | |||||||
10.26 | Amendment Number Five, dated March 11, 2014, to Credit Agreement among the Lenders, Wells Fargo Bank, National Association, Erickson Incorporated and Erickson Helicopters, Inc. | 10-K | 10.43 | 001-35482 | 3/14/2014 | |||||||
10.27 | Amendment Number Six, dated April 30, 2015, to Credit Agreement among the Lenders, Wells Fargo Bank, National Association, Erickson Incorporated and Erickson Helicopters, Inc. | 10-Q | 10.5 | 001-35482 | 8/6/2015 | |||||||
10.28 | Amendment Number Seven, dated July 24, 2015, to Credit Agreement among the Lenders, Wells Fargo Bank, National Association, Erickson Incorporated and Erickson Helicopters, Inc. | 10-Q | 10.6 | 001-35482 | 8/6/2015 | |||||||
10.29* | Executive Employment Agreement, dated as of February 28, 2015, between Erickson Incorporated and Jeffrey G. Roberts | 8-K | 10.1 | 001-35482 | 3/5/2015 | |||||||
77
Incorporated by Reference | ||||||||||||
Exhibit No. | Exhibit Title | Filed Herewith | Form | Exhibit/Appendix No. | File No. | Filing Date | ||||||
10.30 | Sublease Agreement, dated July 29, 2015, between Erickson Incorporated and Greenwell/Medford L.L.C. | 10-Q | 10.7 | 001-35482 | 8/6/2015 | |||||||
10.31* | Erickson Incorporated CEO Plan & Stock Option Agreement | 14C | A | 001-35482 | 7/9/2015 | |||||||
21.1 | Subsidiaries of Erickson Incorporated | X | ||||||||||
23.1 | Consent of Grant Thornton LLP | X | ||||||||||
31.1 | Certification of Chief Executive Officer pursuant to Exchange Act Rules 13a-14(a) and 15d-14(a), as adopted pursuant to Section 302 of the Sarbanes-Oxley Act of 2002 | X | ||||||||||
31.2 | Certification of Chief Financial Officer pursuant to Exchange Act Rules 13a-14(a) and 15d-14(a), as adopted pursuant to Section 302 of the Sarbanes-Oxley Act of 2002 | X | ||||||||||
32.1** | Certifications of Chief Executive Officer and Chief Financial Officer pursuant to 18 U.S.C. Section 1350, as adopted pursuant to Section 906 of the Sarbanes-Oxley Act of 2002 | X | ||||||||||
101.INS | XBRL Instance Document | X | ||||||||||
101.SCH | XBRL Taxonomy Extension Schema Document | X | ||||||||||
101.CAL | XBRL Taxonomy Extension Calculation Linkbase Document | X | ||||||||||
101.DEF | XBRL Taxonomy Extension Definition Linkbase Document | X | ||||||||||
101.LAB | XBRL Taxonomy Extension Label Linkbase Document | X | ||||||||||
101.PRE | XBRL Taxonomy Extension Presentation Linkbase Document | X | ||||||||||
* | Indicates a management compensatory plan, contract or arrangement | |||||||||||
** | Furnished herewith, not filed | |||||||||||
78
SIGNATURES
Pursuant to the requirements of Section 13 or 15(d) of the Securities Exchange Act of 1934, as amended, the registrant has duly caused this report to be signed on its behalf by the undersigned thereunto duly authorized.
Erickson Incorporated | |||
Date: | March 10, 2016 | By: | /s/ Jeffrey G. Roberts |
Jeffrey G. Roberts | |||
President and Chief Executive Officer | |||
KNOW ALL PERSONS BY THESE PRESENTS, that each person whose signature appears below constitutes and appoints Jeff Roberts and Eric Struik and each of them, with full power of substitution and resubstitution and full power to act without the other, as his or her true and lawful attorney-in-fact and agent to act in his or her name, place and stead and to execute in the name and on behalf of each person, individually and in each capacity stated below, and to file, any and all documents in connection therewith, with the Securities and Exchange Commission, granting unto said attorneys-in-fact and agents, and each of them, full power and authority to do and perform each and every act and thing, ratifying and confirming all that said attorneys-in-fact and agents or any of them or their and his or her substitute or substitutes, may lawfully do or cause to be done by virtue thereof.
Pursuant to the requirements of the Securities Exchange Act of 1934, this report has been signed below by the following persons on behalf of the Registrant and in the capacities indicated on March 10, 2016.
Signature | Title | ||
/s/ Jeffrey G. Roberts | President, Chief Executive Officer and Director | ||
Jeffrey G. Roberts | (principal executive officer) | ||
/s/ Eric K. Struik | Chief Financial Officer | ||
Eric Struik | (principal financial and accounting officer) | ||
/s/ Gary R. Scott | Director, Chairman of the Board | ||
Gary R. Scott | |||
/s/ Glenn S. Johnson | Director | ||
Glenn S. Johnson | |||
/s/ Quinn Morgan | Director | ||
Quinn Morgan | |||
/s/ Meredith Siegfried | Director | ||
Meredith Siegfried | |||
/s/ James L. Welch | Director | ||
James L. Welch | |||
79